EXHIBIT 99.4
1 Q1 2017 EARNINGS PRESENTATION May 12 , 2017
2 Safe Harbor Statement Certain statements in the Business Update and Order Backlog sections contain forward - looking statements within the meaning of the “safe harbor” provisions of the U . S . Private Securities Litigation Reform Act of 1995 , and under applicable Canadian securities laws . These statements are based on management’s current expectations and actual results may differ from these forward - looking statements due to numerous factors, including : our inability to increase our revenues or raise additional funding to continue operations, execute our business plan, or to grow our business ; our inability to address a slow return to economic growth, and its impact on our business, results of operations and consolidated financial condition ; our limited operating history ; inability to implement our business strategy ; fluctuations in our quarterly results ; failure to maintain our customer base that generates the majority of our revenues ; currency fluctuations ; failure to maintain sufficient insurance coverage ; changes in value of goodwill ; failure of a significant market to develop for our products ; failure of hydrogen being readily available on a cost - effective basis ; changes in government policies and regulations ; failure of uniform codes and standards for hydrogen fuelled vehicles and related infrastructure to develop ; liability for environmental damages resulting from our research, development or manufacturing operations ; failure to compete with other developers and manufacturers of products in our industry ; failure to compete with developers and manufacturers of traditional and alternative technologies ; failure to develop partnerships with original equipment manufacturers, governments, systems integrators and other third parties ; inability to obtain sufficient materials and components for our products from suppliers ; failure to manage expansion of our operations ; failure to manage foreign sales and operations ; failure to recruit, train and retain key management personnel ; inability to integrate acquisitions ; failure to develop adequate manufacturing processes and capabilities ; failure to complete the development of commercially viable products ; failure to produce cost - competitive products ; failure or delay in field testing of our products ; failure to produce products free of defects or errors ; inability to adapt to technological advances or new codes and standards ; failure to protect our intellectual property ; our involvement in intellectual property litigation ; exposure to product liability claims ; failure to meet rules regarding passive foreign investment companies ; actions of our significant and principal shareholders ; dilution as a result of significant issuances of our common shares and preferred shares ; inability of US investors to enforce US civil liability judgments against us ; volatility of our common share price ; dilution as a result of the exercise of options ; and failure to meet continued listing requirements of Nasdaq . Readers should not place undue reliance on Hydrogenics’ forward - looking statements . Investors are encouraged to review the section captioned “Risk Factors” in our regulatory filings with the Canadian securities regulatory authorities and the US Securities and Exchange Commission for a more complete discussion of factors that could affect our future performance . Furthermore, the forward - looking statements contained herein are made as of the date of this presentation, and we undertake no obligation to revise or update any forward - looking statements in order to reflect events or circumstances that may arise after the date of this presentation, unless otherwise required by law . The forward - looking statements contained in this presentation are expressly qualified by this .
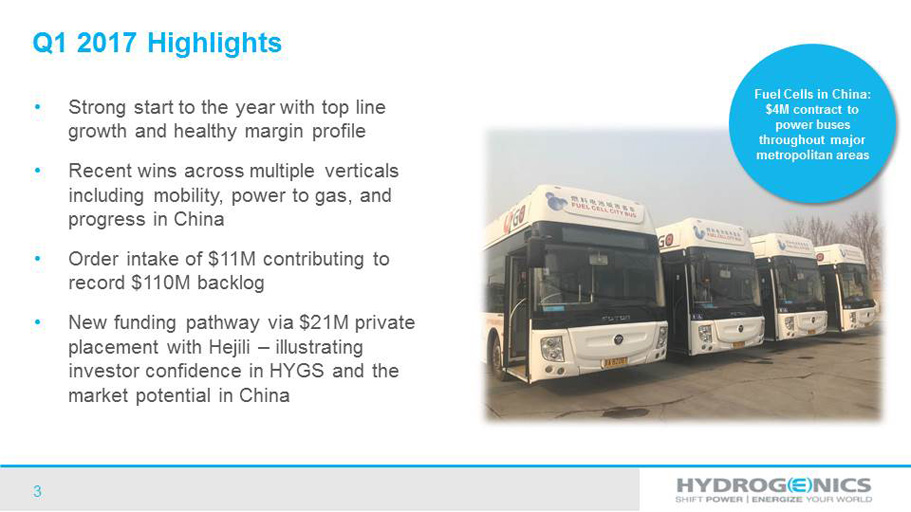
3 Q1 2017 Highlights • Strong start to the year with top line growth and healthy margin profile • Recent wins across multiple verticals including mobility, power to gas, and progress in China • Order intake of $11M contributing to record $110M backlog • New funding pathway via $21M private placement with Hejili – illustrating investor confidence in HYGS and the market potential in China Fuel Cells in China: $4M contract to power buses throughout major metropolitan areas
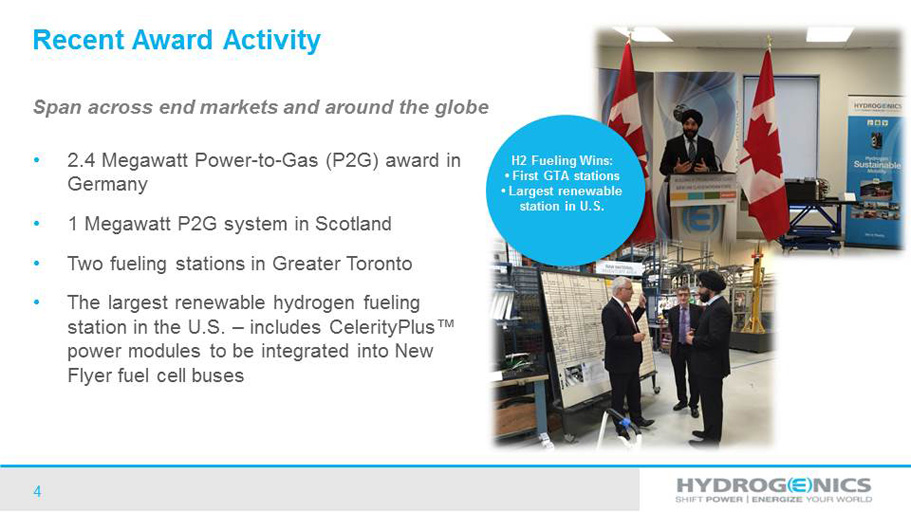
4 Recent Award Activity • 2.4 Megawatt Power - to - Gas (P2G) award in Germany • 1 Megawatt P2G system in Scotland • Two fueling stations in Greater Toronto • The largest renewable hydrogen fueling station in the U.S. – includes CelerityPlus™ power modules to be integrated into New Flyer fuel cell buses Span across end markets and around the globe H2 Fueling Wins: • First GTA stations • Largest renewable station in U.S.
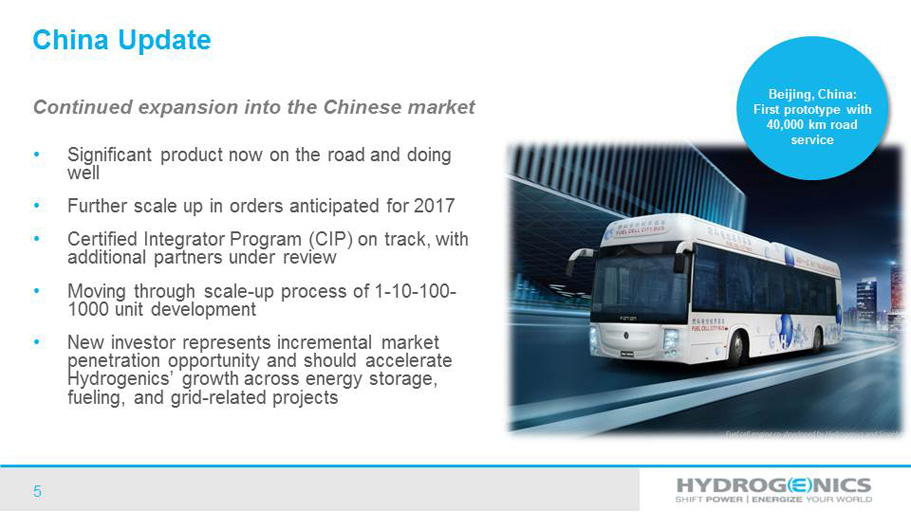
5 China Update • Significant product now on the road and doing well • Further scale up in orders anticipated for 2017 • Certified Integrator Program (CIP) on track, with additional partners under review • Moving through scale - up process of 1 - 10 - 100 - 1000 unit development • New investor represents incremental market penetration opportunity and should accelerate Hydrogenics’ growth across energy storage, fueling, and grid - related projects Continued expansion into the Chinese market Beijing, China: First prototype with 40,000 km road service
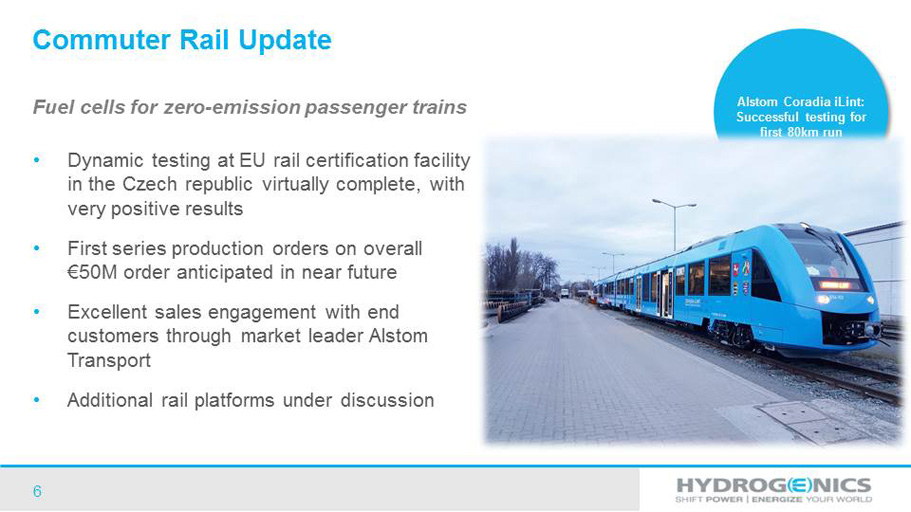
6 Commuter Rail Update • Dynamic testing at EU rail certification facility in the Czech republic virtually complete, with very positive results • First series production orders on overall € 50M order anticipated in near future • Excellent sales engagement with end customers through market leader Alstom Transport • Additional rail platforms under discussion Fuel cells for zero - emission passenger trains Alstom Coradia iLint : Successful testing for first 80km run
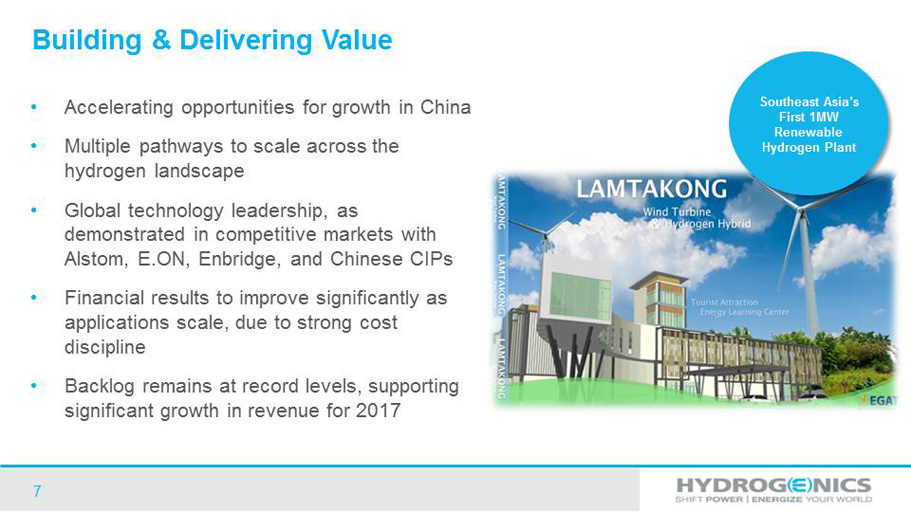
7 Building & Delivering Value • Accelerating opportunities for growth in China • Multiple pathways to scale across the hydrogen landscape • Global technology leadership, as demonstrated in competitive markets with Alstom, E.ON, Enbridge, and Chinese CIPs • Financial results to improve significantly as applications scale, due to strong cost discipline • Backlog remains at record levels, supporting significant growth in revenue for 2017 Southeast Asia’s First 1MW Renewable Hydrogen Plant
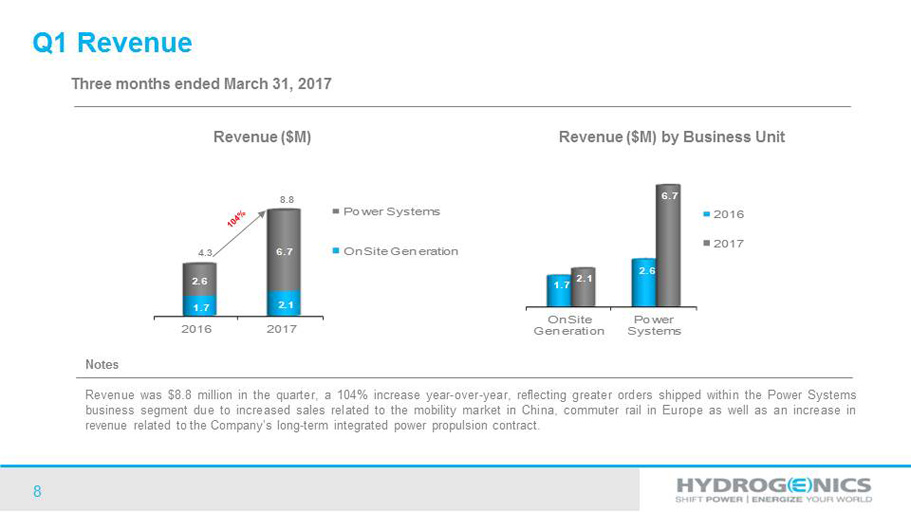
8 2016 2017 1.7 2.1 2.6 6.7 Power Systems OnSite Generation Notes Revenue was $ 8 . 8 million in the quarter, a 104 % increase year - over - year, reflecting greater orders shipped within the Power Systems business segment due to increased sales related to the mobility market in China, commuter rail in Europe as well as an increase in revenue related to the Company’s long - term integrated power propulsion contract . Revenue ($M) Three months ended March 31, 2017 8.8 4.3 Q1 Revenue OnSite Generation Power Systems 1.7 2.6 2.1 6.7 2016 2017 Revenue ($M) by Business Unit
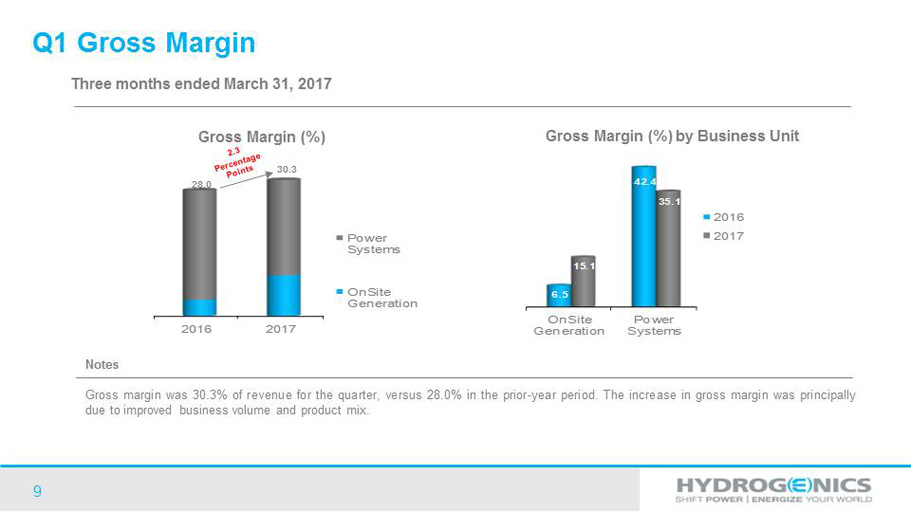
9 2016 2017 Power Systems OnSite Generation Notes Gross margin was 30 . 3 % of revenue for the quarter, versus 28 . 0 % in the prior - year period . The increase in gross margin was principally due to improved business volume and product mix . Gross Margin (%) Three months ended March 31, 2017 30.3 28.0 Q1 Gross Margin OnSite Generation Power Systems 6.5 42.4 15.1 35.1 2016 2017 Gross Margin (%) by Business Unit
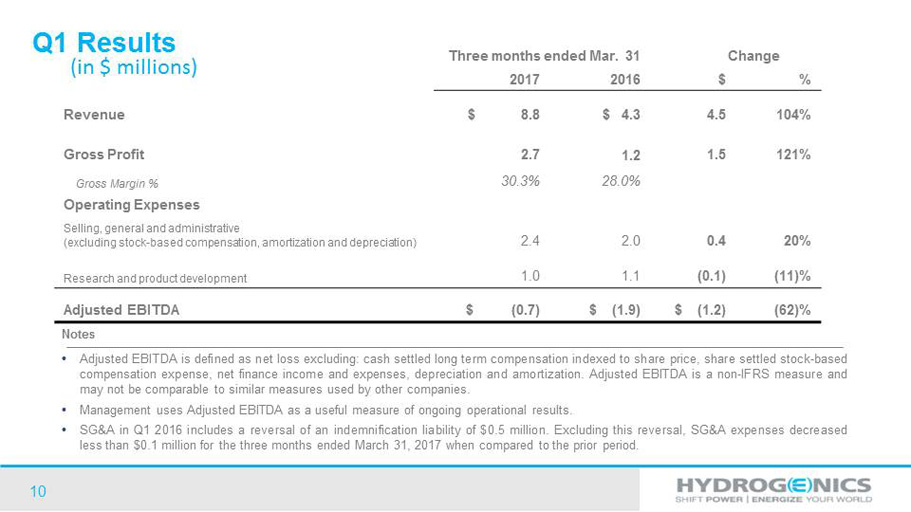
10 Three months ended Mar. 31 Change 2017 2016 $ % Revenue $ 8.8 $ 4.3 4.5 104% Gross Profit 2.7 1.2 1.5 121% Gross Margin % 30.3% 28.0% Operating Expenses Selling, general and administrative (excluding stock - based compensation, amortization and depreciation) 2.4 2.0 0.4 20% Research and product development 1.0 1.1 (0.1) (11)% Adjusted EBITDA $ (0.7) $ (1.9) $ (1.2) (62)% Notes • Adjusted EBITDA is defined as net loss excluding : cash settled long term compensation indexed to share price, share settled stock - based compensation expense, net finance income and expenses, depreciation and amortization . Adjusted EBITDA is a non - IFRS measure and may not be comparable to similar measures used by other companies . • Management uses Adjusted EBITDA as a useful measure of ongoing operational results . • SG&A in Q 1 2016 includes a reversal of an indemnification liability of $ 0 . 5 million . Excluding this reversal, SG&A expenses decreased less than $ 0 . 1 million for the three months ended March 31 , 2017 when compared to the prior period . (in $ millions) Q1 Results
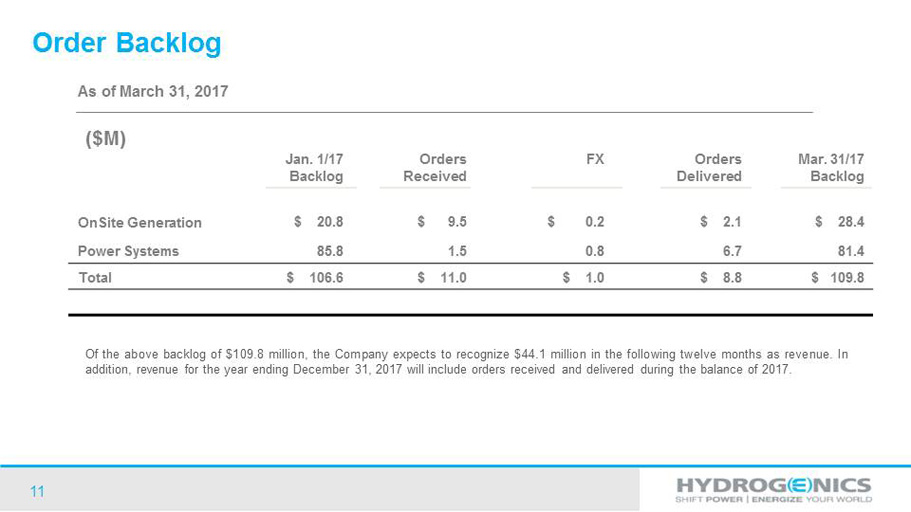
11 Jan. 1/17 Backlog Orders Received FX Orders Delivered Mar. 31/17 Backlog OnSite Generation $ 20.8 $ 9.5 $ 0.2 $ 2.1 $ 28.4 Power Systems 85.8 1.5 0.8 6.7 81.4 Total $ 106.6 $ 11.0 $ 1.0 $ 8.8 $ 109.8 As of March 31, 2017 ($M) Order Backlog Of the above backlog of $ 109 . 8 million, the Company expects to recognize $ 44 . 1 million in the following twelve months as revenue . In addition, revenue for the year ending December 31 , 2017 will include orders received and delivered during the balance of 2017 .
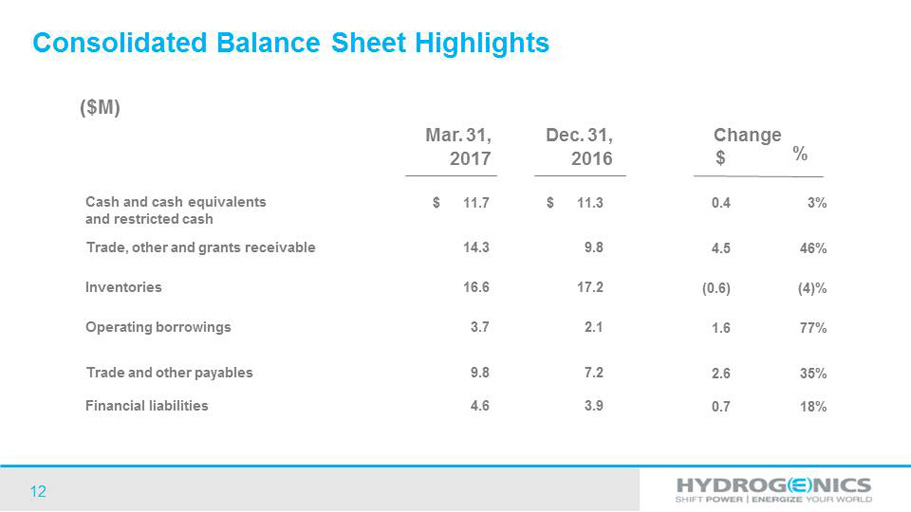
12 Cash and cash equivalents and restricted cash $ 11.7 $ 11.3 0.4 3% Trade, other and grants receivable 14.3 9.8 4.5 46% Inventories 16.6 17.2 (0.6) (4)% Operating borrowings 3.7 2.1 1.6 77% Trade and other payables 9.8 7.2 2.6 35% Financial liabilities 4.6 3.9 0.7 18% Dec. 31, 2016 $ % ($M) Change Mar. 31, 2017 Consolidated Balance Sheet Highlights
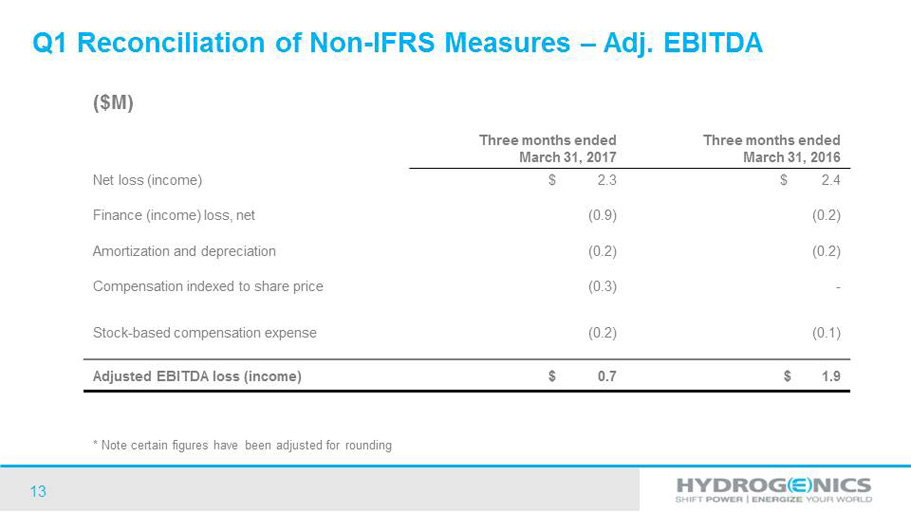
13 Three months ended March 31, 2017 Three months ended March 31, 2016 Net loss (income) $ 2.3 $ 2.4 Finance (income) loss, net (0.9) (0.2) Amortization and depreciation (0.2) (0.2) Compensation indexed to share price (0.3) - Stock - based compensation expense (0.2) (0.1) Adjusted EBITDA loss (income) $ 0.7 $ 1.9 ($M) Q1 Reconciliation of Non - IFRS Measures – Adj. EBITDA * Note certain figures have been adjusted for rounding
14