Exhibit 99.4

1 Q2 2017 EARNINGS PRESENTATION August 2, 2017
2 Safe Harbor Statement Certain statements in the Business Update and Order Backlog sections contain forward - looking statements within the meaning of the “safe harbor” provisions of the U . S . Private Securities Litigation Reform Act of 1995 , and under applicable Canadian securities laws . These statements are based on management’s current expectations and actual results may differ from these forward - looking statements due to numerous factors, including : our inability to increase our revenues or raise additional funding to continue operations, execute our business plan, or to grow our business ; our inability to address a slow return to economic growth, and its impact on our business, results of operations and consolidated financial condition ; our limited operating history ; inability to implement our business strategy ; fluctuations in our quarterly results ; failure to maintain our customer base that generates the majority of our revenues ; currency fluctuations ; failure to maintain sufficient insurance coverage ; changes in value of goodwill ; failure of a significant market to develop for our products ; failure of hydrogen being readily available on a cost - effective basis ; changes in government policies and regulations ; failure of uniform codes and standards for hydrogen fuelled vehicles and related infrastructure to develop ; liability for environmental damages resulting from our research, development or manufacturing operations ; failure to compete with other developers and manufacturers of products in our industry ; failure to compete with developers and manufacturers of traditional and alternative technologies ; failure to develop partnerships with original equipment manufacturers, governments, systems integrators and other third parties ; inability to obtain sufficient materials and components for our products from suppliers ; failure to manage expansion of our operations ; failure to manage foreign sales and operations ; failure to recruit, train and retain key management personnel ; inability to integrate acquisitions ; failure to develop adequate manufacturing processes and capabilities ; failure to complete the development of commercially viable products ; failure to produce cost - competitive products ; failure or delay in field testing of our products ; failure to produce products free of defects or errors ; inability to adapt to technological advances or new codes and standards ; failure to protect our intellectual property ; our involvement in intellectual property litigation ; exposure to product liability claims ; failure to meet rules regarding passive foreign investment companies ; actions of our significant and principal shareholders ; dilution as a result of significant issuances of our common shares and preferred shares ; inability of US investors to enforce US civil liability judgments against us ; volatility of our common share price ; dilution as a result of the exercise of options ; and failure to meet continued listing requirements of Nasdaq . Readers should not place undue reliance on Hydrogenics’ forward - looking statements . Investors are encouraged to review the section captioned “Risk Factors” in our regulatory filings with the Canadian securities regulatory authorities and the US Securities and Exchange Commission for a more complete discussion of factors that could affect our future performance . Furthermore, the forward - looking statements contained herein are made as of the date of this presentation, and we undertake no obligation to revise or update any forward - looking statements in order to reflect events or circumstances that may arise after the date of this presentation, unless otherwise required by law . The forward - looking statements contained in this presentation are expressly qualified by this .
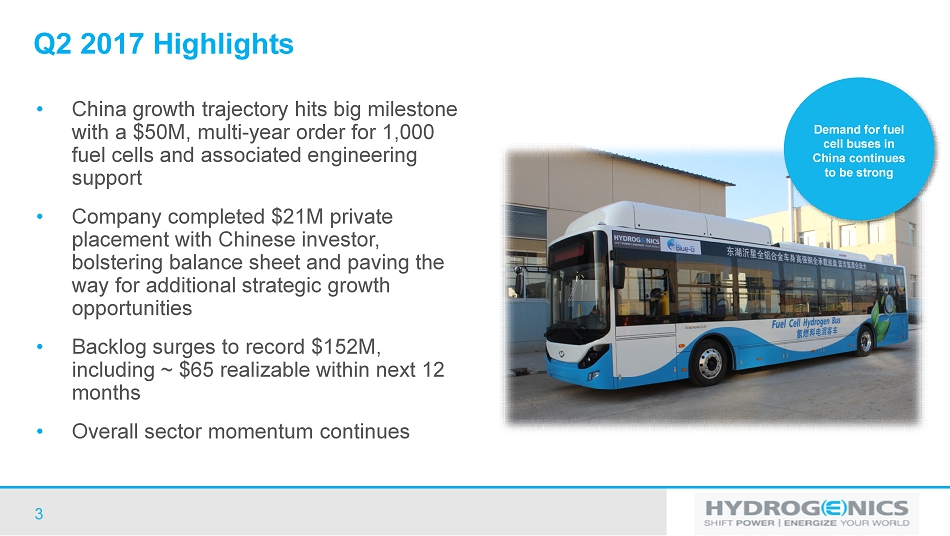
3 Q2 2017 Highlights • China growth trajectory hits big milestone with a $50M, multi - year order for 1,000 fuel cells and associated engineering support • Company completed $21M private placement with Chinese investor, bolstering balance sheet and paving the way for additional strategic growth opportunities • Backlog surges to record $152M, including ~ $65 realizable within next 12 months • Overall sector momentum continues Demand for fuel cell buses in China continues to be strong
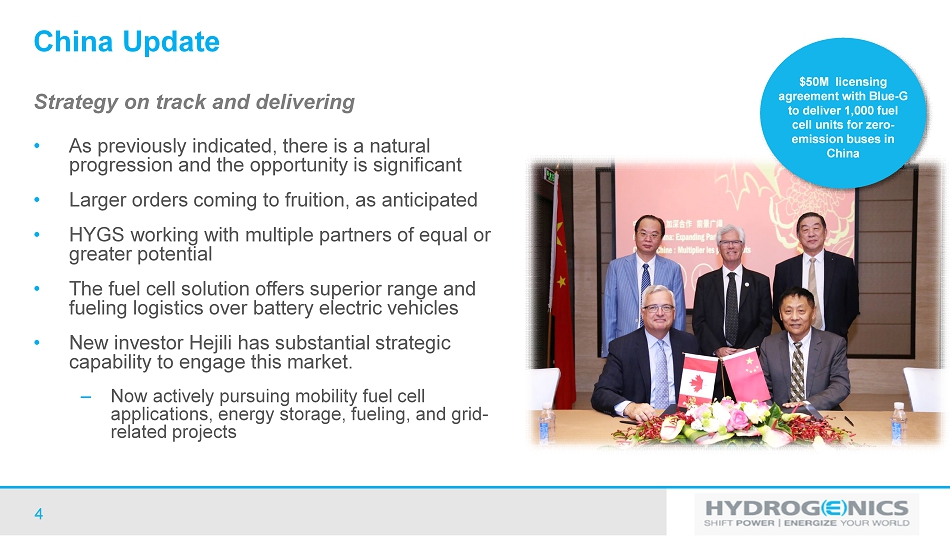
4 China Update • As previously indicated, there is a natural progression and the opportunity is significant • Larger orders coming to fruition, as anticipated • HYGS working with multiple partners of equal or greater potential • The fuel cell solution offers superior range and fueling logistics over battery electric vehicles • New investor Hejili has substantial strategic capability to engage this market. – Now actively pursuing mobility fuel cell applications, energy storage, fueling, and grid - related projects Strategy on track and delivering $50M licensing agreement with Blue - G to deliver 1,000 fuel cell units for zero - emission buses in China

5 Other Recent Awards & Activity Span end markets around the globe • Fuel cells for Scania vehicles owned by Norway's ASKO grocery chain – the first heavy - duty truck order in the EU • UPS launches first of 16 vans with Hydrogenics fuel cells • Numerous other mobility applications, energy storage opportunities, and large - scale power generation contracts being pursued Acceleration of awards for heavy - duty mobility fuel cells and other applications
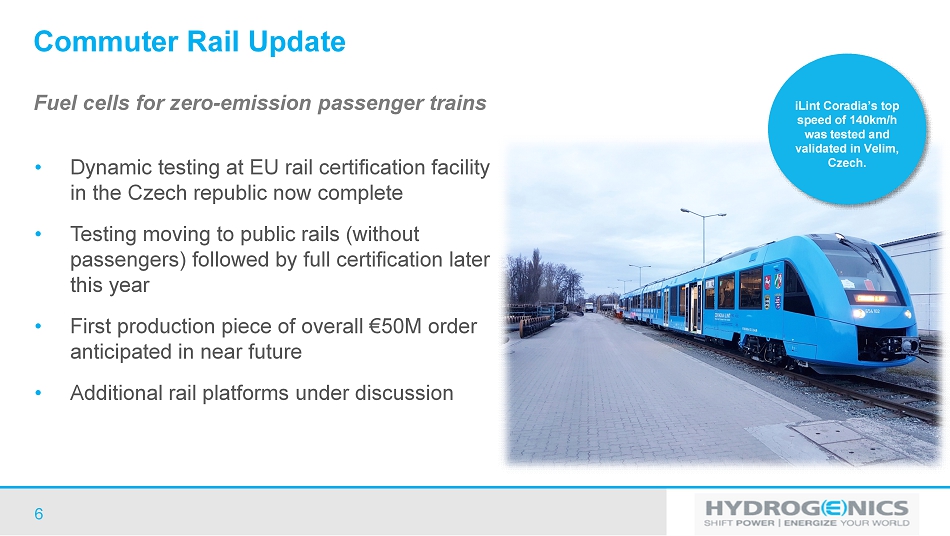
6 Commuter Rail Update • Dynamic testing at EU rail certification facility in the Czech republic now complete • Testing moving to public rails (without passengers) followed by full certification later this year • First production piece of overall € 50M order anticipated in near future • Additional rail platforms under discussion Fuel cells for zero - emission passenger trains iLint Coradia’s top speed of 140km/h was tested and validated in Velim, Czech.
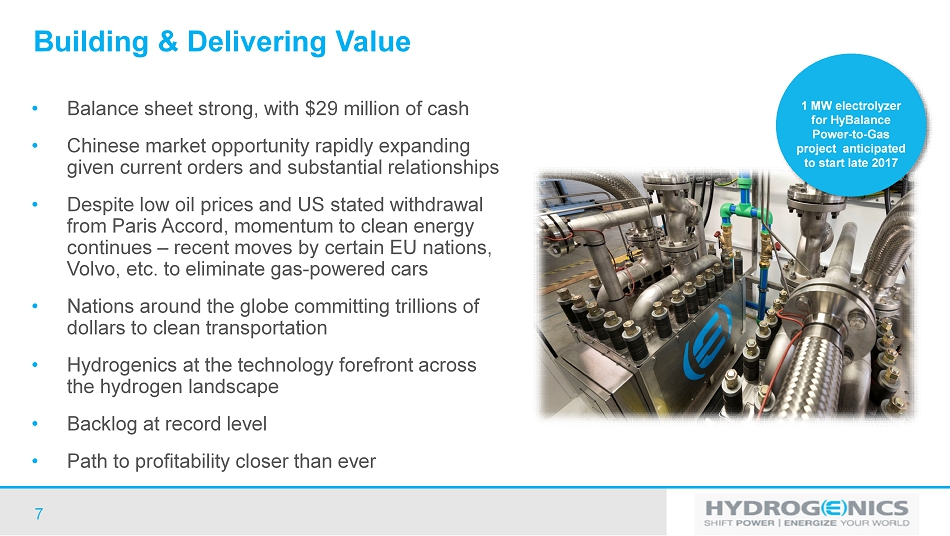
7 Building & Delivering Value • Balance sheet strong, with $29 million of cash • Chinese market opportunity rapidly expanding given current orders and substantial relationships • Despite low oil prices and US stated withdrawal from Paris Accord, momentum to clean energy continues – recent moves by certain EU nations, Volvo, etc. to eliminate gas - powered cars • Nations around the globe committing trillions of dollars to clean transportation • Hydrogenics at the technology forefront across the hydrogen landscape • Backlog at record level • Path to profitability closer than ever 1 MW electrolyzer for HyBalance Power - to - Gas project anticipated to start late 2017
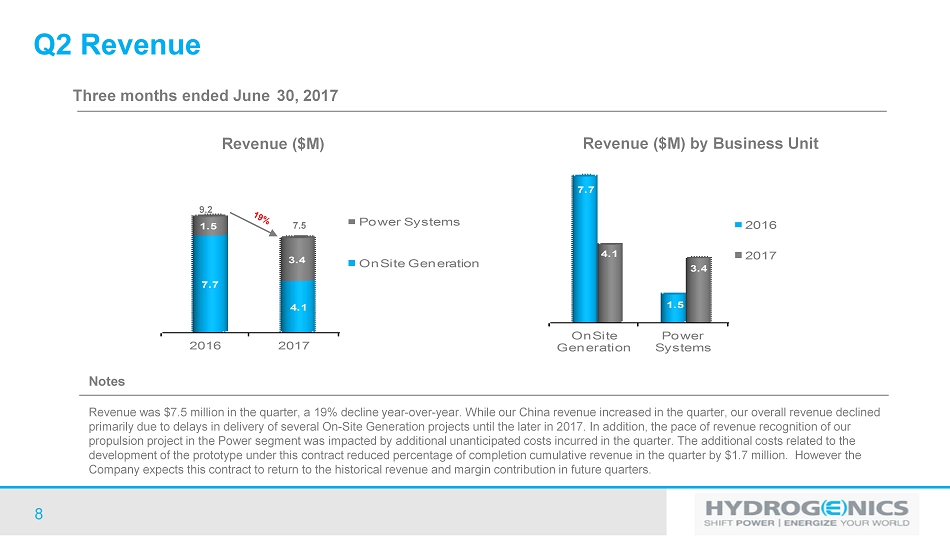
8 2016 2017 7.7 4.1 1.5 3.4 Power Systems OnSite Generation Notes Revenue was $7.5 million in the quarter, a 19% decline year - over - year. While our China revenue increased in the quarter, our overall revenue declined primarily due to delays in delivery of several On - Site Generation projects until the later in 2017. In addition, the pace of rev enue recognition of our propulsion project in the Power segment was impacted by additional unanticipated costs incurred in the quarter. The additiona l c osts related to the development of the prototype under this contract reduced percentage of completion cumulative revenue in the quarter by $1.7 m ill ion. However the Company expects this contract to return to the historical revenue and margin contribution in future quarters. Revenue ($M) Three months ended June 30, 2017 7.5 9.2 Q2 Revenue OnSite Generation Power Systems 7.7 1.5 4.1 3.4 2016 2017 Revenue ($M) by Business Unit

9 2016 2017 9.4 6.2 4.1 10.1 Power Systems OnSite Generation Notes Revenue was $16.3 million YTD, a 21% increase year - over - year. The higher revenue was primarily due to increased activity within the Power Systems business segment including: i) greater deliveries to the Chinese mobility market of $3.7 million; ii) an increase of $1.8 mil lio n related to fuel cells for commuter trains in Europe (Alstom); and iii) an increase in spares and service revenue of $0.4 million; partially offset by i v) a decrease of $0.2 million due to the timing of revenue and re - estimation of costs on the Company’s long - term propulsion contract; and v) fewer OnSite Generati on deliveries. Revenue ($M) Six months ended June 30, 2017 16.3 13.5 YTD Revenue OnSite Generation Power Systems 9.4 4.1 6.2 10.1 2016 2017 Revenue ($M) by Business Unit
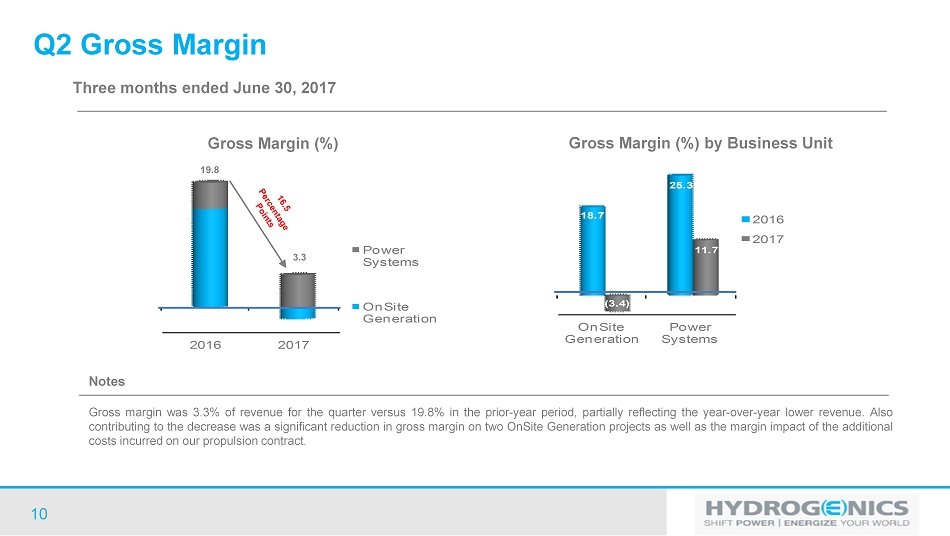
10 2016 2017 Power Systems OnSite Generation Notes Gross margin was 3 . 3 % of revenue for the quarter versus 19 . 8 % in the prior - year period, partially reflecting the year - over - year lower revenue . Also contributing to the decrease was a significant reduction in gross margin on two OnSite Generation projects as well as the margin impact of the additional costs incurred on our propulsion contract . Gross Margin (%) Three months ended June 30, 2017 3.3 19.8 Q2 Gross Margin OnSite Generation Power Systems 18.7 25.3 (3.4) 11.7 2016 2017 Gross Margin (%) by Business Unit

11 2016 2017 Power Systems OnSite Generation Notes Gross margin declined from 22% of revenue for the six months ended June 30, 2016 to 18% in the current - year period, reflecting l ower gross margins on two significant projects in the OnSite Generation business segment as well as the margin impact of the additional costs incurred on our propulsion contract. Gross Margin (%) Six months ended June 30, 2017 17.9 22.4 YTD Gross Margin OnSite Generation Power Systems 16.4 36.1 2.9 27.3 2016 2017 Gross Margin (%) by Business Unit
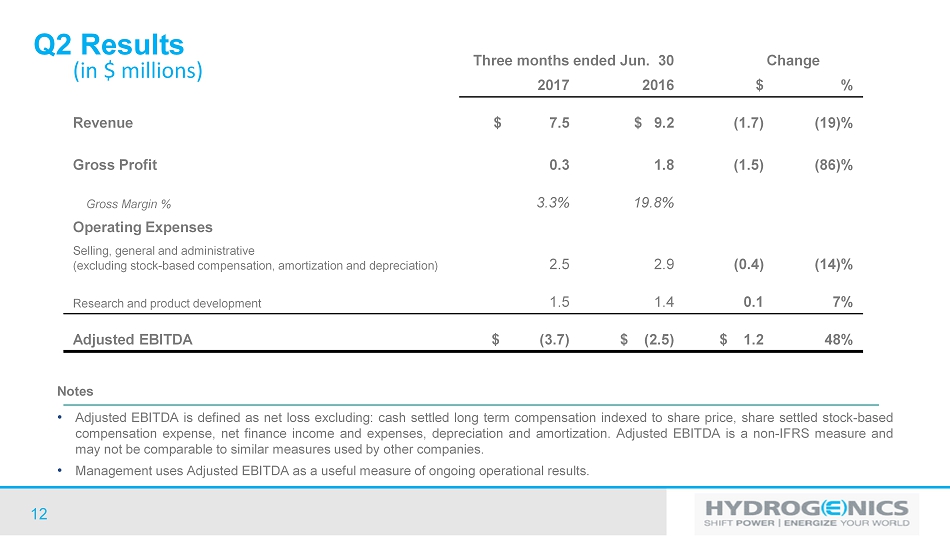
12 Three months ended Jun. 30 Change 2017 2016 $ % Revenue $ 7.5 $ 9.2 (1.7) (19)% Gross Profit 0.3 1.8 (1.5) (86)% Gross Margin % 3.3% 19.8% Operating Expenses Selling, general and administrative (excluding stock - based compensation, amortization and depreciation) 2.5 2.9 (0.4) (14)% Research and product development 1.5 1.4 0.1 7% Adjusted EBITDA $ (3.7) $ (2.5) $ 1.2 48% Notes • Adjusted EBITDA is defined as net loss excluding : cash settled long term compensation indexed to share price, share settled stock - based compensation expense, net finance income and expenses, depreciation and amortization . Adjusted EBITDA is a non - IFRS measure and may not be comparable to similar measures used by other companies . • Management uses Adjusted EBITDA as a useful measure of ongoing operational results . (in $ millions) Q2 Results

13 Six months ended Jun. 30 Change 2017 2016 $ % Revenue $ 16.3 $ 13.5 2.8 21% Gross Profit 2.9 3.0 (0.1) (3)% Gross Margin % 17.9% 22.4% Operating Expenses Selling, general and administrative (excluding stock - based compensation, amortization and depreciation) 4.8 4.8 - - % Research and product development 2.5 2.6 (0.1) (3)% Adjusted EBITDA $ (4.4) $ (4.4) $ - - % Notes • Adjusted EBITDA is defined as net loss excluding : cash settled long term compensation indexed to share price, share settled stock - based compensation expense, net finance income and expenses, depreciation and amortization . Adjusted EBITDA is a non - IFRS measure and may not be comparable to similar measures used by other companies . • Management uses Adjusted EBITDA as a useful measure of ongoing operational results . (in $ millions) YTD Results
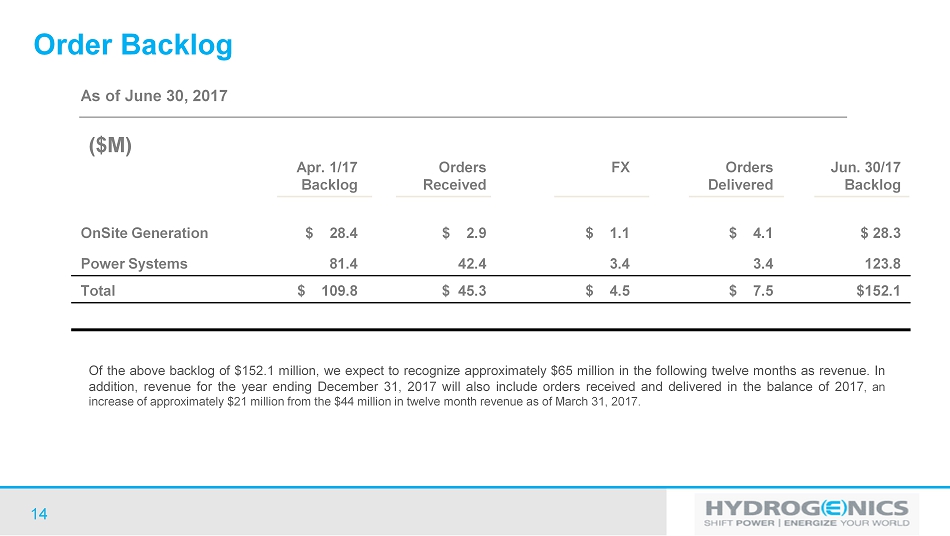
14 Apr. 1/17 Backlog Orders Received FX Orders Delivered Jun. 30/17 Backlog OnSite Generation $ 28.4 $ 2.9 $ 1.1 $ 4.1 $ 28.3 Power Systems 81.4 42.4 3.4 3.4 123.8 Total $ 109.8 $ 45.3 $ 4.5 $ 7.5 $152.1 As of June 30, 2017 ($M) Order Backlog Of the above backlog of $ 152 . 1 million, we expect to recognize approximately $ 65 million in the following twelve months as revenue . In addition, revenue for the year ending December 31 , 2017 will also include orders received and delivered in the balance of 2017 , an increase of approximately $ 21 million from the $ 44 million in twelve month revenue as of March 31 , 2017 .
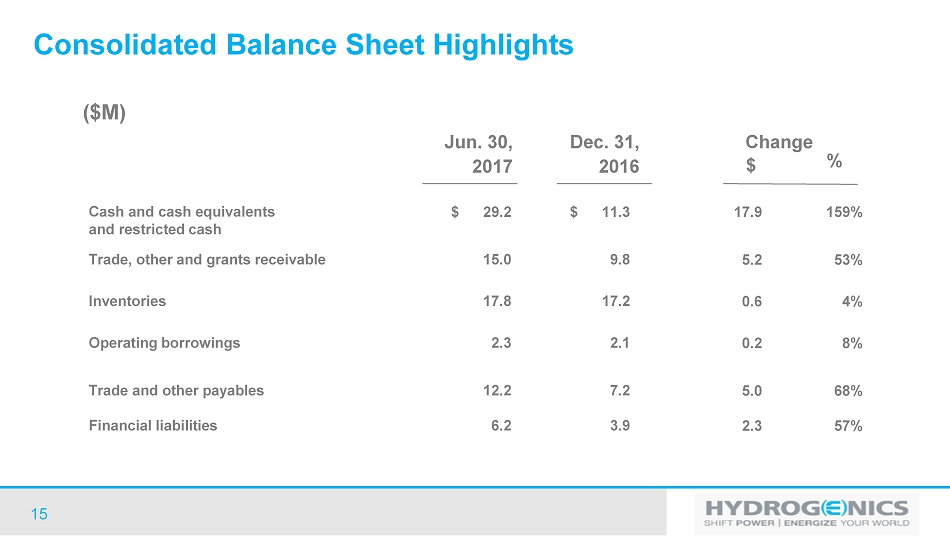
15 Cash and cash equivalents and restricted cash $ 29.2 $ 11.3 17.9 159% Trade, other and grants receivable 15.0 9.8 5.2 53% Inventories 17.8 17.2 0.6 4% Operating borrowings 2.3 2.1 0.2 8% Trade and other payables 12.2 7.2 5.0 68% Financial liabilities 6.2 3.9 2.3 57% Dec. 31, 2016 $ % ($M) Change Jun. 30, 2017 Consolidated Balance Sheet Highlights
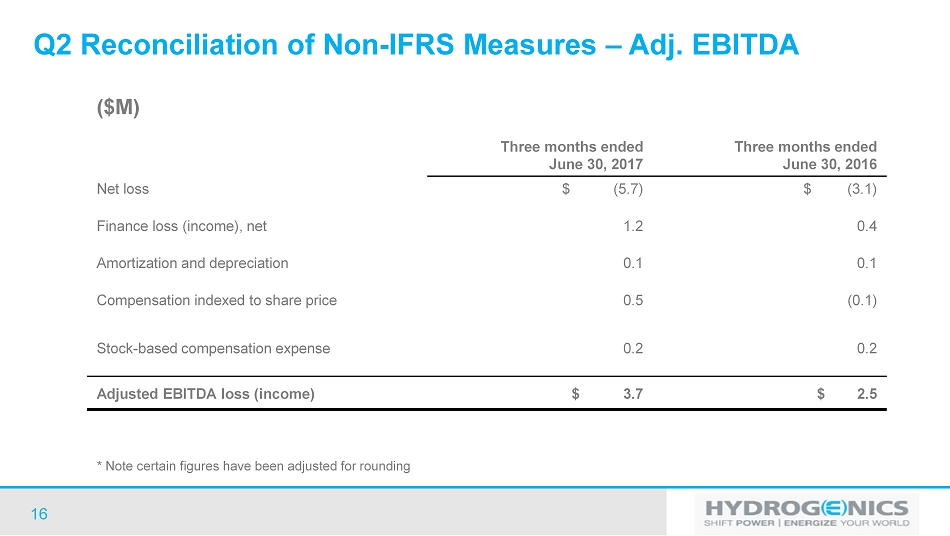
16 Three months ended June 30, 2017 Three months ended June 30, 2016 Net loss $ (5.7) $ (3.1) Finance loss (income), net 1.2 0.4 Amortization and depreciation 0.1 0.1 Compensation indexed to share price 0.5 (0.1) Stock - based compensation expense 0.2 0.2 Adjusted EBITDA loss (income) $ 3.7 $ 2.5 ($M) Q2 Reconciliation of Non - IFRS Measures – Adj. EBITDA * Note certain figures have been adjusted for rounding
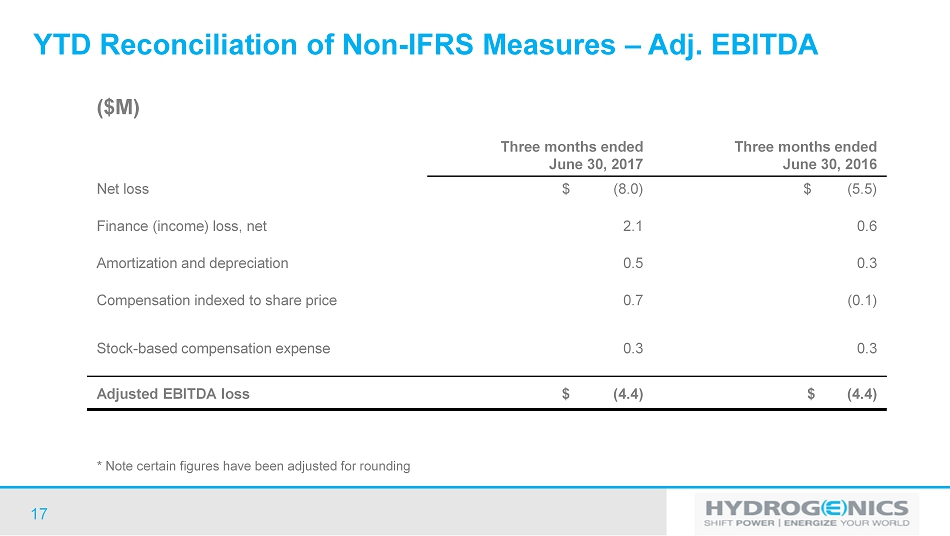
17 Three months ended June 30, 2017 Three months ended June 30, 2016 Net loss $ (8.0) $ (5.5) Finance (income) loss, net 2.1 0.6 Amortization and depreciation 0.5 0.3 Compensation indexed to share price 0.7 (0.1) Stock - based compensation expense 0.3 0.3 Adjusted EBITDA loss $ (4.4) $ (4.4) ($M) YTD Reconciliation of Non - IFRS Measures – Adj. EBITDA * Note certain figures have been adjusted for rounding

18