Exhibit 99.4
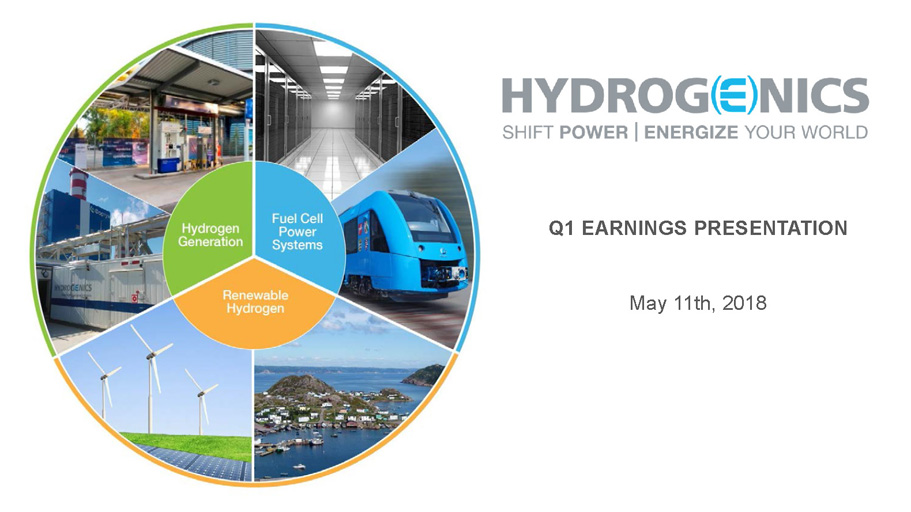
1 Q1 EARNINGS PRESENTATION May 11th, 2018
2 Safe Harbor Statement Certain statements in the Business Update and Order Backlog sections contain forward - looking statements within the meaning of the “safe harbor” provisions of the U . S . Private Securities Litigation Reform Act of 1995 , and under applicable Canadian securities laws . These statements are based on management’s current expectations and actual results may differ from these forward - looking statements due to numerous factors, including : our inability to increase our revenues or raise additional funding to continue operations, execute our business plan, or to grow our business ; our inability to address a slow return to economic growth, and its impact on our business, results of operations and consolidated financial condition ; our limited operating history ; inability to implement our business strategy ; fluctuations in our quarterly results ; failure to maintain our customer base that generates the majority of our revenues ; currency fluctuations ; failure to maintain sufficient insurance coverage ; changes in value of goodwill ; failure of a significant market to develop for our products ; failure of hydrogen being readily available on a cost - effective basis ; changes in government policies and regulations ; failure of uniform codes and standards for hydrogen fuelled vehicles and related infrastructure to develop ; liability for environmental damages resulting from our research, development or manufacturing operations ; failure to compete with other developers and manufacturers of products in our industry ; failure to compete with developers and manufacturers of traditional and alternative technologies ; failure to develop partnerships with original equipment manufacturers, governments, systems integrators and other third parties ; inability to obtain sufficient materials and components for our products from suppliers ; failure to manage expansion of our operations ; failure to manage foreign sales and operations ; failure to recruit, train and retain key management personnel ; inability to integrate acquisitions ; failure to develop adequate manufacturing processes and capabilities ; failure to complete the development of commercially viable products ; failure to produce cost - competitive products ; failure or delay in field testing of our products ; failure to produce products free of defects or errors ; inability to adapt to technological advances or new codes and standards ; failure to protect our intellectual property ; our involvement in intellectual property litigation ; exposure to product liability claims ; failure to meet rules regarding passive foreign investment companies ; actions of our significant and principal shareholders ; dilution as a result of significant issuances of our common shares and preferred shares ; inability of US investors to enforce US civil liability judgments against us ; volatility of our common share price ; dilution as a result of the exercise of options ; and failure to meet continued listing requirements of Nasdaq . Readers should not place undue reliance on Hydrogenics’ forward - looking statements . Investors are encouraged to review the section captioned “Risk Factors” in our regulatory filings with the Canadian securities regulatory authorities and the US Securities and Exchange Commission for a more complete discussion of factors that could affect our future performance . Furthermore, the forward - looking statements contained herein are made as of the date of this presentation, and we undertake no obligation to revise or update any forward - looking statements in order to reflect events or circumstances that may arise after the date of this presentation, unless otherwise required by law . The forward - looking statements contained in this presentation are expressly qualified by this .

3 Q1 2018 Highlights • Significant volume in China from 2017 being deployed and evaluated as new orders await • Q1 revenues flat but greatly improved margin profile due to product mix • Deliveries and orders not indicative of outlook for 2018 as a whole • R&D investment in programs for rail, mobility and Power - to - Gas (P2G) support major opportunities going forward • Strong cash position continues • Solid backlog supports ongoing growth In China the path to higher orders continues with test and evaluation phase
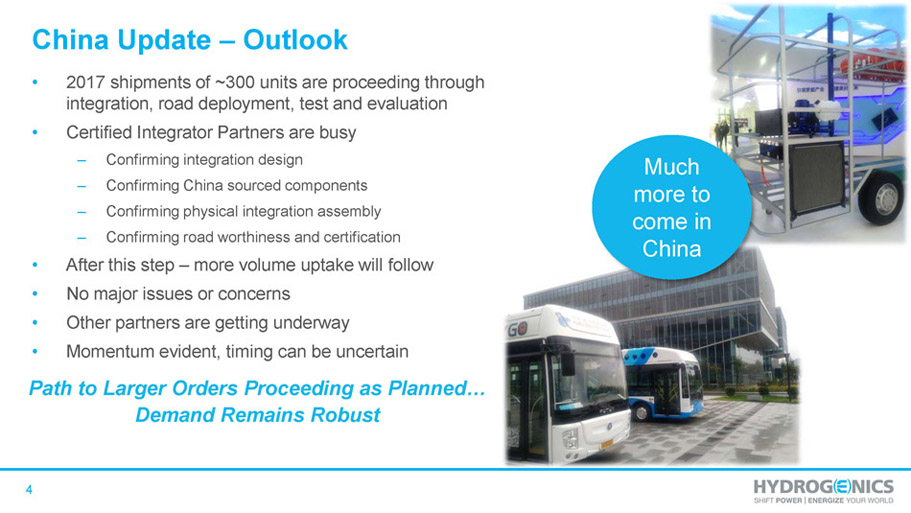
4 China Update – Outlook • 2017 shipments of ~300 units are proceeding through integration, road deployment, test and evaluation • Certified Integrator Partners are busy – Confirming integration design – Confirming China sourced components – Confirming physical integration assembly – Confirming road worthiness and certification • After this step – more volume uptake will follow • No major issues or concerns • Other partners are getting underway Path to Larger Orders Proceeding as Planned… Demand Remains Robust Much more to come in China • Momentum evident, timing can be uncertain
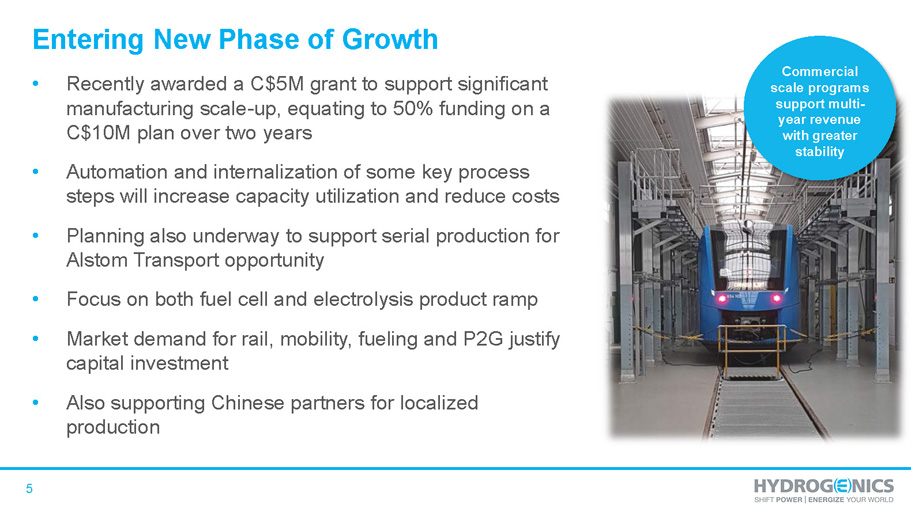
5 Entering New Phase of Growth • Recently awarded a C$5M grant to support significant manufacturing scale - up, equating to 50% funding on a C$10M plan over two years • Automation and internalization of some key process steps will increase capacity utilization and reduce costs • Planning also underway to support serial production for Alstom Transport opportunity • Focus on both fuel cell and electrolysis product ramp • Market demand for rail, mobility, fueling and P2G justify capital investment • Also supporting Chinese partners for localized production Commercial scale programs support multi - year revenue with greater stability
6 Our Strategy and Value Creation 1. We have developed robust PEM technology platforms for fuel cells and electrolysis with market leading product maturity 2. Our 24 years of experience supports safe, reliable and cost - effective application deployments inspiring the trust of new, innovative partners 3. Markets are now emerging for mobility, rail, fuel and power to gas which will drive significant scale up - and we have the credibility to deliver 4. Rail applications are a perfect illustration of how our technology links renewable energy generation, hydrogen fueling and zero emission mobility 5. We have the partners and relationships to carry these applications at scale 6. Our financial and manufacturing model will benefit from operating leverage to realize sustainable profitable growth

7 2017 2018 2.1 3.8 6.6 4.3 Power Systems OnSite Generation Notes Revenues decreased 7%, or $0.6 million, to $8.1 million in the quarter. OnSite Generation revenue was up $1.7 million as a re sul t of greater industrial hydrogen orders shipped. Revenue from Power Systems was down $2.3 million as the comparative quarter inclu ded $1.7 million in revenue related to hydrogen fuel cell systems for commuter trains in Europe as well as greater revenue relate d t o the long - term integrated power propulsion contract. Revenue ($M) Three months ended March 31, 2018 8.1 8.7 Q1 Revenue OnSite Generation Power Systems 2.1 6.6 3.8 4.3 2017 2018 Revenue ($M) by Business Unit
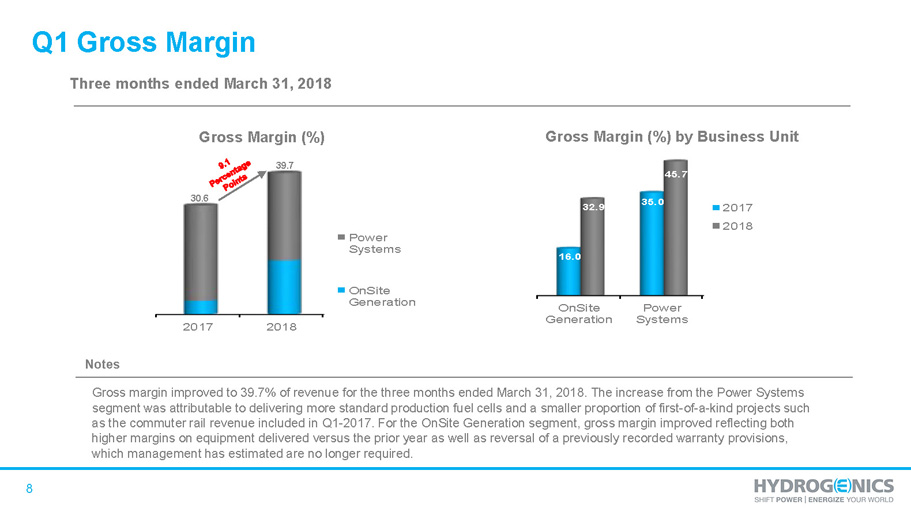
8 2017 2018 Power Systems OnSite Generation Notes Gross Margin (%) Three months ended March 31, 2018 39.7 30.6 Q1 Gross Margin OnSite Generation Power Systems 16.0 35.0 32.9 45.7 2017 2018 Gross Margin (%) by Business Unit Gross margin improved to 39.7% of revenue for the three months ended March 31, 2018. The increase from the Power Systems segment was attributable to delivering more standard production fuel cells and a smaller proportion of first - of - a - kind projects such as the commuter rail revenue included in Q1 - 2017. For the OnSite Generation segment, gross margin improved reflecting both higher margins on equipment delivered versus the prior year as well as reversal of a previously recorded warranty provisions, which management has estimated are no longer required.

9 Notes Adjusted EBITDA is defined as net loss excluding : cash settled long term compensation indexed to share price, share settled stock - based compensation expense, net finance income and expenses, depreciation and amortization . Adjusted EBITDA is a non - IFRS measure and may not be comparable to similar measures used by other companies . Management uses Adjusted EBITDA as a useful measure of ongoing operational results . (in $ millions) Q1 Results 1 Research and product development 2018 2017 Gross r esearch and product development expenses $ 3 . 0 $ 1 . 7 Government research and product development funding ( 0 . 9 ) ( 0 . 7 ) Net research and product development $ 2 . 1 $ 1 . 0 Three months ended Mar. 31, Change 2018 2017 $ % Revenue $ 8.1 $ 8.7 (0.6) (7)% Gross Profit 3.2 2.7 0.5 17% Gross Margin % 39.7% 30.6% Operating Expenses Selling, general and administrative (excluding stock - based compensation, amortization and depreciation) 2.7 2.4 0.3 14% Research and product development 1 2.1 1.0 1.1 107% Adjusted EBITDA $ (1.6) $ (0.7) (0.9) (129)%
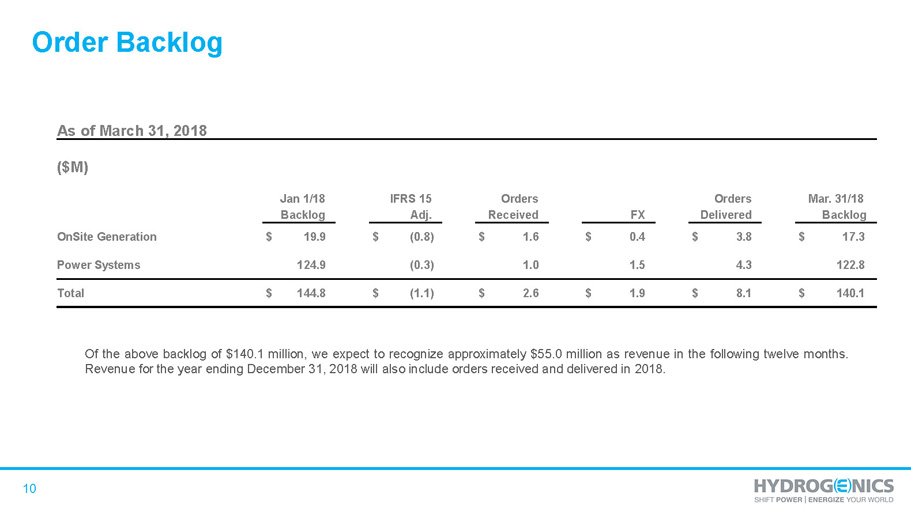
10 Order Backlog Of the above backlog of $ 140 . 1 million, we expect to recognize approximately $ 55 . 0 million as revenue in the following twelve months . Revenue for the year ending December 31 , 2018 will also include orders received and delivered in 2018 . As of March 31, 2018 ($M) Jan 1/18 IFRS 15 Orders Orders Mar. 31/18 Backlog Adj. Received FX Delivered Backlog OnSite Generation $ 19.9 $ (0.8) $ 1.6 $ 0.4 $ 3.8 $ 17.3 Power Systems 124.9 (0.3) 1.0 1.5 4.3 122.8 Total $ 144.8 $ (1.1) $ 2.6 $ 1.9 $ 8.1 $ 140.1
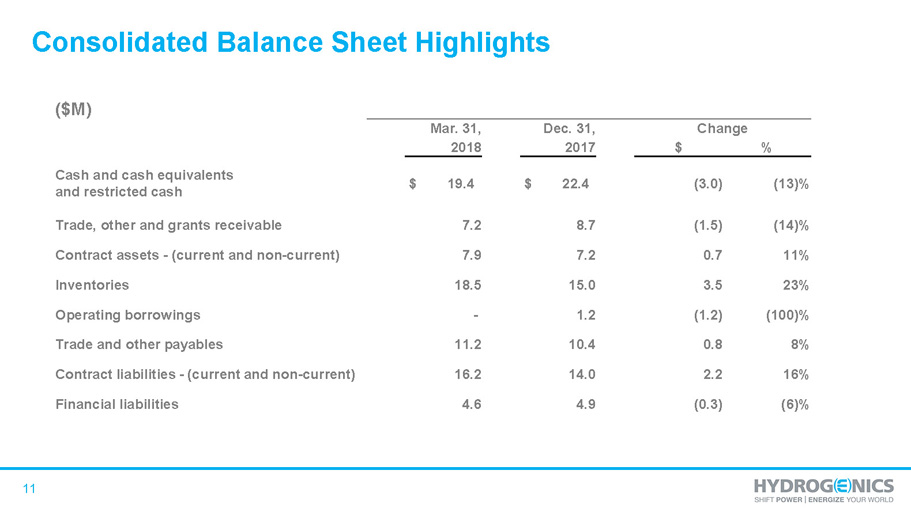
11 Consolidated Balance Sheet Highlights ($M) Mar. 31, Dec. 31, Change 2018 2017 $ % Cash and cash equivalents and restricted cash $ 19.4 $ 22.4 (3.0) (13)% Trade, other and grants receivable 7.2 8.7 (1.5) (14)% Contract assets - (current and non - current) 7.9 7.2 0.7 11% Inventories 18.5 15.0 3.5 23% Operating borrowings - 1.2 (1.2) (100)% Trade and other payables 11.2 10.4 0.8 8% Contract liabilities - (current and non - current) 16.2 14.0 2.2 16% Financial liabilities 4.6 4.9 (0.3) (6)%
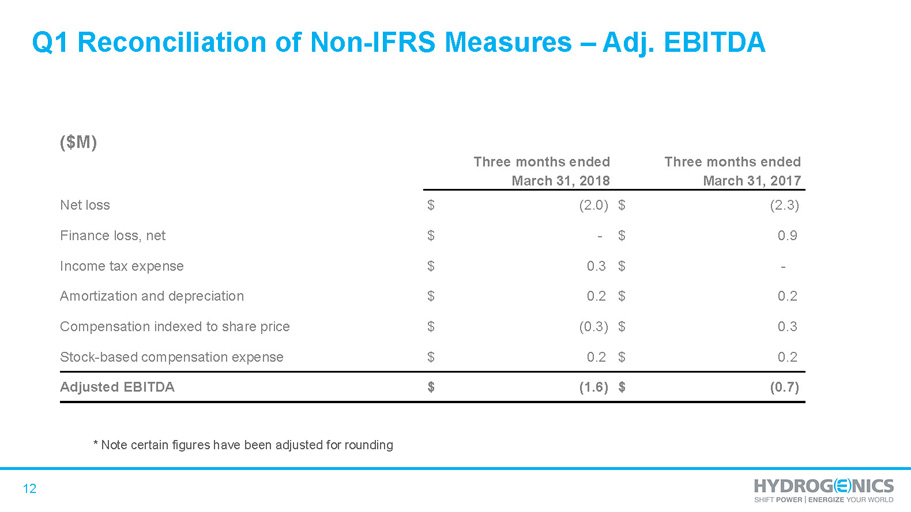
12 Q1 Reconciliation of Non - IFRS Measures – Adj. EBITDA * Note certain figures have been adjusted for rounding ($M) Three months ended Three months ended March 31, 2018 March 31, 2017 Net loss $ (2.0) $ (2.3) Finance loss, net $ - $ 0.9 Income tax expense $ 0.3 $ - Amortization and depreciation $ 0.2 $ 0.2 Compensation indexed to share price $ (0.3) $ 0.3 Stock - based compensation expense $ 0.2 $ 0.2 Adjusted EBITDA $ (1.6) $ (0.7)

13