Exhibit 99.4
1 Q3 EARNINGS PRESENTATION Milestones Move Markets November 2, 2018
2 Safe Harbor Statement Certain statements in the Business Update and Order Backlog sections contain forward - looking statements within the meaning of the “safe harbor” provisions of the U . S . Private Securities Litigation Reform Act of 1995 , and under applicable Canadian securities laws . These statements are based on management’s current expectations and actual results may differ from these forward - looking statements due to numerous factors, including : our inability to increase our revenues or raise additional funding to continue operations, execute our business plan, or to grow our business ; our inability to address a slow return to economic growth, and its impact on our business, results of operations and consolidated financial condition ; our limited operating history ; inability to implement our business strategy ; fluctuations in our quarterly results ; failure to maintain our customer base that generates the majority of our revenues ; currency fluctuations ; failure to maintain sufficient insurance coverage ; changes in value of goodwill ; failure of a significant market to develop for our products ; failure of hydrogen being readily available on a cost - effective basis ; changes in government policies and regulations ; failure of uniform codes and standards for hydrogen fuelled vehicles and related infrastructure to develop ; liability for environmental damages resulting from our research, development or manufacturing operations ; failure to compete with other developers and manufacturers of products in our industry ; failure to compete with developers and manufacturers of traditional and alternative technologies ; failure to develop partnerships with original equipment manufacturers, governments, systems integrators and other third parties ; inability to obtain sufficient materials and components for our products from suppliers ; failure to manage expansion of our operations ; failure to manage foreign sales and operations ; failure to recruit, train and retain key management personnel ; inability to integrate acquisitions ; failure to develop adequate manufacturing processes and capabilities ; failure to complete the development of commercially viable products ; failure to produce cost - competitive products ; failure or delay in field testing of our products ; failure to produce products free of defects or errors ; inability to adapt to technological advances or new codes and standards ; failure to protect our intellectual property ; our involvement in intellectual property litigation ; exposure to product liability claims ; failure to meet rules regarding passive foreign investment companies ; actions of our significant and principal shareholders ; dilution as a result of significant issuances of our common shares and preferred shares ; inability of US investors to enforce US civil liability judgments against us ; volatility of our common share price ; dilution as a result of the exercise of options ; and failure to meet continued listing requirements of Nasdaq . Readers should not place undue reliance on Hydrogenics’ forward - looking statements . Investors are encouraged to review the section captioned “Risk Factors” in our regulatory filings with the Canadian securities regulatory authorities and the US Securities and Exchange Commission for a more complete discussion of factors that could affect our future performance . Furthermore, the forward - looking statements contained herein are made as of the date of this presentation, and we undertake no obligation to revise or update any forward - looking statements in order to reflect events or circumstances that may arise after the date of this presentation, unless otherwise required by law . The forward - looking statements contained in this presentation are expressly qualified by this .
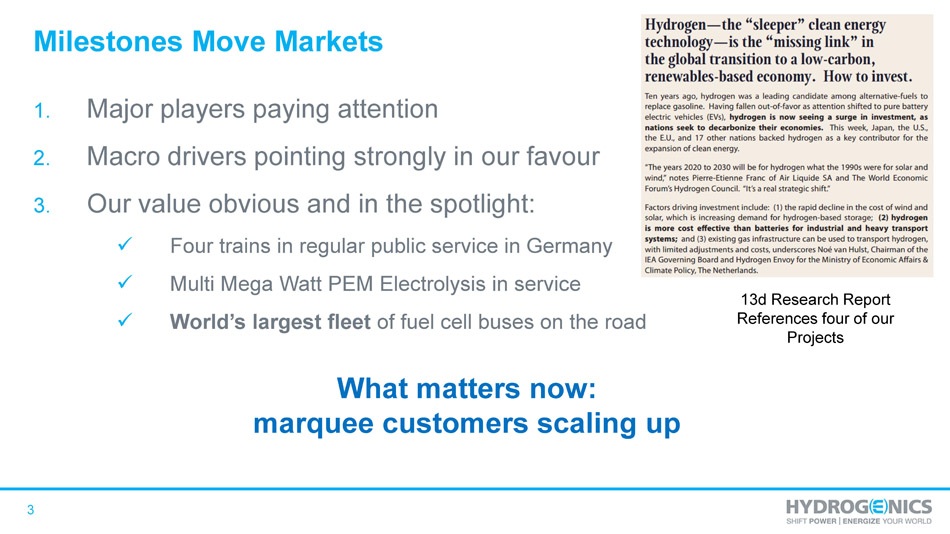
3 Milestones Move Markets 1. Major players paying attention 2. Macro drivers pointing strongly in our favour 3. Our value obvious and in the spotlight: x Four trains in regular public service in Germany x Multi Mega Watt PEM Electrolysis in service x World’s largest fleet of fuel cell buses on the road What matters now: marquee customers scaling up 13d Research Report References four of our Projects
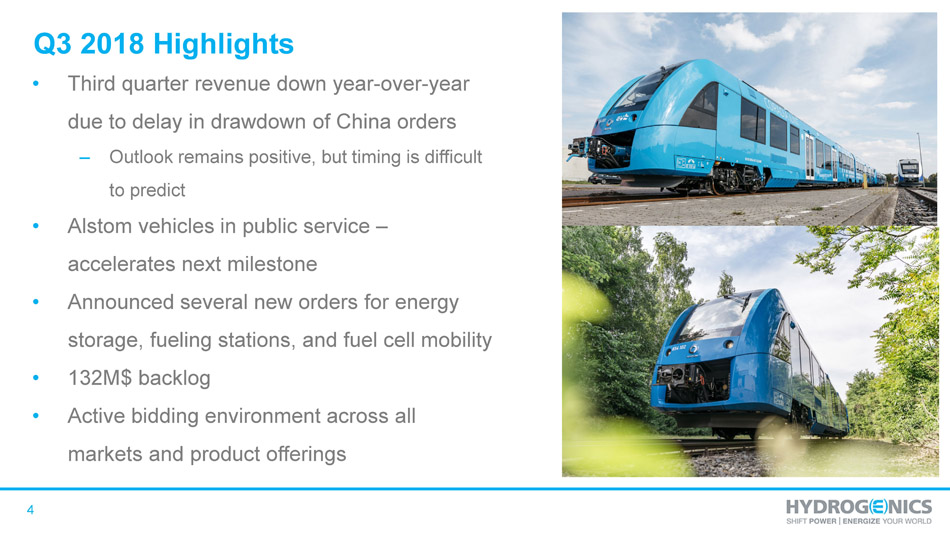
4 Q3 2018 Highlights • Third quarter revenue down year - over - year due to delay in drawdown of China orders – Outlook remains positive, but timing is difficult to predict • Alstom vehicles in public service – accelerates next milestone • Announced several new orders for energy storage, fueling stations, and fuel cell mobility • 132M$ backlog • Active bidding environment across all markets and product offerings
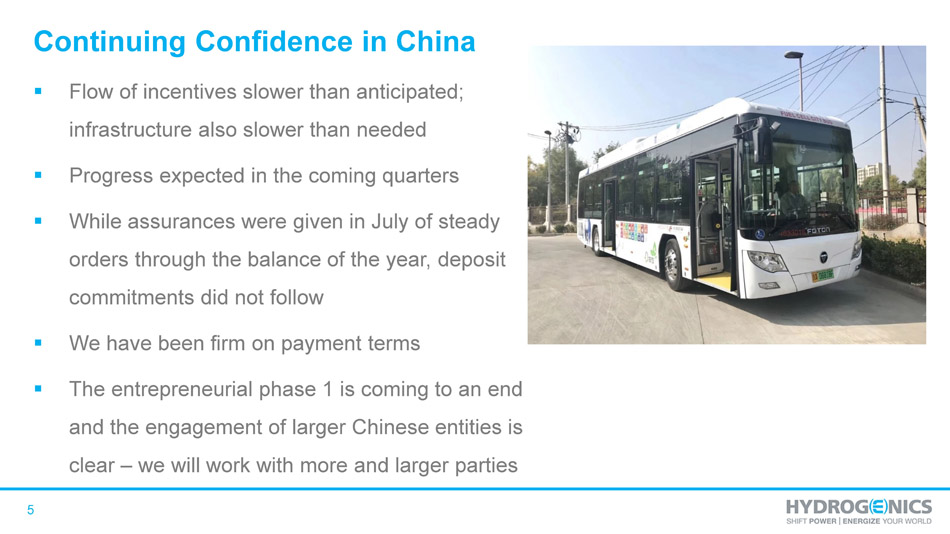
5 Continuing Confidence in China ▪ Flow of incentives slower than anticipated; infrastructure also slower than needed ▪ Progress expected in the coming quarters ▪ While assurances were given in July of steady orders through the balance of the year, deposit commitments did not follow ▪ We have been firm on payment terms ▪ The entrepreneurial phase 1 is coming to an end and the engagement of larger Chinese entities is clear – we will work with more and larger parties
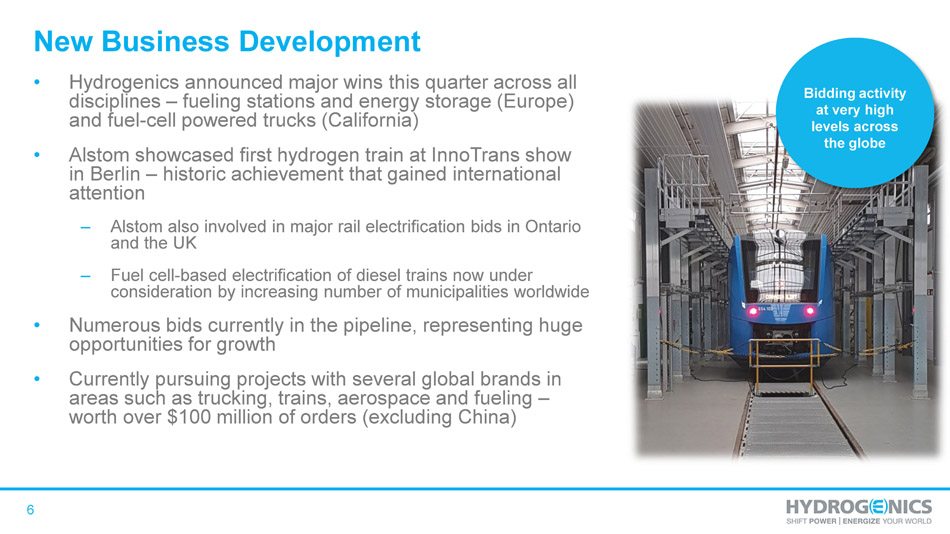
6 New Business Development • Hydrogenics announced major wins this quarter across all disciplines – fueling stations and energy storage (Europe) and fuel - cell powered trucks (California) • Alstom showcased first hydrogen train at InnoTrans show in Berlin – historic achievement that gained international attention – Alstom also involved in major rail electrification bids in Ontario and the UK – Fuel cell - based electrification of diesel trains now under consideration by increasing number of municipalities worldwide • Numerous bids currently in the pipeline, representing huge opportunities for growth • Currently pursuing projects with several global brands in areas such as trucking, trains, aerospace and fueling – worth over $100 million of orders (excluding China) Bidding activity at very high levels across the globe
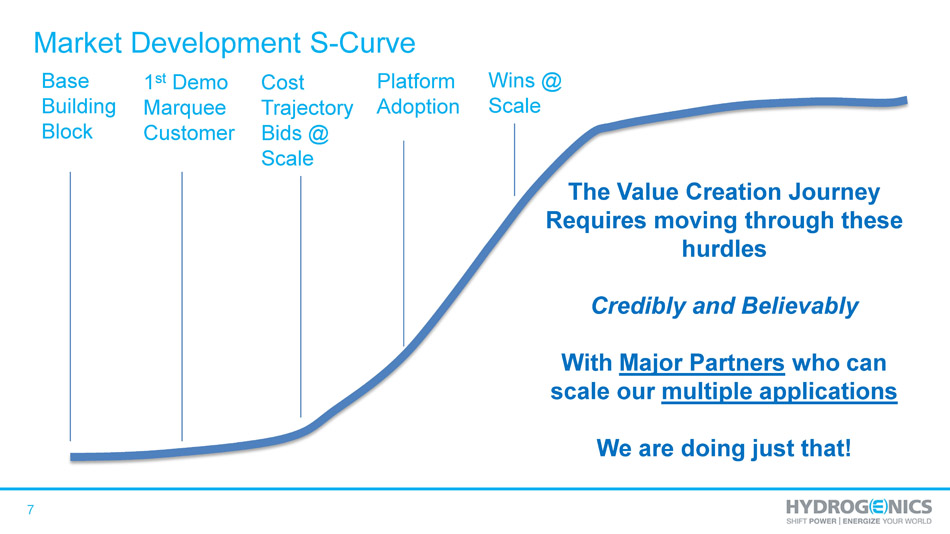
7 Market Development S - Curve Base Building Block 1 st Demo Marquee Customer Cost Trajectory Bids @ Scale Platform Adoption Wins @ Scale The Value Creation Journey Requires moving through these hurdles Credibly and Believably With Major Partners who can scale our multiple applications We are doing just that!
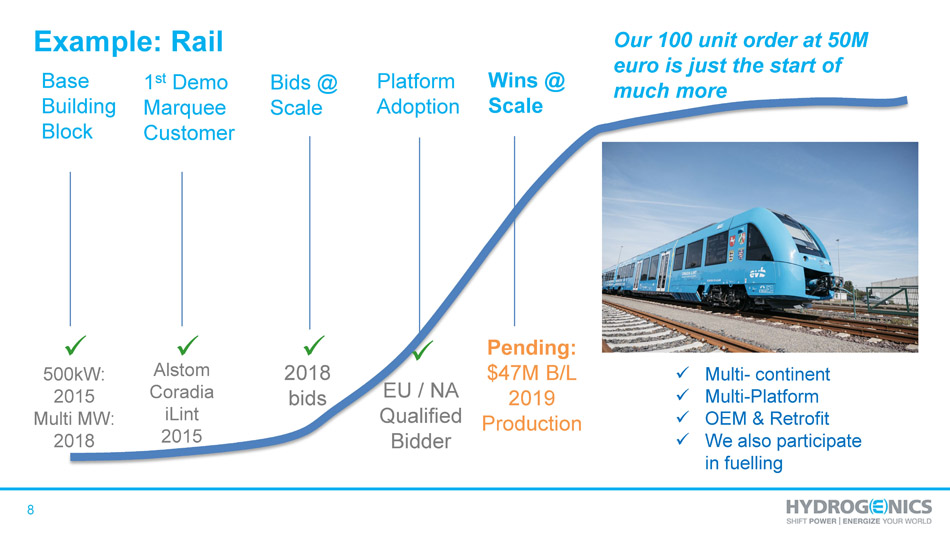
8 Example: Rail Base Building Block 1 st Demo Marquee Customer Bids @ Scale Platform Adoption Wins @ Scale 500kW: 2015 Multi MW: 2018 Alstom Coradia iLint 2015 2018 bids EU / NA Qualified Bidder Pending: $47M B/L 2019 Production x x x x x Multi - continent x Multi - Platform x OEM & Retrofit x We also participate in fuelling Our 100 unit order at 50M euro is just the start of much more
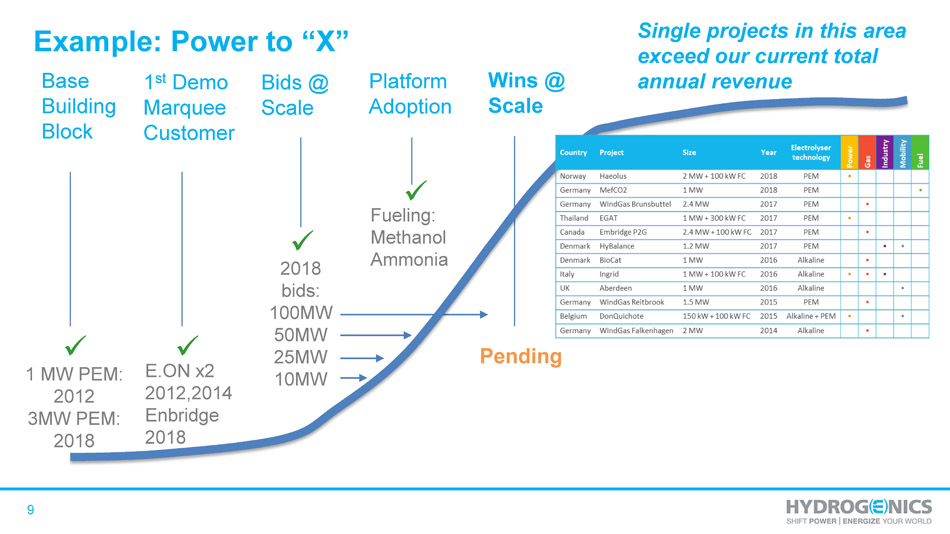
9 Example: Power to “X” Base Building Block 1 st Demo Marquee Customer Bids @ Scale Platform Adoption Wins @ Scale 1 MW PEM: 2012 3MW PEM: 2018 E.ON x2 2012,2014 Enbridge 2018 2018 bids: 100MW 50MW 25MW 10MW Fueling: Methanol Ammonia Pending x x x x Single projects in this area exceed our current total annual revenue
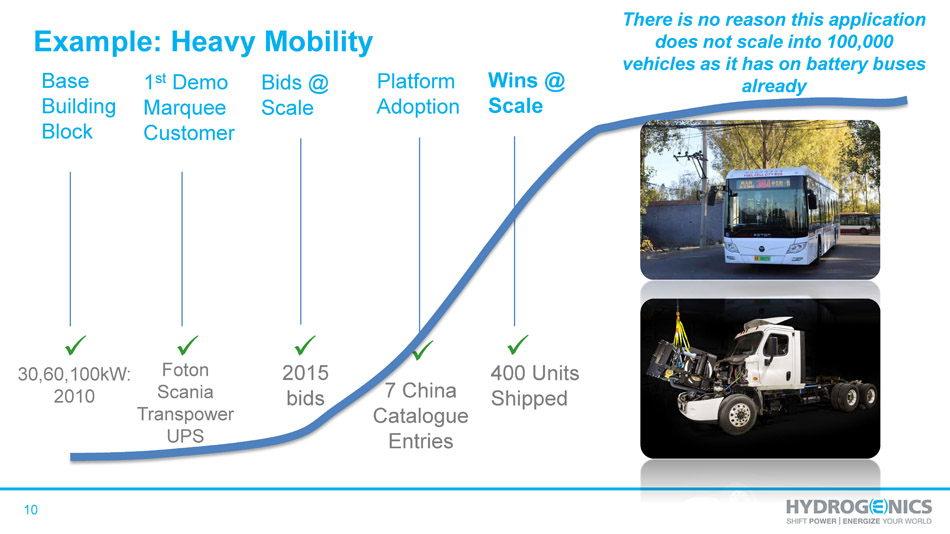
10 Example: Heavy Mobility Base Building Block 1 st Demo Marquee Customer Bids @ Scale Platform Adoption Wins @ Scale 30,60,100kW: 2010 Foton Scania Transpower UPS 2015 bids 7 China Catalogue Entries 400 Units Shipped x x x x x There is no reason this application does not scale into 100,000 vehicles as it has on battery buses already
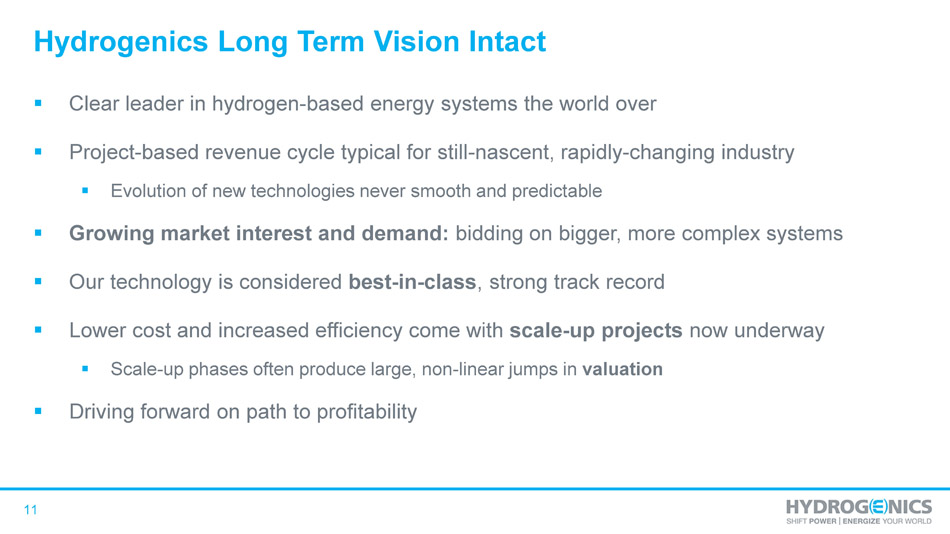
11 Hydrogenics Long Term Vision Intact ▪ Clear leader in hydrogen - based energy systems the world over ▪ Project - based revenue cycle typical for still - nascent, rapidly - changing industry ▪ Evolution of new technologies never smooth and predictable ▪ Growing market interest and demand: bidding on bigger, more complex systems ▪ Our technology is considered best - in - class , strong track record ▪ Lower cost and increased efficiency come with scale - up projects now underway ▪ Scale - up phases often produce large, non - linear jumps in valuation ▪ Driving forward on path to profitability
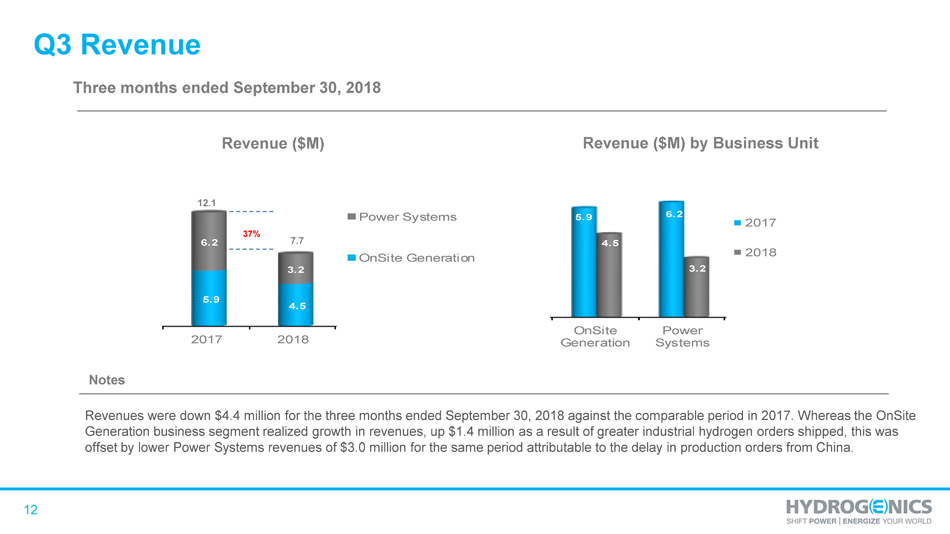
12 2017 2018 5.9 4.5 6.2 3.2 Power Systems OnSite Generation Notes Revenue ($M) Three months ended September 30, 2018 7.7 12.1 Q3 Revenue 37% OnSite Generation Power Systems 5.9 6.2 4.5 3.2 2017 2018 Revenue ($M) by Business Unit Revenues were down $4.4 million for the three months ended September 30, 2018 against the comparable period in 2017. Whereas the OnSite Generation business segment realized growth in revenues, up $1.4 million as a result of greater industrial hydrogen orders sh ipp ed, this was offset by lower Power Systems revenues of $3.0 million for the same period attributable to the delay in production orders fro m C hina.
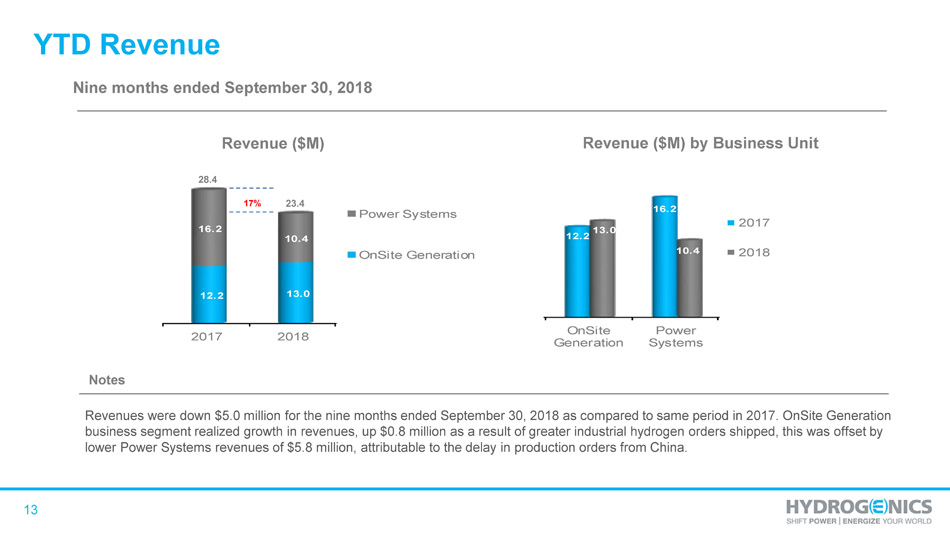
13 2017 2018 12.2 13.0 16.2 10.4 Power Systems OnSite Generation Notes Revenue ($M) Nine months ended September 30, 2018 23.4 28.4 YTD Revenue 17% OnSite Generation Power Systems 12.2 16.2 13 .0 10.4 2017 2018 Revenue ($M) by Business Unit Revenues were down $5.0 million for the nine months ended September 30, 2018 as compared to same period in 2017. OnSite Generati on business segment realized growth in revenues, up $0.8 million as a result of greater industrial hydrogen orders shipped, this wa s offset by lower Power Systems revenues of $5.8 million, attributable to the delay in production orders from China.
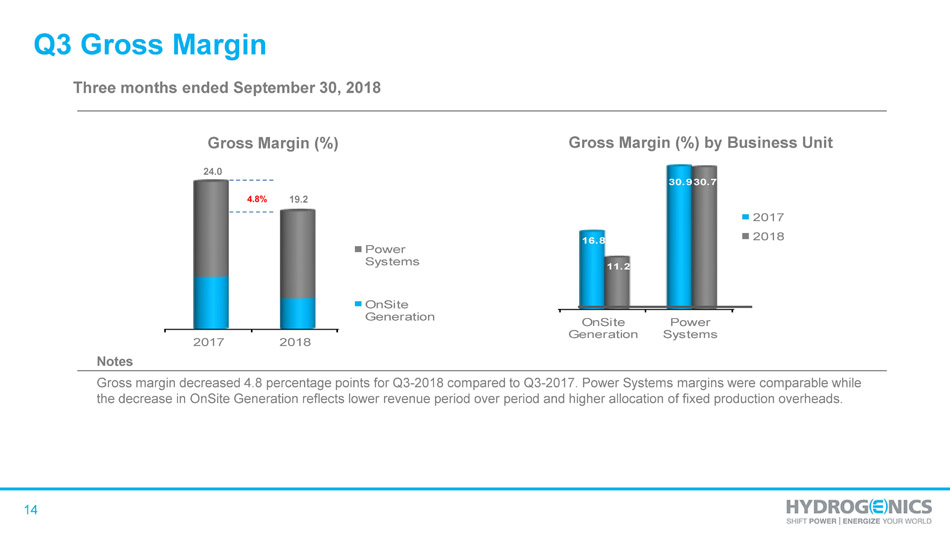
14 2017 2018 Power Systems OnSite Generation Notes Gross Margin (%) Three months ended September 30, 2018 19.2 24.0 Q3 Gross Margin OnSite Generation Power Systems 16.8 30.9 11.2 30.7 2017 2018 Gross Margin (%) by Business Unit 4.8% Gross margin decreased 4.8 percentage points for Q3 - 2018 compared to Q3 - 2017. Power Systems margins were comparable while the decrease in OnSite Generation reflects lower revenue period over period and higher allocation of fixed production overhea ds.
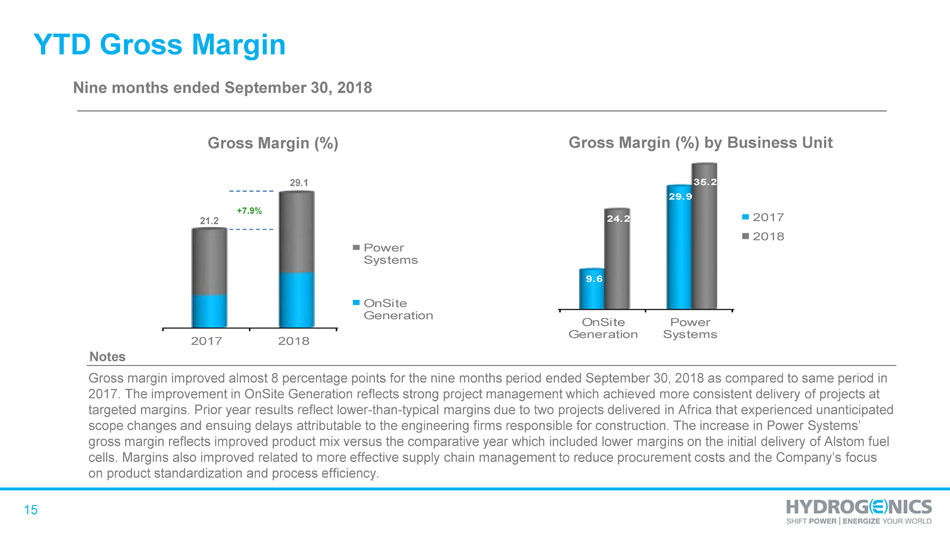
15 2017 2018 Power Systems OnSite Generation Notes Gross Margin (%) Nine months ended September 30, 2018 29.1 21.2 YTD Gross Margin OnSite Generation Power Systems 9.6 29.9 24.2 35.2 2017 2018 Gross Margin (%) by Business Unit +7.9% Gross margin improved almost 8 percentage points for the nine months period ended September 30, 2018 as compared to same period in 2017. The improvement in OnSite Generation reflects strong project management which achieved more consistent delivery of projects at targeted margins. Prior year results reflect lower - than - typical margins due to two projects delivered in Africa that experienced unanticipated scope changes and ensuing delays attributable to the engineering firms responsible for construction. The increase in Power Sy ste ms’ gross margin reflects improved product mix versus the comparative year which included lower margins on the initial delivery o f A lstom fuel cells. Margins also improved related to more effective supply chain management to reduce procurement costs and the Company’s foc us on product standardization and process efficiency.

16 Notes Adjusted EBITDA is defined as net loss excluding : cash settled long term compensation indexed to share price, share settled stock - based compensation expense, net finance income and expenses, depreciation and amortization . Adjusted EBITDA is a non - IFRS measure and may not be comparable to similar measures used by other companies . Management uses Adjusted EBITDA as a useful measure of ongoing operational results . (in $ millions) Q3 Results 1 Research and product development 2018 2017 Gross r esearch and product development expenses $ 2 . 7 $ 2 . 6 Government research and product development funding ( 1 . 4 ) ( 0 . 4 ) Net research and product development $ 1 . 3 $ 2 . 2 Three months ended Sep. 30, Change 2018 2017 $ % Revenue $ 7.7 $ 12.1 (4.4) (36%) Gross Profit 1.5 2.9 (1.4) (48%) Gross Margin % 19.2% 24.0% Operating Expenses Selling, general and administrative (excluding stock - based compensation, amortization and depreciation) 2.7 2.6 0.1 4% Research and product development 1 1.3 2.2 (0.9) (41%) Adjusted EBITDA $ (2.5) $ (1.9) (0.6) (32%)
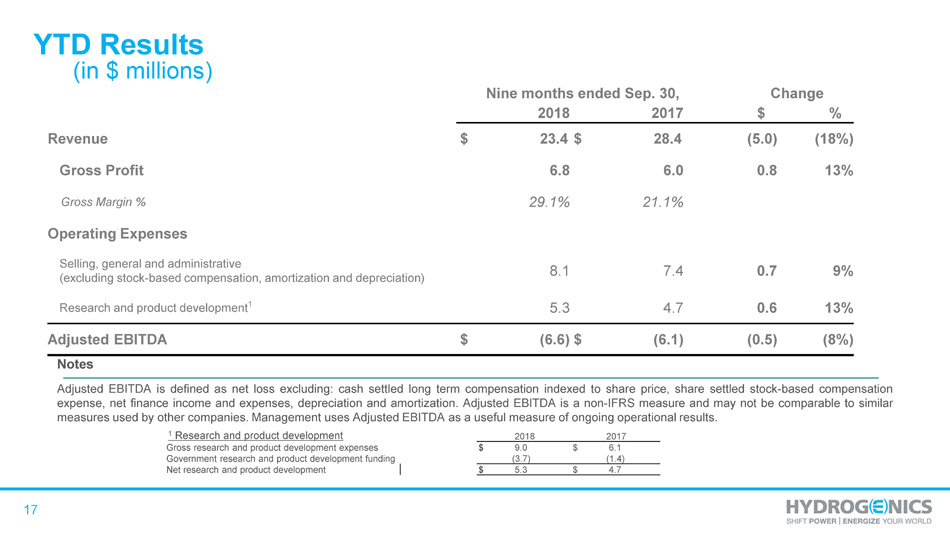
17 Notes Adjusted EBITDA is defined as net loss excluding : cash settled long term compensation indexed to share price, share settled stock - based compensation expense, net finance income and expenses, depreciation and amortization . Adjusted EBITDA is a non - IFRS measure and may not be comparable to similar measures used by other companies . Management uses Adjusted EBITDA as a useful measure of ongoing operational results . (in $ millions) YTD Results 1 Research and product development 2018 2017 Gross r esearch and product development expenses $ 9 . 0 $ 6 . 1 Government research and product development funding ( 3 . 7 ) ( 1 . 4 ) Net research and product development $ 5 . 3 $ 4 . 7 Nine months ended Sep. 30, Change 2018 2017 $ % Revenue $ 23.4 $ 28.4 (5.0) (18%) Gross Profit 6.8 6.0 0.8 13% Gross Margin % 29.1% 21.1% Operating Expenses Selling, general and administrative (excluding stock - based compensation, amortization and depreciation) 8.1 7.4 0.7 9% Research and product development 1 5.3 4.7 0.6 13% Adjusted EBITDA $ (6.6) $ (6.1) (0.5) (8%)
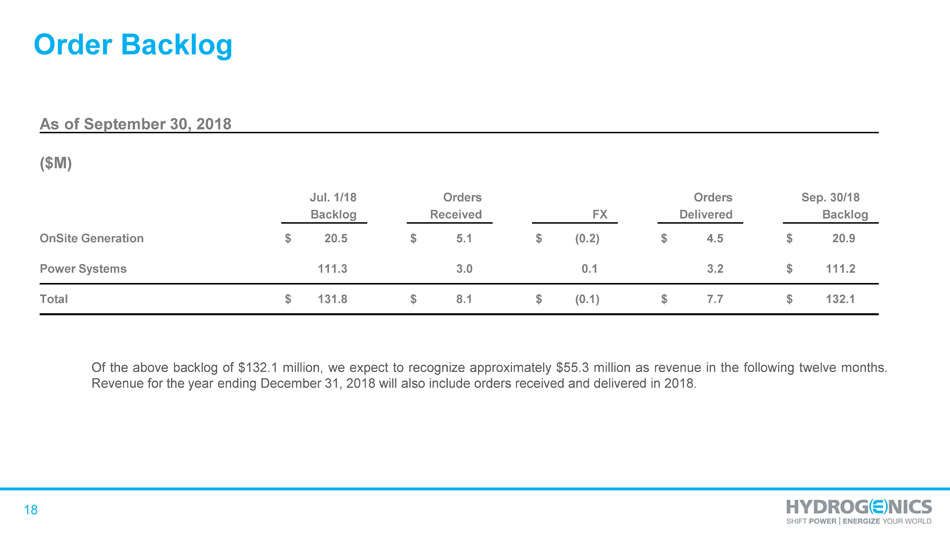
18 Order Backlog Of the above backlog of $ 132 . 1 million, we expect to recognize approximately $ 55 . 3 million as revenue in the following twelve months . Revenue for the year ending December 31 , 2018 will also include orders received and delivered in 2018 . As of September 30, 2018 ($M) Jul. 1/18 Orders Orders Sep. 30/18 Backlog Received FX Delivered Backlog OnSite Generation $ 20.5 $ 5.1 $ (0.2) $ 4.5 $ 20.9 Power Systems 111.3 3.0 0.1 3.2 $ 111.2 Total $ 131.8 $ 8.1 $ (0.1) $ 7.7 $ 132.1
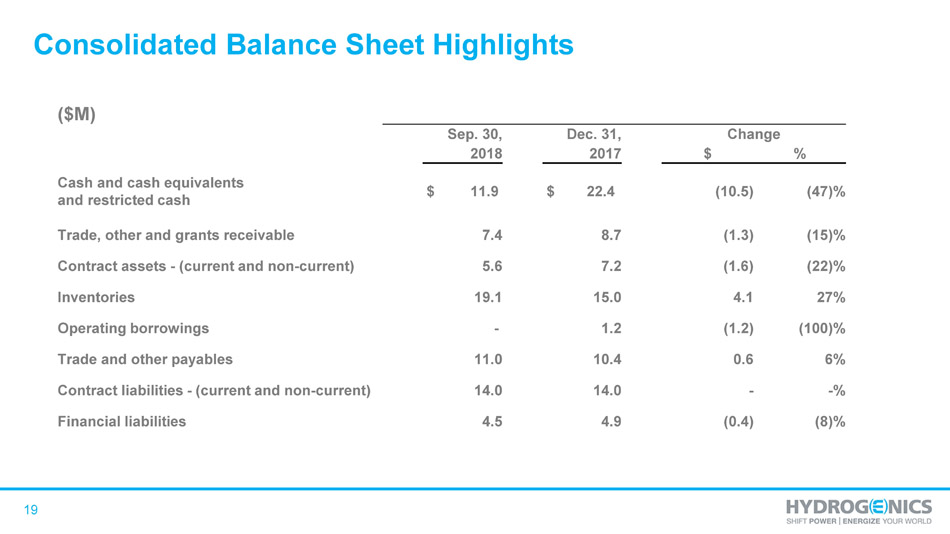
19 Consolidated Balance Sheet Highlights ($M) Sep. 30, Dec. 31, Change 2018 2017 $ % Cash and cash equivalents and restricted cash $ 11.9 $ 22.4 (10.5) (47)% Trade, other and grants receivable 7.4 8.7 (1.3) (15)% Contract assets - (current and non - current) 5.6 7.2 (1.6) (22)% Inventories 19.1 15.0 4.1 27% Operating borrowings - 1.2 (1.2) (100)% Trade and other payables 11.0 10.4 0.6 6% Contract liabilities - (current and non - current) 14.0 14.0 - - % Financial liabilities 4.5 4.9 (0.4) (8)%

20 Q3 Reconciliation of Non - IFRS Measures – Adj. EBITDA * Note certain figures have been adjusted for rounding ($M) Three months ended Three months ended September 30, 2018 September 30, 2017 Net loss $ (3.4) $ (2.0) Finance loss, net 0 . 5 (0.1) Amortization and depreciation 0.2 0.2 Compensation indexed to share price - (0.2) Stock - based compensation expense 0.2 0.2 Adjusted EBITDA $ (2.5) $ (1.9)
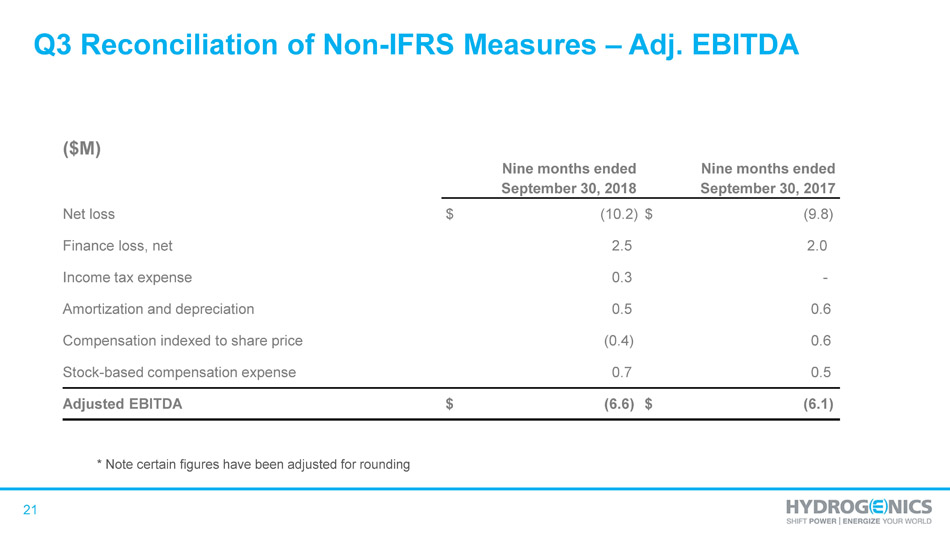
21 Q3 Reconciliation of Non - IFRS Measures – Adj. EBITDA * Note certain figures have been adjusted for rounding ($M) Nine months ended Nine months ended September 30, 2018 September 30, 2017 Net loss $ (10.2) $ (9.8) Finance loss, net 2 . 5 2.0 Income tax expense 0 . 3 - Amortization and depreciation 0.5 0.6 Compensation indexed to share price (0.4) 0.6 Stock - based compensation expense 0.7 0.5 Adjusted EBITDA $ (6.6) $ (6.1)

22