Exhibit 99.4

1 Q4 EARNINGS PRESENTATION March 15th 2019
2 Safe Harbor Statement Certain statements in the Business Update and Order Backlog sections contain forward - looking statements within the meaning of the “safe harbor” provisions of the U . S . Private Securities Litigation Reform Act of 1995 , and under applicable Canadian securities laws . These statements are based on management’s current expectations and actual results may differ from these forward - looking statements due to numerous factors, including : our inability to increase our revenues or raise additional funding to continue operations, execute our business plan, or to grow our business ; our inability to address a slow return to economic growth, and its impact on our business, results of operations and consolidated financial condition ; our limited operating history ; inability to implement our business strategy ; fluctuations in our quarterly results ; failure to maintain our customer base that generates the majority of our revenues ; currency fluctuations ; failure to maintain sufficient insurance coverage ; changes in value of goodwill ; failure of a significant market to develop for our products ; failure of hydrogen being readily available on a cost - effective basis ; changes in government policies and regulations ; failure of uniform codes and standards for hydrogen fuelled vehicles and related infrastructure to develop ; liability for environmental damages resulting from our research, development or manufacturing operations ; failure to compete with other developers and manufacturers of products in our industry ; failure to compete with developers and manufacturers of traditional and alternative technologies ; failure to develop partnerships with original equipment manufacturers, governments, systems integrators and other third parties ; inability to obtain sufficient materials and components for our products from suppliers ; failure to manage expansion of our operations ; failure to manage foreign sales and operations ; failure to recruit, train and retain key management personnel ; inability to integrate acquisitions ; failure to develop adequate manufacturing processes and capabilities ; failure to complete the development of commercially viable products ; failure to produce cost - competitive products ; failure or delay in field testing of our products ; failure to produce products free of defects or errors ; inability to adapt to technological advances or new codes and standards ; failure to protect our intellectual property ; our involvement in intellectual property litigation ; exposure to product liability claims ; failure to meet rules regarding passive foreign investment companies ; actions of our significant and principal shareholders ; dilution as a result of significant issuances of our common shares and preferred shares ; inability of US investors to enforce US civil liability judgments against us ; volatility of our common share price ; dilution as a result of the exercise of options ; and failure to meet continued listing requirements of Nasdaq . Readers should not place undue reliance on Hydrogenics’ forward - looking statements . Investors are encouraged to review the section captioned “Risk Factors” in our regulatory filings with the Canadian securities regulatory authorities and the US Securities and Exchange Commission for a more complete discussion of factors that could affect our future performance . Furthermore, the forward - looking statements contained herein are made as of the date of this presentation, and we undertake no obligation to revise or update any forward - looking statements in order to reflect events or circumstances that may arise after the date of this presentation, unless otherwise required by law . The forward - looking statements contained in this presentation are expressly qualified by this .
3 Q4 2018 Highlights • Fourth quarter revenue higher sequentially due to China shipments and electrolyzer orders • Announced $20.5M private placement with Air Liquide • Backlog steady at $132M • Hydrogen rail leading indicators point to commercial orders in 2019 • Active bidding environment across all markets and product offerings, with healthy revenue growth anticipated this year
4 Air Liquide Investment and Plant Order • The Hydrogen Corporation, a subsidiary of Air Liquide, is now an 18% shareholder of Hydrogenics after $20.5M investment • Above - market price a strong validation of our technology leadership in electrolysis and fuel cell applications • Joint technology development program will focus on existing leadership positions and build on respective strengths • Non - exclusive commercial relationship included • Rapid award of a 20MW – 8 ton per day – hydrogen facility for Air Liquide Canada provides further evidence of confidence in our MW class electrolysis systems
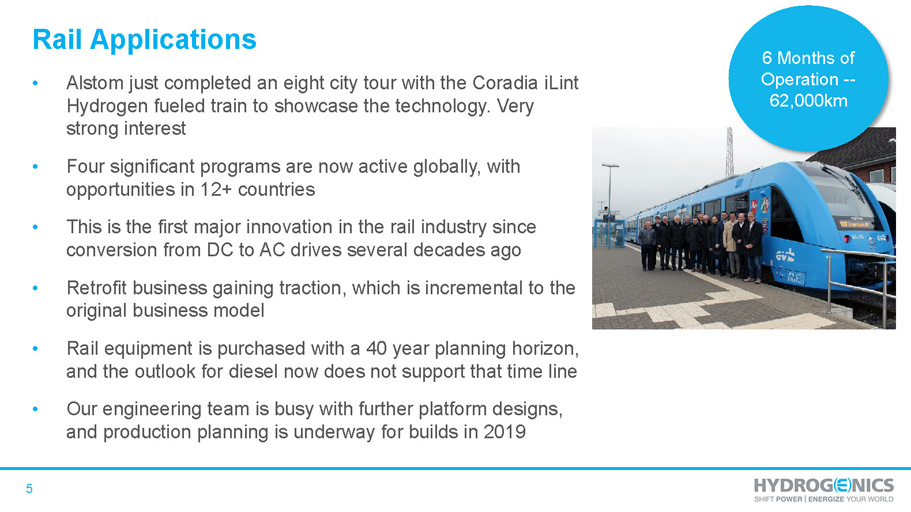
5 Rail Applications • Alstom just completed an eight city tour with the Coradia iLint Hydrogen fueled train to showcase the technology. Very strong interest • Four significant programs are now active globally, with opportunities in 12+ countries • This is the first major innovation in the rail industry since conversion from DC to AC drives several decades ago • Retrofit business gaining traction, which is incremental to the original business model • Rail equipment is purchased with a 40 year planning horizon, and the outlook for diesel now does not support that time line • Our engineering team is busy with further platform designs, and production planning is underway for builds in 2019 6 Months of Operation -- 62,000km
6 China Update ▪ The first phase of market development was led by fast - acting entrepreneurial companies ▪ While quick to start, these integrators have had challenges to scale - up ▪ Some integration learning points are coming to light, and enhancement cycle is active ▪ Overall shipments in 2018 were approximately 200 versus more than 400 in 2017 ▪ We continue to work with our three existing partners and talk to others ▪ Bigger firms have expressed interest to work at larger scale – no decisions yet ▪ Too early to forecast shipments for 2019
7 Positive Momentum in 2019 ▪ 20MW plant build for Air Liquide Canada will be delivered on a percentage completion basis, with initial impact anticipated in Q1 ▪ Platform development and initial deliveries will show growing impact of rail in our portfolio ▪ Investment by Air Liquide and plant award is already strengthening customer confidence in other opportunities ▪ Our technology is considered best - in - class ▪ While China issue plays out, we have many other markets and applications to keep us busy ▪ Driving forward on path to profitability
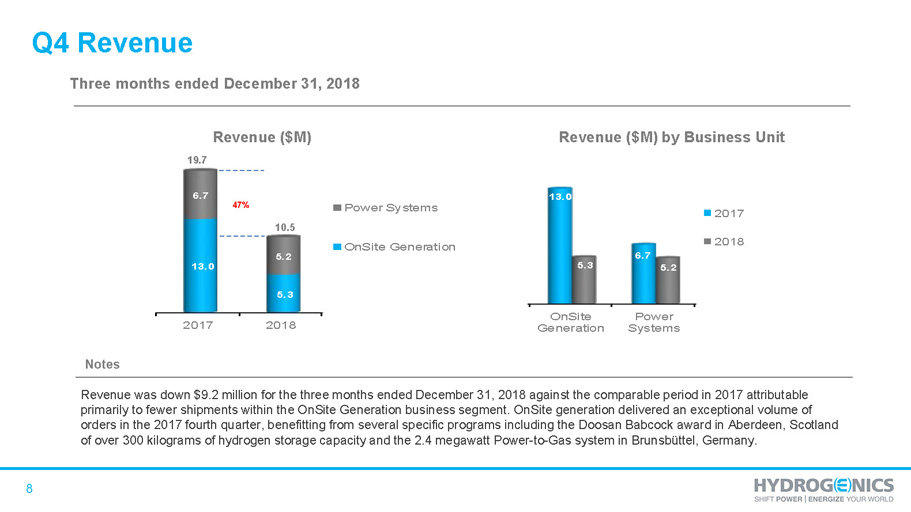
8 2017 2018 13.0 5.3 6.7 5.2 Power Systems OnSite Generation Notes Revenue ($M) Three months ended December 31, 2018 10.5 19.7 Q4 Revenue 47% OnSite Generation Power Systems 13.0 6.7 5.3 5.2 2017 2018 Revenue ($M) by Business Unit Revenue was down $9.2 million for the three months ended December 31, 2018 against the comparable period in 2017 attributable primarily to fewer shipments within the OnSite Generation business segment. OnSite generation delivered an exceptional volume of orders in the 2017 fourth quarter, benefitting from several specific programs including the Doosan Babcock award in Aberdeen, Scotland of over 300 kilograms of hydrogen storage capacity and the 2.4 megawatt Power - to - Gas system in Brunsbüttel , Germany.
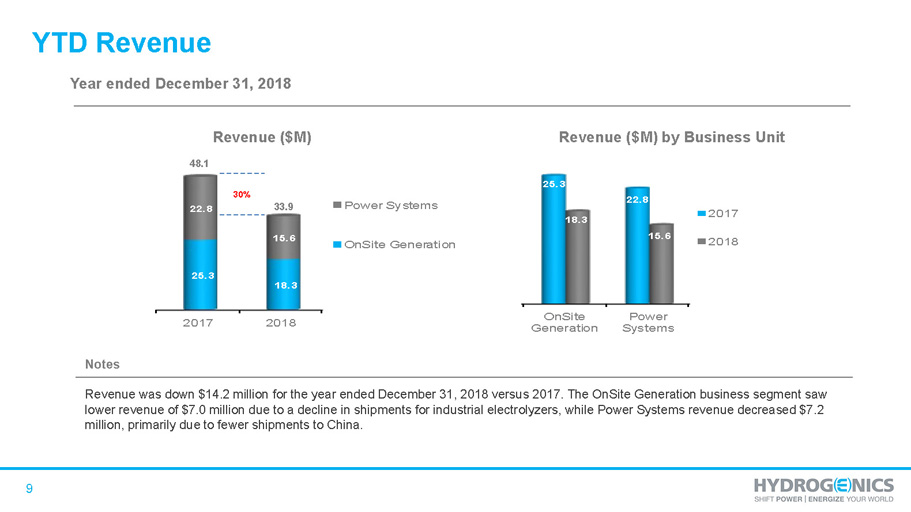
9 2017 2018 25.3 18.3 22.8 15.6 Power Systems OnSite Generation Notes Revenue ($M) Year ended December 31, 2018 33.9 48.1 YTD Revenue 30% OnSite Generation Power Systems 25.3 22.8 18.3 15.6 2017 2018 Revenue ($M) by Business Unit Revenue was down $14.2 million for the year ended December 31, 2018 versus 2017. The OnSite Generation business segment saw lower revenue of $7.0 million due to a decline in shipments for industrial electrolyzers , while Power Systems revenue decreased $7.2 million, primarily due to fewer shipments to China.
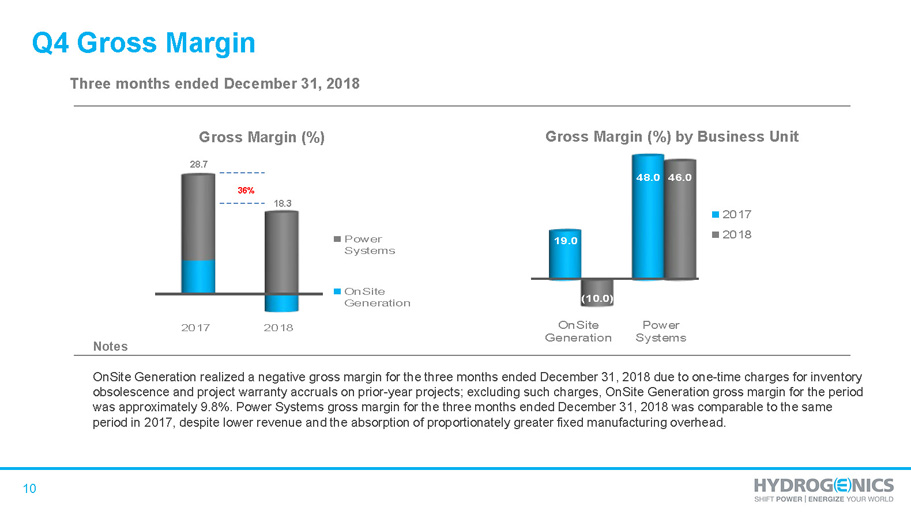
10 2017 2018 Power Systems OnSite Generation Notes OnSite Generation realized a negative gross margin for the three months ended December 31, 2018 due to one - time charges for inventory obsolescence and project warranty accruals on prior - year projects; excluding such charges, OnSite Generation gross margin for the period was approximately 9.8%. Power Systems gross margin for the three months ended December 31, 2018 was comparable to the same period in 2017, despite lower revenue and the absorption of proportionately greater fixed manufacturing overhead. Gross Margin (%) Three months ended December 31, 2018 18.3 28.7 Q4 Gross Margin OnSite Generation Power Systems 19.0 48.0 (10.0) 46.0 2017 2018 Gross Margin (%) by Business Unit 36%

11 2017 2018 Power Systems OnSite Generation Notes Gross Margin (%) Year ended December 31, 2018 25.7 24.3 YTD Gross Margin OnSite Generation Power Systems 14.1 35.1 14.5 39.0 2017 2018 Gross Margin (%) by Business Unit +6% Onsite Generation gross margin for 2018 was 14.5%, reflecting the aforementioned fourth quarter charges; excluding these, Ons ite Generation gross margin was 20.0%. Power Systems gross margin for the year ended December 31, 2018 improved by nearly 400 basis points versus 2017. The improvement reflected reduced procurement costs through more effective supply - chain management and the Company’s focus on product standardization and process efficiency.
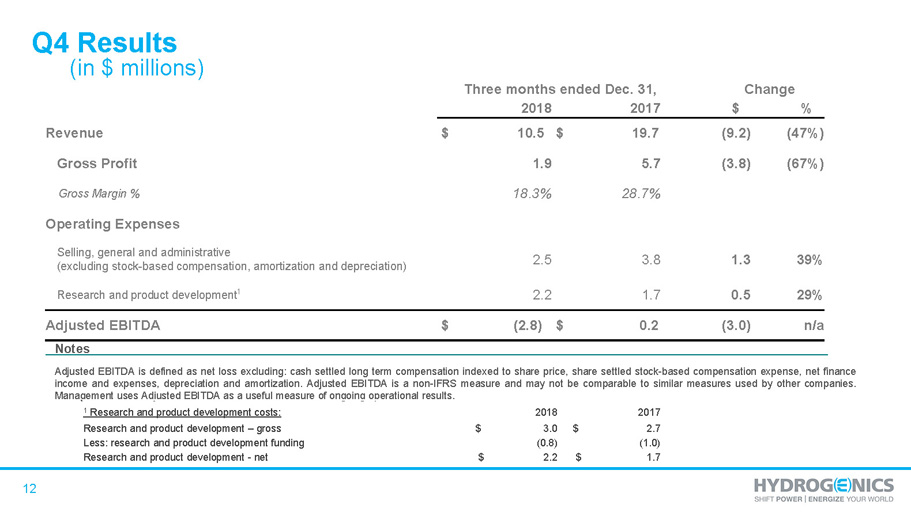
12 Notes Adjusted EBITDA is defined as net loss excluding : cash settled long term compensation indexed to share price, share settled stock - based compensation expense, net finance income and expenses, depreciation and amortization . Adjusted EBITDA is a non - IFRS measure and may not be comparable to similar measures used by other companies . Management uses Adjusted EBITDA as a useful measure of ongoing operational results . (in $ millions) Q4 Results Three months ended Dec. 31, Change 2018 2017 $ % Revenue $ 10.5 $ 19.7 (9.2) (47%) Gross Profit 1.9 5.7 (3.8) (67%) Gross Margin % 18.3% 28.7% Operating Expenses Selling, general and administrative (excluding stock - based compensation, amortization and depreciation) 2.5 3.8 1.3 39% Research and product development 1 2.2 1.7 0.5 29% Adjusted EBITDA $ (2.8) $ 0.2 (3.0) n/a 1 Research and product development costs: 2018 2017 Research and product development – gross $ 3.0 $ 2.7 Less: research and product development funding (0.8) (1.0) Research and product development - net $ 2.2 $ 1.7

13 Notes • Adjusted EBITDA is defined as net loss excluding : cash settled long term compensation indexed to share price, share settled stock - based compensation expense, net finance income and expenses, depreciation and amortization . Adjusted EBITDA is a non - IFRS measure and may not be comparable to similar measures used by other companies . Management uses Adjusted EBITDA as a useful measure of ongoing operational results . (in $ millions) YTD Results Year ended Dec. 31, Change 2018 2017 $ % Revenue $ 33.9 $ 48.1 (14.2) (30%) Gross Profit 8.7 11.7 (3.0) (26%) Gross Margin % 25.7% 24.3% Operating Expenses Selling, general and administrative (excluding stock - based compensation, amortization and depreciation) 10.6 11.3 0.7 6% Research and product development 1 7.5 6.4 (1.1) (17%) Adjusted EBITDA $ (9.4) $ (6.0) (3.4) (57%) 1 Research and product development costs: 2018 2017 Research and product development – gross $ 12.0 $ 8.8 Less: research and product development funding (4.5) (2.4) Research and product development - net $ 7.5 $ 6.4
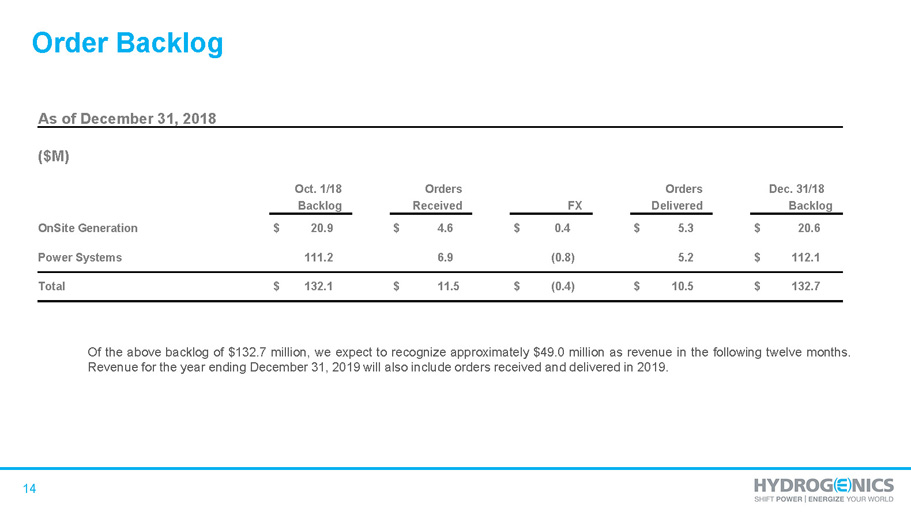
14 Order Backlog Of the above backlog of $ 132 . 7 million, we expect to recognize approximately $ 49 . 0 million as revenue in the following twelve months . Revenue for the year ending December 31 , 2019 will also include orders received and delivered in 2019 . As of December 31, 2018 ($M) Oct. 1/18 Orders Orders Dec. 31/18 Backlog Received FX Delivered Backlog OnSite Generation $ 20.9 $ 4.6 $ 0.4 $ 5.3 $ 20.6 Power Systems 111.2 6.9 (0.8) 5.2 $ 112.1 Total $ 132.1 $ 11.5 $ (0.4) $ 10.5 $ 132.7

15 Consolidated Balance Sheet Highlights ($M) Dec. 31, Dec. 31, Change 2018 2017 $ % Cash and cash equivalents and restricted cash $ 8.7 $ 22.4 (13.7) (61)% Trade, other and grants receivable 6.7 8.7 (2.0) (23)% Contract assets - (current and non - current) 6.2 7.2 (1.0) (14)% Inventories 17.2 15.0 2.2 14% Operating borrowings - 1.2 (1.2) (100)% Trade and other payables 9.1 9.7 (0.6) (7%) Contract liabilities - (current and non - current) 16.0 14.0 2.0 14% Financial liabilities 3.4 4.9 (1.5) (32)%
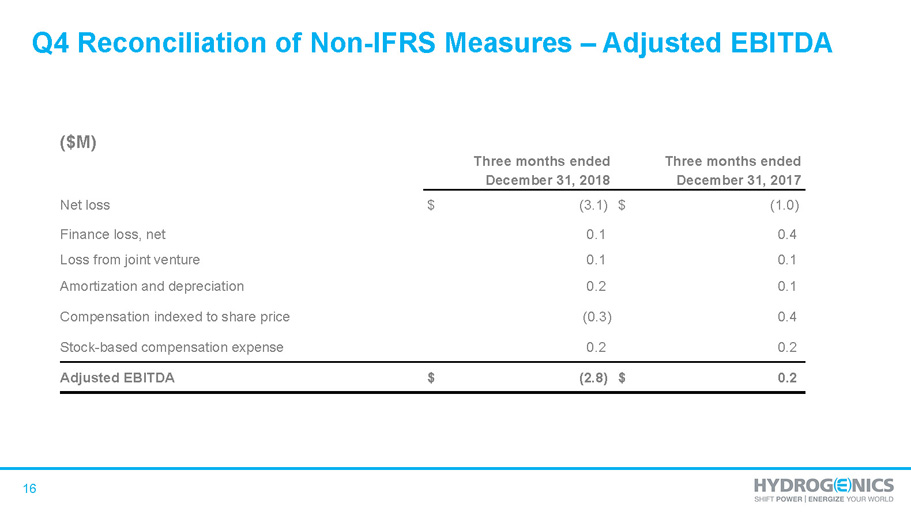
16 Q4 Reconciliation of Non - IFRS Measures – Adjusted EBITDA ($M) Three months ended Three months ended December 31, 2018 December 31, 2017 Net loss $ (3.1) $ (1.0) Finance loss, net 0 . 1 0.4 Loss from joint venture 0 . 1 0.1 Amortization and depreciation 0.2 0.1 Compensation indexed to share price (0.3) 0.4 Stock - based compensation expense 0.2 0.2 Adjusted EBITDA $ (2.8) $ 0.2
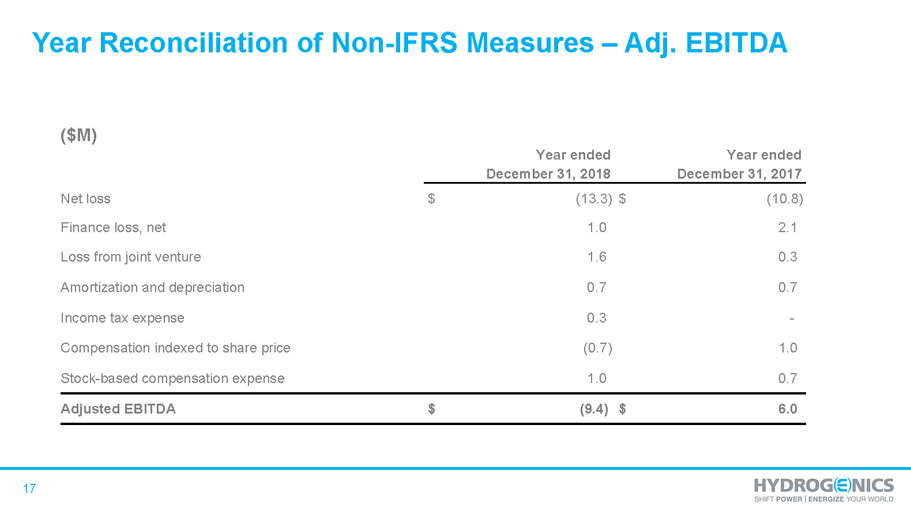
17 Year Reconciliation of Non - IFRS Measures – Adj. EBITDA ($M) Year ended Year ended December 31, 2018 December 31, 2017 Net loss $ (13.3) $ (10.8) Finance loss, net 1 . 0 2.1 Loss from joint venture 1 . 6 0.3 Amortization and depreciation 0.7 0.7 Income tax expense 0.3 - Compensation indexed to share price (0.7) 1.0 Stock - based compensation expense 1.0 0.7 Adjusted EBITDA $ (9.4) $ 6.0
18