Exhibit 99.3

Hydrogenics Corporation
Table of Contents |
| Message to Shareholders | 2 |
| Management’s Responsibility for Financial Reporting | 4 |
| Management Discussion and Analysis | |
| 1. | | Our Business | 5 |
| 2. | | Growth Strategy | 8 |
| 3. | | Operating Results | 9 |
| 4. | | Financial Condition | 15 |
| 5. | | Summary of Quarterly Results | 16 |
| 6. | | Liquidity and Capital Resources | 18 |
| 7. | | Outstanding Share Data | 22 |
| 8. | | Critical Accounting Estimates | 22 |
| 9. | | Changes in Accounting Policies and Recent Accounting Pronouncements | 23 |
| 10. | | Strategy and Outlook | 24 |
| 11. | | Related Party Transactions | 26 |
| 12. | | Disclosure Controls | 26 |
| 13. | | Internal Control Over Financial Reporting | 26 |
| 14. | | Reconciliation of Non-IFRS Measures | 27 |
| 15. | | Risk Factors | 28 |
| 16. | | Forward-looking Statements | 30 |
| Consolidated Financial Statements | |
| | | Management’s Report on Internal Control over Financial Reporting | 32 |
| | | Independent Auditor’s Report | 33 |
| | | Consolidated Financial Statements | 35 |
| | | Notes to Consolidated Financial Statements | 39 |
| Board of Directors | 84 |
Hydrogenics Corporation
Presidents Message
Building, Connecting, Growing.
Hydrogenics is hard at work building a bridge between the old world of energy and the new – we are stretching to span a very wide gap, as the world’s fossil fuel habit will not be broken easily. Over one hundred years of incumbency is tough to counter, and building bridges is not easy work. There is nothing to stand on in the middle of the gap. The tenuous working from both sides looks futile at first but, then, as the gap narrows, confidence grows. For this effort to be successful, teamwork, partnership and trust are everything.
We have been building our team for over twenty-four years. It’s a winning team. It’s a strong team. It’s a committed team – a team that is fully up to the job of bridging the gap. We have the foundational technical skills to solve the challenges of optimizing electrochemistry. We have the commercial skills to engage some of the world’s largest companies and invite them into commercial partnership to innovate together. Most importantly, we have the ragged determination that this bridge will be built. Before any comment on the past year I just wanted to start by acknowledging the strength of the people that make up our small but powerful team. We are all bridge builders.
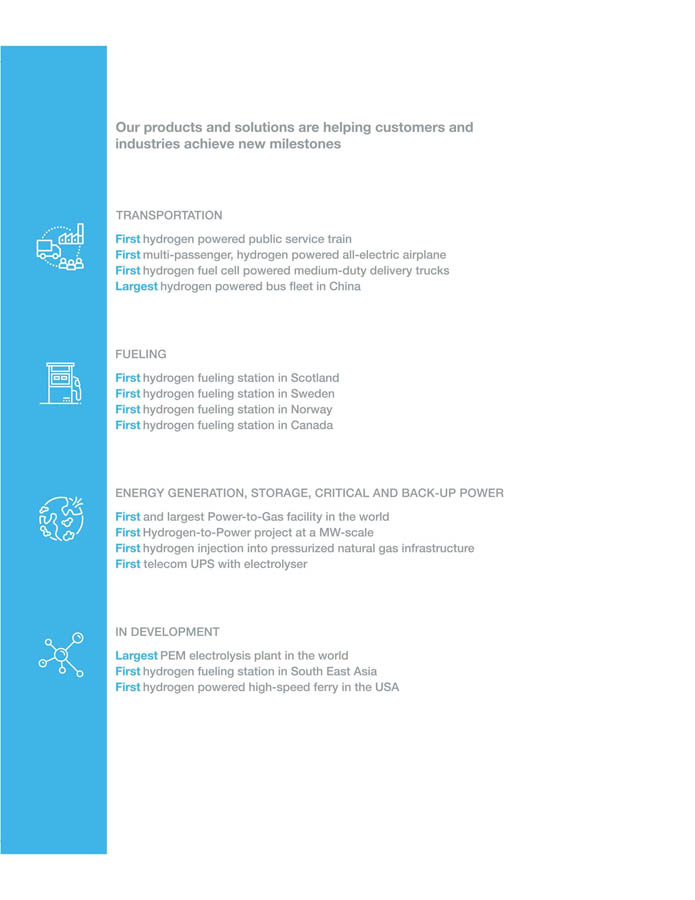
Partnership has been the cornerstone for some very encouraging developments which do, indeed, inspire confidence that the gap is closing on our mission. Large incumbent firms are now deeply engaged with Hydrogenics to bring new solutions to reality at full scale. In September 2018, after three years of development, certification, and testing work, Alstom’s hydrogen fuel cell trains – using our technology – came into regular public service in Germany. Together with our partner Alstom Transport, we have brought zero emission, wireless commuter rail to reality. The cross-linking of mature electric rail coaches with innovative fuel cell technology has shepherded in a new age in rail transportation. The acceleration of interest due to this first important reference site has been a joy to watch. We could not have done this from our side alone – we needed a partner. Alstom has proven to have the tenacity, fortitude and strength to face many challenges and get the job done. By eliminating the need for costly and unsightly overhead electrical infrastructure, and with innovative energy management approaches, we have brought the cost of electrified rail down significantly. Cleaner, cheaper, better and faster, it is all there. We are currently active with Alstom on initiatives in Germany, France, the UK, and in North America. The scale of the opportunities now in sight for this application are inspiring indeed.
Trust is the last critical component of bridge building, and recent developments in our relationship with Air Liquide stand firmly in this column. For many years Air Liquide has been a partner and customer for our industrial electrolysis products. We know each other well. In fact, our first Board Chair as a public company was the late Norman Seagram, formerly the CEO of Air Liquide Canada. Having Air Liquide as a major shareholder was in some way a natural evolution based on many years of connection. Underlining the trust between us was the award for the world’s largest PEM electrolysis project at 20MW, producing 8 metric tons of Hydrogen per day. Crossing the chasm from old to new methods is a risky step – it takes courage, conviction and boldness. At all levels in Air Liquide there is a deep conviction that scaling up hydrogen electrolysis technology is a critical component to the decarbonation of the energy and industrial sectors. The trust of Air Liquide was inspired by what we have already accomplished in scaling up the world’s most compact, efficient and cost-effective electrolysis system. Evidence on the ground – the Enbridge energy storage site in Ontario – was the foundation in which trust could be placed. We are deeply grateful that Air Liquide has chosen to be a willing partner with us as we take a giant step towards closing the gap. This major North American hydrogen generation reference site will be the precursor for even larger projects in the years to come.
Multiple strands of cable, multiple parallel structural supports, and multiple points of securement are all key elements of bridge-building. Our strategy has been to keep open several pathways and approaches rather than to narrow our aspirations prematurely. We have proven capabilities in large-scale hydrogen generation and in a standardized, low-cost and reliable fuel cell platform. We have worked on multiple applications to learn and refine our understanding of where value can be created. Over time we have focused and concentrated our efforts, while our offerings are being met from the “other side” with interest and enthusiasm. However, not all the strands of engagement progress at the same rate. Some, such as our efforts in China, go through robust cycles which are then followed by some slower progress. Nevertheless, the goal and end game remain the same. Today the connections and relationships we have with Alstom, Air Liquide, Enbridge and many other large firms around the globe have reduced the gap between the old energy world and the new. None of this would have happened without such strong partnerships.
| President’s Message to Shareholders | Page 2 |
We also continue to enjoy the support of our shareholders, some of whom have been with us for many years, and some for a lesser time. Their confidence in us has allowed us to keep building, connecting, growing and showing that it “can be done.” I have no reason to doubt that this belief in us will be well rewarded. We’ve also been assisted by government policies, programs, and funding here in Canada as well as many other parts of the world. We have been supported by a patient and wise Board of Directors. We are conscious every day of the multiple stakeholders who support us in our mission of closing the gap.
As we look forward to the coming year, two things stand out. First, the work of delivering on major commitments and programs is ahead of us. We have been preparing for this a long time. Robust design, careful checking, and rigorous planning – complemented by teamwork and a conscientious management system – are all in place. We have always counted on both a strong strategy and capable execution. Second, our job in spreading the confidence we have in these reference sites and projects is critical to accelerating the growth opportunity. The trains in Germany, our Power-to-Gas facility with Enbridge in Canada, and our vehicles on the road all over the world are a strong testament that the bridge to a new place is possible.
On May 24th, 1883 when the Brooklyn bridge opened, 150,000 people and 1800 vehicles crossed the bridge. However, it took John Augustus Roebling 15 years to sell the idea, and it was his son who finished the job between construction approval in 1867 and completion 16 years later. I’m sure there were many nay-sayers, disbelievers and skeptics over the whole journey, but on opening day there was no doubt. The river had been crossed, and the bridge was a whole new path to travel for everyone. One hundred and thirty-six years later, it still stands and serves as a thing of beauty. This is the kind of work that is worth committing your life to.
 |
| |
| Daryl C.F. Wilson |
President & Chief Executive Officer |
| President’s Message to Shareholders | Page 3 |
Management’s Responsibility for Financial Reporting
Management’s Discussion and Analysis of Financial Condition and Results of Operations and the consolidated financial statements have been prepared by management and approved by the Board of Directors of Hydrogenics Corporation (the “Company”). The consolidated financial statements were prepared in accordance with International Financial Reporting Standards as issued by the International Accounting Standards Board (“IFRS”) and where appropriate, reflect management’s best estimates and judgments. Where alternative accounting methods exist, management has chosen those methods considered most appropriate in the circumstances. Management is responsible for the accuracy, integrity and objectivity of the consolidated financial statements within reasonable limits of materiality, and for maintaining a system of internal controls over financial reporting as described in “Management’s Report on Internal Control Over Financial Reporting.” Management is also responsible for the preparation and presentation of other financial information included in the Annual Report and its consistency with the consolidated financial statements.
The Audit Committee, which is appointed annually by the Board of Directors and comprised exclusively of independent directors, meets with management as well as with the independent auditors to satisfy itself that management is properly discharging its financial reporting responsibilities and to review the consolidated financial statements and the independent auditors’ report.
The Audit Committee reports its findings to the Board of Directors for consideration in approving the consolidated financial statements for presentation to the shareholders.
The Audit Committee considers, for review by the Board of Directors and approval by the shareholders, the engagement or reappointment of the independent auditors.
The shareholders’ auditors have full access to the Audit Committee, with and without management being present, to discuss the consolidated financial statements and to report their findings from the audit process. The consolidated financial statements have been audited by the shareholders’ independent auditors, PricewaterhouseCoopers LLP, Chartered Professional Accountants, and their report is provided herein.
| | |  |
| | | |
| Daryl C. F. Wilson | | Marc Beisheim |
| President and Chief Executive Officer | | Chief Financial Officer |
March 15, 2019
Mississauga, Ontario
2018 Management’s Discussion and Analysis | Page 4 |
Who We Are
Hydrogenics, together with its subsidiaries, is a globally recognized leader in the design, development and manufacture of hydrogen generation, energy storage and fuel cell products based on water electrolysis technology and proton exchange membrane (“PEM”), technology. Hydrogenics’ mission is to provide safe, secure, sustainable and emission free energy as a leading global provider of clean energy solutions based on hydrogen. We maintain operations in Belgium, Canada and Germany with a satellite office in the United States and branch offices in Russia and Indonesia.
We believe our intellectual property provides us with a strong competitive advantage and represents a significant barrier to entry. As part of our portfolio, we maintain a collection of innovative energy storage patents with broad and exclusive rights concerning the use of excess electrical power to produce hydrogen from water while simultaneously providing electric grid stabilization services. We believe these patents place Hydrogenics in the strongest possible position to build our company over the long term and will continue to strengthen our efforts as electric grid operators look to hydrogen as an important strategy for utility-scale energy storage.
How We Are Organized
We operate in various geographic markets and organize ourselves in two reportable segments being Onsite Generation and Power Systems.
Our OnSite Generation business segment is primarily based in Oevel, Belgium and develops products for industrial gas, hydrogen fueling and renewable energy storage markets. For the year ended December 31, 2018, our OnSite Generation business reported revenues of $18.3 million and, at December 31, 2018, had 81 full-time employees.
Our Power Systems business segment is primarily based in Mississauga, Canada, with operations in Gladbeck, Germany, and a satellite facility in Carlsbad, California, USA, and develops products for energy storage, motive power and stationary applications. For the year ended December 31, 2018 our Power Systems business reported revenues of $15.6 million and, at December 31, 2018 had 102 full-time employees.
Where applicable, corporate and other activities are reported separately as Corporate and Other. This is the provision of corporate services and administrative support. At December 31, 2018, our corporate segment had four full-time employees.
OnSite Generation
Our OnSite Generation business segment, is based on water electrolysis technology which involves the decomposition of water into oxygen and hydrogen gas by passing an electric current through a liquid electrolyte (“alkaline”) or a solid PEM. The resultant hydrogen gas is then captured and used for industrial gas applications, hydrogen fueling applications, and is used to store renewable and surplus energy in the form of hydrogen gas (commonly referred to as “Power-to-Gas”).
Historically the demand for onsite generation of hydrogen gas has been driven by relatively modest manufacturing market applications for industrial hydrogen. A typical unit for these applications would generate 20 to 60 normal cubic meters of hydrogen and consume 100 to 300 kilowatt (kW) of electrical energy. We serve this market with our HySTAT® and HyLYZER® branded alkaline electrolyzer products, which are based on 60 years of hydrogen experience, meet international standards, such as ASME, CE, Rostechnadzor and UL, and are certified ISO 9001 from design to delivery. We configure our HySTAT® products for both indoor and outdoor applications and tailor our products to accommodate various hydrogen gas requirements. Our OnSite Generation products are sold to leading merchant gas companies, such as Air Liquide and Linde Gas and end-users requiring high purity hydrogen produced on-site for industrial applications.
Hydrogenics is also one of the leaders in Power-to-Gas market, an innovative energy conversion and storage solution using PEM electrolysis. Our modular PEM stack electrolyzer is the most power dense unit in the market today and is ideally suited for large scale, multi megawatt energy storage applications. Power-to-Gas is the three-step process of integrating renewable sources of generation by load-following, converting the surplus electricity to hydrogen or renewable gas, and finally the gas is used for fuel, power generation or industrial purposes. An electrolyzer provides the rapid, dynamic response to the Independent System Operator’s signals to accurately load-follow the intermittent generation pattern of renewable sources such as wind turbines. Surplus electricity can be stored for consecutive days or even consecutive weeks without the need to discharge; it is a seasonal storage capability. This energy storage solution bridges the power grid and the gas grid to unlock new options. It enhances the flexibility of managing the power grid and provides the means to capitalize on the vast potential of alternative sources of generation to produce a local source of renewable gas to de-carbonize the gas system. Hydrogenics is working with global energy utilities such as Uniper and, most recently in a joint venture with Enbridge, to commercialize Power-to-Gas energy storage.
2018 Management’s Discussion and Analysis | Page 5 |
In addition to Power-to-Gas market, large-scale industrial applications are also appearing for the fueling market, which can be supported by the same PEM electrolysis technology we use for Power-to-Gas. Fueling market opportunities are being driven by the planned deployment of heavy mobility applications for trains, buses and trucks with fleet-based requirements. We also are promoting electrolysis in hydrogen fueling stations combined with possible Power-to-Gas solutions at a distributed storage level. The electrolyzer can be used to generate hydrogen during periods of surplus energy levels, thus absorbing the excess energy at lower cost to generate hydrogen. This hydrogen is then stored at site and can be used to fuel hydrogen cars, trains, trucks and buses. If the surplus power is generated from renewable energy sources such as wind and solar, the potential exists for a completely zero-emission “green” solution as hydrogen fuel cell vehicle emissions only produce water vapor.
During the past year, we have identified several large-scale applications which would consume 10 to 100 megawatts (“MW”) of power, which is 100 to 300 times larger than a typical industrial unit to date. On February 25, 2019, we announced the first award of such a project at 20 MW for Air Liquide Canada. On December 21, 2018, we announced the signing of a Technology and Business Development Agreement (“TBDA”) with The Hydrogen Company (“H2C”), a wholly-owned subsidiary of L’Air Liquide S.A. (“Air Liquide”). The terms of the TBDA provide for the joint development of a large scale PEM electrolysis solution focused on lowering the total cost of ownership and collaboration to bid this solution on large scale PEM electrolysis projects worldwide.
Engagement with other lead customers, such as Uniper and Enbridge, continues to suggest substantial long-term opportunity for Power-to-Gas, an application for energy conversion and storage. The ongoing commercialization of these applications will coincide with changes to legal and regulatory frameworks in countries that recognize the commercial importance of energy storage as a key factor in energy management and reducing a carbon footprint for electricity generation. A notable development in 2018 was the adoption of the Renewable Energy Directive, Part ii in June by the European union, which formally sanctioned hydrogen as a zero-emission solution across both motive and Power-to-Gas applications.
The business objectives for our OnSite Generation group are to: (i) continue to pursue opportunities for customers to convert otherwise wasted renewable energy, such as wind, solar or excess baseload energy, into hydrogen; (ii) further expand into global markets, such as Eastern Europe (including Russia), Asia, Australia, North America and the Middle East; (iii) grow our fueling station business; (iv) further increase the gross margins of existing product lines by improving our procurement and manufacturing processes; (v) reduce the total cost of ownership of our products through design and technology improvement; and (vi) further increase the reliability and durability of our products to exceed the expectations of our customers and improve the performance of our applications.
Power Systems
Our Power Systems business segment is based on PEM fuel cell technology, which transforms chemical energy liberated during the electrochemical reaction of hydrogen and oxygen into electrical energy. Our HyPM® branded fuel cell products are based on our extensive track record of on-bench testing and real-time deployments across a wide range of stationary and motive power profiles. We configure our HyPM® products into multiple electrical power outputs ranging from three kW to one MW with ease of integration, high reliability and operating efficiency, delivered from a highly compact fuel cell and balance of stack design.
Our target markets include motive power applications, such as trains, buses, trucks and heavy-duty utility vehicles and stationary power applications (including primary and back-up power). Our target future addressable markets (stationary power and mobility markets) are estimated to be in excess of $2 billion specifically related to power systems now largely served by diesel power generation and other liquid fuels.
Our Power Systems products are sold to leading Original Equipment Manufacturers (“OEMs”) and drive systems integrators for motive power. Additionally, our products are sold for prototype field tests intended to be direct replacements for traditional lead-acid battery packs for motive applications. We also sell our power systems in stationary power applications such as those employed for telecom applications. Finally, we also sell our Power Systems products to aerospace, military and other early adopters of emerging technologies.
2018 Management’s Discussion and Analysis | Page 6 |
The business objectives for our Power Systems group are to: (i) offer a standard fuel cell platform configurable for many markets, thereby enabling manufacturing efficiencies and reduced development spending; (ii) achieve further market penetration in the stationary power and motive power markets by tailoring our HyPM® fuel cell products to meet market specific requirements, including price, performance and features; (iii) reduce product cost while improving durability and reliability; (iv) invest in sales and market development activities in the backup power and motive power markets; (v) continue to target early adopters of emerging technologies as a bridge to future commercial markets; and (vi) secure the requisite people and processes to align our anticipated growth plans with our resources and capabilities.
Our Power Systems business competes with several well-established battery and internal combustion engine companies in addition to several other fuel cell companies. We compete on relative price to performance, design innovation and ease of integration. In the backup power market, we believe our HyPM® systems have an advantage over batteries and internal combustion engines for customers seeking extended run requirements, by offering more reliable and economical performance. In motive power markets, we believe our HyPM® products are well positioned against diesel generation and lead-acid batteries by offering increased productivity, lower operational costs and extended range.
There are four types of fuel cells other than PEM fuel cells that are generally considered to have possible commercial applications, including phosphoric acid fuel cells, molten carbonate fuel cells, solid oxide fuel cells and alkaline fuel cells. Each of these fuel cell technologies differs in their component materials and operating characteristics. While all fuel cell types may have potential environmental and efficiency advantages over traditional power sources, we believe PEM fuel cells can be manufactured less expensively and are more efficient and more practical in compact-scale stationary and motive power applications. Furthermore, most automotive companies have selected PEM technology for fuel cell powered automobiles. We expect this will help establish concentration around PEM technology and may result in a lower cost in the supply chain, as compared to the other fuel cell technologies.
How We Sell Our Products
Our products are sold worldwide to OEMs, systems integrators and end-users through a direct sales force and a network of distributors. Our sales method varies depending on the product offering, market and stage of technology adoption. As discussed above, the terms of the TBDA with Air Liquide provide for a joint collaboration to bid on large scale PEM electrolysis projects.
Intellectual Property
We protect our intellectual property by means of a combination of patents, copyrights, trademarks, trade secrets, licenses, non-disclosure agreements and contractual provisions. We generally enter into non-disclosure and confidentiality agreements with each of our employees, consultants and third parties that have access to our proprietary technology. We currently hold 175 patents in a variety of jurisdictions and have 45 patent applications pending. Additionally, we enter into commercial licenses and cross-licenses to access third party intellectual property.
We believe our intellectual property provides us with a strong competitive advantage and represents a significant barrier to entry into our industry for potential competitors. As part of our patent portfolio, we maintain a collection of innovative energy storage patents with broad and exclusive rights concerning the use of excess electrical power to produce hydrogen from water while simultaneously providing electric grid stabilization services. We believe these patents place Hydrogenics in the strongest possible position to build our Company over the long-term and will continue to strengthen our efforts across the target markets and applications described above.
We typically retain sole ownership of intellectual property developed by us. In certain situations, we provide for shared intellectual property rights. We have these rights in perpetuity, including subsequent improvements to the licensed technology.
Given the relative early stages of our industry, our intellectual property is and will continue to be important in providing differentiated products to customers.
2018 Management’s Discussion and Analysis | Page 7 |
Government Regulation
We are not subject to regulatory commissions governing traditional electric utilities and other regulated entities in any of the jurisdictions that we operate in. Our products are subject to oversight and regulation by governmental bodies in regards to building codes, fire codes, public safety, electrical and gas pipeline connections and hydrogen siting, among others.
Our strategy is to develop electrolyzer and fuel cell products for sale to OEMs, integrators, electric utilities, gas utilities, merchant gas companies, municipalities and other owners of mass transit applications (such as buses and trains) and end-users requiring highly reliable products offered at competitive prices. We believe our success will be substantially predicated on the following factors:
Increasing Market Penetration
At December 31, 2018, we had 17 full-time staff employed in sales functions. Five of our senior management team are also actively involved in sales initiatives, including maintaining close contact with our more significant customers. Our focus remains to strengthen the sales function by continually assessing responsibilities to permit dedicated sales leadership, obtaining detailed assessments of markets, and leveraging our strategic relationships with companies such as Enbridge, Air Liquide and Alstom. Notable in 2018 was the signing of the TBDA with Air Liquide noted in Section 1 above.
During 2018, we continued the focus prior years on developing several key markets and geographies. After a strong start in the Chinese market in 2017 for Power Systems, progress slowed in 2018. The integration and deployment of the earlier shipped volumes consumed the available execution capability to deploy more. We anticipate ongoing growth in demand in China and we continue our discussions with multiple existing and new partners to realize further sales and deliver on current backlog. Also on the mobility front, work continued on our 10 year contract to develop and supply hydrogen fuel cell propulsion systems for Alstom Transport for passenger rail in Europe. Notable in 2018 was the certification and subsequent commissioning into service of the Coradia iLint platform. This has provided Alstom with a significant catalyst in their sales efforts for the platform as it is now in service and production orders under our contract are expected in 2019. We are also actively investigating extending hydrogen rail opportunities into other markets; notably, in North America, Europe and Asia.
Additionally, we have developed or maintained relationships with third parties we believe are well positioned in our relevant markets to identify new opportunities for our products. In the industrial gas market, these third parties include leading merchant gas companies, such as Air Liquide. In the energy storage market, we are leveraging our strategic relationship with Enbridge. During 2018, the energy storage facility project was commissioned and accepted by the Independent Energy Service Operator (“IESO”). The facility began in-service operations under an IESO Regulation Services contract effective May 2018.
Please also refer to Section 1 Our Business under Power Systems and OnSite Generation for further discussion related to increasing our market penetration.
Future Markets
There are several drivers which will accelerate growth in our markets in the coming year. Electrification of transport, elimination of diesel fuel and ongoing concern about air quality are major themes. Increasingly around the world, governments are supporting these themes with policy and funding initiatives. Hydrogen is a versatile energy carrier which enables the “coupling” of sectors which depend on energy. Renewable power generation, efficient grid operations, industrial demand and transport can all be served in an integrated way with hydrogen. Accordingly, our combined competence in electrolysis (the fuel side) and fuel cells (the engine side) supports attractive future market optionality for the company.
Advancing Our Product Designs
Within our OnSite Generation business segment, we remain focused on two key areas. First, reducing the cost of our HySTAT® alkaline electrolyzer and improving its efficiency. Innovation in the design, elimination of non-value adding components, improved component sourcing and fundamental electrochemical improvements have all contributed to ongoing cost reduction initiatives in 2018 and beyond. We also recognize the opportunity for larger scale energy storage installations and are continuing to develop significantly scale-up products to better meet this market opportunity. Second, we are looking at continuing the rollout of PEM electrolysis, particularly in the area of Power-to-Gas where PEM technology provides a more scalable solution than alkaline electrolysis at higher power levels. The terms of the TBDA announced with Air Liquide noted in Section 1 aligns with this focus area as it provides for the joint development of a large-scale PEM electrolysis solution focused on lowering the total cost of ownership.
2018 Management’s Discussion and Analysis | Page 8 |
Within our Power Systems business segment, we spent much of 2018 focusing on further reducing the cost of a fully integrated fuel cell system inclusive of its components and expanding our core product range to 50kW. We continue to leverage our integration capability in taking a standard fuel cell stack and finding multiple cost-effective applications. The result is a common building block such as our (HD30 30kW fuel cell) being used in multiple applications such as buses, stationary power and grid stabilization. We have achieved significant cost reduction milestones but will continue to further improve the financial viability of the product in the marketplace by looking at both scale (increased volume ordering from suppliers) as well as bringing components of the supply chain in-house to further reduce production cost.
Selected Financial information
(in thousands of US dollars, except per share amounts)
| | | | | | | | | | | | | | | | |
| | | Year ended December 31, | | | Favourable
(Unfavourable) | |
| | | 2018 | | | 2017 | | | 2016 | | | 2018 vs 2017 | | | 2017 vs 2016 | |
| OnSite Generation | | $ | 18,308 | | | $ | 25,268 | | | $ | 17,510 | | | | (28 | )% | | | 44 | % |
| Power Systems | | | 15,588 | | | | 22,847 | | | | 11,480 | | | | (32 | )% | | | 99 | % |
| Total revenue | | | 33,896 | | | | 48,115 | | | | 28,990 | | | | (30 | )% | | | 66 | % |
| | | | | | | | | | | | | | | | | | | | | |
| Gross profit | | | 8,725 | | | | 11,678 | | | | 5,995 | | | | (25 | )% | | | 95 | % |
| Gross Margin % | | | 26 | % | | | 24 | % | | | 21 | % | | | | | | | | |
| | | | | | | | | | | | | | | | | | | | | |
| Selling, general and administrative expenses | | | 11,613 | | | | 13,626 | | | | 10,825 | | | | 15 | % | | | (26 | )% |
| Research and product development expenses, net | | | 7,486 | | | | 6,376 | | | | 3,576 | | | | (17 | )% | | | (78 | )% |
| | | | | | | | | | | | | | | | | | | | | |
| Loss from operations | | | (10,374 | ) | | | (8,324 | ) | | | (8,406 | ) | | | (25 | )% | | | 1 | % |
| | | | | | | | | | | | | | | | | | | | | |
| Loss from joint ventures | | | (1,637 | ) | | | (334 | ) | | | (156 | ) | | | (390 | )% | | | (114 | )% |
| Finance loss, net | | | (1,028 | ) | | | (2,108 | ) | | | (1,295 | ) | | | 51 | % | | | (63 | )% |
| Income tax expense | | | (300 | ) | | | – | | | | – | | | | n/a | | | | n/a | |
| Net loss | | $ | (13,339 | ) | | $ | (10,766 | ) | | $ | (9,857 | ) | | | (24 | )% | | | (9 | )% |
| Net loss per share | | $ | (0.86 | ) | | $ | (0.77 | ) | | $ | (0.79 | ) | | | (12 | )% | | | 2 | % |
| | | | | | | | | | | | | | | | | | | | | |
| Cash operating costs1 | | $ | 18,309 | | | $ | 17,725 | | | $ | 13,894 | | | | (3 | )% | | | (28 | )% |
| Adjusted EBITDA1 | | | (9,387 | ) | | | (5,960 | ) | | | (7,555 | ) | | | (57 | )% | | | 21 | % |
| | | | | | | | | | | | | | | | | | | | | |
| Cash used in operating activities | | | (8,381 | ) | | | (4,782 | ) | | | (13,213 | ) | | | (75 | )% | | | 64 | % |
| Cash and cash equivalents (including restricted cash) | | | 8,737 | | | | 22,414 | | | | 11,278 | | | | (61 | )% | | | 99 | % |
| Total assets | | | 49,924 | | | | 66,215 | | | | 49,273 | | | | (25 | )% | | | 34 | % |
| Total non-current liabilities (excluding contract liabilities and deferred funding) | | $ | 6,521 | | | $ | 9,492 | | | $ | 10,103 | | | | 31 | % | | | 6 | % |
| 1 | Cash operating costs and Adjusted EBITDA are Non-IFRS measures. Refer to section 14 – Reconciliation of Non-IFRS Measures. |
2018 Management’s Discussion and Analysis | Page 9 |
Highlights for the year ended December 31, 2018 compared to the year ended December 31, 2017
| • | Revenues decreased by $14.2 million, or 30% to $33.9 million for the year ended December 31, 2018 compared to $48.1 million in the prior year. Power Systems business segment revenues declined by 32% primarily attributable to delayed customer orders against our backlog for the Chinese market due to the capacity of our existing integration partners to deploy and support more units beyond the large number of units they ordered in 2017. OnSite Generation business segment revenues declined by 28% due to reduced demand for our onsite industrial hydrogen solution. |
| | | |
| | • | We received $32.9 million in new orders for the year ended December 31, 2018 (2017 – $75.9 million) consisting of $19.4 million (2017 – $21.7 million) for the OnSite Generation business and $13.5 million (2017 – $54.2 million) for the Power Systems business. The OnSite Generation business achieved a net positive order intake of $1.1 million, whereas orders delivered exceeded orders received by $2.1 million in Power Systems. As discussed in our Q2-2018 MD&A, we commenced discussions with Kolon Water and Energy Co. Ltd. with respect to dissolving our joint arrangement. Accordingly, $7.5 million of backlog with the joint venture arrangement for Power Systems was cancelled at that time. Accumulated backlog otherwise remains strong and our sales pipeline remains very active across both lines of business. |
| | | | | | | | | | | | | | | | | | | | | | |
| | | December 31, 2017
backlog | | | IFRS 15
Adj. | | | Orders
Received | | | FX | | | Orders
Delivered/
Revenue
Recognized | | | Orders cancelled | | | December 31, 2018
backlog | |
| OnSite Generation | | $ | 19.9 | | | $ | (0.8 | ) | | $ | 19.4 | | | $ | 0.4 | | | $ | 18.3 | | | $ | – | | | $ | 20.6 | |
| Power Systems | | | 124.7 | | | | (0.3 | ) | | | 13.5 | | | | (2.7 | ) | | | 15.6 | | | | 7.5 | | | | 112.1 | |
| Total | | $ | 144.6 | | | $ | (1.1 | ) | | $ | 32.9 | | | $ | (2.3 | ) | | $ | 33.9 | | | $ | 7.5 | | | $ | 132.7 | |
| • | Of the above backlog of $132.7 million, we expect to recognize approximately $49.0 million as revenue in the following 12 months. |
| | | |
| | • | Gross margin increased from 24% to 26% of revenue primarily due to product mix within the Power Systems segment, which saw an increase in gross margin from 35% to 39%. The OnSite Generation segment gross margin of 14% was the same as last year. |
| | | |
| | • | Selling, general and administrative (“SG&A”) expenses for 2018 of $11.6 million were lower by $2.0 million, or 15%, compared to $13.6 million for the year ended December 31, 2017. The decrease is attributable to non-cash gains realized on the revaluation of Deferred Share Units (“DSUs”) in 2018 due to changes in our stock price, a reconciliation of which is provided in Section 14 under Cash Operating Costs. Net of these non-cash gains, SG&A for the year decreased by $0.4 million, or 3.3% as compared to last year. |
| | | |
| | • | Net research and product development (“R&D”) expenses were $7.5 million for the year ended December 31, 2018 compared to $6.4 million in 2017, an increase of $1.1 million, or 17%. Of the $7.5 million spent on net R&D, $1.3 million relates to construction of a hydrogen fueling station we will own and operate in the Greater Toronto Area, $0.6 million relates to commissioning costs for the 2.5MW Power-to-Gas joint venture with Enbridge, $1.8 million relates to our Fuel Cell Power Module (“FCPM”) manufacturing expansion and process improvement initiatives, $2.2 million relates to expanding our FCPMs to new mobility use cases and furthering development on the next generation of our fuel cell stack platform, and $1.6 million relates to product development within our OnSite Generation business. |
| | | |
| | • | Loss from operations increased by $2.1 million for the year ended December 31, 2018 to $10.4 million as compared to $8.3 million in 2017. The increase is attributable to lower revenue and reduced gross profit, higher net R&D expenses partially offset by lower SG&A for the year, as noted above. |
| | | |
| | • | Loss from joint ventures increased by $1.3 million for the year ended December 31, 2018 attributable to the loss of $1.6 million recorded in the second quarter of 2018 to adjust the carrying value of our investment in our joint venture arrangement with Kolon Water and Energy Co. Ltd. |
| | | |
| | • | Net finance loss decreased by $1.1 million for the year ended December 31, 2018 due primarily to the non-cash gains on the change in fair value of outstanding warrants due to a lower share price. |
2018 Management’s Discussion and Analysis | Page 10 |
| | • | Net loss for the year ended December 31, 2018 was $13.3 million, or $0.86 per share, compared to a net loss of $10.8 million, or $0.77 per share, for the prior year. The increase in net loss in the current year is a result of lower revenue and gross profit, the increase in loss from joint ventures and higher net R&D partially offset by the decreases in SG&A expenses and net finance loss, as discussed above. |
| | | |
| | • | Cash operating costs increased by $0.6 million for the year ended December 31, 2018 compared to last year attributable to an increase in net R&D of $1.1 million, partially offset by a $0.4 million decrease in SG&A expenses. |
| | | |
| | • | Adjusted EBITDA loss increased by $3.4 million to $9.4 million for the year ended December 31, 2018 from $6.0 million for the prior year. The increase is primarily attributable to lower gross profit of $3.0 million and higher cash operating costs of $0.6 million. |
Highlights for the previous year ended December 31, 2017 compared to the year ended December 31, 2016
| | • | Revenues increased by $19.1 million, or 66%, to $48.1 million for the year ended December 31, 2017 compared to $29.0 million in the prior year due primarily to increases in shipments in both of our segments. Specifically: i) an $8.7 million increase in Power Systems revenue principally related to the delivery of fuel cell mobility orders to the Chinese mobility market; and ii) $11.1 million in energy storage orders related to Power-to-Gas applications for EGAT Thailand, Doosan Babcock in Aberdeen, Scotland, and Brunsbuttel, Germany. |
| | | |
| | • | The Company received new orders for $21.7 million (2016 - $21.2 million) for the OnSite Generation business and $54.2 million (2016 - $22.8 million) for the Power Systems business. |
| | | | | | | | | | | | | | | | |
| | | December 31, 2016
backlog | | | Orders
Received | | | FX | | | Orders
Delivered/
Revenue
Recognized | | | December 31, 2017
backlog | |
| OnSite Generation | | $ | 20.8 | | | $ | 21.7 | | | $ | 2.4 | | | $ | 25.0 | | | $ | 19.9 | |
| Power Systems | | | 85.8 | | | | 54.2 | | | | 7.8 | | | | 23.1 | | | | 124.7 | |
| Total | | $ | 106.6 | | | $ | 75.9 | | | $ | 10.2 | | | $ | 48.1 | | | $ | 144.6 | |
| | • | Gross margin increased from 21% to 24% of revenue primarily due to product mix within the Power Systems segment, which saw an increase in gross margin from 22% to 35%. This was partially offset by several key first-of-a-kind projects having a lower margin profile within the OnSite Generation segment. |
| | | |
| | • | SG&A expenses for 2017 of $13.6 million were greater by $2.8 million, or 26%, compared to $10.8 million for the year ended December 31, 2016. Excluding the impact of the reversal of an indemnification liability of $0.5 million associated with an acquisition in 2004 included within the year ended 2016 as well as the reversal of previously charged compensation expense for PSUs of $0.2 million also included within the year ended 2016, SG&A expenses increased $2.1 million. This increase was due to: i) mark-to-market expenses totaling $1.2 million as a result of the increase in our share price for the year ended December 31, 2017 as compared to the year ended December 31, 2016 (to C$14.00 from C$5.75); ii) an increase of $0.5 million in allowance for doubtful accounts related to the collectability of a receivable related to a energy storage project; and iii) an increase of $0.4 million relating to increased business activity, such as compensation costs tied to the achievement of targets, legal fees and insurance costs. |
| | | |
| | • | R&D expenses were $6.4 million for the year ended December 31, 2017 compared to $3.6 million in 2016, an increase of $2.8 million, or 78%. In the Power Systems segment, theincrease represents increased spending on R&D, primarily for multi-megawatt energy storage projects specifically for our Power-to-Gas facility with our Enbridge joint venture in Toronto, Canada, and mobility applications such as ongoing development on the next generation of our fuel cell stack platform for mobility applications such as rail, trucks and buses. While net R&D expenses also increased in the OnSite Generation segment, this increase was principally due to a decline in funded R&D as there was a significant Power-to-Gas demonstration project ongoing in Denmark in 2016. Overall gross R&D spending levels at OnSite Generation declined year-over-year. |
| | | |
| | • | Adjusted EBITDA loss decreased to $6.0 million for the year ended December 31, 2017 from $7.6 million for the prior year, for the reasons noted above. |
2018 Management’s Discussion and Analysis | Page 11 |
| | • | Net loss for the year ended December 31, 2017 was $10.8 million, or $0.79 per share, compared to a net loss of $9.9 million, or $0.79 per share, for the prior year. While gross profit increased over $5.7 million, the increase in SG&A expenses and R&D expenses, as discussed above, resulted in a consistent loss from operations when compared to the year ended December 31, 2016. The increase in net loss in the current period reflects an increase in other finance losses of $1.0 million. There was a $0.7 million loss on fair value adjustments relating to outstanding and exercised warrants in the year ended December 31, 2017, whereas the year ended December 31, 2016 included a $0.8 million fair value gain related to outstanding warrants. This was offset by an increase in net foreign currency gains (losses) from a loss of $0.3 million for the year ended December 31, 2016 to a gain of $0.6 million in the current year. |
| | | |
| | • | Cash operating costs increased 28% to $17.8 million for the year ended December 31, 2017, compared to $13.9 million for the year ended December 31, 2016, primarily reflecting the increase in SG&A and net R&D expenses above. |
Business Segment Review
We report our results in two business segments: OnSite Generation and Power Systems. Our reporting structure reflects the way we manage our business and how we classify our operations for planning and measuring performance. The corporate office and administrative support is reported under Corporate and Other. Refer to Section 10 Strategy and Outlook for a more extensive discussion regarding our products, markets and our business segment strategy.
OnSite Generation
Selected Financial Information
| | | | | | | | | | |
| | | Years ended December 31, | | | Favourable
(Unfavourable) | |
| | | 2018 | | | 2017 | | | 2018 vs 2017 | |
| Revenues | | $ | 18,308 | | | $ | 25,268 | | | | (28 | )% |
| Gross profit | | | 2,648 | | | | 3,663 | | | | (28 | )% |
| Gross margin % | | | 14 | % | | | 14 | % | | | - | |
| Selling, general and administrative expenses | | | 2,959 | | | | 3,381 | | | | 12 | % |
| Research and product development expenses, net | | | 2,927 | | | | 1,275 | | | | (130 | )% |
| Segment loss | | $ | (3,238 | ) | | $ | (993 | ) | | | (226 | )% |
Revenuesdecreased by 28% for the year ended December 31, 2018 as compared to last year due to reduced demand for industrial hydrogen equipment. New orders awarded for the year ended December 31, 2018 amounted $19.4 million (2017 – $21.7 million), resulting in a net increase of $0.7 million in our backlog during the year. Backlog at December 31, 2018 of $20.6 million (2017 - $19.9 million) is expected to be recognized as revenue in the next twelve months.
Gross margin remained consistent with last year despite the lower level of revenue available to absorb fixed production overheads.
SG&A expenses decreased by 12% in 2018 versus 2017 attributable to the write-off in 2017 of $0.4 million for bad debts. Otherwise expenses were comparable year over year.
Net R&D expensesincreased in 2018 versus 2017, primarily attributable to the construction of a hydrogen fueling station in the Greater Toronto Area that the Company will own and operate. These expenses amounted to $1.3 million for the year ended December 31, 2018 with a further $1.6 million spent related to product development activities.
Segment lossincreased by $2.2 million for the year ended December 31, 2018, as compared to the same period last year, reflecting lower gross profit of $1.0 million and the increase in net R&D expenses of $1.7 million, partially offset by the decrease in SG&A of $0.4 million.
2018 Management’s Discussion and Analysis | Page 12 |
Power Systems
Selected Financial Information
| | | | | | | | | | |
| | | Years ended December 31, | | | Favourable
(Unfavourable) | |
| | | 2018 | | | 2017 | | | 2018 vs 2017 | |
| Revenues | | $ | 15,588 | | | $ | 22,847 | | | | (32 | )% |
| Gross Profit | | | 6,077 | | | | 8,015 | | | | (24 | )% |
| Gross margin % | | | 39 | % | | | 35 | % | | | 11 | % |
| Selling, general and administrative expenses | | | 4,276 | | | | 4,321 | | | | 1 | % |
| Research and product development expenses, net | | | 4,495 | | | | 4,996 | | | | 10 | % |
| Segment loss | | $ | (2,694 | ) | | $ | (1,302 | ) | | | (107 | )% |
Revenuesdecreased $7.3 million for the year ended December 31, 2018 as compared to the same period in 2017. The decrease in revenue is attributable to delayed customer orders against our existing backlog for the Chinese market due to the capacity of our existing integration partners to deploy and support more units beyond the larger number of units they ordered in 2017.
Orders awarded through 2018 amounted to $13.5 million (2017– $54.2 million) versus revenue of $15.6 million over the same period, resulting in a $2.1 million net decrease in backlog. As discussed in Section 3 Overall Performance and in our Q2-2018 MD&A, we commenced discussions in June 2018 with Kolon Water and Energy Co. Ltd. with respect to dissolving our joint venture arrangement. Accordingly, $7.5 million of backlog with the joint venture was cancelled in the second quarter 2018. The balance of backlog reduction year over year relates to foreign exchange movements. Backlog otherwise remained strong and our sales pipeline remains very active. Specifically, at December 31, 2018, backlog was $112.1 million (2017 – $124.7 million) with approximately $28.4 million of this backlog expected to be recognized as revenue in the next twelve months.
Gross marginof 39% was achieved in 2018, compared to 35% in 2017. The lower margin in 2017 was due in part to the initial production run of the Alstom commuter rail power modules. However, the improved margin in 2018 also reflects year-over-year progress towards product standardization, production process efficiencies and improved supply chain management.
SG&A expensesin 2018 were comparable with the prior year.
Net R&D expenses were down $0.5 million for the year ended December 31, 2018 versus the comparative period in 2017 attributable to Canadian government funding received in 2018 towards manufacturing and product development initiatives. Year-to-date 2018 expenses of $4.5 million reflect spending of $0.6 million on the development of the multi-megawatt energy storage project using PEM fuel cell technology, $1.7 million on government funded FCPM manufacturing expansion and process improvement initiatives, and $2.2 million related to expanding our FCPMs to new mobility use cases, such as heavy duty commercial vehicles, and ongoing development on the next generation of our fuel cell stack platform. The Canadian government funding noted above was awarded in March 2018 and subsequently cancelled effective September 28, 2018, coinciding with a change in government and policy direction.
Segment loss increased $1.4 million for the year ended December 31, 2018 compared to same period in 2017 due to lower revenue and lower gross profit of $1.9 million offset by the decrease in R&D expenses of $0.5 million.
2018 Management’s Discussion and Analysis | Page 13 |
Corporate and Other
Selected Financial Information
| | | | | | | | | | |
| | | Years ended December 31, | | | Favourable
(Unfavourable) | |
| | | 2018 | | | 2017 | | | 2018 vs 2017 | |
| Selling, general and administrative expenses | | $ | 4,378 | | | $ | 5,924 | | | | 26 | % |
| Research and product development expenses, net | | | 64 | | | | 105 | | | | 39 | % |
| Loss from joint ventures | | | 1,637 | | | | 334 | | | | (390 | )% |
| Interest expense, net | | | 1,469 | | | | 1,812 | | | | 19 | % |
| Foreign currency gains, net | | | (144 | ) | | | (635 | ) | | | (77 | )% |
| Other finance (gains) losses, net | | | (297 | ) | | | 931 | | | | n/a | |
| Segment loss | | $ | 7,107 | | | $ | 8,471 | | | | 16 | % |
SG&A expenses decreased $1.5 million for the year ended December 31, 2018 versus the comparative period in 2017. The decrease is a result of a net $1.6 million positive change in the non-cash fair value adjustments of DSUs (as reflected in the reconciliation of Cash Operating Costs in Section 14 Reconciliation of Non-IFRS measures). SG&A expenses for the year ended December 31, 2018 were otherwise comparable to same period in 2017.
Loss from joint venturesincreased $1.3 million for the year ended December 31, 2018 as compared to the prior year. The increase relates primarily to the loss of $1.6 million recorded in the second quarter of 2018 to reflect a reduction of the carrying value of the assets of Kolon Hydrogenics to their estimated net recoverable amount based upon an assessment of fair values less costs of disposal. This write-down coincided with discussions commenced in June 2018 with Kolon Water and Energy Co. Ltd. with respect to dissolving our joint venture arrangement expected in 2019.
Net interest expensedecreased $0.3 million for the year ended December 31, 2018 as compared to last year due to lower debt outstanding year over year due to principal repayments.
Net foreign currency gainsdecreased as a result of principal repayments of Canadian dollar denominated loans during the year.
Other net finance gains (losses)improved $1.2 million for the year ended December 31, 2018 compared to last year attributable to non-cash fair value adjustments for outstanding warrants. The improvement was driven by a lower share price as well as the effect of fewer warrants outstanding relative to the prior year.
2018 Management’s Discussion and Analysis | Page 14 |
| | | | | | | | | | | | | |
| | | December 31, | | | December 31, | | | Increase (decrease) | |
| | | 2018 | | | 2017 | | | $ | | | % | |
| Cash, cash equivalents and restricted cash | | $ | 8,737 | | | $ | 22,414 | | | $ | (13,677 | ) | | | (61 | )% |
| Trade and other receivables | | | 6,728 | | | | 8,736 | | | | (2,008 | ) | | | (23 | )% |
| Contract assets – (current and non-current) | | | 6,223 | | | | 7,223 | | | | (1,000 | ) | | | (14 | )% |
| Inventories | | | 17,174 | | | | 15,048 | | | | 2,126 | | | | 14 | % |
| Prepaid expenses | | | 1,960 | | | | 1,374 | | | | 586 | | | | 43 | % |
| Operating borrowings | | | – | | | | 1,200 | | | | (1,200 | ) | | | 100 | % |
| Trade and other payables | | | 9,068 | | | | 9,736 | | | | (668 | ) | | | (7 | )% |
| Contract liabilities – (current and non-current) | | | 16,001 | | | | 14,044 | | | | 1,957 | | | | 14 | % |
| Financial liabilities | | | 3,359 | | | | 4,913 | | | | (1,554 | ) | | | (32 | )% |
| Provisions – (current and non-current) | | | 2,851 | | | | 2,720 | | | | 131 | | | | 5 | % |
| Deferred funding – (current and non-current) | | | 1,973 | | | | 913 | | | | 1,060 | | | | 116 | % |
| Other non-current liabilities | | | 5,711 | | | | 8,516 | | | $ | (2,805 | ) | | | (33 | )% |
Cash, cash equivalents and restricted cashdecreased $13.7 million or 61% in 2018. $5.8 million was used to pay principal and interest on long term debt and repay operating borrowings and $8.4 million was used for operating activities. This was offset by net $0.5 million of cash provided by investing activities attributable to government funding and proceeds on the disposal of equipment. Refer to Section 6 – Liquidity and Capital Resources for a more detailed discussion of the change in cash, cash equivalents and restricted cash.
Trade and other receivablesdecreased $2.0 million consistent with lower revenue in current year versus last year.
Contract assets (current and non-current)decreased $1.0 million due to the change in value of amounts recognized on performance obligations satisfied over time for a long-term Power Systems contract as well as revenue recognized for start-up and commissioning of equipment consistent with the application of IFRS 15, described in Section 9 Changes in Accounting Policies and Recent Accounting Pronouncements.
Inventories increased $2.1 million attributable to work in progress and finished goods inventory build-up required to support the schedule of expected deliveries against our backlog for Power Systems and OnSite Generation products into Q1-2019.
Prepaid expensesincreased $0.6 million reflecting prepayment of purchasing commitments and transaction costs incurred for the subscription agreement with Air Liquide.
Trade and other payablesdecreased $0.7 million as we reduced purchases for long lead items only given the availability of current inventory levels to support scheduled deliveries over the next quarter.
Contract liabilities (current and non-current)increased $2.0 million primarily attributable to the net receipt of deposits on new contracts versus deposits applied to invoiced contracts as compared to the prior year.
Financial liabilitiesdecreased $1.6 million reflecting the revaluation to fair value of outstanding warrants and DSU liabilities compared to December 31, 2017 attributable to drop in our share price year over year.
Provisions include warranty and start-up and commissioning. Warranty provisions increased $0.2 million mainly attributable to additional work required on projects delivered in the prior year offset by a $0.1 million decrease in start-up and commissioning provisions mainly due to strengthening of U.S. dollar against Euro during the year.
Deferred fundingincreased $1.1 million reflecting the receipt of funding for new energy storage projects in Europe.
Other non-current liabilities decreased $2.8 million due to principal repayments made in the year on our long-term debt with Export Development Canada and the Province of Ontario.
2018 Management’s Discussion and Analysis | Page 15 |
| 5 | Summary of Quarterly Results |
The following table highlights selected financial information for the eight consecutive quarters ended December 31, 2018.
| | | | | | | | | | | | | | | | | | | | | | | | | |
| | | 2018 | | | 2018 | | | 2018 | | | 2018 | | | 2017 | | | 2017 | | | 2017 | | | 2017 | |
| | | Q4 | | | Q3 | | | Q2 | | | Q1 | | | Q4 | | | Q3 | | | Q2 | | | Q1 | |
| Revenues | | $ | 10,475 | | | $ | 7,665 | | | $ | 7,609 | | | $ | 8,147 | | | $ | 19,745 | | | $ | 12,079 | | | $ | 7,556 | | | $ | 8,735 | |
| Gross profit | | | 1,915 | | | | 1,471 | | | | 2,101 | | | | 3,238 | | | | 5,668 | | | | 2,897 | | | | 440 | | | | 2,673 | |
| Gross margin % | | | 18.3 | % | | | 19 | % | | | 28 | % | | | 40 | % | | | 29 | % | | | 24 | % | | | 6 | % | | | 31 | % |
| Adjusted EBITDA | | | (2,805 | ) | | | (2,529 | ) | | | (2,447 | ) | | | (1,606 | ) | | | 175 | | | | (1,947 | ) | | | (3,446 | ) | | | (742 | ) |
| Net loss | | | (3,141 | ) | | | (3,443 | ) | | | (4,801 | ) | | | (1,954 | ) | | | (975 | ) | | | (2,032 | ) | | | (5,462 | ) | | | (2,297 | ) |
| Net loss per share - basic and fully diluted | | $ | (0.20 | ) | | $ | (0.22 | ) | | $ | (0.31 | ) | | $ | (0.13 | ) | | $ | (0.06 | ) | | $ | (0.13 | ) | | $ | (0.43 | ) | | $ | (0.18 | ) |
| Weighted average common shares outstanding | | | 15,441,947 | | | | 15,442,416 | | | | 15,440,888 | | | | 15,436,879 | | | | 15,133,194 | | | | 15,232,905 | | | | 12,677,167 | | | | 12,545,076 | |
When comparing the fourth quarter of 2018 to the fourth quarter of 2017, our net loss increased by $2.2 million to $3.1 million ($0.20 per common share) compared to a net loss of $1.0 million ($0.06 per common share). This increase was driven by lower revenue of $9.3 million and a decrease in gross profit of $3.8 million. Adjusted EBITDA decreased by $3.0 million to a loss of $2.8 million from a profit of $0.2 million reflecting the decrease in gross profit of $3.8 million, offset by a decrease in cash operating costs of $0.6 million. The decrease in cash operating costs is attributable to lower SG&A expenses of $1.0 million offset by higher net R&D expenses of $0.4 million attributable to FCPM manufacturing expansion and process improvement initiatives in the current quarter. The focus of our R&D activities in Q4-2018 also included expanding our FCPMs to new mobility use cases, such as heavy duty commercial vehicles, and furthering development on the next generation of our fuel cell stack platform and electrolyzer products.
When comparing the third quarter of 2018 to the third quarter of 2017, our net loss increased by $1.4 million (70%) to $3.4 million ($0.22 per common share) compared to a net loss of $2.0 million ($0.13 per common share). This increase was driven by lower revenue of $4.4 million and a decrease in gross profit of $1.4 million. Adjusted EBITDA decreased by $0.6 million to a loss of $2.5 million from a loss of $1.9 million reflecting the decrease in gross profit of $1.4 million offset by an improvement in cash operating costs of $0.9 million. The improvement in cash operating costs is attributable to reduced net R&D expenses; notably, an increase in government funded FCPM manufacturing expansion and process improvement initiatives in the current quarter. The focus of our R&D activities in Q3-2018 also included expanding our FCPMs to new mobility use cases, such as heavy duty commercial vehicles, and furthering development on the next generation of our fuel cell stack platform and electrolyzer products.
When comparing the second quarter of 2018 to the second quarter of 2017, our net loss decreased by $0.7 million (12%) to $4.8 million ($0.31 per common share) compared to a net loss of $5.4 million ($0.43 per common share). This improvement was driven by the increase in gross profit of $1.7 million reflecting a gross margin improvement to 28% from 6%, offset by an increase in losses from our joint venture with Kolon. Adjusted EBITDA improved by $1.0 million to a loss of $2.4 million from a loss of $3.4 million. The improvement reflects additional gross profit of $1.7 million offset by an increase of $0.7 million in cash operating costs year-over-year. The increase in cash operating costs reflects $0.3 million and $0.4 million respectively of additional expenditures for SG&A and net R&D. The increase in SG&A is attributable to increased business development and marketing activities. The focus of our R&D activities in the quarter included commissioning the 2.5MW Power-to-Gas facility with Enbridge, government funded FCPM manufacturing expansion and process improvement initiatives, expanding our FCPMs to new mobility use cases, such as heavy duty commercial vehicles, and furthering development on the next generation of our fuel cell stack platform and electrolyzer products.
When comparing the first quarter of 2018 to the first quarter of 2017, our net loss decreased 15% to $2.0 million ($0.13 per common share) from $2.3 million ($0.18 per common share). An increase in gross profit of $0.6 million was principally due to improved direct margins due to product mix. Finance loss improved from a loss of $0.9 million to income of $0.1 million primarily as a result of adjustments to the fair value of outstanding warrants related to the net decrease in the Company’s share price in the current quarter as compared to a net increase in share price for the comparative quarter of March 31, 2017. SG&A expenses decreased $0.2 million in the first quarter of 2018. Excluding mark to market expenses relating to our DSUs as a result of the increase in our share price for the three months ended March 31, 2018 as compared to the three months ended March 31, 2017, SG&A expenses increased $0.4 million. The increase is the result of increased advertising and marketing costs, facility costs, and information technology costs within the Company. These improvements were offset by an increase in net R&D expenses of $1.1 million primarily due to increased spending on the 2.5MW energy storage project, and mobility applications such as the demonstration of the technical viability of our Celerity PlusTM product in heavy duty commercial vehicle applications, as well as furthering development on the next generation of our fuel cell stack platform.
2018 Management’s Discussion and Analysis | Page 16 |
In the fourth quarter of 2017, our net loss improved by $1.5 million to a net loss of $1.0 million ($0.06 per common share) from a net loss of $2.5 million ($0.20 per common share) in the fourth quarter of 2016. An increase in gross profit of $3.7 million was principally due to increased revenues and improved direct margins due to product mix through increased production and delivery of standardized fuel cells for the mobility market, as well as economies of scale, particularly within the Power Systems business segment. This was partially offset by an increase in net R&D spending during the quarter of $1.0 million and an increase of $1.4 million relating to SG&A expenses as compared to the fourth quarter of 2016. Excluding the impact of an increase in DSU expense of $0.6 million for the three months ended December 31, 2017 as a result of the increase in the share price in the current quarter, SG&A expenses increased $0.8 million. The improvement in gross profit was also partially offset by an increase in fair value adjustments (loss) relating to outstanding warrants ($0.1 million) in the three months ended December 31, 2017 as a result of the increase in the share price in the current quarter, whereas the three months ended December 31, 2016 had a gain of $0.2 million. This was offset by the movement in net foreign currency gains (losses), from a loss of $0.2 million for the three months ended December 31, 2016 to a gain of $0.1 million in the current year.
In the third quarter of 2017, our net loss was consistent at $2.0 million ($0.13 per common share from $0.15 per common share), compared to the third quarter of 2016. An increase in gross profit of $1.8 million was principally due to increased revenues and improved direct margins due to product mix. This was partially offset by an increase in net R&D spending during the quarter of $1.9 million, and fair value adjustments (loss) relating to outstanding warrants ($0.6 million) in the three months ended September 30, 2017, whereas the three months ended September 30, 2016 had a loss of $0.1 million.
In the second quarter of 2017, our net loss increased to $5.7 million from $3.1 million ($0.45 per common share) compared to the second quarter of 2016 ($0.25 per common share). A decrease in gross profit of $1.5 million was principally due to decreased revenues and reduced direct margins due to product mix. Also contributing to the decrease in gross margin was lower absorption of indirect overhead costs as a result of the decrease in revenue. There was also an increase in other finance losses of $1.1 million in the three months ended June 30, 2017 compared to the same period of 2016 due to the fair value adjustments relating to outstanding warrants (a loss of $0.8 million) in the three months ended June 30, 2017, whereas the three months ended June 30, 2016 included a gain of $0.3 million.
In the first quarter of 2017, our net loss remained consistent at $2.3 million ($0.18 per common share) compared to the first quarter of 2016. An increase in gross profit of $1.5 million was principally due to increased revenue and improved direct margins due to product mix. This was offset by: i) an increase in SG&A expenses related to the increased mark-to-market expenses due to the increase in our share price; ii) the absence of a reversal in SG&A expenses of $0.5 million related to the indemnification liability in the first quarter of 2016; iii) an increase in other finance losses of $0.7 million in the three months ended March 31, 2017 compared to the same period of 2016 due to the fair value adjustments relating to outstanding warrants in the three months ended March 31, 2017 compared to the three months ended March 31, 2016; and iv) a fair market value adjustment gain of $0.1 million on unsettled foreign exchange contracts included in the 2016 quarter.
2018 Management’s Discussion and Analysis | Page 17 |
| 6 | Liquidity and Capital Resources |
Cash Used in Operating Activities
| | | | | | | | | | | | | |
| | | Years ended | | | | | | | |
| | | December 31, | | | | | | | |
| (Thousands of US dollars) | | 2018 | | | 2017 | | | $ Change | | | % Change | |
| Net loss | | $ | (13,339 | ) | | $ | (10,766 | ) | | $ | (2,573 | ) | | | (24 | )% |
| (Increase) decrease in restricted cash | | | (304 | ) | | | 134 | | | | (438 | ) | | | n/a | |
| Net change in non-cash operating assets | | | 1,750 | | | | (223 | ) | | | 1,973 | | | | n/a | |
| Other items not affecting cash | | | 3,512 | | | | 6,073 | | | | (2,561 | ) | | | (42 | )% |
| Cash used in operating activities | | $ | (8,381 | ) | | $ | (4,782 | ) | | $ | (3,599 | ) | | | (75 | )% |
Cash used in operating activities increased by $3.6 million in 2018 compared to 2017 due primarily to lower gross profit of $3.0 million and an increase in cash operating costs of $0.7 million.
Cash Provided by Investing Activities
| | | | | | | | | | | | | |
| | | Years ended | | | | | | | |
| | | December 31, | | | | | | | |
| (Thousands of US dollars) | | 2018 | | | 2017 | | | $ Change | | | % Change | |
| Investment in joint venture | | $ | – | | | $ | (93 | ) | | $ | 93 | | | | n/a | |
| Purchases of property, plant and equipment | | | (1,001 | ) | | | (3,920 | ) | | | 2,919 | | | | 74 | % |
| Receipt of government funding | | | 974 | | | | 1,792 | | | | (818 | ) | | | (46 | )% |
| Proceeds from disposals of property, plant and equipment | | | 700 | | | | 1,035 | | | | (335 | ) | | | (32 | )% |
| Purchase of intangible assets | | | (125 | ) | | | (25 | ) | | | (100 | ) | | | 406 | % |
| Cash provided by (used in) investing activities | | $ | 548 | | | $ | (1,211 | ) | | $ | 1,759 | | | | n/a | |
Cash provided by investing activities improved by $1.8 million in 2018 over 2017 due primarily to reduced capital expenditures net of government funding.
Cash Used in Financing Activities
| | | | | | | | | | | | | |
| | | Years ended | | | | | | | |
| | | December 31, | | | | | | | |
| (Thousands of US dollars) | | 2018 | | | 2017 | | | $ Change | | | % Change | |
| Proceeds from common shares issued and stock options exercised, net of issuance costs | | $ | 40 | | | $ | 19,745 | | | $ | (19,705 | ) | | | n/a | |
| Principal repayment of long-term debt | | | (3,120 | ) | | | (1,639 | ) | | | (1,481 | ) | | | (90 | )% |
| Exercise of warrants | | | – | | | | 1,374 | | | | (1,374 | ) | | | n/a | |
| Interest payment | | | (1,498 | ) | | | (1,274 | ) | | | (224 | ) | | | (18 | )% |
| Repayment of operating borrowings | | | (1,193 | ) | | | (873 | ) | | | (320 | ) | | | (37 | )% |
| Repayment of repayable government contributions | | | – | | | | (171 | ) | | | 171 | | | | n/a | |
| Cash provided by (used in) financing activities | | $ | (5,771 | ) | | $ | 17,162 | | | $ | (22,933 | ) | | | n/a | |
Cash used in financing activities for 2018 amounted to $5.8 million and related entirely to debt service and repayment of operating borrowings.
2018 Management’s Discussion and Analysis | Page 18 |
Credit and Loan Facilities
At December 31, 2018, the Company’s subsidiary in Belgium (the “Borrower”) had a joint credit and operating line facility of €7,000, which renews annually in April upon review. Under this facility, the Borrower may borrow up to a maximum of 75% of the value of awarded sales contracts, approved by the Belgian financial institution, to a maximum of €500; and may also borrow up to €1,500 for general business purposes, provided sufficient limit exists under the overall facility limit of €7,000. Of the €7,000 facility, €2,175 or approximately $2,491 was drawn as standby letters of credit and bank guarantees and €Nil was drawn as an operating line. At December 31, 2018, the Company had availability of €6,321 or approximately $7,234 (December 31, 2017 – $4,377) under this facility totaling €4,321, or approximately $4,945 for use as letters of credit and bank guarantees and totaling €2,000 or approximately $2,289 as an operating line. The credit facility bears interest at EURIBOR plus 1.45% per annum and is secured by a €1,000 secured first charge covering all assets of the Borrower. The credit facility contains a negative pledge precluding the Borrower from providing security over its assets. Additionally, the Borrower is required to maintain a solvency covenant, defined as equity plus current account (intercompany account with the Corporate company), divided by total liabilities of not less than 25% and ensure that its intercompany accounts with Hydrogenics do not fall below a defined level. We were in compliance with these covenants at December 31, 2018.
At December 31, 2018, the Company also had a Canadian credit facility of $2,199 with no expiration date for use only as letters of credit and bank guarantees. At December 31, 2018, $399 was drawn as standby letters of credit and bank guarantees. At December 31, 2018, the Company had $1,800 (December 31, 2017 – $2,391) available under this facility for use only as letters of credit and bank guarantees.
These letters of credit and bank guarantees relate primarily to obligations in connection with the terms and conditions of the Company’s sales contracts. The standby letters of credit and letters of guarantee may be drawn on by the customer if the Company fails to perform its obligations under the sales contracts.
On September 28, 2011, we entered into a loan agreement with the Province of Ontario’s Ministry of Economic Development, Strategic Jobs and Investment Fund for funding up to C$6.0 million. Eligible costs had to be incurred between October 1, 2010 and September 30, 2015. After this five-year period, the loan bears interest at a rate of 3.67% and requires annual repayment at a rate of 20% per year of the outstanding balance for the five years subsequent to the sixth anniversary of the first disbursement, which was November 30, 2011. There is no availability remaining under this facility at December 31, 2018.
The loan is collateralized by a general security agreement covering assets of Hydrogenics Corporation. Additionally, the Company is required to maintain a minimum balance of cash in Canadian dollars in a Canadian financial institution at all times. We were in compliance with this covenant at December 31, 2018.
In the fourth quarter of 2016, we entered into a loan agreement with Export Development Corporation for a five-year facility of $9.0 million. The loan is structured as a five-year term loan with quarterly interest payments calculated at an annual interest rate of U.S. prime plus 10%, declining to U.S. prime plus 5% to 7% if certain annual earnings before interest, taxes, depreciation and amortization thresholds are met. The loan is secured by a second charge over the assets located within Canada. Commencing March 31, 2017, the loan principal is subject to four quarterly repayments of $0.25 million followed by 16 quarterly repayments of $0.5 million. There is an option to prepay a portion of or the entire loan at any time.
2018 Management’s Discussion and Analysis | Page 19 |
Capital Resources
We consider our capital employed to consist of shareholders’ equity and total debt, net of cash and cash equivalents as follows:
| | | | | | | |
| At December 31, | | 2018 | | | 2017 | |
| Total equity | | $ | 10,961 | | | $ | 24,173 | |
| Operating borrowings | | | – | | | | 1,200 | |
| Long-term debt and repayable government contributions, including current portion | | | 8,082 | | | | 11,284 | |
| Total | | | 19,043 | | | | 36,657 | |
| Less Cash and cash equivalents and restricted cash | | | 8,737 | | | | 22,414 | |
| Total capital employed | | $ | 10,306 | | | $ | 14,243 | |
The Company’s financial objective when managing capital is to make sure that we have the cash, debt capacity and financial flexibility to fund our ongoing business objectives including operating activities, research and product development, investments and growth in order to provide returns for our shareholders and other stakeholders.
We monitor our capital structure and make adjustments according to market conditions in an effort to meet our objectives given the Company’s operating and financial performance and current outlook of the business and industry in general. The Company’s alternatives to fund future capital needs include cash flows from operating activities, debt or equity financing, adjustments to research and product development priorities, capital spending and/or sale of assets. These alternatives, and our capital structure, are reviewed by management and the board of directors of the Company on a regular basis to ensure the best mix of capital resources to meet the Company’s needs.
Financial Instruments, Long-term Debt, Commitments and Contingent Off-balance Sheet Arrangements
The Company’s financial instruments and the nature of the risks, existing or potential, are as set out in the following table:
| | |
| | Risk |
| | | | Market |
| Financial Instruments | Credit | Liquidity | Currency | Interest Rate |
| Cash and cash equivalents and restricted cash | X | | X | X |
| Short-term investments | X | | X | X |
| Trade and other receivables | X | | X | |
| Contract assets | X | | X | |
| Trade and other payables | | X | X | |
| Contract liabilities | | X | X | |
| Financial liabilities | | X | X | |
| Non-current liabilities | | X | X | |
Credit risk
Credit risk arises from the potential that a counterparty will fail to perform its obligations. Credit risk associated with cash and cash equivalents and restricted cash is minimized by limiting net exposure to any one jurisdiction or financial institution and ensuring financial assets are placed for short periods of time, generally less than 90 days, with governments, well-capitalized financial institutions and other creditworthy counterparties. Ongoing reviews are performed by management to evaluate changes in the status of financial institutions and counterparties.
Credit risk associated with trade and other receivables is minimized by carrying out a detailed review and approval by senior management of credit extensions to customers taking into account customer history, any amounts that are past due and any available relevant information about the customers’ liquidity and potential going concern problems. In addition, progress payments are generally required by customers as contracts are executed, which generally results in between 35% and 100% of a contract’s value being collected before shipments are made. Where credit terms are extended beyond shipment, terms are generally not granted beyond 60 days. We also maintain provisions for expected credit losses, which we currently assess as insignificant.
2018 Management’s Discussion and Analysis | Page 20 |
Currency risk
Currency risk arises because of fluctuations in foreign exchange rates. We conduct a significant portion of our business activities in currencies other than the functional currency of the parent company (US dollars) and the functional currency of our self-sustaining subsidiaries (euro). This primarily includes Canadian dollar transactions at the parent company and US dollar transactions at our self-sustaining subsidiaries.
Our objective in managing foreign currency risk is to minimize our net exposures to foreign currency cash flows by converting cash balances into foreign currencies to the extent practical to match other foreign currency obligations. Our foreign exchange risk management program includes the potential use of foreign exchange currency forward contracts to fix the exchange rates on short-term Canadian dollar, euro and US dollar denominated transactions and commitments.
Interest rate risk
Interest rate risk arises because of the fluctuation in market interest rates. We are subject to interest rate risk on our cash and cash equivalents, restricted cash and variable rate long-term debt.
Liquidity risk
Liquidity risk arises from our general funding needs and in the management of our assets, liabilities and optimal capital structure. We manage liquidity risk to maintain sufficient liquid financial resources to fund our commitments and obligations in the most cost-effective manner possible.
We have sustained losses and negative cash flows from operations since our inception. At December 31, 2018, we had approximately $8.7 million of cash, cash equivalents and restricted cash. The Company monitors its financial position on a monthly basis at minimum, and updates its expected use of cash resources based on the latest available data. Such forecasting takes into consideration the Company’s financing plans and compliance with internal targets. On December 21, 2018, we entered into a subscription agreement with H2C to issue 3,537,931 common shares for gross proceeds of $20.5 million. The transaction closed on January 24, 2019.
There are uncertainties related to the timing and use of our cash resources and working capital requirements. These uncertainties include, among other things, the timing and volume of commercial sales and associated gross margin of our existing products and the development of markets for, and customer acceptance of, new products. We do not expect our operations to generate sufficient cash flow to fund our obligations as they come due for the next several quarters. As such, these obligations will be funded out of existing and forecasted cash resources, such as proceeds from the private placement referred to above.
We may need to take additional measures to increase liquidity and capital resources, including obtaining additional debt or equity financing, pursuing joint-venture partnerships, equipment financings or other receivables financing arrangements. We may experience difficulty in obtaining satisfactory financing terms. Failure to obtain adequate financing on satisfactory terms could have a material adverse effect on Hydrogenics’ results of operations or financial condition.
Contractual Obligations
| | | | | | | | | | | | | | | | |
| | | | | | Less than | | | | | | | | | After | |
| | | Total | | | 1 year | | | 1-3 years | | | 4-5 years | | | 5 years | |
| Long-term debt1, including current portion | | $ | 10,225 | | | $ | 3,753 | | | $ | 6,472 | | | $ | – | | | $ | – | |
| Operating leases | | | 3,934 | | | | 1,088 | | | | 1,608 | | | | 678 | | | | 560 | |
| Purchase obligations | | | 14,145 | | | | 13,982 | | | | 163 | | | | – | | | | – | |
| Capital lease | | | 33 | | | | 7 | | | | 21 | | | | 5 | | | | – | |
| Total contractual obligations2, 3 | | $ | 28,337 | | | $ | 18,830 | | | $ | 8,264 | | | $ | 683 | | | $ | 560 | |
| 1. | Represents the undiscounted amounts payable as disclosed below under “Other Loan Facilities”. |
| 2. | The table excludes the DSU liability of $730 included in our current liabilities which relate to units that are only settled once a director resigns as a director. |
| 3. | The table excludes the warrant liability of $11 included in our financial liabilities. |
2018 Management’s Discussion and Analysis | Page 21 |
Contingent Off-balance Sheet Arrangements
We do not have any material obligations under forward foreign exchange contracts, guarantee contracts, retained or contingent interests in transferred assets, outstanding derivative instruments or non-consolidated variable interests.
In the normal course of operations, we occasionally provide indemnification agreements, other than those listed above, to counterparties that would require us to compensate them for costs incurred as a result of changes in laws and regulations or as a result of litigation claims or statutory sanctions that may be suffered by the counterparty as a consequence of the transaction. The terms of these indemnification agreements will vary. The nature of the indemnification agreements prevents us from making a reasonable estimate of the maximum potential amount we could be required to pay to counterparties. No amount has been recorded in the consolidated financial statements with respect to these indemnification agreements as we are not aware of any claims.
The authorized share capital of the Company consists of an unlimited number of common shares, with no par value, and an unlimited number of preferred shares in series, with no par value. We had 15,447,483 common shares outstanding at December 31, 2018.
| | | | | | | | | | | | | |
| | | 2018 | | | 2017 | |
| | | Number | | | Amount | | | Number | | | Amount | |
| Balance at January 1, | | | 15,436,879 | | | $ | 387,746 | | | | 12,544,960 | | | $ | 365,923 | |
| Adjustment for partial shares on share consolidation | | | – | | | | – | | | | (1 | ) | | | – | |
| Issuance of common shares | | | – | | | | – | | | | 2,682,742 | | | | 19,725 | |
| Warrants exercised | | | – | | | | – | | | | 200,575 | | | | 1,966 | |
| Issuance of common shares on vesting of performance share units | | | 4,204 | | | | 96 | | | | 4,203 | | | | 96 | |
| Issuance of common shares on exercise of stock options | | | 6,400 | | | | 69 | | | | 4,400 | | | | 36 | |
| At December 31, | | | 15,447,483 | | | $ | 387,911 | | | | 15,436,879 | | | $ | 387,746 | |
At December 31, 2018, there were 853,089 stock options outstanding to purchase our common shares. If these securities are exercised, our shareholders could incur dilution.
| 8 | Critical Accounting Estimates |
The Company’s management make judgments in it process of applying the Company’s accounting policies in the preparation of its consolidated financial statements. The preparation of financial information requires that we make assumptions and estimates of effects of uncertain future events on the carrying amounts of the Company’s assets and liabilities at the end of the reporting period and the reported amounts of revenue and expenses during the reporting period. Actual results may differ from those estimates as the estimation process is inherently uncertain. Estimates are reviewed on an ongoing basis based on historical experience and other factors that are considered to be relevant under the circumstances. Revisions to estimates and the resulting effects on the carrying amounts of the Company’s assets and liabilities are accounted for prospectively.
The critical judgments, estimates and assumptions applied in the preparation of Company’s financial information are reflected in Note 4 of the Company’s 2018 annual audited consolidated financial statements.
2018 Management’s Discussion and Analysis | Page 22 |
| 9 | Changes in Accounting Policies and Recent Accounting Pronouncements |
As described in Note 5 to our consolidated financial statements, effective January 1, 2018 we implemented IFRS 15 – Revenue from Contracts with Customers and IFRS 9 – Financial Instruments. IFRS 15 was applied retrospectively whereas IFRS 9 was applied using the modified retrospective approach. As required, we have restated the financial information for all comparative periods presented within this MD&A to give effect to these policy changes, including the operating results in Section 3, financial condition in Section 4, the quarterly results in Section 5 and liquidity and capital resources in Section 6.
Impact of adoption of IFRS 15 and IFRS 9
The adoption of IFRS 15 did not impact our previously reported net cash flows. However, there has been a material impact on our consolidated balance sheets and consolidated statements of operations and comprehensive loss. The impact on our opening deficit and a description of the adjustments made to amounts previously recognized in our consolidated financial statements is as follows (in thousands of US dollars):
| | | | | | | | | | |
| Restatement effect of the adoption of IFRS 15: | | Note | | | December 31, 2017 | | | December 31, 2016 | |
| Deficit | | | | | | $ | (382,313 | ) | | $ | (371,173 | ) |
| Recognition of contract asset for installation, start-up and commissioning services, net of provision for future costs to fulfill these obligations | | | (a) | | | | 270 | | | | 12 | |
| Recognition of a prepaid asset for agent commissions related to long term contracts | | | (b) | | | | 396 | | | | 280 | |
| Restated deficit | | | | | | $ | (381,647 | ) | | $ | (370,881 | ) |
| a) | Installation, start-up and commissioning services |
Under IAS 18, our previous revenue recognition policy, we applied the revenue recognition criteria to each separate identifiable component of a single transaction. Specifically, contracts containing installation and start-up and commissioning services were accounted for as a separate element from the initial product sale, and the revenue on those services were deferred until the associated work was performed.
Under IFRS 15, the performance of installation and start-up and commissioning services are not considered distinct from and are considered a single performance obligation where these costs are insignificant in the context of the total sales price of the equipment and where the customer expects they are buying a final installed working product. As a result, revenue attributable to the installation, start-up and commissioning is now recorded at the time control passes of the related equipment sale (typically upon shipment). At that time, we also accrue the estimated costs to fulfill these obligations.
The implementation of IFRS 15 does not affect the ultimate amount of revenues and expenses recognized related to installation, start-up and commissioning but rather the timing. These revenues and expenses are recorded sooner. Accordingly, we recognized additional gross profit of $12 accumulated at December 31, 2016 and a further $258 in 2017, thereby reducing the previously reported deficit by $12 and $270 respectively at December 31, 2016 and December 31, 2017.
| b) | Sales agent commissions |
We incur sales agent commissions for obtaining contracts. Under IAS 18, these costs were expensed when they were earned or incurred.
Under IFRS 15, these incremental costs are deferred for contracts expected to be delivered after more than one year and expensed as the contract is delivered. Accordingly, we deferred $280 of commissions in prepaid expenses as at December 31, 2016 and a further $116 in 2017, thereby reducing the previously reported deficit and accumulated other comprehensive loss by $280 and $396 respectively at December 31, 2016 and December 31, 2017.
2018 Management’s Discussion and Analysis | Page 23 |
| c) | Contract assets and liabilities |
Lastly, IFRS 15 distinguishes between contract assets and accrued receivables based on whether receipt of the consideration is conditional on something other than the passage of time. At December 31, 2017 there was $5,556 (January 1, 2017 – $4,658) of receivables outstanding where our right to consideration was not unconditional (primarily relating to revenues accrued on long term contracts) which have been reclassified as a contract asset under IFRS 15.
Under IFRS 15, amounts received from customers before we have transferred the good or service are to be presented as contract liabilities. As a result, the amounts previously presented as deferred revenues have been reclassified as contract liabilities.
There was no impact to the Company’s financial results as a consequence of the adoption of IFRS 9.
Our strategy is to profitably grow and lead hydrogen energy solutions for diverse applications across global markets. We continue to leverage the milestones and reference sites established in prior years to gain additional traction in the following target markets and applications:
Mobility Power – Our Power Systems business segment is based on PEM fuel cell technology, which transforms chemical energy liberated during the electrochemical reaction of hydrogen and oxygen into electrical energy. Our HyPM® branded fuel cell products are based on our extensive track record of on-bench testing and real-time deployments across a wide range of stationary and mobility power profiles. We configure our HyPM® products into multiple electrical power outputs ranging from 3kW to 1MW with ease of integration, high reliability and operating efficiency, delivered from a highly compact configuration. We feel our technology provides us with a competitive advantage based upon a design that supports a compact, integrated balance of plant and ease of modularity. Our design provides for robust cold weather reliability and a patented rapid start-up and shut down capability. Our low pressure and dry/dry design further differentiates our technology and eliminates the need for additional humidification and pump components.
Our target markets include mobility power applications, such as trains, buses, trucks, utility vehicles, air-craft and most recently, a product development contract was signed for a marine application as well as stationary power applications (including primary and back-up power). Our target future addressable markets (stationary power and mobility markets) are estimated to be in excess of $2 billion specifically related to hydrogen power technology.
Our strategy in China is to work with integrators, companies that take our fuel cell technology and incorporate it into buses and other vehicles provided by original equipment manufacturers. We created a certified integrator program to execute this strategy and have established relationships with multiple parties in China to date. Despite a slowdown in production orders in 2018, we still have the largest fleet of buses on the road in China at over 300. As well, to date, more than ten bus models incorporating our fuel cells are listed in the official Chinese government catalogue (meaning these models are approved for commercial sale). Since inception of strategy, approximately 400 units have been shipped to date and we have outstanding orders for 1,000 more units at present.
During 2018, we continued to support the roll out of commercial units for the Company’s ten-year commuter train propulsion system contract with Alstom Transport, which at €50 million, is the largest commercial order in our history. This order highlights the commercial maturity and strong competitive positioning of our fuel cell technology. Alstom Transport achieved certification of the train sets in July 2018 and placed the trains into active passenger service in September 2018. Alstom is actively working opportunities across Europe to aggregate train orders which will drive follow-on fuel cell orders envisioned under our contract including $46 million in backlog. Our first production order under this agreement is expected in 2019.
Energy Storage – We continue to pursue several large-scale applications which would consume 10 to 100MW of power, which is 100 to 300 times larger than a typical industrial unit to date. Several third-party studies and internal analysis by lead customers such as Uniper and Enbridge suggest substantial long-term opportunity for Power-to-Gas, an application for energy conversion and storage. Our joint venture with Enbridge to build and operate a first of its kind 2.5MW energy storage facility, which was commissioned into service in May 2018, signals the rising importance of energy storage to one of North America’s largest energy companies.
2018 Management’s Discussion and Analysis | Page 24 |
We continue our focus to improve and differentiate our PEM electrolyzer technology. Our HyLYZER 600 3MW PEM single stack electrolyzer is the smallest, most power dense unit in the market today and is ideally suited for large scale energy storage applications. Product development is underway to augment to a 5MW stack permitting cost effective modular scaling in 5MW capacity blocks including a focus on this technology within the TBDA referred to in Section 2 Growth Strategy.
We are experiencing a willingness on the part of utilities and regulatory agencies to increase spending in the growing problem areas related to energy storage and grid stabilization and our sales pipeline remains robust in this area. We are also seeing a gradual maturation around the regulatory framework needed to integrate energy storage into an overall energy framework to permit its cost-effective rollout. For example, on June 15, 2018, the European Union issued an update to its’ Renewable Energy Directive, Part ii which explicitly includes hydrogen solutions towards attainment of EU transportation target attainment. In addition, we continue to witness governments in other jurisdictions showing a willingness to increase spending on alternative energy projects for the same purpose. We believe we continue to be well positioned to benefit from government initiatives in Canada, the European Union (particularly in Germany) and the United States (particularly in California), which we expect will positively impact our business. Since 2014, we installed over 16MW of capacity across 12 reference sites in Europe, Asia and North America. An increase in interest in our Power-to-Gas application and orders for energy storage and fueling stations in Europe, California, the UK and other geographies has signaled what we believe could be a significant increase in opportunities in the markets we serve.
Industrial Hydrogen – Historically, the demand for onsite generation of hydrogen gas has been driven by the manufacturing sector requiring hydrogen for industrial use and hydrogen gas resellers. A typical unit for these applications would generate 20 to 60 normal cubic meters of hydrogen and consume 100 to 300 kW of electrical energy. Our OnSite Generation products are sold to leading merchant gas companies, such as Air Liquide and Linde Gas, and end-users requiring high purity hydrogen produced on-site for industrial applications. We recently completed development of our sixth generation (Type 6) design, our lowest cost and most efficient alkaline product to date, which is critical to maintaining commercial success in this market.
Hydrogen Fueling – We also sell and service products for progressive oil and gas companies, requiring hydrogen fueling stations for transportation applications. Recently, the rollout of fuel cell motor vehicles and the increase in fuel cell buses and other mass transit applications, such as rail, has resulted in an increase in orders and interest for fueling stations in Europe, North America, California and elsewhere. The increasing consumption of hydrogen to support mobility applications will demand more hydrogen supply infrastructure. We have been involved with the construction of over 55 fueling stations globally and see increased demand for hydrogen fueling; particularly, when it can be linked to electrolyzed hydrogen coming from electricity that is generated from renewable sources such as wind and solar energy thus reducing the carbon footprint of the production of hydrogen. Serving both the mobility and generation markets, we believe there could be a major increase in size of both addressable markets.
Outlook Summary
The timing and full realization of the opportunities above, under the current market environment, cannot be assured or specifically established. It is, however, important to understand the magnitude of these opportunities and the transformative impact that any one of them can have on the business going forward as discussed above. Over the past several years, we have taken significant steps to reduce operating and product costs, streamline our operations and strengthen our consolidated financial position. We have tenaciously pursued research and product development to expand use cases across both our mobility and generation businesses. We have established significant commercial opportunities with large global companies such as Alstom, Enbridge and Air Liquide that we believe will support our trajectory to larger scale. We also continue to monitor evolving opportunities such as Hydrail.
While we may see volatility in our costs and revenues over the short-term, we expect our trend of improved cost efficiency to continue over the long term. At December 31, 2018, our order backlog was $132.7 million (December 31, 2018 – $144.6 million) spread across numerous geographical regions, of which approximately $49.0 million is expected to be recorded as revenue in the following twelve months.
As a global company, we are subject to the risks arising from adverse changes in global economic and political conditions. Political conditions such as government commitments and policies towards environmental protection and renewable energy may change over time. Economic conditions in leading and emerging economies have been, and remain, unpredictable. In particular, currency fluctuations could have the impact of significantly reducing revenue and gross margin as well as the competitive positioning of our product portfolio. These macroeconomic and geopolitical changes could result in our current or potential customers reducing purchases or delaying shipment which could cause revenue recognition on these products to shift into 2020 or beyond.
2018 Management’s Discussion and Analysis | Page 25 |
| 11 | Related Party Transactions |
In the normal course of operations, the Company subcontracts certain manufacturing functions to a company owned by a family member of an executive officer and Director of the Company. During 2018, Hydrogenics made purchases of $467 (2017 – $646) from this related company. At December 31, 2018, the Company had an accounts payable balance due to this related party of $21 (2017 – $8).
The Company holds an equity investment in the joint venture 2562961 Ontario Ltd., related to the energy storage facility project with Enbridge Gas Distribution. During the year ended December 31, 2018 the Company had sales to the joint venture of $1,372 (2017 – $2,030) and at the end of December 31, 2018 the Company had a receivable of $196 (2017 – $nil) owing from the joint venture.
The Company holds an equity investment in the joint venture Kolon Hydrogenics. The Company had no transactions with the joint venture in 2018 or 2017 and we are in discussions to dissolve the joint venture in 2019.
All related party transactions involve the parent company. There are no related party transactions to disclose for the Company’s subsidiaries.
We have established disclosure controls and procedures that are designed to ensure that the information required to be disclosed by the Company in the reports that it files or submits under Canadian and US securities legislation is recorded, processed, summarized, and reported within the time periods specified in such rules and forms and that such information is accumulated and communicated to management, including our principal executive officer and principal financial officer (who are our Chief Executive Officer (“CEO”) and Chief Financial Officer (“CFO”), respectively) as appropriate to allow timely decisions regarding required disclosure. In designing and evaluating our disclosure controls and procedures, management recognized that disclosure controls and procedures can provide only reasonable, not absolute, assurance that the objectives of the disclosure controls and procedures are met.
We have assessed and effected the necessary change to our current disclosure controls and procedures to reflect the impact of adopting IFRS 15 – Revenues from Contracts with Customers and IFRS 9 – Financial Instruments. Specifically, we have updated and implemented a new revenue recognition checklist that is completed for each new contract to assess the appropriate treatment under IFRS 15. There were no substantive changes to our current disclosure controls and procedures to give effect to IFRS 9 requirements.
Our management, including our CEO and CFO, evaluated the effectiveness of our disclosure controls and procedures. Based on this evaluation and as described below under "Internal Control over Financial Reporting", our CEO and CFO concluded that our disclosure controls and procedures were effective as of December 31, 2018.
| 13 | Internal Control over Financial Reporting |
Our management is responsible for establishing and maintaining adequate internal control over financial reporting. Internal control over financial reporting is a process designed by, or under the supervision of, the CEO and the CFO and effected by the Board of Directors, management and other personnel to provide reasonable assurance regarding the reliability of financial reporting and the preparation of consolidated financial statements for external purposes in accordance with IFRS.
Our management, including our CEO and CFO, believes that any disclosure controls and procedures or internal control over financial reporting, no matter how well conceived and operated, can provide only reasonable, not absolute, assurance that the objectives of the control system are met. Further, the design of a control system must reflect the fact that there are resource constraints, and the benefits of controls must be considered relative to their costs. Because of the inherent limitations in all control systems, they cannot provide absolute assurance that all control issues and instances of fraud, if any, have been prevented or detected. These inherent limitations include the realities that judgments in decision-making can be faulty, and that breakdowns can occur because of a simple error or mistake. Additionally, controls can be circumvented by the individual acts of some persons, by collusion of two or more people, or by unauthorized override of the control. The design of any system of controls is based in part on certain assumptions about the likelihood of future events, and there can be no assurance that any design will succeed in achieving its stated goals under all potential future conditions. Accordingly, because of the inherent limitations in a cost-effective control system, misstatements due to error or fraud might occur and not be detected.
2018 Management’s Discussion and Analysis | Page 26 |
Management assessed the effectiveness of the Company’s internal control over financial reporting at December 31, 2018, based on the criteria set forth in Internal Control – Integrated Framework issued by the Committee of Sponsoring Organizations of the Treadway Commission as published in 2013. Based on this evaluation, management believes, at December 31, 2018, the Company’s internal control over financial reporting is effective. Also, management determined there were no material weaknesses in the Company’s internal control over financial reporting at December 31, 2018.
The effectiveness of the Company's internal control over financial reporting as of December 31, 2018, has been audited by PricewaterhouseCoopers LLP, an independent registered public accounting firm, as stated in their report, which is included in the Company’s annual audited financial statements
| 14 | Reconciliation of Non-IFRS Measures |
Non-IFRS financial measures, including earnings before interest, taxes, depreciation and amortization (“EBITDA”), “Adjusted EBITDA” and “cash operating costs” are used by management to provide additional insight into our performance and financial condition. We believe these non-IFRS measures are an important part of the financial reporting process and are useful in communicating information that complements and supplements the consolidated financial statements.
Adjusted Earnings Before Interest, Taxes, Depreciation and Amortization
We believe Adjusted EBITDA assists investors in comparing a company’s performance on a consistent basis excluding depreciation and amortization, stock-based compensation, including both share settled PSUs and stock options, equity settled restricted share units (“RSUs”) and cash settled DSUs, which are non-cash in nature and can vary significantly due to stock price fluctuations. We believe that removing these expenses is a better measurement of operational performance. Investors should be cautioned that Adjusted EBITDA, as reported by us, may not be comparable in all instances to Adjusted EBITDA, as reported by other companies.
The following table provides a reconciliation of Adjusted EBITDA with net loss:
| | | | | | | |
| | | Years ended December 31, | |
| | | 2018 | | | 2017 | |
| Net loss | | $ | (13,339 | ) | | $ | (10,766 | ) |
| Loss from joint ventures | | | 1,637 | | | | 334 | |
| Finance loss, net | | | 1,028 | | | | 2,108 | |
| Income tax expense | | | 300 | | | | – | |
| Amortization and depreciation | | | 706 | | | | 672 | |
| DSUs expense (recovery) | | | (676 | ) | | | 950 | |
| Stock-based compensation expense (including PSUs and RSUs) | | | 957 | | | | 742 | |
| Adjusted EBITDA | | $ | (9,387 | ) | | $ | (5,960 | ) |
Cash Operating Costs
We report cash operating costs because management feels they are a key measurement of the normal operating costs required to operate the ongoing business units of the Company. Cash operating costs are regularly reported to the chief operating decision maker and correspond to the definition used in our historical quarterly discussions. Investors should be cautioned that cash operating costs as reported by us may not be comparable in all instances to cash operating costs as reported by other companies.
2018 Management’s Discussion and Analysis | Page 27 |
The following table provides a reconciliation of cash operating costs with total operating expenses consisting of SG&A and R&D expenses:
| | | | | | | |
| | | Year ended December 31, | |
| | | 2018 | | | 2017 | |
| Selling, general and administrative expenses | | $ | 11,613 | | | $ | 13,626 | |
| Research and product development expenses | | | 7,486 | | | | 6,376 | |
| Total operating costs | | $ | 19,099 | | | $ | 20,002 | |
| Less: Amortization and depreciation | | | (520 | ) | | | (454 | ) |
| Less: Gain (loss) on disposal of assets | | | 11 | | | | (131 | ) |
| Less: DSUs (expense) recovery | | | 676 | | | | (950 | ) |
| Less: Stock-based compensation expense (including PSUs and RSUs) | | | (957 | ) | | | (742 | ) |
| Cash operating costs | | $ | 18,309 | | | $ | 17,725 | |
An investment in our common shares involves risk. Investors should carefully consider the risks and uncertainties described below and in our Annual Information Form. The risks and uncertainties described below and in our Annual Information Form are not the only ones we face. Additional risks and uncertainties, including those that we do not know about now or that we currently deem immaterial, may also adversely affect our business. For a more complete discussion of the risks and uncertainties which apply to our business and our operating results (which are summarized below), please see our Annual Information Form and other filings with Canadian (www.sedar.com) and U.S. securities regulatory authorities (www.sec.gov/edgar.shtml).
Our business entails risks and uncertainties that affect our outlook and eventual results of our business and commercialization plans. The primary risks relate to meeting our product development and commercialization milestones, which require that our products exhibit the functionality, cost and performance required to be commercially viable against competing technologies and that we have sufficient access to capital to fund these activities. Another primary risk is that key markets for certain of our products may never develop, or that market acceptance might take longer to develop than anticipated – in particular for applications such as energy storage which require leadership at a government and regulatory level.
A summary of our identified risks and uncertainties are as follows:
Risk Factors Related to Our Financial Condition
| • | Our inability to generate sufficient cash flows, raise additional capital and actively manage our liquidity may impair our ability to execute our business plan, and result in our reducing or eliminating product development and commercialization efforts, reducing our sales and marketing efforts, and having to forego attractive business opportunities. There are uncertainties related to the timing and use of our cash resources and working capital requirements. These uncertainties include, among other things, the timing and volume of commercial sales and associated gross margins of our existing products and the development of markets for, and customer acceptance of new products. |
| • | We may not be able to implement our business strategy and the price of our common shares may decline. |
| • | The uncertain and unpredictable condition of the global economy could have a negative impact on our business, results of operations and consolidated financial condition, or our ability to accurately forecast our results, and it may cause a number of the risks that we currently face to increase in likelihood, magnitude and duration. |
| • | Our operating results may be subject to currency fluctuation. |
| • | Our mix of revenues in the recent past does not reflect our current business strategy, it may be difficult to assess our business and future prospects. |
| • | Our quarterly operating results are likely to fluctuate significantly and may fail to meet the expectations of securities analysts and investors and may cause the price of our common shares to decline. |
| • | We currently depend on a relatively limited number of customers for a majority of our revenues and a decrease in revenue from these customers could materially adversely affect our business, consolidated financial condition and results of operations. |
| • | Our insurance may not be sufficient. |
| | • | Certain external factors may affect the value of goodwill, which may require us to recognize an impairment charge. |
2018 Management’s Discussion and Analysis | Page 28 |
Risk Factors Related to Our Business and Industry
| • | Significant markets for fuel cell and other hydrogen energy products may never develop or may develop more slowly than we anticipate. This would significantly harm our revenues and may cause us to be unable to recover the losses we have incurred and expect to incur in the development of our products. |
| • | Hydrogen may not be readily available on a cost-effective basis, in which case our fuel cell products may be unable to compete with existing power sources and our revenues and results of operations would be materially adversely affected. |
| • | Changes in government policies and regulations could hurt the market for our products. |
| • | Lack of new government policies and regulations for the energy storage technologies could hurt the development of the Power-to-Gas market for our hydrogen energy storage products. |
| • | The development of uniform codes and standards for hydrogen powered vehicles and related hydrogen refueling infrastructure may not develop in a timely fashion, if at all. |
| • | We could be liable for environmental damages resulting from our research, development or manufacturing operations. |
| • | We currently face and will continue to face significant competition from other developers and manufacturers of fuel cell power products and hydrogen generation systems. If we are unable to compete successfully, we could experience a loss of market share, reduced gross margins for our existing products and a failure to achieve acceptance of our proposed products. |
| • | We face competition for fuel cell power products from developers and manufacturers of traditional technologies and other alternative technologies. |
| • | Our strategy for the sale of fuel cell power products depends on developing partnerships with OEMs, governments, systems integrators, suppliers and other market channel partners who will incorporate our products into theirs. |
| • | We are dependent on third party suppliers for key materials and components for our products. If these suppliers become unable or unwilling to provide us with sufficient materials and components on a timely and cost-effective basis, we may be unable to manufacture our products cost-effectively or at all, and our revenues and gross margins would suffer. |
| • | We may not be able to manage successfully the anticipated expansion of our operations. |
| • | If we do not properly manage foreign sales and operations, our business could suffer. |
| • | We will need to recruit, train and retain key management and other qualified personnel to successfully expand our business. |
| • | We may acquire technologies or companies in the future, and these acquisitions could disrupt our business and dilute our shareholders’ interests. |
| • | We have no experience manufacturing our fuel cell products on a large-scale basis and if we do not develop adequate manufacturing processes and capabilities to do so in a timely manner, we will be unable to achieve our growth and profitability objectives. |
Risk Factors Related to Our Products and Technology
| • | We may never complete the development of commercially viable fuel cell power products and/or commercially viable hydrogen generation systems for new hydrogen energy applications, and if we fail to do so, we will not be able to meet our business and growth objectives. |
| • | We must lower the cost of our fuel cell and hydrogen generation products and demonstrate their reliability or consumers will be unlikely to purchase our products and we will therefore not generate sufficient revenues to achieve and sustain profitability. |
| • | Any failures or delays in field tests of our products could negatively affect our customer relationships and increase our manufacturing costs. |
| • | The components of our products may contain defects or errors that could negatively affect our customer relationships and increase our development, service and warranty costs. |
| • | Rapid technological advances or the adoption of new codes and standards could impair our ability to deliver our products in a timely manner and, as a result, our revenues would suffer. |
| • | We depend on intellectual property and our failure to protect that intellectual property could adversely affect our future growth and success. |
| • | Our products use flammable fuels that are inherently dangerous substances and could subject us to product liabilities. |
| • | We may experience cybersecurity threats to our information technology infrastructure and systems, and unauthorized attempts to gain access to our proprietary or confidential information, as may our customers, suppliers, subcontractors and joint venture partners. |
2018 Management’s Discussion and Analysis | Page 29 |
Risk Factors Related to Ownership of Our Common Shares
| • | If at any time we are classified as a passive foreign investment company under United State tax laws, our US shareholders may be subject to adverse tax consequences. |
| • | If we fail to maintain the requirements for continued listing on Nasdaq, our common shares could be delisted from trading on Nasdaq, which would materially adversely affect the liquidity of our common shares, the price of our common shares, and our ability to raise additional capital. |
| • | US investors may not be able to enforce US civil liability judgments against us or our directors and officers. |
| • | Our share price is volatile and we may continue to experience significant share price and volume fluctuations. |
| • | Our issuance of warrants, options, RSUs and PSUs to investors and employees may have a negative effect on the trading prices of our common stock as well as a dilutive effect. |
| 16 | Forward-Looking Statements |
This MD&A constitutes “forward-looking information,” within the meaning of applicable Canadian securities laws and “forward-looking statements” within the meaning of the United States Private Securities Litigation Reform Act of 1995 (collectively referred to herein as “forward-looking statements”). Forward-looking statements can be identified by the use of words, such as “plans,” “expects,” or “is expected,” “budget,” “scheduled,” “estimates,” “forecasts,” “intends,” “anticipates,” or “believes” or variations of such words and phrases or state that certain actions, events or results “may,” “could,” “would,” “might” or “will” be taken, occur or be achieved. These forward-looking statements relate to, among other things, our future results, levels of activity, performance, goals or achievements or other future events. These forward-looking statements are based on current expectations and various assumptions and analyses made by us in light of our experience and our perceptions of historical trends, current conditions and expected future developments and other factors that we believe are appropriate in the circumstances. These forward-looking statements involve known and unknown risks, uncertainties and other factors that may cause actual results or events to differ materially from those anticipated in our forward-looking statements.
These risks, uncertainties and other factors include, but are not limited to: our inability to execute our business plan, inability to implement our business strategy or to grow our business and its impact on our business, results of operations and consolidated financial condition; inability to address a slow return to economic growth; fluctuations in our quarterly results; failure to maintain our customer base that generates the majority of our revenues; currency fluctuations; failure to maintain sufficient insurance coverage; changes in value of our goodwill; failure of a significant market to develop for our products; failure of hydrogen being readily available on a cost-effective basis; changes in government policies and regulations; lack of new government policies and regulations for the energy storage technologies; failure of uniform codes and standards for hydrogen fueled vehicles and related infrastructure to develop; liability for environmental damages resulting from our research, development or manufacturing operations; failure to compete with other developers and manufacturers of products in our industry; failure to compete with developers and manufacturers of traditional and alternative technologies; failure to develop partnerships with original equipment manufacturers, governments, systems integrators and other third parties; inability to obtain sufficient materials and components for our products from suppliers; failure to manage expansion of our operations; failure to manage foreign sales and operations; failure to recruit, train and retain key management personnel; inability to integrate acquisitions; failure to develop adequate manufacturing processes and capabilities; failure to complete the development of commercially viable products; failure to produce cost-competitive products; failure or delay in field testing of our products; failure to produce products free of defects or errors; inability to adapt to technological advances or new codes and standards; failure to protect our intellectual property; our involvement in intellectual property litigation; exposure to product liability claims; failure to manage cyber security threats to our information technology infrastructure and systems; failure to meet rules regarding passive foreign investment companies; failure to maintain the requirements for continued listing on Nasdaq; actions of our significant and principal shareholders; dilution as a result of significant issuances of our common shares and preferred shares; inability of US investors to enforce US civil liability judgments against us; volatility of our common share price; and dilution as a result of the exercise of options.
2018 Management’s Discussion and Analysis | Page 30 |
These factors may cause the Company’s actual performance and financial results in future periods to differ materially from any estimates or projections of future performance or results expressed or implied by such forward-looking statements. Forward-looking statements do not take into account the effect that transactions or non-recurring or other special items announced or occurring after the statements are made have on the Company’s business. For example, they do not include the effect of business dispositions, acquisitions, other business transactions, asset write-downs or other charges announced or occurring after forward-looking statements are made. The financial impact of such transactions and non-recurring and other special items can be complex and necessarily depends on the facts particular to each of them.
We believe the expectations represented by our forward-looking statements are reasonable, yet there can be no assurance that such expectations will prove to be correct. The purpose of the forward-looking statements is to provide the reader with a description of management’s expectations regarding the Company’s fiscal 2018 financial performance and may not be appropriate for other purposes. Furthermore, unless otherwise stated, the forward-looking statements contained in this report are made as of the date of this report and we do not undertake any obligation to update publicly or to revise any of the included forward-looking statements, whether as a result of new information, future events or otherwise unless required by applicable legislation or regulation. The forward-looking statements contained in this report are expressly qualified by this cautionary statement.
2018 Management’s Discussion and Analysis | Page 31 |
Management’s Report on Internal Control Over Financial Reporting
Management of the Company is responsible for establishing and maintaining adequate internal control over financial reporting. Internal control over financial reporting is a process designed by, or under the supervision of, the President and Chief Executive Officer and the Chief Financial Officer and is effected by the Board of Directors, management and other personnel to provide reasonable assurance regarding the reliability of financial reporting and the preparation of consolidated financial statements for external purposes in accordance with International Financial Reporting Standards as issued by the International Accounting Standards Board (“IFRS”). It includes those policies and procedures that:
| • | provide reasonable assurance regarding prevention or timely detection of unauthorized acquisition, use or disposition of the Company’s assets that could have a material effect on the Company’s consolidated financial statements; |
| | | |
| | • | pertain to the maintenance of records that accurately and fairly reflect, in reasonable detail, the transactions related to and dispositions of the Company’s assets; and |
| | | |
| | • | provide reasonable assurance that transactions are recorded as necessary to permit preparation of consolidated financial statements in accordance with IFRS, and that the Company’s receipts and expenditures are made only in accordance with authorizations of management and the Company’s directors. |
Due to its inherent limitations, internal control over financial reporting may not prevent or detect misstatements. Also, projections of any evaluation of the effectiveness of internal control over financial reporting to future periods are subject to the risk that the controls may become inadequate because of changes in conditions, or that the degree of compliance with the policies or procedures may deteriorate.
Management assessed the effectiveness of the Company’s internal control over financial reporting at December 31, 2018, based on the criteria set forth in Internal Control – Integrated Framework issued by the Committee of Sponsoring Organizations of the Treadway Commission as published in 2013. Based on this assessment and those criteria, management concluded that as at December 31, 2018, the Company’s internal control over financial reporting was effective.
The effectiveness of the Company's internal control over financial reporting as of December 31, 2018 has been audited by PricewaterhouseCoopers LLP, an independent registered public accounting firm, as stated in their report, which is included in the Company’s audited financial statements.
| | | |
| | | |
| Daryl C. F. Wilson | | Marc Beisheim |
| President and Chief Executive Officer | | Chief Financial Officer |
March 15, 2019
Mississauga, Ontario
2018 Consolidated Financial Statements | Page 32 |

Report of Independent Registered Public Accounting Firm
To the Directors and Shareholders of Hydrogenics Corporation
Opinions on the Financial Statements and Internal Control over Financial Reporting
We have audited the accompanying consolidated balance sheets of Hydrogenics Corporation and its subsidiaries (together, the Company) as of December 31, 2018 and 2017, and the related consolidated statements of operations and comprehensive loss, changes in equity and cash flows for the years then ended, including the related notes (collectively referred to as the consolidated financial statements). We also have audited the Company’s internal control over financial reporting as of December 31, 2018, based on criteria established inInternal Control - Integrated Framework (2013) issued by the Committee of Sponsoring Organizations of the Treadway Commission (COSO).
In our opinion, the consolidated financial statements referred to above present fairly, in all material respects, the financial position of the Company as of December 31, 2018 and 2017, and their financial performance and their cash flows for the years then ended in conformity with International Financial Reporting Standards as issued by the International Accounting Standards Board (IFRS). Also in our opinion, the Company maintained, in all material respects, effective internal control over financial reporting as of December 31, 2018, based on criteria established inInternal Control – Integrated Framework (2013) issued by the COSO.
Change in accounting principles
As discussed in Note 5 to the consolidated financial statements, the Company changed the manner in which it accounts for revenue in 2018.
Basis for Opinions
The Company’s management is responsible for these consolidated financial statements, for maintaining effective internal control over financial reporting, and for its assessment of the effectiveness of internal control over financial reporting, included in the accompanying Management’s Report on Internal Control over Financial Reporting. Our responsibility is to express opinions on the Company’s consolidated financial statements and on the Company’s internal control over financial reporting based on our audits. We are a public accounting firm registered with the Public Company Accounting Oversight Board (United States) (PCAOB) and are required to be independent with respect to the Company in accordance with the U.S. federal securities laws and the applicable rules and regulations of the Securities and Exchange Commission and the PCAOB.
We conducted our audits in accordance with the standards of the PCAOB. Those standards require that we plan and perform the audits to obtain reasonable assurance about whether the consolidated financial statements are free of material misstatement, whether due to error or fraud, and whether effective internal control over financial reporting was maintained in all material respects.
Our audits of the consolidated financial statements included performing procedures to assess the risks of material misstatement of the consolidated financial statements, whether due to error or fraud, and performing procedures that respond to those risks. Such procedures included examining, on a test basis, evidence regarding the amounts and disclosures in the consolidated financial statements. Our audits also included evaluating the accounting principles used and significant estimates made by management, as well as evaluating the overall presentation of the consolidated financial statements. Our audit of internal control over financial reporting included obtaining an understanding of internal control over financial reporting, assessing the risk that a material weakness exists, and testing and evaluating the design and operating effectiveness of internal control based on the assessed risk. Our audits also included performing such other procedures as we considered necessary in the circumstances. We believe that our audits provide a reasonable basis for our opinions.
2018 Consolidated Financial Statements | Page 33 |
Definition and limitations of internal control over financial reporting
A company’s internal control over financial reporting is a process designed to provide reasonable assurance regarding the reliability of financial reporting and the preparation of financial statements for external purposes in accordance with generally accepted accounting principles. A company’s internal control over financial reporting includes those policies and procedures that (i) pertain to the maintenance of records that, in reasonable detail, accurately and fairly reflect the transactions and dispositions of the assets of the company; (ii) provide reasonable assurance that transactions are recorded as necessary to permit preparation of financial statements in accordance with generally accepted accounting principles, and that receipts and expenditures of the company are being made only in accordance with authorizations of management and directors of the company; and (iii) provide reasonable assurance regarding prevention or timely detection of unauthorized acquisition, use, or disposition of the company’s assets that could have a material effect on the financial statements.
Because of its inherent limitations, internal control over financial reporting may not prevent or detect misstatements. Also, projections of any evaluation of effectiveness to future periods are subject to the risk that controls may become inadequate because of changes in conditions, or that the degree of compliance with the policies or procedures may deteriorate.

Chartered Professional Accountants, Licensed Public Accountants
Oakville, Canada
March 15, 2019
We have served as the Company's auditor since 1999.
2018 Consolidated Financial Statements | Page 34 |
Hydrogenics Corporation
Consolidated Balance Sheets
(in thousands of US dollars)
| | | | | | | | | | | | |
| | | | | | December 31, | | | December 31, | | January 1, | |
| | | | | | 2018 | | | 2017 | | 2017 | |
| | | Note | | | | | | Restated (Note 5) | | Restated (Note 5) | |
| Assets | | | | | | | | | | | | | | | |
| Current assets | | | | | | | | | | | | | | | |
| Cash and cash equivalents | | | 7 | | | $ | 7,561 | | | $ | 21,511 | | $ | 10,338 | |
| Restricted cash | | | 7 | | | | 935 | | | | 435 | | | 405 | |
| Trade and other receivables | | | 8 | | | | 6,728 | | | | 8,736 | | | 5,144 | |
| Contract assets | | | 9 | | | | 4,534 | | | | 6,578 | | | 5,572 | |
| Inventories | | | 10 | | | | 17,174 | | | | 15,048 | | | 17,130 | |
| Prepaid expenses | | | 11 | | | | 1,960 | | | | 1,374 | | | 1,198 | |
| | | | | | | | 38,892 | | | | 53,682 | | | 39,787 | |
| Non-current assets | | | | | | | | | | | | | | | |
| Restricted cash | | | 7 | | | | 241 | | | | 468 | | | 535 | |
| Contract assets | | | 9 | | | | 1,689 | | | | 645 | | | – | |
| Investment in joint ventures | | | 12 | | | | 1,644 | | | | 2,797 | | | 1,750 | |
| Property, plant and equipment | | | 13 | | | | 2,867 | | | | 3,874 | | | 4,095 | |
| Intangible assets | | | 14 | | | | 232 | | | | 180 | | | 203 | |
| Goodwill | | | 15 | | | | 4,359 | | | | 4,569 | | | 4,019 | |
| | | | | | | | 11,032 | | | | 12,533 | | | 10,602 | |
| Total assets | | | | | | $ | 49,924 | | | $ | 66,215 | | $ | 50,389 | |
| Liabilities | | | | | | | | | | | | | | | |
| Current liabilities | | | | | | | | | | | | | | | |
| Operating borrowings | | | 19 | | | $ | – | | | $ | 1,200 | | $ | 2,111 | |
| Trade and other payables | | | 16 | | | | 9,068 | | | | 9,736 | | | 7,235 | |
| Contract liabilities | | | 9 | | | | 14,581 | | | | 11,821 | | | 10,268 | |
| Financial liabilities | | | 17 | | | | 3,359 | | | | 4,913 | | | 3,939 | |
| Provisions | | | 18 | | | | 2,041 | | | | 1,744 | | | 2,045 | |
| Deferred funding | | | | | | | 1,744 | | | | 880 | | | 508 | |
| | | | | | | | 30,793 | | | | 30,294 | | | 26,106 | |
| Non-current liabilities | | | | | | | | | | | | | | | |
| Other liabilities | | | 20 | | | | 5,711 | | | | 8,516 | | | 9,262 | |
| Contract liabilities | | | 9 | | | | 1,420 | | | | 2,223 | | | 3,494 | |
| Provisions | | | 18 | | | | 810 | | | | 976 | | | 841 | |
| Deferred funding | | | | | | | 229 | | | | 33 | | | 12 | |
| | | | | | | | 8,170 | | | | 11,748 | | | 13,609 | |
| Total liabilities | | | | | | | 38,963 | | | | 42,042 | | | 39,715 | |
| Share capital | | | 21 | | | | 387,911 | | | | 387,746 | | | 365,923 | |
| Contributed surplus | | | | | | | 20,717 | | | | 19,885 | | | 19,255 | |
| Accumulated other comprehensive loss | | | | | | | (2,681 | ) | | | (1,811 | ) | | (3,623 | ) |
| Deficit | | | | | | | (394,986 | ) | | | (381,647 | ) | | (370,881 | ) |
| Total equity | | | | | | | 10,961 | | | | 24,173 | | | 10,674 | |
| Total equity and liabilities | | | | | | $ | 49,924 | | | $ | 66,215 | | $ | 50,389 | |
Guarantees and Commitments and Contingencies (notes 19 and 31)
Subsequent Events (note 37)
 |  |
Douglas S. Alexander Chair | David C. Ferguson Director |
The accompanying notes form an integral part of these consolidated financial statements.
2018 Consolidated Financial Statements | Page 35 |
Hydrogenics Corporation
Consolidated Statements of Operations and Comprehensive Loss
For the years ended December 31,
(in thousands of US dollars, except share and per share amounts)
| | | | | | | |
| | | Note | | | 2018 | | | 2017 | |
| | | | | | | | | Restated (Note 5) | |
| | | | | | | | | | |
| Revenues | | | | | | $ | 33,896 | | | $ | 48,115 | |
| Cost of sales | | | | | | | 25,171 | | | | 36,437 | |
| Gross profit | | | | | | | 8,725 | | | | 11,678 | |
| | | | | | | | | | | | | |
| Operating expenses | | | | | | | | | | | | |
| Selling, general and administrative expenses | | | 23 | | | | 11,613 | | | | 13,626 | |
| Research and product development expenses | | | 24 | | | | 7,486 | | | | 6,376 | |
| | | | | | | | 19,099 | | | | 20,002 | |
| | | | | | | | | | | | | |
| Loss from operations | | | | | | | (10,374 | ) | | | (8,324 | ) |
| | | | | | | | | | | | | |
| Loss from joint ventures | | | 12 | | | | (1,637 | ) | | | (334 | ) |
| | | | | | | | | | | | | |
| Finance income (loss) | | | | | | | | | | | | |
| Interest expense, net on financial instruments measured at amortized cost | | | | | | | (1,469 | ) | | | (1,812 | ) |
| Foreign currency gains, net(1) | | | | | | | 144 | | | | 635 | |
| Other finance gains (losses), net | | | 28 | | | | 297 | | | | (931 | ) |
| Finance loss, net | | | | | | | (1,028 | ) | | | (2,108 | ) |
| | | | | | | | | | | | | |
| Loss before income taxes | | | | | | | (13,039 | ) | | | (10,766 | ) |
| Income tax expense | | | 29 | | | | 300 | | | | – | |
| Net loss for the year | | | | | | | (13,339 | ) | | | (10,766 | ) |
| | | | | | | | | | | | | |
| Items that will not be reclassified subsequently to net loss: | | | | | | | | | | | | |
| Re-measurements of actuarial liability | | | | | | | 70 | | | | 98 | |
| Items that may be reclassified subsequently to net loss: | | | | | | | | | | | | |
| Exchange differences on translating foreign operations | | | | | | | (940 | ) | | | 1,714 | |
| Comprehensive loss for the year | | | | | | $ | (14,209 | ) | | $ | (8,954 | ) |
| | | | | | | | | | | | | |
| Net loss per share - basic and diluted | | | 30 | | | $ | (0.86 | ) | | $ | (0.77 | ) |
| | | | | | | | | | | | | |
| Weighted average number of common shares outstanding, basic and diluted | | | 30 | | | | 15,441,947 | | | | 13,947,636 | |
| (1) | Foreign currency gains (losses) include a gain of $223 on borrowings for the year ended December 31, 2018 (2017 – loss of $223). |
The accompanying notes form an integral part of these consolidated financial statements.
2018 Consolidated Financial Statements | Page 36 |
Hydrogenics Corporation
Consolidated Statements of Changes in Equity
(in thousands of US dollars, except share and per share amounts)
| | | | | | | | | | | | | | | | | | | | | | |
| | | | | | | | | | | | | | | | | | Accumulated | | | | |
| | | | | | | | | | | | | | | | | | other | | | | |
| | | | | | Common shares | | | Contributed | | | | | | comprehensive | | | Total | |
| | | Note | | | Number | | | Amount | | | surplus | | | Deficit | | | loss(1) | | | equity | |
| Balance at December 31, 2016 | | | | | | | 12,544,960 | | | $ | 365,923 | | | $ | 19,255 | | | $ | (371,173 | ) | | $ | (3,623 | ) | | $ | 10,382 | |
| Change in accounting policy | | | 5 | | | | – | | | | – | | | | – | | | | 292 | | | | – | | | | 292 | |
| Restated Balance at January 1, 2017 | | | | | | | 12,544,960 | | | | 365,923 | | | | 19,255 | | | | (370,881 | ) | | | (3,623 | ) | | | 10,674 | |
| Net loss | | | | | | | – | | | | – | | | | – | | | | (10,766 | ) | | | – | | | | (10,766 | ) |
| Other comprehensive income | | | | | | | – | | | | – | | | | – | | | | – | | | | 1,812 | | | | 1,812 | |
| Total comprehensive income (loss) | | | | | | | – | | | | – | | | | – | | | | (10,766 | ) | | | 1,812 | | | | (8,954 | ) |
Adjustment for partial shares
on share consolidation | | | | | | | (1 | ) | | | – | | | | – | | | | – | | | | – | | | | – | |
| Issuance of common shares | | | 21 | | | | 2,682,742 | | | | 19,725 | | | | – | | | | – | | | | – | | | | 19,725 | |
| Warrants exercised | | | 17 | | | | 200,575 | | | | 1,966 | | | | – | | | | – | | | | – | | | | 1,966 | |
Issuance of common shares
on exercise of stock options | | | 22 | | | | 4,400 | | | | 36 | | | | (16 | ) | | | – | | | | – | | | | 20 | |
Issuance of common shares on
vesting of performance share units | | | 22 | | | | 4,203 | | | | 96 | | | | (96 | ) | | | – | | | | – | | | | – | |
| Stock-based compensation expense | | | 22 | | | | – | | | | – | | | | 742 | | | | – | | | | – | | | | 742 | |
| Balance at December 31, 2017 | | | | | | | 15,436,879 | | | $ | 387,746 | | | $ | 19,885 | | | $ | (381,647 | ) | | $ | (1,811 | ) | | $ | 24,173 | |
| Net loss | | | | | | | – | | | | – | | | | – | | | | (13,339 | ) | | | – | | | | (13,339 | ) |
| Other comprehensive loss | | | | | | | – | | | | – | | | | – | | | | – | | | | (870 | ) | | | (870 | ) |
| Total comprehensive loss | | | | | | | – | | | | – | | | | – | | | | (13,339 | ) | | | (870 | ) | | | (14,209 | ) |
Issuance of common shares on
vesting of performance
share units | | | 22 | | | | 4,204 | | | | 96 | | | | (96 | ) | | | – | | | | – | | | | – | |
Issuance of common shares
on exercise of stock options | | | 22 | | | | 6,400 | | | | 69 | | | | (29 | ) | | | – | | | | – | | | | 40 | |
| Stock-based compensation expense | | | 22 | | | | – | | | | – | | | | 957 | | | | – | | | | – | | | | 957 | |
| Balance at December 31, 2018 | | | | | | | 15,447,483 | | | $ | 387,911 | | | $ | 20,717 | | | $ | (394,986 | ) | | $ | (2,681 | ) | | $ | 10,961 | |
| (1) | Accumulated other comprehensive loss represents currency translation adjustments of ($2,719) as of December 31, 2018 (2017 – $1,779), and a gain on re-measurement of actuarial liability of $27 as of December 31, 2018 (2017 – loss of $43) |
The authorized share capital of the Company consists of an unlimited number of common shares, with no par value, and an unlimited number of preferred shares in series, with no par value.
The accompanying notes form an integral part of these consolidated financial statements.
2018 Consolidated Financial Statements | Page 37 |
Hydrogenics Corporation
Consolidated Statements of Cash Flows
For the years ended December 31,
(in thousands of US dollars)
| | | | | | | | | | |
| | | Note | | | 2018 | | | 2017 | |
| | | | | | | | | Restated (Note 5) | |
| Cash and cash equivalents provided by (used in): | | | | | | | | | | | | |
| Operating activities | | | | | | | | | | | | |
| Net loss for the year | | | | | | $ | (13,339 | ) | | $ | (10,766 | ) |
| Decrease (increase) in restricted cash | | | | | | | (304 | ) | | | 134 | |
| Items not affecting cash: | | | | | | | | | | | | |
| Loss (gain) on disposal of property, plant and equipment | | | | | | | (11 | ) | | | 131 | |
| Amortization and depreciation | | | 13, 14 | | | | 706 | | | | 672 | |
| Loss (gain) from change in fair value of warrants | | | 17 | | | | (398 | ) | | | 675 | |
| Unrealized foreign exchange (gain) loss | | | | | | | (353 | ) | | | 494 | |
| Unrealized loss from joint ventures | | | 12 | | | | 1,637 | | | | 334 | |
| Accreted interest and fair value adjustment | | | 20 | | | | 1,650 | | | | 2,075 | |
| Stock-based compensation | | | 22 | | | | 957 | | | | 742 | |
| Stock-based compensation – DSUs | | | 22 | | | | (676 | ) | | | 950 | |
| Net change in non-cash operating assets and liabilities | | | 33 | | | | 1,750 | | | | (223 | ) |
| Cash used in operating activities | | | | | | | (8,381 | ) | | | (4,782 | ) |
| Investing activities | | | | | | | | | | | | |
| Investment in joint venture | | | 12 | | | | – | | | | (93 | ) |
| Purchase of property, plant and equipment | | | 13 | | | | (1,001 | ) | | | (3,920 | ) |
| Receipt of government funding | | | | | | | 974 | | | | 1,792 | |
| Proceeds from disposals of property, plant and equipment | | | 12 | | | | 700 | | | | 1,035 | |
| Purchase of intangible assets | | | 14 | | | | (125 | ) | | | (25 | ) |
| Cash provided by (used in) investing activities | | | | | | | 548 | | | | (1,211 | ) |
| Financing activities | | | | | | | | | | | | |
| Proceeds from common shares issued and stock options exercised, net of issuance costs | | | 21, 22 | | | | 40 | | | | 19,745 | |
| Principal repayments of long-term debt | | | 20 | | | | (3,120 | ) | | | (1,639 | ) |
| Exercise of warrants | | | 17 | | | | – | | | | 1,374 | |
| Interest payments | | | 20 | | | | (1,498 | ) | | | (1,274 | ) |
| Repayment of operating borrowings | | | 19 | | | | (1,193 | ) | | | (873 | ) |
| Repayment of repayable government contributions | | | | | | | – | | | | (171 | ) |
| Cash provided by (used in) financing activities | | | | | | | (5,771 | ) | | | 17,162 | |
| Increase (decrease) in cash and cash equivalents during the year | | | | | | | (13,604 | ) | | | 11,169 | |
| Cash and cash equivalents – Beginning of year | | | | | | | 21,511 | | | | 10,338 | |
| Effect of exchange rate fluctuations on cash and cash equivalents held | | | | | | | (346 | ) | | | 4 | |
| Cash and cash equivalents – End of year | | | | | | $ | 7,561 | | | $ | 21,511 | |
The accompanying notes form an integral part of these consolidated financial statements.
2018 Consolidated Financial Statements | Page 38 |
Note 1 – Description of Business
Hydrogenics Corporation and its subsidiaries (“Hydrogenics” or the “Corporation” or the “Company”) design, develop and manufacture hydrogen generation products using water electrolysis technology (based on alkaline and proton exchange membrane (“PEM”) electrolyzers), and fuel cell products which convert hydrogen into electricity using PEM technology. The Company has manufacturing plants in Canada and Belgium, satellite facilities in Germany and the United States, and branch offices in Russia and Indonesia. Its products are sold throughout the world.
Hydrogenics is incorporated and domiciled in Canada. The address of the Company’s registered head office is 220 Admiral Boulevard, Mississauga, Ontario, Canada. The Company’s shares trade under the symbol “HYG” on the Toronto Stock Exchange and under the symbol “HYGS” on NASDAQ.
Note 2 – Basis of Preparation
These consolidated financial statements have been prepared in accordance with International Financial Reporting Standards as issued by the International Accounting Standards Board (“IFRS”) applicable to the preparation of consolidated financial statements.
On March 14, 2019, the Board of Directors authorized the consolidated financial statements for issue.
Note 3 – Summary of Significant Accounting Policies
The consolidated financial statements of the Company include the accounts of Hydrogenics and its wholly-owned subsidiaries; Hydrogenics USA, Inc., Hydrogenics Europe N.V., and Hydrogenics Holding GmbH. All intercompany transactions, balances and unrealized gains or losses on transactions between group companies have been eliminated. Accounting policies of subsidiaries have been changed, where necessary, to ensure consistency with the policies adopted by the Company. Subsidiaries include all entities controlled by the Company. Control exists when the Company is exposed or has rights to variable returns from the Company’s involvement, and has the ability to affect those returns through the Company’s power over the subsidiary. The existence and potential voting rights presently exercisable or convertible are considered when assessing whether the Company controls another entity. Subsidiaries are fully consolidated from the date on which control was obtained by the Company and are deconsolidated from the date on which control ceased. The consolidated financial statements have been prepared under the historical cost convention, except for the revaluation of certain financial assets and financial liabilities to fair value.
Investments in joint ventures
Investments in joint ventures, over which the Company has joint control, are accounted for using the equity method. Under the equity method of accounting, investments are initially recorded at cost, and the carrying amount is increased or decreased to recognize the Company’s share of the investee’s net profit or loss, including net profit or loss recognized in other comprehensive income (“OCI”), subsequent to the date of acquisition.
Foreign currency translation
Items included in the financial statements of each consolidated entity in the Company’s consolidated financial statements are measured using the currency of the primary economic environment in which the entity operates (the “functional currency”). The consolidated financial statements are presented in US dollars, which is the functional currency of Hydrogenics Corporation (“the parent company”).
Foreign currency transactions are translated into the functional currency using the exchange rates prevailing at the dates of the transactions. Foreign exchange gains and losses resulting from the settlement of foreign currency transactions and from the translation at period-end exchange rates of monetary assets and liabilities denominated in currencies other than an operation’s functional currency are recognized in the consolidated statements of operations and comprehensive loss.
2018 Consolidated Financial Statements | Page 39 |
The functional currency of the Company’s subsidiaries located in Belgium and Germany is the euro, which is the currency of the primary economic environment in which these subsidiaries operate. The financial statements of these subsidiaries are translated into US dollars as follows: assets and liabilities, at the closing exchange rate at the dates of the consolidated balance sheets; and the income and expenses and other comprehensive income (loss), at the average exchange rate during the year as this is considered a reasonable approximation to the actual rates. All resulting foreign exchange changes are recognized in other comprehensive loss as cumulative translation adjustments.
Cash and cash equivalents and restricted cash
Cash equivalents are short-term, highly liquid investments that are readily convertible into known amounts of cash. Cash and cash equivalents, including restricted cash held as partial security for standby letters of credit and letters of guarantee, include cash on hand, deposits held with banks and other short-term, highly liquid investments with original maturities of three months or less.
Financial instruments (excluding hedging activities)
(i) Classification
The Company classifies its financial instruments in the following categories: at fair value through profit and loss (“FVPL”), at fair value through other comprehensive income (loss) (“FVOCI”) or at amortized cost. The Company determines the classification of financial assets and liabilities at initial recognition. The classification of the Company’s financial assets and liabilities is disclosed in note 35.
(ii) Measurement
Amortized cost
Financial assets and liabilities at amortized cost are initially recognized at fair value (except for trade receivables that do not contain a significant financing component which are measured at the transaction price) plus or minus transaction costs and subsequently carried at amortized cost less any impairment.
Fair value through profit and loss
Financial assets and liabilities carried at FVPL are initially recorded at fair value and transaction costs are expensed in the consolidated statements of operations and comprehensive loss. Derivatives are included in this category unless designated as hedges. Realized and unrealized gains and losses arising from changes in the fair value of the financial assets and liabilities held at FVPL are included in the consolidated statements of operations and comprehensive loss within other gains and losses in the period in which they arise.
Fair value through other comprehensive income
Financial assets carried at FVOCI are measured at fair value. Interest, dividends and impairment gains and losses are recognized in the consolidated statement of operations on the same basis as for amortized cost assets. Changes in fair value are recognized initially in other comprehensive income. When the assets are derecognized or reclassified the cumulative changes in fair value are reclassified to the consolidated statement of operations (except where they relate to investments in equity instruments). The Company has no financial instruments measured at fair value through other comprehensive loss.
(iii) Impairment of financial assets at amortized cost
For trade receivables and contract assets, the Company applies the simplified approach to providing for expected credit losses prescribed by IFRS 9, which requires the use of the lifetime expected loss provision for all trade receivables and contract assets based on the Company’s historical default rates over the expected life of the trade receivables adjusted for forward-looking estimates (see note 35).
2018 Consolidated Financial Statements | Page 40 |
(iv) Derecognition
| i. | Financial assets - The Company derecognizes financial assets only when the contractual rights to cash flows from the financial assets expire, or when it transfers the financial assets and substantially all of the associated risks and rewards of ownership to another entity. Gains and losses on derecognition are recognized in the consolidated statements of operations and comprehensive loss. |
| ii. | Financial liabilities - The Company derecognizes financial liabilities only when its obligations under the financial liabilities are discharged, cancelled or expired. Generally, the difference between the carrying amount of the financial liability derecognized and the consideration paid and payable, including any non-cash assets transferred or liabilities assumed, is recognized in the consolidated statements of operations and comprehensive loss. |
Derivatives and hedging activities
The Company periodically holds derivative financial instruments to hedge its foreign currency risk exposures that are designated as the hedging instrument in a hedge relationship. On initial designation of the hedge, the Company formally documents the relationship between the hedging instrument and hedged item, including the risk management objectives and strategy in undertaking the hedge transaction, together with the methods that will be used to assess the effectiveness of the hedging relationship. The Company makes an assessment, both at the inception of the hedge relationship as well as on an ongoing basis, whether the hedging instruments are expected to be “highly effective” in offsetting the changes in the fair value or cash flows of the respective hedged items during the period for which the hedge is designated, and whether the actual results of each hedge are within a range of 80-125%.
For a cash flow hedge of a forecast transaction, the transaction should be highly probable to occur and should present an exposure to variations in cash flows that could ultimately affect reported net income. Derivatives are recognized initially at fair value; attributable transaction costs are recognized in profit or loss as incurred. Subsequent to initial recognition, derivatives are measured at fair value, and changes therein are recognized in other comprehensive income and presented in unrealized gains/losses on cash flow hedges in equity. The amount recognized in other comprehensive income is removed and included in profit or loss in the same period as the hedged cash flows affect profit or loss under the same line item in the consolidated statements of operations and comprehensive loss as the hedged item. Any ineffective portion of changes in the fair value of the derivative is recognized immediately in profit or loss. If the hedging instrument no longer meets the criteria for hedge accounting, expires or is sold, terminated, exercised, or the designation is revoked, then hedge accounting is discontinued prospectively. The cumulative gain or loss previously recognized in other comprehensive income and presented in unrealized gains/losses on cash flow hedges in equity remains there until the forecast transaction affects profit or loss. If the forecast transaction is no longer expected to occur, then the balance in other comprehensive income is recognized immediately in profit or loss. In other cases the amount recognized in other comprehensive income is transferred to profit or loss in the same period that the hedged item affects profit or loss.
Inventories
Raw materials, work-in-progress and finished goods are valued at the lower of cost, determined on a first-in, first-out basis, and net realizable value. Inventory costs include the cost of material, labour, variable overhead and an allocation of fixed manufacturing overhead including amortization based on normal production volumes. Net realizable value is the estimated selling price less estimated costs of completion and applicable selling expenses. If the carrying value exceeds the net realizable amount, a write-down is recognized. The write-down may be reversed in a subsequent period if the circumstances causing it no longer exist.
Property, plant and equipment
Property, plant and equipment are stated at cost less government grants, accumulated depreciation and accumulated impairment losses. Cost includes expenditures that are directly attributable to the acquisition of the asset. Subsequent costs are included in the asset’s carrying value or recognized as a separate asset, as appropriate, only when it is probable that future economic benefits associated with the item will flow to the Company and the cost can be measured reliably. The cost and accumulated depreciation of replaced assets are derecognized when replaced. Repairs and maintenance costs are charged to the consolidated statements of operations and comprehensive loss during the period in which they are incurred.
2018 Consolidated Financial Statements | Page 41 |
Depreciation is calculated on a diminishing balance method to depreciate the cost of the assets to their residual values over their estimated useful lives. The depreciation rates applicable to each category of property, plant and equipment are as follows:
| Plant and Test equipment | 30% per annum |
| Furniture and equipment | 20% – 30% per annum |
| Computer hardware | 30% per annum |
| Automobiles | 30% per annum |
| Leasehold improvements | Straight-line over the term of the lease |
Residual values, method of depreciation and useful lives of the assets are reviewed at least annually and adjusted if appropriate.
Construction-in-progress assets are not depreciated until such time they are available for use. Depreciation ceases at the earlier of the date the asset is classified as held-for-sale and the date the asset is derecognized.
Gains and losses on disposals of property, plant and equipment are determined by comparing the proceeds with the carrying value of the asset and are included as part of other gains and losses in the consolidated statements of operations and comprehensive loss.
Intangible assets
The Company’s intangible assets consist of computer software with finite useful lives. These assets are capitalized and amortized over their useful lives using the diminishing balance method of 30% per annum. Costs associated with maintaining computer software programs are recognized as an expense as incurred. The method of amortization and useful lives of the assets are reviewed at least annually and adjusted if appropriate.
Goodwill
Goodwill is recognized as the fair value of the consideration transferred including the recognized amount of any non-controlling interest in the acquiree, less the fair value of the net identifiable assets acquired and liabilities assumed, as of the acquisition date. Subsequent to initial recognition, goodwill is measured at cost less accumulated impairment losses. Goodwill acquired in business combinations is allocated to groups of cash generating units (“CGU”) that are expected to benefit from the synergies of the combination. The goodwill recorded in the Company’s consolidated financial statements relates to the OnSite Generation CGU.
Impairment long-lived assets
Property, plant and equipment and definite life intangible assets are tested for impairment when events or changes in circumstances indicate the carrying value may not be recoverable. Intangible assets with an indefinite useful life or intangible assets not yet available-for-use are subject to an annual impairment test. When events or changes in circumstances indicate impairment, impairment test is performed earlier than annual. For the purpose of measuring recoverable values, assets are grouped at the lowest levels for which there are separately identifiable cash inflows being the CGU. Goodwill is not amortized but is reviewed for impairment annually or at any time an indicator of impairment exists. A goodwill CGU represents the lowest level within an entity at which goodwill is monitored for internal management purposes, which is not higher than an operating segment.
For the long-lived asset impairment test, the recoverable value is the higher of an asset or CGU’s fair value less costs of disposal and value in use. An impairment loss is recognized for the value by which the asset or CGU’s carrying value exceeds its recoverable value.
2018 Consolidated Financial Statements | Page 42 |
Segment reporting
Operating segments are reported in a manner consistent with the internal reporting provided to the chief operating decision-maker. The chief operating decision-maker, who is responsible for allocating resources and assessing performance of the operating segments, has been identified as the Chief Executive Officer. The Corporation has two segments which are OnSite Generation and Power Systems. OnSite Generation includes the design, development, manufacture and sale of hydrogen generation products. Power Systems includes the design, development, manufacture and sale of fuel cell products.
Provisions and product warranties
Provisions are recognized when the Company has a present legal or constructive obligation as a result of past events, it is more likely than not that an outflow of resources will be required to settle the obligation, and the amount can be reliably estimated. Provisions are measured based on management’s best estimate of the expenditure required to settle the obligation at the end of the reporting period, and are discounted to their present value where the effect is material.
Provisions for the estimated cost of installation, start up and commissioning services related to the sale of equipment are recognized at the time of sale where the costs are insignificant in the context of the total contract and where the customer believes they are buying a final installed working product rather than the individual collection of products and services. These costs are revised if circumstances change and any resulting increase or decrease in estimated costs is reflected in the consolidated statement of operations and comprehensive loss in the period in which the circumstances that give rise to the revision become known by management.
Additionally, the Company performs evaluations to identify onerous contracts and where applicable, records provisions for such contracts. Onerous contracts are those in which the unavoidable costs of meeting the obligations under the contract exceed the economic benefits expected to be received under it. The unavoidable costs under a contract reflect the least net cost of exiting from the contract, which is the lower of the cost of fulfilling it and any compensation or penalties arising from the failure to fulfill it.
The Company typically provides a warranty for parts and/or labour for up to two years or based on time or certain operating specifications, such as hours of operation. In establishing the warranty provision, the Company estimates the likelihood that products sold will experience warranty claims and the estimated cost to resolve claims received, taking into account the nature of the contract and past and projected experience with the products. Provisions are reviewed at each consolidated balance sheet date and adjusted to reflect the current best estimate. If it is no longer probable that a payment to settle the obligation will be incurred, the provision is reversed.
Warrants
The Company’s warrants include anti-dilution provisions, and as a result have been classified as financial liabilities, and are recorded at their fair value with changes in fair value reflected in the consolidated statements of operations and comprehensive loss.
Leases
Leases are classified as finance leases when the lease arrangement transfers substantially all the risks and rewards of ownership to the lessee. All other leases are classified as operating leases. The assets held under a finance lease are recognized as assets at the lower of the following two values: the present value of the minimum lease payments under the lease arrangement or their fair value determined at inception of the lease. The corresponding obligation to the lessor is accounted for as long-term debt. These assets are depreciated over the shorter of the useful life of the assets and the lease term when there is no reasonable certainty the Company will obtain ownership by the end of the lease term. Payments made under operating leases (net of any incentives received from the lessor) are charged to the consolidated statements of operations and comprehensive loss on a straight-line basis over the period of the lease.
2018 Consolidated Financial Statements | Page 43 |
Research and product development
The Company incurs costs associated with the design and development of new products. Expenditures during the research phase are expensed as incurred. Expenditures during the development phase are capitalized if the Company can demonstrate each of the following criteria: (i) the technical feasibility of completing the intangible asset so that it will be available-for-use or sale; (ii) its intention to complete the intangible asset and use or sell it; (iii) its ability to use or sell the intangible asset; (iv) how the intangible asset will generate probable future economic benefits; (v) the availability of adequate technical, financial, and other resources to complete the development and to use or sell the intangible asset; and (vi) its ability to measure reliably the expenditure attributable to the intangible asset during its development; otherwise, they are expensed as incurred. Capitalized costs are amortized over their estimated useful lives. No government grants have been capitalized to date.
Government assistance
Funding for research and product development includes government and non-government research and product development support. Government research and product development funding is recognized when there is reasonable assurance the Company has complied with the conditions attached to the funding arrangement and is recognized as the applicable costs are incurred. Non-governmental funding is recognized when the Company becomes party to the contractual provisions of the funding agreement and is recognized as the applicable costs are incurred. Research and product development funding is presented as a reduction in research and product development expenses unless it is for reimbursement of an asset, in which case, it is accounted for as a reduction in the carrying amount of the applicable asset. Where the Company receives government contributions that include fixed terms of repayment, a financial liability is recognized and measured as an amortized cost financial liability, as discussed above.
Revenue recognition
The Company’s business is to develop and sell electrolyser and fuel cell products and provide related services. The equipment and services are sold both on their own and bundled together as a package of goods and/or services.
(a) Sale of equipment
Material promises within a contract to deliver distinct goods and services are accounted for as separate performance obligations and the contract price is allocated between each performance obligation based upon their relative stand-alone selling prices. Revenue is recognized at an amount that reflects the consideration to which an entity expects to be entitled in exchange for transferring goods and services to the customer. For contracts with customers in which the sale of equipment is generally expected to be the only performance obligation, the Company recognizes revenue at the point in time when control of the asset is transferred to the customer. Control normally passes upon shipment unless the company enters into a bill and hold arrangement, in which case revenue is recognized upon readiness for shipment. The Company’s standard payment terms include a deposit upon order acceptance and payment in full prior to delivery. Startup and commissioning services, if applicable, are invoiced upon completion of the service.
(i) Variable consideration
Some contracts with customers provide trade discounts, exclusivity, license, sales-based royalties and/or volume rebates and discounts and give rise to variable consideration. Variable consideration is estimated at contract inception and updated prospectively for any changes to the estimates. Variable consideration is only included in the transaction price to the extent that it is highly probable that a significant reversal in the amount of cumulative revenue recognized will not occur when the uncertainty associated with the variable consideration is subsequently resolved.
(ii) Warranty obligations
The Company provides for warranties for general repairs but does not generally provide extended warranties in its contracts with customers. As such, most existing warranties are assurance-type warranties which will continue to be accounted for under IAS 37 Provisions, Contingent Liabilities and Contingent Assets. For non-standard contracts where the Company provides extended warranties, they are accounted for as separate performance obligations to which the Company allocates a portion of the transaction price.
2018 Consolidated Financial Statements | Page 44 |
(b) Long-term contracts
For long-term contracts, such as customer-specific product development contracts, control of the promised goods and services are generally transferred to the customers over time as performance obligations are satisfied. Revenue is recognized over time using input methods based on the measure of the progress towards complete satisfaction of that performance obligation. Under this method, the revenue recognized equals the latest estimate of the total transaction price of the contract multiplied by the actual completion rate, determined by reference to the costs incurred for the transaction and the estimated costs to complete the transaction.
The determination of the transaction price represents the contractually agreed amount, including change orders. A change order results from an official change to the scope of work to be performed compared to the original contract that was signed. The Company estimates costs separately for each customer specific development contract including the effects of change orders.
If circumstances arise that may change the estimated transaction price, the remaining costs or extent of progress toward completion, and estimates of revenues to be recorded are revised. These revisions may result in increases or decreased in estimated revenues or remaining costs to complete and are accounted for prospectively from the period in which the circumstances that give rise to the revision become known by management. If the outcome of a transaction cannot be estimated reliably, revenue is recognized only to the extent of the expenses recognized that are recoverable. When the outcome of a transaction cannot be estimated reliably, and it is not probable the costs incurred will be recovered, revenue is not recognized and the costs incurred are recognized as an expense. Once the uncertainty surrounding the outcome no longer exists, a cumulative catch up adjustment is recognized to record revenue related to prior performance that had not been recognized due to the inability to measure progress.
The timing of revenue recognition, billings and cash collections results in billed accounts receivable, unbilled receivables (contract assets), and customer advances and deposits (contract liabilities) on the consolidated balance sheet. Amounts are billed as work progresses in accordance with agreed-upon contractual terms, either at periodic intervals or upon achievement of contractual milestones. Generally, billing occurs subsequent to revenue recognition, resulting in contract assets reported on the consolidated balance sheet at the end of each reporting period.
(c) Rendering of services
The Company provides start-up, commissioning, installation, scheduled or unscheduled maintenance, both with and without parts and other product development services. These services are sold either on their own or bundled together with the sale of equipment to a customer. Where these performance obligations are not considered distinct (i.e. where the customer believes they are buying a final installed working product and are not buying the individual collection of products and services bundle), these services are combined into a single performance obligation and recognized on the same basis as the sale of the related equipment. Revenue from services deemed to be a separate performance obligation are recognized by reference to the stage of completion based upon relative stand-alone selling prices.
d) Technology transfer, license and exclusivity arrangements
When a single performance obligation includes technology transfer, license of intellectual property or exclusivity arrangements and one or more other goods or services, the Company considers the nature of the combined good or service for which the customer has contracted in determining whether that combined good or service is satisfied over time or at a point in time, and if over time, in selecting an appropriate method for measuring progress.
Revenues from sales-based royalties promised in exchange for a license of intellectual property are recognized as revenue at the later of the date the product subject to the royalty is sold by the licensee, or when the performance obligation to which the sales-based royalty has been allocated is satisfied.
(e) Contract assets
The Company recognizes contract assets depending on the relationship between the Company’s performance obligation and the contract payment terms. A trade receivable is separately recorded only when the Company has an unconditional right to the consideration. For long-term development contracts and OnSite Generation contracts in particular, customers usually retain a small portion of the contract price until completion of the service, installation and commissioning, which generally result in revenue in excess of billings which are presented as contract assets on the consolidated balance sheet. The associated provisions for future costs to complete this work are recorded in provisions.
2018 Consolidated Financial Statements | Page 45 |
(f) Contract liabilities
The Company may receive advances from customers upon contract execution for which revenue is expected to occur within 12 months. These are deferred within contract liabilities until recognition in revenue as or when the performance obligation is satisfied. In relation to licensing arrangements, upfront license fees considered to consist of a single performance obligation, including a license of intellectual property and one or more other goods or services, are deferred in contract liabilities until recognition in revenue as or when the combined performance obligation is satisfied. For contracts that require customers to pay long-term advances, the payment terms are structured primarily for reasons other than the provision of finance to the Company; notably, to meet working capital demands, to ensure the customers follow through with their purchase orders, to ensure an incentive to not terminate the contract for any reasons, including economic, or to mitigate a history of late payments. Other long-term customer advances are analyzed to determine whether there is a significant financing component in its contracts and are accounted for separately.
(g) Incremental costs
The Company incurs incremental costs like sales agent commissions for obtaining the contract or to fulfill a contract. These costs are deferred within prepaids for contracts expected to be delivered after more than one year and expensed as the contract is delivered. Where there is a retrospective step up in the sales agent commission on a sale as a result of the salesperson reaching a new cumulative sales threshold, the Company allocates the commission between the contract in question and the preceding contracts in the year that contributed to the agent reaching the threshold. The commission related to any contract that has already been recorded as revenue is expensed while the commission corresponding to contract revenue that has not yet been recorded is capitalized and expensed simultaneously with the related contract revenue.
Cost of sales
Cost of sales for products includes the cost of finished goods inventory and the costs related to shipping and handling. Cost of sales for service includes direct labour and additional direct and indirect expenses.
Share capital
Common shares are classified as equity. Incremental costs directly attributable to the issuance of shares are recognized as a deduction from equity.
Post-retirement benefit liabilities
The Company has a post-retirement benefit obligation with respect to the Belgium subsidiary related to a defined contribution plan. Under Belgian law, a guaranteed return on the contributions is required and as a result this is accounted for as a defined benefit plan. The Company has recorded a long-term liability associated with this plan for the present value of the obligation at the consolidated balance sheet dates. Changes in the fair value of this liability represent actuarial gains and losses arising from experience adjustments and are charged/credited to equity in other comprehensive loss.
2018 Consolidated Financial Statements | Page 46 |
Stock-based compensation
The Company’s stock-based compensation plans are summarized below:
The Company grants stock options to certain employees. Stock options vest 25% one year from the date of grant and annually thereafter over three more years and expire after ten years. Each tranche in an award is considered a separate award with its own vesting period and grant date fair value. The fair value of each tranche is measured at the date of grant using the Black-Scholes option pricing model. Compensation expense is recognized (with a corresponding adjustment to contributed surplus) over the tranche’s vesting period, and is based on the estimated number of instruments expected to vest, which are then reestimated at the reporting dates to the extent that subsequent information indicates the actual number of instruments expected to vest is likely to differ from previous estimates. When options are exercised the Company issues new shares and the proceeds received net of any directly attributable transaction costs are credited to share capital at exercise price and the difference is adjusted to contributed surplus.
| (ii) | Restricted share units (“RSU”) |
The Company grants RSUs to certain employees. The RSUs will be settled in the Company’s shares. The cost of the Company’s RSUs is charged to selling, general and administrative expenses using the cliff vesting method. RSUs vest three years from grant date. The fair value of each grant of RSUs is the fair value of the Company’s share price on the date of grant. The resulting compensation expense, included in selling, general and administrative expenses, based on the fair value of the awards granted, is charged to income over the period the employees unconditionally become entitled to the award, with a corresponding increase to contributed surplus.
| (iii) | Deferred share units (“DSU”) |
The Company grants DSUs to directors as part of their compensation. The DSUs vest upon grant and are settled in cash. The vested DSUs are marked-to-market at the end of each reporting period based on the closing price of the Company’s shares with the change in fair value recorded in selling, general and administrative expenses. The Company has set up a liability in the consolidated balance sheets, included within financial liabilities, for the fair value of the vested DSUs.
| (iv) | Performance share units (“PSU”) |
The Company has granted PSUs to certain employees. The PSUs will be settled in the Company’s common shares. The cost of the Company’s PSUs is charged to selling, general and administrative expenses using the graded vesting method. The fair value of the vested share units is the fair value of the Company’s share price on the date of grant. The resulting compensation expense, based on the fair value of the awards granted, excluding the impact of any non-market service and performance vesting conditions, is charged to income over the period the employees unconditionally become entitled to the award, with a corresponding increase to contributed surplus. Non-market vesting conditions are considered in making assumptions about the number of awards that are expected to vest. At each reporting date, the Company reassesses its estimates of the number of awards that are expected to vest and recognizes the impact of any revision in the consolidated statements of operations and comprehensive loss with a corresponding adjustment to contributed surplus.
Income taxes
Income tax expense comprises current income tax expense and deferred income tax expense. Income tax expense is recognized in the consolidated statements of operations and comprehensive loss, except to the extent that it relates to items recognized directly in equity, in which case, income taxes are also recognized directly in equity. Current income taxes are the expected taxes payable on the taxable income for the year, using income tax rates enacted at the end of the reporting period, and any adjustment to income taxes payable in respect of previous years. Withholding taxes deducted from license fee revenues by foreign jurisdictions are accounted for and presented as income taxes in the consolidated statement of operations.
In general, deferred income taxes are the amount of income taxes expected to be paid or recoverable in future periods in respect of temporary differences, carry-forwards of unused non-capital tax losses and carry-forwards of unused tax credits. Deferred income taxes arise between the tax base and their carrying values in the consolidated financial statements as well as on unused tax losses and tax credits. Deferred income taxes are determined on a non-discounted basis using tax rates and laws that have been enacted or substantively enacted at the consolidated balance sheet dates and are expected to apply when the deferred income tax asset or liability is settled.
2018 Consolidated Financial Statements | Page 47 |
Deferred income taxes are provided on temporary differences arising on investments in subsidiaries and associates, except, in the case of subsidiaries, where the timing of the reversal of the temporary difference is controlled by the Company and it is probable that the temporary difference will not reverse in the foreseeable future. Deferred income tax assets are recognized to the extent it is probable that taxable profits will be available against which the deductible temporary differences and unused tax losses and tax credits can be utilized. The carrying value of deferred income tax assets is reviewed at each consolidated balance sheet date and reduced to the extent that it is no longer probable that sufficient taxable profits will be available to allow all or part of the deferred income tax asset to be recovered. Deferred income tax liabilities are not recognized on temporary differences that arise from goodwill, which is not deductible for tax purposes. Deferred income tax assets and liabilities are not recognized in respect of temporary differences that arise on initial recognition of certain assets and liabilities acquired other than in a business combination. Deferred income tax assets and liabilities are presented as non-current.
Net loss per share
Basic net loss per share is calculated based on the weighted average number of common shares outstanding for the year. Diluted net loss per share is calculated using the weighted average number of common shares outstanding for the year for basic net loss per share plus the weighted average number of potential dilutive shares that would have been outstanding during the year had all potential common shares been issued at the beginning of the year or when the underlying stock options or warrants were granted, if later, unless they were anti-dilutive. The treasury stock method is used to determine the incremental number of shares that would have been outstanding had the Company used proceeds from the exercise of stock options and warrants to acquire common shares.
Note 4 – Significant Accounting Judgments and Estimation Uncertainties
Critical accounting estimates and judgments
The preparation of consolidated financial statements in accordance with IFRS requires management to make estimates and assumptions that affect the amounts reported in the consolidated financial statements and notes to the consolidated financial statements. These estimates are based on management’s experience and other factors, including expectations about future events that are believed to be reasonable under the circumstances. Significant areas requiring the Company to make estimates include revenue recognition and contract accounting, warranty provisions, goodwill impairment and going concern.
These estimates and judgments are further discussed below:
Significant areas requiring the Company to make estimates impacting revenue recognition related to:
| (a) | Contracts with performance obligations satisfied over time. |
Contracts with performance obligations satisfied over time include:
| i. | Customer specific product development contracts - The Company estimates costs separately for each customer specific product development contract. The determination of estimated costs for completing fixed-price contracts is based on the Company’s business practices, considering budgets as well as historical experience. Management regularly reviews these estimates, which can be affected by a variety of factors such as variances in scheduling, cost of materials, availability and cost of qualified labour and subcontractors, productivity, and possible claims from subcontractors. |
| ii. | Maintenance contracts - Revenue from providing maintenance services is recognized in the accounting period in which the services are rendered. For fixed-price contracts, revenue is recognized based on the actual service provided to the end of the reporting period as a proportion of the total services to be provided, because the customer receives and uses the benefits simultaneously. Some maintenance contracts also offer scheduled visits and discounts on future spare part purchases. Because these represent additional performance obligations, the transaction price must be allocated to each performance obligation on a stand-alone selling price basis where material in the context of the contract. Management estimates the stand-alone selling price at contract inception based on observable prices for services rendered in similar circumstances to similar customers. |
2018 Consolidated Financial Statements | Page 48 |
| iii. | Technology transfer, licensing and manufacturing support contracts – Technology transfer licensing and manufacturing support arrangements constitute a single performance obligation that includes both a license for intellectual property as well as associated manufacturing training and support services. The transaction price is recognized as revenue over time as the combined services are provided. |
| (b) | Contracts with performance obligations satisfied at a point in time. |
Installation, start up and commissioning services related to the sale of equipment are not distinct and are combined into a single performance obligation where the costs are insignificant in the context of the total contract and where the customer believes they are buying a final installed working product rather than the individual collection of products and services. Thus, as long as control has passed when the product is shipped, all the revenue is recorded and an estimate for remaining costs for this work is accrued. These costs will be revised if circumstances change and any resulting increase or decrease in estimated costs will be reflected in the consolidated statement of operations and comprehensive loss in the period in which the circumstances that give rise to the revision become known by management.
The Company typically provides a warranty for parts and/or labour for up to two years from the date of shipment or commissioning or based on certain operating specifications, such as hours of operation. In establishing the warranty provision, management considers historical field data, projected claims experience, results of internal testing and in certain circumstances, application, in determining the value of this provision. Should these estimates prove to be incorrect, the Company may incur costs different from those provided for in the warranty provision. Management reviews warranty assumptions and makes adjustments to the provision at each reporting date based on the latest information available, including the expiry of contractual obligations. Adjustments to the warranty provision are recorded in cost of sales.
| (iii) | Goodwill impairment testing |
The Company tests annually whether goodwill has suffered any impairment, in accordance with the accounting policy stated in note 3. The recoverable amount of the OnSite Generation CGU has been determined based on an estimation of fair value less cost to sell (“FVLCS”). In the absence of a binding sales agreement, FVLCS is estimated using an income approach by discounting future cash flows. The estimation of FVLCS requires the use of estimates which are explained in note 15.
Key estimates and assumptions, include management’s expectations of future revenue growth, operating costs and profit margins as well as discount rates for the CGU and incremental costs for disposing of the assets. Growth rate assumptions used are based on the Company’s historical growth, internal budget, expectations of future revenue growth as well as industry and expected market trends in the hydrogen refueling, Power-to-Gas and industrial hydrogen market sectors. The Company uses a discount rate to calculate the present value of estimated future cash flows, which represents its weighted average cost of capital (WACC), plus a premium to take into account specific industry, size and company specific risks of the CGU, as the case may be. The income approach used by management is supplemented by a market based approach whereby the Company assesses the reasonableness of the resulting revenue multiples from the income approach valuation models based on available data from observable active market prices of broadly comparable businesses, data from recent transactions of similar assets within the same industry, when available and the Company’s stock price.
The assessment of events or conditions that may cast significant doubt on the Company’s ability to continue as a going concern involves significant judgment. In making this determination management considers all relevant information. See note 35 for Liquidity risk disclosures. Management has determined that there is no going concern uncertainty at December 31, 2018.
2018 Consolidated Financial Statements | Page 49 |
Note 5 – IFRS 9 Financial Instruments & IFRS 15 Revenue from Contracts with Customers – Impact of Adoption
IFRS 9 Financial Instruments – Impact of adoption
The Company adopted all the requirements of IFRS 9 Financial Instruments (“IFRS 9”) as of January 1, 2018. IFRS 9 replaces IAS 39 Financial Instruments: Recognition and Measurement (“IAS 39”). IFRS 9 utilizes a revised model for recognition and measurement of financial instruments and a single, forward-looking “expected loss” impairment model. Most of the requirements in IAS 39 for classification and measurement of financial liabilities were carried forward in IFRS 9, such that the Company’s accounting policy with respect to financial liabilities is unchanged. Further, as a result of adoption of IFRS 9, management has not changed its accounting policy for financial assets except for the adoption of the simplified approach to determining expected credit losses for receivables and contract assets, which had no impact on the carrying value of any financial assets or financial liabilities on the January 1, 2018 transition date.
IFRS 15 Revenue from Contracts with Customers – Impact of adoption
The Company has adopted IFRS 15 from January 1, 2018 using the full retrospective method which resulted in changes in accounting policies and adjustments to the amounts recognized in the comparative financial statements.
2018 Consolidated Financial Statements | Page 50 |
The following table shows the effect of the adoption of IFRS 15 on the Company’s balance sheets at January 1, 2017:
| | | | | | | | | | | | | | | |
| | | IAS18
carrying
amount | | | Note | | Remeasure-
ments | | | Reclass-
ifications | | | IFRS 15
carrying
amount | |
| Assets | | | | | | | | | | | | | | | | | | |
| Current assets | | | | | | | | | | | | | | | | | | |
| Cash and cash equivalents | | $ | 10,338 | | | | | $ | - | | | | - | | | $ | 10,338 | |
| Restricted cash | | | 405 | | | | | | - | | | | - | | | | 405 | |
| Trade and other receivables | | | 9,802 | | | 5(c) | | | - | | | | (4,658 | ) | | | 5,144 | |
| Contract assets | | | – | | | 5(a)(c) | | | 914 | | | | 4,658 | | | | 5,572 | |
| Inventories | | | 17,208 | | | 5(a) | | | - | | | | (78 | ) | | | 17,130 | |
| Prepaid expenses | | | 918 | | | 5(b) | | | 280 | | | | - | | | | 1,198 | |
| | | | 38,671 | | | | | | 1,194 | | | | (78 | ) | | | 39,787 | |
| Non-current assets | | | | | | | | | | | | | | | | | | |
| Restricted cash | | | 535 | | | | | | - | | | | - | | | | 535 | |
| Investment in joint ventures | | | 1,750 | | | | | | - | | | | - | | | | 1,750 | |
| Property, plant and equipment | | | 4,095 | | | | | | - | | | | - | | | | 4,095 | |
| Intangible assets | | | 203 | | | | | | - | | | | - | | | | 203 | |
| Goodwill | | | 4,019 | | | | | | - | | | | - | | | | 4,019 | |
| | | | 10,602 | | | | | | - | | | | - | | | | 10,602 | |
| Total assets | | $ | 49,273 | | | | | $ | 1,194 | | | | (78 | ) | | $ | 50,389 | |
| Liabilities | | | | | | | | | | | | | | | | | | |
| Current liabilities | | | | | | | | | | | | | | | | | | |
| Operating borrowings | | $ | 2,111 | | | | | $ | - | | | | - | | | $ | 2,111 | |
| Trade and other payables | | | 7,235 | | | | | | - | | | | - | | | | 7,235 | |
| Contract liabilities | | | – | | | 5(c) | | | - | | | | 10,268 | | | | 10,268 | |
| Financial liabilities | | | 3,939 | | | | | | - | | | | - | | | | 3,939 | |
| Provisions | | | 1,221 | | | 5(a) | | | 902 | | | | (78 | ) | | | 2,045 | |
| Deferred funding | | | – | | | 5(c) | | | - | | | | 508 | | | | 508 | |
| Deferred revenue | | | 10,788 | | | 5(c) | | | - | | | | (10,788 | ) | | | – | |
| | | | 25,294 | | | | | | 902 | | | | (90 | ) | | | 26,106 | |
| Non-current liabilities | | | | | | | | | | | | | | | | | | |
| Other liabilities | | | 9,262 | | | | | | - | | | | - | | | | 9,262 | |
| Contract liabilities | | | – | | | 5(c) | | | - | | | | 3,494 | | | | 3,494 | |
| Provisions | | | 841 | | | | | | - | | | | - | | | | 841 | |
| Deferred funding | | | – | | | 5(c) | | | - | | | | 12 | | | | 12 | |
| Deferred revenue | | | 3,494 | | | 5(c) | | | - | | | | (3,494 | ) | | | – | |
| | | | 13,597 | | | | | | - | | | | 12 | | | | 13,609 | |
| Total liabilities | | | 38,891 | | | | | | 902 | | | | (78 | ) | | | 39,715 | |
| Share capital | | | 365,923 | | | | | | | | | | | | | | 365,923 | |
| Contributed surplus | | | 19,255 | | | | | | - | | | | - | | | | 19,255 | |
| Accumulated other comprehensive loss | | | (3,623 | ) | | | | | - | | | | - | | | | (3,623 | ) |
| Deficit | | | (371,173 | ) | | 5(a)(b) | | | 292 | | | | - | | | | (370,881 | ) |
| Total equity | | | 10,382 | | | | | | 292 | | | | - | | | | 10,674 | |
| Total equity and liabilities | | $ | 49,273 | | | | | $ | 1,194 | | | | (78 | ) | | $ | 50,389 | |
2018 Consolidated Financial Statements | Page 51 |
The following adjustments were made to the amounts recognized in the consolidated balance sheets at December 31, 2017:
| | | | | | | | | | | | | | | |
| | | IAS 18 | | | | | | | | | | | IFRS 15 | |
| | | carrying
amount | | | Note | | Remeasure-
ments | | | Reclass-
ifications | | | carrying
amount | |
| Assets | | | | | | | | | | | | | | | | | | |
| Current assets | | | | | | | | | | | | | | | | | | |
| Cash and cash equivalents | | $ | 21,511 | | | | | $ | - | | | | - | | | $ | 21,511 | |
| Restricted cash | | | 435 | | | | | | - | | | | - | | | | 435 | |
| Trade and other receivables | | | 14,292 | | | 5(c) | | | - | | | | (5,556 | ) | | | 8,736 | |
| Contract assets | | | – | | | 5(a)(c) | | | 1,022 | | | | 5,556 | | | | 6,578 | |
| Inventories | | | 15,164 | | | 5(a) | | | - | | | | (116 | ) | | | 15,048 | |
| Prepaid expenses | | | 978 | | | 5(b) | | | 396 | | | | - | | | | 1,374 | |
| | | | 52,380 | | | | | | 1,418 | | | | (116 | ) | | | 53,682 | |
| Non-current assets | | | | | | | | | | | | | | | | | | |
| Restricted cash | | | 468 | | | | | | - | | | | - | | | | 468 | |
| Non-current receivables | | | 645 | | | 5(c) | | | - | | | | (645 | ) | | | – | |
| Contract assets | | | – | | | 5(c) | | | - | | | | 645 | | | | 645 | |
| Investment in joint ventures | | | 2,797 | | | | | | - | | | | - | | | | 2,797 | |
| Property, plant and equipment | | | 3,874 | | | | | | - | | | | - | | | | 3,874 | |
| Intangible assets | | | 180 | | | | | | - | | | | - | | | | 180 | |
| Goodwill | | | 4,569 | | | | | | - | | | | - | | | | 4,569 | |
| | | | 12,533 | | | | | | - | | | | - | | | | 12,533 | |
| Total assets | | $ | 64,913 | | | | | $ | 1,418 | | | | (116 | ) | | $ | 66,215 | |
| Liabilities | | | | | | | | | | | | | | | | | | |
| Current liabilities | | | | | | | | | | | | | | | | | | |
| Operating borrowings | | $ | 1,200 | | | | | $ | - | | | | - | | | $ | 1,200 | |
| Trade and other payables | | | 9,736 | | | 5(a) | | | - | | | | - | | | | 9,736 | |
| Contract liabilities | | | – | | | 5(c) | | | - | | | | 11,821 | | | | 11,821 | |
| Financial liabilities | | | 4,913 | | | | | | - | | | | - | | | | 4,913 | |
| Provisions | | | 1,174 | | | 5(a) | | | 741 | | | | (171 | ) | | | 1,744 | |
| Deferred funding | | | – | | | 5(c) | | | - | | | | 880 | | | | 880 | |
| Deferred revenue | | | 12,734 | | | 5(c) | | | - | | | | (12,734 | ) | | | – | |
| | | | 29,757 | | | | | | 741 | | | | (204 | ) | | | 30,294 | |
| Non-current liabilities | | | | | | | | | | | | | | | | | | |
| Other liabilities | | | 8,516 | | | | | | - | | | | - | | | | 8,516 | |
| Contract liabilities | | | – | | | 5(c) | | | - | | | | 2,223 | | | | 2,223 | |
| Provisions | | | 921 | | | 5(a) | | | - | | | | 55 | | | | 976 | |
| Deferred funding | | | – | | | 5(c) | | | - | | | | 33 | | | | 33 | |
| Deferred revenue | | | 2,223 | | | 5(c) | | | - | | | | (2,223 | ) | | | – | |
| | | | 11,660 | | | | | | - | | | | 88 | | | | 11,748 | |
| Total liabilities | | | 41,417 | | | | | | 741 | | | | (116 | ) | | | 42,042 | |
| Share capital | | | 387,746 | | | | | | | | | | | | | | 387,746 | |
| Contributed surplus | | | 19,885 | | | | | | - | | | | - | | | | 19,885 | |
| Accumulated other comprehensive loss | | | (1,822 | ) | | 5(a) | | | 11 | | | | - | | | | (1,811 | ) |
| Deficit | | | (382,313 | ) | | 5(a)(b) | | | 666 | | | | - | | | | (381,647 | ) |
| Total equity | | | 23,496 | | | | | | 677 | | | | - | | | | 24,173 | |
| Total equity and liabilities | | $ | 64,913 | | | | | $ | 1,418 | | | | (116 | ) | | $ | 66,215 | |
2018 Consolidated Financial Statements | Page 52 |
The following table shows the effect of the adoption of IFRS 15 on the Company’s consolidated statement of operations and comprehensive loss for the year ended December 31, 2017:
| | | | | | | | | | | | |
| | | For the year ended December 31, 2017 | |
| | | Based on IAS 18 | | | Note | | IFRS 15 Remeasurements | | | Based on IFRS 15 | |
| Revenues | | $ | 48,052 | | | 5(a) | | $ | 63 | | | $ | 48,115 | |
| Cost of sales | | | 36,632 | | | 5(a) | | | (195 | ) | | | 36,437 | |
| Gross profit | | | 11,420 | | | | | | 258 | | | | 11,678 | |
| | | | | | | | | | | | | | | |
| Operating expenses | | | | | | | | | | | | | | |
| Selling, general and administrative expenses | | | 13,742 | | | 5(b) | | | (116 | ) | | | 13,626 | |
| Research and product development expenses | | | 6,376 | | | | | | – | | | | 6,376 | |
| | | | 20,118 | | | | | | (116 | ) | | | 20,002 | |
| | | | | | | | | | | | | | – | |
| Loss from operations | | | (8,698 | ) | | | | | 374 | | | | (8,324 | ) |
| | | | | | | | | | | | | | | |
| Loss from joint ventures | | | (334 | ) | | | | | – | | | | (334 | ) |
| | | | | | | | | | | | | | | |
| Finance income (loss) | | | | | | | | | | | | | | |
| Interest expense, net on financial instruments measured at amortized cost | | | (1,812 | ) | | | | | – | | | | (1,812 | ) |
| Foreign currency gains, net(1) | | | 635 | | | | | | – | | | | 635 | |
| Other finance losses, net | | | (931 | ) | | | | | – | | | | (931 | ) |
| Finance loss, net | | | (2,108 | ) | | | | | – | | | | (2,108 | ) |
| | | | | | | | | | | | | | | |
| Loss before income taxes | | | (11,140 | ) | | | | | 374 | | | | (10,766 | ) |
| Income tax expense | | | – | | | | | | – | | | | – | |
| Net loss for the year | | | (11,140 | ) | | | | | 374 | | | | (10,766 | ) |
| | | | | | | | | | | | | | | |
| Items that will not be reclassified subsequently to net loss: | | | | | | | | | | | | | | |
| Re-measurements of actuarial liability | | | 98 | | | | | | – | | | | 98 | |
| Items that may be reclassified subsequently to net loss | | | | | | | | | | | | | | |
| Exchange differences on translating foreign operations | | | 1,703 | | | 5(a) | | | 11 | | | | 1,714 | |
| Comprehensive loss for the year | | $ | (9,339 | ) | | | | $ | 385 | | | $ | (8,954 | ) |
| | | | | | | | | | | | | | | |
| Net loss per share - basic and diluted | | $ | (0.80 | ) | | | | $ | 0.03 | | | $ | (0.77 | ) |
2018 Consolidated Financial Statements | Page 53 |
A summary of the impact of adoption of IFRS 15 is as follows:
| (a) | Installation, start-up and commissioning services |
Under IAS 18, the Company applied the revenue recognition criteria to each separate identifiable component of a single transaction. The contracts containing installation and start-up and commissioning services were accounted for as a separate element from the product sale. Costs associated with these services were accumulated in inventory and a portion of the contract revenue was deferred until the associated work was completed.
Under IFRS 15, these performance obligations are not distinct and are combined into a single performance obligation with the associated product, where the costs are insignificant in the context of the total contract and where the customer believes they are buying a final installed working product and are not buying the individual collection of products and services that when combined create the finished product. In these situations, revenue is now recorded inclusive of these immaterial performance obligations and the estimated costs to fulfill these obligations accrued for when control passes at the time of shipment of the related products. Accordingly, the Company accrued $914 in contract assets, reduced inventory by $78 and accrued $824 in provisions for future costs expected to be incurred and reduced the deficit by $12 at January 1, 2017. Similarly, the Company accrued $1,022 in contract assets, reduced inventory by $116 and accrued $625 in provisions for future costs expected to be incurred and reduced the deficit by $281 at December 31, 2017.
The restatement effect on the consolidated statements of operations and comprehensive loss for the year ended December 31, 2017 results in a $63 increase in revenue and a $195 reduction in cost of sales. The impact of these restatements on cumulative translation adjustments arising from the Company’s subsidiaries was a gain of $11.
| (b) | Sales agent commissions |
The Company incurs sales agent commissions for obtaining contracts. Under IAS18, these costs were expensed when they were earned or incurred.
Under IFRS 15, these incremental costs incurred to obtain contracts with customers are deferred for contracts expected to be delivered after more than one year and expensed as the contract is delivered. The Company deferred $280 of commissions in prepaid expenses and reduced the deficit by the same amount at January 1, 2017. Similarly, the Company deferred $396 of commissions in prepaid expenses and reduced the deficit by the same amount at December 31, 2017. The impact of these restatements on cumulative translation adjustments arising from the Company’s subsidiaries was immaterial.
The restatement effect on the consolidated statements of operations and comprehensive loss for the year ended December 31, 2017 results in a $116 decrease in selling, general and administrative expenses for commissions previously expensed. The impact of these restatements on cumulative translation adjustments arising from the Company’s subsidiaries was immaterial.
| (c) | Contract assets and liabilities |
IFRS 15 distinguishes between contract assets and receivables based on whether receipt of the consideration is conditional on something other than the passage of time. At December 31, 2017, there was $5,556 (January 1, 2017 - $4,658) of trade and other receivables outstanding where the Company’s right to consideration was not unconditional (primarily relating to revenue accrued on long term contracts). This amount has been reclassified as current and non-current contract assets under IFRS 15.
Under IFRS 15, amounts received from customers before the Company has transferred the good or service are to be presented as contract liabilities. As a result, the amounts previously presented as deferred revenue related to contracts with customers have been reclassified as contract liabilities and amounts not relating to contracts with customers have been reclassified as deferred funding.
2018 Consolidated Financial Statements | Page 54 |
The Company has elected to make use of the following practical expedients:
| • | Completed contracts under IAS 11 and IAS 18 before the date of transition have not been reassessed. |
| • | Costs incurred to obtain contracts with an amortization period of less than one year have been expensed as incurred. |
| • | For completed contract with variable consideration, the Company used the transaction price at the date of contract completion rather than estimating variable consideration amounts in the comparative reporting periods. |
| • | Consideration previously recognized was not adjusted for the effects of a significant financing component if the Company expected, at contract inception, that the period between when the Company transfers a promised good or service to the customer and when the customer pays for the good or service was one year or less. |
| • | For contracts that were modified before the date of initial application, the Company did not retrospectively restate the contract for those contract modifications. The Company reflected the aggregate effect of all of the modifications that occur before the beginning of the earliest period presented when: (i) identifying the satisfied and unsatisfied performance obligations; (ii) determining the transaction price; and (iii) allocating the transaction price to the satisfied and unsatisfied performance obligations. |
| • | The Company also applied the practical expedient not to disclose the amount of the transaction price allocated to the remaining performance obligations and an explanation of when the Company expects to recognize that amount as revenue for the year ended December 31, 2017 |
Note 6 – Accounting Standards Issued But Not Yet Applied – IFRS 16
IFRS 16 Leases (“IFRS 16”) sets out the principles for the recognition, measurement, presentation and disclosure of leases for both parties to a contract, the customer (“lessee”) and the supplier (“lessor”). This standard will replace IAS 17 Leases (“IAS 17”) and related Interpretations. IFRS 16 provides revised guidance on identifying a lease and for separating lease and non-lease components of a contract. IFRS 16 introduces a single accounting model for all lessees and requires a lessee to recognize right-of-use assets and lease liabilities for leases with terms of more than 12 months, unless the underlying asset is of low value, and depreciation of lease assets separately from interest on lease liabilities in the consolidated statement of operations and comprehensive loss. Under IFRS 16, lessor accounting for operating and finance leases will remain substantially unchanged. IFRS 16 is effective for annual periods beginning on or after January 1, 2019. The Company’s contractual obligations in the form of operating leases under IAS 17 will then be reflected on the balance sheet resulting in an increase to both assets and liabilities upon adoption of IFRS 16, and changes to the timing of recognition of expenses associated with the lease arrangements. The Company is assessing the new standard to determine the impact on its consolidated financial statements. An initial review has been completed to identify leases that will require recognition of a right-of-use asset and lease liability. The Company is currently quantifying these impacts and assessing its transition and implementation options.
Note 7 – Cash and Cash Equivalents and Restricted Cash
| | | | | | | |
| At December 31, | | 2018 | | | 2017 | |
| Cash and cash equivalents | | $ | 7,561 | | | $ | 21,511 | |
| Restricted cash | | | 935 | | | | 435 | |
| Restricted cash – non-current | | | 241 | | | | 468 | |
| Total | | $ | 8,737 | | | $ | 22,414 | |
The restricted cash is held by financial institutions in Canada and Europe as partial security for standby letters of credit and letters of guarantee. At December 31, 2018, the Company had standby letters of credit and letters of guarantee issued by several financial institutions of $2,890 (2017 – $2,821), with expiry dates extending to December 2021. See Note 19 – Lines of Credit and Bank Guarantees for additional information.
2018 Consolidated Financial Statements | Page 55 |
Note 8 – Trade and Other Receivables
| | | | | | | |
| At December 31, | | 2018 | | | 2017 | |
| | | | | | Restated (Note 5) | |
| Trade accounts receivable | | $ | 3,313 | | | $ | 6,466 | |
| Less: provision for impairment (note 35) | | | (30 | ) | | | (18 | ) |
| Net trade accounts receivable | | | 3,283 | | | | 6,448 | |
| Other receivables | | | 3,445 | | | | 2,288 | |
| Total trade and other receivables | | $ | 6,728 | | | $ | 8,736 | |
Note 9 – Contract Assets and Contract Liabilities
The Company has recognized the following assets and liabilities related to contracts with customers:
| | | | | | | | | | |
| At December 31, | | 2018 | | | 2017 | | | $ change | |
| Contract assets | | $ | 6,223 | | | $ | 7,223 | | | $ | (1,000 | ) |
| Less: non-current portion | | | (1,689 | ) | | | (645 | ) | | | (1,044 | ) |
| Current portion | | | 4,534 | | | | 6,578 | | | | (2,044 | ) |
| | | | | | | | | | | | | |
| Contract liabilities | | | 16,001 | | | | 14,044 | | | | 1,957 | |
| Less: non-current portion | | | (1,420 | ) | | | (2,223 | ) | | | 803 | |
| Current portion | | | 14,581 | | | | 11,821 | | | | 2,760 | |
| (i) | Significant changes in contract assets and liabilities |
Contract assets at December 31, 2018 includes $4,048 (2017 – $4,764) relating to receivables which are to be billed according to progress based and specified payment schedules, typical with long-term contracts. The remainder relates to the final instalment of contract price on the sale of equipment for installation and commissioning, which is not invoiced to the customer until this work is complete. The change in the contract assets balance during the period reflects the change in the timeframe for a right to consideration to become unconditional (i.e. for the contract asset to be reclassified as a receivable).
Contract liabilities represent deposits and payments received in advance from customers for license fees, product development contracts and equipment sales. The change in the contract liabilities balance during the period reflects changes in the time frame for performance obligations to be satisfied and the timing of receipt of deposits.
| (ii) | Revenue recognized in relation to contract liabilities |
Revenue recognized in the current year, included in opening contract liabilities, amounted to $7,042 (2017 - $895). There were no amounts recognized in the current year related to performance obligations that were satisfied in a prior year (2017 - $nil).
| (iii) | Unsatisfied performance obligations |
The following table shows unsatisfied performance obligations as at December 31, 2018:
| | | | | | | |
| At December 31, | | 2018 | | | 2017 | |
| OnSite Generation | | $ | 20,600 | | | $ | 19,900 | |
| Power Systems | | | 112,100 | | | | 124,700 | |
| Total | | $ | 132,700 | | | $ | 144,600 | |
The Company expects $49,000 of the balance to be recognized as revenues in 2019 and $83,700 is to be recognized beyond 12 months.
2018 Consolidated Financial Statements | Page 56 |
Note 10 – Inventories
| | | | | | | |
| At December 31, | | 2018 | | | 2017 | |
| | | | | | Restated (Note 5) | |
| Raw materials | | $ | 9,954 | | | $ | 9,708 | |
| Work-in-progress | | | 6,349 | | | | 4,750 | |
| Finished goods | | | 871 | | | | 590 | |
| Total inventories | | $ | 17,174 | | | $ | 15,048 | |
Total inventory in the table above are recorded net of provisions to write them down to net realizable value. At December 31, 2018, the inventory provision was as follows:
| | | | | | | |
| | | 2018 | | | 2017 | |
| At January 1, | | $ | 1,534 | | | $ | 1,332 | |
| Net increase in the provision | | | 834 | | | | 873 | |
| Write-downs during the year | | | (779 | ) | | | (691 | ) |
| Foreign exchange revaluation | | | 5 | | | | 20 | |
| At December 31, | | $ | 1,594 | | | $ | 1,534 | |
Note 11 – Prepaid Expenses
| | | | | | | |
| At December 31, | | 2018 | | | 2017 | |
| | | | | | Restated (Note 5) | |
| Prepaid expenses | | $ | 1,593 | | | $ | 978 | |
| Costs incurred to obtain contracts with customers | | | 367 | | | | 396 | |
| Total prepaid expenses | | $ | 1,960 | | | $ | 1,374 | |
The costs incurred to obtain contracts with customers relate to sales agent commissions, which are deferred until the related contract revenues with customers are recognized. The amount amortized to the consolidated statement of operations and comprehensive loss for the year ended December 31, 2018 was $33 (2017 - $167).
Note 12 – Investment in Joint Ventures
On March 30, 2017, the Company entered into an arrangement with Enbridge Gas Distribution (Enbridge) to form the joint venture 2562961 Ontario Ltd. to develop, construct, own and operate a 2.5 megawatts (“MW”) Power-to-Gas energy storage facility project. The Company holds a 49% equity investment in this joint venture. The Board of Directors of the joint venture has five directors consisting of three nominees from Enbridge and two nominees of Hydrogenics and all resolutions are adopted by a majority vote. The Company accounts for this joint venture using the equity method in accordance with IFRS 11, “Joint Arrangements” using the hypothetical liquidation at book value (HLBV) method due to preferential dividends and return rights of the other partner.
During 2017, the Company sold the joint venture related project assets developed as part of the 2.5MW energy storage facility project for $2,030. Hydrogenics received cash consideration of $1,035 and a 49% equity investment in the newly formed joint venture of $995. A loss on disposal of the transferred assets arose of $146, as the transfer to the joint venture was done at the historical Canadian dollar value. This loss on disposal is adjusted for in the Company’s 49% share of the loss relating to the equity interest received. It is eliminated against the investment in the joint venture and will be amortized over the life of the fixed assets. Of the loss of $146, $35 was capitalized as the cost of the equity investment. Legal costs of $93 were capitalized as they were incurred in the creation of the joint venture.
2018 Consolidated Financial Statements | Page 57 |
During 2018, the Company sold the joint venture related project assets developed as part of the 2.5MW energy storage facility project for $1,372. Hydrogenics received cash consideration of $700 and a 49% equity investment in the newly formed joint venture of $672. The Company recorded a $30 gain on sale of assets as the transfer was done at historical Canadian dollar value. This gain on sale is adjusted for the Company’s 49% share of the loss relating to the equity interest received. It is eliminated against the investment in joint venture and will be amortized over the life of the project. Of the gain of $30, $8 was capitalized and netted against the cost of the equity investment.
During 2018, the energy storage facility project was commissioned and accepted by the Independent Energy Service Operator (“IESO”). The facility began in-service operations under an IESO Regulation Services contract effective May 2018.
| | | | | | | |
| | | 2018 | | | 2017 | |
| Balance January 1, | | $ | 1,176 | | | $ | – | |
| Equity investment in joint venture | | | 664 | | | | 1,123 | |
| Loss from investment in joint venture using HLBV method | | | (76 | ) | | | – | |
| Amortization of deferred loss on disposal | | | (10 | ) | | | (9 | ) |
| Foreign currency translation (loss) gain | | | (110 | ) | | | 62 | |
| Investment in Enbridge joint venture at December 31, | | $ | 1,644 | | | $ | 1,176 | |
Summarized financial information for the joint venture, as presented in the IFRS financial statements of 2562961 Ontario Ltd. is as follows:
| | | | | | | |
| At December 31, | | 2018 | | | 2017 | |
| Assets | | | | | | | | |
| Current assets | | $ | 439 | | | $ | 1 | |
| Non-current assets | | | 3,202 | | | | 2,156 | |
| Total assets | | $ | 3,641 | | | $ | 2,157 | |
| Liabilities | | | | | | | | |
| Current liabilities | | $ | 293 | | | $ | – | |
| Total liabilities | | | 293 | | | | – | |
| Net assets | | $ | 3,348 | | | $ | 2,157 | |
| | | | | | | |
| For the year ended December 31, | | 2018 | | | 2017 | |
| Revenue | | $ | 627 | | | $ | – | |
| Earnings before income taxes | | | 71 | | | | 1 | |
| Joint venture earnings from continuing operations | | $ | 52 | | | $ | 1 | |
| | | | | | | |
| At December 31, | | 2018 | | | 2017 | |
| Opening net assets of 2562961 Ontario Ltd. (Equity Investment) | | $ | 2,157 | | | $ | – | |
| Investment in 2562961 Ontario Ltd. | | | 1,372 | | | | 2,030 | |
| Joint venture earnings during the year | | | 52 | | | | 1 | |
| Foreign currency translation | | | (233 | ) | | | 126 | |
| Closing net assets of 2562961 Ontario Ltd. | | $ | 3,348 | | | $ | 2,157 | |
| Unrealized (gains) losses on sales to 2562961 Ontario Ltd. | | | 56 | | | | 71 | |
| Adjusted net assets of 2562961 Ontario Ltd. | | | 3,404 | | | | 2,228 | |
| Company’s share of net assets using the HLBV method | | $ | 1,570 | | | $ | 1,092 | |
| Plus: capitalization of legal costs | | | 93 | | | | 93 | |
| Less: amortization of deferred loss on disposal | | | (19 | ) | | | (9 | ) |
| Investment in Enbridge joint venture at December 31 | | $ | 1,644 | | | $ | 1,176 | |
2018 Consolidated Financial Statements | Page 58 |
On May 28, 2014, the Company entered into a joint arrangement with Kolon Water & Energy Co. Ltd., whereby the parties formed the joint venture Kolon Hydrogenics to launch and market potential businesses based on products and technologies produced by Hydrogenics for the Korean market. The Company has a 49% equity position in Kolon Hydrogenics and shares joint control. The Board of Directors of the joint venture has four directors consisting of two nominees from each of Hydrogenics and Kolon Water and Energy and all resolutions are adopted by an affirmative vote of two thirds. The Company accounts for this joint venture using the equity method in accordance with IFRS 11, “Joint Arrangements”.
In June 2018, Kolon Water & Energy Co. Ltd. and the Company commenced discussions with respect to dissolving the joint arrangement. The carrying value of the assets of Kolon Hydrogenics have been reduced to their estimated net recoverable amount based upon an assessment of fair values less costs of disposal. The share in loss of the joint venture for the year reflects the Company’s proportionate share of this fair value adjustment. Discussions are ongoing to dissolve the joint venture in 2019.
| | | | | | | |
| | | 2018 | | | 2017 | |
| Balance January 1, | | $ | 1,621 | | | $ | 1,750 | |
| Share in loss of the joint venture | | | (1,561 | ) | | | (334 | ) |
| Foreign currency translation gain (loss) | | | (60 | ) | | | 205 | |
| Investment in Kolon Hydrogenics joint venture at December 31, | | $ | – | | | $ | 1,621 | |
Note 13 – Property, Plant and Equipment
| | | | | | | | | | | | | | | | | | | |
| | | Plant and test
equipment | | | Furniture and
equipment | | | Computer
hardware | | | Leasehold
improvements | | | Construction
in progress | | | Total | |
Net book value
December 31, 2017 | | $ | 183 | | | $ | 1,187 | | | $ | 204 | | | $ | 352 | | | $ | 1,948 | | | $ | 3,874 | |
| Additions | | | 155 | | | | 373 | | | | 58 | | | | 290 | | | | 125 | | | | 1,001 | |
| Disposals | | | – | | | | – | | | | (1 | ) | | | – | | | | (1,342 | ) | | | (1,343 | ) |
| Depreciation | | | (100 | ) | | | (333 | ) | | | (90 | ) | | | (117 | ) | | | – | | | | (640 | ) |
| Foreign exchange | | | (8 | ) | | | (9 | ) | | | (4 | ) | | | (4 | ) | | | – | | | | (25 | ) |
Net book value
December 31, 2018 | | $ | 230 | | | $ | 1,218 | | | $ | 167 | | | $ | 521 | | | $ | 731 | | | $ | 2,867 | |
| | | | | | | | | | | | | | | | | | | | | | | | | |
| Total cost | | $ | 3,712 | | | $ | 5,889 | | | $ | 548 | | | $ | 2,044 | | | $ | 731 | | | $ | 12,924 | |
| Total accumulated depreciation | | | (3,482 | ) | | | (4,671 | ) | | | (381 | ) | | | (1,523 | ) | | | – | | | | (10,057 | ) |
Net book value
December 31, 2018 | | $ | 230 | | | $ | 1,218 | | | $ | 167 | | | $ | 521 | | | $ | 731 | | | $ | 2,867 | |
Included in construction in progress is $Nil (2017 - $1,342) relating to capital costs to be transferred to the joint venture project with Enbridge (note 12). During the current and prior year, assets with a book value of $1,342 and $2,176 respectively were transferred to the Enbridge joint venture (notes 12 and 32).
2018 Consolidated Financial Statements | Page 59 |
Depreciation of $454 (2017 – $397) was included in selling, general and administrative expenses, $104 (2017 - $81) in research and product development expenses, and $82 (2017 – $137) in cost of sales in consolidated statement of operations and comprehensive loss.
| | | | | | | | | | | | | | | | | | | |
| | | Plant and test
equipment | | | Furniture and
equipment | | | Computer
hardware | | | Leasehold
improvements | | | Construction
in progress | | | Total | |
Net book value
December 31, 2016 | | $ | 214 | | | $ | 1,270 | | | $ | 182 | | | $ | 308 | | | $ | 2,121 | | | $ | 4,095 | |
| Additions | | | 55 | | | | 233 | | | | 91 | | | | 117 | | | | 2,003 | | | | 2,499 | |
| Disposals | | | (11 | ) | | | – | | | | (2 | ) | | | – | | | | (2,176 | ) | | | (2,189 | ) |
| Depreciation | | | (104 | ) | | | (338 | ) | | | (97 | ) | | | (76 | ) | | | – | | | | (615 | ) |
| Foreign exchange | | | 29 | | | | 22 | | | | 30 | | | | 3 | | | | – | | | | 84 | |
Net book value
December 31, 2017 | | $ | 183 | | | $ | 1,187 | | | $ | 204 | | | $ | 352 | | | $ | 1,948 | | | $ | 3,874 | |
| | | | | | | | | | | | | | | | | | | | | | | | | |
| Total cost | | $ | 3,604 | | | $ | 5,648 | | | $ | 558 | | | $ | 1,777 | | | $ | 1,948 | | | $ | 13,535 | |
| Total accumulated depreciation | | | (3,421 | ) | | | (4,461 | ) | | | (354 | ) | | | (1,425 | ) | | | – | | | | (9,661 | ) |
Net book value
December 31, 2017 | | $ | 183 | | | $ | 1,187 | | | $ | 204 | | | $ | 352 | | | $ | 1,948 | | | $ | 3,874 | |
Note 14 – Intangible Assets
| | | | | | | |
| Computer software | | 2018 | | | 2017 | |
| Net book value January 1, | | $ | 180 | | | $ | 203 | |
| Additions | | | 125 | | | | 25 | |
| Amortization | | | (66 | ) | | | (57 | ) |
| Foreign exchange | | | (7 | ) | | | 9 | |
| Net book value December 31, | | $ | 232 | | | $ | 180 | |
| | | | | | | | | |
| Total cost | | $ | 2,158 | | | $ | 2,043 | |
| Total accumulated depreciation | | | (1,926 | ) | | | (1,863 | ) |
| Net book value December 31, | | $ | 232 | | | $ | 180 | |
Amortization of $66 (2017 – $57) is included in the consolidated statements of operations and comprehensive loss in selling, general and administrative expenses.
Note 15 – Goodwill
The carrying amounts of goodwill at the beginning and end of the current and previous years are set out below.
| | | | | | | |
| | | 2018 | | | 2017 | |
| At January 1, | | $ | 4,569 | | | $ | 4,019 | |
| Foreign exchange revaluation | | | (210 | ) | | | 550 | |
| At December 31, | | $ | 4,359 | | | $ | 4,569 | |
The goodwill relates to the Company's OnSite Generation business CGU. The Company performs its annual impairment test as of September 30.
In estimating the recoverable amount of this CGU, the Company first used an income approach, discounting its future estimated cash flows for Q4 2018 and a five-year forecast period, starting with the approved 2019 budget, and discounted those projected cash flows at a rate of return that reflects the relative risks of achieving those cash flows. To this amount, the Company added the present value of a terminal value, determined by applying a capitalization rate to the expected annual cash flows to be generated beyond the forecast period, and the present value of the tax shield from existing tax loss carryforwards to determine an estimated enterprise value. The resulting enterprise value was then adjusted for redundant assets, interest bearing debt and debt equivalents and estimated costs to sell to determine an estimated fair value less cost to sell.
2018 Consolidated Financial Statements | Page 60 |
Discounted cash flows over the forecast period used a five-year revenue compound annual growth rate (CAGR) of approximately 30% (2017 – 20%) and a perpetual growth rate of 2% (2017 – 2%) thereafter. The five-year revenue CAGR used in the discounted cash flows calculations differs from past experience. Management has determined the five-year revenue CAGR based on expectations for future growth in demand for hydrogen generation products in our core markets; notably, multimegawatt Power-to-Gas and hydrogen refueling opportunities, the impact of recently launched and to be launched solutions, as well as its current backlog. Gross direct margins (excluding indirect overheads) are projected to decline from 29% to 24.5% (2017 – 29% fixed) throughout the forecast period reflecting management’s expectation of competitive pressure on margins to achieve a 30% CAGR. Selling, general and administrative expenses and indirect manufacturing overheads are projected to increase at approximately 5% (2017 – 3%) per year after the 2018 period. Research and development costs (net of grants) are anticipated to increase in 2019 and 2020 and then return to historic levels of less than $1.5 million per year thereafter. Working capital requirements were estimated to approximate 10% (2017 – 15%) of annual sales throughout the forecast period. Using a weighted cost of capital approach, the Company applied a discount rate of 11.6% (2017 – 15.5%) to determine the present value of the projected cash flows and then deducted 1.25% (2017 - 3%) for estimated costs to sell.
The Company supplemented the discounted cash flow analysis by considering transactions multiples over the past five years and current trading multiples for broadly comparable public company businesses with similar operations within the same industry to the resulting sales multiple of the OnSite CGU from the discounted cashflow approach (1.2 times (2017 – 2.2) trailing 12 months revenues) which was within the low end of the range due the significantly smaller size of the Company’s operations relative to some of these public companies comparables.
The sales and operations of the OnSite Generation CGU constitutes approximately half of the Company’s current sales and operations. Accordingly, the Company also compared the enterprise value of the OnSite Generation CGU against the Company’s overall market capitalization and the implied valuation of its Power Systems CGU and the respective revenue multiples. The revenue multiple for the Company as a whole was 2.5 times (2017 - 3.1) trailing 12 months revenues, the implied revenue multiple for the Power Systems CGU was 4.5 times (2017 - 3.8) trailing 12 months revenue and the implied revenue multiple for the OnSite Generation CGU was 1.2 times (2017 - 2.2) trailing 12 months revenue. Management believes all of these multiples are within the low end of the range when compared to multiples of broadly comparable public companies in the hydrogen fuel cell industry.
As the valuation techniques used by the Company require the use of unobservable inputs, the recoverable amount of the Company’s OnSite Generation CGU is classified within Level 3 of the fair value hierarchy.
No impairment charges arose as a result of the reviews in either 2018 or 2017. Reasonably possible changes in key assumptions in the discounted cash flow approach would not cause the recoverable amount of the OnSite Generation CGU to fall below its carrying value. The recoverable amount would equal its carrying value if a revenue multiple of 0.5 times (2017 - 0.3) revenue was used.
2018 Consolidated Financial Statements | Page 61 |
Note 16 – Trade and Other Payables
Accounts payable and accrued liabilities are as follows:
| | | | | | | |
| At December 31, | | 2018 | | | 2017 | |
| Trade accounts payable | | $ | 3,952 | | | $ | 4,612 | |
| Accrued payroll and related compensation | | | 2,292 | | | | 2,645 | |
| Supplier accruals | | | 2,584 | | | | 2,126 | |
| Accrued professional fees | | | 206 | | | | 224 | |
| Other | | | 34 | | | | 129 | |
| Total accounts payable and accrued liabilities | | $ | 9,068 | | | $ | 9,736 | |
Note 17 – Financial Liabilities
Financial liabilities are as follows:
| | | | | | | |
| At December 31, | | 2018 | | | 2017 | |
| Current portion of long-term debt – Export Development Canada (note 20) | | $ | 1,983 | | | $ | 2,470 | |
| Current portion of long-term debt – Province of Ontario (note 20) | | | 628 | | | | 622 | |
| Warrants | | | 11 | | | | 409 | |
| Deferred share unit liability (note 22) | | | 730 | | | | 1,406 | |
| Current portion of capital lease (note 20) | | | 7 | | | | 6 | |
| Total financial liabilities | | $ | 3,359 | | | $ | 4,913 | |
Warrants
On November 4, 2016, concurrent with a new loan agreement with Export Development Canada (“EDC”), the Company issued 200,575 share purchase warrants. Each warrant was exercisable for one common share of the Company at an exercise price of US$6.85 per common share. The warrants were transferrable and were scheduled to expire on November 4, 2021. The proceeds of the loan (net of transaction costs) were allocated between the fair value of the warrant liability and the debt. These warrants include anti-dilution provisions, and as a result were accounted for as a financial liability with changes in fair value reflected in the consolidated statements of operations and comprehensive loss. These warrants were exercised on December 1, 2017 for cash proceeds of $1,374 which together with the associated warrant liability of $592 are reflected in the statements of changes in equity.
On May 8, 2015, concurrent with a new loan agreement with a syndicate of lenders, the Company issued 250,000 share purchase warrants. Each warrant was exercisable for one common share of the Company at an exercise price of US$15.00 per common share. The warrants are non-transferrable and expire on May 6, 2019. As a result of this issuance, the fair market value of these warrants of $885 was included in other finance (losses) gains. These warrants include anti-dilution provisions, and as a result are accounted for as a financial liability with changes in fair value reflected in the consolidated statements of operations and comprehensive loss. On December 16, 2015, as a result of the public offering, the exercise price of the warrants was reduced to US$10.85 per common share.
The fair value of the outstanding warrants was determined using the Black-Scholes option pricing model with the following weighted average assumptions:
| | | | | | | |
| At December 31, | | 2018 | | | 2017 | |
| Risk-free interest rate (%) | | | 1.86 | % | | | 1.68 | % |
| Expected volatility (%) | | | 60.1 | % | | | 55.3 | % |
| Expected life in years | | | 0.35 | | | | 0.38 | |
| Expected dividend | | | Nil | | | | Nil | |
2018 Consolidated Financial Statements | Page 62 |
Note 18 – Provisions
Changes in the Company’s aggregate provisions are as follows:
| | | | | | | | | | |
| | | Warranty | | | Startup and commissioning | | | Total | |
| At January 1, | | $ | 2,095 | | | $ | 625 | | | $ | 2,720 | |
| Additional provisions | | | 1,994 | | | | 726 | | | | 2,720 | |
| Utilized during the year | | | (906 | ) | | | (784 | ) | | | (1,690 | ) |
| Unused amounts reversed | | | (781 | ) | | | (12 | ) | | | (793 | ) |
| Foreign currency translation | | | (75 | ) | | | (31 | ) | | | (106 | ) |
| Total provision at December 31, 2018 | | | 2,327 | | | | 524 | | | | 2,851 | |
| Less current portion | | | (1,636 | ) | | | (405 | ) | | | (2,041 | ) |
| Long-term provision at December 31, 2018 | | $ | 691 | | | $ | 119 | | | $ | 810 | |
| | | | | | | | | | |
| | | Warranty | | | Startup and commissioning | | | Total
Restated (Note 5) | |
| At January 1, | | $ | 2,062 | | | $ | 824 | | | $ | 2,886 | |
| Additional provisions | | | 1,192 | | | | 1,087 | | | | 2,279 | |
| Utilized during the year | | | (639 | ) | | | (1,358 | ) | | | (1,997 | ) |
| Unused amounts reversed | | | (734 | ) | | | – | | | | (734 | ) |
| Foreign currency translation | | | 214 | | | | 72 | | | | 286 | |
| Total provision at December 31, 2017 | | | 2,095 | | | | 625 | | | | 2,720 | |
| Less current portion | | | (1,174 | ) | | | (570 | ) | | | (1,744 | ) |
| Long-term provision at December 31, 2017 | | $ | 921 | | | $ | 55 | | | $ | 976 | |
Note 19 – Lines of Credit and Bank Guarantees
At December 31, 2018, the Company’s subsidiary in Belgium (the “Borrower”) had a joint credit and operating line facility of €7,000 (the “Credit Facility”), which renews annually in April upon review. Under the Credit Facility, the Borrower may borrow up to a maximum of 75% of the value of awarded sales contracts, approved by the Belgian financial institution, to a maximum of €500; and may also borrow up to €1,500 for general business purposes, provided sufficient limit exists under the overall facility limit of €7,000. Of the €7,000 facility, €2,175 or approximately $2,491 was drawn as standby letters of credit and bank guarantees and €Nil was drawn as an operating line. At December 31, 2018, the Company had availability of €6,321 or approximately $7,234 (December 31, 2017 – $4,377) under the Credit Facility totaling €4,321, or approximately $4,945, for use as letters of credit and bank guarantees and totaling €2,000, or approximately $2,289, as an operating line.
The Credit Facility bears interest at EURIBOR plus 1.45% per annum and is secured by a €1,000 secured first charge covering all assets of the Borrower. The credit facility contains a negative pledge precluding the Borrower from providing security over its assets. Additionally, the Borrower is required to maintain a solvency covenant, defined as equity plus current account (intercompany account with the parent company), divided by total liabilities of not less than 25% and ensure that its intercompany accounts with parent company do not fall below a defined level. At December 31, 2018, the Borrower was in compliance with these covenants.
At December 31, 2018, the Company also had a Canadian credit facility of $2,199 with no expiration date for use only as letters of credit and bank guarantees. At December 31, 2018, $399 was drawn as standby letters of credit and bank guarantees. At December 31, 2018, the Company had $1,800 (December 31, 2017 – $2,391) available under this facility.
These letters of credit and bank guarantees relate primarily to obligations in connection with the terms and conditions of the Company’s sales contracts. The standby letters of credit and letters of guarantee may be drawn on by the customer if the Company fails to perform its obligations under the sales contracts.
2018 Consolidated Financial Statements | Page 63 |
Note 20 – Other Non-current Liabilities
Other non-current liabilities are as follows:
| | | | | | | |
| At December 31, | | 2018 | | | 2017 | |
| Long-term debt – Export Development Canada (i) | | $ | 5,958 | | | $ | 8,344 | |
| Long-term debt – Province of Ontario (ii) | | | 2,091 | | | | 2,896 | |
| Non-current post-retirement benefit liabilities (iii) | | | 247 | | | | 330 | |
| Capital lease | | | 33 | | | | 44 | |
| Total | | | 8,329 | | | | 11,614 | |
| Less current portion of long-term debt – EDC (note 17) | | | (1,983 | ) | | | (2,470 | ) |
| Less current portion of long-term debt – Province of Ontario (note 17) | | | (628 | ) | | | (622 | ) |
| Less current portion of capital lease (note 17) | | | (7 | ) | | | (6 | ) |
| Total other non-current liabilities | | $ | 5,711 | | | $ | 8,516 | |
| (i) | Long-term debt – Export Development Canada (“EDC”) |
In the fourth quarter of 2016, the Company entered into a loan agreement with EDC for a five-year facility of $9,000.
The loan is structured as a five-year term loan with quarterly interest payments calculated at an annual interest rate of U.S. prime plus 10%, declining to U.S. prime plus 5% to 7% if certain annual earnings before interest, taxes, depreciation and amortization thresholds are met. The loan is secured by a second charge over the assets located within Canada. Commencing March 31, 2017, the loan principal is subject to four quarterly repayments of $250 followed by 16 quarterly repayments of $500. There is an option to prepay a portion of, or the entire loan at any time, subsequent to March 31, 2017.
The amortized cost of this loan at December 31, 2018 was $5,958 (December 31, 2017 – $8,344). Total interest expense for the year ended December 31, 2018 was $1,133 (December 31, 2017 – $1,306). For the year ended December 31, 2018, accretion of deferred financing fees of $57 has been included in interest expense (December 31, 2017 – $102).
The change in carrying value of this liability was as follows:
| | | | | | | |
| | | 2018 | | | 2017 | |
| At January 1, | | $ | 8,344 | | | $ | 8,625 | |
| Principal repayments during the year | | | (2,250 | ) | | | (750 | ) |
| Interest payments during the year | | | (1,370 | ) | | | (1,093 | ) |
| Interest accretion during the year | | | 1,133 | | | | 1,306 | |
| Revaluation of variable rate long-term debt (note 28) | | | 101 | | | | 256 | |
| At December 31, | | $ | 5,958 | | | $ | 8,344 | |
| (ii) | Long-term debt – Province of Ontario |
In 2011, the Company entered into a loan agreement with the Province of Ontario’s Ministry of Economic Development and Trade, Strategic Jobs and Investment Fund for funding up to C$6,000. Each draw on the loan is calculated based on 50% of eligible costs to a maximum of C$1,500 per disbursement. Eligible costs had to be incurred between October 1, 2010 and September 30, 2015.
After this five-year period, the loan bears interest at a rate of 3.67% and will require repayment at a rate of 20% per year of the outstanding balance for the five years subsequent to the sixth anniversary of the first disbursement. There is no availability remaining under this facility at December 31, 2018.
The loan is collateralized by a general security agreement covering assets of Hydrogenics Corporation. Additionally, the Corporation is required to maintain a minimum balance of cash in Canadian dollars in a Canadian financial institution at all times. The Company was in compliance with this covenant at December 31, 2018.
2018 Consolidated Financial Statements | Page 64 |
The change in carrying value of this liability was as follows:
| | | | | | | |
| | | 2018 | | | 2017 | |
| At January 1, | | $ | 2,896 | | | $ | 3,239 | |
| Principal repayments during the year | | | (870 | ) | | | (888 | ) |
| Interest payments during the year | | | (128 | ) | | | (181 | ) |
| Interest accretion during the year | | | 416 | | | | 503 | |
| Foreign currency translation | | | (223 | ) | | | 223 | |
| At December 31, | | $ | 2,091 | | | $ | 2,896 | |
| (iii) | Post-retirement benefit liabilities |
The liability relates to defined contribution pension plans in Belgium and is payable in euros. Applicable law states that in the context of defined contribution plans, the employer must guarantee a minimum return of 3.75% on employee contributions and 3.25% on employer contributions. The minimum guaranteed return for defined contributions plans in Belgium results in the employer being exposed to financial risk for the legal obligation to pay further contributions if the fund does not hold sufficient assets to meet the minimum guaranteed return.
The change in carrying value of this liability was as follows:
| | | | | | | |
| | | 2018 | | | 2017 | |
| At January 1, | | $ | 330 | | | $ | 377 | |
| Current service and net interest cost | | | 122 | | | | 153 | |
| Employer contributions in the year | | | (122 | ) | | | (153 | ) |
| Re-measurement of actuarial liability | | | (70 | ) | | | (99 | ) |
| Foreign currency translation | | | (13 | ) | | | 52 | |
| At December 31, | | $ | 247 | | | $ | 330 | |
| | | | | | | |
| | | 2018 | | | 2017 | |
| Plan assets | | $ | 1,777 | | | $ | 1,716 | |
| Accrued benefit obligation | | | (2,024 | ) | | | (2,046 | ) |
| Net defined benefit obligation | | $ | (247 | ) | | $ | (330 | ) |
The Company has estimated the post-retirement benefit liabilities of $247 at December 31, 2018, using an actuarial measurement.
2018 Consolidated Financial Statements | Page 65 |
Note 21 – Share Capital
Common shares
The authorized share capital of the Company consists of an unlimited number of common shares, with no par value, and an unlimited number of preferred shares in series, with no par value.
| | | | | | | | | | | | | |
| | | 2018 | | | 2017 | |
| | | Number | | | Amount | | | Number | | | Amount | |
| Balance at January 1, | | | 15,436,879 | | | $ | 387,746 | | | | 12,544,960 | | | $ | 365,923 | |
| Adjustment for partial shares on share consolidation | | | – | | | | – | | | | (1 | ) | | | – | |
| Issuance of common shares | | | – | | | | – | | | | 2,682,742 | | | | 19,725 | |
| Warrants exercised (note 17) | | | – | | | | – | | | | 200,575 | | | | 1,966 | |
Issuance of common shares on vesting
of performance share units (note 22) | | | 4,204 | | | | 96 | | | | 4,203 | | | | 96 | |
Issuance of common shares on exercise
of stock options (note 22) | | | 6,400 | | | | 69 | | | | 4,400 | | | | 36 | |
| At December 31, | | | 15,447,483 | | | $ | 387,911 | | | | 15,436,879 | | | $ | 387,746 | |
Common share issuance
On April 28, 2017, the Company and Fuzhou Bonded Zone Hejili Equity Investment Limited Partnership (“Hejili”) entered into a subscription agreement to issue 2,682,742 common shares of Hydrogenics to Hejili on a private placement basis, for gross proceeds to Hydrogenics of $21,000 or approximately $7.83 per common share. The subscription price represented a 10% premium to the 20-day volume-weighted average trading price of the Company’s common shares on the NASDAQ for the period ending April 27, 2017.
The transaction closed on June 27, 2017 and the Company received net proceeds of $19,725 after underwriting fees and expenses of $1,275. Subsequent to closing of the private placement, Hejili’s interest in Hydrogenics was approximately 17.6% of total issued common shares.
The subscription agreement provides, among other things, that Hejili has participation rights on future offerings and the right to nominate one director to the board of directors of Hydrogenics, and that Hejili will be subject to certain restrictions, including lock-up, transfer and voting restrictions, subject, in each case, to certain ownership threshold requirements. The subscription agreement also provides that Hejili will cooperate with Hydrogenics to jointly develop the Chinese market for hydrogen, energy storage and fuel cell products.
Note 22 – Stock-Based Compensation
Under the Hydrogenics Omnibus Incentive Plan adopted in 2012, the Corporation may issue stock options, RSUs and PSUs to employees, directors and consultants as part of a long-term incentive plan. Stock options were previously granted under the Corporation’s Stock Option Plan.
Under the Company’s previous Stock Option Plan, 234,976 stock options were outstanding at December 31, 2018. No further stock options may be issued under the Corporation’s Stock Option Plan.
Effective May 11, 2018, the Company amended the Omnibus Incentive Plan to increase the number of shares available for issuance to 1,308,032 from 1,002,069. The shareholders’ resolution was passed on May 11, 2018.
Of the 1,308,032 shares available under the Omnibus Incentive Plan, to be issued as stock options, RSUs and PSUs, 618,113 have been granted as stock options, 202,707 have been granted as RSUs and were outstanding at December 31, 2018. In addition, 12,609 previously issued PSU’s had fully vested as of December 31, 2018. The Corporation has 474,603 of share units available for issue as stock options, RSUs and PSUs under the Omnibus Incentive Plan at December 31, 2018.
2018 Consolidated Financial Statements | Page 66 |
Stock options
A summary of the Company’s stock option plan is as follows:
| | | | | | | | | | | | | |
| | | 2018 | | | 2017 | |
| | | | | | Weighted | | | | | | Weighted | |
| | | | | | average | | | | | | average | |
| | | Number of | | | exercise price | | | Number of | | | exercise price | |
| | | shares | | | C$ | | | shares | | | C$ | |
| Balance at January 1, | | | 762,173 | | | $ | 7.99 | | | | 628,636 | | | $ | 7.97 | |
| Granted | | | 111,621 | | | | 11.23 | | | | 141,268 | | | | 8.56 | |
| Exercised | | | (6,400 | ) | | | 8.05 | | | | (4,400 | ) | | | 6.22 | |
| Forfeited | | | (9,280 | ) | | | 13.25 | | | | – | | | | – | |
| Expired | | | (5,025 | ) | | | 10.44 | | | | (3,331 | ) | | | 29.25 | |
| At December 31, | | | 853,089 | | | $ | 8.37 | | | | 762,173 | | | $ | 7.99 | |
During the year ended December 31, 2018, 6,400 (2017 – 4,400) stock options were exercised resulting in cash proceeds of $40 (2017 – $20), an increase in equity of $69 (2017 – $36) with an offset to contributed surplus of $29 (2017 – $16).
During the year ended December 31, 2018, 111,621 (2017 – 141,268) stock options were granted with an average fair value of C$11.23 per option (2017 – $8.56). All options are for a term of ten years from the date of grant and vest over four years unless otherwise determined by the Board of Directors. The fair value of the stock options was determined using the Black-Scholes option pricing model with the following weighted average assumptions:
| | | | | | | |
| | | 2018 | | | 2017 | |
| Risk-free interest rate | | | 2.12 | % | | | 1.34 | % |
| Expected volatility | | | 64.3 | % | | | 64.6 | % |
| Expected life in years | | | 7 | | | | 6 | |
| Expected dividend | | | Nil | | | | Nil | |
Expected volatility was determined using the historical volatility for the Company’s share price for the seven years prior to the date of grant, as this is the expected life of the stock options.
Stock-based compensation expense for the year ended December 31, 2018, related to stock options, was $539 (2017 – $444) and was included in selling, general and administrative expenses with an offsetting increase to contributed surplus.
2018 Consolidated Financial Statements | Page 67 |
The following table summarizes information about the Company’s stock options as of December 31, 2018:
| | | | | | | | | | | | | | | | | | | | | |
| Grant date | | Expiry date | | Total
number
of options | | | Weighted
average
remaining
contractual
life (in
years) | | | Exercise
Price
C$ | | | Number
of vested
options | | | Weighted
average
remaining
contractual
life (in
years) | | | Exercise
Price
C$ | |
| March 27, 2009 | | March 27, 2019 | | | 5,284 | | | | 0.24 | | | | 13.25 | | | | 5,284 | | | | 0.24 | | | $ | 13.25 | |
| April 6, 2010 | | April 5, 2020 | | | 19,787 | | | | 1.26 | | | | 4.91 | | | | 19,787 | | | | 1.26 | | | | 4.91 | |
| March 31, 2011 | | March 31, 2021 | | | 83,000 | | | | 2.25 | | | | 6.96 | | | | 83,000 | | | | 2.25 | | | | 6.96 | |
| June 8, 2011 | | June 8, 2021 | | | 126,905 | | | | 2.44 | | | | 5.03 | | | | 126,905 | | | | 2.44 | | | | 5.03 | |
| May 10, 2012 | | May 11, 2022 | | | 157,871 | | | | 3.36 | | | | 6.25 | | | | 157,871 | | | | 3.36 | | | | 6.25 | |
| November 19, 2012 | | November 19, 2022 | | | 39,476 | | | | 3.89 | | | | 6.60 | | | | 39,476 | | | | 3.89 | | | | 6.60 | |
| March 21, 2013 | | March 21, 2023 | | | 15,000 | | | | 4.22 | | | | 8.10 | | | | 15,000 | | | | 4.22 | | | | 8.10 | |
| March 26, 2015 | | March 25, 2025 | | | 56,821 | | | | 6.23 | | | | 16.14 | | | | 42,616 | | | | 6.23 | | | | 16.14 | |
| March 30, 2016 | | March 31, 2026 | | | 96,056 | | | | 7.25 | | | | 10.53 | | | | 48,028 | | | | 7.25 | | | | 10.53 | |
| March 14, 2017 | | March 14, 2027 | | | 141,268 | | | | 8.20 | | | | 8.56 | | | | 35,317 | | | | 8.20 | | | | 8.56 | |
| March 13, 2018 | | March 13, 2028 | | | 90,836 | | | | 9.20 | | | | 11.41 | | | | – | | | | 9.20 | | | | 11.41 | |
| June 1, 2018 | | June 1, 2028 | | | 20,785 | | | | 9.42 | | | | 10.45 | | | | – | | | | 9.42 | | | | 10.45 | |
| | | | | | 853,089 | | | | 5.29 | | | $ | 8.37 | | | | 573,284 | | | | 5.29 | | | $ | 8.37 | |
Performance Share Units (“PSUs”)
Under the Hydrogenics Omnibus Incentive Plan adopted in 2012, the Company may issue performance based share units to employees, directors and consultants. Pursuant to the Hydrogenics Omnibus Incentive Plan, participants may be granted a portion of their long-term incentive plan in the form of PSUs instead of RSUs and stock options. A PSU is a unit, equivalent in value to a common share of the Company. Each PSU entitles the participant to receive a cash payment or common shares, at the option of the Company. The fair value of the PSUs is recognized as a compensation expense and is pro-rated over the expected vesting period with the offsetting increase to contributed surplus. Fair value is calculated as the market value of the common share at the date of grant. Each PSU is subject to vesting performance conditions. The Company estimates the length of the expected vesting period at the grant date, based on the most likely outcome of the performance conditions. The Company will revise its estimate of the length of the vesting period, if necessary, if subsequent information indicates that the length of the vesting period differs from previous estimates and any change to compensation cost will be recognized in the period in which the revised estimate is made. Forfeitures are estimated at the grant date and are revised to reflect a change in expected or actual forfeitures. The expiry date of PSUs granted is five years from the date of award.
A summary of the Company’s PSU activity is as follows:
| | | | | | | |
| | | 2018 | | | 2017 | |
| Balance at January 1, | | | 191,366 | | | | 195,569 | |
| Expired | | | (187,162 | ) | | | – | |
| Vested – share issuance | | | (4,204 | ) | | | (4,203 | ) |
| At December 31, | | | – | | | | 191,366 | |
Stock-based compensation expense for the year ended December 31, 2018, related to PSUs, was $6 (2017 – $31) and was included in selling, general and administrative expenses with an offsetting increase to contributed surplus.
2018 Consolidated Financial Statements | Page 68 |
Equity-settled Restricted Share Units (“RSUs”)
An RSU is a unit equivalent in value to a common share of the Company. The RSUs will be settled by issuance of shares in the Company. The cost of the Company’s RSUs is determined using the cliff vesting method and is charged to selling, general and administrative expenses. RSUs vest three years from grant date. The fair value of each grant of RSUs is the fair value of the Company’s share price on the date of grant. The resulting compensation expense, included in selling, general and administrative expenses, is based on the fair value of the awards granted is charged to income over the period the employees unconditionally become entitled to the award, with a corresponding increase to contributed surplus.
A summary of the Company’s RSU activity is as follows:
| | | | | | | |
| | | 2018 | | | 2017 | |
| Balance at January 1, | | | 133,184 | | | | 52,483 | |
| RSUs issued | | | 69,523 | | | | 80,701 | |
| At December 31, | | | 202,707 | | | | 133,184 | |
Stock-based compensation expense for the year ended December 31, 2018, related to RSUs, was $412 (2017 – $267) and was included in selling, general and administrative expenses with an offsetting increase to contributed surplus.
Deferred Share Units (“DSUs”)
The Company has a deferred share unit plan for directors. Pursuant to the DSU Plan, non-employee directors are entitled to receive all or any portion of their annual cash retainer and meeting fees in the form of DSUs instead of cash. A DSU is a unit, equivalent in value to a common share of the Company. Each DSU entitles the participant to receive a cash payment upon termination of directorship, valued at the price of the Company’s common shares on the TSX on the date of termination. Compensation cost for DSUs granted under the DSU plan is recorded as an expense with a corresponding increase in accrued liabilities and is measured at fair value. The DSU liability is marked-to-market each reporting period with the offset recorded in selling, general and administrative expenses.
A summary of the Company’s DSU activity is as follows:
| | | | | | | | | | | | | |
| | | 2018 | | | 2017 | |
| | | Number | | | Amount | | | Number | | | Amount | |
| Balance at January 1, | | | 125,949 | | | $ | 1,406 | | | | 106,506 | | | $ | 456 | |
| DSU compensation expense | | | 21,222 | | | | 145 | | | | 20,277 | | | | 174 | |
| DSU cancellation | | | – | | | | – | | | | (834 | ) | | | (9 | ) |
| DSU fair value adjustments | | | – | | | | (821 | ) | | | – | | | | 785 | |
| At December 31, | | | 147,171 | | | $ | 730 | | | | 125,949 | | | $ | 1,406 | |
For the year ended December 31, 2018, the Company recognized $145 (2017 – $165) as expense for the issue of new DSUs (net of cancellations) and a recovery of $821 (2017 – expense of $785) for the mark-to-market adjustment on the liability.
The DSU liability at December 31, 2018 of $730 (2017 – $1,406) was included in financial liabilities. DSUs vest immediately on the date of issuance.
2018 Consolidated Financial Statements | Page 69 |
Summary of stock-based compensation expense (recovery)
| | | | | | | |
| Years ended December 31, | | 2018 | | | 2017 | |
| Stock-based compensation expense - stock options | | $ | 539 | | | $ | 444 | |
| Stock-based compensation expense - PSU | | | 6 | | | | 31 | |
| Stock-based compensation expense - RSU (equity-settled) | | | 412 | | | | 267 | |
| Subtotal stock based compensation expense | | | 957 | | | | 742 | |
| DSU - new issuance (net of cancellations) | | | 145 | | | | 165 | |
| DSU - mark-to-market adjustment | | | (821 | ) | | | 785 | |
| Subtotal stock-based compensation expense - DSU | | | (676 | ) | | | 950 | |
| Total | | $ | 281 | | | $ | 1,692 | |
Note 23 – Selling, General and Administrative Expenses
| | | | | | | |
| Year ended December 31, | | 2018 | | | 2017 | |
| | | | | | Restated (Note 5) | |
| Salaries and benefits, office administration and other expenses | | $ | 10,812 | | | $ | 11,480 | |
| Depreciation (note 13) | | | 454 | | | | 397 | |
| Amortization (note 14) | | | 66 | | | | 57 | |
| Stock-based compensation - stock options, PSU and RSU (note 22) | | | 957 | | | | 742 | |
| Stock-based compensation - DSU (note 22) | | | (676 | ) | | | 950 | |
| Total | | $ | 11,613 | | | $ | 13,626 | |
Note 24 – Research and Product Development Expenses
Research and product development expenses are recorded net of non-repayable third-party program funding received or receivable. For the years ended December 31, 2018 and 2017, research and product development expenses and non-repayable program funding, which have been received or receivable, are as follows:
| | | | | | | |
| Year ended December 31, | | 2018 | | | 2017 | |
| Research and product development expenses | | $ | 12,023 | | | $ | 8,812 | |
| Government research and product development funding | | | (4,537 | ) | | | (2,436 | ) |
| Total | | $ | 7,486 | | | $ | 6,376 | |
Note 25 – Key Management Compensation
Key management includes the Company’s directors and key executive members.
| | | | | | | |
| Year ended December 31, | | 2018 | | | 2017 | |
| Salaries and short-term employee benefits | | $ | 2,286 | | | $ | 1,873 | |
| Stock-based compensation | | | | | | | | |
| DSUs | | | 145 | | | | 165 | |
| Stock options | | | 598 | | | | 561 | |
| RSUs | | | 601 | | | | 533 | |
| PSUs | | | 30 | | | | – | |
| Total | | $ | 3,660 | | | $ | 3,132 | |
Stock-based compensation represents fair value of amounts granted during the year.
2018 Consolidated Financial Statements | Page 70 |
Note 26 – Expenses by Nature
The following expenses are included in cost of sales; selling, general and administrative expenses; and gross research and product development expenses.
| | | | | | | |
| Year ended December 31, | | 2018 | | | 2017 | |
| | | | | | Restated (Note 5) | |
| Raw materials and consumables used | | $ | 23,162 | | | $ | 32,818 | |
| Employee benefits (note 27) | | | 17,857 | | | | 18,497 | |
| Facilities | | | 2,942 | | | | 2,683 | |
| Professional services | | | 1,311 | | | | 1,220 | |
| Depreciation and amortization (note 13, 14) | | | 706 | | | | 672 | |
| Shareholder and other corporate communications | | | 395 | | | | 479 | |
| Insurance | | | 502 | | | | 504 | |
| Marketing | | | 581 | | | | 499 | |
| Other | | | 1,351 | | | | 1,503 | |
| Total | | $ | 48,807 | | | $ | 58,875 | |
Note 27 – Employee Benefits Expense
The following employee benefits expenses are included in cost of sales; selling, general and administrative expenses and research and development expenses.
| | | | | | | |
| Year ended December 31, | | 2018 | | | 2017 | |
| | | | | | Restated (Note 5) | |
| Salaries and wages | | $ | 16,461 | | | $ | 15,790 | |
| Stock-based compensation (including equity-settled RSUs & PSUs), (note 22) | | | 957 | | | | 742 | |
| Medical, dental and insurance | | | 415 | | | | 346 | |
| Pension costs | | | 326 | | | | 270 | |
| Stock-based compensation – DSUs (note 22) | | | (676 | ) | | | 950 | |
| Other | | | 374 | | | | 399 | |
| Total | | $ | 17,857 | | | $ | 18,497 | |
Note 28 – Other Finance Gains and Losses, Net
Components of other finance gains and losses, net are as follows:
| | | | | | | |
| Year ended December 31, | | 2018 | | | 2017 | |
| Revaluation of variable rate long-term debt – EDC (note 20) | | $ | (101 | ) | | $ | (256 | ) |
| Gain (loss) from change in fair value of outstanding warrants (note 17) | | | 398 | | | | (675 | ) |
| Total | | $ | 297 | | | $ | (931 | ) |
Note 29 – Income Taxes
The Corporation had net losses for the periods ended December 31, 2018 and 2017 and income tax expense was $300 and $nil for each of these years, respectively.
The estimated income tax rate for the Company is based on substantively enacted corporate tax rates, expected timing of reversals, and expected taxable income allocation to various tax jurisdictions.
2018 Consolidated Financial Statements | Page 71 |
The Company’s computation of income tax expense is as follows:
| | | | | | | |
| Years ended December 31, | | 2018 | | | 2017 | |
| | | | | | Restated (Note 5) | |
| Loss before income taxes | | $ | (13,039 | ) | | $ | (10,766 | ) |
| Statutory income tax rate | | | 25 | % | | | 25 | % |
| Income tax recovery at statutory rates | | | (3,260 | ) | | | (2,692 | ) |
| Non-deductible expenses | | | 302 | | | | 94 | |
| Withholding tax | | | 300 | | | | – | |
| Tax losses and other temporary differences not recognized | | | 3,244 | | | | 2,622 | |
| Income taxes at different rates in foreign and other provincial jurisdictions | | | (233 | ) | | | (256 | ) |
| Other | | | (53 | ) | | | 231 | |
| Total | | $ | 300 | | | $ | – | |
At December 31, 2018, the Company has available income tax loss carry-forwards of $109,953 that may be used to reduce taxable income in future years, in certain jurisdictions, expiring as follows:
| | | | | | | |
| For the years ended | | 2018 | | | 2017 | |
| 2024 | | $ | 118 | | | $ | 118 | |
| 2025 | | | 244 | | | | 244 | |
| 2026 | | | 512 | | | | 512 | |
| 2027 | | | 14 | | | | 14 | |
| 2028 | | | 1 | | | | 1 | |
| 2029 | | | 517 | | | | 517 | |
| 2030 | | | 7,208 | | | | 7,208 | |
| 2031 | | | 6,243 | | | | 6,432 | |
| 2032 | | | 5,524 | | | | 5,706 | |
| 2033 | | | – | | | | – | |
| 2034 | | | 4,814 | | | | 4,680 | |
| 2035 | | | 5,798 | | | | 6,238 | |
| 2036 | | | 5,237 | | | | 5,411 | |
| 2037 | | | 4,789 | | | | 4,853 | |
| 2038 | | | 6,177 | | | | – | |
| No expiry | | | 62,757 | | | | 61,518 | |
| Total | | $ | 109,953 | | | $ | 103,452 | |
Components of the Company’s tax benefit of deductible temporary differences and unused tax losses are:
| | | | | | | |
| Year ended December 31, | | 2018 | | | 2017 | |
| Non-capital losses | | $ | 30,508 | | | $ | 30,984 | |
| Investment tax credits | | | 1,649 | | | | 1,349 | |
| Scientific research and experimental development | | | 745 | | | | 745 | |
| Property, plant and equipment and intellectual property | | | 1,592 | | | | 1,406 | |
| Provisions | | | 200 | | | | 131 | |
| Other | | | 850 | | | | 669 | |
| Total | | $ | 35,544 | | | $ | 35,283 | |
No deferred income tax asset has been recognized in respect of the $35,544 of losses and other temporary differences, reflecting the Company’s uncertainty associated with the realization of deferred income tax assets.
2018 Consolidated Financial Statements | Page 72 |
Note 30 – Net Loss Per Share
The loss per share for the years ended December 31, 2018 and 2017 was as follows:
| | | | | | | |
| Year ended December 31, | | 2018 | | | 2017 | |
| Net loss | | $ | (13,339 | ) | | $ | (11,140 | ) |
| Change in accounting policy (note 5) | | | – | | | | 374 | |
| Net loss, restated | | | (13,339 | ) | | | (10,766 | ) |
| | | | | | | | | |
| Weighted average number of shares outstanding – basic | | | 15,441,947 | | | | 13,947,636 | |
| Dilutive effect of stock options | | | – | | | | – | |
| Dilutive effect of warrants | | | – | | | | – | |
| Weighted average number of shares outstanding – diluted | | | 15,441,947 | | | | 13,947,636 | |
| Net loss per share – basic and diluted | | $ | (0.86 | ) | | $ | (0.77 | ) |
No effect has been given to the potential exercise of stock options and warrants in the calculation of diluted net loss per share, as their impact would be anti-dilutive.
Note 31 – Commitments and Contingencies
Forgivable loan facility
In November 2014, Hydrogenics entered into an agreement with the IESO to provide a 2.5MW Power-to-Gas storage unit to the Province of Ontario. The target in-service period for the IESO Regulation Services contract was the second quarter of 2018. The contract was assigned to the joint venture 2562961 Ontario Ltd. in 2017. The joint venture will receive a total of C$2,950, paid in equal monthly instalments, in return for IESO’s use of the energy storage solution over the initial three-year period commencing with commissioning. The Power-to-Gas storage unit is estimated to have a potential 20-year life.
In order to partially fund the development of the unit, Hydrogenics and the Province of Ontario, through the Ministry of Research and Innovation (“MRI”), negotiated a C$4,000 forgivable loan from the Innovation Demonstration Fund Program (“IDF”). The loan bears interest at 3.23%, is expected to mature on June 30, 2020 and the principal and interest are forgivable upon the satisfaction of certain criteria.
The forgiveness of the principal and interest on the loan is contingent on a final commercialization report satisfactory to MRI, indicating successful commissioning and verification of the operation of the multi-stack 2.5MW PEM electrolyzer and demonstrated performance capabilities that would be deemed acceptable for ancillary service as per the IESO specifications. The unit achieved acceptance by IESO in May 2018. The final commercialization report is expected to be delivered in 2019. The forgivable loan has been accounted for as a government grant as management estimates there is reasonable assurance that the terms of forgiveness will be met.
| | | | |
| | | December 31, | |
| | | 2018 | |
| | | | |
| Total cumulative cost of 2.5MW Power-To-Gas unit | | $ | 8,792 | |
| Funding received from the IDF (C$4,000) | | | (2,941 | ) |
| Cumulative costs transferred to the joint venture (note 12) | | | (3,402 | ) |
| Foreign exchange loss on disposal | | | (117 | ) |
| Costs recorded as research and product development costs | | | (2,332 | ) |
| Costs remaining to be transferred to the joint venture | | $ | - | |
2018 Consolidated Financial Statements | Page 73 |
Rental expenses
The Company incurred rental expenses of $1,221 under operating leases in 2018 (2017 – $1,120). The Company has future minimum lease payments under operating leases relating to premises, office equipment and vehicles as follows:
| | | | |
| For the years ended | | | |
| 2019 | | $ | 1,088 | |
| 2020 | | | 885 | |
| 2021 | | | 724 | |
| 2022 | | | 387 | |
| 2023 | | | 290 | |
| Thereafter | | | 560 | |
| Total | | $ | 3,934 | |
The Company leases various premises, office equipment and vehicles under non-cancellable operating lease agreements. The lease agreements are classified as non-cancellable, as penalties are charged if cancellation does occur. Certain leases contain purchase option clauses, which provide the Company with the ability to purchase the equipment or automobile at fair value at the time of exercise. The leases have varying terms, escalation clauses and renewal rights.
Indemnification agreements
The Company has entered into indemnification agreements with its current and former directors and officers to indemnify them, to the extent permitted by law, against any and all charges, costs, expenses, amounts paid in settlement, and damages incurred by the directors and officers as a result of any lawsuit or any other judicial, administrative or investigative proceeding in which the directors and officers are sued as a result of their service.
These indemnification claims will be subject to any statutory or other legal limitation period. The nature of the indemnification agreements prevents the Company from making a reasonable estimate of the maximum potential amount it could be required to pay to counterparties. The Company has purchased directors’ and officers’ liability insurance. No amount has been recorded in the consolidated financial statements with respect to these indemnification agreements, as the Company is not aware of any claims.
In the normal course of operations, the Company may provide indemnification agreements, other than those listed above, to counterparties that require the Company to compensate them for costs incurred as a result of changes in laws and regulations or as a result of litigation claims or statutory sanctions that may be suffered by the counterparty as a consequence of the transaction. The terms of these indemnification agreements will vary based on the contract. The nature of the indemnification agreements prevents the Company from making a reasonable estimate of the maximum potential amount it could be required to pay to counterparties. No amount has been recorded in the consolidated financial statements with respect to these indemnification agreements, as the Company is not aware of any claims.
Note 32 – Related Party Transactions
In the normal course of operations, the Company subcontracts certain manufacturing functions to a company owned by a family member of an executive officer and Director of the Company. During 2018, Hydrogenics made purchases of $467 (2017 – $646) from this related company. At December 31, 2018, the Company had an accounts payable balance due to this related party of $21 (2017 – $8).
The Company holds an equity investment in the joint venture 2562961 Ontario Ltd., related to the energy storage facility project with Enbridge Gas Distribution. During the year ended December 31, 2018 the Company transferred assets to the joint venture of $1,372 (2017 – $2,030) and at the end of December 31, 2018 the Company had a receivable of $196 (2017 – $nil) owing from the joint venture.
The Company holds an equity investment in the joint venture Kolon Hydrogenics. The Company had no transactions with the joint venture in either 2018 or 2017.
2018 Consolidated Financial Statements | Page 74 |
All related party transactions involve the parent company. There are no related party transactions to disclose for the Company’s subsidiaries.
Note 33 – Consolidated Statements of Cash Flows
Components of the net change in non-cash operating assets and liabilities are as follows:
| | | | | | | |
| Year ended December 31, | | 2018 | | | 2017 | |
| | | | | | Restated (Note 5) | |
| Decrease (increase) in current assets | | | | | | | | |
| Trade and other receivables | | $ | 1,834 | | | $ | (4,013 | ) |
| Contract assets | | | 921 | | | | (1,006 | ) |
| Inventories | | | (2,497 | ) | | | 3,343 | |
| Prepaid expenses | | | (603 | ) | | | (152 | ) |
| Increase (decrease) in current liabilities | | | | | | | | |
| Trade and other payables, including provisions | | | (1,164 | ) | | | 1,616 | |
| Contract liabilities | | | 2,260 | | | | (282 | ) |
| Deferred funding | | | 999 | | | | 271 | |
| Total | | $ | 1,750 | | | $ | (223 | ) |
Note 34 – Segmented Financial Information
The Company’s two reportable segments include OnSite Generation and Power Systems. Segmentation is based on the internal reporting and organizational structure, taking into account the different risk and income structures of the key products and production processes of the Company. Where applicable, corporate and other activities are reported separately as Corporate and Other. OnSite Generation includes the design, development, manufacture and sale of hydrogen generation products. Power Systems includes the design, development, manufacture and sale of fuel cell products
Financial information by reportable segment for the years ended December 31, 2018 and 2017 was as follows:
| | | | | | | | | | | | | |
| | | OnSite | | | Power | | | Corporate | | | | |
| Year ended December 31, 2018 | | Generation | | | Systems | | | and Other | | | Total | |
| Revenue transferred at a point in time | | $ | 17,463 | | | $ | 12,152 | | | $ | – | | | $ | 29,615 | |
| Revenue transferred over time | | | 845 | | | | 3,436 | | | | – | | | | 4,281 | |
| Revenues from external customers | | | 18,308 | | | | 15,588 | | | | – | | | | 33,896 | |
| Gross profit | | | 2,648 | | | | 6,077 | | | | – | | | | 8,725 | |
| Selling, general and administrative expenses | | | 2,959 | | | | 4,276 | | | | 4,378 | | | | 11,613 | |
| Research and product development expenses | | | 2,927 | | | | 4,495 | | | | 64 | | | | 7,486 | |
| Segment loss | | | (3,238 | ) | | | (2,694 | ) | | | (4,442 | ) | | | (10,374 | ) |
| Loss in joint venture | | | – | | | | – | | | | (1,637 | ) | | | (1,637 | ) |
| Interest expense, net | | | – | | | | – | | | | (1,469 | ) | | | (1,469 | ) |
| Foreign currency gains, net | | | – | | | | – | | | | 144 | | | | 144 | |
| Other finance gains, net | | | – | | | | – | | | | 297 | | | | 297 | |
| Loss before income taxes | | $ | (3,238 | ) | | $ | (2,694 | ) | | $ | (7,107 | ) | | $ | (13,039 | ) |
2018 Consolidated Financial Statements | Page 75 |
| | | | | | | | | | | | | |
| | | OnSite | | | Power | | | Corporate | | | | |
| Year ended December 31, 2017 | | Generation | | | Systems | | | and Other | | | Total | |
| Revenue transferred at a point in time | | $ | 24,385 | | | $ | 19,393 | | | $ | – | | | $ | 43,778 | |
| Revenue transferred over time | | | 883 | | | | 3,454 | | | | | | | | 4,337 | |
| Revenues from external customers | | | 25,268 | | | | 22,847 | | | | – | | | | 48,115 | |
| Gross profit | | | 3,663 | | | | 8,015 | | | | – | | | | 11,678 | |
| Selling, general and administrative expenses | | | 3,381 | | | | 4,321 | | | | 5,924 | | | | 13,626 | |
| Research and product development expenses | | | 1,275 | | | | 4,996 | | | | 105 | | | | 6,376 | |
| Segment loss | | | (993 | ) | | | (1,302 | ) | | | (6,029 | ) | | | (8,324 | ) |
| Loss in joint venture | | | – | | | | – | | | | (334 | ) | | | (334 | ) |
| Interest expense, net | | | – | | | | – | | | | (1,812 | ) | | | (1,812 | ) |
| Foreign currency gains, net | | | – | | | | – | | | | 635 | | | | 635 | |
| Other finance losses, net | | | – | | | | – | | | | (931 | ) | | | (931 | ) |
| Loss before income taxes | | $ | (993 | ) | | $ | (1,302 | ) | | $ | (8,471 | ) | | $ | (10,766 | ) |
Revenue, cost of sales and selling, general and administrative expenses for the comparative year have been restated to reflect the retrospective application of IFRS 15 adopted effective January 1, 2018. See Note 5.
Balance sheet information by reportable segment at December 31, 2018 and 2017 was as follows:
| | | | | | | | | | | | | |
| | | OnSite | | | Power | | | Corporate | | | | |
| At December 31, 2018 | | Generation | | | Systems | | | and Other | | | Total | |
| Cash and cash equivalents and restricted cash | | $ | 5,343 | | | $ | 162 | | | $ | 3,232 | | | $ | 8,737 | |
| Trade and other receivables | | | 1,949 | | | | 4,779 | | | | – | | | | 6,728 | |
| Contract assets (current and non-current) | | | 1,678 | | | | 4,545 | | | | – | | | | 6,223 | |
| Inventories | | | 6,324 | | | | 10,850 | | | | – | | | | 17,174 | |
| Prepaid expenses | | | 368 | | | | 1,353 | | | | 239 | | | | 1,960 | |
| Investment in joint ventures | | | – | | | | – | | | | 1,644 | | | | 1,644 | |
| Property, plant and equipment | | | 272 | | | | 2,595 | | | | – | | | | 2,867 | |
| Goodwill and intangibles | | | 4,427 | | | | 10 | | | | 154 | | | | 4,591 | |
| Total Assets | | $ | 20,361 | | | $ | 24,294 | | | $ | 5,269 | | | $ | 49,924 | |
| Current liabilities | | $ | 12,039 | | | $ | 15,408 | | | $ | 3,346 | | | $ | 30,793 | |
| Non-current liabilities | | | 1,180 | | | | 3,575 | | | | 3,415 | | | | 8,170 | |
| Total Liabilities | | $ | 13,219 | | | $ | 18,983 | | | $ | 6,761 | | | $ | 38,963 | |
| | | | | | | | | | | | | |
| | | OnSite | | | Power | | | Corporate | | | | |
| At December 31, 2017 | | Generation | | | Systems | | | and Other | | | Total | |
| Cash and cash equivalents and restricted cash | | $ | 6,836 | | | $ | 1,160 | | | $ | 14,418 | | | $ | 22,414 | |
| Trade and other receivables | | | 4,936 | | | | 3,800 | | | | – | | | | 8,736 | |
| Contract assets (current and non-current) | | | 676 | | | | 6,547 | | | | – | | | | 7,223 | |
| Inventories | | | 8,045 | | | | 7,003 | | | | – | | | | 15,048 | |
| Prepaid expenses | | | 270 | | | | 928 | | | | 176 | | | | 1,374 | |
| Investment in joint venture | | | – | | | | – | | | | 2,797 | | | | 2,797 | |
| Property, plant and equipment | | | 329 | | | | 3,545 | | | | – | | | | 3,874 | |
| Goodwill and intangibles | | | 4,659 | | | | 6 | | | | 84 | | | | 4,749 | |
| Total Assets | | $ | 25,751 | | | $ | 22,989 | | | $ | 17,475 | | | $ | 66,215 | |
| Current liabilities | | $ | 11,400 | | | $ | 14,538 | | | $ | 4,356 | | | $ | 30,294 | |
| Non-current liabilities | | | 1,138 | | | | 4,737 | | | | 5,873 | | | | 11,748 | |
| Total Liabilities | | $ | 12,538 | | | $ | 19,275 | | | $ | 10,229 | | | $ | 42,042 | |
2018 Consolidated Financial Statements | Page 76 |
Assets and liabilities for the comparative year have been restated to reflect the retrospective application of IFRS 15 adopted effective January 1, 2018. See Note 5.
Property, plant and equipment are located in the following countries:
| | | | | | | |
| Year ended December 31, | | 2018 | | | 2017 | |
| Canada | | $ | 2,497 | | | $ | 3,371 | |
| Belgium | | | 272 | | | | 329 | |
| Germany | | | 98 | | | | 174 | |
| Total | | $ | 2,867 | | | $ | 3,874 | |
Revenue from external customers by region was as follows:
| | | | | | | |
| Year ended December 31, | | 2018 | | | 2017 | |
| | | | | | Restated (Note 5) | |
| Asia | | $ | 12,514 | | | $ | 24,120 | |
| European Union | | | 10,891 | | | | 16,917 | |
| North America | | | 3,400 | | | | 1,514 | |
| Eastern Europe | | | 2,896 | | | | 2,697 | |
| South and Central America | | | 2,698 | | | | 350 | |
| Africa | | | 616 | | | | 1,145 | |
| Middle East | | | 456 | | | | 1,037 | |
| Oceania and Caribbean | | | 425 | | | | 335 | |
| Total | | $ | 33,896 | | | $ | 48,115 | |
Revenue by product type was as follows:
| | | | | | | |
| Year ended December 31, | | 2018 | | | 2017 | |
| | | | | | Restated (Note 5) | |
| Sale of equipment | | $ | 24,295 | | | $ | 40,601 | |
| Spare parts and maintenance | | | 6,267 | | | | 5,662 | |
| Product development services | | | 2,063 | | | | 581 | |
| Exclusivity fees | | | 1,271 | | | | 1,271 | |
| Total revenues by product type | | $ | 33,896 | | | $ | 48,115 | |
Revenue by market application was as follows:
| | | | | | | |
| Year ended December 31, | | 2018 | | | 2017 | |
| | | | | | Restated (Note 5) | |
| Heavy duty motive | | $ | 13,855 | | | $ | 21,955 | |
| Back-up power | | | 1,082 | | | | – | |
| Technology solutions | | | 1,397 | | | | 850 | |
| Power to gas energy storage | | | 1,086 | | | | 8,069 | |
| Industrial hydrogen | | | 14,259 | | | | 16,578 | |
| Fueling stations | | | 2,217 | | | | 663 | |
| Total revenues by market application | | $ | 33,896 | | | $ | 48,115 | |
2018 Consolidated Financial Statements | Page 77 |
Revenue for the largest customers as a percentage of the total revenue was as follows:
| | | | | | | |
| Year ended December 31, | | 2018 | | | 2017 | |
| First largest (Power segment) | | | 13 | % | | | 21 | % |
| Second largest (Power segment) | | | 9 | % | | | 10 | % |
| Third largest (Power segment) | | | 5 | % | | | 8 | % |
| Fourth largest (OnSite Generation segment) | | | 5 | % | | | 7 | % |
| All other customers | | | 68 | % | | | 54 | % |
| Total | | | 100 | % | | | 100 | % |
Note 35 – Risk Management Arising From Financial Instruments
Fair value
The carrying value of cash and cash equivalents, restricted cash, trade and other receivables, trade and other payables and contract assets, and contract liabilities approximates their fair value given their short-term nature. The carrying value of the non-current financial liabilities approximates their fair value given the difference between the discount rates used to recognize the liabilities in the consolidated balance sheets and the market rates of interest is insignificant.
Fair value measurements recognized in the consolidated balance sheets must be categorized in accordance with the following levels:
| (i) | Level 1: quoted prices (unadjusted) in active markets for identical assets or liabilities; |
| (ii) | Level 2: inputs other than quoted prices included in Level 1 that are observable for the asset or liability, either directly (i.e. as prices) or indirectly (i.e. derived from prices); and |
| (iii) | Level 3: inputs for the asset or liability that are not based on observable market data (unobservable inputs). |
The fair value of the liabilities relating to the RSUs and DSUs is classified as Level 1. The fair value of the warrants are classified as Level 2.
The Company has not transferred any financial instruments between Levels 1, 2, or 3 of the fair value hierarchy during the year ended December 31, 2018.
Financial instruments are classified under IFRS 9 into one of the following measurement categories: financial assets at FVPL; financial liabilities at FVPL; financial assets at amortized cost, financial liabilities at amortized cost, and financial assets at FVOCI.
2018 Consolidated Financial Statements | Page 78 |
The following table summarizes information regarding the measurement category of the Company’s financial instruments under IFRS 9 (and where different the previous measurement category under IAS 39) and their carrying amounts (which did not change as a result of the adoption of IFRS 9):
| | | | | | | |
| At December 31, | | 2018 | | | 2017 | |
| | | | | | Restated (Note 5) | |
| Cash and cash equivalents | | $ | 7,561 | | | $ | 21,511 | |
| Restricted cash (current and non-current) | | | 1,176 | | | | 903 | |
| Restricted cash – non-current | | | | | | | | |
| Trade and other receivables, including contract assets | | | 12,951 | | | | 15,959 | |
| Financial assets at amortized cost (IAS 39 - Loans and receivables) | | $ | 21,688 | | | $ | 38,373 | |
| Trade and other payables | | $ | 9,068 | | | $ | 9,736 | |
Long-term debt and repayable government contribution
(current and non-current) | | | 8,049 | | | | 11,240 | |
| Operating borrowings | | | – | | | | 1,200 | |
| Contract liabilities, current and non-current | | | 16,001 | | | | 14,044 | |
| Capital lease | | | 33 | | | | 44 | |
| Financial liabilities at amortized cost (IAS 39 - Other financial liabilities) | | $ | 33,151 | | | $ | 36,264 | |
| DSU liability | | | 730 | | | | 1,406 | |
| Warrants | | | 11 | | | | 409 | |
| Financial liabilities at fair value through profit or loss | | $ | 741 | | | $ | 1,815 | |
Liquidity risk
The Company has sustained losses and negative cash flows from operations since its inception. At December 31, 2018, the Company had $7,561 (2017 – $21,511) of current unrestricted cash and cash equivalents. Liquidity risk is the risk the Company will encounter difficulty in meeting its financial obligations associated with financial liabilities that are settled by delivering cash or another financial asset. The Company is exposed to liquidity risk as it continues to have net cash outflows from its operations. The Company’s objective for liquidity risk management is to maintain sufficient liquid financial resources to fund the consolidated balance sheets, pursue growth and development strategies, and to meet commitments and obligations in the most cost-effective manner possible. The Company achieves this by maintaining sufficient cash and cash equivalents and managing working capital. The Company monitors its financial position on a monthly basis at minimum, and updates its expected use of cash resources based on the latest available data. Such forecasting takes into consideration the Company’s financing plans and compliance with internal targets. A significant portion of the Company’s financial liabilities is classified as current liabilities, as settlement is expected within one year.
There are uncertainties related to the timing and use of the Company’s cash resources and working capital requirements. These uncertainties include, among other things, the timing and volume of commercial sales and associated gross margin of our existing products and the development of markets for, and customer acceptance of, new products. The Company’s operations may not generate sufficient cash flow to fund our obligations. As such, these obligations will be funded out of existing and forecasted cash resources. Hydrogenics may need to take additional measures to increase its liquidity and capital resources, including obtaining additional debt or equity financing, pursuing joint-venture arrangements, equipment financings or other receivables financing arrangements. Hydrogenics may experience difficulty in obtaining satisfactory financing terms. Failure to obtain adequate financing on satisfactory terms could have a material adverse effect on Hydrogenics’ results of operations or financial condition. On December 21, 2018, the Company announced it had entered into a subscription agreement for gross proceeds of $20,520 as described in note 37.
2018 Consolidated Financial Statements | Page 79 |
The following table details the Company’s contractual maturity for its net financial liabilities. The information presented is based on the earliest date on which the Company can be required to pay and represents the undiscounted cash flow including principal and interest.
| | | | | | | | | | |
| | | Due in less | | | Due in 1-3 | | | Due in 4-5 | |
| At December 31, 2018 | | than 1 year | | | years | | | years | |
| Trade and other payables | | $ | 9,068 | | | $ | – | | | $ | – | |
| DSU liability | | | 730 | | | | – | | | | – | |
| Warrants | | | 11 | | | | – | | | | – | |
| Long-term debt – Province of Ontario and EDC | | | 3,760 | | | | 6,493 | | | | 7 | |
| Total | | $ | 13,569 | | | $ | 6,493 | | | $ | 7 | |
| | | | | | | | | | |
| | | Due in less | | | Due in 1-3 | | | Due in 4-5 | |
| At December 31, 2017 | | than 1 year | | | years | | | years | |
| Trade and other payables | | $ | 9,736 | | | $ | – | | | $ | – | |
| DSU liability | | | 1,406 | | | | – | | | | – | |
| Operating borrowings | | | 1,200 | | | | – | | | | – | |
| Warrants | | | 409 | | | | – | | | | – | |
| Long-term debt – Province of Ontario and EDC | | | 4,653 | | | | 7,243 | | | | 3,123 | |
| Total | | $ | 17,404 | | | $ | 7,243 | | | $ | 3,123 | |
Credit risk
Credit risk arises from the risk one party to a financial instrument will cause a financial loss for the other party by failing to discharge an obligation. The Company is exposed to credit risk from customers. At December 31, 2018, the Company’s two largest customers accounted for 22% of revenue (31% at December 31, 2017) and 14% of accounts receivable (2017 – 48%). In order to minimize the risk of loss for trade receivables, the Company’s extension of credit to customers involves a review and approval by senior management as well as progress payments as contracts are executed and in some cases, irrevocable letters of credit. The majority of the Company’s sales are invoiced with payment terms between 30 and 60 days. The Company’s objective is to minimize its exposure to credit risk from customers in order to prevent losses on financial assets by performing regular monitoring of overdue balances and to provide an allowance for potentially uncollectible accounts receivable.
The Company’s trade and other receivables have a carrying value of $3,313 at December 31, 2018 (2017 –$6,466), representing the maximum exposure to credit risk of those financial assets, exclusive of the loss allowance.
The aging of these receivables is as follows:
| | | | | | | |
| At December 31, | | 2018 | | | 2017 | |
| Not due | | | 76 | % | | | 77 | % |
| Less than 30 days past due | | | 8 | | | | 11 | |
| Less than 60 days past due, more than 30 days past due | | | 1 | | | | 1 | |
| More than 60 days past due | | | 15 | | | | 11 | |
| Total | | | 100 | % | | | 100 | % |
2018 Consolidated Financial Statements | Page 80 |
The Company’s gross exposure to credit risk for trade receivables by geographic area at December 31 was as follows:
| | | | | | | |
| At December 31, | | 2018 | | | 2017 | |
| Europe | | | 62 | % | | | 64 | % |
| North America | | | 5 | | | | 4 | |
| Asia | | | 31 | | | | 30 | |
| Rest of world | | | 2 | | | | 2 | |
| Total | | | 100 | % | | | 100 | % |
The Company applies the simplified approach to providing for expected credit losses prescribed by IFRS 9, which permits the use of the lifetime expected loss provision for all trade receivables and contract assets. To measure the expected credit losses, trade receivables and contract assets have been grouped based on shared credit risk characteristics and the days past due. The contract assets relate to unbilled work in progress and have substantially the same risk characteristics as the trade receivables for the same type of contracts. The Company has therefore determined that the expected loss rates for trade receivables are a reasonable approximation of the loss rates for the contract assets. The loss allowance at January 1, 2018 was determined on a combined company wide basis follows for both trade receivables and contract assets based upon the Company’s historic default rates over the expected life of trade receivables and contract assets adjusted for forward looking estimates.
| | | | | | | | | | | | | | | | |
| January 1, 2018: | | Not yet due | | | Less than 31
days past due | | | 31-60 days
past due | | | More than 60
days past due | | | Total | |
| | | | | | | | | | | | | | | | |
| Expected loss rate | | | 0.01 | % | | | 0.05 | % | | | 0.21 | % | | | 1.34 | % | | | | |
| Gross carrying amount | | $ | 9,849 | | | $ | 2,482 | | | $ | 166 | | | $ | 1,192 | | | $ | 13,689 | |
| Loss allowance | | $ | 1 | | | $ | 1 | | | $ | 0 | | | $ | 16 | | | $ | 18 | |
The loss allowance for trade receivables and contract assets as at December 31, 2017 reconciled to the opening loss allowances on January 1, 2018 is as follows:
| | | | | | | | | | |
| | | Contract
Assets | | | Trade and
other
receivables | | | Total | |
| At December 31, 2017 under IAS 39 | | $ | - | | | $ | 943 | | | $ | 943 | |
| Write-off of amounts deemed uncollectible against gross receivables | | | - | | | | (925 | ) | | | (925 | ) |
| | | | | | | | | | | | | |
| Opening loss allowance as at January 1, 2018 | | $ | - | | | $ | 18 | | | $ | 18 | |
The loss allowance at December 31, 2018 was determined as follows for both trade receivables and contract assets:
| | | | | | | | | | | | | | | | |
| December 31, 2018: | | Not yet due | | | Less than 31
days past due | | | 31-60 days
past due | | | More than 60
days past due | | | Total | |
| | | | | | | | | | | | | | | | |
| Expected loss rate | | | 0.1 | % | | | 2.6 | % | | | 3.1 | % | | | 0.9 | % | | | | |
| Gross carrying amount | | $ | 8,334 | | | $ | 529 | | | $ | 96 | | | $ | 577 | | | $ | 9,536 | |
| Loss allowance | | $ | 8 | | | $ | 14 | | | $ | 3 | | | $ | 5 | | | $ | 30 | |
Trade receivables and contract assets are written off when there is no reasonable expectation of recovery. During the year the Company made no write-offs of trade receivables and does not expect to receive future cash flow or recoveries from collection of cash flows previously written off.
2018 Consolidated Financial Statements | Page 81 |
The Company may also have credit risk relating to cash and cash equivalents and restricted cash, which it manages by dealing with chartered Canadian, Belgian and German banks. The credit risk is limited because the counterparties are chartered banks with high credit ratings assigned by international credit rating agencies. In addition, the Company minimizes exposure to credit risk by strategically managing cash balances at individual banks. As well, the Company may also fund working capital by leveraging credit facilities that are not 100% secured by cash, resulting in a mitigation of credit risk at the corresponding bank.
The Company’s objective is to minimize its exposure to credit risk in order to prevent losses on financial assets by placing its investments in lower risk bank acceptances at these banks. The Company’s cash and cash equivalents and restricted cash was $8,737 at December 31, 2018 (2017 – $22,414), representing the maximum exposure to credit risk of these financial assets. Approximately 99% (2017 – 98%) of the Company’s cash and cash equivalents and restricted cash at December 31, 2018 was held by four financial institutions.
The Company’s exposure to credit risk relating to cash and cash equivalents and restricted cash on deposit segmented by geographic area at December 31, 2018 and 2017 was as follows:
| | | | | | | |
| | | 2018 | | | 2017 | |
| Canada | | | 37 | % | | | 65 | % |
| Belgium | | | 61 | | | | 30 | |
| Germany | | | 2 | | | | 5 | |
| | | | 100 | % | | | 100 | % |
Foreign currency risk
Foreign currency risk arises because of fluctuations in exchange rates. The Company conducts a significant portion of its business activities in currencies other than the Company’s functional currency of US dollars and the functional currency of its Belgium and German subsidiaries (euro). This primarily includes Canadian dollar transactions at the parent company and US dollar transactions at the Company’s subsidiaries in Belgium and Germany.
The Company’s objective in managing its foreign currency risk is to minimize its net exposure to foreign currency cash flows by converting foreign denominated financial assets into the applicable currency of the subsidiary to the extent practicable to match the obligations of its financial liabilities. The Company also periodically enters into foreign exchange forward contracts to limit its exposure to foreign currency rate fluctuations. There were no foreign exchange forward contracts in place at December 31, 2018 or at December 31, 2017.
Financial assets and financial liabilities denominated in foreign currencies will be affected by changes in the exchange rate between the functional currency and these foreign currencies. This primarily includes cash and cash equivalents; trade and other receivables; contract assets; trade and other payables; contract liabilities and other long-term financial liabilities, which are denominated in foreign currencies.
The Company recognized a net foreign exchange gains of $144 for the year ended December 31, 2018 (2017 – $635).
At December 31, 2018, if the Canadian dollar had strengthened/weakened by 10% against the US dollar, with all other variables held constant, the net loss would have been lower/higher by approximately $870 as a result of foreign exchange on the translation of Canadian dollar denominated balances.
At December 31, 2018, if the euro had strengthened/weakened by 10% against the US dollar, with all other variables held constant, the net loss would have been lower/higher by approximately $445 as a result of foreign exchange on the translation of euro denominated balances.
2018 Consolidated Financial Statements | Page 82 |
Interest rate risk
Cash flow interest rate risk arises because of the fluctuation in market interest rates. The Company’s objective in managing interest rate risk is to maximize the return on its cash and cash equivalents and restricted cash. The Company is subject to interest rate risk on its short-term borrowings offset by cash and cash equivalents. The Company’s borrowings include both fixed and variable interest rates. Given the prevailing interest rates earned by the Company’s short-term investments, a 100 basis point increase or decrease would have minimal impact on the Company’s results.
Note 36 – Capital Management
The Company’s objective in managing capital is to ensure sufficient liquidity to pursue its growth strategy, fund research and product development, while at the same time, taking a conservative approach toward financial leverage and management of financial risk.
The Company’s primary uses of capital are to finance operations, increase non-cash working capital and capital expenditures. The Company currently funds these requirements from existing cash resources, cash raised through share issuances and long-term debt. The Company’s objectives when managing capital are to ensure the Company will continue to have enough liquidity so it can provide its products and services to its customers and returns to its shareholders. The Company monitors its capital on the basis of the adequacy of its cash resources to fund its business plan. In order to maximize the capacity to finance the Company’s ongoing growth, the Company does not currently pay a dividend to holders of its common shares.
The Company’s capital is composed of debt and shareholders’ equity as follows:
| | | | | | | |
| At December 31, | | 2018 | | | 2017 | |
| Total equity | | $ | 10,961 | | | $ | 24,173 | |
| Operating borrowings | | | – | | | | 1,200 | |
| Long-term debt and repayable government contributions, including current portion | | | 8,082 | | | | 11,284 | |
| Total | | | 19,043 | | | | 36,657 | |
| Less Cash and cash equivalents and restricted cash | | | 8,737 | | | | 22,414 | |
| Total capital employed | | $ | 10,306 | | | $ | 14,243 | |
Note 37 – Subsequent Events
On December 21, 2018, the Company and The Hydrogen Company (“H2C”) entered into a subscription agreement to issue 3,537,931 common shares of Hydrogenics to H2C on a private placement basis, for gross proceeds to Hydrogenics of $20,520 or $5.80 per common share. The subscription price represented approximately a 20% premium to the 20-day volume-weighted average trading price of the Company’s common shares on the NASDAQ for the period ending December 20, 2018.
The transaction closed on January 24, 2019 and the Company received net proceeds of $20,305 after fees and expenses of $215. Subsequent to closing of the private placement, H2C’s interest in Hydrogenics is approximately 18.6% of total issued common shares.
The subscription agreement provides, among other things, that H2C has participation rights on future offerings and the right to nominate one director to the board of directors of Hydrogenics, and that H2C will be subject to certain restrictions, including lock-up, transfer, standstill and voting restrictions, subject, in each case, to certain ownership threshold requirements or for a period of one year from the date of the subscription agreement.
2018 Consolidated Financial Statements | Page 83 |
Board of Directors
Douglas S. Alexander,Chairman
Chair of the Board, Member of Audit Committee and Member of Human Resources and Corporate Governance Committee
Joseph Cargnelli, Director
Chief Technology Officer of the Company
Sara C. Elford, Director
Member of Human Resources and Corporate Governance Committee and member of Audit Committee
David C. Ferguson,Director
Chair of Audit Committee and Member of Human Resources and Corporate Governance Committee
Pierre-Etienne Franc, Director
Nominated by H2C
Donald J. Lowry, Director
Chair of Human Resources and Corporate Governance Committee and Member of Audit Committee
Daryl C.F. Wilson,Director
President and Chief Operating Officer of the Company