EXHIBIT 99.2

Fourth Quarter & Full - Year 2020 Results Conference Call Investor Presentation

SAFE - HARBOR STATEMENT 2 | Investor Presentation This presentation contains “forward looking statements” — that is, statements related to future, not past, events — as defined in Se ction 21E of the Securities Exchange Act of 1934, as amended, that reflect our current expectations regarding our future growth, results of operations, financial condition, cash flo ws, performance, business prospects and opportunities, as well as assumptions made by, and information currently available to, our management. Forward - looking statements include any s tatement that does not directly relate to a current or historical fact. We have tried to identify forward looking statements by using words such as “anticipate,” “believe,” “exp ect ,” “intend,” “will,” “should,” “may,” “plan” and similar expressions, but these words are not the exclusive means of identifying forward looking statements. Our forward - looking statements may include or relate to our beliefs, expectations, plans and/or assumptions with respect to the following, many of which are, and will be, amplified by the COVID - 19 pandemic: ( i ) the impact of global health concerns, including the impact of the current COVID - 19 pandemic on the economies and financial mar kets and the demand for our products; (ii) state, local and federal regulatory frameworks affecting the industries in which we compete, including the wi nd energy industry, and the related extension, continuation or renewal of federal tax incentives and grants and state renewable portfolio standards as well as new or contin uin g tariffs on steel or other products imported into the United States; (iii) our customer relationships and our substantial dependency on a few significant customers and our efforts to diversify our customer base and sector focus and leverage relationships across business units; (iv) the economic and operational stability of our significant customers and su ppl iers, including their respective supply chains, and the ability to source alternative suppliers as necessary, in light of the COVID - 19 pandemic; (v) our ability to continue to grow our business organically and through acquisitions, and the impairment thereto by the impact of the COVID - 19 pandemic; (vi) the production, sales, collections, customer deposits and revenu es generated by new customer orders and our ability to realize the resulting cash flows; (vii) information technology failures, network disruptions, cybersecurity attack s o r breaches in data security, including with respect to any remote work arrangements implemented in response to the COVID - 19 pandemic; (viii) the sufficiency of our liquidity and alternate sources of funding, if necessary; (ix) our ability to realize revenue from customer orders and backlog; (x) our ability to operate our business efficiently, comply with our debt o bli gations, manage capital expenditures and costs effectively, and generate cash flow; (xi) the economy, including its stability in light of the COVID - 19 pandemic, and the potent ial impact it may have on our business, including our customers; (xii) the state of the wind energy market and other energy and industrial markets generally and the impact of comp eti tion and economic volatility in those markets; (xiii) the effects of market disruptions and regular market volatility, including fluctuations in the price of oil, gas and other commod iti es; (xiv) competition from new or existing industry participants including, in particular, increased competition from foreign tower manufacturers; (xv) the effects of the change of administrations in the U.S. federal government; (xvi) our ability to successfully integrate and operate acquired companies and to identify, negotiate and execute future acquisitions; (xv ii) the potential loss of tax benefits if we experience an “ownership change” under Section 382 of the Internal Revenue Code of 1986, as amended; (xviii) our ability to utilize various re lief options enabled by the CARES Act, including our ability to receive forgiveness of the PPP Loans under the CARES Act; (xix) the limited trading market for our securities and the volatility of market price for our securities; and (xx) the impact of future sales of our common stock or securities convertible into our common stock on our stock price. These statemen ts are based on information currently available to us and are subject to various risks, uncertainties and other factors that could cause our actual growth, results of operations, fin ancial condition, cash flows, performance, business prospects and opportunities to differ materially from those expressed in, or implied by, these statements including, but not lim ited to, those set forth under the caption “Risk Factors” in Part I, Item 1A of our Annual Report on Form 10 - K for the year ended December 31, 2019, as supplemented by our Current Report on Form 8 - K filed April 17, 2020, our Quarterly Report on Form 10 - Q for the quarterly period ended September 30, 2020 and the Prospectus Supplement related to this offering. We are under no duty to update any of these statements. You should not consider any list of such factors to be an exhaustive statement of all of the risks, uncertainties or other factors that could cause our current beliefs, expectations, plans and/or assumptions to change. Accordingly, forward - looking statements should not be relied upon as a predict or of actual results.

PERFORMANCE OVERVIEW
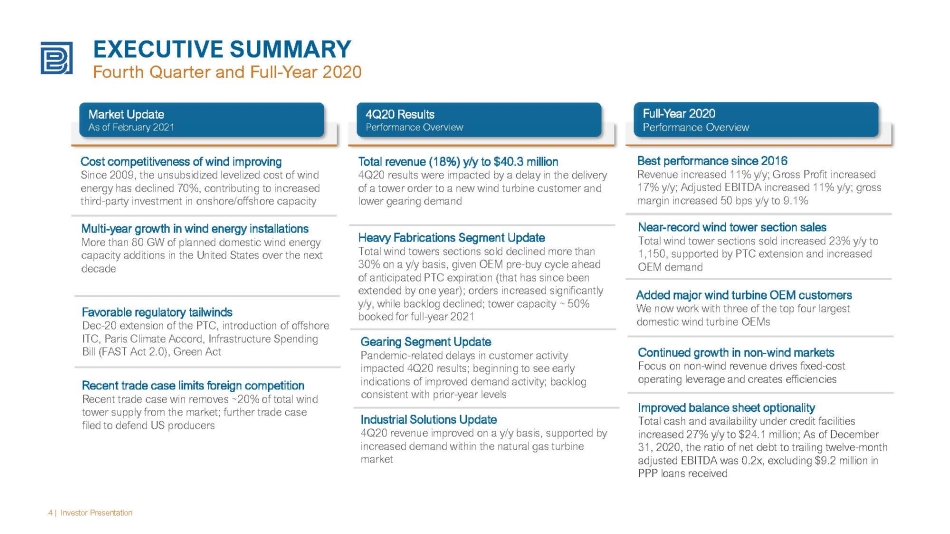
4 | Investor Presentation EXECUTIVE SUMMARY Fourth Quarter and Full - Year 2020 Market Update As of February 2021 4Q20 Results Performance Overview Full - Year 2020 Performance Overview Multi - year growth in wind energy installations More than 80 GW of planned domestic wind energy capacity additions in the United States over the next decade Favorable regulatory tailwinds Dec - 20 extension of the PTC, introduction of offshore ITC, Paris Climate Accord, Infrastructure Spending Bill (FAST Act 2.0), Green Act Recent trade case limits foreign competition Recent trade case win removes ~20% of total wind tower supply from the market; further trade case filed to defend US producers Cost competitiveness of wind improving Since 2009, the unsubsidized levelized cost of wind energy has declined 70%, contributing to increased third - party investment in onshore/offshore capacity Total revenue (18%) y/y to $40.3 million 4Q20 results were impacted by a delay in the delivery of a tower order to a new wind turbine customer and lower gearing demand Heavy Fabrications Segment Update Total wind towers sections sold declined more than 30% on a y/y basis, given OEM pre - buy cycle ahead of anticipated PTC expiration (that has since been extended by one year); orders increased significantly y/y, while backlog declined; tower capacity ~ 50% booked for full - year 2021 Gearing Segment Update Pandemic - related delays in customer activity impacted 4Q20 results; beginning to see early indications of improved demand activity; backlog consistent with prior - year levels Industrial Solutions Update 4Q20 revenue improved on a y/y basis, supported by increased demand within the natural gas turbine market Best performance since 2016 Revenue increased 11% y/y; Gross Profit increased 17% y/y; Adjusted EBITDA increased 11% y/y; gross margin increased 50 bps y/y to 9.1% Near - record wind tower section sales Total wind tower sections sold increased 23% y/y to 1,150, supported by PTC extension and increased OEM demand Added major wind turbine OEM customers We now work with three of the top four largest domestic wind turbine OEMs Continued growth in non - wind markets Focus on non - wind revenue drives fixed - cost operating leverage and creates efficiencies Improved balance sheet optionality Total cash and availability under credit facilities increased 27% y/y to $24.1 million; As of December 31, 2020, the ratio of net debt to trailing twelve - month adjusted EBITDA was 0.2x, excluding $9.2 million in PPP loans received

CONSOLIDATED FINANCIAL DATA 4Q20 results in - line with pre - announced expectations, culminating in strong full - year results 5 | Investor Presentation Total Revenue ($MM) Gross Profit ($MM) Adjusted EBITDA ($MM) Earnings (Loss) Per Share ($) • Fourth quarter results came in - line with the preliminary results update issued in late January 2021 • Strong full - year results driven mainly by increased demand for wind tower sections from major OEM customers • Continue to focus on revenue diversification beyond core wind markets, leveraging our precision manufacturing expertise Gross margin +50 bps y/y to 9.1% $49.3 $40.3 $178.2 $198.5 4Q19 4Q20 2019 2020 $4.0 $2.7 $15.4 $18.0 4Q19 4Q20 2019 2020 $1.8 $0.2 $7.2 $8.0 4Q19 4Q20 2019 2020 Adjusted EBITDA increased +10% y/y Revenue increased +11% y/y Net Loss declined by $3 million y/y ($0.09) ($0.12) ($0.28) ($0.09) 4Q19 4Q20 2019 2020

HEAVY FABRICATIONS SEGMENT Strong wind tower demand contributed to revenue growth, margin expansion 6 | Investor Presentation Segment Revenue ($MM) Segment Adjusted EBITDA ($MM) Segment Orders ($MM) Segment Backlog ($MM) • Segment revenue growth increased 21% y/y, while segment Adjusted EBITDA increased 115%, driven by increased demand for tower sections • Tower plant utilization increased materially on y/y basis, resulting in improved operating leverage • Supply chain disruptions and new customer build weighed on Q4 performance $37.6 $29.8 $128.7 $155.2 4Q19 4Q20 2019 2020 $2.4 $2.7 $6.7 $14.4 4Q19 4Q20 2019 2020 Segment Adj. EBITDA Increased +115% y/y Revenue increased +21% y/y $5.3 $27.5 $179.7 $105.8 4Q19 4Q20 2019 2020 $120.3 $73.4 $71.2 4Q19 3Q20 4Q20

HEAVY FABRICATIONS SEGMENT Dec - 20 PTC extension is a catalyst to wind tower demand 7 | Investor Presentation Total Wind Tower Sections Sold (Number of Sections) (1) Heavy Fabrications Adjusted EBITDA Margin (% of Sales) • Total wind tower sections sold increased 23% y/y; Utilization improved 1,300 bps y/y, resulting in Adjusted EBITDA margin expansion • The timing and magnitude of wind turbine installations in the United States are often driven by tax incentives. • At the end of December 2020, Congress extended the PTC at 60% of the full credit amount for another year through December 31, 2021. Under the new PTC legislation, qualifying wind projects must begin construction by December 31, 2021. 0% 10% 20% 30% 40% 50% 60% 70% 80% - 200 400 600 800 1,000 1,200 1,400 2017 2018 2019 2020 Wind Tower Sections Sold Tower Plant Capacity Utilization 7.5% 1.5% 5.2% 9.3% 2017 2018 2019 2020 (1) Our production facilities, located in Manitowoc, Wisconsin and Abilene, Texas, are situated in close proximity to the prima ry U.S. domestic wind energy and equipment manufacturing hubs. The two facilities have a combined annual tower production capacity of up to approximately 550 towers (1650 tower sections), sufficient to support turbines generating mor e than 1,100 MW of power.
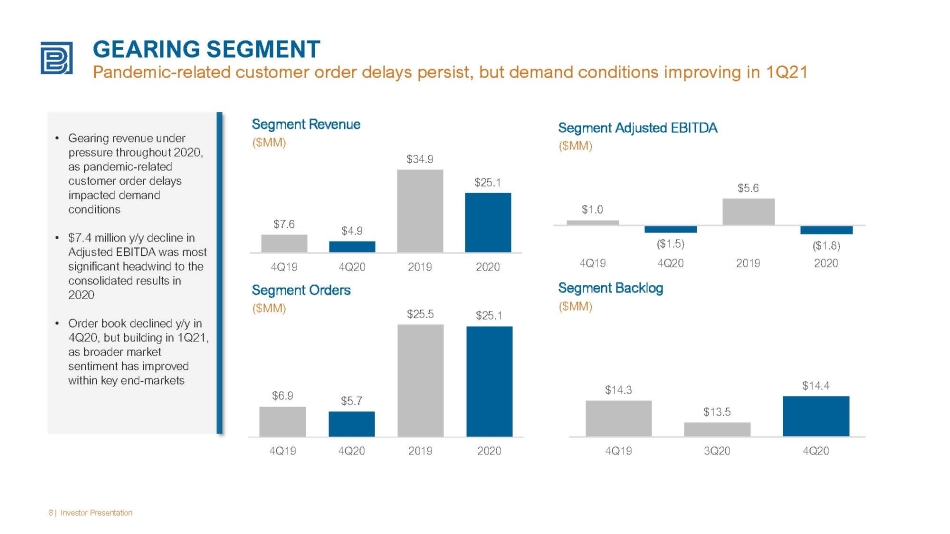
GEARING SEGMENT Pandemic - related customer order delays persist, but demand conditions improving in 1Q21 8 | Investor Presentation Segment Revenue ($MM) Segment Adjusted EBITDA ($MM) Segment Orders ($MM) Segment Backlog ($MM) • Gearing revenue under pressure throughout 2020, as pandemic - related customer order delays impacted demand conditions • $7.4 million y/y decline in Adjusted EBITDA was most significant headwind to the consolidated results in 2020 • Order book declined y/y in 4Q20, but building in 1Q21, as broader market sentiment has improved within key end - markets $7.6 $4.9 $34.9 $25.1 4Q19 4Q20 2019 2020 $1.0 ($1.5) $5.6 ($1.8) 4Q19 4Q20 2019 2020 $6.9 $5.7 $25.5 $25.1 4Q19 4Q20 2019 2020 $14.3 $13.5 $14.4 4Q19 3Q20 4Q20

INDUSTRIAL SOLUTIONS SEGMENT 25% y/y revenue growth support by natural gas turbine and aftermarket demand 9 | Investor Presentation Segment Revenue ($MM) Segment Adjusted EBITDA ($MM) Segment Orders ($MM) Segment Backlog ($MM) • Increased demand for gas turbine components driving growth • $1M y/y full year improvement in Adjusted EBITDA , a result of volume and cost management • Backlog relatively consistent with prior year levels $4.1 $5.8 $14.7 $18.3 4Q19 4Q20 2019 2020 $0.1 $0.5 $0.4 $1.4 4Q19 4Q20 2019 2020 $4.3 $2.7 $16.4 $17.9 4Q19 4Q20 2019 2020 $7.7 $10.3 $7.2 4Q19 3Q20 4Q20
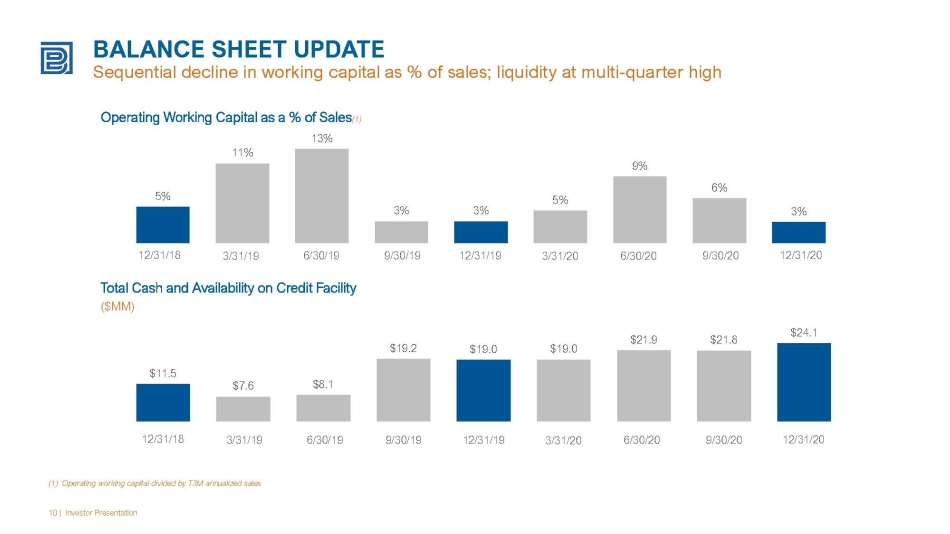
BALANCE SHEET UPDATE S equential decline in working capital as % of sales; liquidity at multi - quarter high 10 | Investor Presentation Total Cash and Availability on Credit Facility ($MM) Operating Working Capital as a % of Sales (1) (1) Operating working capital divided by T3M annualized sales 12/31/20 12/31/18 3/31/19 6/30/19 9/30/19 12/31/19 3/31/20 6/30/20 9/30/20 12/31/20 12/31/18 3/31/19 6/30/19 9/30/19 12/31/19 3/31/20 6/30/20 9/30/20 5% 11% 13% 3% 3% 5% 9% 6% 3% $11.5 $7.6 $8.1 $19.2 $19.0 $19.0 $21.9 $21.8 $24.1

MANAGEMENT OUTLOOK
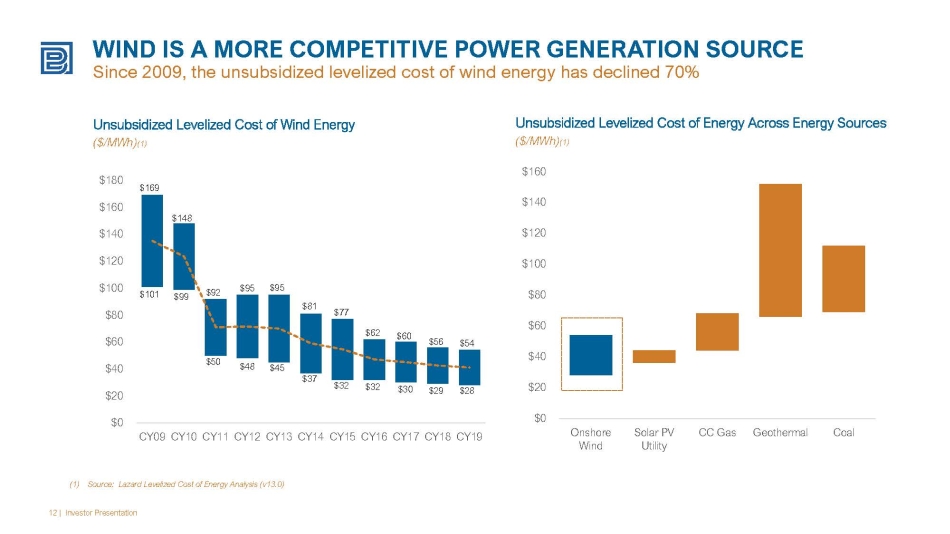
12 | Investor Presentation Unsubsidized Levelized Cost of Wind Energy ($/MWh) (1) (1) Source: Lazard Levelized Cost of Energy Analysis (v13.0) Unsubsidized Levelized Cost of Energy Across Energy Sources ($/MWh) (1) $0 $20 $40 $60 $80 $100 $120 $140 $160 Onshore Wind Solar PV Utility CC Gas Geothermal Coal $0 $20 $40 $60 $80 $100 $120 $140 $160 $180 CY09 CY10 CY11 CY12 CY13 CY14 CY15 CY16 CY17 CY18 CY19 $101 $169 $148 $99 $92 $50 $95 $48 $95 $45 $81 $37 $77 $32 $32 $62 $30 $60 $29 $56 $28 $54 WIND IS A MORE COMPETITIVE POWER GENERATION SOURCE Since 2009, the unsubsidized levelized cost of wind energy has declined 70%

8.0 11.0 16.9 13.3 7.8 6.1 7.5 7.5 CY18 CY19 CY20 CY21 E CY22 E CY23 E CY24 E CY25 E U.S. WIND POWER INSTALLATION FORECAST Reduced cost of wind, clean energy policy agenda likely to improve outlook 13 | Investor Presentation (1) Source: Wood MacKenzie December 2020 Wind Sector Outlook; wind values include new build and repowering U.S. Onshore Wind Capacity Installations (Annual On - Shore GW Installed) (1) • PTC set to expire in 2021, and historically an extension of the PTC has led to significantly increased installations vs. market forecast • U.S. House of Representatives is currently evaluating a bill – The GREEN Act – that would preserve the PTC at the current phaseout level of 60% through the end of 2026 0.0 0.0 0.0 0.8 3.4 5.5 3.7 4.1 4.6 5.8 CY20 CY21 E CY22 E CY23 E CY24 E CY25 E CY26 E CY27 E CY28 E CY29 E • Introduction of new offshore ITC in December 2020 • 22.5 GW of Binding Offshore Wind Mandates and 11.7 GW of Non - binding Goals • Offshore market is key to meeting state policies on the eastern seaboard and transition from fossil fuel generation Before potential PTC extension U.S. Offshore Wind Capacity Installations (Annual Off - Shore GW Installed) (1)

CUSTOMER DIVERSIFICATION INITIATIVE Balanced revenue mix supports long - term growth and profitability 14 | Investor Presentation Wind vs. Non - Wind Revenue Concentration (% of Total Revenue) (1) (1) Wind energy figures shown above exclude repair/replacement demand • Wind and renewables remain our core industry focus • Revenue diversification positions us to better optimize our production capabilities during periods of lower wind tower demand • During the last four years, we have increased non - wind revenue by more than 300% to more than $60 million annually • Pandemic - related headwinds impacted more cyclical, non - wind end - markets in 2020, although we anticipate a gradual recovery in 2021 Fastest Growing Non - Wind Sectors Since 2016 (Absolute Growth in Revenue) 92% 72% 50% 66% 69% 8% 28% 50% 34% 31% 2016 2017 2018 2019 2020 Wind-Revenue Non-Wind Revenue Industrial Mining Power Generation

• Continue to expand market share within NGT, solar, wind and industrial markets through increased business development focus • Expand custom kitting, on - site inventory management, procurement and supply chain management solutions • Leverage single - source procurement, workflow management and quality assurance solutions to help customers reduce cost and improve efficiencies • Sell the remainder of 2021 wind tower capacity (~50% booked) • Add production capabilities and system upgrades to improve asset utilization and drive economies of scale • Continue to evaluate offshore wind market entry points • Expand industrial fabrications customer mix • Further optimize engineering and supply chain to support evolving tower market • Maintain continuous improvement actions to ensure “zero defect” high quality ratings KEY INITIATIVES BY SEGMENT Focus on improved asset utilization, supply chain efficiencies, share expansion and profitable growth 15 | Investor Presentation Heavy Fabrications Segment Organic growth within both core wind, renewables and other markets Gearing Segment Focus on Gearbox market share growth; continue to expand customer mix • Shift sales mix toward cyclical industries benefiting from secular, multi - year growth • Further develop engineering, sales and marketing functions to support a business of scale • Grow custom gearbox business, while moving further into the repair vertical • Cross - sell custom gearbox design, rebuild/replacement, maintenance and in - house treating capabilities Industrial Solutions Segment Focus on sales mix diversification further into renewables and gas turbine market
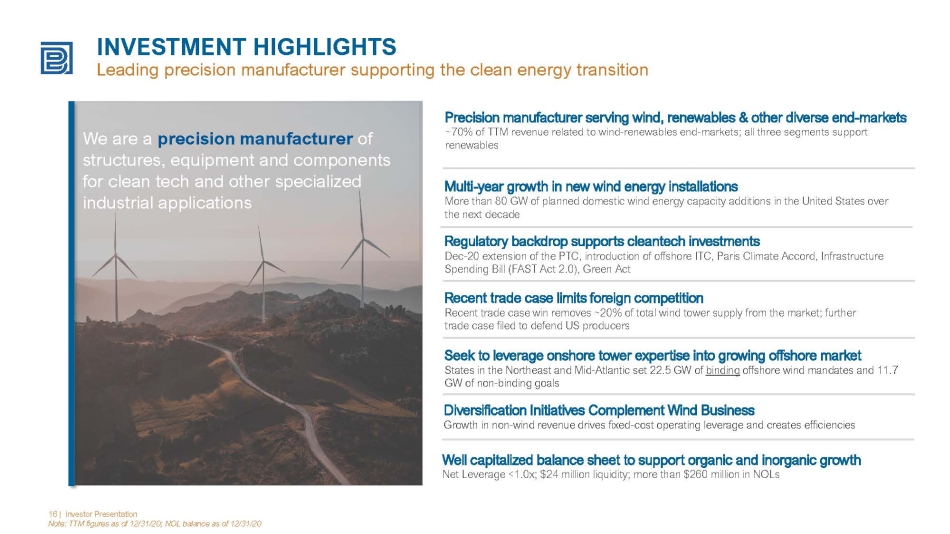
16 | Investor Presentation Note: TTM figures as of 12/31/20; NOL balance as of 12/31/20 INVESTMENT HIGHLIGHTS Leading precision manufacturer supporting the clean energy transition Precision manufacturer serving wind, renewables & other diverse end - markets ~70% of TTM revenue related to wind - renewables end - markets; all three segments support renewables We are a precision manufacturer of structures, equipment and components for clean tech and other specialized industrial applications Multi - year growth in new wind energy installations More than 80 GW of planned domestic wind energy capacity additions in the United States over the next decade Regulatory backdrop supports cleantech investments Dec - 20 extension of the PTC, introduction of offshore ITC, Paris Climate Accord, Infrastructure Spending Bill (FAST Act 2.0), Green Act Recent trade case limits foreign competition Recent trade case win removes ~20% of total wind tower supply from the market; further trade case filed to defend US producers Seek to leverage onshore tower expertise into growing offshore market States in the Northeast and Mid - Atlantic set 22.5 GW of binding offshore wind mandates and 11.7 GW of non - binding goals Diversification Initiatives Complement Wind Business Growth in non - wind revenue drives fixed - cost operating leverage and creates efficiencies Well capitalized balance sheet to support organic and inorganic growth Net Leverage <1.0x; $24 million liquidity; more than $260 million in NOLs

APPENDIX

EXHIBIT A Orders, Revenues and Operating Income (Loss) By Segment 18 | Investor Presentation
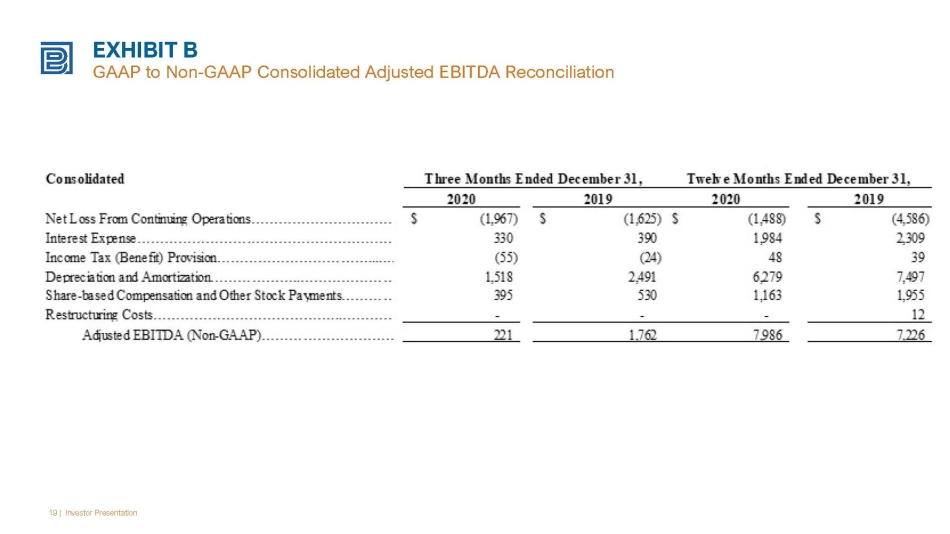
EXHIBIT B GAAP to Non - GAAP Consolidated Adjusted EBITDA Reconciliation 19 | Investor Presentation

EXHIBIT C GAAP to Non - GAAP Adjusted EBITDA Reconciliation By Segment 20 | Investor Presentation
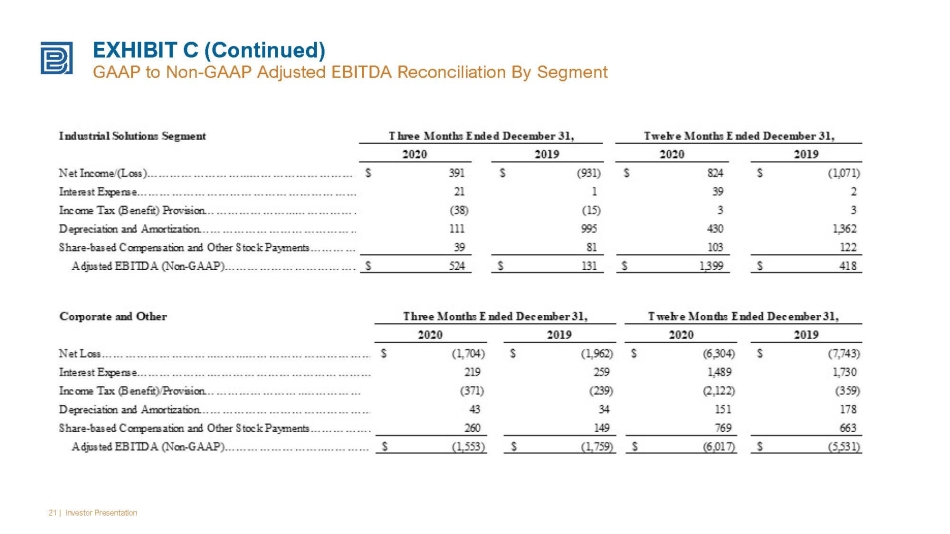
EXHIBIT C (Continued) GAAP to Non - GAAP Adjusted EBITDA Reconciliation By Segment 21 | Investor Presentation

Please contact our investor relations team at Investor@BWEN.com IR CONTACT