Exhibit 99.2

Third Quarter 2021 Results Conference Call Investor Presentation
SAFE - HARBOR STATEMENT 2 | Investor Presentation This release contains “forward looking statements” — that is, statements related to future, not past, events — as defined in Section 21 E of the Securities Exchange Act of 1934 , as amended, that reflect our current expectations regarding our future growth, results of operations, financial condition, cash flows, performance, business prospects and opportunities, as well as assumptions made by, and information currently available to, our management . Forward looking statements include any statement that does not directly relate to a current or historical fact . We have tried to identify forward looking statements by using words such as “anticipate,” “believe,” “expect,” “intend,” “will,” “should,” “may,” “plan” and similar expressions, but these words are not the exclusive means of identifying forward looking statements . Our forward - looking statements may include or relate to our beliefs, expectations, plans and/or assumptions with respect to the following, many of which are, and will be, amplified by the COVID - 19 pandemic : (i) the impact of global health concerns, including the impact of the current COVID - 19 pandemic on the economies and financial markets and the demand for our products ; (ii) state, local and federal regulatory frameworks affecting the industries in which we compete, including the wind energy industry, and the related extension, continuation or renewal of federal tax incentives and grants and state renewable portfolio standards as well as new or continuing tariffs on steel or other products imported into the United States ; (iii) our customer relationships and our substantial dependency on a few significant customers and our efforts to diversify our customer base and sector focus and leverage relationships across business units ; (iv) the economic and operational stability of our significant customers and suppliers, including their respective supply chains, and the ability to source alternative suppliers as necessary, in light of the COVID - 19 pandemic ; (v) our ability to continue to grow our business organically and through acquisitions, and the impairment thereto by the impact of the COVID - 19 pandemic ; (vi) the production, sales, collections, customer deposits and revenues generated by new customer orders and our ability to realize the resulting cash flows ; (vii) information technology failures, network disruptions, cybersecurity attacks or breaches in data security, including with respect to any remote work arrangements implemented in response to the COVID - 19 pandemic ; (viii) the sufficiency of our liquidity and alternate sources of funding, if necessary ; (ix) our ability to realize revenue from customer orders and backlog ; (x) our ability to operate our business efficiently, comply with our debt obligations, manage capital expenditures and costs effectively, and generate cash flow ; (xi) the economy, including its stability in light of the COVID - 19 pandemic, and the potential impact it may have on our business, including our customers ; (xii) the state of the wind energy market and other energy and industrial markets generally and the impact of competition and economic volatility in those markets ; (xiii) the effects of market disruptions and regular market volatility, including fluctuations in the price of oil, gas and other commodities ; (xiv) competition from new or existing industry participants including, in particular, increased competition from foreign tower manufacturers ; (xv) the effects of the change of administrations in the U . S . federal government ; (xvi) our ability to successfully integrate and operate acquired companies and to identify, negotiate and execute future acquisitions ; (xvii) the potential loss of tax benefits if we experience an “ownership change” under Section 382 of the Internal Revenue Code of 1986 , as amended ; (xviii) our ability to utilize various relief options enabled by the CARES Act, including our ability to receive forgiveness of the PPP Loans ; (xix) the limited trading market for our securities and the volatility of market price for our securities ; and (xx) the impact of future sales of our common stock or securities convertible into our common stock on our stock price . These statements are based on information currently available to us and are subject to various risks, uncertainties and other factors that could cause our actual growth, results of operations, financial condition, cash flows, performance, business prospects and opportunities to differ materially from those expressed in, or implied by, these statements including, but not limited to, those set forth under the caption “Risk Factors” in Part I, Item 1 A of our Annual Report on Form 10 - K for the year ended December 31 , 2020 . We are under no duty to update any of these statements . You should not consider any list of such factors to be an exhaustive statement of all of the risks, uncertainties or other factors that could cause our current beliefs, expectations, plans and/or assumptions to change . Accordingly, forward - looking statements should not be relied upon as a predictor of actual results .

PERFORMANCE OVERVIEW
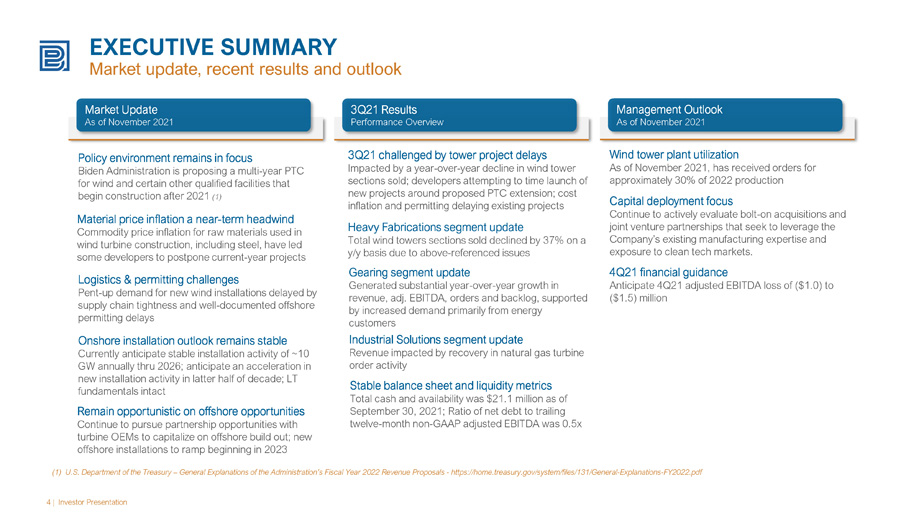
4 | Investor Presentation EXECUTIVE SUMMARY Market update, recent results and outlook Market Update As of November 2021 3Q21 Results Performance Overview Management Outlook As of November 2021 Material price inflation a near - term headwind Commodity price inflation for raw materials used in wind turbine construction, including steel, have led some developers to postpone current - year projects 3Q21 challenged by tower project delays Impacted by a year - over - year decline in wind tower sections sold; developers attempting to time launch of new projects around proposed PTC extension; cost inflation and permitting delaying existing projects Heavy Fabrications segment update Total wind towers sections sold declined by 37% on a y/y basis due to above - referenced issues Gearing segment update Generated substantial year - over - year growth in revenue, adj. EBITDA, orders and backlog, supported by increased demand primarily from energy customers Industrial Solutions segment update Revenue impacted by recovery in natural gas turbine order activity (1) U.S. Department of the Treasury – General Explanations of the Administration’s Fiscal Year 2022 Revenue Proposals - https:/ /home.treasury.gov/system/files/131/General - Explanations - FY2022.pdf Wind tower plant utilization As of November 2021, has received orders for approximately 30% of 2022 production 4Q21 financial guidance Anticipate 4Q21 adjusted EBITDA loss of ($1.0) to ($1.5) million Policy environment remains in focus Biden Administration is proposing a multi - year PTC for wind and certain other qualified facilities that begin construction after 2021 (1) Capital deployment focus Continue to actively evaluate bolt - on acquisitions and joint venture partnerships that seek to leverage the Company’s existing manufacturing expertise and exposure to clean tech markets. Logistics & permitting challenges Pent - up demand for new wind installations delayed by supply chain tightness and well - documented offshore permitting delays Onshore installation outlook remains stable Currently anticipate stable installation activity of ~10 GW annually thru 2026; anticipate an acceleration in new installation activity in latter half of decade; LT fundamentals intact Remain opportunistic on offshore opportunities Continue to pursue partnership opportunities with turbine OEMs to capitalize on offshore build out; new offshore installations to ramp beginning in 2023 Stable balance sheet and liquidity metrics Total cash and availability was $21.1 million as of September 30, 2021; Ratio of net debt to trailing twelve - month non - GAAP adjusted EBITDA was 0.5x
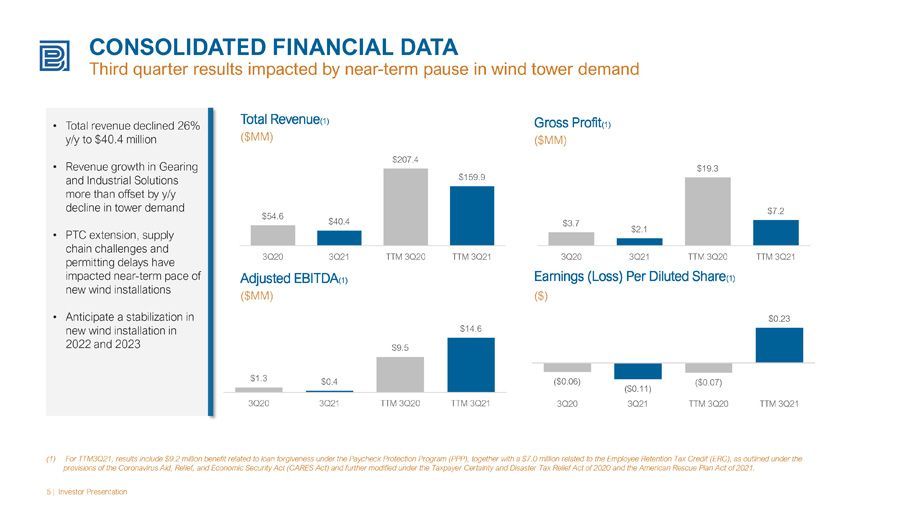
CONSOLIDATED FINANCIAL DATA Third quarter results impacted by near - term pause in wind tower demand 5 | Investor Presentation Total Revenue (1) ($MM) Gross Profit (1) ($MM) Adjusted EBITDA (1) ($MM) Earnings (Loss) Per Diluted Share (1) ($) • Total revenue declined 26% y/y to $40.4 million • Revenue growth in Gearing and Industrial Solutions more than offset by y/y decline in tower demand • PTC extension, supply chain challenges and permitting delays have impacted near - term pace of new wind installations • Anticipate a stabilization in new wind installation in 2022 and 2023 (1) For TTM3Q21, results include $9.2 million benefit related to loan forgiveness under the Paycheck Protection Program (PPP), to ge ther with a $7.0 million related to the Employee Retention Tax Credit (ERC), as outlined under the provisions of the Coronavirus Aid, Relief, and Economic Security Act (CARES Act) and further modified under the Taxpayer Cert ain ty and Disaster Tax Relief Act of 2020 and the American Rescue Plan Act of 2021. $54.6 $40.4 $207.4 $159.9 3Q20 3Q21 TTM 3Q20 TTM 3Q21 $3.7 $2.1 $19.3 $7.2 3Q20 3Q21 TTM 3Q20 TTM 3Q21 $1.3 $0.4 $9.5 $14.6 3Q20 3Q21 TTM 3Q20 TTM 3Q21 ($0.06) ($0.11) ($0.07) $0.23 3Q20 3Q21 TTM 3Q20 TTM 3Q21
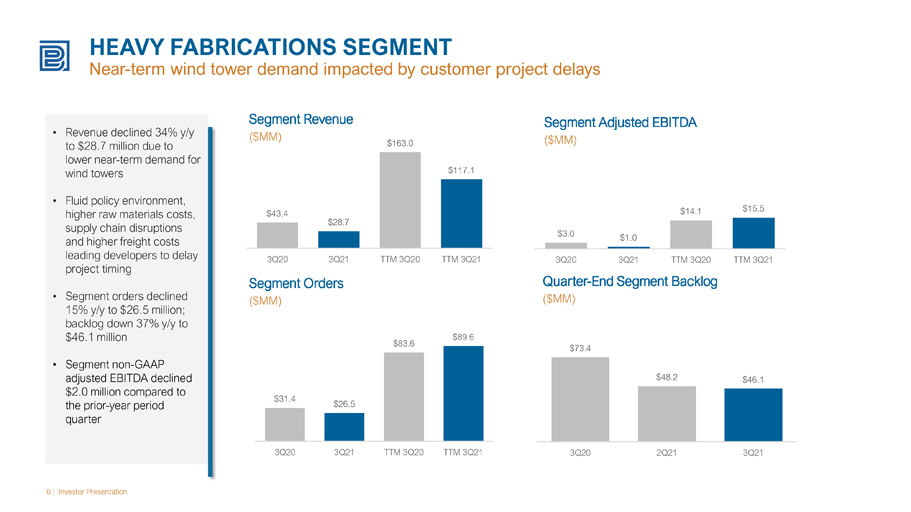
HEAVY FABRICATIONS SEGMENT Near - term wind tower demand impacted by customer project delays 6 | Investor Presentation Segment Revenue ($MM) Segment Adjusted EBITDA ($MM) Segment Orders ($MM) Quarter - End Segment Backlog ($MM) • Revenue declined 34% y/y to $28.7 million due to lower near - term demand for wind towers • Fluid policy environment, higher raw materials costs, supply chain disruptions and higher freight costs leading developers to delay project timing • Segment orders declined 15% y/y to $26.5 million; backlog down 37% y/y to $46.1 million • Segment non - GAAP adjusted EBITDA declined $2.0 million compared to the prior - year period quarter $31.4 $26.5 $83.6 $89.6 3Q20 3Q21 TTM 3Q20 TTM 3Q21 $73.4 $48.2 $46.1 3Q20 2Q21 3Q21 $43.4 $28.7 $163.0 $117.1 3Q20 3Q21 TTM 3Q20 TTM 3Q21 $3.0 $1.0 $14.1 $15.5 3Q20 3Q21 TTM 3Q20 TTM 3Q21
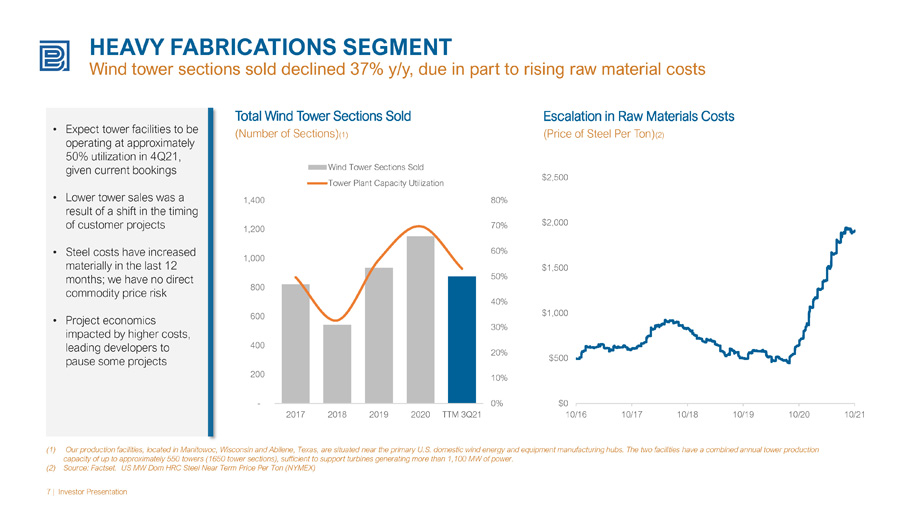
HEAVY FABRICATIONS SEGMENT Wind tower sections sold declined 37% y/y, due in part to rising raw material costs 7 | Investor Presentation Total Wind Tower Sections Sold (Number of Sections) (1) Escalation in Raw Materials Costs (Price of Steel Per Ton) (2) • Expect tower facilities to be operating at approximately 50% utilization in 4Q21, given current bookings • Lower tower sales was a result of a shift in the timing of customer projects • Steel costs have increased materially in the last 12 months; we have no direct commodity price risk • Project economics impacted by higher costs, leading developers to pause some projects (1) Our production facilities, located in Manitowoc, Wisconsin and Abilene, Texas, are situated near the primary U.S. domestic wi nd energy and equipment manufacturing hubs. The two facilities have a combined annual tower production capacity of up to approximately 550 towers (1650 tower sections), sufficient to support turbines generating more than 1,100 M W o f power. (2) Source: Factset. US MW Dom HRC Steel Near Term Price Per Ton (NYMEX) 0% 10% 20% 30% 40% 50% 60% 70% 80% - 200 400 600 800 1,000 1,200 1,400 2017 2018 2019 2020 TTM 3Q21 Wind Tower Sections Sold Tower Plant Capacity Utilization $0 $500 $1,000 $1,500 $2,000 $2,500 10/16 10/17 10/18 10/19 10/20 10/21
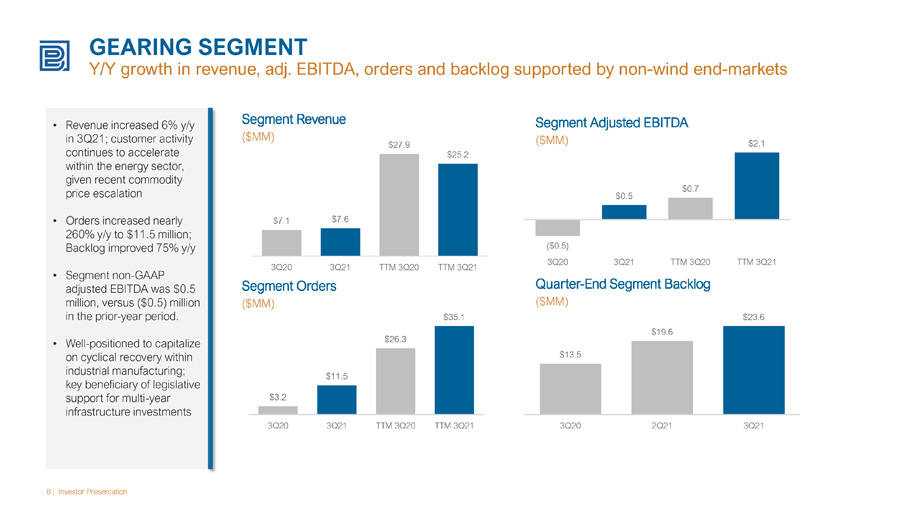
GEARING SEGMENT Y/Y growth in revenue, adj. EBITDA, orders and backlog supported by non - wind end - markets 8 | Investor Presentation Segment Revenue ($MM) Segment Adjusted EBITDA ($MM) Segment Orders ($MM) Quarter - End Segment Backlog ($MM) • Revenue increased 6% y/y in 3Q21; customer activity continues to accelerate within the energy sector, given recent commodity price escalation • Orders increased nearly 260% y/y to $11.5 million; Backlog improved 75% y/y • Segment non - GAAP adjusted EBITDA was $0.5 million, versus ($0.5) million in the prior - year period. • Well - positioned to capitalize on cyclical recovery within industrial manufacturing; key beneficiary of legislative support for multi - year infrastructure investments $7.1 $7.6 $27.9 $25.2 3Q20 3Q21 TTM 3Q20 TTM 3Q21 ($0.5) $0.5 $0.7 $2.1 3Q20 3Q21 TTM 3Q20 TTM 3Q21 $3.2 $11.5 $26.3 $35.1 3Q20 3Q21 TTM 3Q20 TTM 3Q21 $13.5 $19.6 $23.6 3Q20 2Q21 3Q21
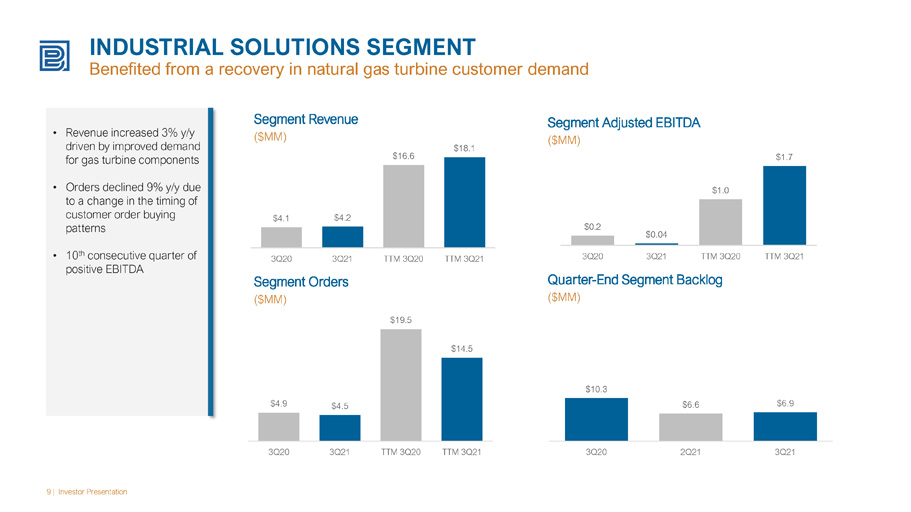
INDUSTRIAL SOLUTIONS SEGMENT Benefited from a recovery in natural gas turbine customer demand 9 | Investor Presentation Segment Revenue ($MM) Segment Adjusted EBITDA ($MM) Segment Orders ($MM) Quarter - End Segment Backlog ($MM) • Revenue increased 3% y/y driven by improved demand for gas turbine components • Orders declined 9% y/y due to a change in the timing of customer order buying patterns • 10 th consecutive quarter of positive EBITDA $4.1 $4.2 $16.6 $18.1 3Q20 3Q21 TTM 3Q20 TTM 3Q21 $0.2 $0.04 $1.0 $1.7 3Q20 3Q21 TTM 3Q20 TTM 3Q21 $4.9 $4.5 $19.5 $14.5 3Q20 3Q21 TTM 3Q20 TTM 3Q21 $10.3 $6.6 $6.9 3Q20 2Q21 3Q21
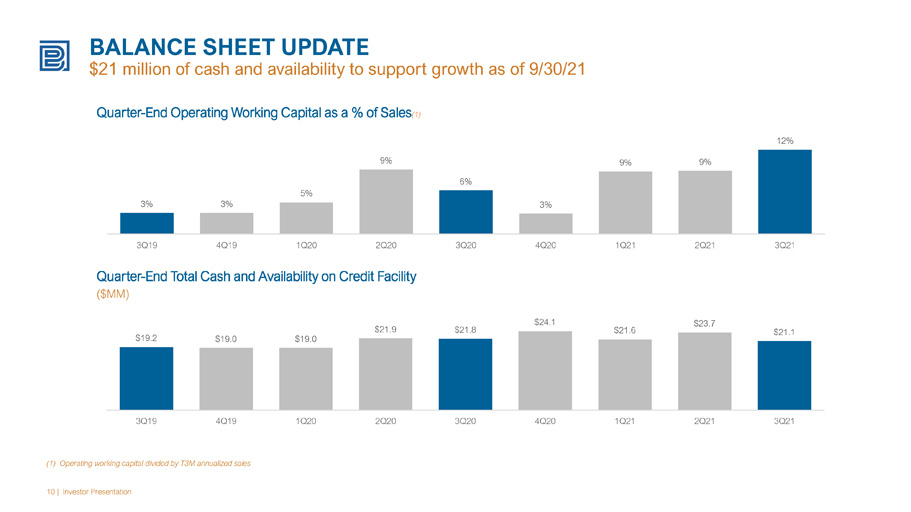
BALANCE SHEET UPDATE $21 million of cash and availability to support growth as of 9/30/21 10 | Investor Presentation Quarter - End Total Cash and Availability on Credit Facility ($MM) Quarter - End Operating Working Capital as a % of Sales (1) (1) Operating working capital divided by T3M annualized sales 3% 3% 5% 9% 6% 3% 9% 9% 12% 3Q19 4Q19 1Q20 2Q20 3Q20 4Q20 1Q21 2Q21 3Q21 $19.2 $19.0 $19.0 $21.9 $21.8 $24.1 $21.6 $23.7 $21.1 3Q19 4Q19 1Q20 2Q20 3Q20 4Q20 1Q21 2Q21 3Q21

U.S. WIND POWER INSTALLATION FORECAST Biden Administration considering multi - year extension of the Production Tax Credit 11 | Investor Presentation (1) Source: Wood MacKenzie 3Q21 Wind Sector Outlook; wind values include new build and repowering U.S. Onshore Wind Capacity Installations (Annual On - Shore GW Installed) (1) • IRS’ decision to extend the Continuity Safe Harbor in July - 21 allows developers six years to complete projects - and still receive the PTC – for projects commenced between 2016 - 2019 remains a LT catalyst for new wind installations • Develo pers postponing projects to assess near - term policy developments; delays also related to raw material cost increases and supply chain challenges, which have impacted NT project economics • Domestic offshore wind installations expected to exceed 32 GW between 2023 and 2030 • 14 GW of offshore projects are already contracted or expected to be approved, up from 9 GW in 2020; most states on track to reach mandates • Biden Administration taking steps to accelerate permitting of offshore wind developments U.S. Offshore Wind Capacity Installations (Annual Off - Shore GW Installed) (1) 13.7 9.8 9.5 8.7 9.2 9.3 11.2 11.9 11.7 11.4 2021 2022e 2023e 2024e 2025e 2026e 2027e 2028e 2029e 2030e 2Q21 Forecast 3Q21 Forecast 0.7 1.8 4.5 4.4 5.9 4.9 5.4 4.8 2023e 2024e 2025e 2026e 2027e 2028e 2029e 2030e 2Q21 Forecast 3Q21 Forecast
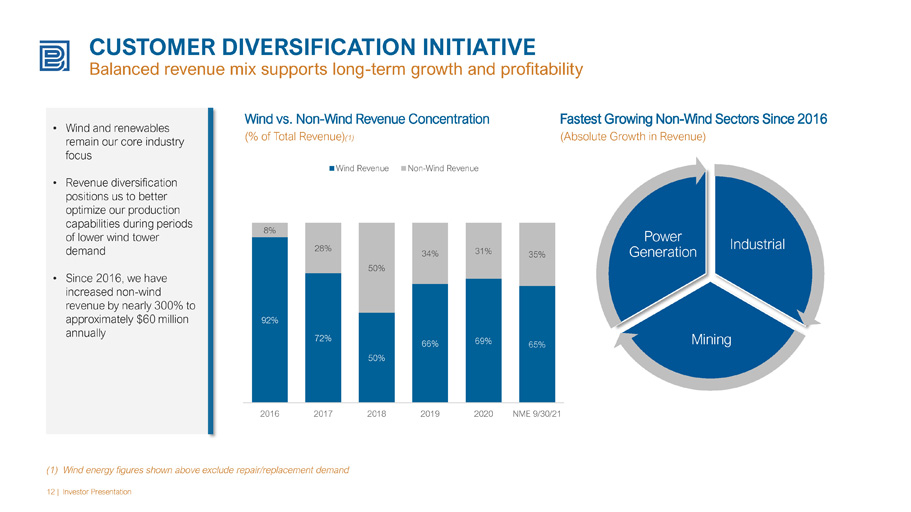
CUSTOMER DIVERSIFICATION INITIATIVE Balanced revenue mix supports long - term growth and profitability 12 | Investor Presentation Wind vs. Non - Wind Revenue Concentration (% of Total Revenue) (1) (1) Wind energy figures shown above exclude repair/replacement demand • Wind and renewables remain our core industry focus • Revenue diversification positions us to better optimize our production capabilities during periods of lower wind tower demand • Since 2016, we have increased non - wind revenue by nearly 300% to approximately $60 million annually Fastest Growing Non - Wind Sectors Since 2016 (Absolute Growth in Revenue) Industrial Mining Power Generation 92% 72% 50% 66% 69% 65% 8% 28% 50% 34% 31% 35% 2016 2017 2018 2019 2020 NME 9/30/21 Wind Revenue Non-Wind Revenue

APPENDIX

EXHIBIT A Orders, Revenues & Operating Income (Loss) Consolidated and by Segment 14 | Investor Presentation Three Months Ended Nine Months Ended 2021 2020 2021 2020 ORDERS: Heavy Fabrications………………………………………………………………26,539$ 31,391$ 62,096$ 78,306$ Gearing………………………………………………………………11,546 3,225 29,325 19,376 Industrial Solutions………………………………………………………………4,512 4,939 11,831 15,240 Total orders………………………………...………………42,597$ 39,555$ 103,252$ 112,922$ REVENUES: Heavy Fabrications………………………………………………………………28,675$ 43,440$ 87,282$ 125,424$ Gearing………………………………………………………………7,562 7,125 20,315 20,273 Industrial Solutions………………………………………………………………4,213 4,081 12,357 12,516 Corporate and Other……………………………………………………………(61) (32) (346) (39) Total revenues…………………………………..……………………40,389$ 54,614$ 119,608$ 158,174$ OPERATING (LOSS)/PROFIT: Heavy Fabrications………………………………………………………………(445)$ 2,020$ (1,873)$ 8,760$ Gearing………………………………………………………………(219) (1,023) (2,090) (1,935) Industrial Solutions………………………………………………………………(108) 87 (169) 496 Corporate and Other……………………………………………………………(1,225) (1,559) (4,487) (5,081) Total operating profit/(loss)……………………………………(1,997)$ (475)$ (8,619)$ 2,240$ September 30, September 30,
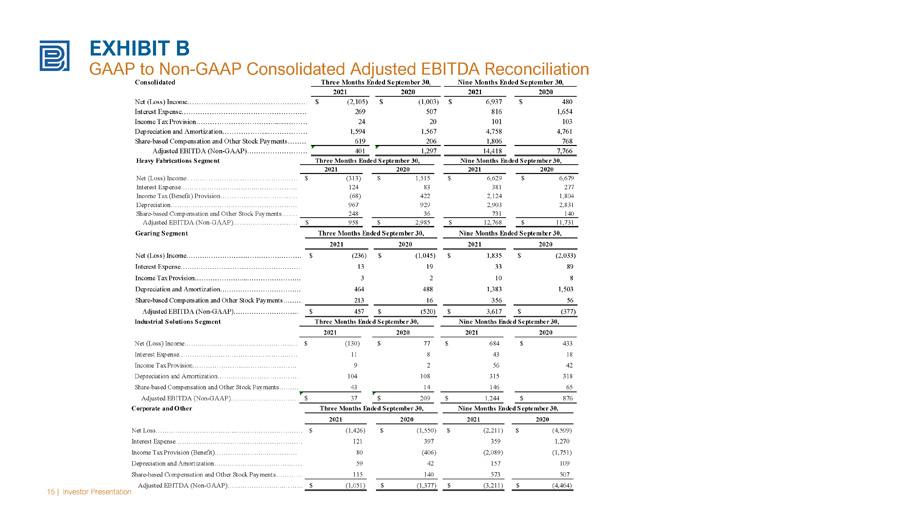
EXHIBIT B GAAP to Non - GAAP Consolidated Adjusted EBITDA Reconciliation 15 | Investor Presentation 15 | Investor Presentation Consolidated 2021 2020 2021 2020 Net (Loss) Income……………..…………...………………………………………(2,105)$ (1,003)$ 6,937$ 480$ Interest Expense…………………….……………………………………. 269 507 816 1,654 Income Tax Provision…………………………….....…………………… 24 20 101 103 Depreciation and Amortization………………..……………………………………………………1,594 1,567 4,758 4,761 Share-based Compensation and Other Stock Payments………………………………………………………………619 206 1,806 768 Adjusted EBITDA (Non-GAAP)…………………………. 401 1,297 14,418 7,766 Three Months Ended September 30, Nine Months Ended September 30, Heavy Fabrications Segment 2021 2020 2021 2020 Net (Loss) Income……………………...…………………………….……. (313)$ 1,515$ 6,629$ 6,679$ Interest Expense……………………………..……………………. 124 83 381 277 Income Tax (Benefit) Provision……..…………………...…………………… (68) 422 2,124 1,804 Depreciation……………………………………………………………… 967 929 2,903 2,831 Share-based Compensation and Other Stock Payments………………………………………………………………248 36 731 140 Adjusted EBITDA (Non-GAAP)…………………………….. 958$ 2,985$ 12,768$ 11,731$ Three Months Ended September 30, Nine Months Ended September 30, Gearing Segment 2021 2020 2021 2020 Net (Loss) Income……………………...……………………...……………. (236)$ (1,045)$ 1,835$ (2,033)$ Interest Expense………………………...……………………………… 13 19 33 89 Income Tax Provision…………………...…………………… 3 2 10 8 Depreciation and Amortization………………………………………………………………464 488 1,383 1,503 Share-based Compensation and Other Stock Payments………………………………………………………………213 16 356 56 Adjusted EBITDA (Non-GAAP)……………………….. 457$ (520)$ 3,617$ (377)$ Three Months Ended September 30, Nine Months Ended September 30, Industrial Solutions Segment 2021 2020 2021 2020 Net (Loss) Income……………………...……...……………………………. (130)$ 77$ 684$ 433$ Interest Expense……………………………………………………. 11 8 43 18 Income Tax Provision…………………...…………………… 9 2 56 42 Depreciation and Amortization……………………………………. 104 108 315 318 Share-based Compensation and Other Stock Payments………… 43 14 146 65 Adjusted EBITDA (Non-GAAP)……………………………… 37$ 209$ 1,244$ 876$ Three Months Ended September 30, Nine Months Ended September 30, Corporate and Other 2021 2020 2021 2020 Net Loss………………………..……...……………………………. (1,426)$ (1,550)$ (2,211)$ (4,599)$ Interest Expense……………….…………………………………… 121 397 359 1,270 Income Tax Provision (Benefit)…………………..…………… 80 (406) (2,089) (1,751) Depreciation and Amortization………………………………………………………………59 42 157 109 Share-based Compensation and Other Stock Payments………………………………………………………………115 140 573 507 Adjusted EBITDA (Non-GAAP)……………………..……………. (1,051)$ (1,377)$ (3,211)$ (4,464)$ Three Months Ended September 30, Nine Months Ended September 30,
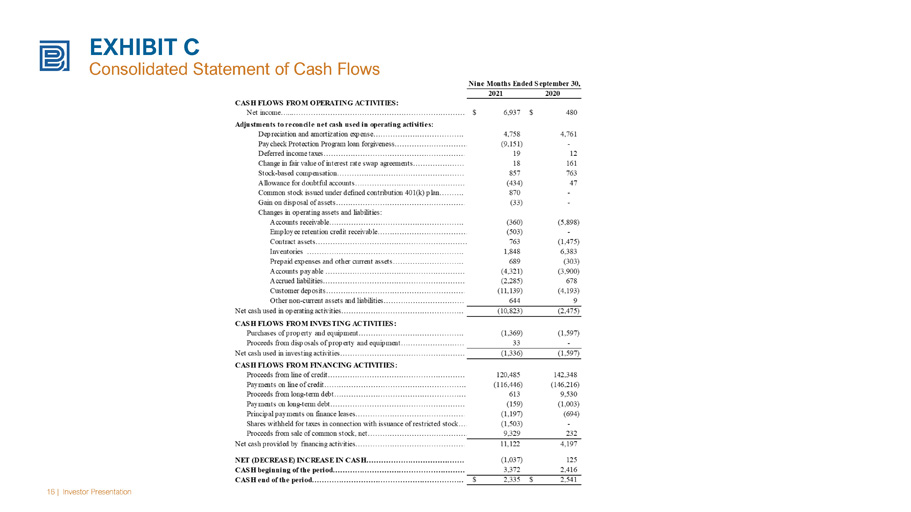
EXHIBIT C Consolidated Statement of Cash Flows 16 | Investor Presentation
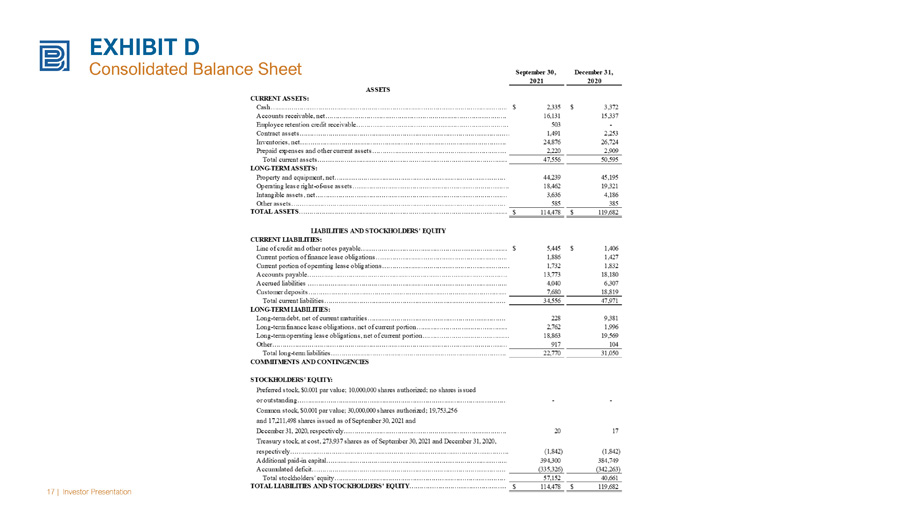
EXHIBIT D Consolidated Balance Sheet 17 | Investor Presentation

Please contact our investor relations team at Investor@BWEN.com IR CONTACT