UNITED STATES
SECURITIES AND EXCHANGE COMMISSION
Washington, D.C. 20549
FORM N-CSR
CERTIFIED SHAREHOLDER REPORT OF REGISTERED MANAGEMENT INVESTMENT COMPANIES
Investment Company Act file number 811-10145
Baillie Gifford Funds
(Exact name of registrant as specified in charter)
1 Greenside Row
Edinburgh, Scotland, UK, EH1 3AN
(Address of principal executive offices) (Zip code)
Gareth Griffiths
1 Greenside Row
Edinburgh, Scotland, UK, EH1 3AN
(Name and address of agent for service)
Registrant's telephone number, including area code: 011-44-131-275-2000
Date of fiscal year end: December 31
Date of reporting period: December 31, 2022
Form N-CSR is to be used by management investment companies to file reports with the Commission not later than 10 days after the transmission to stockholders of any report that is required to be transmitted to stockholders under Rule 30e-1 under the Investment Company Act of 1940 (17 CFR 270.30e-1). The Commission may use the information provided on Form N-CSR in its regulatory, disclosure review, inspection, and policymaking roles.
A registrant is required to disclose the information specified by Form N-CSR, and the Commission will make this information public. A registrant is not required to respond to the collection of information contained in Form N-CSR unless the Form displays a currently valid Office of Management and Budget ("OMB") control number. Please direct comments concerning the accuracy of the information collection burden estimate and any suggestions for reducing the burden to Secretary, Securities and Exchange Commission, 450 Fifth Street, NW, Washington, DC 20549-0609. The OMB has reviewed this collection of information under the clearance requirements of 44 U.S.C. § 3507.
Item 1. Reports to Stockholders.
| (a) | Include a copy of the report transmitted to stockholders pursuant to Rule 30e-1 under the Act (17 CFR 270.30e-1). |
BAILLIE GIFFORD FUNDS
Baillie Gifford China A Shares Growth Fund
Baillie Gifford China Equities Fund
Baillie Gifford Developed EAFE All Cap Fund
Baillie Gifford EAFE Plus All Cap Fund
Baillie Gifford Emerging Markets Equities Fund
Baillie Gifford Emerging Markets ex China Fund
Baillie Gifford Global Alpha Equities Fund
Baillie Gifford Global Stewardship Equities Fund
Baillie Gifford Health Innovation Equities Fund
Baillie Gifford International Alpha Fund
Baillie Gifford International Concentrated Growth Equities Fund
Baillie Gifford International Growth Fund
Baillie Gifford International Smaller Companies Fund
Baillie Gifford Long Term Global Growth Fund
Baillie Gifford U.S. Discovery Fund
Baillie Gifford U.S. Equity Growth Fund
Annual Report
December 31, 2022


Index
Page Number | |||||||
01 | Shareholder Letter | ||||||
04 | Management Discussion | ||||||
46 | Fund Expenses | ||||||
Baillie Gifford China A Shares Growth Fund | |||||||
53 | Industry Diversification Table | ||||||
54 | Portfolio of Investments | ||||||
56 | Financial Statements | ||||||
59 | Financial Highlights | ||||||
Baillie Gifford China Equities Fund | |||||||
61 | Industry Diversification Table | ||||||
62 | Portfolio of Investments | ||||||
64 | Financial Statements | ||||||
67 | Financial Highlights | ||||||
Baillie Gifford Developed EAFE All Cap Fund | |||||||
69 | Industry Diversification Table | ||||||
70 | Portfolio of Investments | ||||||
74 | Financial Statements | ||||||
77 | Financial Highlights | ||||||
Baillie Gifford EAFE Plus All Cap Fund | |||||||
81 | Industry Diversification Table | ||||||
82 | Portfolio of Investments | ||||||
86 | Financial Statements | ||||||
89 | Financial Highlights | ||||||
Baillie Gifford Emerging Markets Equities Fund | |||||||
93 | Industry Diversification Table | ||||||
94 | Portfolio of Investments | ||||||
99 | Financial Statements | ||||||
102 | Financial Highlights | ||||||
Baillie Gifford Emerging Markets ex China Fund | |||||||
108 | Industry Diversification Table | ||||||
109 | Portfolio of Investments | ||||||
113 | Financial Statements | ||||||
116 | Financial Highlights | ||||||
Baillie Gifford Global Alpha Equities Fund | |||||||
118 | Industry Diversification Table | ||||||
119 | Portfolio of Investments | ||||||
124 | Financial Statements | ||||||
127 | Financial Highlights | ||||||
Baillie Gifford Global Stewardship Equities Fund | |||||||
132 | Industry Diversification Table | ||||||
133 | Portfolio of Investments | ||||||
137 | Financial Statements | ||||||
140 | Financial Highlights | ||||||
Baillie Gifford Health Innovation Equities Fund | |||||||
142 | Industry Diversification Table | ||||||
143 | Portfolio of Investments | ||||||
145 | Financial Statements | ||||||
148 | Financial Highlights | ||||||
Baillie Gifford International Alpha Fund | |||||||
150 | Industry Diversification Table | ||||||
151 | Portfolio of Investments | ||||||
156 | Financial Statements | ||||||
159 | Financial Highlights | ||||||
Baillie Gifford International Concentrated Growth Equities Fund | |||||||
165 | Industry Diversification Table | ||||||
166 | Portfolio of Investments | ||||||
168 | Financial Statements | ||||||
171 | Financial Highlights | ||||||
Page Number | |||||||
Baillie Gifford International Growth Fund | |||||||
173 | Industry Diversification Table | ||||||
174 | Portfolio of Investments | ||||||
178 | Financial Statements | ||||||
181 | Financial Highlights | ||||||
Baillie Gifford International Smaller Companies Fund | |||||||
187 | Industry Diversification Table | ||||||
188 | Portfolio of Investments | ||||||
193 | Financial Statements | ||||||
196 | Financial Highlights | ||||||
Baillie Gifford Long Term Global Growth Fund | |||||||
198 | Industry Diversification Table | ||||||
199 | Portfolio of Investments | ||||||
201 | Financial Statements | ||||||
204 | Financial Highlights | ||||||
Baillie Gifford U.S. Discovery Fund | |||||||
208 | Industry Diversification Table | ||||||
209 | Portfolio of Investments | ||||||
211 | Financial Statements | ||||||
214 | Financial Highlights | ||||||
Baillie Gifford U.S. Equity Growth Fund | |||||||
216 | Industry Diversification Table | ||||||
217 | Portfolio of Investments | ||||||
219 | Financial Statements | ||||||
222 | Financial Highlights | ||||||
224 | Notes to Financial Statements | ||||||
252 | Report of Independent Registered Public Accounting Firm | ||||||
Supplemental Information | |||||||
254 | Federal Income Tax Information | ||||||
256 | Management of the Trust | ||||||
The statements and views expressed in this report are as of this report's period end and are subject to change at any time based on a variety of factors. The respective parties disclaim any responsibility to update such views. Actual outcomes may differ significantly from the views expressed.
These views may not be relied on as investment advice or as an indication of trading intent on behalf of any of the Funds.
All investments entail risk, including the possible loss of principal.

Scenic view of the Glenfinnan Viaduct, Glenfinnan, Scotland
Source: © Getty Images
Shareholder Letter (unaudited)
Annual Report December 31, 2022
Dear Shareholder,
We recognize that this has been a very challenging year for many of our Funds after a long period of strong performance. Stock markets have turned sharply against many higher-growth companies, even where their underlying operations remain robust. For most Funds, these disappointing short-term returns have impacted longer-term results, with a mixed performance picture over five years.
The investment headwinds have been of a type not seen for many years. Following the sudden and enormous demand shock brought about by the COVID-19 pandemic, we have seen the return of inflation. This is a phenomenon that many commentators believed had been conquered. Interest rates, until recently at very low levels, have risen rapidly as a result. It may well be that they will continue to do so and remain higher than levels experienced over the past 14 years. Unwinding such loose monetary policy was always likely to have been painful, but this tightening backdrop has made for one of the worst years in memory for major global markets, especially for those investing in growth. On top of this, trade tensions between the U.S. and China have intensified, and the conflict in Ukraine has introduced a geopolitical crisis. A supply shock, particularly in some forms of energy, has followed.
This is relevant for Baillie Gifford Funds because of our strong preference for growth companies. We expect many of these to generate a large proportion of their cash and profits over the long term rather than the immediate future. Done successfully over long periods, the reward for identifying successful growth companies comes from their superior share price performance. But in recent months, this relationship has reversed: those companies whose cashflows derive most from the long term have performed least well. This is because a rise in long-term interest rates can cause growth stocks, which tend to have longer-term cash flow horizons than value stocks, to be more heavily discounted. As a result, growth stocks appear less valuable and suffer greater share price declines.
In the context of such a challenging recent experience, it feels appropriate to step back and reiterate what we are aiming to do for you. We have always highlighted our emphasis on investing in businesses that have the potential to grow more rapidly than their peers over the long term. We choose to do this because there's a solid case that such companies are rewarded by stronger share price performance. While we recognize that this approach feels very uncomfortable at times like the present, patience is needed for it to work.
Our efforts are focused on two key areas. Firstly, we must assure ourselves as to the strength of the investment case and the fundamentals of every business in which we invest. This involves monitoring, questioning, and — where market realities have not met our expectations — selling. In most cases, we have found that your holdings are resilient and continue to meet the high bar we have set for them. Secondly, we must be open to fresh long-term opportunities created by the share price falls we have seen. These have been indiscriminate across different types of growth companies, making it possible for us to acquire several exciting new holdings across the Funds.
Throughout market cycles, we always have a choice. We could pursue the shorter-term rewards offered by the types of companies that are benefitting most from the current environment. Alternatively, we could continue to invest in the way that we know best, sticking to the approach that has served our shareholders well over many decades. Our 114-year history has seen headwinds of many kinds, including wars, acts of terror, pandemics and banking crises.
Our experience of past underperformance periods has taught us that we cannot be in favor throughout all market conditions. We have learned to stay focused on our process during difficult periods like the present.
Following similar periods of significant disruption, such as the early 2000s, we have seen the best-run companies with strong and durable growth opportunities rise to the top. Compared to the past, we believe there are more high-quality growth businesses producing positive cash flow and earnings growth today. This bodes well for future long-term success.
01
Shareholder Letter (unaudited)
Annual Report December 31, 2022
As we enter 2023, we appear to be in an early stage of economic slowdown, when investors typically focus more on near-term valuations, take profits from recent winners and generally become more cautious. We have invested through several full market and economic cycles and have been in this position before. We would observe that following the recent growth stock sell-off and amid the increasingly challenging economic environment, we see significant opportunities for long-term investors.
From here, we believe fundamentals will matter more, and the quality of our stock-picking should be rewarded. Our portfolio managers are optimistic about the following investment opportunities:
• Technological innovation has been an almost omnipresent feature across all Funds. We believe this will continue to have a positive impact across more companies and business models over the long term.
• Notable here are semiconductor and software companies with strong and visible profits. Cloud service providers also merit continued long-term conviction. The most exceptional companies operating in these areas will help provide cost savings, improve agility and drive productivity improvements for businesses now operating in a tougher environment. Although not immune from the current tougher economic environment, these companies are still relatively immature with significant scope to grow.
• The auto industry transformation will continue to evolve towards electrification and autonomous driving. This requires more data and chips.
• Perhaps there were few greater beneficiaries from COVID-19 than healthcare stocks, and many have now fallen significantly in share price terms. Specialist companies in this sector focusing on data-enabled innovations will continue to deliver long-term growth even as demand for COVID-19 vaccines decrease. For example, we believe mRNA technologies are likely to have applicability well beyond COVID-19, to other areas such as the Zika virus, cancers and cardiovascular diseases.
• Traditional hydrocarbon energy stocks have outperformed the market in recent months. Baillie Gifford Funds' low exposure to these businesses has been a significant detriment to performance. Although this has been painful over the short term, we have higher confidence in the long-term secular transition towards different energy production sources. We prefer these investment areas to the recently outperforming traditional energy companies that offer little fundamental long-term growth and have significant exposure to commodity price variations.
• Financials have never been considered a foundation investment area for growth stock investors. But even here, we see long-term opportunities in companies introducing new services in less mature, underbanked and faster-growing markets or applying technology-enabled credit risk management techniques to more mature financial markets.
• Consumer caution is increasing. Outside of the high-end luxury consumer market, this is negatively impacting discretionary spending. Despite the near-term challenge, we see durable growth opportunities from the best-managed brands, new product innovation, geographic expansion into less mature markets and continued progression towards ecommerce spending on goods and services. That, in turn, bodes well for other investment areas, such as the long-term growth in digital advertising.
• Chinese stocks are represented in several Baillie Gifford Funds and have been under extreme pressure during this reporting period. The framework we use to invest in this market has been and remains focused on analysing individual companies. We remain realistic about the Chinese government's policy agenda and believe that individual company opportunities remain. Helped by our on-the-ground research presence in Shanghai, we continue to see this market as being investible and attractive for long-term investors.
02
Shareholder Letter (unaudited)
Annual Report December 31, 2022
All Baillie Gifford Funds focus on growth stock investing and offer varying degrees of exposure to these investment areas. Together they give grounds to be rationally optimistic looking into 2023 and beyond.
Since 1908, Baillie Gifford's focus has been on investing well for clients. We continue to be structured with that single aim in mind. Baillie Gifford is owned by its partners and has no outside interests to distract us from this. We have absolute confidence that our chosen approach of long-term investment in growth businesses will continue to be a successful one. Short-term headwinds will come and go. Sometimes they may blow especially strongly, as we have seen recently. Over time, the companies in which we invest will change too. But ultimately, the strengths of well-managed, robust businesses and the opportunities they present as they adapt and innovate will win out over stock market anxiety.
We appreciate our shareholders' long-term perspectives and understanding of our growth philosophy and process. I hope this letter helps explain the unusually severe deterioration in recent performance and provides reassurance in relation to our continued long-term perspective and ability to add value to your portfolio over the next five to ten years. If you have any questions, please reach out to your contact, who will be delighted to help.
Sincerely,
David W Salter
President
Baillie Gifford Funds
03
Management Discussion (unaudited)
Annual Report December 31, 2022
Baillie Gifford China A Shares Growth Fund
Market Conditions and Review of Performance during 2022
The Fund underperformed the MSCI China A Onshore Index by 2.30% for the year. It has been a challenging year for China's domestic equity markets. Sentiment was hurt by a gloomy domestic economic backdrop which stemmed from an ongoing commitment to a zero-COVID policy. This disrupted supply chains and eroded consumer confidence, which in turn added stress to an already struggling property sector. Markets rebounded at the end of the year as China's leadership surprised with a more pragmatic approach to COVID-19 that ushered in greater expectations of a consumption-fuelled economic recovery in 2023. Exiting COVID-19 is likely to involve a bumpy road in the short term as people deal with the human cost of China's rapid opening up, but we believe this may well be the 'storm before the calm' as the market begins to anticipate the economic recovery that will follow.
It can be easy to be overwhelmed by short-term uncertainties and underestimate how quality businesses and structural trends can overshadow macroeconomic turbulence when viewed over longer time periods. Short-term headwinds generally come and go. When markets fixate on macro events, strong operational performance at individual companies often gets overlooked as all companies are viewed with one lens. We don't believe in painting China with one broad generic brush, but instead seek to navigate its complexities by focusing on company fundamentals. As long-term stock pickers, we remain resolutely focused on finding the individual companies that can benefit from the large opportunities we see that come with solving the challenges that China, and the world, face. We are encouraged that, despite the short-term uncertainties, many companies in the portfolio are investing in capital expenditure (CapEx) and Research & Development (R&D) to secure their future growth and continuing to take market share.
Beijing United Information Technology (BUIT) and Shenzhen Inovance Technology were two of the top contributors to performance over the period.
Beijing United Information Technology, an industrial e-commerce platform, is growing rapidly in a sector with significant scope to displace traditional offline distributors with a modern data-driven approach that adds value to both customers and suppliers. This is still an early stage of the business model and we will need to monitor developments in operations and governance as the industry develops, but we believe the company has plausible competitive advantages in a nascent industry which has the potential for it to become much larger in the future.
Shenzhen Inovance Technology is a domestic manufacturer of industrial automation control products with leading domestic market shares in many of its products. Despite an industry downcycle in the industrial automation sector, Inovance has seen growth accelerate over the year as it has taken market share and developed products in new verticals such as robots and electric vehicles markets. We believe the company's domestic leadership can help to ensure it is a beneficiary of China's greater top-down policy towards automation and innovation in hardware, a key theme of China's next five-year plan, as highlighted at the National People's Congress in October.
Among the key detractors from performance over the period were Asymchem Laboratories and Guangzhou Kingmed.
Asymchem Laboratories, a contract drug development and manufacturing company, was the leading contributor to performance in both 2020 and 2021. The company has built a solid technological edge as a high quality, low-cost service provider to global blue chip pharmaceutical companies. Despite exceeding expectations in terms of operational strength, share price in 2022 was weighed by broader geopolitical concerns given Asymchem's geographic mix of revenues is more concentrated in the US than China. While this adds a layer of uncertainty to future outlook that will require ongoing monitoring, we also recognise chemical engineering is a business where re-shoring is difficult, as it relies on an integrated chemical supply chain, a competitive manufacturing process and a large number of cost-efficient engineers, all of which we believe Asymchem has built its competitive advantages on.
Guangzhou Kingmed is an independent clinical laboratory and diagnostics business. Despite a wide-ranging business and numerous growth drivers, many shorter-term market participants have treated Kingmed as a proxy for COVID-19, given its role in mass COVID-19 testing. As China ends its zero-COVID policy and mass testing, the worry that this revenue line falls to zero has weighed on the share price. In reality, we believe the market is overly focused on COVID-19 revenues and ignoring the longer-term competitive advantages at the company.
We are of the view that short-term market performance doesn't tell us much about the long-term outcomes of the companies the Fund has invested in, and we expect there to be periods of time when stock market performance is driven by factors beyond the operational performance of individual companies. Whilst volatility may last a while, experience has taught us to remain steadfastly focused on the fundamentals and ride out what we believe to be these relatively short-term bouts in order to secure good long-term returns for shareholders.
04
Management Discussion (unaudited)
Annual Report December 31, 2022
Investment strategies used to manage the Fund
We are long-term, active growth investors and invest in domestically listed Chinese companies (A-shares) that we believe have the most exceptional long-term growth prospects. The Fund is a purely stock-driven, unconstrained equity strategy. It does not invest relative to any underlying index and therefore will frequently look very different than its benchmark. At the core of our approach is a research framework that focuses on scale of the opportunity and the cultural, financial and governance factors which support this, alongside a due diligence checklist. Our aim is to identify the exceptional growth businesses in China and hold them for long enough that the advantages of their business models and strength of their cultures become dominant drivers of their share prices. We believe our patience and long-term time horizons are a significant differentiator from the short-term focus of the market.
Trading over the period
Our new buy and complete sale decisions, which are a result of our bottom-up stock research, are listed below:
New Buys:
3Peak, Dongguan Yiheda Automation, Guangdong Kinlong Hardware, Jiangsu Azure, Longshine Technology, Quectel Wireless Solutions
Complete Sales:
Berry Genomics, BGI Genomics, Jiangsu Hengrui, Luzhou Laojiao, Nanji eCommerce, Topchoice Medical, Yunnan Baiyao
Fund Performance for periods ended 12/31/22 (Average Annual Total Returns)
One Year | % p.a. Since Inception | Inception Date | |||||||||||||
Baillie Gifford China A Shares Growth Fund Class K | (29.39 | )% | 10.61 | % | 12/19/19 | ||||||||||
Baillie Gifford China A Shares Growth Fund Institutional Class | (29.39 | )% | 10.61 | % | 12/19/19 | ||||||||||
MSCI China A Onshore Index | (27.09 | )% | 3.01 | % | 12/19/19 | ||||||||||
The returns are provided for all shares classes that had shares outstanding as of December 31, 2022. Additional year-over-year returns for each class are available in the Financial Highlights section.
Comparison of the change in value of $10,000 Investment in the Fund's Class K shares and the index.

Past performance does not predict future performance. The graph and the table above do not reflect the deduction of taxes that a shareholder would pay on the Fund distributions or redemption of Fund shares.
05
Management Discussion (unaudited)
Annual Report December 31, 2022
Baillie Gifford China Equities Fund
Market Conditions and Review of Performance during 2022
The Fund underperformed the MSCI China All Shares Index by 4.93% for Class K shares for the year. It has been a challenging year for Chinese equity markets. Sentiment was hurt by a gloomy domestic economic backdrop which stemmed from an ongoing commitment to a zero-COVID policy. This disrupted supply chains and eroded consumer confidence, which in turn added stress to an already struggling property sector. Geopolitical challenges and concerns regarding the potential de-listing of Chinese companies in the US added further pressure on investor sentiment. Markets rebounded at the end of the year as China's leadership surprised with a more pragmatic approach to COVID-19 that ushered in greater expectations of a consumption-fuelled economic recovery in 2023. Exiting COVID-19 is likely to involve a bumpy road in the short term, but we believe this may well be the 'storm before the calm' as the market anticipates the economic recovery that will follow.
It can be easy to be overwhelmed by short-term uncertainties and underestimate how quality businesses and structural trends can overshadow macroeconomic turbulence when viewed over longer time periods. Short-term headwinds will come and go. When markets fixate on macro events, strong operational performance at individual companies often gets overlooked as all companies are viewed with one lens. We don't believe in painting China with one broad generic brush, but instead seek to navigate its complexities by focusing on company fundamentals. As long-term stock pickers, we remain resolutely focused on finding the individual companies that can benefit from the large opportunities that come with solving the challenges that China, and the world, face.
Ping An Insurance and Proya Cosmetics were two of the top contributors to performance over the period.
After a lacklustre start to the year, Ping An Insurance, a Chinese holding conglomerate whose subsidiaries provide insurance, banking, asset management, financial and healthcare services, performed well during the year-end rally. It was buoyed by a series of measures to boost the property sector that were announced in November and an expectation of faster economic growth in 2023 as China recovers from COVID-19. Many things, including weak property sector, sluggish consumption growth amid lockdowns, have weighed on Ping An's operations, and valuation, in recent years. We
remain excited by the long-term fundamental attractions of life insurance in China and Ping An's competitive strengths in this area.
Proya Cosmetics is one of China's leading domestic skincare brands which has executed very well on a strategy to deepen its sales channels, deliver new and innovative product launches and develop alternative brands. We attribute much of this success to the company's organisation and culture as it focuses on a long-term goal of becoming a multi-brand, omni-channel platform selling to a large cohort of Generation Z customers who we expect to drive consumption trends in coming years.
Among the key detractors from performance over the period were Asymchem Laboratories and Bilibili.
Asymchem Laboratories is a leading contract drug development and manufacturing company. The company has built a solid technological edge as a high quality, low-cost service provider to global blue chip pharmaceutical companies. Despite exceeding expectations in terms of operational strength, greater focus has been put on geopolitical risk implications given its geographic mix of revenues is more concentrated in the US than China. This adds a layer of uncertainty to any future outlook that will require ongoing monitoring.
Bilibili is an online anime, gaming and comic content provider which had been seen as the platform of choice for Generation Z, giving it significant future monetization potential. However, a combination of concerns arising from greater internet regulation, particularly of China's younger demographic, as well as growing competition within the industry, led us to question the upside for this heavily loss-making company. We have sold the holding.
We are of the view that short-term market performance doesn't tell us much about the long-term outcomes of the companies the Fund has invested in, and we expect there to be periods of time when stock market performance is driven by factors beyond the operational performance of individual companies. Whilst volatility may last a while, we believe that remaining steadfastly focused on company fundamentals during these periods is important in our goal of delivering good long-term returns for shareholders.
Investment strategies used to manage the Fund
We are long-term, active growth investors and invest in Chinese companies that we believe have the most substantial long-term growth prospects, regardless of
06
Management Discussion (unaudited)
Annual Report December 31, 2022
where they are listed, their size in an index or their market capitalization. To do so, we look for businesses in attractive industries that enjoy sustainable competitive advantages and which we believe have the management and financial strengths to allow them to grow their earnings significantly faster than the market average. Our approach results in a committed portfolio which will frequently look very different than its benchmark. In the pursuit of superior performance over the long term, we are happy to accept volatility around an index in the short term. We believe our patience and long-term time horizons are a significant differentiator from the short-term focus of the market.
Trading over the period
Our new buy and complete sale decisions, which are a result of our bottom-up stock research, are listed below:
New Buys:
Brilliance China Automotive, Centre Testing, Dongguan Yiheda Automation, Guangdong Kinlong Hardware, Jiangsu Azure, Sungrow Power
Complete Sales:
Berry Genomics, BGI Genomics, Bilibili, Burning Rock Biotech, China Molybdenum, Hutchison China Meditech, Lufax, Luzhou Laojiao, Tencent Music Entertainment, Yatsen, Zai Labs
Fund Performance for periods ended 12/31/22 (Average Annual Total Returns)
One Year | % p.a. Since Inception | Inception Date | |||||||||||||
Baillie Gifford China Equities Fund Class K | (28.40 | )% | (29.69 | )% | 07/07/21 | ||||||||||
Baillie Gifford China Equities Fund Institutional Class | (28.43 | )% | (29.71 | )% | 07/07/21 | ||||||||||
MSCI China All Shares Index | (23.47 | )% | (23.57 | )% | 07/07/21 | ||||||||||
The returns are provided for all shares classes that had shares outstanding as of December 31, 2022. Additional year-over-year returns for each class are available in the Financial Highlights section.
Comparison of the change in value of $10,000 Investment in the Fund's Class K shares and the index.

Past performance does not predict future performance. The graph and the table above do not reflect the deduction of taxes that a shareholder would pay on the Fund distributions or redemption of Fund shares.
07
Management Discussion (unaudited)
Annual Report December 31, 2022
Baillie Gifford Developed EAFE All Cap Fund
Market Conditions and Review of Performance during 2022
2022 was a tumultuous year, with war, inflation, interest rates, and geopolitics all coming to the fore. Against this market backdrop, time horizons shortened, and perceptions of growth deteriorated. Many expect the fragility of markets to persist as the troubles move from Wall Street to Main Street. Indeed, Andrew Bailey, Governor of the Bank of England, noted that "there is a tough road ahead," and Christine Lagarde, President of the European Central Bank, and Jerome Powell, Chair of the U.S. Federal Reserve, have both cited how it is too premature to think about inflation passing. At the same time, some green shoots are emerging, providing grounds for optimism. Most notably, China has begun unwinding its onerous COVID-19 restrictions, which have weighed heavily on demand and supply chains. Business activity across Europe is also showing signs of picking up.
When considering the Fund's positioning, we aim to strike the right balance of growth, quality, and resilience. We have continued to be pleased with the operational progress of many of the Fund's holdings. While there have been some bumps in the road and there may be further setbacks ahead, we believe the market underappreciates their long-term prospects, and that share prices will, ultimately, reflect fundamentals as they have done in the past. We stand firmly by our long-term, bottom-up active approach to investing and continue to identify new and compelling growth opportunities. To quote Warren Buffett, "every decade or so, dark clouds will fill the economic skies, and they will briefly rain gold." In our view, now is a beautiful time to be a growth investor, with many opportunities available for those willing to be patient.
Turning to performance, the latest calendar year has been challenging for the Fund's investment returns in absolute and relative terms. While our investment time horizon remains five years, the Fund's short-term performance is disappointing. Such has been the magnitude of the recent underperformance that longer-term outcomes are also now well below what we would expect to deliver. This being said, absolute returns picked up in the latter parts of the year, with some green shoots emerging and some encouraging operational performance being rewarded. We also saw a breakdown in the share price correlations seen in the earlier parts of the year when all growth stocks sold off indiscriminately.
Positive contributors over the past 12 months include some of the Fund's Financials sector holdings, such as United Overseas Bank and AIA Group.
United Overseas Bank is a family-run Singaporean bank with operations spanning South East Asia. It focuses primarily on consumer and small and mid-sized business lending. The Fund's managers added to the Fund's United Overseas Bank position it in early 2022. It is seen as a steady as she goes investment case, consistently demonstrating above market returns and high asset quality. Loan growth has picked up during the year, and margins have expanded, while net interest benefitted from higher interest rates.
AIA is a leading life insurance business in Asia. Results this fiscal year have been subdued due to lockdowns in major Chinese cities, although they have shown signs of recovery more recently. The share price further benefitted from the surprise easing of COVID restrictions in China following the well-publicized wave of protests against onerous curtailments. The long-term structural growth opportunity for AIA remains intact. It is a beneficiary of burgeoning middle-class income, which we expect to drive rising insurance penetration in Asia. AIA continues to expand its presence in China and invest in well-trained agents to capitalize on this trend.
Other positive contributors include Consumer Staples holdings such as Jeronimo Martins and Unicharm, with Luxury holdings also doing well.
Detractors for the calendar year again feature some of the Fund's internet disruptors and rapid growth holdings. Many of these saw strong returns in the early stages of the pandemic and have since suffered a derating on the back of shifting sentiment. For most of these companies, results have been encouraging, they are investing heavily in growth, and some are choosing to remain loss-making as they build out into new areas. In a market environment driven by uncertainty and prizing short-term profits, those stocks that require a patient, long-term approach have been hit hardest.
Zalando, Europe's largest online fashion retailer, was again a top detractor. In 2022, it suffered from a perfect storm of macro events that contributed to ongoing inflation and declining consumer sentiment. The result has been more muted growth than the highs in recent years, but growth, nonetheless. Zalando continues to be focused primarily on profitability and adjusting its business model to tackle the cost pressures it has been facing. Importantly, it has consistently invested in the business, improving the customer experience and deepening brand partnerships. We
08
Management Discussion (unaudited)
Annual Report December 31, 2022
remain confident in our belief that Zalando will continue to take share from traditional bricks and mortar retailers.
Farfetch, another online fashion marketplace, but one which is focused on the global luxury segment, also struggled in share price terms over the past 12 months. Concerns over the external environment — lockdowns in China, exit from Russian operations, currency headwinds, and worries over the impact of a recession on luxury spending — have overshadowed some significant positive strategic developments. Notably, the announcement that it will become the technology platform provider for luxury jewelry brand owner Richemont as well as buy a stake in Richemont's luxury online apparel business Yoox Net-a-Porter. In the latest quarter, Farfetch hosted an investor day, resulting in further pressure on the share price. While the three-year targets were impressive, the market fretted over the make-up of the segmental mix and what appears to be conservative assumptions on underlying growth, especially in the short term. Our stance on Farfetch remains unchanged. While much depends on the company's successful execution from here, we believe its strategic position in the industry is strong and much improved since we first invested, and its long-term growth prospects remain compelling.
The Fund's lower exposure to specific sectors which performed well was also a headwind to relative performance — not owning many banks or certain asset-intensive areas such as energy and commodities, for example.
Investment strategies used to manage the Fund
Baillie Gifford is a growth manager with a bottom-up approach to stock picking. Bottom-up investing is an approach that focuses on analyzing individual stocks and de-emphasizes the significance of economic and market cycles. We aim to invest in companies that we believe will generate sustainable earnings growth above the market over the long term. We analyze industry background, competitive advantages, management capabilities, financial strength, and valuation in determining a company's potential. From the outset, we also consider aspects that may derail the investment case. We regularly revisit the thesis for the Fund's holdings to ensure our expectations are met.
Trading over the period
Our new buy and complete sale decisions, which are a result of our bottom-up stock research, are listed below:
New Buys:
Adyen, Anheuser-Busch Inbev, Ashtead, DSV, EXOR, Experian, Hoshizaki, Lonza Group, Unicharm
Complete Sales:
ASOS, Bechtle, HomeServe, Inditex, Johnson Matthey, Kakaku.com, Rational
09
Management Discussion (unaudited)
Annual Report December 31, 2022
Fund Performance for periods ended 12/31/22 (Average Annual Total Returns)
One Year | % p.a. Five year | % p.a. Since Inception | Inception Date | ||||||||||||||||
Baillie Gifford Developed EAFE All Cap Fund Class 2 | (32.32 | )% | 0.66 | % | 3.13 | % | 04/15/14 | ||||||||||||
Baillie Gifford Developed EAFE All Cap Fund Class 3 | (32.27 | )% | 0.73 | % | 3.17 | % | 03/24/17 | ||||||||||||
Baillie Gifford Developed EAFE All Cap Fund Class K | (32.33 | )% | 0.66 | % | 3.13 | % | 04/28/17 | ||||||||||||
| Baillie Gifford Developed EAFE All Cap Fund Institutional Class | (32.34 | )% | 0.59 | % | 3.04 | % | 04/28/17 | ||||||||||||
MSCI EAFE Index | (14.01 | )% | 2.03 | % | 3.52 | % | 04/15/14 | ||||||||||||
The returns are provided for all shares classes that had shares outstanding as of December 31, 2022. Additional year-over-year returns for each class are available in the Financial Highlights section.
Returns for the Class 3 shares are based on actual performance from March 24, 2017. Prior to that date returns are calculated based on the oldest share class of the Fund and were not adjusted to reflect the differences in class expense due to the fees being lower.
Returns for the Class K and Institutional Class shares are based on actual performance from April 28, 2017. Prior to that date returns are calculated based on the oldest share class of the Fund adjusted to reflect the Class K and Institutional Class fees where these fees are higher.
Comparison of the change in value of $10,000 Investment in the Fund's Class 2 shares and the index.

10
Management Discussion (unaudited)
Annual Report December 31, 2022
Baillie Gifford EAFE Plus All Cap Fund
Market Conditions and Review of Performance during 2022
2022 was a tumultuous year, with war, inflation, interest rates, and geopolitics all coming to the fore. Against this market backdrop, time horizons shortened, and perceptions of growth deteriorated. Many expect the fragility of markets to persist as the troubles move from Wall Street to Main Street. Indeed, Andrew Bailey, Governor of the Bank of England, noted that "there is a tough road ahead," and Christine Lagarde, President of the European Central Bank, and Jerome Powell, Chair of the US Federal Reserve, have both cited how it is too premature to think about inflation passing. At the same time, some green shoots are emerging, providing grounds for optimism. Most notably, China has begun unwinding its onerous COVID-19 restrictions, which have weighed heavily on demand and supply chains. Business activity across Europe is also showing signs of picking up.
When considering the Fund's positioning, we aim to strike the right balance of growth, quality, and resilience. We have continued to be pleased with the operational progress of many of the Fund's holdings. While there have been some bumps in the road and there may be further setbacks ahead, we believe the market underappreciates their long-term prospects, and that share prices will, ultimately, reflect fundamentals as they have done in the past. We stand firmly by our long-term, bottom-up active approach to investing and continue to identify new and compelling growth opportunities. To quote from Warren Buffett, "every decade or so, dark clouds will fill the economic skies, and they will briefly rain gold." In our view, now is a beautiful time to be a growth investor, with many opportunities available for those willing to be patient.
Turning to performance, the latest calendar year has been challenging for the Fund's investment returns in absolute and relative terms. While our investment time horizon remains five years, the Fund's short-term performance is disappointing. Such has been the magnitude of the recent underperformance that longer-term outcomes are also now well below what we would expect to deliver. This being said, absolute returns picked up in the latter parts of the year, with some green shoots emerging and some encouraging operational performance being rewarded. We also saw a breakdown in the share price correlations seen in the earlier parts of the year when all growth stocks sold off indiscriminately.
Positive contributors over the past 12 months include some of the Fund's Financials sector holdings, such as United Overseas Bank and AIA Group.
United Overseas Bank is a family-run Singaporean bank with operations spanning South East Asia. It focuses primarily on consumer and small and mid-sized business lending. The Fund's managers debated and added to it in early 2022. It is seen as a steady as she goes investment case, consistently demonstrating above market returns and high asset quality. Loan growth has picked up during the year, and margins have expanded, while net interest benefitted from higher interest rates.
AIA is a leading life insurance business in Asia. Results this fiscal year have been subdued due to lockdowns in major Chinese cities, although they have shown signs of recovery more recently. The share price further benefitted from the surprise easing of COVID-19 restrictions in China following the well-publicized wave of protests against onerous curtailments. The long-term structural growth opportunity for AIA remains intact. It is a beneficiary of burgeoning middle-class income, which we expect to drive rising insurance penetration in Asia. AIA continues to expand its presence in China and invest in well-trained agents to capitalize on this trend.
Other positive contributors include Consumer Staples holdings such as Jeronimo Martins and Unicharm, with Luxury holdings also doing well.
Detractors for the calendar year again feature some of the Fund's internet disruptors and rapid growth holdings. Many of these saw strong returns in the early stages of the pandemic and have since suffered a derating on the back of shifting sentiment. For most of these companies, results have been encouraging, they are investing heavily in growth, and some are choosing to remain loss-making as they build out into new areas. In a market environment driven by uncertainty and prizing short-term profits, those stocks that require a patient, long-term approach have been hit hardest.
Sartorius AG was the biggest detractor to the Fund's relative return for the calendar year. The German-listed group provides single-use equipment and products used in manufacturing biological drugs, such as antibodies and vaccines. Growth started to moderate in the second half of the year, compared to the high growth rates of the previous year. Order intake, which had been boosted by the pandemic and associated supply chain disruption, has declined this year as management had previously indicated would happen. Sartorius is a beneficiary of the shift towards single-use biopharmaceutical equipment and has
11
Management Discussion (unaudited)
Annual Report December 31, 2022
a long-term focused management team with an excellent execution record. We believe it is well positioned to increase its market share over time due to its scale and innovation advantage.
Zalando, Europe's largest online fashion retailer, also features in the top detractors. In 2022, Zalando suffered from a perfect storm of macro events that contributed to ongoing inflation and declining consumer sentiment. The result has been more muted growth than the highs in recent years, but growth, nonetheless. It continues to be focused primarily on profitability and adjusting its business model to tackle the cost pressures it has been facing. Importantly, it has consistently invested in the business, improving the customer experience and deepening brand partnerships. We remain confident in our belief that Zalando will continue to take share from traditional bricks and mortar retailers.
The Fund's lower exposure to specific sectors which performed well was also a headwind to relative performance — not owning many banks or certain asset-intensive areas such as energy and commodities, for example.
Investment strategies used to manage the Fund
Baillie Gifford is a growth manager with a bottom-up approach to stock picking. Bottom-up investing is an
approach that focuses on analyzing individual stocks and de-emphasizes the significance of economic and market cycles. We aim to invest in companies that we believe will generate sustainable earnings growth above the market over the long term. We analyze industry background, competitive advantages, management capabilities, financial strength, and valuation in determining a company's potential. From the outset, we also consider aspects that may derail the investment case. We regularly revisit the thesis for the Fund's holdings to ensure our expectations are met.
Trading over the period
Our new buy and complete sale decisions, which are a result of our bottom-up stock research, are listed below:
New Buys:
Adyen, Anheuser-Busch Inbev, Ashtead, DSV, EXOR, Experian, Lonza Group, Unicharm
Complete Sales:
ASOS, Bechtle, HomeServe, Inditex, Johnson Matthey, Kakaku.com, Naspers, Rational
12
Management Discussion (unaudited)
Annual Report December 31, 2022
Fund Performance for periods ended 12/31/22 (Average Annual Total Returns)
One Year | % p.a. Five Year | % p.a. Ten Year | % p.a. Since Inception | Inception Date | |||||||||||||||||||
Baillie Gifford EAFE Plus All Cap Fund Class 2 | (31.17 | )% | 0.17 | % | 4.67 | % | 5.49 | % | 12/17/09 | ||||||||||||||
Baillie Gifford EAFE Plus All Cap Fund Class 3* | (31.12 | )% | 0.20 | % | 4.69 | % | 5.50 | % | 08/03/20 | ||||||||||||||
Baillie Gifford EAFE Plus All Cap Fund Class K | (31.19 | )% | 0.17 | % | 4.68 | % | 5.49 | % | 04/28/17 | ||||||||||||||
| Baillie Gifford EAFE Plus All Cap Fund Institutional Class | (31.22 | )% | 0.08 | % | 4.56 | % | 5.37 | % | 04/28/17 | ||||||||||||||
MSCI EAFE Index | (14.01 | )% | 2.03 | % | 5.16 | % | 5.05 | % | 12/17/09 | ||||||||||||||
* Returns for Class 3 shares are based on actual performance from August 3, 2020. Prior to that date returns are calculated based on Class 2 shares, and no adjustment has been made to the performance information shown for Class 3 to reflect its different expense structure.
The returns are provided for all shares classes that had shares outstanding as of December 31, 2022. Additional year-over-year returns for each class are available in the Financial Highlights section.
Returns for the Class K and Institutional Class shares are based on actual performance from April 28, 2017. Prior to that date returns are calculated based on the oldest share class of the Fund adjusted to reflect the Class K and Institutional Class fees where these fees are higher.
Comparison of the change in value of $10,000 Investment in the Fund's Class 2 shares and the index.

Past performance does not predict future performance. The graph and the table above do not reflect the deduction of taxes that a shareholder would pay on the Fund distributions or redemption of Fund shares.
13
Management Discussion (unaudited)
Annual Report December 31, 2022
Baillie Gifford Emerging Markets Equities Fund
Market Conditions and Review of Performance during 2022
2022 has been a bruising year for growth investors globally, as most central banks have started the difficult process of unwinding 14 years of loose monetary policy. For growth companies, particularly those with a high portion of their expected cashflows furthest into the future, this has made for a particularly weak year, and valuation multiples have compressed significantly.
This said, for Baillie Gifford Emerging Markets Equities Fund, we do take comfort from the fact that the operational performance across the majority of the Fund's holdings has been strong, as well as the fact that on an aggregate basis, we believe the Fund is displaying much stronger growth characteristics than the comparative index. This is true even though the valuation multiple of the overall Fund is now broadly in line with the index.
A large portion of the underperformance during 2022 was a result of the Fund's overweight position in Russia at the beginning of the year. Having written the positions down to zero, and with all trading suspended, we continue monitoring the positions though there has unfortunately been no real change to trading conditions for nearly a year. Our mental energy quickly moved into thinking about the second-order impacts of the war, especially in the context of inflation and higher energy and materials prices.
The other main driver of underperformance was the exposure to high-growth stocks such as Sea Ltd, the leading South East Asian gaming and e-commerce business) and Mercadolibre, the leading Latin American e-commerce platform, both of which have been hit very hard in the recent market environment. Mercadolibre (MELI) continues to perform well operationally, however, and we believe it has a large growth opportunity ahead. E-commerce represents around 10% of retail in Brazil and 6% in Mexico. This compares to the global average e-commerce penetration of 19%. MELI has ample experience weathering difficult periods before, growing its revenue 28x in US dollar terms over the past decade despite what has frequently proven a difficult operating environment.
China has been in the news in one way or another for most of the year. The narrative, until recently, has been almost entirely negative. President Xi used the phrase 'friendship without limits' in his meetings with Putin
before the Beijing Winter Olympics. Next, we had further bouts of regulation of Chinese online platforms while aggressive COVID-19 lockdowns, notably in Shanghai, disrupted supply chains and eroded consumer confidence. Property, one of the engines of Chinese economic growth, started to splutter and stall as developers were unable to finish projects for which they had received customer prepayments. Finally, in October, the Communist Party Congress confirmed President Xi's iron grip on the party and, with it, the government. This may have marked the nadir of negative sentiment towards China. Subsequently, Xi's meeting with President Biden in Bali appears to have taken some of the heat out of Sino-American relations and increased the possibility of détente between the US and China. Next, the Chinese government has rolled out a series of measures to restore confidence in the beleaguered property sector. Perhaps most dramatically, the recent zero-COVID protests in China have led to a rapid dismantling of the zero-COVID policy, showing even Xi must factor popular pressure into his decision-making. As a result, in 2023, some market commentary suggests that China may enjoy the post-COVID bounce that the rest of the world enjoyed in 2022.
Energy was one of the very few areas where market performance was strong during 2022. For some time, we have seen a significant imbalance between supply and demand in key areas such as oil, with the war in Ukraine exaggerating this further. Petrobras, the Brazilian energy giant, was one of the top performers. Overall lifting costs (the cost of operating and maintaining producing oil wells) at Petrobras are of the order of US$7.70/barrel, making it one of the cheapest producers outside the Middle East. The company continues to be highly profitable at these oil price levels, with third quarter net income up 48% on the previous year.
Reliance Industries the Indian conglomerate was also a strong relative performer during the year. The energy part of the business continues to perform well, and we are encouraged too by the progress at the relatively newer parts of the company, namely telecoms and retail. We'd also note that their ambitious management team, with a track record of success, have stated they 'will have the world's most affordable green energy within this decade, and these solutions will then be exported to other countries.' Amongst their ambitions are 20 gigawatts of solar generation capacity by 2025 and making India the first country to produce green hydrogen for $1 a kilogram within a decade (the current cost is four times that).
2022 will not sit fondly in memory for many market participants, regardless of where you've invested. However,
14
Management Discussion (unaudited)
Annual Report December 31, 2022
we do believe that innovation and entrepreneurship remain as strong as ever in Emerging Markets. We believe that this, combined with a scarcer capital environment, means that stock picking matters more: companies with strong business models and balance sheets will prosper. When you combine this with very low valuations in Emerging Markets, we think it's right to remain upbeat.
Investment strategies used to manage the Fund
We are long-term, active growth investors and invest in companies that we believe have the most substantial long-term growth prospects. To do so, we look for businesses that enjoy sustainable competitive advantages and that we believe will grow their earnings significantly faster than the market average. As emerging markets investors, we operate in a different opportunity set to global or developed market investors: economic and industrial cycles are often shorter or sharper and information is frequently incomplete. We have significant experience in dealing with
these challenges, which require a greater focus on future change rather than the present reality. Our approach results in a committed portfolio which will frequently look very different than its benchmark. In the pursuit of superior performance over the long-term, we are happy to accept volatility around an index in the short term.
Trading over the period
Our new buy and complete sale decisions, which are a result of our bottom-up stock research, are listed below:
New Buys:
Anker Innovations Technology, Baidu.com, Credicorp, Firstrand, PTT Exploration and Production
Complete Sales:
Burning Rock Biotech, Dada Nexus, HUYA, ICICI Lombard, IDFC First Bank, Kingsoft Cloud, LG Energy Solutions, Mahindra & Mahindra, Vale
15
Management Discussion (unaudited)
Annual Report December 31, 2022
Fund Performance for periods ended 12/31/22 (Average Annual Total Returns)
One Year | % p.a. Five Year | % p.a. Ten Year | % p.a. Since Inception | Inception Date | |||||||||||||||||||
| Baillie Gifford Emerging Markets Equities Fund Class 2 | (26.44 | )% | (1.16 | )% | 3.57 | % | 10.74 | % | 03/02/15 | ||||||||||||||
| Baillie Gifford Emerging Markets Equities Fund Class 3 | (26.39 | )% | (1.09 | )% | 3.63 | % | 10.81 | % | 03/31/16 | ||||||||||||||
| Baillie Gifford Emerging Markets Equities Fund Class 4* | (26.37 | )% | (1.06 | )% | 3.66 | % | 10.83 | % | 01/10/20 | ||||||||||||||
| Baillie Gifford Emerging Markets Equities Fund Class 5** | (26.33 | )% | (1.01 | )% | 3.70 | % | 10.85 | % | 04/04/03 | ||||||||||||||
| Baillie Gifford Emerging Markets Equities Fund Class K | (26.47 | )% | (1.16 | )% | 3.56 | % | 10.73 | % | 04/28/17 | ||||||||||||||
| Baillie Gifford Emerging Markets Equities Fund Institutional Class | (26.52 | )% | (1.24 | )% | 3.45 | % | 10.59 | % | 04/28/17 | ||||||||||||||
MSCI Emerging Markets Index | (19.74 | )% | (1.03 | )% | 1.81 | % | 9.36 | % | 04/04/03 | ||||||||||||||
* Returns for Class 4 shares are based on actual performance from January 10, 2020. Prior to that date, returns are calculated based on Class 5 shares from January 1, 2015, adjusted to reflect the differences in share class fees. Prior to January 1, 2015, returns are calculated based on the shares previously designated as Class 3 shares, prior to conversion to Class 5 shares.
** Effective January 1, 2015, the share class structure of Baillie Gifford Emerging Markets Equities Fund was changed, and shares previously designated as Class 3 shares were converted to Class 5 shares. The performance information provided for Class 5 reflects the performance for Class 3 for periods prior to January 1, 2015. Class 3 shares were subject to a higher shareholder service fee than Class 5 shares, and no adjustment has been made to the performance information shown for Class 5 to reflect its different expense structure.
The returns are provided for all shares classes that had shares outstanding as of December 31, 2022. Additional year-over-year returns for each class are available in the Financial Highlights section.
Returns for the Class K and Institutional Class shares are based on actual performance from April 28, 2017. Prior to that date returns are calculated based on the oldest share class of the Fund adjusted to reflect the Class K and Institutional Class fees where these fees are higher.
Comparison of the change in value of $10,000 Investment in the Fund's Class 5 shares and the index.
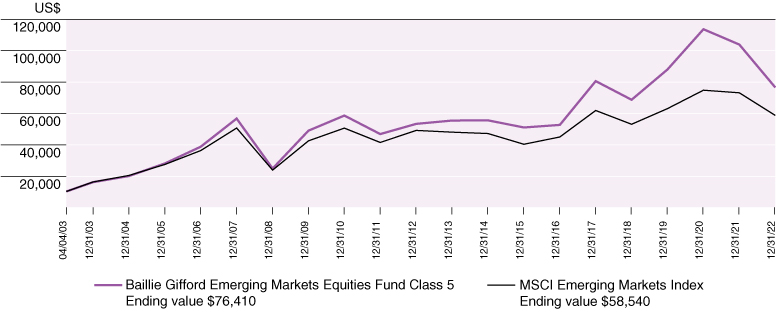
Past performance does not predict future performance. The graph and the table above do not reflect the deduction of taxes that a shareholder would pay on the Fund distributions or redemption of Fund shares.
16
Management Discussion (unaudited)
Annual Report December 31, 2022
Baillie Gifford Emerging Markets ex China Fund
Market Conditions and Review of Performance during 2022
2022 has been a bruising year for growth investors globally, as most central banks have started the difficult process of unwinding 14 years of loose monetary policy. For growth companies, particularly those with a high portion of their expected cashflows furthest into the future, this has made for a particularly weak year, and valuation multiples have compressed significantly.
This said, for Baillie Gifford Emerging Markets ex China Fund, we do take comfort from the fact that the operational performance across the majority of the Fund's holdings has been strong, as well as the fact that on an aggregate basis, we believe the Fund is displaying much stronger growth characteristics than the comparative index. This is true even though the valuation multiple of the overall Fund is now broadly in line with the index.
A large portion of the underperformance during 2022 was a result of the Fund's overweight position in Russia at the beginning of the year. Having written the positions down to zero, with all trading suspended we continue monitoring the positions though there has unfortunately been no real change to trading conditions here now for around 10 months. Our mental energy quickly moved into thinking about the second-order impacts of the war, especially in the context of inflation and higher energy and materials prices.
The other main driver of underperformance was the exposure to high-growth stocks such as Sea Ltd, the leading South East Asian gaming and e-commerce business and Mercadolibre the leading Latin American e-commerce platform, which have been hit very hard in the recent market environment. Mercadolibre (MELI) continues to perform well operationally, however, with a large growth opportunity ahead. E-commerce represents around 10% of retail in Brazil and 6% in Mexico. This compares to the global average e-commerce penetration of 19%. MELI has ample experience weathering difficult periods before, growing its revenue 28x in US dollar terms over the past decade despite what has frequently proven a miserable operating environment.
Energy was one of the very few areas where market performance was strong during 2022. For some time, we have seen a significant imbalance between supply and demand in key areas such as oil, with the war in Ukraine
exaggerating this further. Petrobras, the Brazilian energy major, was one of the top performers. Overall lifting costs at Petrobras are of the order of US$7.70/barrel, making it one of the cheapest producers outside the Middle East. The company continues to be highly profitable at these oil price levels, with third quarter net income up 48% on the previous year.
Reliance Industries the Indian conglomerate was also a strong relative performer during the year. The energy part of the business continues to perform well, and we are encouraged too by the progress at the relatively newer parts of the company, namely telecoms and retail. We'd also note that their ambitious management team, with a track record of success, have stated they 'will have the world's most affordable green energy within this decade, and these solutions will then be exported to other countries.' Amongst their ambitions are 20 gigawatts of solar generation capacity by 2025 and making India the first country to produce green hydrogen for $1 a kilogram, within a decade (the current cost is four times that).
2022 will not sit fondly in memory for many market participants, regardless of where you've invested. However, we do believe that innovation and entrepreneurship remain as strong as ever in Emerging Markets. The fact that this is combined with a scarcer capital environment means that stock picking matters more: companies with strong business models and balance sheets will prosper. When you combine this with very low valuations in Emerging Markets, we think it's right to remain upbeat.
Investment strategies used to manage the Fund
We are long-term, active growth investors and invest in companies that we believe have the most substantial long-term growth prospects. To do so, we look for businesses that enjoy sustainable competitive advantages and that we believe will grow their earnings significantly faster than the market average. As emerging markets investors, we operate in a different opportunity set to global or developed market investors: economic and industrial cycles are often shorter or sharper and information is frequently incomplete. We have significant experience in dealing with these challenges, which require a greater focus on future change rather than the present reality. Our approach results in a committed portfolio which will frequently look very different than its benchmark. In the pursuit of superior performance over the long-term, we are happy to accept volatility around an index in the short term.
17
Management Discussion (unaudited)
Annual Report December 31, 2022
Trading over the period
Our new buy and complete sale decisions, which are a result of our bottom-up stock research, are listed below:
New Buys:
Bank Mandiri, Firstrand, Nu Holdings, PT Vale Indonesia, PTT Exploration and Production, Saudi Tadawul
Complete Sales:
Douzone Bizon, Pagseguro Digital, Tata Motors
Fund Performance for periods ended 12/31/22 (Average Annual Total Returns)
One Year | % p.a. Since Inception | Inception Date | |||||||||||||
Baillie Gifford Emerging Markets ex China Fund Class K | (25.07 | )% | (24.74 | )% | 12/28/21 | ||||||||||
Baillie Gifford Emerging Markets ex China Institutional Class | (25.07 | )% | (24.74 | )% | 12/28/21 | ||||||||||
MSCI EM ex China Index | (18.79 | )% | (18.63 | )% | 12/28/21 | ||||||||||
The returns are provided for all shares classes that had shares outstanding as of December 31, 2022. Additional year-over-year returns for each class are available in the Financial Highlights section.
Comparison of the change in value of $10,000 Investment in the Fund's Class K shares and the index.

Past performance does not predict future performance. The graph and the table above do not reflect the deduction of taxes that a shareholder would pay on the Fund distributions or redemption of Fund shares.
18
Management Discussion (unaudited)
Annual Report December 31, 2022
Baillie Gifford Global Alpha Equities Fund
Market Conditions and Review of Performance during 2022
2022 has been a challenging year for global stock markets and for the Fund. The MSCI ACWI index returned (17.96)% while the Fund returned (29.03)% for Class 3 shares. The macro environment has been something of a perfect storm for growth investors. Following a remarkable decade and more for growth investing, storm clouds gathered in 2022. A shock to global energy markets, precipitated by the dreadful war in Ukraine, has added to the COVID-induced shock to global supply chains. This resulted in a surge in inflation across much of the world and led central banks to hike interest rates aggressively in response. Uncertainty is pervasive, and the market's time horizon has shrunk. As a result, stock markets have performed a sharp about-turn as reward-seeking capital has fled.
The Fund's top and bottom contributors over the calendar year illustrate the point. Sea Ltd is a rapidly growing Asian consumer internet company operating businesses in gaming (Garena), e-commerce (Shopee) and financial technology services (SeaMoney). The company has grown revenues at close to 100% per annum over the last five years. The stock has fallen sharply over the past year, which we think has been driven by two main issues. Firstly, the market has been particularly sensitive to the slowing sales of hit game 'FreeFire.' And secondly, the company's inability to generate and sustain profits. Although the company is facing headwinds, we remain optimistic about its long-term prospects. In core Asian markets where Shopee has already established significant market share, Sea is shifting focus to profitability. We believe these are large markets where e-commerce penetration, usage and wealth are rising, and where Shopee is gaining share. In the face of short-term headwinds, we believe founder CEO Forrest Li is taking sensible action — exiting non-core markets and placing greater focus on reducing costs. We expect this should help the company navigate the current, challenging environment and we believe the long-term growth opportunity remains attractive.
Meanwhile the Fund's top contributor was the long-standing stalwart Elevance Health (formerly named Anthem), and now the Fund's largest holding. In the recent market turmoil, the resilient nature of health insurance and Elevance's strong underlying cashflows explain why shares have performed well. Over the years, the company has been successfully diversifying beyond its core commercial
business, with growth in its government business and launching its pharmacy benefits manager (PBM) initiative which Elevance says will develop and maintain contracts with pharmacies and drug manufacturers, thereby better facilitating prescription drug claims. The company benefits from a critical and entrenched position in the US health care system, and we see meaningful opportunity for the company to continue its run of strong operational execution and grow earnings in the coming years.
In periods of weak performance, it is essential we adhere to our core investment philosophy. We will always be reward-seeking and growth focussed. Our approach is patient and long term and focuses on the operational progress of companies. It is our belief that earnings growth is the most reliable guide to long-term returns. However, we are cognizant of the fact that the environment has changed, and we recognize the need to respond to it. Staying at the forefront of change has been key to the Strategy's approach since its inception in 2005. Despite the uncertainty, shocks and volatility experienced in 2022, our optimism about the future remains undimmed. This sentiment is founded on the basis that all market environments, even challenging ones, present opportunities and our diversified approach to growth allows us to embrace ideas in a diverse range of wealth-creating businesses.
A significant amount of investment thought over the year has focussed on two (related) fronts. As detailed in previous letters, the first has been a practical exercise to weed the portfolio of several early-stage businesses where the investment thesis has deteriorated or where their financial resilience looks increasingly brittle as costs of capital rise. The first-order effect of this surgery has been to reduce the portfolio's exposure to very early-stage, loss-making companies. As a result, the portfolio feels much more balanced for the environment in which we now find ourselves.
The second step focused more on philosophy and process. Whenever we look at a new business or re-examine an existing holding, we ask ourselves four questions, one of which is, 'What does it add to the portfolio?'. The salience of this question increases in importance during periods of exuberance in certain areas of the market. We have been working on better identifying when we are in such an episode of investor herding which might have helped avoid the concentration in early-stage pre-profit businesses. To be clear, the above does not, and must not, preclude us from buying exciting, immature companies on your behalf, where the range of outcomes can be very wide. The importance of a reward-seeking mentality remains paramount.
19
Management Discussion (unaudited)
Annual Report December 31, 2022
Investment strategies used to manage the Fund
We aim to invest in companies that will generate sustainable earnings growth above the market over the long-term. In determining the potential of a company, we analyze industry background, competitive advantage, management attitudes, financial strength, and valuation. We meet the management of the companies within our investment universe and revisit the investment case for the Fund's holdings on a regular basis to ensure that our expectations are being met.
Trading over the period
Our new buy and complete sale decisions, which are a result of our bottom-up stock research, are listed below:
New Buys:
Adobe, Analog Devices, Eaton, Entegris, MercadoLibre, Royalty Pharma, Shiseido
Complete Sales:
Brilliance China Automotive Holdings, Carvana, KE Holdings, Lyft, Naspers, Oscar Health, Peloton, Stericycle, Teladoc, Tencent Music Entertainment, Vimeo, VK Co, Zillow
20
Management Discussion (unaudited)
Annual Report December 31, 2022
Fund Performance for periods ended 12/31/22 (Average Annual Total Returns)
One Year | % p.a. Five Year | % p.a. Ten Year | % p.a. Since Inception | Inception Date | |||||||||||||||||||
| Baillie Gifford Global Alpha Equities Fund Class 2 | (29.08 | )% | 4.55 | % | 9.20 | % | 9.78 | % | 01/06/13 | ||||||||||||||
| Baillie Gifford Global Alpha Equities Fund Class 3 | (29.03 | )% | 4.63 | % | 9.27 | % | 9.86 | % | 11/15/11 | ||||||||||||||
| Baillie Gifford Global Alpha Equities Fund Class 4 | (29.00 | )% | 4.66 | % | 9.29 | % | 9.87 | % | 07/10/17 | ||||||||||||||
| Baillie Gifford Global Alpha Equities Fund Class K | (29.08 | )% | 4.56 | % | 9.20 | % | 9.78 | % | 04/28/17 | ||||||||||||||
| Baillie Gifford Global Alpha Equities Fund Institutional Class | (29.14 | )% | 4.50 | % | 9.10 | % | 9.68 | % | 04/28/17 | ||||||||||||||
MSCI ACWI Index | (17.96 | )% | 5.74 | % | 8.53 | % | 9.04 | % | 11/15/11 | ||||||||||||||
The returns are provided for all shares classes that had shares outstanding as of December 31, 2022. Additional year-over-year returns for each class are available in the Financial Highlights section.
Returns for the Class 2 shares are based on actual performance from January 6, 2013. Prior to that date returns are calculated based on the oldest share class of the Fund and were not adjusted to reflect the differences in class expense due to the fees being lower.
Returns for the Class 4 shares are based on actual performance from July 10, 2017. Prior to that date returns are calculated based on the oldest share class of the Fund and were not adjusted to reflect the differences in class expense due to the fees being lower.
Returns for the Class K and Institutional Class shares are based on actual performance from April 28, 2017. Prior to that date returns are calculated based on the oldest share class of the Fund adjusted to reflect the Class K and Institutional Class fees where these fees are higher.
Comparison of the change in value of $10,000 Investment in the Fund's Class 3 shares and the index.

Past performance does not predict future performance. The graph and the table above do not reflect the deduction of taxes that a shareholder would pay on the Fund distributions or redemption of Fund shares.
21
Management Discussion (unaudited)
Annual Report December 31, 2022
Baillie Gifford Global Stewardship Equities Fund
At a meeting held on December 13, 2022, the Board of Trustees of Baillie Gifford Funds approved the liquidation and termination of Baillie Gifford Global Stewardship Equities Fund. It is expected that the Fund will be liquidated and terminated in mid-2023.
Market Conditions and Review of Performance during 2022
It has been an incredibly challenging 12 months for the Fund, and performance has been poor. As we will describe below, we believe this can largely be explained by the investment backdrop, as growth equities have been deeply out of favor due to rising interest rates. Moreover, despite deteriorating economic conditions, we remain confident in the companies held by the Fund. At an aggregate level, these firms start with stronger balance sheets than the wider market. We believe they will grow faster than the index over time, underpinned by relatively higher reinvestment rates in capital spending and research & development (R&D).
Regarding the backdrop, a confluence of events — rampant inflation, interest rate rises and the outbreak of war in Ukraine — have hurt sentiment. This led to significant compression of valuations, the largest such fall since 1975, according to the Financial Times, with the growth companies favored by the Fund particularly hard hit.
Towards the end of the period, investors began to fret that higher interest rates would push economies into recession and that companies would struggle as a result. Given this, we have spent time analysing the short-term resilience of the portfolio. Most of the portfolio remains profitable or cash flow-positive and, therefore, we believe most of the portfolio will be able to sustain the downturn without needing additional external capital.
In terms of individual detractors from performance over the past year, the online furniture retailer Wayfair has struggled as its growth slowed following super-normal demand during pandemic lockdowns. Meanwhile, the enzyme development business Codexis suffered as its partner Pfizer cancelled a significant contract with the company.
But other holdings have been weak despite impressive operational progress — we believe these are examples of the valuation compression referred to above. For example,
shares in the Canadian internet retail platform Shopify have fallen by three quarters, despite the firm continuing to grow at double-digit rates. Twilio, a provider of programmable communication tools, is down by more than 80 percent, despite continuing to grow and expand its base of new customers and sales to existing accounts.
We believe the impact of the valuation squeeze is further illustrated by the fact that two of the largest positive contributors to performance over the year were stocks not held — social media group Meta and software company Microsoft. The two firms are large parts of the Fund's comparative index; hence the weakness in their share prices over the 12 months was beneficial to relative, if not absolute, returns.
More positively, the holding in medical devices company Abiomed performed well after the company was the subject of a takeover bid by Johnson & Johnson at a 50 per cent premium to the prevailing share price. Abiomed's management team has recommended this bid and we reduced the holding as a result. The takeover completed at the end of the year.
Wider portfolio turnover was low during the year's first half but picked up in the second half as we sought to invest in more resilient growth companies. This involved selling out of some firms which we believed would be challenged by higher interest rates and a deteriorating economic backdrop, such as consumer-related firms Affirm Holdings and LendingTree. In their place, we took holdings in companies as diverse as cosmetics firm L'Oréal, niche engineer Spirax Sarco, and logistics business DSV.
Investment strategies used to manage the Fund
Baillie Gifford is a growth manager with a bottom-up approach to stock picking. Bottom-up investing is an investment approach that focuses on analysing individual stocks and deemphasizes the significance of economic and market cycles. We aim to invest in companies that will generate sustainable long-term earnings growth. We analyse industry background, competitive advantages, management capabilities, financial strength and valuation, and environmental, social and governance (ESG) factors in determining a company's potential. From the outset, we also consider aspects that may derail the investment case and revisit the thesis for the Fund's holdings regularly to ensure our expectations are met.
22
Management Discussion (unaudited)
Annual Report December 31, 2022
Trading over the period
Our new buy and complete sale decisions, which are a result of our bottom-up stock research, are listed below:
New Buys:
DSV, Experian, L'Oréal, Moderna, Progyny, Recruit, Spirax Sarco, Starbucks, Wise
Complete Sales:
Affirm Holdings, Alibaba, Baidu, Denso, Hargreaves Lansdown, iRobot, Just Group, LendingTree, Peloton Interactive, SoftBank, Tencent
Fund Performance for periods ended 12/31/22 (Average Annual Total Returns)
One Year | % p.a. Five Year | % p.a. Since Inception | Inception Date | ||||||||||||||||
| Baillie Gifford Global Stewardship Equities Fund Class K | (42.41 | )% | 3.48 | % | 3.75 | % | 12/14/17 | ||||||||||||
| Baillie Gifford Global Stewardship Equities Fund Institutional Class | (42.41 | )% | 3.48 | % | 3.75 | % | 12/14/17 | ||||||||||||
MSCI ACWI Index | (17.96 | )% | 5.74 | % | 6.03 | % | 12/14/17 | ||||||||||||
The returns are provided for all shares classes that had shares outstanding as of December 31, 2022. Additional year-over-year returns for each class are available in the Financial Highlights section.
Comparison of the change in value of $10,000 Investment in the Fund's Class K shares and the index.

Past performance does not predict future performance. The graph and the table above do not reflect the deduction of taxes that a shareholder would pay on the Fund distributions or redemption of Fund shares.
23
Management Discussion (unaudited)
Annual Report December 31, 2022
Baillie Gifford Health Innovation Equities Fund
Market Conditions and Review of Performance during 2022
2022 was a painful year for growth equity investors. The performance of the Fund suffered in the year's first half. While the Fund regained significant ground in the second half, the Fund's Class K shares ultimately underperformed the MSCI ACWI Index and the MSCI ACWI Health Care Index for the calendar year. We understand that the returns the Fund has produced over the last 12 months are uncomfortable and challenging for investors in the Fund. We appreciate your patience and support.
We believe that fear and uncertainty over rampant inflation, rising interest rates, slowing global growth, and the war in Ukraine were behind much of the market volatility. Growth stocks generally suffered the most, which impacted the Fund's performance. Of course, there have also been some companies in the Fund that have struggled this year. 10x Genomics and Illumina were among the biggest detractors to relative performance in 2022.
10x Genomics is a US biotechnology company that develops instruments and consumables to analyze single cells. When combined with next-generation sequencing, we believe 10x Genomics' tools can enable researchers to make more granular discoveries, leading to more personalized treatments than is currently the case. The strong US dollar in 2022 impacted its exports, and the challenging macro environment meant some customers decided to delay spending on projects involving 10x's machines. This led to the company reducing its growth guidance several times during 2022 hurting the share price. Reassuringly, 10x continues to innovate at an impressive pace, and we believe the current headwinds for 10x are cyclical.
Illumina is the world leader in the genome sequencing market. Several legal challenges and weaker-than-expected financial results weighed on its share price during the year. In May, it lost a patent-infringement case which could cost $333 million in royalty payments. In September, the European Union blocked Illumina's acquisition of Grail, the pan-cancer blood screening company, on antitrust grounds. Illumina is appealing both decisions. Management is confident in their appeal arguments (and has indicated that they have workarounds should the appeals be unsuccessful). Meanwhile, fundamental growth has stalled. While macroeconomic conditions are probably partly to blame, there is growing competition. Nevertheless, we believe the potential for genomic sequencing to revolutionize health
care in the coming years remains vast, and Illumina still dominates the market.
This year's top relative performance contributors include Shockwave Medical and Alnylam Pharmaceuticals. Shockwave (a cardiovascular catheter company) consistently delivered ahead of expectations in terms of sales, margins and forecasts and aims to be the standard of care for treating hardened arteries globally. It continues to reinvest in research and development to broaden and enhance its existing product offering, alongside its ongoing commitment to generate robust clinical data to support the safety and efficacy of its technology to treat blocked arteries.
Alnylam, the leading RNA interference (RNAi) drug developer, enjoyed growing revenues from its novel commercial lineup and announced positive results in its latest phase three clinical trial for a genetic heart disease. We also saw further evidence of the potential for Alnylam's RNAi platform as, in July, it launched the fifth Alnylam-discovered product within four years. We believe there is substantial additional return potential in Alnylam's platform, which could raise the standard of care across a widening range of diseases.
The Fund's performance in 2022 is doubly frustrating given the disconnect between the strong fundamental progress of most of the companies in the Fund and their share prices. On average, companies in the Fund have grown sales by approximately 24% per year over the last five years, nearly four times the broader market, and their earnings by approximately 20% per year, nearly double the market. Almost 70% of the portfolio by weight has positive net income and/or cash flows, and 68% of the portfolio by weight sits on net cash.
Despite the problematic macro conditions, this is an exciting time to invest in innovative healthcare. 2022 saw breakthrough announcements on treatments for Alzheimer's disease, gene-editing of immune cells to treat cancer, and Moderna's Personal Cancer Vaccine delivering exceptional trial results for very sick skin cancer patients. The majority of holdings in the Fund are healthy. We are pleased with how they are delivering operationally and believe this select group of exceptional healthcare companies are well-placed for long-term growth.
Investment strategies used to manage the Fund
The Fund seeks to meet its objective by investing in growing companies that have the potential to bring substantial improvements in human health and healthcare systems.
24
Management Discussion (unaudited)
Annual Report December 31, 2022
We aim to find companies that are driving innovation across the full value chain of human health, categorized into five 'buckets': (i) understanding of diseases, (ii) diagnostic healthcare tools, (iii) treatment for disease, (iv) prevention of diseases, and (v) operational efficiency in the healthcare industry.
We employ a bottom-up stock-picking approach that seeks to make long-term investments in well-managed healthcare businesses with genuine and sustainable competitive advantages. We believe these companies will generate sustainable earnings growth above the market over the long term.
In determining the potential of a company, we conduct fundamental research focused on: (i) the opportunity for it to deliver superior returns; (ii) its ability to execute on that opportunity; and (iii) the current valuation. Inputs into this research include its competitive advantage, culture, management approach, financial strength and environmental, social, and governance characteristics.
The Fund is a non-diversified fund as we concentrate our investments in healthcare and healthcare-related industries. We reserve the flexibility to use the Fund's position as a shareholder to guide companies in the portfolio to resist excessive focus on shorter-term returns over the goal of delivering longer-term outcomes for both investors and society.
Trading over the period
Our new buy and complete sale decisions, which are a result of our bottom-up stock research, are listed below:
New Buys:
Doximity, Staar Surgical, Zai Lab
Complete Sales:
American Well Corp, BridgeBio Pharma
25
Management Discussion (unaudited)
Annual Report December 31, 2022
Fund Performance for periods ended 12/31/22 (Average Annual Total Returns)
One Year | % p.a. Since Inception | Inception Date | |||||||||||||
Baillie Gifford Health Innovation Equities Fund Class K | (32.46 | )% | (32.38 | )% | 12/28/21 | ||||||||||
Baillie Gifford Health Innovation Equities Fund Institutional Class | (32.46 | )% | (32.38 | )% | 12/28/21 | ||||||||||
MSCI ACWI Index | (17.96 | )% | (17.98 | )% | 12/28/21 | ||||||||||
MSCI World Healthcare Index | (4.97 | )% | (4.67 | )% | 12/28/21 | ||||||||||
The returns are provided for all shares classes that had shares outstanding as of December 31, 2022. Additional year-over-year returns for each class are available in the Financial Highlights section.
Comparison of the change in value of $10,000 Investment in the Fund's Class K shares and the index.

Past performance does not predict future performance. The graph and the table above do not reflect the deduction of taxes that a shareholder would pay on the Fund distributions or redemption of Fund shares.
26
Management Discussion (unaudited)
Annual Report December 31, 2022
Baillie Gifford International Alpha Fund
Market Conditions and Review of Performance during 2022
2022 has been a challenging year for long-term growth investors with few places to hide. Indeed, the flight to safety in the face of recent volatility saw not only rapid growth stocks sell-off, but quality stocks were affected at the same time.
There have been some recent straws in the wind, however. The unwinding of one or two of the macroeconomic factors we observed during last year's "polycrisis" has brought brief periods of relief in equity markets, notably in July and November. Looking ahead, it is worthy of note that manufacturing activity in Europe is showing signs of improvement and gas prices are beginning to fall from elevated levels. The decision from the Chinese Communist Party to relax COVID-19 restrictions towards the end of the period was also received well by markets and we hope will underpin a more supportive demand backdrop for a number of portfolio holdings. China's "zero-COVID" policy has weighed heavily on global demand and supply chains alike and although there has since been an inevitable spike in cases there is some tentative evidence now emerging that infection levels are peaking in major Chinese cities. In this context, the Fund has underperformed its benchmark over the 12-month period.
Throughout the period we have remained focused on the fundamentals of individual companies held in the Fund. We benefit from being an unlimited liability partnership, meaning our interests as a firm are fully aligned with those of our clients on long-term returns. This means our fund managers are able to look past short-term performance and dedicate their efforts on the next 5 years and beyond, which we believe helps to ensure the Fund is well placed to capitalize on the attractive structural growth opportunities that may lie ahead.
The bottom contributing holdings in the Fund included online platform names and certain European holdings.
MercadoLibre, the leading Latin American e-commerce platform was the largest detractor. The negative sentiment around high-growth technology stocks saw its share price derate this year even though results have continued to be strong. Total Payment Volume increased 76% year-on-year, margins have expanded and the business continues to gain market share. MercadoLibre's financial technology segment (MercadoPago) is an exciting development which is progressing well and which we
believe has the potential to generate attractive returns in the future. In the long term, we are excited by the company's operational resilience amid recent volatility and the opportunity for it to continue to gain further share in the Latin American e-commerce space.
It will not surprise you to learn that several European holdings struggled in 2022. Chief among these is Kingspan, the Irish leader in high-quality insulation materials which has seen its share price fall sharply. The construction sector has struggled in the face of rising interest rates; whilst lack of confidence in the sustainability of demand has been reflected in negative sentiment towards the stock. Meanwhile, Spotify, the music streaming specialist also detracted from performance. The business has posted solid results with monthly active users rising 20% year on year, but with profitability lagging expectations (largely on the back of continued investment), the share price has suffered.
The top contributors to performance include names which are natural beneficiaries of a rising inflationary environment and names which rebounded following China's reopening.
Leading Asian life insurer, AIA, recovered from a difficult first 10 months of the year to deliver positive returns for the year. This was largely due to the reopening across China which significantly buoyed sentiment towards a number of Chinese holdings. AIA it is a beneficiary of rising middle-class income, which we believe will underpin rising insurance penetration in Asia. AIA continues to expand its presence in China, invest in well-trained agents and benefits from a huge untapped market for its insurance products in lower-tier Chinese cities.
Anglo-UK mining business, Rio Tinto, also contributed positively to performance. The backdrop of rising commodity prices driven by increasing demand provided a supportive backdrop for the company. During the period the business announced the completion of the acquisition of the Turquoise Hill mine, the largest copper mine in the world which should position it well to capitalize on the structural growth of this commodity, underpinned by rising demand for electrification. We have been continuing to engage with Rio Tinto and recently participated in two separate events hosted by the Chair, CEO and several senior managers, including the CEO of Rio Tinto Australia. This engagement has offered us additional insight into managing the complex climate-related risks and opportunities that Rio Tinto faces and we are also interested to learn that the role of Chief Scientist has been re-established to ramp up technical skills to help potential de-carbonization.
27
Management Discussion (unaudited)
Annual Report December 31, 2022
Investment strategies used to manage the Fund
The investment strategy remains unchanged. The Fund invests in growth stocks based on bottom-up company analysis. In determining the potential of a company, we analyze industry opportunity, competitive advantage, management attitudes, financial strength, and valuation.
We also consider whether we have a different view from the market. We think that the market, in general, is too short-term and inward-looking. Our ability to add value is derived from having a much longer time horizon and from our differentiated sources of information. We believe our patient investment approach, and reputation as a long-term investor, allows us to develop much deeper relationships with management teams and have more meaningful conversations with company leaders.
Trading over the period
Our new buy and complete sale decisions, which are a result of our bottom-up stock research, are listed below:
New Buys:
AbCellera, Coupang, EXOR, Kering, Keyence, MIPS, MonotaRO, Nexans, Oxford Nanopore, Sartorius, Shopify
Complete Sales:
CSL, Hangzhou Tigermed Consulting, Hargreaves Lansdown, Heineken, JD.com, KE Holdings, Naver, Ping An Health, Prudential, Temenos, Umicore, Zai Lab
28
Management Discussion (unaudited)
Annual Report December 31, 2022
Fund Performance for periods ended 12/31/22 (Average Annual Total Returns)
One Year | % p.a. Five Year | % p.a. Ten Year | % p.a. Since Inception | Inception Date | |||||||||||||||||||
Baillie Gifford International Alpha Fund Class 2 | (28.64 | )% | (0.24 | )% | 4.42 | % | 3.75 | % | 02/07/08 | ||||||||||||||
Baillie Gifford International Alpha Fund Class 3 | (28.59 | )% | (0.17 | )% | 4.49 | % | 4.00 | % | 09/01/10 | ||||||||||||||
Baillie Gifford International Alpha Fund Class 4 | (28.57 | )% | (0.14 | )% | 4.48 | % | 3.79 | % | 07/10/17 | ||||||||||||||
Baillie Gifford International Alpha Fund Class 5 | (28.53 | )% | (0.09 | )% | 4.55 | % | 3.84 | % | 04/07/14 | ||||||||||||||
Baillie Gifford International Alpha Fund Class K | (28.65 | )% | (0.23 | )% | 4.42 | % | 3.75 | % | 04/28/17 | ||||||||||||||
| Baillie Gifford International Alpha Fund Institutional Class | (28.67 | )% | (0.32 | )% | 4.31 | % | 3.62 | % | 04/28/17 | ||||||||||||||
MSCI ACWI ex USA Index | (15.57 | )% | 1.36 | % | 4.28 | % | 2.91 | % | 02/07/08 | ||||||||||||||
The returns are provided for all shares classes that had shares outstanding as of December 31, 2022. Additional year-over-year returns for each class are available in the Financial Highlights section.
Returns for the Class 3 shares are based on actual performance from September 1, 2010. Prior to that date returns are calculated based on the oldest share class of the Fund and were not adjusted to reflect the differences in class expense due to the fees being lower.
Returns for the Class 4 shares are based on actual performance from July 10, 2017. Prior to that date returns are calculated based on the oldest share class of the Fund and were not adjusted to reflect the differences in class expense due to the fees being lower.
Returns for the Class 5 shares are based on actual performance from April 7, 2014. Prior to that date returns are calculated based on the oldest share class of the Fund and were not adjusted to reflect the differences in class expense due to the fees being lower.
Returns for the Class K and Institutional Class shares are based on actual performance from April 28, 2017. Prior to that date returns are calculated based on the oldest share class of the Fund adjusted to reflect the Class K and Institutional Class fees where these fees are higher.
Comparison of the change in value of $10,000 Investment in the Fund's Class 2 shares and the index.
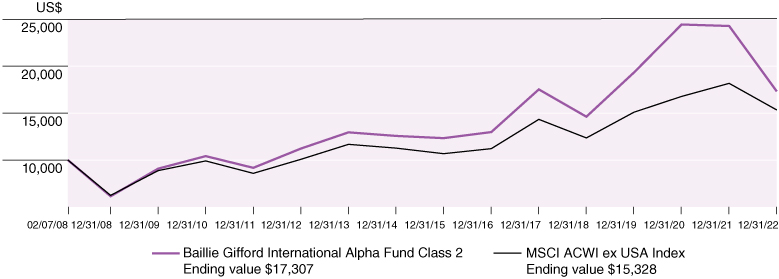
Past performance does not predict future performance. The graph and the table above do not reflect the deduction of taxes that a shareholder would pay on the Fund distributions or redemption of Fund shares.
29
Management Discussion (unaudited)
Annual Report December 31, 2022
Baillie Gifford International Concentrated Growth Equities Fund
Market Conditions and Review of Performance during 2022
Baillie Gifford International Concentrated Growth Equities Fund takes a long-term view in finding the 20-35 most rapidly growing companies in international markets: Companies taking market share at scale by disrupting incumbents.
However, the market environment has been singularly challenging for our style of growth investing this year and in that market environment the Fund has underperformed.
The academic Adam Tooze has termed what we've experienced this year as a 'polycrisis'. The stresses of war, supply chain disruption, geopolitical tensions, rising inflation and higher interest rates have combined to create a period of significant uncertainty for financial markets.
The market has reacted by spending much of the year fixated on macroeconomics. We believe that the latest Consumer Price Index print and, more so than usual, the language from the US Federal Reserve, have become, at least in the short-term, the main determinants of share prices. The adjustment to a higher interest rate environment has clearly been painful for growth companies and the main driver of our material underperformance this year. We recognize that this will have been an uncomfortable time for our clients. As ever, there will be things that we, as investors, should reflect on and learn from this period, but as we look forward, we remain optimistic about the long-term potential of the Fund.
We are not macroeconomic forecasters, but our central case is that we believe we are close to the peak in interest rates and that the debate is now over half a point in either direction. However, the source of our long-term optimism is that, in the long run, we think it will continue to be the individual and fundamental progress of companies that matters. And as we peer beneath the macroeconomic storm, the picture we find is far from distressing. The majority of the Fund's holdings have continued not just to grow, but to grow rapidly. Many have even done so whilst improving profitability.
Among the main detractors were Ocado and Zalando.
The share price of Ocado, the UK based online grocery retailer, slid for most of the year, though it experienced a partial rebound in the last quarter. The company is creating technology that it believes will transform the retail, logistics and distribution of online groceries. Ocado's
thrust onto the global stage is being achieved by forming partnerships with leading groceries companies around the world, by offering those businesses a radical new avenue for meeting their customers' needs. During the market tumult that began earlier in 2022, Ocado received particularly negative sentiment as investors baulked at the company's invest now for earnings later strategy. However, later in the year, the company offered a "roadmap to cash flow positive" to help with market concerns — the key message has been the "business is fully funded, and on the road to cash flow positive in the midterm" (4-6 years). Recent operational progress has included the announcement that Ocado will help Lotte, the largest food business group in South Korea, to develop their online business. We also learned that their US partner, Kroger, is expanding operations through the acquisition of Albertsons. We remain enthusiastic about the company's opportunity and execution.
Zalando is Europe's leading fashion platform. Consumer sentiment in Germany, the company's largest market, deteriorated throughout 2022 to an all-time low at the beginning of the fourth quarter. Similarly, tough operating conditions across Europe have resulted in decelerating topline growth and a series of downgrades to the group's near-term financial guidance this year. Recent results showed that management are working on increasing profitability. Its competitive advantages include: strong brand recognition, a wide product and brand assortment, and solid logistics capabilities.
The top contributors to performance included Genmab and Hermès.
Genmab is a Danish biotech company that develops antibody-based drugs. The group primarily focuses on two categories of cancer (solid tumors and blood cancers). The company continues to do well operationally. Its 9 months revenues rose 60% year-on-year, driven by higher royalties from DARZALEX (treatment of Multiple Myeloma), Kesimpta (for adults with relapsing multiple sclerosis) and TEPEZZA (treatment of thyroid eye disease), stemming from Genmab's collaboration with Janssen, Novartis and Roche. On the back of those results, management increased their full year guidance. In addition, Genmab recently made regulatory submissions for Epcoritamab (treatment of hematologic malignancies) in both the USA and Europe. We remain excited about the long-term outlook for Genmab, whose core purpose is to improve the lives of people with cancer. The company currently has 6 approved therapies, 4 proprietary technologies and more than 20 products in clinical development.
30
Management Discussion (unaudited)
Annual Report December 31, 2022
Hermès is a 180-year-old family run luxury goods company with exceptionally strong brand appeal. Its segments are leather goods and saddlery, clothes and accessories, silk and textiles, and other products such as perfumes, watches, jewelry, and home furnishings. The share price fell earlier in 2022, as part of the broader selloff that growth experienced. However, it recovered much of that over the remainder of the year, as the market recognized Hermès' strength of financials and pricing power. Reports during 2022 of strong year-on-year sales growth also helped. Importantly for us, is the company's long-term view to a greater portion of an increasing global spend on luxury. The sector has structural buoyancy, with newer markets and a growing number of high-net-worth individuals, and we believe Hermès' enduring appeal places it well to take substantial share.
Investment strategies used to manage the Fund
The Fund invests in growth stocks based on bottom-up company analysis. In determining the potential of a company, we conduct a process of Idea Generation, Initial Research, Investment Decision and Ownership. Within
Initial Research, we consider questions on exceptional growth potential, durable edge, stewardship, financial strength and perspective.
We think that the market, in general, is too short-term and inward looking. Our ability to add value is derived from having a much longer time horizon, from being concentrated, from seeking to take advantage of asymmetric returns, and from our differentiated sources of information. When formulating an investment opinion we prefer to listen to alternative voices such as industry experts, academics, visionary management and unlisted companies.
Trading over the period
Our new buy and complete sale decisions, which are a result of our bottom-up stock research, are listed below:
New Buy:
Ginkgo Bioworks
Complete Sale:
Ping An Insurance
31
Management Discussion (unaudited)
Annual Report December 31, 2022
Fund Performance for periods ended 12/31/22 (Average Annual Total Returns)
One Year | % p.a. Five Year | % p.a. Since Inception | Inception Date | ||||||||||||||||
| Baillie Gifford International Concentrated Growth Equities Fund Class K | (39.55 | )% | 8.75 | % | 8.77 | % | 12/14/17 | ||||||||||||
| Baillie Gifford International Concentrated Growth Equities Fund Institutional Class | (39.58 | )% | 8.62 | % | 8.64 | % | 12/14/17 | ||||||||||||
MSCI ACWI ex USA Index | (15.57 | )% | 1.36 | % | 1.82 | % | 12/14/17 | ||||||||||||
The returns are provided for all shares classes that had shares outstanding as of December 31, 2022. Additional year-over-year returns for each class are available in the Financial Highlights section.
Comparison of the change in value of $10,000 Investment in the Fund's Class K shares and the index.

Past performance does not predict future performance. The graph and the table above do not reflect the deduction of taxes that a shareholder would pay on the Fund distributions or redemption of Fund shares.
32
Management Discussion (unaudited)
Annual Report December 31, 2022
Baillie Gifford International Growth Fund
Market Conditions and Review of Performance during 2022
2022 presented a multitude of challenges to growth investors. We struggled with the interrelated stresses of a major war in Europe, global supply chain disruption, rising geopolitical tensions, inflation shocks and the abrupt change in the interest rate landscape. Unwinding 14 years of accommodative monetary policy was always likely to be painful. The Fund underperformed its benchmark with a return of (34.43)% for Class 2 shares over the 12-month period versus a benchmark return of (15.57)% for the MSCI ACWI ex USA Index.
The rise in long term interest rates, and the higher discount factor applied to future cashflows, had a greater effect on companies earlier in their growth trajectory. Many of these businesses had also seen their valuations expand during the COVID-19 pandemic, and many fell back sharply in the last twelve months. Those with high exposure to consumer spending also suffered, given the likelihood of a difficult near-term operating environment as pressure mounts on consumers wallets.
Our analysis remains focused on the long-term growth potential of each business in the Fund. Where our companies continue to execute well operationally, we used share price weakness as an opportunity to add to existing holdings. We also added new companies to the Fund at lower valuations.
Amongst 2022's detractors, Spotify was the largest drag on the Fund's return as concerns rose about consumer loyalty during a recession, and its valuation fell sharply. Third quarter results showed that the group grew the number of premium subscribers at a double-digit rate year-on-year, which was still surprisingly resilient. But the growth in advertising revenue began slowing down, in a challenging macro-economic environment. We still believe in the long-term blue-sky for Spotify as it is still early in terms of monetization of audio. Importantly, advertising is a key growth driver, notably through podcasts. But we fear there could be further short-term weakness to come as the cost-of-living crisis might cause people to switch to free, albeit lower quality, music streaming services.
Other detractors in the year included Dutch payment service company Adyen and on-line fashion retail group Zalando.
Despite weaker macro conditions, Adyen's net revenue remains on track to grow in the 30% range in 2022. The
market is concerned that continued investment in its future growth will continue to weigh on margins near term. We remain confident in its investment case. Its large longer-term growth opportunity is to expand beyond traditional payments, for example into the areas of capital, accounts, and foreign exchange management.
Consumer sentiment in Germany, Zalando's largest market, has deteriorated throughout 2022 to an all-time low at the beginning of the fourth quarter. Similarly, tough operating conditions across Europe have resulted in decelerating top line growth and a series of downgrades to the group's near-term financial guidance during 2022. Recent results showed that management are working on increasing profitability. Its competitive advantages include: strong brand recognition, a wide product and brand assortment, and solid logistics capabilities. On one hand, we are reflecting on whether the dramatic slowdown in its gross merchandise volume growth rate this year could be signalling the business is more mature than we previously assumed. On the other hand, Zalando still has a mere 3% share of online fashion spend which seems very low for an aggregator. Management hope to take this to 10% plus.
Positive contributors to performance were generally companies with more defensive characteristics, particularly some of our more innovative healthcare holdings; two of these businesses featured in the top three contributors to performance.
Danish biotech company Genmab performed well. Sales of its flagship product Darzalex, for the treatment of Multiple Myeloma, continued to beat market expectations. This allowed management to upgrade their financial guidance for the year. More importantly, its own proprietary pipeline continues to develop and shall allow the group to further flesh out its commercial capabilities.
2022 marked the first commercial revenues for Argenx as it launched efgartigimod, for the treatment of generalized Myasthenia Gravis, across multiple geographies including the important US market. The revenues of the Belgian biotech company continued to exceed market expectations throughout the year. Management are clearly confident in the prospects of broadening the usage of efgartigimod. Indeed, they recently purchased a Food and Drug Administration (FDA) priority review voucher which should accelerate future marketing applications in additional indications.
AIA is the largest pan-Asian life insurer, present in 18 countries, providing protection and wealth products. There is a $110 trillion mortality protection gap across its markets, which equates to the need for an additional $275 billion in additional annual life insurance premiums
33
Management Discussion (unaudited)
Annual Report December 31, 2022
by 2030. In the latter months of 2022, AIA's share price responded positively to the lifting of COVID-19 restrictions in China. These restrictions had limited its ability to operate to its full potential. With these impediments now lifting, expectations are for a return to a more hospitable operating environment.
Investment strategies used to manage the Fund
As active bottom-up stock pickers, our ability to add value is derived from patient ownership of exceptional growth companies. Our investment process is designed to identify a sufficient number of rare businesses and own them in size for the long term.
In determining the potential of a company, we consider its competitive advantage, its culture, its management approach and financial strength. We use scenario analysis to explore the scale and probability of different outcomes.
We are interested in two types of growth companies: those that are able to grow very rapidly, and those with durable growth prospects. The Fund's exposure to these two types of growth is typically fairly balanced. In each case, we expect a holding to have the potential to grow to multiple of their current size.
To assess an investment case, we look for information outside the financial world. For instance, we engage with academia, spend time with authors and with the management teams of unlisted businesses. Most of all, we pay attention to long term duration trends to see how the world could be in many years to come and which companies could benefit from these changes.
Trading over the period
Our new buy and complete sale decisions, which are a result of our bottom-up stock research, are listed below:
New Buys:
AutoStore, CyberAgent, Elastic, Ganfeng Lithium,Prysmian, GMO Payment Gateway, Mobileye, Nu Holdings, SEA, Wise
Complete Sales:
Block Inc (formerly Afterpay), CureVac,Morphosys, Inditex, Pan Pacific International, Ping An Insurance, Stellantis, TAL Education Group
34
Management Discussion (unaudited)
Annual Report December 31, 2022
Fund Performance for periods ended 12/31/22 (Average Annual Total Returns)
One Year | % p.a. Five Year | % p.a. Ten Year | % p.a. Since Inception | Inception Date | |||||||||||||||||||
Baillie Gifford International Growth Fund Class 2 | (34.43 | )% | 1.91 | % | 6.57 | % | 4.76 | % | 03/06/08 | ||||||||||||||
Baillie Gifford International Growth Fund Class 3 | (34.38 | )% | 1.98 | % | 6.64 | % | 4.83 | % | 04/19/10 | ||||||||||||||
Baillie Gifford International Growth Fund Class 4 | (34.36 | )% | 2.01 | % | 6.64 | % | 4.81 | % | 10/10/16 | ||||||||||||||
Baillie Gifford International Growth Fund Class 5 | (34.33 | )% | 2.06 | % | 6.73 | % | 5.01 | % | 07/19/12 | ||||||||||||||
Baillie Gifford International Growth Fund Class K | (34.43 | )% | 1.91 | % | 6.57 | % | 4.76 | % | 04/28/17 | ||||||||||||||
| Baillie Gifford International Growth Fund Institutional Class | (34.49 | )% | 1.84 | % | 6.46 | % | 4.64 | % | 04/28/17 | ||||||||||||||
MSCI ACWI ex USA Index | (15.57 | )% | 1.69 | % | 4.98 | % | 2.63 | % | 03/06/08 | ||||||||||||||
MSCI EAFE Index | (14.01 | )% | 2.03 | % | 5.16 | % | 2.99 | % | 03/06/08 | ||||||||||||||
The returns are provided for all shares classes that had shares outstanding as of December 31, 2022. Additional year-over-year returns for each class are available in the Financial Highlights section.
Returns for the Class 3 shares are based on actual performance from April 19, 2010. Prior to that date returns are calculated based on the oldest share class of the Fund and were not adjusted to reflect the differences in class expense due to the fees being lower.
Returns for the Class 4 shares are based on actual performance from October 10, 2016. Prior to that date returns are calculated based on the oldest share class of the Fund and were not adjusted to reflect the differences in class expense due to the fees being lower.
Returns for the Class 5 shares are based on actual performance from July 19, 2012. Prior to that date returns are calculated based on the oldest share class of the Fund and were not adjusted to reflect the differences in class expense due to the fees being lower.
Returns for the Class K and Institutional Class shares are based on actual performance from April 28, 2017. Prior to that date returns are calculated based on theoldest share class of the Fund adjusted to reflect the Class K and Institutional Class fees where these fees are higher.
Comparison of the change in value of $10,000 Investment in the Fund's Class 2 shares and the index.

Past performance does not predict future performance. The graph and the table above do not reflect the deduction of taxes that a shareholder would pay on the Fund distributions or redemption of Fund shares.
35
Management Discussion (unaudited)
Annual Report December 31, 2022
Baillie Gifford International Smaller Companies Fund
Market Conditions and Review of Performance during 2022
During 2022 the Fund returned (39.20)% for Class K shares compared to a benchmark return of (19.57)%.
2022 is often referred to as the year of the polycrisis, as championed by Adam Tooze, the English historian. And this past year has rather been an eventful one. The ongoing COVID-19 pandemic (in addition to avian flu and monkeypox), the protracted Ukraine-Russia war, natural disasters worldwide from floods and drought to megastorms, heightening geopolitical tension between China and the West, supply chain disruptions, rampant inflation and rising interest rates made 2022 a year to remember for mostly the wrong reasons. The web of these significant, (often) interconnected, and complex issues was extremely difficult to disentangle and propagated to new areas in unpredictable ways. This led to a prolonged period of deep uncertainty in economic and societal terms.
The polycrisis, as mentioned above, may yet trigger further negative (and individually unpredictable) events. Investors and companies (of 2023) should be mindful of this. 2022, however, was also a year of exciting scientific and technological breakthroughs, the impact of which could be transformative. For example, take the US Food and Drug Administration (FDA's) first approval of cultivated meat, scientists' breakthrough in nuclear fusion, or the accelerating cadence of biotech developments such as cancer vaccines. These may not grab the same amount of news coverage as the 'crisis-of-the-day', but each of these examples has the potential to be truly transformational.
Over the year, the most significant detractor from relative performance was Hypoport, the online mortgage broker. It operates EUROPACE, Germany's leading online business-to-business mortgage marketplace, and its subsidiary, Dr Klein. The company has been grappling with rising interest rates and lower consumer confidence in the German housing market, culminating in a profit warning. Although fewer people are looking to purchase properties in the current economic climate, this hasn't dented our enthusiasm for this high-quality business. While continuing to increase market share, it is taking prudent measures on costs, and we think it should come out of this in a much stronger position.
Megachips, the manufacturer of Application Specific Integrated Circuits (ASIC) predominantly used in gaming devices such as Nintendo's Switch, has also been at the mercy of a challenging macroeconomic backdrop. This resulted in it reporting weaker sales during 2023. Notwithstanding, underlying profitability remains healthy, partly thanks to its gaming exposure. We believe it remains supported by strong long-term tailwinds in demand, part of which will come from Nintendo's next-generation console. It also has potential to increase its market share in areas such as factory automation and expansion into new markets.
The top contributor over the year was Brunello Cucinelli, the Italian high-end luxury clothing firm. It raised its revenue guidance for 2023 and 2024 after reporting healthy revenue growth for the first nine months of 2022. As a result, it looks set to meet its 10-year target of doubling sales by 2028, four years early. Management has continued to develop new revenue streams, recently signing a 10-year deal with Luxottica to manufacture and distribute eyewear under the Brunello Cucinelli brand. The luxury industry has been a bright spot in an otherwise challenging recent operating environment, and we believe Brunello's premium customer profile gives it particular resilience.
Another contributor over the year was Kamakura Shinsho, Japan's only comprehensive and independent online end-of-life service provider. We met with the founder and the president in Japan during November, and came away feeling enthused. As their business continues to recover post-COVID-19 — as evidenced by recently published financials — a crucial part of their long-term sales growth strategy is to build a nationwide network of local authority partners. We believe they will wield considerable influence in the choice of funeral parlors for people living within their areas. We learnt that this is progressing well, with the number of such alliances having more than doubled to 250 over the past year.
Investment strategies used to manage the Fund
The investment strategy used to manage the Fund has been unchanged over the year. The Fund employs bottom-up, fundamental research to build a portfolio of growing companies. The Fund is constructed with an awareness of the asset class; all new purchases must be below $2 billion in market capitalization at the time of purchase, we cannot add to a position once its value increases beyond $5 billion and we are forced sellers at $10 billion. International
36
Management Discussion (unaudited)
Annual Report December 31, 2022
smaller companies present a vast and incredibly diverse investment universe. This Fund seeks to find the exceptional businesses within that, companies with the potential to deliver strong returns for our clients, while acknowledging that these companies can do so in different ways. Our edge in this comes from our portfolio managers, who bring a range of experiences in managing small and all-cap portfolios across different geographies, and our ability to employ a longer-term investment horizon than most of the market. This long-termism is fundamental to how we exploit the asymmetry available in equity returns.
Central to our investment process is our 'Radar' framework. We assess all potential new and existing holdings against this. It has six spokes (opportunity, edge, alignment, scalability, sustainability, insight) that represent what we believe are the most important factors to the investment case. We recognize that special companies can
come in different shapes, and often the most exciting companies will score very highly in few, rather than all, categories.
Trading over the period
Our new buy and complete sale decisions, which are a result of our bottom-up stock research, are listed below:
New Buys:
Angle, Auto1, Freee, Nanoform Finland, Nayax, Shima Seiki, Snow Peak, Tonies, Trustpilot, Volpara Health Technologies, Vulcan Energy Resources
Complete Sales:
Daikyonishikawa, FDM Group, Genexine, Healios, Hotel Chocolat, Ichiyoshi Securities, Sato Holdings
Fund Performance for periods ended 12/31/22 (Average Annual Total Returns)
One Year | % p.a. Since Inception | Inception Date | |||||||||||||
Baillie Gifford International Smaller Companies Fund Class K | (39.20 | )% | 4.88 | % | 12/19/18 | ||||||||||
| Baillie Gifford International Smaller Companies Fund Institutional Class | (39.28 | )% | 4.84 | % | 12/19/18 | ||||||||||
MSCI ACWI ex-USA Small Cap Index | (19.57 | )% | 6.30 | % | 12/19/18 | ||||||||||
The returns are provided for all shares classes that had shares outstanding as of December 31, 2022. Additional year-over-year returns for each class are available in the Financial Highlights section.
Comparison of the change in value of $10,000 Investment in the Fund's Class K shares and the index.

Past performance does not predict future performance. The graph and the table above do not reflect the deduction of taxes that a shareholder would pay on the Fund distributions or redemption of Fund shares.
37
Management Discussion (unaudited)
Annual Report December 31, 2022
Baillie Gifford Long Term Global Growth Fund
Market conditions and review of performance during 2022
During 2022 global equity markets were faced by a challenging macroeconomic backdrop shaped by rampant inflation, rising interest rates, geopolitical tensions, and a slowing global economy. This proved particularly difficult for growth companies in which we invest. Market time horizons have shrunk markedly, making longer duration assets less desirable in the short term. Consequently, the Fund delivered a return of (46.04)% for Class 2 shares during the period, which was 28.08% behind the benchmark. However, we do not believe that such short-term views are an accurate reflection of a company's long-term value. As such we remain steadfast in our focus on the business fundamentals of our holdings over periods of five to ten years and beyond.
Reflecting on 2022, Tesla, Carvana and Atlassian were among the top detractors to the Fund's relative performance during the year.
The share price of Tesla, the electric vehicle company, experienced a significant decline over the course of the year as a range of factors weighed on sentiment. From a macroeconomic perspective the market showed signs of concern over slowing electric vehicle demand in the face of rising interest rates, with consumers more likely to delay the purchase of big-ticket items. In addition the company's Chief Executive Officer, Elon Musk, purchased Twitter in his personal capacity which raised questions over the degree to which this move might impact his time. Despite these developments the company's operational performance remains strong, having delivered just over 1.3 million new vehicles to customers in 2022 — an increase of 40% over the previous year.
The share price of Carvana, the online used car retailer, suffered a precipitous decline in 2022 as the company battled material macroeconomic headwinds and the market expressed significant concern over the potential for bankruptcy. The short-term challenges experienced by Carvana include a slowing economy impacting second-hand car demand, rising used car prices and interest rates making them less affordable, as well as the drying up of the asset backed security debt market which has been a more profitable financing route for the company. Despite this Carvana has generally been executing well and we believe the long-term opportunity remains attractive in the face of the short-term financing challenges sprouting from the macroeconomic environment.
The share price of Atlassian, the Australian software company, declined significantly during the year — likely a reflection of a slowing global economy which has seen companies reduce spending and slow hiring. This has resulted in a decrease in the rate of free users converting to free plans as well as a slowing of paid user growth. We believe that their competitive position and the demand for their products remain stable, however, with revenues up over 30% year on year.
Among the most notable contributors to relative performance during the year were Pinduoduo, Hermès and Dexcom.
Pinduoduo's share price appreciated during 2022 despite broader market concerns over Chinese equities throughout the year. Founded in 2015, the company has grown to become the largest online marketplace for agricultural products in China and now has more users than their sizeable competitor Alibaba. In the context of the Chinese regulatory environment, we believe that Pinduoduo's business model is well aligned with the state objectives of common prosperity by supporting small-scale farmers and merchants. In August, the company also launched an international platform, Temu, which sells low-cost Chinese-made products to consumers primarily situated in the United States.
Hermès, a 180-year-old family run luxury goods company, proved a durable holding over the course of 2022 despite an overall decline in its share price. It continues to compound steadily and has largely been insulated from rising inflation likely due to brand strength, scarcity value and luxury status. We believe the business exhibits strong fundamentals, and we continue to be attracted to its extreme long-term approach.
The share price of Dexcom, the glucose monitoring device manufacture, declined during the year but proved more resilient than the market more broadly. The company continued to show positive operational progress. The Dexcom G7 device — their smallest glucose monitoring sensor — received federal clearance in the United States. Their footprint also continued to expand internationally, with the G7 having been launched in the United Kingdom, Ireland, Germany, Austria and Hong Kong. The company has significant strategic and financial flexibility which we think leaves it well placed to capitalize on the vast opportunity relating to the management of diabetes globally.
Though this commentary pertains to the year 2022, as ever our focus is on the much longer-term prospects for companies in the Fund over five to ten years and beyond. Our role as stock-pickers remains as relevant as ever. We
38
Management Discussion (unaudited)
Annual Report December 31, 2022
are forever seeking to identify the small number of exceptional companies with the most compelling operational performance and opportunities for long-term growth. The trading undertaken for the portfolio in 2022 (as detailed in the table below) reflects our excitement in what we believe will be transformative growth companies over our investment horizon. We believe the potential for upside from here remains vast.
Investment strategies used to manage the Fund
Baillie Gifford is a growth manager with a bottom-up approach to stock picking. We aim to invest in companies that will generate sustainable earnings growth over the long-term. In determining the potential of a company, we analyse industry background, competitive advantage,
management attitudes, financial strength and valuation. We meet the management of the companies within our investment universe and revisit the investment case for the Fund's holdings on a regular basis to ensure that our expectations are being met.
Trading over the period
Our new buy and complete sale decisions, which are a result of our bottom-up stock research, are listed below:
New Buys:
Ginkgo Bioworks, MercadoLibre, Roblox, SEA
Complete sales:
Beyond Meat, Bilibili, Delivery Hero, JD.com, KE Holdings, Meta, Peloton
39
Management Discussion (unaudited)
Annual Report December 31, 2022
Fund Performance for periods ended 12/31/22 (Average Annual Total Returns)
One Year | % p.a. Five Year | % p.a. Since Inception | Inception Date | ||||||||||||||||
Baillie Gifford Long Term Global Growth Fund Class 2 | (46.04 | )% | 7.99 | % | 11.76 | % | 06/10/14 | ||||||||||||
Baillie Gifford Long Term Global Growth Fund Class 4 | (46.00 | )% | 8.01 | % | 11.77 | % | 04/12/22 | ||||||||||||
Baillie Gifford Long Term Global Growth Fund Class K | (46.04 | )% | 7.99 | % | 11.76 | % | 04/28/17 | ||||||||||||
| Baillie Gifford Long Term Global Growth Fund Institutional Class | (46.08 | )% | 7.91 | % | 11.66 | % | 04/28/17 | ||||||||||||
MSCI ACWI Index | (17.96 | )% | 5.74 | % | 6.64 | % | 06/10/14 | ||||||||||||
The returns are provided for all shares classes that had shares outstanding as of December 31, 2022. Additional year-over-year returns for each class are available in the Financial Highlights section.
Returns for the Class 4 shares are based on actual performance from April 12, 2022. Prior to that date returns are calculated based on the oldest share class of the Fund and were not adjusted to reflect the differences in class expense due to the fees being lower.
Returns for the Class K and Institutional Class shares are based on actual performance from April 28, 2017. Prior to that date returns are calculated based on the oldest share class of the Fund adjusted to reflect the Class K and Institutional Class fees where these fees are higher.
Comparison of the change in value of $10,000 Investment in the Fund's Class 2 shares and the index.
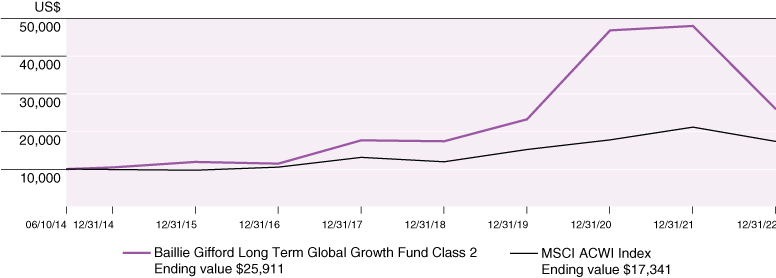
Past performance does not predict future performance. The graph and the table above do not reflect the deduction of taxes that a shareholder would pay on the Fund distributions or redemption of Fund shares.
40
Management Discussion (unaudited)
Annual Report December 31, 2022
Baillie Gifford U.S. Discovery Fund
Market Conditions and Review of Performance during 2022
Throughout 2022, the macroeconomic backdrop continued evolving on a path of instability and heightened volatility creating an incredibly challenging environment for growth investors, particularly those investing further down the market capitalization spectrum. Sustaining this turbulence were persisting second order effects from the global COVID-19 pandemic and Russia's invasion of Ukraine, straddling global supply chain disruption and labor force challenges, and heightening geopolitical tension between China and the west. More recently a decade of low interest rates, mistaken by many as a quasi-constant, has now ended as central banks wrestle with high inflation. This instability has sculpted a new investment backdrop, one where capital is less freely available, the hurdle rate for returns is higher and the tolerance for uncertainty is lower. For our US Discovery investment strategy this adjustment in the backdrop has been painful, as the Fund's performance over the past 12 months shows. We nevertheless remain long-term growth focused investors who, by pointing our analytical focus lower down the market capitalization spectrum, seek to identify high potential growth businesses when they are early in their lifecycle and benefit from the compounding of long-term growth off a low base. We pursue a growth focus as we believe it aligns with the overarching constant in equity investing of long-term progress being driven by innovation and adoption of technology. Whilst the whims of a stock market can come and go, the legacy of innovation remains and is all around us. We believe the fundamental opportunity for innovation and tech-led progress are as strong as we have seen. Given sufficient time, companies that deliver better, cheaper and more efficient solutions to significant problems should ultimately find this more challenging environment one where their relative attractions hold more sway. In a stock market that is increasingly impatient, we think the rewards to the selective and patient growth investor remain attractive.
Among the top positive contributors to the Fund's relative performance during the year were TransMedics Group and Shockwave Medical.
TransMedics is a commercial-stage medical technology company that has developed and sells a proprietary organ care system (OCS) used to transport donated organs from donors to recipients. The system mimics the conditions of the human body and perfuses the donated organs with
nutrient rich oxygenated blood, minimizing damage due to oxygen deprivation. This substantially reduces the waste associated with the current standard "cold-box" approach to transportation and we believe has the potential to truly transform the transplant market by massively increasing the supply side and improving clinical outcomes. TransMedics has seen strong performance from all areas of its business throughout 2022 and management are committed to investing for future growth as they continue to expand the OCS program, develop future technology and increase manufacturing infrastructure. What intrigues us the most about TransMedics is the potential for the company's technology to unlock the use of organs after circulatory death, which would meaningfully increase the supply of organs available for transplant.
2022 was also a strong year for Shockwave Medical, a medical device manufacturer that treats calcified cardiovascular diseases by using sonic pressure waves. The company has shown an impressive ability to execute on the opportunity over the last year. It continues to see robust demand in the US and internationally for its devices, recently receiving approval for its products in China. We used the high share price as an opportunity to significantly reduce the position as we believe its core franchise may be reaching a point of relative maturity. That said, with a management team committed to investing heavily in research and development (R&D), we do foresee a possibility that the company will produce another innovative product to unlock a sizeable market hence we have not sold out of the position entirely.
Among the top detractors from relative performance over the year were Codexis Inc and Trupanion Inc.
Codexis, a leading enzyme engineering company, started the first half of the year well, reporting strong operational performance. Despite this, the share price fell as the company appeared to suffer from an almost mechanical derating prompted by the expectation of higher interest rates (symbolic of a pattern we saw with other highly rated holdings held in the Fund). As the year progressed however the company did experience some operational setbacks, firstly issuing a revenue warning (reducing full-year guidance) then announcing Pfizer cancelled their 2023 order for Paxlovid (a treatment for COVID). More recently, the company reduced staff headcount by 18% and announced a rationalization of their pipeline to focus on the areas they believe have the strongest commercial opportunity and the greatest probability of success. Whilst there is no escaping that there have been some unsatisfactory developments throughout the year, we still see the long term appeal in the
41
Management Discussion (unaudited)
Annual Report December 31, 2022
position and believe our thesis to be intact for the time being.
Trupanion, a leading provider of medical insurance for pets, also notably underperformed. Many investors consider the company to be vulnerable to the effects of inflation as concerns over the potential for new customer gains and increased pressure on margins, caused by significant inflation in vet invoices, underpinned the fall in share price. Our longer-term view is that inflation in vet bills and stagnating disposable income for consumers may in fact be a positive development for Trupanion as the cost to self-insure (which accounts for 97% of the market in the US today) becomes less desirable relative to having pet insurance. Trupanion's most recent quarterly results, in which they reported particularly strong growth with a new quarterly record addition of new subscription pets for the business, provides some evidence in support of this thesis.
Investment strategies used to manage the Fund
Baillie Gifford is a growth manager with a bottom-up approach to stock picking. Bottom-up investing is an investment approach that focuses on the analysis of
individual stocks and deemphasizes the significance of economic cycles and market cycles. We aim to deliver excellent long-term investment returns by investing in a portfolio of high potential, immature smaller companies in the United States with a view to owning them over a 5-10 year investment time horizon as they grow. We focus on understanding where innovation is happening and the necessary conditions and factors which need to come together for it to succeed.
Trading over the period
Our new buy and complete sale decisions, which are a result of our bottom-up stock research, are listed below:
New Buys:
Appian Corp, Avalara Inc, Calix Inc, Doximity Inc, Exact Sciences, Fiverr Intl, Hashicorp Inc, Progyny, Schrodinger, Teladoc, Twist Bioscience
Complete Sales:
Axogen, Glaukos Corp, iRobot, Kaleido Biosciences Inc
42
Management Discussion (unaudited)
Annual Report December 31, 2022
Fund Performance for periods ended 12/31/22 (Cumulative Returns)
One Year | % p.a. Since Inception | Inception Date | |||||||||||||
Baillie Gifford U.S. Discovery Fund Class K | (45.72 | )% | (36.59 | )% | 05/05/21 | ||||||||||
Baillie Gifford U.S. Discovery Fund Institutional Class | (45.72 | )% | (36.59 | )% | 05/05/21 | ||||||||||
Russell 2500 Growth Index | (26.21 | )% | (15.52 | )% | 05/05/21 | ||||||||||
The returns are provided for all shares classes that had shares outstanding as of December 31, 2022. Additional year-over-year returns for each class are available in the Financial Highlights section.
Comparison of the change in value of $10,000 Investment in the Fund's Class K shares and the index.
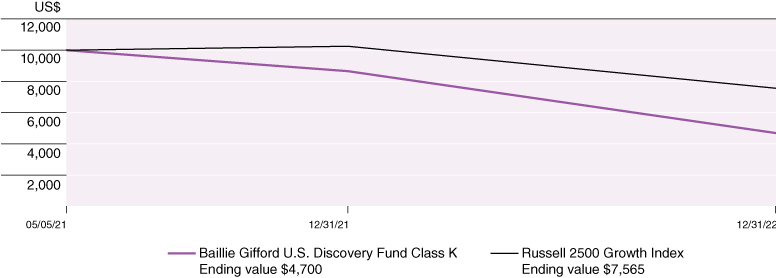
Past performance does not predict future performance. The graph and the table above do not reflect the deduction of taxes that a shareholder would pay on the Fund distributions or redemption of Fund shares.
43
Management Discussion (unaudited)
Annual Report December 31, 2022
Baillie Gifford U.S. Equity Growth Fund
Market Conditions and Review of Performance during 2022
2022 was a challenging year for US stock markets. High inflation, exacerbated by energy security concerns, ongoing global supply chain challenges and a tight domestic labor market, dominated the headlines. The Federal Reserve tightened monetary policy significantly in response by raising the Federal Funds interest rate several times over the course of the year and by reducing its bond holdings. The change in policy raised concerns of an economic recession, prompting falls in stock prices. Higher interest rates often mean that stock market investors discount the value of future cashflows more aggressively when valuing businesses, and this seemed to be the case in 2022. There were rare pockets of strength in stock markets, most notably in Energy-related businesses where high commodity prices provided support, but these were in the minority. The Russell 1000 Growth Index, one of the Fund's two comparative benchmarks, delivered a return of (29.14)% for the year.
Against this backdrop the Fund's Class K shares delivered a return of (55.58)% over the year. The Fund owns several positions in companies that are early in their growth trajectory and where most of their value is based on their potential to grow substantially in the future. The share prices of many of the Fund's holdings proved to be sensitive to the prevailing environment even though we believe most of them are in strong operating positions.
Through our individual stock selections, the Fund has exposure to innovative healthcare businesses that may enable a move towards personalized and more affordable healthcare. The Fund has invested in businesses that are enabling the shift online of consumers and businesses, which are both much earlier in their transitions than many appreciate. the Fund has positions in companies that are electrifying transport, that are making education easier to access, and that are supporting the re-emergence of local businesses to name just a selection of the growth drivers we are exposed to. We believe the growth prospects for these businesses are far more tied to change than to overall economic activity, a feature which we think deserves far more attention.
The largest single detractor from performance was the Fund's holding in the e-commerce platform Shopify. Shopify provides merchants of all sizes with the tools to sell online, from websites to payments infrastructure through to fulfilment. It grew its revenues rapidly during
the pandemic. Growth rates have since moderated. The company has reduced headcount and is slowing its spending in response to a more challenging environment. The shares have been weak, but in our view the underlying economics of their business remain very attractive. We think Shopify is well placed to consolidate its position as infrastructure for online retail.
The online home furnishings retailer Wayfair had a difficult 2022 and was also among the Fund's detractors. Revenues have fallen this year as consumers delayed discretionary spending in an uncertain environment. We continue to believe that Wayfair is in a strong position to capture more of the home furnishings market as consumers move online. The current share price underappreciates the value of Wayfair's potential in our view.
The biotechnology business Alnylam Pharmaceuticals was the largest single contributor to performance in 2022. It makes drugs that treat disease by silencing troublesome genes using a process called RNA interference. Alnylam made encouraging progress in trials this year with a heart disease treatment and the shares responded positively. We believe that there is substantial additional return potential in Alnylam's platform, which could raise the standard of care across a widening range of diseases.
The commercial real estate information provider CoStar also contributed to performance in 2022. In a weakening real estate market, CoStar's suite of tools was used more heavily by the industry, contributing to solid revenue growth for the year. We believe CoStar has a history of supplementing its growth via the acquisition of smaller independent data providers. CoStar's large cash position on its balance sheet leaves it well placed if acquisition targets become available at attractive prices. We are supportive of this strategy and believe that CoStar could deliver attractive returns to patient shareholders from this position.
We have high conviction in the Fund's holdings. They are mostly robustly financed and, in our view, far more resilient than recent share price moves suggest. The drivers of growth we are investing appear compelling to us, and a scarcer capital environment will separate out the best businesses from the also-rans. We believe this ought to be a good environment for the selective and patient growth investor.
Investment strategies used to manage the Fund
The Fund seeks to meet its objective by identifying exceptional growth businesses and owning them for long
44
Management Discussion (unaudited)
Annual Report December 31, 2022
enough that the advantages of their business models and cultural strengths become the dominant drivers of their stock prices. The non-diversified and committed nature of the strategy means that we can and will deliver significantly different returns versus indices over any shorter time frame. However, our long-term time horizon allows us to capture the disproportionate impact of successful investments, harnessing the asymmetry of returns inherent in equity markets. In our terms, an exceptional growth business has a special culture, addresses a large market opportunity and possesses an edge that gives it a high chance of delivering large future returns. Such opportunities are rare. The Fund is concentrated as
we do not want to dilute the impact of exceptional companies in the name of diversification.
Trading over the period
Our new buy and complete sale decisions, which are a result of our bottom-up stock research, are listed below:
New Buys:
Roblox, Sweetgreen
Complete Sales:
Peloton, Teladoc, Vroom
Fund Performance for periods ended 12/31/22 (Average Annual Total Returns)
One Year | % p.a. Five Year | % p.a. Since Inception | Inception Date | ||||||||||||||||
Baillie Gifford U.S. Equity Growth Fund Class K* | (55.58 | )% | 6.24 | % | 10.35 | % | 12/05/16 | ||||||||||||
| Baillie Gifford U.S. Equity Growth Fund Institutional Class | (55.63 | )% | 6.16 | % | 10.29 | % | 04/28/17 | ||||||||||||
Russell 1000 Growth Index | (29.14 | )% | 10.95 | % | 14.04 | % | 12/05/16 | ||||||||||||
S&P 500 Index | (18.11 | )% | 9.41 | % | 11.57 | % | 12/05/16 | ||||||||||||
* The inception date for Baillie Gifford U.S. Equity Growth Fund is December 5, 2016, when Baillie Gifford International, LLC purchased Class 1 shares. Classes 1-5 of Baillie Gifford U.S. Equity Growth Fund were terminated effective May 1, 2017, and Class 1 was converted to Class K. For the purposes of the total return data and other data reflected in the Fund's management discussion, the Fund has used December 5, 2016 as its inception date for Class K.
The returns are provided for all shares classes that had shares outstanding as of December 31, 2022. Additional year-over-year returns for each class are available in the Financial Highlights section.
Returns for the Institutional share class are based on actual performance from April 28, 2017. Prior to that date, returns are calculated based on Class 1 and are adjusted to reflect the Institutional share class fees where these fees are higher.
Comparison of the change in value of $10,000 Investment in the Fund's Class K shares and the index.

Past performance does not predict future performance. The graph and the table above do not reflect the deduction of taxes that a shareholder would pay on the Fund distributions or redemption of Fund shares.
45
Fund Expenses (unaudited)
Annual Report December 31, 2022
As a shareholder of Baillie Gifford China A Shares Growth Fund, Baillie Gifford China Equities Fund, Baillie Gifford Developed EAFE All Cap Fund, Baillie Gifford EAFE Plus All Cap Fund, Baillie Gifford Emerging Markets Equities Fund, Baillie Gifford Emerging Markets ex China Fund, Baillie Gifford Global Alpha Equities Fund, Baillie Gifford Global Stewardship Equities Fund, Baillie Gifford Health Innovation Equities Fund, Baillie Gifford International Alpha Fund, Baillie Gifford International Concentrated Growth Equities Fund, Baillie Gifford International Growth Fund, Baillie Gifford International Smaller Companies Fund, Baillie Gifford Long Term Global Growth Fund, Baillie Gifford U.S. Discovery Fund and/or Baillie Gifford U.S. Equity Growth Fund, you incur two types of costs: (1) transactional costs and (2) ongoing costs, including advisory fees, administration and supervisory fees and other Fund expenses. This example is intended to help you understand your ongoing costs (in dollars) of investing in the Funds and to compare these costs with the ongoing costs of investing in other mutual funds.
The example is based on an investment of $1,000 invested at the beginning of the period and held for the entire period from July 1, 2022 to December 31, 2022.
Actual Expenses
The first line of each table provides information about actual account values and actual expenses. You may use the information in this line, together with the amount you invested, to estimate the expenses that you paid over the
period. Simply divide the account value by $1,000 (for example, an $8,600 account value divided by $1,000 = 8.6), then multiply the result by the number in the first line under the heading entitled "Expenses Paid During the Period" to estimate the expenses you paid on your account during this period.
Hypothetical Example for Comparison Purposes
The second line of each table on the following page provides information about hypothetical account values and hypothetical expenses based on the Fund's actual expense ratio and an assumed annual rate of return of 5% before expenses, which is not the Fund's actual return.
The hypothetical account values and expenses may not be used to estimate the actual ending account balance or expenses you paid for the period. You may use this information to compare the ongoing costs of investing in the Fund and other funds by comparing this 5% hypothetical example with the 5% hypothetical examples that appear in the shareholder reports of other funds.
Please note that the expenses shown in the table are meant to highlight your ongoing costs only and do not reflect any transactional costs. Therefore, the second line of the table labeled "Hypothetical (5% return before expenses)" is useful in comparing ongoing costs only, and will not help you determine the relative total costs of owning different funds. In addition, if these transactional costs were included, your costs would have been higher.
46
Fund Expenses (unaudited)
Annual Report December 31, 2022
| Beginning Account Value July 1, 2022 | Ending Account Value December 31, 2022 | Annualized Expense Ratios Based on the Period July 1, 2022 to December 31, 2022 | Expenses Paid During Period* | ||||||||||||||||
Baillie Gifford China A Shares Growth Fund — Class K | |||||||||||||||||||
Actual | $ | 1,000 | $ | 834.20 | 0.87 | % | $ | 4.02 | |||||||||||
Hypothetical (5% return before expenses) | $ | 1,000 | $ | 1,020.82 | 0.87 | % | $ | 4.43 | |||||||||||
Baillie Gifford China A Shares Growth Fund — Institutional Class | |||||||||||||||||||
Actual | $ | 1,000 | $ | 834.20 | 0.87 | % | $ | 4.02 | |||||||||||
Hypothetical (5% return before expenses) | $ | 1,000 | $ | 1,020.82 | 0.87 | % | $ | 4.43 | |||||||||||
Baillie Gifford China Equities Fund — Class K | |||||||||||||||||||
Actual | $ | 1,000 | $ | 847.10 | 0.87 | % | $ | 4.05 | |||||||||||
Hypothetical (5% return before expenses) | $ | 1,000 | $ | 1,020.82 | 0.87 | % | $ | 4.43 | |||||||||||
Baillie Gifford China Equities Fund — Institutional Class | |||||||||||||||||||
Actual | $ | 1,000 | $ | 845.40 | 0.99 | % | $ | 4.60 | |||||||||||
Hypothetical (5% return before expenses) | $ | 1,000 | $ | 1,020.21 | 0.99 | % | $ | 5.04 | |||||||||||
Baillie Gifford Developed EAFE All Cap Fund — Class 2 | |||||||||||||||||||
Actual | $ | 1,000 | $ | 1,050.80 | 0.65 | % | $ | 3.36 | |||||||||||
Hypothetical (5% return before expenses) | $ | 1,000 | $ | 1,021.93 | 0.65 | % | $ | 3.31 | |||||||||||
Baillie Gifford Developed EAFE All Cap Fund — Class 3 | |||||||||||||||||||
Actual | $ | 1,000 | $ | 1,051.10 | 0.58 | % | $ | 3.00 | |||||||||||
Hypothetical (5% return before expenses) | $ | 1,000 | $ | 1,022.28 | 0.58 | % | $ | 2.96 | |||||||||||
Baillie Gifford Developed EAFE All Cap Fund — Class K | |||||||||||||||||||
Actual | $ | 1,000 | $ | 1,050.60 | 0.65 | % | $ | 3.36 | |||||||||||
Hypothetical (5% return before expenses) | $ | 1,000 | $ | 1,021.93 | 0.65 | % | $ | 3.31 | |||||||||||
Baillie Gifford Developed EAFE All Cap Fund — Institutional Class | |||||||||||||||||||
Actual | $ | 1,000 | $ | 1,050.70 | 0.74 | % | $ | 3.82 | |||||||||||
Hypothetical (5% return before expenses) | $ | 1,000 | $ | 1,021.48 | 0.74 | % | $ | 3.77 | |||||||||||
Baillie Gifford EAFE Plus All Cap Fund — Class 2 | |||||||||||||||||||
Actual | $ | 1,000 | $ | 1,042.60 | 0.65 | % | $ | 3.35 | |||||||||||
Hypothetical (5% return before expenses) | $ | 1,000 | $ | 1,021.93 | 0.65 | % | $ | 3.31 | |||||||||||
47
Fund Expenses (unaudited)
Annual Report December 31, 2022
| Beginning Account Value July 1, 2022 | Ending Account Value December 31, 2022 | Annualized Expense Ratios Based on the Period July 1, 2022 to December 31, 2022 | Expenses Paid During Period* | ||||||||||||||||
Baillie Gifford EAFE Plus All Cap Fund — Class 3 | |||||||||||||||||||
Actual | $ | 1,000 | $ | 1,043.00 | 0.58 | % | $ | 2.99 | |||||||||||
Hypothetical (5% return before expenses) | $ | 1,000 | $ | 1,022.28 | 0.58 | % | $ | 2.96 | |||||||||||
Baillie Gifford EAFE Plus All Cap Fund — Class K | |||||||||||||||||||
Actual | $ | 1,000 | $ | 1,042.40 | 0.65 | % | $ | 3.35 | |||||||||||
Hypothetical (5% return before expenses) | $ | 1,000 | $ | 1,021.93 | 0.65 | % | $ | 3.31 | |||||||||||
Baillie Gifford EAFE Plus All Cap Fund — Institutional Class | |||||||||||||||||||
Actual | $ | 1,000 | $ | 1,042.50 | 0.69 | % | $ | 3.55 | |||||||||||
Hypothetical (5% return before expenses) | $ | 1,000 | $ | 1,021.73 | 0.69 | % | $ | 3.52 | |||||||||||
Baillie Gifford Emerging Markets Equities Fund — Class 2 | |||||||||||||||||||
Actual | $ | 1,000 | $ | 979.00 | 0.84 | % | $ | 4.19 | |||||||||||
Hypothetical (5% return before expenses) | $ | 1,000 | $ | 1,020.97 | 0.84 | % | $ | 4.28 | |||||||||||
Baillie Gifford Emerging Markets Equities Fund — Class 3 | |||||||||||||||||||
Actual | $ | 1,000 | $ | 979.30 | 0.77 | % | $ | 3.84 | |||||||||||
Hypothetical (5% return before expenses) | $ | 1,000 | $ | 1,021.32 | 0.77 | % | $ | 3.92 | |||||||||||
Baillie Gifford Emerging Markets Equities Fund — Class 4 | |||||||||||||||||||
Actual | $ | 1,000 | $ | 979.50 | 0.74 | % | $ | 3.69 | |||||||||||
Hypothetical (5% return before expenses) | $ | 1,000 | $ | 1,021.48 | 0.74 | % | $ | 3.77 | |||||||||||
Baillie Gifford Emerging Markets Equities Fund — Class 5 | |||||||||||||||||||
Actual | $ | 1,000 | $ | 979.70 | 0.69 | % | $ | 3.44 | |||||||||||
Hypothetical (5% return before expenses) | $ | 1,000 | $ | 1,021.73 | 0.69 | % | $ | 3.52 | |||||||||||
Baillie Gifford Emerging Markets Equities Fund — Class K | |||||||||||||||||||
Actual | $ | 1,000 | $ | 978.80 | 0.84 | % | $ | 4.19 | |||||||||||
Hypothetical (5% return before expenses) | $ | 1,000 | $ | 1,020.97 | 0.84 | % | $ | 4.28 | |||||||||||
Baillie Gifford Emerging Markets Equities Fund — Institutional Class | |||||||||||||||||||
Actual | $ | 1,000 | $ | 978.30 | 0.92 | % | $ | 4.59 | |||||||||||
Hypothetical (5% return before expenses) | $ | 1,000 | $ | 1,020.57 | 0.92 | % | $ | 4.69 | |||||||||||
48
Fund Expenses (unaudited)
Annual Report December 31, 2022
| Beginning Account Value July 1, 2022 | Ending Account Value December 31, 2022 | Annualized Expense Ratios Based on the Period July 1, 2022 to December 31, 2022 | Expenses Paid During Period* | ||||||||||||||||
Baillie Gifford Emerging Markets ex China Fund — Class K | |||||||||||||||||||
Actual | $ | 1,000 | $ | 1,053.00 | 0.87 | % | $ | 4.50 | |||||||||||
Hypothetical (5% return before expenses) | $ | 1,000 | $ | 1,020.82 | 0.87 | % | $ | 4.43 | |||||||||||
Baillie Gifford Emerging Markets ex China Fund — Institutional Class | |||||||||||||||||||
Actual | $ | 1,000 | $ | 1,053.00 | 0.87 | % | $ | 4.50 | |||||||||||
Hypothetical (5% return before expenses) | $ | 1,000 | $ | 1,020.82 | 0.87 | % | $ | 4.43 | |||||||||||
Baillie Gifford Global Alpha Equities Fund — Class 2 | |||||||||||||||||||
Actual | $ | 1,000 | $ | 1,022.10 | 0.68 | % | $ | 3.47 | |||||||||||
Hypothetical (5% return before expenses) | $ | 1,000 | $ | 1,021.78 | 0.68 | % | $ | 3.47 | |||||||||||
Baillie Gifford Global Alpha Equities Fund — Class 3 | |||||||||||||||||||
Actual | $ | 1,000 | $ | 1,022.40 | 0.61 | % | $ | 3.11 | |||||||||||
Hypothetical (5% return before expenses) | $ | 1,000 | $ | 1,022.13 | 0.61 | % | $ | 3.11 | |||||||||||
Baillie Gifford Global Alpha Equities Fund — Class 4 | |||||||||||||||||||
Actual | $ | 1,000 | $ | 1,022.60 | 0.58 | % | $ | 2.96 | |||||||||||
Hypothetical (5% return before expenses) | $ | 1,000 | $ | 1,022.28 | 0.58 | % | $ | 2.96 | |||||||||||
Baillie Gifford Global Alpha Equities Fund — Class K | |||||||||||||||||||
Actual | $ | 1,000 | $ | 1,021.60 | 0.68 | % | $ | 3.46 | |||||||||||
Hypothetical (5% return before expenses) | $ | 1,000 | $ | 1,021.78 | 0.68 | % | $ | 3.47 | |||||||||||
Baillie Gifford Global Alpha Equities Fund — Institutional Class | |||||||||||||||||||
Actual | $ | 1,000 | $ | 1,021.60 | 0.76 | % | $ | 3.87 | |||||||||||
Hypothetical (5% return before expenses) | $ | 1,000 | $ | 1,021.37 | 0.76 | % | $ | 3.87 | |||||||||||
Baillie Gifford Global Stewardship Equities Fund — Class K | |||||||||||||||||||
Actual | $ | 1,000 | $ | 964.40 | 0.65 | % | $ | 3.22 | |||||||||||
Hypothetical (5% return before expenses) | $ | 1,000 | $ | 1,021.93 | 0.65 | % | $ | 3.31 | |||||||||||
Baillie Gifford Global Stewardship Equities Fund — Institutional Class | |||||||||||||||||||
Actual | $ | 1,000 | $ | 964.40 | 0.65 | % | $ | 3.22 | |||||||||||
Hypothetical (5% return before expenses) | $ | 1,000 | $ | 1,021.93 | 0.65 | % | $ | 3.31 | |||||||||||
49
Fund Expenses (unaudited)
Annual Report December 31, 2022
| Beginning Account Value July 1, 2022 | Ending Account Value December 31, 2022 | Annualized Expense Ratios Based on the Period July 1, 2022 to December 31, 2022 | Expenses Paid During Period* | ||||||||||||||||
Baillie Gifford Health Innovation Equities Fund — Class K | |||||||||||||||||||
Actual | $ | 1,000 | $ | 1,063.20 | 0.65 | % | $ | 3.38 | |||||||||||
Hypothetical (5% return before expenses) | $ | 1,000 | $ | 1,021.93 | 0.65 | % | $ | 3.31 | |||||||||||
Baillie Gifford Health Innovation Equities Fund — Institutional Class | |||||||||||||||||||
Actual | $ | 1,000 | $ | 1,063.20 | 0.65 | % | $ | 3.38 | |||||||||||
Hypothetical (5% return before expenses) | $ | 1,000 | $ | 1,021.93 | 0.65 | % | $ | 3.31 | |||||||||||
Baillie Gifford International Alpha Fund — Class 2 | |||||||||||||||||||
Actual | $ | 1,000 | $ | 1,019.00 | 0.64 | % | $ | 3.26 | |||||||||||
Hypothetical (5% return before expenses) | $ | 1,000 | $ | 1,021.98 | 0.64 | % | $ | 3.26 | |||||||||||
Baillie Gifford International Alpha Fund — Class 3 | |||||||||||||||||||
Actual | $ | 1,000 | $ | 1,019.30 | 0.57 | % | $ | 2.90 | |||||||||||
Hypothetical (5% return before expenses) | $ | 1,000 | $ | 1,022.33 | 0.57 | % | $ | 2.91 | |||||||||||
Baillie Gifford International Alpha Fund — Class 4 | |||||||||||||||||||
Actual | $ | 1,000 | $ | 1,019.50 | 0.54 | % | $ | 2.75 | |||||||||||
Hypothetical (5% return before expenses) | $ | 1,000 | $ | 1,022.48 | 0.54 | % | $ | 2.75 | |||||||||||
Baillie Gifford International Alpha Fund — Class 5 | |||||||||||||||||||
Actual | $ | 1,000 | $ | 1,019.70 | 0.48 | % | $ | 2.44 | |||||||||||
Hypothetical (5% return before expenses) | $ | 1,000 | $ | 1,022.79 | 0.48 | % | $ | 2.45 | |||||||||||
Baillie Gifford International Alpha Fund — Class K | |||||||||||||||||||
Actual | $ | 1,000 | $ | 1,018.50 | 0.64 | % | $ | 3.26 | |||||||||||
Hypothetical (5% return before expenses) | $ | 1,000 | $ | 1,021.98 | 0.64 | % | $ | 3.26 | |||||||||||
Baillie Gifford International Alpha Fund — Institutional Class | |||||||||||||||||||
Actual | $ | 1,000 | $ | 1,018.80 | 0.67 | % | $ | 3.41 | |||||||||||
Hypothetical (5% return before expenses) | $ | 1,000 | $ | 1,021.83 | 0.67 | % | $ | 3.41 | |||||||||||
Baillie Gifford International Concentrated Growth Equities Fund — Class K | |||||||||||||||||||
Actual | $ | 1,000 | $ | 1,036.20 | 0.72 | % | $ | 3.70 | |||||||||||
Hypothetical (5% return before expenses) | $ | 1,000 | $ | 1,021.58 | 0.72 | % | $ | 3.67 | |||||||||||
50
Fund Expenses (unaudited)
Annual Report December 31, 2022
| Beginning Account Value July 1, 2022 | Ending Account Value December 31, 2022 | Annualized Expense Ratios Based on the Period July 1, 2022 to December 31, 2022 | Expenses Paid During Period* | ||||||||||||||||
Baillie Gifford International Concentrated Growth Equities Fund — Institutional Class | |||||||||||||||||||
Actual | $ | 1,000 | $ | 1,036.70 | 0.78 | % | $ | 4.00 | |||||||||||
Hypothetical (5% return before expenses) | $ | 1,000 | $ | 1,021.27 | 0.78 | % | $ | 3.97 | |||||||||||
Baillie Gifford International Growth Fund — Class 2 | |||||||||||||||||||
Actual | $ | 1,000 | $ | 1,010.70 | 0.61 | % | $ | 3.09 | |||||||||||
Hypothetical (5% return before expenses) | $ | 1,000 | $ | 1,022.13 | 0.61 | % | $ | 3.11 | |||||||||||
Baillie Gifford International Growth Fund — Class 3 | |||||||||||||||||||
Actual | $ | 1,000 | $ | 1,011.10 | 0.54 | % | $ | 2.74 | |||||||||||
Hypothetical (5% return before expenses) | $ | 1,000 | $ | 1,022.48 | 0.54 | % | $ | 2.75 | |||||||||||
Baillie Gifford International Growth Fund — Class 4 | |||||||||||||||||||
Actual | $ | 1,000 | $ | 1,011.20 | 0.51 | % | $ | 2.59 | |||||||||||
Hypothetical (5% return before expenses) | $ | 1,000 | $ | 1,022.63 | 0.51 | % | $ | 2.60 | |||||||||||
Baillie Gifford International Growth Fund — Class 5 | |||||||||||||||||||
Actual | $ | 1,000 | $ | 1,011.50 | 0.46 | % | $ | 2.33 | |||||||||||
Hypothetical (5% return before expenses) | $ | 1,000 | $ | 1,022.89 | 0.46 | % | $ | 2.35 | |||||||||||
Baillie Gifford International Growth Fund — Class K | |||||||||||||||||||
Actual | $ | 1,000 | $ | 1,010.60 | 0.61 | % | $ | 3.09 | |||||||||||
Hypothetical (5% return before expenses) | $ | 1,000 | $ | 1,022.13 | 0.61 | % | $ | 3.11 | |||||||||||
Baillie Gifford International Growth Fund — Institutional Class | |||||||||||||||||||
Actual | $ | 1,000 | $ | 1,010.50 | 0.66 | % | $ | 3.34 | |||||||||||
Hypothetical (5% return before expenses) | $ | 1,000 | $ | 1,021.88 | 0.66 | % | $ | 3.36 | |||||||||||
Baillie Gifford International Smaller Companies Fund — Class K | |||||||||||||||||||
Actual | $ | 1,000 | $ | 1,025.30 | 0.90 | % | $ | 4.59 | |||||||||||
Hypothetical (5% return before expenses) | $ | 1,000 | $ | 1,020.67 | 0.90 | % | $ | 4.58 | |||||||||||
Baillie Gifford International Smaller Companies Fund — Institutional Class | |||||||||||||||||||
Actual | $ | 1,000 | $ | 1,023.90 | 1.01 | % | $ | 5.15 | |||||||||||
Hypothetical (5% return before expenses) | $ | 1,000 | $ | 1,020.11 | 1.01 | % | $ | 5.14 | |||||||||||
51
Fund Expenses (unaudited)
Annual Report December 31, 2022
| Beginning Account Value July 1, 2022 | Ending Account Value December 31, 2022 | Annualized Expense Ratios Based on the Period July 1, 2022 to December 31, 2022 | Expenses Paid During Period* | ||||||||||||||||
Baillie Gifford Long Term Global Growth Fund — Class 2 | |||||||||||||||||||
Actual | $ | 1,000 | $ | 965.50 | 0.75 | % | $ | 3.72 | |||||||||||
Hypothetical (5% return before expenses) | $ | 1,000 | $ | 1,021.42 | 0.75 | % | $ | 3.82 | |||||||||||
Baillie Gifford Long Term Global Growth Fund — Class 4 | |||||||||||||||||||
Actual | $ | 1,000 | $ | 966.00 | 0.65 | % | $ | 3.22 | |||||||||||
Hypothetical (5% return before expenses) | $ | 1,000 | $ | 1,021.93 | 0.65 | % | $ | 3.31 | |||||||||||
Baillie Gifford Long Term Global Growth Fund — Class K | |||||||||||||||||||
Actual | $ | 1,000 | $ | 965.40 | 0.75 | % | $ | 3.72 | |||||||||||
Hypothetical (5% return before expenses) | $ | 1,000 | $ | 1,021.42 | 0.75 | % | $ | 3.82 | |||||||||||
Baillie Gifford Long Term Global Growth Fund — Institutional Class | |||||||||||||||||||
Actual | $ | 1,000 | $ | 965.30 | 0.80 | % | $ | 3.96 | |||||||||||
Hypothetical (5% return before expenses) | $ | 1,000 | $ | 1,021.17 | 0.80 | % | $ | 4.08 | |||||||||||
Baillie Gifford U.S. Discovery Fund — Class K | |||||||||||||||||||
Actual | $ | 1,000 | $ | 961.10 | 0.82 | % | $ | 4.05 | |||||||||||
Hypothetical (5% return before expenses) | $ | 1,000 | $ | 1,021.07 | 0.82 | % | $ | 4.18 | |||||||||||
Baillie Gifford U.S. Discovery Fund — Institutional Class | |||||||||||||||||||
Actual | $ | 1,000 | $ | 961.10 | 0.82 | % | $ | 4.05 | |||||||||||
Hypothetical (5% return before expenses) | $ | 1,000 | $ | 1,021.07 | 0.82 | % | $ | 4.18 | |||||||||||
Baillie Gifford U.S. Equity Growth Fund — Class K | |||||||||||||||||||
Actual | $ | 1,000 | $ | 976.60 | 0.65 | % | $ | 3.24 | |||||||||||
Hypothetical (5% return before expenses) | $ | 1,000 | $ | 1,021.93 | 0.65 | % | $ | 3.31 | |||||||||||
Baillie Gifford U.S. Equity Growth Fund — Institutional Class | |||||||||||||||||||
Actual | $ | 1,000 | $ | 977.10 | 0.60 | %** | $ | 2.99 | |||||||||||
Hypothetical (5% return before expenses) | $ | 1,000 | $ | 1,022.18 | 0.60 | %** | $ | 3.06 | |||||||||||
* Unless otherwise indicated, expenses are calculated using the Fund's annualized expense ratio, multiplied by the average account value for the period, multiplied by 184/365 (to reflect the six-month period).
** The expense ratio of the Institutional Class is lower than Class K due to adjustments made to sub-transfer agency expenses in the six-month period. The ratio for the year ended December 31, 2022 is 0.76%.
Expenses are calculated using the annualized expense ratio for the Fund, which represents the ongoing expenses as a percentage of net assets for the period ended December 31, 2022. Expenses are calculated by multiplying the annualized expense ratio by the average account value for the period;
then multiplying the result by the number of days in the most recent most recent fiscal half-year; and then dividing that result by the number of days in the calendar year. Expense ratios for the most recent fiscal year may differ from expense ratios based on the one-year data in the financial highlights.
52
Industry Diversification Table
Annual Report December 31, 2022
December 31, 2022
Baillie Gifford China A Shares Growth Fund
Value | % of Total Net Assets | ||||||||||
Auto Parts & Equipment | $ | 84,522 | 6.2 | % | |||||||
Beverages | 74,213 | 5.5 | |||||||||
Chemicals | 23,365 | 1.7 | |||||||||
Commercial Services | 69,818 | 5.1 | |||||||||
Cosmetics/Personal Care | 43,803 | 3.2 | |||||||||
Electrical Components & Equipment | 18,796 | 1.4 | |||||||||
Electronics | 142,730 | 10.5 | |||||||||
Energy — Alternate Sources | 39,154 | 2.9 | |||||||||
Food | 24,882 | 1.8 | |||||||||
Healthcare — Products | 58,339 | 4.3 | |||||||||
Healthcare — Services | 142,601 | 10.5 | |||||||||
Home Furnishings | 113,393 | 8.4 | |||||||||
Insurance | 53,851 | 4.0 | |||||||||
Internet | 73,633 | 5.4 | |||||||||
Machinery — Diversified | 37,247 | 2.8 | |||||||||
Metal Fabricate/Hardware | 118,393 | 8.7 | |||||||||
Semiconductors | 44,597 | 3.3 | |||||||||
Software | 141,253 | 10.4 | |||||||||
Telecommunications | 22,242 | 1.6 | |||||||||
Transportation | 42,266 | 3.1 | |||||||||
Total Value of Investments | 1,369,098 | 100.8 | |||||||||
Other assets less liabilities | (11,200 | ) | (0.8 | ) | |||||||
Net Assets | $ | 1,357,898 | 100.0 | % | |||||||
The table above is based on Bloomberg Industry Group classifications. For compliance monitoring purposes, sub-industry classifications are used which results in less concentration across industry sectors.
53
Portfolio of Investments
Annual Report December 31, 2022
December 31, 2022
Baillie Gifford China A Shares Growth Fund
Shares | Value | ||||||||||
COMMON STOCKS — 100.8% | |||||||||||
CHINA — 100.8% | |||||||||||
3peak, Inc., Class A | 546 | $ | 21,599 | ||||||||
Anker Innovations Technology Co., Ltd., Class A | 2,400 | 20,432 | |||||||||
Asymchem Laboratories Tianjin Co., Ltd., Class A | 2,940 | 62,485 | |||||||||
Beijing United Information Technology Co., Ltd., Class A | 5,800 | 73,633 | |||||||||
Centre Testing International Group Co., Ltd., Class A | 9,600 | 30,750 | |||||||||
Contemporary Amperex Technology Co., Ltd., Class A | 1,500 | 84,522 | |||||||||
Dongguan Yiheda Automation Co., Ltd., Class A | 2,100 | 19,837 | |||||||||
Foshan Haitian Flavouring & Food Co., Ltd., Class A | 2,178 | 24,882 | |||||||||
Glodon Co., Ltd., Class A | 8,100 | 69,710 | |||||||||
Guangdong Kinlong Hardware Products Co., Ltd., Class A | 2,800 | 41,699 | |||||||||
Guangzhou Kingmed Diagnostics Group Co., Ltd., Class A | 4,000 | 44,922 | |||||||||
Hangzhou Tigermed Consulting Co., Ltd., Class A | 2,600 | 39,068 | |||||||||
Hefei Meiya Optoelectronic Technology, Inc., Class A | 5,070 | 17,410 | |||||||||
Iflytek Co., Ltd., Class A | 3,500 | 16,480 | |||||||||
Jafron Biomedical Co., Ltd., Class A | 4,500 | 20,034 | |||||||||
Jiangsu Azure Corp., Class A | 9,363 | 19,977 | |||||||||
Kweichow Moutai Co., Ltd., Class A | 300 | 74,213 | |||||||||
LONGi Green Energy Technology Co., Ltd., Class A | 6,466 | 39,154 | |||||||||
Longshine Technology Group Co. Ltd., Class A | 6,700 | 21,164 | |||||||||
Midea Group Co., Ltd., Class A | 8,300 | 61,597 | |||||||||
Oppein Home Group, Inc., Class A | 1,800 | 31,364 | |||||||||
Ping An Insurance Group Co. of China Ltd., Class A | 8,000 | 53,851 | |||||||||
Proya Cosmetics Co., Ltd., Class A | 1,820 | 43,803 | |||||||||
Quectel Wireless Solutions Co., Ltd., Class A | 1,536 | 22,242 | |||||||||
SF Holding Co., Ltd., Class A | 5,100 | 42,266 | |||||||||
SG Micro Corp., Class A | 1,800 | 44,596 | |||||||||
Shandong Sinocera Functional Material Co., Ltd., Class A | 5,900 | 23,364 | |||||||||
Shenzhen Inovance Technology Co., Ltd., Class A | 9,150 | 91,297 | |||||||||
Shenzhen Megmeet Electrical Co., Ltd., Class A | 8,000 | 29,833 | |||||||||
Sinocare, Inc., Class A | 7,900 | 38,305 | |||||||||
WuXi AppTec Co., Ltd., Class A | 3,036 | 35,195 | |||||||||
Wuxi Lead Intelligent Equipment Co., Ltd., Class A | 3,258 | 18,796 | |||||||||
Yonyou Network Technology Co., Ltd., Class A | 9,780 | 33,900 | |||||||||
Zhejiang Sanhua Intelligent Controls Co., Ltd., Class A | 18,620 | 56,718 | |||||||||
1,369,098 | |||||||||||
The accompanying notes are an integral part of the financial statements.
54
Portfolio of Investments
Annual Report December 31, 2022
December 31, 2022
Baillie Gifford China A Shares Growth Fund
Value | |||||||
| TOTAL INVESTMENTS — 100.8% * | |||||||
(cost $1,252,411) | $ | 1,369,098 | |||||
Other liabilities less assets — (0.8)% | (11,200 | ) | |||||
NET ASSETS — 100.0% | $ | 1,357,898 | |||||
* The Total Investments percentage exceeds 100% due to the timing of settling transactions and not as a result of borrowings for investment purposes.
This report classifies issuers geographically by their country of risk. For compliance monitoring purposes, Baillie Gifford Overseas Limited (the "Manager") retains discretion to consider a number of factors in determining where a particular issuer is located, as described in further detail in each Fund's prospectus.
Fair Value Measurement
The following is a summary of the inputs used as of December 31, 2022 in valuing the Fund's investments carried at fair value:
Investments in Securities | Level 1 | Level 2 | Level 3 | Total | |||||||||||||||
| Common Stocks ** | $ | — | $ | 1,369,098 | $ | — | $ | 1,369,098 | |||||||||||
Total | $ | — | $ | 1,369,098 | $ | — | $ | 1,369,098 | |||||||||||
** Refer to Portfolio of Investments for further detail.
The accompanying notes are an integral part of the financial statements.
55
Statement of Assets and Liabilities
Annual Report December 31, 2022
December 31, 2022
Baillie Gifford China A Shares Growth Fund
ASSETS | |||||||
Investments, at value (cost $1,252,411) | $ | 1,369,098 | |||||
Cash | 39,121 | ||||||
Due from Manager | 28,111 | ||||||
Total Assets | 1,436,330 | ||||||
LIABILITIES | |||||||
Advisory fee payable | 1,825 | ||||||
Administration & Supervisory fee payable | 564 | ||||||
Trustee fee payable | 15 | ||||||
Commitment fee payable | 5 | ||||||
Accrued expenses | 76,023 | ||||||
Total Liabilities | 78,432 | ||||||
NET ASSETS | $ | 1,357,898 | |||||
COMPOSITION OF NET ASSETS | |||||||
Paid-in capital | $ | 1,243,507 | |||||
Total distributable earnings | 114,391 | ||||||
$ | 1,357,898 | ||||||
NET ASSET VALUE, PER SHARE | |||||||
| Class K ($678,949 / 57,733 shares outstanding), unlimited authorized, no par value | $ | 11.76 | |||||
| Institutional Class ($678,949 / 57,733 shares outstanding), unlimited authorized, no par value | $ | 11.76 | |||||
The accompanying notes are an integral part of the financial statements.
56
Statement of Operations
Annual Report December 31, 2022
For the Year Ended December 31, 2022
Baillie Gifford China A Shares Growth Fund
INVESTMENT INCOME | |||||||
Dividends (net of foreign withholding taxes of $1,465) | $ | 13,085 | |||||
Interest | 188 | ||||||
Total Investment Income | 13,273 | ||||||
EXPENSES | |||||||
Advisory fee (Note B) | 8,152 | ||||||
Administration & Supervisory fee — Class K shares (Note B) | 1,260 | ||||||
Administration & Supervisory fee — Institutional Class shares (Note B) | 1,260 | ||||||
Transfer agency | 34,798 | ||||||
Fund accounting | 96,458 | ||||||
Professional fees | 28,981 | ||||||
Custody | 3,254 | ||||||
Legal | 267 | ||||||
Trustees' fees | 62 | ||||||
Commitment fees | 20 | ||||||
Registration fees | 17 | ||||||
Miscellaneous | 6,320 | ||||||
Total Expenses | 180,849 | ||||||
Fees waived/expenses reimbursed | (167,953 | ) | |||||
Total Expenses after Waiver | 12,896 | ||||||
Net Investment Income | 377 | ||||||
| REALIZED AND UNREALIZED GAIN (LOSS) ON INVESTMENTS AND FOREIGN CURRENCY TRANSACTIONS | |||||||
Net realized loss from: | |||||||
Investments | (2,571 | ) | |||||
Foreign currency transactions | (101 | ) | |||||
(2,672 | ) | ||||||
Net change in unrealized (depreciation) on: | |||||||
Investments | (562,712 | ) | |||||
(562,712 | ) | ||||||
Net realized and unrealized (loss) | (565,384 | ) | |||||
NET (DECREASE) IN NET ASSETS FROM OPERATIONS | $ | (565,007 | ) | ||||
The accompanying notes are an integral part of the financial statements.
57
Statements of Changes in Net Assets
Annual Report December 31, 2022
Baillie Gifford China A Shares Growth Fund
| For the Year Ended December 31, 2022 | For the Year Ended December 31, 2021 | ||||||||||
INCREASE (DECREASE) IN NET ASSETS FROM OPERATIONS | |||||||||||
Net investment income (loss) | $ | 377 | $ | (4,843 | ) | ||||||
Net realized gain (loss) | (2,672 | ) | 181,785 | ||||||||
Net change in unrealized (depreciation) | (562,712 | ) | (232,311 | ) | |||||||
Net (Decrease) in Net Assets from Operations | (565,007 | ) | (55,369 | ) | |||||||
DIVIDENDS AND DISTRIBUTIONS TO SHAREHOLDERS FROM: | |||||||||||
Distributable earnings | |||||||||||
Class K | (18,603 | ) | (97,909 | ) | |||||||
Institutional Class | (18,603 | ) | (97,909 | ) | |||||||
Total Distributions to Shareholders | (37,206 | ) | (195,818 | ) | |||||||
TRANSACTIONS IN SHARES OF BENEFICIAL INTEREST | |||||||||||
Net proceeds from shares subscribed: | |||||||||||
Dividends reinvested: | |||||||||||
Class K | 18,603 | 97,909 | |||||||||
Institutional Class | 18,603 | 97,909 | |||||||||
Increase in Net Assets from Transactions in Shares of Beneficial Interest | 37,206 | 195,818 | |||||||||
Total (Decrease) in Net Assets | (565,007 | ) | (55,369 | ) | |||||||
NET ASSETS | |||||||||||
Beginning of Year | 1,922,905 | 1,978,274 | |||||||||
End of Year | $ | 1,357,898 | $ | 1,922,905 | |||||||
The accompanying notes are an integral part of the financial statements.
58
Financial Highlights
Annual Report December 31, 2022
Baillie Gifford China A Shares Growth Fund
Selected data for a Class K share outstanding throughout each year:
| For the Year Ended December 31, 2022 | For the Year Ended December 31, 2021 | For the Year Ended December 31, 2020 | For the Period December 19, 2019(a) through December 31, 2019 | ||||||||||||||||
Net asset value, beginning of period | $ | 17.13 | $ | 19.64 | $ | 10.29 | $ | 10.00 | |||||||||||
From Investment Operations | |||||||||||||||||||
Net investment income (loss)(b) | 0.00 | (c) | (0.05 | ) | (0.02 | ) | 0.00 | (c) | |||||||||||
| Net realized and unrealized gain (loss) on investments and foreign currency | (5.04 | ) | (0.52 | ) | 9.51 | 0.29 | |||||||||||||
| Net increase (decrease) in net asset value from investment operations | (5.04 | ) | (0.57 | ) | 9.49 | 0.29 | |||||||||||||
Dividends and Distributions to Shareholders | |||||||||||||||||||
From net realized gain on investments | (0.33 | ) | (1.94 | ) | (0.14 | ) | — | ||||||||||||
Total dividends and distributions | (0.33 | ) | (1.94 | ) | (0.14 | ) | — | ||||||||||||
Net asset value, end of period | $ | 11.76 | $ | 17.13 | $ | 19.64 | $ | 10.29 | |||||||||||
Total Return | |||||||||||||||||||
Total return based on net asset value(d) | (29.39 | )% | (2.82 | )% | 92.29 | % | 2.90 | % | |||||||||||
Ratios/Supplemental Data | |||||||||||||||||||
Net assets, end of period (000's omitted) | $ | 679 | $ | 961 | $ | 989 | $ | 514 | |||||||||||
Ratio of net expenses to average net assets, before waiver | 12.20 | % | 9.34 | % | 10.52 | % | 90.51 | %* | |||||||||||
Ratio of net expenses to average net assets, after waiver | 0.87 | % | 0.87 | % | 0.87 | % | 0.87 | %* | |||||||||||
Ratio of net investment income (loss) to average net assets | 0.03 | % | (0.25 | )% | (0.15 | )% | (0.80 | )%* | |||||||||||
Portfolio turnover rate(e) | 13 | % | 17 | % | 20 | % | 0 | % | |||||||||||
* Annualized.
(a) Commencement of investment operations.
(b) Calculated based upon average shares outstanding during the period.
(c) Amount is less than $0.005 per share.
(d) Total investment return is calculated assuming an initial investment made at the net asset value at the beginning of the period, reinvestment of all dividends and distributions, if any, at net asset value during the period, and redemption on the last day of the period. Total return is not annualized for periods less than one year.
(e) Portfolio turnover rate calculated at Fund level. Portfolio turnover is not annualized for periods less than one year.
The accompanying notes are an integral part of the financial statements.
59
Financial Highlights
Annual Report December 31, 2022
Baillie Gifford China A Shares Growth Fund
Selected data for an Institutional Class share outstanding throughout each year:
| For the Year Ended December 31, 2022 | For the Year Ended December 31, 2021 | For the Year Ended December 31, 2020 | For the Period December 19, 2019(a) through December 31, 2019 | ||||||||||||||||
Net asset value, beginning of period | $ | 17.13 | $ | 19.64 | $ | 10.29 | $ | 10.00 | |||||||||||
From Investment Operations | |||||||||||||||||||
Net investment income (loss)(b) | 0.00 | (c) | (0.05 | ) | (0.02 | ) | 0.00 | (c) | |||||||||||
| Net realized and unrealized gain (loss) on investments and foreign currency | (5.04 | ) | (0.52 | ) | 9.51 | 0.29 | |||||||||||||
| Net increase (decrease) in net asset value from investment operations | (5.04 | ) | (0.57 | ) | 9.49 | 0.29 | |||||||||||||
Dividends and Distributions to Shareholders | |||||||||||||||||||
From net realized gain on investments | (0.33 | ) | (1.94 | ) | (0.14 | ) | — | ||||||||||||
Total dividends and distributions | (0.33 | ) | (1.94 | ) | (0.14 | ) | — | ||||||||||||
Net asset value, end of period | $ | 11.76 | $ | 17.13 | $ | 19.64 | $ | 10.29 | |||||||||||
Total Return | |||||||||||||||||||
Total return based on net asset value(d) | (29.39 | )% | (2.82 | )% | 92.29 | % | 2.90 | % | |||||||||||
Ratios/Supplemental Data | |||||||||||||||||||
Net assets, end of period (000's omitted) | $ | 679 | $ | 961 | $ | 989 | $ | 514 | |||||||||||
Ratio of net expenses to average net assets, before waiver | 12.20 | % | 9.34 | % | 10.52 | % | 90.51 | %* | |||||||||||
Ratio of net expenses to average net assets, after waiver | 0.87 | % | 0.87 | % | 0.87 | % | 0.87 | %* | |||||||||||
Ratio of net investment income (loss) to average net assets | 0.03 | % | (0.25 | )% | (0.15 | )% | (0.80 | )%* | |||||||||||
Portfolio turnover rate(e) | 13 | % | 17 | % | 20 | % | 0 | % | |||||||||||
* Annualized.
(a) Commencement of investment operations.
(b) Calculated based upon average shares outstanding during the period.
(c) Amount is less than $0.005 per share.
(d) Total investment return is calculated assuming an initial investment made at the net asset value at the beginning of the period, reinvestment of all dividends and distributions, if any, at net asset value during the period, and redemption on the last day of the period. Total return is not annualized for periods less than one year.
(e) Portfolio turnover rate calculated at Fund level. Portfolio turnover is not annualized for periods less than one year.
The accompanying notes are an integral part of the financial statements.
60
Industry Diversification Table
Annual Report December 31, 2022
December 31, 2022
Baillie Gifford China Equities Fund
Value | % of Total Net Assets | ||||||||||
Apparel | $ | 32,340 | 1.6 | % | |||||||
Auto Manufacturers | 42,798 | 2.1 | |||||||||
Auto Parts & Equipment | 133,156 | 6.4 | |||||||||
Banks | 106,926 | 5.1 | |||||||||
Beverages | 98,950 | 4.8 | |||||||||
Biotechnology | 47,369 | 2.3 | |||||||||
Chemicals | 55,870 | 2.7 | |||||||||
Commercial Services | 52,969 | 2.5 | |||||||||
Cosmetics/Personal Care | 37,064 | 1.8 | |||||||||
Distribution/Wholesale | 10,068 | 0.5 | |||||||||
Electronics | 73,466 | 3.5 | |||||||||
Energy — Alternate Sources | 38,845 | 1.9 | |||||||||
Gas | 27,936 | 1.3 | |||||||||
Healthcare — Products | 18,910 | 0.9 | |||||||||
Healthcare — Services | 103,632 | 5.0 | |||||||||
Home Furnishings | 82,228 | 3.9 | |||||||||
Insurance | 88,692 | 4.3 | |||||||||
Internet | 555,189 | 26.7 | |||||||||
Machinery — Diversified | 50,297 | 2.4 | |||||||||
Metal Fabricate/Hardware | 71,651 | 3.4 | |||||||||
Mining | 37,632 | 1.8 | |||||||||
Miscellaneous Manufacturing | 18,870 | 0.9 | |||||||||
Real Estate | 11,344 | 0.5 | |||||||||
Retail | 81,029 | 3.9 | |||||||||
Semiconductors | 39,394 | 1.9 | |||||||||
Software | 131,077 | 6.3 | |||||||||
Total Value of Investments | 2,047,702 | 98.4 | |||||||||
Other assets less liabilities | 32,961 | 1.6 | |||||||||
Net Assets | $ | 2,080,663 | 100.0 | % | |||||||
The table above is based on Bloomberg Industry Group classifications. For compliance monitoring purposes, sub-industry classifications are used which results in less concentration across industry sectors.
61
Portfolio of Investments
Annual Report December 31, 2022
December 31, 2022
Baillie Gifford China Equities Fund
Shares | Value | ||||||||||
COMMON STOCKS — 98.4% | |||||||||||
CHINA — 98.4% | |||||||||||
| Alibaba Group Holding Ltd. * | 10,900 | $ | 119,605 | ||||||||
Asymchem Laboratories Tianjin Co., Ltd., Class A | 1,160 | 24,654 | |||||||||
| BeiGene Ltd. * | 2,791 | 47,369 | |||||||||
Beijing United Information Technology Co., Ltd., Class A | 1,930 | 24,502 | |||||||||
| Brilliance China Automotive Holdings Ltd. * | 30,000 | 16,796 | |||||||||
Centre Testing International Group Co., Ltd., Class A | 9,500 | 30,430 | |||||||||
China Merchants Bank Co., Ltd., Class H | 12,500 | 69,173 | |||||||||
Contemporary Amperex Technology Co., Ltd., Class A | 900 | 50,713 | |||||||||
Dongguan Yiheda Automation Co., Ltd., Class A | 1,600 | 15,114 | |||||||||
ENN Energy Holdings Ltd. | 2,000 | 27,936 | |||||||||
Estun Automation Co., Ltd., Class A | 11,300 | 35,184 | |||||||||
Fuyao Glass Industry Group Co., Ltd., Class H | 5,600 | 23,383 | |||||||||
Geely Automobile Holdings Ltd. | 18,000 | 26,002 | |||||||||
Glodon Co., Ltd., Class A | 3,000 | 25,818 | |||||||||
Guangdong Kinlong Hardware Products Co., Ltd., Class A | 1,000 | 14,893 | |||||||||
Guangzhou Kingmed Diagnostics Group Co., Ltd., Class A | 3,400 | 38,183 | |||||||||
Haier Smart Home Co., Ltd., Class H | 8,800 | 29,868 | |||||||||
Hangzhou Robam Appliances Co., Ltd., Class A | 4,200 | 16,738 | |||||||||
Hangzhou Tigermed Consulting Co., Ltd., Class A | 1,500 | 22,539 | |||||||||
Huayu Automotive Systems Co., Ltd., Class A | 9,800 | 24,354 | |||||||||
JD.com, Inc., Class A | 3,419 | 95,447 | |||||||||
Jiangsu Azure Corp., Class A | 7,900 | 16,855 | |||||||||
| KE Holdings, Inc. ADR * | 289 | 4,034 | |||||||||
| KE Holdings, Inc., Class A * | 1,567 | 7,310 | |||||||||
| Kingdee International Software Group Co., Ltd. * | 14,000 | 29,709 | |||||||||
Kingsoft Corp., Ltd. | 5,800 | 19,222 | |||||||||
| Kuaishou Technology * | 1,800 | 16,181 | |||||||||
Kweichow Moutai Co., Ltd., Class A | 400 | 98,950 | |||||||||
Li Ning Co., Ltd. | 7,500 | 64,493 | |||||||||
LONGi Green Energy Technology Co., Ltd., Class A | 3,500 | 21,194 | |||||||||
Medlive Technology Co., Ltd. | 8,500 | 9,220 | |||||||||
| Meituan, Class B * | 4,300 | 95,270 | |||||||||
Midea Group Co., Ltd., Class A | 4,800 | 35,622 | |||||||||
Minth Group Ltd. | 6,000 | 16,195 | |||||||||
NetEase, Inc. | 1,900 | 27,558 | |||||||||
| Pinduoduo, Inc. ADR * | 363 | 29,603 | |||||||||
Ping An Bank Co., Ltd., Class A | 20,000 | 37,752 | |||||||||
The accompanying notes are an integral part of the financial statements.
62
Portfolio of Investments
Annual Report December 31, 2022
December 31, 2022
Baillie Gifford China Equities Fund
Shares | Value | ||||||||||
Ping An Insurance Group Co. of China Ltd., Class H | 13,500 | $ | 88,692 | ||||||||
Pop Mart International Group Ltd. | 4,000 | 10,068 | |||||||||
Proya Cosmetics Co., Ltd., Class A | 1,540 | 37,064 | |||||||||
SG Micro Corp., Class A | 1,590 | 39,394 | |||||||||
Shandong Sinocera Functional Material Co., Ltd., Class A | 10,300 | 40,789 | |||||||||
Shenzhen Inovance Technology Co., Ltd., Class A | 4,700 | 46,896 | |||||||||
Shenzhen Megmeet Electrical Co., Ltd., Class A | 7,125 | 26,570 | |||||||||
Shenzhou International Group Holdings Ltd. | 2,900 | 32,340 | |||||||||
Sinocare, Inc., Class A | 3,900 | 18,910 | |||||||||
Sungrow Power Supply Co., Ltd., Class A | 1,100 | 17,651 | |||||||||
Sunny Optical Technology Group Co., Ltd. | 1,600 | 18,870 | |||||||||
Tencent Holdings Ltd. | 3,900 | 165,361 | |||||||||
| Topchoice Medical Corp., Class A * | 1,000 | 21,908 | |||||||||
Weichai Power Co., Ltd., Class H | 14,000 | 18,511 | |||||||||
WuXi AppTec Co., Ltd., Class H | 1,800 | 18,887 | |||||||||
Yifeng Pharmacy Chain Co., Ltd., Class A | 1,800 | 16,536 | |||||||||
Yonyou Network Technology Co., Ltd., Class A | 8,300 | 28,770 | |||||||||
Yunnan Energy New Material Co., Ltd., Class A | 800 | 15,081 | |||||||||
Zhejiang Sanhua Intelligent Controls Co., Ltd., Class A | 13,100 | 39,903 | |||||||||
Zijin Mining Group Co., Ltd., Class H | 28,000 | 37,632 | |||||||||
2,047,702 | |||||||||||
TOTAL INVESTMENTS — 98.4% | |||||||||||
(cost $2,760,211) | $ | 2,047,702 | |||||||||
Other assets less liabilities — 1.6% | 32,961 | ||||||||||
NET ASSETS — 100.0% | $ | 2,080,663 | |||||||||
* Non-income producing security.
ADR — American Depositary Receipt
This report classifies issuers geographically by their country of risk. For compliance monitoring purposes, the Manager retains discretion to consider a number of factors in determining where a particular issuer is located, as described in further detail in each Fund's prospectus.
Fair Value Measurement
The following is a summary of the inputs used as of December 31, 2022 in valuing the Fund's investments carried at fair value:
Investments in Securities | Level 1 | Level 2 | Level 3 | Total | |||||||||||||||
| Common Stocks ** | $ | 50,433 | $ | 1,997,269 | $ | — | $ | 2,047,702 | |||||||||||
Total | $ | 50,433 | $ | 1,997,269 | $ | — | $ | 2,047,702 | |||||||||||
** Refer to Portfolio of Investments for further detail.
The accompanying notes are an integral part of the financial statements.
63
Statement of Assets and Liabilities
Annual Report December 31, 2022
December 31, 2022
Baillie Gifford China Equities Fund
ASSETS | |||||||
Investments, at value (cost $2,760,211) | $ | 2,047,702 | |||||
Cash | 55,318 | ||||||
Foreign cash, at value (cost $3,702) | 3,712 | ||||||
Due from Manager | 38,959 | ||||||
Receivable for investments sold | 5,575 | ||||||
Dividends receivable | 90 | ||||||
Prepaid assets | 12,176 | ||||||
Total Assets | 2,163,532 | ||||||
LIABILITIES | |||||||
Advisory fee payable | 2,783 | ||||||
Administration & Supervisory fee payable | 860 | ||||||
Trustee fee payable | 23 | ||||||
Commitment fee payable | 8 | ||||||
Accrued expenses | 79,195 | ||||||
Total Liabilities | 82,869 | ||||||
NET ASSETS | $ | 2,080,663 | |||||
COMPOSITION OF NET ASSETS | |||||||
Paid-in capital | $ | 3,247,597 | |||||
Total accumulated (loss) | (1,166,934 | ) | |||||
$ | 2,080,663 | ||||||
NET ASSET VALUE, PER SHARE | |||||||
| Class K ($296,091 / 50,268 shares outstanding), unlimited authorized, no par value | $ | 5.89 | |||||
| Institutional Class ($1,784,572 / 303,733 shares outstanding), unlimited authorized, no par value | $ | 5.88 | |||||
The accompanying notes are an integral part of the financial statements.
64
Statement of Operations
Annual Report December 31, 2022
For the Year Ended December 31, 2022
Baillie Gifford China Equities Fund
INVESTMENT INCOME | |||||||
Dividends (net of foreign withholding taxes of $2,095) | $ | 26,851 | |||||
Non-cash income | 7,991 | ||||||
Interest | 274 | ||||||
Total Investment Income | 35,116 | ||||||
EXPENSES | |||||||
Advisory fee (Note B) | 12,620 | ||||||
Administration & Supervisory fee — Class K shares (Note B) | 1,082 | ||||||
Administration & Supervisory fee — Institutional Class shares (Note B) | 2,819 | ||||||
Transfer agency | 35,981 | ||||||
Sub-transfer agency — Institutional Class shares | 1,451 | ||||||
Fund accounting | 93,921 | ||||||
Professional fees | 26,731 | ||||||
Custody | 20,253 | ||||||
Registration fees | 12,562 | ||||||
Legal | 422 | ||||||
Line of Credit Interest | 172 | ||||||
Trustees' fees | 101 | ||||||
Commitment fees | 33 | ||||||
Miscellaneous | 4,571 | ||||||
Total Expenses | 212,719 | ||||||
Fees waived/expenses reimbursed | (191,306 | ) | |||||
Total Expenses after Waiver | 21,413 | ||||||
Net Investment Income | 13,703 | ||||||
| REALIZED AND UNREALIZED GAIN (LOSS) ON INVESTMENTS AND FOREIGN CURRENCY TRANSACTIONS | |||||||
Net realized gain (loss) from: | |||||||
Investments | (436,203 | ) | |||||
Foreign currency transactions | 33 | ||||||
(436,170 | ) | ||||||
Net change in unrealized appreciation (depreciation) on: | |||||||
Investments | (426,820 | ) | |||||
Translation of net assets and liabilities denominated in foreign currencies | 7 | ||||||
(426,813 | ) | ||||||
Net realized and unrealized (loss) | (862,983 | ) | |||||
NET (DECREASE) IN NET ASSETS FROM OPERATIONS | $ | (849,280 | ) | ||||
The accompanying notes are an integral part of the financial statements.
65
Statements of Changes in Net Assets
Annual Report December 31, 2022
Baillie Gifford China Equities Fund
| For the Year Ended December 31, 2022 | For the Period July 7, 2021(a) through December 31, 2021 | ||||||||||
INCREASE (DECREASE) IN NET ASSETS FROM OPERATIONS | |||||||||||
Net investment income (loss) | $ | 13,703 | $ | (4,115 | ) | ||||||
Net realized loss | (436,170 | ) | (17,426 | ) | |||||||
Net change in unrealized (depreciation) | (426,813 | ) | (285,689 | ) | |||||||
Net (Decrease) in Net Assets from Operations | (849,280 | ) | (307,230 | ) | |||||||
DIVIDENDS AND DISTRIBUTIONS TO SHAREHOLDERS FROM: | |||||||||||
Distributable earnings | |||||||||||
Class K | (1,566 | ) | — | ||||||||
Institutional Class | (11,711 | ) | — | ||||||||
Total Distributions to Shareholders | (13,277 | ) | — | ||||||||
TRANSACTIONS IN SHARES OF BENEFICIAL INTEREST | |||||||||||
Net proceeds from shares subscribed: | |||||||||||
Class K | — | 1,017,000 | |||||||||
Institutional Class | 593,485 | 1,962,735 | |||||||||
Dividends reinvested: | |||||||||||
Class K | 1,566 | — | |||||||||
Institutional Class | 11,711 | — | |||||||||
Cost of shares redeemed: | |||||||||||
Class K | (308,872 | ) | — | ||||||||
Institutional Class | (27,175 | ) | — | ||||||||
Increase in Net Assets from Transactions in Shares of Beneficial Interest | 270,715 | 2,979,735 | |||||||||
Total Increase (Decrease) in Net Assets | (591,842 | ) | 2,672,505 | ||||||||
NET ASSETS | |||||||||||
Beginning of Period | 2,672,505 | — | |||||||||
End of Period | $ | 2,080,663 | $ | 2,672,505 | |||||||
The accompanying notes are an integral part of the financial statements.
66
Financial Highlights
Annual Report December 31, 2022
Baillie Gifford China Equities Fund
Selected data for a Class K share outstanding throughout each year:
| For the Year Ended December 31, 2022 | For the Period July 7, 2021(a) through December 31, 2021 | ||||||||||
Net asset value, beginning of period | $ | 8.27 | $ | 10.00 | |||||||
From Investment Operations | |||||||||||
Net investment income (loss)(b) | 0.05 | (0.02 | ) | ||||||||
Net realized and unrealized (loss) on investments and foreign currency | (2.40 | ) | (1.71 | ) | |||||||
Net (decrease) in net asset value from investment operations | (2.35 | ) | (1.73 | ) | |||||||
Dividends and Distributions to Shareholders | |||||||||||
From net investment income | (0.03 | ) | — | ||||||||
Total dividends and distributions | (0.03 | ) | — | ||||||||
Net asset value, end of period | $ | 5.89 | $ | 8.27 | |||||||
Total Return | |||||||||||
Total return based on net asset value(c) | (28.40 | )% | (17.30 | )% | |||||||
Ratios/Supplemental Data | |||||||||||
Net assets, end of period (000's omitted) | $ | 296 | $ | 872 | |||||||
Ratio of net expenses to average net assets, before waiver | 9.21 | % | 11.32 | %* | |||||||
Ratio of net expenses to average net assets, after waiver | 0.87 | % | 0.87 | %* | |||||||
Ratio of net investment income (loss) to average net assets | 0.73 | % | (0.56 | )%* | |||||||
Portfolio turnover rate(d) | 31 | % | 6 | % | |||||||
* Annualized.
(a) Commencement of investment operations.
(b) Calculated based upon average shares outstanding during the period.
(c) Total investment return is calculated assuming an initial investment made at the net asset value at the beginning of the period, reinvestment of all dividends and distributions, if any, at net asset value during the period, and redemption on the last day of the period. Total return is not annualized for periods less than one year.
(d) Portfolio turnover rate calculated at Fund level. Portfolio turnover is not annualized for periods less than one year.
The accompanying notes are an integral part of the financial statements.
67
Financial Highlights
Annual Report December 31, 2022
Baillie Gifford China Equities Fund
Selected data for an Institutional Class share outstanding throughout each year:
| For the Year Ended December 31, 2022 | For the Period July 7, 2021(a) through December 31, 2021 | ||||||||||
Net asset value, beginning of period | $ | 8.27 | $ | 10.00 | |||||||
From Investment Operations | |||||||||||
Net investment income (loss)(b) | 0.03 | (0.03 | ) | ||||||||
Net realized and unrealized (loss) on investments and foreign currency | (2.38 | ) | (1.70 | ) | |||||||
Net (decrease) in net asset value from investment operations | (2.35 | ) | (1.73 | ) | |||||||
Dividends and Distributions to Shareholders | |||||||||||
From net investment income | (0.04 | ) | — | ||||||||
Total dividends and distributions | (0.04 | ) | — | ||||||||
Net asset value, end of period | $ | 5.88 | $ | 8.27 | |||||||
Total Return | |||||||||||
Total return based on net asset value(c) | (28.43 | )% | (17.30 | )% | |||||||
Ratios/Supplemental Data | |||||||||||
Net assets, end of period (000's omitted) | $ | 1,785 | $ | 1,801 | |||||||
Ratio of net expenses to average net assets, before waiver | 9.30 | % | 11.32 | %* | |||||||
Ratio of net expenses to average net assets, after waiver | 0.96 | % | 0.87 | %* | |||||||
Ratio of net investment income (loss) to average net assets | 0.55 | % | (0.60 | )%* | |||||||
Portfolio turnover rate(d) | 31 | % | 6 | % | |||||||
* Annualized.
(a) Commencement of investment operations.
(b) Calculated based upon average shares outstanding during the period.
(c) Total investment return is calculated assuming an initial investment made at the net asset value at the beginning of the period, reinvestment of all dividends and distributions, if any, at net asset value during the period, and redemption on the last day of the period. Total return is not annualized for periods less than one year.
(d) Portfolio turnover rate calculated at Fund level. Portfolio turnover is not annualized for periods less than one year.
The accompanying notes are an integral part of the financial statements.
68
Industry Diversification Table
Annual Report December 31, 2022
December 31, 2022
Baillie Gifford Developed EAFE All Cap Fund
Value | % of Total Net Assets | ||||||||||
Apparel | $ | 34,935,834 | 6.2 | % | |||||||
Auto Manufacturers | 6,959,543 | 1.2 | |||||||||
Auto Parts & Equipment | 7,360,878 | 1.3 | |||||||||
Banks | 22,733,799 | 4.0 | |||||||||
Beverages | 20,543,539 | 3.7 | |||||||||
Building Materials | 2,898,223 | 0.5 | |||||||||
Commercial Services | 42,019,449 | 7.4 | |||||||||
Cosmetics/Personal Care | 37,098,850 | 6.6 | |||||||||
Distribution/Wholesale | 8,012,760 | 1.4 | |||||||||
Diversified Financial Services | 20,779,155 | 3.7 | |||||||||
Electronics | 44,490,047 | 7.8 | |||||||||
Food | 13,621,625 | 2.4 | |||||||||
Hand/Machine Tools | 11,212,360 | 2.0 | |||||||||
Healthcare — Products | 36,049,650 | 6.4 | |||||||||
Healthcare — Services | 9,874,078 | 1.7 | |||||||||
Home Furnishings | 4,356,576 | 0.8 | |||||||||
Insurance | 17,581,079 | 3.1 | |||||||||
Internet | 49,892,375 | 8.8 | |||||||||
Investment Companies | 17,534,061 | 3.1 | |||||||||
Leisure Time | 11,108,728 | 2.0 | |||||||||
Machinery — Construction & Mining | 14,938,963 | 2.7 | |||||||||
Machinery — Diversified | 39,833,426 | 7.1 | |||||||||
Retail | 34,402,978 | 6.1 | |||||||||
Semiconductors | 16,836,840 | 3.0 | |||||||||
Software | 14,355,333 | 2.6 | |||||||||
Telecommunications | 7,557,753 | 1.3 | |||||||||
Toys/Games/Hobbies | 7,857,278 | 1.4 | |||||||||
Transportation | 4,134,655 | 0.7 | |||||||||
Total Value of Investments | 558,979,835 | 99.0 | |||||||||
Other assets less liabilities | 5,735,670 | 1.0 | |||||||||
Net Assets | $ | 564,715,505 | 100.0 | % | |||||||
The table above is based on Bloomberg Industry Group classifications. For compliance monitoring purposes, sub-industry classifications are used which results in less concentration across industry sectors.
69
Portfolio of Investments
Annual Report December 31, 2022
December 31, 2022
Baillie Gifford Developed EAFE All Cap Fund
Shares | Value | ||||||||||
COMMON STOCKS — 96.4% | |||||||||||
AUSTRALIA — 2.3% | |||||||||||
Cochlear Ltd. | 95,122 | $ | 13,137,054 | ||||||||
BELGIUM — 1.5% | |||||||||||
Anheuser-Busch InBev SA/NV | 138,052 | 8,315,006 | |||||||||
CHINA — 1.4% | |||||||||||
Prosus NV | 109,953 | 7,591,534 | |||||||||
DENMARK — 0.7% | |||||||||||
DSV A/S | 26,146 | 4,134,655 | |||||||||
FRANCE — 7.0% | |||||||||||
Kering | 15,622 | 7,950,472 | |||||||||
LVMH Moet Hennessy Louis Vuitton SE | 20,849 | 15,171,677 | |||||||||
Remy Cointreau SA | 72,524 | 12,228,534 | |||||||||
| Ubisoft Entertainment SA * | 137,434 | 3,882,627 | |||||||||
39,233,310 | |||||||||||
GERMANY — 3.9% | |||||||||||
adidas AG | 33,060 | 4,480,504 | |||||||||
| Auto1 Group SE * | 313,692 | 2,606,160 | |||||||||
Nemetschek SE | 85,504 | 4,371,508 | |||||||||
| Zalando SE * | 307,026 | 10,808,796 | |||||||||
22,266,968 | |||||||||||
HONG KONG — 5.1% | |||||||||||
AIA Group Ltd. | 1,592,000 | 17,581,079 | |||||||||
Techtronic Industries Co., Ltd. | 1,009,500 | 11,212,360 | |||||||||
28,793,439 | |||||||||||
JAPAN — 26.0% | |||||||||||
Denso Corp. | 150,100 | 7,360,878 | |||||||||
Hoshizaki Corp. | 123,900 | 4,356,576 | |||||||||
Kao Corp. | 137,700 | 5,466,752 | |||||||||
Keyence Corp. | 20,500 | 7,959,018 | |||||||||
Murata Manufacturing Co., Ltd. | 155,900 | 7,688,238 | |||||||||
Nidec Corp. | 128,900 | 6,633,085 | |||||||||
The accompanying notes are an integral part of the financial statements.
70
Portfolio of Investments
Annual Report December 31, 2022
December 31, 2022
Baillie Gifford Developed EAFE All Cap Fund
Shares | Value | ||||||||||
Olympus Corp. | 867,800 | $ | 15,305,900 | ||||||||
Pigeon Corp. | 196,100 | 3,213,855 | |||||||||
Recruit Holdings Co., Ltd. | 205,700 | 6,438,817 | |||||||||
Shimano, Inc. | 70,300 | 11,108,728 | |||||||||
Shiseido Co., Ltd. | 362,100 | 17,747,871 | |||||||||
SMC Corp. | 32,100 | 13,403,477 | |||||||||
SoftBank Group Corp. | 178,700 | 7,557,753 | |||||||||
Sugi Holdings Co., Ltd. | 63,100 | 2,806,319 | |||||||||
Suzuki Motor Corp. | 217,300 | 6,959,543 | |||||||||
Sysmex Corp. | 126,000 | 7,606,696 | |||||||||
Unicharm Corp. | 278,700 | 10,670,372 | |||||||||
Z Holdings Corp. | 1,877,200 | 4,688,337 | |||||||||
146,972,215 | |||||||||||
NETHERLANDS — 7.5% | |||||||||||
| Adyen NV * | 7,306 | 10,142,554 | |||||||||
| ASML Holding NV | 30,879 | 16,836,840 | |||||||||
| EXOR NV * | 101,601 | 7,438,650 | |||||||||
IMCD NV | 56,017 | 8,012,760 | |||||||||
42,430,804 | |||||||||||
NEW ZEALAND — 1.5% | |||||||||||
Ryman Healthcare Ltd. | 696,212 | 2,355,830 | |||||||||
| Xero Ltd. * | 127,951 | 6,101,198 | |||||||||
8,457,028 | |||||||||||
PORTUGAL — 2.4% | |||||||||||
Jeronimo Martins SGPS SA | 629,596 | 13,621,625 | |||||||||
SINGAPORE — 4.0% | |||||||||||
United Overseas Bank Ltd. | 992,489 | 22,733,799 | |||||||||
SWEDEN — 9.1% | |||||||||||
Atlas Copco AB, A Shares | 1,558,939 | 18,470,930 | |||||||||
Avanza Bank Holding AB | 607,747 | 13,041,980 | |||||||||
Epiroc AB, B Shares | 409,874 | 6,593,725 | |||||||||
Investor AB, B Shares | 557,728 | 10,095,411 | |||||||||
Nibe Industrier AB, B Shares | 310,509 | 2,898,223 | |||||||||
51,100,269 | |||||||||||
The accompanying notes are an integral part of the financial statements.
71
Portfolio of Investments
Annual Report December 31, 2022
December 31, 2022
Baillie Gifford Developed EAFE All Cap Fund
Shares | Value | ||||||||||
SWITZERLAND — 5.0% | |||||||||||
Cie Financiere Richemont SA | 160,326 | $ | 20,787,863 | ||||||||
Lonza Group AG | 15,316 | 7,518,248 | |||||||||
28,306,111 | |||||||||||
UNITED KINGDOM — 15.4% | |||||||||||
Ashtead Group PLC | 88,918 | 5,050,969 | |||||||||
Auto Trader Group PLC | 2,012,367 | 12,531,723 | |||||||||
Burberry Group PLC | 301,626 | 7,333,181 | |||||||||
Experian PLC | 277,252 | 9,390,064 | |||||||||
| Farfetch Ltd., Class A * | 470,552 | 2,225,711 | |||||||||
Games Workshop Group PLC | 76,119 | 7,857,279 | |||||||||
Hargreaves Lansdown PLC | 751,331 | 7,737,175 | |||||||||
Intertek Group PLC | 117,452 | 5,714,297 | |||||||||
Rightmove PLC | 1,747,732 | 10,812,239 | |||||||||
| Trainline PLC * | 1,319,723 | 4,381,186 | |||||||||
Weir Group PLC (The) | 414,888 | 8,345,238 | |||||||||
| Wise PLC, Class A * | 779,766 | 5,282,748 | |||||||||
86,661,810 | |||||||||||
UNITED STATES — 3.6% | |||||||||||
| Mettler-Toledo International, Inc. * | 10,650 | 15,394,043 | |||||||||
| Spotify Technology SA * | 64,034 | 5,055,484 | |||||||||
20,449,527 | |||||||||||
Total Common Stocks | |||||||||||
(cost $520,656,251) | 544,205,154 | ||||||||||
PREFERRED STOCKS — 2.6% | |||||||||||
GERMANY — 2.6% | |||||||||||
Sartorius AG 0.34% (cost $7,771,005) | 37,416 | 14,774,681 | |||||||||
TOTAL INVESTMENTS — 99.0% | |||||||||||
(cost $528,427,256) | $ | 558,979,835 | |||||||||
Other assets less liabilities — 1.0% | 5,735,670 | ||||||||||
NET ASSETS — 100.0% | $ | 564,715,505 | |||||||||
* Non-income producing security.
This report classifies issuers geographically by their country of risk. For compliance monitoring purposes, the Manager retains discretion to consider a number of factors in determining where a particular issuer is located, as described in further detail in each Fund's prospectus.
The accompanying notes are an integral part of the financial statements.
72
Portfolio of Investments
Annual Report December 31, 2022
December 31, 2022
Baillie Gifford Developed EAFE All Cap Fund
Fair Value Measurement
The following is a summary of the inputs used as of December 31, 2022 in valuing the Fund's investments carried at fair value:
Investments in Securities | Level 1 | Level 2 | Level 3 | Total | |||||||||||||||
| Common Stocks ** | $ | 27,056,423 | $ | 517,148,731 | $ | — | $ | 544,205,154 | |||||||||||
| Preferred Stocks ** | — | 14,774,681 | — | 14,774,681 | |||||||||||||||
Total | $ | 27,056,423 | $ | 531,923,412 | $ | — | $ | 558,979,835 | |||||||||||
** Refer to Portfolio of Investments for further detail.
The accompanying notes are an integral part of the financial statements.
73
Statement of Assets and Liabilities
Annual Report December 31, 2022
December 31, 2022
Baillie Gifford Developed EAFE All Cap Fund
ASSETS | |||||||
Investments, at value (cost $528,427,256) | $ | 558,979,835 | |||||
Cash | 5,661,733 | ||||||
Capital shares sold receivable | 591,600 | ||||||
Tax reclaims receivable | 877,968 | ||||||
Dividends receivable | 410,407 | ||||||
Prepaid assets | 37,546 | ||||||
Total Assets | 566,559,089 | ||||||
LIABILITIES | |||||||
Advisory fee payable | 500,874 | ||||||
Capital shares purchased payable | 824,631 | ||||||
Administration & Supervisory fee payable | 151,752 | ||||||
Payable for investment purchased | 110,650 | ||||||
Shareholder Servicing fee payable | 78,085 | ||||||
Trustee fee payable | 6,806 | ||||||
Commitment fee payable | 2,277 | ||||||
Accrued expenses | 168,509 | ||||||
Total Liabilities | 1,843,584 | ||||||
NET ASSETS | $ | 564,715,505 | |||||
COMPOSITION OF NET ASSETS | |||||||
Paid-in capital | $ | 556,977,434 | |||||
Total distributable earnings | 7,738,071 | ||||||
$ | 564,715,505 | ||||||
NET ASSET VALUE, PER SHARE | |||||||
| Class 2 ($136,363,150 / 11,730,055 shares outstanding), unlimited authorized, no par value | $ | 11.63 | |||||
| Class 3 ($79,200,741 / 6,740,876 shares outstanding), unlimited authorized, no par value | $ | 11.75 | |||||
| Class K ($214,015,657 / 18,452,320 shares outstanding), unlimited authorized, no par value | $ | 11.60 | |||||
| Institutional Class ($135,135,957 / 11,679,517 shares outstanding), unlimited authorized, no par value | $ | 11.57 | |||||
The accompanying notes are an integral part of the financial statements.
74
Statement of Operations
Annual Report December 31, 2022
For the Year Ended December 31, 2022
Baillie Gifford Developed EAFE All Cap Fund
INVESTMENT INCOME | |||||||
Dividends (net of foreign withholding taxes of $974,020) | $ | 8,338,937 | |||||
Windfall tax recovery (Note A) | 518,031 | ||||||
Interest | 36,492 | ||||||
Total Investment Income | 8,893,460 | ||||||
EXPENSES | |||||||
Advisory fee (Note B) | 2,025,404 | ||||||
Shareholder Servicing fees — Class 2 shares (Note B) | 215,455 | ||||||
Shareholder Servicing fees — Class 3 shares (Note B) | 82,477 | ||||||
Shareholder Servicing fees — Class 4 shares (Note B) | 19,309 | ||||||
Administration & Supervisory fee — Class K shares (Note B) | 427,048 | ||||||
Administration & Supervisory fee — Institutional Class shares (Note B) | 154,159 | ||||||
Transfer agency | 85,414 | ||||||
Sub-transfer agency — Institutional Class shares | 64,979 | ||||||
Fund accounting | 213,335 | ||||||
Legal | 105,682 | ||||||
Registration fees | 79,782 | ||||||
Custody | 79,517 | ||||||
Professional fees | 38,080 | ||||||
Trustees' fees | 24,012 | ||||||
Commitment fees | 7,992 | ||||||
Line of Credit Interest | 7,549 | ||||||
Miscellaneous | 40,715 | ||||||
Total Expenses | 3,670,909 | ||||||
Net Investment Income | 5,222,551 | ||||||
| REALIZED AND UNREALIZED GAIN (LOSS) ON INVESTMENTS AND FOREIGN CURRENCY TRANSACTIONS | |||||||
Net realized gain (loss) from: | |||||||
Investments | (20,570,604 | ) | |||||
Foreign currency transactions | 161,529 | ||||||
(20,409,075 | ) | ||||||
Net change in unrealized (depreciation) on: | |||||||
Investments | (217,849,564 | ) | |||||
Translation of net assets and liabilities denominated in foreign currencies | (27,215 | ) | |||||
(217,876,779 | ) | ||||||
Net realized and unrealized (loss) | (238,285,854 | ) | |||||
NET (DECREASE) IN NET ASSETS FROM OPERATIONS | $ | (233,063,303 | ) | ||||
The accompanying notes are an integral part of the financial statements.
75
Statements of Changes in Net Assets
Annual Report December 31, 2022
Baillie Gifford Developed EAFE All Cap Fund
| For the Year Ended December 31, 2022 | For the Year Ended December 31, 2021 | ||||||||||
INCREASE (DECREASE) IN NET ASSETS FROM OPERATIONS | |||||||||||
Net investment income | $ | 5,222,551 | $ | 2,735,470 | |||||||
Net realized gain (loss) | (20,409,075 | ) | 19,323,000 | ||||||||
Net change in unrealized appreciation (depreciation) | (217,876,779 | ) | 22,801,110 | ||||||||
Net Increase (Decrease) in Net Assets from Operations | (233,063,303 | ) | 44,859,580 | ||||||||
DIVIDENDS AND DISTRIBUTIONS TO SHAREHOLDERS FROM: | |||||||||||
Distributable earnings | |||||||||||
Class 2 | (1,315,372 | ) | (3,070,717 | ) | |||||||
Class 3 | (755,979 | ) | (3,299,115 | ) | |||||||
Class 4 | — | (3,568,899 | ) | ||||||||
Class K | (2,073,615 | ) | (10,436,889 | ) | |||||||
Institutional Class | (1,321,019 | ) | (1,033,964 | ) | |||||||
Total Distributions to Shareholders | (5,465,985 | ) | (21,409,584 | ) | |||||||
TRANSACTIONS IN SHARES OF BENEFICIAL INTEREST | |||||||||||
Net proceeds from shares subscribed: | |||||||||||
Class 2 | 82,492,963 | * | 6,000 | ||||||||
Class 3 | 88,645,931 | * | 103,921,278 | ||||||||
Class 4 | — | 111,639,409 | |||||||||
Class K | 45,155,999 | 111,763,657 | |||||||||
Institutional Class | 232,591,735 | 37,047,091 | |||||||||
Dividends reinvested: | |||||||||||
Class 2 | 1,315,372 | 3,070,718 | |||||||||
Class 3 | 755,979 | 3,299,115 | |||||||||
Class 4 | — | 3,568,899 | |||||||||
Class K | 2,063,614 | 10,047,376 | |||||||||
Institutional Class | 1,320,743 | 1,029,566 | |||||||||
Cost of shares redeemed: | |||||||||||
Class 2 | (7,500,000 | ) | (128,955,703 | ) | |||||||
Class 3 | (82,486,963 | )* | (111,639,409 | ) | |||||||
Class 4 | (88,645,931 | )* | — | ||||||||
Class K | (62,875,742 | ) | (31,415,609 | ) | |||||||
Institutional Class | (127,032,078 | ) | (7,719,308 | ) | |||||||
Increase in Net Assets from Transactions in Shares of Beneficial Interest | 85,801,622 | 105,663,080 | |||||||||
Total Increase (Decrease) in Net Assets | (152,727,666 | ) | 129,113,076 | ||||||||
NET ASSETS | |||||||||||
Beginning of Year | 717,443,171 | 588,330,095 | |||||||||
End of Year | $ | 564,715,505 | $ | 717,443,171 | |||||||
* See Note D for details of share class conversions.
The accompanying notes are an integral part of the financial statements.
76
Financial Highlights
Annual Report December 31, 2022
Baillie Gifford Developed EAFE All Cap Fund
Selected data for a Class 2 share outstanding throughout each year:
| For the Year Ended December 31, 2022 | For the Year Ended December 31, 2021 | For the Year Ended December 31, 2020 | For the Year Ended December 31, 2019 | For the Year Ended December 31, 2018 | |||||||||||||||||||
Net asset value, beginning of year | $ | 17.34 | $ | 16.64 | $ | 13.13 | $ | 10.04 | $ | 12.06 | |||||||||||||
From Investment Operations | |||||||||||||||||||||||
Net investment income(a) | 0.12 | 0.07 | 0.07 | 0.13 | 0.15 | ||||||||||||||||||
| Net realized and unrealized gain (loss) on investments and foreign currency | (5.72 | ) | 1.16 | 3.61 | 3.11 | (2.08 | ) | ||||||||||||||||
| Net increase (decrease) in net asset value from investment operations | (5.60 | ) | 1.23 | 3.68 | 3.24 | (1.93 | ) | ||||||||||||||||
Dividends and Distributions to Shareholders | |||||||||||||||||||||||
From net investment income | — | (0.20 | ) | (0.17 | ) | (0.15 | ) | (0.03 | ) | ||||||||||||||
From net realized gain on investments | (0.11 | ) | (0.33 | ) | — | — | (0.06 | ) | |||||||||||||||
Total dividends and distributions | (0.11 | ) | (0.53 | ) | (0.17 | ) | (0.15 | ) | (0.09 | ) | |||||||||||||
Net asset value, end of year | $ | 11.63 | $ | 17.34 | $ | 16.64 | $ | 13.13 | $ | 10.04 | |||||||||||||
Total Return | |||||||||||||||||||||||
Total return based on net asset value(b) | (32.32 | )% | 7.44 | % | 27.95 | % | 32.33 | % | (16.05 | )% | |||||||||||||
Ratios/Supplemental Data | |||||||||||||||||||||||
Net assets, end of year (000's omitted) | $ | 136,363 | $ | 103,630 | $ | 221,181 | $ | 229,861 | $ | 181,679 | |||||||||||||
Ratio of net expenses to average net assets | 0.64 | % | 0.61 | % | 0.64 | % | 0.66 | % | 0.67 | % | |||||||||||||
| Ratio of net investment income to average net assets | 1.03 | % | 0.37 | % | 0.50 | % | 1.08 | % | 1.23 | % | |||||||||||||
Portfolio turnover rate(c) | 25 | % | 14 | % | 12 | % | 19 | % | 14 | % | |||||||||||||
(a) Calculated based upon average shares outstanding during the period.
(b) Total investment return is calculated assuming an initial investment made at the net asset value at the beginning of the period, reinvestment of all dividends and distributions, if any, at net asset value during the period, and redemption on the last day of the period.
(c) Portfolio turnover rate calculated at Fund level.
The accompanying notes are an integral part of the financial statements.
77
Financial Highlights
Annual Report December 31, 2022
Baillie Gifford Developed EAFE All Cap Fund
Selected data for a Class 3 share outstanding throughout each year:
| For the Year Ended December 31, 2022 | For the Year Ended December 31, 2021 | For the Year Ended December 31, 2020 | For the Year Ended December 31, 2019 | For the Year Ended December 31, 2018 | |||||||||||||||||||
Net asset value, beginning of year | $ | 17.52 | $ | 16.80 | $ | 13.26 | $ | 10.13 | $ | 12.17 | |||||||||||||
From Investment Operations | |||||||||||||||||||||||
Net investment income(a) | 0.12 | 0.08 | 0.07 | 0.14 | 0.16 | ||||||||||||||||||
| Net realized and unrealized gain (loss) on investments and foreign currency | (5.78 | ) | 1.19 | 3.65 | 3.15 | (2.11 | ) | ||||||||||||||||
| Net increase (decrease) in net asset value from investment operations | (5.66 | ) | 1.27 | 3.72 | 3.29 | (1.95 | ) | ||||||||||||||||
Dividends and Distributions to Shareholders | |||||||||||||||||||||||
From net investment income | — | (0.22 | ) | (0.18 | ) | (0.16 | ) | (0.03 | ) | ||||||||||||||
From net realized gain on investments | (0.11 | ) | (0.33 | ) | — | — | (0.06 | ) | |||||||||||||||
Total dividends and distributions | (0.11 | ) | (0.55 | ) | (0.18 | ) | (0.16 | ) | (0.09 | ) | |||||||||||||
Net asset value, end of year | $ | 11.75 | $ | 17.52 | $ | 16.80 | $ | 13.26 | $ | 10.13 | |||||||||||||
Total Return | |||||||||||||||||||||||
Total return based on net asset value(b) | (32.27 | )% | 7.51 | % | 28.04 | % | 32.42 | % | (15.99 | )% | |||||||||||||
Ratios/Supplemental Data | |||||||||||||||||||||||
Net assets, end of year (000's omitted) | $ | 79,201 | $ | 108,808 | $ | 108,722 | $ | 84,911 | $ | 64,123 | |||||||||||||
Ratio of net expenses to average net assets | 0.57 | % | 0.54 | % | 0.57 | % | 0.59 | % | 0.60 | % | |||||||||||||
| Ratio of net investment income to average net assets | 0.97 | % | 0.46 | % | 0.55 | % | 1.16 | % | 1.31 | % | |||||||||||||
Portfolio turnover rate(c) | 25 | % | 14 | % | 12 | % | 19 | % | 14 | % | |||||||||||||
(a) Calculated based upon average shares outstanding during the period.
(b) Total investment return is calculated assuming an initial investment made at the net asset value at the beginning of the period, reinvestment of all dividends and distributions, if any, at net asset value during the period, and redemption on the last day of the period.
(c) Portfolio turnover rate calculated at Fund level.
The accompanying notes are an integral part of the financial statements.
78
Financial Highlights
Annual Report December 31, 2022
Baillie Gifford Developed EAFE All Cap Fund
Selected data for a Class K share outstanding throughout each year:
| For the Year Ended December 31, 2022 | For the Year Ended December 31, 2021 | For the Year Ended December 31, 2020 | For the Year Ended December 31, 2019 | For the Year Ended December 31, 2018 | |||||||||||||||||||
Net asset value, beginning of year | $ | 17.31 | $ | 16.61 | $ | 13.11 | $ | 10.03 | $ | 12.06 | |||||||||||||
From Investment Operations | |||||||||||||||||||||||
Net investment income(a) | 0.11 | 0.07 | 0.06 | 0.12 | 0.11 | ||||||||||||||||||
| Net realized and unrealized gain (loss) on investments and foreign currency | (5.71 | ) | 1.17 | 3.61 | 3.11 | (2.04 | ) | ||||||||||||||||
| Net increase (decrease) in net asset value from investment operations | (5.60 | ) | 1.24 | 3.67 | 3.23 | (1.93 | ) | ||||||||||||||||
Dividends and Distributions to Shareholders | |||||||||||||||||||||||
From net investment income | — | (0.21 | ) | (0.17 | ) | (0.15 | ) | (0.04 | ) | ||||||||||||||
From net realized gain on investments | (0.11 | ) | (0.33 | ) | — | — | (0.06 | ) | |||||||||||||||
Total dividends and distributions | (0.11 | ) | (0.54 | ) | (0.17 | ) | (0.15 | ) | (0.10 | ) | |||||||||||||
Net asset value, end of year | $ | 11.60 | $ | 17.31 | $ | 16.61 | $ | 13.11 | $ | 10.03 | |||||||||||||
Total Return | |||||||||||||||||||||||
Total return based on net asset value(b) | (32.33 | )% | 7.47 | % | 27.98 | % | 32.24 | % | (16.05 | )% | |||||||||||||
Ratios/Supplemental Data | |||||||||||||||||||||||
Net assets, end of year (000's omitted) | $ | 214,016 | $ | 345,052 | $ | 246,283 | $ | 247,155 | $ | 152,397 | |||||||||||||
Ratio of net expenses to average net assets | 0.64 | % | 0.61 | % | 0.64 | % | 0.66 | % | 0.67 | % | |||||||||||||
| Ratio of net investment income to average net assets | 0.91 | % | 0.38 | % | 0.49 | % | 1.04 | % | 0.99 | % | |||||||||||||
Portfolio turnover rate(c) | 25 | % | 14 | % | 12 | % | 19 | % | 14 | % | |||||||||||||
(a) Calculated based upon average shares outstanding during the period.
(b) Total investment return is calculated assuming an initial investment made at the net asset value at the beginning of the period, reinvestment of all dividends and distributions, if any, at net asset value during the period, and redemption on the last day of the period.
(c) Portfolio turnover rate calculated at Fund level.
The accompanying notes are an integral part of the financial statements.
79
Financial Highlights
Annual Report December 31, 2022
Baillie Gifford Developed EAFE All Cap Fund
Selected data for an Institutional Class share outstanding throughout each year:
| For the Year Ended December 31, 2022 | For the Year Ended December 31, 2021 | For the Year Ended December 31, 2020 | For the Year Ended December 31, 2019 | For the Year Ended December 31, 2018 | |||||||||||||||||||
Net asset value, beginning of year | $ | 17.27 | $ | 16.59 | $ | 13.10 | $ | 10.02 | $ | 12.06 | |||||||||||||
From Investment Operations | |||||||||||||||||||||||
Net investment income(a) | 0.09 | 0.05 | 0.06 | 0.11 | 0.06 | ||||||||||||||||||
| Net realized and unrealized gain (loss) on investments and foreign currency | (5.68 | ) | 1.17 | 3.58 | 3.13 | (2.00 | ) | ||||||||||||||||
| Net increase (decrease) in net asset value from investment operations | (5.59 | ) | 1.22 | 3.64 | 3.24 | (1.94 | ) | ||||||||||||||||
Dividends and Distributions to Shareholders | |||||||||||||||||||||||
From net investment income | — | (0.21 | ) | (0.15 | ) | (0.16 | ) | (0.04 | ) | ||||||||||||||
From net realized gain on investments | (0.11 | ) | (0.33 | ) | — | — | (0.06 | ) | |||||||||||||||
Total dividends and distributions | (0.11 | ) | (0.54 | ) | (0.15 | ) | (0.16 | ) | (0.10 | ) | |||||||||||||
Net asset value, end of year | $ | 11.57 | $ | 17.27 | $ | 16.59 | $ | 13.10 | $ | 10.02 | |||||||||||||
Total Return | |||||||||||||||||||||||
Total return based on net asset value(b) | (32.34 | )% | 7.36 | % | 27.77 | % | 32.28 | % | (16.13 | )% | |||||||||||||
Ratios/Supplemental Data | |||||||||||||||||||||||
Net assets, end of year (000's omitted) | $ | 135,136 | $ | 43,030 | $ | 12,143 | $ | 9,179 | $ | 1,862 | |||||||||||||
Ratio of net expenses to average net assets | 0.71 | % | 0.67 | % | 0.76 | % | 0.73 | % | 0.77 | % | |||||||||||||
| Ratio of net investment income to average net assets | 0.80 | % | 0.29 | % | 0.43 | % | 0.89 | % | 0.59 | % | |||||||||||||
Portfolio turnover rate(c) | 25 | % | 14 | % | 12 | % | 19 | % | 14 | % | |||||||||||||
(a) Calculated based upon average shares outstanding during the period.
(b) Total investment return is calculated assuming an initial investment made at the net asset value at the beginning of the period, reinvestment of all dividends and distributions, if any, at net asset value during the period, and redemption on the last day of the period.
(c) Portfolio turnover rate calculated at Fund level.
The accompanying notes are an integral part of the financial statements.
80
Industry Diversification Table
Annual Report December 31, 2022
December 31, 2022
Baillie Gifford EAFE Plus All Cap Fund
Value | % of Total Net Assets | ||||||||||
Apparel | $ | 20,763,145 | 4.7 | % | |||||||
Auto Manufacturers | 4,362,125 | 1.0 | |||||||||
Auto Parts & Equipment | 4,987,350 | 1.1 | |||||||||
Banks | 15,016,453 | 3.4 | |||||||||
Beverages | 14,098,210 | 3.2 | |||||||||
Building Materials | 2,208,513 | 0.5 | |||||||||
Commercial Services | 30,220,592 | 6.8 | |||||||||
Cosmetics/Personal Care | 26,764,017 | 6.1 | |||||||||
Distribution/Wholesale | 5,972,272 | 1.4 | |||||||||
Diversified Financial Services | 7,366,949 | 1.7 | |||||||||
Electronics | 36,100,119 | 8.2 | |||||||||
Food | 9,907,740 | 2.2 | |||||||||
Hand/Machine Tools | 7,580,422 | 1.7 | |||||||||
Healthcare — Products | 24,150,001 | 5.5 | |||||||||
Healthcare — Services | 5,957,264 | 1.4 | |||||||||
Insurance | 21,538,424 | 4.9 | |||||||||
Internet | 66,448,562 | 15.0 | |||||||||
Investment Companies | 15,254,562 | 3.4 | |||||||||
Leisure Time | 6,210,143 | 1.4 | |||||||||
Machinery — Construction & Mining | 11,798,763 | 2.7 | |||||||||
Machinery — Diversified | 29,318,784 | 6.7 | |||||||||
Retail | 27,453,843 | 6.2 | |||||||||
Semiconductors | 21,677,967 | 4.9 | |||||||||
Software | 10,226,112 | 2.3 | |||||||||
Telecommunications | 4,538,035 | 1.0 | |||||||||
Toys/Games/Hobbies | 5,022,448 | 1.1 | |||||||||
Transportation | 2,822,116 | 0.6 | |||||||||
Total Value of Investments | 437,764,931 | 99.1 | |||||||||
Other assets less liabilities | 4,136,897 | 0.9 | |||||||||
Net Assets | $ | 441,901,828 | 100.0 | % | |||||||
The table above is based on Bloomberg Industry Group classifications. For compliance monitoring purposes, sub-industry classifications are used which results in less concentration across industry sectors.
81
Portfolio of Investments
Annual Report December 31, 2022
December 31, 2022
Baillie Gifford EAFE Plus All Cap Fund
Shares | Value | ||||||||||
COMMON STOCKS — 96.1% | |||||||||||
AUSTRALIA — 2.0% | |||||||||||
Cochlear Ltd. | 64,404 | $ | 8,894,671 | ||||||||
BELGIUM — 1.3% | |||||||||||
Anheuser-Busch InBev SA/NV | 94,147 | 5,670,565 | |||||||||
BRAZIL — 2.3% | |||||||||||
| MercadoLibre, Inc. * | 7,936 | 6,715,761 | |||||||||
Raia Drogasil SA | 768,400 | 3,460,599 | |||||||||
10,176,360 | |||||||||||
CHINA — 7.0% | |||||||||||
| Alibaba Group Holding Ltd. * | 422,088 | 4,631,535 | |||||||||
| Baidu, Inc., Class A * | 158,816 | 2,264,833 | |||||||||
| Meituan, Class B * | 310,700 | 6,883,818 | |||||||||
Ping An Insurance Group Co. of China Ltd., Class H | 874,000 | 5,741,957 | |||||||||
Prosus NV | 119,520 | 8,252,073 | |||||||||
| Trip.com Group Ltd. * | 92,874 | 3,203,187 | |||||||||
30,977,403 | |||||||||||
DENMARK — 0.6% | |||||||||||
DSV A/S | 17,846 | 2,822,116 | |||||||||
FRANCE — 5.2% | |||||||||||
Kering | 8,908 | 4,533,530 | |||||||||
LVMH Moet Hennessy Louis Vuitton SE | 10,553 | 7,679,347 | |||||||||
Remy Cointreau SA | 49,982 | 8,427,645 | |||||||||
| Ubisoft Entertainment SA * | 82,506 | 2,330,865 | |||||||||
22,971,387 | |||||||||||
GERMANY — 4.0% | |||||||||||
adidas AG | 30,315 | 4,108,484 | |||||||||
| Auto1 Group SE * | 264,546 | 2,197,854 | |||||||||
Nemetschek SE | 65,086 | 3,327,610 | |||||||||
| Zalando SE * | 224,119 | 7,890,070 | |||||||||
17,524,018 | |||||||||||
The accompanying notes are an integral part of the financial statements.
82
Portfolio of Investments
Annual Report December 31, 2022
December 31, 2022
Baillie Gifford EAFE Plus All Cap Fund
Shares | Value | ||||||||||
HONG KONG — 5.3% | |||||||||||
AIA Group Ltd. | 1,430,400 | $ | 15,796,467 | ||||||||
Techtronic Industries Co., Ltd. | 682,500 | 7,580,422 | |||||||||
23,376,889 | |||||||||||
INDIA — 1.2% | |||||||||||
Housing Development Finance Corp., Ltd. | 90,923 | 2,890,530 | |||||||||
| MakeMyTrip Ltd. * | 81,188 | 2,238,353 | |||||||||
5,128,883 | |||||||||||
JAPAN — 22.4% | |||||||||||
Denso Corp. | 101,700 | 4,987,350 | |||||||||
Kao Corp. | 87,700 | 3,481,730 | |||||||||
Keyence Corp. | 15,900 | 6,173,092 | |||||||||
Murata Manufacturing Co., Ltd. | 121,500 | 5,991,796 | |||||||||
Nidec Corp. | 96,900 | 4,986,392 | |||||||||
Olympus Corp. | 509,300 | 8,982,824 | |||||||||
Pigeon Corp. | 143,900 | 2,358,357 | |||||||||
Recruit Holdings Co., Ltd. | 145,500 | 4,554,438 | |||||||||
Shimano, Inc. | 39,300 | 6,210,142 | |||||||||
Shiseido Co., Ltd. | 256,300 | 12,562,218 | |||||||||
SMC Corp. | 24,200 | 10,104,802 | |||||||||
SoftBank Group Corp. | 107,300 | 4,538,035 | |||||||||
Sugi Holdings Co., Ltd. | 52,700 | 2,343,788 | |||||||||
Suzuki Motor Corp. | 136,200 | 4,362,125 | |||||||||
Sysmex Corp. | 103,900 | 6,272,506 | |||||||||
Unicharm Corp. | 218,400 | 8,361,713 | |||||||||
Z Holdings Corp. | 1,040,200 | 2,597,916 | |||||||||
98,869,224 | |||||||||||
NETHERLANDS — 6.9% | |||||||||||
| Adyen NV * | 5,742 | 7,971,331 | |||||||||
| ASML Holding NV | 20,880 | 11,384,864 | |||||||||
| EXOR NV * | 73,293 | 5,366,098 | |||||||||
IMCD NV | 41,752 | 5,972,272 | |||||||||
30,694,565 | |||||||||||
NEW ZEALAND — 1.0% | |||||||||||
| Xero Ltd. * | 95,790 | 4,567,637 | |||||||||
The accompanying notes are an integral part of the financial statements.
83
Portfolio of Investments
Annual Report December 31, 2022
December 31, 2022
Baillie Gifford EAFE Plus All Cap Fund
Shares | Value | ||||||||||
PORTUGAL — 2.2% | |||||||||||
Jeronimo Martins SGPS SA | 457,939 | $ | 9,907,740 | ||||||||
SINGAPORE — 3.4% | |||||||||||
United Overseas Bank Ltd. | 655,573 | 15,016,453 | |||||||||
SOUTH KOREA — 0.6% | |||||||||||
| Coupang, Inc. * | 172,695 | 2,540,343 | |||||||||
SWEDEN — 7.0% | |||||||||||
Atlas Copco AB, A Shares | 792,407 | 9,388,754 | |||||||||
Atlas Copco AB, B Shares | 342,292 | 3,652,136 | |||||||||
Epiroc AB, B Shares | 349,263 | 5,618,663 | |||||||||
Investor AB, B Shares | 546,295 | 9,888,463 | |||||||||
Nibe Industrier AB, B Shares | 236,615 | 2,208,513 | |||||||||
30,756,529 | |||||||||||
SWITZERLAND — 4.5% | |||||||||||
Cie Financiere Richemont SA | 106,119 | 13,759,386 | |||||||||
Lonza Group AG | 12,136 | 5,957,264 | |||||||||
19,716,650 | |||||||||||
TAIWAN — 2.3% | |||||||||||
Taiwan Semiconductor Manufacturing Co., Ltd. ADR | 138,181 | 10,293,103 | |||||||||
UNITED KINGDOM — 13.5% | |||||||||||
Ashtead Group PLC | 65,945 | 3,745,992 | |||||||||
Auto Trader Group PLC | 1,460,628 | 9,095,849 | |||||||||
Burberry Group PLC | 182,698 | 4,441,784 | |||||||||
Experian PLC | 178,869 | 6,057,995 | |||||||||
| Farfetch Ltd., Class A * | 326,203 | 1,542,940 | |||||||||
Games Workshop Group PLC | 48,656 | 5,022,448 | |||||||||
Hargreaves Lansdown PLC | 434,690 | 4,476,420 | |||||||||
Intertek Group PLC | 97,979 | 4,766,893 | |||||||||
Rightmove PLC | 1,200,747 | 7,428,349 | |||||||||
| Trainline PLC * | 1,121,941 | 3,724,594 | |||||||||
Weir Group PLC (The) | 307,247 | 6,180,100 | |||||||||
| Wise PLC, Class A * | 461,113 | 3,123,942 | |||||||||
59,607,306 | |||||||||||
The accompanying notes are an integral part of the financial statements.
84
Portfolio of Investments
Annual Report December 31, 2022
December 31, 2022
Baillie Gifford EAFE Plus All Cap Fund
Shares | Value | ||||||||||
UNITED STATES — 3.4% | |||||||||||
| Mettler-Toledo International, Inc. * | 8,325 | $ | 12,033,371 | ||||||||
| Spotify Technology SA * | 39,660 | 3,131,157 | |||||||||
15,164,528 | |||||||||||
Total Common Stocks | |||||||||||
(cost $399,330,468) | 424,676,370 | ||||||||||
PREFERRED STOCKS — 3.0% | |||||||||||
GERMANY — 3.0% | |||||||||||
Sartorius AG 0.34% (cost $6,610,985) | 33,146 | 13,088,561 | |||||||||
TOTAL INVESTMENTS — 99.1% | |||||||||||
(cost $405,941,453) | $ | 437,764,931 | |||||||||
Other assets less liabilities — 0.9% | 4,136,897 | ||||||||||
NET ASSETS — 100.0% | $ | 441,901,828 | |||||||||
* Non-income producing security.
ADR — American Depositary Receipt
This report classifies issuers geographically by their country of risk. For compliance monitoring purposes, the Manager retains discretion to consider a number of factors in determining where a particular issuer is located, as described in further detail in each Fund's prospectus.
Fair Value Measurement
The following is a summary of the inputs used as of December 31, 2022 in valuing the Fund's investments carried at fair value:
Investments in Securities | Level 1 | Level 2 | Level 3 | Total | |||||||||||||||
| Common Stocks ** | $ | 42,219,622 | $ | 382,456,748 | $ | — | $ | 424,676,370 | |||||||||||
| Preferred Stocks ** | — | 13,088,561 | — | 13,088,561 | |||||||||||||||
Total | $ | 42,219,622 | $ | 395,545,309 | $ | — | $ | 437,764,931 | |||||||||||
** Refer to Portfolio of Investments for further detail.
The accompanying notes are an integral part of the financial statements.
85
Statement of Assets and Liabilities
Annual Report December 31, 2022
December 31, 2022
Baillie Gifford EAFE Plus All Cap Fund
ASSETS | |||||||
Investments, at value (cost $405,941,453) | $ | 437,764,931 | |||||
Cash | 4,000,775 | ||||||
Tax reclaims receivable | 569,521 | ||||||
Dividends receivable | 334,611 | ||||||
Prepaid assets | 17,524 | ||||||
Total Assets | 442,687,362 | ||||||
LIABILITIES | |||||||
Advisory fee payable | 375,291 | ||||||
Shareholder Servicing fee payable | 102,219 | ||||||
Capital shares purchased payable | 720 | ||||||
Payable for investment purchased | 85,879 | ||||||
Administration & Supervisory fee payable | 59,298 | ||||||
Deferred India capital gains tax liability (Note A) | 11,679 | ||||||
Trustee fee payable | 5,006 | ||||||
Commitment fee payable | 1,675 | ||||||
Accrued expenses | 143,767 | ||||||
Total Liabilities | 785,534 | ||||||
NET ASSETS | $ | 441,901,828 | |||||
COMPOSITION OF NET ASSETS | |||||||
Paid-in capital | $ | 419,750,955 | |||||
Total distributable earnings | 22,150,873 | ||||||
$ | 441,901,828 | ||||||
NET ASSET VALUE, PER SHARE | |||||||
| Class 2 ($176,604,033 / 13,205,658 shares outstanding), unlimited authorized, no par value | $ | 13.37 | |||||
| Class 3 ($122,783,681 / 9,191,917 shares outstanding), unlimited authorized, no par value | $ | 13.36 | |||||
| Class K ($124,889,493 / 9,375,348 shares outstanding), unlimited authorized, no par value | $ | 13.32 | |||||
| Institutional Class ($17,624,621 / 1,327,633 shares outstanding), unlimited authorized, no par value | $ | 13.28 | |||||
The accompanying notes are an integral part of the financial statements.
86
Statement of Operations
Annual Report December 31, 2022
For the Year Ended December 31, 2022
Baillie Gifford EAFE Plus All Cap Fund
INVESTMENT INCOME | |||||||
Dividends (net of foreign withholding taxes of $695,449) | $ | 6,117,816 | |||||
Windfall tax recovery (Note A) | 228,594 | ||||||
Interest | 17,987 | ||||||
Total Investment Income | 6,364,397 | ||||||
EXPENSES | |||||||
Advisory fee (Note B) | 1,650,683 | ||||||
Shareholder Servicing fees — Class 2 shares (Note B) | 289,646 | ||||||
Shareholder Servicing fees — Class 3 shares (Note B) | 147,247 | ||||||
Shareholder Servicing fees — Class 4 shares (Note B) | 819 | ||||||
Administration & Supervisory fee — Class K shares (Note B) | 215,732 | ||||||
Administration & Supervisory fee — Institutional Class shares (Note B) | 44,073 | ||||||
Transfer agency | 92,939 | ||||||
Sub-transfer agency — Institutional Class shares | 22,963 | ||||||
Fund accounting | 183,553 | ||||||
Legal | 86,718 | ||||||
Custody | 68,126 | ||||||
Registration fees | 38,168 | ||||||
Professional fees | 37,919 | ||||||
Trustees' fees | 19,192 | ||||||
Commitment fees | 6,373 | ||||||
Miscellaneous | 27,562 | ||||||
Total Expenses | 2,931,713 | ||||||
Net Investment Income | 3,432,684 | ||||||
| REALIZED AND UNREALIZED GAIN (LOSS) ON INVESTMENTS AND FOREIGN CURRENCY TRANSACTIONS | |||||||
Net realized gain (loss) from: | |||||||
Investments (net of India capital gains tax expense of $2,822) | (3,304,634 | ) | |||||
Foreign currency transactions | 76,326 | ||||||
(3,228,308 | ) | ||||||
Net change in unrealized (depreciation) on: | |||||||
Investments (net of change in deferred India capital gains tax liability of $11,680) (Note A) | (201,801,581 | ) | |||||
Translation of net assets and liabilities denominated in foreign currencies | (18,445 | ) | |||||
(201,820,026 | ) | ||||||
Net realized and unrealized (loss) | (205,048,334 | ) | |||||
NET (DECREASE) IN NET ASSETS FROM OPERATIONS | $ | (201,615,650 | ) | ||||
The accompanying notes are an integral part of the financial statements.
87
Statements of Changes in Net Assets
Annual Report December 31, 2022
Baillie Gifford EAFE Plus All Cap Fund
| For the Year Ended December 31, 2022 | For the Year Ended December 31, 2021 | ||||||||||
INCREASE (DECREASE) IN NET ASSETS FROM OPERATIONS | |||||||||||
Net investment income | $ | 3,432,684 | $ | 2,150,228 | |||||||
Net realized gain (loss) | (3,228,308 | ) | 52,856,595 | ||||||||
Net change in unrealized (depreciation) | (201,820,026 | ) | (32,486,870 | ) | |||||||
Net Increase (Decrease) in Net Assets from Operations | (201,615,650 | ) | 22,519,953 | ||||||||
DIVIDENDS AND DISTRIBUTIONS TO SHAREHOLDERS FROM: | |||||||||||
Distributable earnings | |||||||||||
Class 2 | (4,407,369 | ) | (15,772,463 | ) | |||||||
Class 3 | (3,067,698 | ) | (18,905,378 | ) | |||||||
Class 4 | — | (440,760 | ) | ||||||||
Class K | (3,131,099 | ) | (14,734,840 | ) | |||||||
Institutional Class | (443,381 | ) | (3,749,028 | ) | |||||||
Total Distributions to Shareholders | (11,049,547 | ) | (53,602,469 | ) | |||||||
TRANSACTIONS IN SHARES OF BENEFICIAL INTEREST | |||||||||||
Net proceeds from shares subscribed: | |||||||||||
Class 2 | 66,979,275 | * | 6,000 | ||||||||
Class 3 | 48,661,226 | * | 108,708,698 | ||||||||
Class 4 | — | 4,689,893 | |||||||||
Class K | 14,784,641 | 14,492,662 | |||||||||
Institutional Class | 2,016,768 | 9,054,805 | |||||||||
Dividends reinvested: | |||||||||||
Class 2 | 4,407,368 | 15,772,464 | |||||||||
Class 3 | 3,067,698 | 18,905,377 | |||||||||
Class 4 | — | 440,760 | |||||||||
Class K | 3,130,898 | 14,725,746 | |||||||||
Institutional Class | 441,482 | 3,736,271 | |||||||||
Cost of shares redeemed: | |||||||||||
Class 2 | (7,100,000 | ) | (177,343,738 | ) | |||||||
Class 3 | (67,348,275 | )* | (45,139,893 | ) | |||||||
Class 4 | (3,764,253 | )* | — | ||||||||
Class K | (3,894,300 | ) | (55,928,721 | ) | |||||||
Institutional Class | (12,855,574 | ) | (7,859,622 | ) | |||||||
Increase (Decrease) in Net Assets from Transactions in Shares of Beneficial Interest | 48,526,954 | (95,739,298 | ) | ||||||||
Total (Decrease) in Net Assets | (164,138,243 | ) | (126,821,814 | ) | |||||||
NET ASSETS | |||||||||||
Beginning of Year | 606,040,071 | 732,861,885 | |||||||||
End of Year | $ | 441,901,828 | $ | 606,040,071 | |||||||
* See Note D for details of share class conversions.
The accompanying notes are an integral part of the financial statements.
88
Financial Highlights
Annual Report December 31, 2022
Baillie Gifford EAFE Plus All Cap Fund
Selected data for a Class 2 share outstanding throughout each year:
| For the Year Ended December 31, 2022 | For the Year Ended December 31, 2021 | For the Year Ended December 31, 2020 | For the Year Ended December 31, 2019 | For the Year Ended December 31, 2018 | |||||||||||||||||||
Net asset value, beginning of year | $ | 19.93 | $ | 21.15 | $ | 16.71 | $ | 13.15 | $ | 16.11 | |||||||||||||
From Investment Operations | |||||||||||||||||||||||
Net investment income(a) | 0.11 | 0.07 | 0.07 | 0.27 | 0.17 | ||||||||||||||||||
| Net realized and unrealized gain (loss) on investments and foreign currency | (6.32 | ) | 0.63 | 4.73 | 3.91 | (2.81 | ) | ||||||||||||||||
| Net increase (decrease) in net asset value from investment operations | (6.21 | ) | 0.70 | 4.80 | 4.18 | (2.64 | ) | ||||||||||||||||
Dividends and Distributions to Shareholders | |||||||||||||||||||||||
From net investment income | (0.01 | ) | (0.28 | ) | (0.14 | ) | (0.33 | ) | (0.09 | ) | |||||||||||||
From net realized gain on investments | (0.34 | ) | (1.64 | ) | (0.22 | ) | (0.29 | ) | (0.23 | ) | |||||||||||||
Total dividends and distributions | (0.35 | ) | (1.92 | ) | (0.36 | ) | (0.62 | ) | (0.32 | ) | |||||||||||||
Net asset value, end of year | $ | 13.37 | $ | 19.93 | $ | 21.15 | $ | 16.71 | $ | 13.15 | |||||||||||||
Total Return | |||||||||||||||||||||||
Total return based on net asset value(b) | (31.17 | )% | 3.31 | % | 28.77 | % | 31.73 | % | (16.39 | )% | |||||||||||||
Ratios/Supplemental Data | |||||||||||||||||||||||
Net assets, end of year (000's omitted) | $ | 176,604 | $ | 179,913 | $ | 343,888 | $ | 309,335 | $ | 232,937 | |||||||||||||
Ratio of net expenses to average net assets | 0.64 | % | 0.61 | % | 0.62 | % | 0.65 | % | 0.68 | % | |||||||||||||
Ratio of net investment income to average net assets | 0.80 | % | 0.32 | % | 0.42 | % | 1.76 | % | 1.06 | % | |||||||||||||
Portfolio turnover rate(c) | 17 | % | 10 | % | 20 | % | 11 | % | 26 | % | |||||||||||||
(a) Calculated based upon average shares outstanding during the period.
(b) Total investment return is calculated assuming an initial investment made at the net asset value at the beginning of the period, reinvestment of all dividends and distributions, if any, at net asset value during the period, and redemption on the last day of the period.
(c) Portfolio turnover rate calculated at Fund level.
The accompanying notes are an integral part of the financial statements.
89
Financial Highlights
Annual Report December 31, 2022
Baillie Gifford EAFE Plus All Cap Fund
Selected data for a Class 3 share outstanding throughout each year:
| For the Year Ended December 31, 2022 | For the Year Ended December 31, 2021 | For the Period August 3, 2020(a) through December 31, 2020 | For the Year Ended December 31, 2017 | For the Year Ended December 31, 2016 | |||||||||||||||||||
Net asset value, beginning of year | $ | 19.90 | $ | 21.14 | $ | 17.57 | $ | 12.58 | $ | 12.67 | |||||||||||||
From Investment Operations | |||||||||||||||||||||||
Net investment income(b) | 0.10 | 0.08 | 0.03 | 0.16 | 0.20 | ||||||||||||||||||
| Net realized and unrealized gain (loss) on investments and foreign currency | (6.29 | ) | 0.63 | 3.93 | 3.79 | (0.13 | ) | ||||||||||||||||
| Net increase (decrease) in net asset value from investment operations | (6.19 | ) | 0.71 | 3.96 | 3.95 | 0.07 | |||||||||||||||||
Dividends and Distributions to Shareholders | |||||||||||||||||||||||
From net investment income | (0.01 | ) | (0.31 | ) | (0.17 | ) | (0.27 | ) | (0.17 | ) | |||||||||||||
From net realized gain on investments | (0.34 | ) | (1.64 | ) | (0.22 | ) | — | — | |||||||||||||||
Total dividends and distributions | (0.35 | ) | (1.95 | ) | (0.39 | ) | (0.27 | ) | (0.17 | ) | |||||||||||||
| Proceeds from Purchase Fees and Redemption Fees(b) | — | — | — | 0.00 | (c) | 0.01 | |||||||||||||||||
Net asset value, end of period | $ | 13.36 | $ | 19.90 | $ | 21.14 | $ | 16.26 | $ | 12.58 | |||||||||||||
Total Return | |||||||||||||||||||||||
Total return based on net asset value(d) | (31.12 | )% | 3.38 | % | 22.49 | % | 31.37 | % | 0.66 | % | |||||||||||||
Ratios/Supplemental Data | |||||||||||||||||||||||
Net assets, end of year (000's omitted) | $ | 122,784 | $ | 211,865 | $ | 146,565 | $ | 26,932 | $ | 19,890 | |||||||||||||
Ratio of net expenses to average net assets | 0.57 | % | 0.54 | % | 0.54 | %* | 0.60 | % | 0.58 | % | |||||||||||||
Ratio of net investment income to average net assets | 0.69 | % | 0.36 | % | 0.35 | %* | 1.06 | % | 1.59 | % | |||||||||||||
Portfolio turnover rate(e) | 17 | % | 10 | % | 20 | % | 12 | % | 23 | % | |||||||||||||
* Annualized
(a) Recommencement of investment operations. Class had no shareholders from April 9, 2018 to August 2, 2020. All shares of this class were redeemed at $16.18 on April 9, 2018. New Shares were issued at $17.57 on August 3, 2020.
(b) Calculated based upon average shares outstanding during the period.
(c) Amount is less than $0.005 per share.
(d) Total investment return is calculated assuming an initial investment made at the net asset value at the beginning of the period, reinvestment of all dividends and distributions, if any, at net asset value during the period, and redemption on the last day of the period. Total return is not annualized for periods less than one year.
(e) Portfolio turnover rate calculated at Fund level. Portfolio turnover is not annualized for periods less than one year.
The accompanying notes are an integral part of the financial statements.
90
Financial Highlights
Annual Report December 31, 2022
Baillie Gifford EAFE Plus All Cap Fund
Selected data for a Class K share outstanding throughout each year:
| For the Year Ended December 31, 2022 | For the Year Ended December 31, 2021 | For the Year Ended December 31, 2020 | For the Year Ended December 31, 2019 | For the Year Ended December 31, 2018 | |||||||||||||||||||
Net asset value, beginning of year | $ | 19.86 | $ | 21.09 | $ | 16.66 | $ | 13.12 | $ | 16.10 | |||||||||||||
From Investment Operations | |||||||||||||||||||||||
Net investment income(a) | 0.10 | 0.07 | 0.07 | 0.26 | 0.04 | ||||||||||||||||||
| Net realized and unrealized gain (loss) on investments and foreign currency | (6.29 | ) | 0.63 | 4.73 | 3.91 | (2.68 | ) | ||||||||||||||||
| Net increase (decrease) in net asset value from investment operations | (6.19 | ) | 0.70 | 4.80 | 4.17 | (2.64 | ) | ||||||||||||||||
Dividends and Distributions to Shareholders | |||||||||||||||||||||||
From net investment income | (0.01 | ) | (0.29 | ) | (0.15 | ) | (0.34 | ) | (0.11 | ) | |||||||||||||
From net realized gain on investments | (0.34 | ) | (1.64 | ) | (0.22 | ) | (0.29 | ) | (0.23 | ) | |||||||||||||
Total dividends and distributions | (0.35 | ) | (1.93 | ) | (0.37 | ) | (0.63 | ) | (0.34 | ) | |||||||||||||
Net asset value, end of year | $ | 13.32 | $ | 19.86 | $ | 21.09 | $ | 16.66 | $ | 13.12 | |||||||||||||
Total Return | |||||||||||||||||||||||
Total return based on net asset value(b) | (31.19 | )% | 3.33 | % | 28.78 | % | 31.72 | % | (16.36 | )% | |||||||||||||
Ratios/Supplemental Data | |||||||||||||||||||||||
Net assets, end of year (000's omitted) | $ | 124,889 | $ | 166,910 | $ | 202,514 | $ | 114,922 | $ | 64,827 | |||||||||||||
Ratio of net expenses to average net assets | 0.64 | % | 0.61 | % | 0.62 | % | 0.65 | % | 0.68 | % | |||||||||||||
Ratio of net investment income to average net assets | 0.70 | % | 0.31 | % | 0.40 | % | 1.73 | % | 0.42 | % | |||||||||||||
Portfolio turnover rate(c) | 17 | % | 10 | % | 20 | % | 11 | % | 26 | % | |||||||||||||
(a) Calculated based upon average shares outstanding during the period.
(b) Total investment return is calculated assuming an initial investment made at the net asset value at the beginning of the period, reinvestment of all dividends and distributions, if any, at net asset value during the period, and redemption on the last day of the period.
(c) Portfolio turnover rate calculated at Fund level.
The accompanying notes are an integral part of the financial statements.
91
Financial Highlights
Annual Report December 31, 2022
Baillie Gifford EAFE Plus All Cap Fund
Selected data for an Institutional Class share outstanding throughout each year:
| For the Year Ended December 31, 2022 | For the Year Ended December 31, 2021 | For the Year Ended December 31, 2020 | For the Year Ended December 31, 2019 | For the Year Ended December 31, 2018 | |||||||||||||||||||
Net asset value, beginning of year | $ | 19.81 | $ | 21.05 | $ | 16.63 | $ | 13.10 | $ | 16.09 | |||||||||||||
From Investment Operations | |||||||||||||||||||||||
Net investment income(a) | 0.10 | 0.05 | 0.05 | 0.26 | 0.07 | ||||||||||||||||||
| Net realized and unrealized gain (loss) on investments and foreign currency | (6.28 | ) | 0.62 | 4.72 | 3.88 | (2.73 | ) | ||||||||||||||||
| Net increase (decrease) in net asset value from investment operations | (6.18 | ) | 0.67 | 4.77 | 4.14 | (2.66 | ) | ||||||||||||||||
Dividends and Distributions to Shareholders | |||||||||||||||||||||||
From net investment income | (0.01 | ) | (0.27 | ) | (0.13 | ) | (0.32 | ) | (0.10 | ) | |||||||||||||
From net realized gain on investments | (0.34 | ) | (1.64 | ) | (0.22 | ) | (0.29 | ) | (0.23 | ) | |||||||||||||
Total dividends and distributions | (0.35 | ) | (1.91 | ) | (0.35 | ) | (0.61 | ) | (0.33 | ) | |||||||||||||
Net asset value, end of year | $ | 13.28 | $ | 19.81 | $ | 21.05 | $ | 16.63 | $ | 13.10 | |||||||||||||
Total Return | |||||||||||||||||||||||
Total return based on net asset value(b) | (31.22 | )% | 3.20 | % | 28.68 | % | 31.60 | % | (16.50 | )% | |||||||||||||
Ratios/Supplemental Data | |||||||||||||||||||||||
Net assets, end of year (000's omitted) | $ | 17,625 | $ | 42,442 | $ | 39,894 | $ | 23,378 | $ | 10,768 | |||||||||||||
Ratio of net expenses to average net assets | 0.73 | % | 0.72 | % | 0.72 | % | 0.75 | % | 0.78 | % | |||||||||||||
Ratio of net investment income to average net assets | 0.65 | % | 0.21 | % | 0.30 | % | 1.72 | % | 0.47 | % | |||||||||||||
Portfolio turnover rate(c) | 17 | % | 10 | % | 20 | % | 11 | % | 26 | % | |||||||||||||
(a) Calculated based upon average shares outstanding during the period.
(b) Total investment return is calculated assuming an initial investment made at the net asset value at the beginning of the period, reinvestment of all dividends and distributions, if any, at net asset value during the period, and redemption on the last day of the period.
(c) Portfolio turnover rate calculated at Fund level.
The accompanying notes are an integral part of the financial statements.
92
Industry Diversification Table
Annual Report December 31, 2022
December 31, 2022
Baillie Gifford Emerging Markets Equities Fund
Value | % of Total Net Assets | ||||||||||
Airlines | $ | 53,659,122 | 1.2 | % | |||||||
Apparel | 30,601,811 | 0.7 | |||||||||
Auto Manufacturers | 130,013,966 | 3.0 | |||||||||
Auto Parts & Equipment | 77,421,096 | 1.8 | |||||||||
Banks | 453,608,028 | 10.2 | |||||||||
Biotechnology | 42,936,074 | 1.0 | |||||||||
Building Materials | 67,999,042 | 1.5 | |||||||||
Chemicals | 70,467,089 | 1.6 | |||||||||
Commercial Services | 4,758,751 | 0.1 | |||||||||
Computers | 87,018,093 | 2.0 | |||||||||
Diversified Financial Services | 254,280,207 | 5.8 | |||||||||
Food | 0 | 0.0 | |||||||||
Gas | 27,383,739 | 0.6 | |||||||||
Home Furnishings | 106,134,090 | 2.4 | |||||||||
Insurance | 184,437,240 | 4.2 | |||||||||
Internet | 988,569,803 | 22.5 | |||||||||
Machinery — Construction & Mining | 25,167,684 | 0.6 | |||||||||
Mining | 201,958,138 | 4.6 | |||||||||
Oil & Gas | 479,156,858 | 10.9 | |||||||||
Pharmaceuticals | 9,402,464 | 0.2 | |||||||||
Real Estate | 24,358,650 | 0.6 | |||||||||
Retail | 88,010,596 | 2.0 | |||||||||
Semiconductors | 817,524,207 | 18.5 | |||||||||
Software | 65,515,531 | 1.5 | |||||||||
Telecommunications | 84,589,492 | 1.9 | |||||||||
Total Value of Investments | 4,374,971,771 | 99.4 | |||||||||
Other assets less liabilities | 28,068,122 | 0.6 | |||||||||
Net Assets | $ | 4,403,039,893 | 100.0 | % | |||||||
The table above is based on Bloomberg Industry Group classifications. For compliance monitoring purposes, sub-industry classifications are used which results in less concentration across industry sectors.
93
Portfolio of Investments
Annual Report December 31, 2022
December 31, 2022
Baillie Gifford Emerging Markets Equities Fund
Shares | Value | ||||||||||
COMMON STOCKS — 96.1% | |||||||||||
BRAZIL — 9.5% | |||||||||||
B3 SA — Brasil Bolsa Balcao | 34,133,800 | $ | 85,287,506 | ||||||||
Banco Bradesco SA ADR | 20,014,787 | 57,642,586 | |||||||||
| MercadoLibre, Inc. * | 123,591 | 104,587,648 | |||||||||
Petroleo Brasileiro SA ADR | 15,471,918 | 164,775,927 | |||||||||
StoneCo Ltd., Class A * | 504,105 | 4,758,751 | |||||||||
417,052,418 | |||||||||||
CANADA — 0.2% | |||||||||||
Valeura Energy, Inc. * | 4,672,400 | 7,212,198 | |||||||||
CHILE — 1.3% | |||||||||||
Lundin Mining Corp. | 9,496,282 | 58,282,203 | |||||||||
CHINA — 31.4% | |||||||||||
| Alibaba Group Holding Ltd. * | 15,868,020 | 174,118,409 | |||||||||
Anker Innovations Technology Co., Ltd., Class A | 2,075,600 | 17,670,103 | |||||||||
Baidu, Inc., Class A * | 3,324,250 | 47,406,261 | |||||||||
| BeiGene Ltd. * | 1,718,795 | 29,171,686 | |||||||||
| Brilliance China Automotive Holdings Ltd. * | 35,694,000 | 19,983,829 | |||||||||
China Merchants Bank Co., Ltd., Class H | 19,684,500 | 108,931,203 | |||||||||
Contemporary Amperex Technology Co., Ltd., Class A | 774,345 | 43,632,680 | |||||||||
Geely Automobile Holdings Ltd. | 25,595,000 | 36,972,786 | |||||||||
Haier Smart Home Co., Ltd., Class H | 16,305,080 | 55,340,749 | |||||||||
JD.com, Inc., Class A | 3,023,785 | 84,413,922 | |||||||||
| KE Holdings, Inc. ADR * | 359,307 | 5,015,926 | |||||||||
KE Holdings, Inc., Class A * | 4,146,424 | 19,342,725 | |||||||||
| Kuaishou Technology * | 2,462,900 | 22,139,674 | |||||||||
Li Ning Co., Ltd. | 4,590,000 | 39,469,434 | |||||||||
Lufax Holding Ltd. ADR | 6,343,355 | 12,306,109 | |||||||||
Meituan, Class B * | 6,369,100 | 141,112,730 | |||||||||
Midea Group Co., Ltd., Class A | 4,463,270 | 33,123,238 | |||||||||
Minth Group Ltd. | 12,518,000 | 33,788,416 | |||||||||
Ping An Bank Co., Ltd., Class A | 20,186,609 | 38,104,618 | |||||||||
Ping An Insurance Group Co. of China Ltd., Class H | 19,234,000 | 126,362,482 | |||||||||
Shenzhou International Group Holdings Ltd. | 2,744,100 | 30,601,811 | |||||||||
Tencent Holdings Ltd. | 4,499,900 | 190,797,397 | |||||||||
| Tencent Music Entertainment Group ADR * | 3,258,592 | 26,981,142 | |||||||||
The accompanying notes are an integral part of the financial statements.
94
Portfolio of Investments
Annual Report December 31, 2022
December 31, 2022
Baillie Gifford Emerging Markets Equities Fund
Shares | Value | ||||||||||
| Zai Lab Ltd. * | 4,446,930 | $ | 13,764,387 | ||||||||
Zijin Mining Group Co., Ltd., Class H | 23,218,000 | 31,204,811 | |||||||||
1,381,756,528 | |||||||||||
INDIA — 13.6% | |||||||||||
HDFC Life Insurance Co., Ltd. | 8,501,790 | 58,074,758 | |||||||||
Housing Development Finance Corp., Ltd. | 4,395,876 | 139,749,138 | |||||||||
Piramal Enterprises Ltd. | 1,696,175 | 16,937,455 | |||||||||
| Piramal Pharma Ltd. * | 6,784,700 | 9,402,464 | |||||||||
Reliance Industries Ltd. | 6,061,420 | 186,089,314 | |||||||||
Tata Consultancy Services Ltd. | 2,212,674 | 87,018,093 | |||||||||
Tech Mahindra Ltd. | 5,342,229 | 65,515,531 | |||||||||
UltraTech Cement Ltd. | 420,763 | 35,307,211 | |||||||||
598,093,964 | |||||||||||
INDONESIA — 2.3% | |||||||||||
Bank Rakyat Indonesia Persero Tbk PT | 321,372,663 | 101,891,287 | |||||||||
MEXICO — 3.8% | |||||||||||
| Cemex SAB de CV, Participating Certificates ADR * | 8,072,057 | 32,691,831 | |||||||||
Grupo Financiero Banorte SAB de CV, Class O | 11,840,927 | 85,216,514 | |||||||||
Wal-Mart de Mexico SAB de CV | 13,732,540 | 48,541,162 | |||||||||
166,449,507 | |||||||||||
PANAMA — 1.2% | |||||||||||
Copa Holdings SA, Class A * | 645,174 | 53,659,122 | |||||||||
PERU — 0.7% | |||||||||||
Credicorp Ltd. | 235,376 | 31,931,108 | |||||||||
POLAND — 1.1% | |||||||||||
| Allegro.eu SA * | 3,717,023 | 21,453,031 | |||||||||
KGHM Polska Miedz SA | 897,734 | 26,112,932 | |||||||||
47,565,963 | |||||||||||
RUSSIA — 0.0% (a) | |||||||||||
| Magnit PJSC *(b) | 362,537 | 0 | |||||||||
| Magnit PJSC GDR Reg S *(b) | 2 | 0 | |||||||||
MMC Norilsk Nickel PJSC (b) | 548,127 | 0 | |||||||||
MMC Norilsk Nickel PJSC ADR (b) | 2 | 0 | |||||||||
The accompanying notes are an integral part of the financial statements.
95
Portfolio of Investments
Annual Report December 31, 2022
December 31, 2022
Baillie Gifford Emerging Markets Equities Fund
Shares | Value | ||||||||||
| Moscow Exchange MICEX-RTS PJSC *(b) | 14,557,370 | $ | 0 | ||||||||
| Ozon Holdings PLC ADR *(b) | 1,051,835 | 0 | |||||||||
| Sberbank of Russia PJSC *(b) | 31,444,360 | 0 | |||||||||
0 | |||||||||||
SINGAPORE — 0.4% | |||||||||||
| Sea Ltd. ADR * | 322,740 | 16,792,162 | |||||||||
SOUTH AFRICA — 2.8% | |||||||||||
FirstRand Ltd. | 8,227,356 | 29,890,712 | |||||||||
Naspers Ltd., N Shares | 556,662 | 93,021,383 | |||||||||
122,912,095 | |||||||||||
SOUTH KOREA — 13.4% | |||||||||||
| Coupang, Inc. * | 3,345,295 | 49,209,290 | |||||||||
Doosan Bobcat, Inc. | 919,829 | 25,167,684 | |||||||||
Hyundai Motor Co. | 610,429 | 73,057,351 | |||||||||
| LG Chem Ltd. * | 147,566 | 70,467,089 | |||||||||
NAVER Corp. | 116,275 | 16,536,753 | |||||||||
Samsung Electronics Co., Ltd. | 5,045,182 | 221,449,402 | |||||||||
Samsung SDI Co., Ltd. | 180,153 | 84,589,492 | |||||||||
SK Hynix, Inc. | 816,936 | 48,741,711 | |||||||||
589,218,772 | |||||||||||
TAIWAN — 10.7% | |||||||||||
MediaTek, Inc. | 4,190,000 | 84,717,353 | |||||||||
Taiwan Semiconductor Manufacturing Co., Ltd. | 26,720,310 | 388,071,441 | |||||||||
472,788,794 | |||||||||||
THAILAND — 1.7% | |||||||||||
PTT Exploration & Production PCL | 15,072,100 | 76,756,439 | |||||||||
ZAMBIA — 2.0% | |||||||||||
First Quantum Minerals Ltd. | 4,133,227 | 86,358,192 | |||||||||
Total Common Stocks | |||||||||||
(cost $4,401,980,931) | 4,228,720,752 | ||||||||||
The accompanying notes are an integral part of the financial statements.
96
Portfolio of Investments
Annual Report December 31, 2022
December 31, 2022
Baillie Gifford Emerging Markets Equities Fund
Shares | Value | ||||||||||
PREFERRED STOCKS — 3.3% | |||||||||||
BRAZIL — 1.6% | |||||||||||
Petroleo Brasileiro SA ADR 44.53% | 4,771,042 | $ | 44,322,980 | ||||||||
Raizen SA 4.61% | 38,778,110 | 27,383,740 | |||||||||
71,706,720 | |||||||||||
SOUTH KOREA — 1.7% | |||||||||||
Samsung Electronics Co., Ltd. 2.02% | 1,860,196 | 74,544,299 | |||||||||
Total Preferred Stocks | |||||||||||
(cost $151,817,733) | 146,251,019 | ||||||||||
TOTAL INVESTMENTS — 99.4% | |||||||||||
(cost $4,553,798,664) | $ | 4,374,971,771 | |||||||||
Other assets less liabilities — 0.6% | 28,068,122 | ||||||||||
NET ASSETS — 100.0% | $ | 4,403,039,893 | |||||||||
(a) Amount rounds to less than 0.1%.
(b) Investment was valued using significant unobservable inputs.
* Non-income producing security.
ADR — American Depositary Receipt
GDR — Global Depositary Receipt
Reg S — Regulation S ("Reg S") under the Securities Act of 1933, as amended ("1933 Act"), is a safe harbor that defines when an offering of securities will be deemed to come to rest abroad and therefore is not subject to the registration obligations imposed under Section 5 of the 1933 Act. The regulation includes two safe harbor provisions: an issuer safe harbor and a resale safe harbor. In each case, the regulation demands that offers and sales of the securities be made outside the United States and that no offering participant (which includes the issuer, the banks assisting with the offer and their respective affiliates) engage in "directed" selling efforts. In the case of issuers for whose securities there is substantial U.S. market interest, the regulation also requires that no offers and sales be made to U.S. persons (including U.S. persons physically located outside the United States). These securities have been deemed liquid under procedures approved by the Fund's Board of Trustees. At December 31, 2022, the net value of these securities was $0 representing 0.0% of net assets.
This report classifies issuers geographically by their country of risk. For compliance monitoring purposes, the Manager retains discretion to consider a number of factors in determining where a particular issuer is located, as described in further detail in each Fund's prospectus.
Fair Value Measurement
The following is a summary of the inputs used as of December 31, 2022 in valuing the Fund's investments carried at fair value:
Investments in Securities | Level 1 | Level 2 | Level 3 | Total | |||||||||||||||
| Common Stocks ** | $ | 875,348,164 | $ | 3,353,372,588 | $ | 0 | $ | 4,228,720,752 | |||||||||||
| Preferred Stocks ** | 44,322,980 | 101,928,039 | — | 146,251,019 | |||||||||||||||
Total | $ | 919,671,144 | $ | 3,455,300,627 | $ | 0 | $ | 4,374,971,771 | |||||||||||
** Refer to Portfolio of Investments for further detail.
The accompanying notes are an integral part of the financial statements.
97
Portfolio of Investments
Annual Report December 31, 2022
December 31, 2022
Baillie Gifford Emerging Markets Equities Fund
The following is a reconciliation of the Fund's Level 3 investments for which significant unobservable inputs were used in determining value:
Balance at December 31, 2021 | $ | 16,708,210 | |||||
Purchases | 4,458,290 | ||||||
Sales | (8,108,606 | ) | |||||
Realized (loss) | (64,688,597 | ) | |||||
Change in unrealized (loss) | (392,241,042 | ) | |||||
Transfers into Level 3 | 460,579,955 | ||||||
Transfers out of Level 3 | (16,708,210 | ) | |||||
Balance at December 31, 2022 | $ | 0 | |||||
Change in unrealized (loss) related to Investments still held at December 31, 2022 | $ | (392,241,042 | ) | ||||
$31,144,834 was transferred out of Level 1 into Level 3 during the year ended December 31, 2022, $429,435,121 was transferred out of Level 2 into Level 3 during the during the year ended December 31, 2022 as a result of the unavailability of a quoted market price in an active market for identical securities and other significant observable inputs. $16,708,210 was transferred out of Level 3 into Level 1 during the year ended December 31, 2022 as a result of the availability of a quoted market price.
Summary of Unobservable Inputs for Level 3 Investments
The ongoing conflict in Russia and Ukraine has led to significant disruption and volatility in the global stock market. This impacted the Fund in terms of suspensions of trading activities on the Russian Stock Exchange as well as suspensions of depositary receipts traded on exchanges outside of Russia. As a result, management made the decision to value several securities at nil and transfer them into Level 3. The impacted securities are as follows:
Magnit PJSC
Magnit PJSC GDR Reg S
MMC Norilsk Nickel PJSC
MMC Norilsk Nickel PJSC ADR
Moscow Exchange MICEX-RTS PJSC
Ozon Holdings PLC ADR
Sberbank of Russia PJSC
The accompanying notes are an integral part of the financial statements.
98
Statement of Assets and Liabilities
Annual Report December 31, 2022
December 31, 2022
Baillie Gifford Emerging Markets Equities Fund
ASSETS | |||||||
Investments, at value (cost $4,553,798,664) | $ | 4,374,971,771 | |||||
Cash | 7,668,436 | ||||||
Foreign cash, at value (cost $159,768) | 159,491 | ||||||
Receivable for investments sold | 26,782,587 | ||||||
Dividends receivable | 19,834,220 | ||||||
Capital shares sold receivable | 7,975,381 | ||||||
Tax reclaims receivable | 240,329 | ||||||
Receivable for India capital gains tax refunds (Note A) | 1,176,756 | ||||||
Prepaid assets | 27,764 | ||||||
Total Assets | 4,438,836,735 | ||||||
LIABILITIES | |||||||
Advisory fee payable | 5,749,885 | ||||||
Capital shares purchased payable | 14,278,763 | ||||||
Deferred India capital gains tax liability (Note A) | 12,895,261 | ||||||
Administration & Supervisory fee payable | 1,183,728 | ||||||
Shareholder Servicing fee payable | 161,005 | ||||||
Trustee fee payable | 49,913 | ||||||
Commitment fee payable | 16,697 | ||||||
Accrued expenses | 1,461,590 | ||||||
Total Liabilities | 35,796,842 | ||||||
NET ASSETS | $ | 4,403,039,893 | |||||
COMPOSITION OF NET ASSETS | |||||||
Paid-in capital | $ | 4,931,551,747 | |||||
Total accumulated loss | (528,511,854 | ) | |||||
$ | 4,403,039,893 | ||||||
NET ASSET VALUE, PER SHARE | |||||||
| Class 2 ($51,848,273 / 3,027,568 shares outstanding), unlimited authorized, no par value | $ | 17.13 | |||||
| Class 3 ($214,703,660 / 12,425,359 shares outstanding), unlimited authorized, no par value | $ | 17.28 | |||||
| Class 4 ($186,171,408 / 10,613,488 shares outstanding), unlimited authorized, no par value | $ | 17.54 | |||||
| Class 5 ($1,162,456,960 / 65,302,048 shares outstanding), unlimited authorized, no par value | $ | 17.80 | |||||
| Class K ($1,949,585,731 / 114,385,842 shares outstanding), unlimited authorized, no par value | $ | 17.04 | |||||
| Institutional Class ($838,273,861 / 49,186,626 shares outstanding), unlimited authorized, no par value | $ | 17.04 | |||||
The accompanying notes are an integral part of the financial statements.
99
Statement of Operations
Annual Report December 31, 2022
For the Year Ended December 31, 2022
Baillie Gifford Emerging Markets Equities Fund
INVESTMENT INCOME | |||||||
Dividends (net of foreign withholding taxes of $15,954,659) | $ | 233,082,938 | |||||
Interest | 206,944 | ||||||
Total Investment Income | 233,289,882 | ||||||
EXPENSES | |||||||
Advisory fee (Note B) | 25,895,390 | ||||||
Shareholder Servicing fees — Class 2 shares (Note B) | 93,385 | ||||||
Shareholder Servicing fees — Class 3 shares (Note B) | 231,833 | ||||||
Shareholder Servicing fees — Class 4 shares (Note B) | 140,695 | ||||||
Shareholder Servicing fees — Class 5 shares (Note B) | 261,149 | ||||||
Administration & Supervisory fee — Class K shares (Note B) | 3,689,036 | ||||||
Administration & Supervisory fee — Institutional Class shares (Note B) | 1,643,035 | ||||||
Transfer agency | 236,418 | ||||||
Sub-transfer agency — Institutional Class shares | 838,106 | ||||||
Custody | 2,756,087 | ||||||
Fund accounting | 1,723,251 | ||||||
Legal | 900,422 | ||||||
Trustees' fees | 201,121 | ||||||
Registration fees | 187,194 | ||||||
Commitment fees | 66,242 | ||||||
Professional fees | 60,144 | ||||||
Line of Credit Interest | 944 | ||||||
Miscellaneous | 265,552 | ||||||
Total Expenses | 39,190,004 | ||||||
Net Investment Income | 194,099,878 | ||||||
| REALIZED AND UNREALIZED (LOSS) ON INVESTMENTS AND FOREIGN CURRENCY TRANSACTIONS | |||||||
Net realized (loss) from: | |||||||
Investments (net of India capital gains tax expense of $3,680,083) | (176,707,131 | ) | |||||
Foreign currency transactions | (399,425 | ) | |||||
(177,106,556 | ) | ||||||
Net change in unrealized (depreciation) on: | |||||||
Investments (net of change in deferred India capital gains tax liability of $17,183,305) (Note A) | (1,677,352,036 | ) | |||||
Translation of net assets and liabilities denominated in foreign currencies | (8,722 | ) | |||||
(1,677,360,758 | ) | ||||||
Net realized and unrealized (loss) | (1,854,467,314 | ) | |||||
NET (DECREASE) IN NET ASSETS FROM OPERATIONS | $ | (1,660,367,436 | ) | ||||
The accompanying notes are an integral part of the financial statements.
100
Statements of Changes in Net Assets
Annual Report December 31, 2022
Baillie Gifford Emerging Markets Equities Fund
| For the Year Ended December 31, 2022 | For the Year Ended December 31, 2021 | ||||||||||
INCREASE (DECREASE) IN NET ASSETS FROM OPERATIONS | |||||||||||
Net investment income | $ | 194,099,878 | $ | 106,527,091 | |||||||
Net realized gain (loss) | (177,106,556 | ) | 153,496,653 | ||||||||
Net change in unrealized (depreciation) | (1,677,360,758 | ) | (883,496,915 | ) | |||||||
Net (Decrease) in Net Assets from Operations | (1,660,367,436 | ) | (623,473,171 | ) | |||||||
DIVIDENDS AND DISTRIBUTIONS TO SHAREHOLDERS FROM: | |||||||||||
Distributable earnings | |||||||||||
Class 2 | (2,673,322 | ) | (1,803,685 | ) | |||||||
Class 3 | (11,120,134 | ) | (8,340,251 | ) | |||||||
Class 4 | (9,560,421 | ) | (7,173,573 | ) | |||||||
Class 5 | (59,441,029 | ) | (49,817,720 | ) | |||||||
Class K | (103,143,708 | ) | (75,297,311 | ) | |||||||
Institutional Class | (43,187,502 | ) | (32,956,981 | ) | |||||||
Total Distributions to Shareholders | (229,126,116 | ) | (175,389,521 | ) | |||||||
TRANSACTIONS IN SHARES OF BENEFICIAL INTEREST | |||||||||||
Net proceeds from shares subscribed: | |||||||||||
Class 2 | 3,592,367 | * | 90,006,000 | ||||||||
Class 3 | — | 16,0385,840 | * | ||||||||
Class 5 | 5,000,000 | 166,800,000 | |||||||||
Class K | 649,159,308 | * | 1,143,888,868 | ||||||||
Institutional Class | 529,206,581 | 524,250,455 | |||||||||
Dividends reinvested: | |||||||||||
Class 2 | 2,673,322 | 1,803,685 | |||||||||
Class 3 | 11,120,134 | 8,340,251 | |||||||||
Class 4 | 9,560,421 | 7,173,573 | |||||||||
Class 5 | 59,441,029 | 49,817,720 | |||||||||
Class K | 82,369,239 | 62,411,077 | |||||||||
Institutional Class | 42,294,883 | 32,461,628 | |||||||||
Cost of shares redeemed: | |||||||||||
Class 2 | (80,000 | ) | (160,385,840 | )* | |||||||
Class 3 | — | (5,000,000 | ) | ||||||||
Class 5 | (144,626,367 | )* | (227,640,000 | ) | |||||||
Class K | (613,627,474 | ) | (635,251,719 | ) | |||||||
Institutional Class | (558,503,670 | )* | (416,430,456 | ) | |||||||
Increase in Net Assets from Transactions in Shares of Beneficial Interest | 77,579,773 | 802,631,082 | |||||||||
Total Increase (Decrease) in Net Assets | (1,811,913,779 | ) | 3,768,390 | ||||||||
NET ASSETS | |||||||||||
Beginning of Year | 6,214,953,672 | 6,211,185,282 | |||||||||
End of Year | $ | 4,403,039,893 | $ | 6,214,953,672 | |||||||
* See Note D for details of share class conversions.
The accompanying notes are an integral part of the financial statements.
101
Financial Highlights
Annual Report December 31, 2022
Baillie Gifford Emerging Markets Equities Fund
Selected data for a Class 2 share outstanding throughout each year:
| For the Year Ended December 31, 2022 | For the Year Ended December 31, 2021 | For the Year Ended December 31, 2020 | For the Year Ended December 31, 2019 | For the Year Ended December 31, 2018 | |||||||||||||||||||
Net asset value, beginning of year | $ | 24.55 | $ | 27.66 | $ | 21.71 | $ | 17.62 | $ | 22.82 | |||||||||||||
From Investment Operations | |||||||||||||||||||||||
Net investment income(a) | 0.77 | 0.34 | 0.19 | 0.63 | 0.28 | ||||||||||||||||||
| Net realized and unrealized gain (loss) on investments and foreign currency | (7.26 | ) | (2.76 | ) | 6.11 | 4.30 | (3.70 | ) | |||||||||||||||
| Net increase (decrease) in net asset value from investment operations | (6.49 | ) | (2.42 | ) | 6.30 | 4.93 | (3.42 | ) | |||||||||||||||
Dividends and Distributions to Shareholders | |||||||||||||||||||||||
From net investment income | (0.93 | ) | (0.33 | ) | (0.35 | ) | (0.65 | ) | (0.23 | ) | |||||||||||||
From net realized gain on investments | — | (0.36 | ) | — | (0.19 | ) | (1.55 | ) | |||||||||||||||
Total dividends and distributions | (0.93 | ) | (0.69 | ) | (0.35 | ) | (0.84 | ) | (1.78 | ) | |||||||||||||
Net asset value, end of year | $ | 17.13 | $ | 24.55 | $ | 27.66 | $ | 21.71 | $ | 17.62 | |||||||||||||
Total Return | |||||||||||||||||||||||
Total return based on net asset value(b) | (26.44 | )% | (8.75 | )% | 29.06 | % | 28.00 | % | (14.92 | )% | |||||||||||||
Ratios/Supplemental Data | |||||||||||||||||||||||
Net assets, end of year (000's omitted) | $ | 51,848 | $ | 66,301 | $ | 144,906 | $ | 118,856 | $ | 191,177 | |||||||||||||
Ratio of net expenses to average net assets | 0.83 | % | 0.78 | % | 0.80 | % | 0.83 | % | 0.84 | % | |||||||||||||
Ratio of net investment income to average net assets | 3.96 | % | 1.20 | % | 0.90 | % | 3.29 | %(c) | 1.31 | % | |||||||||||||
Portfolio turnover rate(d) | 15 | % | 19 | % | 24 | % | 15 | % | 22 | % | |||||||||||||
(a) Calculated based upon average shares outstanding during the period.
(b) Total investment return is calculated assuming an initial investment made at the net asset value at the beginning of the period, reinvestment of all dividends and distributions, if any, at net asset value during the period, and redemption on the last day of the period.
(c) Large increase due to taxable stock dividends that were treated as income.
(d) Portfolio turnover rate calculated at Fund level.
The accompanying notes are an integral part of the financial statements.
102
Financial Highlights
Annual Report December 31, 2022
Baillie Gifford Emerging Markets Equities Fund
Selected data for a Class 3 share outstanding throughout each year:
| For the Year Ended December 31, 2022 | For the Year Ended December 31, 2021 | For the Year Ended December 31, 2020 | For the Year Ended December 31, 2019 | For the Year Ended December 31, 2018 | |||||||||||||||||||
Net asset value, beginning of year | $ | 24.76 | $ | 27.92 | $ | 21.91 | $ | 17.77 | $ | 23.00 | |||||||||||||
From Investment Operations | |||||||||||||||||||||||
Net investment income(a) | 0.78 | 0.50 | 0.20 | 0.71 | 0.29 | ||||||||||||||||||
| Net realized and unrealized gain (loss) on investments and foreign currency | (7.32 | ) | (2.93 | ) | 6.18 | 4.29 | (3.72 | ) | |||||||||||||||
| Net increase (decrease) in net asset value from investment operations | (6.54 | ) | (2.43 | ) | 6.38 | 5.00 | (3.43 | ) | |||||||||||||||
Dividends and Distributions to Shareholders | |||||||||||||||||||||||
From net investment income | (0.94 | ) | (0.37 | ) | (0.37 | ) | (0.67 | ) | (0.25 | ) | |||||||||||||
From net realized gain on investments | — | (0.36 | ) | — | (0.19 | ) | (1.55 | ) | |||||||||||||||
Total dividends and distributions | (0.94 | ) | (0.73 | ) | (0.37 | ) | (0.86 | ) | (1.80 | ) | |||||||||||||
Net asset value, end of year | $ | 17.28 | $ | 24.76 | $ | 27.92 | $ | 21.91 | $ | 17.77 | |||||||||||||
Total Return | |||||||||||||||||||||||
Total return based on net asset value(b) | (26.39 | )% | (8.68 | )% | 29.15 | % | 28.09 | % | (14.86 | )% | |||||||||||||
Ratios/Supplemental Data | |||||||||||||||||||||||
Net assets, end of year (000's omitted) | $ | 214,704 | $ | 291,674 | $ | 168,460 | $ | 344,702 | $ | 167,268 | |||||||||||||
Ratio of net expenses to average net assets | 0.76 | % | 0.71 | % | 0.73 | % | 0.76 | % | 0.77 | % | |||||||||||||
Ratio of net investment income to average net assets | 3.97 | % | 1.79 | % | 0.95 | % | 3.45 | %(c) | 1.33 | % | |||||||||||||
Portfolio turnover rate(d) | 15 | % | 19 | % | 24 | % | 15 | % | 22 | % | |||||||||||||
(a) Calculated based upon average shares outstanding during the period.
(b) Total investment return is calculated assuming an initial investment made at the net asset value at the beginning of the period, reinvestment of all dividends and distributions, if any, at net asset value during the period, and redemption on the last day of the period.
(c) Large increase due to taxable stock dividends that were treated as income.
(d) Portfolio turnover rate calculated at Fund level.
The accompanying notes are an integral part of the financial statements.
103
Financial Highlights
Annual Report December 31, 2022
Baillie Gifford Emerging Markets Equities Fund
Selected data for a Class 4 share outstanding throughout each year:
| For the Year Ended December 31, 2022 | For the Year Ended December 31, 2021 | For the Period January 10, 2020(a) through December 31, 2020 | For the Period January 1, 2016 through October 10, 2016(a) | For the Period November 2, 2015(b) through December 31, 2015 | |||||||||||||||||||
Net asset value, beginning of period | $ | 25.11 | $ | 28.30 | $ | 22.69 | $ | 15.12 | $ | 15.40 | |||||||||||||
From Investment Operations | |||||||||||||||||||||||
Net investment income(c) | 0.80 | 0.47 | 0.22 | 0.11 | 0.02 | ||||||||||||||||||
| Net realized and unrealized gain (loss) on investments and foreign currency | (7.42 | ) | (2.93 | ) | 5.76 | 1.69 | (0.28 | ) | |||||||||||||||
| Net increase (decrease) in net asset value from investment operations | (6.62 | ) | (2.46 | ) | 5.98 | 1.80 | (0.26 | ) | |||||||||||||||
Dividends and Distributions to Shareholders | |||||||||||||||||||||||
From net investment income | (0.95 | ) | (0.37 | ) | (0.37 | ) | — | (0.06 | ) | ||||||||||||||
From net realized gain on investments | — | (0.36 | ) | — | — | (0.00 | )(d) | ||||||||||||||||
Total dividends and distributions | (0.95 | ) | (0.73 | ) | (0.37 | ) | — | (0.06 | ) | ||||||||||||||
| Proceeds from Purchase Fees and Redemption Fees(c) | — | — | — | 0.01 | 0.04 | ||||||||||||||||||
Net asset value, end of period | $ | 17.54 | $ | 25.11 | $ | 28.30 | 16.93 | 15.12 | |||||||||||||||
Total Return | |||||||||||||||||||||||
Total return based on net asset value(e) | (26.37 | )% | (8.66 | )% | 26.45 | % | 12.04 | % | (1.40 | )% | |||||||||||||
Ratios/Supplemental Data | |||||||||||||||||||||||
Net assets, end of year (000's omitted) | $ | 186,171 | $ | 252,837 | $ | 276,791 | $ | 110,086 | $ | 98,273 | |||||||||||||
Ratio of net expenses to average net assets | 0.73 | % | 0.68 | % | 0.70 | %* | 0.73 | %* | 0.76 | %* | |||||||||||||
Ratio of net investment income to average net assets | 4.00 | % | 1.64 | % | 1.05 | %* | 1.29 | %* | 0.88 | %* | |||||||||||||
Portfolio turnover rate(g) | 15 | % | 19 | % | 24 | % | 24 | % | 46 | % | |||||||||||||
* Annualized.
(a) Recommencement of investment operations. Class had no shareholders from October 10, 2016 to January 9, 2020. All shares of this class were redeemed on October 10, 2016 at $16.93. New shares were issued at $22.69 on January 10, 2020
(b) Commencement of investment operations.
(c) Calculated based upon average shares outstanding during the period.
(d) Amount is less than $0.005 per share.
(e) Total investment return is calculated assuming an initial investment made at the net asset value at the beginning of the period, reinvestment of all dividends and distributions, if any, at net asset value during the period, and redemption on the last day of the period. Total return is not annualized for periods less than one year.
(f) Large increase due to taxable stock dividends that were treated as income.
(g) Portfolio turnover rate calculated at Fund level. Portfolio turnover is not annualized for periods less than one year.
The accompanying notes are an integral part of the financial statements.
104
Financial Highlights
Annual Report December 31, 2022
Baillie Gifford Emerging Markets Equities Fund
Selected data for a Class 5 share outstanding throughout each year:
| For the Year Ended December 31, 2022 | For the Year Ended December 31, 2021 | For the Year Ended December 31, 2020 | For the Year Ended December 31, 2019 | For the Year Ended December 31, 2018 | |||||||||||||||||||
Net asset value, beginning of year | $ | 25.47 | $ | 28.69 | $ | 22.50 | $ | 18.23 | $ | 23.55 | |||||||||||||
From Investment Operations | |||||||||||||||||||||||
Net investment income(a) | 0.82 | 0.49 | 0.24 | 0.72 | 0.31 | ||||||||||||||||||
| Net realized and unrealized gain (loss) on investments and foreign currency | (7.53 | ) | (2.96 | ) | 6.33 | 4.42 | (3.81 | ) | |||||||||||||||
| Net increase (decrease) in net asset value from investment operations | (6.71 | ) | (2.47 | ) | 6.57 | 5.14 | (3.50 | ) | |||||||||||||||
Dividends and Distributions to Shareholders | |||||||||||||||||||||||
From net investment income | (0.96 | ) | (0.39 | ) | (0.38 | ) | (0.68 | ) | (0.27 | ) | |||||||||||||
From net realized gain on investments | — | (0.36 | ) | — | (0.19 | ) | (1.55 | ) | |||||||||||||||
Total dividends and distributions | (0.96 | ) | (0.75 | ) | (0.38 | ) | (0.87 | ) | (1.82 | ) | |||||||||||||
Net asset value, end of year | $ | 17.80 | $ | 25.47 | $ | 28.69 | $ | 22.50 | $ | 18.23 | |||||||||||||
Total Return | |||||||||||||||||||||||
Total return based on net asset value(b) | (26.33 | )% | (8.61 | )% | 29.25 | % | 28.19 | % | (14.80 | )% | |||||||||||||
Ratios/Supplemental Data | |||||||||||||||||||||||
Net assets, end of year (000's omitted) | $ | 1,162,457 | $ | 1,746,589 | $ | 1,953,356 | $ | 1,331,946 | $ | 1,063,434 | |||||||||||||
Ratio of net expenses to average net assets | 0.68 | % | 0.63 | % | 0.65 | % | 0.68 | % | 0.69 | % | |||||||||||||
Ratio of net investment income to average net assets | 4.01 | % | 1.68 | % | 1.08 | % | 3.47 | %(c) | 1.41 | % | |||||||||||||
Portfolio turnover rate(d) | 15 | % | 19 | % | 24 | % | 15 | % | 22 | % | |||||||||||||
(a) Calculated based upon average shares outstanding during the period.
(b) Total investment return is calculated assuming an initial investment made at the net asset value at the beginning of the period, reinvestment of all dividends and distributions, if any, at net asset value during the period, and redemption on the last day of the period.
(c) Large increase due to taxable stock dividends that were treated as income.
(d) Portfolio turnover rate calculated at Fund level.
The accompanying notes are an integral part of the financial statements.
105
Financial Highlights
Annual Report December 31, 2022
Baillie Gifford Emerging Markets Equities Fund
Selected data for a Class K share outstanding throughout each year:
| For the Year Ended December 31, 2022 | For the Year Ended December 31, 2021 | For the Year Ended December 31, 2020 | For the Year Ended December 31, 2019 | For the Year Ended December 31, 2018 | |||||||||||||||||||
Net asset value, beginning of year | $ | 24.44 | $ | 27.56 | $ | 21.64 | $ | 17.57 | $ | 22.79 | |||||||||||||
From Investment Operations | |||||||||||||||||||||||
Net investment income(a) | 0.76 | 0.44 | 0.20 | 0.71 | 0.34 | ||||||||||||||||||
| Net realized and unrealized gain (loss) on investments and foreign currency | (7.23 | ) | (2.85 | ) | 6.08 | 4.21 | (3.75 | ) | |||||||||||||||
| Net increase (decrease) in net asset value from investment operations | (6.47 | ) | (2.41 | ) | 6.28 | 4.92 | (3.41 | ) | |||||||||||||||
Dividends and Distributions to Shareholders | |||||||||||||||||||||||
From net investment income | (0.93 | ) | (0.35 | ) | (0.36 | ) | (0.66 | ) | (0.26 | ) | |||||||||||||
From net realized gain on investments | — | (0.36 | ) | — | (0.19 | ) | (1.55 | ) | |||||||||||||||
Total dividends and distributions | (0.93 | ) | (0.71 | ) | (0.36 | ) | (0.85 | ) | (1.81 | ) | |||||||||||||
Net asset value, end of year | $ | 17.04 | $ | 24.44 | $ | 27.56 | $ | 21.64 | $ | 17.57 | |||||||||||||
Total Return | |||||||||||||||||||||||
Total return based on net asset value(b) | (26.47 | )% | (8.72 | )% | 29.04 | % | 28.00 | % | (14.91 | )% | |||||||||||||
Ratios/Supplemental Data | |||||||||||||||||||||||
Net assets, end of year (000's omitted) | $ | 1,949,586 | $ | 2,654,520 | $ | 2,441,338 | $ | 1,328,535 | $ | 499,172 | |||||||||||||
Ratio of net expenses to average net assets | 0.83 | % | 0.78 | % | 0.80 | % | 0.83 | % | 0.84 | % | |||||||||||||
Ratio of net investment income to average net assets | 3.94 | % | 1.58 | % | 0.95 | % | 3.55 | %(c) | 1.65 | % | |||||||||||||
Portfolio turnover rate(d) | 15 | % | 19 | % | 24 | % | 15 | % | 22 | % | |||||||||||||
(a) Calculated based upon average shares outstanding during the period.
(b) Total investment return is calculated assuming an initial investment made at the net asset value at the beginning of the period, reinvestment of all dividends and distributions, if any, at net asset value during the period, and redemption on the last day of the period.
(c) Large increase due to taxable stock dividends that were treated as income.
(d) Portfolio turnover rate calculated at Fund level.
The accompanying notes are an integral part of the financial statements.
106
Financial Highlights
Annual Report December 31, 2022
Baillie Gifford Emerging Markets Equities Fund
Selected data for an Institutional Class share outstanding throughout each year:
| For the Year Ended December 31, 2022 | For the Year Ended December 31, 2021 | For the Year Ended December 31, 2020 | For the Year Ended December 31, 2019 | For the Year Ended December 31, 2018 | |||||||||||||||||||
Net asset value, beginning of year | $ | 24.43 | $ | 27.55 | $ | 21.64 | $ | 17.56 | $ | 22.80 | |||||||||||||
From Investment Operations | |||||||||||||||||||||||
Net investment income(a) | 0.74 | 0.41 | 0.18 | 0.79 | 0.11 | ||||||||||||||||||
| Net realized and unrealized gain (loss) on investments and foreign currency | (7.22 | ) | (2.85 | ) | 6.07 | 4.12 | (3.54 | ) | |||||||||||||||
| Net increase (decrease) in net asset value from investment operations | (6.48 | ) | (2.44 | ) | 6.25 | 4.91 | (3.43 | ) | |||||||||||||||
Dividends and Distributions to Shareholders | |||||||||||||||||||||||
From net investment income | (0.91 | ) | (0.32 | ) | (0.34 | ) | (0.64 | ) | (0.26 | ) | |||||||||||||
From net realized gain on investments | — | (0.36 | ) | — | (0.19 | ) | (1.55 | ) | |||||||||||||||
Total dividends and distributions | (0.91 | ) | (0.68 | ) | (0.34 | ) | (0.83 | ) | (1.81 | ) | |||||||||||||
Net asset value, end of year | $ | 17.04 | $ | 24.43 | $ | 27.55 | $ | 21.64 | $ | 17.56 | |||||||||||||
Total Return | |||||||||||||||||||||||
Total return based on net asset value(b) | (26.52 | )% | (8.82 | )% | 28.91 | % | 27.94 | % | (14.98 | )% | |||||||||||||
Ratios/Supplemental Data | |||||||||||||||||||||||
Net assets, end of year (000's omitted) | $ | 838,274 | $ | 1,203,032 | $ | 1,226,335 | $ | 663,593 | $ | 255,795 | |||||||||||||
Ratio of net expenses to average net assets | 0.91 | % | 0.87 | % | 0.89 | % | 0.92 | % | 0.95 | % | |||||||||||||
Ratio of net investment income to average net assets | 3.81 | % | 1.46 | % | 0.86 | % | 3.81 | %(c) | 0.68 | % | |||||||||||||
Portfolio turnover rate(d) | 15 | % | 19 | % | 24 | % | 15 | % | 22 | % | |||||||||||||
(a) Calculated based upon average shares outstanding during the period.
(b) Total investment return is calculated assuming an initial investment made at the net asset value at the beginning of the period, reinvestment of all dividends and distributions, if any, at net asset value during the period, and redemption on the last day of the period.
(c) Large increase due to taxable stock dividends that were treated as income.
(d) Portfolio turnover rate calculated at Fund level.
The accompanying notes are an integral part of the financial statements.
107
Industry Diversification Table
Annual Report December 31, 2022
December 31, 2022
Baillie Gifford Emerging Markets ex China Fund
Value | % of Total Net Assets | ||||||||||
Airlines | $ | 8,816 | 1.2 | % | |||||||
Auto Manufacturers | 13,045 | 1.7 | |||||||||
Auto Parts & Equipment | 3,140 | 0.4 | |||||||||
Banks | 149,896 | 20.0 | |||||||||
Building Materials | 8,505 | 1.1 | |||||||||
Chemicals | 14,803 | 2.0 | |||||||||
Commercial Services | 2,211 | 0.3 | |||||||||
Computers | 33,111 | 4.4 | |||||||||
Diversified Financial Services | 21,205 | 2.9 | |||||||||
Electronics | 5,498 | 0.7 | |||||||||
Food | 0 | 0.0 | |||||||||
Gas | 3,178 | 0.4 | |||||||||
Internet | 74,901 | 10.0 | |||||||||
Iron/Steel | 10,980 | 1.5 | |||||||||
Leisure Time | 5,420 | 0.7 | |||||||||
Machinery — Construction & Mining | 4,515 | 0.6 | |||||||||
Mining | 53,658 | 7.2 | |||||||||
Oil & Gas | 104,781 | 13.9 | |||||||||
Retail | 15,882 | 2.1 | |||||||||
Semiconductors | 175,475 | 23.4 | |||||||||
Telecommunications | 21,129 | 2.8 | |||||||||
Total Value of Investments | 730,149 | 97.3 | |||||||||
Other assets less liabilities | 20,174 | 2.7 | |||||||||
Net Assets | $ | 750,323 | 100.0 | % | |||||||
The table above is based on Bloomberg Industry Group classifications. For compliance monitoring purposes, sub-industry classifications are used which results in less concentration across industry sectors.
108
Portfolio of Investments
Annual Report December 31, 2022
December 31, 2022
Baillie Gifford Emerging Markets ex China Fund
Shares | Value | ||||||||||
COMMON STOCKS — 94.3% | |||||||||||
BRAZIL — 12.3% | |||||||||||
B3 SA — Brasil Bolsa Balcao | 6,200 | $ | 15,492 | ||||||||
Banco Bradesco SA ADR | 2,839 | 8,176 | |||||||||
| MercadoLibre, Inc. * | 30 | 25,387 | |||||||||
| NU Holdings Ltd., Class A * | 757 | 3,081 | |||||||||
Petroleo Brasileiro SA ADR | 2,762 | 29,415 | |||||||||
Vale SA ADR | 647 | 10,980 | |||||||||
92,531 | |||||||||||
CANADA — 1.5% | |||||||||||
| Ivanhoe Mines Ltd., Class A * | 1,400 | 11,064 | |||||||||
CHILE — 1.3% | |||||||||||
Lundin Mining Corp. | 1,561 | 9,580 | |||||||||
INDIA — 20.2% | |||||||||||
HDFC Bank Ltd. ADR | 707 | 48,366 | |||||||||
ICICI Bank Ltd. ADR | 1,232 | 26,968 | |||||||||
Infosys Ltd. ADR | 1,244 | 22,404 | |||||||||
Reliance Industries Ltd. GDR | 874 | 53,615 | |||||||||
151,353 | |||||||||||
INDONESIA — 4.2% | |||||||||||
Bank Mandiri Persero Tbk PT | 13,600 | 8,673 | |||||||||
Bank Rakyat Indonesia Persero Tbk PT | 53,700 | 17,025 | |||||||||
| Vale Indonesia Tbk PT * | 13,100 | 5,959 | |||||||||
31,657 | |||||||||||
MEXICO — 6.1% | |||||||||||
| Cemex SAB de CV, Participating Certificates ADR * | 2,100 | 8,505 | |||||||||
Grupo Financiero Banorte SAB de CV, Class O | 3,014 | 21,691 | |||||||||
Wal-Mart de Mexico SAB de CV | 4,493 | 15,882 | |||||||||
46,078 | |||||||||||
PANAMA — 1.2% | |||||||||||
| Copa Holdings SA, Class A * | 106 | 8,816 | |||||||||
The accompanying notes are an integral part of the financial statements.
109
Portfolio of Investments
Annual Report December 31, 2022
December 31, 2022
Baillie Gifford Emerging Markets ex China Fund
Shares | Value | ||||||||||
PERU — 1.5% | |||||||||||
Credicorp Ltd. | 81 | $ | 10,989 | ||||||||
POLAND — 1.5% | |||||||||||
| Allegro.eu SA * | 892 | 5,148 | |||||||||
KGHM Polska Miedz SA | 224 | 6,516 | |||||||||
11,664 | |||||||||||
RUSSIA — 0.0% (a) | |||||||||||
| Magnit PJSC *(b) | 87 | 0 | |||||||||
MMC Norilsk Nickel PJSC (b) | 94 | 0 | |||||||||
MMC Norilsk Nickel PJSC ADR (b) | 6 | 0 | |||||||||
| Moscow Exchange MICEX-RTS PJSC *(b) | 2,760 | 0 | |||||||||
| Ozon Holdings PLC ADR *(b) | 142 | 0 | |||||||||
| Sberbank of Russia PJSC *(b) | 5,512 | 0 | |||||||||
0 | |||||||||||
SAUDI ARABIA — 0.8% | |||||||||||
Saudi Tadawul Group Holding Co. | 118 | 5,714 | |||||||||
SINGAPORE — 0.8% | |||||||||||
| Sea Ltd. ADR * | 115 | 5,983 | |||||||||
SOUTH AFRICA — 3.5% | |||||||||||
FirstRand Ltd. | 1,356 | 4,926 | |||||||||
Naspers Ltd., N Shares | 130 | 21,724 | |||||||||
26,650 | |||||||||||
SOUTH KOREA — 17.8% | |||||||||||
| Coupang, Inc. * | 435 | 6,399 | |||||||||
Doosan Bobcat, Inc. | 165 | 4,515 | |||||||||
Hanon Systems | 489 | 3,140 | |||||||||
Hyundai Motor Co. | 109 | 13,045 | |||||||||
| Koh Young Technology, Inc. * | 542 | 5,498 | |||||||||
| LG Chem Ltd. * | 31 | 14,803 | |||||||||
NAVER Corp. | 42 | 5,973 | |||||||||
| NCSoft Corp. * | 12 | 4,287 | |||||||||
Samsung Electronics Co., Ltd. | 976 | 42,840 | |||||||||
Samsung SDI Co., Ltd. | 45 | 21,129 | |||||||||
SK Hynix, Inc. | 204 | 12,172 | |||||||||
133,801 | |||||||||||
The accompanying notes are an integral part of the financial statements.
110
Portfolio of Investments
Annual Report December 31, 2022
December 31, 2022
Baillie Gifford Emerging Markets ex China Fund
Shares | Value | ||||||||||
TAIWAN — 16.5% | |||||||||||
Advantech Co., Ltd. | 1,000 | $ | 10,707 | ||||||||
MediaTek, Inc. | 1,000 | 20,219 | |||||||||
Merida Industry Co., Ltd. | 1,000 | 5,420 | |||||||||
Taiwan Semiconductor Manufacturing Co., Ltd. | 6,000 | 87,141 | |||||||||
123,487 | |||||||||||
THAILAND — 2.1% | |||||||||||
PTT Exploration & Production PCL | 3,100 | 15,787 | |||||||||
URUGUAY — 0.3% | |||||||||||
| Dlocal Ltd. * | 142 | 2,211 | |||||||||
ZAMBIA — 2.7% | |||||||||||
First Quantum Minerals Ltd. | 983 | 20,538 | |||||||||
Total Common Stocks | |||||||||||
(cost $964,408) | 707,903 | ||||||||||
PREFERRED STOCKS — 3.0% | |||||||||||
BRAZIL — 1.2% | |||||||||||
Petroleo Brasileiro SA ADR 44.54% | 642 | 5,964 | |||||||||
Raizen SA 4.61% | 4,500 | 3,178 | |||||||||
9,142 | |||||||||||
SOUTH KOREA — 1.8% | |||||||||||
Samsung Electronics Co., Ltd. 2.02% | 327 | 13,104 | |||||||||
Total Preferred Stocks | |||||||||||
(cost $31,398) | 22,246 | ||||||||||
TOTAL INVESTMENTS — 97.3% | |||||||||||
(cost $995,806) | $ | 730,149 | |||||||||
Other assets less liabilities — 2.7% | 20,174 | ||||||||||
NET ASSETS — 100.0% | $ | 750,323 | |||||||||
(a) Amount rounds to less than 0.1%.
(b) Investment was valued using significant unobservable inputs.
* Non-income producing security.
ADR — American Depositary Receipt
GDR — Global Depositary Receipt
This report classifies issuers geographically by their country of risk. For compliance monitoring purposes, the Manager retains discretion to consider a number of factors in determining where a particular issuer is located, as described in further detail in each Fund's prospectus.
The accompanying notes are an integral part of the financial statements.
111
Portfolio of Investments
Annual Report December 31, 2022
December 31, 2022
Baillie Gifford Emerging Markets ex China Fund
Fair Value Measurement
The following is a summary of the inputs used as of December 31, 2022 in valuing the Fund's investments carried at fair value:
Investments in Securities | Level 1 | Level 2 | Level 3 | Total | |||||||||||||||
| Common Stocks ** | $ | 296,435 | $ | 411,468 | $ | 0 | $ | 707,903 | |||||||||||
| Preferred Stocks ** | 5,964 | 16,282 | — | 22,246 | |||||||||||||||
Total | $ | 302,399 | $ | 427,750 | $ | 0 | $ | 730,149 | |||||||||||
** Refer to Portfolio of Investments for further detail.
The following is a reconciliation of the Fund's Level 3 investments for which significant unobservable inputs were used in determining value:
Balance at December 31, 2021 | $ | — | |||||
Purchases | — | ||||||
Sales | (1,098 | ) | |||||
Realized gain (loss) | (12,731 | ) | |||||
Change in unrealized (loss) | (67,853 | ) | |||||
Transfers into Level 3 | 81,682 | ||||||
Transfers out of Level 3 | — | ||||||
Balance at December 31, 2022 | $ | 0 | |||||
Change in unrealized (loss) related to Investments still held at December 31, 2022 | $ | (67,853 | ) | ||||
$4,204 was transferred out of Level 1 into Level 3 during the year ended December 31, 2022, $77,478 was transferred out of Level 2 into Level 3 during the year ended December 31, 2022.
Summary of Unobservable Inputs for Level 3 Investments
The ongoing conflict in Russia and Ukraine has led to significant disruption and volatility in the global stock market. This impacted the Fund in terms of suspensions of trading activities on the Russian Stock Exchange as well as suspensions of depositary receipts traded on exchanges outside of Russia. As a result, management made the decision to value several securities at nil and transfer them into Level 3. The impacted securities are as follows:
Magnit PJSC
MMC Norilsk Nickel PJSC
MMC Norilsk Nickel PJSC ADR
Moscow Exchange MICEX-RTS
Ozon Holdings PLC ADR
Sberbank of Russia PJSC
The accompanying notes are an integral part of the financial statements.
112
Statement of Assets and Liabilities
Annual Report December 31, 2022
December 31, 2022
Baillie Gifford Emerging Markets ex China Fund
ASSETS | |||||||
Investments, at value (cost $995,806) | $ | 730,149 | |||||
Cash | 38,154 | ||||||
Foreign cash, at value (cost $28) | 29 | ||||||
Due from Manager | 30,247 | ||||||
Dividends receivable | 3,661 | ||||||
Prepaid assets | 22,089 | ||||||
Total Assets | 824,329 | ||||||
LIABILITIES | |||||||
Advisory fee payable | 1,031 | ||||||
Administration & Supervisory fee payable | 318 | ||||||
Trustee fee payable | 9 | ||||||
Commitment fee payable | 3 | ||||||
Accrued expenses | 72,645 | ||||||
Total Liabilities | 74,006 | ||||||
NET ASSETS | $ | 750,323 | |||||
COMPOSITION OF NET ASSETS | |||||||
Paid-in capital | $ | 1,035,709 | |||||
Total accumulated (loss) | (285,386 | ) | |||||
$ | 750,323 | ||||||
NET ASSET VALUE, PER SHARE | |||||||
| Class K ($375,161 / 52,504 shares outstanding), unlimited authorized, no par value | $ | 7.15 | |||||
| Institutional Class ($375,162 / 52,504 shares outstanding), unlimited authorized, no par value | $ | 7.15 | |||||
The accompanying notes are an integral part of the financial statements.
113
Statement of Operations
Annual Report December 31, 2022
For the Year Ended December 31, 2022
Baillie Gifford Emerging Markets ex China Fund
INVESTMENT INCOME | |||||||
Dividends (net of foreign withholding taxes of $3,271) | $ | 41,095 | |||||
Interest | 223 | ||||||
Total Investment Income | 41,318 | ||||||
EXPENSES | |||||||
Advisory fee (Note B) | 4,443 | ||||||
Administration & Supervisory fee — Class K shares (Note B) | 687 | ||||||
Administration & Supervisory fee — Institutional Class shares (Note B) | 687 | ||||||
Transfer agency | 34,625 | ||||||
Fund accounting | 61,305 | ||||||
Professional fees | 36,592 | ||||||
Custody | 8,472 | ||||||
Registration fees | 4,272 | ||||||
Legal | 2,569 | ||||||
Trustees' fees | 34 | ||||||
Commitment fees | 11 | ||||||
Miscellaneous | 4,462 | ||||||
Total Expenses | 158,159 | ||||||
Fees waived/expenses reimbursed | (151,073 | ) | |||||
Total Expenses after Waiver | 7,086 | ||||||
Net Investment Income | 34,232 | ||||||
| REALIZED AND UNREALIZED GAIN (LOSS) ON INVESTMENTS AND FOREIGN CURRENCY TRANSACTIONS | |||||||
Net realized (loss) from: | |||||||
Investments | (19,387 | ) | |||||
Foreign currency transactions | (52 | ) | |||||
(19,439 | ) | ||||||
Net change in unrealized appreciation (depreciation) on: | |||||||
Investments | (266,814 | ) | |||||
Translation of net assets and liabilities denominated in foreign currencies | 4 | ||||||
(266,810 | ) | ||||||
Net realized and unrealized (loss) | (286,249 | ) | |||||
NET (DECREASE) IN NET ASSETS FROM OPERATIONS | $ | (252,017 | ) | ||||
The accompanying notes are an integral part of the financial statements.
114
Statements of Changes in Net Assets
Annual Report December 31, 2022
Baillie Gifford Emerging Markets ex China Fund
| For the Year Ended December 31, 2022 | For the Period December 28, 2021(a) through December 31, 2021 | ||||||||||
INCREASE (DECREASE) IN NET ASSETS FROM OPERATIONS | |||||||||||
Net investment income | $ | 34,232 | $ | 1,448 | |||||||
Net realized loss | (19,439 | ) | (264 | ) | |||||||
Net change in unrealized appreciation (depreciation) | (266,810 | ) | 1,156 | ||||||||
Net Increase (Decrease) in Net Assets from Operations | (252,017 | ) | 2,340 | ||||||||
DIVIDENDS AND DISTRIBUTIONS TO SHAREHOLDERS FROM: | |||||||||||
Distributable earnings | |||||||||||
Class K | (17,855 | ) | — | ||||||||
Institutional Class | (17,854 | ) | — | ||||||||
Total Distributions to Shareholders | (35,709 | ) | — | ||||||||
TRANSACTIONS IN SHARES OF BENEFICIAL INTEREST | |||||||||||
Net proceeds from shares subscribed: | |||||||||||
Class K | — | 500,000 | |||||||||
Institutional Class | — | 500,000 | |||||||||
Dividends reinvested: | |||||||||||
Class K | 17,855 | — | |||||||||
Institutional Class | 17,854 | — | |||||||||
Increase in Net Assets from Transactions in Shares of Beneficial Interest | 35,709 | 1,000,000 | |||||||||
Total Increase (Decrease) in Net Assets | (252,017 | ) | 1,002,340 | ||||||||
NET ASSETS | |||||||||||
Beginning of Year | 1,002,340 | — | |||||||||
End of Year | $ | 750,323 | $ | 1,002,340 | |||||||
(a) Commencement of investment operations.
The accompanying notes are an integral part of the financial statements.
115
Financial Highlights
Annual Report December 31, 2022
Baillie Gifford Emerging Markets ex China Fund
Selected data for a Class K share outstanding throughout each period:
| For the Year Ended December 31, 2022 | For the Period December 28, 2021(a) through December 31, 2021 | ||||||||||
Net asset value, beginning of period | $ | 10.02 | $ | 10.00 | |||||||
From Investment Operations | |||||||||||
Net investment income(b) | 0.34 | 0.01 | |||||||||
Net realized and unrealized gain (loss) on investments and foreign currency | (2.85 | ) | 0.01 | ||||||||
Net increase (decrease) in net asset value from investment operations | (2.51 | ) | 0.02 | ||||||||
Dividends and Distributions to Shareholders | |||||||||||
From net investment income | (0.36 | ) | — | ||||||||
Total dividends and distributions | (0.36 | ) | — | ||||||||
Net asset value, end of period | $ | 7.15 | $ | 10.02 | |||||||
Total Return | |||||||||||
Total return based on net asset value(c) | (25.07 | )% | 0.20 | % | |||||||
Ratios/Supplemental Data | |||||||||||
Net assets, end of period (000's omitted) | $ | 375 | $ | 501 | |||||||
Ratio of net expenses to average net assets, before waiver | 19.57 | % | 328.89 | %* | |||||||
Ratio of net expenses to average net assets, after waiver | 0.87 | % | 0.87 | %* | |||||||
Ratio of net investment income to average net assets | 4.24 | % | 17.62 | %* | |||||||
Portfolio turnover rate(d) | 13 | % | 0 | % | |||||||
* Annualized.
(a) Commencement of investment operations.
(b) Calculated based upon average shares outstanding during the period.
(c) Total investment return is calculated assuming an initial investment made at the net asset value at the beginning of the period, reinvestment of all dividends and distributions, if any, at net asset value during the period, and redemption on the last day of the period. Total return is not annualized for periods less than one year.
(d) Portfolio turnover rate calculated at Fund level. Portfolio turnover is not annualized for periods less than one year.
The accompanying notes are an integral part of the financial statements.
116
Financial Highlights
Annual Report December 31, 2022
Baillie Gifford Emerging Markets ex China Fund
Selected data for an Institutional Class share outstanding throughout each period:
| For the Year Ended December 31, 2022 | For the Period December 28, 2021(a) through December 31, 2021 | ||||||||||
Net asset value, beginning of period | $ | 10.02 | $ | 10.00 | |||||||
From Investment Operations | |||||||||||
Net investment income(b) | 0.34 | 0.01 | |||||||||
Net realized and unrealized gain (loss) on investments and foreign currency | (2.85 | ) | 0.01 | ||||||||
Net increase (decrease) in net asset value from investment operations | (2.51 | ) | 0.02 | ||||||||
Dividends and Distributions to Shareholders | |||||||||||
From net investment income | (0.36 | ) | — | ||||||||
Total dividends and distributions | (0.36 | ) | — | ||||||||
Net asset value, end of period | $ | 7.15 | $ | 10.02 | |||||||
Total Return | |||||||||||
Total return based on net asset value(c) | (25.07 | )% | 0.20 | % | |||||||
Ratios/Supplemental Data | |||||||||||
Net assets, end of period (000's omitted) | $ | 375 | $ | 501 | |||||||
Ratio of net expenses to average net assets, before waiver | 19.57 | % | 328.89 | %* | |||||||
Ratio of net expenses to average net assets, after waiver | 0.87 | % | 0.87 | %* | |||||||
Ratio of net investment income to average net assets | 4.24 | % | 17.62 | %* | |||||||
Portfolio turnover rate(d) | 13 | % | 0 | % | |||||||
* Annualized.
(a) Commencement of investment operations.
(b) Calculated based upon average shares outstanding during the period.
(c) Total investment return is calculated assuming an initial investment made at the net asset value at the beginning of the period, reinvestment of all dividends and distributions, if any, at net asset value during the period, and redemption on the last day of the period. Total return is not annualized for periods less than one year.
(d) Portfolio turnover rate calculated at Fund level. Portfolio turnover is not annualized for periods less than one year.
The accompanying notes are an integral part of the financial statements.
117
Industry Diversification Table
Annual Report December 31, 2022
December 31, 2022
Baillie Gifford Global Alpha Equities Fund
Value | % of Total Net Assets | ||||||||||
Advertising | $ | 9,504,005 | 0.9 | % | |||||||
Airlines | 22,272,837 | 2.2 | |||||||||
Apparel | 5,506,575 | 0.5 | |||||||||
Auto Manufacturers | 13,193,610 | 1.3 | |||||||||
Auto Parts & Equipment | 6,007,379 | 0.6 | |||||||||
Banks | 1,117,546 | 0.1 | |||||||||
Beverages | 21,092,213 | 2.0 | |||||||||
Biotechnology | 73,639,257 | 7.1 | |||||||||
Building Materials | 49,917,090 | 4.7 | |||||||||
Chemicals | 12,876,713 | 1.2 | |||||||||
Commercial Services | 87,213,983 | 8.3 | |||||||||
Cosmetics/Personal Care | 27,592,271 | 2.7 | |||||||||
Distribution/Wholesale | 6,985,937 | 0.7 | |||||||||
Diversified Financial Services | 67,924,224 | 6.5 | |||||||||
Healthcare — Products | 53,047,182 | 5.1 | |||||||||
Healthcare — Services | 45,351,678 | 4.3 | |||||||||
Home Furnishings | 3,474,009 | 0.3 | |||||||||
Insurance | 85,442,128 | 8.2 | |||||||||
Internet | 168,962,603 | 16.2 | |||||||||
Lodging | 4,800,942 | 0.5 | |||||||||
Machinery — Construction & Mining | 8,168,806 | 0.8 | |||||||||
Machinery — Diversified | 20,348,323 | 1.9 | |||||||||
Media | 6,162,402 | 0.6 | |||||||||
Mining | 42,418,041 | 4.1 | |||||||||
Miscellaneous Manufacturing | 13,048,937 | 1.3 | |||||||||
Oil&Gas | 31,354,780 | 3.0 | |||||||||
Real Estate | 15,963,071 | 1.5 | |||||||||
Retail | 12,879,902 | 1.2 | |||||||||
Semiconductors | 40,396,391 | 3.9 | |||||||||
Software | 64,092,602 | 6.1 | |||||||||
Total Value of Investments | 1,020,755,437 | 97.8 | |||||||||
Other assets less liabilities | 23,089,041 | 2.2 | |||||||||
Net Assets | $ | 1,043,844,478 | 100.0 | % | |||||||
The table above is based on Bloomberg Industry Group classifications. For compliance monitoring purposes, sub-industry classifications are used which results in less concentration across industry sectors.
118
Portfolio of Investments
Annual Report December 31, 2022
December 31, 2022
Baillie Gifford Global Alpha Equities Fund
Shares | Value | ||||||||||
COMMON STOCKS — 97.8% | |||||||||||
AUSTRALIA — 4.4% | |||||||||||
BHP Group Ltd. | 742,394 | $ | 23,071,228 | ||||||||
Rio Tinto PLC | 274,875 | 19,346,813 | |||||||||
Woodside Energy Group Ltd. | 133,049 | 3,201,089 | |||||||||
45,619,130 | |||||||||||
BRAZIL — 1.4% | |||||||||||
B3 SA — Brasil Bolsa Balcao | 3,928,600 | 9,816,091 | |||||||||
| MercadoLibre, Inc. * | 5,993 | 5,071,517 | |||||||||
14,887,608 | |||||||||||
CANADA — 0.7% | |||||||||||
| Shopify, Inc., Class A * | 202,370 | 7,024,263 | |||||||||
CHINA — 6.3% | |||||||||||
| Alibaba Group Holding Ltd. * | 884,532 | 9,705,893 | |||||||||
| LI Auto, Inc., Class A * | 588,736 | 5,692,318 | |||||||||
| Meituan, Class B * | 216,700 | 4,801,170 | |||||||||
Ping An Insurance Group Co. of China Ltd., Class H | 1,490,500 | 9,792,206 | |||||||||
Prosus NV | 525,325 | 36,270,248 | |||||||||
66,261,835 | |||||||||||
DENMARK — 0.9% | |||||||||||
| Genmab A/S * | 22,422 | 9,479,905 | |||||||||
FRANCE — 2.3% | |||||||||||
| Adevinta ASA * | 524,095 | 3,470,412 | |||||||||
Pernod Ricard SA | 107,218 | 21,092,213 | |||||||||
24,562,625 | |||||||||||
GERMANY — 1.4% | |||||||||||
adidas AG | 40,631 | 5,506,575 | |||||||||
Deutsche Boerse AG | 50,294 | 8,660,133 | |||||||||
14,166,708 | |||||||||||
HONG KONG — 4.0% | |||||||||||
AIA Group Ltd. | 1,951,000 | 21,545,657 | |||||||||
Prudential PLC | 1,477,369 | 20,144,362 | |||||||||
41,690,019 | |||||||||||
The accompanying notes are an integral part of the financial statements.
119
Portfolio of Investments
Annual Report December 31, 2022
December 31, 2022
Baillie Gifford Global Alpha Equities Fund
Shares | Value | ||||||||||
INDIA — 4.0% | |||||||||||
HDFC Bank Ltd. ADR | 16,336 | $ | 1,117,546 | ||||||||
Housing Development Finance Corp., Ltd. | 386,683 | 12,293,025 | |||||||||
Reliance Industries Ltd. GDR | 458,949 | 28,153,691 | |||||||||
41,564,262 | |||||||||||
IRELAND — 3.8% | |||||||||||
CRH PLC | 509,016 | 20,256,167 | |||||||||
| Ryanair Holdings PLC ADR * | 257,755 | 19,269,764 | |||||||||
39,525,931 | |||||||||||
JAPAN — 6.0% | |||||||||||
CyberAgent, Inc. | 634,400 | 5,647,926 | |||||||||
Denso Corp. | 122,500 | 6,007,379 | |||||||||
Hoshizaki Corp. | 98,800 | 3,474,009 | |||||||||
Olympus Corp. | 1,005,300 | 17,731,069 | |||||||||
Shiseido Co., Ltd. | 265,200 | 12,998,440 | |||||||||
SMC Corp. | 20,500 | 8,559,853 | |||||||||
Sysmex Corp. | 137,300 | 8,288,884 | |||||||||
62,707,560 | |||||||||||
MACAU — 0.5% | |||||||||||
| Sands China Ltd. * | 1,463,600 | 4,800,942 | |||||||||
NETHERLANDS — 0.6% | |||||||||||
| Adyen NV * | 4,756 | 6,602,516 | |||||||||
NORWAY — 0.6% | |||||||||||
Schibsted ASA, Class A | 324,957 | 6,162,402 | |||||||||
RUSSIA — 0.0% (a) | |||||||||||
| Sberbank of Russia PJSC *(b) | 1,284,860 | 0 | |||||||||
SINGAPORE — 0.6% | |||||||||||
| Sea Ltd. ADR * | 124,033 | 6,453,437 | |||||||||
SOUTH KOREA — 0.6% | |||||||||||
| Coupang, Inc. * | 411,212 | 6,048,929 | |||||||||
The accompanying notes are an integral part of the financial statements.
120
Portfolio of Investments
Annual Report December 31, 2022
December 31, 2022
Baillie Gifford Global Alpha Equities Fund
Shares | Value | ||||||||||
SWEDEN — 1.9% | |||||||||||
Atlas Copco AB, B Shares | 1,104,860 | $ | 11,788,470 | ||||||||
Epiroc AB, B Shares | 507,783 | 8,168,806 | |||||||||
19,957,276 | |||||||||||
SWITZERLAND — 1.5% | |||||||||||
Cie Financiere Richemont SA | 99,336 | 12,879,902 | |||||||||
| Wizz Air Holdings PLC * | 131,335 | 3,003,073 | |||||||||
15,882,975 | |||||||||||
TAIWAN — 1.4% | |||||||||||
Taiwan Semiconductor Manufacturing Co., Ltd. | 932,000 | 13,535,868 | |||||||||
Taiwan Semiconductor Manufacturing Co., Ltd. ADR | 14,669 | 1,092,694 | |||||||||
14,628,562 | |||||||||||
UNITED KINGDOM — 0.3% | |||||||||||
| Farfetch Ltd., Class A * | 669,928 | 3,168,759 | |||||||||
UNITED STATES — 54.6% | |||||||||||
| Adobe, Inc. * | 20,216 | 6,803,291 | |||||||||
Albemarle Corp. | 59,378 | 12,876,713 | |||||||||
| Alnylam Pharmaceuticals, Inc. * | 88,408 | 21,010,161 | |||||||||
| Alphabet, Inc., Class C * | 275,940 | 24,484,156 | |||||||||
| Amazon.com, Inc. * | 173,716 | 14,592,144 | |||||||||
Analog Devices, Inc. | 59,553 | 9,768,479 | |||||||||
Arthur J Gallagher & Co. | 123,980 | 23,375,189 | |||||||||
| Axon Enterprise, Inc. * | 44,878 | 7,446,607 | |||||||||
| Booking Holdings, Inc. * | 6,577 | 13,254,497 | |||||||||
Broadridge Financial Solutions, Inc. | 81,065 | 10,873,248 | |||||||||
| CBRE Group, Inc., Class A * | 138,128 | 10,630,331 | |||||||||
| Certara, Inc. * | 248,062 | 3,986,356 | |||||||||
Charles Schwab Corp. (The) | 195,044 | 16,239,363 | |||||||||
| Chegg, Inc. * | 109,601 | 2,769,617 | |||||||||
| Chewy, Inc., Class A * | 208,399 | 7,727,435 | |||||||||
| Cloudflare, Inc., Class A * | 100,256 | 4,532,574 | |||||||||
| CoStar Group, Inc. * | 128,636 | 9,940,990 | |||||||||
| Datadog, Inc., Class A * | 66,937 | 4,919,870 | |||||||||
| DoorDash, Inc., Class A * | 87,261 | 4,260,082 | |||||||||
Eaton Corp. PLC | 35,695 | 5,602,330 | |||||||||
Elevance Health, Inc. | 88,410 | 45,351,678 | |||||||||
The accompanying notes are an integral part of the financial statements.
121
Portfolio of Investments
Annual Report December 31, 2022
December 31, 2022
Baillie Gifford Global Alpha Equities Fund
Shares | Value | ||||||||||
Entegris, Inc. | 70,684 | $ | 4,636,164 | ||||||||
Estee Lauder Cos., Inc. (The), Class A | 58,820 | 14,593,830 | |||||||||
| Exact Sciences Corp. * | 51,928 | 2,570,955 | |||||||||
| Howard Hughes Corp. (The) * | 69,782 | 5,332,740 | |||||||||
| IAC, Inc. * | 37,603 | 1,669,573 | |||||||||
| Illumina, Inc. * | 39,507 | 7,988,315 | |||||||||
| Markel Corp. * | 8,034 | 10,584,715 | |||||||||
Martin Marietta Materials, Inc. | 87,762 | 29,660,923 | |||||||||
Mastercard, Inc., Class A | 60,149 | 20,915,612 | |||||||||
| Meta Platforms, Inc., Class A * | 55,095 | 6,630,132 | |||||||||
Microsoft Corp. | 122,703 | 29,426,633 | |||||||||
| Moderna, Inc. * | 84,700 | 15,213,814 | |||||||||
Moody's Corp. | 104,167 | 29,023,010 | |||||||||
| Netflix, Inc. * | 17,764 | 5,238,248 | |||||||||
| Novocure Ltd. * | 77,605 | 5,692,327 | |||||||||
Royalty Pharma PLC, Class A | 403,864 | 15,960,705 | |||||||||
S&P Global, Inc. | 36,233 | 12,135,881 | |||||||||
Service Corp. International | 386,780 | 26,741,969 | |||||||||
| SiteOne Landscape Supply, Inc. * | 59,546 | 6,985,937 | |||||||||
| Snowflake, Inc., Class A * | 33,338 | 4,785,337 | |||||||||
| Spotify Technology SA * | 23,540 | 1,858,483 | |||||||||
| STAAR Surgical Co. * | 57,741 | 2,802,748 | |||||||||
Teradyne, Inc. | 130,088 | 11,363,187 | |||||||||
| Tesla, Inc. * | 60,897 | 7,501,292 | |||||||||
Thermo Fisher Scientific, Inc. | 28,984 | 15,961,199 | |||||||||
| Trade Desk, Inc. (The), Class A * | 212,001 | 9,504,005 | |||||||||
| Twilio, Inc., Class A * | 56,202 | 2,751,650 | |||||||||
| Wayfair, Inc., Class A * | 48,200 | 1,585,298 | |||||||||
569,559,793 | |||||||||||
Total Common Stocks | |||||||||||
(cost $861,777,833) | 1,020,755,437 | ||||||||||
TOTAL INVESTMENTS — 97.8% | |||||||||||
(cost $861,777,833) | $ | 1,020,755,437 | |||||||||
Other assets less liabilities — 2.2% | 23,089,041 | ||||||||||
NET ASSETS — 100.0% | $ | 1,043,844,478 | |||||||||
(a) Amount rounds to less than 0.1%.
(b) Investment was valued using significant unobservable inputs.
* Non-income producing security.
ADR — American Depositary Receipt
The accompanying notes are an integral part of the financial statements.
122
Portfolio of Investments
Annual Report December 31, 2022
December 31, 2022
Baillie Gifford Global Alpha Equities Fund
GDR — Global Depositary Receipt
This report classifies issuers geographically by their country of risk. For compliance monitoring purposes, the Manager retains discretion to consider a number of factors in determining where a particular issuer is located, as described in further detail in each Fund's prospectus.
Fair Value Measurement
The following is a summary of the inputs used as of December 31, 2022 in valuing the Fund's investments carried at fair value:
Investments in Securities | Level 1 | Level 2 | Level 3 | Total | |||||||||||||||
| Common Stocks ** | $ | 618,806,701 | $ | 401,948,736 | $ | 0 | $ | 1,020,755,437 | |||||||||||
Total | $ | 618,806,701 | $ | 401,948,736 | $ | 0 | $ | 1,020,755,437 | |||||||||||
** Refer to Portfolio of Investments for further detail.
The following is a reconciliation of the Fund's Level 3 investments for which significant unobservable inputs were used in determining value:
Balance at December 31, 2021 | $ | 2,979,897 | |||||
Purchases | — | ||||||
Sales | (1,780,929 | ) | |||||
Realized (loss) | (7,882,354 | ) | |||||
Change in unrealized gain | (1,627,269 | ) | |||||
Transfers into Level 3 | 8,310,655 | ||||||
Transfers out of Level 3 | — | ||||||
Balance at December 31, 2022 | $ | 0 | |||||
Change in unrealized (loss) related to Investments still held at December 31, 2022 | $ | (5,365,657 | ) | ||||
$8,310,655 was transferred out of Level 2 into Level 3 during the year ended December 31, 2022 as a result of the unavailability of a quoted market price in an active market for identical securities and other significant observable inputs.
Summary of Unobservable Inputs for Level 3 Investments
The ongoing conflict in Russia and Ukraine has led to significant disruption and volatility in the global stock market. This impacted the Fund in terms of suspensions of trading activities on the Russian Stock Exchange as well as suspensions of depositary receipts traded on exchanges outside of Russia. As a result, management made the decision to value the following security at nil and transfer them into Level 3. The impacted securities are as follows:
Sberbank of Russia PJSC
The accompanying notes are an integral part of the financial statements.
123
Statement of Assets and Liabilities
Annual Report December 31, 2022
December 31, 2022
Baillie Gifford Global Alpha Equities Fund
ASSETS | |||||||
Investments, at value (cost $861,777,833) | $ | 1,020,755,437 | |||||
Cash | 24,029,534 | ||||||
Foreign cash, at value (cost $17,891) | 17,860 | ||||||
Tax reclaims receivable | 639,047 | ||||||
Dividends receivable | 295,187 | ||||||
Receivable for investments sold | 22,983 | ||||||
Capital shares sold receivable | 886 | ||||||
Prepaid assets | 19,361 | ||||||
Total Assets | 1,045,780,295 | ||||||
LIABILITIES | |||||||
Advisory fee payable | 999,195 | ||||||
Deferred India capital gains tax liability (Note A) | 308,419 | ||||||
Shareholder Servicing fee payable | 154,012 | ||||||
Administration & Supervisory fee payable | 169,862 | ||||||
IRS Closing agreement fees for foreign reclaims (Note A) | 20,900 | ||||||
Trustee fee payable | 11,599 | ||||||
Commitment fee payable | 3,880 | ||||||
Accrued expenses | 267,950 | ||||||
Total Liabilities | 1,935,817 | ||||||
NET ASSETS | $ | 1,043,844,478 | |||||
COMPOSITION OF NET ASSETS | |||||||
Paid-in capital | $ | 955,610,431 | |||||
Total distributable earnings | 88,234,047 | ||||||
$ | 1,043,844,478 | ||||||
NET ASSET VALUE, PER SHARE | |||||||
| Class 2 ($167,683,110 / 12,355,952 shares outstanding), unlimited authorized, no par value | $ | 13.57 | |||||
| Class 3 ($98,322,590 / 6,996,859 shares outstanding), unlimited authorized, no par value | $ | 14.05 | |||||
| Class 4 ($340,858,234 / 23,522,448 shares outstanding), unlimited authorized, no par value | $ | 14.49 | |||||
| Class K ($398,663,268 / 29,528,073 shares outstanding), unlimited authorized, no par value | $ | 13.50 | |||||
| Institutional Class ($38,317,276 / 2,836,334 shares outstanding), unlimited authorized, no par value | $ | 13.51 | |||||
The accompanying notes are an integral part of the financial statements.
124
Statement of Operations
Annual Report December 31, 2022
For the Year Ended December 31, 2022
Baillie Gifford Global Alpha Equities Fund
INVESTMENT INCOME | |||||||
Dividends (net of foreign withholding taxes of $749,864) | $ | 12,287,762 | |||||
Non-cash income | 2,612,375 | ||||||
Windfall tax recovery (Note A) | 500,757 | ||||||
Interest | 29,286 | ||||||
IRS Closing agreement user fees for foreign reclaims (Note A) | (20,900 | ) | |||||
Total Investment Income | 15,409,280 | ||||||
EXPENSES | |||||||
Advisory fee (Note B) | 4,378,443 | ||||||
Shareholder Servicing fees — Class 2 shares (Note B) | 290,840 | ||||||
Shareholder Servicing fees — Class 3 shares (Note B) | 96,575 | ||||||
Shareholder Servicing fees — Class 4 shares (Note B) | 251,711 | ||||||
Shareholder Servicing fees — Class 5 shares (Note B) | 10,101 | ||||||
Administration & Supervisory fee — Class K shares (Note B) | 644,307 | ||||||
Administration & Supervisory fee — Institutional Class shares (Note B) | 64,356 | ||||||
Transfer agency | 106,137 | ||||||
Sub-transfer agency — Institutional Class shares | 36,335 | ||||||
Fund accounting | 398,422 | ||||||
Legal | 196,321 | ||||||
Custody | 136,076 | ||||||
Professional fees | 54,874 | ||||||
Registration fees | 51,121 | ||||||
Trustees' fees | 44,204 | ||||||
Commitment fees | 14,694 | ||||||
Line of Credit Interest | 3,360 | ||||||
Miscellaneous | 46,647 | ||||||
Total Expenses | 6,824,524 | ||||||
Net Investment Income | 8,584,756 | ||||||
| REALIZED AND UNREALIZED (LOSS) ON INVESTMENTS AND FOREIGN CURRENCY TRANSACTIONS | |||||||
Net realized loss from: | |||||||
Investments (net of India capital gains tax expense of $18,713) | (71,774,554 | ) | |||||
Foreign currency transactions | (299,906 | ) | |||||
(72,074,460 | ) | ||||||
Net change in unrealized (depreciation) on: | |||||||
Investments (net of change in deferred India capital gains tax liability of $43,850) (Note A) | (371,695,191 | ) | |||||
Translation of net assets and liabilities denominated in foreign currencies | (3,570 | ) | |||||
(371,698,761 | ) | ||||||
Net realized and unrealized (loss) | (443,773,221 | ) | |||||
NET (DECREASE) IN NET ASSETS FROM OPERATIONS | $ | (435,188,465 | ) | ||||
The accompanying notes are an integral part of the financial statements.
125
Statements of Changes in Net Assets
Annual Report December 31, 2022
Baillie Gifford Global Alpha Equities Fund
| For the Year Ended December 31, 2022 | For the Year Ended December 31, 2021 | ||||||||||
INCREASE (DECREASE) IN NET ASSETS FROM OPERATIONS | |||||||||||
Net investment income | $ | 8,584,756 | $ | 5,222,160 | |||||||
Net realized gain (loss) | (72,074,460 | ) | 237,099,323 | ||||||||
Net change in unrealized (depreciation) | (371,698,761 | ) | (122,668,832 | ) | |||||||
Net Increase (Decrease) in Net Assets from Operations | (435,188,465 | ) | 119,652,651 | ||||||||
DIVIDENDS AND DISTRIBUTIONS TO SHAREHOLDERS FROM: | |||||||||||
Distributable earnings | |||||||||||
Class 2 | (4,894,311 | ) | (25,318,524 | ) | |||||||
Class 3 | (2,774,341 | ) | (13,371,461 | ) | |||||||
Class 4 | (9,335,035 | ) | (86,057,906 | ) | |||||||
Class K | (11,704,716 | ) | (70,277,149 | ) | |||||||
Institutional Class | (1,142,054 | ) | (7,445,427 | ) | |||||||
Total Distributions to Shareholders | (29,850,457 | ) | (202,470,467 | ) | |||||||
TRANSACTIONS IN SHARES OF BENEFICIAL INTEREST | |||||||||||
Net proceeds from shares subscribed: | |||||||||||
Class 2 | 73,247,462 | * | 170,721,384 | ||||||||
Class 3 | 151,183,648 | * | — | ||||||||
Class 4 | 196,727,309 | * | 30,000,000 | ||||||||
Class 5 | 230,119,015 | * | — | ||||||||
Class K | 106,320,026 | ** | 271,493,367 | ||||||||
Institutional Class | 21,599,894 | 27,820,913 | |||||||||
Dividends reinvested: | |||||||||||
Class 2 | 4,894,311 | 25,318,524 | |||||||||
Class 3 | 2,774,341 | 13,371,461 | |||||||||
Class 4 | 9,335,035 | 86,057,906 | |||||||||
Class K | 11,363,164 | 70,027,474 | |||||||||
Institutional Class | 1,130,701 | 6,687,568 | |||||||||
Cost of shares redeemed: | |||||||||||
Class 2 | (31,750,000 | ) | (258,817,289 | ) | |||||||
Class 3 | (119,241,462 | )* | (201,670,946 | ) | |||||||
Class 4 | (381,302,662 | )* | (100,000,000 | ) | |||||||
Class 5 | (196,727,309 | )* | — | ||||||||
Class K | (70,373,062 | ) | (45,018,740 | ) | |||||||
Institutional Class | (19,780,953 | ) | (5,284,272 | ) | |||||||
Increase (Decrease) in Net Assets from Transactions in Shares of Beneficial Interest | (10,480,542 | ) | 90,707,350 | ||||||||
Total Increase (Decrease) in Net Assets | (475,519,464 | ) | 7,889,534 | ||||||||
NET ASSETS | |||||||||||
Beginning of Year | 1,519,363,942 | 1,511,474,408 | |||||||||
End of Year | $ | 1,043,844,478 | $ | 1,519,363,942 | |||||||
* See Note D for details of share class conversions
** This amount includes an in-kind transfer of $80,804,752.
The accompanying notes are an integral part of the financial statements.
126
Financial Highlights
Annual Report December 31, 2022
Baillie Gifford Global Alpha Equities Fund
Selected data for a Class 2 share outstanding throughout each year:
| For the Year Ended December 31, 2022 | For the Year Ended December 31, 2021 | For the Year Ended December 31, 2020 | For the Year Ended December 31, 2019 | For the Year Ended December 31, 2018 | |||||||||||||||||||
Net asset value, beginning of year | $ | 19.72 | $ | 21.18 | $ | 16.46 | $ | 13.13 | $ | 18.85 | |||||||||||||
From Investment Operations | |||||||||||||||||||||||
Net investment income(a) | 0.11 | 0.08 | 0.04 | 0.39 | 0.11 | ||||||||||||||||||
| Net realized and unrealized gain (loss) on investments and foreign currency | (5.85 | ) | 1.54 | 5.93 | 3.89 | (1.93 | ) | ||||||||||||||||
| Net increase (decrease) in net asset value from investment operations | (5.74 | ) | 1.62 | 5.97 | 4.28 | (1.82 | ) | ||||||||||||||||
Dividends and Distributions to Shareholders | |||||||||||||||||||||||
From net investment income | (0.01 | ) | (0.30 | ) | (0.13 | ) | (0.57 | ) | (0.13 | ) | |||||||||||||
From net realized gain on investments | (0.40 | ) | (2.78 | ) | (1.12 | ) | (0.38 | ) | (3.77 | ) | |||||||||||||
Total dividends and distributions | (0.41 | ) | (3.08 | ) | (1.25 | ) | (0.95 | ) | (3.90 | ) | |||||||||||||
Net asset value, end of year | $ | 13.57 | $ | 19.72 | $ | 21.18 | $ | 16.46 | $ | 13.13 | |||||||||||||
Total Return | |||||||||||||||||||||||
Total return based on net asset value(b) | (29.08 | )% | 7.65 | % | 36.31 | % | 32.56 | % | (9.44 | )% | |||||||||||||
Ratios/Supplemental Data | |||||||||||||||||||||||
Net assets, end of year (000's omitted) | $ | 167,683 | $ | 187,473 | $ | 250,776 | $ | 173,625 | $ | 129,690 | |||||||||||||
Ratio of net expenses to average net assets | 0.67 | % | 0.64 | % | 0.65 | % | 0.67 | % | 0.68 | % | |||||||||||||
Ratio of net investment income to average net assets | 0.77 | % | 0.33 | % | 0.25 | % | 2.52 | %(c) | 0.59 | % | |||||||||||||
Portfolio turnover rate(d) | 9 | % | 40 | % | 23 | % | 17 | % | 18 | % | |||||||||||||
(a) Calculated based upon average shares outstanding during the period.
(b) Total investment return is calculated assuming an initial investment made at the net asset value at the beginning of the period, reinvestment of all dividends and distributions, if any, at net asset value during the period, and redemption on the last day of the period.
(c) Large increase due to one-off taxable stock dividends that were treated as income.
(d) Portfolio turnover rate calculated at Fund level and excludes the value of portfolio securities sold or received in-kind in connection with Fund capital shares sold or redemptions in-kind.
The accompanying notes are an integral part of the financial statements.
127
Financial Highlights
Annual Report December 31, 2022
Baillie Gifford Global Alpha Equities Fund
Selected data for a Class 3 share outstanding throughout each year:
| For the Year Ended December 31, 2022 | For the Year Ended December 31, 2021 | For the Year Ended December 31, 2020 | For the Year Ended December 31, 2019 | For the Year Ended December 31, 2018 | |||||||||||||||||||
Net asset value, beginning of year | $ | 20.38 | $ | 21.80 | $ | 16.90 | $ | 13.46 | $ | 19.22 | |||||||||||||
From Investment Operations | |||||||||||||||||||||||
Net investment income(a) | 0.13 | 0.09 | 0.07 | 0.41 | 0.13 | ||||||||||||||||||
| Net realized and unrealized gain (loss) on investments and foreign currency | (6.05 | ) | 1.59 | 6.07 | 3.99 | (1.97 | ) | ||||||||||||||||
| Net increase (decrease) in net asset value from investment operations | (5.92 | ) | 1.68 | 6.14 | 4.40 | (1.84 | ) | ||||||||||||||||
Dividends and Distributions to Shareholders | |||||||||||||||||||||||
From net investment income | (0.01 | ) | (0.32 | ) | (0.12 | ) | (0.58 | ) | (0.15 | ) | |||||||||||||
From net realized gain on investments | (0.40 | ) | (2.78 | ) | (1.12 | ) | (0.38 | ) | (3.77 | ) | |||||||||||||
Total dividends and distributions | (0.41 | ) | (3.10 | ) | (1.24 | ) | (0.96 | ) | (3.92 | ) | |||||||||||||
Net asset value, end of year | $ | 14.05 | $ | 20.38 | $ | 21.80 | $ | 16.90 | $ | 13.46 | |||||||||||||
Total Return | |||||||||||||||||||||||
Total return based on net asset value(b) | (29.03 | )% | 7.72 | % | 36.40 | % | 32.65 | % | (9.37 | )% | |||||||||||||
Ratios/Supplemental Data | |||||||||||||||||||||||
Net assets, end of year (000's omitted) | $ | 98,323 | $ | 101,328 | $ | 282,859 | $ | 568,608 | $ | 449,177 | |||||||||||||
Ratio of net expenses to average net assets | 0.60 | % | 0.57 | % | 0.58 | % | 0.60 | % | 0.61 | % | |||||||||||||
Ratio of net investment income to average net assets | 0.84 | % | 0.38 | % | 0.41 | % | 2.61 | %(c) | 0.67 | % | |||||||||||||
Portfolio turnover rate(d) | 9 | % | 40 | % | 23 | % | 17 | % | 18 | % | |||||||||||||
(a) Calculated based upon average shares outstanding during the period.
(b) Total investment return is calculated assuming an initial investment made at the net asset value at the beginning of the period, reinvestment of all dividends and distributions, if any, at net asset value during the period, and redemption on the last day of the period.
(c) Large increase due to one-off taxable stock dividends that were treated as income.
(d) Portfolio turnover rate calculated at Fund level and excludes the value of portfolio securities sold or received in-kind in connection with Fund capital shares sold or redemptions in-kind.
The accompanying notes are an integral part of the financial statements.
128
Financial Highlights
Annual Report December 31, 2022
Baillie Gifford Global Alpha Equities Fund
Selected data for a Class 4 share outstanding throughout each year:
| For the Year Ended December 31, 2022 | For the Year Ended December 31, 2021 | For the Year Ended December 31, 2020 | For the Year Ended December 31, 2019 | For the Year Ended December 31, 2018 | |||||||||||||||||||
Net asset value, beginning of year | $ | 21.00 | $ | 22.38 | $ | 17.34 | $ | 13.79 | $ | 19.58 | |||||||||||||
From Investment Operations | |||||||||||||||||||||||
Net investment income(a) | 0.13 | 0.10 | 0.03 | 0.42 | 0.11 | ||||||||||||||||||
| Net realized and unrealized gain (loss) on investments and foreign currency | (6.23 | ) | 1.64 | 6.28 | 4.10 | (1.98 | ) | ||||||||||||||||
| Net increase (decrease) in net asset value from investment operations | (6.10 | ) | 1.74 | 6.31 | 4.52 | (1.87 | ) | ||||||||||||||||
Dividends and Distributions to Shareholders | |||||||||||||||||||||||
From net investment income | (0.01 | ) | (0.34 | ) | (0.15 | ) | (0.59 | ) | (0.15 | ) | |||||||||||||
From net realized gain on investments | (0.40 | ) | (2.78 | ) | (1.12 | ) | (0.38 | ) | (3.77 | ) | |||||||||||||
Total dividends and distributions | (0.41 | ) | (3.12 | ) | (1.27 | ) | (0.97 | ) | (3.92 | ) | |||||||||||||
Net asset value, end of year | $ | 14.49 | $ | 21.00 | $ | 22.38 | $ | 17.34 | $ | 13.79 | |||||||||||||
Total Return | |||||||||||||||||||||||
Total return based on net asset value(b) | (29.00 | )% | 7.76 | % | 36.45 | % | 32.69 | % | (9.35 | )% | |||||||||||||
Ratios/Supplemental Data | |||||||||||||||||||||||
Net assets, end of year (000's omitted) | $ | 340,858 | $ | 665,712 | $ | 682,239 | $ | 147,092 | $ | 110,854 | |||||||||||||
Ratio of net expenses to average net assets | 0.57 | % | 0.54 | % | 0.55 | % | 0.57 | % | 0.58 | % | |||||||||||||
Ratio of net investment income to average net assets | 0.83 | % | 0.41 | % | 0.16 | % | 2.62 | %(c) | 0.57 | % | |||||||||||||
Portfolio turnover rate(d) | 9 | % | 40 | % | 23 | % | 17 | % | 18 | % | |||||||||||||
(a) Calculated based upon average shares outstanding during the period.
(b) Total investment return is calculated assuming an initial investment made at the net asset value at the beginning of the period, reinvestment of all dividends and distributions, if any, at net asset value during the period, and redemption on the last day of the period.
(c) Large increase due to one-off taxable stock dividends that were treated as income.
(d) Portfolio turnover rate calculated at Fund level and excludes the value of portfolio securities sold or received in-kind in connection with Fund capital shares sold or redemptions in-kind.
The accompanying notes are an integral part of the financial statements.
129
Financial Highlights
Annual Report December 31, 2022
Baillie Gifford Global Alpha Equities Fund
Selected data for a Class K share outstanding throughout each year:
| For the Year Ended December 31, 2022 | For the Year Ended December 31, 2021 | For the Year Ended December 31, 2020 | For the Year Ended December 31, 2019 | For the Year Ended December 31, 2018 | |||||||||||||||||||
Net asset value, beginning of year | $ | 19.62 | $ | 21.12 | $ | 16.42 | $ | 13.11 | $ | 18.82 | |||||||||||||
From Investment Operations | |||||||||||||||||||||||
Net investment income(a) | 0.11 | 0.05 | 0.03 | 0.35 | 0.11 | ||||||||||||||||||
| Net realized and unrealized gain (loss) on investments and foreign currency | (5.82 | ) | 1.56 | 5.93 | 3.92 | (1.92 | ) | ||||||||||||||||
| Net increase (decrease) in net asset value from investment operations | (5.71 | ) | 1.61 | 5.96 | 4.27 | (1.81 | ) | ||||||||||||||||
Dividends and Distributions to Shareholders | |||||||||||||||||||||||
From net investment income | (0.01 | ) | (0.33 | ) | (0.14 | ) | (0.58 | ) | (0.13 | ) | |||||||||||||
From net realized gain on investments | (0.40 | ) | (2.78 | ) | (1.12 | ) | (0.38 | ) | (3.77 | ) | |||||||||||||
Total dividends and distributions | (0.41 | ) | (3.11 | ) | (1.26 | ) | (0.96 | ) | (3.90 | ) | |||||||||||||
Net asset value, end of year | $ | 13.50 | $ | 19.62 | $ | 21.12 | $ | 16.42 | $ | 13.11 | |||||||||||||
Total Return | |||||||||||||||||||||||
Total return based on net asset value(b) | (29.08 | )% | 7.64 | % | 36.35 | % | 32.48 | % | (9.38 | )% | |||||||||||||
Ratios/Supplemental Data | |||||||||||||||||||||||
Net assets, end of year (000's omitted) | $ | 398,663 | $ | 513,807 | $ | 267,923 | $ | 81,234 | $ | 41,427 | |||||||||||||
Ratio of net expenses to average net assets | 0.67 | % | 0.64 | % | 0.65 | % | 0.67 | % | 0.68 | % | |||||||||||||
Ratio of net investment income to average net assets | 0.74 | % | 0.23 | % | 0.18 | % | 2.22 | %(c) | 0.56 | % | |||||||||||||
Portfolio turnover rate(d) | 9 | % | 40 | % | 23 | % | 17 | % | 18 | % | |||||||||||||
(a) Calculated based upon average shares outstanding during the period.
(b) Total investment return is calculated assuming an initial investment made at the net asset value at the beginning of the period, reinvestment of all dividends and distributions, if any, at net asset value during the period, and redemption on the last day of the period.
(c) Large increase due to one-off taxable stock dividends that were treated as income.
(d) Portfolio turnover rate calculated at Fund level and excludes the value of portfolio securities sold or received in-kind in connection with Fund capital shares sold or redemptions in-kind.
The accompanying notes are an integral part of the financial statements.
130
Financial Highlights
Annual Report December 31, 2022
Baillie Gifford Global Alpha Equities Fund
Selected data for an Institutional Class share outstanding throughout each year:
| For the Year Ended December 31, 2022 | For the Year Ended December 31, 2021 | For the Year Ended December 31, 2020 | For the Year Ended December 31, 2019 | For the Year Ended December 31, 2018 | |||||||||||||||||||
Net asset value, beginning of year | $ | 19.65 | $ | 21.15 | $ | 16.45 | $ | 13.12 | $ | 18.84 | |||||||||||||
From Investment Operations | |||||||||||||||||||||||
Net investment income(a) | 0.09 | 0.05 | 0.02 | 0.39 | 0.12 | ||||||||||||||||||
| Net realized and unrealized gain (loss) on investments and foreign currency | (5.82 | ) | 1.54 | 5.93 | 3.89 | (1.94 | ) | ||||||||||||||||
| Net increase (decrease) in net asset value from investment operations | (5.73 | ) | 1.59 | 5.95 | 4.28 | (1.82 | ) | ||||||||||||||||
Dividends and Distributions to Shareholders | |||||||||||||||||||||||
From net investment income | (0.01 | ) | (0.31 | ) | (0.13 | ) | (0.57 | ) | (0.13 | ) | |||||||||||||
From net realized gain on investments | (0.40 | ) | (2.78 | ) | (1.12 | ) | (0.38 | ) | (3.77 | ) | |||||||||||||
Total dividends and distributions | (0.41 | ) | (3.09 | ) | (1.25 | ) | (0.95 | ) | (3.90 | ) | |||||||||||||
Net asset value, end of year | $ | 13.51 | $ | 19.65 | $ | 21.15 | $ | 16.45 | $ | 13.12 | |||||||||||||
Total Return | |||||||||||||||||||||||
Total return based on net asset value(b) | (29.14 | )% | 7.53 | % | 36.22 | % | 32.56 | % | (9.42 | )% | |||||||||||||
Ratios/Supplemental Data | |||||||||||||||||||||||
Net assets, end of year (000's omitted) | $ | 38,317 | $ | 51,045 | $ | 27,677 | $ | 7 | $ | 5 | |||||||||||||
Ratio of net expenses to average net assets | 0.76 | % | 0.74 | % | 0.74 | % | 0.67 | % | 0.68 | % | |||||||||||||
Ratio of net investment income to average net assets | 0.58 | % | 0.21 | % | 0.09 | % | 2.56 | %(c) | 0.62 | % | |||||||||||||
Portfolio turnover rate(d) | 9 | % | 40 | % | 23 | % | 17 | % | 18 | % | |||||||||||||
(a) Calculated based upon average shares outstanding during the period.
(b) Total investment return is calculated assuming an initial investment made at the net asset value at the beginning of the period, reinvestment of all dividends and distributions, if any, at net asset value during the period, and redemption on the last day of the period.
(c) Large increase due to one-off taxable stock dividends that were treated as income.
(d) Portfolio turnover rate calculated at Fund level and excludes the value of portfolio securities sold or received in-kind in connection with Fund capital shares sold or redemptions in-kind.
The accompanying notes are an integral part of the financial statements.
131
Industry Diversification Table
Annual Report December 31, 2022
December 31, 2022
Baillie Gifford Global Stewardship Equities Fund
Value | % of Total Net Assets | ||||||||||
Advertising | $ | 71,325 | 2.0 | % | |||||||
Apparel | 30,222 | 0.8 | |||||||||
Auto Manufacturers | 64,670 | 1.8 | |||||||||
Auto Parts & Equipment | 49,570 | 1.4 | |||||||||
Banks | 146,171 | 4.0 | |||||||||
Biotechnology | 141,668 | 3.9 | |||||||||
Building Materials | 54,780 | 1.5 | |||||||||
Chemicals | 15,261 | 0.4 | |||||||||
Commercial Services | 341,228 | 9.5 | |||||||||
Cosmetics/Personal Care | 61,235 | 1.7 | |||||||||
Distribution/Wholesale | 219,258 | 6.1 | |||||||||
Diversified Financial Services | 107,305 | 3.0 | |||||||||
Energy — Alternate Sources | 16,976 | 0.5 | |||||||||
Food | 15,707 | 0.4 | |||||||||
Hand/Machine Tools | 55,619 | 1.5 | |||||||||
Healthcare — Products | 227,505 | 6.3 | |||||||||
Healthcare — Services | 16,883 | 0.5 | |||||||||
Insurance | 218,224 | 6.1 | |||||||||
Internet | 564,533 | 15.6 | |||||||||
Machinery — Diversified | 295,306 | 8.2 | |||||||||
Metal Fabricate/Hardware | 43,469 | 1.2 | |||||||||
Pharmaceuticals | 98,174 | 2.7 | |||||||||
Real Estate | 7,280 | 0.2 | |||||||||
Retail | 88,774 | 2.5 | |||||||||
Semiconductors | 221,847 | 6.1 | |||||||||
Software | 166,785 | 4.6 | |||||||||
Telecommunications | 69,492 | 1.9 | |||||||||
Toys/Games/Hobbies | 46,629 | 1.3 | |||||||||
Transportation | 40,958 | 1.1 | |||||||||
Total Value of Investments | 3,496,854 | 96.8 | |||||||||
Other assets less liabilities | 115,646 | 3.2 | |||||||||
Net Assets | $ | 3,612,500 | 100.0 | % | |||||||
The table above is based on Bloomberg Industry Group classifications. For compliance monitoring purposes, sub-industry classifications are used which results in less concentration across industry sectors.
132
Portfolio of Investments
Annual Report December 31, 2022
December 31, 2022
Baillie Gifford Global Stewardship Equities Fund
Shares | Value | ||||||||||
COMMON STOCKS — 96.8% | |||||||||||
BRAZIL — 1.6% | |||||||||||
| MercadoLibre, Inc. * | 69 | $ | 58,391 | ||||||||
CANADA — 2.2% | |||||||||||
| Shopify, Inc., Class A * | 2,260 | 78,445 | |||||||||
CHINA — 3.9% | |||||||||||
JD.com, Inc., Class A | 2,923 | 81,600 | |||||||||
| Meituan, Class B * | 2,700 | 59,821 | |||||||||
141,421 | |||||||||||
DENMARK — 1.1% | |||||||||||
DSV A/S | 259 | 40,958 | |||||||||
FRANCE — 5.1% | |||||||||||
| Adevinta ASA * | 4,033 | 26,705 | |||||||||
Dassault Systemes SE | 1,137 | 40,886 | |||||||||
L'Oreal SA | 171 | 61,235 | |||||||||
Sartorius Stedim Biotech | 175 | 56,870 | |||||||||
185,696 | |||||||||||
GERMANY — 1.5% | |||||||||||
adidas AG | 223 | 30,222 | |||||||||
| Zalando SE * | 702 | 24,714 | |||||||||
54,936 | |||||||||||
HONG KONG — 5.7% | |||||||||||
AIA Group Ltd. | 9,200 | 101,599 | |||||||||
Hong Kong Exchanges & Clearing Ltd. | 900 | 38,673 | |||||||||
Prudential PLC | 4,873 | 66,445 | |||||||||
206,717 | |||||||||||
INDIA — 1.9% | |||||||||||
HDFC Life Insurance Co., Ltd. | 7,346 | 50,180 | |||||||||
Metropolis Healthcare Ltd. | 1,054 | 16,882 | |||||||||
67,062 | |||||||||||
The accompanying notes are an integral part of the financial statements.
133
Portfolio of Investments
Annual Report December 31, 2022
December 31, 2022
Baillie Gifford Global Stewardship Equities Fund
Shares | Value | ||||||||||
IRELAND — 0.7% | |||||||||||
COSMO Pharmaceuticals NV | 400 | $ | 26,475 | ||||||||
JAPAN — 14.3% | |||||||||||
Bridgestone Corp. | 1,400 | 49,570 | |||||||||
DMG Mori Co., Ltd. | 4,200 | 55,620 | |||||||||
FANUC Corp. ADR | 4,081 | 60,684 | |||||||||
FANUC Corp. | 200 | 29,929 | |||||||||
Kubota Corp. | 4,600 | 62,843 | |||||||||
MISUMI Group, Inc. | 2,000 | 43,469 | |||||||||
Nintendo Co., Ltd. ADR | 4,475 | 46,629 | |||||||||
Rakuten Group, Inc. | 5,300 | 23,887 | |||||||||
Recruit Holdings Co., Ltd. | 2,200 | 68,864 | |||||||||
Sumitomo Mitsui Trust Holdings, Inc. | 2,100 | 73,281 | |||||||||
514,776 | |||||||||||
NETHERLANDS — 2.8% | |||||||||||
IMCD NV | 700 | 100,129 | |||||||||
SOUTH KOREA — 1.9% | |||||||||||
Samsung SDI Co., Ltd. | 148 | 69,492 | |||||||||
SWEDEN — 4.5% | |||||||||||
Atlas Copco AB, B Shares | 5,884 | 62,780 | |||||||||
Beijer Ref AB | 3,103 | 43,816 | |||||||||
Nibe Industrier AB, B Shares | 5,869 | 54,780 | |||||||||
161,376 | |||||||||||
TAIWAN — 3.2% | |||||||||||
Taiwan Semiconductor Manufacturing Co., Ltd. | 8,000 | 116,188 | |||||||||
UNITED KINGDOM — 4.5% | |||||||||||
Experian PLC | 1,139 | 38,576 | |||||||||
| ITM Power PLC * | 15,279 | 16,976 | |||||||||
| Ocado Group PLC * | 2,116 | 15,707 | |||||||||
Spirax-Sarco Engineering PLC | 276 | 35,254 | |||||||||
St James's Place PLC | 2,887 | 38,031 | |||||||||
| Wise PLC, Class A * | 2,611 | 17,689 | |||||||||
162,233 | |||||||||||
The accompanying notes are an integral part of the financial statements.
134
Portfolio of Investments
Annual Report December 31, 2022
December 31, 2022
Baillie Gifford Global Stewardship Equities Fund
Shares | Value | ||||||||||
UNITED STATES — 41.9% | |||||||||||
| 10X Genomics, Inc., Class A * | 766 | $ | 27,913 | ||||||||
| Alphabet, Inc., Class A * | 283 | 24,969 | |||||||||
| Amazon.com, Inc. * | 609 | 51,156 | |||||||||
| Chegg, Inc. * | 2,801 | 70,781 | |||||||||
| Codexis, Inc. * | 3,275 | 15,261 | |||||||||
| Denali Therapeutics, Inc. * | 1,622 | 45,108 | |||||||||
| Exact Sciences Corp. * | 775 | 38,370 | |||||||||
Fastenal Co. | 1,163 | 55,033 | |||||||||
First Republic Bank | 598 | 72,890 | |||||||||
| Illumina, Inc. * | 291 | 58,840 | |||||||||
MarketAxess Holdings, Inc. | 382 | 106,536 | |||||||||
Mastercard, Inc., Class A | 88 | 30,600 | |||||||||
| Moderna, Inc. * | 210 | 37,720 | |||||||||
| Netflix, Inc. * | 282 | 83,156 | |||||||||
NVIDIA Corp. | 723 | 105,659 | |||||||||
| Pacira BioSciences, Inc. * | 1,857 | 71,699 | |||||||||
| Progyny, Inc. * | 1,245 | 38,782 | |||||||||
| Redfin Corp. * | 1,717 | 7,280 | |||||||||
| Spotify Technology SA * | 302 | 23,843 | |||||||||
| STAAR Surgical Co. * | 1,070 | 51,938 | |||||||||
Starbucks Corp. | 511 | 50,691 | |||||||||
| Tesla, Inc. * | 525 | 64,670 | |||||||||
| Trade Desk, Inc. (The), Class A * | 1,591 | 71,325 | |||||||||
| Twilio, Inc., Class A * | 498 | 24,382 | |||||||||
| Upwork, Inc. * | 3,579 | 37,365 | |||||||||
| Warby Parker, Inc., Class A * | 991 | 13,369 | |||||||||
| Waters Corp. * | 153 | 52,415 | |||||||||
Watsco, Inc. | 257 | 64,096 | |||||||||
| Wayfair, Inc., Class A * | 462 | 15,195 | |||||||||
| Workday, Inc., Class A * | 482 | 80,653 | |||||||||
| Zoom Video Communications, Inc., Class A * | 308 | 20,864 | |||||||||
1,512,559 | |||||||||||
Total Common Stocks | |||||||||||
(cost $3,645,495) | 3,496,854 | ||||||||||
TOTAL INVESTMENTS — 96.8% | |||||||||||
(cost $3,645,495) | $ | 3,496,854 | |||||||||
Other assets less liabilities — 3.2% | 115,646 | ||||||||||
NET ASSETS — 100.0% | $ | 3,612,500 | |||||||||
The accompanying notes are an integral part of the financial statements.
135
Portfolio of Investments
Annual Report December 31, 2022
December 31, 2022
Baillie Gifford Global Stewardship Equities Fund
* Non-income producing security.
ADR — American Depositary Receipt
This report classifies issuers geographically by their country of risk. For compliance monitoring purposes, the Manager retains discretion to consider a number of factors in determining where a particular issuer is located, as described in further detail in each Fund's prospectus.
Fair Value Measurement
The following is a summary of the inputs used as of December 31, 2022 in valuing the Fund's investments carried at fair value:
Investments in Securities | Level 1 | Level 2 | Level 3 | Total | |||||||||||||||
| Common Stocks ** | $ | 1,783,183 | $ | 1,713,671 | $ | — | $ | 3,496,854 | |||||||||||
Total | $ | 1,783,183 | $ | 1,713,671 | $ | — | $ | 3,496,854 | |||||||||||
** Refer to Portfolio of Investments for further detail.
The accompanying notes are an integral part of the financial statements.
136
Statement of Assets and Liabilities
Annual Report December 31, 2022
December 31, 2022
Baillie Gifford Global Stewardship Equities Fund
ASSETS | |||||||
Investments, at value (cost $3,645,495) | $ | 3,496,854 | |||||
Cash | 145,692 | ||||||
Due from Manager | 50,753 | ||||||
Dividends receivable | 3,326 | ||||||
Tax reclaims receivable | 163 | ||||||
Total Assets | 3,696,788 | ||||||
LIABILITIES | |||||||
Advisory fee payable | 3,007 | ||||||
Administration & Supervisory fee payable | 1,549 | ||||||
Trustee fee payable | 42 | ||||||
Commitment fee payable | 14 | ||||||
Accrued expenses | 79,676 | ||||||
Total Liabilities | 84,288 | ||||||
NET ASSETS | $ | 3,612,500 | |||||
COMPOSITION OF NET ASSETS | |||||||
Paid-in capital | $ | 3,989,298 | |||||
Total accumulated (loss) | (376,798 | ) | |||||
$ | 3,612,500 | ||||||
NET ASSET VALUE, PER SHARE | |||||||
| Class K ($1,806,250 / 181,557 shares outstanding), unlimited authorized, no par value | $ | 9.95 | |||||
| Institutional Class ($1,806,250 / 181,557 shares outstanding), unlimited authorized, no par value | $ | 9.95 | |||||
The accompanying notes are an integral part of the financial statements.
137
Statement of Operations
Annual Report December 31, 2022
For the Year Ended December 31, 2022
Baillie Gifford Global Stewardship Equities Fund
INVESTMENT INCOME | |||||||
Dividends (net of foreign withholding taxes of $2,920) | $ | 32,985 | |||||
Non-cash income | 3,721 | ||||||
Interest | 321 | ||||||
Total Investment Income | 37,027 | ||||||
EXPENSES | |||||||
Advisory fee (Note B) | 14,044 | ||||||
Administration & Supervisory fee — Class K shares (Note B) | 3,617 | ||||||
Administration & Supervisory fee — Institutional Class shares (Note B) | 3,617 | ||||||
Transfer agency | 33,650 | ||||||
Fund accounting | 102,565 | ||||||
Registration fees | 39,089 | ||||||
Professional fees | 34,723 | ||||||
Legal | 13,860 | ||||||
Custody | 2,260 | ||||||
Trustees' fees | 170 | ||||||
Commitment fees | 57 | ||||||
Miscellaneous | 5,225 | ||||||
Total Expenses | 252,877 | ||||||
Fees waived/expenses reimbursed | (225,215 | ) | |||||
Total Expenses after Waiver | 27,662 | ||||||
Net Investment Income | 9,365 | ||||||
| REALIZED AND UNREALIZED GAIN (LOSS) ON INVESTMENTS AND FOREIGN CURRENCY TRANSACTIONS | |||||||
Net realized (loss) from: | |||||||
Investments | (204,160 | ) | |||||
Foreign currency transactions | (1,713 | ) | |||||
(205,873 | ) | ||||||
Net change in unrealized appreciation (depreciation) on: | |||||||
Investments | (2,465,430 | ) | |||||
Translation of net assets and liabilities denominated in foreign currencies | 39 | ||||||
(2,465,391 | ) | ||||||
Net realized and unrealized (loss) | (2,671,264 | ) | |||||
NET (DECREASE) IN NET ASSETS FROM OPERATIONS | $ | (2,661,899 | ) | ||||
The accompanying notes are an integral part of the financial statements.
138
Statements of Changes in Net Assets
Annual Report December 31, 2022
Baillie Gifford Global Stewardship Equities Fund
| For the Year Ended December 31, 2022 | For the Year Ended December 31, 2021 | ||||||||||
INCREASE (DECREASE) IN NET ASSETS FROM OPERATIONS | |||||||||||
Net investment income (loss) | $ | 9,365 | $ | (7,264 | ) | ||||||
Net realized gain (loss) | (205,873 | ) | 658,590 | ||||||||
Net change in unrealized (depreciation) | (2,465,391 | ) | (635,868 | ) | |||||||
Net Increase (Decrease) in Net Assets from Operations | (2,661,899 | ) | 15,458 | ||||||||
DIVIDENDS AND DISTRIBUTIONS TO SHAREHOLDERS FROM: | |||||||||||
Distributable earnings | |||||||||||
Class K | (74,363 | ) | (275,056 | ) | |||||||
Institutional Class | (74,363 | ) | (275,056 | ) | |||||||
Total Distributions to Shareholders | (148,726 | ) | (550,112 | ) | |||||||
TRANSACTIONS IN SHARES OF BENEFICIAL INTEREST | |||||||||||
Dividends reinvested: | |||||||||||
Class K | 74,363 | 275,056 | |||||||||
Institutional Class | 74,363 | 275,056 | |||||||||
Increase in Net Assets from Transactions in Shares of Beneficial Interest | 148,726 | 550,112 | |||||||||
Total Increase (Decrease) in Net Assets | (2,661,899 | ) | 15,458 | ||||||||
NET ASSETS | |||||||||||
Beginning of Year | 6,274,399 | 6,258,941 | |||||||||
End of Year | $ | 3,612,500 | $ | 6,274,399 | |||||||
The accompanying notes are an integral part of the financial statements.
139
Financial Highlights
Annual Report December 31, 2022
Baillie Gifford Global Stewardship Equities Fund
Selected data for a Class K share outstanding throughout each year:
| For the Year Ended December 31, 2022 | For the Year Ended December 31, 2021 | For the Year Ended December 31, 2020 | For the Year Ended December 31, 2019 | For the Year Ended December 31, 2018 | |||||||||||||||||||
Net asset value, beginning of year | $ | 17.97 | $ | 19.65 | $ | 11.62 | $ | 9.09 | $ | 10.15 | |||||||||||||
From Investment Operations | |||||||||||||||||||||||
Net investment income (loss)(a) | 0.03 | (0.02 | ) | (0.01 | ) | 0.03 | 0.03 | ||||||||||||||||
| Net realized and unrealized gain (loss) on investments and foreign currency | (7.62 | ) | 0.06 | 8.77 | 2.64 | (0.99 | ) | ||||||||||||||||
| Net increase (decrease) in net asset value from investment operations | (7.59 | ) | 0.04 | 8.76 | 2.67 | (0.96 | ) | ||||||||||||||||
Dividends and Distributions to Shareholders | |||||||||||||||||||||||
From net investment income | — | (0.23 | ) | — | (0.03 | ) | (0.02 | ) | |||||||||||||||
From net realized gain on investments | (0.43 | ) | (1.49 | ) | (0.73 | ) | (0.11 | ) | (0.08 | ) | |||||||||||||
Total dividends and distributions | (0.43 | ) | (1.72 | ) | (0.73 | ) | (0.14 | ) | (0.10 | ) | |||||||||||||
Net asset value, end of year | $ | 9.95 | $ | 17.97 | $ | 19.65 | $ | 11.62 | $ | 9.09 | |||||||||||||
Total Return | |||||||||||||||||||||||
Total return based on net asset value(b) | (42.41 | )% | 0.25 | % | 75.39 | % | 29.37 | % | (9.43 | )% | |||||||||||||
Ratios/Supplemental Data | |||||||||||||||||||||||
Net assets, end of year (000's omitted) | $ | 1,806 | $ | 3,137 | $ | 3,129 | $ | 1,784 | $ | 1,378 | |||||||||||||
| Ratio of net expenses to average net assets, before waiver | 5.94 | % | 3.64 | % | 5.22 | % | 6.60 | % | 5.53 | % | |||||||||||||
| Ratio of net expenses to average net assets, after waiver | 0.65 | % | 0.65 | % | 0.65 | % | 0.65 | % | 0.65 | % | |||||||||||||
| Ratio of net investment income (loss) to average net assets | 0.22 | % | (0.11 | )% | (0.10 | )% | 0.24 | % | 0.25 | % | |||||||||||||
Portfolio turnover rate(c) | 12 | % | 18 | % | 17 | % | 21 | % | 14 | % | |||||||||||||
(a) Calculated based upon average shares outstanding during the period.
(b) Total investment return is calculated assuming an initial investment made at the net asset value at the beginning of the period, reinvestment of all dividends and distributions, if any, at net asset value during the period, and redemption on the last day of the period.
(c) Portfolio turnover rate calculated at Fund level.
The accompanying notes are an integral part of the financial statements.
140
Financial Highlights
Annual Report December 31, 2022
Baillie Gifford Global Stewardship Equities Fund
Selected data for an Institutional Class share outstanding throughout each year:
| For the Year Ended December 31, 2022 | For the Year Ended December 31, 2021 | For the Year Ended December 31, 2020 | For the Year Ended December 31, 2019 | For the Year Ended December 31, 2018 | |||||||||||||||||||
Net asset value, beginning of year | $ | 17.97 | $ | 19.65 | $ | 11.62 | $ | 9.09 | $ | 10.15 | |||||||||||||
From Investment Operations | |||||||||||||||||||||||
Net investment income (loss)(a) | 0.03 | (0.02 | ) | (0.01 | ) | 0.03 | 0.03 | ||||||||||||||||
| Net realized and unrealized gain (loss) on investments and foreign currency | (7.62 | ) | 0.06 | 8.77 | 2.64 | (0.99 | ) | ||||||||||||||||
| Net increase (decrease) in net asset value from investment operations | (7.59 | ) | 0.04 | 8.76 | 2.67 | (0.96 | ) | ||||||||||||||||
Dividends and Distributions to Shareholders | |||||||||||||||||||||||
From net investment income | — | (0.23 | ) | — | (0.03 | ) | (0.02 | ) | |||||||||||||||
From net realized gain on investments | (0.43 | ) | (1.49 | ) | (0.73 | ) | (0.11 | ) | (0.08 | ) | |||||||||||||
Total dividends and distributions | (0.43 | ) | (1.72 | ) | (0.73 | ) | (0.14 | ) | (0.10 | ) | |||||||||||||
Net asset value, end of year | $ | 9.95 | $ | 17.97 | $ | 19.65 | $ | 11.62 | $ | 9.09 | |||||||||||||
Total Return | |||||||||||||||||||||||
Total return based on net asset value(b) | (42.41 | )% | 0.25 | % | 75.39 | % | 29.37 | % | (9.43 | )% | |||||||||||||
Ratios/Supplemental Data | |||||||||||||||||||||||
Net assets, end of year (000's omitted) | $ | 1,806 | $ | 3,137 | $ | 3,129 | $ | 1,784 | $ | 1,379 | |||||||||||||
| Ratio of net expenses to average net assets, before waiver | 5.94 | % | 3.64 | % | 5.22 | % | 6.60 | % | 5.53 | % | |||||||||||||
| Ratio of net expenses to average net assets, after waiver | 0.65 | % | 0.65 | % | 0.65 | % | 0.65 | % | 0.65 | % | |||||||||||||
| Ratio of net investment income (loss) to average net assets | 0.22 | % | (0.11 | )% | (0.10 | )% | 0.24 | % | 0.25 | % | |||||||||||||
Portfolio turnover rate(c) | 12 | % | 18 | % | 17 | % | 21 | % | 14 | % | |||||||||||||
(a) Calculated based upon average shares outstanding during the period.
(b) Total investment return is calculated assuming an initial investment made at the net asset value at the beginning of the period, reinvestment of all dividends and distributions, if any, at net asset value during the period, and redemption on the last day of the period.
(c) Portfolio turnover rate calculated at Fund level.
The accompanying notes are an integral part of the financial statements.
141
Industry Diversification Table
Annual Report December 31, 2022
December 31, 2022
Baillie Gifford Health Innovation Equities Fund
Value | % of Total Net Assets | ||||||||||
Biotechnology | $ | 9,028,613 | 43.1 | % | |||||||
Electronics | 1,026,283 | 4.9 | |||||||||
Healthcare — Products | 5,571,644 | 26.6 | |||||||||
Healthcare — Services | 902,916 | 4.4 | |||||||||
Internet | 798,602 | 3.8 | |||||||||
Pharmaceuticals | 2,028,007 | 9.7 | |||||||||
Software | 1,087,800 | 5.2 | |||||||||
Total Value of Investments | 20,443,865 | 97.7 | |||||||||
Other assets less liabilities | 471,693 | 2.3 | |||||||||
Net Assets | $ | 20,915,558 | 100.0 | % | |||||||
The table above is based on Bloomberg Industry Group classifications. For compliance monitoring purposes, sub-industry classifications are used which results in less concentration across industry sectors.
142
Portfolio of Investments
Annual Report December 31, 2022
December 31, 2022
Baillie Gifford Health Innovation Equities Fund
Shares | Value | ||||||||||
COMMON STOCKS — 92.8% | |||||||||||
CHINA — 3.8% | |||||||||||
| Wuxi Biologics Cayman, Inc. * | 82,000 | $ | 621,061 | ||||||||
| Zai Lab Ltd. * | 56,790 | 175,779 | |||||||||
796,840 | |||||||||||
DENMARK — 15.9% | |||||||||||
| ALK-Abello A/S * | 40,581 | 566,067 | |||||||||
| Ambu A/S, B Shares * | 60,695 | 779,481 | |||||||||
| Ascendis Pharma A/S ADR * | 3,335 | 407,303 | |||||||||
| Genmab A/S * | 3,719 | 1,572,374 | |||||||||
3,325,225 | |||||||||||
JAPAN — 3.8% | |||||||||||
M3, Inc. | 29,400 | 798,602 | |||||||||
NETHERLANDS — 6.8% | |||||||||||
| Argenx SE * | 3,768 | 1,414,530 | |||||||||
UNITED KINGDOM — 0.5% | |||||||||||
| Exscientia PLC ADR * | 20,393 | 108,695 | |||||||||
UNITED STATES — 62.0% | |||||||||||
| 10X Genomics, Inc., Class A * | 15,569 | 567,334 | |||||||||
| Alector, Inc. * | 14,943 | 137,924 | |||||||||
| Alnylam Pharmaceuticals, Inc. * | 6,500 | 1,544,725 | |||||||||
| Berkeley Lights, Inc. * | 28,963 | 77,621 | |||||||||
| Butterfly Network, Inc. * | 56,296 | 138,488 | |||||||||
| Denali Therapeutics, Inc. * | 12,360 | 343,732 | |||||||||
| Dexcom, Inc. * | 7,215 | 817,027 | |||||||||
| Doximity, Inc., Class A * | 18,112 | 607,839 | |||||||||
| Edwards Lifesciences Corp. * | 9,374 | 699,394 | |||||||||
| Exact Sciences Corp. * | 10,649 | 527,232 | |||||||||
| Health Catalyst, Inc. * | 21,271 | 226,111 | |||||||||
| Illumina, Inc. * | 4,204 | 850,049 | |||||||||
| Ionis Pharmaceuticals, Inc. * | 12,035 | 454,562 | |||||||||
| Lyell Immunopharma, Inc. * | 28,728 | 99,686 | |||||||||
| Masimo Corp. * | 3,466 | 512,795 | |||||||||
| Moderna, Inc. * | 9,228 | 1,657,533 | |||||||||
The accompanying notes are an integral part of the financial statements.
143
Portfolio of Investments
Annual Report December 31, 2022
December 31, 2022
Baillie Gifford Health Innovation Equities Fund
Shares | Value | ||||||||||
| Novocure Ltd. * | 6,815 | $ | 499,880 | ||||||||
| Oscar Health, Inc., Class A * | 14,082 | 34,642 | |||||||||
| Recursion Pharmaceuticals, Inc., Class A * | 35,338 | 272,456 | |||||||||
| Relay Therapeutics, Inc. * | 15,046 | 224,787 | |||||||||
ResMed, Inc. | 2,422 | 504,091 | |||||||||
| Sage Therapeutics, Inc. * | 3,521 | 134,291 | |||||||||
| Sana Biotechnology, Inc. * | 6,436 | 25,422 | |||||||||
| Shockwave Medical, Inc. * | 5,184 | 1,065,882 | |||||||||
| STAAR Surgical Co. * | 5,708 | 277,066 | |||||||||
| Teladoc Health, Inc. * | 10,453 | 247,213 | |||||||||
| Veeva Systems, Inc., Class A * | 1,573 | 253,851 | |||||||||
| Vir Biotechnology, Inc. * | 6,798 | 172,057 | |||||||||
12,973,690 | |||||||||||
Total Common Stocks | |||||||||||
(cost $22,479,877) | 19,417,582 | ||||||||||
PREFERRED STOCKS — 4.9% | |||||||||||
GERMANY — 4.9% | |||||||||||
Sartorius AG 0.34% (cost $1,173,878) | 2,599 | 1,026,283 | |||||||||
TOTAL INVESTMENTS — 97.7% | |||||||||||
(cost $23,653,755) | $ | 20,443,865 | |||||||||
Other assets less liabilities — 2.3% | 471,693 | ||||||||||
NET ASSETS — 100.0% | $ | 20,915,558 | |||||||||
* Non-income producing security.
ADR — American Depositary Receipt
This report classifies issuers geographically by their country of risk. For compliance monitoring purposes, the Manager retains discretion to consider a number of factors in determining where a particular issuer is located, as described in further detail in each Fund's prospectus.
Fair Value Measurement
The following is a summary of the inputs used as of December 31, 2022 in valuing the Fund's investments carried at fair value:
Investments in Securities | Level 1 | Level 2 | Level 3 | Total | |||||||||||||||
| Common Stocks ** | $ | 13,489,688 | $ | 5,927,894 | $ | — | $ | 19,417,582 | |||||||||||
| Preferred Stocks ** | — | 1,026,283 | — | 1,026,283 | |||||||||||||||
Total | $ | 13,489,688 | $ | 6,954,177 | $ | — | $ | 20,443,865 | |||||||||||
** Refer to Portfolio of Investments for further detail.
The accompanying notes are an integral part of the financial statements.
144
Statement of Assets and Liabilities
Annual Report December 31, 2022
December 31, 2022
Baillie Gifford Health Innovation Equities Fund
ASSETS | |||||||
Investments, at value (cost $23,653,755) | $ | 20,443,865 | |||||
Cash | 751,429 | ||||||
Due from Manager | 75,235 | ||||||
Receivable for investments sold | 32,773 | ||||||
Prepaid assets | 22,889 | ||||||
Total Assets | 21,326,191 | ||||||
LIABILITIES | |||||||
Advisory fee payable | 11,893 | ||||||
Payable for investment purchased | 324,819 | ||||||
Administration & Supervisory fee payable | 6,127 | ||||||
Trustee fee payable | 191 | ||||||
Commitment fee payable | 64 | ||||||
Accrued expenses | 67,539 | ||||||
Total Liabilities | 410,633 | ||||||
NET ASSETS | $ | 20,915,558 | |||||
COMPOSITION OF NET ASSETS | |||||||
Paid-in capital | $ | 24,142,630 | |||||
Total accumulated (loss) | (3,227,072 | ) | |||||
$ | 20,915,558 | ||||||
NET ASSET VALUE, PER SHARE | |||||||
| Class K ($3,368,309 / 500,041 shares outstanding), unlimited authorized, no par value | $ | 6.74 | |||||
| Institutional Class ($17,547,249 / 2,604,586 shares outstanding), unlimited authorized, no par value | $ | 6.74 | |||||
The accompanying notes are an integral part of the financial statements.
145
Statement of Operations
Annual Report December 31, 2022
For the Year Ended December 31, 2022
Baillie Gifford Health Innovation Equities Fund
INVESTMENT INCOME | |||||||
Dividends (net of foreign withholding taxes of $301) | $ | 3,928 | |||||
Interest | 2,050 | ||||||
Total Investment Income | 5,978 | ||||||
EXPENSES | |||||||
Advisory fee (Note B) | 29,521 | ||||||
Administration & Supervisory fee — Class K shares (Note B) | 5,984 | ||||||
Administration & Supervisory fee — Institutional Class shares (Note B) | 9,223 | ||||||
Transfer agency | 34,632 | ||||||
Fund accounting | 59,824 | ||||||
Legal | 58,487 | ||||||
Professional fees | 26,918 | ||||||
Registration fees | 5,064 | ||||||
Custody | 2,734 | ||||||
Trustees' fees | 405 | ||||||
Commitment fees | 135 | ||||||
Miscellaneous | 7,969 | ||||||
Total Expenses | 240,896 | ||||||
Fees waived/expenses reimbursed | (182,742 | ) | |||||
Total Expenses after Waiver | 58,154 | ||||||
Net Investment (Loss) | (52,176 | ) | |||||
| REALIZED AND UNREALIZED GAIN (LOSS) ON INVESTMENTS AND FOREIGN CURRENCY TRANSACTIONS | |||||||
Net realized gain from: | |||||||
Investments | 17,834 | ||||||
Foreign currency transactions | (4,218 | ) | |||||
13,616 | |||||||
Net change in unrealized (depreciation) on: | |||||||
Investments | (3,184,271 | ) | |||||
Translation of net assets and liabilities denominated in foreign currencies | (46 | ) | |||||
(3,184,317 | ) | ||||||
Net realized and unrealized (loss) | (3,170,701 | ) | |||||
NET (DECREASE) IN NET ASSETS FROM OPERATIONS | $ | (3,222,877 | ) | ||||
The accompanying notes are an integral part of the financial statements.
146
Statements of Changes in Net Assets
Annual Report December 31, 2022
Baillie Gifford Health Innovation Equities Fund
| For the Year Ended December 31, 2022 | For the Period December 28, 2021(a) through December 31, 2021 | ||||||||||
INCREASE (DECREASE) IN NET ASSETS FROM OPERATIONS | |||||||||||
Net investment (loss) | $ | (52,176 | ) | $ | (532 | ) | |||||
Net realized gain | 13,616 | 2,188 | |||||||||
Net change in unrealized (depreciation) | (3,184,317 | ) | (25,583 | ) | |||||||
Net (Decrease) in Net Assets from Operations | (3,222,877 | ) | (23,927 | ) | |||||||
DIVIDENDS AND DISTRIBUTIONS TO SHAREHOLDERS FROM: | |||||||||||
Distributable earnings | |||||||||||
Class K | (268 | ) | — | ||||||||
Institutional Class | (1,390 | ) | — | ||||||||
Total Distributions to Shareholders | (1,658 | ) | — | ||||||||
TRANSACTIONS IN SHARES OF BENEFICIAL INTEREST | |||||||||||
Net proceeds from shares subscribed: | |||||||||||
Class K | — | 5,000,000 | |||||||||
Institutional Class | 14,252,929 | 5,000,000 | |||||||||
Dividends reinvested: | |||||||||||
Class K | 267 | — | |||||||||
Institutional Class | 1,295 | — | |||||||||
Cost of shares redeemed: | |||||||||||
Institutional Class | (90,471 | ) | — | ||||||||
Increase in Net Assets from Transactions in Shares of Beneficial Interest | 14,164,020 | 10,000,000 | |||||||||
Total Increase in Net Assets | 10,939,485 | 9,976,073 | |||||||||
NET ASSETS | |||||||||||
Beginning of Period | 9,976,073 | — | |||||||||
End of Period | $ | 20,915,558 | $ | 9,976,073 | |||||||
(a) Commencement of investment operations.
The accompanying notes are an integral part of the financial statements.
147
Financial Highlights
Annual Report December 31, 2022
Baillie Gifford Health Innovation Equities Fund
Selected data for a Class K share outstanding throughout each period:
| For the Year Ended December 31, 2022 | For the Period December 28, 2021(a) through December 31, 2021 | ||||||||||
Net asset value, beginning of period | $ | 9.98 | $ | 10.00 | |||||||
From Investment Operations | |||||||||||
Net investment income (loss)(b) | (0.04 | ) | 0.00 | (c) | |||||||
Net realized and unrealized (loss) on investments and foreign currency | (3.20 | ) | (0.02 | ) | |||||||
Net (decrease) in net asset value from investment operations | (3.24 | ) | (0.02 | ) | |||||||
Dividends and Distributions to Shareholders | |||||||||||
From net investment income | — | — | |||||||||
From net realized gain on investments | — | — | |||||||||
Total dividends and distributions | — | — | |||||||||
Net asset value, end of period | $ | 6.74 | $ | 9.98 | |||||||
Total Return | |||||||||||
Total return based on net asset value(d) | (32.46 | )% | (0.20 | )% | |||||||
Ratios/Supplemental Data | |||||||||||
Net assets, end of period (000's omitted) | $ | 3,368 | $ | 4,988 | |||||||
Ratio of net expenses to average net assets, before waiver | 2.69 | % | 33.47 | %* | |||||||
Ratio of net expenses to average net assets, after waiver | 0.65 | % | 0.65 | %* | |||||||
Ratio of net investment (loss) to average net assets | (0.61 | )% | (0.65 | )%* | |||||||
Portfolio turnover rate(e) | 12 | % | 0 | % | |||||||
* Annualized.
(a) Commencement of investment operations.
(b) Calculated based upon average shares outstanding during the period.
(c) Amount is less than $0.005 per share.
(d) Total investment return is calculated assuming an initial investment made at the net asset value at the beginning of the period, reinvestment of all dividends and distributions, if any, at net asset value during the period, and redemption on the last day of the period. Total return is not annualized for periods less than one year.
(e) Portfolio turnover rate calculated at Fund level. Portfolio turnover is not annualized for periods less than one year.
The accompanying notes are an integral part of the financial statements.
148
Financial Highlights
Annual Report December 31, 2022
Baillie Gifford Health Innovation Equities Fund
Selected data for an Institutional Class share outstanding throughout each period:
| For the Year Ended December 31, 2022 | For the Period December 28, 2021(a) through December 31, 2021 | ||||||||||
Net asset value, beginning of period | $ | 9.98 | $ | 10.00 | |||||||
From Investment Operations | |||||||||||
Net investment income (loss)(b) | (0.04 | ) | 0.00 | (c) | |||||||
Net realized and unrealized (loss) on investments and foreign currency | (3.20 | ) | (0.02 | ) | |||||||
Net (decrease) in net asset value from investment operations | (3.24 | ) | (0.02 | ) | |||||||
Dividends and Distributions to Shareholders | |||||||||||
From net investment income | — | — | |||||||||
From net realized gain on investments | — | — | |||||||||
Total dividends and distributions | — | — | |||||||||
Net asset value, end of period | $ | 6.74 | $ | 9.98 | |||||||
Total Return | |||||||||||
Total return based on net asset value(d) | (32.46 | )% | (0.20 | )% | |||||||
Ratios/Supplemental Data | |||||||||||
Net assets, end of period (000's omitted) | $ | 17,547 | $ | 4,988 | |||||||
Ratio of net expenses to average net assets, before waiver | 2.69 | % | 33.47 | %* | |||||||
Ratio of net expenses to average net assets, after waiver | 0.65 | % | 0.65 | %* | |||||||
Ratio of net investment (loss) to average net assets | (0.57 | )% | (0.65 | )%* | |||||||
Portfolio turnover rate(e) | 12 | % | 0 | % | |||||||
* Annualized.
(a) Commencement of investment operations.
(b) Calculated based upon average shares outstanding during the period.
(c) Amount is less than $0.005 per share.
(d) Total investment return is calculated assuming an initial investment made at the net asset value at the beginning of the period, reinvestment of all dividends and distributions, if any, at net asset value during the period, and redemption on the last day of the period. Total return is not annualized for periods less than one year.
(e) Portfolio turnover rate calculated at Fund level. Portfolio turnover is not annualized for periods less than one year.
The accompanying notes are an integral part of the financial statements.
149
Industry Diversification Table
Annual Report December 31, 2022
December 31, 2022
Baillie Gifford International Alpha Fund
Value | % of Total Net Assets | ||||||||||
Airlines | $ | 76,383,003 | 3.6 | % | |||||||
Apparel | 21,333,749 | 1.0 | |||||||||
Auto Parts & Equipment | 29,301,296 | 1.4 | |||||||||
Banks | 35,230,434 | 1.7 | |||||||||
Biotechnology | 29,758,977 | 1.4 | |||||||||
Building Materials | 75,199,320 | 3.6 | |||||||||
Chemicals | 49,675,386 | 2.4 | |||||||||
Commercial Services | 138,578,977 | 6.5 | |||||||||
Cosmetics/Personal Care | 33,437,165 | 1.6 | |||||||||
Distribution/Wholesale | 46,230,751 | 2.2 | |||||||||
Diversified Financial Services | 156,944,099 | 7.4 | |||||||||
Electrical Components & Equipment | 13,268,303 | 0.6 | |||||||||
Electronics | 17,624,759 | 0.8 | |||||||||
Energy — Alternate Sources | 12,368,927 | 0.6 | |||||||||
Food | 82,776,786 | 3.9 | |||||||||
Healthcare — Products | 44,104,268 | 2.1 | |||||||||
Healthcare — Services | 9,077,332 | 0.4 | |||||||||
Home Furnishings | 66,294,703 | 3.1 | |||||||||
Insurance | 144,942,736 | 6.8 | |||||||||
Internet | 305,679,880 | 14.5 | |||||||||
Investment Companies | 20,197,567 | 1.0 | |||||||||
Leisure Time | 33,790,195 | 1.6 | |||||||||
Machinery — Construction & Mining | 33,902,453 | 1.6 | |||||||||
Machinery — Diversified | 152,527,949 | 7.2 | |||||||||
Mining | 46,941,933 | 2.2 | |||||||||
Pharmaceuticals | 8,463,159 | 0.4 | |||||||||
Retail | 43,925,943 | 2.1 | |||||||||
Semiconductors | 148,568,903 | 7.1 | |||||||||
Software | 126,701,761 | 5.9 | |||||||||
Toys/Games/Hobbies | 22,150,139 | 1.1 | |||||||||
Transportation | 50,312,843 | 2.4 | |||||||||
Total Value of Investments | 2,075,693,696 | 98.2 | |||||||||
Other assets less liabilities | 37,523,811 | 1.8 | |||||||||
Net Assets | $ | 2,113,217,507 | 100.0 | % | |||||||
The table above is based on Bloomberg Industry Group classifications. For compliance monitoring purposes, sub-industry classifications are used which results in less concentration across industry sectors.
150
Portfolio of Investments
Annual Report December 31, 2022
December 31, 2022
Baillie Gifford International Alpha Fund
Shares | Value | ||||||||||
COMMON STOCKS — 98.2% | |||||||||||
AUSTRALIA — 2.8% | |||||||||||
Cochlear Ltd. | 93,693 | $ | 12,939,699 | ||||||||
Rio Tinto PLC | 666,940 | 46,941,933 | |||||||||
59,881,632 | |||||||||||
BRAZIL — 3.3% | |||||||||||
| MercadoLibre, Inc. * | 82,383 | 69,715,790 | |||||||||
CANADA — 3.1% | |||||||||||
| AbCellera Biologics, Inc. * | 835,455 | 8,463,159 | |||||||||
Constellation Software, Inc. | 17,922 | 27,981,086 | |||||||||
Ritchie Bros. Auctioneers, Inc. | 228,655 | 13,223,119 | |||||||||
| Shopify, Inc., Class A * | 430,507 | 14,942,898 | |||||||||
64,610,262 | |||||||||||
CHINA — 7.0% | |||||||||||
| Alibaba Group Holding Ltd. * | 1,618,388 | 17,758,431 | |||||||||
| Meituan, Class B * | 1,254,400 | 27,792,280 | |||||||||
Ping An Insurance Group Co. of China Ltd., Class H | 3,019,000 | 19,834,061 | |||||||||
Prosus NV | 258,745 | 17,864,647 | |||||||||
Tencent Holdings Ltd. | 740,000 | 31,376,269 | |||||||||
| Tencent Music Entertainment Group ADR * | 2,858,742 | 23,670,384 | |||||||||
| Wuxi Biologics Cayman, Inc. * | 1,198,500 | 9,077,332 | |||||||||
147,373,404 | |||||||||||
DENMARK — 4.3% | |||||||||||
| Ambu A/S, B Shares * | 679,370 | 8,724,872 | |||||||||
Chr. Hansen Holding A/S | 308,964 | 22,224,644 | |||||||||
DSV A/S | 212,204 | 33,557,346 | |||||||||
Novozymes A/S, B Shares | 541,075 | 27,450,742 | |||||||||
91,957,604 | |||||||||||
FINLAND — 1.4% | |||||||||||
Kone Oyj, B Shares | 578,022 | 29,925,216 | |||||||||
FRANCE — 7.6% | |||||||||||
Danone SA | 613,785 | 32,349,988 | |||||||||
Dassault Systemes SE | 908,312 | 32,662,599 | |||||||||
The accompanying notes are an integral part of the financial statements.
151
Portfolio of Investments
Annual Report December 31, 2022
December 31, 2022
Baillie Gifford International Alpha Fund
Shares | Value | ||||||||||
Edenred | 699,995 | $ | 38,097,509 | ||||||||
Kering | 41,919 | 21,333,749 | |||||||||
Nexans SA | 146,596 | 13,268,303 | |||||||||
Sartorius Stedim Biotech | 69,052 | 22,439,697 | |||||||||
160,151,845 | |||||||||||
GERMANY — 8.4% | |||||||||||
BioNTech SE ADR | 136,262 | 20,469,278 | |||||||||
Deutsche Boerse AG | 247,587 | 42,632,052 | |||||||||
Rational AG | 50,619 | 30,058,944 | |||||||||
SAP SE | 459,891 | 47,479,486 | |||||||||
Scout24 SE | 737,473 | 37,119,720 | |||||||||
177,759,480 | |||||||||||
HONG KONG — 5.4% | |||||||||||
AIA Group Ltd. | 7,147,400 | 78,931,537 | |||||||||
| Futu Holdings Ltd. ADR * | 166,054 | 6,750,095 | |||||||||
Hong Kong Exchanges & Clearing Ltd. | 688,900 | 29,602,210 | |||||||||
115,283,842 | |||||||||||
INDIA — 3.6% | |||||||||||
Housing Development Finance Corp., Ltd. | 1,766,552 | 56,160,392 | |||||||||
ICICI Lombard General Insurance Co., Ltd. | 1,301,155 | 19,427,246 | |||||||||
75,587,638 | |||||||||||
IRELAND — 5.8% | |||||||||||
CRH PLC | 1,067,791 | 42,492,482 | |||||||||
Kingspan Group PLC | 604,072 | 32,706,838 | |||||||||
| Ryanair Holdings PLC ADR * | 633,037 | 47,325,846 | |||||||||
122,525,166 | |||||||||||
ITALY — 1.7% | |||||||||||
FinecoBank Banca Fineco SpA | 2,121,533 | 35,230,434 | |||||||||
JAPAN — 13.6% | |||||||||||
Denso Corp. | 597,500 | 29,301,296 | |||||||||
FANUC Corp. | 202,400 | 30,288,468 | |||||||||
Japan Exchange Group, Inc. | 1,512,500 | 21,799,350 | |||||||||
Keyence Corp. | 57,000 | 22,129,953 | |||||||||
MonotaRO Co., Ltd. | 1,753,300 | 24,696,783 | |||||||||
The accompanying notes are an integral part of the financial statements.
152
Portfolio of Investments
Annual Report December 31, 2022
December 31, 2022
Baillie Gifford International Alpha Fund
Shares | Value | ||||||||||
Nidec Corp. | 342,500 | $ | 17,624,759 | ||||||||
Nintendo Co., Ltd. | 526,800 | 22,150,139 | |||||||||
Shimano, Inc. | 155,600 | 24,587,740 | |||||||||
Shiseido Co., Ltd. | 682,200 | 33,437,165 | |||||||||
SMC Corp. | 59,600 | 24,886,207 | |||||||||
Sony Group Corp. | 475,400 | 36,235,758 | |||||||||
287,137,618 | |||||||||||
NETHERLANDS — 7.1% | |||||||||||
| Adyen NV * | 18,387 | 25,525,750 | |||||||||
| ASML Holding NV | 72,928 | 39,764,146 | |||||||||
| EXOR NV * | 275,869 | 20,197,567 | |||||||||
IMCD NV | 323,198 | 46,230,751 | |||||||||
| Topicus.com, Inc. * | 353,853 | 18,578,589 | |||||||||
150,296,803 | |||||||||||
NORWAY — 0.6% | |||||||||||
| Aker Carbon Capture ASA * | 10,538,898 | 12,368,927 | |||||||||
PANAMA — 1.0% | |||||||||||
| Copa Holdings SA, Class A * | 261,085 | 21,714,439 | |||||||||
RUSSIA — 0.0% (a) | |||||||||||
| Magnit PJSC *(b) | 237,700 | 0 | |||||||||
| Magnit PJSC GDR Reg S *(b) | 1 | 0 | |||||||||
MMC Norilsk Nickel PJSC (b) | 77,386 | 0 | |||||||||
MMC Norilsk Nickel PJSC ADR (b) | 1 | 0 | |||||||||
0 | |||||||||||
SINGAPORE — 0.4% | |||||||||||
| Sea Ltd. ADR * | 168,041 | 8,743,173 | |||||||||
SOUTH AFRICA — 1.3% | |||||||||||
| Discovery Ltd. * | 3,698,137 | 26,749,892 | |||||||||
SOUTH KOREA — 3.0% | |||||||||||
| Coupang, Inc. * | 1,188,771 | 17,486,821 | |||||||||
Samsung Electronics Co., Ltd. | 1,051,096 | 46,136,013 | |||||||||
63,622,834 | |||||||||||
The accompanying notes are an integral part of the financial statements.
153
Portfolio of Investments
Annual Report December 31, 2022
December 31, 2022
Baillie Gifford International Alpha Fund
Shares | Value | ||||||||||
SPAIN — 1.4% | |||||||||||
| Amadeus IT Group SA * | 571,024 | $ | 29,623,453 | ||||||||
SWEDEN — 4.2% | |||||||||||
Atlas Copco AB, B Shares | 4,245,510 | 45,298,106 | |||||||||
Epiroc AB, B Shares | 2,107,418 | 33,902,453 | |||||||||
MIPS AB | 222,627 | 9,202,455 | |||||||||
88,403,014 | |||||||||||
SWITZERLAND — 3.2% | |||||||||||
Cie Financiere Richemont SA | 338,778 | 43,925,943 | |||||||||
Kuehne + Nagel International AG | 72,072 | 16,755,497 | |||||||||
| Wizz Air Holdings PLC * | 321,123 | 7,342,718 | |||||||||
68,024,158 | |||||||||||
TAIWAN — 3.0% | |||||||||||
Taiwan Semiconductor Manufacturing Co., Ltd. | 4,315,000 | 62,668,744 | |||||||||
UNITED KINGDOM — 2.1% | |||||||||||
Experian PLC | 948,058 | 32,109,146 | |||||||||
| Just Eat Takeaway * | 159,921 | 3,364,076 | |||||||||
| Oxford Nanopore Technologies PLC * | 3,153,979 | 9,289,699 | |||||||||
44,762,921 | |||||||||||
UNITED STATES — 2.9% | |||||||||||
Nestle SA | 436,560 | 50,426,798 | |||||||||
| Spotify Technology SA * | 141,211 | 11,148,609 | |||||||||
61,575,407 | |||||||||||
TOTAL INVESTMENTS — 98.2% | |||||||||||
(cost $1,681,515,820) | $ | 2,075,693,696 | |||||||||
Other assets less liabilities — 1.8% | 37,523,811 | ||||||||||
NET ASSETS — 100.0% | �� | $ | 2,113,217,507 | ||||||||
(a) Amount rounds to less than 0.1%.
(b) Investment was valued using significant unobservable inputs.
* Non-income producing security.
ADR — American Depositary Receipt
GDR — Global Depositary Receipt
Reg S — Regulation S ("Reg S") under the Securities Act of 1933, as amended ("1933 Act") is a safe harbor that defines when an offering of securities will be deemed to come to rest abroad and therefore is not subject to the registration obligations imposed under Section 5 of the 1933 Act. The regulation includes two safe harbor provisions: an issuer safe harbor and a resale safe harbor. In each case, the regulation demands that offers and sales of the securities be made outside the United States and that no offering participant (which includes the issuer, the banks assisting with the offer and their respective affiliates) engage in "directed" selling efforts. In the case of issuers for whose securities there is substantial U.S. market interest, the regulation also requires that no offers and sales be made to U.S. persons (including U.S. persons physically located outside the United States). These securities have been deemed liquid under procedures approved by the Fund's Board of Trustees. At December 31, 2022, the net value of these securities was $0 representing 0.0% of net assets.
The accompanying notes are an integral part of the financial statements.
154
Portfolio of Investments
Annual Report December 31, 2022
December 31, 2022
Baillie Gifford International Alpha Fund
This report classifies issuers geographically by their country of risk. For compliance monitoring purposes, the Manager retains discretion to consider a number of factors in determining where a particular issuer is located, as described in further detail in each Fund's prospectus.
Fair Value Measurement
The following is a summary of the inputs used as of December 31, 2022 in valuing the Fund's investments carried at fair value:
Investments in Securities | Level 1 | Level 2 | Level 3 | Total | |||||||||||||||
| Common Stocks ** | $ | 310,213,286 | $ | 1,765,480,410 | $ | 0 | $ | 2,075,693,696 | |||||||||||
Total | $ | 310,213,286 | $ | 1,765,480,410 | $ | 0 | $ | 2,075,693,696 | |||||||||||
** Refer to Portfolio of Investments for further detail.
The following is a reconciliation of the Fund's Level 3 investments for which significant unobservable inputs were used in determining value:
Balance at December 31, 2021 | $ | — | |||||
Purchases | — | ||||||
Sales | (100,487 | ) | |||||
Realized (loss) | (1,661,532 | ) | |||||
Change in unrealized (loss) | (40,793,173 | ) | |||||
Transfers into Level 3 | 42,555,192 | ||||||
Transfers out of Level 3 | — | ||||||
Balance at December 31, 2022 | $ | 0 | |||||
Change in unrealized (loss) related to Investments still held at December 31, 2022 | $ | (40,793,173 | ) | ||||
$42,555,192 was transferred out of Level 2 into Level 3 during the period from December 31, 2021 to December 31, 2022.
Summary of Unobservable Inputs for Level 3 Investments
The ongoing conflict in Russia and Ukraine has led to significant disruption and volatility in the global stock market. This impacted the Fund in terms of suspensions of trading activities on the Russian Stock Exchange as well as suspensions of depositary receipts traded on exchanges outside of Russia. As a result, management made the decision to value several securities at nil and transfer them into Level 3. The impacted securities are as follows:
Magnit PJSC
Magnit PJSC GDR Reg S
MMC Norilsk Nickel PJSC
MMC Norilsk Nickel PJSC ADR
The accompanying notes are an integral part of the financial statements.
155
Statement of Assets and Liabilities
Annual Report December 31, 2022
December 31, 2022
Baillie Gifford International Alpha Fund
ASSETS | |||||||
Investments, at value (cost $1,681,515,820) | $ | 2,075,693,696 | |||||
Cash | 35,551,729 | ||||||
Foreign cash, at value (cost $50,846) | 50,771 | ||||||
Tax reclaims receivable | 5,462,710 | ||||||
Dividends receivable | 920,060 | ||||||
Capital shares sold receivable | 406,353 | ||||||
Prepaid assets | 23,178 | ||||||
Total Assets | 2,118,108,497 | ||||||
LIABILITIES | |||||||
Advisory fee payable | 1,890,053 | ||||||
Capital shares purchased payable | 408,881 | ||||||
Deferred India capital gains tax liability (Note A) | 972,339 | ||||||
Administration & Supervisory fee payable | 389,338 | ||||||
Shareholder Servicing fee payable | 320,648 | ||||||
Payable for investment purchased | 214,477 | ||||||
Trustee fee payable | 25,624 | ||||||
Commitment fee payable | 8,572 | ||||||
Accrued expenses | 661,058 | ||||||
Total Liabilities | 4,890,990 | ||||||
NET ASSETS | $ | 2,113,217,507 | |||||
COMPOSITION OF NET ASSETS | |||||||
Paid-in capital | $ | 1,869,382,663 | |||||
Total distributable earnings | 243,834,844 | ||||||
$ | 2,113,217,507 | ||||||
NET ASSET VALUE, PER SHARE | |||||||
| Class 2 ($324,524,809 / 30,007,788 shares outstanding), unlimited authorized, no par value | $ | 10.81 | |||||
| Class 3 ($388,154,824 / 35,312,911 shares outstanding), unlimited authorized, no par value | $ | 10.99 | |||||
| Class 4 ($511,619,587 / 45,683,607 shares outstanding), unlimited authorized, no par value | $ | 11.20 | |||||
| Class 5 ($51,399,789 / 4,495,952 shares outstanding), unlimited authorized, no par value | $ | 11.43 | |||||
| Class K ($700,531,448 / 65,041,705 shares outstanding), unlimited authorized, no par value | $ | 10.77 | |||||
| Institutional Class ($136,987,050 / 12,605,057 shares outstanding), unlimited authorized, no par value | $ | 10.87 | |||||
The accompanying notes are an integral part of the financial statements.
156
Statement of Operations
Annual Report December 31, 2022
For the Year Ended December 31, 2022
Baillie Gifford International Alpha Fund
INVESTMENT INCOME | |||||||
Dividends (net of foreign withholding taxes of $6,158,342) | $ | 41,831,252 | |||||
Non-cash income | 3,474,891 | ||||||
Windfall tax recovery (Note A) | 3,492,070 | ||||||
Interest | 107,005 | ||||||
Total Investment Income | 48,905,218 | ||||||
EXPENSES | |||||||
Advisory fee (Note B) | 9,176,421 | ||||||
Shareholder Servicing fees — Class 2 shares (Note B) | 554,841 | ||||||
Shareholder Servicing fees — Class 3 shares (Note B) | 412,387 | ||||||
Shareholder Servicing fees — Class 4 shares (Note B) | 416,648 | ||||||
Shareholder Servicing fees — Class 5 shares (Note B) | 18,000 | ||||||
Administration & Supervisory fee — Class K shares (Note B) | 1,456,288 | ||||||
Administration & Supervisory fee — Institutional Class shares (Note B) | 716,478 | ||||||
Transfer agency | 163,822 | ||||||
Sub-transfer agency — Institutional Class shares | 401,294 | ||||||
Fund accounting | 956,791 | ||||||
Custody | 601,109 | ||||||
Legal | 502,592 | ||||||
Trustees' fees | 108,147 | ||||||
Professional fees | 86,508 | ||||||
Registration fees | 62,981 | ||||||
Commitment fees | 35,931 | ||||||
Line of Credit Interest | 25,346 | ||||||
Miscellaneous | 266,330 | ||||||
Total Expenses | 15,961,914 | ||||||
Net Investment Income | 32,943,304 | ||||||
| REALIZED AND UNREALIZED GAIN (LOSS) ON INVESTMENTS AND FOREIGN CURRENCY TRANSACTIONS | |||||||
Net realized (loss) from: | |||||||
Investments (net of India capital gains tax expense of $501,343) | (124,919,195 | ) | |||||
Foreign currency transactions | (1,191,197 | ) | |||||
(126,110,392 | ) | ||||||
Net change in unrealized appreciation (depreciation) on: | |||||||
Investments (net of change in deferred India capital gains tax liability of $889,896) (Note A) | (978,526,524 | ) | |||||
Translation of net assets and liabilities denominated in foreign currencies | 64,944 | ||||||
(978,461,580 | ) | ||||||
Net realized and unrealized (loss) | (1,104,571,972 | ) | |||||
NET (DECREASE) IN NET ASSETS FROM OPERATIONS | $ | (1,071,628,668 | ) | ||||
The accompanying notes are an integral part of the financial statements.
157
Statements of Changes in Net Assets
Annual Report December 31, 2022
Baillie Gifford International Alpha Fund
| For the Year Ended December 31, 2022 | For the Year Ended December 31, 2021 | ||||||||||
INCREASE (DECREASE) IN NET ASSETS FROM OPERATIONS | |||||||||||
Net investment income | $ | 32,943,304 | $ | 39,653,062 | |||||||
Net realized gain (loss) | (126,110,392 | ) | 206,207,583 | ||||||||
Net change in unrealized (depreciation) | (978,461,580 | ) | (261,445,913 | ) | |||||||
Net (Decrease) in Net Assets from Operations | (1,071,628,668 | ) | (15,585,268 | ) | |||||||
DIVIDENDS AND DISTRIBUTIONS TO SHAREHOLDERS FROM: | |||||||||||
Distributable earnings | |||||||||||
Class 2 | (5,649,860 | ) | (24,786,900 | ) | |||||||
Class 3 | (6,886,811 | ) | (38,629,582 | ) | |||||||
Class 4 | (9,027,072 | ) | (66,380,678 | ) | |||||||
Class 5 | (911,339 | ) | (9,031,853 | ) | |||||||
Class K | (12,025,298 | ) | (91,864,785 | ) | |||||||
Institutional Class | (1,525,549 | ) | (56,749,052 | ) | |||||||
Total Distributions to Shareholders | (36,025,929 | ) | (287,442,850 | ) | |||||||
TRANSACTIONS IN SHARES OF BENEFICIAL INTEREST | |||||||||||
Net proceeds from shares subscribed: | |||||||||||
Class 2 | 182,272,469 | * | 21,780,009 | ||||||||
Class 3 | 215,842,807 | * | 167,796,050 | ||||||||
Class 4 | 2,420,000 | 233,443,729 | |||||||||
Class 5 | 9,380,896 | — | |||||||||
Class K | 138,561,731 | * | 251,570,911 | ||||||||
Institutional Class | 158,244,408 | * | 272,576,224 | ||||||||
Dividends reinvested: | |||||||||||
Class 2 | 5,649,860 | 24,786,899 | |||||||||
Class 3 | 6,886,811 | 38,629,582 | |||||||||
Class 4 | 9,027,072 | 66,380,677 | |||||||||
Class 5 | 911,339 | 9,031,928 | |||||||||
Class K | 10,989,690 | 82,904,506 | |||||||||
Institutional Class | 1,453,166 | 51,732,944 | |||||||||
Cost of shares redeemed: | |||||||||||
Class 2 | (81,665,960 | ) | (54,578,192 | ) | |||||||
Class 3 | (202,418,469 | )* | (404,578,419 | ) | |||||||
Class 4 | (161,424,480 | )* | (402,768,420 | ) | |||||||
Class 5 | (48,114,155 | ) | (24,534,404 | ) | |||||||
Class K | (320,802,089 | )* | (94,925,921 | ) | |||||||
Institutional Class | (584,695,815 | )* | (228,187,591 | ) | |||||||
Increase (Decrease) in Net Assets from Transactions in Shares of Beneficial Interest | (657,480,719 | ) | 11,060,512 | ||||||||
Total (Decrease) in Net Assets | (1,765,135,316 | ) | (291,967,606 | ) | |||||||
NET ASSETS | |||||||||||
Beginning of Year | 3,878,352,823 | 4,170,320,429 | |||||||||
End of Year | $ | 2,113,217,507 | $ | 3,878,352,823 | |||||||
* See Note D for details of share class conversions.
The accompanying notes are an integral part of the financial statements.
158
Financial Highlights
Annual Report December 31, 2022
Baillie Gifford International Alpha Fund
Selected data for a Class 2 share outstanding throughout each year:
| For the Year Ended December 31, 2022 | For the Year Ended December 31, 2021 | For the Year Ended December 31, 2020 | For the Year Ended December 31, 2019 | For the Year Ended December 31, 2018 | |||||||||||||||||||
Net asset value, beginning of year | $ | 15.43 | $ | 16.78 | $ | 13.57 | $ | 10.78 | $ | 14.20 | |||||||||||||
From Investment Operations | |||||||||||||||||||||||
Net investment income(a) | 0.13 | 0.16 | 0.12 | 0.27 | 0.22 | ||||||||||||||||||
| Net realized and unrealized gain (loss) on investments and foreign currency | (4.56 | ) | (0.28 | ) | 3.47 | 3.20 | (2.59 | ) | |||||||||||||||
| Net increase (decrease) in net asset value from investment operations | (4.43 | ) | (0.12 | ) | 3.59 | 3.47 | (2.37 | ) | |||||||||||||||
Dividends and Distributions to Shareholders | |||||||||||||||||||||||
From net investment income | (0.19 | ) | (0.16 | ) | (0.10 | ) | (0.34 | ) | (0.17 | ) | |||||||||||||
From net realized gain on investments | — | (1.07 | ) | (0.28 | ) | (0.34 | ) | (0.88 | ) | ||||||||||||||
Total dividends and distributions | (0.19 | ) | (1.23 | ) | (0.38 | ) | (0.68 | ) | (1.05 | ) | |||||||||||||
Net asset value, end of year | $ | 10.81 | $ | 15.43 | $ | 16.78 | $ | 13.57 | $ | 10.78 | |||||||||||||
Total Return | |||||||||||||||||||||||
Total return based on net asset value(b) | (28.64 | )% | (0.65 | )% | 26.45 | % | 32.14 | % | (16.57 | )% | |||||||||||||
Ratios/Supplemental Data | |||||||||||||||||||||||
Net assets, end of year (000's omitted) | $ | 324,525 | $ | 334,569 | $ | 367,841 | $ | 513,803 | $ | 335,450 | |||||||||||||
Ratio of net expenses to average net assets | 0.61 | % | 0.58 | % | 0.59 | % | 0.61 | % | 0.62 | % | |||||||||||||
| Ratio of net investment income to average net assets | 1.17 | % | 0.94 | % | 0.85 | % | 2.11 | %(c) | 1.57 | % | |||||||||||||
Portfolio turnover rate(d) | 19 | % | 16 | % | 24 | % | 13 | % | 33 | % | |||||||||||||
(a) Calculated based upon average shares outstanding during the period.
(b) Total investment return is calculated assuming an initial investment made at the net asset value at the beginning of the period, reinvestment of all dividends and distributions, if any, at net asset value during the period, and redemption on the last day of the period.
(c) Large increase due to one-off taxable stock dividends that were treated as income.
(d) Portfolio turnover rate calculated at Fund level.
The accompanying notes are an integral part of the financial statements.
159
Financial Highlights
Annual Report December 31, 2022
Baillie Gifford International Alpha Fund
Selected data for a Class 3 share outstanding throughout each year:
| For the Year Ended December 31, 2022 | For the Year Ended December 31, 2021 | For the Year Ended December 31, 2020 | For the Year Ended December 31, 2019 | For the Year Ended December 31, 2018 | |||||||||||||||||||
Net asset value, beginning of year | $ | 15.67 | $ | 17.02 | $ | 13.76 | $ | 10.92 | $ | 14.37 | |||||||||||||
From Investment Operations | |||||||||||||||||||||||
Net investment income(a) | 0.15 | 0.18 | 0.13 | 0.28 | 0.22 | ||||||||||||||||||
| Net realized and unrealized gain (loss) on investments and foreign currency | (4.63 | ) | (0.28 | ) | 3.52 | 3.24 | (2.60 | ) | |||||||||||||||
| Net increase (decrease) in net asset value from investment operations | (4.48 | ) | (0.10 | ) | 3.65 | 3.52 | (2.38 | ) | |||||||||||||||
Dividends and Distributions to Shareholders | |||||||||||||||||||||||
From net investment income | (0.20 | ) | (0.18 | ) | (0.11 | ) | (0.34 | ) | (0.19 | ) | |||||||||||||
From net realized gain on investments | — | (1.07 | ) | (0.28 | ) | (0.34 | ) | (0.88 | ) | ||||||||||||||
Total dividends and distributions | (0.20 | ) | (1.25 | ) | (0.39 | ) | (0.68 | ) | (1.07 | ) | |||||||||||||
Net asset value, end of year | $ | 10.99 | $ | 15.67 | $ | 17.02 | $ | 13.76 | $ | 10.92 | |||||||||||||
Total Return | |||||||||||||||||||||||
Total return based on net asset value(b) | (28.59 | )% | (0.58 | )% | 26.54 | % | 32.23 | % | (16.51 | )% | |||||||||||||
Ratios/Supplemental Data | |||||||||||||||||||||||
Net assets, end of year (000's omitted) | $ | 388,155 | $ | 524,717 | $ | 757,194 | $ | 668,206 | $ | 613,224 | |||||||||||||
Ratio of net expenses to average net assets | 0.54 | % | 0.51 | % | 0.52 | % | 0.54 | % | 0.55 | % | |||||||||||||
| Ratio of net investment income to average net assets | 1.22 | % | 1.01 | % | 0.92 | % | 2.18 | %(c) | 1.58 | % | |||||||||||||
Portfolio turnover rate(d) | 19 | % | 16 | % | 24 | % | 13 | % | 33 | % | |||||||||||||
(a) Calculated based upon average shares outstanding during the period.
(b) Total investment return is calculated assuming an initial investment made at the net asset value at the beginning of the period, reinvestment of all dividends and distributions, if any, at net asset value during the period, and redemption on the last day of the period.
(c) Large increase due to one-off taxable stock dividends that were treated as income.
(d) Portfolio turnover rate calculated at Fund level.
The accompanying notes are an integral part of the financial statements.
160
Financial Highlights
Annual Report December 31, 2022
Baillie Gifford International Alpha Fund
Selected data for a Class 4 share outstanding throughout each year:
| For the Year Ended December 31, 2022 | For the Year Ended December 31, 2021 | For the Year Ended December 31, 2020 | For the Year Ended December 31, 2019 | For the Year Ended December 31, 2018 | |||||||||||||||||||
Net asset value, beginning of year | $ | 15.96 | $ | 17.32 | $ | 14.00 | $ | 11.10 | $ | 14.59 | |||||||||||||
From Investment Operations | |||||||||||||||||||||||
Net investment income(a) | 0.16 | 0.19 | 0.12 | 0.28 | 0.23 | ||||||||||||||||||
| Net realized and unrealized gain (loss) on investments and foreign currency | (4.72 | ) | (0.30 | ) | 3.60 | 3.31 | (2.65 | ) | |||||||||||||||
| Net increase (decrease) in net asset value from investment operations | (4.56 | ) | (0.11 | ) | 3.72 | 3.59 | (2.42 | ) | |||||||||||||||
Dividends and Distributions to Shareholders | |||||||||||||||||||||||
From net investment income | (0.20 | ) | (0.18 | ) | (0.12 | ) | (0.35 | ) | (0.19 | ) | |||||||||||||
From net realized gain on investments | — | (1.07 | ) | (0.28 | ) | (0.34 | ) | (0.88 | ) | ||||||||||||||
Total dividends and distributions | (0.20 | ) | (1.25 | ) | (0.40 | ) | (0.69 | ) | (1.07 | ) | |||||||||||||
Net asset value, end of year | $ | 11.20 | $ | 15.96 | $ | 17.32 | $ | 14.00 | $ | 11.10 | |||||||||||||
Total Return | |||||||||||||||||||||||
Total return based on net asset value(b) | (28.57 | )% | (0.55 | )% | 26.57 | % | 32.27 | % | (16.49 | )% | |||||||||||||
Ratios/Supplemental Data | |||||||||||||||||||||||
Net assets, end of year (000's omitted) | $ | 511,620 | $ | 912,395 | $ | 1,082,123 | $ | 580,146 | $ | 438,616 | |||||||||||||
Ratio of net expenses to average net assets | 0.51 | % | 0.48 | % | 0.49 | % | 0.51 | % | 0.52 | % | |||||||||||||
| Ratio of net investment income to average net assets | 1.26 | % | 1.03 | % | 0.82 | % | 2.20 | %(c) | 1.61 | % | |||||||||||||
Portfolio turnover rate(d) | 19 | % | 16 | % | 24 | % | 13 | % | 33 | % | |||||||||||||
(a) Calculated based upon average shares outstanding during the period.
(b) Total investment return is calculated assuming an initial investment made at the net asset value at the beginning of the period, reinvestment of all dividends and distributions, if any, at net asset value during the period, and redemption on the last day of the period.
(c) Large increase due to one-off taxable stock dividends that were treated as income.
(d) Portfolio turnover rate calculated at Fund level.
The accompanying notes are an integral part of the financial statements.
161
Financial Highlights
Annual Report December 31, 2022
Baillie Gifford International Alpha Fund
Selected data for a Class 5 share outstanding throughout each year:
| For the Year Ended December 31, 2022 | For the Year Ended December 31, 2021 | For the Year Ended December 31, 2020 | For the Year Ended December 31, 2019 | For the Year Ended December 31, 2018 | |||||||||||||||||||
Net asset value, beginning of year | $ | 16.29 | $ | 17.65 | $ | 14.26 | $ | 11.30 | $ | 14.82 | |||||||||||||
From Investment Operations | |||||||||||||||||||||||
Net investment income(a) | 0.17 | 0.20 | 0.14 | 0.30 | 0.21 | ||||||||||||||||||
| Net realized and unrealized gain (loss) on investments and foreign currency | (4.82 | ) | (0.30 | ) | 3.66 | 3.35 | (2.65 | ) | |||||||||||||||
| Net increase (decrease) in net asset value from investment operations | (4.65 | ) | (0.10 | ) | 3.80 | 3.65 | (2.44 | ) | |||||||||||||||
Dividends and Distributions to Shareholders | |||||||||||||||||||||||
From net investment income | (0.21 | ) | (0.19 | ) | (0.13 | ) | (0.35 | ) | (0.20 | ) | |||||||||||||
From net realized gain on investments | — | (1.07 | ) | (0.28 | ) | (0.34 | ) | (0.88 | ) | ||||||||||||||
Total dividends and distributions | (0.21 | ) | (1.26 | ) | (0.41 | ) | (0.69 | ) | (1.08 | ) | |||||||||||||
Net asset value, end of year | $ | 11.43 | $ | 16.29 | $ | 17.65 | $ | 14.26 | $ | 11.30 | |||||||||||||
Total Return | |||||||||||||||||||||||
Total return based on net asset value(b) | (28.53 | )% | (0.50 | )% | 26.64 | % | 32.34 | % | (16.44 | )% | |||||||||||||
Ratios/Supplemental Data | |||||||||||||||||||||||
Net assets, end of year (000's omitted) | $ | 51,400 | $ | 125,578 | $ | 149,745 | $ | 104,935 | $ | 79,293 | |||||||||||||
Ratio of net expenses to average net assets | 0.46 | % | 0.43 | % | 0.44 | % | 0.46 | % | 0.47 | % | |||||||||||||
| Ratio of net investment income to average net assets | 1.39 | % | 1.09 | % | 0.94 | % | 2.25 | %(c) | 1.55 | % | |||||||||||||
Portfolio turnover rate(d) | 19 | % | 16 | % | 24 | % | 13 | % | 33 | % | |||||||||||||
(a) Calculated based upon average shares outstanding during the period.
(b) Total investment return is calculated assuming an initial investment made at the net asset value at the beginning of the period, reinvestment of all dividends and distributions, if any, at net asset value during the period, and redemption on the last day of the period.
(c) Large increase due to one-off taxable stock dividends that were treated as income.
(d) Portfolio turnover rate calculated at Fund level.
The accompanying notes are an integral part of the financial statements.
162
Financial Highlights
Annual Report December 31, 2022
Baillie Gifford International Alpha Fund
Selected data for a Class K share outstanding throughout each year:
| For the Year Ended December 31, 2022 | For the Year Ended December 31, 2021 | For the Year Ended December 31, 2020 | For the Year Ended December 31, 2019 | For the Year Ended December 31, 2018 | |||||||||||||||||||
Net asset value, beginning of year | $ | 15.36 | $ | 16.71 | $ | 13.53 | $ | 10.75 | $ | 14.17 | |||||||||||||
From Investment Operations | |||||||||||||||||||||||
Net investment income(a) | 0.14 | 0.16 | 0.10 | 0.26 | 0.17 | ||||||||||||||||||
| Net realized and unrealized gain (loss) on investments and foreign currency | (4.54 | ) | (0.27 | ) | 3.47 | 3.20 | (2.52 | ) | |||||||||||||||
| Net increase (decrease) in net asset value from investment operations | (4.40 | ) | (0.11 | ) | 3.57 | 3.46 | (2.35 | ) | |||||||||||||||
Dividends and Distributions to Shareholders | |||||||||||||||||||||||
From net investment income | (0.19 | ) | (0.17 | ) | (0.11 | ) | (0.34 | ) | (0.19 | ) | |||||||||||||
From net realized gain on investments | — | (1.07 | ) | (0.28 | ) | (0.34 | ) | (0.88 | ) | ||||||||||||||
Total dividends and distributions | (0.19 | ) | (1.24 | ) | (0.39 | ) | (0.68 | ) | (1.07 | ) | |||||||||||||
Net asset value, end of year | $ | 10.77 | $ | 15.36 | $ | 16.71 | $ | 13.53 | $ | 10.75 | |||||||||||||
Total Return | |||||||||||||||||||||||
Total return based on net asset value(b) | (28.65 | )% | (0.62 | )% | 26.40 | % | 32.16 | % | (16.54 | )% | |||||||||||||
Ratios/Supplemental Data | |||||||||||||||||||||||
Net assets, end of year (000's omitted) | $ | 700,531 | $ | 1,222,693 | $ | 1,083,711 | $ | 566,554 | $ | 290,186 | |||||||||||||
Ratio of net expenses to average net assets | 0.61 | % | 0.58 | % | 0.59 | % | 0.61 | % | 0.62 | % | |||||||||||||
| Ratio of net investment income to average net assets | 1.20 | % | 0.92 | % | 0.74 | % | 2.09 | %(c) | 1.26 | % | |||||||||||||
Portfolio turnover rate(d) | 19 | % | 16 | % | 24 | % | 13 | % | 33 | % | |||||||||||||
(a) Calculated based upon average shares outstanding during the period.
(b) Total investment return is calculated assuming an initial investment made at the net asset value at the beginning of the period, reinvestment of all dividends and distributions, if any, at net asset value during the period, and redemption on the last day of the period.
(c) Large increase due to one-off taxable stock dividends that were treated as income.
(d) Portfolio turnover rate calculated at Fund level.
The accompanying notes are an integral part of the financial statements.
163
Financial Highlights
Annual Report December 31, 2022
Baillie Gifford International Alpha Fund
Selected data for an Institutional Class share outstanding throughout each year:
| For the Year Ended December 31, 2022 | For the Year Ended December 31, 2021 | For the Year Ended December 31, 2020 | For the Year Ended December 31, 2019 | For the Year Ended December 31, 2018 | |||||||||||||||||||
Net asset value, beginning of year | $ | 15.41 | $ | 16.76 | $ | 13.58 | $ | 10.79 | $ | 14.19 | |||||||||||||
From Investment Operations | |||||||||||||||||||||||
Net investment income(a) | 0.14 | 0.14 | 0.08 | 0.25 | 0.22 | ||||||||||||||||||
| Net realized and unrealized gain (loss) on investments and foreign currency | (4.56 | ) | (0.27 | ) | 3.49 | 3.22 | (2.59 | ) | |||||||||||||||
| Net increase (decrease) in net asset value from investment operations | (4.42 | ) | (0.13 | ) | 3.57 | 3.47 | (2.37 | ) | |||||||||||||||
Dividends and Distributions to Shareholders | |||||||||||||||||||||||
From net investment income | (0.12 | ) | (0.15 | ) | (0.11 | ) | (0.34 | ) | (0.15 | ) | |||||||||||||
From net realized gain on investments | — | (1.07 | ) | (0.28 | ) | (0.34 | ) | (0.88 | ) | ||||||||||||||
Total dividends and distributions | (0.12 | ) | (1.22 | ) | (0.39 | ) | (0.68 | ) | (1.03 | ) | |||||||||||||
Net asset value, end of year | $ | 10.87 | $ | 15.41 | $ | 16.76 | $ | 13.58 | $ | 10.79 | |||||||||||||
Total Return | |||||||||||||||||||||||
Total return based on net asset value(b) | (28.67 | )% | (0.74 | )% | 26.29 | % | 32.11 | % | (16.68 | )% | |||||||||||||
Ratios/Supplemental Data | |||||||||||||||||||||||
Net assets, end of year (000's omitted) | $ | 136,987 | $ | 758,401 | $ | 729,705 | $ | 126,189 | $ | 38,019 | |||||||||||||
Ratio of net expenses to average net assets | 0.71 | % | 0.68 | % | 0.67 | % | 0.67 | % | 0.72 | % | |||||||||||||
| Ratio of net investment income to average net assets | 1.20 | % | 0.82 | % | 0.52 | % | 1.93 | %(c) | 1.58 | % | |||||||||||||
Portfolio turnover rate(d) | 19 | % | 16 | % | 24 | % | 13 | % | 33 | % | |||||||||||||
(a) Calculated based upon average shares outstanding during the period.
(b) Total investment return is calculated assuming an initial investment made at the net asset value at the beginning of the period, reinvestment of all dividends and distributions, if any, at net asset value during the period, and redemption on the last day of the period.
(c) Large increase due to one-off taxable stock dividends that were treated as income.
(d) Portfolio turnover rate calculated at Fund level.
The accompanying notes are an integral part of the financial statements.
164
Industry Diversification Table
Annual Report December 31, 2022
December 31, 2022
Baillie Gifford International Concentrated Growth Equities Fund
Value | % of Total Net Assets | ||||||||||
Apparel | $ | 5,969,842 | 8.8 | % | |||||||
Auto Manufacturers | 5,281,853 | 7.9 | |||||||||
Biotechnology | 9,269,282 | 13.7 | |||||||||
Commercial Services | 3,950,959 | 5.9 | |||||||||
Cosmetics/Personal Care | 1,480,376 | 2.2 | |||||||||
Food | 2,519,307 | 3.7 | |||||||||
Healthcare — Services | 313,547 | 0.5 | |||||||||
Internet | 24,307,498 | 35.9 | |||||||||
Investment Companies | 992,534 | 1.5 | |||||||||
Machinery — Diversified | 1,147,990 | 1.7 | |||||||||
Retail | 2,719,326 | 4.0 | |||||||||
Semiconductors | 9,727,045 | 14.5 | |||||||||
Total Value of Investments | 67,679,559 | 100.3 | |||||||||
Other assets less liabilities | (180,257 | ) | (0.3 | ) | |||||||
Net Assets | $ | 67,499,302 | 100.0 | % | |||||||
The table above is based on Bloomberg Industry Group classifications. For compliance monitoring purposes, sub-industry classifications are used which results in less concentration across industry sectors.
165
Portfolio of Investments
Annual Report December 31, 2022
December 31, 2022
Baillie Gifford International Concentrated Growth Equities Fund
Shares | Value | ||||||||||
COMMON STOCKS — 100.3% | |||||||||||
BRAZIL — 9.8% | |||||||||||
| MercadoLibre, Inc. * | 7,802 | $ | 6,602,365 | ||||||||
CANADA — 1.3% | |||||||||||
| Shopify, Inc., Class A * | 25,868 | 897,878 | |||||||||
CHINA — 15.0% | |||||||||||
| Alibaba Group Holding Ltd. * | 136,524 | 1,498,066 | |||||||||
| Meituan, Class B * | 208,800 | 4,626,138 | |||||||||
| NIO, Inc. ADR * | 101,137 | 986,086 | |||||||||
Tencent Holdings Ltd. | 71,300 | 3,023,146 | |||||||||
10,133,436 | |||||||||||
DENMARK — 4.5% | |||||||||||
| Genmab A/S * | 7,207 | 3,047,082 | |||||||||
FRANCE — 11.0% | |||||||||||
Hermes International | 1,938 | 2,999,738 | |||||||||
Kering | 5,836 | 2,970,104 | |||||||||
L'Oreal SA | 4,134 | 1,480,376 | |||||||||
7,450,218 | |||||||||||
GERMANY — 4.0% | |||||||||||
| Zalando SE * | 77,243 | 2,719,326 | |||||||||
ITALY — 4.5% | |||||||||||
Ferrari NV | 14,174 | 3,039,454 | |||||||||
JAPAN — 2.6% | |||||||||||
M3, Inc. | 63,200 | 1,716,722 | |||||||||
NETHERLANDS — 18.2% | |||||||||||
| Adyen NV * | 2,846 | 3,950,959 | |||||||||
| ASML Holding NV | 15,296 | 8,340,176 | |||||||||
12,291,135 | |||||||||||
SOUTH KOREA — 6.2% | |||||||||||
| Delivery Hero SE * | 86,600 | 4,155,913 | |||||||||
The accompanying notes are an integral part of the financial statements.
166
Portfolio of Investments
Annual Report December 31, 2022
December 31, 2022
Baillie Gifford International Concentrated Growth Equities Fund
Shares | Value | ||||||||||
SWEDEN — 3.2% | |||||||||||
Atlas Copco AB, B Shares | 107,594 | $ | 1,147,990 | ||||||||
| Kinnevik AB, B Shares * | 72,110 | 992,535 | |||||||||
2,140,525 | |||||||||||
UNITED KINGDOM — 3.7% | |||||||||||
| Ocado Group PLC * | 339,391 | 2,519,306 | |||||||||
UNITED STATES — 16.3% | |||||||||||
| Ginkgo Bioworks Holdings, Inc. * | 185,531 | 313,547 | |||||||||
| Illumina, Inc. * | 9,378 | 1,896,232 | |||||||||
| Moderna, Inc. * | 24,084 | 4,325,968 | |||||||||
NVIDIA Corp. | 9,490 | 1,386,869 | |||||||||
| Spotify Technology SA * | 22,638 | 1,787,270 | |||||||||
| Tesla, Inc. * | 10,199 | 1,256,313 | |||||||||
10,966,199 | |||||||||||
| TOTAL INVESTMENTS — 100.3% ** | |||||||||||
(cost $80,595,852) | $ | 67,679,559 | |||||||||
Other liabilities less assets — (0.3)% | (180,257 | ) | |||||||||
NET ASSETS — 100.0% | $ | 67,499,302 | |||||||||
* Non-income producing security.
** The Total Investments percentage exceeds 100% due to the timing of settling transactions and not as a result of borrowings for investment purposes.
ADR — American Depositary Receipt
This report classifies issuers geographically by their country of risk. For compliance monitoring purposes, the Manager retains discretion to consider a number of factors in determining where a particular issuer is located, as described in further detail in each Fund's prospectus.
Fair Value Measurement
The following is a summary of the inputs used as of December 31, 2022 in valuing the Fund's investments carried at fair value:
Investments in Securities | Level 1 | Level 2 | Level 3 | Total | |||||||||||||||
| Common Stocks *** | $ | 19,452,527 | $ | 48,227,032 | $ | — | $ | 67,679,559 | |||||||||||
Total | $ | 19,452,527 | $ | 48,227,032 | $ | — | $ | 67,679,559 | |||||||||||
*** Refer to Portfolio of Investments for further detail.
The accompanying notes are an integral part of the financial statements.
167
Statement of Assets and Liabilities
Annual Report December 31, 2022
December 31, 2022
Baillie Gifford International Concentrated Growth Equities Fund
ASSETS | |||||||
Investments, at value (cost $80,595,852) | $ | 67,679,559 | |||||
Cash | 22,511 | ||||||
Receivable for investments sold | 2,477,991 | ||||||
Capital shares sold receivable | 152,641 | ||||||
Tax reclaims receivable | 34,489 | ||||||
Due from Manager | 29,810 | ||||||
Prepaid assets | 23,119 | ||||||
Total Assets | 70,420,120 | ||||||
LIABILITIES | |||||||
Advisory fee payable | 71,619 | ||||||
Line of credit payable | 1,500,000 | ||||||
Capital shares purchased payable | 1,228,144 | ||||||
Administration & Supervisory fee payable | 30,438 | ||||||
Trustee fee payable | 848 | ||||||
Commitment fee payable | 283 | ||||||
Accrued expenses | 89,486 | ||||||
Total Liabilities | 2,920,818 | ||||||
NET ASSETS | $ | 67,499,302 | |||||
COMPOSITION OF NET ASSETS | |||||||
Paid-in capital | $ | 107,220,553 | |||||
Total accumulated (loss) | (39,721,251 | ) | |||||
$ | 67,499,302 | ||||||
NET ASSET VALUE, PER SHARE | |||||||
| Class K ($29,866,506 / 5,305,962 shares outstanding), unlimited authorized, no par value | $ | 5.63 | |||||
| Institutional Class ($37,632,796 / 6,774,521 shares outstanding), unlimited authorized, no par value | $ | 5.56 | |||||
The accompanying notes are an integral part of the financial statements.
168
Statement of Operations
Annual Report December 31, 2022
For the Year Ended December 31, 2022
Baillie Gifford International Concentrated Growth Equities Fund
INVESTMENT INCOME | |||||||
Dividends (net of foreign withholding taxes of $68,034) | $ | 304,572 | |||||
Non-cash income | 202,279 | ||||||
Interest | 5,248 | ||||||
Total Investment Income | 512,099 | ||||||
EXPENSES | |||||||
Advisory fee (Note B) | 341,874 | ||||||
Administration & Supervisory fee — Class K shares (Note B) | 63,556 | ||||||
Administration & Supervisory fee — Institutional Class shares (Note B) | 81,740 | ||||||
Transfer agency | 47,394 | ||||||
Sub-transfer agency — Institutional Class shares | 42,459 | ||||||
Fund accounting | 94,351 | ||||||
Registration fees | 55,080 | ||||||
Professional fees | 33,906 | ||||||
Custody | 23,982 | ||||||
Legal | 15,880 | ||||||
Line of credit interest | 4,542 | ||||||
Trustees' fees | 3,376 | ||||||
Commitment fees | 1,109 | ||||||
Miscellaneous | 10,342 | ||||||
Total Expenses | 819,591 | ||||||
Fees waived/expenses reimbursed | (161,759 | ) | |||||
Total Expenses after Waiver | 657,832 | ||||||
Net Investment (Loss) | (145,733 | ) | |||||
| REALIZED AND UNREALIZED GAIN (LOSS) ON INVESTMENTS AND FOREIGN CURRENCY TRANSACTIONS | |||||||
Net realized (loss) from: | |||||||
Investments | (21,142,108 | ) | |||||
Foreign currency transactions | (18,464 | ) | |||||
(21,160,572 | ) | ||||||
Net change in unrealized appreciation (depreciation) on: | |||||||
Investments | (32,966,384 | ) | |||||
Translation of net assets and liabilities denominated in foreign currencies | 1,224 | ||||||
(32,965,160 | ) | ||||||
Net realized and unrealized (loss) | (54,125,732 | ) | |||||
NET (DECREASE) IN NET ASSETS FROM OPERATIONS | $ | (54,271,465 | ) | ||||
The accompanying notes are an integral part of the financial statements.
169
Statements of Changes in Net Assets
Annual Report December 31, 2022
Baillie Gifford International Concentrated Growth Equities Fund
| For the Year Ended December 31, 2022 | For the Year Ended December 31, 2021 | ||||||||||
INCREASE (DECREASE) IN NET ASSETS FROM OPERATIONS | |||||||||||
Net investment income (loss) | $ | (145,733 | ) | $ | 248,071 | ||||||
Net realized gain (loss) | (21,160,572 | ) | 3,666,248 | ||||||||
Net change in unrealized (depreciation) | (32,965,160 | ) | (11,690,410 | ) | |||||||
Net (Decrease) in Net Assets from Operations | (54,271,465 | ) | (7,776,091 | ) | |||||||
DIVIDENDS AND DISTRIBUTIONS TO SHAREHOLDERS FROM: | |||||||||||
Distributable earnings | |||||||||||
Class K | (1,870,224 | ) | (12,048,790 | ) | |||||||
Institutional Class | (2,240,014 | ) | (11,556,065 | ) | |||||||
Total Distributions to Shareholders | (4,110,238 | ) | (23,604,855 | ) | |||||||
TRANSACTIONS IN SHARES OF BENEFICIAL INTEREST | |||||||||||
Net proceeds from shares subscribed: | |||||||||||
Class K | 21,349,940 | 32,264,192 | |||||||||
Institutional Class | 66,139,903 | 103,591,639 | |||||||||
Dividends reinvested: | |||||||||||
Class K | 1,767,282 | 11,398,944 | |||||||||
Institutional Class | 2,240,014 | 11,556,064 | |||||||||
Cost of shares redeemed: | |||||||||||
Class K | (24,487,536 | ) | (16,619,698 | ) | |||||||
Institutional Class | (54,919,668 | ) | (57,388,368 | ) | |||||||
Increase in Net Assets from Transactions in Shares of Beneficial Interest | 12,089,935 | 84,802,773 | |||||||||
Total Increase (Decrease) in Net Assets | (46,291,768 | ) | 53,421,827 | ||||||||
NET ASSETS | |||||||||||
Beginning of Year | 113,791,070 | 60,369,243 | |||||||||
End of Year | $ | 67,499,302 | $ | 113,791,070 | |||||||
The accompanying notes are an integral part of the financial statements.
170
Financial Highlights
Annual Report December 31, 2022
Baillie Gifford International Concentrated Growth Equities Fund
Selected data for a Class K share outstanding throughout each year:
| For the Year Ended December 31, 2022 | For the Year Ended December 31, 2021 | For the Year Ended December 31, 2020 | For the Year Ended December 31, 2019 | For the Year Ended December 31, 2018 | |||||||||||||||||||
Net asset value, beginning of year | $ | 9.89 | $ | 12.31 | $ | 12.70 | $ | 8.75 | $ | 10.05 | |||||||||||||
From Investment Operations | |||||||||||||||||||||||
Net investment income (loss)(a) | (0.01 | ) | 0.04 | (0.04 | ) | 0.03 | (0.03 | ) | |||||||||||||||
| Net realized and unrealized gain (loss) on investments and foreign currency | (3.91 | ) | 0.03 | 12.16 | 3.94 | (1.27 | ) | ||||||||||||||||
| Net increase (decrease) in net asset value from investment operations | (3.92 | ) | 0.07 | 12.12 | 3.97 | (1.30 | ) | ||||||||||||||||
Dividends and Distributions to Shareholders | |||||||||||||||||||||||
From net investment income | (0.00 | )(b) | (0.03 | ) | — | (0.02 | ) | — | |||||||||||||||
From net realized gain on investments | (0.34 | ) | (2.46 | ) | (12.51 | ) | — | — | |||||||||||||||
Total dividends and distributions | (0.34 | ) | (2.49 | ) | (12.51 | ) | (0.02 | ) | — | ||||||||||||||
Net asset value, end of year | $ | 5.63 | $ | 9.89 | $ | 12.31 | $ | 12.70 | $ | 8.75 | |||||||||||||
Total Return | |||||||||||||||||||||||
Total return based on net asset value(c) | (39.55 | )% | 0.74 | % | 97.24 | % | 45.26 | % | (12.84 | )% | |||||||||||||
Ratios/Supplemental Data | |||||||||||||||||||||||
Net assets, end of year (000's omitted) | $ | 29,867 | $ | 56,513 | $ | 42,357 | $ | 101,797 | $ | 55,852 | |||||||||||||
| Ratio of net expenses to average net assets, before waiver | 0.91 | % | 0.79 | % | 0.79 | % | 0.90 | % | 1.07 | % | |||||||||||||
| Ratio of net expenses to average net assets, after waiver | 0.72 | % | 0.72 | % | 0.72 | % | 0.72 | % | 0.72 | % | |||||||||||||
| Ratio of net investment income (loss) to average net assets | (0.10 | )% | 0.27 | % | (0.26 | )% | 0.26 | %(d) | (0.26 | )% | |||||||||||||
Portfolio turnover rate(e) | 65 | % | 54 | % | 59 | % | 4 | % | 32 | % | |||||||||||||
(a) Calculated based upon average shares outstanding during the period.
(b) Amount is less than $0.005 per share.
(c) Total investment return is calculated assuming an initial investment made at the net asset value at the beginning of the period, reinvestment of all dividends and distributions, if any, at net asset value during the period, and redemption on the last day of the period.
(d) Large increase due to one-off taxable stock dividends that were treated as income.
(e) Portfolio turnover rate calculated at Fund level.
The accompanying notes are an integral part of the financial statements.
171
Financial Highlights
Annual Report December 31, 2022
Baillie Gifford International Concentrated Growth Equities Fund
Selected data for an Institutional Class share outstanding throughout each year:
| For the Year Ended December 31, 2022 | For the Year Ended December 31, 2021 | For the Year Ended December 31, 2020 | For the Year Ended December 31, 2019 | For the Year Ended December 31, 2018 | |||||||||||||||||||
Net asset value, beginning of year | $ | 9.78 | $ | 12.19 | $ | 12.65 | $ | 8.72 | $ | 10.05 | |||||||||||||
From Investment Operations | |||||||||||||||||||||||
Net investment income (loss)(a) | (0.01 | ) | 0.01 | (0.09 | ) | 0.03 | (0.06 | ) | |||||||||||||||
| Net realized and unrealized gain (loss) on investments and foreign currency | (3.87 | ) | 0.05 | 12.14 | 3.92 | (1.27 | ) | ||||||||||||||||
| Net increase (decrease) in net asset value from investment operations | (3.88 | ) | 0.06 | 12.05 | 3.95 | (1.33 | ) | ||||||||||||||||
Dividends and Distributions to Shareholders | |||||||||||||||||||||||
From net investment income | (0.00 | )(b) | (0.01 | ) | — | (0.02 | ) | — | |||||||||||||||
From net realized gain on investments | (0.34 | ) | (2.46 | ) | (12.51 | ) | — | — | |||||||||||||||
Total dividends and distributions | (0.34 | ) | (2.47 | ) | (12.51 | ) | (0.02 | ) | — | ||||||||||||||
Net asset value, end of year | $ | 5.56 | $ | 9.78 | $ | 12.19 | $ | 12.65 | $ | 8.72 | |||||||||||||
Total Return | |||||||||||||||||||||||
Total return based on net asset value(c) | (39.58 | )% | 0.69 | % | 97.09 | % | 45.32 | % | (13.23 | )% | |||||||||||||
Ratios/Supplemental Data | |||||||||||||||||||||||
Net assets, end of year (000's omitted) | $ | 37,633 | $ | 57,278 | $ | 18,012 | $ | 876 | $ | 476 | |||||||||||||
| Ratio of net expenses to average net assets, before waiver | 1.00 | % | 0.90 | % | 0.87 | % | 0.91 | % | 1.16 | % | |||||||||||||
| Ratio of net expenses to average net assets, after waiver | 0.81 | % | 0.83 | % | 0.80 | % | 0.73 | % | 0.81 | % | |||||||||||||
| Ratio of net investment income (loss) to average net assets | (0.22 | )% | 0.11 | % | (0.47 | )% | 0.30 | %(d) | (0.53 | )% | |||||||||||||
Portfolio turnover rate(e) | 65 | % | 54 | % | 59 | % | 4 | % | 32 | % | |||||||||||||
(a) Calculated based upon average shares outstanding during the period.
(b) Amount is less than $0.005 per share.
(c) Total investment return is calculated assuming an initial investment made at the net asset value at the beginning of the period, reinvestment of all dividends and distributions, if any, at net asset value during the period, and redemption on the last day of the period.
(d) Large increase due to one-off taxable stock dividends that were treated as income.
(e) Portfolio turnover rate calculated at Fund level.
The accompanying notes are an integral part of the financial statements.
172
Industry Diversification Table
Annual Report December 31, 2022
December 31, 2022
Baillie Gifford International Growth Fund
Value | % of Total Net Assets | ||||||||||
Apparel | $ | 116,839,163 | 4.5 | % | |||||||
Auto Manufacturers | 158,564,969 | 6.1 | |||||||||
Auto Parts & Equipment | 12,230,260 | 0.5 | |||||||||
Banks | 16,445,315 | 0.6 | |||||||||
Beverages | 3,493,080 | 0.1 | |||||||||
Biotechnology | 213,788,377 | 8.2 | |||||||||
Chemicals | 84,996,365 | 3.4 | |||||||||
Commercial Services | 136,367,362 | 5.2 | |||||||||
Computers | 14,222,050 | 0.5 | |||||||||
Cosmetics/Personal Care | 75,651,016 | 2.9 | |||||||||
Diversified Financial Services | 60,542,272 | 2.3 | |||||||||
Electrical Components & Equipment | 13,285,555 | 0.5 | |||||||||
Electronics | 105,523,631 | 4.0 | |||||||||
Energy — Alternate Sources | 46,949,365 | 1.8 | |||||||||
Food | 64,459,740 | 2.5 | |||||||||
Healthcare — Products | 20,702,040 | 0.8 | |||||||||
Healthcare — Services | 27,663,710 | 1.1 | |||||||||
Insurance | 74,114,410 | 2.9 | |||||||||
Internet | 709,864,304 | 27.6 | |||||||||
Investment Companies | 68,011,091 | 2.6 | |||||||||
Machinery — Diversified | 120,344,547 | 4.6 | |||||||||
Media | 9,856,758 | 0.4 | |||||||||
Retail | 60,083,754 | 2.3 | |||||||||
Semiconductors | 276,465,771 | 10.7 | |||||||||
Software | 88,815,055 | 3.3 | |||||||||
Total Value of Investments | 2,579,279,960 | 99.4 | |||||||||
Other assets less liabilities | 15,937,180 | 0.6 | |||||||||
Net Assets | $ | 2,595,217,140 | 100.0 | % | |||||||
The table above is based on Bloomberg Industry Group classifications. For compliance monitoring purposes, sub-industry classifications are used which results in less concentration across industry sectors.
173
Portfolio of Investments
Annual Report December 31, 2022
December 31, 2022
Baillie Gifford International Growth Fund
Shares | Value | ||||||||||
COMMON STOCKS — 97.2% | |||||||||||
AUSTRALIA — 1.7% | |||||||||||
WiseTech Global Ltd. | 1,307,420 | $ | 44,965,366 | ||||||||
BELGIUM — 2.1% | |||||||||||
Umicore SA | 1,451,150 | 53,373,004 | |||||||||
BRAZIL — 5.4% | |||||||||||
| MercadoLibre, Inc. * | 145,742 | 123,332,710 | |||||||||
| NU Holdings Ltd., Class A * | 4,040,618 | 16,445,315 | |||||||||
139,778,025 | |||||||||||
CHINA — 13.7% | |||||||||||
| Alibaba Group Holding Ltd. * | 3,425,908 | 37,592,192 | |||||||||
Ganfeng Lithium Group Co. Ltd., Class H | 1,634,000 | 12,113,358 | |||||||||
| Meituan, Class B * | 5,291,900 | 117,246,464 | |||||||||
| NIO, Inc. ADR * | 3,098,212 | 30,207,567 | |||||||||
| Pinduoduo, Inc. ADR * | 280,511 | 22,875,672 | |||||||||
Tencent Holdings Ltd. | 2,513,500 | 106,573,315 | |||||||||
| Wuxi Biologics Cayman, Inc. * | 3,652,500 | 27,663,710 | |||||||||
354,272,278 | |||||||||||
DENMARK — 8.1% | |||||||||||
| Ambu A/S, B Shares * | 1,611,983 | 20,702,040 | |||||||||
| Genmab A/S * | 289,121 | 122,238,851 | |||||||||
Novozymes A/S, B Shares | 384,557 | 19,510,003 | |||||||||
Vestas Wind Systems A/S | 1,609,472 | 46,949,365 | |||||||||
209,400,259 | |||||||||||
FRANCE — 7.6% | |||||||||||
| Adevinta ASA * | 752,367 | 4,981,966 | |||||||||
Kering | 229,579 | 116,839,162 | |||||||||
L'Oreal SA | 211,258 | 75,651,016 | |||||||||
197,472,144 | |||||||||||
GERMANY — 4.6% | |||||||||||
Aixtron SE | 1,179,242 | 33,930,634 | |||||||||
| HelloFresh SE * | 1,110,944 | 24,246,193 | |||||||||
The accompanying notes are an integral part of the financial statements.
174
Portfolio of Investments
Annual Report December 31, 2022
December 31, 2022
Baillie Gifford International Growth Fund
Shares | Value | ||||||||||
| Zalando SE * | 1,706,691 | $ | 60,083,754 | ||||||||
118,260,581 | |||||||||||
HONG KONG — 3.9% | |||||||||||
AIA Group Ltd. | 6,711,200 | 74,114,410 | |||||||||
Hong Kong Exchanges & Clearing Ltd. | 657,501 | 28,252,986 | |||||||||
102,367,396 | |||||||||||
INDIA — 0.6% | |||||||||||
Housing Development Finance Corp., Ltd. | 522,919 | 16,624,099 | |||||||||
ISRAEL — 2.3% | |||||||||||
| Mobileye Global, Inc., Class A * | 348,838 | 12,230,260 | |||||||||
| Wix.com Ltd. * | 625,756 | 48,076,834 | |||||||||
60,307,094 | |||||||||||
ITALY — 5.5% | |||||||||||
Ferrari NV | 598,574 | 128,357,401 | |||||||||
Prysmian SpA | 357,566 | 13,285,555 | |||||||||
141,642,956 | |||||||||||
JAPAN — 7.7% | |||||||||||
CyberAgent, Inc. | 1,328,800 | 11,830,020 | |||||||||
GMO Payment Gateway, Inc. | 198,300 | 16,399,213 | |||||||||
M3, Inc. | 2,211,000 | 60,058,113 | |||||||||
Nidec Corp. | 924,600 | 47,579,130 | |||||||||
SBI Holdings, Inc. | 822,200 | 15,665,187 | |||||||||
SMC Corp. | 113,500 | 47,392,358 | |||||||||
198,924,021 | |||||||||||
NETHERLANDS — 15.8% | |||||||||||
| Adyen NV * | 75,317 | 104,558,816 | |||||||||
| Argenx SE * | 243,868 | 91,549,526 | |||||||||
| ASML Holding NV | 316,586 | 172,619,185 | |||||||||
| EXOR NV * | 572,247 | 41,896,686 | |||||||||
410,624,213 | |||||||||||
NEW ZEALAND — 0.5% | |||||||||||
| Xero Ltd. * | 284,357 | 13,559,240 | |||||||||
The accompanying notes are an integral part of the financial statements.
175
Portfolio of Investments
Annual Report December 31, 2022
December 31, 2022
Baillie Gifford International Growth Fund
Shares | Value | ||||||||||
NORWAY — 0.9% | |||||||||||
| AutoStore Holdings Ltd. * | 7,788,131 | $ | 14,222,050 | ||||||||
Schibsted ASA, Class A | 241,038 | 4,570,984 | |||||||||
Schibsted ASA, B Shares | 288,179 | 5,285,775 | |||||||||
24,078,809 | |||||||||||
SINGAPORE — 0.6% | |||||||||||
| Sea Ltd. ADR * | 295,503 | 15,375,021 | |||||||||
SOUTH KOREA — 3.4% | |||||||||||
| Coupang, Inc. * | 1,537,346 | 22,614,360 | |||||||||
| Delivery Hero SE * | 1,342,003 | 64,402,404 | |||||||||
87,016,764 | |||||||||||
SWEDEN — 3.8% | |||||||||||
Atlas Copco AB, A Shares | 6,157,135 | 72,952,189 | |||||||||
| Kinnevik AB, B Shares * | 1,897,274 | 26,114,405 | |||||||||
99,066,594 | |||||||||||
SWITZERLAND — 0.6% | |||||||||||
Temenos AG | 297,453 | 16,363,871 | |||||||||
TAIWAN — 2.7% | |||||||||||
Taiwan Semiconductor Manufacturing Co., Ltd. | 4,814,000 | 69,915,952 | |||||||||
UNITED KINGDOM — 2.1% | |||||||||||
| Ocado Group PLC * | 5,417,410 | 40,213,547 | |||||||||
| Wise PLC, Class A * | 2,274,512 | 15,409,333 | |||||||||
55,622,880 | |||||||||||
UNITED STATES — 3.6% | |||||||||||
| Elastic NV * | 270,419 | 13,926,578 | |||||||||
| Oatly Group AB ADR * | 2,007,517 | 3,493,080 | |||||||||
| Spotify Technology SA * | 948,768 | 74,905,234 | |||||||||
92,324,892 | |||||||||||
Total Common Stocks | |||||||||||
(cost $1,919,179,939) | 2,521,335,459 | ||||||||||
The accompanying notes are an integral part of the financial statements.
176
Portfolio of Investments
Annual Report December 31, 2022
December 31, 2022
Baillie Gifford International Growth Fund
Shares | Value | ||||||||||
PREFERRED STOCKS — 2.2% | |||||||||||
GERMANY — 2.2% | |||||||||||
Sartorius AG 0.34% (cost $33,481,919) | 146,741 | $ | 57,944,501 | ||||||||
TOTAL INVESTMENTS — 99.4% | |||||||||||
(cost $1,952,661,858) | $ | 2,579,279,960 | |||||||||
Other assets less liabilities — 0.6% | 15,937,180 | ||||||||||
NET ASSETS — 100.0% | $ | 2,595,217,140 | |||||||||
* Non-income producing security.
ADR — American Depositary Receipt
This report classifies issuers geographically by their country of risk. For compliance monitoring purposes, the Manager retains discretion to consider a number of factors in determining where a particular issuer is located, as described in further detail in each Fund's prospectus.
Fair Value Measurement
The following is a summary of the inputs used as of December 31, 2022 in valuing the Fund's investments carried at fair value:
Investments in Securities | Level 1 | Level 2 | Level 3 | Total | |||||||||||||||
| Common Stocks ** | $ | 383,482,631 | $ | 2,137,852,828 | $ | — | $ | 2,521,335,459 | |||||||||||
| Preferred Stocks ** | — | 57,944,501 | — | 57,944,501 | |||||||||||||||
Total | $ | 383,482,631 | $ | 2,195,797,329 | $ | — | $ | 2,579,279,960 | |||||||||||
** Refer to Portfolio of Investments for further detail.
The accompanying notes are an integral part of the financial statements.
177
Statement of Assets and Liabilities
Annual Report December 31, 2022
December 31, 2022
Baillie Gifford International Growth Fund
ASSETS | |||||||
Investments, at value (cost $1,952,661,858) | $ | 2,579,279,960 | |||||
Cash | 19,897,620 | ||||||
Foreign cash, at value (cost $473,240) | 474,659 | ||||||
Tax reclaims receivable | 2,180,643 | ||||||
Capital shares sold receivable | 157,494 | ||||||
Dividends receivable | 225,379 | ||||||
Prepaid assets | 22,830 | ||||||
Total Assets | 2,602,238,585 | ||||||
LIABILITIES | |||||||
Advisory fee payable | 2,155,752 | ||||||
Capital shares purchased payable | 2,211,064 | ||||||
Payable for investment purchased | 1,008,970 | ||||||
Shareholder Servicing fee payable | 429,301 | ||||||
Deferred India capital gains tax liability (Note A) | 407,410 | ||||||
Administration & Supervisory fee payable | 115,552 | ||||||
Trustee fee payable | 29,266 | ||||||
IRS closing agreement fees for foreign reclaims (Note A) | 20,900 | ||||||
Commitment fee payable | 9,790 | ||||||
Accrued expenses | 633,440 | ||||||
Total Liabilities | 7,021,445 | ||||||
NET ASSETS | $ | 2,595,217,140 | |||||
COMPOSITION OF NET ASSETS | |||||||
Paid-in capital | $ | 2,012,083,048 | |||||
Total distributable earnings | 583,134,092 | ||||||
$ | 2,595,217,140 | ||||||
NET ASSET VALUE, PER SHARE | |||||||
| Class 2 ($598,426,328 / 54,620,829 shares outstanding), unlimited authorized, no par value | $ | 10.96 | |||||
| Class 3 ($225,484,748 / 20,524,710 shares outstanding), unlimited authorized, no par value | $ | 10.99 | |||||
| Class 4 ($491,265,054 / 44,700,030 shares outstanding), unlimited authorized, no par value | $ | 10.99 | |||||
| Class 5 ($1,026,318,647 / 93,133,774 shares outstanding), unlimited authorized, no par value | $ | 11.02 | |||||
| Class K ($57,074,773 / 5,220,942 shares outstanding), unlimited authorized, no par value | $ | 10.93 | |||||
| Institutional Class ($196,647,590 / 18,036,560 shares outstanding), unlimited authorized, no par value | $ | 10.90 | |||||
The accompanying notes are an integral part of the financial statements.
178
Statement of Operations
Annual Report December 31, 2022
For the Year Ended December 31, 2022
Baillie Gifford International Growth Fund
INVESTMENT INCOME | |||||||
Dividends (net of foreign withholding taxes of $3,632,897) | $ | 20,333,234 | |||||
Windfall tax recovery (Note A) | 7,347,037 | ||||||
Non-cash income | 6,483,970 | ||||||
Interest | 120,009 | ||||||
IRS closing agreement user fees for foreign reclaims (Note A) | (20,900 | ) | |||||
Total Investment Income | 34,263,350 | ||||||
EXPENSES | |||||||
Advisory fee (Note B) | 9,364,770 | ||||||
Shareholder Servicing fees — Class 2 shares (Note B) | 902,512 | ||||||
Shareholder Servicing fees — Class 3 shares (Note B) | 280,911 | ||||||
Shareholder Servicing fees — Class 4 shares (Note B) | 375,658 | ||||||
Shareholder Servicing fees — Class 5 shares (Note B) | 221,780 | ||||||
Administration & Supervisory fee — Class K shares (Note B) | 103,628 | ||||||
Administration & Supervisory fee — Institutional Class shares (Note B) | 415,682 | ||||||
Transfer agency | 144,591 | ||||||
Sub-transfer agency — Institutional Class shares | 206,809 | ||||||
Fund accounting | 969,281 | ||||||
Legal | 499,443 | ||||||
Custody | 442,310 | ||||||
Trustees' fees | 111,635 | ||||||
Registration fees | 80,694 | ||||||
Professional fees | 65,850 | ||||||
Commitment fees | 36,604 | ||||||
Miscellaneous | 127,389 | ||||||
Total Expenses | 14,349,547 | ||||||
Net Investment Income | 19,913,803 | ||||||
| REALIZED AND UNREALIZED (LOSS) ON INVESTMENTS AND FOREIGN CURRENCY TRANSACTIONS | |||||||
Net realized (loss) from: | |||||||
Investments (net of India capital gains tax expense of $42,017) | (12,931,277 | ) | |||||
Foreign currency transactions | (812,636 | ) | |||||
(13,743,913 | ) | ||||||
Net change in unrealized (depreciation) on: | |||||||
Investments (net of change in deferred India capital gains tax liability of $44,490) (Note A) | (1,322,144,847 | ) | |||||
Translation of net assets and liabilities denominated in foreign currencies | (62,330 | ) | |||||
(1,322,207,177 | ) | ||||||
Net realized and unrealized (loss) | (1,335,951,090 | ) | |||||
NET (DECREASE) IN NET ASSETS FROM OPERATIONS | $ | (1,316,037,287 | ) | ||||
The accompanying notes are an integral part of the financial statements.
179
Statements of Changes in Net Assets
Annual Report December 31, 2022
Baillie Gifford International Growth Fund
| For the Year Ended December 31, 2022 | For the Year Ended December 31, 2021 | ||||||||||
INCREASE (DECREASE) IN NET ASSETS FROM OPERATIONS | |||||||||||
Net investment income | $ | 19,913,803 | $ | 32,407,436 | |||||||
Net realized gain (loss) | (13,743,913 | ) | 447,638,726 | ||||||||
Net change in unrealized (depreciation) | (1,322,207,177 | ) | (869,061,162 | ) | |||||||
Net (Decrease) in Net Assets from Operations | (1,316,037,287 | ) | (389,015,000 | ) | |||||||
DIVIDENDS AND DISTRIBUTIONS TO SHAREHOLDERS FROM: | |||||||||||
Distributable earnings | |||||||||||
Class 2 | (3,692,032 | ) | (62,818,687 | ) | |||||||
Class 3 | (1,457,987 | ) | (69,076,213 | ) | |||||||
Class 4 | (3,381,707 | ) | (120,474,576 | ) | |||||||
Class 5 | (7,602,619 | ) | (219,002,340 | ) | |||||||
Class K | (335,676 | ) | (12,174,900 | ) | |||||||
Institutional Class | (961,021 | ) | (47,370,977 | ) | |||||||
Total Distributions to Shareholders | (17,431,042 | ) | (530,917,693 | ) | |||||||
TRANSACTIONS IN SHARES OF BENEFICIAL INTEREST | |||||||||||
Net proceeds from shares subscribed: | |||||||||||
Class 2 | 342,081,605 | * | 94,862,331 | ||||||||
Class 3 | 151,313,900 | * | 152,146,174 | ||||||||
Class 4 | 50,000,000 | 32,700,771 | |||||||||
Class 5 | — | 2,000,000 | |||||||||
Class K | 10,780,634 | 12,785,685 | |||||||||
Institutional Class | 226,507,373 | 237,406,612 | |||||||||
Dividends reinvested: | |||||||||||
Class 2 | 3,691,376 | 62,797,066 | |||||||||
Class 3 | 1,456,319 | 69,053,504 | |||||||||
Class 4 | 3,381,707 | 120,474,576 | |||||||||
Class 5 | 7,602,619 | 219,002,340 | |||||||||
Class K | 335,676 | 9,023,516 | |||||||||
Institutional Class | 918,730 | 46,287,943 | |||||||||
Cost of shares redeemed: | |||||||||||
Class 2 | (1,550,000 | )* | (195,081,174 | ) | |||||||
Class 3 | (272,875,605 | )* | (299,199,945 | ) | |||||||
Class 4 | (134,613,900 | ) | (53,552,555 | ) | |||||||
Class 5 | — | (125,000,000 | ) | ||||||||
Class K | (7,662,243 | ) | (45,641,020 | ) | |||||||
Institutional Class | (239,977,847 | ) | (175,527,255 | ) | |||||||
Increase in Net Assets from Transactions in Shares of Beneficial Interest | 141,390,344 | 164,538,569 | |||||||||
Total (Decrease) in Net Assets | (1,192,077,985 | ) | (755,394,124 | ) | |||||||
NET ASSETS | |||||||||||
Beginning of Year | 3,787,295,125 | 4,542,689,249 | |||||||||
End of Year | $ | 2,595,217,140 | $ | 3,787,295,125 | |||||||
* See Note D for details of share class conversions.
The accompanying notes are an integral part of the financial statements.
180
Financial Highlights
Annual Report December 31, 2022
Baillie Gifford International Growth Fund
Selected data for a Class 2 share outstanding throughout each year:
| For the Year Ended December 31, 2022 | For the Year Ended December 31, 2021 | For the Year Ended December 31, 2020 | For the Year Ended December 31, 2019 | For the Year Ended December 31, 2018 | |||||||||||||||||||
Net asset value, beginning of year | $ | 16.81 | $ | 21.56 | $ | 14.59 | $ | 10.74 | $ | 14.39 | |||||||||||||
From Investment Operations | |||||||||||||||||||||||
Net investment income(a) | 0.08 | 0.15 | 0.00 | (b) | 0.15 | 0.11 | |||||||||||||||||
| Net realized and unrealized gain (loss) on investments and foreign currency | (5.87 | ) | (2.20 | ) | 9.17 | 3.87 | (2.61 | ) | |||||||||||||||
| Net increase (decrease) in net asset value from investment operations | (5.79 | ) | (2.05 | ) | 9.17 | 4.02 | (2.50 | ) | |||||||||||||||
Dividends and Distributions to Shareholders | |||||||||||||||||||||||
From net investment income | (0.01 | ) | (0.41 | ) | — | (0.15 | ) | (0.10 | ) | ||||||||||||||
From net realized gain on investments | (0.05 | ) | (2.29 | ) | (2.20 | ) | (0.02 | ) | (1.03 | ) | |||||||||||||
Return of capital | — | — | — | — | (0.02 | ) | |||||||||||||||||
Total dividends and distributions | (0.06 | ) | (2.70 | ) | (2.20 | ) | (0.17 | ) | (1.15 | ) | |||||||||||||
Net asset value, end of year | $ | 10.96 | $ | 16.81 | $ | 21.56 | $ | 14.59 | $ | 10.74 | |||||||||||||
Total Return | |||||||||||||||||||||||
Total return based on net asset value(c) | (34.43 | )% | (9.40 | )% | 62.95 | % | 37.34 | % | (17.33 | )% | |||||||||||||
Ratios/Supplemental Data | |||||||||||||||||||||||
Net assets, end of year (000's omitted) | $ | 598,426 | $ | 455,384 | $ | 599,275 | $ | 874,230 | $ | 632,645 | |||||||||||||
Ratio of net expenses to average net assets | 0.60 | % | 0.57 | % | 0.58 | % | 0.60 | % | 0.60 | % | |||||||||||||
| Ratio of net investment income to average net assets | 0.68 | % | 0.68 | % | 0.02 | % | 1.16 | %(d) | 0.72 | % | |||||||||||||
Portfolio turnover rate(e) | 12 | % | 13 | % | 26 | % | 6 | % | 14 | % | |||||||||||||
(a) Calculated based upon average shares outstanding during the period.
(b) Amount is less than $0.005 per share.
(c) Total investment return is calculated assuming an initial investment made at the net asset value at the beginning of the period, reinvestment of all dividends and distributions, if any, at net asset value during the period, and redemption on the last day of the period.
(d) Large increase due to one-off taxable stock dividends that were treated as income.
(e) Portfolio turnover rate calculated at Fund level and excludes the value of portfolio securities sold or received in-kind in connection with Fund capital shares sold or redemptions in-kind.
The accompanying notes are an integral part of the financial statements.
181
Financial Highlights
Annual Report December 31, 2022
Baillie Gifford International Growth Fund
Selected data for a Class 3 share outstanding throughout each year:
| For the Year Ended December 31, 2022 | For the Year Ended December 31, 2021 | For the Year Ended December 31, 2020 | For the Year Ended December 31, 2019 | For the Year Ended December 31, 2018 | |||||||||||||||||||
Net asset value, beginning of year | $ | 16.85 | $ | 21.63 | $ | 14.62 | $ | 10.76 | $ | 14.42 | |||||||||||||
From Investment Operations | |||||||||||||||||||||||
Net investment income(a) | 0.08 | 0.16 | 0.01 | 0.16 | 0.11 | ||||||||||||||||||
| Net realized and unrealized gain (loss) on investments and foreign currency | (5.87 | ) | (2.21 | ) | 9.20 | 3.88 | (2.61 | ) | |||||||||||||||
| Net increase (decrease) in net asset value from investment operations | (5.79 | ) | (2.05 | ) | 9.21 | 4.04 | (2.50 | ) | |||||||||||||||
Dividends and Distributions to Shareholders | |||||||||||||||||||||||
From net investment income | (0.02 | ) | (0.44 | ) | — | (0.16 | ) | (0.11 | ) | ||||||||||||||
From net realized gain on investments | (0.05 | ) | (2.29 | ) | (2.20 | ) | (0.02 | ) | (1.03 | ) | |||||||||||||
Return of capital | — | — | — | — | (0.02 | ) | |||||||||||||||||
Total dividends and distributions | (0.07 | ) | (2.73 | ) | (2.20 | ) | (0.18 | ) | (1.16 | ) | |||||||||||||
Net asset value, end of year | $ | 10.99 | $ | 16.85 | $ | 21.63 | $ | 14.62 | $ | 10.76 | |||||||||||||
Total Return | |||||||||||||||||||||||
Total return based on net asset value(b) | (34.38 | )% | (9.34 | )% | 63.07 | % | 37.44 | % | (17.27 | )% | |||||||||||||
Ratios/Supplemental Data | |||||||||||||||||||||||
Net assets, end of year (000's omitted) | $ | 225,485 | $ | 503,783 | $ | 693,179 | $ | 546,477 | $ | 393,050 | |||||||||||||
Ratio of net expenses to average net assets | 0.53 | % | 0.50 | % | 0.51 | % | 0.53 | % | 0.53 | % | |||||||||||||
| Ratio of net investment income to average net assets | 0.64 | % | 0.74 | % | 0.03 | % | 1.22 | %(c) | 0.74 | % | |||||||||||||
Portfolio turnover rate(d) | 12 | % | 13 | % | 26 | % | 6 | % | 14 | % | |||||||||||||
(a) Calculated based upon average shares outstanding during the period.
(b) Total investment return is calculated assuming an initial investment made at the net asset value at the beginning of the period, reinvestment of all dividends and distributions, if any, at net asset value during the period, and redemption on the last day of the period.
(c) Large increase due to one-off taxable stock dividends that were treated as income.
(d) Portfolio turnover rate calculated at Fund level and excludes the value of portfolio securities sold or received in-kind in connection with Fund capital shares sold or redemptions in-kind.
The accompanying notes are an integral part of the financial statements.
182
Financial Highlights
Annual Report December 31, 2022
Baillie Gifford International Growth Fund
Selected data for a Class 4 share outstanding throughout each year:
| For the Year Ended December 31, 2022 | For the Year Ended December 31, 2021 | For the Year Ended December 31, 2020 | For the Year Ended December 31, 2019 | For the Year Ended December 31, 2018 | |||||||||||||||||||
Net asset value, beginning of year | $ | 16.86 | $ | 21.65 | $ | 14.63 | $ | 10.77 | $ | 14.43 | |||||||||||||
From Investment Operations | |||||||||||||||||||||||
Net investment income(a) | 0.09 | 0.17 | 0.01 | 0.16 | 0.12 | ||||||||||||||||||
| Net realized and unrealized gain (loss) on investments and foreign currency | (5.89 | ) | (2.21 | ) | 9.21 | 3.88 | (2.61 | ) | |||||||||||||||
| Net increase (decrease) in net asset value from investment operations | (5.80 | ) | (2.04 | ) | 9.22 | 4.04 | (2.49 | ) | |||||||||||||||
Dividends and Distributions to Shareholders | |||||||||||||||||||||||
From net investment income | (0.02 | ) | (0.46 | ) | 0.00 | (b) | (0.16 | ) | (0.12 | ) | |||||||||||||
From net realized gain on investments | (0.05 | ) | (2.29 | ) | (2.20 | ) | (0.02 | ) | (1.03 | ) | |||||||||||||
Return of capital | — | — | — | — | (0.02 | ) | |||||||||||||||||
Total dividends and distributions | (0.07 | ) | (2.75 | ) | (2.20 | ) | (0.18 | ) | (1.17 | ) | |||||||||||||
Net asset value, end of year | $ | 10.99 | $ | 16.86 | $ | 21.65 | $ | 14.63 | $ | 10.77 | |||||||||||||
Total Return | |||||||||||||||||||||||
Total return based on net asset value(c) | (34.36 | )% | (9.31 | )% | 63.12 | % | 37.48 | % | (17.24 | )% | |||||||||||||
Ratios/Supplemental Data | |||||||||||||||||||||||
Net assets, end of year (000's omitted) | $ | 491,265 | $ | 860,635 | $ | 969,427 | $ | 283,094 | $ | 205,923 | |||||||||||||
Ratio of net expenses to average net assets | 0.50 | % | 0.47 | % | 0.48 | % | 0.50 | % | 0.50 | % | |||||||||||||
| Ratio of net investment income to average net assets | 0.72 | % | 0.78 | % | 0.06 | % | 1.26 | %(d) | 0.83 | % | |||||||||||||
Portfolio turnover rate(e) | 12 | % | 13 | % | 26 | % | 6 | % | 14 | % | |||||||||||||
(a) Calculated based upon average shares outstanding during the period.
(b) Amount is less than $0.005 per share.
(c) Total investment return is calculated assuming an initial investment made at the net asset value at the beginning of the period, reinvestment of all dividends and distributions, if any, at net asset value during the period, and redemption on the last day of the period.
(d) Large increase due to one-off taxable stock dividends that were treated as income.
(e) Portfolio turnover rate calculated at Fund level and excludes the value of portfolio securities sold or received in-kind in connection with Fund capital shares sold or redemptions in-kind.
The accompanying notes are an integral part of the financial statements.
183
Financial Highlights
Annual Report December 31, 2022
Baillie Gifford International Growth Fund
Selected data for a Class 5 share outstanding throughout each year:
| For the Year Ended December 31, 2022 | For the Year Ended December 31, 2021 | For the Year Ended December 31, 2020 | For the Year Ended December 31, 2019 | For the Year Ended December 31, 2018 | |||||||||||||||||||
Net asset value, beginning of year | $ | 16.91 | $ | 21.70 | $ | 14.66 | $ | 10.79 | $ | 14.46 | |||||||||||||
From Investment Operations | |||||||||||||||||||||||
Net investment income(a) | 0.09 | 0.18 | 0.02 | 0.17 | 0.12 | ||||||||||||||||||
| Net realized and unrealized gain (loss) on investments and foreign currency | (5.90 | ) | (2.21 | ) | 9.23 | 3.89 | (2.61 | ) | |||||||||||||||
| Net increase (decrease) in net asset value from investment operations | (5.81 | ) | (2.03 | ) | 9.25 | 4.06 | (2.49 | ) | |||||||||||||||
Dividends and Distributions to Shareholders | |||||||||||||||||||||||
From net investment income | (0.03 | ) | (0.47 | ) | (0.01 | ) | (0.17 | ) | (0.13 | ) | |||||||||||||
From net realized gain on investments | (0.05 | ) | (2.29 | ) | (2.20 | ) | (0.02 | ) | (1.03 | ) | |||||||||||||
Return of capital | — | — | — | — | (0.02 | ) | |||||||||||||||||
Total dividends and distributions | (0.08 | ) | (2.76 | ) | (2.21 | ) | (0.19 | ) | (1.18 | ) | |||||||||||||
Net asset value, end of year | $ | 11.02 | $ | 16.91 | $ | 21.70 | $ | 14.66 | $ | 10.79 | |||||||||||||
Total Return | |||||||||||||||||||||||
Total return based on net asset value(b) | (34.33 | )% | (9.27 | )% | 63.20 | % | 37.55 | % | (17.20 | )% | |||||||||||||
Ratios/Supplemental Data | |||||||||||||||||||||||
Net assets, end of year (000's omitted) | $ | 1,026,319 | $ | 1,562,791 | $ | 1,842,231 | $ | 1,298,918 | $ | 944,366 | |||||||||||||
Ratio of net expenses to average net assets | 0.45 | % | 0.42 | % | 0.43 | % | 0.45 | % | 0.45 | % | |||||||||||||
| Ratio of net investment income to average net assets | 0.79 | % | 0.82 | % | 0.13 | % | 1.31 | %(c) | 0.84 | % | |||||||||||||
Portfolio turnover rate(d) | 12 | % | 13 | % | 26 | % | 6 | % | 14 | % | |||||||||||||
(a) Calculated based upon average shares outstanding during the period.
(b) Total investment return is calculated assuming an initial investment made at the net asset value at the beginning of the period, reinvestment of all dividends and distributions, if any, at net asset value during the period, and redemption on the last day of the period.
(c) Large increase due to one-off taxable stock dividends that were treated as income.
(d) Portfolio turnover rate calculated at Fund level and excludes the value of portfolio securities sold or received in-kind in connection with Fund capital shares sold or redemptions in-kind.
The accompanying notes are an integral part of the financial statements.
184
Financial Highlights
Annual Report December 31, 2022
Baillie Gifford International Growth Fund
Selected data for a Class K share outstanding throughout each year:
| For the Year Ended December 31, 2022 | For the Year Ended December 31, 2021 | For the Year Ended December 31, 2020 | For the Year Ended December 31, 2019 | For the Year Ended December 31, 2018 | |||||||||||||||||||
Net asset value, beginning of year | $ | 16.77 | $ | 21.54 | $ | 14.58 | $ | 10.73 | $ | 14.38 | |||||||||||||
From Investment Operations | |||||||||||||||||||||||
Net investment income (loss)(a) | 0.08 | 0.15 | (0.05 | )(b) | 0.15 | 0.10 | |||||||||||||||||
| Net realized and unrealized gain (loss) on investments and foreign currency | (5.86 | ) | (2.20 | ) | 9.21 | 3.87 | (2.60 | ) | |||||||||||||||
| Net increase (decrease) in net asset value from investment operations | (5.78 | ) | (2.05 | ) | 9.16 | 4.02 | (2.50 | ) | |||||||||||||||
Dividends and Distributions to Shareholders | |||||||||||||||||||||||
From net investment income | (0.01 | ) | (0.43 | ) | — | (c) | (0.15 | ) | (0.10 | ) | |||||||||||||
From net realized gain on investments | (0.05 | ) | (2.29 | ) | (2.20 | ) | (0.02 | ) | (1.03 | ) | |||||||||||||
Return of capital | — | — | — | — | (0.02 | ) | |||||||||||||||||
Total dividends and distributions | (0.06 | ) | (2.72 | ) | (2.20 | ) | (0.17 | ) | (1.15 | ) | |||||||||||||
Net asset value, end of year | $ | 10.93 | $ | 16.77 | $ | 21.54 | $ | 14.58 | $ | 10.73 | |||||||||||||
Total Return | |||||||||||||||||||||||
Total return based on net asset value(d) | (34.43 | )% | (9.43 | )% | 62.95 | % | 37.40 | % | (17.32 | )% | |||||||||||||
Ratios/Supplemental Data | |||||||||||||||||||||||
Net assets, end of year (000's omitted) | $ | 57,075 | $ | 82,820 | $ | 130,401 | $ | 7 | $ | 5 | |||||||||||||
Ratio of net expenses to average net assets | 0.60 | % | 0.57 | % | 0.58 | % | 0.60 | % | 0.60 | % | |||||||||||||
| Ratio of net investment income (loss) to average net assets | 0.66 | % | 0.69 | % | (0.26 | )% | 1.17 | %(e) | 0.72 | % | |||||||||||||
Portfolio turnover rate(f) | 12 | % | 13 | % | 26 | % | 6 | % | 14 | % | |||||||||||||
(a) Calculated based upon average shares outstanding during the period.
(b) Calculation of the net gain or (loss) per share may not correlate to the aggregate investment income presented in the Statement of Operations due to the allocation of expenses across the share classes.
(c) Amount is less than $0.005 per share.
(d) Total investment return is calculated assuming an initial investment made at the net asset value at the beginning of the period, reinvestment of all dividends and distributions, if any, at net asset value during the period, and redemption on the last day of the period.
(e) Large increase due to one-off taxable stock dividends that were treated as income.
(f) Portfolio turnover rate calculated at Fund level and excludes the value of portfolio securities sold or received in-kind in connection with Fund capital shares sold or redemptions in-kind.
The accompanying notes are an integral part of the financial statements.
185
Financial Highlights
Annual Report December 31, 2022
Baillie Gifford International Growth Fund
Selected data for an Institutional Class share outstanding throughout each year:
| For the Year Ended December 31, 2022 | For the Year Ended December 31, 2021 | For the Year Ended December 31, 2020 | For the Year Ended December 31, 2019 | For the Year Ended December 31, 2018 | |||||||||||||||||||
Net asset value, beginning of year | $ | 16.72 | $ | 21.48 | $ | 14.55 | $ | 10.72 | $ | 14.38 | |||||||||||||
From Investment Operations | |||||||||||||||||||||||
Net investment income (loss)(a) | 0.07 | 0.12 | (0.03 | ) | 0.15 | (0.01 | ) | ||||||||||||||||
| Net realized and unrealized gain (loss) on investments and foreign currency | (5.84 | ) | (2.18 | ) | 9.16 | 3.85 | (2.49 | ) | |||||||||||||||
| Net increase (decrease) in net asset value from investment operations | (5.77 | ) | (2.06 | ) | 9.13 | 4.00 | (2.50 | ) | |||||||||||||||
Dividends and Distributions to Shareholders | |||||||||||||||||||||||
From net investment income | — | (0.41 | ) | — | (0.15 | ) | (0.11 | ) | |||||||||||||||
From net realized gain on investments | (0.05 | ) | (2.29 | ) | (2.20 | ) | (0.02 | ) | (1.03 | ) | |||||||||||||
Return of capital | — | — | — | — | (0.02 | ) | |||||||||||||||||
Total dividends and distributions | (0.05 | ) | (2.70 | ) | (2.20 | ) | (0.17 | ) | (1.16 | ) | |||||||||||||
Net asset value, end of year | $ | 10.90 | $ | 16.72 | $ | 21.48 | $ | 14.55 | $ | 10.72 | |||||||||||||
Total Return | |||||||||||||||||||||||
Total return based on net asset value(b) | (34.49 | )% | (9.49 | )% | 62.84 | % | 37.25 | % | (17.34 | )% | |||||||||||||
Ratios/Supplemental Data | |||||||||||||||||||||||
Net assets, end of year (000's omitted) | $ | 196,648 | $ | 321,882 | $ | 308,176 | $ | 26,800 | $ | 2,081 | |||||||||||||
Ratio of net expenses to average net assets | 0.68 | % | 0.65 | % | 0.64 | % | 0.65 | % | 0.69 | % | |||||||||||||
| Ratio of net investment income (loss) to average net assets | 0.60 | % | 0.55 | % | (0.16 | )% | 1.09 | %(c) | (0.23 | )% | |||||||||||||
Portfolio turnover rate(d) | 12 | % | 13 | % | 26 | % | 6 | % | 14 | % | |||||||||||||
(a) Calculated based upon average shares outstanding during the period.
(b) Total investment return is calculated assuming an initial investment made at the net asset value at the beginning of the period, reinvestment of all dividends and distributions, if any, at net asset value during the period, and redemption on the last day of the period.
(c) Large increase due to one-off taxable stock dividends that were treated as income.
(d) Portfolio turnover rate calculated at Fund level and excludes the value of portfolio securities sold or received in-kind in connection with Fund capital shares sold or redemptions in-kind.
The accompanying notes are an integral part of the financial statements.
186
Industry Diversification Table
Annual Report December 31, 2022
December 31, 2022
Baillie Gifford International Smaller Companies Fund
Value | % of Total Net Assets | ||||||||||
Biotechnology | $ | 203,996 | 0.5 | % | |||||||
Building Materials | 1,556,967 | 4.4 | |||||||||
Chemicals | 291,782 | 0.8 | |||||||||
Commercial Services | 1,803,656 | 5.1 | |||||||||
Computers | 563,884 | 1.6 | |||||||||
Distribution/Wholesale | 1,507,459 | 4.2 | |||||||||
Diversified Financial Services | 4,370,978 | 12.4 | |||||||||
Electrical Components & Equipment | 321,013 | 0.9 | |||||||||
Electronics | 1,857,585 | 5.3 | |||||||||
Food | 29,596 | 0.1 | |||||||||
Hand/Machine Tools | 456,874 | 1.3 | |||||||||
Healthcare — Products | 470,352 | 1.4 | |||||||||
Insurance | 130,697 | 0.4 | |||||||||
Internet | 3,878,970 | 10.9 | |||||||||
Investment Companies | 145,246 | 0.4 | |||||||||
Leisure Time | 1,055,093 | 2.9 | |||||||||
Machinery — Diversified | 1,031,920 | 2.9 | |||||||||
Media | 62,945 | 0.2 | |||||||||
Mining | 70,118 | 0.2 | |||||||||
Miscellaneous Manufacturing | 1,697,636 | 4.8 | |||||||||
Pharmaceuticals | 591,271 | 1.6 | |||||||||
Private Equity | 191,302 | 0.5 | |||||||||
Retail | 1,601,363 | 4.5 | |||||||||
Semiconductors | 4,219,472 | 11.9 | |||||||||
Software | 4,828,671 | 13.6 | |||||||||
Telecommunications | 545,240 | 1.5 | |||||||||
Toys/Games/Hobbies | 1,100,672 | 3.1 | |||||||||
Total Value of Investments | 34,584,758 | 97.4 | |||||||||
Other assets less liabilities | 910,789 | 2.6 | |||||||||
Net Assets | $ | 35,495,547 | 100.0 | % | |||||||
The table above is based on Bloomberg Industry Group classifications. For compliance monitoring purposes, sub-industry classifications are used which results in less concentration across industry sectors.
187
Portfolio of Investments
Annual Report December 31, 2022
December 31, 2022
Baillie Gifford International Smaller Companies Fund
Shares | Value | ||||||||||
COMMON STOCKS — 97.4% | |||||||||||
AUSTRALIA — 1.5% | |||||||||||
| Cleanspace Holdings Ltd. * | 186,083 | $ | 63,347 | ||||||||
Netwealth Group Ltd. | 50,397 | 412,884 | |||||||||
| Vulcan Energy Resources Ltd. * | 16,343 | 70,118 | |||||||||
546,349 | |||||||||||
BELGIUM — 1.1% | |||||||||||
| Biocartis Group NV * | 33,774 | 19,079 | |||||||||
Melexis NV | 4,167 | 362,721 | |||||||||
381,800 | |||||||||||
CANADA — 4.3% | |||||||||||
| Docebo, Inc. * | 12,138 | 401,074 | |||||||||
| Kinaxis, Inc. * | 9,985 | 1,120,252 | |||||||||
1,521,326 | |||||||||||
CHINA — 4.8% | |||||||||||
Airtac International Group | 56,229 | 1,697,636 | |||||||||
DENMARK — 1.1% | |||||||||||
| ALK-Abello A/S * | 28,407 | 396,251 | |||||||||
FINLAND — 0.4% | |||||||||||
| Nanoform Finland PLC * | 45,167 | 154,717 | |||||||||
FRANCE — 1.0% | |||||||||||
| Cellectis SA ADR * | 22,950 | 48,195 | |||||||||
| Cellectis SA * | 506 | 1,084 | |||||||||
| ESI Group * | 3,611 | 285,266 | |||||||||
334,545 | |||||||||||
GERMANY — 4.9% | |||||||||||
Aumann AG | 9,457 | 115,799 | |||||||||
| Auto1 Group SE * | 26,851 | 223,079 | |||||||||
| Hypoport SE * | 5,480 | 568,779 | |||||||||
New Work SE | 2,521 | 412,300 | |||||||||
The accompanying notes are an integral part of the financial statements.
188
Portfolio of Investments
Annual Report December 31, 2022
December 31, 2022
Baillie Gifford International Smaller Companies Fund
Shares | Value | ||||||||||
| Tonies SE, Class A * | 61,683 | $ | 396,171 | ||||||||
| Veganz Group AG * | 2,160 | 29,596 | |||||||||
1,745,724 | |||||||||||
HONG KONG — 1.1% | |||||||||||
| Hypebeast Ltd. * | 1,256,600 | 64,287 | |||||||||
Johnson Electric Holdings Ltd. | 255,000 | 321,013 | |||||||||
385,300 | |||||||||||
INDIA — 1.1% | |||||||||||
| CreditAccess Grameen Ltd. * | 35,335 | 390,490 | |||||||||
IRELAND — 1.6% | |||||||||||
Keywords Studios PLC | 17,183 | 563,884 | |||||||||
ISRAEL — 2.3% | |||||||||||
Maytronics Ltd. | 57,936 | 576,270 | |||||||||
| Nayax Ltd. * | 12,805 | 241,506 | |||||||||
817,776 | |||||||||||
ITALY — 7.0% | |||||||||||
Brunello Cucinelli SpA | 15,011 | 1,110,678 | |||||||||
Reply SpA | 7,855 | 901,110 | |||||||||
Technogym SpA | 62,436 | 478,823 | |||||||||
2,490,611 | |||||||||||
JAPAN — 26.7% | |||||||||||
Anicom Holdings, Inc. | 29,800 | 130,697 | |||||||||
| Bengo4.com, Inc. * | 19,600 | 382,662 | |||||||||
COLOPL, Inc. | 57,100 | 271,711 | |||||||||
| Demae-Can Co., Ltd. * | 21,100 | 69,208 | |||||||||
DMG Mori Co., Ltd. | 34,500 | 456,874 | |||||||||
eGuarantee, Inc. | 30,500 | 563,746 | |||||||||
| Freee KK * | 7,500 | 166,420 | |||||||||
| GA Technologies Co., Ltd. * | 31,300 | 314,639 | |||||||||
Infomart Corp. | 66,700 | 180,654 | |||||||||
Inter Action Corp. | 11,400 | 132,198 | |||||||||
Iriso Electronics Co., Ltd. | 14,500 | 464,499 | |||||||||
| Istyle, Inc. * | 42,700 | 173,687 | |||||||||
JMDC, Inc. | 10,600 | 304,065 | |||||||||
The accompanying notes are an integral part of the financial statements.
189
Portfolio of Investments
Annual Report December 31, 2022
December 31, 2022
Baillie Gifford International Smaller Companies Fund
Shares | Value | ||||||||||
Kamakura Shinsho Ltd. | 59,800 | $ | 457,388 | ||||||||
Katitas Co., Ltd. | 32,400 | 739,605 | |||||||||
KH Neochem Co., Ltd. | 14,400 | 291,782 | |||||||||
Kitanotatsujin Corp. | 110,800 | 234,259 | |||||||||
| Locondo, Inc. * | 20,700 | 169,005 | |||||||||
Megachips Corp. | 35,200 | 652,302 | |||||||||
Optex Group Co., Ltd. | 20,900 | 283,158 | |||||||||
Outsourcing, Inc. | 42,100 | 301,721 | |||||||||
| Raksul, Inc. * | 37,300 | 933,155 | |||||||||
| Sansan, Inc. * | 27,500 | 264,952 | |||||||||
Shima Seiki Manufacturing Ltd. | 17,700 | 247,277 | |||||||||
Snow Peak, Inc. | 21,700 | 386,497 | |||||||||
Tsugami Corp. | 69,100 | 605,497 | |||||||||
| WealthNavi, Inc. * | 30,700 | 312,797 | |||||||||
9,490,455 | |||||||||||
NEW ZEALAND — 0.4% | |||||||||||
| Volpara Health Technologies Ltd. * | 384,714 | 136,625 | |||||||||
SOUTH KOREA — 3.6% | |||||||||||
| Cafe24 Corp. * | 10,865 | 85,177 | |||||||||
| Douzone Bizon Co., Ltd. * | 18,341 | 535,162 | |||||||||
| Koh Young Technology, Inc. * | 61,471 | 623,608 | |||||||||
| Wantedlab, Inc. * | 3,239 | 32,175 | |||||||||
1,276,122 | |||||||||||
SWEDEN — 11.5% | |||||||||||
AddTech AB, B Shares | 67,403 | 962,258 | |||||||||
Avanza Bank Holding AB | 74,543 | 1,599,660 | |||||||||
| Bactiguard Holding AB * | 9,525 | 100,075 | |||||||||
Cellavision AB | 4,416 | 96,997 | |||||||||
HMS Networks AB | 16,741 | 545,240 | |||||||||
Paradox Interactive AB | 20,547 | 418,086 | |||||||||
| Storytel AB * | 14,833 | 62,944 | |||||||||
| VNV Global AB * | 58,145 | 145,246 | |||||||||
| Xvivo Perfusion AB * | 8,654 | 151,763 | |||||||||
4,082,269 | |||||||||||
The accompanying notes are an integral part of the financial statements.
190
Portfolio of Investments
Annual Report December 31, 2022
December 31, 2022
Baillie Gifford International Smaller Companies Fund
Shares | Value | ||||||||||
SWITZERLAND — 5.3% | |||||||||||
Bossard Holding AG | 2,523 | $ | 545,201 | ||||||||
| Sensirion Holding AG * | 9,517 | 1,012,344 | |||||||||
u-blox Holding AG | 2,764 | 329,941 | |||||||||
1,887,486 | |||||||||||
TAIWAN — 7.6% | |||||||||||
ASPEED Technology, Inc. | 10,100 | 551,347 | |||||||||
Chroma ATE, Inc. | 131,000 | 769,478 | |||||||||
Global Unichip Corp. | 57,000 | 1,178,619 | |||||||||
TCI Co., Ltd. | 35,148 | 195,020 | |||||||||
2,694,464 | |||||||||||
UNITED KINGDOM — 9.1% | |||||||||||
Alpha Group International PLC | 21,791 | 487,368 | |||||||||
| Angle PLC * | 167,788 | 102,438 | |||||||||
dotdigital group PLC | 204,692 | 204,183 | |||||||||
| FD Technologies PLC * | 21,266 | 350,164 | |||||||||
Games Workshop Group PLC | 6,825 | 704,501 | |||||||||
| Molten Ventures PLC * | 44,756 | 191,302 | |||||||||
| Naked Wines PLC * | 68,761 | 104,187 | |||||||||
| Team17 Group PLC * | 63,642 | 338,536 | |||||||||
| Trustpilot Group PLC * | 180,138 | 211,515 | |||||||||
| Victoria PLC * | 91,866 | 534,206 | |||||||||
3,228,400 | |||||||||||
UNITED STATES — 1.0% | |||||||||||
Burford Capital Ltd. | 44,958 | 362,528 | |||||||||
TOTAL INVESTMENTS — 97.4% | |||||||||||
(cost $46,884,962) | $ | 34,584,758 | |||||||||
Other assets less liabilities — 2.6% | 910,789 | ||||||||||
NET ASSETS — 100.0% | $ | 35,495,547 | |||||||||
* Non-income producing security.
ADR — American Depositary Receipt
This report classifies issuers geographically by their country of risk. For compliance monitoring purposes, the Manager retains discretion to consider a number of factors in determining where a particular issuer is located, as described in further detail in each Fund's prospectus.
The accompanying notes are an integral part of the financial statements.
191
Portfolio of Investments
Annual Report December 31, 2022
December 31, 2022
Baillie Gifford International Smaller Companies Fund
Fair Value Measurement
The following is a summary of the inputs used as of December 31, 2022 in valuing the Fund's investments carried at fair value:
Investments in Securities | Level 1 | Level 2 | Level 3 | Total | |||||||||||||||
| Common Stocks ** | $ | 4,673,858 | $ | 29,910,900 | $ | — | $ | 34,584,758 | |||||||||||
Total | $ | 4,673,858 | $ | 29,910,900 | $ | — | $ | 34,584,758 | |||||||||||
** Refer to Portfolio of Investments for further detail.
The accompanying notes are an integral part of the financial statements.
192
Statement of Assets and Liabilities
Annual Report December 31, 2022
December 31, 2022
Baillie Gifford International Smaller Companies Fund
ASSETS | |||||||
Investments, at value (cost $46,884,962) | $ | 34,584,758 | |||||
Cash | 825,629 | ||||||
Foreign cash, at value (cost $123,820) | 125,855 | ||||||
Due from Manager | 52,863 | �� | |||||
Dividends receivable | 38,120 | ||||||
Tax reclaims receivable | 22,478 | ||||||
Prepaid assets | 22,988 | ||||||
Total Assets | 35,672,691 | ||||||
LIABILITIES | |||||||
Advisory fee payable | 48,624 | ||||||
Payable for investment purchased | 16,762 | ||||||
Administration & Supervisory fee payable | 14,252 | ||||||
Deferred India capital gains tax liability (Note A) | 3,611 | ||||||
Trustee fee payable | 373 | ||||||
Commitment fee payable | 124 | ||||||
Accrued expenses | 93,398 | ||||||
Total Liabilities | 177,144 | ||||||
NET ASSETS | $ | 35,495,547 | |||||
COMPOSITION OF NET ASSETS | |||||||
Paid-in capital | $ | 57,297,375 | |||||
Total accumulated (loss) | (21,801,828 | ) | |||||
LIABILITIES | $ | 35,495,547 | |||||
NET ASSET VALUE, PER SHARE | |||||||
| Class K ($22,909,625 / 2,034,562 shares outstanding), unlimited authorized, no par value | $ | 11.26 | |||||
| Institutional Class ($12,585,922 / 1,118,630 shares outstanding), unlimited authorized, no par value | $ | 11.25 | |||||
The accompanying notes are an integral part of the financial statements.
193
Statement of Operations
Annual Report December 31, 2022
For the Year Ended December 31, 2022
Baillie Gifford International Smaller Companies Fund
INVESTMENT INCOME | |||||||
Dividends (net of foreign withholding taxes of $72,125) | $ | 430,879 | |||||
Interest | 2,903 | ||||||
Total Investment Income | 433,782 | ||||||
EXPENSES | |||||||
Advisory fee (Note B) | 220,534 | ||||||
Administration & Supervisory fee — Class K shares (Note B) | 45,234 | ||||||
Administration & Supervisory fee — Institutional Class shares (Note B) | 19,405 | ||||||
Transfer agency | 41,616 | ||||||
Sub-transfer agency — Institutional Class shares | 10,832 | ||||||
Fund accounting | 109,611 | ||||||
Registration fees | 61,652 | ||||||
Professional fees | 39,749 | ||||||
Custody | 29,192 | ||||||
Legal | 13,564 | ||||||
Line of credit interest | 2,260 | ||||||
Trustees' fees | 1,557 | ||||||
Commitment fees | 525 | ||||||
Miscellaneous | 5,978 | ||||||
Total Expenses | 601,709 | ||||||
Fees waived/expenses reimbursed | (248,669 | ) | |||||
Total Expenses after Waiver | 353,040 | ||||||
Net Investment Income | 80,742 | ||||||
| REALIZED AND UNREALIZED GAIN (LOSS) ON INVESTMENTS AND FOREIGN CURRENCY TRANSACTIONS | |||||||
Net realized gain (loss) from: | |||||||
Investments (net of India capital gains tax expense of $8,671) | (9,212,188 | ) | |||||
Foreign currency transactions | 5,930 | ||||||
(9,206,258 | ) | ||||||
Net change in unrealized appreciation (depreciation) on: | |||||||
Investments (net of change in deferred India capital gains tax liability of $3,611) (Note A) | (13,846,668 | ) | |||||
Translation of net assets and liabilities denominated in foreign currencies | 602 | ||||||
(13,846,066 | ) | ||||||
Net realized and unrealized (loss) | (23,052,324 | ) | |||||
NET (DECREASE) IN NET ASSETS FROM OPERATIONS | $ | (22,971,582 | ) | ||||
The accompanying notes are an integral part of the financial statements.
194
Statements of Changes in Net Assets
Annual Report December 31, 2022
Baillie Gifford International Smaller Companies Fund
| For the Year Ended December 31, 2022 | For the Year Ended December 31, 2021 | ||||||||||
INCREASE (DECREASE) IN NET ASSETS FROM OPERATIONS | |||||||||||
Net investment income (loss) | $ | 80,742 | $ | (78,936 | ) | ||||||
Net realized (loss) | (9,206,258 | ) | (21,702 | ) | |||||||
Net change in unrealized appreciation (depreciation) | (13,846,066 | ) | 783,376 | ||||||||
Net Increase (Decrease) in Net Assets from Operations | (22,971,582 | ) | 682,738 | ||||||||
DIVIDENDS AND DISTRIBUTIONS TO SHAREHOLDERS FROM: | |||||||||||
Distributable earnings | |||||||||||
Class K | (35,904 | ) | (168,144 | ) | |||||||
Institutional Class | (14,391 | ) | (60,637 | ) | |||||||
Total Distributions to Shareholders | (50,295 | ) | (228,781 | ) | |||||||
TRANSACTIONS IN SHARES OF BENEFICIAL INTEREST | |||||||||||
Net proceeds from shares subscribed: | |||||||||||
Class K | 1,526,400 | 40,085,550 | |||||||||
Institutional Class | 14,373,256 | 14,302,761 | |||||||||
Dividends reinvested: | |||||||||||
Class K | 35,491 | 166,380 | |||||||||
Institutional Class | 14,391 | 60,637 | |||||||||
Cost of shares redeemed: | |||||||||||
Class K | (4,101,595 | ) | — | ||||||||
Institutional Class | (10,217,456 | ) | (53,975 | ) | |||||||
Increase in Net Assets from Transactions in Shares of Beneficial Interest | 1,630,487 | 54,561,353 | |||||||||
Total Increase (Decrease) in Net Assets | (21,391,390 | ) | 55,015,310 | ||||||||
NET ASSETS | |||||||||||
Beginning of Year | 56,886,937 | 1,871,627 | |||||||||
End of Year | $ | 35,495,547 | $ | 56,886,937 | |||||||
The accompanying notes are an integral part of the financial statements.
195
Financial Highlights
Annual Report December 31, 2022
Baillie Gifford International Smaller Companies Fund
Selected data for a Class K share outstanding throughout each period:
| For the Year Ended December 31, 2022 | For the Year Ended December 31, 2021 | For the Year Ended December 31, 2020 | For the Year Ended December 31, 2019 | For the Period December 19, 2018(a) through December 31, 2018 | |||||||||||||||||||
Net asset value, beginning of period | $ | 18.55 | $ | 17.49 | $ | 12.30 | $ | 9.95 | $ | 10.00 | |||||||||||||
From Investment Operations | |||||||||||||||||||||||
Net investment income (loss)(b) | 0.03 | (0.06 | ) | (0.03 | ) | 0.01 | 0.01 | ||||||||||||||||
| Net realized and unrealized gain (loss) on investments and foreign currency | (7.30 | ) | 1.20 | 6.00 | 2.64 | (0.06 | ) | ||||||||||||||||
| Net increase (decrease) in net asset value from investment operations | (7.27 | ) | 1.14 | 5.97 | 2.65 | (0.05 | ) | ||||||||||||||||
Dividends and Distributions to Shareholders | |||||||||||||||||||||||
From net investment income | (0.02 | ) | (0.01 | ) | — | (0.11 | ) | — | |||||||||||||||
From net realized gain on investments | — | (0.07 | ) | (0.78 | ) | (0.19 | ) | — | |||||||||||||||
Total dividends and distributions | (0.02 | ) | (0.08 | ) | (0.78 | ) | (0.30 | ) | — | ||||||||||||||
Net asset value, end of period | $ | 11.26 | $ | 18.55 | $ | 17.49 | $ | 12.30 | $ | 9.95 | |||||||||||||
Total Return | |||||||||||||||||||||||
Total return based on net asset value(c) | (39.20 | )% | 6.49 | % | 48.61 | % | 26.58 | % | (0.50 | )% | |||||||||||||
Ratios/Supplemental Data | |||||||||||||||||||||||
Net assets, end of period (000's omitted) | $ | 22,910 | $ | 41,517 | $ | 936 | $ | 630 | $ | 497 | |||||||||||||
| Ratio of net expenses to average net assets, before waiver | 1.55 | % | 1.84 | % | 17.20 | % | 15.15 | % | 95.80 | %* | |||||||||||||
| Ratio of net expenses to average net assets, after waiver | 0.90 | % | 0.90 | % | 0.90 | % | 0.90 | % | 0.90 | %* | |||||||||||||
| Ratio of net investment income (loss) to average net assets | 0.23 | % | (0.31 | )% | (0.23 | )% | 0.13 | % | 1.85 | %* | |||||||||||||
Portfolio turnover rate(d) | 44 | % | 16 | % | 16 | % | 11 | % | 0 | % | |||||||||||||
* Annualized.
(a) Commencement of investment operations.
(b) Calculated based upon average shares outstanding during the period.
(c) Total investment return is calculated assuming an initial investment made at the net asset value at the beginning of the period, reinvestment of all dividends and distributions, if any, at net asset value during the period, and redemption on the last day of the period. Total return is not annualized for periods less than one year.
(d) Portfolio turnover rate calculated at Fund level. Portfolio turnover is not annualized for periods less than one year.
The accompanying notes are an integral part of the financial statements.
196
Financial Highlights
Annual Report December 31, 2022
Baillie Gifford International Smaller Companies Fund
Selected data for an Institutional Class share outstanding throughout each period:
| For the Year Ended December 31, 2022 | For the Year Ended December 31, 2021 | For the Year Ended December 31, 2020 | For the Year Ended December 31, 2019 | For the Period December 19, 2018(a) through December 31, 2018 | |||||||||||||||||||
Net asset value, beginning of period | $ | 18.55 | $ | 17.49 | $ | 12.30 | $ | 9.95 | $ | 10.00 | |||||||||||||
From Investment Operations | |||||||||||||||||||||||
Net investment income (loss)(b) | 0.02 | (0.06 | ) | (0.03 | ) | 0.01 | 0.01 | ||||||||||||||||
| Net realized and unrealized gain (loss) on investments and foreign currency | (7.31 | ) | 1.20 | 6.00 | 2.64 | (0.06 | ) | ||||||||||||||||
| Net increase (decrease) in net asset value from investment operations | (7.29 | ) | 1.14 | 5.97 | 2.65 | (0.05 | ) | ||||||||||||||||
Dividends and Distributions to Shareholders | |||||||||||||||||||||||
From net investment income | (0.01 | ) | (0.01 | ) | — | (0.11 | ) | — | |||||||||||||||
From net realized gain on investments | — | (0.07 | ) | (0.78 | ) | (0.19 | ) | — | |||||||||||||||
Total dividends and distributions | (0.01 | ) | (0.08 | ) | (0.78 | ) | (0.30 | ) | — | ||||||||||||||
Net asset value, end of period | $ | 11.25 | $ | 18.55 | $ | 17.49 | $ | 12.30 | $ | 9.95 | |||||||||||||
Total Return | |||||||||||||||||||||||
Total return based on net asset value(c) | (39.28 | )% | 6.48 | % | 48.61 | % | 26.58 | % | (0.50 | )% | |||||||||||||
Ratios/Supplemental Data | |||||||||||||||||||||||
Net assets, end of period (000's omitted) | $ | 12,586 | $ | 15,370 | $ | 936 | $ | 630 | $ | 498 | |||||||||||||
| Ratio of net expenses to average net assets, before waiver | 1.65 | % | 1.91 | % | 17.20 | % | 15.15 | % | 95.80 | %* | |||||||||||||
| Ratio of net expenses to average net assets, after waiver | 0.99 | % | 0.97 | % | 0.90 | % | 0.90 | % | 0.90 | %* | |||||||||||||
| Ratio of net investment income (loss) to average net assets | 0.17 | % | (0.30 | )% | (0.23 | )% | 0.13 | % | 1.85 | %* | |||||||||||||
Portfolio turnover rate(d) | 44 | % | 16 | % | 16 | % | 11 | % | 0 | % | |||||||||||||
* Annualized.
(a) Commencement of investment operations.
(b) Calculated based upon average shares outstanding during the period.
(c) Total investment return is calculated assuming an initial investment made at the net asset value at the beginning of the period, reinvestment of all dividends and distributions, if any, at net asset value during the period, and redemption on the last day of the period. Total return is not annualized for periods less than one year.
(d) Portfolio turnover rate calculated at Fund level. Portfolio turnover is not annualized for periods less than one year.
The accompanying notes are an integral part of the financial statements.
197
Industry Diversification Table
Annual Report December 31, 2022
December 31, 2022
Baillie Gifford Long Term Global Growth Fund
Value | % of Total Net Assets | ||||||||||
Advertising | $ | 13,657,639 | 2.6 | % | |||||||
Apparel | 38,147,493 | 7.4 | |||||||||
Auto Manufacturers | 23,513,672 | 4.5 | |||||||||
Auto Parts & Equipment | 12,633,189 | 2.4 | |||||||||
Biotechnology | 73,579,851 | 14.2 | |||||||||
Commercial Services | 18,196,104 | 3.5 | |||||||||
Diversified Financial Services | 13,761,959 | 2.7 | |||||||||
Healthcare — Products | 17,869,200 | 3.4 | |||||||||
Healthcare — Services | 2,848,801 | 0.5 | |||||||||
Internet | 161,648,827 | 31.3 | |||||||||
Pharmaceuticals | 24,030,547 | 4.6 | |||||||||
Retail | 904,691 | 0.2 | |||||||||
Semiconductors | 49,500,303 | 9.6 | |||||||||
Software | 58,306,949 | 11.3 | |||||||||
Total Value of Investments | 508,599,225 | 98.2 | |||||||||
Other assets less liabilities | 9,081,636 | 1.8 | |||||||||
Net Assets | $ | 517,680,861 | 100.0 | % | |||||||
The table above is based on Bloomberg Industry Group classifications. For compliance monitoring purposes, sub-industry classifications are used which results in less concentration across industry sectors.
198
Portfolio of Investments
Annual Report December 31, 2022
December 31, 2022
Baillie Gifford Long Term Global Growth Fund
Shares | Value | ||||||||||
COMMON STOCKS — 98.2% | |||||||||||
BRAZIL — 1.1% | |||||||||||
| MercadoLibre, Inc. * | 6,530 | $ | 5,525,947 | ||||||||
CANADA — 2.2% | |||||||||||
| Shopify, Inc., Class A * | 328,029 | 11,385,887 | |||||||||
CHINA — 21.1% | |||||||||||
| Alibaba Group Holding Ltd. * | 907,152 | 9,954,100 | |||||||||
| BeiGene Ltd. ADR * | 54,684 | 12,027,199 | |||||||||
Contemporary Amperex Technology Co., Ltd., Class A | 224,200 | 12,633,189 | |||||||||
| Meituan, Class B * | 1,159,000 | 25,678,613 | |||||||||
| NIO, Inc. ADR * | 643,034 | 6,269,582 | |||||||||
| Pinduoduo, Inc. ADR * | 312,997 | 25,524,905 | |||||||||
Tencent Holdings Ltd. | 402,900 | 17,083,107 | |||||||||
109,170,695 | |||||||||||
FRANCE — 7.4% | |||||||||||
Hermes International | 9,821 | 15,201,460 | |||||||||
Kering | 45,087 | 22,946,033 | |||||||||
38,147,493 | |||||||||||
GERMANY — 3.1% | |||||||||||
BioNTech SE ADR | 107,619 | 16,166,526 | |||||||||
INDIA — 2.6% | |||||||||||
Housing Development Finance Corp., Ltd. | 432,889 | 13,761,959 | |||||||||
NETHERLANDS — 8.3% | |||||||||||
| Adyen NV * | 12,018 | 16,683,987 | |||||||||
| ASML Holding NV | 48,204 | 26,283,333 | |||||||||
42,967,320 | |||||||||||
SINGAPORE — 1.0% | |||||||||||
| Sea Ltd. ADR * | 97,547 | 5,075,370 | |||||||||
SOUTH KOREA — 2.2% | |||||||||||
| Coupang, Inc. * | 774,685 | 11,395,616 | |||||||||
The accompanying notes are an integral part of the financial statements.
199
Portfolio of Investments
Annual Report December 31, 2022
December 31, 2022
Baillie Gifford Long Term Global Growth Fund
Shares | Value | ||||||||||
UNITED STATES — 49.2% | |||||||||||
| Affirm Holdings, Inc. * | 156,372 | $ | 1,512,117 | ||||||||
| Amazon.com, Inc. * | 292,609 | 24,579,156 | |||||||||
| Atlassian Corp., Class A * | 120,701 | 15,531,805 | |||||||||
| Carvana Co. * | 190,863 | 904,691 | |||||||||
| Cloudflare, Inc., Class A * | 215,481 | 9,741,896 | |||||||||
| Dexcom, Inc. * | 212,209 | 24,030,547 | |||||||||
| Ginkgo Bioworks Holdings, Inc. * | 1,685,681 | 2,848,801 | |||||||||
| Illumina, Inc. * | 82,170 | 16,614,774 | |||||||||
| Intuitive Surgical, Inc. * | 67,342 | 17,869,200 | |||||||||
| Moderna, Inc. * | 160,179 | 28,771,352 | |||||||||
| Netflix, Inc. * | 58,964 | 17,387,304 | |||||||||
NVIDIA Corp. | 158,868 | 23,216,970 | |||||||||
| ROBLOX Corp., Class A * | 282,721 | 8,046,240 | |||||||||
| salesforce, Inc. * | 52,290 | 6,933,131 | |||||||||
| Spotify Technology SA * | 102,075 | 8,058,821 | |||||||||
| Tesla, Inc. * | 139,991 | 17,244,091 | |||||||||
| Trade Desk, Inc. (The), Class A * | 304,654 | 13,657,639 | |||||||||
| Workday, Inc., Class A * | 79,704 | 13,336,870 | |||||||||
| Zoom Video Communications, Inc., Class A * | 69,634 | 4,717,007 | |||||||||
255,002,412 | |||||||||||
TOTAL INVESTMENTS — 98.2% | |||||||||||
(cost $498,603,555) | $ | 508,599,225 | |||||||||
Other assets less liabilities — 1.8% | 9,081,636 | ||||||||||
NET ASSETS — 100.0% | $ | 517,680,861 | |||||||||
* Non-income producing security.
ADR — American Depositary Receipt
This report classifies issuers geographically by their country of risk. For compliance monitoring purposes, the Manager retains discretion to consider a number of factors in determining where a particular issuer is located, as described in further detail in each Fund's prospectus.
Fair Value Measurement
The following is a summary of the inputs used as of December 31, 2022 in valuing the Fund's investments carried at fair value:
Investments in Securities | Level 1 | Level 2 | Level 3 | Total | |||||||||||||||
| Common Stocks ** | $ | 348,373,444 | $ | 160,225,781 | $ | — | $ | 508,599,225 | |||||||||||
Total | $ | 348,373,444 | $ | 160,225,781 | $ | — | $ | 508,599,225 | |||||||||||
** Refer to Portfolio of Investments for further detail.
The accompanying notes are an integral part of the financial statements.
200
Statement of Assets and Liabilities
Annual Report December 31, 2022
December 31, 2022
Baillie Gifford Long Term Global Growth Fund
ASSETS | |||||||
Investments, at value (cost $498,603,555) | $ | 508,599,225 | |||||
Cash | 1,568,933 | ||||||
Receivable for investments sold | 8,506,103 | ||||||
Capital shares sold receivable | 952,069 | ||||||
Tax reclaims receivable | 169,027 | ||||||
Prepaid assets | 21,612 | ||||||
Total Assets | 519,816,969 | ||||||
LIABILITIES | |||||||
Advisory fee payable | 632,172 | ||||||
Capital shares purchased payable | 1,057,387 | ||||||
Administration & Supervisory fee payable | 194,925 | ||||||
Shareholder Servicing fee payable | 33,618 | ||||||
Trustee fee payable | 6,380 | ||||||
Commitment fee payable | 2,134 | ||||||
Accrued expenses | 209,492 | ||||||
Total Liabilities | 2,136,108 | ||||||
NET ASSETS | $ | 517,680,861 | |||||
COMPOSITION OF NET ASSETS | |||||||
Paid-in capital | $ | 702,954,650 | |||||
Total accumulated (loss) | (185,273,789 | ) | |||||
$ | 517,680,861 | ||||||
NET ASSET VALUE, PER SHARE | |||||||
| Class 2 ($60,623,673 / 3,116,264 shares outstanding), unlimited authorized, no par value | $ | 19.45 | |||||
| Class 4 ($40,092,306 / 1,774,513 shares outstanding), unlimited authorized, no par value | $ | 22.59 | |||||
| Class K ($240,855,857 / 12,374,893 shares outstanding), unlimited authorized, no par value | $ | 19.46 | |||||
| Institutional Class ($176,109,025 / 9,088,399 shares outstanding), unlimited authorized, no par value | $ | 19.38 | |||||
The accompanying notes are an integral part of the financial statements.
201
Statement of Operations
Annual Report December 31, 2022
For the Year Ended December 31, 2022
Baillie Gifford Long Term Global Growth Fund
INVESTMENT INCOME | |||||||
Dividends (net of foreign withholding taxes of $352,599) | $ | 1,590,071 | |||||
Non-cash income | 1,278,543 | ||||||
Interest | 45,705 | ||||||
Total Investment Income | 2,914,319 | ||||||
EXPENSES | |||||||
Advisory fee (Note B) | 3,173,803 | ||||||
Shareholder Servicing fees — Class 2 shares (Note B) | 125,796 | ||||||
Shareholder Servicing fees — Class 4 shares (Note B) | 21,851 | ||||||
Shareholder Servicing fees — Class 5 shares (Note B) | 4,333 | ||||||
Administration & Supervisory fee — Class K shares (Note B) | 484,582 | ||||||
Administration & Supervisory fee — Institutional Class shares (Note B) | 498,713 | ||||||
Transfer agency | 114,105 | ||||||
Sub-transfer agency — Institutional Class shares | 313,178 | ||||||
Fund accounting | 263,868 | ||||||
Legal | 126,079 | ||||||
Custody | 91,406 | ||||||
Registration fees | 90,174 | ||||||
Professional fees | 38,247 | ||||||
Trustees' fees | 27,741 | ||||||
Commitment fees | 9,211 | ||||||
Line of credit interest | 3,585 | ||||||
Miscellaneous | 56,075 | ||||||
Total Expenses | 5,442,747 | ||||||
Net Investment (Loss) | (2,528,428 | ) | |||||
| REALIZED AND UNREALIZED GAIN (LOSS) ON INVESTMENTS AND FOREIGN CURRENCY TRANSACTIONS | |||||||
Net realized (loss) from: | |||||||
Investments | (189,493,977 | ) | |||||
Foreign currency transactions | 4,391 | ||||||
(189,489,586 | ) | ||||||
Net change in unrealized (depreciation) on: | |||||||
Investments | (336,216,619 | ) | |||||
Translation of net assets and liabilities denominated in foreign currencies | (4,040 | ) | |||||
(336,220,659 | ) | ||||||
Net realized and unrealized (loss) | (525,710,245 | ) | |||||
NET (DECREASE) IN NET ASSETS FROM OPERATIONS | $ | (528,238,673 | ) | ||||
The accompanying notes are an integral part of the financial statements.
202
Statements of Changes in Net Assets
Annual Report December 31, 2022
Baillie Gifford Long Term Global Growth Fund
| For the Year Ended December 31, 2022 | For the Year Ended December 31, 2021 | ||||||||||
INCREASE (DECREASE) IN NET ASSETS FROM OPERATIONS | |||||||||||
Net investment (loss) | $ | (2,528,428 | ) | $ | (6,898,200 | ) | |||||
Net realized gain (loss) | (189,489,586 | ) | 66,845,179 | ||||||||
Net change in unrealized (depreciation) | (336,220,659 | ) | (63,926,740 | ) | |||||||
Net (Decrease) in Net Assets from Operations | (528,238,673 | ) | (3,979,761 | ) | |||||||
DIVIDENDS AND DISTRIBUTIONS TO SHAREHOLDERS FROM: | |||||||||||
Distributable earnings | |||||||||||
Class 2 | (2,238,949 | ) | (5,937,177 | ) | |||||||
Class 4 | (1,281,675 | ) | — | ||||||||
Class 5 | — | (3,833,233 | ) | ||||||||
Class K | (8,926,777 | ) | (21,200,289 | ) | |||||||
Institutional Class | (6,589,232 | ) | (26,334,555 | ) | |||||||
Total Distributions to Shareholders | (19,036,633 | ) | (57,305,254 | ) | |||||||
TRANSACTIONS IN SHARES OF BENEFICIAL INTEREST | |||||||||||
Net proceeds from shares subscribed: | |||||||||||
Class 2 | 6,000 | 32,500 | |||||||||
Class 4 | 53,862,692 | — | |||||||||
Class K | 48,885,953 | 252,634,576 | |||||||||
Institutional Class | 222,264,057 | 290,000,498 | * | ||||||||
Dividends reinvested: | |||||||||||
Class 2 | 2,238,949 | 5,937,177 | |||||||||
Class 4 | 1,281,675 | — | |||||||||
Class 5 | — | 3,833,233 | |||||||||
Class K | 8,277,694 | 21,145,301 | |||||||||
Institutional Class | 6,561,366 | 26,299,259 | |||||||||
Cost of shares redeemed: | |||||||||||
Class 2 | (7,000,000 | ) | (14,000,000 | ) | |||||||
Class 5 | (74,362,692 | ) | (11,000,000 | ) | |||||||
Class K | (36,691,886 | ) | (31,354,012 | ) | |||||||
Institutional Class | (340,255,603 | ) | (114,269,725 | )* | |||||||
Increase (Decrease) in Net Assets from Transactions in Shares of Beneficial Interest | (114,931,795 | ) | 429,258,807 | ||||||||
Total Increase (Decrease) in Net Assets | (662,207,101 | ) | 367,973,792 | ||||||||
NET ASSETS | |||||||||||
Beginning of Year | 1,179,887,962 | 811,914,170 | |||||||||
End of Year | $ | 517,680,861 | $ | 1,179,887,962 | |||||||
* See Note D for details of share class conversions.
The accompanying notes are an integral part of the financial statements.
203
Financial Highlights
Annual Report December 31, 2022
Baillie Gifford Long Term Global Growth Fund
Selected data for a Class 2 share outstanding throughout each year:
| For the Year Ended December 31, 2022 | For the Year Ended December 31, 2021 | For the Year Ended December 31, 2020 | For the Year Ended December 31, 2019 | For the Year Ended December 31, 2018 | |||||||||||||||||||
Net asset value, beginning of year | $ | 37.47 | $ | 38.45 | $ | 20.68 | $ | 15.51 | $ | 17.33 | |||||||||||||
From Investment Operations | |||||||||||||||||||||||
Net investment (loss)(a) | (0.08 | ) | (0.25 | ) | (0.17 | ) | (0.07 | ) | (0.04 | ) | |||||||||||||
| Net realized and unrealized gain (loss) on investments and foreign currency | (17.19 | ) | 1.20 | 21.17 | 5.27 | (0.22 | ) | ||||||||||||||||
| Net increase (decrease) in net asset value from investment operations | (17.27 | ) | 0.95 | 21.00 | 5.20 | (0.26 | ) | ||||||||||||||||
Dividends and Distributions to Shareholders | |||||||||||||||||||||||
From net realized gain on investments | (0.75 | ) | (1.93 | ) | (3.23 | ) | (0.03 | ) | (1.56 | ) | |||||||||||||
Total dividends and distributions | (0.75 | ) | (1.93 | ) | (3.23 | ) | (0.03 | ) | (1.56 | ) | |||||||||||||
Net asset value, end of year | $ | 19.45 | $ | 37.47 | $ | 38.45 | $ | 20.68 | $ | 15.51 | |||||||||||||
Total Return | |||||||||||||||||||||||
Total return based on net asset value(b) | (46.04 | )% | 2.50 | % | 101.77 | % | 33.49 | % | (1.42 | )% | |||||||||||||
Ratios/Supplemental Data | |||||||||||||||||||||||
Net assets, end of year (000's omitted) | $ | 60,624 | $ | 121,252 | $ | 131,695 | $ | 72,023 | $ | 54,661 | |||||||||||||
Ratio of net expenses to average net assets | 0.73 | % | 0.70 | % | 0.71 | % | 0.76 | % | 0.79 | % | |||||||||||||
Ratio of net investment (loss) to average net assets | (0.33 | )% | (0.60 | )% | (0.58 | )% | (0.40 | )% | (0.22 | )% | |||||||||||||
Portfolio turnover rate(c) | 28 | % | 16 | % | 40 | % | 5 | % | 16 | % | |||||||||||||
(a) Calculated based upon average shares outstanding during the period.
(b) Total investment return is calculated assuming an initial investment made at the net asset value at the beginning of the period, reinvestment of all dividends and distributions, if any, at net asset value during the period, and redemption on the last day of the period.
(c) Portfolio turnover rate calculated at Fund level.
The accompanying notes are an integral part of the financial statements.
204
Financial Highlights
Annual Report December 31, 2022
Baillie Gifford Long Term Global Growth Fund
Selected data for a Class 4 share outstanding throughout each period:
| For the Period April 13, 2022(a) through December 31, 2022 | For the Period January 1, 2020 through July 13, 2020 | For the Period April 10, 2019(b) through December 31, 2019 | For the Period January 1, 2018 through April 9, 2018 | For the Year Ended December 31, 2017 | |||||||||||||||||||
Net asset value, beginning of period | $ | 31.38 | $ | 24.24 | $ | 21.80 | $ | 19.99 | $ | 12.96 | |||||||||||||
From Investment Operations | |||||||||||||||||||||||
Net investment (loss)(c) | (0.06 | ) | (0.05 | ) | (0.04 | ) | (0.03 | ) | (0.07 | ) | |||||||||||||
| Net realized and unrealized gain (loss) on investments and foreign currency | (7.98 | ) | 9.71 | 2.51 | 1.11 | 7.10 | |||||||||||||||||
| Net increase (decrease) in net asset value from investment operations | (8.04 | ) | 9.66 | 2.47 | 1.08 | 7.03 | |||||||||||||||||
Dividends and Distributions to Shareholders | |||||||||||||||||||||||
From net realized gain on investments | (0.75 | ) | — | (0.03 | ) | — | — | ||||||||||||||||
Total dividends and distributions | (0.75 | ) | — | (0.03 | ) | — | — | ||||||||||||||||
| Proceeds from Purchase Fees and Redemption Fees(c) | — | — | — | — | 0.00 | (d) | |||||||||||||||||
Net asset value, end of period | $ | 22.59 | $ | 33.90 | $ | 24.24 | $ | 21.07 | $ | 19.99 | |||||||||||||
Total Return | |||||||||||||||||||||||
Total return based on net asset value(e) | (25.57 | )% | 39.84 | % | 11.34 | % | 5.41 | % | 54.22 | % | |||||||||||||
Ratios/Supplemental Data | |||||||||||||||||||||||
Net assets, end of period (000's omitted) | $ | 40,092 | $ | — | $ | 74,808 | $ | — | $ | 58,802 | |||||||||||||
| Ratio of net expenses to average net assets, before waiver | 0.65 | %* | 0.63 | %* | 0.66 | %* | 0.67 | %* | 0.72 | % | |||||||||||||
| Ratio of net expenses to average net assets, after waiver | 0.65 | %* | 0.63 | %* | 0.66 | %* | 0.67 | %* | 0.67 | % | |||||||||||||
Ratio of net investment (loss) to average net assets | (0.34 | )%* | (0.38 | )%* | (0.27 | )%* | 0.15 | %* | (0.41 | )% | |||||||||||||
Portfolio turnover rate(f) | 28 | % | 40 | % | 5 | % | 16 | % | 13 | % | |||||||||||||
* Annualized
(a) Recommencement of investment operations. Class had no shareholders from July 13, 2020 to April 12, 2022. All shares of this class were redeemed at $33.90 on July 13, 2020. New shares were issued at $31.38 on April 13, 2022.
(b) Recommencement of investment operations. Class had no shareholders from April 9, 2018 to April 9, 2019. All shares of this class were redeemed at $21.07 on April 9, 2018. New shares were issued at $21.80 on April 10, 2019.
(c) Calculated based upon average shares outstanding during the period.
(d) Amount is less than $0.005 per share.
(e) Total investment return is calculated assuming an initial investment made at the net asset value at the beginning of the period, reinvestment of all dividends and distributions, if any, at net asset value during the period, and redemption on the last day of the period. Total return is not annualized for periods less than one year.
(f) Portfolio turnover rate calculated at Fund level. Portfolio turnover is not annualized for periods less than one year.
The accompanying notes are an integral part of the financial statements.
205
Financial Highlights
Annual Report December 31, 2022
Baillie Gifford Long Term Global Growth Fund
Selected data for a Class K share outstanding throughout each year:
| For the Year Ended December 31, 2022 | For the Year Ended December 31, 2021 | For the Year Ended December 31, 2020 | For the Year Ended December 31, 2019 | For the Year Ended December 31, 2018 | |||||||||||||||||||
Net asset value, beginning of year | $ | 37.48 | $ | 38.47 | $ | 20.69 | $ | 15.52 | $ | 17.34 | |||||||||||||
From Investment Operations | |||||||||||||||||||||||
Net investment (loss)(a) | (0.08 | ) | (0.25 | ) | (0.17 | ) | (0.07 | ) | (0.04 | ) | |||||||||||||
| Net realized and unrealized gain (loss) on investments and foreign currency | (17.19 | ) | 1.19 | 21.18 | 5.27 | (0.22 | ) | ||||||||||||||||
| Net increase (decrease) in net asset value from investment operations | (17.27 | ) | 0.94 | 21.01 | 5.20 | (0.26 | ) | ||||||||||||||||
Dividends and Distributions to Shareholders | |||||||||||||||||||||||
From net realized gain on investments | (0.75 | ) | (1.93 | ) | (3.23 | ) | (0.03 | ) | (1.56 | ) | |||||||||||||
Total dividends and distributions | (0.75 | ) | (1.93 | ) | (3.23 | ) | (0.03 | ) | (1.56 | ) | |||||||||||||
Net asset value, end of year | $ | 19.46 | $ | 37.48 | $ | 38.47 | $ | 20.69 | $ | 15.52 | |||||||||||||
Total Return | |||||||||||||||||||||||
Total return based on net asset value(b) | (46.04 | )% | 2.48 | % | 101.76 | % | 33.50 | % | (1.41 | )% | |||||||||||||
Ratios/Supplemental Data | |||||||||||||||||||||||
Net assets, end of year (000's omitted) | $ | 240,856 | $ | 432,975 | $ | 221,188 | $ | 136,096 | $ | 75,402 | |||||||||||||
| Ratio of net expenses to average net assets, before waiver | 0.73 | % | 0.70 | % | 0.71 | % | 0.76 | % | 0.79 | % | |||||||||||||
| Ratio of net expenses to average net assets, after waiver | 0.73 | % | 0.70 | % | 0.71 | % | 0.76 | % | 0.77 | % | |||||||||||||
Ratio of net investment (loss) to average net assets | (0.34 | )% | (0.61 | )% | (0.57 | )% | (0.41 | )% | (0.23 | )% | |||||||||||||
Portfolio turnover rate(c) | 28 | % | 16 | % | 40 | % | 5 | % | 16 | % | |||||||||||||
(a) Calculated based upon average shares outstanding during the period.
(b) Total investment return is calculated assuming an initial investment made at the net asset value at the beginning of the period, reinvestment of all dividends and distributions, if any, at net asset value during the period, and redemption on the last day of the period.
(c) Portfolio turnover rate calculated at Fund level.
The accompanying notes are an integral part of the financial statements.
206
Financial Highlights
Annual Report December 31, 2022
Baillie Gifford Long Term Global Growth Fund
Selected data for an Institutional Class share outstanding throughout each year:
| For the Year Ended December 31, 2022 | For the Year Ended December 31, 2021 | For the Year Ended December 31, 2020 | For the Year Ended December 31, 2019 | For the Year Ended December 31, 2018 | |||||||||||||||||||
Net asset value, beginning of year | $ | 37.36 | $ | 38.38 | $ | 20.66 | $ | 15.51 | $ | 17.34 | |||||||||||||
From Investment Operations | |||||||||||||||||||||||
Net investment (loss)(a) | (0.10 | ) | (0.29 | ) | (0.22 | ) | (0.10 | ) | (0.19 | ) | |||||||||||||
| Net realized and unrealized gain (loss) on investments and foreign currency | (17.13 | ) | 1.20 | 21.17 | 5.28 | (0.08 | ) | ||||||||||||||||
| Net increase (decrease) in net asset value from investment operations | (17.23 | ) | 0.91 | 20.95 | 5.18 | (0.27 | ) | ||||||||||||||||
Dividends and Distributions to Shareholders | |||||||||||||||||||||||
From net realized gain on investments | (0.75 | ) | (1.93 | ) | (3.23 | ) | (0.03 | ) | (1.56 | ) | |||||||||||||
Total dividends and distributions | (0.75 | ) | (1.93 | ) | (3.23 | ) | (0.03 | ) | (1.56 | ) | |||||||||||||
Net asset value, end of year | $ | 19.38 | $ | 37.36 | $ | 38.38 | $ | 20.66 | $ | 15.51 | |||||||||||||
Total Return | |||||||||||||||||||||||
Total return based on net asset value(b) | (46.08 | )% | 2.40 | % | 101.61 | % | 33.40 | % | (1.47 | )% | |||||||||||||
Ratios/Supplemental Data | |||||||||||||||||||||||
Net assets, end of year (000's omitted) | $ | 176,109 | $ | 525,321 | $ | 350,860 | $ | 57,009 | $ | 356 | |||||||||||||
| Ratio of net expenses to average net assets, before waiver | 0.84 | % | 0.80 | % | 0.79 | % | 0.86 | % | 0.88 | % | |||||||||||||
| Ratio of net expenses to average net assets, after waiver | 0.84 | % | 0.80 | % | 0.79 | % | 0.86 | % | 0.87 | % | |||||||||||||
Ratio of net investment (loss) to average net assets | (0.42 | )% | (0.71 | )% | (0.68 | )% | (0.53 | )% | (0.91 | )% | |||||||||||||
Portfolio turnover rate(c) | 28 | % | 16 | % | 40 | % | 5 | % | 16 | % | |||||||||||||
(a) Calculated based upon average shares outstanding during the period.
(b) Total investment return is calculated assuming an initial investment made at the net asset value at the beginning of the period, reinvestment of all dividends and distributions, if any, at net asset value during the period, and redemption on the last day of the period.
(c) Portfolio turnover rate calculated at Fund level.
The accompanying notes are an integral part of the financial statements.
207
Industry Diversification Table
Annual Report December 31, 2022
December 31, 2022
Baillie Gifford U.S. Discovery Fund
Value | % of Total Net Assets | ||||||||||
Aerospace/Defense | $ | 92,941 | 3.3 | % | |||||||
Biotechnology | 364,302 | 12.8 | |||||||||
Chemicals | 30,980 | 1.1 | |||||||||
Commercial Services | 149,772 | 5.3 | |||||||||
Computers | 164,465 | 5.8 | |||||||||
Diversified Financial Services | 12,158 | 0.4 | |||||||||
Electrical Components & Equipment | 83,696 | 3.0 | |||||||||
Healthcare — Products | 330,795 | 11.7 | |||||||||
Healthcare — Services | 40,364 | 1.4 | |||||||||
Insurance | 68,823 | 2.4 | |||||||||
Internet | 242,358 | 8.5 | |||||||||
Miscellaneous Manufacturing | 165,598 | 5.8 | |||||||||
Pharmaceuticals | 65,907 | 2.3 | |||||||||
Real Estate | 7,369 | 0.3 | |||||||||
Retail | 34,564 | 1.2 | |||||||||
Semiconductors | 212,939 | 7.5 | |||||||||
Software | 674,901 | 23.8 | |||||||||
Telecommunications | 56,934 | 2.0 | |||||||||
Total Value of Investments | 2,798,866 | 98.6 | |||||||||
Other assets less liabilities | 41,045 | 1.4 | |||||||||
Net Assets | $ | 2,839,911 | 100.0 | % | |||||||
The table above is based on Bloomberg Industry Group classifications. For compliance monitoring purposes, sub-industry classifications are used which results in less concentration across industry sectors.
208
Portfolio of Investments
Annual Report December 31, 2022
December 31, 2022
Baillie Gifford U.S. Discovery Fund
Shares | Value | ||||||||||
COMMON STOCKS — 98.6% | |||||||||||
ISRAEL — 2.1% | |||||||||||
| JFrog Ltd. * | 2,796 | $ | 59,639 | ||||||||
UNITED STATES — 96.5% | |||||||||||
| Adaptimmune Therapeutics PLC ADR * | 10,551 | 15,404 | |||||||||
| AeroVironment, Inc. * | 1,085 | 92,941 | |||||||||
| Ambarella, Inc. * | 1,064 | 87,493 | |||||||||
| American Well Corp., Class A * | 8,246 | 23,336 | |||||||||
| Appian Corp., Class A * | 897 | 29,206 | |||||||||
| Axon Enterprise, Inc. * | 998 | 165,598 | |||||||||
| Bandwidth, Inc., Class A * | 958 | 21,986 | |||||||||
| Benefitfocus, Inc. * | 4,257 | 44,528 | |||||||||
| Berkeley Lights, Inc. * | 2,428 | 6,507 | |||||||||
| Blackline, Inc. * | 1,323 | 88,998 | |||||||||
| Calix, Inc. * | 832 | 56,934 | |||||||||
| Cardlytics, Inc. * | 2,911 | 16,826 | |||||||||
| Cargurus, Inc. * | 2,532 | 35,473 | |||||||||
| CEVA, Inc. * | 1,135 | 29,033 | |||||||||
| Chegg, Inc. * | 1,784 | 45,082 | |||||||||
| Codexis, Inc. * | 6,648 | 30,980 | |||||||||
| CS Disco, Inc. * | 2,885 | 18,233 | |||||||||
| CyberArk Software Ltd. * | 757 | 98,145 | |||||||||
| Denali Therapeutics, Inc. * | 1,031 | 28,672 | |||||||||
| Digimarc Corp. * | 1,494 | 27,624 | |||||||||
| Doximity, Inc., Class A * | 1,804 | 60,542 | |||||||||
| Everbridge, Inc. * | 1,165 | 34,461 | |||||||||
| EverQuote, Inc., Class A * | 4,742 | 69,897 | |||||||||
| Exact Sciences Corp. * | 1,276 | 63,175 | |||||||||
| Expensify, Inc., Class A * | 3,256 | 28,751 | |||||||||
| Fiverr International Ltd. * | 1,382 | 40,272 | |||||||||
| Freshpet, Inc. * | 655 | 34,564 | |||||||||
| HashiCorp, Inc., Class A * | 1,546 | 42,268 | |||||||||
| IPG Photonics Corp. * | 557 | 52,731 | |||||||||
| LendingTree, Inc. * | 570 | 12,158 | |||||||||
| LiveRamp Holdings, Inc. * | 3,047 | 71,422 | |||||||||
| Novanta, Inc. * | 616 | 83,696 | |||||||||
| Novocure Ltd. * | 1,251 | 91,761 | |||||||||
| Pacira BioSciences, Inc. * | 1,707 | 65,907 | |||||||||
| Precision BioSciences, Inc. * | 4,774 | 5,681 | |||||||||
The accompanying notes are an integral part of the financial statements.
209
Portfolio of Investments
Annual Report December 31, 2022
December 31, 2022
Baillie Gifford U.S. Discovery Fund
Shares | Value | ||||||||||
| Progyny, Inc. * | 1,068 | $ | 33,268 | ||||||||
| Q2 Holdings, Inc. * | 1,442 | 38,747 | |||||||||
| Quanterix Corp. * | 2,370 | 32,825 | |||||||||
| Redfin Corp. * | 1,738 | 7,369 | |||||||||
| Rubius Therapeutics, Inc. * | 2,398 | 413 | |||||||||
| Schrodinger, Inc. * | 1,581 | 29,549 | |||||||||
| Shockwave Medical, Inc. * | 198 | 40,711 | |||||||||
| Sprout Social, Inc., Class A * | 1,869 | 105,524 | |||||||||
| STAAR Surgical Co. * | 1,282 | 62,228 | |||||||||
| Stitch Fix, Inc., Class A * | 2,755 | 8,568 | |||||||||
| Stratasys Ltd. * | 2,122 | 25,167 | |||||||||
| Sutro Biopharma, Inc. * | 5,929 | 47,906 | |||||||||
| Tabula Rasa HealthCare, Inc. * | 2,495 | 12,350 | |||||||||
| Tandem Diabetes Care, Inc. * | 892 | 40,095 | |||||||||
| Teladoc Health, Inc. * | 720 | 17,028 | |||||||||
| TransMedics Group, Inc. * | 2,699 | 166,582 | |||||||||
| Trupanion, Inc. * | 1,448 | 68,823 | |||||||||
| Twist Bioscience Corp. * | 1,230 | 29,286 | |||||||||
| Upwork, Inc. * | 4,732 | 49,402 | |||||||||
| Varonis Systems, Inc. * | 1,719 | 41,153 | |||||||||
| Veeco Instruments, Inc. * | 2,351 | 43,682 | |||||||||
| Xencor, Inc. * | 2,452 | 63,850 | |||||||||
| Zuora, Inc., Class A * | 8,556 | 54,416 | |||||||||
2,739,227 | |||||||||||
TOTAL INVESTMENTS — 98.6% | |||||||||||
(cost $3,624,074) | $ | 2,798,866 | |||||||||
Other assets less liabilities — 1.4% | 41,045 | ||||||||||
NET ASSETS — 100.0% | $ | 2,839,911 | |||||||||
* Non-income producing security.
ADR — American Depositary Receipt
This report classifies issuers geographically by their country of risk. For compliance monitoring purposes, the Manager retains discretion to consider a number of factors in determining where a particular issuer is located, as described in further detail in each Fund's prospectus.
Fair Value Measurement
The following is a summary of the inputs used as of December 31, 2022 in valuing the Fund's investments carried at fair value:
Investments in Securities | Level 1 | Level 2 | Level 3 | Total | |||||||||||||||
| Common Stocks ** | $ | 2,798,866 | $ | — | $ | — | $ | 2,798,866 | |||||||||||
Total | $ | 2,798,866 | $ | — | $ | — | $ | 2,798,866 | |||||||||||
** Refer to Portfolio of Investments for further detail.
The accompanying notes are an integral part of the financial statements.
210
Statement of Assets and Liabilities
Annual Report December 31, 2022
December 31, 2022
Baillie Gifford U.S. Discovery Fund
ASSETS | |||||||
Investments, at value (cost $3,624,074) | $ | 2,798,866 | |||||
Cash | 72,328 | ||||||
Due from Manager | 29,915 | ||||||
Prepaid assets | 9,132 | ||||||
Total Assets | 2,910,241 | ||||||
LIABILITIES | |||||||
Advisory fee payable | 3,626 | ||||||
Administration & Supervisory fee payable | 1,233 | ||||||
Trustee fee payable | 34 | ||||||
Commitment fee payable | 11 | ||||||
Accrued expenses | 65,426 | ||||||
Total Liabilities | 70,330 | ||||||
NET ASSETS | $ | 2,839,911 | |||||
COMPOSITION OF NET ASSETS | |||||||
Paid-in capital | $ | 4,568,545 | |||||
Total accumulated (loss) | (1,728,634 | ) | |||||
$ | 2,839,911 | ||||||
NET ASSET VALUE, PER SHARE | |||||||
| Class K ($2,604,912 / 555,135 shares outstanding), unlimited authorized, no par value | $ | 4.69 | |||||
| Institutional Class ($234,999 / 50,109 shares outstanding), unlimited authorized, no par value | $ | 4.69 | |||||
The accompanying notes are an integral part of the financial statements.
211
Statement of Operations
Annual Report December 31, 2022
For the Year Ended December 31, 2022
Baillie Gifford U.S. Discovery Fund
INVESTMENT INCOME | |||||||
Dividend | $ | 79 | |||||
Interest | 299 | ||||||
Total Investment Income | 378 | ||||||
EXPENSES | |||||||
Advisory fee (Note B) | 13,385 | ||||||
Administration & Supervisory fee — Class K shares (Note B) | 4,070 | ||||||
Administration & Supervisory fee — Institutional Class shares (Note B) | 481 | ||||||
Transfer agency | 38,519 | ||||||
Fund accounting | 79,764 | ||||||
Professional fees | 24,587 | ||||||
Registration fees | 15,584 | ||||||
Custody | 3,250 | ||||||
Legal | 487 | ||||||
Trustees' fees | 114 | ||||||
Commitment fees | 42 | ||||||
Miscellaneous | 4,538 | ||||||
Total Expenses | 184,821 | ||||||
Fees waived/expenses reimbursed | (162,869 | ) | |||||
Total Expenses after Waiver | 21,952 | ||||||
Net Investment (Loss) | (21,574 | ) | |||||
REALIZED AND UNREALIZED (LOSS) ON INVESTMENTS | |||||||
Net realized (loss) from: | |||||||
Investments | (896,106 | ) | |||||
(896,106 | ) | ||||||
Net change in unrealized (depreciation) on: | |||||||
Investments | (583,200 | ) | |||||
(583,200 | ) | ||||||
Net realized and unrealized (loss) | (1,479,306 | ) | |||||
NET (DECREASE) IN NET ASSETS FROM OPERATIONS | $ | (1,500,880 | ) | ||||
The accompanying notes are an integral part of the financial statements.
212
Statements of Changes in Net Assets
Annual Report December 31, 2022
Baillie Gifford U.S. Discovery Fund
| For the Year Ended December 31, 2022 | For the Period May 5, 2021(a) through December 31, 2021 | ||||||||||
INCREASE (DECREASE) IN NET ASSETS FROM OPERATIONS | |||||||||||
Net investment (loss) | $ | (21,574 | ) | $ | (7,858 | ) | |||||
Net realized gain (loss) | (896,106 | ) | 3,567 | ||||||||
Net change in unrealized (depreciation) | (583,200 | ) | (242,008 | ) | |||||||
Net (Decrease) in Net Assets from Operations | (1,500,880 | ) | (246,299 | ) | |||||||
DIVIDENDS AND DISTRIBUTIONS TO SHAREHOLDERS FROM: | |||||||||||
Distributable earnings | |||||||||||
Class K | — | (2,362 | ) | ||||||||
Institutional Class | — | (933 | ) | ||||||||
Total Distributions to Shareholders | — | (3,295 | ) | ||||||||
TRANSACTIONS IN SHARES OF BENEFICIAL INTEREST | |||||||||||
Net proceeds from shares subscribed: | |||||||||||
Class K | 4,455,000 | 1,275,000 | |||||||||
Institutional Class | — | 500,000 | |||||||||
Dividends reinvested: | |||||||||||
Class K | — | 2,362 | |||||||||
Institutional Class | — | 933 | |||||||||
Cost of shares redeemed: | |||||||||||
Class K | (1,642,910 | ) | — | ||||||||
Institutional Class | — | — | |||||||||
Increase in Net Assets from Transactions in Shares of Beneficial Interest | 2,812,090 | 1,778,295 | |||||||||
Total Increase (Decrease) in Net Assets | 1,311,210 | 1,528,701 | |||||||||
NET ASSETS | |||||||||||
Beginning of Period | 1,528,701 | — | |||||||||
End of Period | $ | 2,839,911 | $ | 1,528,701 | |||||||
(a) Commencement of investment operations.
The accompanying notes are an integral part of the financial statements.
213
Financial Highlights
Annual Report December 31, 2022
Baillie Gifford U.S. Discovery Fund
Selected data for a Class K share outstanding throughout each period:
| For the Year Ended December 31, 2022 | For the Period May 5, 2021(a) through December 31, 2021 | ||||||||||
Net asset value, beginning of period | $ | 8.64 | $ | 10.00 | |||||||
From Investment Operations | |||||||||||
Net investment (loss)(b) | (0.04 | ) | (0.05 | ) | |||||||
Net realized and unrealized (loss) on investments and foreign currency | (3.91 | ) | (1.29 | ) | |||||||
Net (decrease) in net asset value from investment operations | (3.95 | ) | (1.34 | ) | |||||||
Dividends and Distributions to Shareholders | |||||||||||
From net realized gain on investments | — | (0.02 | ) | ||||||||
Total dividends and distributions | — | (0.02 | ) | ||||||||
Net asset value, end of period | $ | 4.69 | $ | 8.64 | |||||||
Total Return | |||||||||||
Total return based on net asset value(c) | (45.72 | )% | (13.41 | )% | |||||||
Ratios/Supplemental Data | |||||||||||
Net assets, end of period (000's omitted) | $ | 2,605 | $ | 1,096 | |||||||
Ratio of net expenses to average net assets, before waiver | 6.90 | % | 9.87 | %* | |||||||
Ratio of net expenses to average net assets, after waiver | 0.82 | % | 0.82 | %* | |||||||
Ratio of net investment (loss) to average net assets | (0.81 | )% | (0.82 | )%* | |||||||
Portfolio turnover rate(d) | 86 | % | 6 | % | |||||||
* Annualized.
(a) Commencement of investment operations.
(b) Calculated based upon average shares outstanding during the period.
(c) Total investment return is calculated assuming an initial investment made at the net asset value at the beginning of the period, reinvestment of all dividends and distributions, if any, at net asset value during the period, and redemption on the last day of the period. Total return is not annualized for periods less than one year.
(d) Portfolio turnover rate calculated at Fund level. Portfolio turnover is not annualized for periods less than one year.
The accompanying notes are an integral part of the financial statements.
214
Financial Highlights
Annual Report December 31, 2022
Baillie Gifford U.S. Discovery Fund
Selected data for an Institutional Class share outstanding throughout each period:
| For the Year Ended December 31, 2022 | For the Period May 5, 2021(a) through December 31, 2021 | ||||||||||
Net asset value, beginning of period | $ | 8.64 | $ | 10.00 | |||||||
From Investment Operations | |||||||||||
Net investment (loss)(b) | (0.05 | ) | (0.05 | ) | |||||||
Net realized and unrealized (loss) on investments and foreign currency | (3.90 | ) | (1.29 | ) | |||||||
Net (decrease) in net asset value from investment operations | (3.95 | ) | (1.34 | ) | |||||||
Dividends and Distributions to Shareholders | |||||||||||
From net realized gain on investments | — | (0.02 | ) | ||||||||
Total dividends and distributions | — | (0.02 | ) | ||||||||
Net asset value, end of period | $ | 4.69 | $ | 8.64 | |||||||
Total Return | |||||||||||
Total return based on net asset value(c) | (45.72 | )% | (13.41 | )% | |||||||
Ratios/Supplemental Data | |||||||||||
Net assets, end of period (000's omitted) | $ | 235 | $ | 433 | |||||||
Ratio of net expenses to average net assets, before waiver | 6.90 | % | 9.87 | %* | |||||||
Ratio of net expenses to average net assets, after waiver | 0.82 | % | 0.82 | %* | |||||||
Ratio of net investment (loss) to average net assets | (0.81 | )% | (0.82 | )%* | |||||||
Portfolio turnover rate(d) | 86 | % | 6 | % | |||||||
* Annualized.
(a) Commencement of investment operations.
(b) Calculated based upon average shares outstanding during the period.
(c) Total investment return is calculated assuming an initial investment made at the net asset value at the beginning of the period, reinvestment of all dividends and distributions, if any, at net asset value during the period, and redemption on the last day of the period. Total return is not annualized for periods less than one year.
(d) Portfolio turnover rate calculated at Fund level. Portfolio turnover is not annualized for periods less than one year.
The accompanying notes are an integral part of the financial statements.
215
Industry Diversification Table
Annual Report December 31, 2022
December 31, 2022
Baillie Gifford U.S. Equity Growth Fund
Value | % of Total Net Assets | ||||||||||
Advertising | $ | 2,311,569 | 6.6 | % | |||||||
Auto Manufacturers | 1,800,209 | 5.1 | |||||||||
Banks | 806,058 | 2.3 | |||||||||
Biotechnology | 6,169,368 | 17.6 | |||||||||
Commercial Services | 3,520,522 | 10.1 | |||||||||
Distribution/Wholesale | 1,139,010 | 3.3 | |||||||||
Healthcare — Products | 1,957,724 | 5.6 | |||||||||
Healthcare — Services | 195,428 | 0.6 | |||||||||
Insurance | 184,215 | 0.5 | |||||||||
Internet | 8,543,526 | 24.4 | |||||||||
Real Estate | 114,968 | 0.3 | |||||||||
Retail | 167,295 | 0.5 | |||||||||
Semiconductors | 1,138,577 | 3.3 | |||||||||
Software | 6,061,873 | 17.3 | |||||||||
Total Value of Investments | 34,110,342 | 97.5 | |||||||||
Other assets less liabilities | 877,557 | 2.5 | |||||||||
Net Assets | $ | 34,987,899 | 100.0 | % | |||||||
The table above is based on Bloomberg Industry Group classifications. For compliance monitoring purposes, sub-industry classifications are used which results in less concentration across industry sectors.
216
Portfolio of Investments
Annual Report December 31, 2022
December 31, 2022
Baillie Gifford U.S. Equity Growth Fund
Shares | Value | ||||||||||
COMMON STOCKS — 97.5% | |||||||||||
CANADA — 6.5% | |||||||||||
| Shopify, Inc., Class A * | 65,618 | $ | 2,277,601 | ||||||||
UNITED STATES — 91.0% | |||||||||||
| 10X Genomics, Inc., Class A * | 8,780 | 319,943 | |||||||||
| Affirm Holdings, Inc. * | 20,080 | 194,174 | |||||||||
| Alnylam Pharmaceuticals, Inc. * | 6,178 | 1,468,202 | |||||||||
| Amazon.com, Inc. * | 20,933 | 1,758,372 | |||||||||
| Appian Corp., Class A * | 178 | 5,796 | |||||||||
| Carvana Co. * | 7,214 | 34,194 | |||||||||
| Chegg, Inc. * | 26,177 | 661,493 | |||||||||
| Chewy, Inc., Class A * | 24,083 | 892,998 | |||||||||
| Cloudflare, Inc., Class A * | 19,932 | 901,126 | |||||||||
| CoStar Group, Inc. * | 20,547 | 1,587,872 | |||||||||
| Coursera, Inc. * | 31,842 | 376,691 | |||||||||
| Datadog, Inc., Class A * | 8,526 | 626,661 | |||||||||
| Denali Therapeutics, Inc. * | 22,880 | 636,293 | |||||||||
| DoorDash, Inc., Class A * | 11,933 | 582,569 | |||||||||
| Duolingo, Inc. * | 5,231 | 372,081 | |||||||||
First Republic Bank | 6,613 | 806,059 | |||||||||
| Ginkgo Bioworks Holdings, Inc. * | 115,638 | 195,428 | |||||||||
| HashiCorp, Inc., Class A * | 18,369 | 502,208 | |||||||||
| Illumina, Inc. * | 3,420 | 691,524 | |||||||||
| Lemonade, Inc. * | 13,466 | 184,215 | |||||||||
MarketAxess Holdings, Inc. | 2,511 | 700,293 | |||||||||
| Moderna, Inc. * | 17,446 | 3,133,650 | |||||||||
| Netflix, Inc. * | 4,610 | 1,359,397 | |||||||||
| Novocure Ltd. * | 11,316 | 830,029 | |||||||||
NVIDIA Corp. | 7,791 | 1,138,577 | |||||||||
| Penumbra, Inc. * | 3,631 | 807,752 | |||||||||
| Pinterest, Inc., Class A * | 21,221 | 515,246 | |||||||||
| Recursion Pharmaceuticals, Inc., Class A * | 23,550 | 181,570 | |||||||||
| Redfin Corp. * | 27,115 | 114,968 | |||||||||
| Rivian Automotive, Inc., Class A * | 9,808 | 180,761 | |||||||||
| ROBLOX Corp., Class A * | 22,833 | 649,827 | |||||||||
| Roku, Inc. * | 10,008 | 407,326 | |||||||||
| Sana Biotechnology, Inc. * | 14,716 | 58,128 | |||||||||
| Snap, Inc., Class A * | 32,114 | 287,420 | |||||||||
The accompanying notes are an integral part of the financial statements.
217
Portfolio of Investments
Annual Report December 31, 2022
December 31, 2022
Baillie Gifford U.S. Equity Growth Fund
Shares | Value | ||||||||||
| Snowflake, Inc., Class A * | 5,514 | $ | 791,479 | ||||||||
| Sweetgreen, Inc., Class A * | 15,531 | 133,101 | |||||||||
| Tesla, Inc. * | 13,147 | 1,619,447 | |||||||||
| Trade Desk, Inc. (The), Class A * | 51,563 | 2,311,569 | |||||||||
| Twilio, Inc., Class A * | 12,318 | 603,089 | |||||||||
Watsco, Inc. | 4,567 | 1,139,010 | |||||||||
| Wayfair, Inc., Class A * | 14,065 | 462,598 | |||||||||
| Workday, Inc., Class A * | 6,237 | 1,043,637 | |||||||||
| Zoom Video Communications, Inc., Class A * | 8,355 | 565,968 | |||||||||
31,832,741 | |||||||||||
Total Common Stocks | |||||||||||
(cost $51,851,005) | 34,110,342 | ||||||||||
TOTAL INVESTMENTS — 97.5% | |||||||||||
(cost $51,851,005) | $ | 34,110,342 | |||||||||
Other assets less liabilities — 2.5% | 877,557 | ||||||||||
NET ASSETS — 100.0% | $ | 34,987,899 | |||||||||
* Non-income producing security.
This report classifies issuers geographically by their country of risk. For compliance monitoring purposes, the Manager retains discretion to consider a number of factors in determining where a particular issuer is located, as described in further detail in each Fund's prospectus.
Fair Value Measurement
The following is a summary of the inputs used as of December 31, 2022 in valuing the Fund's investments carried at fair value:
Investments in Securities | Level 1 | Level 2 | Level 3 | Total | |||||||||||||||
| Common Stocks ** | $ | 34,110,342 | $ | — | $ | — | $ | 34,110,342 | |||||||||||
Total Investments in Securities | $ | 34,110,342 | $ | — | $ | — | $ | 34,110,342 | |||||||||||
** Refer to Portfolio of Investments for further detail.
The accompanying notes are an integral part of the financial statements.
218
Statement of Assets and Liabilities
Annual Report December 31, 2022
December 31, 2022
Baillie Gifford U.S. Equity Growth Fund
ASSETS | |||||||
Investments, at value (cost $51,851,005) | $ | 34,110,342 | |||||
Cash | 1,587,150 | ||||||
Receivable for investments sold | 59,329 | ||||||
Due from Manager | 30,142 | ||||||
Capital shares sold receivable | 6,825 | ||||||
Prepaid assets | 19,805 | ||||||
Total Assets | 35,813,593 | ||||||
LIABILITIES | |||||||
Advisory fee payable | 31,547 | ||||||
Payable for investment purchased | 684,263 | ||||||
Capital shares purchased payable | 19,131 | ||||||
Administration & Supervisory fee payable | 16,251 | ||||||
Trustee fee payable | 443 | ||||||
Commitment fee payable | 148 | ||||||
Accrued expenses | 73,911 | ||||||
Total Liabilities | 825,694 | ||||||
NET ASSETS | $ | 34,987,899 | |||||
COMPOSITION OF NET ASSETS | |||||||
Paid-in capital | $ | 67,394,187 | |||||
Total accumulated (loss) | (32,406,288 | ) | |||||
$ | 34,987,899 | ||||||
NET ASSET VALUE, PER SHARE | |||||||
| Class K ($16,273,430 / 1,166,329 shares outstanding), unlimited authorized, no par value | $ | 13.95 | |||||
| Institutional Class ($18,714,469 / 1,346,754 shares outstanding), unlimited authorized, no par value | $ | 13.90 | |||||
The accompanying notes are an integral part of the financial statements.
219
Statement of Operations
Annual Report December 31, 2022
For the Year Ended December 31, 2022
Baillie Gifford U.S. Equity Growth Fund
INVESTMENT INCOME | |||||||
Dividends | $ | 57,995 | |||||
Interest | 2,710 | ||||||
Total Investment Income | 60,705 | ||||||
EXPENSES | |||||||
Advisory fee (Note B) | 160,987 | ||||||
Administration & Supervisory fee — Class K shares (Note B) | 37,441 | ||||||
Administration & Supervisory fee — Institutional Class shares (Note B) | 45,492 | ||||||
Transfer agency | 48,966 | ||||||
Sub-transfer agency — Institutional Class shares | 29,369 | ||||||
Fund accounting | 82,671 | ||||||
Registration fees | 43,301 | ||||||
Professional fees | 28,034 | ||||||
Legal | 8,631 | ||||||
Custody | 7,296 | ||||||
Trustees' fees | 1,669 | ||||||
Line of Credit Interest | 715 | ||||||
Commitment fees | 542 | ||||||
Miscellaneous | 7,563 | ||||||
Total Expenses | 502,677 | ||||||
Fees waived/expenses reimbursed | (156,211 | ) | |||||
Total Expenses after Waiver | 346,466 | ||||||
Net Investment (Loss) | (285,761 | ) | |||||
REALIZED AND UNREALIZED (LOSS) ON INVESTMENTS | |||||||
Net realized (loss) from: | |||||||
Investments | (11,108,390 | ) | |||||
(11,108,390 | ) | ||||||
Net change in unrealized (depreciation) on: | |||||||
Investments | (38,498,352 | ) | |||||
(38,498,352 | ) | ||||||
Net realized and unrealized (loss) | (49,606,742 | ) | |||||
NET (DECREASE) IN NET ASSETS FROM OPERATIONS | $ | (49,892,503 | ) | ||||
The accompanying notes are an integral part of the financial statements.
220
Statements of Changes in Net Assets
Annual Report December 31, 2022
Baillie Gifford U.S. Equity Growth Fund
| For the Year Ended December 31, 2022 | For the Year Ended December 31, 2021 | ||||||||||
INCREASE (DECREASE) IN NET ASSETS FROM OPERATIONS | |||||||||||
Net investment (loss) | $ | (285,761 | ) | $ | (921,565 | ) | |||||
Net realized gain (loss) | (11,108,390 | ) | 6,517,195 | ||||||||
Net change in unrealized (depreciation) | (38,498,352 | ) | (14,946,640 | ) | |||||||
Net (Decrease) in Net Assets from Operations | (49,892,503 | ) | (9,351,010 | ) | |||||||
DIVIDENDS AND DISTRIBUTIONS TO SHAREHOLDERS FROM: | |||||||||||
Distributable earnings | |||||||||||
Class K | (1,476,563 | ) | (3,628,645 | ) | |||||||
Institutional Class | (1,702,423 | ) | (5,556,811 | ) | |||||||
Total Distributions to Shareholders | (3,178,986 | ) | (9,185,456 | ) | |||||||
TRANSACTIONS IN SHARES OF BENEFICIAL INTEREST | |||||||||||
Net proceeds from shares subscribed: | |||||||||||
Class K | 738,649 | 21,778,411 | |||||||||
Institutional Class | 8,520,193 | 106,488,365 | |||||||||
Dividends reinvested: | |||||||||||
Class K | 1,438,401 | 3,493,770 | |||||||||
Institutional Class | 1,702,423 | 5,556,812 | |||||||||
Cost of shares redeemed: | |||||||||||
Class K | (1,849,937 | ) | (41,666,785 | ) | |||||||
Institutional Class | (19,967,202 | ) | (80,445,589 | ) | |||||||
Increase (Decrease) in Net Assets from Transactions in Shares of Beneficial Interest | (9,417,473 | ) | 15,204,984 | ||||||||
Total (Decrease) in Net Assets | (62,488,962 | ) | (3,331,482 | ) | |||||||
NET ASSETS | |||||||||||
Beginning of Year | 97,476,861 | 100,808,343 | |||||||||
End of Year | $ | 34,987,899 | $ | 97,476,861 | |||||||
The accompanying notes are an integral part of the financial statements.
221
Financial Highlights
Annual Report December 31, 2022
Baillie Gifford U.S. Equity Growth Fund
Selected data for a Class K share outstanding throughout each year:
| For the Year Ended December 31, 2022 | For the Year Ended December 31, 2021 | For the Year Ended December 31, 2020 | For the Year Ended December 31, 2019 | For the Year Ended December 31, 2018 | |||||||||||||||||||
Net asset value, beginning of year | $ | 34.63 | $ | 39.85 | $ | 18.25 | $ | 14.25 | $ | 13.39 | |||||||||||||
From Investment Operations | |||||||||||||||||||||||
Net investment (loss)(a) | (0.10 | ) | (0.25 | ) | (0.16 | ) | (0.08 | ) | (0.07 | ) | |||||||||||||
| Net realized and unrealized gain (loss) on investments and foreign currency | (19.21 | ) | (1.40 | ) | 23.07 | 4.33 | 1.22 | ||||||||||||||||
| Net increase (decrease) in net asset value from investment operations | (19.31 | ) | (1.65 | ) | 22.91 | 4.25 | 1.15 | ||||||||||||||||
Dividends and Distributions to Shareholders | |||||||||||||||||||||||
From net realized gain on investments | (1.37 | ) | (3.57 | ) | (1.31 | ) | (0.25 | ) | (0.29 | ) | |||||||||||||
Total dividends and distributions | (1.37 | ) | (3.57 | ) | (1.31 | ) | (0.25 | ) | (0.29 | ) | |||||||||||||
Net asset value, end of year | $ | 13.95 | $ | 34.63 | $ | 39.85 | $ | 18.25 | $ | 14.25 | |||||||||||||
Total Return | |||||||||||||||||||||||
Total return based on net asset value(b) | (55.58 | )% | (4.17 | )% | 125.57 | % | 29.78 | % | 8.60 | % | |||||||||||||
Ratios/Supplemental Data | |||||||||||||||||||||||
Net assets, end of year (000's omitted) | $ | 16,273 | $ | 38,673 | $ | 58,076 | $ | 13,867 | $ | 10,594 | |||||||||||||
| Ratio of net expenses to average net assets, before waiver | 0.97 | % | 0.68 | % | 0.97 | % | 1.72 | % | 7.75 | % | |||||||||||||
| Ratio of net expenses to average net assets, after waiver | 0.65 | % | 0.65 | % | 0.65 | % | 0.65 | % | 0.63 | % | |||||||||||||
Ratio of net investment (loss) to average net assets | (0.53 | )% | (0.58 | )% | (0.55 | )% | (0.45 | )% | (0.46 | )% | |||||||||||||
Portfolio turnover rate(c) | 14 | % | 70 | % | 33 | % | 18 | % | 107 | % | |||||||||||||
(a) Calculated based upon average shares outstanding during the period.
(b) Total investment return is calculated assuming an initial investment made at the net asset value at the beginning of the period, reinvestment of all dividends and distributions, if any, at net asset value during the period, and redemption on the last day of the period.
(c) Portfolio turnover rate calculated at Fund level.
The accompanying notes are an integral part of the financial statements.
222
Financial Highlights
Annual Report December 31, 2022
Baillie Gifford U.S. Equity Growth Fund
Selected data for an Institutional Class share outstanding throughout each year:
| For the Year Ended December 31, 2022 | For the Year Ended December 31, 2021 | For the Year Ended December 31, 2020 | For the Year Ended December 31, 2019 | For the Year Ended December 31, 2018 | |||||||||||||||||||
Net asset value, beginning of year | $ | 34.53 | $ | 39.78 | $ | 18.23 | $ | 14.21 | $ | 13.39 | |||||||||||||
From Investment Operations | |||||||||||||||||||||||
Net investment (loss)(a) | (0.13 | ) | (0.29 | ) | (0.20 | ) | (0.10 | ) | (0.10 | ) | |||||||||||||
| Net realized and unrealized gain (loss) on investments and foreign currency | (19.13 | ) | (1.39 | ) | 23.06 | 4.37 | 1.21 | ||||||||||||||||
| Net increase (decrease) in net asset value from investment operations | (19.26 | ) | (1.68 | ) | 22.86 | 4.27 | 1.11 | ||||||||||||||||
Dividends and Distributions to Shareholders | |||||||||||||||||||||||
From net realized gain on investments | (1.37 | ) | (3.57 | ) | (1.31 | ) | (0.25 | ) | (0.29 | ) | |||||||||||||
Total dividends and distributions | (1.37 | ) | (3.57 | ) | (1.31 | ) | (0.25 | ) | (0.29 | ) | |||||||||||||
Net asset value, end of year | $ | 13.90 | $ | 34.53 | $ | 39.78 | $ | 18.23 | $ | 14.21 | |||||||||||||
Total Return | |||||||||||||||||||||||
Total return based on net asset value(b) | (55.63 | )% | (4.25 | )% | 125.43 | % | 30.01 | %(c) | 8.30 | % | |||||||||||||
Ratios/Supplemental Data | |||||||||||||||||||||||
Net assets, end of year (000's omitted) | $ | 18,714 | $ | 58,804 | $ | 42,732 | $ | 3,464 | $ | 6 | |||||||||||||
| Ratio of net expenses to average net assets, before waiver | 1.08 | % | 0.77 | % | 1.06 | % | 1.82 | % | 6.69 | % | |||||||||||||
| Ratio of net expenses to average net assets, after waiver | 0.76 | % | 0.75 | % | 0.74 | % | 0.75 | % | 0.78 | % | |||||||||||||
Ratio of net investment (loss) to average net assets | (0.64 | )% | (0.68 | )% | (0.65 | )% | (0.56 | )% | (0.53 | )% | |||||||||||||
Portfolio turnover rate(d) | 14 | % | 70 | % | 33 | % | 18 | % | 107 | % | |||||||||||||
(a) Calculated based upon average shares outstanding during the period.
(b) Total investment return is calculated assuming an initial investment made at the net asset value at the beginning of the period, reinvestment of all dividends and distributions, if any, at net asset value during the period, and redemption on the last day of the period.
(c) Excluding reimbursement received from the Manager, total return for the period is 29.72%.
(d) Portfolio turnover rate calculated at Fund level.
The accompanying notes are an integral part of the financial statements.
223
Notes to Financial Statements
Annual Report December 31, 2022
Note A — Organization and Accounting Policies
As of December 31, 2022, each fund identified in the table below (each, a "Fund", and collectively, the "Funds") was a series of Baillie Gifford Funds (the "Trust"). The Trust includes one series, Baillie Gifford International All Cap Fund, that is not included in this report. The investment objective of each Fund includes achieving capital appreciation.
For more detail on specific objectives of each Fund and a description of each share class, please refer to the relevant prospectus. The Trust is an open-end management investment company registered under the Investment Company Act of 1940, as amended (the "1940 Act"). The Trust was organized as a Massachusetts business trust on
June 21, 2000, under the laws of Massachusetts. The Trust operates pursuant to the Second Amended and Restated Agreement and Declaration of Trust dated February 27, 2017, as amended from time to time.
On July 18, 2022, Baillie Gifford Positive Change Equities Fund (the "Positive Change Fund") was reorganized with and into Vanguard Baillie Gifford Global Positive Impact Stock Fund (the "Vanguard Fund"), a series of the Vanguard Valley Forge Funds. Shareholders in the Positive Change Fund received shares in the Vanguard Fund in exchange for their holding and the Positive Change Fund subsequently ceased operations.
At a meeting held on December 13, 2022, the Board approved the liquidation and termination of Baillie Gifford Global Stewardship Equities Fund. It is expected that the Fund will be liquidated and terminated in mid-2023.
The following table is a summary of classes of the Funds with shares outstanding as of December 31, 2022:
Class 2 | Class 3 | Class 4 | Class 5 | Class K | Institutional Class | ||||||||||||||||||||||
Baillie Gifford China A Shares Growth Fund | N/A | N/A | N/A | N/A | X | X | |||||||||||||||||||||
Baillie Gifford China Equities Fund | N/A | N/A | N/A | N/A | X | X | |||||||||||||||||||||
Baillie Gifford Developed EAFE All Cap Fund | X | X | N/A | N/A | X | X | |||||||||||||||||||||
Baillie Gifford EAFE Plus All Cap Fund | X | X | N/A | N/A | X | X | |||||||||||||||||||||
Baillie Gifford Emerging Markets Equities Fund | X | X | X | X | X | X | |||||||||||||||||||||
Baillie Gifford Emerging Markets ex China Fund | N/A | N/A | N/A | N/A | X | X | |||||||||||||||||||||
Baillie Gifford Global Alpha Equities Fund | X | X | X | N/A | X | X | |||||||||||||||||||||
Baillie Gifford Global Stewardship Equities Fund | N/A | N/A | N/A | N/A | X | X | |||||||||||||||||||||
Baillie Gifford Health Innovation Equities Fund | N/A | N/A | N/A | N/A | X | X | |||||||||||||||||||||
Baillie Gifford International Alpha Fund | X | X | X | X | X | X | |||||||||||||||||||||
| Baillie Gifford International Concentrated Growth Equities Fund | N/A | N/A | N/A | N/A | X | X | |||||||||||||||||||||
Baillie Gifford International Growth Fund | X | X | X | X | X | X | |||||||||||||||||||||
Baillie Gifford International Smaller Companies Fund | N/A | N/A | N/A | N/A | X | X | |||||||||||||||||||||
Baillie Gifford Long Term Global Growth Fund | X | N/A | X | N/A | X | X | |||||||||||||||||||||
Baillie Gifford U.S. Discovery Fund | N/A | N/A | N/A | N/A | X | X | |||||||||||||||||||||
Baillie Gifford U.S. Equity Growth Fund | N/A | N/A | N/A | N/A | X | X | |||||||||||||||||||||
The Funds are investment companies that apply the accounting and reporting guidance issued in Topic 946 by the U.S. Financial Accounting Standards Board. The financial statements of the Funds have been prepared in conformity with generally accepted accounting principles in the United States of America ("GAAP"). Management is required to make certain estimates and assumptions that
affect the reported amounts of assets and liabilities and disclosure of contingent assets and liabilities at the date of the financial statements and the reported amounts of increases and decreases in net assets from operations during the reporting period. Actual results could differ from those estimates.
224
Notes to Financial Statements
Annual Report December 31, 2022
The following is a summary of significant accounting policies followed by the Funds:
Valuation of Investments
On December 3, 2020, the Securities and Exchange Commission (the "SEC") adopted new rule 2a-5 ("Rule 2a-5") under the 1940 Act, addressing valuation practices and the role of the Board of Trustees of the Trust (the "Board") with respect to the fair valuation of investments of a registered investment company. Rule 2a-5 became effective on March 8, 2021, with a compliance date of September 8, 2022. The Funds have implemented Rule 2a-5 effective as of June 22, 2022, which has not had, and is not expected to have, a significant impact on the financial statements.
Investments for which there are readily available market quotations are valued at market value. Equity securities listed on a securities exchange, market or automated quotation system (including equity securities traded over the counter) for which quotations are readily available, are valued at the last quoted trade price on the primary exchange or market (foreign or domestic) on which they are most actively traded on the date of valuation (or at approximately 4:00 p.m. Eastern Time if a security's primary exchange is normally open at that time), or, if there is no such reported sale on the date of valuation at the most recent quoted bid price.
Other securities for which current market quotations are not readily available (or for which quotations are not believed to be reliable due to market changes that occur after the most recent available quotations are obtained, or for any other reason), and all other assets, are valued at their fair value as determined in good faith by the Funds' investment adviser and valuation designee, Baillie Gifford Overseas Limited (the "Manager").
Generally, trading in foreign securities markets is substantially completed each day at various times prior to close of regular trading on the New York Stock Exchange. Occasionally, events affecting the value of equity securities of non-U.S. issuers not traded on a U.S. exchange may occur between the completion of substantial trading of such securities for the day and the close of regular trading on the New York Stock Exchange, and such events may not be reflected in the computation of a Fund's net asset value.
The Valuation Designee utilizes a third-party pricing service for all equity securities, except those traded on Canadian, Latin American or U.S. exchanges, subject to certain minimum confidence levels, which applies a fair
value adjustment that seeks to reflect changes in such securities' market prices since the close of the market on which the securities are traded. To the extent that securities are valued using this service, the securities will be classified as Level 2 securities in the fair value measurement framework described below.
Fair Value Measurement
GAAP provides guidance on fair value measurements and defines fair value as the price that a Fund would receive to sell an investment or pay to transfer a liability in a timely transaction with an independent buyer in the principal market, or in the absence of a principal market, the most advantageous market for the investment or liability. It establishes a single definition of fair value, creates a three-tier hierarchy as a framework for measuring fair value based on inputs used to value the Fund's investments, and requires additional disclosure about fair value. The hierarchy of inputs is summarized below:
Level 1 — unadjusted quoted prices in active markets for identical investments that the Funds have the ability to access
Level 2 — other significant observable inputs (including quoted prices for similar investments, interest rates, prepayment speeds, credit risk, etc.)
Level 3 — significant unobservable inputs (including the Trust's own assumptions in determining the fair value of investments)
For Level 1 inputs, the Funds use unadjusted quoted prices in active markets for assets or liabilities with sufficient frequency and volume to provide pricing information as the most reliable evidence of fair value.
The Funds' Level 2 valuation techniques include inputs other than quoted prices within Level 1 that are observable for an asset or liability, either directly or indirectly. This includes when a fair value adjustment is applied which seeks to reflect changes in foreign securities' market prices since the close of the market on which they are traded. Level 2 observable inputs may include quoted prices for similar assets and liabilities in active markets or quoted prices for identical or similar assets or liabilities in markets that are not active in which there are few transactions, the prices are not current, or price quotations vary substantially over time or among market participants. Inputs that are observable for the asset or liability in Level 2 include such factors as interest rates, yield curves, prepayment speeds, credit risk, and default rates for similar liabilities.
225
Notes to Financial Statements
Annual Report December 31, 2022
For Level 3 valuation techniques, the Funds use unobservable inputs that reflect assumptions market participants would be expected to use in pricing the asset or liability. Unobservable inputs are used to measure fair value to the extent that observable inputs are not available and are developed based on the best information available under the circumstances. In developing unobservable inputs, market participant assumptions are used if they are reasonably available without undue cost and effort.
The inputs or methodology used for valuing securities are not necessarily an indication of the risk associated with investing in those securities. The hierarchy classification of inputs used to value each Fund's investments at December 31, 2022 is disclosed at the end of each Fund's Portfolio of Investments.
Foreign Currency Translation
The accounting records of the Funds are maintained in U.S. dollars. Foreign currency amounts are translated into U.S. dollars at the applicable rate of exchange to determine the value of investments, assets and liabilities. Purchases and sales of securities and income and expenses are translated at the prevailing rate of exchange on the respective dates of such transactions. The Funds do not isolate that portion of net realized and unrealized gains and losses on investments resulting from changes in foreign exchange rates from the impact arising from changes in market prices. Such fluctuations are included with net realized and unrealized gain or loss from investments.
Net realized foreign exchange gains and losses arise from sales of foreign currencies, currency gains or losses realized between the trade and settlement dates on securities transactions, and the differences between the amounts of dividends, interest, and foreign withholding taxes recorded on the Funds' books and the U.S. dollar equivalent of the amounts actually received or paid. Net unrealized foreign exchange gains and losses arise from changes in the value of assets and liabilities, other than investments in securities, resulting from changes in the exchange rates.
Securities Transactions and Investment Income
The Funds' securities transactions are recorded on the trade date. Realized gains or losses on sales of investments are determined on the basis of identified cost. Dividend income is recorded on the ex-dividend date. Non-cash
income, if any, is included in investment income, with any non-cash income exceeding 5% of a Fund's total income stated separately on the Statements of Operations, and is recorded at the fair value of securities received.
Investment income, expenses (other than those specific to a particular class of shares), and realized and unrealized gains and losses on investments are allocated to the separate classes of shares based upon their relative net asset value on the date income is earned or expensed and realized and unrealized gains and losses are incurred.
U.S. Federal and Other Taxes
Each Fund intends to continue to qualify to be taxed as a "regulated investment company" under the provisions of the U.S. Internal Revenue Code of 1986, as amended (the "Code"), and as such will not be subject to U.S. federal income tax on income (including any net realized capital gains) which is distributed in accordance with the provisions of the Code to the Funds' shareholders. Therefore, no U.S. federal income tax provision is required.
Investment income received from investments in foreign jurisdictions may be subject to foreign withholding tax. Investment income is recorded net of any foreign withholding taxes, less any amounts reclaimable. The Funds may file withholding tax reclaims in certain jurisdictions to recover a portion of amounts previously withheld. Whenever possible, the Funds will attempt to operate so as to qualify for reduced tax rates or tax exemptions in those countries with which the United States has a tax treaty. Foreign taxes, if any, net of any reclaims, are recorded based on the tax regulations and rates that exist in the foreign markets in which the Funds invest.
As a result of several court cases in certain countries across the European Union ("EU"), some Funds may file European tax reclaims for previously withheld taxes on dividends earned in those countries. These additional filings are subject to various administrative proceedings by the local jurisdictions' tax authorities within the EU, as well as a number of related judicial proceedings. If a positive decision is reached and as such, reclaims become payable to the Funds, they will be reflected as windfall tax recovery within investment income in the Statements of Operations and related receivables, if any, will be reflected within tax reclaims receivable in the Statements of Assets and Liabilities. If the associated cash is received, the Funds will generally follow, for tax purposes, IRS guidance in Notice 2016-10 and reduce the current year foreign taxes paid by the amount of the refund. When uncertainty exists as to the
226
Notes to Financial Statements
Annual Report December 31, 2022
ultimate resolution of these proceedings and the likelihood of receipt of these EU reclaims, no amounts are reflected in the financial statements.
During the year ended December 31, 2022, Baillie Gifford Developed EAFE All Cap Fund, Baillie Gifford EAFE Plus All Cap Fund, Baillie Gifford Global Alpha Equities Fund, Baillie Gifford International Alpha Fund and Baillie Gifford International Growth Fund successfully recovered taxes withheld by Sweden and have recorded the windfall tax recovery in the Statements of Operations.
In the event that EU reclaims received by a Fund during a fiscal year exceed foreign withholding taxes paid by the Fund, and the Fund previously passed through to its shareholders foreign taxes incurred by the Fund to be used as a credit or deduction on a shareholder's income tax return, the Fund will enter into a closing agreement with the IRS in order to pay the associated tax liability on behalf of the Fund's shareholders.
Such an event occurred in September 2022 when Baillie Gifford Global Alpha Equities Fund and Baillie Gifford International Growth Fund successfully recovered taxes withheld by Sweden. As such, both Funds have determined to enter into a closing agreement with the IRS and recorded the closing agreement user fees as a reduction to income, as reflected in the Statements of Operations.
In addition to the requirements of the Code, the Funds may also be subject to capital gains tax in India and potentially other foreign jurisdictions, on gains realized upon the sale of securities in India or other such foreign jurisdictions, payable upon repatriation of sales proceeds. Any realized losses in excess of gains in India may be carried forward to offset future gains. Funds with exposure to Indian securities and potentially other foreign jurisdictions accrue a deferred tax liability for unrealized gains in excess of available loss carryforwards based on
existing tax rates and holding periods of the securities. As of December 31, 2022, Baillie Gifford Emerging Markets Equities Fund recorded a receivable for India capital gains tax refunds of $1,176,756. As of December 31, 2022, Baillie Gifford EAFE Plus All Cap Fund, Baillie Gifford Emerging Markets Equities Fund, Baillie Gifford Global Alpha Equities Fund, Baillie Gifford International Alpha Fund, Baillie Gifford International Growth Fund and Baillie Gifford International Smaller Companies Fund recorded a deferred liability for potential future India capital gains taxes of $11,679, $12,895,261, $308,419, $972,339, $407,410 and $3,611, respectively.
While overseas investors currently are exempt from paying capital gains or value added taxes on income and gains from investments in China A shares purchased through the Stock Connect programs, these Chinese tax rules could be changed, which could result in unexpected tax liabilities for the Fund.
The Funds are subject to tax accounting standards that provide guidance for how certain and uncertain tax positions should be recognized, measured, presented and disclosed in the financial statements. These standards require the evaluation of tax positions taken, or expected to be taken, in the course of preparing the Funds' tax returns to determine whether the tax positions are "more-likely-than-not" of being sustained by the applicable tax authority. Tax positions not deemed to meet the "more-likely-than-not" threshold would be recorded as a reduction in a tax benefit or expense in the current year. Management has evaluated the application of these standards and has determined no liabilities for income tax related expenses are required in the financial statements of the Funds. The previous three tax year ends and the interim tax period since then, as applicable, remain subject to examination.
At December 31, 2022 for federal income tax purposes, the following Funds had capital loss carryforwards available to offset future capital gains. To the extent that these loss carryforwards are utilized, capital gains so offset will not be distributed to shareholders.
| Fund | Short Term Capital (Losses) No Expiration | Long Term Capital (Losses) No Expiration | Capital (Loss) Available Total | ||||||||||||
Baillie Gifford China A Shares Growth Fund | $ | (58 | ) | $ | (2,513 | ) | $ | (2,571 | ) | ||||||
Baillie Gifford China Equities Fund | (194,883 | ) | (58,975 | ) | (253,858 | ) | |||||||||
Baillie Gifford Developed EAFE All Cap Fund | (9,582,017 | ) | (863,354 | ) | (10,445,371 | ) | |||||||||
Baillie Gifford EAFE Plus All Cap Fund | (2,242,540 | ) | — | (2,242,540 | ) | ||||||||||
Baillie Gifford Emerging Markets Equities Fund | (92,966,834 | ) | (86,423,380 | ) | (179,390,214 | ) | |||||||||
227
Notes to Financial Statements
Annual Report December 31, 2022
| Fund | Short Term Capital (Losses) No Expiration | Long Term Capital (Losses) No Expiration | Capital (Loss) Available Total | ||||||||||||
Baillie Gifford Emerging Markets ex China Fund | $ | (19,387 | ) | $ | — | $ | (19,387 | ) | |||||||
Baillie Gifford Global Alpha Equities Fund | (60,489,750 | ) | (14,378,685 | ) | (74,868,435 | ) | |||||||||
Baillie Gifford Global Stewardship Equities Fund | (27,105 | ) | (200,721 | ) | (227,826 | ) | |||||||||
Baillie Gifford Health Innovation Equities Fund | — | — | — | ||||||||||||
Baillie Gifford International Alpha Fund | (66,793,114 | ) | — | (66,793,114 | ) | ||||||||||
Baillie Gifford International Concentrated Growth Equities Fund | (5,203,159 | ) | (6,406,718 | ) | (11,609,877 | ) | |||||||||
Baillie Gifford International Growth Fund | — | — | — | ||||||||||||
Baillie Gifford International Smaller Companies Fund | (5,948,855 | ) | (83,862 | ) | (6,032,717 | ) | |||||||||
Baillie Gifford Long Term Global Growth Fund | (66,952,996 | ) | (68,133,753 | ) | (135,086,749 | ) | |||||||||
Baillie Gifford U.S. Discovery Fund | (829,595 | ) | (67,232 | ) | (896,827 | ) | |||||||||
Baillie Gifford U.S. Equity Growth Fund | (3,404,558 | ) | (8,404,127 | ) | (11,808,685 | ) | |||||||||
During the year ended December 31, 2022, no Fund utilized capital loss carryforwards.
Realized capital losses, currency losses and passive foreign investment company ("PFIC") losses incurred after October 31 ("post-October capital/late year ordinary losses") within the taxable year are deemed to arise on the first business day of each Fund's next taxable year. During the year or period ended December 31, 2022, the Funds shown below incurred and will elect to defer net post-October or late year losses as indicated.
At December 31, 2022, the components of accumulated earnings on a tax basis were as follows:
Fund | Undistributed Net Ordinary Income | Long Term Capital Gains | Capital (Loss) Carryforwards | Post October Capital/Late Year Ordinary (Losses) | Other Temporary Differences | Net Unrealized Appreciation/ (Depreciation) on Investments, Foreign Currency and Foreign Tax | Distributable Earnings/ (Accumulated Loss) | ||||||||||||||||||||||||
| Baillie Gifford China A Shares Growth Fund | $ | 276 | $ | — | $ | (2,571 | ) | $ | — | $ | — | $ | 116,686 | $ | 114,391 | ||||||||||||||||
| Baillie Gifford China Equities Fund | 459 | — | (253,858 | ) | (152,935 | ) | — | (760,600 | ) | (1,166,934 | ) | ||||||||||||||||||||
| Baillie Gifford Developed EAFE All Cap Fund | 3,579,914 | — | (10,445,371 | ) | — | 110,984 | 14,492,544 | 7,738,071 | |||||||||||||||||||||||
| Baillie Gifford EAFE Plus All Cap Fund | — | — | (2,242,540 | ) | (1,075,051 | ) | — | 25,468,464 | 22,150,873 | ||||||||||||||||||||||
| Baillie Gifford Emerging Markets Equities Fund | 34,264,264 | — | (179,390,214 | ) | (31,231,955 | ) | — | (352,153,949 | ) | (528,511,854 | ) | ||||||||||||||||||||
| Baillie Gifford Emerging Markets ex China Fund | 1,571 | — | (19,387 | ) | — | — | (267,570 | ) | (285,386 | ) | |||||||||||||||||||||
| Baillie Gifford Global Alpha Equities Fund | 10,946,859 | — | (74,868,435 | ) | — | — | 152,155,623 | 88,234,047 | |||||||||||||||||||||||
| Baillie Gifford Global Stewardship Equities Fund | — | — | (227,826 | ) | — | — | (148,972 | ) | (376,798 | ) | |||||||||||||||||||||
| Baillie Gifford Health Innovation Equities Fund | — | — | — | — | — | (3,227,072 | ) | (3,227,072 | ) | ||||||||||||||||||||||
| Baillie Gifford International Alpha Fund | 8,421,778 | — | (66,793,114 | ) | (64,568,326 | ) | 1,572,738 | 365,201,768 | 243,834,844 | ||||||||||||||||||||||
228
Notes to Financial Statements
Annual Report December 31, 2022
| Fund | Undistributed Net Ordinary Income | Long Term Capital Gains | Capital (Loss) Carryforwards | Post October Capital/Late Year Ordinary (Losses) | Other Temporary Differences | Net Unrealized Appreciation/ (Depreciation) on Investments, Foreign Currency and Foreign Tax | Distributable Earnings/ (Accumulated Loss) | ||||||||||||||||||||||||
| Baillie Gifford International Concentrated Growth Equities Fund | $ | — | $ | — | $ | (11,609,877 | ) | $ | (1,209,914 | ) | $ | — | $ | (26,901,460 | ) | $ | (39,721,251 | ) | |||||||||||||
| Baillie Gifford International Growth Fund | 1,101,370 | — | — | (29,130,779 | ) | — | 611,163,501 | 583,134,092 | |||||||||||||||||||||||
| Baillie Gifford International Smaller Companies Fund | 39,359 | — | (6,032,717 | ) | (1,808,819 | ) | — | (13,999,651 | ) | (21,801,828 | ) | ||||||||||||||||||||
| Baillie Gifford Long Term Global Growth Fund | — | — | (135,086,749 | ) | (34,314,972 | ) | — | (15,872,068 | ) | (185,273,789 | ) | ||||||||||||||||||||
| Baillie Gifford U.S. Discovery Fund | — | — | (896,827 | ) | — | — | (831,807 | ) | (1,728,634 | ) | |||||||||||||||||||||
| Baillie Gifford U.S. Equity Growth Fund | — | — | (11,808,685 | ) | — | — | (20,597,603 | ) | (32,406,288 | ) | |||||||||||||||||||||
The differences between the components of distributable earnings on a tax basis and the amounts reflected in the Statements of Assets and Liabilities are primarily due to the differing book/tax treatment of realized losses on wash sales and mark to market income on securities categorized as PFICs and certain corporate actions.
For the year ended December 31, 2022, the following reclassifications have been made on the Statements of Assets and Liabilities as a result of certain differences in the computation of net investment income and net realized capital gains under U.S. federal income tax rules and regulations versus GAAP, such as the treatment of foreign currency gains and losses, the redesignation of dividends, organizational costs, and net operating losses.
| Fund | Total Distributable Earnings | Paid-in Capital | |||||||||
Baillie Gifford China A Shares Growth Fund | $ | — | $ | — | |||||||
Baillie Gifford China Equities Fund | — | — | |||||||||
Baillie Gifford Developed EAFE All Cap Fund | — | — | |||||||||
Baillie Gifford EAFE Plus All Cap Fund | 1,026,577 | (1,026,577 | ) | ||||||||
Baillie Gifford Emerging Markets Equities Fund | — | — | |||||||||
Baillie Gifford Emerging Markets ex China Fund | — | — | |||||||||
Baillie Gifford Global Alpha Equities Fund | — | — | |||||||||
Baillie Gifford Global Stewardship Equities Fund | 6,179 | (6,179 | ) | ||||||||
Baillie Gifford Health Innovation Equities Fund | 21,390 | (21,390 | ) | ||||||||
Baillie Gifford International Alpha Fund | — | — | |||||||||
Baillie Gifford International Concentrated Growth Equities Fund | 163,711 | (163,711 | ) | ||||||||
Baillie Gifford International Growth Fund | 5,505 | (5,505 | ) | ||||||||
Baillie Gifford International Smaller Companies Fund | — | — | |||||||||
Baillie Gifford Long Term Global Growth Fund | 2,436,954 | (2,436,954 | ) | ||||||||
Baillie Gifford U.S. Discovery Fund | 21,574 | (21,574 | ) | ||||||||
Baillie Gifford U.S. Equity Growth Fund | 285,762 | (285,762 | ) | ||||||||
229
Notes to Financial Statements
Annual Report December 31, 2022
Dividends and Distributions to Shareholders
The Funds intend to distribute each year, as dividends, substantially all net investment income and net capital gains realized. All such dividends or distributions are credited in the form of additional shares of the Funds at net asset value on the ex-dividend date unless the shareholder elects to receive dividends and distributions in cash. Currently, the Funds' policies are to distribute net investment income and net capital gains on an annual basis. Such distributions are determined in conformity with U.S. federal income tax regulations, which may differ from GAAP.
For the years or periods ended December 31, 2022 and December 31, 2021, the tax characters of the dividends paid were:
| Fund | Ordinary Income 2022 | Long Term Capital Gains 2022 | Return of Capital 2022 | Ordinary Income 2021 | Long Term Capital Gains 2021 | Return of Capital 2021 | |||||||||||||||||||||
Baillie Gifford China A Shares Growth Fund | $ | — | $ | 37,206 | $ | — | $ | 52,713 | $ | 143,105 | $ | — | |||||||||||||||
Baillie Gifford China Equities Fund | 13,277 | — | — | — | — | — | |||||||||||||||||||||
Baillie Gifford Developed EAFE All Cap Fund | 38 | 5,465,947 | — | 8,308,514 | 13,101,070 | — | |||||||||||||||||||||
Baillie Gifford EAFE Plus All Cap Fund | 230,950 | 10,818,597 | — | 9,741,701 | 43,860,768 | — | |||||||||||||||||||||
Baillie Gifford Emerging Markets Equities Fund | 229,126,116 | — | — | 87,014,813 | 88,374,708 | — | |||||||||||||||||||||
| Baillie Gifford Emerging Markets ex China Fund | 35,709 | — | — | — | — | — | |||||||||||||||||||||
Baillie Gifford Global Alpha Equities Fund | 684,212 | 29,166,245 | — | 25,463,667 | 177,006,800 | — | |||||||||||||||||||||
| Baillie Gifford Global Stewardship Equities Fund | — | 148,726 | — | 85,490 | 464,622 | — | |||||||||||||||||||||
Baillie Gifford Health Innovation Equities Fund | 1,658 | — | — | — | — | — | |||||||||||||||||||||
Baillie Gifford International Alpha Fund | 36,025,929 | — | — | 43,424,575 | 244,018,275 | — | |||||||||||||||||||||
| Baillie Gifford International Concentrated Growth Equities Fund | 40,519 | 4,069,719 | — | 8,817,775 | 14,787,080 | — | |||||||||||||||||||||
Baillie Gifford International Growth Fund | 4,932,632 | 12,498,410 | — | 87,678,200 | 443,239,493 | — | |||||||||||||||||||||
| Baillie Gifford International Smaller Companies Fund | 50,295 | — | — | 40,765 | 188,016 | — | |||||||||||||||||||||
Baillie Gifford Long Term Global Growth Fund | — | 19,036,633 | — | — | 57,305,254 | — | |||||||||||||||||||||
Baillie Gifford U.S. Discovery Fund | — | — | — | 3,295 | — | — | |||||||||||||||||||||
Baillie Gifford U.S. Equity Growth Fund | — | 3,178,986 | — | — | 9,185,456 | — | |||||||||||||||||||||
For tax purposes, short-term capital gain distributions, if any, are considered ordinary income distributions.
The Funds' cost of investments and gross unrealized appreciation (depreciation) at December 31, 2022 for U.S. federal income tax purposes were as follows:
Fund | Cost of Investments | Gross Appreciation | Gross (Depreciation) | Net Appreciation (Depreciation) | |||||||||||||||
Baillie Gifford China A Shares Growth Fund | $ | 1,252,411 | $ | 361,213 | $ | (244,527 | ) | $ | 116,686 | ||||||||||
Baillie Gifford China Equities Fund | 2,808,309 | 24,055 | (784,655 | ) | (760,600 | ) | |||||||||||||
Baillie Gifford Developed EAFE All Cap Fund | 544,442,833 | 120,329,538 | (105,836,994 | ) | 14,492,544 | ||||||||||||||
Baillie Gifford EAFE Plus All Cap Fund | 412,267,760 | 110,821,937 | (85,353,473 | ) | 25,468,464 | ||||||||||||||
Baillie Gifford Emerging Markets Equities Fund | 4,715,138,518 | 958,302,310 | (1,310,456,259 | ) | (352,153,949 | ) | |||||||||||||
Baillie Gifford Emerging Markets ex China Fund | 997,722 | 23,691 | (291,261 | ) | (267,570 | ) | |||||||||||||
Baillie Gifford Global Alpha Equities Fund | 868,279,793 | 302,251,512 | (150,095,889 | ) | 152,155,623 | ||||||||||||||
230
Notes to Financial Statements
Annual Report December 31, 2022
| Fund | Cost of Investments | Gross Appreciation | Gross (Depreciation) | Net Appreciation (Depreciation) | |||||||||||||||
Baillie Gifford Global Stewardship Equities Fund | $ | 3,645,886 | $ | 838,149 | $ | (987,121 | ) | $ | (148,972 | ) | |||||||||
Baillie Gifford Health Innovation Equities Fund | 23,670,927 | 409,619 | (3,636,691 | ) | (3,227,072 | ) | |||||||||||||
Baillie Gifford International Alpha Fund | 1,709,352,803 | 749,361,642 | (384,159,874 | ) | 365,201,768 | ||||||||||||||
| Baillie Gifford International Concentrated Growth Equities Fund | 94,581,286 | 6,851,180 | (33,752,640 | ) | (26,901,460 | ) | |||||||||||||
Baillie Gifford International Growth Fund | 1,967,593,668 | 1,037,720,468 | (426,556,967 | ) | 611,163,501 | ||||||||||||||
Baillie Gifford International Smaller Companies Fund | 48,581,523 | 1,561,516 | (15,561,167 | ) | (13,999,651 | ) | |||||||||||||
Baillie Gifford Long Term Global Growth Fund | 524,463,561 | 120,423,629 | (136,295,697 | ) | (15,872,068 | ) | |||||||||||||
Baillie Gifford U.S. Discovery Fund | 3,630,673 | 235,043 | (1,066,850 | ) | (831,807 | ) | |||||||||||||
Baillie Gifford U.S. Equity Growth Fund | 54,707,945 | 3,761,483 | (24,359,086 | ) | (20,597,603 | ) | |||||||||||||
Note B — Investment Management and Other Services
The Funds are advised and managed by the Manager. The Manager, an investment adviser registered with the SEC, is a wholly owned subsidiary of Baillie Gifford & Co.
Under an investment advisory agreement between the Manager and the Trust on behalf of the Funds (the "Advisory Agreement"), each Fund pays the Manager an investment advisory fee, in arrears.
The advisory fee paid by each Fund under the Advisory Agreement is calculated and accrued daily on the basis of the annual rate noted below and expressed as a percentage of that Fund's average daily net assets.
Fund | Average Daily Net Assets of the Fund (billions) | Annual Rate at Each Asset Level | |||||||||
| Baillie Gifford China A Shares Growth Fund | $0 - $2 > $2 - $5 Above $5 | 0.55% 0.51% 0.49% | |||||||||
| Baillie Gifford China Equities Fund | $0 - $2 > $2 - $5 Above $5 | 0.55% 0.51% 0.49% | |||||||||
| Baillie Gifford Developed EAFE All Cap Fund | $0 - $2 > $2 - $5 Above $5 | 0.35% 0.31% 0.29% | |||||||||
| Baillie Gifford EAFE Plus All Cap Fund | $0 - $2 > $2 - $5 Above $5 | 0.35% 0.31% 0.29% | |||||||||
| Baillie Gifford Emerging Markets Equities Fund | $0 - $2 > $2 - $5 Above $5 | 0.55% 0.51% 0.49% | |||||||||
| Baillie Gifford Emerging Markets ex China Fund | $0 - $2 > $2 - $5 Above $5 | 0.55% 0.51% 0.49% | |||||||||
| Baillie Gifford Global Alpha Equities Fund | $0 - $2 > $2 - $5 Above $5 | 0.40% 0.36% 0.34% | |||||||||
| Baillie Gifford Global Stewardship Equities Fund | $0 - $2 > $2 - $5 Above $5 | 0.33% 0.29% 0.27% | |||||||||
231
Notes to Financial Statements
Annual Report December 31, 2022
Fund | Average Daily Net Assets of the Fund (billions) | Annual Rate at Each Asset Level | |||||||||
| Baillie Gifford Health Innovation Equities Fund | $0 - $2 > $2 - $5 Above $5 | 0.33% 0.29% 0.27% | |||||||||
| Baillie Gifford International Alpha Fund | $0 - $2 > $2 - $5 Above $5 | 0.35% 0.31% 0.29% | |||||||||
| Baillie Gifford International Concentrated Growth Equities Fund | $0 - $2 > $2 - $5 Above $5 | 0.40% 0.36% 0.34% | |||||||||
| Baillie Gifford International Growth Fund | $0 - $2 > $2 - $5 Above $5 | 0.35% 0.31% 0.29% | |||||||||
Baillie Gifford International Smaller Companies Fund | All assets | 0.58% | |||||||||
| Baillie Gifford Long Term Global Growth Fund | $0 - $2 > $2 - $5 Above $5 | 0.45% 0.41% 0.39% | |||||||||
Baillie Gifford U.S. Discovery Fund | All assets | 0.50% | |||||||||
| Baillie Gifford U.S. Equity Growth Fund | $0 - $2 > $2 - $5 Above $5 | 0.33% 0.29% 0.27% | |||||||||
The Manager has contractually agreed to waive its fees and/or bear expenses of the following Funds to the extent that such Fund's total annual operating expenses (excluding taxes, sub-accounting expenses and extraordinary expenses) exceed the following amounts:
Fund | Class | Expense Limitation | Expiration Date | ||||||||||||
Baillie Gifford China A Shares Growth Fund | Class K | 0.87 | % | April 30, 2023 | |||||||||||
Institutional Class | 0.87 | % | April 30, 2023 | ||||||||||||
Baillie Gifford China Equities Fund | Class K | 0.87 | % | April 30, 2023 | |||||||||||
Institutional Class | 0.87 | % | April 30, 2023 | ||||||||||||
Baillie Gifford Emerging Markets ex China Fund | Class K | 0.87 | % | April 30, 2023 | |||||||||||
Institutional Class | 0.87 | % | April 30, 2023 | ||||||||||||
Baillie Gifford Global Stewardship Equities Fund | Class K | 0.65 | % | April 30, 2023 | |||||||||||
Institutional Class | 0.65 | % | April 30, 2023 | ||||||||||||
Baillie Gifford Health Innovation Equities Fund | Class K | 0.65 | % | April 30, 2023 | |||||||||||
Institutional Class | 0.65 | % | April 30, 2023 | ||||||||||||
Baillie Gifford International Concentrated Growth Equities Fund | Class K | 0.72 | % | April 30, 2023 | |||||||||||
Institutional Class | 0.72 | % | April 30, 2023 | ||||||||||||
Baillie Gifford International Smaller Companies Fund | Class K | 0.90 | % | April 30, 2023 | |||||||||||
Institutional Class | 0.90 | % | April 30, 2023 | ||||||||||||
Baillie Gifford U.S. Discovery Fund | Class K | 0.82 | % | April 30, 2023 | |||||||||||
Institutional Class | 0.82 | % | April 30, 2023 | ||||||||||||
Baillie Gifford U.S. Equity Growth Fund | Class K | 0.65 | % | April 30, 2023 | |||||||||||
Institutional Class | 0.65 | % | April 30, 2023 | ||||||||||||
232
Notes to Financial Statements
Annual Report December 31, 2022
Fees waived or expenses reimbursed for all Funds are not subject to recoupment. These contractual agreements may only be terminated by the Board.
Baillie Gifford Funds Services LLC, a wholly-owned subsidiary of the Manager, serves as the sole distributor and principal underwriter of the shares of the Funds.
The Funds have adopted a Shareholder Servicing Plan providing that the Fund may pay the Manager, or any other entity that acts from time to time as the shareholder servicing agent with respect to a class of Fund shares, for services rendered and expenses borne in connection with the provision of services provided to Fund investors and/or the maintenance of shareholder accounts. For these services, the Funds pay the Manager a fee at the annualized rate of the Funds' average daily net assets attributed to each class of shares. The fee paid by Class 2 shares is 0.17%, Class 3 shares is 0.10%, Class 4 shares is 0.07%, and Class 5 shares is 0.02%. Class K and Institutional Class shares do not pay this fee.
With respect to Class K and Institutional Class shares, the Manager is responsible for providing certain administrative services to Fund shareholders as well as coordinating, overseeing and supporting services provided to Fund shareholders by third parties, including financial intermediaries that hold accounts with the Funds, pursuant
to an Administration and Supervisory Agreement between the Manager and the Trust on behalf of each Fund.
Each Fund has adopted an Administration, Supervisory and Sub-Accounting Services Plan with respect to Class K and Institutional Class shares of each Fund, which authorizes each Fund to pay the Manager an Administration and Supervisory Fee quarterly, in arrears, with respect to Class K and Institutional Class shares at an annual rate of 0.17% of such Fund's average net assets.
Institutional Class shares bear expenses in connection with compensating financial intermediaries for sub-transfer agency and other services. Class K shares do not bear such expenses.
The Funds may enter into certain agreements with Financial Intermediaries that require payments for sub-transfer agency services in excess of the Board approved cap on payments and/or reimbursements to Financial Intermediaries. In such instances the Manager will pay, out of its own profits, the difference between the amount due under the agreement with the Financial Intermediary and the cap on such payments and/or reimbursements approved by the Board.
The Bank of New York Mellon serves as the Funds' administrator and custodian. BNY Mellon Investment Servicing (U.S.) Inc. serves as the Trust's transfer agent, registrar and dividend disbursing agent.
Note C — Investment Transactions
Purchases and proceeds from sales of securities (excluding short term securities and in-kind transactions) for the year ended December 31, 2022 were as follows:
Fund | Purchases | Sales | |||||||||
Baillie Gifford China A Shares Growth Fund | $ | 205,929 | $ | 200,509 | |||||||
Baillie Gifford China Equities Fund | 1,013,915 | 709,289 | |||||||||
Baillie Gifford Developed EAFE All Cap Fund | 240,425,460 | 146,737,457 | |||||||||
Baillie Gifford EAFE Plus All Cap Fund | 124,924,937 | 82,756,202 | |||||||||
Baillie Gifford Emerging Markets Equities Fund | 804,980,614 | 722,838,309 | |||||||||
Baillie Gifford Emerging Markets ex China Fund | 137,662 | 100,638 | |||||||||
Baillie Gifford Global Alpha Equities Fund | 100,452,711 | 227,738,807 | |||||||||
Baillie Gifford Global Stewardship Equities Fund | 534,411 | 546,730 | |||||||||
Baillie Gifford Health Innovation Equities Fund | 14,890,144 | 1,068,738 | |||||||||
Baillie Gifford International Alpha Fund | 510,070,483 | 1,171,159,262 | |||||||||
Baillie Gifford International Concentrated Growth Equities Fund | 64,679,229 | 56,103,737 | |||||||||
Baillie Gifford International Growth Fund | 483,699,092 | 332,690,593 | |||||||||
Baillie Gifford International Smaller Companies Fund | 18,352,584 | 17,079,755 | |||||||||
Baillie Gifford Long Term Global Growth Fund | 202,422,800 | 330,257,026 | |||||||||
Baillie Gifford U.S. Discovery Fund | 4,901,681 | 2,141,244 | |||||||||
Baillie Gifford U.S. Equity Growth Fund | 7,202,076 | 20,245,345 | |||||||||
233
Notes to Financial Statements
Annual Report December 31, 2022
Note D — Transactions in Shares of Beneficial Interest
Baillie Gifford China A Shares Growth Fund | |||||||||||||||||||
| For the Year Ended December 31, 2022 | For the Year Ended December 31, 2021 | ||||||||||||||||||
Shares | Amount | Shares | Amount | ||||||||||||||||
Class K Shares | |||||||||||||||||||
Shares sold | — | $ | — | — | $ | — | |||||||||||||
Shares issued in reinvestment of dividends and distributions | 1,604 | 18,603 | 5,756 | 97,909 | |||||||||||||||
Shares redeemed | — | — | — | — | |||||||||||||||
Net Increase (Decrease) | 1,604 | $ | 18,603 | 5,756 | $ | 97,909 | |||||||||||||
Institutional Class Shares | |||||||||||||||||||
Shares sold | — | $ | — | — | $ | — | |||||||||||||
Shares issued in reinvestment of dividends and distributions | 1,604 | 18,603 | 5,756 | 97,909 | |||||||||||||||
Shares redeemed | — | — | — | — | |||||||||||||||
Net Increase (Decrease) | 1,604 | $ | 18,603 | 5,756 | $ | 97,909 | |||||||||||||
Total Net Increase (Decrease) | 3,208 | $ | 37,206 | 11,512 | $ | 195,818 | |||||||||||||
Baillie Gifford China Equities Fund | |||||||||||||||||||
| For the Year Ended December 31, 2022 | For the Year Ended December 31, 2021 | ||||||||||||||||||
Shares | Amount | Shares | Amount | ||||||||||||||||
Class K Shares | |||||||||||||||||||
Shares sold | — | $ | — | — | $ | — | |||||||||||||
Shares issued in reinvestment of dividends and distributions | 268 | 1,566 | 105,353 | 1,017,000 | |||||||||||||||
Shares redeemed | (55,353 | ) | (308,872 | ) | — | — | |||||||||||||
Net Increase (Decrease) | (55,085 | ) | $ | (307,306 | ) | 105,353 | $ | 1,017,000 | |||||||||||
Institutional Class Shares | |||||||||||||||||||
Shares sold | 87,890 | $ | 593,485 | — | $ | — | |||||||||||||
Shares issued in reinvestment of dividends and distributions | 2,008 | 11,711 | 217,722 | 1,962,735 | |||||||||||||||
Shares redeemed | (3,887 | ) | (27,175 | ) | — | — | |||||||||||||
Net Increase (Decrease) | 86,011 | $ | 578,021 | 217,722 | $ | 1,962,735 | |||||||||||||
Total Net Increase (Decrease) | 30,926 | $ | 270,715 | 323,075 | $ | 2,979,735 | |||||||||||||
234
Notes to Financial Statements
Annual Report December 31, 2022
Baillie Gifford Developed EAFE All Cap Fund | |||||||||||||||||||
| For the Year Ended December 31, 2022 | For the Year Ended December 31, 2021 | ||||||||||||||||||
Shares | Amount | Shares | Amount | ||||||||||||||||
Class 2 Shares | |||||||||||||||||||
Shares sold | 6,275,170 | (a) | $ | 82,492,963 | (a) | 344 | $ | 6,000 | |||||||||||
Shares issued in reinvestment of dividends and distributions | 114,263 | 1,315,372 | 177,235 | 3,070,718 | |||||||||||||||
Shares redeemed | (634,271 | ) | (7,500,000 | ) | (7,496,960 | )(b) | (128,955,703 | )(b) | |||||||||||
Net Increase (Decrease) | 5,755,162 | $ | 76,308,335 | (7,319,381 | ) | $ | (125,878,985 | ) | |||||||||||
Class 3 Shares | |||||||||||||||||||
Shares sold | 6,675,899 | (c) | $ | 88,645,931 | (c) | 6,023,514 | (d) | $ | 103,921,278 | (d) | |||||||||
Shares issued in reinvestment of dividends and distributions | 64,977 | 755,979 | 188,554 | 3,299,115 | |||||||||||||||
Shares redeemed | (6,212,069 | )(e) | (82,486,963 | )(e) | (6,470,874 | )(f) | (111,639,409 | )(f) | |||||||||||
Net Increase (Decrease) | 528,807 | $ | 6,914,947 | (258,806 | ) | $ | (4,419,016 | ) | |||||||||||
Class 4 Shares | |||||||||||||||||||
Shares sold | — | $ | — | 6,448,597 | (g) | $ | 111,639,409 | (g) | |||||||||||
Shares issued in reinvestment of dividends and distributions | — | — | 203,257 | 3,568,899 | |||||||||||||||
Shares redeemed | (6,651,854 | )(h) | (88,645,931 | )(h) | — | — | |||||||||||||
Net Increase (Decrease) | (6,651,854 | ) | $ | (88,645,931 | ) | 6,651,854 | $ | 115,208,308 | |||||||||||
Class K Shares | |||||||||||||||||||
Shares sold | 3,758,575 | $ | 45,155,999 | 6,335,745 | $ | 111,763,657 | |||||||||||||
Shares issued in reinvestment of dividends and distributions | 179,601 | 2,063,614 | 581,109 | 10,047,376 | |||||||||||||||
Shares redeemed | (5,425,132 | ) | (62,875,742 | ) | (1,805,323 | ) | (31,415,609 | ) | |||||||||||
Net Increase (Decrease) | (1,486,956 | ) | $ | (15,656,129 | ) | 5,111,531 | $ | 90,395,424 | |||||||||||
Institutional Class Shares | |||||||||||||||||||
Shares sold | 20,510,124 | $ | 232,591,735 | 2,143,379 | $ | 37,047,091 | |||||||||||||
Shares issued in reinvestment of dividends and distributions | 115,248 | 1,320,743 | 59,685 | 1,029,566 | |||||||||||||||
Shares redeemed | (11,436,995 | ) | (127,032,078 | ) | (443,832 | ) | (7,719,308 | ) | |||||||||||
Net Increase (Decrease) | 9,188,377 | $ | 106,880,400 | 1,759,232 | $ | 30,357,349 | |||||||||||||
Total Net Increase (Decrease) | 7,333,536 | $ | 85,801,622 | 5,944,430 | $ | 105,663,080 | |||||||||||||
(a) 6,274,682 shares and $82,486,963 converted into Class 2 from Class 3.
(b) 6,083,173 shares and $103,921,278 converted from Class 2 into Class 3.
(c) 6,675,899 shares and $88,645,931 converted into Class 3 from Class 4.
(d) 6,023,514 shares and $103,921,278 converted into Class 3 from Class 2.
(e) 6,212,069 shares and $82,486,963 converted from Class 3 into Class 2.
(f) 6,470,874 shares and $111,639,409 converted from Class 3 into Class 4.
(g) 6,448,597 shares and $111,639,409 converted into Class 4 from Class 3.
(h) 6,651,854 shares and $88,645,931 converted from Class 4 into Class 3.
235
Notes to Financial Statements
Annual Report December 31, 2022
Baillie Gifford EAFE Plus All Cap Fund | |||||||||||||||||||
| For the Year Ended December 31, 2022 | For the Year Ended December 31, 2021 | ||||||||||||||||||
Shares | Amount | Shares | Amount | ||||||||||||||||
Class 2 Shares | |||||||||||||||||||
Shares sold | 4,384,864 | (a) | $ | 66,979,275 | (a) | 273 | $ | 6,000 | |||||||||||
Shares issued in reinvestment of dividends and distributions | 332,581 | 4,407,368 | 793,811 | 15,772,464 | |||||||||||||||
Shares redeemed | (538,157 | ) | (7,100,000 | ) | (8,024,318 | )(b) | (177,343,738 | )(b) | |||||||||||
Net Increase (Decrease) | 4,179,288 | $ | 64,286,643 | (7,230,234 | ) | $ | (161,565,274 | ) | |||||||||||
Class 3 Shares | |||||||||||||||||||
Shares sold | 2,729,644 | (c) | $ | 48,661,226 | (c) | 4,848,759 | (d) | $ | 108,708,698 | (d) | |||||||||
Shares issued in reinvestment of dividends and distributions | 231,760 | 3,067,698 | 953,239 | 18,905,377 | |||||||||||||||
Shares redeemed | (4,418,442 | )(e) | (67,348,275 | )(e) | (2,087,262 | )(f) | (45,139,893 | )(f) | |||||||||||
Net Increase (Decrease) | (1,457,038 | ) | $ | (15,619,351 | ) | 3,714,736 | $ | 82,474,182 | |||||||||||
Class 4 Shares | |||||||||||||||||||
Shares sold | — | $ | — | 224,291 | (g) | $ | 4,689,893 | (g) | |||||||||||
Shares issued in reinvestment of dividends and distributions | — | — | 22,194 | 440,760 | |||||||||||||||
Shares redeemed | (246,485 | )(h) | (3,764,253 | )(h) | — | — | |||||||||||||
Net Increase (Decrease) | (246,485 | ) | $ | (3,764,253 | ) | 246,485 | $ | 5,130,653 | |||||||||||
Class K Shares | |||||||||||||||||||
Shares sold | 1,007,240 | $ | 14,784,641 | 658,370 | (i) | $ | 14,492,662 | (i) | |||||||||||
Shares issued in reinvestment of dividends and distributions | 237,189 | 3,130,898 | 744,100 | 14,725,746 | |||||||||||||||
Shares redeemed | (274,901 | ) | (3,894,300 | ) | (2,599,010 | ) | (55,928,721 | ) | |||||||||||
Net Increase (Decrease) | 969,528 | $ | 14,021,239 | (1,196,540 | ) | $ | (26,710,313 | ) | |||||||||||
Institutional Class Shares | |||||||||||||||||||
Shares sold | 135,560 | $ | 2,016,768 | 411,092 | $ | 9,054,805 | |||||||||||||
Shares issued in reinvestment of dividends and distributions | 33,573 | 441,482 | 189,274 | 3,736,271 | |||||||||||||||
Shares redeemed | (984,443 | ) | (12,855,574 | ) | (353,062 | )(j) | (7,859,622 | )(j) | |||||||||||
Net Increase (Decrease) | (815,310 | ) | $ | (10,397,324 | ) | 247,304 | $ | 4,931,454 | |||||||||||
Total Net Increase (Decrease) | 2,629,983 | $ | 48,526,954 | (4,218,249 | ) | $ | (95,739,298 | ) | |||||||||||
(a) 4,384,445 shares and $66,973,275 converted into Class 2 from Class 3.
(b) 4,846,598 shares and $108,708,699 converted from Class 2 into Class 3
(c) 246,833 shares and $3,764,253 converted into Class 3 from Class 4.
(d) 4,848,759 shares and $108,708,699 converted into Class 3 from Class 2
(e) 4,391,633 shares and $66,973,275 converted from Class 3 into Class 2.
(f) 204,363 shares and $4,239,893 converted from Class 3 into Class 4
(g) 203,987 shares and $4,239,893 converted into Class 4 from Class 3
(h) 246,485 shares and $3,764,253 converted from Class 4 into Class 3.
(i) 152,082 shares and $3,455,307 converted into Class K from Institutional Class.
(j) 152,552 shares and $3,455,307 converted from Institutional Class into Class K.
236
Notes to Financial Statements
Annual Report December 31, 2022
Baillie Gifford Emerging Markets Equities Fund | |||||||||||||||||||
| For the Year Ended December 31, 2022 | For the Year Ended December 31, 2021 | ||||||||||||||||||
Shares | Amount | Shares | Amount | ||||||||||||||||
Class 2 Shares | |||||||||||||||||||
Shares sold | 174,843 | (a) | $ | 3,592,367 | (a) | 3,043,916 | $ | 90,006,000 | |||||||||||
Shares issued in reinvestment of dividends and distributions | 156,220 | 2,673,322 | 74,348 | 1,803,685 | |||||||||||||||
Shares redeemed | (4,418 | ) | (80,000 | ) | (5,655,693 | )(b) | (160,385,840 | )(b) | |||||||||||
Net Increase (Decrease) | 326,645 | $ | 6,185,689 | (2,537,429 | ) | $ | (68,576,155 | ) | |||||||||||
Class 3 Shares | |||||||||||||||||||
Shares sold | — | $ | — | 5,602,725 | (c) | $ | 160,385,840 | (c) | |||||||||||
Shares issued in reinvestment of dividends and distributions | 644,033 | 11,120,134 | 340,872 | 8,340,251 | |||||||||||||||
Shares redeemed | — | — | (196,231 | ) | (5,000,000 | ) | |||||||||||||
Net Increase (Decrease) | 644,033 | $ | 11,120,134 | 5,747,366 | $ | 163,726,091 | |||||||||||||
Class 4 Shares | |||||||||||||||||||
Shares sold | — | $ | — | — | $ | — | |||||||||||||
Shares issued in reinvestment of dividends and distributions | 545,447 | 9,560,421 | 289,039 | 7,173,573 | |||||||||||||||
Shares redeemed | — | — | — | — | |||||||||||||||
Net Increase (Decrease) | 545,447 | $ | 9,560,421 | 289,039 | $ | 7,173,573 | |||||||||||||
Class 5 Shares | |||||||||||||||||||
Shares sold | 272,126 | $ | 5,000,000 | 6,114,978 | $ | 166,800,000 | |||||||||||||
Shares issued in reinvestment of dividends and distributions | 3,341,711 | 59,441,029 | 1,979,376 | 49,817,720 | |||||||||||||||
Shares redeemed | (6,895,066 | )(d) | (144,626,367 | )(d) | (7,587,417 | ) | (227,640,000 | ) | |||||||||||
Net Increase (Decrease) | (3,281,229 | ) | $ | (80,185,338 | ) | 506,937 | $ | (11,022,280 | ) | ||||||||||
Class K Shares | |||||||||||||||||||
Shares sold | 33,644,739 | (e) | $ | 649,159,308 | (e) | 41,053,308 | (f) | $ | 1,143,888,868 | (f) | |||||||||
Shares issued in reinvestment of dividends and distributions | 4,836,714 | 82,369,239 | 2,584,310 | 62,411,077 | |||||||||||||||
Shares redeemed | (32,727,321 | ) | (613,627,474 | ) | (23,579,566 | )(g) | (635,251,719 | )(g) | |||||||||||
Net Increase (Decrease) | 5,754,132 | $ | 117,901,073 | 20,058,052 | $ | 571,048,226 | |||||||||||||
237
Notes to Financial Statements
Annual Report December 31, 2022
Baillie Gifford Emerging Markets Equities Fund | |||||||||||||||||||
| For the Year Ended December 31, 2022 | For the Year Ended December 31, 2021 | ||||||||||||||||||
Shares | Amount | Shares | Amount | ||||||||||||||||
Institutional Class Shares | |||||||||||||||||||
Shares sold | 26,815,013 | $ | 529,206,581 | 18,703,308 | (h) | $ | 524,250,455 | (h) | |||||||||||
Shares issued in reinvestment of dividends and distributions | 2,483,551 | 42,294,883 | 1,344,723 | 32,461,628 | |||||||||||||||
Shares redeemed | (29,357,992 | )(i) | (558,503,670 | )(i) | (15,312,378 | )(j) | (416,430,456 | )(j) | |||||||||||
Net Increase (Decrease) | (59,428 | ) | $ | 12,997,794 | 4,735,653 | $ | 140,281,627 | ||||||||||||
Total Net Increase (Decrease) | 3,929,600 | $ | 77,579,773 | 28,799,618 | $ | 802,631,082 | |||||||||||||
(a) 174,533 shares and $3,586,367 converted into Class 2 from Class 5.
(b) 5,655,693 shares and $160,385,840 converted from Class 2 into Class 3.
(c) 5,602,725 shares and $160,385,840 converted into Class 3 from Class 2.
(d) 168,163 shares and $3,586,367 converted from Class 5 into Class 2.
(e) 84,183 shares and $1,876,386 converted into Class K from Institutional Class
(f) 50,077 shares and $1,296,500 converted into Class K from Institutional Class.
(g) 41 shares and $1,064 converted from Class K into Institutional Class.
(h) 41 shares and $1,064 converted into Institutional Class from Class K.
(i) 84,183 shares and $1,876,386 converted from Institutional Class into Class K.
(j) 50,152 shares and $1,296,500 converted from Institutional Class into Class K.
Baillie Gifford Emerging Markets ex China Fund | |||||||||||||||||||
| For the Year Ended December 31, 2022 | For the Year Ended December 31, 2021 | ||||||||||||||||||
Shares | Amount | Shares | Amount | ||||||||||||||||
Class K Shares | |||||||||||||||||||
Shares sold | — | $ | — | 50,000 | $ | 500,000 | |||||||||||||
Shares issued in reinvestment of dividends and distributions | 2,504 | 17,855 | — | — | |||||||||||||||
Shares redeemed | — | — | — | — | |||||||||||||||
Net Increase (Decrease) | 2,504 | $ | 17,855 | 50,000 | $ | 500,000 | |||||||||||||
Institutional Class Shares | |||||||||||||||||||
Shares sold | — | $ | — | 50,000 | $ | 500,000 | |||||||||||||
Shares issued in reinvestment of dividends and distributions | 2,504 | 17,854 | — | — | |||||||||||||||
Shares redeemed | — | — | — | — | |||||||||||||||
Net Increase (Decrease) | 2,504 | $ | 17,854 | 50,000 | $ | 500,000 | |||||||||||||
Total Net Increase (Decrease) | 5,008 | $ | 35,709 | 100,000 | $ | 1,000,000 | |||||||||||||
238
Notes to Financial Statements
Annual Report December 31, 2022
Baillie Gifford Global Alpha Equities Fund | |||||||||||||||||||
| For the Year Ended December 31, 2022 | For the Year Ended December 31, 2021 | ||||||||||||||||||
Shares | Amount | Shares | Amount | ||||||||||||||||
Class 2 Shares | |||||||||||||||||||
Shares sold | 4,607,121 | (a) | $ | 73,247,462 | (a) | 7,480,245 | (b) | $ | 170,721,384 | (b) | |||||||||
Shares issued in reinvestment of dividends and distributions | 366,379 | 4,894,311 | 1,285,909 | 25,318,524 | |||||||||||||||
Shares redeemed | (2,124,537 | ) | (31,750,000 | ) | (11,097,275 | ) | (258,817,289 | ) | |||||||||||
Net Increase (Decrease) | 2,848,963 | $ | 46,391,773 | (2,331,121 | ) | $ | (62,777,381 | ) | |||||||||||
Class 3 Shares | |||||||||||||||||||
Shares sold | 9,107,174 | (c) | $ | 151,183,648 | (c) | — | $ | — | |||||||||||
Shares issued in reinvestment of dividends and distributions | 200,570 | 2,774,341 | 656,990 | 13,371,461 | |||||||||||||||
Shares redeemed | (7,281,855 | )(d) | (119,241,462 | )(d) | (8,658,562 | )(e) | (201,670,946 | )(e) | |||||||||||
Net Increase (Decrease) | 2,025,889 | $ | 34,716,527 | (8,001,572 | ) | $ | (188,299,485 | ) | |||||||||||
Class 4 Shares | |||||||||||||||||||
Shares sold | 11,504,588 | (f) | $ | 196,727,309 | (f) | 1,210,976 | $ | 30,000,000 | |||||||||||
Shares issued in reinvestment of dividends and distributions | 654,457 | 9,335,035 | 4,105,248 | 86,057,906 | |||||||||||||||
Shares redeemed | (20,344,448 | )(g) | (381,302,662 | )(g) | (4,090,097 | ) | (100,000,000 | ) | |||||||||||
Net Increase (Decrease) | (8,185,403 | ) | $ | (175,240,318 | ) | 1,226,127 | $ | 16,057,906 | |||||||||||
Class 5 Shares | |||||||||||||||||||
Shares sold | 10,892,744 | (h) | $ | 230,119,015 | (h) | — | $ | — | |||||||||||
Shares issued in reinvestment of dividends and distributions | — | — | — | — | |||||||||||||||
Shares redeemed | (10,892,744 | )(i) | (196,727,309 | )(i) | — | — | |||||||||||||
Net Increase (Decrease) | — | $ | 33,391,706 | — | $ | — | |||||||||||||
Class K Shares | |||||||||||||||||||
Shares sold | 7,303,892 | $ | 106,320,026 | (j) | 11,893,493 | $ | 271,493,367 | ||||||||||||
Shares issued in reinvestment of dividends and distributions | 855,016 | 11,363,164 | 3,574,655 | 70,027,474 | |||||||||||||||
Shares redeemed | (4,816,330 | ) | (70,373,062 | ) | (1,968,026 | ) | (45,018,740 | ) | |||||||||||
Net Increase (Decrease) | 3,342,578 | $ | 47,310,128 | 13,500,122 | $ | 296,502,101 | |||||||||||||
239
Notes to Financial Statements
Annual Report December 31, 2022
Baillie Gifford Global Alpha Equities Fund | |||||||||||||||||||
| For the Year Ended December 31, 2022 | For the Year Ended December 31, 2021 | ||||||||||||||||||
Shares | Amount | Shares | Amount | ||||||||||||||||
Institutional Class Shares | |||||||||||||||||||
Shares sold | 1,405,960 | $ | 21,599,894 | 1,201,553 | $ | 27,820,913 | |||||||||||||
Shares issued in reinvestment of dividends and distributions | 85,015 | 1,130,701 | 340,854 | 6,687,568 | |||||||||||||||
Shares redeemed | (1,252,083 | ) | (19,780,953 | ) | (253,620 | ) | (5,284,272 | ) | |||||||||||
Net Increase (Decrease) | 238,892 | $ | 2,949,642 | 1,288,787 | $ | 29,224,209 | |||||||||||||
Total Net Increase (Decrease) | 270,919 | $ | (10,480,542 | ) | 5,682,343 | $ | 90,707,350 | ||||||||||||
(a) 4,312,417 shares and $69,241,462 converted into Class 2 from Class 3.
(b) 4,429,348 shares and $100,167,937 converted into Class 2 from Class 3.
(c) 9,107,174 shares and $151,183,648 converted into Class 3 from Class 4.
(d) 4,171,047 shares and 69,241,462 converted from Class 3 into Class 2.
(e) 4,302,451 shares and $100,167,937 converted from Class 3 into Class 2.
(f) 11,504,588 shares and $196,727,309 converted into Class 4 from Class 5.
(g) 11,503,248 shares and $230,119,015 converted from Class 4 into Class 5. 8,841,200 shares and $151,183,648 converted from Class 4 into Class 3.
(h) 10,892,744 shares and $230,119,015 converted into Class 5 from Class 4.
(i) 10,892,744 shares and $196,727,309 converted from Class 5 into Class 4.
(j) This amount includes an in-kind transfer of $80,804,752.
Baillie Gifford Global Stewardship Equities Fund | |||||||||||||||||||
| For the Year Ended December 31, 2022 | For the Year Ended December 31, 2021 | ||||||||||||||||||
Shares | Amount | Shares | Amount | ||||||||||||||||
Class K Shares | |||||||||||||||||||
Shares sold | — | $ | — | — | $ | — | |||||||||||||
Shares issued in reinvestment of dividends and distributions | 6,989 | 74,363 | 15,323 | 275,056 | |||||||||||||||
Shares redeemed | — | — | — | — | |||||||||||||||
Net Increase (Decrease) | 6,989 | $ | 74,363 | 15,323 | $ | 275,056 | |||||||||||||
Institutional Class Shares | |||||||||||||||||||
Shares sold | — | $ | — | — | $ | — | |||||||||||||
Shares issued in reinvestment of dividends and distributions | 6,989 | 74,363 | 15,324 | 275,056 | |||||||||||||||
Shares redeemed | — | — | — | — | |||||||||||||||
Net Increase (Decrease) | 6,989 | $ | 74,363 | 15,324 | $ | 275,056 | |||||||||||||
Total Net Increase (Decrease) | 13,978 | $ | 148,726 | 30,647 | $ | 550,112 | |||||||||||||
240
Notes to Financial Statements
Annual Report December 31, 2022
Baillie Gifford Health Innovation Equities Fund | |||||||||||||||||||
| For the Year Ended December 31, 2022 | For the Period Ended December 31, 2021 | ||||||||||||||||||
Shares | Amount | Shares | Amount | ||||||||||||||||
Class K Shares | |||||||||||||||||||
Shares sold | — | $ | — | 500,000 | $ | 5,000,000 | |||||||||||||
Shares issued in reinvestment of dividends and distributions | 41 | 267 | — | — | |||||||||||||||
Shares redeemed | — | — | — | — | |||||||||||||||
Net Increase (Decrease) | 41 | $ | 267 | 500,000 | $ | 5,000,000 | |||||||||||||
Institutional Class Shares | |||||||||||||||||||
Shares sold | 2,117,775 | $ | 14,252,929 | 500,000 | $ | 5,000,000 | |||||||||||||
Shares issued in reinvestment of dividends and distributions | 198 | 1,295 | — | — | |||||||||||||||
Shares redeemed | (13,387 | ) | (90,471 | ) | — | — | |||||||||||||
Net Increase (Decrease) | 2,104,586 | $ | 14,163,753 | 500,000 | $ | 5,000,000 | |||||||||||||
Total Net Increase (Decrease) | 2,104,627 | $ | 14,164,020 | 1,000,000 | $ | 10,000,000 | |||||||||||||
Baillie Gifford International Alpha Fund | |||||||||||||||||||
| For the Year Ended December 31, 2022 | For the Year Ended December 31, 2021 | ||||||||||||||||||
Shares | Amount | Shares | Amount | ||||||||||||||||
Class 2 Shares | |||||||||||||||||||
Shares sold | 14,636,098 | (a) | $ | 182,272,469 | (a) | 1,286,623 | $ | 21,780,009 | |||||||||||
Shares issued in reinvestment of dividends and distributions | 526,774 | 5,649,860 | 1,614,613 | 24,786,899 | |||||||||||||||
Shares redeemed | (6,843,280 | ) | (81,665,960 | ) | (3,139,152 | )(b) | (54,578,192 | )(b) | |||||||||||
Net Increase (Decrease) | 8,319,592 | $ | 106,256,369 | (237,916 | ) | $ | (8,011,284 | ) | |||||||||||
Class 3 Shares | |||||||||||||||||||
Shares sold | 17,301,906 | (c) | $ | 215,842,807 | (c) | 9,378,598 | (d) | $ | 167,796,050 | (d) | |||||||||
Shares issued in reinvestment of dividends and distributions | 631,754 | 6,886,811 | 2,476,668 | 38,629,582 | |||||||||||||||
Shares redeemed | (16,098,948 | )(e) | (202,418,469 | )(e) | (22,853,592 | )(f) | (404,578,419 | )(f) | |||||||||||
Net Increase (Decrease) | 1,834,712 | $ | 20,311,149 | (10,998,326 | ) | $ | (198,152,787 | ) | |||||||||||
Class 4 Shares | |||||||||||||||||||
Shares sold | 161,654 | $ | 2,420,000 | 12,884,594 | (g) | $ | 233,443,729 | (g) | |||||||||||
Shares issued in reinvestment of dividends and distributions | 812,759 | 9,027,072 | 4,178,776 | 66,380,677 | |||||||||||||||
Shares redeemed | (12,448,965 | )(h) | (161,424,480 | )(h) | (22,393,336 | )(i) | (402,768,420 | )(i) | |||||||||||
Net Increase (Decrease) | (11,474,552 | ) | $ | (149,977,408 | ) | (5,329,966 | ) | $ | (102,944,014 | ) | |||||||||
241
Notes to Financial Statements
Annual Report December 31, 2022
Baillie Gifford International Alpha Fund | |||||||||||||||||||
| For the Year Ended December 31, 2022 | For the Year Ended December 31, 2021 | ||||||||||||||||||
Shares | Amount | Shares | Amount | ||||||||||||||||
Class 5 Shares | |||||||||||||||||||
Shares sold | 802,568 | $ | 9,380,896 | — | $ | — | |||||||||||||
Shares issued in reinvestment of dividends and distributions | 80,379 | 911,339 | 557,199 | 9,031,928 | |||||||||||||||
Shares redeemed | (4,096,653 | ) | (48,114,155 | ) | (1,333,617 | ) | (24,534,404 | ) | |||||||||||
Net Increase (Decrease) | (3,213,706 | ) | $ | (37,821,920 | ) | (776,418 | ) | $ | (15,502,476 | ) | |||||||||
Class K Shares | |||||||||||||||||||
Shares sold | 12,791,395 | (j) | $ | 138,561,731 | (j) | 14,849,984 | $ | 251,570,911 | |||||||||||
Shares issued in reinvestment of dividends and distributions | 1,028,997 | 10,989,690 | 5,425,688 | 82,904,506 | |||||||||||||||
Shares redeemed | (28,387,144 | )(k) | (320,802,089 | )(k) | (5,504,581 | ) | (94,925,921 | ) | |||||||||||
Net Increase (Decrease) | (14,566,752 | ) | $ | (171,250,668 | ) | 14,771,091 | $ | 239,549,496 | |||||||||||
Institutional Class Shares | |||||||||||||||||||
Shares sold | 12,616,613 | (l) | $ | 158,244,408 | (l) | 15,712,386 | $ | 272,576,224 | |||||||||||
Shares issued in reinvestment of dividends and distributions | 134,802 | 1,453,166 | 3,372,421 | 51,732,944 | |||||||||||||||
Shares redeemed | (49,358,422 | )(m) | (584,695,815 | )(m) | (13,401,497 | ) | (228,187,591 | ) | |||||||||||
Net Increase (Decrease) | (36,607,007 | ) | $ | (424,998,241 | ) | 5,683,310 | $ | 96,121,577 | |||||||||||
Total Net Increase (Decrease) | (55,707,713 | ) | $ | (657,480,719 | ) | 3,111,775 | $ | 11,060,512 | |||||||||||
(a) 13,766,810 shares and $172,466,469 converted into Class 2 from Class 3.
(b) 1,286,279 shares and $22,778,192 converted from Class 2 into Class 3.
(c) 12,679,738 shares and $161,424,480 converted into Class 3 from Class 4.
(d) 1,267,060 shares and $22,778,192 converted into Class 3 from Class 2. 7,679,274 shares and $137,460,543 converted into Class 3 from Class 4.
(e) 13,547,076 shares and $172,466,469 converted from Class 3 into Class 2.
(f) 12,342,734 shares and $220,102,199 converted from Class 3 into Class 4.
(g) 12,132,971 shares and $220,102,199 converted into Class 4 from Class 3.
(h) 12,448,965 shares and $161,424,480 converted from Class 4 into Class 3.
(i) 7,548,837 shares and $137,460,543 converted from Class 4 into Class 3.
(j) 1,915 shares and $21,719 converted into Class K from Institutional Class.
(k) 6,147 shares and $83,656 converted from Class K into Institutional Class.
(l) 6,124 shares and $83,656 converted into Institutional Class from Class K.
(m) 1,910 shares and $21,719 converted from Institutional Class into Class K.
Baillie Gifford International Concentrated Growth Equities Fund | |||||||||||||||||||
| For the Year Ended December 31, 2022 | For the Year Ended December 31, 2021 | ||||||||||||||||||
Shares | Amount | Shares | Amount | ||||||||||||||||
Class K Shares | |||||||||||||||||||
Shares sold | 3,297,607 | $ | 21,349,940 | 2,492,265 | $ | 32,264,192 | |||||||||||||
Shares issued in reinvestment of dividends and distributions | 319,004 | 1,767,282 | 1,163,157 | 11,398,944 | |||||||||||||||
Shares redeemed | (4,023,433 | ) | (24,487,536 | ) | (1,384,438 | ) | (16,619,698 | ) | |||||||||||
Net Increase (Decrease) | (406,822 | ) | $ | (1,370,314 | ) | 2,270,984 | $ | 27,043,438 | |||||||||||
242
Notes to Financial Statements
Annual Report December 31, 2022
Baillie Gifford International Concentrated Growth Equities Fund | |||||||||||||||||||
| For the Year Ended December 31, 2022 | For the Year Ended December 31, 2021 | ||||||||||||||||||
Shares | Amount | Shares | Amount | ||||||||||||||||
Institutional Class Shares | |||||||||||||||||||
Shares sold | 8,490,864 | $ | 66,139,903 | 7,992,818 | $ | 103,591,639 | |||||||||||||
Shares issued in reinvestment of dividends and distributions | 409,509 | 2,240,014 | 1,192,576 | 11,556,064 | |||||||||||||||
Shares redeemed | (7,983,474 | ) | (54,919,668 | ) | (4,805,157 | ) | (57,388,368 | ) | |||||||||||
Net Increase (Decrease) | 916,899 | $ | 13,460,249 | 4,380,237 | $ | 57,759,335 | |||||||||||||
Total Net Increase (Decrease) | 510,077 | $ | 12,089,935 | 6,651,221 | $ | 84,802,773 | |||||||||||||
Baillie Gifford International Growth Fund | |||||||||||||||||||
| For the Year Ended December 31, 2022 | For the Year Ended December 31, 2021 | ||||||||||||||||||
Shares | Amount | Shares | Amount | ||||||||||||||||
Class 2 Shares | |||||||||||||||||||
Shares sold | 27,299,774 | (a) | $ | 342,081,605 | (a) | 4,324,682 | (b) | $ | 94,862,331 | (b) | |||||||||
Shares issued in reinvestment of dividends and distributions | 342,206 | 3,691,376 | 3,767,026 | 62,797,066 | |||||||||||||||
Shares redeemed | (105,915 | ) | (1,550,000 | ) | (8,806,245 | )(c) | (195,081,174 | )(c) | |||||||||||
Net Increase (Decrease) | 27,536,065 | $ | 344,222,981 | (714,537 | ) | $ | (37,421,777 | ) | |||||||||||
Class 3 Shares | |||||||||||||||||||
Shares sold | 12,234,680 | (d) | $ | 151,313,900 | (d) | 7,058,372 | (e) | $ | 152,146,174 | (e) | |||||||||
Shares issued in reinvestment of dividends and distributions | 134,639 | 1,456,319 | 4,132,837 | 69,053,504 | |||||||||||||||
Shares redeemed | (21,739,338 | )(f) | (272,875,605 | )(f) | (13,350,707 | )(g) | (299,199,945 | )(g) | |||||||||||
Net Increase (Decrease) | (9,370,019 | ) | $ | (120,105,386 | ) | (2,159,498 | ) | $ | (78,000,267 | ) | |||||||||
Class 4 Shares | |||||||||||||||||||
Shares sold | 4,340,428 | $ | 50,000,000 | 1,662,426 | $ | 32,700,771 | |||||||||||||
Shares issued in reinvestment of dividends and distributions | 312,522 | 3,381,707 | 7,206,366 | 120,474,576 | |||||||||||||||
Shares redeemed | (10,994,906 | )(h) | (134,613,900 | )(h) | (2,606,084 | ) | (53,552,555 | ) | |||||||||||
Net Increase (Decrease) | (6,341,956 | ) | $ | (81,232,193 | ) | 6,262,708 | $ | 99,622,792 | |||||||||||
Class 5 Shares | |||||||||||||||||||
Shares sold | — | $ | — | 94,102 | $ | 2,000,000 | |||||||||||||
Shares issued in reinvestment of dividends and distributions | 700,721 | 7,602,619 | 13,064,393 | 219,002,340 | |||||||||||||||
Shares redeemed | — | — | (5,616,791 | ) | (125,000,000 | ) | |||||||||||||
Net Increase (Decrease) | 700,721 | $ | 7,602,619 | 7,541,704 | $ | 96,002,340 | |||||||||||||
Class K Shares | |||||||||||||||||||
Shares sold | 806,923 | $ | 10,780,634 | 613,671 | $ | 12,785,685 | |||||||||||||
Shares issued in reinvestment of dividends and distributions | 31,197 | 335,676 | 542,605 | 9,023,516 | |||||||||||||||
Shares redeemed | (555,229 | ) | (7,662,243 | ) | (2,272,662 | ) | (45,641,020 | ) | |||||||||||
Net Increase (Decrease) | 282,891 | $ | 3,454,067 | (1,116,386 | ) | $ | (23,831,819 | ) | |||||||||||
243
Notes to Financial Statements
Annual Report December 31, 2022
Baillie Gifford International Growth Fund | |||||||||||||||||||
| For the Year Ended December 31, 2022 | For the Year Ended December 31, 2021 | ||||||||||||||||||
Shares | Amount | Shares | Amount | ||||||||||||||||
Institutional Class Shares | |||||||||||||||||||
Shares sold | 18,989,593 | $ | 226,507,373 | 10,979,214 | $ | 237,406,612 | |||||||||||||
Shares issued in reinvestment of dividends and distributions | 85,623 | 918,730 | 2,791,793 | 46,287,943 | |||||||||||||||
Shares redeemed | (20,285,609 | ) | (239,977,847 | ) | (8,869,161 | ) | (175,527,255 | ) | |||||||||||
Net Increase (Decrease) | (1,210,393 | ) | $ | (12,551,744 | ) | 4,901,846 | $ | 108,167,300 | |||||||||||
Total Net Increase (Decrease) | 11,597,309 | $ | 141,390,344 | 14,715,837 | $ | 164,538,569 | |||||||||||||
(a) 20,387,845 shares and $255,875,605 converted into Class 2 from Class 3.
(b) 4,195,924 shares and $91,856,330 converted into Class 2 from Class 3.
(c) 5,171,930 shares and $114,721,174 converted from Class 2 into Class 3.
(d) 8,871,130 shares and $111,613,900 converted into Class 3 from Class 4.
(e) 5,155,544 shares and $114,721,174 converted into Class 3 from Class 2
(f) 20,337,125 shares and $255,875,605 converted from Class 3 into Class 2.
(g) 4,181,922 shares and $91,856,330 converted from Class 3 into Class 2.
(h) 8,865,493 shares and $111,613,900 converted from Class 4 into Class 3.
Baillie Gifford International Smaller Companies Fund | |||||||||||||||||||
| For the Year Ended December 31, 2022 | For the Year Ended December 31, 2021 | ||||||||||||||||||
Shares | Amount | Shares | Amount | ||||||||||||||||
Class K Shares | |||||||||||||||||||
Shares sold | 115,612 | $ | 1,526,400 | 2,175,577 | $ | 40,085,550 | |||||||||||||
Shares issued in reinvestment of dividends and distributions | 3,223 | 35,491 | 8,974 | 166,380 | |||||||||||||||
Shares redeemed | (322,332 | ) | (4,101,595 | ) | — | — | |||||||||||||
Net Increase (Decrease) | (203,497 | ) | $ | (2,539,704 | ) | 2,184,551 | $ | 40,251,930 | |||||||||||
Institutional Class Shares | |||||||||||||||||||
Shares sold | 1,240,005 | $ | 14,373,256 | 774,881 | $ | 14,302,761 | |||||||||||||
Shares issued in reinvestment of dividends and distributions | 1,308 | 14,391 | 3,272 | 60,637 | |||||||||||||||
Shares redeemed | (951,432 | ) | (10,217,456 | ) | (2,913 | ) | (53,975 | ) | |||||||||||
Net Increase (Decrease) | 289,881 | $ | 4,170,191 | 775,240 | $ | 14,309,423 | |||||||||||||
Total Net Increase (Decrease) | 86,384 | $ | 1,630,487 | 2,959,791 | $ | 54,561,353 | |||||||||||||
244
Notes to Financial Statements
Annual Report December 31, 2022
Baillie Gifford Long Term Global Growth Fund | |||||||||||||||||||
| For the Year Ended December 31, 2022 | For the Year Ended December 31, 2021 | ||||||||||||||||||
Shares | Amount | Shares | Amount | ||||||||||||||||
Class 2 Shares | |||||||||||||||||||
Shares sold | 248 | $ | 6,000 | 816 | $ | 32,500 | |||||||||||||
Shares issued in reinvestment of dividends and distributions | 117,877 | 2,238,949 | 159,599 | 5,937,177 | |||||||||||||||
Shares redeemed | (238,116 | ) | (7,000,000 | ) | (349,440 | ) | (14,000,000 | ) | |||||||||||
Net Increase (Decrease) | (119,991 | ) | $ | (4,755,051 | ) | (189,025 | ) | $ | (8,030,323 | ) | |||||||||
Class 4 Shares | |||||||||||||||||||
Shares sold | 1,716,411 | (a) | $ | 53,862,692 | (a) | — | $ | — | |||||||||||
Shares issued in reinvestment of dividends and distributions | 58,102 | 1,281,675 | — | — | |||||||||||||||
Shares redeemed | — | — | — | — | |||||||||||||||
Net Increase (Decrease) | 1,774,513 | $ | 55,144,367 | — | $ | — | |||||||||||||
Class 5 Shares | |||||||||||||||||||
Shares sold | — | $ | — | — | $ | — | |||||||||||||
Shares issued in reinvestment of dividends and distributions | — | — | 79,486 | 3,833,233 | |||||||||||||||
Shares redeemed | (2,065,875 | )(b) | (74,362,692 | )(b) | (211,915 | ) | (11,000,000 | ) | |||||||||||
Net Increase (Decrease) | (2,065,875 | ) | $ | (74,362,692 | ) | (132,429 | ) | $ | (7,166,767 | ) | |||||||||
Class K Shares | |||||||||||||||||||
Shares sold | 1,960,500 | $ | 48,885,953 | 5,982,410 | (c) | $ | 252,634,576 | (c) | |||||||||||
Shares issued in reinvestment of dividends and distributions | 435,668 | 8,277,694 | 568,116 | 21,145,301 | |||||||||||||||
Shares redeemed | (1,572,029 | ) | (36,691,886 | ) | (750,143 | ) | (31,354,012 | ) | |||||||||||
Net Increase (Decrease) | 824,139 | $ | 20,471,761 | 5,800,383 | $ | 242,425,865 | |||||||||||||
Institutional Class Shares | |||||||||||||||||||
Shares sold | 8,690,764 | $ | 222,264,057 | 7,080,296 | $ | 290,000,498 | |||||||||||||
Shares issued in reinvestment of dividends and distributions | 346,795 | 6,561,366 | 708,875 | 26,299,259 | |||||||||||||||
Shares redeemed | (14,009,874 | ) | (340,255,603 | ) | (2,869,323 | )(d) | (114,269,725 | )(d) | |||||||||||
Net Increase (Decrease) | (4,972,315 | ) | $ | (111,430,180 | ) | 4,919,848 | $ | 202,030,032 | |||||||||||
Total Net Increase (Decrease) | (4,559,529 | ) | $ | (114,931,795 | ) | 10,398,777 | $ | 429,258,807 | |||||||||||
(a) 1,716,411 shares and $53,862,692 converted into Class 4 from Class 5.
(b) 1,527,868 shares and $53,862,692 converted from Class 5 into Class 4.
(c) 11,840 shares and $448,599 converted into Class K from Institutional Class.
(d) 11,871 shares and $448,599 converted into from Institutional Class into Class K.
245
Notes to Financial Statements
Annual Report December 31, 2022
Baillie Gifford U.S. Discovery Fund | |||||||||||||||||||
| For the Year Ended December 31, 2022 | For the Period Ended December 31, 2021 | ||||||||||||||||||
Shares | Amount | Shares | Amount | ||||||||||||||||
Class K Shares | |||||||||||||||||||
Shares sold | 745,444 | $ | 4,455,000 | 126,581 | $ | 1,275,000 | |||||||||||||
Shares issued in reinvestment of dividends and distributions | — | — | 274 | 2,362 | |||||||||||||||
Shares redeemed | (317,164 | ) | (1,642,910 | ) | — | — | |||||||||||||
Net Increase (Decrease) | 428,280 | $ | 2,812,090 | 126,855 | $ | 1,277,362 | |||||||||||||
Institutional Class Shares | |||||||||||||||||||
Shares sold | — | $ | — | 50,000 | $ | 500,000 | |||||||||||||
Shares issued in reinvestment of dividends and distributions | — | — | 109 | 933 | |||||||||||||||
Shares redeemed | — | — | — | — | |||||||||||||||
Net Increase (Decrease) | — | $ | — | 50,109 | $ | 500,933 | |||||||||||||
Total Net Increase (Decrease) | 428,280 | $ | 2,812,090 | 176,964 | $ | 1,778,295 | |||||||||||||
Baillie Gifford U.S. Equity Growth Fund | |||||||||||||||||||
| For the Year Ended December 31, 2022 | For the Year Ended December 31, 2021 | ||||||||||||||||||
Shares | Amount | Shares | Amount | ||||||||||||||||
Class K Shares | |||||||||||||||||||
Shares sold | 37,695 | $ | 738,649 | 535,696 | $ | 21,778,411 | |||||||||||||
Shares issued in reinvestment of dividends and distributions | 107,344 | 1,438,401 | 100,801 | 3,493,770 | |||||||||||||||
Shares redeemed | (95,410 | ) | (1,849,937 | ) | (977,315 | ) | (41,666,785 | ) | |||||||||||
Net Increase (Decrease) | 49,629 | $ | 327,113 | (340,818 | ) | $ | (16,394,604 | ) | |||||||||||
Institutional Class Shares | |||||||||||||||||||
Shares sold | 440,682 | $ | 8,520,193 | 2,467,221 | $ | 106,488,365 | |||||||||||||
Shares issued in reinvestment of dividends and distributions | 127,618 | 1,702,423 | 160,787 | 5,556,812 | |||||||||||||||
Shares redeemed | (924,299 | ) | (19,967,202 | ) | (1,999,426 | ) | (80,445,589 | ) | |||||||||||
Net Increase (Decrease) | (355,999 | ) | $ | (9,744,586 | ) | 628,582 | $ | 31,599,588 | |||||||||||
Total Net Increase (Decrease) | (306,370 | ) | $ | (9,417,473 | ) | 287,764 | $ | 15,204,984 | |||||||||||
246
Notes to Financial Statements
Annual Report December 31, 2022
Note E — Beneficial Ownership
Beneficial ownership, either direct or indirect, of more than 25% of the voting securities of a Fund creates a presumption of control under Section 2(a)(9) of the 1940 Act. As of December 31, 2022, the following Funds had one or more shareholders which beneficially owned 25% or more of the Fund's voting securities:
Fund | |||
Baillie Gifford China A Shares Growth Fund | |||
| Baillie Gifford China Equities Fund* | |||
Baillie Gifford EAFE Plus All Cap Fund | |||
Baillie Gifford Emerging Markets ex China Fund | |||
Baillie Gifford Global Stewardship Equities Fund | |||
| Baillie Gifford Health Innovation Equities Fund* | |||
Baillie Gifford International Concentrated Growth Equities Fund | |||
Baillie Gifford International Growth Fund | |||
| Baillie Gifford International Smaller Companies Fund* | |||
Baillie Gifford U.S. Discovery Fund | |||
* The Fund has two shareholders which each beneficially own 25% or more of the Fund's voting securities.
Purchase and redemption activity of these accounts may have a significant effect on the operation of each Fund.
At December 31, 2022, Baillie Gifford International LLC, a wholly owned subsidiary of the Manager, owned 100% of Baillie Gifford China A Shares Growth Fund, Baillie Gifford Emerging Markets ex China Fund and Baillie Gifford Global Stewardship Equities Fund and as a result may be deemed to control such Funds.
Note F — Commitments and Contingencies
Each of the Funds indemnifies the Trust's officers and each member of the Board for certain liabilities that might arise from the performance of their duties to the Fund. Additionally, in the normal course of business, each Fund enters into contracts that contain a variety of representations and warranties and which provide general indemnifications.
The Funds' maximum exposure under these arrangements is unknown, as this would involve future claims that may be made against the Funds that have not yet occurred. However, based on experience, the Funds expect the risk of loss to be remote.
Note G — Line of Credit
The Trust entered into a committed facility with Bank of New York Mellon on May 1, 2017, renewed April 19, 2022, and expiring April 18, 2023 (unless renewed), which allows certain series of the Trust to borrow up to $75 million in
total subject to minimum asset coverage requirements set out in the Credit Agreement. Each such series may borrow money under this credit facility for the temporary funding of shareholder redemptions or for other temporary or emergency purposes.
In normal market conditions, borrowings are charged an interest rate of 1.25% per annum plus the greater of the Federal Funds Effective Rate or the Secured Overnight Financing Rate + 0.10%. Prior to April 19, 2022, the rate used was the greater of the Federal Funds Effective Rate or the one-month U.S. LIBOR Rate.
The Funds pay a share of a commitment fee on the portion of the facility which is undrawn. The commitment fee is 0.25% on undrawn amounts.
The rate payable at December 31, 2022 was 5.65% on any amounts drawn down.
247
Notes to Financial Statements
Annual Report December 31, 2022
The following borrowings were made against the credit facility during the period:
Fund | Date of Borrowing | Full Repayment Date | Maximum Amount Borrowed | Average Amount Borrowed(1) | Average Interest Rate | ||||||||||||||||||
Baillie Gifford China Equities Fund | 11/21/22 | 11/25/22 | $ | 300,000 | $ | 300,000 | 5.15% | ||||||||||||||||
| Baillie Gifford Developed EAFE All Cap Fund | 9/1/22 12/1/22 12/16/22 | 9/6/22 12/6/22 12/19/22 | 11,500,000 8,500,000 500,000 | 5,238,462 | 3.64% 5.16% 5.67% | ||||||||||||||||||
Baillie Gifford Emerging Market Equities Fund | 11/25/22 | 11/28/22 | 2,200,000 | 2,200,000 | 5.14% | ||||||||||||||||||
| Baillie Gifford Global Alpha Equities Fund | 4/29/22 5/5/22 6/1/22 | 5/3/22 5/9/22 6/2/22 | 10,600,000 5,650,000 2,850,000 | 7,383,333 | 1.64% 2.14% 2.14% | ||||||||||||||||||
| Baillie Gifford International Alpha Fund | 2/1/22 3/25/22 6/17/22 6/22/22 7/29/22 8/9/22 11/15/22 | 2/2/22 3/29/22 6/21/22 6/23/22 8/3/22 8/12/22 11/17/22 | 4,950,000 44,350,000 3,900,000 700,000 36,450,000 29,800,000 10,950,000 | 17,078,571 | 1.36% 1.70% 2.83% 2.83% 3.63% 3.63% 5.15% | ||||||||||||||||||
| Baillie Gifford International Concentrated Growth Equities Fund | 1/1/22 2/22/22 3/4/22 4/29/22 6/27/22 7/8/22 7/13/22 10/11/22 12/29/22 | 1/4/22 2/24/22 3/8/22 5/2/22 7/7/22 7/11/22 7/15/22 10/13/22 12/31/22 | 4,900,000 8,050,000 12,650,000 750,000 2,100,000 250,000 250,000 1,200,000 1,500,000(2) | 2,625,000 | 1.35% 1.42% 1.55% 1.63% 2.86% 2.89% 2.88% 4.40% 5.65% | ||||||||||||||||||
| Baillie Gifford International Smaller Companies Fund | 3/30/22 6/1/22 7/14/22 7/26/22 11/2/22 | 4/1/22 6/7/22 7/20/22 7/28/22 11/14/22 | 900,000 1,400,000 4,750,000 450,000 2,250,000 | 1,437,500 | 1.70% 2.14% 2.88% 2.88% 5.08% | ||||||||||||||||||
| Baillie Gifford Long Term Global Growth Fund | 1/7/22 1/25/22 5/10/22 6/13/22 10/25/22 | 1/10/22 1/27/22 5/13/22 6/14/22 10/31/22 | 2,300,000 12,900,000 26,050,000 850,000 2,850,000 | 5,580,000 | 1.35% 1.36% 2.13% 2.09% 4.37% | ||||||||||||||||||
| Baillie Gifford U.S. Equity Growth Fund | 1/6/22 1/20/22 1/25/22 1/31/22 3/25/22 4/5/22 5/17/22 6/6/22 6/17/22 8/5/22 | 1/10/22 1/24/22 1/27/22 2/2/22 3/28/22 4/7/22 5/18/22 6/8/22 6/22/22 8/12/22 | 1,350,000 800,000 800,000 250,000 250,000 250,000 250,000 300,000 550,000 250,000 | 476,563 | 1.35% 1.36% 1.36% 1.36% 1.70% 1.70% 2.15% 2.13% 2.83% 3.63% | ||||||||||||||||||
(1) Average amount borrowed is calculated using days with outstanding borrowings.
(2) At December 31, 2022, the Fund had an outstanding loan balance of $1,500,000.
248
Notes to Financial Statements
Annual Report December 31, 2022
Note H — Principal Risks (unaudited)
The below is a selection of the Funds' principal risks. The Funds' full list of principal risks, including more commonly known risks, are further described within their respective prospectuses.
Investment Style Risk
The Manager actively makes investment decisions for the Funds through bottom-up stock selection. Accordingly, the Funds will have risk characteristics that differ from their benchmark indices. The Manager's judgments about the attractiveness, relative value, or potential appreciation of a particular stock may prove to be incorrect and cause a Fund to lose money or underperform compared to its benchmark index. There can be no assurance that the Manager's investment decisions will produce the desired results.
Growth Stock Risk
The prices of growth stocks may be based largely on expectations of future earnings, and their prices can decline rapidly and significantly in reaction to negative news. Growth stocks may underperform stocks in other broad style categories (and the stock market as a whole) over any period of time and may shift in and out of favor with investors generally, sometimes rapidly, depending on changes in market, economic, and other factors.
Long-Term Investment Strategy Risk
The Funds pursue a long-term investment approach, typically seeking returns over a period of several years. This investment style may cause a Fund to lose money or underperform compared to its benchmark index or other mutual funds over extended periods of time, and a Fund may not perform as expected in the long term. An investment in a Fund may be more suitable for long-term investors who can bear the risk of short- or medium-term fluctuations in the value of the Fund's portfolio.
Emerging Markets Risk
To the extent the Funds invest in emerging market securities, the Funds may be exposed to greater market, credit, currency, liquidity, legal, political, technical and other risks different from, or greater than the risks of investing in developed markets.
Geographic Focus Risk
Certain Funds expect to focus investments in a limited number of countries or geographic regions, and as a result may not offer the same level of diversification of risks as a more broadly global fund because these Funds will be exposed to a smaller geographic area. The performance of a fund that is less diversified across countries or geographic regions will be closely tied to market, currency, economic, political, environmental, or regulatory conditions and developments in the countries or regions in which the fund invests, and may be more volatile than the performance of a more geographically-diversified portfolio.
Non-Diversification Risk
A non-diversified fund may hold a smaller number of portfolio securities, with larger positions in each security it holds, than many other mutual funds. To the extent a Fund invests in a relatively small number of issuers, a decline in the market value of a particular security held by the Fund may affect its value more than if it invested in a larger number of issuers. The value of the Fund's shares may be more volatile than the values of shares of more diversified funds. Baillie Gifford China A Shares Growth Fund, Baillie Gifford China Equities Fund, Baillie Gifford Emerging Markets ex China Fund, Baillie Gifford International Concentrated Growth Equities Fund, Baillie Gifford Health Innovation Equities Fund, Baillie Gifford Long Term Global Growth Fund, Baillie Gifford U.S. Discovery Fund and Baillie Gifford U.S. Equity Growth Fund are all non-diversified Funds.
249
Notes to Financial Statements
Annual Report December 31, 2022
Market Disruption and Geopolitical Risk
Geopolitical, environmental and other events may disrupt securities markets and adversely affect global economies and markets. These disruptions could prevent the Funds from implementing their investment strategies and achieving their investment objectives, and increase the Funds' exposure to the other risks detailed in this Prospectus. Given the increasing interdependence among global economies and markets, conditions in one country, market, or region might adversely affect markets, issuers, and/or foreign exchange rates in other countries, including the U.S.
War, terrorism, public health crises, and other geopolitical events, such as sanctions, tariffs, trade disputes, the imposition of exchange controls or other cross-border trade barriers, have led, and in the future may lead, to increased short-term market volatility and may have adverse long-term effects on U.S. and world economies and markets generally. For instance, the 2022 Russian invasion of Ukraine and the sanctions that followed had immediate negative effects on global financial markets, sovereign debt and the markets for certain securities and commodities, such as oil and natural gas, and reduced the liquidity and value of Russian securities to zero or near zero. Similarly, terrorism in the U.S. and around the world has resulted in increased geopolitical risk.
Natural and environmental disasters, such as earthquakes and tsunamis, can be highly disruptive to economies and markets, adversely impacting individual companies and industries, securities markets, interest rates, credit ratings, inflation, investor sentiment, and other factors affecting the value of the Funds' investments. Similarly, dramatic disruptions can be caused by communicable diseases, epidemics, pandemics, plagues and other public health crises.
An outbreak of a respiratory disease caused by COVID-19, first detected in China in December 2019, has resulted in a global pandemic and major disruptions to economies and markets around the world, including the United States. Financial markets experienced and may continue to experience extreme volatility and severe losses, and trading in many instruments was and may continue to be disrupted as a result.
For further information on the risks of investing in each Fund, please refer to each Fund's prospectus.
Note I — Legal Notice (unaudited)
MSCI
The MSCI information may only be used for your internal use, may not be reproduced or re-disseminated in any form and may not be used as a basis for or a component of any financial instruments or products or indices. None of the MSCI information is intended to constitute investment advice or a recommendation to make (or refrain from making) any kind of investment decision and may not be relied on as such. Historical data and analysis should not be taken as an indication or guarantee of any future performance analysis, forecast or prediction. The MSCI information is provided on an "as is" basis and the user of this information assumes the entire risk of any use made of this information. MSCI, each of its affiliates and each other person involved in or related to compiling, computing or creating any MSCI information (collectively, the "MSCI Parties") expressly disclaims all warranties (including, without limitation, any warranties of originality, accuracy, completeness, timeliness, non-infringement, merchantability and fitness for a particular purpose) with respect to this information.
Without limiting any of the foregoing, in no event shall any MSCI Party have any liability for any direct, indirect, special, incidental, punitive, consequential (including, without limitation, lost profits) or any other damages. (www.msci.com)
FTSE Russell (U.S. Discovery & U.S. Equity Growth)
FTSE Russell is a trading name of certain of the LSE Group companies. Russell® is a trade mark of the relevant LSE Group companies and is used by any other LSE Group company under license. "TMX®" is a trade mark of TSX, Inc. and used by the LSE Group under license. All rights in the FTSE Russell indexes or data vest in the relevant LSE Group company which owns the index or the data. Neither LSE Group nor its licensors accept any liability for any errors or omissions in the indexes or data and no party may rely on any indexes or data contained in this communication. No further distribution of data from the LSE Group is permitted without the relevant LSE Group company's express written consent. The LSE Group does not promote, sponsor or endorse the content of this communication.
250
Notes to Financial Statements
Annual Report December 31, 2022
S&P (U.S. Equity Growth)
The S&P 500 and S&P Global Small Cap ("Index") is a product of S&P Dow Jones Indices LLC, a division of S&P Global, or its affiliates ("SPDJI"). Standard & Poor's® and S&P® are registered trademarks of Standard & Poor's Financial Services LLC, a division of S&P Global ("S&P"); Dow Jones® is a registered trademark of Dow Jones Trademark Holdings LLC ("Dow Jones"). Neither S&P Dow Jones Indices LLC, Dow Jones Trademark Holdings LLC, their affiliates nor their third party licensors make any representation or warranty, express or implied, as to the ability of any index to accurately represent the asset class or market sector that it purports to represent and neither S&P Dow Jones Indices LLC, Dow Jones Trademark Holdings LLC, their affiliates nor their third party licensors shall have any liability for any errors, omissions, or interruptions of any index or the data included therein.
Note J — Liquidity Risk Management Program (unaudited)
In accordance with Rule 22e-4 (the "Liquidity Rule") under the 1940 Act, the Funds have adopted and implemented a liquidity risk management program (the "Program"). The purpose of the Program is to outline the techniques, tools and arrangements employed for the management of liquidity risk within the Funds, and the terms, contents and frequency of reporting and escalation of any issues to the Board. Liquidity is managed taking into account of the investment strategy, liquidity profile, and redemption policy and history of each Fund, with the objective of maintaining a level of liquidity that is appropriate in light of each Fund's obligations to its shareholders. The Program assesses liquidity risk under both normal and stressed market conditions.
During the reporting period, the Funds maintained a high level of liquidity and, other than the Baillie Gifford International Smaller Companies Fund, primarily held assets that are defined under the Liquidity Rule as "Highly Liquid Investments". A Highly Liquid Investment is defined as cash and any investment reasonably expected to be convertible to cash in current market conditions in three business days or less without the conversion to cash significantly changing the market value of the investment. As a result of the high level of liquidity maintained by the Funds, none of the Funds, other than Baillie Gifford International Smaller Companies Fund, have adopted a
Highly Liquid Investment minimum. Baillie Gifford International Smaller Companies Fund has adopted a Highly Liquid Investment Minimum of 30% and complied with the Highly Liquid Investment minimum throughout the period.
During the reporting period, there were no liquidity events that materially affected the performance of the Funds or their ability to timely meet redemptions without dilution to existing shareholders. The Manager, which has been designated by the Board to administer the Program, determined that, during the reporting period, the Program operated adequately and effectively to manage the Funds' liquidity risk. There can be no assurance that the Program will achieve its objectives in the future. Further information on liquidity risks applicable to the Funds can be found in the Funds' prospectuses.
Note K — Subsequent Events
Events or transactions that occur after the financial statement date but before the financial statements are issued are categorized as recognized or non-recognized for financial statement purposes.
There were no subsequent events identified between December 31, 2022 and the issuance of the Financial Statements.
251
Report of Independent Registered Public Accounting Firm
Annual Report December 31, 2022
To the Shareholders and Board of Trustees of
Baillie Gifford Funds
Opinion on the Financial Statements
We have audited the accompanying statements of assets and liabilities, including the portfolios of investments, of the funds listed below (the "Funds"), each a series of Baillie Gifford Funds, as of December 31, 2022, the related statements of operations and changes in net assets, the related notes, and the financial highlights for each of the periods indicated below (collectively referred to as the "financial statements"). In our opinion, the financial statements present fairly, in all material respects, the financial position of each of the Funds as of December 31, 2022, the results of their operations, the changes in net assets, and the financial highlights for each of the periods indicated below in conformity with accounting principles generally accepted in the United States of America.
| Fund Name | Statements of Operations | Statements of Changes in Net Assets | Financial Highlights | ||||||||||||
Baillie Gifford Developed EAFE All Cap Fund, Baillie Gifford EAFE Plus All Cap Fund, Baillie Gifford Emerging Markets Equities Fund, Baillie Gifford Global Alpha Equities Fund, Baillie Gifford Global Stewardship Equities Fund, Baillie Gifford International Alpha Fund, Baillie Gifford International Concentrated Growth Equities Fund, Baillie Gifford International Growth Fund, Baillie Gifford Long Term Global Growth Fund, and Baillie Gifford U.S. Equity Growth Fund | For the year ended December 31, 2022 | For the years ended December 31, 2022 and 2021 | For the years ended December 31, 2022, 2021, 2020, 2019, and 2018 | ||||||||||||
Baillie Gifford International Smaller Companies Fund | For the year ended December 31, 2022 | For the years ended December 31, 2022 and 2021 | For the years ended December 31, 2022 2021, 2020, 2019, and for the period from December 19, 2018 (commencement of operations) through December 31, 2018 | ||||||||||||
Baillie Gifford China A Shares Growth Fund | For the year ended December 31, 2022 | For the years ended December 31, 2022 and 2021 | For the years ended December 31, 2022, 2021, 2020, and for the period from December 19, 2019 (commencement of operations) through December 31, 2019 | ||||||||||||
Baillie Gifford Emerging Markets ex China Fund and Baillie Gifford Health Innovation Equities Fund | For the year ended December 31, 2022 | For the year ended December 31, 2022 and for the period from December 28, 2021 (commencement of operations) through December 31, 2021 | |||||||||||||
Baillie Gifford China Equities Fund | For the year ended December 31, 2022 | For the year ended December 31, 2022 and for the period from July 7, 2021 (commencement of operations) through December 31, 2021 | |||||||||||||
Baillie Gifford U.S. Discovery Fund | For the year ended December 31, 2022 | For the year ended December 31, 2022 and for the period from May 5, 2021 (commencement of operations) through December 31, 2021 | |||||||||||||
252
Report of Independent Registered Public Accounting Firm
Annual Report December 31, 2022
Basis for Opinion
These financial statements are the responsibility of the Funds' management. Our responsibility is to express an opinion on the Funds' financial statements based on our audits. We are a public accounting firm registered with the Public Company Accounting Oversight Board (United States) ("PCAOB") and are required to be independent with respect to the Funds in accordance with the U.S. federal securities laws and the applicable rules and regulations of the Securities and Exchange Commission and the PCAOB.
We conducted our audits in accordance with the standards of the PCAOB. Those standards require that we plan and perform the audit to obtain reasonable assurance about whether the financial statements are free of material misstatement whether due to error or fraud.
Our audits included performing procedures to assess the risks of material misstatement of the financial statements, whether due to error or fraud, and performing procedures that respond to those risks. Such procedures included examining, on a test basis, evidence regarding the amounts and disclosures in the financial statements. Our procedures included confirmation of securities owned as of December 31, 2022, by correspondence with the custodian and brokers; when replies were not received from brokers, we performed other auditing procedures. Our audits also included evaluating the accounting principles used and significant estimates made by management, as well as evaluating the overall presentation of the financial statements. We believe that our audits provide a reasonable basis for our opinion.
We have served as the Funds' auditor since 2017.

COHEN & COMPANY, LTD.
Milwaukee, Wisconsin
February 28, 2023
253
Supplemental Information (unaudited)
Annual Report December 31, 2022
Federal Income Tax Information
The Funds intend to designate the maximum amount of dividends that qualify for the reduced tax rate pursuant to the Jobs and Growth Tax Relief Reconciliation Act of 2003 for the year ended December 31, 2022.
For corporate shareholders, the percentage of ordinary income distributions for the year/period ended December 31, 2022 for the corporate dividends-received deduction for each Fund is as follows.
| Fund | Qualified Dividend Income | Dividends-received Deductions | |||||||||
Baillie Gifford China A Shares Growth Fund | 0.00 | % | 0.00 | % | |||||||
Baillie Gifford China Equities Fund | 100.00 | % | 0.00 | % | |||||||
Baillie Gifford Developed EAFE All Cap Fund | 100.00 | % | 0.00 | % | |||||||
Baillie Gifford EAFE Plus All Cap Fund | 100.00 | % | 0.00 | % | |||||||
Baillie Gifford Emerging Markets Equities Fund | 90.02 | % | 0.00 | % | |||||||
Baillie Gifford Emerging Markets ex China Fund | 100.00 | % | 0.00 | % | |||||||
Baillie Gifford Global Alpha Equities Fund | 100.00 | % | 100.00 | % | |||||||
Baillie Gifford Global Stewardship Equities Fund | 0.00 | % | 0.00 | % | |||||||
Baillie Gifford Health Innovation Equities Fund | 100.00 | % | 100.00 | % | |||||||
Baillie Gifford International Alpha Fund | 100.00 | % | 0.00 | % | |||||||
Baillie Gifford International Concentrated Growth Equities Fund | 100.00 | % | 2.14 | % | |||||||
Baillie Gifford International Growth Fund | 100.00 | % | 0.00 | % | |||||||
Baillie Gifford International Smaller Companies Fund | 100.00 | % | 0.00 | % | |||||||
Baillie Gifford Long Term Global Growth Fund | 0.00 | % | 0.00 | % | |||||||
Baillie Gifford U.S. Discovery Fund | 0.00 | % | 0.00 | % | |||||||
Baillie Gifford U.S. Equity Growth Fund | 0.00 | % | 0.00 | % | |||||||
In February 2023, certain U.S. shareholders will be advised on IRS Form 1099 DIV or substitute 1099 DIV as to the U.S. federal tax status of the distributions received in the calendar year 2022.
Foreign Taxes Paid — The following Funds elect under the Code Section 853 to pass through foreign taxes paid to its shareholders. The total amounts of foreign taxes passed through to shareholders on a per share basis for the year ended December 31, 2022, are as follows:
| Fund | Foreign Taxes Per Share | Foreign Income Per Share | |||||||||
Baillie Gifford China A Shares Growth Fund | — | — | |||||||||
Baillie Gifford China Equities Fund | 0.0060 | 0.1054 | |||||||||
Baillie Gifford Developed EAFE All Cap Fund | 0.0072 | 0.1929 | |||||||||
Baillie Gifford EAFE Plus All Cap Fund | — | — | |||||||||
Baillie Gifford Emerging Markets Equities Fund | 0.0538 | 1.1287 | |||||||||
Baillie Gifford Emerging Markets ex China Fund | 0.0255 | 0.4447 | |||||||||
Baillie Gifford Global Alpha Equities Fund | — | — | |||||||||
Baillie Gifford Global Stewardship Equities Fund | — | — | |||||||||
Baillie Gifford Health Innovation Equities Fund | — | — | |||||||||
Baillie Gifford International Alpha Fund | 0.0213 | 0.2846 | |||||||||
Baillie Gifford International Concentrated Growth Equities Fund | — | — | |||||||||
Baillie Gifford International Growth Fund | — | — | |||||||||
254
Supplemental Information (unaudited)
Annual Report December 31, 2022
| Fund | Foreign Taxes Per Share | Foreign Income Per Share | |||||||||
Baillie Gifford International Smaller Companies Fund | 0.0224 | 0.1430 | |||||||||
Baillie Gifford Long Term Global Growth Fund | — | — | |||||||||
Baillie Gifford U.S. Discovery Fund | — | — | |||||||||
Baillie Gifford U.S. Equity Growth Fund | — | — | |||||||||
255
Supplemental Information (unaudited)
Annual Report December 31, 2022
Management of the Trust
The following tables set forth the Trustees and officers of the Trust, their principal occupations during the past five years, and certain other information as of December 31, 2022.
Name and Year of Birth | Position(s) Held with Trust | Length of Time Served as Trustee(1) | Principal Occupation and Other Directorships Held During Past 5 Years(2) | Number of Funds in Fund Complex overseen by Trustee(3) | |||||||||||||||
Indepedent Trustees | |||||||||||||||||||
| Howard W. Chin 1952 | Trustee, Chair of the Nominating and Governance Committee | Since 2015 | Retired. Formerly: Managing Director, Investments, Guardian Life Insurance (financial services). | 17 | |||||||||||||||
| Pamela M.J. Cox 1952 | Trustee | Since 2017 | Retired. Formerly: Senior Associate (nonresident), CSIS (think-tank); Senior Vice President; Vice President East Asia, World Bank Group (international bank & financial services). | 17 | |||||||||||||||
| Robert E. Rigsby 1949 | Trustee, Chair of the Audit Oversight Committee | Since 2014 | Retired. Formerly: President & COO, Delivery Business at Dominion Energy, Inc. (electric and gas energy company). | 17 | |||||||||||||||
| Donald P. Sullivan Jr. 1954 | Trustee | Since 2020 | Retired. Formerly: Senior Vice President, Agency Distribution, Guardian Life Insurance (financial services). | 17 | |||||||||||||||
Interested Trustee (as defined in the 1940 Act)(4) | |||||||||||||||||||
| David Salter(5) 1975 | Trustee, Chair of the Board, and President | Since 2016 (Previously Vice President since 2014) | Partner, Baillie Gifford & Co. (parent of investment adviser); CEO & Chair, Baillie Gifford Funds Services LLC (broker-dealer). | 17 | |||||||||||||||
Name and Year of Birth | Position(s) Held with Trust | Length of Time Served(1) | Principal Occupation During Past 5 Years(2) | ||||||||||||
Officers (other than officers who are also Trustees)(4) | |||||||||||||||
| Andrew Telfer 1967 | Vice President | Since 2008 | Managing Partner, Baillie Gifford & Co. (parent of investment adviser) | ||||||||||||
| Michael Stirling-Aird 1977 | Vice President | Since 2012 | Partner; Baillie Gifford & Co. (parent of investment adviser) | ||||||||||||
| Julie Paul 1975 | Vice President | Since 2012 | Manager, North American Funds Operations Department, Baillie Gifford & Co. (parent of investment adviser) | ||||||||||||
| Tim Campbell 1975 | Vice President | Since 2014 | Partner, Baillie Gifford & Co. (parent of investment adviser); Manager, Baillie Gifford International LLC with oversight of marketing performed in North America. | ||||||||||||
| Lindsay Cockburn 1978 | Treasurer | Since 2015 | Manager, North American Funds Operations Department, Baillie Gifford & Co. (parent of investment adviser) | ||||||||||||
256
Supplemental Information (unaudited)
Annual Report December 31, 2022
Name and Year of Birth | Position(s) Held with Trust | Length of Time Served(1) | Principal Occupation During Past 5 Years(2) | ||||||||||||
Officers (other than officers who are also Trustees) | |||||||||||||||
| Gareth Griffiths 1973 | Secretary and Chief Legal Officer | Secretary since 2015; Chief Legal Officer since 2017 | Senior Legal Counsel for Baillie Gifford & Co. (parent of investment adviser) | ||||||||||||
| Graham Laybourn 1966 | Vice President | Since 2018 | Partner, Baillie Gifford & Co. (parent of investment adviser) | ||||||||||||
| Suzanne Quinn 1979 | Chief Compliance Officer and AML Compliance Officer | Since 2018 | Manager, Compliance Department, Baillie Gifford & Co. (parent of investment adviser) | ||||||||||||
| Lesley-Anne Archibald 1988 | Vice President | Since 2017 | Manager, North American Funds Operations Department, Baillie Gifford & Co. (parent of investment adviser) | ||||||||||||
| Kelly Cameron 1989 | Vice President | Since 2020 | Client Service Director, Baillie Gifford Overseas Limited (investment adviser) | ||||||||||||
| Neil Riddell 1988 | Chief Risk Officer | Since 2021 | Head of Group Business Risk, Baillie Gifford & Co. (parent of investment adviser) | ||||||||||||
The address of each Trustee of the Trust is c/o Ropes & Gray LLP, Prudential Tower, 800 Boylston Street, Boston, MA, 02199. The address of each officer of the Trust is c/o Baillie Gifford Funds, Calton Square, 1 Greenside Row, Edinburgh, Scotland EH1 3AN.
(1) There is no stated term of office for the Trustees and a Trustee may serve until such Trustee reaches the age of 75 years. The Chair of the Board and officers of the Trust, including the President of the Trust, are elected annually by the Board.
(2) Previous positions during the past five years with Baillie Gifford & Co., the Manager, and Baillie Gifford Group are omitted if not materially different from the positions listed.
(3) The number of Funds in the Fund complex overseen by the Trustee includes a series of the Trust not included in this shareholder report.
(4) The Trust currently pays no compensation to its officers or interested Trustee.
(5) David Salter is an "interested person" (as defined in the 1940 Act) of the Trust or the Manager due to his positions with the Manager and his role as an officer of the Trust.
Additional information regarding the Trustees is in each Fund's Statement of Additional Information and is available upon request, without charge, by calling the Manager at +44-131-275-2000. Shareholders may submit to the Trust claims for reimbursement of telephone charges incurred in placing such calls.
A description of each Fund's proxy voting policies and procedures related to portfolio securities is available without charge, upon request, by calling the Manager at +44-131-275-2000 or on the SEC's website at http://www.sec.gov. Shareholders may submit to the Trust claims for reimbursement of telephone charges incurred in placing such calls.
Information regarding how the Funds voted proxies relating to portfolio securities during the most recent
12-month period ended June 30 is also available without charge upon request by calling the Manager at +44-131-275-2000 or by accessing each Fund's Form N-PX on the SEC's website at http://www.sec.gov. Shareholders may submit to the Trust claims for reimbursement of telephone charges incurred in placing such calls.
Each of the Funds files its complete schedule of portfolio holdings with the SEC for the first and third quarters of each fiscal year as an exhibit to its Form N-PORT. The Funds' Form N-PORT is available on the SEC's website at http://www.sec.gov. The Funds' holdings can also be found at Baillie Gifford Funds' website: http://USmutualfund.bailliegifford.com.
257

Copyright © Baillie Gifford & Co. 2023
BAILLIE GIFFORD FUNDS
Baillie Gifford International All Cap Fund
Annual Report
December 31, 2022


Index
Page Number | |||
01 | Management Discussion | ||||||
04 | Fund Expenses | ||||||
06 | Industry Diversification Table | ||||||
07 | Portfolio of Investments | ||||||
12 | Financial Statements | ||||||
15 | Financial Highlights | ||||||
18 | Notes to Financial Statements | ||||||
27 | Report of Independent Registered Public Accounting Firm | ||||||
Supplemental Information | |||||||
28 | Federal Income Tax Information | ||||||
29 | Management of the Trust | ||||||

Scenic view of the Glenfinnan Viaduct, Glenfinnan, Scotland. @ Getty Images
The statements and views expressed in this report are as of this report's period end and are subject to change at any time based on a variety of factors. The respective parties disclaim any responsibility to update such views.
Actual outcomes may differ significantly from the views expressed. These views may not be relied on as investment advice or as an indication of trading intent on behalf of the Fund.
All investments entail risk, including the possible loss of principal.
Management Discussion (unaudited)
Annual Report December 31, 2022
Baillie Gifford International All Cap Fund
Market Conditions and Review of Performance during 2022
2022 was a tumultuous year, with war, inflation, interest rates, and geopolitics all coming to the fore. Against this market backdrop, time horizons shortened, and perceptions of growth deteriorated. Many expect the fragility of markets to persist as the troubles move from Wall Street to Main Street. Indeed, Andrew Bailey, Governor of the Bank of England, noted that "there is a tough road ahead," and Christine Lagarde, President of the European Central Bank, and Jerome Powell, Chair of the US Federal Reserve, have both cited how it is too premature to think about inflation passing. At the same time, some green shoots are emerging, providing grounds for optimism. Most notably, China has begun unwinding its onerous COVID-19 restrictions, which have weighed heavily on demand and supply chains. Business activity across Europe is also showing signs of picking up.
When considering the Fund's positioning, we aim to strike the right balance of growth, quality, and resilience. We have continued to be pleased with the operational progress of many of the Fund's holdings. While there have been some bumps in the road and there may be further setbacks ahead, we believe the market underappreciates their long-term prospects, and that share prices will, ultimately, reflect fundamentals as they have done in the past. We stand firmly by our long-term, bottom-up active approach to investing and continue to identify new and compelling growth opportunities. To quote from Warren Buffett, "every decade or so, dark clouds will fill the economic skies, and they will briefly rain gold." In our view, now is a beautiful time to be a growth investor, with many opportunities available for those willing to be patient.
Turning to performance, the latest calendar year has been challenging for the Fund's investment returns in absolute and relative terms. While our investment time horizon remains five years, the Fund's short-term performance is disappointing. Such has been the magnitude of the recent underperformance that longer-term outcomes are also now well below what we would expect to deliver. This being said, absolute returns picked up in the latter parts of the year, with some green shoots emerging and some encouraging operational performance being rewarded. We also saw a breakdown in the share price correlations seen in the earlier parts of the year when all growth stocks sold off indiscriminately.
Positive contributors over the past 12 months include some of the Fund's Financials sector holdings, such as United Overseas Bank and AIA Group.
United Overseas Bank is a family-run Singaporean bank with operations spanning South East Asia. It focuses primarily on consumer and small and mid-sized business lending. The Fund's managers debated and added to it in early 2022. It is seen as a steady as she goes investment case, consistently demonstrating above market returns and high asset quality. Loan growth has picked up during the year, and margins have expanded, while net interest benefitted from higher interest rates.
AIA is a leading life insurance business in Asia. Results this fiscal year have been subdued due to lockdowns in major Chinese cities, although they have shown signs of recovery more recently. The share price further benefitted from the surprise easing of COVID-19 restrictions in China following the well-publicized wave of protests against onerous curtailments. The long-term structural growth opportunity for AIA remains intact. It is a beneficiary of burgeoning middle-class income, which we expect to drive rising insurance penetration in Asia. AIA continues to expand its presence in China and invest in well-trained agents to capitalize on this trend.
Other positive contributors include Consumer Staples holdings such as Jeronimo Martins and Unicharm, with Luxury holdings also doing well.
Detractors for the calendar year again feature some of the Fund's internet disruptors and rapid growth holdings. Many of these saw strong returns in the early stages of the pandemic and have since suffered a derating on the back of shifting sentiment. For most of these companies, results have been encouraging, they are investing heavily in growth, and some are choosing to remain loss-making as they build out into new areas. In a market environment driven by uncertainty and prizing short-term profits, those stocks that require a patient, long-term approach have been hit hardest.
Shopify was the biggest detractor to the Fund's relative return for the calendar year. This Canadian-listed company is an 'all-in-one' e-commerce solutions provider. The shares had been notably weak over the past 12 months; however, this holding has been a top contributor to the Fund's longer-term performance. Operationally, Shopify has continued to grow its business in the past fiscal year, but the growth rate has slowed or reverted to pre-pandemic trends. This unexpected slowdown led the group to make personnel cuts. Operational progress has been more encouraging lately, with the market rewarding this with
01
Management Discussion (unaudited)
Annual Report December 31, 2022
better share price performance. We remain enthused about the long-term broadening of Shopify's business into areas such as payments.
Zalando, Europe's largest online fashion retailer, also features in the top detractors. In 2022, it suffered from a perfect storm of macro events that contributed to ongoing inflation and declining consumer sentiment. The result has been more muted growth than the highs in recent years, but growth, nonetheless. It continues to be focused primarily on profitability and adjusting its business model to tackle the cost pressures it has been facing. Importantly, it has consistently invested in the business, improving the customer experience and deepening brand partnerships. We remain confident that Zalando will continue to take share from traditional bricks and mortar retailers.
The Fund's lower exposure to specific sectors which performed well was also a headwind to relative performance — not owning many banks or certain asset-intensive areas such as energy and commodities, for example.
Investment strategies used to manage the Fund
Baillie Gifford is a growth manager with a bottom-up approach to stock picking. Bottom-up investing is an
approach that focuses on analyzing individual stocks and de-emphasizes the significance of economic and market cycles. We aim to invest in companies that we believe will generate sustainable earnings growth above the market over the long term. We analyze industry background, competitive advantages, management capabilities, financial strength, and valuation in determining a company's potential. From the outset, we also consider aspects that may derail the investment case. We regularly revisit the thesis for the Fund's holdings to ensure our expectations are met.
Trading over the period
Our new buy and complete sale decisions, which are a result of our bottom-up stock research, are listed below:
New Buys:
Adyen, Anheuser-Busch Inbev, Ashtead, Canadian Pacific Railway, DSV, EXOR, Experian, Lonza Group, Reliance Industries, Unicharm
Complete Sales:
ASOS, Bechtle, Burning Rock, HomeServe, Inditex, Johnson Matthey, Kakaku.com, Naspers, Rational, Yatsen
02
Management Discussion (unaudited)
Annual Report December 31, 2022
Fund Performance for periods ended 12/31/22 (Average Annual Total Returns)
One Year | % p.a. Five Year | % p.a. Ten Year | % p.a. Since Inception | Inception Date | |||||||||||||||||||
| Baillie Gifford International All Cap Fund Class 2* | (31.67 | )% | 0.81 | % | 4.85 | % | 5.06 | % | 04/09/13 | ||||||||||||||
| Baillie Gifford International All Cap Fund Class 3 | (31.62 | )% | 0.88 | % | 4.91 | % | 5.11 | % | 05/01/13 | ||||||||||||||
| Baillie Gifford International All Cap Fund Class 5** | (31.56 | )% | 0.91 | % | 4.90 | % | 5.11 | % | 07/10/19 | ||||||||||||||
MSCI ACWI ex USA Index | (15.57 | )% | 1.36 | % | 4.28 | % | 4.60 | % | 09/24/12 | ||||||||||||||
* Performance for Class 2 shares prior to their date of inception is derived from the historical performance of Class 1 shares (inception date September 24, 2012), and has not been adjusted for the lower shareholder servicing fees applicable to Class 2 shares.
** Performance for Class 5 shares prior to their dates of inception are derived from the historical performance of Class 2 shares and have not been adjusted for the lower shareholder servicing fees applicable to Class 5 shares. Prior to the inception of Class 2 (April 9, 2013), Class 5 shares historical performance is derived from Class 1 shares and have not been adjusted for the lower shareholder servicing fees applicable to Class 5 shares.
The returns are provided for all shares classes that had shares outstanding as of December 31, 2022. Additional year-over-year returns for each class are available in the Financial Highlights section.
Comparison of the change in value of $10,000 Investment in the Fund's Class 2 shares and the index.
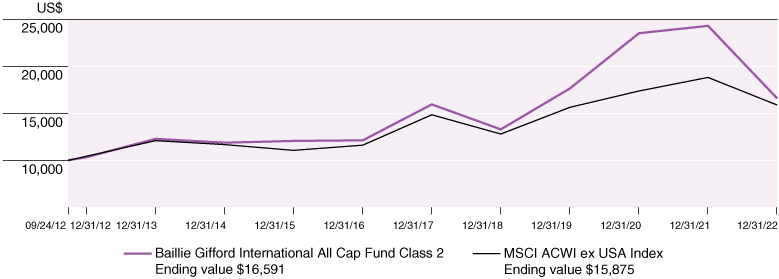
Past performance does not predict future performance. The graph and the table above do not reflect the deduction of taxes that a shareholder would pay on the Fund distributions or redemption of Fund shares.
03
Fund Expenses (unaudited)
Annual Report December 31, 2022
As a shareholder of the Fund you incur two types of costs: (1) transaction costs and (2) ongoing costs, including advisory fees, shareholder service fees and other Fund expenses. This example is intended to help you understand your ongoing costs (in dollars) of investing in the Fund and to compare these costs with the ongoing costs of investing in other mutual funds.
The example is based on an investment of $1,000 invested at the beginning of the period and held for the entire period from July 1, 2022 to December 31, 2022.
Actual Expenses
The first line of each table provides information about actual account values and actual expenses. You may use the information in this line, together with the amount you invested, to estimate the expenses that you paid over the period. Simply divide the account value by $1,000 (for example, an $8,600 account value divided by $1,000 = 8.6), then multiply the result by the number in the first line under the heading entitled "Expenses Paid During the Period" to estimate the expenses you paid on your account during this period.
Hypothetical Example for Comparison Purposes
The second line of each table on the following page provides information about hypothetical account values and hypothetical expenses based on the Fund's actual expense ratio and an assumed annual rate of return of 5% before expenses, which is not the Fund's actual return.
The hypothetical account values and expenses may not be used to estimate the actual ending account balance or expenses you paid for the period. You may use this information to compare the ongoing costs of investing in the Fund and other funds by comparing this 5% hypothetical example with the 5% hypothetical examples that appear in the shareholder reports of other funds.
Please note that the expenses shown in the table are meant to highlight your ongoing costs only and do not reflect any transactional costs. Therefore, the second line of the table labeled "Hypothetical (5% return before expenses)" is useful in comparing ongoing costs only, and will not help you determine the relative total costs of owning different funds. In addition, if these transactional costs were included, your costs would have been higher.
04
Fund Expenses (unaudited)
Annual Report December 31, 2022
| Beginning Account Value July 1, 2022 | Ending Account Value December 31, 2022 | Annualized Expense Ratios Based on the Period July 1, 2022 to December 31, 2022 | Expenses Paid During Period* | ||||||||||||||||
Baillie Gifford International All Cap Fund — Class 2 | |||||||||||||||||||
Actual | $ | 1,000 | $ | 1,029.60 | 0.65 | % | $ | 3.33 | |||||||||||
Hypothetical (5% return before expenses) | $ | 1,000 | $ | 1,021.93 | 0.65 | % | $ | 3.31 | |||||||||||
Baillie Gifford International All Cap Fund — Class 3 | |||||||||||||||||||
Actual | $ | 1,000 | $ | 1,030.00 | 0.58 | % | $ | 2.97 | |||||||||||
Hypothetical (5% return before expenses) | $ | 1,000 | $ | 1,022.28 | 0.58 | % | $ | 2.96 | |||||||||||
Baillie Gifford International All Cap Fund — Class 5 | |||||||||||||||||||
Actual | $ | 1,000 | $ | 1,030.40 | 0.50 | % | $ | 2.56 | |||||||||||
Hypothetical (5% return before expenses) | $ | 1,000 | $ | 1,022.68 | 0.50 | % | $ | 2.55 | |||||||||||
* Unless otherwise indicated, expenses are calculated using the Fund's annualized expense ratio, multiplied by the average account value for the period, multiplied by 184/365 (to reflect the six-month period).
Expenses are calculated using the annualized expense ratio for the Fund, which represents the ongoing expenses as a percentage of net assets for the period ended December 31, 2022. Expenses are calculated by multiplying the annualized expense ratio by the average account value for the period; then multiplying the result by the number of
days in the most recent fiscal half-year; and then dividing that result by the number of days in the calendar year. Expense ratios for the most recent fiscal year may differ from expense ratios based on the one-year data in the financial highlights.
05
Industry Diversification Table
Annual Report December 31, 2022
December 31, 2022
Baillie Gifford International All Cap Fund
Value | % of Total Net Assets | ||||||||||
Apparel | $ | 13,448,964 | 4.2 | % | |||||||
Auto Manufacturers | 2,706,311 | 0.9 | |||||||||
Auto Parts & Equipment | 5,494,643 | 1.8 | |||||||||
Banks | 8,912,641 | 2.8 | |||||||||
Beverages | 12,745,757 | 4.1 | |||||||||
Biotechnology | 2,407,825 | 0.8 | |||||||||
Building Materials | 1,566,274 | 0.5 | |||||||||
Chemicals | 1,361,206 | 0.4 | |||||||||
Commercial Services | 17,657,022 | 5.6 | |||||||||
Cosmetics/Personal Care | 15,511,118 | �� | 4.9 | ||||||||
Distribution/Wholesale | 4,335,018 | 1.4 | |||||||||
Diversified Financial Services | 10,968,252 | 3.5 | |||||||||
Electronics | 22,353,362 | 7.0 | |||||||||
Energy — Alternate Sources | 3,159,009 | 1.0 | |||||||||
Food | 4,755,591 | 1.5 | |||||||||
Hand/Machine Tools | 5,242,431 | 1.7 | |||||||||
Healthcare — Products | 15,005,444 | 4.7 | |||||||||
Healthcare-Services | 2,937,890 | 0.9 | |||||||||
Insurance | 12,157,042 | 3.8 | |||||||||
Internet | 51,857,646 | 16.5 | |||||||||
Investment Companies | 8,998,038 | 2.8 | |||||||||
Leisure Time | 3,713,444 | 1.2 | |||||||||
Machinery — Construction & Mining | 7,713,560 | 2.5 | |||||||||
Machinery — Diversified | 15,918,625 | 5.0 | |||||||||
Oil & Gas | 2,791,883 | 0.9 | |||||||||
Retail | 23,483,649 | 7.5 | |||||||||
Semiconductors | 17,444,251 | 5.6 | |||||||||
Software | 6,135,478 | 1.9 | |||||||||
Telecommunications | 2,575,642 | 0.8 | |||||||||
Toys/Games/Hobbies | 3,452,417 | 1.1 | |||||||||
Transportation | 4,694,384 | 1.5 | |||||||||
Total Value of Investments | 311,504,817 | 98.8 | |||||||||
Other assets less liabilities | 3,734,258 | 1.2 | |||||||||
Net Assets | $ | 315,239,075 | 100.0 | % | |||||||
The table above is based on Bloomberg Industry Group classifications. For compliance monitoring purposes, sub-industry classifications are used which results in less concentration across industry sectors.
06
Portfolio of Investments
Annual Report December 31, 2022
December 31, 2022
Baillie Gifford International All Cap Fund
Shares | Value | ||||||||||
COMMON STOCKS — 96.6% | |||||||||||
AUSTRALIA — 1.5% | |||||||||||
Cochlear Ltd. | 34,852 | $ | 4,813,320 | ||||||||
BELGIUM — 1.1% | |||||||||||
Anheuser-Busch InBev SA/NV | 56,352 | 3,394,135 | |||||||||
BRAZIL — 2.8% | |||||||||||
| MercadoLibre, Inc. * | 5,548 | 4,694,940 | |||||||||
Raia Drogasil SA | 890,800 | 4,011,845 | |||||||||
8,706,785 | |||||||||||
CANADA — 2.1% | |||||||||||
Canadian Pacific Railway Ltd. | 40,500 | 3,019,553 | |||||||||
| Shopify, Inc., Class A * | 102,240 | 3,548,751 | |||||||||
6,568,304 | |||||||||||
CHINA — 12.1% | |||||||||||
| Alibaba Group Holding Ltd. * | 406,856 | 4,464,396 | |||||||||
| Baidu, Inc., Class A * | 147,608 | 2,104,999 | |||||||||
| BeiGene Ltd. * | 141,869 | 2,407,825 | |||||||||
Contemporary Amperex Technology Co., Ltd., Class A | 54,955 | 3,096,596 | |||||||||
Li Ning Co., Ltd. | 431,000 | 3,706,171 | |||||||||
LONGi Green Energy Technology Co., Ltd., Class A | 521,686 | 3,159,009 | |||||||||
| Meituan, Class B * | 204,300 | 4,526,437 | |||||||||
Ping An Insurance Group Co. of China Ltd., Class H | 622,500 | 4,089,667 | |||||||||
Prosus NV | 116,660 | 8,054,609 | |||||||||
| Trip.com Group Ltd. * | 70,854 | 2,443,726 | |||||||||
38,053,435 | |||||||||||
DENMARK — 0.5% | |||||||||||
DSV A/S | 10,591 | 1,674,831 | |||||||||
FRANCE — 4.7% | |||||||||||
Kering | 5,835 | 2,969,595 | |||||||||
LVMH Moet Hennessy Louis Vuitton SE | 7,390 | 5,377,653 | |||||||||
Remy Cointreau SA | 31,702 | 5,345,389 | |||||||||
| Ubisoft Entertainment SA * | 44,099 | 1,245,834 | |||||||||
14,938,471 | |||||||||||
The accompanying notes are an integral part of the financial statements.
07
Portfolio of Investments
Annual Report December 31, 2022
December 31, 2022
Baillie Gifford International All Cap Fund
Shares | Value | ||||||||||
GERMANY — 3.2% | |||||||||||
adidas AG | 16,413 | $ | 2,224,396 | ||||||||
| Auto1 Group SE * | 173,896 | 1,444,732 | |||||||||
Nemetschek SE | 37,634 | 1,924,089 | |||||||||
| Zalando SE * | 124,934 | 4,398,279 | |||||||||
9,991,496 | |||||||||||
HONG KONG — 3.7% | |||||||||||
AIA Group Ltd. | 580,800 | 6,414,002 | |||||||||
Techtronic Industries Co., Ltd. | 472,000 | 5,242,431 | |||||||||
11,656,433 | |||||||||||
INDIA — 5.7% | |||||||||||
Asian Paints Ltd. | 36,615 | 1,361,206 | |||||||||
Housing Development Finance Corp., Ltd. | 254,690 | 8,096,841 | |||||||||
ICICI Lombard General Insurance Co., Ltd. | 110,736 | 1,653,374 | |||||||||
| MakeMyTrip Ltd. * | 54,285 | 1,496,637 | |||||||||
Reliance Industries Ltd. | 90,939 | 2,791,883 | |||||||||
| United Spirits Ltd. * | 240,967 | 2,552,758 | |||||||||
17,952,699 | |||||||||||
JAPAN — 19.0% | |||||||||||
Denso Corp. | 48,900 | 2,398,047 | |||||||||
Kao Corp. | 40,400 | 1,603,898 | |||||||||
Keyence Corp. | 10,200 | 3,960,097 | |||||||||
Murata Manufacturing Co., Ltd. | 86,100 | 4,246,038 | |||||||||
Nidec Corp. | 65,900 | 3,391,158 | |||||||||
Olympus Corp. | 334,500 | 5,899,774 | |||||||||
Pigeon Corp. | 103,200 | 1,691,330 | |||||||||
Recruit Holdings Co., Ltd. | 93,700 | 2,932,995 | |||||||||
Shimano, Inc. | 23,500 | 3,713,444 | |||||||||
Shiseido Co., Ltd. | 163,700 | 8,023,547 | |||||||||
SMC Corp. | 11,800 | 4,927,135 | |||||||||
SoftBank Group Corp. | 60,900 | 2,575,642 | |||||||||
Sugi Holdings Co., Ltd. | 30,500 | 1,356,462 | |||||||||
Suzuki Motor Corp. | 84,500 | 2,706,311 | |||||||||
Sysmex Corp. | 71,100 | 4,292,350 | |||||||||
Unicharm Corp. | 109,500 | 4,192,342 | |||||||||
Z Holdings Corp. | 738,800 | 1,845,165 | |||||||||
59,755,735 | |||||||||||
The accompanying notes are an integral part of the financial statements.
08
Portfolio of Investments
Annual Report December 31, 2022
December 31, 2022
Baillie Gifford International All Cap Fund
Shares | Value | ||||||||||
MEXICO — 0.7% | |||||||||||
Wal-Mart de Mexico SAB de CV | 601,349 | $ | 2,125,621 | ||||||||
NETHERLANDS — 6.1% | |||||||||||
| Adyen NV * | 3,316 | 4,603,437 | |||||||||
| ASML Holding NV | 13,122 | 7,154,798 | |||||||||
| EXOR NV * | 43,926 | 3,216,013 | |||||||||
IMCD NV | 30,306 | 4,335,018 | |||||||||
19,309,266 | |||||||||||
NEW ZEALAND — 0.9% | |||||||||||
| Xero Ltd. * | 62,192 | 2,965,555 | |||||||||
PORTUGAL — 1.5% | |||||||||||
Jeronimo Martins SGPS SA | 219,805 | 4,755,591 | |||||||||
SINGAPORE — 2.8% | |||||||||||
United Overseas Bank Ltd. | 389,099 | 8,912,641 | |||||||||
SOUTH KOREA — 0.5% | |||||||||||
| Coupang, Inc. * | 116,967 | 1,720,584 | |||||||||
NAVER Corp. | 17 | 2,418 | |||||||||
1,723,002 | |||||||||||
SWEDEN — 5.8% | |||||||||||
Atlas Copco AB, A Shares | 35,164 | 416,637 | |||||||||
Atlas Copco AB, B Shares | 619,960 | 6,614,756 | |||||||||
Epiroc AB, B Shares | 248,003 | 3,989,674 | |||||||||
Investor AB, B Shares | 319,432 | 5,782,025 | |||||||||
Nibe Industrier AB, B Shares | 167,807 | 1,566,274 | |||||||||
18,369,366 | |||||||||||
SWITZERLAND — 3.4% | |||||||||||
Cie Financiere Richemont SA | 60,815 | 7,885,271 | |||||||||
Lonza Group AG | 5,985 | 2,937,889 | |||||||||
10,823,160 | |||||||||||
TAIWAN — 3.3% | |||||||||||
Taiwan Semiconductor Manufacturing Co., Ltd. ADR | 138,132 | 10,289,453 | |||||||||
The accompanying notes are an integral part of the financial statements.
09
Portfolio of Investments
Annual Report December 31, 2022
December 31, 2022
Baillie Gifford International All Cap Fund
Shares | Value | ||||||||||
THAILAND — 0.5% | |||||||||||
Thai Beverage PCL | 2,842,700 | $ | 1,453,474 | ||||||||
UNITED KINGDOM — 11.7% | |||||||||||
Ashtead Group PLC | 31,858 | 1,809,687 | |||||||||
Auto Trader Group PLC | 831,663 | 5,179,060 | |||||||||
Burberry Group PLC | 118,349 | 2,877,321 | |||||||||
Experian PLC | 97,265 | 3,294,204 | |||||||||
| Farfetch Ltd., Class A * | 203,822 | 964,078 | |||||||||
Games Workshop Group PLC | 33,446 | 3,452,417 | |||||||||
Hargreaves Lansdown PLC | 278,833 | 2,871,411 | |||||||||
Intertek Group PLC | 53,173 | 2,586,983 | |||||||||
Rightmove PLC | 839,912 | 5,196,065 | |||||||||
| Trainline PLC * | 714,487 | 2,371,937 | |||||||||
Weir Group PLC (The) | 185,135 | 3,723,886 | |||||||||
| Wise PLC, Class A * | 358,641 | 2,429,716 | |||||||||
36,756,765 | |||||||||||
UNITED STATES — 3.0% | |||||||||||
| Mettler-Toledo International, Inc. * | 5,341 | 7,720,148 | |||||||||
| Spotify Technology SA * | 22,788 | 1,799,113 | |||||||||
9,519,261 | |||||||||||
Total Common Stocks | |||||||||||
(cost $264,681,372) | 304,508,799 | ||||||||||
PREFERRED STOCKS — 2.2% | |||||||||||
GERMANY — 2.2% | |||||||||||
Sartorius AG 0.34% (cost $2,110,464) | 17,717 | 6,996,018 | |||||||||
TOTAL INVESTMENTS — 98.8% | |||||||||||
(cost $266,791,836) | $ | 311,504,817 | |||||||||
Other assets less liabilities — 1.2% | 3,734,258 | ||||||||||
NET ASSETS — 100.0% | $ | 315,239,075 | |||||||||
* Non-income producing security.
ADR — American Depositary Receipt
This report classifies issuers geographically by their country of risk. For compliance monitoring purposes, Baillie Gifford Overseas Limited retains discretion to consider a number of factors in determining where a particular issuer is located, as described in further detail in the Fund's prospectus for private placement.
The accompanying notes are an integral part of the financial statements.
10
Portfolio of Investments
Annual Report December 31, 2022
December 31, 2022
Baillie Gifford International All Cap Fund
Fair Value Measurement
The following is a summary of the inputs used as of December 31, 2022 in valuing the Fund's investments carried at fair value:
Investments in Securities | Level 1 | Level 2 | Level 3 | Total | |||||||||||||||
| Common Stocks ** | $ | 39,750,815 | $ | 264,757,984 | $ | — | $ | 304,508,799 | |||||||||||
| Preferred Stocks ** | — | 6,996,018 | — | 6,996,018 | |||||||||||||||
Total | $ | 39,750,815 | $ | 271,754,002 | $ | — | $ | 311,504,817 | |||||||||||
** Refer to Portfolio of Investments for further detail.
The accompanying notes are an integral part of the financial statements.
11
Statement of Assets and Liabilities
Annual Report December 31, 2022
December 31, 2022
Baillie Gifford International All Cap Fund
ASSETS | |||||||
Investments, at value (cost $266,791,836) | $ | 311,504,817 | |||||
Cash | 3,968,038 | ||||||
Foreign cash, at value (cost $4,714) | 4,722 | ||||||
Tax reclaims receivable | 408,996 | ||||||
Dividends receivable | 230,467 | ||||||
Total Assets | 316,117,040 | ||||||
LIABILITIES | |||||||
Advisory fee payable | 267,148 | ||||||
Deferred India capital gains tax liability (Note A) | 318,434 | ||||||
Payable for investment purchased | 92,485 | ||||||
Shareholder Servicing fee payable | 80,263 | ||||||
Trustee fee payable | 3,554 | ||||||
Commitment fee payable | 1,189 | ||||||
Accrued expenses | 114,892 | ||||||
Total Liabilities | 877,965 | ||||||
NET ASSETS | $ | 315,239,075 | |||||
COMPOSITION OF NET ASSETS | |||||||
Paid-in capital | $ | 270,723,599 | |||||
Total distributable earnings | 44,515,476 | ||||||
$ | 315,239,075 | ||||||
NET ASSET VALUE, PER SHARE | |||||||
| Class 2 ( $61,056,640 / 5,434,247 shares outstanding), unlimited authorized, no par value | $ | 11.24 | |||||
| Class 3 ( $221,063,641 / 19,368,994 shares outstanding), unlimited authorized, no par value | $ | 11.41 | |||||
| Class 5 ( $33,118,794 / 2,822,916 shares outstanding), unlimited authorized, no par value | $ | 11.73 | |||||
The accompanying notes are an integral part of the financial statements.
12
Statement of Operations
Annual Report December 31, 2022
For the Year Ended December 31, 2022
Baillie Gifford International All Cap Fund
INVESTMENT INCOME | |||||||
Dividends (net of foreign withholding taxes of $457,478) | $ | 4,030,046 | |||||
Windfall tax recovery (Note A) | 646,041 | ||||||
Interest | 12,841 | ||||||
Total Investment Income | 4,688,928 | ||||||
EXPENSES | |||||||
Advisory fee (Note B) | 1,170,255 | ||||||
Shareholder Servicing fees — Class 2 shares (Note B) | 115,261 | ||||||
Shareholder Servicing fees — Class 3 shares (Note B) | 190,388 | ||||||
Shareholder Servicing fees — Class 4 shares (Note B) | 28,642 | ||||||
Shareholder Servicing fees — Class 5 shares (Note B) | 7,051 | ||||||
Transfer agency | 58,598 | ||||||
Fund accounting | 138,692 | ||||||
Custody | 73,059 | ||||||
Legal | 62,395 | ||||||
Professional fees | 37,885 | ||||||
Trustees' fees | 13,543 | ||||||
Commitment fees | 4,480 | ||||||
Miscellaneous | 25,514 | ||||||
Total Expenses | 1,925,763 | ||||||
Net Investment Income | 2,763,165 | ||||||
| REALIZED AND UNREALIZED GAIN (LOSS) ON INVESTMENTS AND FOREIGN CURRENCY TRANSACTIONS | |||||||
Net realized gain (loss) from: | |||||||
Investments (net of India capital gains tax expense of $563,869) | 7,988,027 | ||||||
Foreign currency transactions | (70,675 | ) | |||||
7,917,352 | |||||||
Net change in unrealized (depreciation) on: | |||||||
Investments (net of change in deferred India capital gains tax liability of $787,947) (Note A) | (155,261,559 | ) | |||||
Translation of net assets and liabilities denominated in foreign currencies | (8,841 | ) | |||||
(155,270,400 | ) | ||||||
Net realized and unrealized (loss) | (147,353,048 | ) | |||||
NET (DECREASE) IN NET ASSETS FROM OPERATIONS | $ | (144,589,883 | ) | ||||
The accompanying notes are an integral part of the financial statements.
13
Statements of Changes in Net Assets
Annual Report December 31, 2022
Baillie Gifford International All Cap Fund
| For the Year Ended December 31, 2022 | For the Year Ended December 31, 2021 | ||||||||||
INCREASE (DECREASE) IN NET ASSETS FROM OPERATIONS | |||||||||||
Net investment income | $ | 2,763,165 | $ | 1,790,869 | |||||||
Net realized gain | 7,917,352 | 86,337,673 | |||||||||
Net change in unrealized (depreciation) | (155,270,400 | ) | (64,551,790 | ) | |||||||
Net Increase (Decrease) in Net Assets from Operations | (144,589,883 | ) | 23,576,752 | ||||||||
DIVIDENDS AND DISTRIBUTIONS TO SHAREHOLDERS FROM: | |||||||||||
Distributable earnings | |||||||||||
Class 2 | (1,409,109 | ) | (21,958,684 | ) | |||||||
Class 3 | (5,024,230 | ) | (25,864,981 | ) | |||||||
Class 4 | — | (33,178,532 | ) | ||||||||
Class 5 | (732,708 | ) | (9,222,007 | ) | |||||||
Total Distributions to Shareholders | (7,166,047 | ) | (90,224,204 | ) | |||||||
TRANSACTIONS IN SHARES OF BENEFICIAL INTEREST | |||||||||||
Net proceeds from shares subscribed: | |||||||||||
Class 2 | — | 10,000,967 | |||||||||
Class 3 | 144,914,059 | * | 6,001,749 | ||||||||
Class 4 | — | 207,931,390 | * | ||||||||
Class 5 | — | — | |||||||||
Dividends reinvested: | |||||||||||
Class 2 | 1,409,109 | 21,958,684 | |||||||||
Class 3 | 5,024,230 | 25,864,981 | |||||||||
Class 4 | — | 33,178,532 | |||||||||
Class 5 | 732,708 | 9,222,325 | |||||||||
Cost of shares redeemed: | |||||||||||
Class 2 | (20,000,000 | ) | (89,047,447 | ) | |||||||
Class 3 | — | (222,931,390 | )* | ||||||||
Class 4 | (131,414,059 | )* | (30,000,000 | ) | |||||||
Class 5 | — | (13,700,000 | ) | ||||||||
Increase (Decrease) in Net Assets from Transactions in Shares of Beneficial Interest | 666,047 | (41,520,209 | ) | ||||||||
Total (Decrease) in Net Assets | (151,089,883 | ) | (108,167,661 | ) | |||||||
NET ASSETS | |||||||||||
Beginning of Year | 466,328,958 | 574,496,619 | |||||||||
End of Year | $ | 315,239,075 | $ | 466,328,958 | |||||||
* See Note D for details of share class conversions.
The accompanying notes are an integral part of the financial statements.
14
Financial Highlights
Annual Report December 31, 2022
Baillie Gifford International All Cap Fund
Selected data for a Class 2 share outstanding throughout each year
| For the Year Ended December 31, 2022 | For the Year Ended December 31, 2021 | For the Year Ended December 31, 2020 | For the Year Ended December 31, 2019 | For the Year Ended December 31, 2018 | |||||||||||||||||||
Net asset value, beginning of year | $ | 16.83 | $ | 20.27 | $ | 15.82 | $ | 12.26 | $ | 14.85 | |||||||||||||
From Investment Operations | |||||||||||||||||||||||
Net investment income(a) | 0.09 | 0.05 | 0.06 | 0.27 | 0.15 | ||||||||||||||||||
| Net realized and unrealized gain (loss) on investments and foreign currency | (5.41 | ) | 0.60 | 5.20 | 3.73 | (2.61 | ) | ||||||||||||||||
| Net increase (decrease) in net asset value from investment operations | (5.32 | ) | 0.65 | 5.26 | 4.00 | (2.46 | ) | ||||||||||||||||
Dividends and Distributions to Shareholders | |||||||||||||||||||||||
From net investment income | — | (0.19 | ) | (0.18 | ) | (0.44 | ) | (0.13 | ) | ||||||||||||||
From net realized gain on investments | (0.27 | ) | (3.90 | ) | (0.63 | ) | — | — | |||||||||||||||
Total dividends and distributions | (0.27 | ) | (4.09 | ) | (0.81 | ) | (0.44 | ) | (0.13 | ) | |||||||||||||
Net asset value, end of year | $ | 11.24 | $ | 16.83 | $ | 20.27 | $ | 15.82 | $ | 12.26 | |||||||||||||
Total Return | |||||||||||||||||||||||
Total return based on net asset value(b) | (31.67 | )% | 3.34 | % | 33.31 | % | 32.65 | % | (16.63 | )% | |||||||||||||
Ratios/Supplemental Data | |||||||||||||||||||||||
Net assets, end of year (000's omitted) | $ | 61,057 | $ | 112,388 | $ | 183,037 | $ | 258,860 | $ | 242,317 | |||||||||||||
Ratio of net expenses to average net assets | 0.64 | % | 0.61 | % | 0.62 | % | 0.65 | % | 0.64 | % | |||||||||||||
| Ratio of net investment income to average net assets | 0.71 | % | 0.26 | % | 0.34 | % | 1.92 | %(c) | 1.02 | % | |||||||||||||
Portfolio turnover rate(d) | 19 | % | 14 | % | 12 | % | 13 | % | 15 | % | |||||||||||||
(a) Calculated based upon average shares outstanding during the year.
(b) Total investment return is calculated assuming an initial investment made at the net asset value at the beginning of the period, reinvestment of all dividends and distributions, if any, at net asset value during the period, and redemption on the last day of the period.
(c) Large increase due to one-off taxable stock dividends that were treated as income.
(d) Portfolio turnover rate calculated at Fund level.
The accompanying notes are an integral part of the financial statements.
15
Financial Highlights
Annual Report December 31, 2022
Baillie Gifford International All Cap Fund
Selected data for a Class 3 share outstanding throughout each year
| For the Year Ended December 31, 2022 | For the Year Ended December 31, 2021 | For the Year Ended December 31, 2020 | For the Year Ended December 31, 2019 | For the Year Ended December 31, 2018 | |||||||||||||||||||
Net asset value, beginning of year | $ | 17.08 | $ | 20.50 | $ | 15.99 | $ | 12.39 | $ | 15.01 | |||||||||||||
From Investment Operations | |||||||||||||||||||||||
Net investment income(a) | 0.12 | 0.09 | 0.07 | 0.30 | 0.16 | ||||||||||||||||||
| Net realized and unrealized gain (loss) on investments and foreign currency | (5.52 | ) | 0.59 | 5.27 | 3.75 | (2.64 | ) | ||||||||||||||||
| Net increase (decrease) in net asset value from investment operations | (5.40 | ) | 0.68 | 5.34 | 4.05 | (2.48 | ) | ||||||||||||||||
Dividends and Distributions to Shareholders | |||||||||||||||||||||||
From net investment income | — | (0.20 | ) | (0.20 | ) | (0.45 | ) | (0.14 | ) | ||||||||||||||
From net realized gain on investments | (0.27 | ) | (3.90 | ) | (0.63 | ) | — | — | |||||||||||||||
Total dividends and distributions | (0.27 | ) | (4.10 | ) | (0.83 | ) | (0.45 | ) | (0.14 | ) | |||||||||||||
Net asset value, end of year | $ | 11.41 | $ | 17.08 | $ | 20.50 | $ | 15.99 | $ | 12.39 | |||||||||||||
Total Return | |||||||||||||||||||||||
Total return based on net asset value(b) | (31.62 | )% | 3.41 | % | 33.40 | % | 32.74 | % | (16.57 | )% | |||||||||||||
Ratios/Supplemental Data | |||||||||||||||||||||||
Net assets, end of year (000's omitted) | $ | 221,064 | $ | 133,796 | $ | 331,138 | $ | 158,198 | $ | 119,176 | |||||||||||||
Ratio of net expenses to average net assets | 0.58 | % | 0.54 | % | 0.55 | % | 0.58 | % | 0.57 | % | |||||||||||||
| Ratio of net investment income to average net assets | 1.03 | % | 0.41 | % | 0.44 | % | 2.04 | %(c) | 1.09 | % | |||||||||||||
Portfolio turnover rate(d) | 19 | % | 14 | % | 12 | % | 13 | % | 15 | % | |||||||||||||
(a) Calculated based upon average shares outstanding during the year.
(b) Total investment return is calculated assuming an initial investment made at the net asset value at the beginning of the period, reinvestment of all dividends and distributions, if any, at net asset value during the period, and redemption on the last day of the period.
(c) Large increase due to one-off taxable stock dividends that were treated as income.
(d) Portfolio turnover rate calculated at Fund level.
The accompanying notes are an integral part of the financial statements.
16
Financial Highlights
Annual Report December 31, 2022
Baillie Gifford International All Cap Fund
Selected data for a Class 5 share outstanding throughout each year
| For the Year Ended December 31, 2022 | For the Year Ended December 31, 2021 | For the Year Ended December 31, 2020 | For the Period July 10, 2019 through December 31, 2019(a) | For the Period January 1, 2019 through April 10, 2019(a) | For the Period January 10, 2018(b) through December 31, 2018 | ||||||||||||||||||||||
Net asset value, beginning of period | $ | 17.53 | $ | 20.96 | $ | 16.33 | $ | 15.14 | $ | 12.64 | $ | 15.72 | |||||||||||||||
From Investment Operations | |||||||||||||||||||||||||||
Net investment income(c) | 0.12 | 0.09 | 0.09 | 0.20 | 0.06 | 0.18 | |||||||||||||||||||||
| Net realized and unrealized gain (loss) on investments and foreign currency | (5.65 | ) | 0.61 | 5.38 | 1.46 | 1.97 | (3.11 | ) | |||||||||||||||||||
| Net increase (decrease) in net asset value from investment operations | (5.53 | ) | 0.70 | 5.47 | 1.66 | 2.03 | (2.93 | ) | |||||||||||||||||||
| Dividends and Distributions to Shareholders | |||||||||||||||||||||||||||
From net investment income | — | (0.23 | ) | (0.21 | ) | (0.47 | ) | — | (0.15 | ) | |||||||||||||||||
From net realized gain on investments | (0.27 | ) | (3.90 | ) | (0.63 | ) | — | — | — | ||||||||||||||||||
Total dividends and distributions | (0.27 | ) | (4.13 | ) | (0.84 | ) | (0.47 | ) | — | (0.15 | ) | ||||||||||||||||
Net asset value, end of period | $ | 11.73 | $ | 17.53 | $ | 20.96 | $ | 16.33 | $ | 14.67 | $ | 12.64 | |||||||||||||||
Total Return | |||||||||||||||||||||||||||
| Total return based on net asset value(d) | (31.56 | )% | 3.49 | % | 33.51 | % | 10.95 | % | 16.02 | % | (18.61 | )% | |||||||||||||||
Ratios/Supplemental Data | |||||||||||||||||||||||||||
| Net assets, end of period (000's omitted) | $ | 33,119 | $ | 48,392 | $ | 60,321 | $ | 45,183 | $ | 39,464 | $ | 34,016 | |||||||||||||||
| Ratio of net expenses to average net assets | 0.49 | % | 0.46 | % | 0.47 | % | 0.50 | %* | 0.49 | %* | 0.49 | %* | |||||||||||||||
| Ratio of net investment income to average net assets | 0.91 | % | 0.43 | % | 0.51 | % | 2.66 | %(e) | 1.59 | %* | 1.21 | %* | |||||||||||||||
Portfolio turnover rate(f) | 19 | % | 14 | % | 12 | % | 13 | % | 13 | % | 15 | % | |||||||||||||||
* Annualized.
(a) Recommencement of investment operations. Class had no shareholders from April 11, 2019 to July 10, 2019. All shares of this class were redeemed on April 10, 2019 at $14.67. New shares were issued at $15.14 on July 10, 2019.
(b) Commencement of investment operations.
(c) Calculated based upon average shares outstanding during the period.
(d) Total investment return is calculated assuming an initial investment made at the net asset value at the beginning of the period, reinvestment of all dividends and distributions, if any, at net asset value during the period, and redemption on the last day of the period. Total return is not annualized for periods less than one year.
(e) Large increase due to one-off taxable stock dividends that were treated as income.
(f) Portfolio turnover rate calculated at Fund level. Portfolio turnover is not annualized for periods less than one year.
The accompanying notes are an integral part of the financial statements.
17
Notes to Financial Statements
Annual Report December 31, 2022
Note A — Organization and Accounting Policies
The Fund is a series of Baillie Gifford Funds (the "Trust"). The investment objective of the Fund is to achieve capital appreciation. For information on the specific investment strategies of the Fund and a description of each share class, please refer to the Fund's Prospectus for Private Placement ("Prospectus"). The Trust is an open-end management investment company registered under the Investment Company Act of 1940, as amended (the "1940 Act"). The Trust was organized as a Massachusetts business trust on June 21, 2000, under the laws of Massachusetts. The Trust operates pursuant to the Second Amended and Restated Agreement and Declaration of Trust dated February 27, 2017, as amended from time to time.
The Fund's Class 2, Class 3 and Class 5 share classes had shares outstanding as of December 31, 2022.
The Fund is an investment company that applies the accounting and reporting guidance issued in Topic 946 by the U.S. Financial Accounting Standards Board. The financial statements of the Fund have been prepared in conformity with generally accepted accounting principles in the United States of America ("GAAP"). Management is required to make certain estimates and assumptions that affect the reported amounts of assets and liabilities and disclosure of contingent assets and liabilities at the date of the financial statements and the reported amounts of increases and decreases in net assets from operations during the reporting period. Actual results could differ from those estimates.
The following is a summary of significant accounting policies followed by the Fund:
Valuation of Investments
On December 3, 2020, the Securities and Exchange Commission (the "SEC") adopted new rule 2a-5 ("Rule 2a-5") under the 1940 Act, addressing valuation practices and the role of the Board of Trustees of the Trust (the "Board") with respect to the fair valuation of investments of a registered investment company. Rule 2a-5 became effective on March 8, 2021, with a compliance date of September 8, 2022. The Fund has implemented Rule 2a-5 effective as of June 22, 2022, which has not had, and is not expected to have, a significant impact on the financial statements.
Investments for which there are readily available market quotations are valued at market value. Equity securities listed on a securities exchange, market or automated quotation system (including equity securities traded over the counter) for which quotations are readily available, are valued at the last quoted trade price on the primary exchange or market (foreign or domestic) on which they are most actively traded on the date of valuation (or at approximately 4:00 p.m. Eastern Time if a security's primary exchange is normally open at that time), or, if there is no such reported sale on the date of valuation, at the most recent quoted bid price.
Other securities for which current market quotations are not readily available (or for which quotations are not believed to be reliable due to market changes that occur after the most recent available quotations are obtained, or for any other reason), and all other assets, are valued at their fair value as determined in good faith by the Fund's investment adviser and valuation designee, Baillie Gifford Overseas Limited (the "Manager").
Generally, trading in foreign securities markets is substantially completed each day at various times prior to close of regular trading on the New York Stock Exchange. Occasionally, events affecting the value of equity securities of non-U.S. issuers not traded on a U.S. exchange may occur between the completion of substantial trading of such securities for the day and the close of regular trading on the New York Stock Exchange, and such events may not be reflected in the computation of the Fund's net asset value.
The Valuation Designee utilizes a third-party pricing service for all equity securities, except those traded on Canadian, Latin American, or U.S. exchanges, subject to certain minimum confidence levels, which applies a fair value adjustment that seeks to reflect changes in such securities' market prices since the close of the market on which the securities are traded. To the extent that securities are valued using this service, the securities will be classified as Level 2 securities in the fair value measurement framework described below.
Fair Value Measurement
GAAP provides guidance on fair value measurements and defines fair value as the price that the Fund would receive to sell an investment or pay to transfer a liability in a timely transaction with an independent buyer in the principal market, or in the absence of a principal market, the most
18
Notes to Financial Statements
Annual Report December 31, 2022
advantageous market for the investment or liability. It establishes a single definition of fair value, creates a three-tier hierarchy as a framework for measuring fair value based on inputs used to value the Fund's investments, and requires additional disclosure about fair value. The hierarchy of inputs is summarized below:
Level 1 — unadjusted quoted prices in active markets for identical investments which the fund has the ability to access
Level 2 — other significant observable inputs (including quoted prices for similar investments, interest rates, prepayment speeds, credit risk, etc.)
Level 3 — significant unobservable inputs (including the Trust's own assumptions in determining the fair value of investments)
For Level 1 inputs, the Fund uses unadjusted quoted prices in active markets for assets or liabilities with sufficient frequency and volume to provide pricing information as the most reliable evidence of fair value.
The Fund's Level 2 valuation techniques include inputs other than quoted prices within Level 1 that are observable for an asset or liability, either directly or indirectly. This includes when a fair value adjustment is applied which seeks to reflect changes in foreign securities' market prices since the close of the market on which they are traded. Level 2 observable inputs may include quoted prices for similar assets and liabilities in active markets or quoted prices for identical or similar assets or liabilities in markets that are not active in which there are few transactions, the prices are not current, or price quotations vary substantially over time or among market participants. Inputs that are observable for the asset or liability in Level 2 include such factors as interest rates, yield curves, prepayment speeds, credit risk, and default rates for similar liabilities.
For Level 3 valuation techniques, the Fund uses unobservable inputs that reflect assumptions market participants would be expected to use in pricing the asset or liability. Unobservable inputs are used to measure fair value to the extent that observable inputs are not available and are developed based on the best information available under the circumstances. In developing unobservable inputs, market participant assumptions are used if they are reasonably available without undue cost and effort.
The inputs or methodology used for valuing securities are not necessarily an indication of the risk associated with investing in those securities. The hierarchy classification of inputs used to value the Fund's investments at December 31, 2022 is disclosed at the end of the Fund's Portfolio of Investments.
For the year ended December 31, 2022, there were no Level 3 investments for which significant unobservable inputs were used to determine the fair value.
Foreign Currency Translation
The accounting records of the Fund are maintained in U.S. dollars. Foreign currency amounts are translated into U.S. dollars at the applicable rate of exchange to determine the value of investments, assets and liabilities. Purchases and sales of securities and income and expenses are translated at the prevailing rate of exchange on the respective dates of such transactions. The Fund does not isolate that portion of net realized and unrealized gains and losses on investments resulting from changes in foreign exchange rates from the impact arising from changes in market prices. Such fluctuations are included with net realized and unrealized gain or loss from investments.
Net realized foreign exchange gains and losses arise from sales of foreign currencies, currency gains or losses realized between the trade and settlement dates on securities transactions, and the differences between the amounts of dividends, interest, and foreign withholding taxes recorded on the Fund's books and the U.S. dollar equivalent of the amounts actually received or paid. Net unrealized foreign exchange gains and losses arise from changes in the value of assets and liabilities, other than investments in securities, resulting from changes in the exchange rates.
Securities Transactions and Investment Income
The Fund's securities transactions are recorded on the trade date. Realized gains or losses on sales of investments are determined on the basis of identified cost. Dividend income is recorded on the ex-dividend date. Non-cash income, if any, is included in investment income, with any non-cash income exceeding 5% of the Fund's total income stated separately on the Statement of Operations, and is recorded at the fair market value of securities received.
Investment income, expenses (other than those specific to a particular class of shares), and realized and unrealized gains and losses on investments are allocated to the separate classes of shares based upon their relative net asset value on the date income is earned or expensed and realized and unrealized gains and losses are incurred.
19
Notes to Financial Statements
Annual Report December 31, 2022
U.S. Federal and Other Taxes
The Fund intends to continue to qualify to be taxed as a "regulated investment company" under the provisions of the U.S. Internal Revenue Code of 1986, as amended (the "Code"), and as such will not be subject to U.S. federal income tax on income (including any net realized capital gains) which is distributed in accordance with the provisions of the Code to the Fund's shareholders. Therefore, no U.S. federal income tax provision is required.
Investment income received from investments in foreign jurisdictions may be subject to foreign withholding tax. Investment income is recorded net of any foreign withholding taxes, less any amounts reclaimable. The Fund may file withholding tax reclaims in certain jurisdictions to recover a portion of amounts previously withheld. Whenever possible, the Fund will attempt to operate so as to qualify for reduced tax rates or tax exemptions in those countries with which the United States has a tax treaty. Foreign taxes, if any, net of any reclaims, are recorded based on the tax regulations and rates that exist in the foreign markets in which the Fund invests.
As a result of several court cases in certain countries across the European Union ("EU"), the Fund may file European tax reclaims for previously withheld taxes on dividends earned in those countries. These additional filings are subject to various administrative proceedings by the local jurisdictions' tax authorities within the EU, as well as a number of related judicial proceedings. If a positive decision is reached and as such, reclaims becomes payable to the Fund, they will be reflected as windfall tax recovery within investment income in the Statement of Operations and related receivables, if any, will be reflected within tax reclaims receivable in the Statements of Assets and Liabilities. If the associated cash is received, the Fund will generally follow, for tax purposes, IRS guidance in Notice 2016-10 and reduce the current year foreign taxes paid by the amount of the refund. When uncertainty exists as to the ultimate resolution of these proceedings and the likelihood of receipt of these EU reclaims, no amounts are reflected in the financial statements.
During the year ended December 31, 2022, the Fund successfully recovered taxes withheld by Sweden and has recorded the windfall tax recovery in the Statement of Operations.
In addition to the requirements of the Code, the Fund may also be subject to capital gains tax in India and potentially other foreign jurisdictions, on gains realized upon the sale of securities in India or other such jurisdictions, payable upon repatriation of sales proceeds. Any realized losses in excess of gains in India may be carried forward to offset future gains. Funds with exposure to Indian securities and potentially other foreign jurisdictions accrue a deferred tax liability for unrealized gains in excess of available loss carryforwards based on existing tax rates and holding periods of the securities. As of December 31, 2022, the Fund recorded a deferred tax liability for potential future India capital gains taxes of $318,434.
The Fund is subject to tax accounting standards that provide guidance for how certain and uncertain tax positions should be recognized, measured, presented and disclosed in the financial statements. These standards require the evaluation of tax positions taken, or expected to be taken, in the course of preparing the Fund's tax returns to determine whether the tax positions are "more-likely-than-not" of being sustained by the applicable tax authority. Tax positions not deemed to meet the "more-likely-than-not" threshold would be recorded as a reduction in a tax benefit or expense in the current year. Management has evaluated the application of these standards and has determined no liabilities for income tax related expenses are required in the financial statements of the Fund. The previous three tax year ends remain subject to examination.
During the year ended December 31, 2022, the Fund did not utilize any capital loss carryforwards.
Realized capital losses, currency losses and passive foreign investment company ("PFIC") losses incurred after October 31 ("post-October capital/late year ordinary losses") within the taxable year are deemed to arise on the first business day of the Fund's next taxable year.
20
Notes to Financial Statements
Annual Report December 31, 2022
At December 31, 2022, the components of accumulated earnings on a tax basis were as follows:
Fund | Undistributed Net Ordinary Income | Long Term Capital Gains | Capital Loss Carryforwards | Post October Capital/ Late Year Ordinary Losses | Net Unrealized Appreciation/ Depreciation on Investments and Foreign Currencies and Foreign Tax | Total Distributable Earnings/ Accumulated Deficit | |||||||||||||||||||||
| Baillie Gifford International All Cap Fund | $ | — | $ | 4,232,703 | $ | — | $ | — | $ | 40,282,773 | $ | 44,515,476 | |||||||||||||||
The differences between the components of distributable earnings on a tax basis and the amounts reflected in the Statement of Assets and Liabilities are primarily due to the differing book/tax treatment of realized losses on wash sales and mark to market income on securities categorized as PFICs.
For the year ended December 31, 2022, the following reclassification has been made on the Statement of Assets and Liabilities as a result of current year write-off of net operating losses.
| Fund | Total Distributable Earnings | Paid-in Capital | |||||||||
Baillie Gifford International All Cap Fund | $ | 693,902 | $ | (693,902 | ) | ||||||
Dividends and Distributions to Shareholders
The Fund intends to distribute each year, as dividends, substantially all net investment income and net capital gains realized. All such dividends or distributions are credited in the form of additional shares of the Fund at net asset value on the ex-dividend date unless the shareholder elects to receive dividends and distributions in cash. Currently, the Fund's policy is to distribute net investment income and net capital gains on an annual basis. Such distributions are determined in conformity with U.S. federal income tax regulations, which may differ from GAAP.
For the years ended December 31, 2022 and December 31, 2021, the tax characters of the dividends paid were:
Fund | Ordinary Income 2022 | Long Term Capital Gains 2022 | Return of Capital 2022 | Ordinary Income 2021 | Long Term Capital Gains 2021 | Return of Capital 2021 | |||||||||||||||||||||
| Baillie Gifford International All Cap Fund | $ | — | $ | 7,166,047 | $ | — | $ | 6,821,517 | $ | 83,402,686 | $ | — | |||||||||||||||
For tax purposes, short-term capital gain distributions, if any, are considered ordinary income distributions.
The Fund's cost of investments and gross unrealized appreciation (depreciation) at December 31, 2022 for U.S. federal income tax purposes were as follows:
Fund | Cost of Investments | Gross Appreciation | Gross Depreciation | Net Appreciation | |||||||||||||||
Baillie Gifford International All Cap Fund | $ | 270,888,929 | $ | 96,771,267 | $ | (56,488,494 | ) | $ | 40,282,773 | ||||||||||
Note B — Investment Management and Other Services
The Fund is advised and managed by the Manager. The Manager, an investment adviser registered with the SEC, is a wholly owned subsidiary of Baillie Gifford & Co.
21
Notes to Financial Statements
Annual Report December 31, 2022
Under an investment advisory agreement between the Manager and the Trust on behalf of the Fund (the "Advisory Agreement"), the Fund pays the Manager an investment advisory fee, in arrears.
The advisory fee paid by the Fund under the Advisory Agreement is calculated and accrued daily on the basis of the annual rate noted below and expressed as a percentage of the Fund's average daily net assets.
Fund | Average Daily Net Assets of the Fund (billions) | Annual Rate at Each Asset Level | |||||||||
| Baillie Gifford International All Cap Fund | $0 - $2 >$2 - $5 Above $5 | 0.35% 0.31% 0.29% | |||||||||
Baillie Gifford Funds Services LLC, a wholly-owned subsidiary of the Manager, serves as the sole distributor and principal underwriter of the shares of the Fund.
The Fund has adopted a Shareholder Servicing Plan providing that the Fund may pay the Manager, or any other entity that acts from time to time as the shareholder servicing agent with respect to a class of Fund shares, for services rendered and expenses borne in connection with the provision of services provided to Fund investors and/or
the maintenance of shareholder accounts. For these services, the Fund pays the Manager a fee at the annualized rate of the Fund's average daily net assets attributed to each class of shares. The fee paid by Class 2 shares is 0.17%, Class 3 shares is 0.10%, and Class 5 shares is 0.02%.
The Bank of New York Mellon ("BNYM") serves as the Fund's administrator and custodian. BNY Mellon Investment Servicing (U.S.) Inc. serves as the Trust's transfer agent, registrar and dividend disbursing agent.
Note C — Investment Transactions
Purchases and proceeds from sales of securities (excluding short-term securities) for the year ended December 31, 2022 were as follows:
Fund | Purchases | Sales | |||||||||
Baillie Gifford International All Cap Fund | $ | 64,691,080 | $ | 67,205,307 | |||||||
Note D — Transactions in Shares of Beneficial Interest
Baillie Gifford International All Cap Fund | |||||||||||||||||||
| For the Year Ended December 31, 2022 | For the Year Ended December 31, 2021 | ||||||||||||||||||
Shares | Amount | Shares | Amount | ||||||||||||||||
Class 2 Shares | |||||||||||||||||||
Shares sold | — | $ | — | 496,825 | $ | 10,000,967 | |||||||||||||
Shares issued in reinvestment of dividends and distributions | 126,470 | 1,409,109 | 1,311,381 | 21,958,684 | |||||||||||||||
Shares redeemed | (1,368,700 | ) | (20,000,000 | ) | (4,161,237 | ) | (89,047,447 | ) | |||||||||||
Net increase (decrease) | (1,242,230 | ) | $ | (18,590,891 | ) | (2,353,031 | ) | $ | (57,087,796 | ) | |||||||||
Class 3 Shares | |||||||||||||||||||
Shares sold | 11,092,291 | (a) | $ | 144,914,059 | (a) | 283,970 | $ | 6,001,749 | |||||||||||
Shares issued in reinvestment of dividends and distributions | 443,915 | 5,024,230 | 1,522,240 | 25,864,981 | |||||||||||||||
Shares redeemed | — | — | (10,124,764 | )(b) | (222,931,390 | )(b) | |||||||||||||
Net increase (decrease) | 11,536,206 | $ | 149,938,289 | (8,318,554 | ) | $ | (191,064,660 | ) | |||||||||||
22
Notes to Financial Statements
Annual Report December 31, 2022
Baillie Gifford International All Cap Fund | |||||||||||||||||||
| For the Year Ended December 31, 2022 | For the Year Ended December 31, 2021 | ||||||||||||||||||
Shares | Amount | Shares | Amount | ||||||||||||||||
Class 4 Shares | |||||||||||||||||||
Shares sold | — | $ | — | 9,386,871 | (c) | $ | 207,931,390 | (c) | |||||||||||
Shares issued in reinvestment of dividends and distributions | — | — | 1,935,963 | 33,178,532 | |||||||||||||||
Shares redeemed | (9,968,903 | )(d) | (131,414,059 | )(d) | (1,353,931 | ) | (30,000,000 | ) | |||||||||||
Net increase (decrease) | (9,968,903 | ) | $ | (131,414,059 | ) | 9,968,903 | $ | 211,109,922 | |||||||||||
Class 5 Shares | |||||||||||||||||||
Shares sold | — | $ | — | — | $ | — | |||||||||||||
Shares issued in reinvestment of dividends and distributions | 62,979 | 732,708 | 528,748 | 9,222,325 | |||||||||||||||
Shares redeemed | — | — | (647,233 | ) | (13,700,000 | ) | |||||||||||||
Net increase (decrease) | 62,979 | $ | 732,708 | (118,485 | ) | $ | (4,477,675 | ) | |||||||||||
Total net increase (decrease) | 388,052 | $ | 666,047 | (821,167 | ) | $ | (41,520,209 | ) | |||||||||||
(a) 10,055,711 shares and $131,414,059 converted into Class 3 from Class 4.
(b) 9,465,194 shares and $207,931,390 converted from Class 3 into Class 4.
(c) 9,386,871 shares and $207,931,390 converted into Class 4 from Class 3.
(d) 9,968,903 shares and $131,414,059 converted from Class 4 into Class 3.
Note E — Beneficial Ownership
Beneficial ownership, either direct or indirect, of more than 25% of the voting securities of the Fund creates a presumption of control under Section 2(a)(9) of the 1940 Act.
As of December 31, 2022, the Fund had two shareholders which beneficially owned 25% or more of the Fund's voting securities. Purchase and redemption activity of these accounts may have a significant effect on the operation of the Fund.
Note F — Commitments and Contingencies
The Fund indemnifies the Trust's officers and Trustees for certain liabilities that might arise from the performance of their duties to the Fund. Additionally, in the normal course of business, the Fund enters into contracts that contain a variety of representations and warranties and which provide general indemnifications.
The Fund's maximum exposure under these arrangements is unknown, as this would involve future claims that may be made against the Fund that have not yet occurred. However, based on experience, the Fund expects the risk of loss to be remote.
Note G — Line of Credit
The Trust entered into a committed facility with BNYM on May 1, 2017, most recently renewed April 19, 2022 and expiring April 18, 2023 (unless renewed), which allows certain series of the Trust to borrow up to $75 million in total subject to minimum asset coverage requirements set out in the Credit Agreement. Each such series may borrow money under this credit facility for the temporary funding of shareholder redemptions or for other temporary or emergency purposes.
In normal market conditions, borrowings are charged an interest rate of 1.25% per annum plus the greater of the Federal Funds Effective Rate or the Secured Overnight Financing Rate + 0.10%. Prior to April 19, 2022, the rate used was the greater of the Federal Funds Effective Rate or the one-month U.S. LIBOR Rate.
23
Notes to Financial Statements
Annual Report December 31, 2022
The Fund pays a share of a commitment fee on the portion of the facility which is undrawn. The commitment fee is 0.25% on undrawn amounts.
The rate payable at December 31, 2022 was 5.65% on any amount drawn down. There were no borrowings made against the credit facility during the period.
Note H — Principal Risks (unaudited)
The below is a selection of the Fund's principal risks. Additional risks of investing in the Fund are included in the Fund's Prospectus.
Investment Style Risk
The Manager actively makes investment decisions for the Fund through bottom-up stock selection. Accordingly, the Fund will have risk characteristics that differ from its benchmark index. The Manager's judgments about the attractiveness, relative value, or potential appreciation of a particular stock may prove to be incorrect and cause the Fund to lose money or underperform compared to its benchmark index. There can be no assurance that the Manager's investment decisions will produce the desired results.
Growth Stock Risk
The prices of growth stocks may be based largely on expectations of future earnings, and their prices can decline rapidly and significantly in reaction to negative news. Growth stocks may underperform stocks in other broad style categories (and the stock market as a whole) over any period of time and may shift in and out of favor with investors generally, sometimes rapidly, depending on changes in market, economic, and other factors.
Long-Term Investment Strategy Risk
The Fund pursues a long-term investment approach, typically seeking returns over a period of several years. This investment style may cause the Fund to lose money or underperform compared to its benchmark index or other mutual funds over extended periods of time, and the Fund
may not perform as expected in the long term. An investment in the Fund may be more suitable for long-term investors who can bear the risk of short- or medium-term fluctuations in the value of the Fund's portfolio.
Non-U.S. Investment Risk
Non-U.S. securities are subject to additional risks, including less liquidity, increased volatility, less transparency, withholding or other taxes, increased vulnerability to adverse changes in local and global economic conditions, less regulation, and possible fluctuation in value due to adverse political conditions. Foreign portfolio transactions generally involve higher commission rates, transfer taxes, and custodial costs than similar transactions in the U.S.
Asia Risk
Investing in securities of companies located in or with exposure to Asian countries involves certain risks and considerations not typically associated with investing in securities of U.S. issuers, including different financial reporting standards, currency exchange rate fluctuations, and highly regulated markets with the potential for government interference. The economies of many Asian countries are heavily dependent on international trade and on only a few industries or commodities and, as a result, can be adversely affected by trade barriers, exchange controls and other measures imposed or negotiated by the countries with which they trade. Some Asian securities may be less liquid than U.S. or other foreign securities.
Market Disruption and Geopolitical Risk
Geopolitical, environmental and other events may disrupt securities markets and adversely affect global economies and markets. These disruptions could prevent the Fund from implementing its investment strategies and achieving its investment objectives, and increase the Fund's exposure to the other risks detailed in the Prospectus. Given the increasing interdependence among global economies and markets, conditions in one country, market, or region might adversely affect markets, issuers, and/or foreign exchange rates in other countries, including the U.S.
24
Notes to Financial Statements
Annual Report December 31, 2022
War, terrorism, public health crises, and other geopolitical events, such as sanctions, tariffs, trade disputes, the imposition of exchange controls or other cross-border trade barriers, have led, and in the future may lead, to increased short-term market volatility and may have adverse long-term effects on U.S. and world economies and markets generally. For instance, the 2022 Russian invasion of Ukraine and the sanctions that followed had immediate negative effects on global financial markets, sovereign debt and the markets for certain securities and commodities, such as oil and natural gas, and reduced the liquidity and value of Russian securities to zero or near zero. Similarly, terrorism in the U.S. and around the world has resulted in increased geopolitical risk.
Natural and environmental disasters, such as earthquakes and tsunamis, can be highly disruptive to economies and markets, adversely impacting individual companies and industries, securities markets, interest rates, credit ratings, inflation, investor sentiment, and other factors affecting the value of the Fund's investments. Similarly, dramatic disruptions can be caused by communicable diseases, epidemics, pandemics, plagues and other public health crises.
An outbreak of a respiratory disease caused by COVID-19, first detected in China in December 2019, has resulted in a global pandemic and major disruptions to economies and markets around the world, including the United States. Financial markets experienced and may continue to experience extreme volatility and severe losses, and trading in many instruments was and may continue to be disrupted as a result.
For further information on the risks of investing in the Fund, please refer to the Prospectus.
Note I — Legal Notice (unaudited)
MSCI
The MSCI information may only be used for your internal use, may not be reproduced or re-disseminated in any form and may not be used as a basis for or a component of any financial instruments or products or indices. None of the MSCI information is intended to constitute investment advice or a recommendation to make (or refrain from making) any kind of investment decision and may not be relied on as such. Historical data and analysis should not
be taken as an indication or guarantee of any future performance analysis, forecast or prediction. The MSCI information is provided on an "as is" basis and the user of this information assumes the entire risk of any use made of this information. MSCI, each of its affiliates and each other person involved in or related to compiling, computing or creating any MSCI information (collectively, the "MSCI Parties") expressly disclaims all warranties (including, without limitation, any warranties of originality, accuracy, completeness, timeliness, non-infringement, merchantability and fitness for a particular purpose) with respect to this information.
Without limiting any of the foregoing, in no event shall any MSCI Party have any liability for any direct, indirect, special, incidental, punitive, consequential (including, without limitation, lost profits) or any other damages. (www.msci.com)
Note J — Liquidity Risk Management Program (unaudited)
In accordance with Rule 22e-4 (the "Liquidity Rule") under the 1940 Act, the Fund has adopted and implemented a liquidity risk management program (the "Program"). The purpose of the Program is to outline the techniques, tools and arrangements employed for the management of liquidity risk within the Fund, and the terms, contents and frequency of reporting and escalation of any issues to the Board. Liquidity is managed taking into account of the investment strategy, liquidity profile, and redemption policy and history of the Fund, with the objective of maintaining a level of liquidity that is appropriate in light of the Fund's obligations to its shareholders. The Program assesses liquidity risk under both normal and stressed market conditions.
During the reporting period, the Fund maintained a high level of liquidity and primarily held assets that are defined under the Liquidity Rule as "Highly Liquid Investments". A Highly Liquid Investment is defined as cash and any investment reasonably expected to be convertible to cash in current market conditions in three business days or less without the conversion to cash significantly changing the market value of the investment. As a result of the high level of liquidity maintained by the Fund, the Fund has not adopted a "Highly Liquid Investment Minimum", as defined under the Liquidity Rule.
25
Notes to Financial Statements
Annual Report December 31, 2022
During the reporting period, there were no liquidity events that materially affected the performance of the Fund or its ability to timely meet redemptions without dilution to existing shareholders. The Manager, which has been designated by the Board to administer the Program, determined that, during the reporting period, the Program operated adequately and effectively to manage the Fund's liquidity risk. There can be no assurance that the Program will achieve its objectives in the future. Further information on liquidity risks applicable to the Fund can be found in the Fund's Prospectus.
Note K — Subsequent Events
Events or transactions that occur after the financial statement date but before the financial statements are issued are categorized as recognized or non-recognized for financial statement purposes.
There were no subsequent events identified between December 31, 2022 and the issuance of the Financial Statements.
26
Report of Independent Registered Public Accounting Firm
Annual Report December 31, 2022
To the Shareholders of Baillie Gifford International All Cap Fund and
Board of Trustees of Baillie Gifford Funds
Opinion on the Financial Statements
We have audited the accompanying statement of assets and liabilities, including the portfolio of investments, of Baillie Gifford International All Cap Fund (the "Fund"), a series of Baillie Gifford Funds, as of December 31, 2022, the related statement of operations for the year then ended, the statements of changes in net assets for each of the two years in the period then ended, the related notes, and the financial highlights for each of the five years in the period then ended (collectively referred to as the "financial statements"). In our opinion, the financial statements present fairly, in all material respects, the financial position of the Fund as of December 31, 2022, the results of its operations for the year then ended, the changes in net assets for each of the two years in the period then ended, and the financial highlights for each of the five years in the period then ended, in conformity with accounting principles generally accepted in the United States of America.
Basis for Opinion
These financial statements are the responsibility of the Fund's management. Our responsibility is to express an opinion on the Fund's financial statements based on our audits. We are a public accounting firm registered with the Public Company Accounting Oversight Board (United States) ("PCAOB") and are required to be independent with respect to the Fund in accordance with the U.S. federal securities laws and the applicable rules and regulations of the Securities and Exchange Commission and the PCAOB.
We conducted our audits in accordance with the standards of the PCAOB. Those standards require that we plan and perform the audit to obtain reasonable assurance about whether the financial statements are free of material misstatement whether due to error or fraud.
Our audits included performing procedures to assess the risks of material misstatement of the financial statements, whether due to error or fraud, and performing procedures that respond to those risks. Such procedures included examining, on a test basis, evidence regarding the amounts and disclosures in the financial statements. Our procedures included confirmation of securities owned as of December 31, 2022, by correspondence with the custodian and brokers. Our audits also included evaluating the accounting principles used and significant estimates made by management, as well as evaluating the overall presentation of the financial statements. We believe that our audits provide a reasonable basis for our opinion.
We have served as the Fund's auditor since 2017.

COHEN & COMPANY, LTD.
Milwaukee, Wisconsin
February 28, 2023
27
Supplemental Information (unaudited)
Annual Report December 31, 2022
Federal Income Tax Information
The Fund intends to designate the maximum amount of dividends that qualify for the reduced tax rate pursuant to the Jobs and Growth Tax Relief Reconciliation Act of 2003 for the year ended December 31, 2022.
Fund | Qualified Dividend Income | ||||||
Baillie Gifford International All Cap Fund | 100.00 | % | |||||
For corporate shareholders, the percentage of ordinary income distributions for the year ended December 31, 2022 for the corporate dividends-received deduction is:
Fund | Dividends-received Deductions | ||||||
Baillie Gifford International All Cap Fund | 0.00 | % | |||||
In February 2023, certain U.S. shareholders will be advised on IRS Form 1099 DIV or substitute 1099 DIV as to the U.S. federal tax status of the distributions received in the calendar year 2022.
Foreign Taxes Paid — The Fund elects under the Code Section 853 to pass through foreign taxes paid to its shareholders. The total amounts of foreign taxes passed through to shareholders on a per share basis for the year ended December 31, 2022, are as follows:
Fund | Foreign Taxes Per Share | Foreign Income Per Share | |||||||||
Baillie Gifford International All Cap Fund | 0.0199 | 0.1904 | |||||||||
28
Supplemental Information (unaudited)
Annual Report December 31, 2022
Management of the Trust
The following tables set forth the Trustees and officers of the Trust, their principal occupations during the past five years, and certain other information as of December 31, 2022.
Name and Year of Birth | Position(s) Held with Trust | Length of Time Served as Trustee(1) | Principal Occupation and Other Directorships Held During Past 5 Years(2) | Number of Funds in Fund Complex overseen by Trustee(3) | |||||||||||||||
Indepedent Trustees | |||||||||||||||||||
| Howard W. Chin 1952 | Trustee, Chair of the Nominating and Governance Committee | Since 2015 | Retired. Formerly: Managing Director, Investments, Guardian Life Insurance (financial services). | 17 | |||||||||||||||
| Pamela M.J. Cox 1952 | Trustee | Since 2017 | Retired. Formerly: Senior Associate (nonresident), CSIS (think-tank); Senior Vice President; Vice President East Asia, World Bank Group (international bank & financial services). | 17 | |||||||||||||||
| Robert E. Rigsby 1949 | Trustee, Chair of the Audit Oversight Committee | Since 2014 | Retired. Formerly: President & COO, Delivery Business at Dominion Energy, Inc. (electric and gas energy company). | 17 | |||||||||||||||
| Donald P. Sullivan Jr. 1954 | Trustee | Since 2020 | Retired. Formerly: Senior Vice President, Agency Distribution, Guardian Life Insurance (financial services). | 17 | |||||||||||||||
Interested Trustee (as defined in the 1940 Act)(4) | |||||||||||||||||||
| David Salter(5) 1975 | Trustee, Chair of the Board, and President | Since 2016 (Previously Vice President since 2014) | Partner, Baillie Gifford & Co. (parent of investment adviser); CEO & Chair, Baillie Gifford Funds Services LLC (broker-dealer). | 17 | |||||||||||||||
Name and Year of Birth | Position(s) Held with Trust | Length of Time Served(1) | Principal Occupation During Past 5 Years(2) | ||||||||||||
Officers (other than officers who are also Trustees)(4) | |||||||||||||||
| Andrew Telfer 1967 | Vice President | Since 2008 | Managing Partner, Baillie Gifford & Co. (parent of investment adviser). | ||||||||||||
| Michael Stirling-Aird 1977 | Vice President | Since 2012 | Partner; Baillie Gifford & Co. (parent of investment adviser) | ||||||||||||
| Julie Paul 1975 | Vice President | Since 2012 | Manager, North American Funds Operations Department, Baillie Gifford & Co. (parent of investment adviser). | ||||||||||||
| Tim Campbell 1975 | Vice President | Since 2014 | Partner, Baillie Gifford & Co. (parent of investment adviser); Manager, Baillie Gifford International LLC with oversight of marketing performed in North America. | ||||||||||||
29
Supplemental Information (unaudited)
Annual Report December 31, 2022
Name and Year of Birth | Position(s) Held with Trust | Length of Time Served(1) | Principal Occupation During Past 5 Years(2) | ||||||||||||
Officers (other than officers who are also Trustees) | |||||||||||||||
| Lindsay Cockburn 1978 | Treasurer | Since 2015 | Manager, North American Funds Operations Department, Baillie Gifford & Co. (parent of investment adviser). | ||||||||||||
| Gareth Griffiths 1973 | Secretary and Chief Legal Officer | Secretary since 2015; Chief Legal Officer since 2017 | Senior Legal Counsel for Baillie Gifford & Co. (parent of investment adviser). | ||||||||||||
| Graham Laybourn 1966 | Vice President | Since 2018 | Partner, Baillie Gifford & Co. (parent of investment adviser). | ||||||||||||
| Suzanne Quinn 1979 | Chief Compliance Officer and AML Compliance Officer | Since 2018 | Manager, Compliance Department, Baillie Gifford & Co. (parent of investment adviser). | ||||||||||||
| Lesley-Anne Archibald 1988 | Vice President | Since 2017 | Manager, North American Funds Operations Department, Baillie Gifford & Co. (parent of investment adviser). | ||||||||||||
| Kelly Cameron 1989 | Vice President | Since 2020 | Client Service Director, Baillie Gifford Overseas Limited (investment adviser). | ||||||||||||
| Neil Riddell 1988 | Chief Risk Officer | Since 2021 | Head of Group Risk, Baillie Gifford & Co. (parent of investment adviser). | ||||||||||||
The address of each Trustee of the Trust is c/o Ropes & Gray LLP, Prudential Tower, 800 Boylston Street, Boston, MA, 02199. The address of each officer of the Trust is c/o Baillie Gifford Funds, Calton Square, 1 Greenside Row, Edinburgh, Scotland EH1 3AN.
(1) There is no stated term of office for the Trustees and a Trustee may serve until such Trustee reaches the age of 75 years. The Chair of the Board and officers of the Trust, including the President of the Trust, are elected annually by the Board.
(2) Previous positions during the past five years with Baillie Gifford & Co., the Manager, and Baillie Gifford Group are omitted if not materially different from the positions listed.
(3) The number of Funds in the Fund complex overseen by the Trustee includes a series of the Trust not included in this shareholder report hereof.
(4) The Trust pays no compensation to its officers or interested Trustee.
(5) David Salter is an "interested person" (as defined in the 1940 Act) of the Trust or the Manager due to his positions with the Manager and his role as an officer of the Trust.
Additional information regarding the Trustees is in the Fund's Statement of Additional Information and is available upon request, without charge, by calling the Manager at +44-131-275-2000. Shareholders may submit to the Trust claims for reimbursement of telephone charges incurred in placing such calls.
A description of the Fund's proxy voting policies and procedures related to portfolio securities is available without charge, upon request, by calling the Manager at +44-131-275-2000 or on the SEC's website at http://www.sec.gov. Shareholders may submit to the Trust claims for reimbursement of telephone charges incurred in placing such calls.
Information regarding how the Fund voted proxies relating to portfolio securities during the most recent 12-month period ended June 30 is also available without charge upon request by calling the Manager at +44-131-275-2000 or by accessing the Fund's Form N-PX on the SEC's website at http://www.sec.gov. Shareholders may submit to the Trust claims for reimbursement of telephone charges incurred in placing such calls.
The Fund files its complete schedule of portfolio holdings with the SEC for the first and third quarters of each fiscal year as an exhibit to its Form N-PORT. The Fund's Form N-PORT is available on the SEC's website at http://www.sec.gov.
30

Copyright © Baillie Gifford & Co. 2023.
| (b) | Not applicable |
Item 2. Code of Ethics.
| (a) | The registrant, as of the end of the period covered by this report, has adopted a code of ethics that applies to the registrant’s principal executive officer, principal financial officer, principal accounting officer or controller, or persons performing similar functions, regardless of whether these individuals are employed by the registrant or a third party. |
| (b) | Not applicable. |
| (c) | There have been no amendments, during the period covered by this report, to a provision of the code of ethics that applies to the registrant’s principal executive officer, principal financial officer, principal accounting officer or controller, or persons performing similar functions, regardless of whether these individuals are employed by the registrant or a third party, and that relates to any element of the code of ethics description. |
| (d) | The registrant has not granted any waivers, including an implicit waiver, from a provision of the code of ethics that applies to the registrant’s principal executive officer, principal financial officer, principal accounting officer or controller, or persons performing similar functions, regardless of whether these individuals are employed by the registrant or a third party, that relates to one or more of the items set forth in paragraph (b) of this item’s instructions. |
| (e) | Not applicable. |
| (f) | The registrant’s Code of Ethics is attached hereto as an exhibit. |
Item 3. Audit Committee Financial Expert.
As of the end of the period covered by the report, the registrant’s Board of Trustees has determined that Mr. Robert E. Rigsby, is qualified to serve as an audit committee financial expert serving on its audit oversight committee and that he is “independent,” as defined by Item 3 of Form N-CSR.
Item 4. Principal Accountant Fees and Services.
Audit Fees
| (a) | The aggregate fees billed for each of the last two fiscal years for professional services rendered by the principal accountant for the audit of the registrant's annual financial statements or services that are normally provided by the accountant in connection with statutory and regulatory filings or engagements for those fiscal years are $368,500 for 2022 and $362,518 for 2021. |
Audit-Related Fees
| (b) | The aggregate fees billed in each of the last two fiscal years for assurance and related services by the principal accountant that are reasonably related to the performance of the audit of the registrant's financial statements and are not reported under paragraph (a) of this Item are $26,165 for 2022 and $0 for 2021. |
The fees disclosed above relate to out of pocket expenses incurred in relation to attendance at the Audit Oversight Committee meetings.
Tax Fees
| (c) | The aggregate fees billed in each of the last two fiscal years for professional services rendered by the principal accountant for tax compliance, tax advice, and tax planning are $110,330 for 2022 and $110,210 for 2021. These services are related to the review of federal and state income tax returns, excise tax returns, and the review of the distribution requirements for excise tax purposes. |
All Other Fees
| (d) | The aggregate fees billed in each of the last two fiscal years for products and services provided by the principal accountant, other than the services reported in paragraphs (a) through (c) of this Item are $9,781 for 2022 and $0 for 2021. |
The fees disclosed above relate to services provided by the registrant’s accountant to the registrant’s investment adviser with regards to the reorganization of Baillie Gifford Positive Change Equities Fund into Vanguard Baillie Gifford Global Positive Impact Stock Fund.
| (e)(1) | In order for the Trust’s accountant to remain independent, the following engagements must be approved in advance by the Trust’s Audit Oversight Committee or pursuant to the Pre-Approval Policies and Procedures for Audit and Non-Audit Services, as adopted by the Trust’s Audit Oversight Committee: |
| (a) | any engagement of the accountant to provide audit services or non-audit services to the Trust; and |
| (b) | any engagement of the accountant to provide non-audit services to the Trust’s investment adviser, or any entity controlling, controlled by or under common control with the investment adviser that provides ongoing services to the Trust (“Service Providers”), if the engagement relates directly to the operations and financial reporting of the Trust. |
| (e)(2) | No services included in (b)-(d) above were approved by the audit committee pursuant to paragraph (c)(7)(i)(C) of Rule 2-01 of Regulation S-X. |
| (f) | Not applicable. |
| (g) | The aggregate non-audit fees billed by the registrant's accountant for services rendered to the registrant, and rendered to the registrant's investment adviser (not including any sub-adviser whose role is primarily portfolio management and is subcontracted with or overseen by another investment adviser), and any entity controlling, controlled by, or under common control with the adviser that provides ongoing services to the registrant for each of the last two fiscal years of the registrant was $15,900 for 2022 and $6,280 for 2021. |
The fees disclosed above relate to ad-hoc tax advice provided by the registrant’s accountant to the registrant’s investment adviser and out of pocket expenses in relation to the non-audit services provided.
| (h) | Not applicable. |
| (i) | Not applicable. |
| (j) | Not applicable. |
Item 5. Audit Committee of Listed Registrants.
Not applicable.
Item 6. Investments.
| (a) | Schedule of Investments in securities of unaffiliated issuers as of the close of the reporting period is included as part of the report to shareholders filed under Item 1(a) of this form. |
| (b) | In accordance with Section 13(c) of the Investment Company Act of 1940, the registrant has divested itself of the following securities since the filing of its last report or Form N-CSR. |
Baillie Gifford Developed EAFE All Cap Fund
| Name of Issuer | Exchange Ticker Symbol | Security Identifier (CUSIP number/ISIN) | Total Number of Shares Divested | Date Securities were Divested | Amount Held on Filing Date | Statute | ||||||||||
| Atlas Copco AB –A Shares | ATCO A | SE0017486889 | 69,015
55,175
69,759
50,699
48,896 | 09/01/2022 10/12/2022 11/07/2022 12/01/2022 12/16/2022 | 1,558,939 | Sudan Accountability and Divestment Act of 2007 | ||||||||||
Baillie Gifford EAFE Plus All Cap Fund
| Name of Issuer | Exchange Ticker Symbol | Security Identifier (CUSIP number/ISIN) | Total Number of Shares Divested | Date Securities were Divested | Amount Held on Filing Date | Statute | ||||||||||
| Atlas Copco AB – B Shares | ATCO B | SE0017486897 | 32,461 | 11/23/2022 | 342,292 | Sudan Accountability and Divestment Act of 2007 | ||||||||||
Baillie Gifford International All Cap Fund
| Name of Issuer | Exchange Ticker Symbol | Security Identifier (CUSIP number/ISIN) | Total Number of Shares Divested | Date Securities were Divested | Amount Held on Filing Date | Statute | ||||||||
| Atlas Copco AB – B Shares | ATCO B | SE0017486897 | 14,724 | 12/22/2022 | 619,960 | Sudan Accountability and Divestment Act of 2007 | ||||||||
Baillie Gifford International Alpha Fund
| Name of Issuer | Exchange Ticker Symbol | Security Identifier (CUSIP number/ISIN) | Total Number of Shares Divested | Date Securities were Divested | Amount Held on Filing Date | Statute | ||||||||||
| Atlas Copco AB – B Shares | ATCO B | SE0017486897 | 170,808
109,688
57,601
125,581
121,037
177,984
120,009
136,308
128,359 | 07/29/2022 08/09/2022 08/10/2022 08/19/2022 10/26/2022 11/11/2022 11/15/2022 11/17/2022 12/09/2022 | 4,245,510 | Sudan Accountability and Divestment Act of 2007 | ||||||||||
Baillie Gifford International Concentrated Growth Equities Fund
| Name of Issuer | Exchange Ticker Symbol | Security Identifier (CUSIP number/ISIN) | Total Number of Shares Divested | Date Securities were Divested | Amount Held on Filing Date | Statute | ||||||||||
| Atlas Copco AB – B Shares | ATCO B | SE0017486897 | 4,971
2,705
2,318
1,654
4,696 | 07/01/2022 07/14/2022 07/20/2022 12/21/2022 12/30/2022 | 112,290 | Sudan Accountability and Divestment Act of 2007 | ||||||||||
Item 7. Disclosure of Proxy Voting Policies and Procedures for Closed-End Management Investment Companies.
Not applicable.
Item 8. Portfolio Managers of Closed-End Management Investment Companies.
Not applicable.
Item 9. Purchases of Equity Securities by Closed-End Management Investment Company and Affiliated Purchasers.
Not applicable.
Item 10. Submission of Matters to a Vote of Security Holders.
Not applicable.
Item 11. Controls and Procedures.
| (a) | The registrant’s principal executive and principal financial officers, or persons performing similar functions, have concluded that the registrant’s disclosure controls and procedures (as defined in Rule 30a-3(c) under the Investment Company Act of 1940, as amended (the “1940 Act”) (17 CFR 270.30a-3(c))) are effective, as of a date within 90 days of the filing date of the report that includes the disclosure required by this paragraph, based on their evaluation of these controls and procedures required by Rule 30a-3(b) under the 1940 Act (17 CFR 270.30a-3(b)) and Rules 13a-15(b) or 15d-15(b) under the Securities Exchange Act of 1934, as amended (17 CFR 240.13a-15(b) or 240.15d-15(b)). |
| (b) | There were no changes in the registrant’s internal control over financial reporting (as defined in Rule 30a-3(d) under the 1940 Act (17 CFR 270.30a-3(d))) that occurred during the period covered by this report that has materially affected, or is reasonably likely to materially affect, the registrant’s internal control over financial reporting. |
Item 12. Disclosure of Securities Lending Activities for Closed-End Management Investment Companies.
Not applicable.
Item 13. Exhibits.
| (a)(1) | Code of ethics, or any amendment thereto, that is the subject of disclosure required by Item 2 is attached hereto. |
| (a)(2) | Certifications pursuant to Rule 30a-2(a) under the 1940 Act and Section 302 of the Sarbanes-Oxley Act of 2002 are attached hereto. |
There was no change in the Registrant’s independent public accountant during the period covered by the report.
| (b) | Certifications pursuant to Rule 30a-2(b) under the 1940 Act and Section 906 of the Sarbanes- Oxley Act of 2002 are attached hereto. |
SIGNATURES
Pursuant to the requirements of the Securities Exchange Act of 1934 and the Investment Company Act of 1940, the registrant has duly caused this report to be signed on its behalf by the undersigned, thereunto duly authorized.
(Registrant): Baillie Gifford Funds
Date: March 2, 2023
Pursuant to the requirements of the Securities Exchange Act of 1934 and the Investment Company Act of 1940, this report has been signed below by the following persons on behalf of the registrant and in the capacities and on the dates indicated.
| By (Signature and Title)* | /s/ David Salter, President | |
| David Salter, President | ||
| (principal executive officer) |
Date: March 2, 2023
| By (Signature and Title)* | /s/ Lindsay Cockburn, Treasurer | |
| Lindsay Cockburn, Treasurer | ||
| (principal financial officer) |
Date: March 2, 2023
* Print the name and title of each signing officer under his or her signature.