Item 1: Report to Shareholders| International Equity Index Fund | April 30, 2005 |
The views and opinions in this report were current as of April 30, 2005. They are not guarantees of performance or investment results and should not be taken as investment advice. Investment decisions reflect a variety of factors, and the managers reserve the right to change their views about individual stocks, sectors, and the markets at any time. As a result, the views expressed should not be relied upon as a forecast of the fund’s future investment intent. The report is certified under the Sarbanes-Oxley Act of 2002, which requires mutual funds and other public companies to affirm that, to the best of their knowledge, the information in their financial reports is fairly and accurately stated in all material respects.
REPORTS ON THE WEB
Sign up for our E-mail Program, and you can begin to receive updated fund reports and prospectuses online rather than through the mail. Log in to your account at troweprice.com for more information.
Fellow Shareholders
International stocks outpaced U.S. equities over the 6- and 12-month periods ended April 30, 2005. Performance was strong despite a pull-back during the past two months as rising oil prices and interest rates led to caution among investors. European stocks did well in both periods. Japan’s results were respectable in the six-month period but lackluster for the entire year.
The fund returned 8.88% over the six months ended April 30, 2005, versus 9.12% for its benchmark index. Fund results relative to the benchmark primarily reflect the fund’s operating and management expenses and technical factors as we approached full replication of the underlying index. The fund seeks to match the performance of the FTSE Developed ex North America Index, a broadly diversified stock market index based on the investable market capitalization of more than 1,000 predominantly larger companies listed in 21 countries (the index’s performance reflects no operational costs or management fees). The index’s major markets include the U.K., Japan, and developed countries in Europe and the Pacific Rim. It is constructed by selecting the countries it covers, sorting the market in each country by industry groups, and targeting a significant portion of the stocks in these groups for inclusion. The fund attempts to replicate the index by i nvesting in the stocks included in the index in proportion to their weighting.
| Periods Ended 4/30/05 | 6 Months | 12 Months |
| International Equity Index Fund | 8.88% | 15.66% |
| FTSE Developed ex | | |
| North America Index | 9.12 | 15.77 |
| Please see the fund’s quarter-end returns following this letter. |
At the end of April, Europe represented 69.4% of net assets, with Japan and the Pacific Rim representing the balance. The U.K. was the largest country allocation at 24.3%, followed closely by Japan at 20.5% . Financial stocks were the largest sector weighting at 27.6% of assets, followed by consumer discretionary stocks (10.9%), industrials and business services (8.8%), energy and consumer staples (8.0%), health care (7.5%), telecommunication services (7.2%), materials (6.7%), information technology and utilities (5.1%), and trusts (5.0%) .
MARKET REVIEW
Despite weakness in March and April, international stocks performed solidly during the past six months. Higher oil prices, fears of global inflation, and rising bond yields triggered the late-period sell-off. Since your fund invests only in the developed international markets, performance was not affected by the slide in emerging markets, which suffered most during the correction as risk-averse investors redirected their assets to less volatile regions.
Among the developed markets in which we invest, Japan lagged once again because of the strong yen and a pause in the country’s economic recovery. Japan’s economy remains dependent on global consumers as domestic demand is still fragile. Europe started the year with a relatively upbeat economic outlook, but as the quarter progressed, the prospects began to dim with poor German unemployment data and weak consumer confidence numbers in France. However, European markets performed solidly given the benign economic data. Among the top-performing markets in this region were the U.K., Switzerland, and Italy.
| Six Months | Local | Local Currency | U.S. |
| Ended 4/30/05 | Currency | vs. U.S. Dollars | Dollars |
| France | 5.97% | 1.49% | 7.55% |
| Germany | 5.75 | 1.49 | 7.32 |
| Hong Kong | 11.63 | -0.16 | 11.45 |
| Italy | 10.77 | 1.49 | 12.42 |
| Japan | 3.61 | 1.22 | 4.87 |
| Mexico | 6.78 | 4.00 | 11.06 |
| Netherlands | 7.52 | 1.49 | 9.11 |
| Singapore | 6.70 | 1.88 | 8.70 |
| Sweden | 10.21 | -0.16 | 10.03 |
| Switzerland | 11.11 | 0.92 | 12.13 |
| United Kingdom | 5.77 | 4.24 | 10.25 |
| Source: RIMES Online, using MSCI indices. | |
Energy and consumer staples performed well, as higher oil prices and improved investor sentiment drove energy stocks, while food and tobacco stocks influenced the consumer staples segment’s particularly strong performance. Pharmaceuticals were a particularly bright spot over the period, but the information technology (IT) sector was a major disappointment, largely due to weakness in the semiconductor and Internet industries. Poor global demand, input prices, and falling capacity utilization in the semiconductor industry were primarily responsible for poor results in the group.
The performance of the dollar has had less impact over the last six months compared with the previous six-month period. The dollar was slightly weaker against all major currencies, but it strengthened over the past month and should continue on this path in the near future.
PORTFOLIO HIGHLIGHTS
The portfolio’s three top contributors to performance during the past six months were U.K. pharmaceutical GlaxoSmithKline, France’s Sanofi-Aventis, and Switzerland’s pharmaceutical giant Roche Holding. GlaxoSmithKline posted quarterly earnings that were ahead of consensus expectations because of the company’s cost controls. While revenue growth fell a bit short of the mark, recent prescription data show a clear acceleration in U.S. growth for key products. Performance for Sanofi-Aventis was enhanced by strong earnings, a positive outlook for products in the company’s pipeline, and a favorable legal decision regarding its anti-stroke drug Plavix. The third stock mentioned above, Roche Holding, also benefited from favorable developments in the health care sector. Roche reported better than expected first-quarter pharmaceutical sales thanks to robust demand for flu drug Tamiflu. (Please refer to our detailed list of holdings and the amount each represents of the portfolio.)
| GEOGRAPHIC DIVERSIFICATION |
| | Percent of Net Assets |
| Periods Ended | 10/31/04 | 4/30/05 |
| Europe | 68.6% | 69.4% |
| Japan | 20.8 | 20.5 |
| Pacific Rim | 9.3 | 9.5 |
| Other and Reserves | 1.3 | 0.6 |
| Total | 100.0% | 100.0% |
Among the fund’s worst laggards was Ireland’s Elan, which suspended the marketing of Tysabri, the company’s potentially multibillion-dollar multiple sclerosis drug, in February. The drug was linked to a rare, sometimes fatal disease that affects the central nervous system. The condition was confirmed in two patients who used the medication for two years, and a third case was confirmed in March, sending the shares down further. Another stock that hindered results in the European region was French communications giant Alcatel.
Bright spots in Japan included Mizuho Financial Group, Japan Tobacco, Canon, and Mitsubishi. However, Japan’s automotive powerhouses Toyota Motor and Nissan Motor, as well as wireless telecom provider NTT DoCoMo, detracted from performance. Australia reported strong results, with BHP Billiton once again contributing nicely over the period. In other areas of the Pacific, Hutchison Whampoa and China Mobile did well, while Singapore’s DBS Group hindered returns.
Most sectors delivered positive results during the period. As the largest sector weighting in the benchmark index and the portfolio, financials as a group contributed the most to results. Swiss banks and capital markets majors Credit Suisse Group and UBS were the biggest contributors in the sector; during the past three months the companies reaped the rewards of significant cash flows into their private banking divisions. Commercial banks performed well with Commonwealth Bank of Australia and Mizuho Financial Group among the top performers in the industry. Other contributing banks included the U.K.’s HBOS and Japan’s UFJ Holdings. The pharmaceuticals industry was certainly a highlight during the period, as the three top performers in the portfolio (mentioned earlier) were all pharmaceutical companies. Energy was another sterling sector, as oil giants BP and Shell T&T/Royal Dutch, which benefited overall from strong demand fueling persistently high oil prices, were leaders within the group. Among the highlights in the consumer staples sector was Switzerland’s food product giant Nestle, which is one of the top 10 holdings in the portfolio. British America Tobacco and Japan Tobacco also contributed to superior results in the sector.
| | Percent of Net Assets |
| 10/31/04 | 4/30/05 |
| Financials | 27.5 | 27.6% |
| Consumer Discretionary | 12.1 | 10.9 |
| Industrials and Business Services | 8.8 | 8.8 |
| Energy | 8.0 | 8.0 |
| Consumer Staples | 7.8 | 8.0 |
| Health Care | 7.5 | 7.5 |
| Telecommunication Services | 7.8 | 7.2 |
| Materials | 6.7 | 6.7 |
| Information Technology | 5.7 | 5.1 |
| Utilities | 5.1 | 5.1 |
| Trusts | 3.1 | 5.0 |
| Other and Reserves | -0.1 | 0.1 |
| Total | 100.0% | 100.0% |
| Historical weightings reflect current industry/sector classifications. |
Unfortunately, information technology, which included Alcatel and SAP, did poorly overall for the reasons mentioned in the Market Review section. Alcatel reported poor numbers in the first quarter of the year and will require a recovery in its fixed-line business before operating margins improve. Cash flow from the firm’s operating activities was disappointing due to a rise in inventories. SAP subtracted value after slightly missing estimates for software licenses in the fourth quarter of last year. Telecommunications, which performed well as a group in the fourth quarter of 2004, struggled in the early months of 2005. The worst contributors in this sector included Japan’s NTT DoCoMo and KDDI. NTT DoCoMo fell because of disappointing growth and profitability, and KDDI shares weakened on concerns over near-term profitability during the first quarter of 2005.
INVESTMENT OUTLOOK
Company balance sheets are strong and we expect earnings to rise, although at a more measured rate than in 2004. Several factors are creating slightly greater risk than in the recent past, however. Low bond yields have supported stock prices for some time, but shorter-term yields have been rising in the U.S., and risk premiums could go up if the Federal Reserve decides to tighten monetary policy beyond the measured pace it has so far adopted. The price of oil remains elevated, and the dollar is still weak. That said, growth stocks tend to do best when the economy is growing steadily, and large-caps normally do better than small-caps in this environment.
The outlook for European profits remains largely positive. With European equities currently trading at attractive earnings multiples, we believe the downside risk for stocks in this arena is limited. In addition, the balance sheet restructuring that has been taking place is leading to healthy cash generation. We continue to be troubled by the strong euro versus the dollar and stubbornly high oil prices. Both have affected consumer confidence, but these issues should be mitigated to some extent.
Japan’s economy should regain momentum in the second half of 2005, underpinned by an uplift in consumer spending. The risks here are the same as for Europe, namely, high oil prices, rising U.S. interest rates, and the weak dollar—as well as an upward trend in raw materials prices. We believe, however, that negatives will be overcome by resilient domestic consumer demand.
The diversification provided in an index fund portfolio of international stocks is a prudent, low-cost approach for investors seeking exposure to these developed foreign equities markets.
Respectfully submitted,

Richard T. Whitney
President and chairman of the fund’s Investment Advisory Committee
May 20, 2005
The committee chairman has day-to-day responsibility for managing the portfolio and works with committee members in developing and executing the fund’s investment program.
RISKS OF INTERNATIONAL INVESTING
Funds that invest overseas generally carry more risk than funds that invest strictly in U.S. assets. Funds investing in a single country or in a limited geographic region tend to be riskier than more diversified funds. Risks can result from varying stages of economic and political development, differing regulatory environments, trading days, and accounting standards, and higher transaction costs of non-U.S. markets. Non-U.S. investments are also subject to currency risk, or a decline in the value of a foreign currency versus the U.S. dollar, which reduces the dollar value of securities denominated in that currency.
GLOSSARY
FTSE Developed ex North America Index: A broadly diversified stock market index based on the investable market capitalization of more than 1,000 predominantly larger companies listed in 21 countries. The index’s major markets include the U.K., Japan, and developed countries in Europe and the Pacific Rim.
| TWENTY-FIVE LARGEST HOLDINGS | |
| | Percent of |
| | Net Assets |
| | 4/30/05 |
| |
| BP, United Kingdom | 2.2% |
| Shell T&T/Royal Dutch, United Kingdom/Netherlands | 2.1 |
| HSBC, United Kingdom | 1.8 |
| Vodafone, United Kingdom | 1.7 |
| GlaxoSmithKline, United Kingdom | 1.5 |
| iShares MSCI EMU, Foreign/Europe | 1.4 |
| Total, France | 1.4 |
| Novartis, Switzerland | 1.4 |
| iShares MSCI United Kingdom, United Kingdom | 1.1 |
| Nestle, Switzerland | 1.0 |
| Toyota Motor, Japan | 1.0 |
| iShares MSCI Japan, Japan | 1.0 |
| Royal Bank of Scotland, United Kingdom | 1.0 |
| UBS, Switzerland | 0.9 |
| Roche Holding, Switzerland | 0.9 |
| Sanofi-Aventis, France | 0.9 |
| Telefonica, Spain | 0.8 |
| BHP Billiton, Australia/United Kingdom | 0.8 |
| ENI S.p.A., Italy | 0.8 |
| Nokia, Finland | 0.7 |
| Banco Santander Central Hispano, Spain | 0.7 |
| AstraZeneca, United Kingdom | 0.7 |
| Barclays, United Kingdom | 0.7 |
| Siemens, Germany | 0.7 |
| Unilever, United Kingdom/Netherlands | 0.6 |
| Total | 27.8% |
| |
| Note: Table excludes investments in the T. Rowe Price Reserve Investment Fund and collateral for |
| securities lending. | |
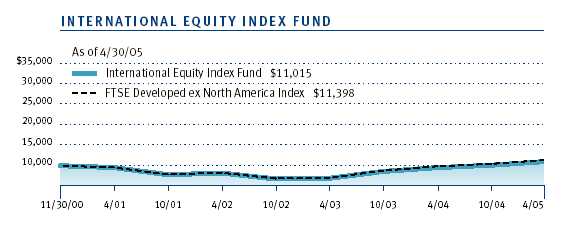
This chart shows the value of a hypothetical $10,000 investment in the fund over the past 10 fiscal year periods or since inception (for funds lacking 10-year records). The result is compared with benchmarks, which may include a broad-based market index and a peer group average or index. Market indexes do not include expenses, which are deducted from fund returns as well as mutual fund averages and indexes.
| AVERAGE ANNUAL COMPOUND TOTAL RETURN |
This table shows how the fund and its benchmarks would have performed if their actual (or cumulative) returns for the periods shown had been earned at a constant rate.
| | | Since |
| | | Inception |
| Periods Ended 4/30/05 | 1 Year | 11/30/00 |
| International Equity Index Fund | 15.66% | 2.21% |
| FTSE Developed ex North America Index | 15.77 | 3.01 |
| Returns do not reflect taxes that the shareholder may pay on fund distributions or the redemption of fund |
| shares. Past performance cannot guarantee future results. | | |
As a mutual fund shareholder, you may incur two types of costs: (1) transaction costs such as redemption fees or sales loads and (2) ongoing costs, including management fees, distribution and service (12b-1) fees, and other fund expenses. The following example is intended to help you understand your ongoing costs (in dollars) of investing in the fund and to compare these costs with the ongoing costs of investing in other mutual funds. The example is based on an investment of $1,000 invested at the beginning of the most recent six-month period and held for the entire period.
Actual Expenses
The first line of the following table (“Actual”) provides information about actual account values and actual expenses. You may use the information in this line, together with your account balance, to estimate the expenses that you paid over the period. Simply divide your account value by $1,000 (for example, an $8,600 account value divided by $1,000 = 8.6), then multiply the result by the number in the first line under the heading “Expenses Paid During Period” to estimate the expenses you paid on your account during this period.
Hypothetical Example for Comparison Purposes
The information on the second line of the table (“Hypothetical”) is based on hypothetical account values and expenses derived from the fund’s actual expense ratio and an assumed 5% per year rate of return before expenses (not the fund’s actual return). You may compare the ongoing costs of investing in the fund with other funds by contrasting this 5% hypothetical example and the 5% hypothetical examples that appear in the shareholder reports of the other funds. The hypothetical account values and expenses may not be used to estimate the actual ending account balance or expenses you paid for the period.
Note: T. Rowe Price charges an account maintenance fee that is not included in the accompanying table. The account maintenance fee is charged on a quarterly basis, usually during the last week of a calendar quarter, and applies to accounts with balances below $10,000 on the day of the assessment. The fee is charged to accounts that fall below $10,000 for any reason, including market fluctuations, redemptions, or exchanges. When an account with less than $10,000 is closed either through redemption or exchange, the fee is charged and deducted from the proceeds. The fee applies to IRA accounts but not to retirement plans directly registered with T. Rowe Price Services or accounts maintained by intermediaries through NSCC® Networking. If you are subject to the fee, keep it in mind when you are estimating the ongoing expenses of investing in the fund and when comparing the expenses of this fund with other funds.
You should also be aware that the expenses shown in the table highlight only your ongoing costs and do not reflect any transaction costs, such as redemption fees or sales loads. Therefore, the second line of the table is useful in comparing ongoing costs only and will not help you determine the relative total costs of owning different funds. To the extent a fund charges transaction costs, however, the total cost of owning that fund is higher.
| T. ROWE PRICE INTERNATIONAL EQUITY INDEX FUND |
| | Beginning | Ending | Expenses Paid |
| | Account Value | Account Value | During Period* |
| | 11/1/04 | 4/30/05 | 11/1/04 to 4/30/05 |
| |
| Actual | $1,000.00 | $1,088.80 | $2.59 |
| |
| Hypothetical (assumes 5% | | | |
| return before expenses) | 1,000.00 | 1,022.32 | 2.51 |
| |
| * Expenses are equal to the fund’s annualized expense ratio for the six-month period (0.50%), multiplied by |
| the average account value over the period, multiplied by the number of days in the most recent fiscal |
| half year (181) divided by the days in the year (365) to reflect the half-year period. |
| | | Since |
| | | Inception |
| Periods Ended 3/31/05 | 1 Year | 11/30/00 |
| |
| International Equity Index Fund | 14.06% | 2.64% |
| FTSE Developed ex North America Index | 15.57 | 3.58 |
| |
| Current performance may be higher or lower than the quoted past performance, which cannot |
| guarantee future results. Share price, principal value, and return will vary, and you may have |
| a gain or loss when you sell your shares. For the most recent month-end performance informa- |
| tion, please visit our Web site (troweprice.com) or contact a T. Rowe Price representative |
| at 1-800-225-5132. The performance information shown does not reflect the deduction of a |
| 2% redemption fee on shares held for three months or less. If it did, the performance would |
| be lower. | | |
| This table provides returns through the most recent calendar quarter-end rather than through the end of |
| the fund’s fiscal period. It shows how the fund would have performed each year if its actual (or cumulative) |
| returns for the periods shown had been earned at a constant rate. Average annual total return figures include |
| changes in principal value, reinvested dividends, and capital gain distributions. Returns do not reflect taxes |
| that the shareholder may pay on fund distributions or the redemption of fund shares. When assessing per- |
| formance, investors should consider both short- and long-term returns. | | |
Unaudited
| FINANCIAL HIGHLIGHTS | For a share outstanding throughout each period |
| | 6 Months | | Year | | | | | 11/30/00 |
| | | Ended | | Ended | | | | | | Through |
| | | 4/30/05** | 10/31/04 | 10/31/03 | 10/31/02 | 10/31/01 |
| NET ASSET VALUE | | | | | | | | | | |
| Beginning of period | $ | 9.72 | $ | 8.38 | $ | 6.68 | $ | 7.78 | $ | 10.00 |
|
|
| |
| Investment activities | | | | | | | | | | |
| Net investment income (loss) | | 0.13 | | 0.14 | | 0.13 | | 0.09 | | 0.10 |
| Net realized and unrealized | | | | | | | | | | |
| gain (loss) | | 0.73 | | 1.34 | | 1.67 | | (1.12) | | (2.32) |
|
|
| Total from investment activities | | 0.86 | | 1.48 | | 1.80 | | (1.03) | | (2.22) |
|
|
| |
| Distributions | | | | | | | | | | |
| Net investment income | | (0.15) | | (0.13) | | (0.10) | | (0.07) | | – |
| Net realized gain | | (0.01) | | (0.01) | | – | | – | | – |
|
|
| Total distributions | | (0.16) | | (0.14) | | (0.10) | | (0.07) | | – |
|
|
| |
| NET ASSET VALUE | | | | | | | | | | |
| End of period | $ | 10.42 | $ | 9.72 | $ | 8.38 | $ | 6.68 | $ | 7.78 |
|
|
| |
| |
| Ratios/Supplemental Data | | | | | | | | | | |
| Total return^ | | 8.88% | | 17.86% | | 27.37% | (13.38)% | (22.20)% |
| Ratio of total expenses to | | | | | | | | | | |
| average net assets | | 0.50%† | | 0.50% | | 0.50% | | 0.50% | | 0.50%† |
| Ratio of net investment income | | | | | | | | | | |
| (loss) to average net assets | | 2.55%† | | 1.97% | | 2.09% | | 1.59% | | 1.51%† |
| Portfolio turnover rate | | 80.8%† | | 58.2% | | 39.4% | | 49.0% | | 63.1%† |
| Net assets, end of period | | | | | | | | | | |
| (in thousands) | $ | 82,704 | $ | 48,340 | $ | 20,622 | $ | 12,031 | $ | 7,502 |
| |
| |
| |
| |
| ^ Total return reflects the rate that an investor would have earned on an investment in the fund during each period, |
| assuming reinvestment of all distributions and payment of no redemption on account fees. | | | |
| † Annualized | | | | | | | | | | |
| ** Per share amounts calculated using average shares outstanding method. | | | | | |
| |
| The accompanying notes are an integral part of these financial statements. | | | | | | |
| Unaudited | April 30, 2005 |
| | | |
| PORTFOLIO OF INVESTMENTS (1)++ | Shares | Value |
| (Cost and value in $ 000s) | | |
| AUSTRALIA 5.5% | | |
| Common Stocks 5.5% | | |
| Adelaide Bank | 482 | 4 |
| Adelaide Brighton § | 521 | 1 |
| Alinta | 1,708 | 12 |
| Alumina | 9,581 | 43 |
| Amcor | 7,218 | 37 |
| AMP | 15,085 | 80 |
| Ansell Limited | 1,118 | 8 |
| APN News & Media | 664 | 2 |
| Aristocrat Leisure § | 4,173 | 32 |
| Austereo Group | 1,422 | 2 |
| Australand Property Group | 3,157 | 4 |
| Australia & New Zealand Banking § | 14,931 | 253 |
| Australian Foundation | 7,458 | 21 |
| Australian Gas Light | 3,752 | 42 |
| Australian Pharmaceutical Industries | 1,583 | 3 |
| Australian Stock Exchange § | 924 | 14 |
| Australian Wealth * | 1,507 | 1 |
| AWB | 4,007 | 14 |
| AXA Asia Pacific | 10,789 | 36 |
| Babcock & Brown * | 686 | 5 |
| Bank of Queensland | 540 | 5 |
| Bendigo Bank | 1,552 | 11 |
| BHP Billiton | 29,970 | 380 |
| Billabong International | 1,649 | 15 |
| BlueScope Steel | 6,121 | 37 |
| Boral | 4,852 | 22 |
| Brambles Industries § | 7,886 | 49 |
| Brickworks | 575 | 4 |
| Burns, Philip & Company * | 10,903 | 8 |
| Caltex Australia | 892 | 10 |
| Centro Properties Group | 6,830 | 27 |
| CFS Gandel Retail Trust, Equity Units | 11,789 | 15 |
| Challenger Financial Services *§ | 2,305 | 6 |
| Coca-Cola Amatil | 4,371 | 28 |
| Cochlear § | 678 | 16 |
| Coles Myer | 10,118 | 68 |
| Commonwealth Bank of Australia | 10,454 | 299 |
| Commonwealth Property Office | 11,208 | 11 |
| Computershare § | 4,072 | 16 |
| Corporate Express Australia | 886 | 4 |
| CSL Limited | 1,635 | 41 |
| CSR | 6,174 | 12 |
| DB RREEF Trust | 19,501 | 20 |
| Downer EDI | 2,558 | 9 |
| Envestra | 2,638 | 2 |
| Flight Centre | 467 | 5 |
| Foodland Associated | 967 | 19 |
| Foster's Group | 16,811 | 68 |
| Futuris | 7,662 | 11 |
| General Property Trust, Equity Units | 16,560 | 48 |
| Gunns | 2,353 | 7 |
| GWA International | 1,182 | 2 |
| Harvey Norman Holdings | 6,466 | 13 |
| Hills Motorway Group | 2,043 | 18 |
| Iluka Resources | 2,620 | 12 |
| Incitec Pivot | 68 | 1 |
| Insurance Australia § | 13,094 | 63 |
| Investa Property, Equity Units | 11,088 | 18 |
| iShares MSCI Australia (USD) | 12,600 | 212 |
| James Hardie Industries | 3,320 | 15 |
| John Fairfax Holdings | 1,397 | 4 |
| Leighton Holdings | 1,634 | 13 |
| Lend Lease | 3,261 | 31 |
| Lion Nathan | 2,922 | 17 |
| Macquarie Airports § | 4,667 | 12 |
| Macquarie Bank | 1,836 | 66 |
| Macquarie Goodman * | 1,032 | 3 |
| Macquarie Goodman (Ordinary shares) | 10,327 | 32 |
| Macquarie Infrastructure Group | 17,768 | 51 |
| Macquarie Office Trust, Equity Units | 12,198 | 12 |
| Mayne Group | 6,286 | 17 |
| Metcash Trading | 4,243 | 11 |
| Minara Resources § | 1,346 | 2 |
| Mirvac Group | 6,888 | 23 |
| National Australia Bank § | 12,730 | 292 |
| National Foods | 1,928 | 10 |
| Newcrest Mining | 2,854 | 33 |
| Novogen * | 794 | 3 |
| Nufarm | 1,990 | 14 |
| OneSteel | 6,550 | 11 |
| Orica | 2,371 | 29 |
| Origin Energy | 6,420 | 35 |
| Oxiana *§ | 6,865 | 5 |
| Pacifica Group | 329 | 0 |
| Paperlinx | 4,760 | 11 |
| Patrick Corporation | 5,285 | 23 |
| Perpetual Trust Australia § | 255 | 10 |
| Promina Group § | 8,627 | 35 |
| Publishing & Broadcasting | 1,449 | 16 |
| Qantas Airways | 6,623 | 17 |
| QBE Insurance | 6,146 | 72 |
| Rinker Group § | 7,662 | 69 |
| Rio Tinto § | 3,061 | 100 |
| Rural Press | 345 | 3 |
| Santos | 4,453 | 32 |
| SFE | 1,416 | 10 |
| Sigma Company | 1,029 | 7 |
| Simsmetal Group | 1,086 | 13 |
| Smorgon Steel Group | 3,843 | 3 |
| Sonic Healthcare | 2,252 | 21 |
| Southcorp | 5,429 | 18 |
| Southern Cross Broadcasting | 318 | 3 |
| Spotless Group | 1,074 | 4 |
| St. George Bank | 4,226 | 82 |
| Stockland | 10,611 | 49 |
| Suncorp-Metway | 4,428 | 69 |
| Tabcorp Holdings | 4,290 | 52 |
| Telstra | 18,093 | 69 |
| Ten Network Holdings | 2,623 | 7 |
| Toll Holdings | 2,929 | 29 |
| Transurban Group | 3,927 | 23 |
| UNiTAB | 927 | 9 |
| Washington H. Soul Pattinson & Company | 694 | 5 |
| Wesfarmers | 3,089 | 87 |
| West Australian Newspapers | 365 | 2 |
| Westfield Group | 13,805 | 177 |
| Westpac Banking | 14,674 | 224 |
| WMC Resorces | 9,593 | 60 |
| Woodside Petroleum | 4,123 | 76 |
| Woolworths | 8,514 | 102 |
| | | 4,556 |
| Preferred Stocks 0.0% | | |
| Rural Press | 297 | 2 |
| | | 2 |
| Total Australia (Cost $3,721) | | 4,558 |
| |
| AUSTRIA 0.3% | | |
| Common Stocks 0.3% | | |
| Bank Austria Creditanstalt § | 346 | 32 |
| Erste Bank | 1,446 | 70 |
| EVN | 76 | 5 |
| Immofinanz Immobilien Anlagen * | 1,972 | 18 |
| Immofinanz Immobilien Anlagen, Rights * | 1,972 | 0 |
| Oest Elektrizitatswirts, Class A § | 35 | 9 |
| OMV | 127 | 39 |
| Telekom Austria | 3,131 | 60 |
| Wienerberger | 675 | 29 |
| Total Austria (Cost $195) | | 262 |
| BELGIUM 1.4% | | |
| Common Stocks 1.4% | | |
| Agfa Gevaert | 630 | 21 |
| Almancora | 87 | 8 |
| Belgacom | 1,513 | 58 |
| CNP | 17 | 4 |
| Colruyt | 73 | 11 |
| Cumerio * | 199 | 3 |
| Delhaize Group | 668 | 44 |
| Dexia | 6,925 | 160 |
| Electrabel | 319 | 149 |
| Fortis | 2,916 | 81 |
| Fortis, Series B | 7,916 | 221 |
| Groupe Bruxelles Lambert | 540 | 49 |
| Interbrew § | 1,359 | 43 |
| KBC | 1,539 | 122 |
| Mobistar * | 170 | 15 |
| RTL Group | 161 | 12 |
| SES Global GDR | 1,749 | 23 |
| Solvay | 435 | 50 |
| UCB | 905 | 44 |
| Umicore | 199 | 17 |
| Total Belgium (Cost $940) | | 1,135 |
| |
| CHINA 0.5% | | |
| Common Stocks 0.5% | | |
| Brilliance China Automotive (HKD) § | 6,000 | 1 |
| China Merchants Holdings (HKD) | 8,000 | 16 |
| China Mobile (HKD) | 48,000 | 168 |
| China Netcom (HKD) * | 10,500 | 14 |
| China Overseas Land & Investment (HKD) | 26,000 | 5 |
| China Resources Enterprise (HKD) | 10,000 | 14 |
| China Unicom (HKD) | 28,000 | 23 |
| Citic Pacific (HKD) | 8,000 | 24 |
| CNOOC (HKD) | 97,000 | 52 |
| Cosco Pacific (HKD) | 8,000 | 17 |
| Global Bio-Chem Technology (HKD) | 14,000 | 9 |
| Guangzhou Investment (HKD) | 18,000 | 2 |
| Semiconductor Manufacturing (HKD) * | 21,000 | 4 |
| Shanghai Industrial (HKD) | 14,000 | 29 |
| TCL International Holdings (HKD) | 4,000 | 1 |
| TPV Technology (HKD) | 8,000 | 5 |
| Total China (Cost $359) | | 384 |
| |
| DENMARK 0.8% | | |
| Common Stocks 0.8% | | |
| A P Moller-Maersk, Series B | 14 | 124 |
| A P Moller-Maersk | 5 | 44 |
| Carlsberg, Series B | 335 | 17 |
| Coloplast, Series B | 260 | 15 |
| Danisco | 416 | 28 |
| Danske Bank | 5,783 | 170 |
| H. Lundbeck | 553 | 13 |
| ISS | 341 | 27 |
| Jyske Bank * | 406 | 16 |
| Novo Nordisk, Series B | 1,764 | 89 |
| Novozymes, Series B | 520 | 25 |
| TDC | 1,691 | 73 |
| Vestas Wind Systems * | 1,363 | 17 |
| William Demant Holding * | 211 | 10 |
| Total Denmark (Cost $562) | | 668 |
| |
| EUROPE/FAR EAST 0.6% | | |
| Common Stocks 0.6% | | |
| iShares MSCI EAFE Index Fund (USD) | 3,156 | 493 |
| Total Europe/Far East (Cost $483) | | 493 |
| |
| FINLAND 1.2% | | |
| Common Stocks 1.2% | | |
| Fortum § | 3,149 | 48 |
| Kone Oyj, Class B *§ | 308 | 23 |
| Metso Oyi | 1,137 | 21 |
| Neste Oil * | 786 | 18 |
| Nokia | 38,033 | 610 |
| Outokumpu | 1,062 | 15 |
| Sampo | 3,283 | 46 |
| SanomaWSOY Oyj, Series B | 303 | 7 |
| Stora Enso, Series R | 5,152 | 68 |
| TietoEnator | 649 | 20 |
| UPM-Kymmene | 4,429 | 89 |
| Total Finland (Cost $1,036) | | 965 |
| |
| FOREIGN/EUROPE 1.4% | | |
| Common Stocks 1.4% | | |
| iShares MSCI EMU (USD) | 16,900 | 1,180 |
| Total Foreign/Europe (Cost $1,170) | | 1,180 |
| |
| FRANCE 9.4% | | |
| Common Stocks 9.4% | | |
| Accor | 1,616 | 74 |
| Assurances Generales de France § | 447 | 36 |
| Air France § | 1,797 | 28 |
| Alcatel *§ | 10,104 | 109 |
| Arcelor | 3,718 | 76 |
| Atos Origin * | 586 | 35 |
| Autoroutes du Sud | 543 | 28 |
| AXA § | 15,430 | 382 |
| BIC | 315 | 17 |
| BNP Paribas § | 7,244 | 479 |
| Bouygues | 2,078 | 83 |
| Cap Gemini * | 1,188 | 37 |
| Carrefour § | 5,824 | 284 |
| Casino Guichard-Perrachon § | 369 | 27 |
| Christian Dior | 569 | 40 |
| Ciments Francais | 89 | 8 |
| CNP Assurances | 396 | 27 |
| Compagnie De Saint-Gobain § | 2,718 | 154 |
| Credit Agricole § | 4,613 | 120 |
| Dassault Systemes | 440 | 21 |
| EADS § | 2,528 | 72 |
| Essilor International | 927 | 66 |
| Eurazeo | 183 | 17 |
| Euronext | 1,088 | 36 |
| France Telecom *§ | 15,094 | 444 |
| Gecina | 287 | 33 |
| Groupe Danone § | 2,233 | 210 |
| Imerys | 263 | 19 |
| JC Decaux *§ | 520 | 14 |
| Klepierre | 143 | 14 |
| L'Air Liquide | 877 | 157 |
| L'Oreal § | 2,826 | 204 |
| Lafarge § | 1,337 | 122 |
| Lagardere | 1,094 | 79 |
| LVMH § | 3,001 | 213 |
| Michelin | 829 | 50 |
| Natexis Banques Populaires | 70 | 10 |
| Pernod-Ricard § | 551 | 84 |
| Peugeot § | 1,425 | 85 |
| Pinault Printemps Redoute | 717 | 71 |
| Publicis | 1,319 | 38 |
| Renault § | 1,673 | 141 |
| Sagem | 1,498 | 31 |
| Sanofi-Aventis | 8,216 | 730 |
| Schneider | 1,814 | 131 |
| Snecma * | 843 | 20 |
| Societe Generale | 3,641 | 364 |
| Sodexho Alliance | 1,067 | 36 |
| STMicroelectronics | 5,279 | 75 |
| Suez | 8,624 | 236 |
| Technip | 180 | 31 |
| Television Francaise * | 1,355 | 39 |
| Thales | 658 | 27 |
| Thomson | 2,463 | 61 |
| Total | 5,230 | 1,165 |
| Unibail | 384 | 48 |
| Valeo | 733 | 32 |
| Veolia Environnement | 3,164 | 120 |
| Vinci | 660 | 100 |
| Vivendi Universal * | 8,728 | 260 |
| Total France (Cost $7,022) | | 7,750 |
| |
| GERMANY 6.6% | | |
| Common Stocks 6.4% | | |
| Adidas-Salomon | 432 | 67 |
| Allianz | 3,139 | 377 |
| Altana AG | 663 | 42 |
| AMB Generali Holding | 84 | 7 |
| BASF § | 4,791 | 311 |
| Bayer AG | 5,711 | 188 |
| Bayerische Hypo-und Vereinsbank * | 5,917 | 141 |
| Bayerische Motoren Werke | 2,436 | 104 |
| Beiersdorf | 131 | 14 |
| Celesio *§ | 266 | 21 |
| Commerzbank *§ | 3,512 | 77 |
| Continental | 1,071 | 79 |
| DaimlerChrysler § | 8,230 | 324 |
| Degussa § | 182 | 8 |
| DEPFA Bank * | 3,188 | 49 |
| Deutsche Bank | 4,456 | 366 |
| Deutsche Boerse | 1,016 | 77 |
| Deutsche Lufthansa * | 1,796 | 23 |
| Deutsche Post | 3,480 | 82 |
| Deutsche Postbank * | 513 | 24 |
| Deutsche Telekom § | 25,865 | 485 |
| E.On § | 5,678 | 481 |
| Fresenius | 38 | 4 |
| Fresenius Medical Care | 329 | 27 |
| Hannover Rueckversicherung | 456 | 17 |
| Heidelberger Druckmaschinen * | 504 | 14 |
| Heidelberger Zement § | 390 | 23 |
| Henkel | 213 | 18 |
| Hypo Real Estate Holding * | 1,143 | 48 |
| Infineon Technologies * | 6,694 | 56 |
| Karstadt § | 689 | 7 |
| Lanxess * | 571 | 12 |
| Linde | 784 | 52 |
| MAN | 1,217 | 51 |
| Merck § | 118 | 9 |
| METRO | 1,271 | 67 |
| MLP | 436 | 7 |
| Munich Re § | 1,863 | 205 |
| Puma § | 97 | 22 |
| RWE § | 3,285 | 197 |
| SAP | 1,984 | 313 |
| Schering | 1,563 | 104 |
| Siemens | 7,318 | 539 |
| Suedzucker | 435 | 8 |
| T-Online International | 1,593 | 17 |
| ThyssenKrupp | 3,026 | 56 |
| TUI | 1,683 | 41 |
| Volkswagen | 1,869 | 78 |
| | | 5,339 |
| Preferred Stocks 0.2% | | |
| Fresenius | 245 | 29 |
| Fresenius Medical Care | 122 | 7 |
| Henkel § | 581 | 50 |
| Porsche | 68 | 44 |
| Wella AG | 137 | 14 |
| | | 144 |
| Total Germany (Cost $5,192) | | 5,483 |
| GREECE 0.5% | | |
| Common Stocks 0.5% | | |
| Alpha Bank | 2,450 | 80 |
| Bank of Piraeus | 1,367 | 23 |
| Coca-Cola Hellenic Bottling | 739 | 20 |
| Commercial Bank of Greece | 497 | 16 |
| Cosmote Mobile Communication | 1,050 | 20 |
| EFG Eurobank Ergasias | 1,828 | 55 |
| Hellenic Petroleum * | 962 | 10 |
| Hellenic Telecommunications | 3,323 | 62 |
| National Bank of Greece | 1,956 | 66 |
| OPAP | 1,110 | 29 |
| Public Power * | 910 | 25 |
| Titan Cement * | 450 | 14 |
| Total Greece (Cost $331) | | 420 |
| |
| HONG KONG 2.4% | | |
| Common Stocks 2.4% | | |
| Asia Aluminum Holdings | 8,000 | 1 |
| Asia Satellite Telecommunications | 500 | 1 |
| ASM Pacific Technology | 1,500 | 6 |
| Bank of East Asia | 11,600 | 34 |
| Beijing Enterprises, Class H | 2,000 | 3 |
| BOC Hong Kong | 32,500 | 62 |
| Cafe De Coral Holdings | 4,000 | 4 |
| Cathay Pacific Airways | 14,000 | 27 |
| Chaoda Modern Agriculture | 10,100 | 4 |
| Cheung Kong Holdings | 14,000 | 132 |
| Cheung Kong Infrastructure | 4,000 | 13 |
| China Everbright § | 14,000 | 5 |
| China Insurance International | 6,000 | 2 |
| China National Aviation | 10,000 | 2 |
| China Resources Power Holdings | 16,000 | 9 |
| China Travel International Investment | 28,000 | 8 |
| Chinese Estates Holdings * | 4,000 | 4 |
| CITIC International Financial Holdings | 12,000 | 5 |
| CLP Holdings | 14,700 | 84 |
| CNPC Hong Kong | 20,000 | 3 |
| COFCO International | 2,000 | 1 |
| Dah Sing Financial § | 1,200 | 8 |
| Dairy Farm (USD) | 4,500 | 12 |
| Denway Motors | 36,000 | 13 |
| Esprit Holdings | 7,000 | 52 |
| First Pacific * | 30,000 | 9 |
| Fountain Set | 2,000 | 1 |
| Fubon Bank | 2,000 | 1 |
| Giordano International | 8,000 | 6 |
| Great Eagle Holdings | 2,000 | 5 |
| Guangdong Investment | 10,000 | 3 |
| Guoco Group | 1,000 | 10 |
| Hang Lung Group | 6,000 | 11 |
| Hang Lung Properties | 13,000 | 20 |
| Hang Seng Bank | 6,300 | 86 |
| Henderson Investment | 9,000 | 13 |
| Henderson Land Development | 6,000 | 28 |
| Hengan International Group | 6,000 | 4 |
| Hong Kong & China Gas | 35,930 | 74 |
| Hong Kong & Shanghai Hotels | 5,000 | 5 |
| Hong Kong Aircraft Engineering | 800 | 5 |
| Hong Kong Electric | 13,000 | 59 |
| Hong Kong Exchanges | 8,000 | 19 |
| Hong Kong Land Holdings (USD) | 15,000 | 43 |
| Hopewell Highway Infrastructure § | 12,500 | 9 |
| Hopewell Holdings | 7,000 | 17 |
| Hung Hing Printing Group | 2,000 | 1 |
| Hutchison Harbour Ring | 6,000 | 1 |
| Hutchison Telecommunications * | 10,000 | 10 |
| Hutchison Whampoa | 26,000 | 233 |
| Hysan Development | 5,000 | 10 |
| i-Cable Communication | 2,200 | 1 |
| Industrial & Commercial Bank of China | 3,000 | 4 |
| iShares MSCI Hong Kong Index (USD) | 8,900 | 107 |
| Jardine Matheson (USD) | 2,400 | 43 |
| Jardine Strategic (USD) | 3,000 | 30 |
| JCG Holdings | 2,000 | 2 |
| Johnson Electric | 19,500 | 17 |
| Kerry Properties | 2,500 | 5 |
| Kingboard Chemical, Warrants, 12/31/06 * | 200 | 0 |
| Kingboard Chemical Holdings | 6,000 | 18 |
| Kowloon Motor Bus Holdings | 2,000 | 11 |
| Lee & Man Paper Manufacturing | 2,000 | 2 |
| Levono Group | 16,000 | 5 |
| Li & Fung | 20,000 | 38 |
| Liu Chong Hing Bank | 1,000 | 1 |
| Mandarin Oriental (USD) | 6,000 | 5 |
| MTR | 14,500 | 23 |
| New World Development | 22,000 | 24 |
| Next Media * | 2,000 | 1 |
| NWS Holdings | 5,000 | 7 |
| Orient Overseas International * | 2,200 | 11 |
| Oriental Press Group | 14,000 | 4 |
| PCCW | 45,200 | 27 |
| SCMP Group | 10,000 | 5 |
| Shangri-La Asia | 8,000 | 12 |
| Shenzhen International Holdings | 22,500 | 1 |
| Shenzhen Investment | 2,000 | 0 |
| Shun Tak Holdings | 10,000 | 10 |
| Sino Land | 24,000 | 23 |
| Skyworth Digital | 6,000 | 2 |
| Smartone Telecommunications | 1,000 | 1 |
| Sun Hung Kai Properties | 15,000 | 144 |
| Swire Pacific, Series A | 8,500 | 71 |
| Swire Pacific, Series B | 7,500 | 12 |
| Techtronic Industries | 12,000 | 27 |
| Television Broadcasts | 2,000 | 10 |
| Texwinca Holdings | 4,000 | 3 |
| Tingyi | 14,000 | 3 |
| Wharf | 10,000 | 33 |
| Wheelock | 10,000 | 15 |
| Wing Hang Bank | 1,500 | 9 |
| Wing Lung Bank | 1,500 | 11 |
| Yue Yuen Industrial | 5,500 | 16 |
| Total Hong Kong (Cost $1,742) | | 1,972 |
| |
| IRELAND 0.7% | | |
| Common Stocks 0.7% | | |
| Allied Irish Banks | 7,718 | 157 |
| Anglo Irish Bank | 5,226 | 61 |
| Bank of Ireland | 8,693 | 132 |
| CRH | 4,480 | 112 |
| Elan * | 3,112 | 17 |
| Irish Life & Permanent | 2,211 | 37 |
| Kerry Group | 1,081 | 26 |
| Total Ireland (Cost $526) | | 542 |
| |
| ITALY 4.3% | | |
| Common Stocks 4.3% | | |
| AEM | 7,038 | 14 |
| Alleanza Assicurazioni | 3,313 | 40 |
| Assicurazioni Generali § | 10,460 | 323 |
| Autogrill * | 993 | 14 |
| Autostrade * | 2,239 | 59 |
| Banca Antonveneta *§ | 2,524 | 84 |
| Banca Carige | 3,755 | 15 |
| Banca Fideuram | 2,304 | 12 |
| Banca Intesa § | 36,324 | 174 |
| Banca Lombarda | 2,641 | 37 |
| Banca Monte dei Paschi di Siena | 9,571 | 34 |
| Banca Nazionale Lavoro § | 17,572 | 56 |
| Banca Popol Emilia Romagna * | 712 | 38 |
| Banca Popolare di Lodi | 2,592 | 26 |
| Banche Poplari Unite Scrl | 2,989 | 64 |
| Banco Popolare di Verona e Novara | 3,319 | 61 |
| Benetton Group § | 504 | 5 |
| Bulgari § | 1,155 | 13 |
| Capitalia | 12,890 | 69 |
| Edison *§ | 9,584 | 20 |
| Enel | 37,329 | 356 |
| ENI S.p.A. | 24,744 | 624 |
| Fiat *§ | 4,699 | 31 |
| FinecoGroup | 1,548 | 13 |
| Finmeccanica | 49,327 | 46 |
| Gruppo Editoriale L'Espresso § | 1,684 | 10 |
| Ifil | 4,055 | 17 |
| Italcementi | 1,120 | 18 |
| Italcementi-RNC | 382 | 5 |
| Luxottica | 1,063 | 21 |
| Mediaset | 7,227 | 94 |
| Mediobanca | 3,047 | 50 |
| Mediolanum | 1,705 | 11 |
| Pirelli | 30,051 | 34 |
| RAS | 2,604 | 57 |
| RCS MediaGroup | 5,180 | 32 |
| SAI | 759 | 20 |
| Saipem | 2,550 | 32 |
| San Paolo IMI | 9,062 | 135 |
| Seat Pagine Gialle * | 42,072 | 16 |
| Snam Rete Gas | 7,652 | 43 |
| Telecom Italia | 104,420 | 356 |
| Telecom Italia Mobile | 11,323 | 66 |
| Telecom Italia-RNC | 28,539 | 81 |
| Terna | 7,830 | 22 |
| UniCredito | 37,923 | 214 |
| Unipol | 811 | 3 |
| | | 3,565 |
| Preferred Stocks 0.0% | | |
| Unipol * | 3,290 | 12 |
| | | 12 |
| Total Italy (Cost $3,137) | | 3,577 |
| |
| JAPAN 20.5% | | |
| Common Stocks 20.5% | | |
| ABC-Mart | 100 | 3 |
| ACOM § | 570 | 37 |
| Advantest | 500 | 35 |
| AEON | 4,500 | 70 |
| AEON Credit Service § | 200 | 13 |
| AEON Mall | 200 | 8 |
| Aichi Steel | 2,000 | 11 |
| AIFUL | 250 | 19 |
| AIFUL (Bonus shares) * | 125 | 9 |
| Aioi Insurance § | 5,000 | 26 |
| Aisin Seiki | 1,200 | 26 |
| Ajinomoto | 4,000 | 48 |
| Alfresa Holdings | 200 | 9 |
| All Nippon Airways § | 9,000 | 29 |
| Alps Electric § | 1,000 | 16 |
| Amada | 3,000 | 19 |
| Anritsu | 1,000 | 6 |
| Aoyama Trading | 400 | 11 |
| Arisawa * | 220 | 7 |
| Asahi Breweries | 3,000 | 38 |
| Asahi Glass § | 7,000 | 78 |
| Asahi Kasei | 9,000 | 44 |
| Asatsu-DK § | 300 | 9 |
| Askul | 100 | 6 |
| Astellas Pharmaceutical | 4,120 | 150 |
| Autobacs Seven § | 200 | 7 |
| Awa Bank | 2,000 | 12 |
| Bandai § | 600 | 14 |
| Bank of Fukuoka § | 4,000 | 24 |
| Bank of Kyoto § | 2,000 | 17 |
| Bank of Nagoya | 2,000 | 13 |
| Bank of Yokohama | 9,000 | 52 |
| Benesse | 800 | 26 |
| Bosch Automotives | 1,000 | 5 |
| Bridgestone | 5,000 | 96 |
| Brother Industries | 2,000 | 19 |
| Calsonic Kansei | 1,000 | 6 |
| Canon | 7,300 | 381 |
| Canon Sales | 1,000 | 16 |
| Casio Computer § | 2,000 | 27 |
| Central Glass § | 1,000 | 7 |
| Central Japan Railway § | 7 | 58 |
| Chiba Bank § | 5,000 | 31 |
| Chiyoda | 1,000 | 11 |
| Chubu Electric § | 4,500 | 108 |
| Chugai Pharmaceutical | 1,900 | 30 |
| Chugoku Bank | 1,000 | 12 |
| Chugoku Electric Power | 2,300 | 44 |
| Circle K Sunkus § | 400 | 10 |
| Citizen Watch § | 2,000 | 18 |
| Coca-Cola West Japan § | 300 | 7 |
| Cosmo Oil § | 3,000 | 10 |
| Credit Saison § | 1,200 | 41 |
| CSK | 400 | 15 |
| Dai Nippon Printing | 5,000 | 81 |
| Daicel Chemical Industries | 2,000 | 11 |
| Daido Steel § | 2,000 | 8 |
| Daiei * | 1,500 | 3 |
| Daihatsu Motor | 1,000 | 8 |
| Daiichi Pharmaceutical | 1,500 | 35 |
| Daikin Industries § | 2,000 | 50 |
| Daimaru § | 3,000 | 26 |
| Dainippon Ink & Chemicals § | 9,000 | 25 |
| Dainippon Pharmaceutical | 1,000 | 10 |
| Dainippon Screen | 1,000 | 7 |
| Daishi Bank | 2,000 | 8 |
| Daito Trust Construction | 800 | 32 |
| Daiwa House | 3,000 | 34 |
| Daiwa Securities Group | 10,000 | 63 |
| Denki Kagaku Kogyo | 4,000 | 14 |
| Denso | 3,600 | 85 |
| Dentsu § | 9 | 23 |
| Diamond Lease | 100 | 4 |
| Disco Corporation § | 100 | 4 |
| Don Quijote | 100 | 6 |
| Dowa Mining § | 3,000 | 20 |
| East Japan Railway | 25 | 130 |
| Ebara | 2,000 | 8 |
| Eisai | 1,600 | 53 |
| Ezaki Glico | 1,000 | 8 |
| FamilyMart § | 500 | 16 |
| Fanuc § | 1,300 | 77 |
| Fast Retailing | 400 | 24 |
| Fuji Photo Film | 3,000 | 100 |
| Fuji Electric Holdings | 5,000 | 15 |
| Fuji Fire & Marine Insurance | 1,000 | 3 |
| Fuji Heavy Industries § | 5,000 | 23 |
| Fuji Soft ABC | 300 | 9 |
| Fuji Television Network | 4 | 8 |
| Fujikura § | 3,000 | 13 |
| Fujitsu Limited § | 13,000 | 72 |
| Fukui Bank | 1,000 | 4 |
| Fukuyama Transporting | 1,000 | 4 |
| Funai Electric § | 100 | 11 |
| Furukawa Electric * | 4,000 | 18 |
| Futaba | 200 | 6 |
| Global Media Online § | 100 | 3 |
| Goodwill Group | 3 | 6 |
| Gunma Bank | 3,000 | 17 |
| Gunze | 1,000 | 5 |
| Hachijuni Bank | 3,000 | 21 |
| Hamamatsu Photonics § | 300 | 7 |
| Hankyu Department Stores | 1,000 | 7 |
| Hankyu Holdings § | 8,000 | 31 |
| Hanshin Electric Railway | 2,000 | 7 |
| Heiwa | 700 | 12 |
| Higo Bank | 2,000 | 14 |
| Hikari Tsushin | 100 | 6 |
| Hino Motors § | 2,000 | 12 |
| Hirose Electric § | 200 | 20 |
| Hiroshima Bank | 4,000 | 19 |
| Hitachi | 20,000 | 118 |
| Hitachi Cable § | 1,000 | 4 |
| Hitachi Capital | 300 | 6 |
| Hitachi Chemical | 900 | 15 |
| Hitachi Construction Machinery | 600 | 8 |
| Hitachi High-Technologies | 200 | 3 |
| Hitachi Information Systems | 100 | 2 |
| Hitachi Metals § | 1,000 | 7 |
| Hokkaido Electric Power | 1,400 | 28 |
| Hokkoku Bank | 2,000 | 9 |
| Hokugin Financial Group § | 15,000 | 43 |
| Hokuriku Electric | 1,200 | 22 |
| Honda | 5,700 | 275 |
| House Foods § | 300 | 4 |
| Hoya | 700 | 73 |
| Hyakugo Bank | 2,000 | 12 |
| Hyakujushi Bank | 2,000 | 12 |
| Ibiden § | 900 | 19 |
| INPEX | 5 | 27 |
| Invoice | 19 | 2 |
| Isetan § | 1,200 | 14 |
| iShares MSCI Japan (USD) | 77,200 | 791 |
| Ishikawajima-Harima *§ | 8,000 | 13 |
| Isuzu Motors § | 5,000 | 13 |
| Ito EN § | 300 | 15 |
| Ito-Yokado § | 3,000 | 103 |
| Itochu § | 10,000 | 50 |
| Itochu Techno-Science § | 200 | 6 |
| Iyo Bank | 2,000 | 16 |
| Izumi § | 300 | 7 |
| JAFCO § | 300 | 17 |
| Japan Airlines System | 6,000 | 17 |
| Japan Petroleum Exploration | 200 | 8 |
| Japan Tobacco | 8 | 103 |
| JFE Holdings § | 3,500 | 97 |
| JGC § | 1,000 | 10 |
| Joyo Bank | 5,000 | 25 |
| JS Group | 3,000 | 54 |
| JSAT | 1 | 3 |
| JSR | 2,000 | 41 |
| Juroku Bank § | 2,000 | 11 |
| Kagoshima Bank | 1,000 | 8 |
| Kajima | 11,000 | 42 |
| Kamigumi | 3,000 | 24 |
| Kandenko | 1,000 | 6 |
| Kaneka | 1,000 | 11 |
| Kansai Electric | 5,900 | 119 |
| Kansai Paint § | 4,000 | 24 |
| Kao | 5,000 | 115 |
| Katokichi | 300 | 2 |
| Katokichi (Bonus shares) *§ | 600 | 5 |
| Kawasaki Heavy Industries § | 10,000 | 19 |
| Kawasaki Kisen Kaisha | 5,000 | 33 |
| KDDI | 25 | 116 |
| Keihin Electric Express Railway § | 3,000 | 18 |
| Keio Electric Railway | 5,000 | 28 |
| Keyence § | 300 | 67 |
| Kikkoman | 1,000 | 10 |
| Kinden | 2,000 | 17 |
| Kinki Nippon Railways § | 11,000 | 34 |
| Kirin Beverage § | 100 | 3 |
| Kirin Brewery | 6,000 | 59 |
| Kobayashi Pharmaceutical § | 100 | 3 |
| Kobe Steel | 18,000 | 33 |
| Koei | 1,300 | 34 |
| Kokuyo § | 800 | 10 |
| Komatsu § | 8,000 | 57 |
| Komeri | 300 | 8 |
| Konami § | 800 | 17 |
| Konica Minolta Holdings § | 3,000 | 29 |
| Kose * | 110 | 4 |
| Koyo Seiko § | 1,000 | 14 |
| Kubota | 5,000 | 26 |
| Kuraray § | 3,000 | 28 |
| Kuraya Sanseido § | 1,200 | 15 |
| Kurita Water Industries | 700 | 11 |
| Kyocera | 1,600 | 117 |
| Kyowa Hakko Kogyo | 3,000 | 22 |
| Kyushu Electric Power | 2,900 | 62 |
| Lawson § | 600 | 23 |
| Leopalace21 | 700 | 11 |
| Lion Corporation | 2,000 | 11 |
| Mabuchi Motor § | 300 | 18 |
| Makita | 1,000 | 19 |
| Marubeni | 9,000 | 29 |
| Marui | 2,300 | 30 |
| Maruichi Steel Tube § | 2,000 | 44 |
| Matsui Securities | 300 | 4 |
| Matsui Securities (Bonus shares) * | 600 | 8 |
| Matsumotokiyoshi | 300 | 9 |
| Matsushita Electric Industries | 20,000 | 294 |
| Matsushita Electric Works | 1,671 | 14 |
| Mazda Motor | 5,000 | 18 |
| Meiji Dairies | 2,000 | 11 |
| Meiji Seika Kaisha § | 2,000 | 10 |
| Meitec § | 300 | 10 |
| Millea | 11 | 150 |
| Minebea § | 3,000 | 12 |
| Misumi | 100 | 3 |
| Mitsubishi Chemical | 11,000 | 35 |
| Mitsubishi Corporation | 10,000 | 137 |
| Mitsubishi Electric | 13,000 | 69 |
| Mitsubishi Estate | 8,000 | 86 |
| Mitsubishi Gas Chemical § | 4,000 | 20 |
| Mitsubishi Heavy Industries | 25,000 | 67 |
| Mitsubishi Logistics § | 1,000 | 10 |
| Mitsubishi Materials | 6,000 | 14 |
| Mitsubishi Motors * | 5,000 | 6 |
| Mitsubishi Pharmaceutical | 1,000 | 10 |
| Mitsubishi Rayon § | 3,000 | 11 |
| Mitsubishi Securities § | 2,000 | 17 |
| Mitsubishi Tokyo Financial | 27 | 235 |
| Mitsui | 9,000 | 86 |
| Mitsui Chemical | 5,000 | 28 |
| Mitsui Engineering & Shipbuilding § | 5,000 | 11 |
| Mitsui Fudosan | 7,000 | 78 |
| Mitsui Mining & Smelting | 5,000 | 22 |
| Mitsui OSK Lines | 7,000 | 44 |
| Mitsui Sumitomo Insurance | 12,000 | 110 |
| Mitsui Trust Holdings § | 5,000 | 50 |
| Mitsukoshi | 3,000 | 14 |
| Mitsumi Electric | 500 | 6 |
| Mizuho Financial Group | 73 | 344 |
| Mizuho Investors * | 3,000 | 6 |
| Mizuho Trust & Banking § | 14,000 | 25 |
| Mochida Pharmaceutical | 1,000 | 7 |
| Murata Manufacturing | 1,900 | 95 |
| Musashino Bank | 300 | 13 |
| Nagoya Railroad § | 5,000 | 17 |
| Namco | 700 | 9 |
| NEC | 12,000 | 66 |
| NEC Electronics | 200 | 9 |
| Net One Systems § | 3 | 8 |
| NGK Insulators | 2,000 | 21 |
| NGK Spark Plug § | 1,000 | 10 |
| NHK Spring § | 2,000 | 15 |
| Nichicon | 1,100 | 14 |
| Nichii Gakkan | 100 | 3 |
| Nichirei | 2,000 | 7 |
| Nidec | 200 | 24 |
| Nikko Cordial | 12,000 | 56 |
| Nikon | 2,000 | 21 |
| Nintendo | 800 | 92 |
| Nippon Broadcasting System | 50 | 3 |
| Nippon Electric Glass | 2,000 | 32 |
| Nippon Express | 6,000 | 29 |
| Nippon Kayaku | 1,000 | 6 |
| Nippon Light Metal § | 3,000 | 8 |
| Nippon Meat Packer | 1,000 | 13 |
| Nippon Mining | 5,000 | 30 |
| Nippon Oil | 9,000 | 63 |
| Nippon Paint | 1,000 | 4 |
| Nippon Sheet Glass | 3,000 | 12 |
| Nippon Shokubai | 1,000 | 9 |
| Nippon Steel | 42,000 | 107 |
| Nippon Telegraph & Telephone | 43 | 180 |
| Nippon Television Network | 30 | 5 |
| Nippon Unipac Holding | 7 | 30 |
| Nippon Yusen | 8,000 | 47 |
| Nipponkoa Insurance § | 5,000 | 34 |
| Nishi-Nippon Bank § | 4,000 | 16 |
| Nishi-Nippon Railroad § | 2,000 | 6 |
| Nishimatsu Corporation | 1,000 | 4 |
| Nissan Motor | 18,600 | 184 |
| Nissan Chemical Industries § | 2,000 | 17 |
| Nissay Dowa General Insurance § | 1,000 | 5 |
| Nisshin Seifun Group | 1,000 | 10 |
| Nisshin Steel | 5,000 | 13 |
| Nisshinbo Industries | 1,000 | 8 |
| Nissin Food Products | 700 | 19 |
| Nitori | 200 | 14 |
| Nitto Denko | 1,100 | 60 |
| NOK § | 1,000 | 26 |
| Nomura Research Institute | 200 | 19 |
| Nomura Securities | 16,000 | 204 |
| NSK | 3,000 | 15 |
| NTN § | 4,000 | 21 |
| NTT Data | 9 | 28 |
| NTT DoCoMo | 157 | 243 |
| Obayashi | 4,000 | 23 |
| Odakyu Electric Railway § | 4,000 | 23 |
| Ogaki Kyoritsu Bank | 3,000 | 18 |
| Oji Paper | 7,000 | 37 |
| Oki Electric § | 4,000 | 15 |
| Olympus Optical § | 2,000 | 41 |
| OMC Card § | 1,000 | 13 |
| Omron | 2,000 | 44 |
| Ono Pharmaceutical | 700 | 36 |
| Onward Kashiyama | 1,000 | 13 |
| Oracle Japan § | 200 | 9 |
| Orient | 2,000 | 7 |
| Oriental Land | 300 | 19 |
| Orix | 700 | 96 |
| Osaka Gas § | 15,000 | 47 |
| Otsuka | 100 | 8 |
| Park24 § | 400 | 8 |
| Pasona * | 1 | 3 |
| Pioneer § | 1,100 | 19 |
| Privee Zurich Turnaround * | 1,000 | 3 |
| Promise | 850 | 55 |
| Q.P. § | 600 | 5 |
| Resona Holdings *§ | 37,000 | 70 |
| Ricoh | 5,000 | 80 |
| Rinnai § | 300 | 8 |
| Rohm Company | 900 | 85 |
| Ryohin Keikaku § | 200 | 10 |
| Sagami Railway § | 2,000 | 7 |
| San-In Godo Bank | 1,000 | 10 |
| Sanken Electric | 1,000 | 14 |
| Sankyo | 2,400 | 50 |
| Sankyo Seiki § | 1,000 | 9 |
| Sankyo-Gunma | 400 | 20 |
| Santen Pharmaceutical | 500 | 11 |
| Sanyo Electric | 12,000 | 35 |
| Sanyo Shinpan Finance | 100 | 7 |
| Sapporo Breweries | 2,000 | 9 |
| Sapporo Hokuyo Holdings | 1 | 7 |
| Secom | 1,500 | 60 |
| Sega Sammy Holdings | 600 | 35 |
| Seibu Railway | 1,000 | 5 |
| Seiko Epson | 1,200 | 42 |
| Seino Transportation | 1,000 | 10 |
| Seiyu * | 3,000 | 5 |
| Sekisui Chemical | 3,000 | 22 |
| Sekisui House | 4,000 | 42 |
| Seven-Eleven Japan | 3,000 | 85 |
| SFCG | 50 | 13 |
| Sharp | 7,000 | 110 |
| Shiga Bank | 2,000 | 13 |
| Shikoku Electric Power | 1,300 | 26 |
| Shikoku Bank | 1,000 | 6 |
| Shima Seiki | 200 | 6 |
| Shimachu | 300 | 8 |
| Shimadzu | 2,000 | 12 |
| Shimamura | 200 | 17 |
| Shimano | 1,500 | 50 |
| Shimizu | 5,000 | 24 |
| Shin-Etsu Chemical | 2,600 | 96 |
| Shinko Electric | 100 | 3 |
| Shinko Securities | 5,000�� | 16 |
| Shinsei Bank | 4,000 | 22 |
| Shionogi | 2,000 | 28 |
| Shiseido | 2,000 | 26 |
| Shizuoka Bank | 4,000 | 37 |
| Showa Denko | 8,000 | 20 |
| Showa Shell Sekiyu | 900 | 9 |
| Sky Perfect Communications | 4 | 3 |
| Skylark | 600 | 10 |
| SMBS Friend Securities | 1,000 | 6 |
| SMC | 400 | 42 |
| Softbank | 1,300 | 52 |
| Softbank Investment | 20 | 7 |
| Sohgo Security Services | 2,100 | 30 |
| Sompo Japan Insurance | 6,000 | 58 |
| Sony | 7,500 | 277 |
| Square Enix | 300 | 10 |
| Stanley Electric | 1,300 | 21 |
| Sumisho Computer Systems | 1,100 | 26 |
| Sumisho Lease | 100 | 4 |
| Sumitomo | 7,000 | 59 |
| Sumitomo Bakelite | 2,000 | 13 |
| Sumitomo Chemicals | 9,000 | 46 |
| Sumitomo Electric Industries | 4,000 | 42 |
| Sumitomo Forestry | 1,000 | 9 |
| Sumitomo Heavy Industries | 3,000 | 12 |
| Sumitomo Metal Industries | 25,000 | 44 |
| Sumitomo Metal Mining | 5,000 | 35 |
| Sumitomo Mitsui Financial | 38 | 246 |
| Sumitomo Osaka Cement | 4,000 | 10 |
| Sumitomo Realty & Development | 4,000 | 46 |
| Sumitomo Rubber Industries | 2,000 | 20 |
| Sumitomo Trust & Banking | 10,000 | 63 |
| Suruga Bank | 2,000 | 17 |
| Suzuken | 300 | 8 |
| Suzuki Motor | 3,000 | 51 |
| T&D Holdings | 1,500 | 74 |
| Taiheiyo Cement | 6,000 | 17 |
| Taisei | 6,000 | 21 |
| Taisho Pharmaceutical | 2,000 | 43 |
| Taiyo Nippon Sanso | 2,000 | 11 |
| Taiyo Yuden | 1,000 | 10 |
| Takara Holdings | 1,000 | 6 |
| Takashimaya | 2,000 | 18 |
| Takeda Chemical Industries | 5,500 | 269 |
| Takefuji | 490 | 31 |
| Tanabe Seiyaku | 1,000 | 11 |
| TDK | 800 | 56 |
| Teijin | 5,000 | 23 |
| Teikoku Oil | 2,000 | 14 |
| TEPCO | 8,400 | 202 |
| Terumo | 1,100 | 33 |
| The 77 Bank | 2,000 | 14 |
| THK | 1,000 | 19 |
| TIS | 200 | 7 |
| Tobu Railway | 5,000 | 19 |
| Toda | 2,000 | 10 |
| Toho | 1,000 | 16 |
| Toho Gas | 3,000 | 11 |
| Tohoku Electric Power | 3,100 | 60 |
| Tokai Rika | 100 | 2 |
| Tokai Rubber Industries | 500 | 7 |
| Tokuyama | 2,000 | 15 |
| Tokyo Broadcasting System | 200 | 4 |
| Tokyo Electron | 1,000 | 52 |
| Tokyo Gas | 17,000 | 68 |
| Tokyo Steel | 800 | 12 |
| Tokyo Style | 1,000 | 11 |
| Tokyo Tatemono | 2,000 | 14 |
| Tokyu | 7,000 | 34 |
| Tokyu Land | 2,000 | 8 |
| Tomen * | 5,000 | 8 |
| TonenGeneral Sekiyu | 2,000 | 21 |
| Toppan Forms | 100 | 1 |
| Toppan Printing | 4,000 | 44 |
| Toray Industries | 7,000 | 31 |
| Toshiba | 20,000 | 82 |
| Toshiba TEC | 1,000 | 5 |
| Tosoh | 4,000 | 19 |
| TOTO | 2,000 | 17 |
| Toyo Seikan Kaisha | 1,000 | 18 |
| Toyo Suisan Kaisha | 2,000 | 32 |
| Toyobo | 4,000 | 9 |
| Toyoda Gosei | 1,100 | 20 |
| Toyota Industries | 1,100 | 31 |
| Toyota Motor | 22,200 | 810 |
| Toyota Tsusho | 1,000 | 17 |
| Trend Micro | 1,000 | 37 |
| TV Asahi | 2 | 4 |
| Ube Industries | 6,000 | 12 |
| UFJ * | 32 | 169 |
| UFJ Tsubasa Securities | 3,000 | 10 |
| ULVAC * | 200 | 6 |
| Uni-Charm | 300 | 13 |
| Uniden | 1,000 | 20 |
| UNY | 1,000 | 12 |
| Ushio | 1,000 | 19 |
| USS | 190 | 15 |
| Victor Company of Japan | 1,000 | 8 |
| Wacoal | 1,000 | 13 |
| West Japan Railway | 12 | 45 |
| World | 300 | 10 |
| Yahoo Japan | 17 | 38 |
| Yahoo Japan (Bonus shares) | 17 | 38 |
| Yakult Honsha | 1,000 | 20 |
| Yamada Denki | 700 | 34 |
| Yamaguchi Bank | 1,000 | 12 |
| Yamaha | 1,100 | 16 |
| Yamaha Motor | 1,000 | 18 |
| Yamato Transport | 3,000 | 40 |
| Yamazaki Baking | 2,000 | 18 |
| Yaskawa Electric * | 1,000 | 6 |
| Yokogawa Electric | 1,000 | 13 |
| Yokohama Rubber | 2,000 | 8 |
| York-Benimaru | 100 | 3 |
| Yoshinoya D&C | 1 | 2 |
| Zeon | 2,000 | 16 |
| Total Japan (Cost $16,108) | | 16,974 |
| |
| LUXEMBOURG 0.0% | | |
| Common Stocks 0.0% | | |
| SES Global GDR * | 2,050 | 28 |
| Total Luxembourg (Cost $25) | | 28 |
| |
| NETHERLANDS 4.4% | | |
| Common Stocks 4.4% | | |
| ABN AMRO § | 14,782 | 363 |
| Aegon | 13,691 | 172 |
| Akzo Nobel § | 2,352 | 97 |
| ASML *§ | 3,747 | 54 |
| Corio | 492 | 27 |
| DSM | 749 | 50 |
| Heineken § | 2,405 | 77 |
| Heineken Holding | 513 | 15 |
| ING Groep GDS § | 18,026 | 496 |
| Koninklijke Numico * | 1,317 | 55 |
| Philips Electronics | 10,302 | 258 |
| Randstad Holding * | 780 | 32 |
| Reed Elsevier § | 6,703 | 97 |
| Rodamco Europe | 526 | 40 |
| Royal Ahold * | 13,518 | 103 |
| Royal Dutch Petroleum § | 17,186 | 1,006 |
| Royal KPN | 18,864 | 158 |
| TPG | 3,785 | 103 |
| Unilever GDS | 4,683 | 303 |
| VNU | 1,967 | 56 |
| Wolters Kluwer GDS | 2,327 | 42 |
| Total Netherlands (Cost $3,510) | | 3,604 |
| |
| NEW ZEALAND 0.2% | | |
| Common Stocks 0.2% | | |
| Air New Zealand | 395 | 0 |
| Auckland International Airport | 6,088 | 9 |
| Carter Holt Harvey | 3,779 | 5 |
| Contact Energy | 2,280 | 12 |
| Fisher & Paykel Appliances § | 1,226 | 2 |
| Fisher & Paykel Healthcare | 2,983 | 7 |
| Fletcher Building | 3,615 | 16 |
| Independent Newspapers | 3,598 | 16 |
| Infratil | 1,016 | 3 |
| Infratil, Warrants, 7/10/09 * | 203 | 0 |
| Kiwi Income Property Trust, Equity Units | 6,039 | 5 |
| NGC Holdings | 1,302 | 3 |
| Port of Tauranga | 94 | 0 |
| Ports of Auckland | 30 | 0 |
| Sanford | 733 | 2 |
| Sky City Entertainment Group | 3,414 | 11 |
| Sky Network Television | 776 | 4 |
| Telecom Corporation of New Zealand | 16,641 | 74 |
| Tenon * | 219 | 1 |
| Tower * | 2,903 | 4 |
| Warehouse Group | 1,391 | 4 |
| Westpac Trust Investments | 593 | 9 |
| Total New Zealand (Cost $148) | | 187 |
| |
| NORWAY 0.6% | | |
| Common Stocks 0.6% | | |
| DNB Holdings | 7,520 | 72 |
| Norsk Hydro | 1,675 | 133 |
| Norske Skogsindustrier | 1,046 | 18 |
| Orkla | 1,805 | 61 |
| Statoil ASA | 5,811 | 103 |
| Storebrand ASA | 2,177 | 16 |
| Telenor ASA | 6,858 | 58 |
| Yara International * | 1,862 | 25 |
| Total Norway (Cost $390) | | 486 |
| |
| PORTUGAL 0.3% | | |
| Common Stocks 0.3% | | |
| Banco BPI | 4,451 | 18 |
| Banco Comercial § | 20,500 | 55 |
| Banco Espirito Santo § | 591 | 10 |
| Brisa-Auto Estradas | 2,999 | 24 |
| Cimpor-Cimentos de Portugal | 1,569 | 9 |
| Electricidade de Portugal § | 21,438 | 58 |
| Portugal Telecom | 10,074 | 111 |
| PT Multimedia-Servicos * | 295 | 7 |
| Total Portugal (Cost $272) | | 292 |
| |
| SINGAPORE 0.9% | | |
| Common Stocks 0.9% | | |
| Allgreen Properties | 1,000 | 1 |
| BIL International | 9,500 | 7 |
| CapitaCommercial Trust, REIT | 400 | 0 |
| CapitaLand * | 7,000 | 11 |
| Capitamall Trust, REIT | 7,000 | 9 |
| Chartered Semiconductor * | 13,000 | 8 |
| China Aviation Oil Singapore | 1,400 | 1 |
| City Developments | 7,000 | 30 |
| ComfortDelGro | 16,012 | 17 |
| Creative Technology | 350 | 3 |
| Cycle & Carriage | 1,000 | 7 |
| Datacraft Asia (USD) * | 3,000 | 3 |
| DBS Group | 9,000 | 79 |
| Fortune, REIT (HKD) | 2,000 | 2 |
| Fraser & Neave | 1,000 | 9 |
| Haw Par | 1,103 | 3 |
| Hong Leong Finance | 2,000 | 4 |
| iShares MSCI Singapore (USD) | 4,900 | 36 |
| Keppel | 5,000 | 33 |
| Keppel Land * | 2,000 | 3 |
| MobileOne | 5,650 | 7 |
| NatSteel | 4,000 | 5 |
| Neptune Orient Lines | 6,000 | 13 |
| Noble Group | 4,000 | 4 |
| Overseas Chinese Banking | 8,000 | 66 |
| Overseas Union Enterprise | 1,000 | 5 |
| Pacific Century Regional Developments * | 3,600 | 1 |
| Parkway Holdings | 2,000 | 2 |
| People's Food Holdings | 2,000 | 1 |
| Sembcorp | 5,000 | 6 |
| Sembcorp Logistics | 2,520 | 3 |
| Sembcorp Marine | 7,000 | 8 |
| Singapore Airlines | 6,000 | 41 |
| Singapore Exchange | 13,000 | 15 |
| Singapore Land | 1,000 | 4 |
| Singapore Post | 18,000 | 9 |
| Singapore Press | 12,500 | 33 |
| Singapore Technologies | 10,000 | 15 |
| Singapore Telecommunications | 54,642 | 86 |
| Singapore Telecommunications GDR (AUD) | 1,237 | 2 |
| SMRT | 2,000 | 1 |
| Starhub * | 16,000 | 13 |
| Stats ChipPAC * | 8,000 | 5 |
| United Industrial | 5,000 | 3 |
| United Overseas Bank | 9,520 | 83 |
| United Overseas Land | 3,000 | 4 |
| Venture | 2,000 | 17 |
| Want Want Holdings (USD) | 8,000 | 8 |
| Wheelock Properties | 1,000 | 2 |
| Wing Tai Holdings | 1,000 | 1 |
| Total Singapore (Cost $655) | | 729 |
| |
| SPAIN 4.0% | | |
| Common Stocks 4.0% | | |
| Abertis Infraestructuras § | 3,017 | 67 |
| Acciona | 211 | 18 |
| Acerinox § | 2,791 | 42 |
| ACS Actividades | 2,465 | 60 |
| Alba § | 259 | 10 |
| Altadis | 2,211 | 94 |
| Amadeus Global Travel | 2,306 | 22 |
| Antena 3 Television | 696 | 14 |
| Banco Bilbao Vizcaya Argentaria | 29,833 | 464 |
| Banco de Sabadell § | 2,398 | 60 |
| Banco Popular Espanol | 1,362 | 85 |
| Banco Santander Central Hispano | 51,450 | 603 |
| Bankinter | 710 | 35 |
| Cia Espanola de Petroleos | 347 | 13 |
| Corporacion Mapfre | 1,180 | 18 |
| Endesa | 8,301 | 182 |
| FCC | 421 | 23 |
| Gamesa § | 955 | 12 |
| Gas Natural | 1,755 | 50 |
| Gestevision Telecino *§ | 770 | 18 |
| Groupo Prisa | 690 | 13 |
| Grupo Ferrovial § | 548 | 31 |
| Iberdrola | 7,390 | 194 |
| Inditex | 1,953 | 58 |
| Repsol | 9,997 | 255 |
| Sogecable * | 740 | 28 |
| Telefonica | 40,537 | 692 |
| Terra Networks * | 1,811 | 8 |
| Union Fenosa | 2,728 | 82 |
| Vallehermoso § | 1,043 | 18 |
| Zardoya Otis | 680 | 18 |
| Total Spain (Cost $2,830) | | 3,287 |
| |
| SWEDEN 2.4% | | |
| Common Stocks 2.4% | | |
| Assa-Abloy, Series B § | 2,700 | 35 |
| Atlas Copco, Series A § | 1,299 | 59 |
| Atlas Copco, Series B | 244 | 10 |
| Electrolux, Series B § | 2,438 | 49 |
| ForeningsSparbanken | 3,116 | 74 |
| Gambro, Series A | 2,246 | 31 |
| Gambro, Series B § | 455 | 6 |
| Hennes & Mauritz, Series B § | 2,396 | 83 |
| Holmen, Series B § | 485 | 13 |
| Industrivarden, Series A | 1,315 | 29 |
| Industrivarden, Series C | 174 | 3 |
| Investor, Series A | 915 | 12 |
| Investor, Series B § | 5,668 | 74 |
| iShares MSCI Sweden Index (USD) | 3,600 | 72 |
| LM Ericsson | 123,276 | 367 |
| NORDEA | 22,831 | 218 |
| SEB | 5,711 | 101 |
| Sandvik, Series A | 2,085 | 82 |
| Svenska Cellulosa, Series B | 1,749 | 61 |
| Scania, Series B | 782 | 30 |
| Securitas, Series B | 3,115 | 50 |
| Skandia Forsakrings | 8,008 | 38 |
| Skanska | 3,038 | 37 |
| SKF, Series A | 101 | 4 |
| SKF, Series B | 806 | 34 |
| SSAB Svenskt Stal, Series A | 582 | 14 |
| SSAB Svenskt Stal, Series B | 203 | 5 |
| SSAB Svenskt Stal, Rights * | 582 | 0 |
| SSAB Svenskt Stal, Series B, Rights * | 203 | 0 |
| Svenska Handelsbanken, Series A | 5,085 | 115 |
| Swedish Match | 2,751 | 33 |
| Tele2, Series B | 1,110 | 35 |
| TeliaSonera | 18,501 | 97 |
| TeliaSonera (EUR) | 1,303 | 7 |
| Volvo, Series A | 1,045 | 41 |
| Volvo, Series B | 2,400 | 98 |
| Total Sweden (Cost $1,781) | | 2,017 |
| |
| SWITZERLAND 6.8% | | |
| Common Stocks 6.8% | | |
| ABB * | 15,910 | 99 |
| Adecco | 1,083 | 53 |
| Baloise Holding § | 481 | 25 |
| Ciba Specialty Chemicals | 565 | 36 |
| Compagnie Financiere Richemont, Equity Units, Class A | 4,080 | 122 |
| Clariant * | 1,804 | 28 |
| Converium Holding * | 1,141 | 10 |
| Credit Suisse Group *§ | 9,890 | 418 |
| Givaudan *§ | 63 | 40 |
| Holcim | 1,351 | 83 |
| iShares MSCI Switzerland (USD) | 17,000 | 284 |
| Julius Baer | 440 | 29 |
| Kuehne & Nagel * | 54 | 11 |
| Lonza Group § | 485 | 29 |
| Nestle § | 3,238 | 854 |
| Nobel Biocare | 238 | 51 |
| Novartis | 23,128 | 1,130 |
| Pargesa Holdings | 11 | 42 |
| Roche Holding | 115 | 16 |
| Roche Holding Genusscheine NPV | 5,921 | 719 |
| Schindler Holding | 16 | 6 |
| Schindler Holding (Participation certificates) | 24 | 9 |
| Swiss Re | 2,755 | 184 |
| Serono | 43 | 28 |
| Societe Generale de Surveillance | 50 | 34 |
| Straumann Holding | 61 | 13 |
| Swatch (Bearer shares) | 374 | 48 |
| Swatch (Registered shares) | 455 | 12 |
| Swiss Life Holding * | 226 | 31 |
| Swisscom | 207 | 72 |
| Syngenta * | 885 | 92 |
| Synthes | 343 | 39 |
| UBS | 9,225 | 743 |
| Zurich Financial Services * | 1,202 | 204 |
| Total Switzerland (Cost $5,036) | | 5,594 |
| |
| THAILAND 0.0% | | |
| Common Stocks 0.0% | | |
| Total Access Communications (USD) * | 800 | 2 |
| Total Thailand (Cost $2) | | 2 |
| |
| UNITED KINGDOM 24.3% | | |
| Common Stocks 24.3% | | |
| 3i Group | 4,802 | 59 |
| Aegis Group | 11,366 | 21 |
| Alliance & Leicester | 3,536 | 56 |
| Alliance Trust | 394 | 20 |
| Alliance UniChem | 2,094 | 32 |
| Allied Domecq | 9,108 | 120 |
| AMVESCAP | 6,348 | 37 |
| Anglo American | 12,393 | 277 |
| Antofagasta | 612 | 13 |
| Associated British Foods | 3,093 | 44 |
| Associated British Ports | 2,447 | 22 |
| AstraZeneca | 13,432 | 590 |
| Aviva | 18,736 | 212 |
| AWG | 1,116 | 19 |
| BAE Systems | 24,994 | 122 |
| Barclays | 53,025 | 547 |
| BBA Group | 4,203 | 22 |
| BG Group | 29,303 | 227 |
| BHP Billiton | 20,333 | 249 |
| BOC Group | 3,899 | 72 |
| Boots Group | 5,849 | 67 |
| BP | 177,706 | 1,815 |
| BPB | 3,901 | 34 |
| Bradford & Bingley | 6,120 | 36 |
| Brambles | 6,740 | 38 |
| British Airport Authorities | 8,725 | 97 |
| British Airways * | 4,248 | 19 |
| British America Tobacco | 13,329 | 250 |
| British Land | 4,444 | 70 |
| British Sky Broadcasting | 11,340 | 118 |
| British Telecommunications | 71,929 | 276 |
| Bunzl | 4,128 | 40 |
| Burberry Group | 1,190 | 8 |
| Cable & Wireless | 18,716 | 43 |
| Cadbury Schweppes | 17,661 | 178 |
| Cairn Energy * | 1,505 | 33 |
| Capita Group | 6,102 | 44 |
| Carnival | 1,696 | 88 |
| Centrica | 29,565 | 125 |
| Cobham | 870 | 22 |
| Compass Group | 18,966 | 85 |
| Corus Group * | 41,696 | 35 |
| Daily Mail & General Trust | 2,232 | 28 |
| Diageo | 24,831 | 369 |
| Dixons Group | 15,174 | 41 |
| DX Services | 678 | 5 |
| Electrocomponents | 3,395 | 15 |
| Emap | 2,403 | 37 |
| EMI | 7,474 | 34 |
| Enterprise Inns | 2,732 | 38 |
| Exel | 2,320 | 37 |
| Foreign & Colonial Investment | 7,143 | 26 |
| Friends Provident | 15,549 | 48 |
| Gallaher Group | 5,079 | 79 |
| GKN | 6,911 | 31 |
| GlaxoSmithKline | 48,512 | 1,224 |
| Group 4 Securicor * | 9,863 | 25 |
| GUS | 7,875 | 126 |
| Hammerson | 2,164 | 35 |
| Hanson | 5,745 | 53 |
| Hays | 15,537 | 39 |
| HBOS | 31,825 | 472 |
| Henderson Group * | 10,000 | 12 |
| Hilton Group | 12,335 | 65 |
| HSBC | 91,266 | 1,463 |
| ICAP | 3,549 | 18 |
| Imperial Chemical | 9,360 | 45 |
| Imperial Tobacco | 5,708 | 164 |
| InterContinental Hotels | 4,878 | 58 |
| International Power * | 11,591 | 40 |
| Invesys * | 41,576 | 10 |
| iShares MSCI United Kingdom (USD) | 49,800 | 892 |
| J Sainsbury | 9,911 | 54 |
| Jardine Lloyd Thomson Group | 2,013 | 13 |
| Johnson Matthey | 2,062 | 36 |
| Johnston Press | 2,224 | 21 |
| Kelda Group | 3,425 | 41 |
| Kesa Electricals | 5,100 | 26 |
| Kingfisher | 18,354 | 87 |
| Land Securities | 3,824 | 98 |
| Legal & General Group | 50,716 | 102 |
| Liberty International | 2,521 | 46 |
| Lloyds TSB | 45,726 | 394 |
| Logica | 5,849 | 18 |
| Lonmin | 1,106 | 19 |
| Man Group | 2,411 | 56 |
| Marks & Spencer | 14,554 | 94 |
| Matalan | 1,523 | 5 |
| Misys | 4,390 | 17 |
| Mitchells & Butlers | 4,947 | 28 |
| National Grid | 25,364 | 250 |
| Next | 2,065 | 59 |
| Northern Rock | 3,309 | 47 |
| O2 * | 73,659 | 166 |
| Old Mutual | 29,964 | 72 |
| Pearson | 6,227 | 76 |
| Peninsular & Oriental Steam | 5,766 | 30 |
| Persimmon | 2,747 | 36 |
| Premier Farnell | 4,771 | 14 |
| Provident Financial | 2,482 | 32 |
| Prudential | 19,812 | 179 |
| Rank Group | 4,646 | 23 |
| Reckitt Benckiser | 5,937 | 193 |
| Reed Elsevier | 10,457 | 102 |
| Rentokil Group | 14,149 | 43 |
| Reuters | 12,555 | 93 |
| Rexam | 4,269 | 38 |
| Rio Tinto | 8,958 | 271 |
| Rolls-Royce * | 13,158 | 60 |
| Rolls-Royce, Class B | 587,900 | 1 |
| Royal & Sun | 27,567 | 40 |
| Royal Bank of Scotland | 25,989 | 786 |
| SABMiller | 8,622 | 128 |
| Sage Group | 10,076 | 38 |
| Schroders | 1,918 | 25 |
| Schroders (Non-Voting Shares) | 434 | 5 |
| Scottish & Newcastle | 6,968 | 61 |
| Scottish & Southern Energy | 6,915 | 124 |
| Scottish Mortgage | 2,347 | 15 |
| Scottish Power | 15,169 | 123 |
| Severn Trent | 2,705 | 50 |
| Shell Transport & Trading | 78,785 | 707 |
| Shire Pharmaceuticals | 3,761 | 39 |
| Signet Group | 16,143 | 31 |
| Slough Estates | 3,901 | 36 |
| Smith & Nephew | 7,715 | 80 |
| Smiths Group | 4,758 | 78 |
| Standard Chartered | 10,859 | 196 |
| Tate & Lyle | 4,592 | 41 |
| Tesco | 63,646 | 377 |
| TI Automotive, Class A * | 270 | 0 |
| Tomkins | 7,172 | 34 |
| Travis Perkins | 900 | 28 |
| Trinity Mirror | 2,789 | 34 |
| Unilever | 23,912 | 228 |
| United Business Media | 2,613 | 25 |
| United Utilities | 5,695 | 69 |
| United Utilities, Class A | 984 | 9 |
| Vodafone | 531,798 | 1,391 |
| WH Smith | 2,203 | 14 |
| Whitbread | 2,319 | 38 |
| William Hill | 3,761 | 39 |
| William Morrison Supermarkets | 23,345 | 87 |
| Witan Investment Trust | 2,654 | 17 |
| Wolseley | 4,830 | 97 |
| WPP Group | 10,547 | 115 |
| Xstrata | 3,707 | 64 |
| Yell Group | 5,437 | 42 |
| Total United Kingdom (Cost $18,161) | | 20,062 |
| |
| SHORT-TERM INVESTMENTS 0.3% | | |
| Money Market Funds 0.3% | | |
| T. Rowe Price Reserve Investment Fund, 2.93% #† | 264,510 | 264 |
| Total Short-Term Investments (Cost $264) | | 264 |
| |
| SECURITIES LENDING COLLATERAL 18.6% | | |
| Money Market Pooled Account 18.6% | | |
| Investment in money market pooled account managed by JP | | |
| Morgan Chase Bank, London, 2.902% # | 15,412,662 | 15,413 |
| Total Securities Lending Collateral (Cost $15,413) | | 15,413 |
| |
| Total Investments in Securities | | |
| 118.9% of Net Assets (Cost $91,011) | | 98,328 |
| (1) | Denominated in currency of country of | | |
| | incorporation unless otherwise noted | | |
| # | Seven-day yield | † | Affiliated company – See Note 5 |
| * | Non-income producing | ADS | American Depository Shares |
| § | All or a portion of this security is on loan | AUD | Australian dollar |
| | at April 30, 2005 – See Note 2 | EUR | Euro |
| ++ | At April 30, 2005, a substantial number | GDR | Global Depository Receipts |
| | of the fund’s international securities were | GDS | Global Depository Shares |
| | valued by the T. Rowe Price Valuation | HKD | Hong Kong dollar |
| | Committee, established by the fund’s | REIT | Real Estate Investment Trust |
| | Board of Directors. See Note 1 | USD | U.S. dollar |
| |
| |
| The accompanying notes are an integral part of these financial statements. |
| STATEMENT OF ASSETS AND LIABILITIES |
| (In thousands except shares and per share amounts) | | |
| Assets | | |
| Investments in securities, at value | | |
| Affiliated companies (cost $264) | $ | 264 |
| Non-affiliated companies (cost $90,747) | | 98,064 |
|
|
| Total investments in securities | | 98,328 |
| Dividends receivable | | 339 |
| Receivable for investment securities sold | | 12 |
| Receivable for shares sold | | 101 |
| Other assets | | 39 |
|
|
| Total assets | | 98,819 |
|
|
| |
| Liabilities | | |
| Payable for investment securities purchased | | 585 |
| Payable for shares redeemed | | 67 |
| Obligation to return securities lending collateral | | 15,413 |
| Due to affiliates | | 41 |
| Other liabilities | | 9 |
|
|
| Total liabilities | | 16,115 |
|
|
| |
| NET ASSETS | $ | 82,704 |
|
|
| Net Assets Consist of: | | |
| Undistributed net investment income (loss) | $ | 684 |
| Undistributed net realized gain (loss) | | (363) |
| Net unrealized gain (loss) | | 7,319 |
| Paid-in-capital applicable to 7,938,615 shares of | | |
| $0.01 par value capital stock outstanding; | | |
| 1,000,000,000 shares of the Corporation authorized | | 75,064 |
|
|
| |
| NET ASSETS | $ | 82,704 |
|
|
| |
| NET ASSET VALUE PER SHARE | $ | 10.42 |
|
|
| |
| |
| |
| |
| The accompanying notes are an integral part of these financial statements. | | |
Unaudited
| ($ 000s) | | |
| | | 6 Months |
| | | Ended |
| | | 4/30/05 |
| Investment Income (Loss) | | |
| Income | | |
| Dividend (net of foreign taxes of $77) | $ | 993 |
| Securities lending | | 26 |
|
|
| Total income | | 1,019 |
| Investment management and administrative expense | | 167 |
|
|
| Net investment income (loss) | | 852 |
|
|
| |
| Realized and Unrealized Gain (Loss) | | |
| Net realized gain (loss) | | |
| Securities | | 162 |
| Foreign currency transactions | | 7 |
|
|
| Net realized gain (loss) | | 169 |
|
|
| Change in net unrealized gain (loss) | | |
| Securities | | 2,951 |
| Other assets and liabilities | | |
| denominated in foreign currencies | | 1 |
|
|
| Change in net unrealized gain (loss) | | 2,952 |
|
|
| Net realized and unrealized gain (loss) | | 3,121 |
|
|
| |
| INCREASE (DECREASE) IN NET | | |
| ASSETS FROM OPERATIONS | $ | 3,973 |
|
|
| |
| |
| |
| |
| The accompanying notes are an integral part of these financial statements. | | |
Unaudited
| STATEMENT OF CHANGES IN NET ASSETS |
| ($ 000s) | | | | |
| | | 6 Months | | Year |
| | | Ended | | Ended |
| | | 4/30/05 | | 10/31/04 |
| |
| Increase (Decrease) in Net Assets | | | | |
| Operations | | | | |
| Net investment income (loss) | $ | 852 | $ | 674 |
| Net realized gain (loss) | | 169 | | 42 |
| Change in net unrealized gain (loss) | | 2,952 | | 4,062 |
|
|
| Increase (decrease) in net assets from operations | | 3,973 | | 4,778 |
|
|
| |
| Distributions to shareholders | | | | |
| Net investment income | | (798) | | (338) |
| Net realized gain | | (53) | | (26) |
|
|
| Decrease in net assets from distributions | | (851) | | (364) |
|
|
| |
| Capital share transactions * | | | | |
| Shares sold | | 36,720 | | 28,624 |
| Distributions reinvested | | 758 | | 310 |
| Shares redeemed | | (6,240) | | (5,635) |
| Redemption fees | | 4 | | 5 |
|
|
| Increase (decrease) in net assets from capital | | | | |
| share transactions | | 31,242 | | 23,304 |
|
|
| |
| Net Assets | | | | |
| Increase (decrease) during period | | 34,364 | | 27,718 |
| Beginning of period | | 48,340 | | 20,622 |
|
|
| |
| End of period | $ | 82,704 | $ | 48,340 |
|
|
| (Including undistributed net investment income of | | | | |
| $684 at 4/30/05 and $630 at 10/31/04) | | | | |
| |
| *Share information | | | | |
| Shares sold | | 3,482 | | 3,090 |
| Distributions reinvested | | 74 | | 36 |
| Shares redeemed | | (589) | | (616) |
|
|
| Increase (decrease) in shares outstanding | | 2,967 | | 2,510 |
| |
| |
| |
| |
| The accompanying notes are an integral part of these financial statements. | | | | |
| NOTES TO FINANCIAL STATEMENTS |
NOTE 1 - SIGNIFICANT ACCOUNTING POLICIES
T. Rowe Price International Index Fund, Inc. (the corporation) is registered under the Investment Company Act of 1940 (the 1940 Act). The International Equity Index Fund (the fund), a diversified, open-end management investment company, is one portfolio established by the corporation. The fund commenced operations on November 30, 2000. The fund seeks to provide long-term capital growth, using the FTSE™ International Limited Developed ex North America Index.
The accompanying financial statements were prepared in accordance with accounting principles generally accepted in the United States of America, which require the use of estimates made by fund management.
Valuation The fund values its investments and computes its net asset value per share at the close of the New York Stock Exchange (NYSE), normally 4 p.m. ET, each day that the NYSE is open for business. Equity securities listed or regularly traded on a securities exchange or in the over-the-counter market are valued at the last quoted sale price or, for certain markets, the official closing price at the time the valuations are made, except for OTC Bulletin Board securities, which are valued at the mean of the latest bid and asked prices. A security that is listed or traded on more than one exchange is valued at the quotation on the exchange determined to be the primary market for such security. Listed securities not traded on a particular day are valued at the mean of the latest bid and asked prices for domestic securities and the last quoted sale price for international securities.
Investments in mutual funds are valued at the mutual fund’s closing net asset value per share on the day of valuation.
Other investments, including restricted securities, and those for which the above valuation procedures are inappropriate or are deemed not to reflect fair value are stated at fair value as determined in good faith by the T. Rowe Price Valuation Committee, established by the fund’s Board of Directors.
Most foreign markets close before the close of trading on the NYSE. If the fund determines that developments between the close of a foreign market and the close of the NYSE will, in its judgment, materially affect the value of some or all of its portfolio securities, which in turn will affect the fund’s share price, the fund will adjust the previous closing prices to reflect the fair value of the securities as of the close of the NYSE, as determined in good faith by the T. Rowe Price Valuation Committee, established by the fund’s Board of Directors. A fund may also fair value securities in other situations, such as when a particular foreign market is closed but the fund is open. In deciding whether to make fair value adjustments, the fund reviews a variety of factors, including developments in foreign markets, the performance of U.S. securities markets, and the performance of instruments trading in U. S. markets that represent foreign securities and baskets of foreign securities. The fund uses outside pricing services to provide it with closing market prices and information used for adjusting those prices. The fund cannot predict how often it will use closing prices and how often it will adjust those prices. As a means of evaluating its fair value process, the fund routinely compares closing market prices, the next day’s opening prices in the same markets, and adjusted prices.
Currency Translation Assets, including investments, and liabilities denominated in foreign currencies are translated into U.S. dollar values each day at the prevailing exchange rate, using the mean of the bid and asked prices of such currencies against U.S. dollars as quoted by a major bank. Purchases and sales of securities, income, and expenses are translated into U.S. dollars at the prevailing exchange rate on the date of the transaction. The effect of changes in foreign currency exchange rates on realized and unrealized security gains and losses is reflected as a component of security gains and losses.
Redemption Fees A 2% fee is assessed on redemptions of fund shares held less than 90 days to deter short-term trading and protect the interests of long-term shareholders. Redemption fees are withheld from proceeds that shareholders receive from the sale or exchange of fund shares. The fees are paid to the fund, and are recorded as an increase to paid-in capital. The fees may cause the redemption price per share to differ from the net asset value per share.
Investment Transactions, Investment Income, and Distributions Income and expenses are recorded on the accrual basis. Dividends received from mutual fund investments are reflected as dividend income; capital gain distributions are reflected as realized gain/loss. Dividend income and capital gain distributions are recorded on the ex-dividend date. Investment transactions are accounted for on the trade date. Realized gains and losses are reported on the identified cost basis. Distributions to shareholders are recorded on the ex-dividend date. Income distributions are declared and paid on an annual basis. Capital gain distributions, if any, are declared and paid by the fund, typically on an annual basis.
Other In the normal course of business, the fund enters into contracts that provide general indemnifications. The fund’s maximum exposure under these arrangements is dependent on claims that may be made against the fund in the future and, therefore, cannot be estimated; however, based on experience, the risk of material loss from such claims is considered remote.
NOTE 2 - INVESTMENT TRANSACTIONS
Consistent with its investment objective, the fund engages in the following practices to manage exposure to certain risks or enhance performance. The investment objective, policies, program, and risk factors of the fund are described more fully in the fund’s prospectus and Statement of Additional Information.
Securities Lending The fund lends its securities to approved brokers to earn additional income. It receives as collateral cash and U.S. government securities valued at 102% to 105% of the value of the securities on loan. Cash collateral is invested in a money market pooled account managed by the fund’s lending agent in accordance with investment guidelines approved by fund management. Collateral is maintained over the life of the loan in an amount not less than the value of loaned securities, as determined at the close of fund business each day; any additional collateral required due to changes in security values is delivered to the fund the next business day. Although risk is mitigated by the collateral, the fund could experience a delay in recovering its securities and a possible loss of income or value if the borrower fails to return the securities. Securities lending revenue recognized by the fund consists of earnings on invested collateral and borrowing fees, net of any rebates to the borrower and compensation to the lending agent. At April 30, 2005, the value of loaned securities was $14,750,000; aggregate collateral consisted of $15,413,000 in the money market pooled account.
Other Purchases and sales of portfolio securities, other than short-term securities, aggregated $58,425,000 and $27,244,000, respectively, for the six months ended April 30, 2005.
NOTE 3 - FEDERAL INCOME TAXES
No provision for federal income taxes is required since the fund intends to continue to qualify as a regulated investment company under Subchapter M of the Internal Revenue Code and distribute to shareholders all of its taxable income and gains. Federal income tax regulations differ from generally accepted accounting principles; therefore, distributions determined in accordance with tax regulations may differ in amount or character from net investment income and realized gains for financial reporting purposes. Financial reporting records are adjusted for permanent book/tax differences to reflect tax character. Financial records are not adjusted for temporary differences. The amount and character of tax-basis distributions and composition of net assets are finalized at fiscal year-end; accordingly, tax-basis balances have not been determined as of April 30, 2005.
The fund intends to retain realized gains to the extent of available capital loss carryforwards. As of October 31, 2004, the fund had $449,000 of unused capital loss carryforwards, of which $80,000 expire in fiscal 2009, $285,000 expire in fiscal 2010, and $84,000 expire in fiscal 2011.
At April 30, 2005, the cost of investments for federal income tax purposes was $91,011,000. Net unrealized gain aggregated $7,319,000 at period-end, of which $8,946,000 related to appreciated investments and $1,627,000 related to depreciated investments.
NOTE 4 - FOREIGN TAXES
The fund is subject to foreign income taxes imposed by certain countries in which it invests. Foreign income taxes are accrued by the fund as a reduction of income.
NOTE 5 - RELATED PARTY TRANSACTIONS
The fund is managed by T. Rowe Price International, Inc. (the manager), a wholly owned subsidiary of T. Rowe Price Associates, Inc. (Price Associates), which is wholly owned by T. Rowe Price Group, Inc. The investment management and administrative agreement between the fund and the manager provides for an all-inclusive annual fee equal to 0.50% of the fund’s average daily net assets. The fee is computed daily and paid monthly. The agreement provides that investment management, shareholder servicing, transfer agency, accounting, and custody services are provided to the fund, and interest, taxes, brokerage commissions, directors’ fees and expenses, and extraordinary expenses are paid directly by the fund.
The fund may invest in the T. Rowe Price Reserve Investment Fund and the T. Rowe Price Government Reserve Investment Fund (collectively, the Reserve Funds), open-end management investment companies managed by Price Associates and affiliates of the fund. The Reserve Funds are offered as cash management options to mutual funds, trusts, and other accounts managed by Price Associates and/or its affiliates, and are not available for direct purchase by members of the public. The Reserve Funds pay no investment management fees. During the six months ended April 30, 2005, dividend income from the Reserve Funds totaled $6,000, and the value of shares of the Reserve Funds held at April 30, 2005 and October 31, 2004 was $264,000 and $1,288,000, respectively.
As of April 30, 2005, T. Rowe Price Group, Inc. and/or its wholly owned subsidiaries owned 320,000 shares of the fund, representing 4% of the fund’s net assets.
| INFORMATION ON PROXY VOTING POLICIES, PROCEDURES, AND RECORDS |
A description of the policies and procedures used by T. Rowe Price funds and portfolios to determine how to vote proxies relating to portfolio securities is available in each fund’s Statement of Additional Information, which you may request by calling 1-800-225-5132 or by accessing the SEC’s Web site, www.sec.gov. The description of our proxy voting policies and procedures is also available on our Web site, www.troweprice.com. To access it, click on the words “Company Info” at the top of our homepage for individual investors. Then, in the window that appears, click on the “Proxy Voting Policy” navigation button in the top left corner.
Each fund’s most recent annual proxy voting record is available on our Web site and through the SEC’s Web site. To access it through our Web site, follow the directions above, then click on the words “Proxy Voting Record” at the bottom of the Proxy Voting Policy page.
| HOW TO OBTAIN QUARTERLY PORTFOLIO HOLDINGS |
The fund files a complete schedule of portfolio holdings with the Securities and Exchange Commission for the first and third quarters of each fiscal year on Form N-Q. The fund’s Form N-Q is available electronically on the SEC’s Web site (www.sec.gov); hard copies may be reviewed and copied at the SEC’s Public Reference Room, 450 Fifth St. N.W., Washington, DC 20549. For more information on the Public Reference Room, call 1-800-SEC-0330.
| APPROVAL OF INVESTMENT MANAGEMENT AGREEMENT |
On March 2, 2005, the fund’s Board of Directors unanimously approved the investment advisory contract (“Contract”) between the fund and its investment manager, T. Rowe Price International, Inc. (“Manager”). The Board considered a variety of factors in connection with its review of the Contract, also taking into account information provided by the Manager during the course of the year, as discussed below:
Services Provided by the Manager
The Board considered the nature, quality, and extent of the services provided to the fund by the Manager. These services included but were not limited to management of the fund’s portfolio and a variety of activities related to portfolio management. The Board also reviewed the background and experience of the Manager’s senior management team and investment personnel involved in the management of the fund. The Board had previously conducted a detailed review of the organization, structure, and investment teams of the Manager at a meeting held in October 2004. The Board concluded that it was satisfied with the nature, quality, and extent of the services provided by the Manager.
Investment Performance of the Fund
The Board reviewed the fund’s average annual total return over the one- and three-year and since-inception periods as well as the fund’s year-by-year returns and compared these returns to a wide variety of previously agreed upon comparable performance measures and market data, including those supplied by Lipper and Morningstar, which are independent providers of mutual fund data. On the basis of this evaluation and the Board’s ongoing review of investment results, the Board concluded that the fund’s performance was satisfactory.
Costs, Benefits, Profits, and Economies of Scale
The Board was provided with detailed information regarding the revenues received by the Manager under the Contract and other benefits that the Manager (and its affiliates) may have realized from its relationship with the fund (including research received under “soft dollar” agreements). The Board also received information on the estimated costs incurred and profits realized by the Manager and its affiliates from advising T. Rowe Price mutual funds. Because the Manager is currently waiving its fee, the Board was not provided with estimates of the gross profits realized from managing the fund in particular. The Board concluded that the Manager’s profits were reasonable in light of the services provided to the fund. In this regard, the Board noted that the advisory fees were being waived. The Board also considered the extent to which economies of scale were being realized by the Manager and concluded that the Manager had not realized any material economies of scale from managing the fund.
Fees
The Board reviewed the fund’s management fee rate, operating expenses, and total expense ratio and compared them to fees and expenses of other comparable funds based on information and data supplied by Lipper. The information provided to the Board showed that the fund’s management fee (after waivers) and expense ratio were generally below the median of comparable funds. The Board also reviewed the fee schedules for comparable privately managed accounts of the Manager and its affiliates. Management informed the Board that the Manager’s responsibilities for privately managed accounts are more limited than its responsibilities for the fund and other T. Rowe Price mutual funds that it or its affiliates advise. On the basis of the information provided, the Board concluded that the fees paid by the fund under the Contract were reasonable.
Approval of the Contract
As noted, the Board approved the continuation of the Contract. No single factor was considered in isolation or to be determinative to the decision. Rather, the Board concluded that, in light of a weighting and balancing of all factors considered, it was in the best interests of the fund to approve the continuation of the Contract including the fees to be charged for services thereunder.
Item 2. Code of Ethics.
A code of ethics, as defined in Item 2 of Form N-CSR, applicable to its principal executive officer, principal financial officer, principal accounting officer or controller, or persons performing similar functions is filed as an exhibit to the registrant’s annual Form N-CSR. No substantive amendments were approved or waivers were granted to this code of ethics during the registrant’s most recent fiscal half-year.
Item 3. Audit Committee Financial Expert.
Disclosure required in registrant’s annual Form N-CSR.
Item 4. Principal Accountant Fees and Services.
Disclosure required in registrant’s annual Form N-CSR.
Item 5. Audit Committee of Listed Registrants.
Not applicable.
Item 6. Schedule of Investments.
Not applicable. The complete schedule of investments is included in Item 1 of this Form N-CSR.
Item 7. Disclosure of Proxy Voting Policies and Procedures for Closed-End Management Investment Companies.
Not applicable.
Item 8. Portfolio Managers of Closed-End Management Investment Companies.
Not applicable.
Item 9. Purchases of Equity Securities by Closed-End Management Investment Company and Affiliated Purchasers.
Not applicable.
Item 10. Submission of Matters to a Vote of Security Holders.
Not applicable.
Item 11. Controls and Procedures.
(a) The registrant’s principal executive officer and principal financial officer have evaluated the registrant’s disclosure controls and procedures within 90 days of this filing and have concluded that the registrant’s disclosure controls and procedures were effective, as of that date, in ensuring that information required to be disclosed by the registrant in this Form N-CSR was recorded, processed, summarized, and reported timely.
(b) The registrant’s principal executive officer and principal financial officer are aware of no change in the registrant’s internal control over financial reporting that occurred during the registrant’s second fiscal quarter covered by this report that has materially affected, or is reasonably likely to materially affect, the registrant’s internal control over financial reporting.
| Item 12. Exhibits. |
| |
| (a)(1) The registrant’s code of ethics pursuant to Item 2 of Form N-CSR is filed with the registrant’s |
| annual Form N-CSR. |
| |
| (2) Separate certifications by the registrant's principal executive officer and principal financial |
| officer, pursuant to Section 302 of the Sarbanes-Oxley Act of 2002 and required by Rule 30a-2(a) |
| under the Investment Company Act of 1940, are attached. |
| |
| (3) Written solicitation to repurchase securities issued by closed-end companies: not applicable. |
| |
| (b) A certification by the registrant's principal executive officer and principal financial officer, |
| pursuant to Section 906 of the Sarbanes-Oxley Act of 2002 and required by Rule 30a-2(b) under the |
| Investment Company Act of 1940, is attached. |
Pursuant to the requirements of the Securities Exchange Act of 1934 and the Investment Company Act of 1940, the registrant has duly caused this report to be signed on its behalf by the undersigned, thereunto duly authorized.
T. Rowe Price International Index Fund, Inc.
| By | /s/ James S. Riepe |
| | James S. Riepe |
| | Principal Executive Officer |
| |
| Date | June 16, 2005 |
Pursuant to the requirements of the Securities Exchange Act of 1934 and the Investment Company Act of 1940, this report has been signed below by the following persons on behalf of the registrant and in the capacities and on the dates indicated.
| By | /s/ James S. Riepe |
| | James S. Riepe |
| | Principal Executive Officer |
| |
| Date | June 16, 2005 |
| |
| |
| |
| By | /s/ Joseph A. Carrier |
| | Joseph A. Carrier |
| | Principal Financial Officer |
| |
| Date | June 16, 2005 |