Item 1: Report to Shareholders| International Equity Index Fund | October 31, 2006 |
The views and opinions in this report were current as of October 31, 2006. They are not guarantees of performance or investment results and should not be taken as investment advice. Investment decisions reflect a variety of factors, and the managers reserve the right to change their views about individual stocks, sectors, and the markets at any time. As a result, the views expressed should not be relied upon as a forecast of the fund’s future investment intent. The report is certified under the Sarbanes-Oxley Act of 2002, which requires mutual funds and other public companies to affirm that, to the best of their knowledge, the information in their financial reports is fairly and accurately stated in all material respects.
REPORTS ON THE WEB
Sign up for our E-mail Program, and you can begin to receive updated fund reports and prospectuses online rather than through the mail. Log in to your account at troweprice.com for more information.
Fellow Shareholders
During the last six months, non-U.S. stocks slowed down from the blistering pace they had set earlier in the year and performed in line with their U.S. counterparts. Non-U.S. markets experienced an abrupt decline in May and June, but by the end of October most regional markets had regained much of the ground they lost. All the regions we invest in delivered solid returns. Strong currencies in Europe enhanced returns for U.S. investors.
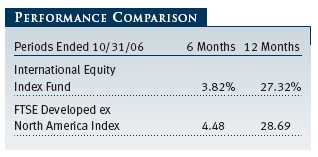
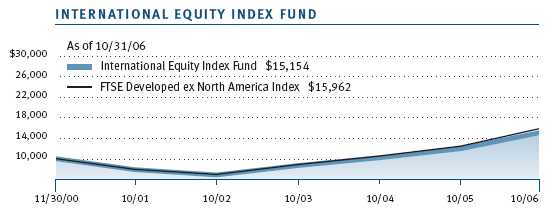
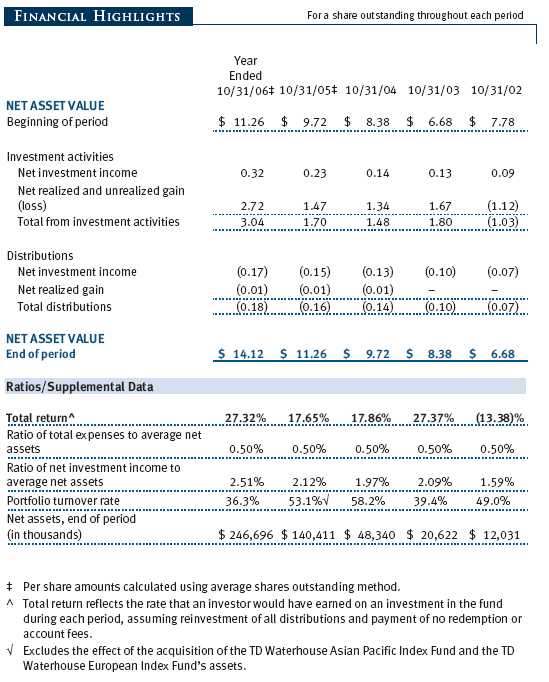
The fund returned 3.82% over the six months ended October 31, 2006, versus 4.48% for the FTSE Developed ex North America Index. The fund produced a very strong return of 27.32% for the 12-month period that covers our fiscal year, but it slightly underperformed its benchmark. Fund results relative to the benchmark primarily reflect the fund’s operating and management expenses as well as taxes. The fund gives shareholders exposure to non-U.S. stocks by seeking to match the performance of the FTSE Developed ex North America Index, a broadly diversified stock market index based on the investable market capitalization of more than 1,000 predominantly larger companies listed in 21 countries (the index’s performance reflects no operational costs, management fees, or taxes). The index’s major markets include the U.K., Japan, and developed countries in Europe and the Pacific Rim. It is constructed by sorting the market in each country in the index by industry groups and targeting a significant portion of the stocks in these groups for inclusion. The fund attempts to replicate the index by investing in the stocks included in the index in proportion to their weighting.
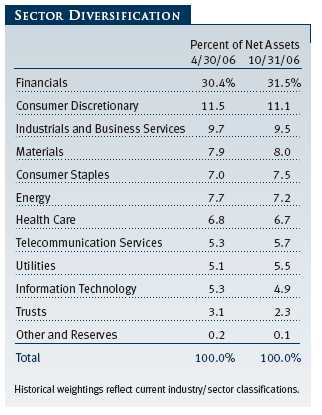
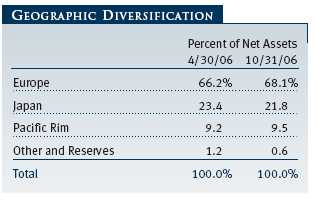
At the end of October, Europe represented 68.1% of net assets, with Japan and the Pacific Rim representing most of the balance. The U.K. was the largest country allocation, followed closely by Japan (see the Geographic Diversification table on page 4 in this report for a breakdown of regional allocations). Financial stocks were the largest sector weighting at 31.5% of assets, followed by consumer discretionary stocks (11.1%), industrials and business services (9.5%), materials (8.0%), consumer staples (7.5%), and energy (7.2%).
MARKET REVIEW
Risk-averse investors pulled the rug out from under non-U.S. markets in May and June, but strong economic and corporate fundamentals helped the markets overcome that decline. By the end of this reporting period, most non-U.S. markets posted positive returns for the most recent six-month period. Energy prices, which had climbed to record levels in the first half of 2006, moderated through the summer and early fall. Although there were no obvious signs of global inflation, the central banks of the world’s three largest economies—the U.S., the European Union (EU), and Japan—raised interest rates to maintain the world’s steady yet non-inflationary economic expansion. The dollar was stronger against the yen, weakening results for U.S. investors in that market, although the dollar weakness versus the euro boosted results.
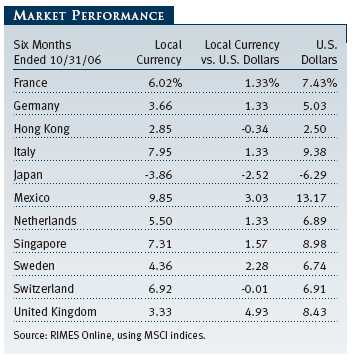
Among developed markets, Europe benefited from improving economies, strong exports, and increased merger activity. Domestic demand and a steady flow of exports helped improve business sentiment across the continent. The German Ifo survey, which tracks business confidence in Europe’s largest national economy, continued to climb to levels not seen in the past 15 years. Even though Italy’s growth lagged relative to other European economies, its business sentiment reached its highest levels in six years. Across Europe, demand for loans picked up, and many companies increased their plant and machinery investments and added to their inventories. In the face of rising economic activity, the European Central Bank (ECB) raised interest rates, and the equity market absorbed the news without much disruption. The bond market expects the ECB to raise rates again before the end of 2006. Improving economic data and strong merger activity appear to have offset investors’ fears that the ECB’s rate increases, uneven EU economic growth, and political unrest would slow down Europe’s markets.
Japan’s economic recovery gathered strength from its export-oriented industries and corporate capital expenditures. However, Japanese consumers remained on the sidelines, and that lack of strong domestic consumption added to fears that Japan’s current expansion might lose momentum should U.S. consumers curtail their spending. The extended rally in emerging markets came to an abrupt halt in May. As part of its effort to jump-start the Japanese economy, the Bank of Japan (BOJ) had been pumping billions of dollars into the country’s economy. The BOJ loans carried no interest charge, and investors had been using this cheap money to invest in other markets. In May, the central bank ended its zero interest rate policy and withdrew more than $100 billion of liquidity from the global financial system. This abrupt loss of liquidity caused many investors to liquidate their more risky investments and precipitated a sharp drop in international markets in May and June.
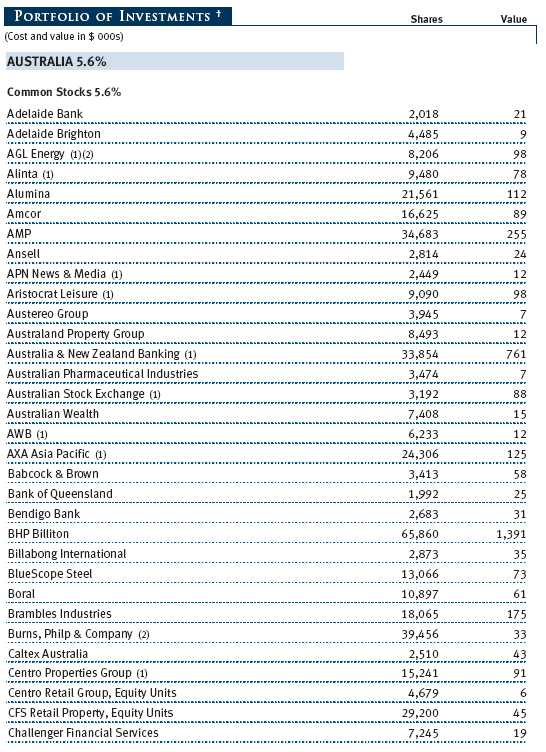
Developed Pacific Rim markets also gained during the six-month period. Australia, as well as many of the countries throughout Southeast Asia, benefited from China’s strong demand for raw materials and energy. Singapore posted the strongest results for the region, and New Zealand the weakest.
Value stocks reasserted their dominance and outperformed growth. Among sectors in developed markets, the best performer was utilities, followed by telecommunication services and consumer staples. Information technology was the worst performer along with energy and industrials.
PORTFOLIO HIGHLIGHTS
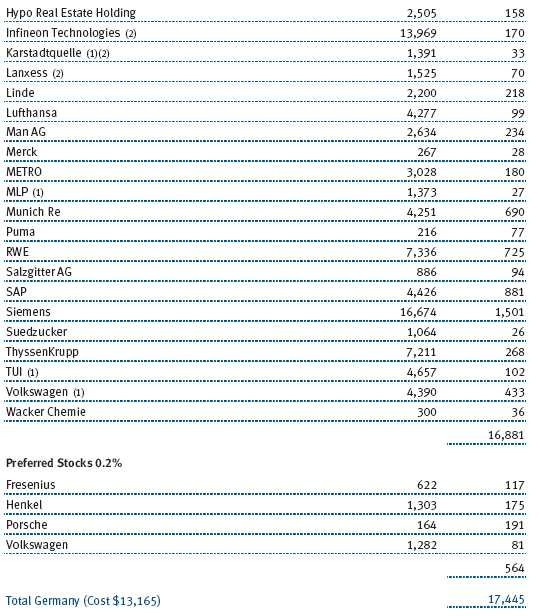
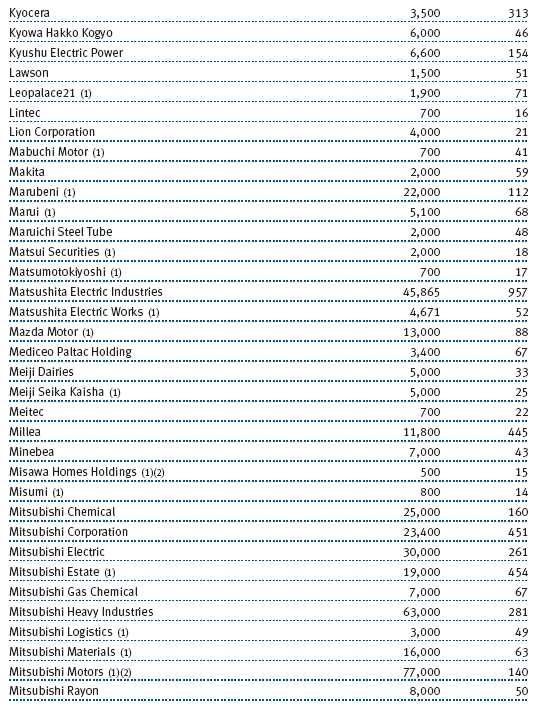
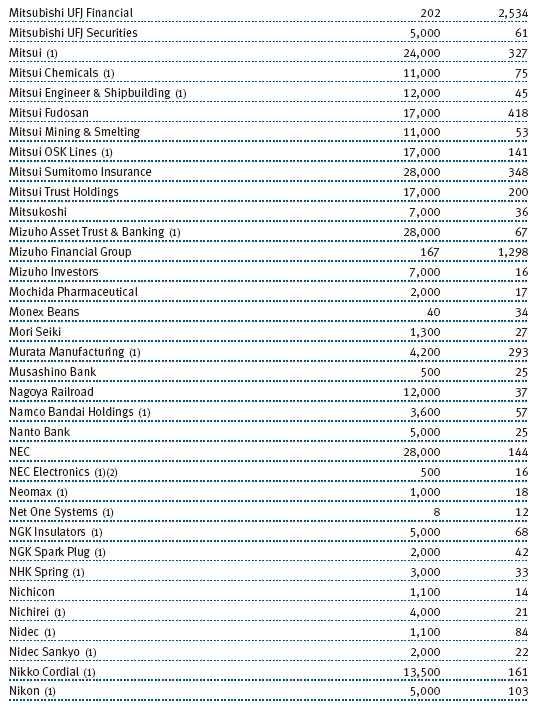
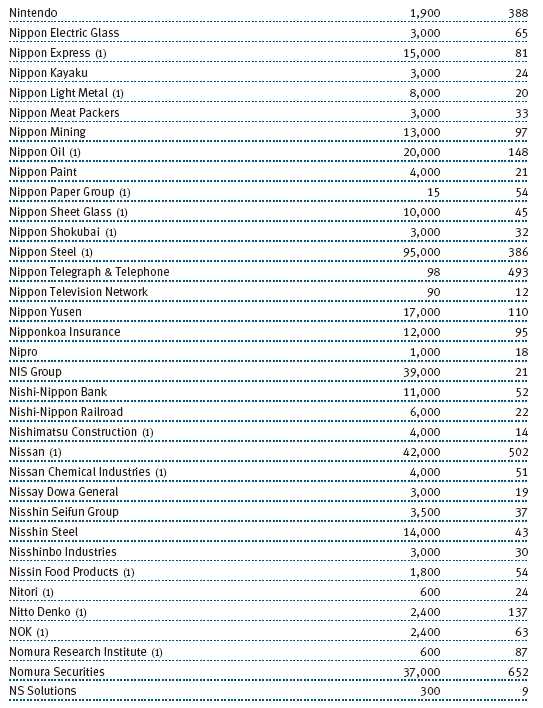
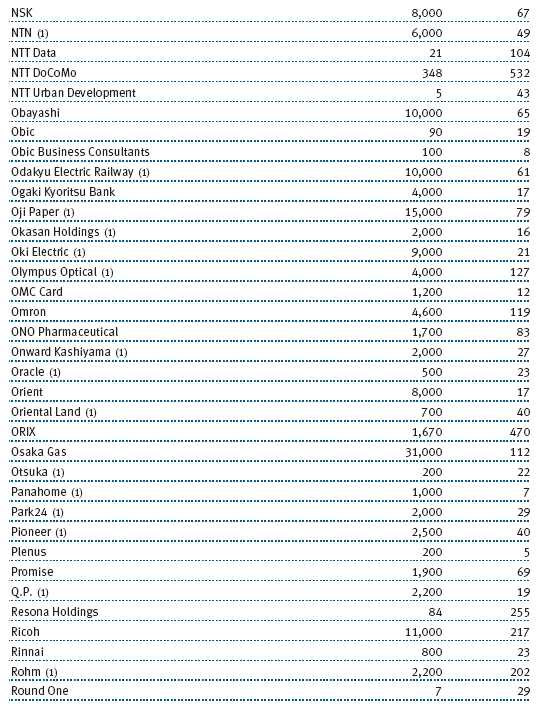
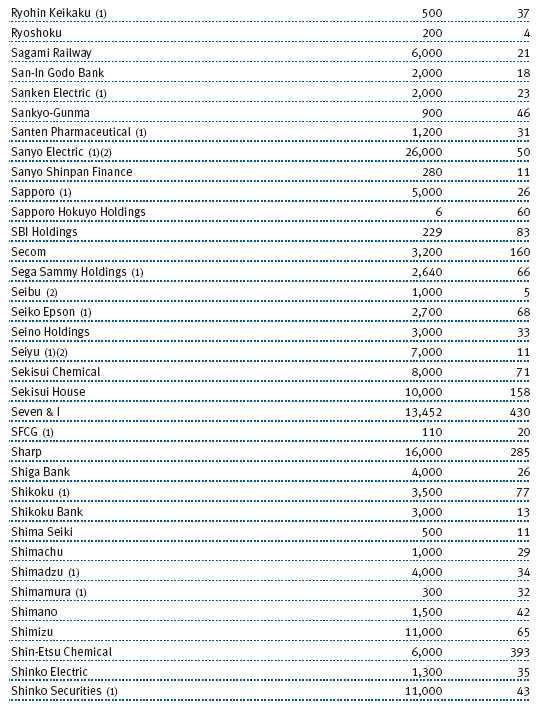
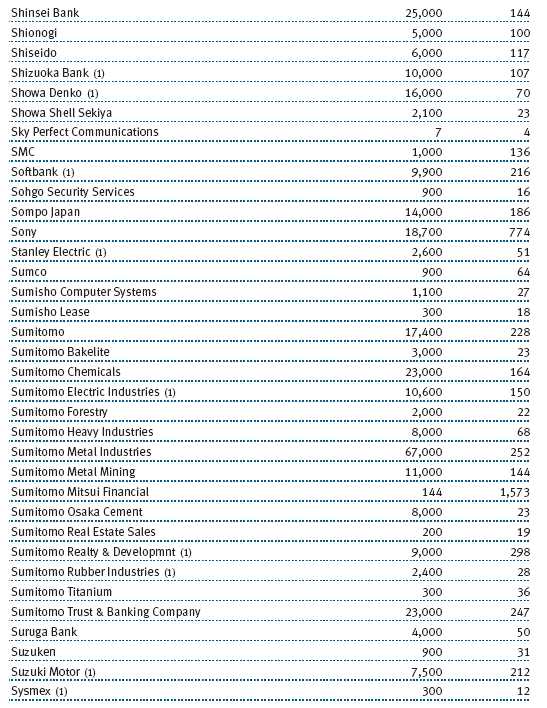
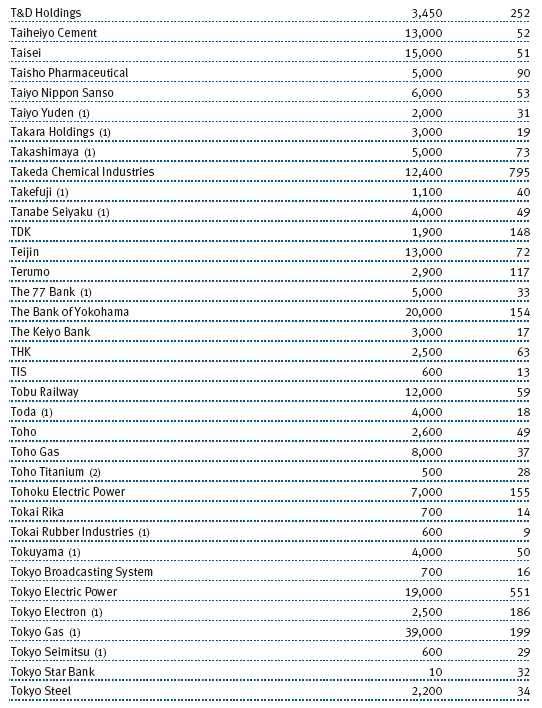
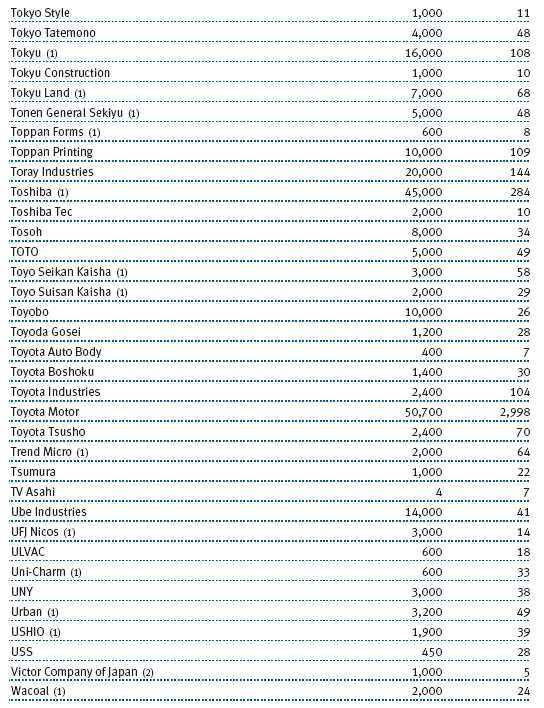
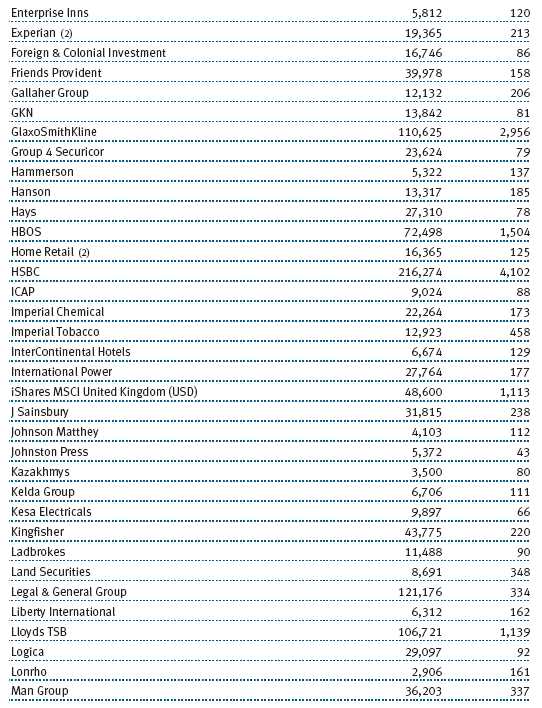
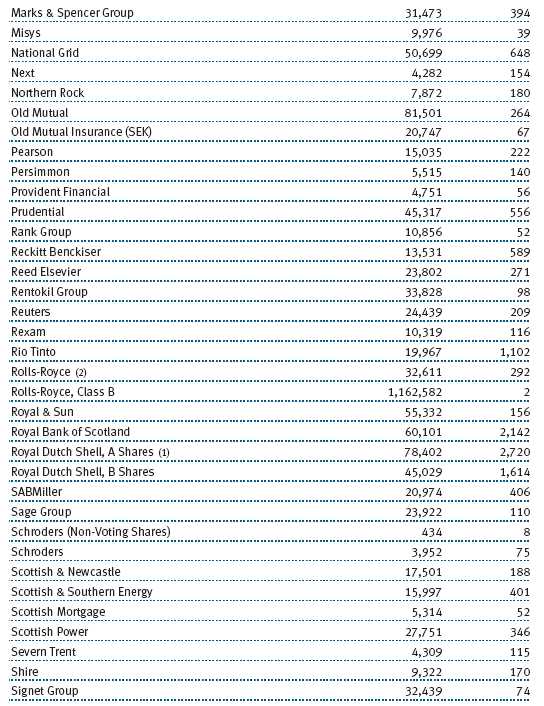
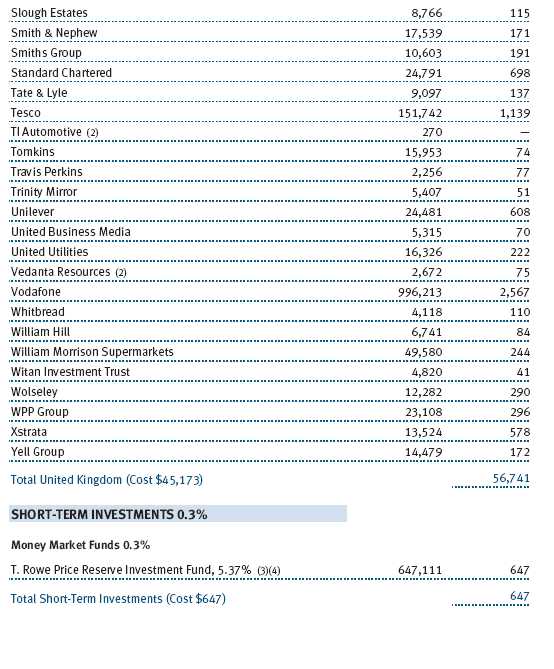
The strongest performer of the past six months was the financials sector, and fund performance benefited from the healthy returns of key European banks, asset managers, and other financial institutions. Key holdings here included international banking giant HSBC, France’s BNP Paribas, and Great Britain’s HBOS. Fee-generated income and returns from investment management and investment banking operations helped bolster the performance of these large financial companies. (Please refer to the fund’s portfolio of investments for a detailed list of holdings and the amount each represents of the portfolio.)
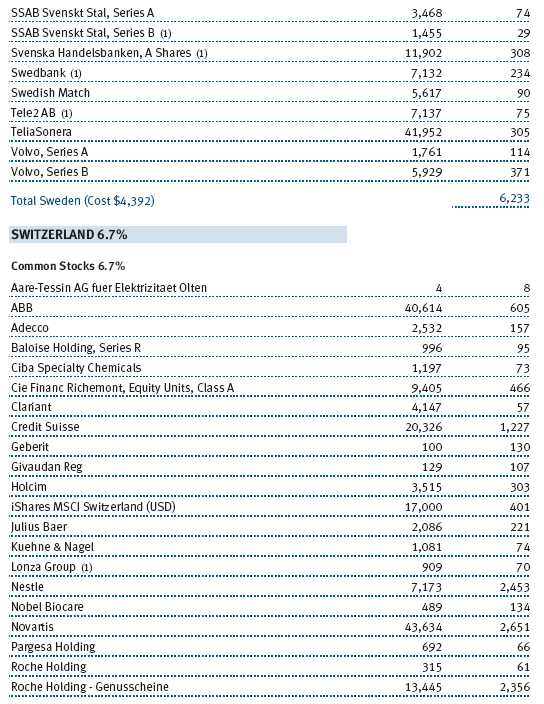
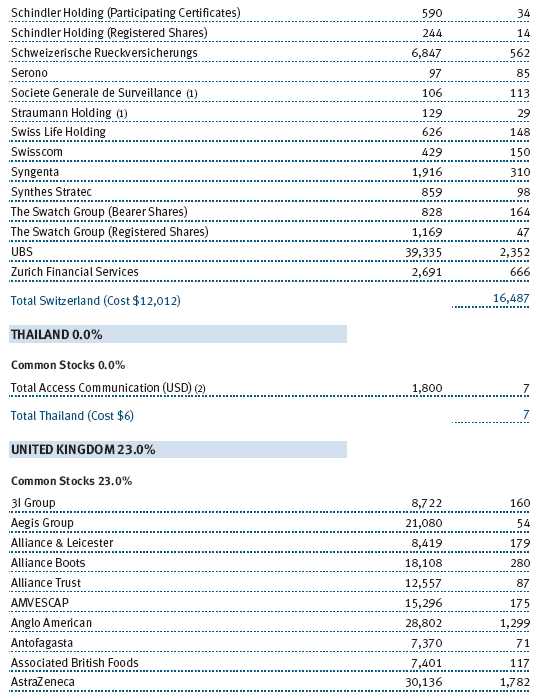
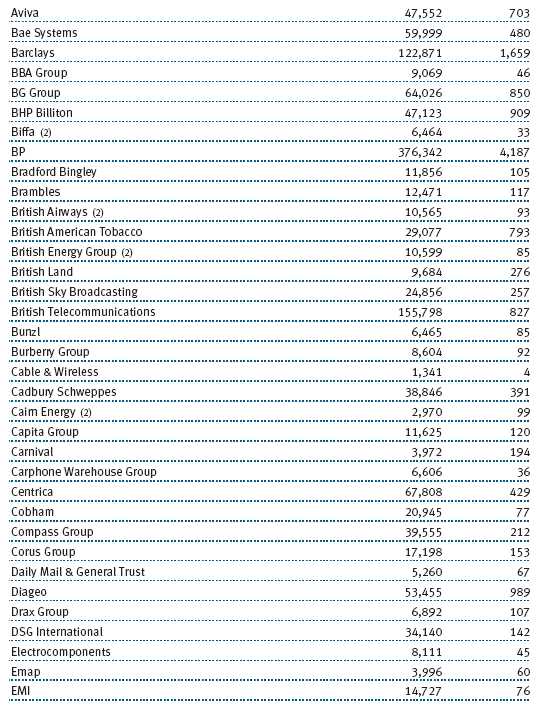
The consumer staples sector also had a good six-month period. After the market’s abrupt slide in May and June, risk-averse investors sought out defensive companies, benefiting companies such as U.K. grocery retailer Tesco and Swiss food giant Nestle. Pharmaceuticals, another defensive play, also had a good six months. Swiss drug giants Roche Holding and Novartis posed strong gains for the period. A number of telecommunication services companies turned in strong performances, including Spain’s Telefonica, Norway’s Telenor, and China Mobile.
Falling crude oil prices took their toll on the fund’s energy holdings. Former high flyers such as Britain’s BP, Norway’s Statoil ABA, and France’s Total, which registered substantial gains earlier in the year, posted losses in the past six months. Not all large oil companies declined. Spain’s Repsol and Royal Dutch Shell were among the handful of international oil companies that registered gains. Information technology also struggled, as it has for the past few years.
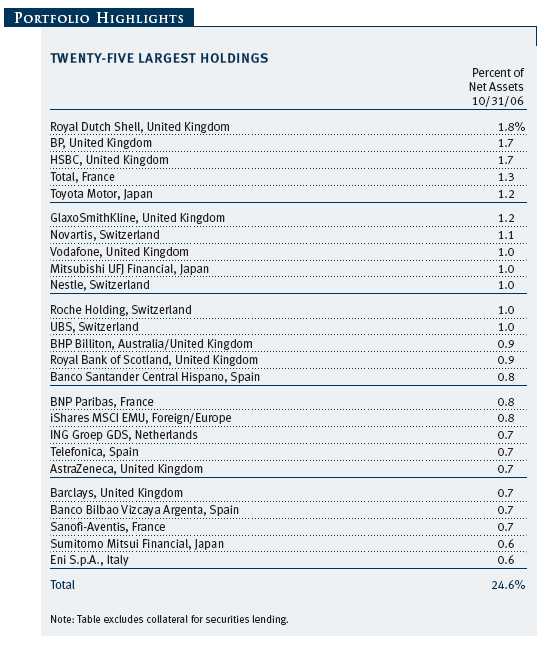
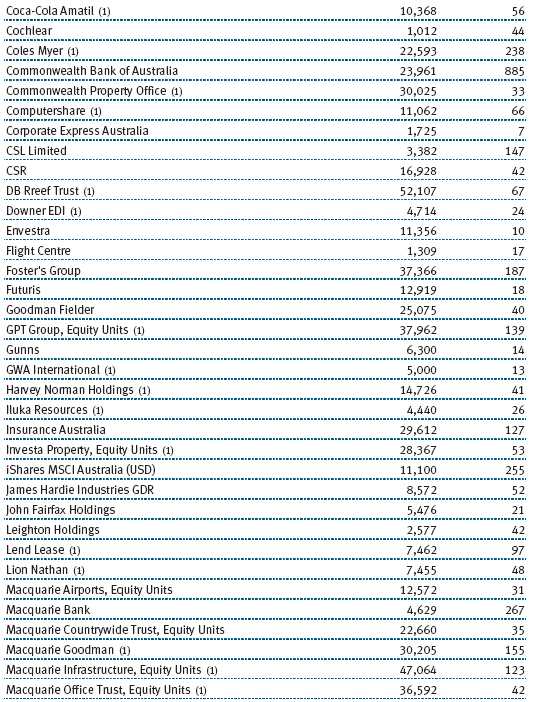
Again, we would like to remind shareholders that it is not the fund’s purpose to attempt to outperform its benchmark, but rather to match its performance by buying stocks held in the index. We should also call shareholders’ attention to the iShares listed among the portfolio’s 25 largest holdings. These shares help us manage cash flows as we strive to achieve the fund’s performance objective by replicating the stocks, sectors, countries, and regions represented in the index along with their respective weightings.
INVESTMENT OUTLOOK
The economies of Europe and Japan have improved markedly in the past year, bolstering their equities markets. The world’s central banks are concerned about possible inflation, but they have been judicious in raising rates so far. Under the new leadership of Ben Bernanke, the Federal Reserve appears as keen on keeping inflation in check as it was under Alan Greenspan. The Fed recognizes that it cannot continue to raise rates while maintaining economic expansion. As long as price increases in the U.S. remain modest, we expect the Fed to keep its current neutral policy in place.
Europe’s economy is likely to slow down in the coming year. In the next several months, we expect the European Central Bank to raise rates at least one or two more times. In addition, an increase in the German valued-added tax that takes effect in January could crimp growth. Stocks in Europe are generally fairly valued, and many of them are taking shareholder-friendly actions, such as increased dividends and share buybacks, to return cash flows to shareholders.
The outlook for Japanese stocks, which had been better in the past year than it had been in some years, has become less certain. Satisfied that the country’s extended period of deflation has ended, the Bank of Japan is likely to raise rates again. Japan’s recovery will continue to rely on business investment and exports to the U.S. and China, which should sustain corporate profits. We would be more optimistic about the Japanese market if the domestic demand were stronger. Japanese consumers continue to hoard their money and are reluctant to spend. As a result, we believe Japan’s economic expansion is now tenuous. Should there be any drop-off in U.S. or Chinese demand, the country’s current economic momentum may grind to a halt.
Clearly, a slowdown in U.S. or Chinese consumption will have a major impact on global growth rates. Corporate profitability has been robust in the past few years. We expect most companies to continue generating positive earnings growth, barring an unexpected global economic slowdown, but we do not expect corporations to sustain the large year-over-year percentage gains in earnings growth.
Overall, except for the concerns we have already addressed, we are optimistic about the prospects for continued gains in international markets.
Respectfully submitted,

E. Frederick Bair
Co-chairman of the fund’s Investment Advisory Committee

Neil Smith
Co-chairman of the fund’s Investment Advisory Committee
November 15, 2006
The committee co-chairmen have day-to-day responsibility for managing the portfolio and work with committee members in developing and executing the fund’s investment program.
On May 1, 2006, Neil Smith was named co-chairman of the fund’s Investment Advisory Committee. Mr. Smith is a vice president of T. Rowe Price International, Inc., and head of Non-U.S. Portfolio Modeling. He joined the firm in 1994 and has 11 years of experience in trade management. Prior to joining the firm, he earned his B.S. in Technological Physics at the University of Essex and his M.B.A. in Management of International Financial Services from the University of London.
RISKS OF INTERNATIONAL INVESTING
Funds that invest overseas generally carry more risk than funds that invest strictly in U.S. assets. Funds investing in a single country or in a limited geographic region tend to be riskier than more diversified funds. Risks can result from varying stages of economic and political development; differing regulatory environments, trading days, and accounting standards; and higher transaction costs of non-U.S. markets. Non-U.S. investments are also subject to currency risk, or a decline in the value of a foreign currency versus the U.S. dollar, which reduces the dollar value of securities denominated in that currency.
GLOSSARY
FTSE Developed ex North America Index: A broadly diversified stock market index based on the investable market capitalization of more than 1,000 predominantly larger companies. The index’s major markets include the U.K., Japan, and developed countries in Europe and the Pacific Rim.
This chart shows the value of a hypothetical $10,000 investment in the fund over the past 10 fiscal year periods or since inception (for funds lacking 10-year records). The result is compared with benchmarks, which may include a broad-based market index and a peer group average or index. Market indexes do not include expenses, which are deducted from fund returns as well as mutual fund averages and indexes.
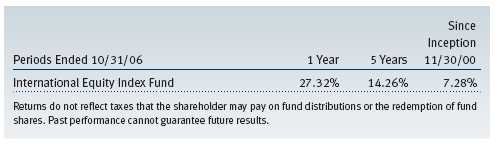
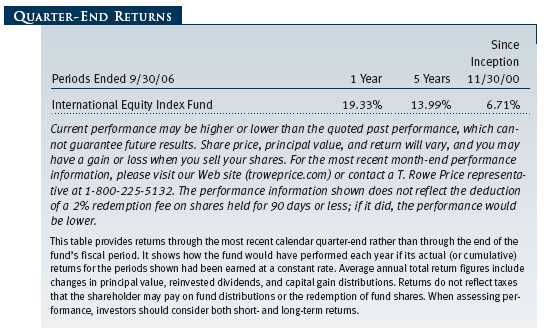
| AVERAGE ANNUAL COMPOUND TOTAL RETURN |
This table shows how the fund would have performed each year if its actual (or cumulative) returns for the periods shown had been earned at a constant rate.
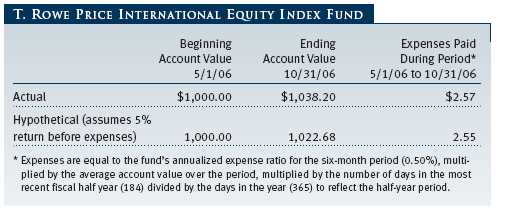
As a mutual fund shareholder, you may incur two types of costs: (1) transaction costs, such as redemption fees or sales loads, and (2) ongoing costs, including management fees, distribution and service (12b-1) fees, and other fund expenses. The following example is intended to help you understand your ongoing costs (in dollars) of investing in the fund and to compare these costs with the ongoing costs of investing in other mutual funds. The example is based on an investment of $1,000 invested at the beginning of the most recent six-month period and held for the entire period.
Actual Expenses
The first line of the following table (“Actual”) provides information about actual account values and actual expenses. You may use the information in this line, together with your account balance, to estimate the expenses that you paid over the period. Simply divide your account value by $1,000 (for example, an $8,600 account value divided by $1,000 = 8.6), then multiply the result by the number in the first line under the heading “Expenses Paid During Period” to estimate the expenses you paid on your account during this period.
Hypothetical Example for Comparison Purposes
The information on the second line of the table (“Hypothetical”) is based on hypothetical account values and expenses derived from the fund’s actual expense ratio and an assumed 5% per year rate of return before expenses (not the fund’s actual return). You may compare the ongoing costs of investing in the fund with other funds by contrasting this 5% hypothetical example and the 5% hypothetical examples that appear in the shareholder reports of the other funds. The hypothetical account values and expenses may not be used to estimate the actual ending account balance or expenses you paid for the period.
Note: T. Rowe Price charges an account maintenance fee that is not included in the accompanying table. The account maintenance fee is charged on a quarterly basis, usually during the last week of a calendar quarter, and applies to accounts with balances below $10,000 on the day of the assessment. The fee is charged to accounts that fall below $10,000 for any reason, including market fluctuations, redemptions, or exchanges. When an account with less than $10,000 is closed either through redemption or exchange, the fee is charged and deducted from the proceeds. The fee applies to IRA accounts but not to retirement plans directly registered with T. Rowe Price Services or accounts maintained by intermediaries through NSCC® Networking. If you are subject to the fee, keep it in mind when you are estimating the ongoing expenses of investing in the fund and when comparing the expenses of this fund with other funds.
You should also be aware that the expenses shown in the table highlight only your ongoing costs and do not reflect any transaction costs, such as redemption fees or sales loads. Therefore, the second line of the table is useful in comparing ongoing costs only and will not help you determine the relative total costs of owning different funds. To the extent a fund charges transaction costs, however, the total cost of owning that fund is higher.
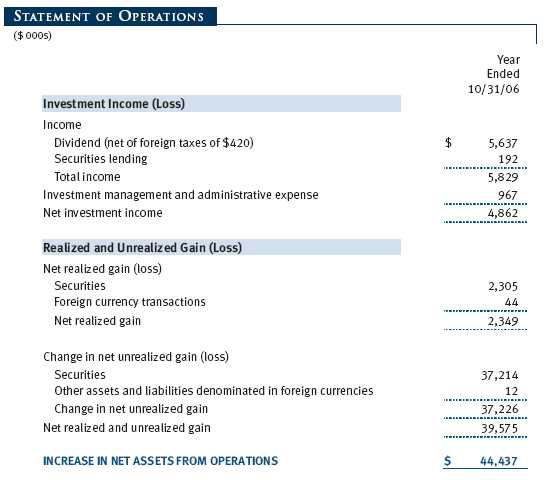
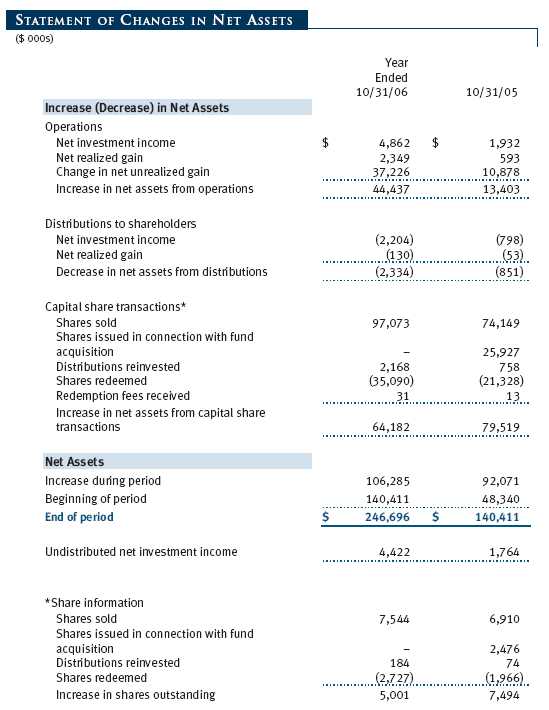
The accompanying notes are an integral part of these financial statements.


The accompanying notes are an integral part of these financial statements.
The accompanying notes are an integral part of these financial statements.
The accompanying notes are an integral part of these financial statements.
The accompanying notes are an integral part of these financial statements.
| NOTES TO FINANCIAL STATEMENTS |
NOTE 1 - SIGNIFICANT ACCOUNTING POLICIES
T. Rowe Price International Index Fund, Inc. (the corporation), is registered under the Investment Company Act of 1940 (the 1940 Act). The International Equity Index Fund (the fund), a diversified, open-end management investment company, is one portfolio established by the corporation. The fund commenced operations on November 30, 2000. The fund seeks to provide long-term capital growth, using the FTSE™ International Limited Developed ex North America Index.
The accompanying financial statements were prepared in accordance with accounting principles generally accepted in the United States of America, which require the use of estimates made by fund management. Fund management believes that estimates and security valuations are appropriate; however, actual results may differ from those estimates, and the security valuations reflected in the financial statements may differ from the value the fund ultimately realizes upon sale of the securities.
Valuation The fund values its investments and computes its net asset value per share at the close of the New York Stock Exchange (NYSE), normally 4 p.m. ET, each day that the NYSE is open for business. Equity securities listed or regularly traded on a securities exchange or in the over-the-counter (OTC) market are valued at the last quoted sale price or, for certain markets, the official closing price at the time of valuations are made, except for OTC Bulletin Board securities, which are valued at the mean of the latest bid and asked prices. A security that is listed or traded on more than one exchange is valued at the quotation on the exchange determined to be the primary market for such security. Listed securities not traded on a particular day are valued at the mean of the latest bid and asked prices for domestic securities and the last quoted sale price for international securities.
Investments in mutual funds are valued at the mutual fund’s closing net asset value per share on the day of valuation.
Other investments, including restricted securities, and those for which the above valuation procedures are inappropriate or are deemed not to reflect fair value are stated at fair value as determined in good faith by the T. Rowe Price Valuation Committee, established by the fund’s Board of Directors.
Most foreign markets close before the close of trading on the NYSE. If the fund determines that developments between the close of a foreign market and the close of the NYSE will, in its judgment, materially affect the value of some or all of its portfolio securities, which in turn will affect the fund’s share price, the fund will adjust the previous closing prices to reflect the fair value of the securities as of the close of the NYSE, as determined in good faith by the T. Rowe Price Valuation Committee, established by the fund’s Board of Directors. A fund may also fair value securities in other situations, such as when a particular foreign market is closed but the fund is open. In deciding whether to make fair value adjustments, the fund reviews a variety of factors, including developments in foreign markets, the performance of U.S. securities markets, and the performance of instruments trading in U.S. markets that represent foreign securities and baskets of foreign securities. The fund uses outside pricing services to provide it with closing market prices and information used for adjusting those prices. The fund cannot predict when and how often it will use closing prices and when it will adjust those prices to reflect fair value. As a means of evaluating its fair value process, the fund routinely compares closing market prices, the next day’s opening prices in the same markets, and adjusted prices.
Currency Translation Assets, including investments, and liabilities denominated in foreign currencies are translated into U.S. dollar values each day at the prevailing exchange rate, using the mean of the bid and asked prices of such currencies against U.S. dollars as quoted by a major bank. Purchases and sales of securities, income, and expenses are translated into U.S. dollars at the prevailing exchange rate on the date of the transaction. The effect of changes in foreign currency exchange rates on realized and unrealized security gains and losses is reflected as a component of security gains and losses.
Redemption Fees A 2% fee is assessed on redemptions of fund shares held less than 90 days to deter short-term trading and to protect the interests of long-term shareholders. Redemption fees are withheld from proceeds that shareholders receive from the sale or exchange of fund shares. The fees are paid to the fund, and are recorded as an increase to paid-in capital. The fees may cause the redemption price per share to differ from the net asset value per share.
Investment Transactions, Investment Income, and Distributions Income and expenses are recorded on the accrual basis. Dividends received from mutual fund investments are reflected as dividend income; capital gain distributions are reflected as realized gain/loss. Dividend income and capital gain distributions are recorded on the ex-dividend date. Investment transactions are accounted for on the trade date. Realized gains and losses are reported on the identified cost basis. Distributions to shareholders are recorded on the ex-dividend date. Income distributions are declared and paid on an annual basis. Capital gain distributions, if any, are declared and paid by the fund, typically on an annual basis.
In June 2006, the Financial Accounting Standards Board (“FASB”) issued FASB Interpretation No. 48 (“FIN 48”), Accounting for Uncertainty in Income Taxes, a clarification of FASB Statement No. 109, Accounting for Income Taxes. FIN 48 establishes financial reporting rules regarding recognition and measurement of tax positions taken or expected to be taken on a tax return. Management is evaluating the anticipated impact on the fund from FIN 48, which is effective for the fund’s fiscal year beginning November 1, 2007.
NOTE 2 - INVESTMENT TRANSACTIONS
Consistent with its investment objective, the fund engages in the following practices to manage exposure to certain risks or to enhance performance. The investment objective, policies, program, and risk factors of the fund are described more fully in the fund’s prospectus and Statement of Additional Information.
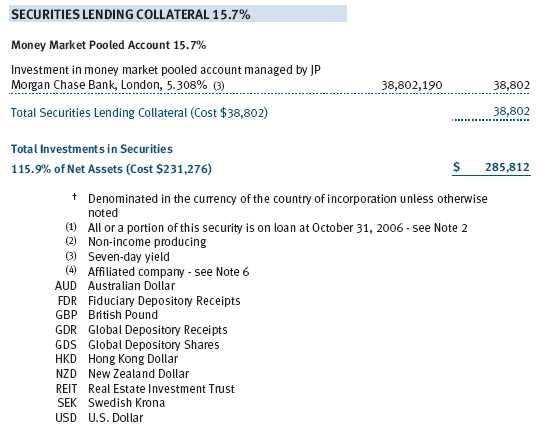
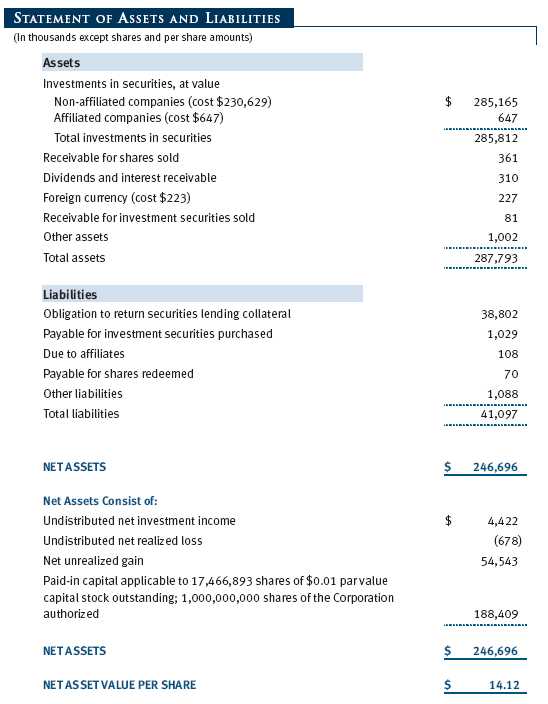
Securities Lending The fund lends its securities to approved brokers to earn additional income. It receives as collateral cash and U.S. government securities valued at 102% to 105% of the value of the securities on loan. Cash collateral is invested in a money market pooled account managed by the fund’s lending agent in accordance with investment guidelines approved by fund management. Collateral is maintained over the life of the loan in an amount not less than the value of loaned securities, as determined at the close of fund business each day; any additional collateral required due to changes in security values is delivered to the fund the next business day. Although risk is mitigated by the collateral, the fund could experience a delay in recovering its securities and a possible loss of income or value if the borrower fails to return the securities. Securities lending revenue recognized by the fund consists of earnings on invested collateral and borrowing fees, net of any rebates to the borrower and compensation to the lending agent. At October 31, 2006, the value of loaned securities was $36,995,000; aggregate collateral consisted of $38,802,000 in the money market pooled trust or account.
Other Purchases and sales of portfolio securities, other than short-term securities, aggregated $137,064,000 and $70,465,000, respectively, for the year ended October 31, 2006.
NOTE 3 - FEDERAL INCOME TAXES
No provision for federal income taxes is required since the fund intends to continue to qualify as a regulated investment company under Subchapter M of the Internal Revenue Code and distribute to shareholders all of its taxable income and gains. Federal income tax regulations differ from generally accepted accounting principles; therefore, distributions determined in accordance with tax regulations may differ significantly in amount or character from net investment income and realized gains for financial reporting purposes. Financial reporting records are adjusted for permanent book/tax differences to reflect tax character. Financial records are not adjusted for temporary differences.
Distributions during the year ended October 31, 2006, totaled $2,334,000 and were characterized as ordinary income for tax purposes. At October 31, 2006, the tax-basis components of net assets were as follows:
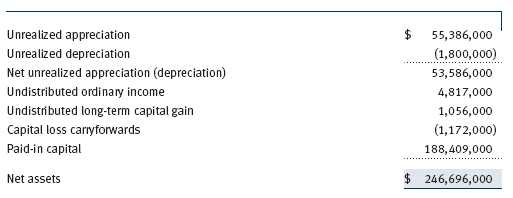
Federal income tax regulations require the fund to treat the gain/loss on passive foreign investment companies as realized on the last day of the tax year; accordingly, $957,000 of unrealized gains reflected in the accompanying financial statements were realized for tax purposes as of October 31, 2006. The fund intends to retain realized gains to the extent of available capital loss carryforwards. During the fiscal year ended October 31, 2006, the fund utilized $1,163,000 of capital loss carryforwards. As of October 31, 2006, the fund had $1,172,000 of capital loss carryforwards, of which $288,000 expire in fiscal 2010, and $884,000 expire in fiscal 2011.
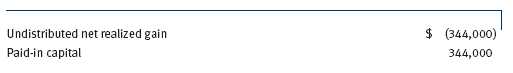
For the year ended October 31, 2006, the fund recorded the following permanent reclassifications to reflect tax character. Reclassifications to paid-in capital relate primarily to a tax practice that treats a portion of the proceeds from each redemption of capital shares as a distribution of taxable net investment income and/or realized capital gain. Results of operations and net assets were not affected by these reclassifications.
At October 31, 2006, the cost of investments for federal income tax purposes was $232,233,000.
NOTE 4 - FOREIGN TAXES
The fund is subject to foreign income taxes imposed by certain countries in which it invests. Additionally, capital gains realized by the fund upon disposition of securities issued in or by certain foreign countries are subject to capital gains tax imposed by those countries, which is payable prior to repatriation of sale proceeds. Similarly, a tax on net profits, including interest income and realized and unrealized capital gains, is imposed by certain other countries. All taxes are computed in accordance with the applicable foreign tax law, and, to the extent permitted, capital losses are used to offset capital gains. Tax expense attributable to income is accrued by the fund as a reduction of income. Current and deferred tax expense attributable to net capital gains is reflected as a component of realized and/or change in unrealized gain/loss on securities in the accompanying financial statements. At October 31, 2006, the fund had no taxes payable, tax refunds receivable, deferred tax liabilities, or foreign capital loss carryforwards attributable to foreign securities.
NOTE 5 - ACQUISITION
On July 11, 2005, the fund acquired substantially all of the assets of the TD Waterhouse Asian Pacific Index Fund and the TD Waterhouse European Index Fund (collectively, the acquired funds), pursuant to the Agreement and Plan of Reorganization dated March 23, 2005, and approved by shareholders of the acquired fund on June 28, 2005. The acquisition was accomplished by a tax-free exchange of 1,150,435 shares of the T. Rowe Price International Equity Index Fund (with a value of $12,045,000) for the 1,599,203 shares of the TD Waterhouse Asian Pacific Index Fund outstanding at the merger date; an additional 1,325,916 shares of the T. Rowe Price International Equity Index Fund (with a value of $13,882,000) were exchanged for the 1,526,191 shares of the TD Waterhouse European Index Fund outstanding on July 8, 2005. The aggregate net assets of the acquired funds at that date included $2,072,000 of unrealized appreciation and $2,525,000 of realized losses carried forward for tax purposes to offset distributable gains realized in the future. Upon merger, the aggregate net assets of the acquired funds were combined with those of the T. Rowe Price International Equity Index Fund, immediately after which, the net assets of the T. Rowe Price International Equity Index Fund totaled $116,941,000.
NOTE 6 - RELATED PARTY TRANSACTIONS
The fund is managed by T. Rowe Price International, Inc. (the manager), a wholly owned subsidiary of T. Rowe Price Associates, Inc. (Price Associates), which is wholly owned by T. Rowe Price Group, Inc. The investment management and administrative agreement between the fund and the manager provides for an all-inclusive annual fee equal to 0.50% of the fund’s average daily net assets. The fee is computed daily and paid monthly. The agreement provides that investment management, shareholder servicing, transfer agency, accounting, and custody services are provided to the fund, and interest, taxes, brokerage commissions, directors’ fees and expenses, and extraordinary expenses are paid directly by the fund.
The fund may invest in the T. Rowe Price Reserve Investment Fund and the T. Rowe Price Government Reserve Investment Fund (collectively, the T. Rowe Price Reserve Funds), open-end management investment companies managed by Price Associates and affiliates of the fund. The T. Rowe Price Reserve Funds are offered as cash management options to mutual funds, trusts, and other accounts managed by Price Associates and/or its affiliates, and are not available for direct purchase by members of the public. The T. Rowe Price Reserve Funds pay no investment management fees. During the year ended October 31, 2006, dividend income from the T. Rowe Price Reserve Funds totaled $17,000, and the value of shares of the T. Rowe Price Reserve Funds held at October 31, 2006, and October 31, 2005, was $647,000 and $257,000, respectively.
As of October 31, 2006, T. Rowe Price Group, Inc., and/or its wholly owned subsidiaries owned 319,726 shares of the fund, representing 2% of the fund’s net assets.
| REPORT OF INDEPENDENT REGISTERED PUBLIC ACCOUNTING FIRM |
To the Board of Directors of T. Rowe Price International Index Fund, Inc. and Shareholders of T. Rowe Price International Equity Index Fund
In our opinion, the accompanying statement of assets and liabilities, including the portfolio of investments, and the related statements of operations and of changes in net assets and the financial highlights present fairly, in all material respects, the financial position of T. Rowe Price International Equity Index Fund (the portfolio comprising T. Rowe Price International Index Fund, Inc., hereafter referred to as the “Fund”) at October 31, 2006, the results of its operations for the year then ended, the changes in its net assets for each of the two years in the period then ended and the financial highlights for each of the five years in the period then ended, in conformity with accounting principles generally accepted in the United States of America. These financial statements and financial highlights (hereafter referred to as “financial statements”) are the responsibility of the Fund’s management; our responsibility is to express an opinion on these financial statements based on our audits. We conducted our audits of these financial statements in accordance with the auditing standards of the Public Company Accounting Oversight Board (United States). Those standards require that we plan and perform the audit to obtain reasonable assurance about whether the financial statements are free of material misstatement. An audit includes examining, on a test basis, evidence supporting the amounts and disclosures in the financial statements, assessing the accounting principles used and significant estimates made by management, and evaluating the overall financial statement presentation. We believe that our audits, which included confirmation of securities at October 31, 2006 by correspondence with the custodian and by agreement to the underlying ownership records for T. Rowe Price Reserve Investment Fund, provide a reasonable basis for our opinion.
PricewaterhouseCoopers LLP
Baltimore, Maryland
December 12, 2006
| TAX INFORMATION (UNAUDITED) FOR THE TAX YEAR ENDED 10/31/06 |
We are providing this information as required by the Internal Revenue Code. The amounts shown may differ from those elsewhere in this report because of differences between tax and financial reporting requirements.
The fund’s distributions to shareholders included:
• $416,000 from short-term capital gains,
• $57,000 from long-term capital gains, subject to the 15% rate gains category
For taxable non-corporate shareholders, $3,475,000 of the fund’s income represents qualified dividend income subject to the 15% rate category.
The fund will pass through foreign source income of $4,925,000 and foreign taxes paid of $141,000.
| INFORMATION ON PROXY VOTING POLICIES, PROCEDURES, AND RECORDS |
A description of the policies and procedures used by T. Rowe Price funds and portfolios to determine how to vote proxies relating to portfolio securities is available in each fund’s Statement of Additional Information, which you may request by calling 1-800-225-5132 or by accessing the SEC’s Web site, www.sec.gov. The description of our proxy voting policies and procedures is also available on our Web site, www.troweprice.com. To access it, click on the words “Company Info” at the top of our homepage for individual investors. Then, in the window that appears, click on the “Proxy Voting Policy” navigation button in the top left corner.
Each fund’s most recent annual proxy voting record is available on our Web site and through the SEC’s Web site. To access it through our Web site, follow the directions above, then click on the words “Proxy Voting Record” at the bottom of the Proxy Voting Policy page.
| HOW TO OBTAIN QUARTERLY PORTFOLIO HOLDINGS |
The fund files a complete schedule of portfolio holdings with the Securities and Exchange Commission for the first and third quarters of each fiscal year on Form N-Q. The fund’s Form N-Q is available electronically on the SEC’s Web site (www.sec.gov); hard copies may be reviewed and copied at the SEC’s Public Reference Room, 450 Fifth St. N.W., Washington, DC 20549. For more information on the Public Reference Room, call 1-800-SEC-0330.
| ABOUT THE FUND’S DIRECTORS AND OFFICERS |
Your fund is governed by a Board of Directors that meets regularly to review a wide variety of matters affecting the fund, including performance, investment programs, compliance matters, advisory fees and expenses, service providers, and other business affairs. The Board of Directors elects the fund’s officers, who are listed in the final table. At least 75% of Board members are independent of T. Rowe Price Associates, Inc. (T. Rowe Price) and T. Rowe Price International, Inc. (T. Rowe Price International); “inside” or “interested” directors are officers of T. Rowe Price. The business address of each director and officer is 100 East Pratt Street, Baltimore, MD 21202. The Statement of Additional Information includes additional information about the fund directors and is available without charge by calling a T. Rowe Price representative at 1-800-225-5132.
| Independent Directors | |
| |
| Name | |
| (Year of Birth) | Principal Occupation(s) During Past 5 Years and Directorships of |
| Year Elected * | Other Public Companies |
| |
| Jeremiah E. Casey | Director, Allfirst Financial Inc. (previously First Maryland Bankcorp) |
| (1940) | (1983 to 2002); Director, National Life Insurance (2001 to 2005); |
| 2006 | Director, The Rouse Company, real estate developers (1990 to 2004) |
| |
| Anthony W. Deering | Chairman, Exeter Capital, LLC, a private investment firm (2004 to pres- |
| (1945) | ent); Director, Vornado Real Estate Investment Trust (3/04 to present); |
| 2000 | Director, Mercantile Bankshares (4/03 to present); Member, Advisory |
| | Board, Deutsche Bank North America (2004 to present); Director, |
| | Chairman of the Board, and Chief Executive Officer, The Rouse |
| | Company, real estate developers (1997 to 2004) |
| |
| Donald W. Dick, Jr. | Principal, EuroCapital Advisors, LLC, an acquisition and management |
| (1943) | advisory firm; Chairman, President, and Chief Executive Officer, |
| 2000 | The Haven Group, a custom manufacturer of modular homes (1/04 |
| | to present) |
| |
| David K. Fagin | Chairman and President, Nye Corporation (6/88 to present); Director, |
| (1938) | Canyon Resources Corp., Golden Star Resources Ltd. (5/92 to present), |
| 2001 | and Pacific Rim Mining Corp. (2/02 to present) |
| |
| Karen N. Horn | Director, Federal National Mortgage Association (9/06 to present); |
| (1943) | Managing Director and President, Global Private Client Services, Marsh |
| 2003 | Inc. (1999 to 2003); Managing Director and Head of International |
| | Private Banking, Bankers Trust (1996 to 1999); Director, Georgia Pacific |
| | (5/04 to 12/05), Eli Lilly and Company, and Simon Property Group |
| |
| Theo C. Rodgers | President, A&R Development Corporation |
| (1941) | |
| 2006 | |
| | |
| John G. Schreiber | Owner/President, Centaur Capital Partners, Inc., a real estate invest- |
| (1946) | ment company; Partner, Blackstone Real Estate Advisors, L.P. |
| 2001 | |
* Each independent director oversees 116 T. Rowe Price portfolios and serves until retirement, resignation, or election of a successor.
| Inside Directors | |
| |
| Name | |
| (Year of Birth) | |
| Year Elected * | |
| [Number of T. Rowe Price | Principal Occupation(s) During Past 5 Years and Directorships of |
| Portfolios Overseen] | Other Public Companies |
| |
| Edward C. Bernard | Director and Vice President, T. Rowe Price and T. Rowe Price Group, |
| (1956) | Inc.; Chairman of the Board, Director, and President, T. Rowe Price |
| 2006 | Investment Services, Inc.; Chairman of the Board and Director, T. Rowe |
| [116] | Price International, Inc., T. Rowe Price Retirement Plan Services, Inc., |
| | T. Rowe Price Services, Inc., and T. Rowe Price Savings Bank; Director, |
| | T. Rowe Price Global Asset Management Limited and T. Rowe Price |
| | Global Investment Services Limited; Chief Executive Officer, Chairman |
| | of the Board, Director, and President, T. Rowe Price Trust Company; |
| | Chairman of the Board, all funds |
| |
| Brian C. Rogers, CFA, CIC | Chief Investment Officer, Director, and Vice President, T. Rowe Price and |
| (1955) | T. Rowe Price Group, Inc.; Vice President, T. Rowe Price Trust Company |
| 2006 | |
| [62] | |
* Inside directors serve until retirement, resignation, or election of a successor.
| Officers (continued) | |
| |
| Name (Year of Birth) | |
| Title and Fund(s) Served | Principal Occupation(s) |
| |
| E. Frederick Bair, CFA, CPA (1969) | Vice President, T. Rowe Price, T. Rowe Price |
| President, International Index Fund | Group, Inc., and T. Rowe Price Trust Company |
| |
| Joseph A. Carrier, CPA (1960) | Vice President, T. Rowe Price, T. Rowe Price |
| Treasurer, International Index Fund | Group, Inc., T. Rowe Price Investment Services, |
| | Inc., and T. Rowe Price Trust Company |
| |
| Roger L. Fiery III, CPA (1959) | Vice President, T. Rowe Price, T. Rowe Price |
| Vice President, International Index Fund | Group, Inc., T. Rowe Price International, Inc., |
| | and T. Rowe Price Trust Company |
| |
| John R. Gilner (1961) | Chief Compliance Officer and Vice President, |
| Chief Compliance Officer, International | T. Rowe Price; Vice President, T. Rowe Price |
| Index Fund | Group, Inc., and T. Rowe Price Investment |
| | Services, Inc. |
| |
| Gregory S. Golczewski (1966) | Vice President, T. Rowe Price and T. Rowe Price |
| Vice President, International Index Fund | Trust Company |
| |
| Henry H. Hopkins (1942) | Director and Vice President, T. Rowe Price |
| Vice President, International Index Fund | Investment Services, Inc., T. Rowe Price Services, |
| | Inc., and T. Rowe Price Trust Company; Vice |
| | President, T. Rowe Price, T. Rowe Price Group, |
| | Inc., T. Rowe Price International, Inc., and |
| | T. Rowe Price Retirement Plan Services, Inc. |
| |
| Patricia B. Lippert (1953) | Assistant Vice President, T. Rowe Price and |
| Secretary, International Index Fund | T. Rowe Price Investment Services, Inc. |
| |
| Neil Smith (1972) | Vice President, T. Rowe Price International, Inc. |
| Executive Vice President, International | |
| Index Fund | |
| |
| Ken D. Uematsu, CFA (1966) | Assistant Vice President, T. Rowe Price |
| Vice President, International Index Fund | |
| |
| Julie L. Waples (1970) | Vice President, T. Rowe Price |
| Vice President, International Index Fund | |
| | |
| Richard T. Whitney, CFA (1958) | Vice President, T. Rowe Price, T. Rowe Price |
| Vice President, International Index Fund | Group, Inc., T. Rowe Price International, Inc., |
| | and T. Rowe Price Trust Company |
| |
| Paul W. Wojcik, CFA (1970) | Vice President, T. Rowe Price and T. Rowe Price |
| Vice President, International Index Fund | Group, Inc. |
Unless otherwise noted, officers have been employees of T. Rowe Price or T. Rowe Price International for at least five years.
Item 2. Code of Ethics.
The registrant has adopted a code of ethics, as defined in Item 2 of Form N-CSR, applicable to its principal executive officer, principal financial officer, principal accounting officer or controller, or persons performing similar functions. A copy of this code of ethics is filed as an exhibit to this Form N-CSR. No substantive amendments were approved or waivers were granted to this code of ethics during the period covered by this report.
Item 3. Audit Committee Financial Expert.
The registrant’s Board of Directors/Trustees has determined that Mr. Donald W. Dick Jr. qualifies as an audit committee financial expert, as defined in Item 3 of Form N-CSR. Mr. Dick is considered independent for purposes of Item 3 of Form N-CSR.
Item 4. Principal Accountant Fees and Services.
(a) – (d) Aggregate fees billed to the registrant for the last two fiscal years for professional services rendered by the registrant’s principal accountant were as follows:

Audit fees include amounts related to the audit of the registrant’s annual financial statements and services normally provided by the accountant in connection with statutory and regulatory filings. Audit-related fees include amounts reasonably related to the performance of the audit of the registrant’s financial statements and specifically include the issuance of a report on internal controls and, if applicable, agreed-upon procedures related to fund acquisitions. Tax fees include amounts related to services for tax compliance, tax planning, and tax advice. The nature of these services specifically includes the review of distribution calculations and the preparation of Federal, state, and excise tax returns. Reclassification from tax fees to audit fees of fiscal 2005 amounts related to the auditing of tax disclosures within the registrant’s annual financial statements has been made in order to conform to fiscal 2006 presentation. All other fees include the registrant’s pro-rata share of amounts for agreed-upon procedures in conjunction with service contract approvals by the registrant’s Board of Directors/Trustees.
(e)(1) The registrant’s audit committee has adopted a policy whereby audit and non-audit services performed by the registrant’s principal accountant for the registrant, its investment adviser, and any entity controlling, controlled by, or under common control with the investment adviser that provides ongoing services to the registrant require pre-approval in advance at regularly scheduled audit committee meetings. If such a service is required between regularly scheduled audit committee meetings, pre-approval may be authorized by one audit committee member with ratification at the next scheduled audit committee meeting. Waiver of pre-approval for audit or non-audit services requiring fees of a de minimis amount is not permitted.
(2) No services included in (b) – (d) above were approved pursuant to paragraph (c)(7)(i)(C) of Rule 2-01 of Regulation S-X.
(f) Less than 50 percent of the hours expended on the principal accountant’s engagement to audit the registrant’s financial statements for the most recent fiscal year were attributed to work performed by persons other than the principal accountant’s full-time, permanent employees.
(g) The aggregate fees billed for the most recent fiscal year and the preceding fiscal year by the registrant’s principal accountant for non-audit services rendered to the registrant, its investment adviser, and any entity controlling, controlled by, or under common control with the investment adviser that provides ongoing services to the registrant were $1,200,000 and $883,000, respectively, and were less than the aggregate fees billed for those same periods by the registrant’s principal accountant for audit services rendered to the T. Rowe Price Funds. Preceding fiscal year amount reflects the reclassification of tax fees described in (a) – (d) above.
(h) All non-audit services rendered in (g) above were pre-approved by the registrant’s audit committee. Accordingly, these services were considered by the registrant’s audit committee in maintaining the principal accountant’s independence.Item 5. Audit Committee of Listed Registrants.
Not applicable.
Item 6. Schedule of Investments.
Not applicable. The complete schedule of investments is included in Item 1 of this Form N-CSR.
Item 7. Disclosure of Proxy Voting Policies and Procedures for Closed-End Management Investment Companies.
Not applicable.
Item 8. Portfolio Managers of Closed-End Management Investment Companies.
Not applicable.
Item 9. Purchases of Equity Securities by Closed-End Management Investment Company and Affiliated Purchasers.
Not applicable.
Item 10. Submission of Matters to a Vote of Security Holders.
Not applicable.
Item 11. Controls and Procedures.
(a) The registrant’s principal executive officer and principal financial officer have evaluated the registrant’s disclosure controls and procedures within 90 days of this filing and have concluded that the registrant’s disclosure controls and procedures were effective, as of that date, in ensuring that information required to be disclosed by the registrant in this Form N-CSR was recorded, processed, summarized, and reported timely.
(b) The registrant’s principal executive officer and principal financial officer are aware of no change in the registrant’s internal control over financial reporting that occurred during the registrant’s second fiscal quarter covered by this report that has materially affected, or is reasonably likely to materially affect, the registrant’s internal control over financial reporting.
Item 12. Exhibits.
(a)(1) The registrant’s code of ethics pursuant to Item 2 of Form N-CSR is attached.
(2) Separate certifications by the registrant's principal executive officer and principal financial officer, pursuant to Section 302 of the Sarbanes-Oxley Act of 2002 and required by Rule 30a-2(a) under the Investment Company Act of 1940, are attached.
(3) Written solicitation to repurchase securities issued by closed-end companies: not applicable.
(b) A certification by the registrant's principal executive officer and principal financial officer, pursuant to Section 906 of the Sarbanes-Oxley Act of 2002 and required by Rule 30a-2(b) under the Investment Company Act of 1940, is attached.
| | |
SIGNATURES |
| |
| | Pursuant to the requirements of the Securities Exchange Act of 1934 and the Investment |
| Company Act of 1940, the registrant has duly caused this report to be signed on its behalf by the |
| undersigned, thereunto duly authorized. |
| |
| T. Rowe Price International Index Fund, Inc. |
| |
| |
| By | /s/ Edward C. Bernard |
| | Edward C. Bernard |
| | Principal Executive Officer |
| |
| Date | December 15, 2006 |
| |
| |
| | Pursuant to the requirements of the Securities Exchange Act of 1934 and the Investment |
| Company Act of 1940, this report has been signed below by the following persons on behalf of |
| the registrant and in the capacities and on the dates indicated. |
| |
| |
| By | /s/ Edward C. Bernard |
| | Edward C. Bernard |
| | Principal Executive Officer |
| |
| Date | December 15, 2006 |
| |
| |
| |
| By | /s/ Joseph A. Carrier |
| | Joseph A. Carrier |
| | Principal Financial Officer |
| |
| Date | December 15, 2006 |