1 Company Overview NYSE Amex: LODE 24th Annual ROTH Conference March 11 - 14, 2012
2 Forward Looking Statements This presentation includes certain “ forward - looking statements ” or “ forward - looking information ” . All statements other than those of historical fact, included in this presentation are forward - looking statements that involve risks and uncertainties. The words “ believe ” , “ expect ” , “ anticipate ” , “ contemplate ” , “ target ” , “ plan ” , “ intends ” , “ continue ” , “ budget ” , “ estimate ” , “ forecast ” , “ may ” , “ will ” , “ schedule ” , and similar expressions identify forward - looking statements. Forward - looking statements include, among other things, statements regarding ta rgets, estimates and assumptions in respect of gold and silver and gold equivalent production and prices, cash and operating costs, res ults and capital expenditures, mineral reserves and mineral resources and anticipated grades, recovery rates, future financial or operating pe rfo rmances, margins, operating and exploration expenditures, costs and timing of the development of new deposits, costs and timing of con str uction, costs and timing of future exploration and reclamation expenses, anticipated 2012 results, our ability to fully fund our business m ode l, including our capital and exploration program, internally, anticipated 2012 year - end interim and annual gold and silver production and the cas h and operating costs associated with the same, the ability to achieve productivity and operational efficiencies, the ability to achieve posi tiv e cash flow, the ability to develop and put into production our exploration targets and the timing of each thereof. Forward - looking statements are necess arily based upon a number of estimates and assumptions that, while considered reasonable by Comstock Mining, Inc. ( “ Comstock ” ), are inherently subject to significant business, economic, competitive, political and social uncertainties and contingencies. Important factors that cou ld cause actual results to differ materially from Comstock expectations include, among others, the actual results of current exploration acti vit ies, conclusions of economic evaluations and changes in project parameters as plans continue to be refined, future prices of gold and silver, kno wn and unknown uncertainties and risks relating to additional funding requirements, reserve and resource estimates, hedging activities, deve lop ment and operating risks, illegal miners, uninsurable risks, competition, limited mining operations, production risks, environmental r egu lation and liability, government regulation, recent losses and write - downs, dependence on key employees, possible variations of ore grade or recovery rates, failure of plant, equipment or process to operate as anticipated, or accidents. Although Comstock has attempted to identify important fa ctors that could cause actual results to differ materially, there may be other factors that cause results not to be as anticipated, estimated or intended. There can be no assurance that such statements will prove to be accurate as actual results and future events could differ materially fr om those anticipated in such statements. Forward - looking statements are not guarantees of future performance. Accordingly, readers should not place u ndue reliance on forward - looking statements. QUALIFIED PERSON Mr. Laurence G. Martin, AIPG Certified Professional Geologist #10985, a Qualified Person as defined under Canadian National I nst rument 43 - 101, has reviewed and verified the technical contents of this report. DOLLARS All dollar amounts are in US dollars unless otherwise noted.
3 Why Comstock? ▪ Nevada ’ s historically prominent GOLD AND SILVER mining district ▪ Consolidated 6,099 acres of contiguous mineralized trend (almost 6 miles) ▪ Validated almost 3 million gold equivalent ounces TO DATE – Still vastly underexplored by modern methods – Significant near term upside in resource growth – Robust development pipeline of high grade gold and silver deposits ▪ Permitted, production - ready facility provides cash flow opportunities ▪ Strong management team with development, operational, regulatory and financial experience ▪ Experienced board chaired by the company's largest shareholder
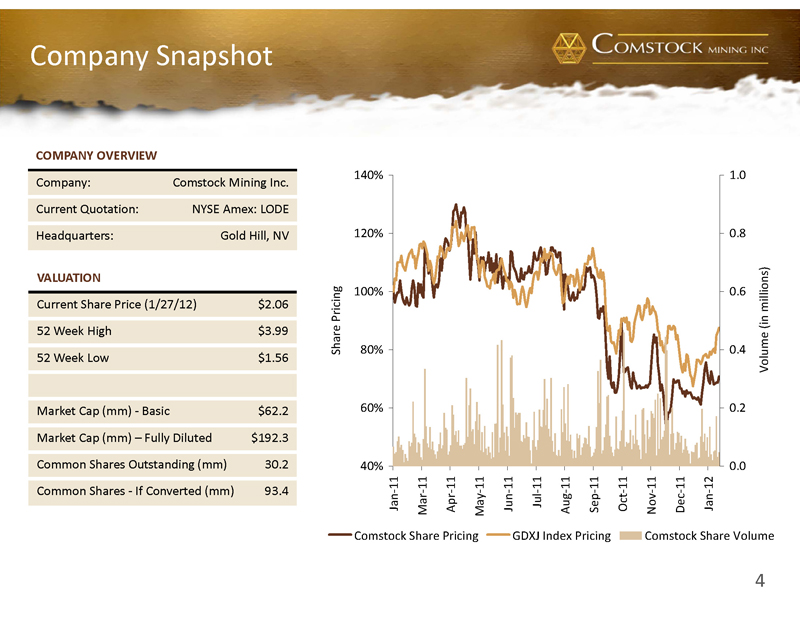
4 Company Snapshot COMPANY OVERVIEW Company: Comstock Mining Inc. Current Quotation: NYSE Amex: LODE Headquarters: Gold Hill, NV VALUATION Current Share Price (1/27/12) $2.06 52 Week High $3.99 52 Week Low $1.56 Market Cap (mm) - Basic $62.2 Market Cap (mm) – Fully Diluted $192.3 Common Shares Outstanding (mm) 30.2 Common Shares - If Converted (mm) 93.4 40% 60% 80% 100% 120% 140% Jan-11 Mar-11 Apr-11 May-11 Jun-11 Jul-11 Aug-11 Sep-11 Oct-11 Nov-11 Dec-11 Jan-12 Share Pricing 0.0 0.2 0.4 0.6 0.8 1.0 Volume (in millions) Comstock Share Pricing GDXJ Index Pricing Comstock Share Volume
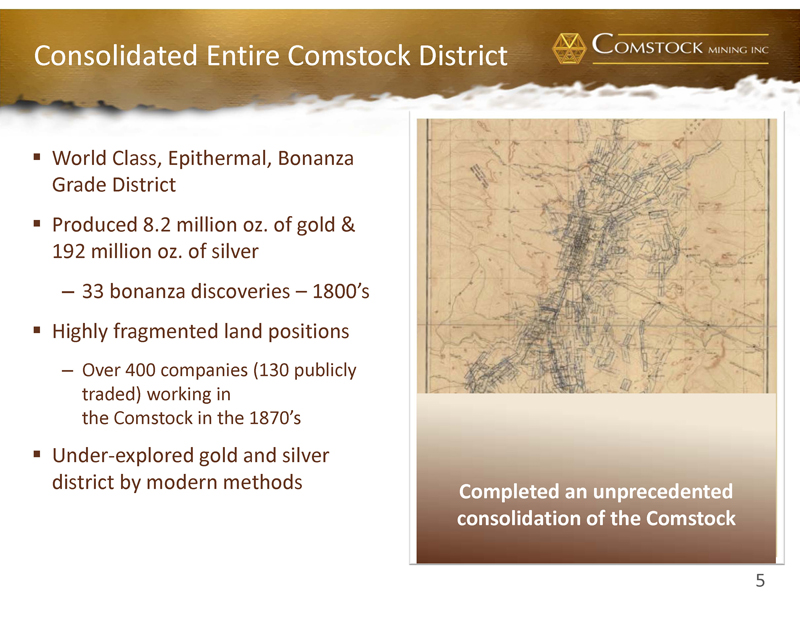
5 Consolidated Entire Comstock District ▪ World Class, Epithermal, Bonanza Grade District ▪ Produced 8.2 million oz. of gold & 192 million oz. of silver – 33 bonanza discoveries – 1800 ’ s ▪ Highly fragmented land positions – Over 400 companies (130 publicly traded) working in the Comstock in the 1870 ’ s ▪ Under - explored gold and silver district by modern methods Completed an unprecedented consolidation of the Comstock

6 Epithermal, High - Grade District “ The author believes the Comstock Mine Project represents a well - explored, epithermal, precious metal deposit within a world - class mining district…. The geology of the project area is well described and understood…. The density of geologic data is high, and the reliability is excellent, particularly in the various Starter Mine areas. ” (Behre Dolbear, September 2011) 2.4 Million Gold Ounces and 20.4 Million Ounces of Silver Validated

7 - 500,000 1,000,000 1,500,000 2,000,000 2,500,000 3,000,000 3,500,000 4,000,000 4,500,000 5,000,000 GOAL Dec-13 Sep-11 Aug-10 May-10 3,250,000 1,780,000 1,060,000 770,000 1,500,000 990,000 380,000 147,000 250,000 200,000 190,000 108,000 Measured and Indicated Inferred Historical Reported Mineral Resource 2011 M&I M&I M&I M&I Result of Behre Dolbear NI 43 - 101 Report September 2011 Average Grade Metric Average Grade Contained Ounces 53.20 (1) Tons (000’s) Au (oz/ton) Ag (oz/ton) Tonnes (000’s) Au (g/t) Ag (g/t) Au (ounces) Ag (ounces) Au Eq Oz Measured 27,610 0.030 0.314 25,100 1.027 10.737 828,000 8,660,000 990,000 Indicated 23,650 0.029 0.241 21,500 0.985 8.255 680,000 5,700,000 790,000 Measured and Indicated 51,260 0.029 0.280 46,600 1.008 9.592 1,508,000 14,360,000 1,780,000 Inferred 33,580 0.026 0.179 30,530 0.898 6.143 881,000 6,030,000 990,000 Historical 2,460 0.053 1.472 2,230 1.821 50.426 131,000 3,620,000 200,000 1) Au Eq Oz using using September 30, 2011 closing price
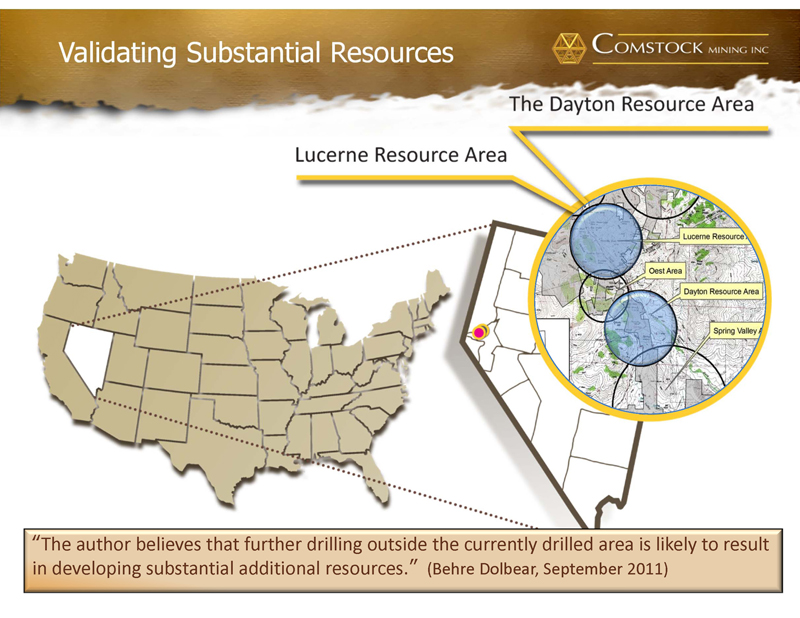
8 Validating Substantial Resources “ The author believes that further drilling outside the currently drilled area is likely to result in developing substantial additional resources. ” (Behre Dolbear, September 2011)

9 9 Lucerne Resource Area 1.27 million Gold ounces (M&I) 12.59 million Silver ounces (M&I) – Additional .68 million Gold ounces & 4.9 million Silver ounces Inferred – 2012 Lucerne Mine 5+ years – Near surface, Oxide ores – Low Strip ratio – Persistent, high grades – Open on East and Northern borders and at depth Excellent, Permitted Infrastructure Lucerne - Hartford Geologic Section
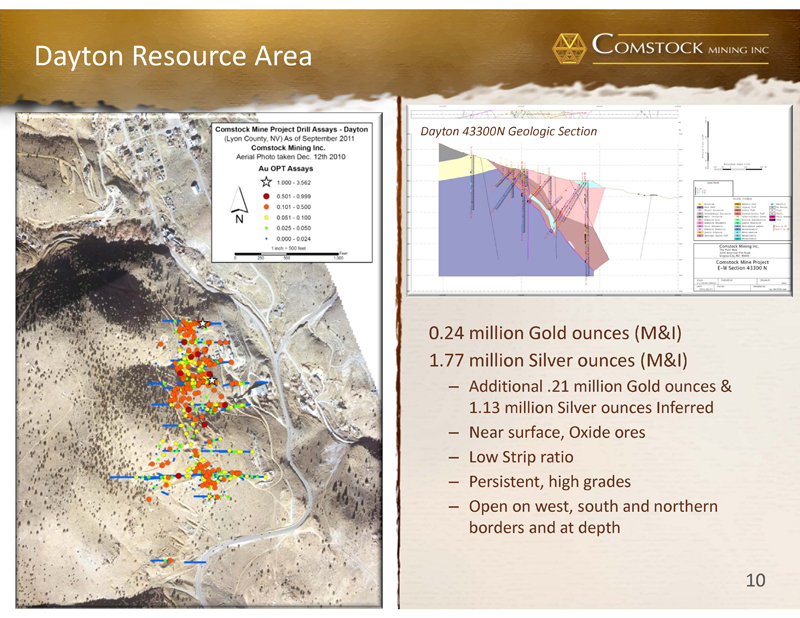
10 10 Dayton Resource Area 0.24 million Gold ounces (M&I) 1.77 million Silver ounces (M&I) – Additional .21 million Gold ounces & 1.13 million Silver ounces Inferred – Near surface, Oxide ores – Low Strip ratio – Persistent, high grades – Open on west, south and northern borders and at depth Dayton 43300N Geologic Section
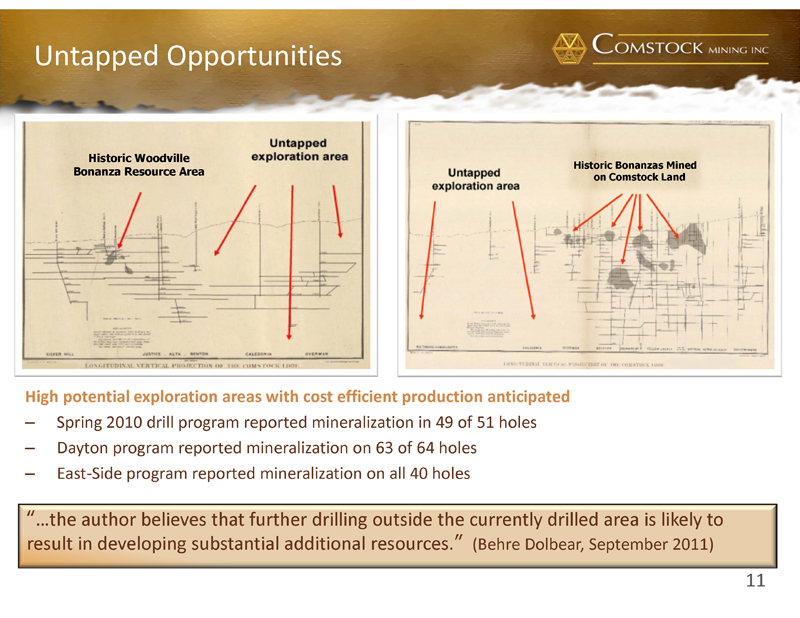
11 Untapped Opportunities High potential exploration areas with cost efficient production anticipated – Spring 2010 drill program reported mineralization in 49 of 51 holes – Dayton program reported mineralization on 63 of 64 holes – East - Side program reported mineralization on all 40 holes Historic Bonanzas Mined on Comstock Land Historic Woodville Bonanza Resource Area “ …the author believes that further drilling outside the currently drilled area is likely to result in developing substantial additional resources. ” (Behre Dolbear, September 2011)
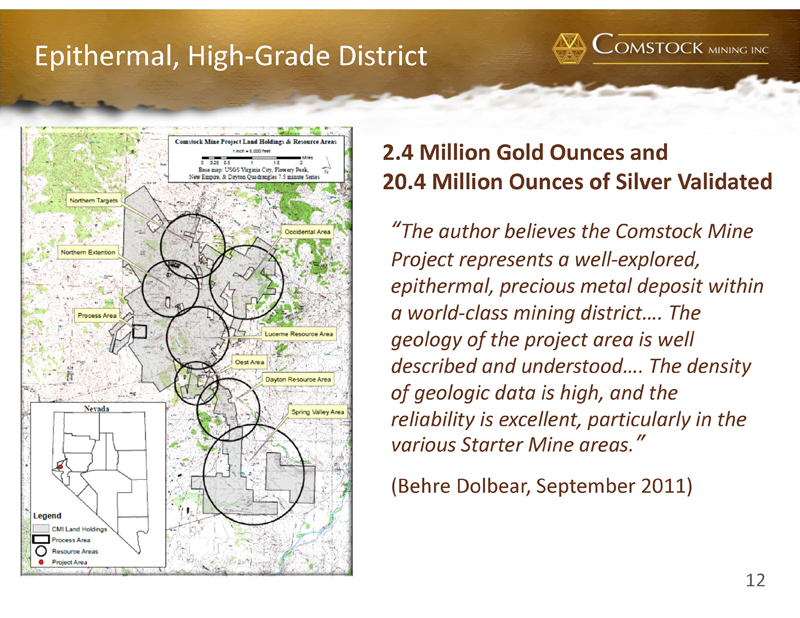
12 Epithermal, High - Grade District “ The author believes the Comstock Mine Project represents a well - explored, epithermal, precious metal deposit within a world - class mining district…. The geology of the project area is well described and understood…. The density of geologic data is high, and the reliability is excellent, particularly in the various Starter Mine areas. ” (Behre Dolbear, September 2011) 2.4 Million Gold Ounces and 20.4 Million Ounces of Silver Validated
13 PRODUCTION
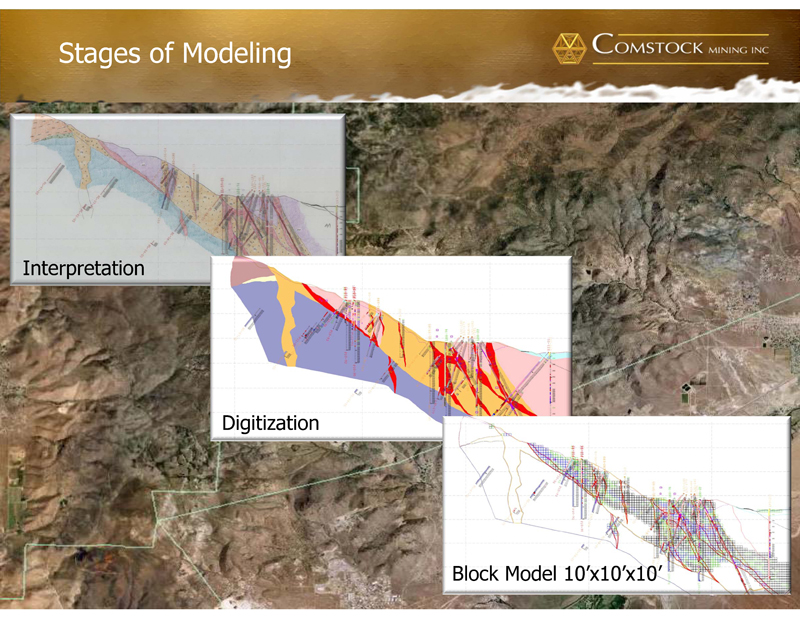
14 Stages of Modeling Interpretation Digitization Block Model 10 ’ x10 ’ x10 ’
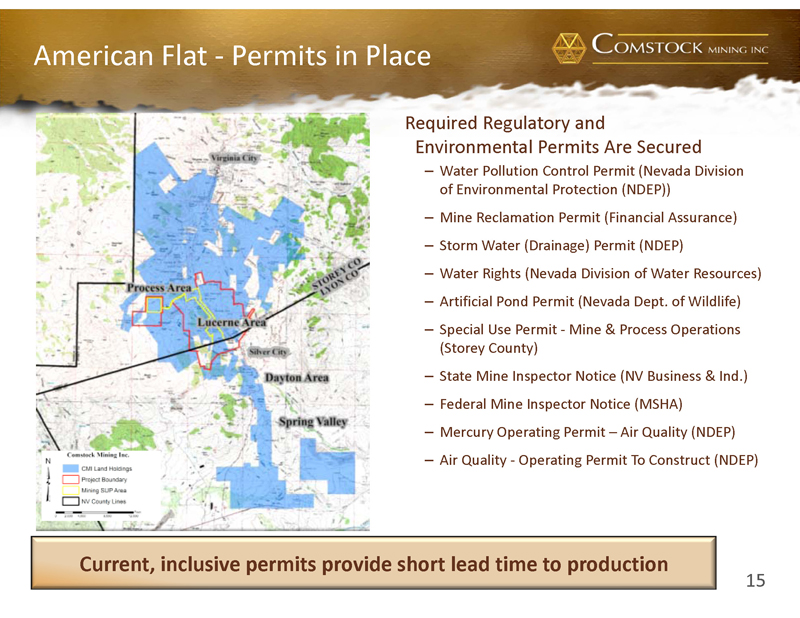
15 American Flat - Permits in Place Required Regulatory and Environmental Permits Are Secured – Water Pollution Control Permit (Nevada Division of Environmental Protection (NDEP)) – Mine Reclamation Permit (Financial Assurance) – Storm Water (Drainage) Permit (NDEP) – Water Rights (Nevada Division of Water Resources) – Artificial Pond Permit (Nevada Dept. of Wildlife) – Special Use Permit - Mine & Process Operations (Storey County) – State Mine Inspector Notice (NV Business & Ind.) – Federal Mine Inspector Notice (MSHA) – Mercury Operating Permit – Air Quality (NDEP) – Air Quality - Operating Permit To Construct (NDEP) Current, inclusive permits provide short lead time to production
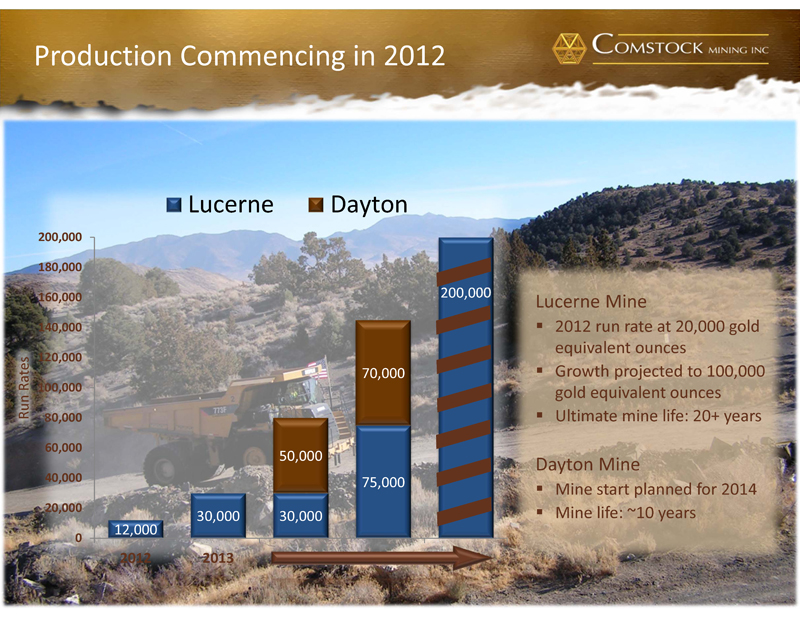
16 Production Commencing in 2012 12,000 30,000 30,000 75,000 200,000 50,000 70,000 0 20,000 40,000 60,000 80,000 100,000 120,000 140,000 160,000 180,000 200,000 2012 2013 2014 2015 2016 Lucerne Dayton Lucerne Mine ▪ 2012 run rate at 20,000 gold equivalent ounces ▪ Growth projected to 100,000 gold equivalent ounces ▪ Ultimate mine life: 20+ years Dayton Mine ▪ Mine start planned for 2014 ▪ Mine life: ~10 years Run Rates
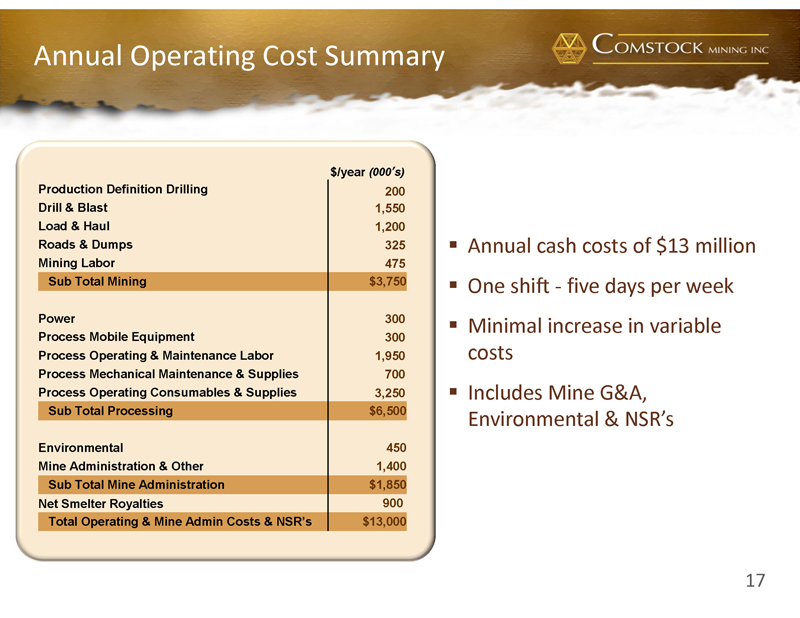
17 Annual Operating Cost Summary $/year (000 ’ s) Production Definition Drilling 200 Drill & Blast 1,550 Load & Haul 1,200 Roads & Dumps 325 Mining Labor 475 Sub Total Mining $3,750 Power 300 Process Mobile Equipment 300 Process Operating & Maintenance Labor 1,950 Process Mechanical Maintenance & Supplies 700 Process Operating Consumables & Supplies 3,250 Sub Total Processing $6,500 Environmental 450 Mine Administration & Other 1,400 Sub Total Mine Administration $1,850 Net Smelter Royalties 900 Total Operating & Mine Admin Costs & NSR ’ s $13,000 ▪ Annual cash costs of $13 million ▪ One shift - five days per week ▪ Minimal increase in variable costs ▪ Includes Mine G&A, Environmental & NSR ’ s
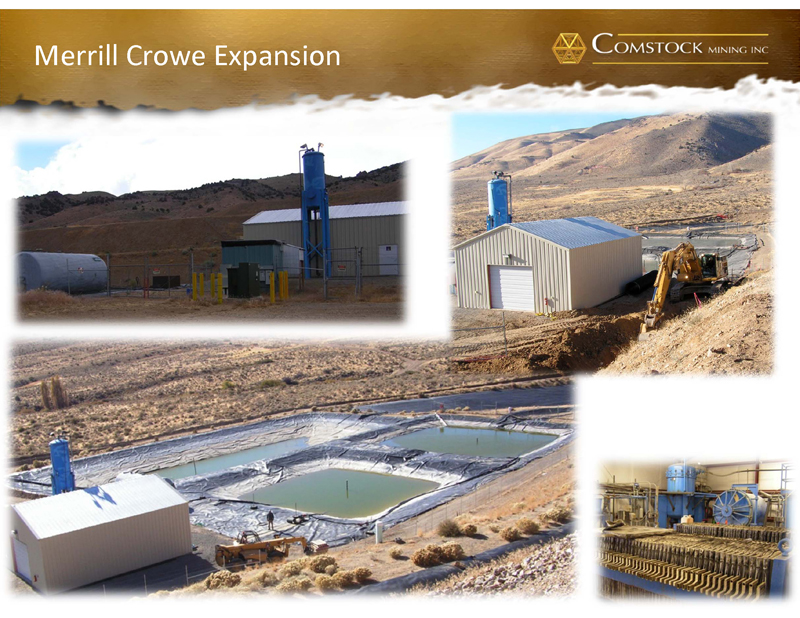
18 Merrill Crowe Expansion
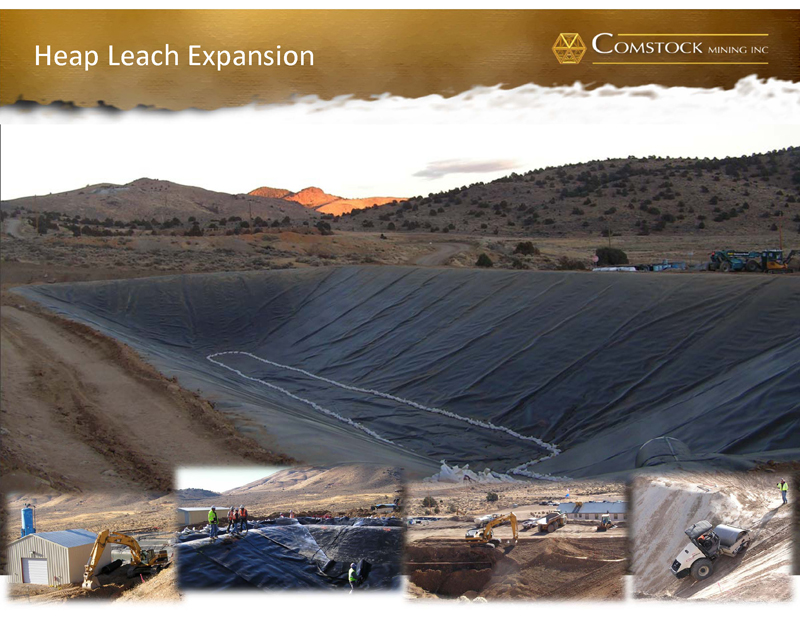
19 Heap Leach Expansion
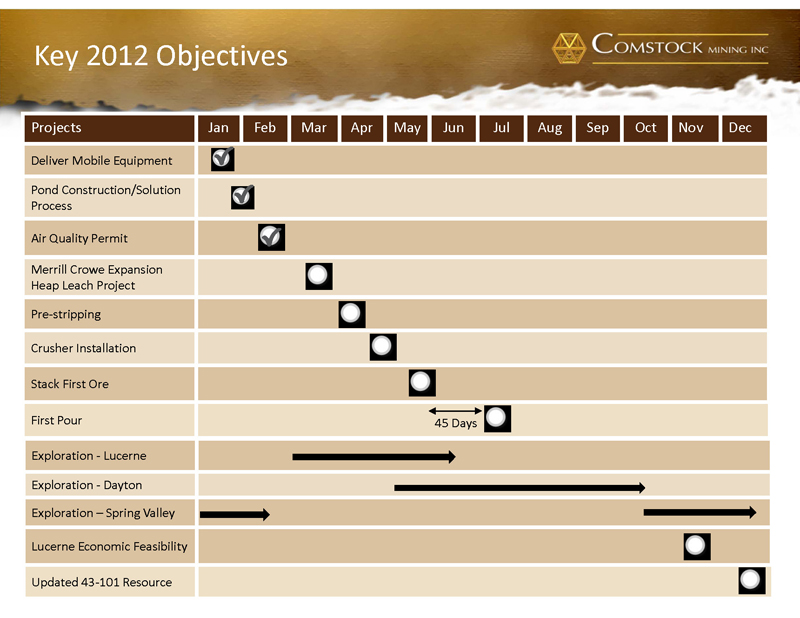
20 Exploration - Lucerne Exploration - Dayton Exploration – Spring Valley Lucerne Economic Feasibility Updated 43 - 101 Resource Key 2012 Objectives Projects Jan Feb Mar Apr May Jun Jul Aug Sep Oct Nov Dec Deliver Mobile Equipment Pond Construction/Solution Process Air Quality Permit Merrill Crowe Expansion Heap Leach Project Pre - stripping Crusher Installation Stack First Ore First Pour 45 Days
21 CORPORATE
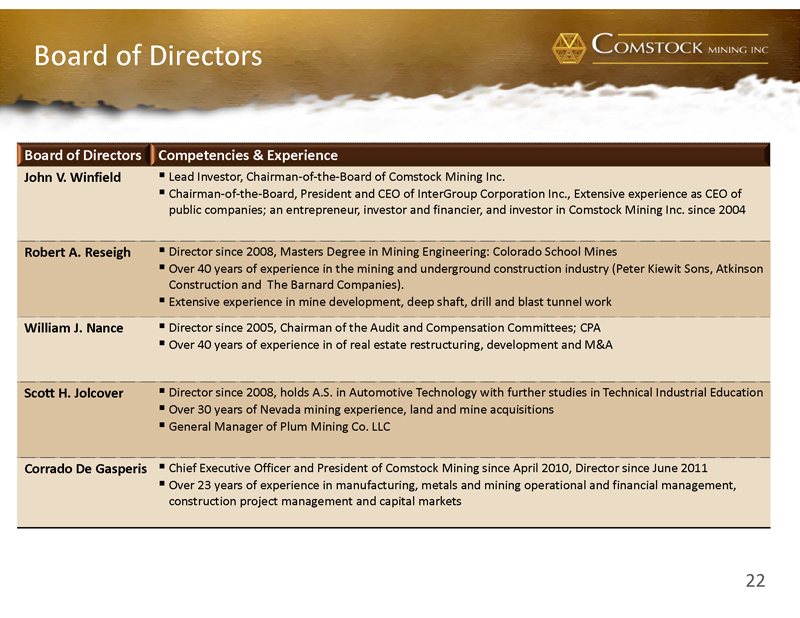
22 Board of Directors Board of Directors Competencies & Experience John V. Winfield ▪ Lead Investor, Chairman - of - the - Board of Comstock Mining Inc. ▪ Chairman - of - the - Board, President and CEO of InterGroup Corporation Inc., Extensive experience as CEO of public companies; an entrepreneur, investor and financier, and investor in Comstock Mining Inc. since 2004 Robert A. Reseigh ▪ Director since 2008, Masters Degree in Mining Engineering: Colorado School Mines ▪ Over 40 years of experience in the mining and underground construction industry (Peter Kiewit Sons, Atkinson Construction and The Barnard Companies). ▪ Extensive experience in mine development, deep shaft, drill and blast tunnel work William J. Nance ▪ Director since 2005, Chairman of the Audit and Compensation Committees; CPA ▪ Over 40 years of experience in of real estate restructuring, development and M&A Scott H. Jolcover ▪ Director since 2008, holds A.S. in Automotive Technology with further studies in Technical Industrial Education ▪ Over 30 years of Nevada mining experience, land and mine acquisitions ▪ General Manager of Plum Mining Co. LLC Corrado De Gasperis ▪ Chief Executive Officer and President of Comstock Mining since April 2010, Director since June 2011 ▪ Over 23 years of experience in manufacturing, metals and mining operational and financial management, construction project management and capital markets
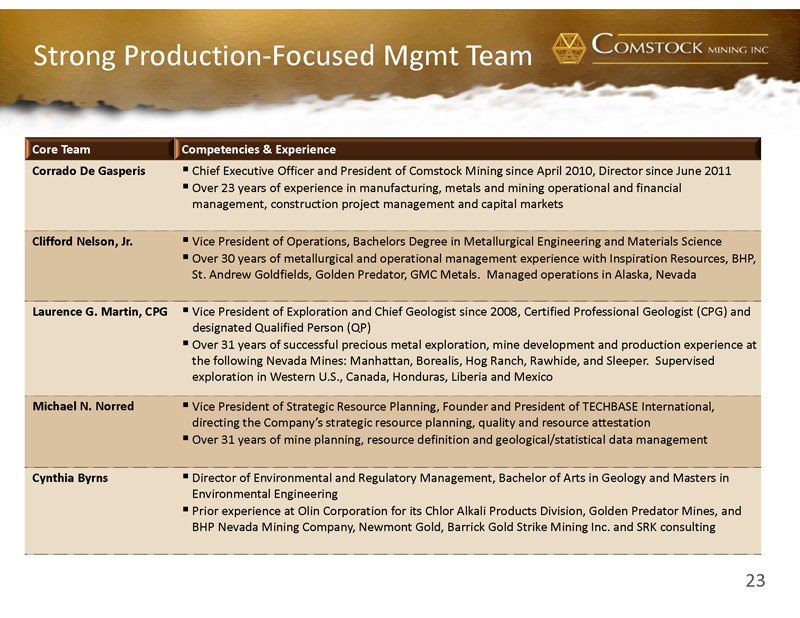
23 Strong Production - Focused Mgmt Team Core Team Competencies & Experience Corrado De Gasperis ▪ Chief Executive Officer and President of Comstock Mining since April 2010, Director since June 2011 ▪ Over 23 years of experience in manufacturing, metals and mining operational and financial management, construction project management and capital markets Clifford Nelson, Jr. ▪ Vice President of Operations, Bachelors Degree in Metallurgical Engineering and Materials Science ▪ Over 30 years of metallurgical and operational management experience with Inspiration Resources, BHP, St. Andrew Goldfields, Golden Predator, GMC Metals. Managed operations in Alaska, Nevada Laurence G. Martin, CPG ▪ Vice President of Exploration and Chief Geologist since 2008, Certified Professional Geologist (CPG) and designated Qualified Person (QP) ▪ Over 31 years of successful precious metal exploration, mine development and production experience at the following Nevada Mines: Manhattan, Borealis, Hog Ranch, Rawhide, and Sleeper. Supervised exploration in Western U.S., Canada, Honduras, Liberia and Mexico Michael N. Norred ▪ Vice President of Strategic Resource Planning, Founder and President of TECHBASE International, directing the Company’s strategic resource planning, quality and resource attestation ▪ Over 31 years of mine planning, resource definition and geological/statistical data management Cynthia Byrns ▪ Director of Environmental and Regulatory Management, Bachelor of Arts in Geology and Masters in Environmental Engineering ▪ Prior experience at Olin Corporation for its Chlor Alkali Products Division, Golden Predator Mines, and BHP Nevada Mining Company, Newmont Gold, Barrick Gold Strike Mining Inc. and SRK consulting

24 LEGAL SERVICES M. Ridgway Barker III, Partner, and Chair of the Corporate Finance and Securities Practice Group INSURANCE SERVICES Nick Conca , Managing Principal Professional Partners AUDITING AND ACCOUNTING Terry Neil, Head of North American Mining Practice DRILLING SERVICES Todd Delong Winnemucca, NV ASSAY George Burke, President Reno, NV METALLURGY Gene McClelland, President and CEO McClelland Labs Reno, NV MINERAL INDUSTRY ADVISORS Behre Dolbear , Mineral Industry Advisors FINANCIAL SERVICES Kenneth D. Moelis , Founder and CEO Mark W. Henkels , Managing Director, Metals and Mining STOCK EXCHANGE Paul Dorfman , Managing Director MINING INDUSTRY SERVICES David L. Bentel , Practice Leader Reno, NV
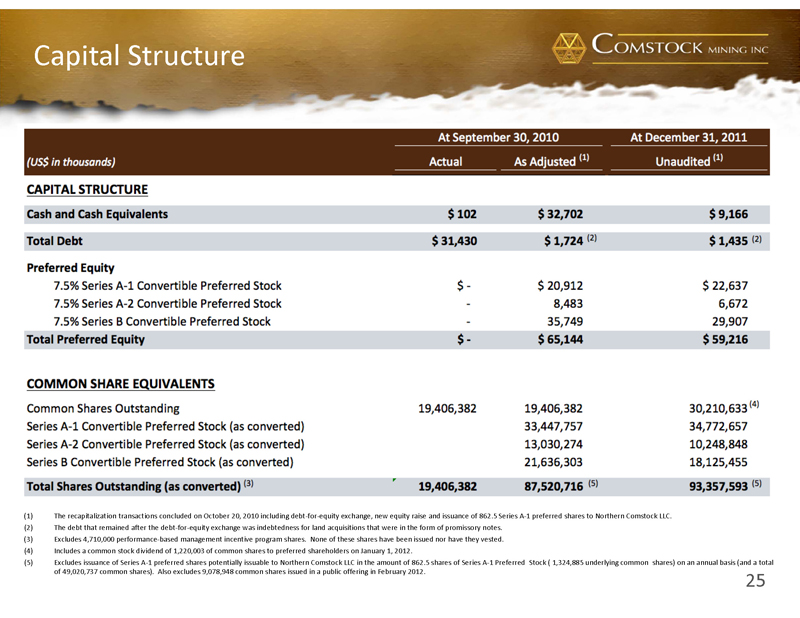
25 Capital Structure (1) The recapitalization transactions concluded on October 20, 2010 including debt - for - equity exchange, new equity raise and is suance of 862.5 Series A - 1 preferred shares to Northern Comstock LLC. (2) The debt that remained after the debt - for - equity exchange was indebtedness for land acquisitions that were in the form of promis sory notes. (3) Excludes 4,710,000 performance - based management incentive program shares. None of these shares have been issued nor have they v ested. (4) Includes a common stock dividend of 1,220,003 of common shares to preferred shareholders on January 1, 2012. (5) Excludes issuance of Series A - 1 preferred shares potentially issuable to Northern Comstock LLC in the amount of 862.5 shares of Series A - 1 Preferred Stock ( 1,324,885 underlying common shares) on an annual basis (and a total of 49,020,737 common shares). Also excludes 9,078,948 common shares issued in a public offering in February 2012.
26 Outstanding Valuation Growth ▪ Nevada ’ s historically prominent GOLD AND SILVER mining district ▪ Consolidated 6,099 acres of contiguous mineralized trend (almost 6 miles) ▪ Validated almost 3 million gold equivalent ounces TO DATE – Still vastly underexplored by modern methods – Significant near - term upside in resource growth – Robust development pipeline of high grade gold and silver deposits ▪ Permitted, production - ready facility provides strong, near term cash flow ▪ Strong management team with development, operational, regulatory and financial experience ▪ Experienced board chaired by the Company's largest shareholder
27 1200 American Flat Rd PO Box 1118 Virginia City, NV 89440 775 - 847 - 5272 Main 775 - 847 - 4755 Investors 7 800 - 750 - 5740 info@comstockmining.com 8 www.comstockmining.com NYSE Amex: LODE March 2012