| | |
| 2. HALF-YEAR MANAGEMENT REPORT |
| | |
| A/ SIGNIFICANT EVENTS OF THE FIRST HALF OF 2020 |
|
| A.1. FIRST-HALF OVERVIEW |
In the first half of 2020, and since the onset of the pandemic, Sanofi has played a leading role in the fight against COVID-19 on multiple fronts:
▪On February 18, 2020, Sanofi announced that it would leverage previous development work for a vaccine against severe acute respiratory syndrome (SARS) to attempt to unlock a fast path forward for developing a COVID-19 vaccine. Sanofi is collaborating with BARDA (the US Biomedical Advanced Research and Development Authority), part of the Office of the Assistant Secretary for Preparedness and Response within the US Department of Health and Human Services, expanding Sanofi’s long-standing partnership with BARDA.
▪On March 27, 2020, Sanofi and Translate Bio, a clinical-stage messenger RNA (mRNA) therapeutics company, announced a collaboration to develop a novel mRNA vaccine for the virus responsible for COVID-19. This collaboration leverages an existing agreement from 2018 between the two companies to develop mRNA vaccines for infectious diseases. Translate Bio has begun to produce multiple mRNA constructs and will use its mRNA platform to discover, design, and manufacture a number of SARS-CoV-2 vaccine candidates. Sanofi will provide deep vaccine expertise and support from its external research networks to advance identified vaccine candidates for potential further development.
▪On April 14, 2020, Sanofi and GSK announced that they had signed a letter of intent to develop an adjuvanted vaccine for COVID‑19, using innovative technology from both companies to help address the pandemic. Sanofi is contributing its S‑protein COVID-19 antigen, which is based on recombinant DNA technology. This technology has produced an exact genetic match to proteins found on the surface of the virus, and the DNA sequence encoding this antigen has been combined into the DNA of the baculovirus expression platform, the basis of Sanofi’s licensed recombinant influenza product in the United States. GSK will contribute its proven pandemic adjuvant technology. The use of an adjuvant can be of particular importance in a pandemic situation since it may reduce the amount of vaccine protein required per dose, allowing more vaccine doses to be produced and thereby helping to protect more people.
▪On April 16, 2020, Sanofi and Luminostics signed an agreement to evaluate a collaboration on a unique self-testing solution for COVID-19 using Luminostics’ innovative technology. Luminostics is contributing its proprietary consumer-diagnostics technology for COVID-19 testing, while Sanofi is bringing its clinical research testing experience and capabilities. The goal is to provide a smartphone-based solution that eliminates the need for healthcare professional administration or laboratory tests.
Also in the first half of 2020, Sanofi continued to implement its new “Play to Win” strategy, involving major decisions and positive actions that will support and rebuild the competitive margins necessary for Sanofi to continue to deliver on its mission. The strategy is based on four major priorities: focus on growth, lead with innovation, accelerate efficiency, and reinvent how we work.
On January 23, 2020, Sanofi completed the acquisition of Synthorx, Inc., a clinical-stage biotechnology company focused on prolonging and improving the lives of people suffering from cancer and autoimmune disorders, for $68 per share in cash, representing an aggregate equity value of approximately $2.5 billion (on a fully diluted basis).
On February 24, 2020, Sanofi announced its ambition to create a leading European company dedicated to the production and marketing to third parties of active pharmaceutical ingredients (API), the essential molecules responsible for the beneficial effects used in the composition of any drug. The project involves creating a new standalone company combining Sanofi’s API commercial and development activities with six of its European API production sites: Brindisi (Italy), Frankfurt Chemistry (Germany), Haverhill (UK), St Aubin les Elbeuf (France), Újpest (Hungary), and Vertolaye (France). With increasing medicine shortages that critically impact patient care, the new entity will contribute to securing API manufacturing and supply capacity for Europe and beyond. The new entity is expected to rank as the world’s second-largest API company, with approximately €1 billion of sales expected by 2022 and 3,100 employees; it is to be headquartered in France. An initial public offering on Euronext Paris is being evaluated with a decision expected by 2022, subject to market conditions. Sanofi is fully committed to the long-term success of the new entity, in which it intends to retain a minority stake of approximately 30%. To provide optimal conditions for success, Sanofi intends the new company to be debt free in order to maximize its future investment capacities, and is committed to remaining an important customer of the new entity.
On February 28, 2020, the Sanofi subsidiary Aventis Inc. acquired from Bristol-Myers Squibb Investco LLC., E.R. Squibb & Sons LLC and Bristol-Myers Squibb Puerto Rico, Inc. (all subsidiaries of BMS) their respective equity interests in the three partnerships that organize the commercialization of Plavix® in the United States and Puerto Rico. As a result of those transactions, Sanofi obtained sole control and freedom to operate commercially with respect to Plavix® in the United States and Puerto Rico. As from March 2020, Sanofi recognizes in its consolidated financial statements the revenues and expenses generated by its own operations in the two territories.
On April 6, 2020, Sanofi announced that it had finalized the planned restructuring related to Praluent® (alirocumab) with Regeneron Pharmaceuticals, Inc. (“Regeneron”). Effective April 1, 2020, Sanofi has sole responsibility for Praluent® outside the United States, while Regeneron has sole responsibility for Praluent® in the United States. The restructuring simplifies the antibody collaboration between the companies, increases efficiency, and streamlines operations for Praluent®. Although each company has responsibility
| | | | | |
| 38 | 2020 Half-Year Financial Report - Sanofi |
for supplying Praluent® in its respective territory, the companies have entered into agreements to support manufacturing needs in the near term. Sanofi had previously announced its intention to restructure the antibody collaboration on Praluent® and Kevzara® (sarilumab) in December 2019.
On May 29, 2020, Sanofi announced the closing of its sale of 13 million shares of Regeneron common stock through a registered offering at a price of $515 per share. This included a previously-announced overallotment option, which was fully exercised by the underwriters. In addition, Sanofi announced the completion of Regeneron's repurchase of 9.8 million shares or approximately $5 billion in common stock directly from Sanofi. As a result of the offering, Sanofi has sold its entire equity investment in Regeneron (except for 400,000 Regeneron shares retained by Sanofi to support its ongoing collaboration with Regeneron) for total gross proceeds of $11.7 billion. Consequently, Sanofi’s equity interest in Regeneron ceased to be accounted for by the equity method. The registered offering and share repurchase will not affect the ongoing collaboration between Sanofi and Regeneron: the two companies have had a successful and long-standing clinical and commercial collaboration dating back to 2003 that has resulted in five approved treatments to date, with additional candidates currently in clinical development.
On June 16, 2020, Sanofi announced that it is investing in France to increase its vaccine research and production capacities, and to respond to future pandemic risks. In line with the corporate strategy presented in December 2019, Sanofi is investing €610 million to create a new flexible, digitalized production site and a research center in France, both dedicated to vaccines. Sanofi’s investment in vaccine production in France involves the creation of an Evolutive Vaccine Facility (EVF) in Neuville sur Saône. This state-of-the-art industrial site will use the latest innovative vaccine production technologies. The project represents an investment of €490 million over a five-year period, and is expected to create 200 new jobs. Building this plant will enable Sanofi Pasteur, Sanofi’s global vaccines entity, to be the first pharmaceutical manufacturer to benefit from such a facility, and will help secure vaccine supplies in France and the rest of Europe in the event of new pandemics. Sanofi is also investing €120 million to create a new R&D center in France, on the Sanofi Pasteur site at Marcy-l’Etoile. This state-of-the-art digital facility will house biosecurity level 3 (BSL 3) laboratories for the development of vaccines against emerging diseases and pandemic risks, and aims to set a global standard for pre-clinical research and pharmaceutical and clinical development.
On June 23, 2020, Sanofi Pasteur and Translate Bio announced they had expanded their existing 2018 collaboration and license agreement to develop mRNA vaccines for infectious diseases. Under the terms of the expanded agreement, Translate Bio receive a total upfront payment of $425 million, consisting of a $300 million cash payment and a private placement equity investment of $125 million at $25.59 per share, representing a 50% premium to the 20-day moving average share price prior to signing. Translate Bio will also be eligible for potential future milestones and other payments of up to $1.9 billion, including $450 million of milestones under the 2018 agreement. Of those potential milestones and other payments, approximately $360 million are anticipated over the next several years, inclusive of COVID-19 vaccine development milestones (under the collaboration announced on March 27, 2020 as described above). Translate Bio is also eligible to receive tiered royalty payments based upon worldwide sales of the developed vaccines. Sanofi Pasteur will pay for all costs during the collaboration term. Under this agreement Sanofi Pasteur will receive exclusive worldwide rights for infectious disease vaccines.
Net sales for the first half of 2020 amounted to €17,180 million, 0.9% higher than in the first half of 2019. At constant exchange rates (CER)1, net sales rose by 1.6%, mainly reflecting good performances for Dupixent® and the Specialty Care GBU generally, which more than offset a decrease in net sales for the General Medicines GBU (and more specifically, lower sales for Plavix® and Aprovel® family products in China, Lantus® in the United States, and Lovenox® in Europe). Net sales for the Vaccines segment were down year-on-year, due largely to reduced sales of travel vaccines due to Covid-19-related travel restrictions. Sales of Consumer Healthcare products also decreased, reflecting in particular the recall of Zantac® in the United States and Canada.
Net income attributable to equity holders of Sanofi amounted to €9,281 million, versus €1,050 million in the first half of 2019, mainly reflecting the gain on the divestment of Sanofi’s equity investment in Regeneron (€7,382 million) following the transaction of May 29, 2020 (see Note B.1. to the condensed half-year consolidated financial statements). Earnings per share was €7.41, versus €0.84 for the first half of 2019. Business net income2 was €3,521 million, up 8.7% on the first half of 2019, while business earnings per share (business EPS3) was 8.1% higher than in the first half of 2019 at €2.81.
1 Non-GAAP financial measure: see definition in C.3., “Net sales”.
2 Non-GAAP financial measure: see definition in C.2., “Business net income”.
| | | | | |
2020 Half-Year Financial Report - Sanofi | 39 |
| | |
| A.2. RESEARCH AND DEVELOPMENT |
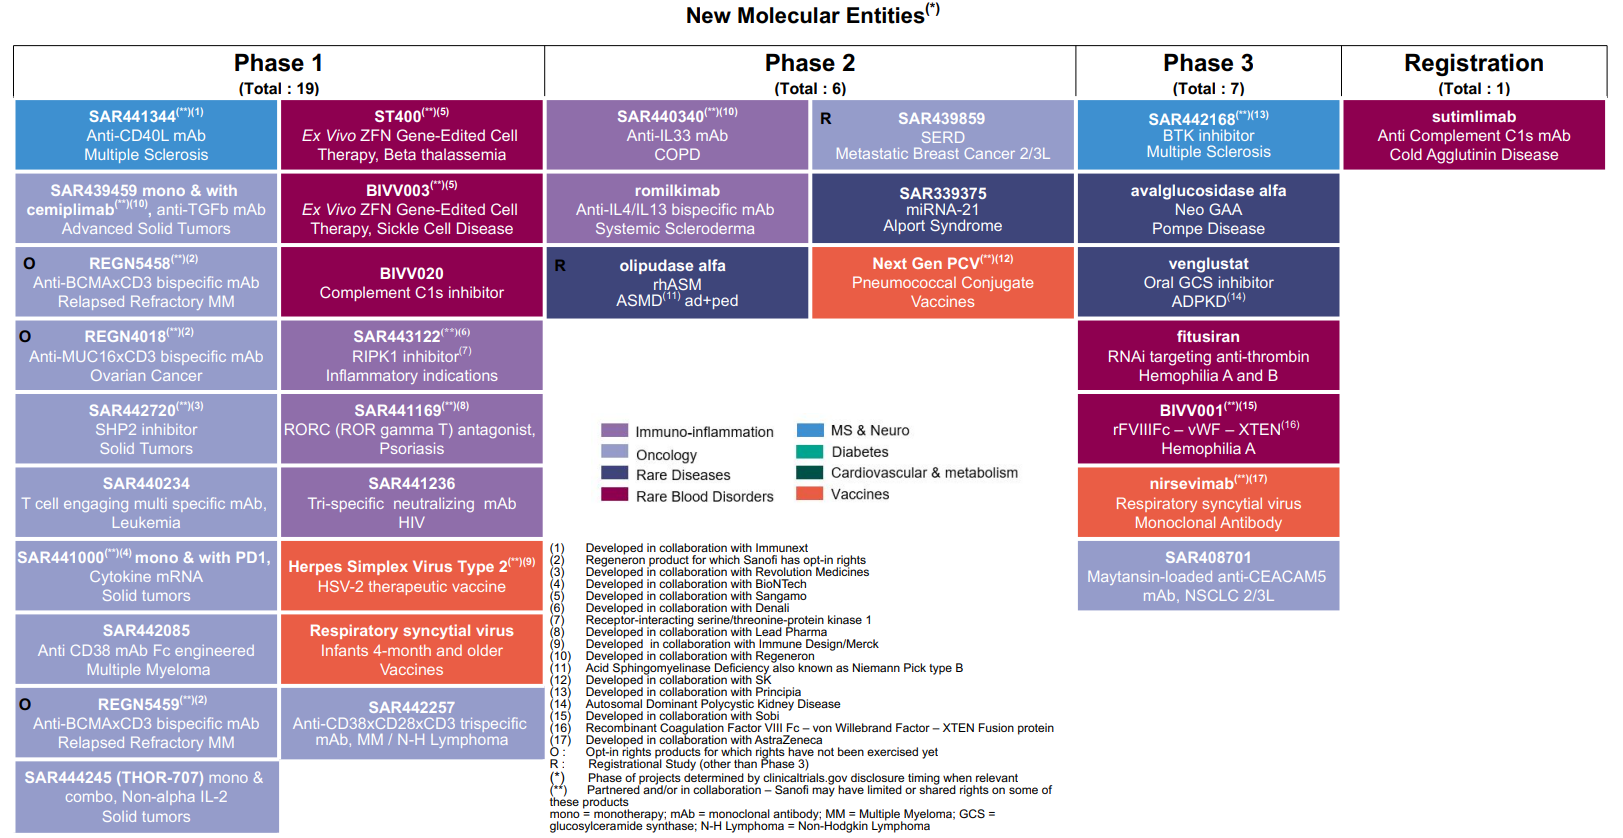
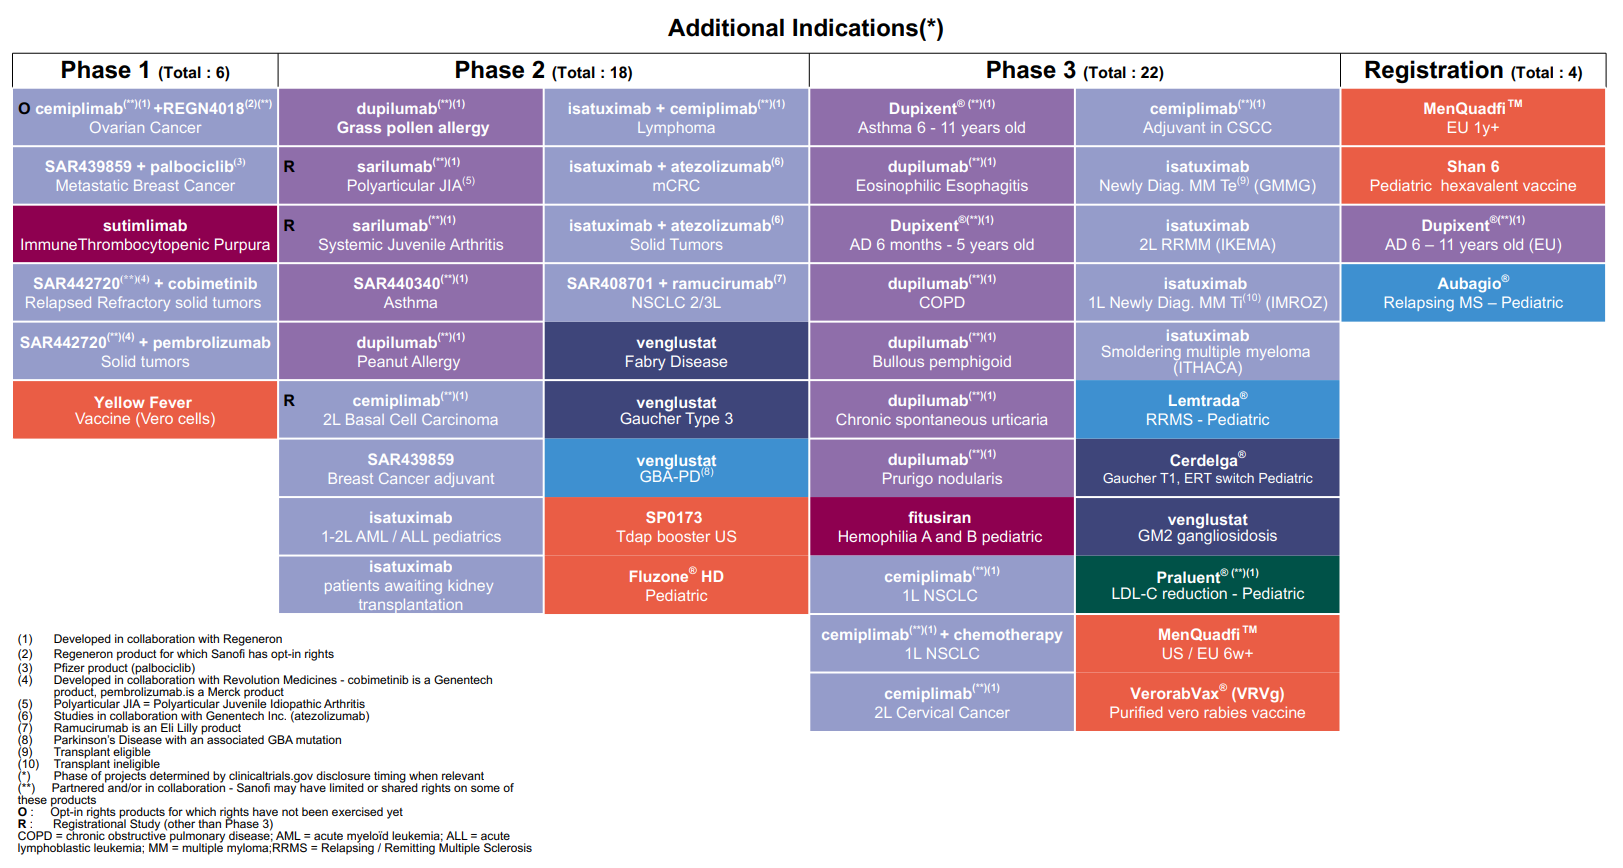
Highlights of Sanofi’s research and development efforts in the first half of 2020 in the Pharmaceuticals segment included the launch of Phase III trials of venglustat (GZ402671), an orally administered glucosylceramide synthase (GCS) inhibitor, in the treatment of GM2 gangliosidoses; of Sarclisa® (isatuximab-irfc) in the treatment of indolent multiple myeloma; and of SAR442168, a BTK inhibitor, in the treatment of remitting-relapsing multiple sclerosis.
Sanofi obtained regulatory marketing approval for a number of products in the first half of 2020. The US Food and Drug Administration (FDA) approved Sarclisa® (isatuximab-irfc) in combination with pomalidomide and dexamethasone (pom-dex) for the treatment of adults with relapsed or refractory multiple myeloma (RRMM). The European Commission and the Japanese healthcare authorities (PDMA) also approved Sarclisa® (isatuximab) for the treatment of adults with RRMM. The FDA approved Dupixent® in the treatment of moderate to severe atopic dermatitis in children aged 6 to 11 years. The Chinese National Medical Products Administration (NMPA) approved Dupixent® (dupilumab) in the treatment of adults with moderate to severe atopic dermatitis not controlled by medically-prescribed topical treatments, or for whom such treatments are contra-indicated. The NMPA identified Dupixent® as a foreign drug for which China has an urgent need in clinical practice, accelerating the evaluation and approval process. Dupixent® was also approved by the PDMA in Japan for nasal polyps. In China, the NPMA approved Aldurazyme® for the treatment of mucopolysaccharidosis type 1. Soliqua® was approved by the PDMA in Japan for the treatment of type 2 diabetes. The FDA approved a Biologics License Application (BLA) for MenQuadfiTM, a conjugate meningococcal vaccine to prevent invasive meningococcal infections (serogroups A, C, W and Y) from age 2 onwards. Finally, Fluzone® QIV HD, an inactivated quadrivalent influenza vaccine, was approved by the European Commission..
For an update on our research and development pipeline, refer to Section F of this half-year management report.
| | |
| A.3. OTHER SIGNIFICANT EVENTS |
|
| A.3.1 CORPORATE GOVERNANCE |
The Annual General Meeting of Sanofi shareholders was held on April 28, 2020 behind closed doors, in accordance with exceptional measures implemented by the French authorities to adapt the rules for holding shareholder meetings in light of the COVID-19 crisis. The meeting, chaired by Serge Weinberg, took place at Sanofi’s Paris headquarters. All the resolutions put to the vote were passed except for the 19th resolution on the compensation awarded in respect of the 2019 financial year to Olivier Brandicourt, the former Chief Executive Officer, who left office on August 31, 2019. Sanofi’s Board of Directors met immediately after the shareholder meeting. The Annual General Meeting approved the individual company financial statements and the consolidated financial statements for the year ended December 31, 2019; it also approved the distribution of a cash dividend of €3.15 per share, paid on May 6, 2020. The meeting approved the reappointment of Laurent Attal, Carole Piwnica, Diane Souza and Thomas Südhof as directors; ratified the co-opting of Paul Hudson as a director; and approved the appointment of Rachel Duan and Lise Kingo as independent directors to replace Suet-Fern Lee and Claudie Haigneré. Following the Annual General Meeting, the Board of Directors still has 16 members, six of whom are women and two of whom are employee representatives. The Board retains a substantial majority of independent directors.
A Board meeting held on May 22, 2020 noted the resignation of Emmanuel Babeau and decided, on advice from the Appointments, Governance and CSR Committee, to co-opt Gilles Schnepp to serve as an independent director for the remaining term of office of Emmanuel Babeau (i.e. until the end of the Annual General Meeting held in 2022 to approve the financial statements for the year ended December 31, 2021). The appointment of Gilles Schnepp will be submitted for ratification at the next Annual General Meeting of Sanofi shareholders on April 28, 2021. Gilles Schnepp was also appointed as a member of the Audit Committee.
On May 29, 2020, Sanofi appointed four new members to its Executive Committee, building on previous organizational changes to put in place a streamlined executive leadership team. The full Executive Committee team now includes the four heads of Sanofi’s global business units (Specialty Care, General Medicines, Sanofi Pasteur, and Consumer Healthcare) as well as the global Heads of Research and Development, Industrial Affairs, Finance, Human Resources, Legal and Digital.
▪Natalie Bickford will take up the post of Executive Vice President, Chief People Officer on August 1, 2020. She joins Sanofi from Merlin Entertainments, the world’s second largest location-based entertainment business (which includes brands like Legoland Resorts, Madame Tussaud’s and Sealife Aquariums). At Merlin, she was responsible for 30,000 employees across Europe, North America, and Asia Pacific. Natalie Bickford brings a wealth of consumer-facing experience. She held previous Human Resources leadership positions at Sodexo, AstraZeneca, and Kingfisher, and has consistently demonstrated a passion for engaging teams and driving change in behaviors and culture. She also has a solid track record of transforming organizations, with a strong focus on inclusion and diversity.
▪Arnaud Robert, previously Chief Digital Officer (CDO) at cruise operator Viking Cruises, joined Sanofi as Executive Vice President, CDO on June 15, 2020, and will drive Sanofi’s digital, data and technology strategy. As a newcomer to the pharmaceuticals sector, Arnaud Robert brings a strong background in consumer and omni-channel strategies, plus expertise in platforms, technology, big data, and user experience. He has held previous leadership positions at The Walt Disney Company and Nike, where he devised and launched the Apple Watch l Nike+ digital community.
▪Julie Van Ongevalle will join Sanofi on September 1, 2020, succeeding Alan Main as Executive Vice President, Head of Consumer Healthcare. She is currently Global Brand President of Origins, a division of the Estée Lauder Companies, based in New York City. With more than 20 years of international experience, Julie Van Ongevalle has a strong track record in building
| | | | | |
| 40 | 2020 Half-Year Financial Report - Sanofi |
brands, from identifying accelerated growth opportunities to devising and delivering sustainable, profitable growth strategies. Her deep knowledge of consumers and digital will be essential as Sanofi builds an agile, stand-alone Consumer Healthcare business.
▪Thomas Triomphe, previously Head of Franchises and Product Strategy at Sanofi Pasteur, was promoted to Executive Vice President, Head of Sanofi Pasteur, on June 15, 2020, replacing David Loew who has left to take the helm at another company. Thomas Triomphe joined Sanofi Pasteur in 2004 as part of a talent management program and has since held roles of increasing responsibility in sales and marketing at country, regional and global levels.
| | |
| A.3.2. LEGAL AND ARBITRATION PROCEEDINGS |
For a description of the most significant developments in legal and arbitration proceedings since publication of the financial statements for the year ended December 31, 2019, refer to Note B.14. to the condensed half-year consolidated financial statements.
The following events have occurred in respect of litigation, arbitration and other legal proceedings in which Sanofi and its affiliates are involved:
•Lantus® Mylan Patent Litigation (United States)
In March 2020, the New Jersey District Court issued a ruling in Mylan/Biocon’s favor finding the asserted claims of U.S. Patent No. 9,526,844 invalid and not infringed by Mylan’s pen product. Sanofi intends to appeal. The 30-month stay is no longer in place for either Mylan’s pen or vial products.
In June 2020, Sanofi filed a petition seeking review by the U.S. Supreme Court of the invalidity decisions for U.S. Patent Nos. 7,476,652 and 7,713,930. The New Jersey District Court proceedings are currently suspended pending Supreme Court review.
Regarding the ongoing Patent Trial and Appeal Board (PTAB) proceedings brought by Mylan and/or Pfizer Inc. challenging the validity of certain claims of U.S. Patent Nos. 8,603,044, 8,679,069, 8,992,486, 9,526,844, and 9,604,008, in April and May 2020, the PTAB issued nine written decisions concerning validity, finding two claims of U.S. Patent No. 9,604,008 valid and the remainder of the challenged claims invalid. Sanofi has appealed the April 2020 and May 2020 PTAB decisions.
Regarding the ongoing PTAB proceedings brought by Mylan challenging the validity of the claims of U.S. Patent No. RE47,614, the PTAB decided to move forward with one of these two IPRs in April 2020. A written decision on the validity of this patent is expected in April 2021.
| | |
| GOVERNMENT INVESTIGATIONS AND RELATED LITIGATION |
On March 31, 2020, two putative class actions on behalf of direct purchasers of insulin (Rochester Drug Co-Operative, Inc. and FWK Holdings, LLC) were filed in the New Jersey Federal Court against Sanofi U.S., asserting claims under the RICO Act and various state and federal laws. A third action was filed by another direct purchaser (Value Drug Co.) on April 27, 2020, and a motion to consolidate the three lawsuits is pending.
On March 24, 2020, Sanofi announced that it had successfully placed a €1.5 billion bond issue in two tranches. On April 6, 2020, Sanofi carried out a €500 million tap issue on two outstanding bond tranches.
Those issues were carried out under the Euro Medium Term Note program, and enable Sanofi to reduce the average cost and extend the average maturity of its debt. The proceeds of the issue have been allocated for general corporate purposes.
On June 8, 2020, Sanofi launched “Action 2020”, a global employee stock ownership plan, across nearly 75 countries. Sanofi sees its employees as crucial to value creation, and issuing shares gives them a greater stake in the company’s future growth and results. The plan stems from a decision by the Sanofi Board of Directors on February 5, 2020 to issue ordinary shares to employees belonging to the Group savings plan. The subscription price was €70.67, corresponding to 80% of the average opening price of Sanofi shares quoted on Euronext Paris for the 20 trading days preceding June 2, 2020. For each tranche of five shares applied for, the applicant received one additional new share by way of employer’s contribution; and for each application for 20 or more shares, the applicant received an additional four new shares by way of employer’s contribution. Employees could subscribe for no more than 1,500 shares, subject to a cap set at 25% of their annual gross compensation. The issue is due to be completed and the shares delivered by the end of July 2020. The maximum number of Sanofi shares that can be issued under the plan is 6,269,231 (representing a maximum capital increase of €12,538,461 in nominal value, i.e. 0.5% of the share capital).
| | | | | |
2020 Half-Year Financial Report - Sanofi | 41 |
| | |
| B/ EVENTS SUBSEQUENT TO JUNE 30, 2020 |
Early July, 2020, Sanofi entered into an exclusive license agreement with Kiadis Pharma N.V., a clinical-stage biopharmaceutical company developing natural killer (NK) cell therapies for patients with life-threatening diseases, for Kiadis’ previously undisclosed K-NK004 program. The agreement covers Kiadis’ proprietary CD38 knock out (CD38KO) K-NK therapeutic for combination with anti-CD38 monoclonal antibodies including Sarclisa®, Sanofi’s recently approved therapy for patients with multiple myeloma. Sanofi also obtained exclusive rights to use Kiadis’ K-NK platform for two undisclosed pre-clinical programs. As part of the agreement, Kiadis will receive a €17.5 million upfront payment and will be entitled to receive up to €857.5 million upon Sanofi attaining preclinical, clinical, regulatory and commercial milestones. Kiadis will also receive double-digit royalties based on commercial sales of approved products resulting from the agreement.
Early July, 2020, Sanofi and Kymera Therapeutics Inc. signed a multi-program strategic collaboration agreement to develop and commercialize first-in-class protein degrader therapies targeting IRAK4 in patients with immune-inflammatory diseases. The companies will also partner on a second earlier stage program. Kymera will receive $150 million in cash upfront and may receive more than $2 billion in potential milestones, as well as royalty payments. Kymera retains the option to participate in US development and commercialization for both programs subject to its having an equal share in the costs, profits and losses, and to co-promote partnered products in the US.
| | | | | |
| 42 | 2020 Half-Year Financial Report - Sanofi |
| | |
| C/ CONSOLIDATED FINANCIAL STATEMENTS FOR THE FIRST HALF OF 2020 |
Unless otherwise indicated, all financial data in this report are presented in accordance with international financial reporting standards (IFRS), including international accounting standards and interpretations (see Note A.1. to the condensed half-year consolidated financial statements).
Consolidated income statements for the six months ended June 30, 2019 and June 30, 2020
| | | | | | | | | | | | | | |
| (€ million) | June 30, 2020 (6 months) | as % of net sales | June 30, 2019 (6 months) | as % of net sales |
| Net sales | 17,180 | | 100.0 | % | 17,019 | | 100.0 | % |
| Other revenues | 574 | | 3.3 | % | 674 | | 4.0 | % |
| Cost of sales | (5,543) | | (32.3) | % | (5,385) | | (31.6) | % |
| Gross profit | 12,211 | | 71.1 | % | 12,308 | | 72.3 | % |
| Research and development expenses | (2,692) | | (15.7) | % | (2,972) | | (17.5) | % |
| Selling and general expenses | (4,607) | | (26.8) | % | (4,835) | | (28.4) | % |
| Other operating income | 281 | |
| 273 | | |
| Other operating expenses | (693) | |
| (466) | | |
| Amortization of intangible assets | (883) | |
| (1,116) | | |
| Impairment of intangible assets | (323) | |
| (1,840) | | |
| Fair value remeasurement of contingent consideration | 54 | |
| 190 | | |
| Restructuring costs and similar items | (758) | |
| (747) | | |
| Other gains and losses, and litigation | 136 | |
| 317 | | |
| Gain on Regeneron investment arising from transaction of May 29, 2020 | 7,382 | | | — | | |
| Operating income | 10,108 | | 58.8 | % | 1,112 | | 6.5 | % |
| Financial expenses | (198) | |
| (244) | | |
| Financial income | 31 | |
| 94 | | |
| Income before tax and investments accounted for using the equity method | 9,941 | | 57.9 | % | 962 | | 5.7 | % |
| Income tax expense | (994) | |
| (13) | | |
| Share of profit/(loss) from investments accounted for using the equity method | 354 | |
| 116 | | |
| Net income | 9,301 | | 54.1 | % | 1,065 | | 6.3 | % |
| Net income attributable to non-controlling interests | 20 | |
| 15 | |
|
| Net income attributable to equity holders of Sanofi | 9,281 | | 54.0 | % | 1,050 | | 6.2 | % |
| Average number of shares outstanding (million) | 1,251.7 | |
| 1,247.2 | |
|
| Average number of shares after dilution (million) | 1,258.2 | |
| 1,254.7 | |
|
▪Basic earnings per share (in euros) | 7.41 | |
| 0.84 | |
|
▪Diluted earnings per share (in euros) | 7.38 | |
| 0.84 | |
|
| | | | | |
2020 Half-Year Financial Report - Sanofi | 43 |
| | |
| C.1. SEGMENT INFORMATION |
|
| C.1.1. OPERATING SEGMENTS |
In accordance with IFRS 8 (Operating Segments), the segment information reported by Sanofi is prepared on the basis of internal management data provided to our Chief Executive Officer, who is the chief operating decision maker of Sanofi. The performance of those segments is monitored individually using internal reports and common indicators. The operating segment disclosures required under IFRS 8 are provided in Note B.20. to the condensed half-year consolidated financial statements.
Sanofi has three operating segments: Pharmaceuticals, Vaccines, and Consumer Healthcare.
The Pharmaceuticals segment comprises the commercial operations of the following global franchises: Specialty Care (Dupixent®, Multiple Sclerosis, Neurology, Other Inflammatory Diseases & Immunology, Rare Diseases, Oncology, and Rare Blood Disorders) and General Medicines (Diabetes, Cardiovascular, and Established Prescription Products), together with research, development and production activities dedicated to the Pharmaceuticals segment. This segment also includes associates whose activities are related to pharmaceuticals. Following the transaction of May 29, 2020, Regeneron is no longer an associate of Sanofi (see Note B.1. to our condensed half-year consolidated financial statements). Consequently, the Pharmaceuticals segment no longer includes Sanofi’s equity-accounted share of Regeneron’s profits for all the periods presented in this section.
The Vaccines segment comprises, for all geographical territories, the commercial operations of Sanofi Pasteur, together with research, development and production activities dedicated to vaccines.
The Consumer Healthcare segment comprises, for all geographical territories, the commercial operations for Sanofi’s Consumer Healthcare products, together with research, development and production activities dedicated to those products.
Inter-segment transactions are not material.
The costs of Sanofi’s global support functions (External Affairs, Finance, Human Resources, Legal Affairs, Information Solutions & Technologies, Sanofi Business Services, etc.) are mainly managed centrally at group-wide level. The costs of those functions are presented within the “Other” category. That category also includes other reconciling items such as retained commitments in respect of divested activities.
In 2020, Sanofi adopted a new management reporting structure. This resulted in cost reallocations between the Pharmaceuticals, Consumer Healthcare, Vaccines segments and the “Other” category, and product reallocations (mainly between Pharmaceuticals and Consumer Healthcare). Expenses relating to Medical Affairs, allocated to the “Other” category in the old management reporting structure, were reallocated to the Pharmaceuticals segment.
| | |
| C.1.2. BUSINESS OPERATING INCOME |
We report segment results on the basis of “Business operating income”. This indicator is used internally by Sanofi’s chief operating decision maker to measure the performance of each operating segment and to allocate resources. For a definition of “Business operating income”, and a reconciliation between that indicator and Income before tax and investments accounted for using the equity method, refer to Note B.20.1.2. to our condensed half-year consolidated financial statements.
Following the transaction of May 29, 2020, Regeneron is no longer an associate of Sanofi (see Note B.1. to our condensed half-year consolidated financial statements). Consequently, the definition of the “Business operating income” indicator has been adjusted, and no longer includes Sanofi’s share of the net income of Regeneron. This means that the Share of profit/(loss) from investments accounted for using the equity method line in the table reconciling Operating income (as shown in the income statement) to “Business operating income” no longer includes the equity-accounted share of profits from Regeneron. The comparatives presented for 2019 have been restated to reflect that adjustment. In addition, the gain arising on the divestment of the equity investment in Regeneron is not included in “Business operating income”, with the exception of the gain on the remeasurement of the 400,000 retained shares at market value at the transaction date.
In addition, with effect from January 1, 2020 “Business operating income” includes depreciation charged against right-of-use assets recognized under IFRS 16 (Leases), applicable since January 1, 2019, and excludes rental expenses previously recognized under IAS 17. In the interests of consistency, business operating income and business operating income margin for comparative periods of 2019 presented have been restated to include the effects of IFRS 16, and of certain expenses and income presented differently for segment reporting purposes to align on Sanofi’s new 2020 management reporting structure (see C.1.1, “Operating Segments”, above).
In the first half of 2020, “Business operating income” amounted to €4,683 million (versus €4,306 million for the first half of 2019), while “Business operating income margin” was 27.3% (versus 25.3% for the first half of 2019). “Business operating income margin” is a non-GAAP financial measure that we define as the ratio of “Business net income” to our consolidated net sales.
Because our business operating income and business operating income margin are not standardized measures, they may not be directly comparable with the non-GAAP financial measures of other companies using the same or similar non-GAAP financial measures. Despite the use of non-GAAP measures by management in setting goals and measuring performance, these are non-GAAP measures that have no standardized meaning prescribed by IFRS.
| | | | | |
| 44 | 2020 Half-Year Financial Report - Sanofi |
We believe that understanding of our operational performance by our management and our investors is enhanced by reporting “Business net income”. This non-GAAP financial measure represents “Business operating income”, less net financial expenses and the relevant income tax effects.
On May 29, 2020, Sanofi sold its entire equity investment in Regeneron (except for 400,000 Regeneron shares retained by Sanofi) for gross sale proceeds of $11.7 billion (see Note B.1. to our condensed half-year consolidated financial statements). As a result, the definition of the non-GAAP financial measure “Business net income” has been adjusted such that Share of profit/(loss) from investments accounted for using the equity method now excludes the effects of applying the equity method to the investment in Regeneron. The effects of applying the equity method to the investment in Regeneron up to and including May 29, 2020 are now shown on a separate line in the table reconciling “Business net income” to Net income attributable to equity holders of Sanofi. The comparative periods of 2019 presented have been restated to reflect that adjustment.
In addition, with effect from January 1, 2020 “Business net income” includes depreciation charged against right-of-use assets recognized under IFRS 16 (Leases), applicable since January 1, 2019, and excludes rental expenses previously recognized under IAS 17.
“Business net income” for the first half of 2020 amounted to €3,521 million, 8.7% more than in the first half of 2019 (€3,240 million). That represents 20.5% of net sales, versus 19.0% for the first half of 2019.
We also report “Business earnings per share” (business EPS), a non-GAAP financial measure which we define as business net income divided by the weighted average number of shares outstanding.
Business EPS was €2.81 for the first half of 2020, 8.1% higher than the 2019 first-half figure of €2.60, based on an average number of shares outstanding of 1,251.7 million for the first half of 2020 and 1,247.2 million for the first half of 2019.
The table below reconciles our “Business operating income” to our “Business net income”:
| | | | | | | | | | | | | | | | | |
| (€ million) | June 30, 2020 (6 months) | June 30, 2019 (6 months) | (a) | December 31, 2019 (12 months) | (a) |
| Business operating income | 4,683 | | 4,306 | | | 9,349 | | |
| Financial income and expenses | (167) | | (150) | | | (303) | | |
| Income tax expense | (995) | | (916) | | | (1,996) | | |
| Business net income | 3,521 | | 3,240 | | | 7,050 | | |
(a)2019 figures have been restated to exclude Sanofi’s share of profits from its equity investment in Regeneron (see Note B.1. to our condensed half-year consolidated financial statements) and to include the effects of IFRS 16 for comparative purposes.
We define “Business net income” as Net income attributable to equity holders of Sanofi determined under IFRS, excluding the following items:
▪amortization and impairment losses charged against intangible assets (other than software and other rights of an industrial or operational nature);
▪fair value remeasurements of contingent consideration relating to business combinations or divestments;
▪other impacts associated with acquisitions (including impacts of acquisitions on investments accounted for using the equity method);
▪restructuring costs and similar items (presented within the line item Restructuring costs and similar items);
▪other gains and losses, including gains and losses on major disposals of non-current assets (presented within the line item Other gains and losses, and litigation);
▪the gain on the divestment of Regeneron shares dated May 29, 2020 (not including the gain on the remeasurement of the 400,000 retained shares at market value as of that date);
▪other costs and provisions related to litigation (presented within the line item Other gains and losses, and litigation);
▪the tax effects of the items listed above, and the impact of major tax disputes; and
▪the effects of the discontinuation of accounting by the equity method for the investment in Regeneron (see Note B.1. to our condensed half-year consolidated financial statements);
▪the portion attributable to non-controlling interests of the items listed above.
| | | | | |
2020 Half-Year Financial Report - Sanofi | 45 |
The table below reconciles our “Business net income” to Net income attributable to equity holders of Sanofi:
| | | | | | | | | | | | | | | | | |
| (€ million) | June 30, 2020 (6 months) | June 30, 2019 (6 months) | (a) | December 31, 2019 (12 months) | (a) |
| Net income attributable to equity holders of Sanofi | 9,281 | | 1,050 | | | 2,806 | | |
Amortization of intangible assets (b) | 883 | | 1,116 | | | 2,146 | | |
Impairment of intangible assets (c) | 323 | | 1,840 | | | 3,604 | | |
| Fair value remeasurement of contingent consideration | (54) | | (190) | | | (238) | | |
| Expenses arising from the impact of acquisitions on inventories | 36 | | 3 | | | 3 | | |
| | | | | |
| Restructuring costs and similar items | 758 | | 747 | | | 1,062 | | |
Other gains and losses, and litigation (d) | (136) | | (317) | | | (327) | | |
Gain on divestment of Regeneron shares on May 29, 2020 (e) | (7,225) | | — | | | — | | |
| Tax effects of the items listed above: | (1) | | (903) | | | (1,857) | | |
▪amortization and impairment of intangible assets | (302) | | (711) | | | (1,409) | | |
▪fair value remeasurement of contingent consideration | 2 | | 24 | | | (6) | | |
▪expenses arising from the impact of acquisitions on inventories | (5) | | — | | | — | | |
| | | | | |
▪tax effects of restructuring costs and similar items | (232) | | (197) | | | (311) | | |
▪ gain on divestment of Regeneron shares on May 29, 2020 | 475 | | — | | | — | | |
▪other tax effects | 61 | | (19) | | | (131) | | |
| Share of items listed above attributable to non-controlling interests | (1) | | — | | | (4) | | |
| Investments accounted for using the equity method: restructuring costs and expenses arising from the impact of acquisitions | (30) | | 53 | | | 165 | | |
Effect of discontinuation of equity method for investment in Regeneron (f) | (313) | | (159) | | | (411) | | |
Net income from held-for-exchange operations, net of tax (g) | — | | — | | | 101 | | |
| Business net income | 3,521 | | 3,240 | | | 7,050 | | |
| Average number of shares outstanding (million) | 1,251.7 | | 1,247.2 | | | 1,249.9 | | |
| Basic earnings per share (in euros) | 7.41 | | 0.84 | | | 2.24 | | |
| Reconciling items per share (in euros) | (4.60) | | 1.76 | | | 3.40 | | |
| Business earnings per share (in euros) | 2.81 | | 2.60 | | | 5.64 | | |
(a)“Business net income” for the 2019 comparative periods has been restated to exclude Sanofi’s share of profits from its equity investment in Regeneron, and to include the effects of IFRS 16 for comparative purposes.
(b)Includes amortization expense related to accounting for business combinations: €839 million in the six months ended June 30, 2020; €1,060 million in the six months ended June 30, 2019; and €2,044 million in the year ended December 31, 2019.
(c)For the first half of 2020, this line includes impairment losses taken against in-house and partnered R&D programs within the Specialty Care GBU, and to the discontinuation of certain R&D programs and collaboration agreements in Diabetes, in line with the strategy announced by Sanofi in December 2019. For 2019, this line includes impairment losses taken against Eloctate® franchise assets amounting to €2,803 million over the full year and €1,609 million in the first half.
(d)For the six months ended June 30, 2020, this line mainly comprises the gain on the sale of operations related to the Seprafilm product to Baxter.
(e)This line includes the gain on the sale of (i) 13 million shares of Regeneron common stock in the registered public offering and (ii) the 9.8 million shares repurchased by Regeneron, but does not include the gain arising from the remeasurement of the 400,000 retained shares at market value as of May 29, 2020.
(f)“Business net income” no longer includes Sanofi’s share of profits from its equity investment in Regeneron (see Note B.1. to our condensed half-year consolidated financial statements), which is reflected on this line.
(g)This line shows the residual impacts of the divestment of our Animal Health business.
The most significant reconciling items between “Business net income” and Net income attributable to equity holders of Sanofi relate to (i) the purchase accounting effects of our acquisitions and business combinations, particularly the amortization and impairment of intangible assets (other than software and other rights of an industrial or operational nature) and (ii) the impacts of restructurings or transactions regarded as non-recurring, where the amounts involved are particularly significant. We believe that excluding those impacts enhances an investor’s understanding of our underlying economic performance, because it gives a better representation of our recurring operating performance.
We believe that eliminating charges related to the purchase accounting effect of our acquisitions and business combinations (particularly amortization and impairment of some intangible assets) enhances comparability of our ongoing operating performance relative to our peers. Those intangible assets (principally rights relating to research, development and commercialization of products) are accounted for in accordance with IFRS 3 (Business Combinations) and hence may be subject to remeasurement. Such remeasurements are not made other than in a business combination.
We also believe that eliminating the other effects of business combinations (such as the incremental cost of sales arising from the workdown of acquired inventories remeasured at fair value in business combinations) gives a better understanding of our recurring operating performance.
| | | | | |
| 46 | 2020 Half-Year Financial Report - Sanofi |
Eliminating restructuring costs and similar items enhances comparability with our peers because those costs are incurred in connection with reorganization and transformation processes intended to optimize our operations.
Finally, we believe that eliminating the effects of transactions that we regard as non-recurring and that involve particularly significant amounts (such as major gains and losses on disposals, and costs and provisions associated with major litigation and other major non-recurring items) improves comparability from one period to the next.
We remind investors, however, that “Business net income” should not be considered in isolation from, or as a substitute for, Net income attributable to equity holders of Sanofi reported in accordance with IFRS. In addition, we strongly encourage investors and potential investors not to rely on any single financial measure but to review our financial statements, including the notes thereto, carefully and in their entirety.
We compensate for the material limitations described above by using “Business net income” only to supplement our IFRS financial reporting and by ensuring that our disclosures provide sufficient information for a full understanding of all adjustments included in “Business net income”.
Because our “Business net income” and “Business EPS” are not standardized measures, they may not be directly comparable with the non-GAAP financial measures of other companies using the same or similar non-GAAP financial measures.
| | | | | |
2020 Half-Year Financial Report - Sanofi | 47 |
Net sales for the first half of 2020 amounted to €17,180 million, 0.9% higher than in the first half of 2019. Exchange rate fluctuations had a negative effect of 0.7 of a percentage point overall, due mainly to adverse trends in the euro exchange rate against the Brazilian real, Argentinean peso and Turkish lira, partially offset by favorable trends in the US dollar and Japanese yen rates. At constant exchange rates (CER, see definition below), net sales rose by 1.6%. This mainly reflects good performances for Dupixent® and the Specialty Care GBU generally, which more than offset a decrease in net sales for the General Medicines GBU (and more specifically, lower sales for Plavix® and Aprovel® family products in China, Lantus® in the United States, and Lovenox® in Europe). Net sales for the Vaccines segment were also down year-on-year, partly due to reduced sales of travel vaccines linked to Covid-19-related travel restrictions. Sales of Consumer Healthcare products also decreased, reflecting in particular the recall of Zantac® in the United States and Canada.
Reconciliation of net sales to net sales at constant exchange rates
| | | | | | | | | | | |
| (€ million) | June 30, 2020 (6 months) | June 30, 2019 (6 months) | Change |
| Net sales | 17,180 | | 17,019 | | +0.9 | % |
| Effect of exchange rates | 104 | | | |
| Net sales at constant exchange rates | 17,284 | | 17,019 | | +1.6 | % |
When we refer to changes in our net sales at constant exchange rates (CER), that means that we have excluded the effect of exchange rates by recalculating net sales for the relevant period using the exchange rates that were used for the previous period.
When we refer to changes in our net sales on a constant structure (CS) basis, that means that we eliminate the effect of changes in structure by restating the net sales for the previous period as follows:
▪by including sales generated by entities or product rights acquired in the current period for a portion of the previous period equal to the portion of the current period during which we owned them, based on historical sales information we receive from the party from whom we make the acquisition;
▪similarly, by excluding sales for a portion of the previous period when we have sold an entity or rights to a product in the current period; and
▪for a change in consolidation method, by recalculating the previous period on the basis of the method used for the current period.
To facilitate analysis and comparisons with prior periods, some figures are given at constant exchange rates and on a constant structure basis (CER/CS).
| | |
| C.3.1. NET SALES BY GLOBAL BUSINESS UNIT (GBU) |
Our net sales comprise the net sales generated by our Pharmaceuticals, Vaccines and Consumer Healthcare segments. The table below also presents net sales by Global Business Unit (GBU).
| | | | | | | | | | | | | | | | | |
| (€ million) | June 30, 2020 (6 months) | June 30, 2019 (6 months) | (a) | Change on
a reported
basis | Change at
constant
exchange rates |
| Specialty Care GBU | 5,402 | | 4,314 | | | +25.2 | % | +23.9 | % |
| General Medicines GBU | 7,618 | | 8,404 | | | -9.4 | % | -8.2 | % |
| Pharmaceuticals segment | 13,020 | | 12,718 | | | +2.4 | % | +2.7 | % |
| Vaccines GBU/segment | 1,836 | | 1,894 | | | -3.1 | % | -2.0 | % |
| Consumer Healthcare GBU/segment | 2,324 | | 2,407 | | | -3.4 | % | -1.6 | % |
| Total net sales | 17,180 | | 17,019 | | | +0.9 | % | +1.6 | % |
(a)To reflect the new organizational structure adopted by Sanofi on January 1, 2020, figures for 2019 have been restated to take account of transfers of products between GBUs, as described below.
With effect from the first quarter of 2020, Sanofi is organized into three major Global Business Units that underpin the corporate strategy: the Speciality Care GBU (Dupixent®, Multiple Sclerosis, Neurology, Other Inflammatory Diseases & Immunology, Rare Diseases, Oncology, and Rare Blood Disorders), the Vaccines GBU, and the General Medicines GBU (Diabetes, Cardiovascular and Established Prescription Products). The Consumer Healthcare GBU has become a standalone commercial entity with its own manufacturing and R&D capabilities. Each GBU now includes its own contribution to emerging markets sales. The new structure has led to some products being transferred, and some franchises being combined. Some mature products formerly in the Oncology franchise (Zaltrap®, Mozobil®, Thymoglobulin®, Clolar®, Fludara®, Taxotere®, Eloxatin® and Campath®) have been transferred to the Established Prescription Products franchise in the General Medicines GBU. The Cardiovascular franchise (Praluent® and Multaq®) and the Established Prescription Products franchise have been combined. Some products formerly in the Consumer Healthcare GBU have been transferred to the General Medicines GBU and vice versa, with virtually no effect on the sales of the two GBUs. Finally, endocrinology products (Thyrogen®, Caprelsa®) have been transferred to the Established Prescription Products franchise.
| | | | | |
| 48 | 2020 Half-Year Financial Report - Sanofi |
| | |
C.3.2. NET SALES BY GEOGRAPHICAL REGION(a) AND PRODUCT |
| | | | | | | | | | | | | | | | | | | | | | | | | | | | | |
| (€ million) | Net sales | Change
(CER) | Change
(reported) | United
States | Change
(CER) | Europe | Change
(CER) | Rest of
the World | Change
(CER) |
Dupixent® | 1,634 | | +93.8 | % | +98.1 | % | 1,310 | | +91.0 | % | 174 | | +109.6 | % | 150 | | +101.4 | % |
Aubagio® | 1,068 | | +16.5 | % | +18.3 | % | 775 | | +17.2 | % | 231 | | +13.7 | % | 62 | | +18.5 | % |
Lemtrada® | 68 | | -59.0 | % | -59.0 | % | 35 | | -57.8 | % | 18 | | -72.3 | % | 15 | | -16.7 | % |
Kevzara® | 117 | | +40.2 | % | +42.7 | % | 64 | | +31.3 | % | 37 | | +105.6 | % | 16 | | -6.3 | % |
| Total Multiple Sclerosis, Neurology, Other Inflammatory Diseases & Immunology | 1,253 | | +7.3 | % | +8.9 | % | 874 | | +10.1 | % | 286 | | — | | 93 | | +6.8 | % |
Cerezyme® | 368 | | +5.8 | % | +1.4 | % | 90 | | -1.1 | % | 125 | | -2.3 | % | 153 | | +17.0 | % |
Cerdelga® | 115 | | +16.3 | % | +17.3 | % | 63 | | +7.0 | % | 45 | | +28.6 | % | 7 | | +33.3 | % |
Myozyme®/ Lumizyme® | 472 | | +4.4 | % | +4.0 | % | 178 | | +6.8 | % | 193 | | -1.0 | % | 101 | | +11.3 | % |
Fabrazyme® | 413 | | +3.8 | % | +4.3 | % | 206 | | +1.0 | % | 98 | | +10.0 | % | 109 | | +3.7 | % |
Aldurazyme® | 122 | | +1.7 | % | +0.8 | % | 26 | | — | | 39 | | — | | 57 | | +3.6 | % |
| Total Rare Diseases | 1,532 | | +5.2 | % | +4.1 | % | 563 | | +3.0 | % | 500 | | +2.9 | % | 469 | | +10.2 | % |
Jevtana® | 271 | | +13.1 | % | +14.3 | % | 123 | | +18.8 | % | 92 | | +5.7 | % | 56 | | +14.3 | % |
Fasturtec® | 72 | | +9.2 | % | +10.8 | % | 45 | | +7.3 | % | 20 | | +5.3 | % | 7 | | +40.0 | % |
Libtayo® | 27 | | — | | — | | — | | — | | 24 | | — | | 3 | | — | |
Sarclisa® | 5 | | — | | — | | 5 | | — | | — | | — | | — | | — | |
| Total Oncology | 375 | | +23.2 | % | +24.2 | % | 173 | | +19.0 | % | 136 | | +28.3 | % | 66 | | +24.1 | % |
Alprolix® | 226 | | +10.5 | % | +13.0 | % | 161 | | +9.0 | % | — | | — | | 65 | | +14.3 | % |
Eloctate® | 330 | | -7.0 | % | -4.3 | % | 234 | | -16.2 | % | — | | — | | 96 | | +27.4 | % |
Cablivi® | 52 | | +155.0 | % | +160.0 | % | 33 | | +190.9 | % | 19 | | +111.1 | % | — | | — | |
| Total Rare Blood Disorders | 608 | | +5.0 | % | +7.6 | % | 428 | | -2.3 | % | 19 | | +111.1 | % | 161 | | +21.7 | % |
| Specialty Care GBU | 5,402 | | +23.9 | % | +25.2 | % | 3,348 | | +28.3 | % | 1,115 | | +14.9 | % | 939 | | +21.0 | % |
Lantus® | 1,417 | | -6.8 | % | -7.5 | % | 474 | | -18.7 | % | 281 | | -8.2 | % | 662 | | +4.1 | % |
Toujeo® | 496 | | +15.3 | % | +15.1 | % | 143 | | — | | 188 | | +13.2 | % | 165 | | +35.2 | % |
Apidra® | 173 | | +2.9 | % | — | | 15 | | -44.0 | % | 67 | | -1.5 | % | 91 | | +21.3 | % |
Soliqua® / Suliqua® | 75 | | +50.0 | % | +50.0 | % | 47 | | +27.8 | % | 11 | | +50.0 | % | 17 | | +183.3 | % |
| Total Diabetes | 2,476 | | -3.4 | % | -4.2 | % | 766 | | -17.7 | % | 618 | | -0.5 | % | 1,092 | | +7.0 | % |
Plavix® | 509 | | -33.6 | % | -33.6 | % | 5 | | — | | 67 | | -4.3 | % | 437 | | -37.1 | % |
Lovenox® | 630 | | -6.1 | % | -8.7 | % | 15 | | -16.7 | % | 298 | | -22.3 | % | 317 | | +16.4 | % |
Renagel® / Renvela® | 131 | | -10.3 | % | -9.7 | % | 45 | | -25.4 | % | 24 | | -11.1 | % | 62 | | +5.1 | % |
| Aprovel | 306 | | -17.4 | % | -18.2 | % | 12 | | -14.3 | % | 53 | | -1.9 | % | 241 | | -20.3 | % |
Synvisc® / Synvysc one | 96 | | -38.1 | % | -38.1 | % | 63 | | -40.8 | % | 9 | | -35.7 | % | 24 | | -31.6 | % |
Mozobil® | 99 | | +5.4 | % | +6.5 | % | 58 | | +3.7 | % | 26 | | +4.0 | % | 15 | | +14.3 | % |
Thymoglobulin® | 149 | | -14.9 | % | -14.9 | % | 88 | | -9.5 | % | 13 | | -27.8 | % | 48 | | -19.4 | % |
Taxotere® | 78 | | -12.4 | % | -12.4 | % | — | | -100.0 | % | 1 | | -50.0 | % | 77 | | -12.5 | % |
Eloxatin® | 94 | | -11.9 | % | -13.8 | % | 1 | | -125.0 | % | 1 | | — | | 92 | | -16.1 | % |
Praluent® | 146 | | +18.0 | % | +19.7 | % | 68 | | +50.0 | % | 56 | | -11.1 | % | 22 | | +46.7 | % |
Multaq® | 154 | | -6.2 | % | -4.3 | % | 135 | | -2.2 | % | 12 | | -40.0 | % | 7 | | +16.7 | % |
| Generics | 494 | | -1.7 | % | -7.8 | % | 75 | | -7.6 | % | 57 | | -13.6 | % | 362 | | +1.5 | % |
| Other Prescription products | 2,256 | | -5.1 | % | -6.2 | % | 127 | | -13.1 | % | 997 | | -5.0 | % | 1,132 | | -4.1 | % |
| Total Cardiovascular & Established Prescription Products | 5,142 | | -10.3 | % | -11.6 | % | 692 | | -8.8 | % | 1,614 | | -10.0 | % | 2,836 | | -10.9 | % |
| General Medicines GBU | 7,618 | | -8.2 | % | -9.4 | % | 1,458 | | -13.7 | % | 2,232 | | -7.6 | % | 3,928 | | -6.5 | % |
| Total Pharmaceuticals | 13,020 | | +2.7 | % | +2.4 | % | 4,806 | | +11.8 | % | 3,347 | | -1.1 | % | 4,867 | | -2.3 | % |
| Polio / Pertussis / Hib vaccines | 1,059 | | +8.8 | % | +7.2 | % | 183 | | -6.8 | % | 162 | | +3.2 | % | 714 | | +14.9 | % |
| Adult Booster vaccines | 193 | | -18.4 | % | -17.5 | % | 96 | | -24.2 | % | 74 | | -14.0 | % | 23 | | -4.2 | % |
| Meningitis / Pneumonia vaccines | 220 | | -11.7 | % | -11.3 | % | 128 | | -28.0 | % | 1 | | -100.0 | % | 91 | | +29.2 | % |
| Influenza vaccines | 179 | | +59.8 | % | +53.0 | % | 13 | | +200.0 | % | 5 | | +150.0 | % | 161 | | +53.2 | % |
| Travel and Other Endemics vaccines | 154 | | -40.5 | % | -40.1 | % | 43 | | -44.6 | % | 38 | | -44.9 | % | 73 | | -35.1 | % |
| Total Vaccines | 1,836 | | -2.0 | % | -3.1 | % | 491 | | -21.3 | % | 281 | | -11.4 | % | 1,064 | | +13.3 | % |
| Allergy, Cough and Cold | 640 | | +3.7 | % | +3.7 | % | 214 | | +11.8 | % | 177 | | -3.3 | % | 249 | | +2.8 | % |
| Pain | 635 | | +3.3 | % | -0.9 | % | 98 | | +3.2 | % | 271 | | -1.1 | % | 266 | | +7.7 | % |
| Digestive | 426 | | -19.5 | % | -20.8 | % | 38 | | -65.0 | % | 167 | | -4.0 | % | 221 | | -11.9 | % |
| Nutritionals | 308 | | +6.3 | % | +2.7 | % | 23 | | +21.1 | % | 62 | | -7.5 | % | 223 | | +9.3 | % |
| Total Consumer Healthcare | 2,324 | | -1.6 | % | -3.4 | % | 583 | | -5.2 | % | 717 | | -2.8 | % | 1,024 | | +1.2 | % |
| Total Sanofi | 17,180 | | +1.6 | % | +0.9 | % | 5,880 | | +6.2 | % | 4,345 | | -2.1 | % | 6,955 | | +0.4 | % |
(a)With effect from January 1, 2020, the geographical split of net sales is aligned on Sanofi’s new organizational structure: Europe, the United States, and Rest of the World. In addition, Israel and Ukraine are now included in the Europe region. The presentation of 2019 first-half figures has been amended to facilitate year-on-year comparisons.
| | | | | |
2020 Half-Year Financial Report - Sanofi | 49 |
| | |
| C.3.3. PHARMACEUTICALS SEGMENT |
In the first half of 2020, net sales for our Pharmaceuticals segment reached €13,020 million, up 2.4% on a reported basis and 2.7% at constant exchange rates.
The year-on-year rise of €302 million reflects negative exchange rate effects of €39 million, and the following effects at constant exchange rates:
▪positive performances from Dupixent® (+€774 million), the Multiple Sclerosis, Neurology, Other Inflammatory Diseases & Immunology franchise (+€84 million), the Rare Diseases franchise (+€76 million), the Oncology franchise (+€70 million), and the Rare Blood Disorders franchise (+€28 million);
▪negative performances from the Cardiovascular & Established Prescription Products franchise (-€602 million) and the Diabetes franchise (-€89 million).
Comments on the performances of our major Pharmaceuticals segment products are provided below.
DUPIXENT®
Dupixent® (developed in collaboration with Regeneron) generated net sales of €1,634 million in the first half of 2020, up 98.1% on a reported basis and 93.8% at constant exchange rates. In the United States, sales of Dupixent® reached €1,310 million in the first half of 2020, boosted by continuing growth in atopic dermatitis, in which the product is indicated for adults, adolescents and more recently children aged 6 to 11 (approved in May 2020); by a rapid start-up in asthma; and by its launch as a treatment for nasal polyps, an indication approved in June 2019. In Europe, the product’s net sales for the first half of 2020 were €174 million, up 109.6% CER, driven by further growth in atopic dermatitis in key markets and by new launches. In the Rest of the World region, Dupixent® posted net sales of €150 million (+101.4% CER), including €86 million in Japan, where a government-imposed price cut came into force in April 2020. Dupixent® was approved in China in June 2020 for the treatment of moderate-to-severe atopic dermatitis in adults; launch is scheduled for the third quarter. Dupixent® has now been launched in 44 countries as a treatment for atopic dermatitis in adults. Dupixent® has also been launched in 18 countries for adolescents (and in one country for children) in the same indication; in 18 countries for asthma; and in six countries for nasal polyps. Potentially more than 50 additional launches are anticipated in those indications by the end of 2020. We are reiterating our objective of achieving sales of Dupixent® in excess of €10 billion by the time the product reaches maturity.
MULTIPLE SCLEROSIS, NEUROLOGY, OTHER INFLAMMATORY DISEASES AND IMMUNOLOGY
In the first half of 2020, the Multiple Sclerosis, Neurology, Other Inflammatory Diseases and Immunology franchise reported net sales of €1,253 million, up 8.9% on a reported basis and 7.3% CER, with higher sales of Aubagio® more than compensating for a decrease in sales of Lemtrada® in the United States and Europe.
Net sales of Aubagio® amounted to €1,068 million, up 16.5% CER, driven by the United States (+17.2% CER at €775 million) and Europe (+13.7% CER at €231 million). The rise in sales was driven by favorable price effects, increased demand, and a build-up of stocks at patient level.
First-half net sales of Lemtrada® were down 59.0% CER at €68 million, on lower sales in the United States (-57.8% CER at €35 million) and in Europe (-72.3% CER at €18 million), reflecting tougher competition globally and a decline in sales that may have been accelerated in the context of the Covid-19 crisis (product route of administration and mode of action).
First-half net sales of Kevzara® (developed in collaboration with Regeneron) reached €117 million (+40.2% CER), including sales of €64 million in the United States (+31.3% CER) and €37 million in Europe (+105.6% CER). On July 2, 2020, Sanofi and Regeneron announced that the Phase III clinical trial in the United States on the administration of Kevzara® 400 mg to patients infected with Covid-19 requiring mechanical ventilation had not met its primary or secondary endpoints when Kevzara® was added to best supportive care compared to best supportive care alone. Based on the results, the US trial was stopped. A separate Sanofi-led trial outside the US in hospitalized patients with severe and critical Covid-19 using a different dosing regimen is ongoing. The same Independent Data Monitoring Committee (IDMC) is overseeing both the Regeneron-led US trial and the Sanofi-led trial outside the US, and has recommended that the trial outside the US continue. Sanofi and Regeneron expect to report results in the third quarter of 2020.
RARE DISEASES
In the first half of 2020, net sales of the Rare Diseases franchise were €1,532 million, up 4.1% on a reported basis and 5.2% at constant exchange rates. In Europe, net sales for the franchise rose by 2.9% CER to €500 million. In the United States, net sales were up 3.0% CER at €563 million. A strong performance in the Rest of the World region (+10.2% CER at €469 million) reflected increased demand, and a favorable sequence of tender bids.
Net sales from the Gaucher disease franchise (Cerezyme® and Cerdelga®) for the first half of 2020 increased by 8.0% CER to €483 million. Sales of Cerezyme® rose by 5.8% CER to €368 million, helped by a solid performance in the Rest of the World region (+17.0% CER at €153 million) on a favorable sequence of shipments in Brazil. Sales of Cerdelga® were 16.3% higher CER at €115 million, driven by sales in Europe (+28.6% CER at €45 million) as new patients adopted the product.
| | | | | |
| 50 | 2020 Half-Year Financial Report - Sanofi |
Net sales of Myozyme® / Lumizyme® for the treatment of Pompe disease increased by 4.4% CER in the first half of 2020 to €472 million, supported by sales growth in the Rest of the World region (+11.3% CER at €101 million) and the United States (+6.8% CER at €178 million), reflecting the growing number of patients diagnosed with and treated for Pompe disease. Conversely, sales decreased slightly in Europe (-1.0% CER at €193 million).
In the first half of 2020, net sales of the Fabry disease treatment Fabrazyme® were €413 million, up 3.8% CER, propelled by Europe (+10.0% CER at €98 million). In the United States and the Rest of the World region, net sales of Fabrazyme® rose by 1.0% CER (to €206 million) and 3.7% CER (to €109 million), respectively. Sales growth reflected the increasing number of patients diagnosed with and treated for Fabry disease in Europe and the Rest of the World region, the latter region having also benefited from a favorable sequence of orders.
ONCOLOGY
First-half net sales for the Oncology franchise were up 24.2% on a reported basis and by 23.2% at constant exchange rates at €375 million, with all regions delivering double-digit growth.
Jevtana® reported net sales of €271 million in the first half of 2020, up 13.1% CER, reflecting sales growth in all geographies and especially in the United States (+18.8% CER at €123 million) and the Rest of the World region (+14.3% CER at €56 million). In Europe, sales of the product were 5.7% higher CER at €92 million. Sales were boosted by publication of results from the CARD trial evaluating the product in metastatic castration-resistant prostate cancer at the European Society of Medical Oncology and in the New England Journal of Medicine (NEJM) in September 2019.
Libtayo® (developed in collaboration with Regeneron), approved for patients with metastatic or locally advanced cutaneous squamous cell carcinoma who are not candidates for surgery or curative radiotherapy, reported net sales of €27 million outside the United States in the first half of 2020. Libtayo® has been launched in 16 countries outside the US, and is scheduled for launch in up to 8 countries by the end of 2020. In the United States, sales of Libtayo® are consolidated by Regeneron under the terms of the alliance between Sanofi and Regeneron (see Note C.1. “Alliance arrangements with Regeneron Pharmaceuticals, Inc. (Regeneron)” to our consolidated financial statements for the year ended December 31, 2019, at Item 18 of our 2019 Annual Report on Form 20-F).
Sarclisa® (isatuximab-irfc) was approved during the first half of 2020 by the US Food and Drug Administration (FDA), the European Commission and the Japanese health authorities (PDMA) for the treatment of adults with relapsed or refractory multiple myeloma (RRMM). In the United States, where the product launch was hampered by Covid-19 lockdown measures, sales reached €5 million in the first half of 2020.
RARE BLOOD DISORDERS
In the first half of 2020, the Rare Blood Disorders franchise generated net sales of €608 million, up 7.6% on a reported basis and 5.0% at constant exchange rates. Higher sales for the franchise in the Rest of the World region (+21.7% CER at €161 million), with Japan the main contributor, and a good performance from Cablivi® in the United States and Europe, more than offset a decrease in sales of Eloctate® in the United States.
Eloctate®, indicated in the treatment of hemophilia A, generated net sales of €330 million in the first half of 2020, down 7.0% at constant exchange rates. In the United States, sales were €234 million, a decrease of 16.2% CER, reflecting ongoing competitive pressure. In the Rest of the World region, Eloctate® sales rose by 27.4% CER to €96 million, driven by increased sales to Swedish Orphan Biovitrum AB (SOBI). In Japan, the product posted net sales of €45 million in the first half of 2020.
In the first half of 2020, sales of Alprolix®, indicated in the treatment of hemophilia B, amounted to €226 million, up 10.5% CER. Growth was driven by the United States, where sales of the product were up 9.0% CER at €161 million; this reflected transfers of patients using shorter-acting drugs, and also switches to prophylactic treatments. in the Rest of the World region, Alprolix® sales advanced by 14.3% CER to €65 million.
Cablivi®, which treats acquired thrombotic thrombocytopenic purpura (aTTP) in adults, posted net sales of €52 million in the first half of 2020. Of this, €33 million was generated in the United States and €19 million in Europe, where the product is sold in several countries and was granted a temporary authorization for use (ATU) by the French health authorities.
DIABETES
In the first half of 2020, global Diabetes sales were €2,476 million, down 4.2% on a reported basis and 3.4% at constant exchange rates due to lower sales of Lantus® in the United States and Europe; this was partly offset by a good performance for the franchise in the Rest of the World region (+7.0% CER, at €1,092 million). First-half Diabetes net sales in the United States totaled €766 million, down 17.7% CER, reflecting an ongoing decline in average net prices of insulin glargines in the territory. Over the same period, European sales held fairly steady at €618 million (-0.5% CER versus the first half of 2019), with a good performance from Toujeo® cushioning the effect of lower sales of Lantus®.
Net sales of Lantus® in the first half of 2020 were down 6.8% CER at €1,417 million. In the United States, net sales of the product were 18.7% lower CER at €474 million, due largely to a drop in the average net price. In Europe, net sales of Lantus® amounted to €281 million (-8.2% CER), reflecting competition from biosimilars and patients switching to Toujeo®. In the Rest of the World region, first-half net sales of Lantus® were up 4.1% CER at €662 million, helped by a solid performance in China.
| | | | | |
2020 Half-Year Financial Report - Sanofi | 51 |
Toujeo® posted 2020 first-half net sales of €496 million, up 15.3% CER, boosted by strong performances in the Rest of the World region (+35.2% CER at €165 million) and in Europe (+13.2% CER at €188 million). US sales were stable CER at €143 million.
In the first half of 2020, net sales of Apidra® increased by 2.9% CER to €173 million. Lower sales in the United States (-44.0% at €15 million) were more than offset by growth in the Rest of the World region (+21.3% CER at €91 million). In Europe, net sales of the product decreased slightly to €67 million (-1.5% CER).
Net sales of Amaryl® for the first half of 2020 were down 19.3% CER at €137 million due to lower sales in China (-39.4% CER at €42 million), reflecting a second wave of the Volume Based Procurement (VBP) program that includes glimepiride (the international proprietary name for Amaryl®). As previously indicated, Sanofi decided not to submit a tender bid for Amaryl® and expects a significant drop in sales of the product in China during 2020.
In the first half of 2020, net sales of Soliqua® 100/33/Suliqua® (insulin glargine 100 units/ml and lixisenatide 33 mcg/ml injectable) rose by 50.0% CER to €75 million. Sales of the product were higher in all geographies, reaching €47 million in the United States (+27.8% CER). Soliqua® was launched in Japan in June 2020.
CARDIOVASCULAR & ESTABLISHED PRESCRIPTION PRODUCTS
Net sales of the Cardiovascular & Established Prescription Products franchise for the first half of 2020 were €5,142 million, down 11.6% on a reported basis and 10.3% at constant exchange rates. Key factors included a decrease in European sales of Lovenox®, and lower net sales of Aprovel® family products in China due to price adjustments following the nationwide rollout of the Volume Based Procurement (VBP) program in December 2019. In addition, the decrease in the franchise’s net sales in the period was exacerbated by the negative effects of the Covid-19 crisis.
Net sales of Lovenox® amounted to €630 million, a decrease of 6.1% CER, mainly reflecting lower sales in Europe (-22.3% CER at €298 million) due to competition from biosimilars in a number of European countries and the negative effects of Covid-19 on non-urgent surgery. The effect was partly offset by sales growth in the Rest of the World region (+16.4% CER at €317 million).
In the first half of 2020, net sales of Plavix® were €509 million, down 33.6% CER, mainly due to lower sales in China (-55.6% CER at €205 million) following price adjustments related to the VBP program (see above). Net sales of Plavix® in Japan were down 16.4% CER at €58 million, due to price cuts implemented in October 2019.
Net sales of Aprovel®/Avapro® for the first half of 2020 were €306 million, down 17.4% CER, primarily as a result of lower sales in China (-37.5% CER at €109 million) due to net price adjustments related to the VBP program (see above).
As previously announced, Sanofi expects net sales of Plavix® and Aprovel® family products in China to decrease by approximately 50% in 2020 due to the rollout of the VBP program. Sales of these products in China increased nearly 70% by volume in the first half, in line with our full-year forecasts.
Net sales of Multaq® totaled €154 million in the first half of 2020, down 6.2% CER. Most of the product’s sales are generated in the United States (€135 million, down 2.2% CER), and in Europe (€12 million, down 40.0% CER).
In the first half of 2020, net sales of Praluent® reached €146 million, up 18.0% CER, driven by the United States (+50.0% CER at €68 million) and the Rest of the World region (+46.7% CER at €22 million), with the product being launched in China in April 2020. In Europe, sales of Praluent® were down 11.1% CER at €56 million, with sales in Germany suspended in August 2019 following a ruling by the Düsseldorf Regional Court in the ongoing patent litigation with Amgen.
On April 6, 2020, Sanofi announced that it had finalized the planned restructuring related to Praluent® with Regeneron. Effective April 1, 2020, Sanofi has sole responsibility for Praluent® outside the United States, while Regeneron has sole responsibility for Praluent® in the United States. The restructuring simplifies the antibody collaboration between the companies, increases efficiency, and streamlines operations for Praluent®. As a result of the restructuring, Sanofi ceased to include US sales of Praluent® in its consolidated net sales with effect from April 1, 2020.
Net sales of Renvela®/Renagel® (sevelamer) in the first half of 2020 were €131 million, down 10.3% CER, due to competition from generics in the United States (-25.4% CER at €45 million), and despite growth in China (+40.9% CER, at €30 million).
In the first half of 2020, net sales of Generics amounted to €494 million, a decrease of 1.7 % CER. Sales growth in the Rest of the World region (+1.5% CER at €362 million) did not fully offset lower sales in Europe (-13.6% CER at €57 million) and the United States (-7.6% CER at €75 million).
| | |
| C.3.4. VACCINES SEGMENT/GBU |
In the first half of 2020, the Vaccines segment posted net sales of €1,836 million, down 3.1% on a reported basis and 2.0% CER. A strong performance from Polio/Pertussis/Hib vaccines in the Rest of the World region (+14.9% CER at €714 million) and from influenza vaccines across all geographies (+59.8% CER at €179 million) only partly offset the impact of the Covid-19 pandemic on sales for the Travel Vaccines franchise (-40.5% CER at €154 million), the Adult Booster vaccines franchise (-18.4% CER at €193 million, and Menactra® (-11.7% CER at €220 million).
Net sales of Polio/Pertussis/Hib (PPH) vaccines in the first half of 2020 reached €1,059 million, up 8.8% CER, mainly on stronger sales in the Rest of the World region (+14.9% CER at €714 million), especially in China (+44.9% CER at €239 million) with a rise in sales of Pentaxim®. Those effects more than offset a decrease in US sales of PPH vaccines (-6.8% CER at €183 million), linked to the negative impact of Covid-19 on vaccinations in the United States. In Europe, sales of PPH vaccines were up 3.2% CER at €162 million.
| | | | | |
| 52 | 2020 Half-Year Financial Report - Sanofi |
Sales of Menactra® in the first half of 2020 were down 11.7% CER at €220 million. Increased sales in the Rest of the World region (+29.2% CER at €91 million), due largely to a successful tender in Brazil, partly offset a decrease in sales of Menactra® in the United States (-28.0% CER at €128 million) linked to the negative effect of Covid-19 on vaccinations.
Net sales of Adult Booster vaccines for the period were down 18.4% CER at €193 million, on lower sales in the United States (-24.2% CER at €96 million) and Europe (-14.0% CER at €74 million), mainly reflecting the negative effect of Covid-19.
Sales of Influenza vaccines were sharply higher in the first half (+59.8% CER at €179 million) due to a late influenza season in the northern hemisphere and to increased shipments in the southern hemisphere due to a positive effect related to Covid-19.
First-half net sales of Travel and Other Endemics vaccines were €154 million, down 40.5% CER, reflecting travel restrictions associated with the Covid-19 pandemic.
| | |
| C.3.5. CONSUMER HEALTHCARE SEGMENT/GBU |
Net sales from the Consumer Healthcare (CHC) segment for the first half of 2020 were down 3.4% on a reported basis and 1.6% at constant exchange rates, at €2,324 million. This reflects the negative effects of the Zantac® recall, the divestment of non-strategic brands, and product suspensions due to tighter regulatory requirements (especially in Europe). CHC sales for the first half of 2020 rose in the Allergy Cough & Cold (+3.7% CER at €640 million), Pain (+3.3% CER at €635 million) and Nutritionals (+6.3% CER at €308 million) categories, but sales for the Digestive category decreased by 19.5% CER to €426 million. Excluding Zantac®, CHC net sales increased by 2.0% CER in the first half of 2020.
In September 2019, the US Food and Drug Administration (FDA) and the Canadian health authorities announced publicly that ranitidine-based medicines, including Zantac®, might contain low levels of N-nitrosodimethylamine (NDMA), and that manufacturers had been asked to conduct tests. Inconsistencies in the results of preliminary tests on the active ingredient used in the products we sell in the United States and Canada led Sanofi to voluntarily recall Zantac® in October 2019. On April 1, 2020, the FDA ordered the immediate withdrawal from the US market of all ranitidine-based medicines.
In Europe, CHC net sales decreased by 2.8% CER in the first half of 2020 to €717 million, due largely to the divestment of non-strategic brands and tougher regulatory requirements for some products.
In the United States, CHC net sales for the first half were 5.2% lower CER at €583 million, reflecting the impact of the recall of Zantac® (-€68 million). Sales increased in the Allergy, Cough & Cold (+11.8% CER at €214 million), Nutritionals (+21.1% CER at €23 million) and Pain (+3.2% CER at €98 million) categories. Sales of Gold Bond® increased by 4.1% CER to €104 million, boosted by a strong rise in demand.
In the Rest of the World region, first-half CHC net sales were up 1.2% CER at €1,024 million, driven by growth in the Pain (+7.7% CER at €266 million), Nutritionals (+9.3% CER at €223 million) and Allergy, Cough & Cold (+2.8% CER at €249 million) categories. That growth was partly offset by lower sales in the Digestive category (-11.9% CER at €221 million), due largely to the impact of the Zantac® recall in Canada and reduced sales of Essentiale® in Russia and Enterogermina® in Latin America.
| | |
| C.3.6. NET SALES BY GEOGRAPHICAL REGION |
| | | | | | | | | | | | | | | | | |
| (€ million) | June 30, 2020 (6 months) | June 30, 2019 (6 months) | (a) | Change on
a reported
basis | Change at
constant
exchange rates |
| United States | 5,880 | | 5,401 | | | +8.9 | % | +6.2 | % |
Europe (b) | 4,345 | | 4,451 | | | -2.4 | % | -2.1 | % |
| Rest of the World | 6,955 | | 7,167 | | | -3.0 | % | +0.4 | % |
| of which China | 1,307 | | 1,507 | | | -13.3 | % | -12.4 | % |
| of which Japan | 926 | | 997 | | | -7.1 | % | -10.8 | % |
| of which Brazil | 460 | | 503 | | | -8.5 | % | +10.5 | % |
| of which Russia | 364 | | 339 | | | +7.4 | % | +11.2 | % |
| Total net sales | 17,180 | | 17,019 | | | +0.9 | % | +1.6 | % |
(a)With effect from January 1, 2020, the geographical split of net sales is aligned on Sanofi’s new organizational structure: Europe, the United States, and Rest of the World. The presentation of 2019 first-half figures has been amended to facilitate year-on-year comparisons.
(b)Israel and Ukraine are now included in the Europe region.
In the first half of 2020, net sales in the United States reached €5,880 million, up 8.9% on a reported basis and 6.2% at constant exchange rates. This reflects a solid performances by Dupixent® (+91.0% CER at €1,310 million) and Aubagio® (+17.2% CER at €775 million), influenced by favorable inventory build-ups linked partly to Covid-19. Those effects more than offset lower sales of Lantus® (-18.7% CER at €474 million) and Zantac® (-€68 million), and more generally a decrease in Vaccine segment sales (-21.3% CER at €491 million) related to the negative effect of Covid-19 on vaccinations.
In Europe, net sales were 2.4% lower on a reported basis and 2.1% lower at constant exchange rates in the first half of 2020, at €4,345 million. This decrease mainly reflected erosion in sales of Lovenox®, Lemtrada® and Lantus®; of Travel Vaccines, due to the Covid-19 pandemic; and of Consumer Healthcare products. Those effects were partly offset by the performances of Dupixent®, Aubagio®, Libtayo® and Toujeo®.
| | | | | |
2020 Half-Year Financial Report - Sanofi | 53 |
In the Rest of the World region, first-half net sales were down 3.0% on a reported basis, but rose slightly at constant exchange rates (+0.4%) to €6,955 million. Good sales performances from Dupixent® and the Speciality Care GBU in general and from the Diabetes franchise were offset by lower sales of Plavix® and Aprovel®, of Travel Vaccines (due to Covid-19), and to the Digestive category of CHC products. In China, net sales decreased by 12.4% CER to €1,307 million, impacted by a reduction in net sales of Plavix® and the Aprovel® family due to the VBP program, despite significant growth in sales volumes for both products. Chinese sales of non-VBP products rose by 20.7% in the first half. In Japan, net sales decreased by 10.8% CER in the first half to €926 million on lower sales for the Cardiovascular & Established Prescription Products franchise and for Vaccines, and despite a solid performance from Dupixent®. In Brazil, net sales were 8.5% lower on a reported basis but increased by 10.5% at constant exchange rates in the first half of 2020 to €460 million, driven by Rare Diseases and Vaccines.
.
| | |
| C.4. OTHER INCOME STATEMENT ITEMS |
|
| C.4.1. OTHER REVENUES |
Other revenues decreased by 14.8% to €574 million in the first half of 2020 (versus €674 million in the first half of 2019). This mainly reflects a lower level of VaxServe sales of non-Sanofi products (€471 million, versus €543 million for the first half of 2019, within the Vaccines segment). This line item also includes revenues arising from the distribution of Eloctate® and Alprolix® (mainly in Europe) under Sanofi’s agreements with Swedish Orphan Biovitrum AB (SOBI).
Gross profit for the first half of 2020 was €12,211 million, versus €12,308 million for the first half of 2019, a decrease of 0.8 %. Gross margin was also lower, at 71.1% for the first half of 2020 compared with 72.3% for the first half of 2019.
In the Pharmaceuticals segment, gross margin for the first half of 2020 was 1.1 percentage points lower at 74.2%. Positive effects from good performances in the Specialty Care GBU and from industrial productivity gains only partially offset the negative impacts of adjustments to the net prices of Plavix® and Aprovel® family products in China and of price trends for Diabetes products in the United States.
In the Vaccines segment, gross margin for the first half of 2020 was down 1.2 percentage points at 61.3%, largely due to an unfavorable product mix effect.
In the Consumer Healthcare segment, gross margin for the first half of 2020 was 0.4 of a percentage point lower at 68.2%, due in particular to a reduction in US sales following the recall of Zantac®.
| | |
| C.4.3. RESEARCH AND DEVELOPMENT EXPENSES |
Research and development expenses (R&D expenses) in the first half of 2020 totaled €2,692 million (versus €2,972 million in the first half of 2019). That represents 15.7% of net sales, compared with 17.5% in the first half of 2019. Overall, R&D expenses decreased by 9.4%, mainly due to reduced R&D spend in diabetes.
| | |
| C.4.4. SELLING AND GENERAL EXPENSES |
Selling and general expenses were €4,607 million in the first half of 2020 (26.8% of net sales), versus €4,835 million in the first half of 2019 (28.4% of net sales). The year-on-year reduction of 4.7% reflects global cost containment measures, amplified by the effects of Covid-19.
| | |
| C.4.5. OTHER OPERATING INCOME AND EXPENSES |
In the first half of 2020, Other operating income amounted to €281 million (versus €273 million in the first half of 2019), and Other operating expenses to €693 million (versus €466 million in the first half of 2019).
Overall, other operating income and expenses represented a net expense of €412 million in the first half of 2020, compared with a net expense of €193 million in the first half of 2019.
| | | | | | | | | | | |
| (€ million) | June 30, 2020 | June 30, 2019 | Change |
| Other operating income | 281 | | 273 | | +8 | |
| Other operating expenses | (693) | | (466) | | -227 | |
| Other operating income/(expenses), net | (412) | | (193) | | -219 | |
The overall negative change of €219 million reflects (i) an increase in the net expense relating to our pharmaceutical partners (€433 million in the first half of 2020, versus €223 million in the first half of 2019), and above all an increase in the share of profits/ losses generated by the alliance with Regeneron under our collaboration agreement (see Note C.1. to our consolidated financial statements for the year ended December 31, 2019), due mainly to increased sales of Dupixent®.
| | | | | |
| 54 | 2020 Half-Year Financial Report - Sanofi |
The table below sets forth the contribution from the Regeneron alliance to this line item:
| | | | | | | | | | | |
| (€ million) | June 30, 2020 (6 months) | June 30, 2019 (6 months) | December 31, 2019 (12 months) |
| Share of (profits)/losses of the Antibody Alliance | (341) | | (16) | | (253) | |
| Additional share of profit paid by Regeneron related to development costs | 35 | | — | | 21 | |
| Regeneron commercial operating expenses reimbursement | (176) | | (218) | | (449) | |
| Total: Antibody Alliance | (482) | | (234) | | (681) | |
| Immuno-Oncology Alliance | 44 | | 30 | | 62 | |
Other (mainly Zaltrap®) | (8) | | (7) | | (14) | |
| Other operating income/(expenses), net, related to Regeneron Alliance | (446) | | (211) | | (633) | |
This line item also includes gains on divestments of assets and operations, relating mainly to mature products (€147 million in the first half of 2020, versus €71 million in the first half of 2019).
It does not include the €157 million gain arising from the remeasurement at market value effective May 29, 2020 of the 400,000 Regeneron shares retained by Sanofi to support its ongoing collaboration with Regeneron. That amount is included within the “Other operating income and expenses” line in the segment results of the Pharmaceuticals segment (see Note B.20.1 to our condensed half-year consolidated financial statements).
| | |
| C.4.6. AMORTIZATION OF INTANGIBLE ASSETS |
Amortization charged against intangible assets in the first half of 2020 was €883 million, versus €1,116 million in the comparable period of 2019. This €233 million decrease was mainly due to a reduction in amortization expense generated by intangible assets recognized in connection with (i) the acquisition of Bioverativ (€170 million, versus €272 million in the first half of 2019), reflecting impairment losses taken against Eloctate® franchise assets in the first half of 2019, and (ii) the acquisitions of Aventis (€68 million, versus €107 million in the first half of 2019) and Genzyme (€295 million, versus €368 million in the first half of 2019) as certain products reached the end of their life cycle.
| | |
| C.4.7. IMPAIRMENT OF INTANGIBLE ASSETS |
In the first half of 2020, this line item showed a net impairment loss of €323 million (versus €1,840 million in the first half of 2019), most of which related to in-house and partnered development projects in Speciality Care and to the discontinuation of a number of R&D programs and collaboration agreements in Diabetes, in line with the strategic roadmap announced in December 2019.
In the first half of 2019, the net impairment loss mainly comprised an amount of €1,609 million taken against Eloctate® franchise assets. It also included inter alia an additional impairment loss of €33 million taken against rights relating to Lemtrada®, and net write-downs of €192 million relating to in-house or partnered development projects.
| | |
| C.4.8. FAIR VALUE REMEASUREMENT OF CONTINGENT CONSIDERATION |
Fair value remeasurements of contingent consideration assets and liabilities relating to business combinations (recognized in accordance with the revised IFRS 3) represented a net gain of €54 million in the first half of 2020 versus a net gain of €190 million in the first half of 2019.
This mainly comprises remeasurements of contingent consideration (i) payable to Bayer as a result of an acquisition made by Genzyme prior to the latter’s acquisition by Sanofi (loss of €11 million in the first half of 2020, versus a gain of €140 million in the first half of 2019); and (ii) arising from the dissolution of the Sanofi Pasteur MSD joint venture (net loss of €6 million, versus a net gain of €98 million a year earlier). See Note B.11. to our condensed half-year consolidated financial statements. The above movements were more than offset by the impact of a €71 million change in the contingent consideration arising from Sanofi’s March 2018 acquisition of Bioverativ.
| | |
| C.4.9. RESTRUCTURING COSTS AND SIMILAR ITEMS |
Restructuring costs and similar items amounted to a charge of €758 million in the first half of 2020, compared with a charge of €747 million in the first half of 2019. They include employee-related expenses of €642 million in respect of separation costs further to the announcement of plans to adapt Sanofi’s organization (primarily in Europe) in line with the new “Play to Win” strategy announced in December 2019.
In the first half of 2019, restructuring costs comprised employee-related expenses arising from headcount adjustment plans in Europe and the United States.
| | |
| C.4.10. OTHER GAINS AND LOSSES, AND LITIGATION |
Other gains and losses, and litigation for the first half of 2020 represent a net gain of €136 million, mainly comprising a gain on the sale of operations related to the Seprafilm product to Baxter for proceeds of €313 million. This compares with a net gain of €317 million in the first half of 2019, mainly relating to litigation.
| | | | | |
2020 Half-Year Financial Report - Sanofi | 55 |
Operating income amounted to €10,108 million in the first half of 2020, versus €1,112 million in the first half of 2019. This increase was mainly due to the recognition of the €7,382 million gain on the divestment of Sanofi’s equity investment in Regeneron following the transaction of May 29, 2020. Operating income also increased year-on-year due to a reduction in impairment losses taken against intangible assets in the period compared with the first half of 2019, when impairment losses reached €1,840 million due mainly to write-downs of Eloctate® franchise assets.
| | |
| C.4.12. FINANCIAL INCOME AND EXPENSES |
Net financial expenses were €167 million for the first half of 2020, €17 million higher than the 2019 first-half figure of €150 million.
Our cost of net debt (see the definition in Section C.7., “Consolidated balance sheet” below) increased to €100 million in the first half of 2020, versus €89 million in the comparable period of 2019.
Other movements in net financial expenses included:
•the fair value remeasurement of certain financial assets (expense of €18 million in the first half of 2020, versus a gain of €13 million in the first half of 2019); and
•a decrease in the net interest cost of pension plans, mainly in France and Germany (€32 million, versus €45 million in the first half of 2019).
| | |
| C.4.13. INCOME BEFORE TAX AND INVESTMENTS ACCOUNTED FOR USING THE EQUITY METHOD |
Income before tax and investments accounted for using the equity method for the first half of 2020 was €9,941 million, versus €962 million for the first half of 2019.
| | |
| C.4.14. INCOME TAX EXPENSE |
Income tax expense represented €994 million in the first half of 2020, versus €13 million in the first half of 2019, giving an effective tax rate (based on consolidated net income) of 10.0%, compared with 1.3% in the first half of 2019. The increase in income tax expense was mainly due to the tax effects of the transaction involving Regeneron shares (€512 million in the first half of 2020); the amortization and impairment of intangible assets (€302 million in the first half of 2020, versus €711 million in the first half of 2019); and restructuring costs (€232 million in the first half of 2020, versus €197 million in the first half of 2019) as well as the positive tax effects relating to the contingencies arising from business divestitures.
The effective tax rate on our “Business net income”3 is a non-GAAP financial measure. It is calculated on the basis of business operating income, minus net financial expenses and before (i) the share of profit/loss from investments accounted for using the equity method and (ii) net income attributable to non-controlling interests. We believe the presentation of this measure, used by our management, is also useful for investors as it provides a means to analyze the effective tax cost of our current business activities. It should not be seen as a substitute for the effective tax rate based on consolidated net income.
When calculated on business net income, our effective tax rate was 22.0% in the first half of 2020, compared with 22.0% in the first half of 2019 and 22.0% for 2019 as a whole.
| | |
| C.4.15. SHARE OF PROFIT/(LOSS) FROM INVESTMENTS ACCOUNTED FOR USING THE EQUITY METHOD |
Share of profit/(loss) from investments accounted for using the equity method contributed net income of €354 million in the first half of 2020, versus net income of €116 million in the comparable period of 2019. In the first half of 2020 this line item mainly comprises our share of the profits of Regeneron (€343 million, versus €106 million in the first half of 2019); the year-on-year rise mainly reflects an increase in the company profits of Regeneron as adjusted to reflect Sanofi accounting policies.
Net income amounted to €9,301 million in the first half of 2020, versus €1,065 million in the first half of 2019.
| | |
| C.4.17. NET INCOME ATTRIBUTABLE TO NON-CONTROLLING INTERESTS |
Net income attributable to non-controlling interests for the first half of 2020 was €20 million, against €15 million for the first half of 2019.
3 See definition in section C.2., “Business net income”.
| | | | | |
| 56 | 2020 Half-Year Financial Report - Sanofi |
| | |
| C.4.18. NET INCOME ATTRIBUTABLE TO EQUITY HOLDERS OF SANOFI |
Net income attributable to equity holders of Sanofi amounted to €9,281 million in the first half of 2020, compared with €1,050 million in the first half of 2019.
Basic earnings per share (EPS) was €7.41, compared with €0.84 for the first half of 2019, based on an average number of shares outstanding of 1,251.7 million for the first half of 2020 and 1,247.2 million for the first half of 2019. Diluted earnings per share was also €7.38, compared with €0.84 for the first half of 2019, based on an average number of shares after dilution of 1,258.2 million for the first half of 2020 and 1,254.7 million for the first half of 2019.
In the first half of 2020, “Business operating income” (see Note B.20.1 to our condensed half-year consolidated financial statements for a definition and further details) was €4,683 million (versus €4,306 million for the first half of 2019) up 8.8%, while “Business operating income margin” was 27.3% (versus 25.3% for the first half of 2019).
Following the transaction of May 29, 2020, Regeneron is no longer an associate of Sanofi (see Note B.1. to our condensed half-year consolidated financial statements). Consequently, business operating income has been adjusted, and no longer includes Sanofi’s share of the net income of Regeneron. This means that the Share of profit/(loss) from investments accounted for using the equity method line in the table reconciling Operating income (as shown in the income statement) to total “Business operating income” no longer includes the equity-accounted share of profits from Regeneron. The comparatives presented for 2019 have been restated to reflect that adjustment. In addition, the gain arising on the divestment of the equity investment in Regeneron is not included in “Business operating income”, with the exception of the gain on the remeasurement of the 400,000 retained shares at market value at the transaction date.
In addition, with effect from January 1, 2020 “Business operating income” includes depreciation charged against right-of-use assets recognized under IFRS 16 (Leases), applicable since January 1, 2019, and excludes rental expenses previously recognized under IAS 17. In the interests of consistency, “Business operating income” and “Business operating margin” for the comparative periods of 2019 presented have been restated to include the effects of IFRS 16, and of certain expenses and income presented differently for segment reporting purposes to align on Sanofi’s new 2020 management reporting structure (see Note C.1.1, “Operating Segments”, above).
The table below shows “Business operating income” for the six-month periods ended June 30, 2020 and 2019:
| | | | | | | | | | | | | | |
| (€ million) | June 30, 2020 (6 months) | June 30, 2019 (6 months) | (a) | Change |
| Pharmaceuticals segment | 4,885 | | 4,244 | | | +15.1 | % |
| Consumer Healthcare segment | 787 | | 928 | | | -15.2 | % |
| Vaccines segment | 420 | | 508 | | | -17.3 | % |
| Other | (1,409) | | (1,374) | | | +2.5 | % |
| Business operating income | 4,683 | | 4,306 | | | +8.8 | % |
(a)2019 figures have been restated (i) to exclude Sanofi’s share of net profits from the investment in Regeneron, amounting to €159 million in the six months ended June 30, 2019 (see above); and to include (ii) the effects of IFRS 16; and (iii) the effect of certain expenses and income being presented differently for segment reporting purposes to align on Sanofi’s new 2020 management reporting structure.
| | | | | |
2020 Half-Year Financial Report - Sanofi | 57 |
| | |
| C.6. CONSOLIDATED STATEMENTS OF CASH FLOWS |
Summarized consolidated statements of cash flows
| | | | | | | | | | | |
| (€ million) | June 30, 2020 (6 months) | June 30, 2019 (6 months) | December 31,
2019
(12 months) |
| Net cash provided by/(used in) operating activities | 3,926 | | 3,179 | | 7,744 | |
| Net cash provided by/(used in) investing activities | 8,075 | | (165) | | (1,212) | |
| Net cash inflow/(outflow) from the exchange of the Animal Health business for BI’s Consumer Healthcare business | — | | — | | 154 | |
| Net cash provided by/(used in) financing activities | (5,402) | | (3,209) | | (4,193) | |
| Impact of exchange rates on cash and cash equivalents | (57) | | 12 | | 9 | |
| Net change in cash and cash equivalents | 6,542 | | (183) | | 2,502 | |
Net cash provided by/(used in) operating activities represented a net cash inflow of €3,926 million in the first half of 2020, against €3,179 million in the first half of 2019.
Operating cash flow before changes in working capital for the first half of 2020 was €4,320 million, versus €3,976 million in the first half of 2019.
Working capital requirements rose by €394 million in the first half of 2020, due largely to an increase in inventories (mainly Vaccines and Dupixent®); this compares with a rise of €797 million in the first half of 2019.
Net cash provided by/(used in) investing activities represented a net cash inflow of €8,075 million in the first half of 2020, due mainly to the after-tax proceeds of €10,512 million from the divestment of Regeneron shares on May 29, 2020 and the purchase price of €2,246 million paid for Synthorx; this compares with a net cash outflow of €165 million in the first half of 2019.
Acquisitions of property, plant and equipment and intangible assets totaled €682 million, versus €841 million in the first half of 2019. There were €502 million of acquisitions of property, plant and equipment (versus €654 million in the first half of 2019), most of which (€294 million) were in the Pharmaceuticals segment, primarily in industrial facilities. The Vaccines segment accounted for €181 million of acquisitions of property, plant and equipment during the period. Acquisitions of intangible assets (€180 million, versus €187 million in the first half of 2019) mainly comprised contractual payments for intangible rights under license and collaboration agreements.
After-tax proceeds from disposals amounted to €709 million in the first half of 2020, and relate mainly to (i) the sale of operations relating to the Seprafilm product to Baxter for €313 million; (ii) the divestment of some established prescription products for €105 million; and (iii) contingent consideration of €167 million relating to a past divestment. In the first half of 2019, after-tax proceeds from disposals amounted to €867 million, mainly from the sale of Sanofi’s equity interests in Alnylam (€706 million) and MyoKardia (€118 million).
Net cash provided by/(used in) financing activities represented a net cash outflow of €5,402 million in the first half of 2020, compared with a net outflow of €3,209 million in the first half of 2019. The 2020 first-half figure includes the dividend payout to our shareholders of €3,937 million (versus €3,834 million in the first half of 2019); and net external debt repayments of €1,138 million (versus net external debt financing raised of €585 million in the first half of 2019); and movements in Sanofi’s share capital (purchases and disposals of treasury shares, net of capital increases) that represented a net outflow of €323 million (versus a net inflow of €49 million in the first half of 2019).
The net change in cash and cash equivalents in the first half of 2020 was an increase of €6,542 million, compared with a decrease of €183 million in the first half of 2019.
“Free cash flow” is a non-GAAP financial measure which is reviewed by our management, and which we believe provides useful information to measure the net cash generated from the Company’s operations that is available for strategic investments4 (net of divestments5), for debt repayment, and for payments to shareholders. Free cash flow is determined from business net income5 adjusted for depreciation, amortization and impairment, share of undistributed earnings from investments accounted for using the equity method, gains & losses on disposals of non-current assets, net change in provisions including pensions and other post-employment benefits, deferred taxes, share-based payment expense and other non-cash items. It also includes net changes in working capital, capital expenditures and other asset acquisitions6 net of disposal proceeds7, and payments related to restructuring and similar items. Free Cash Flow is not defined by IFRS, and is not a substitute for Net cash provided by/(used in) operating activities as reported under IFRS. Management recognizes that the term “Free Cash Flow” may be interpreted differently by other companies and under different circumstances.
4 Amount of the transaction above a cap of €500 million per transaction.
5 Non-GAAP financial measure, as defined in “Business net income” above.
6 Not exceeding a cap of €500 million per transaction.
| | | | | |
| 58 | 2020 Half-Year Financial Report - Sanofi |
The table below sets forth a reconciliation between Net cash provided by/(used in) operating activities and Free Cash Flow:
| | | | | | | | | | | |
| (€ million) | June 30, 2020 (6 months) | June 30, 2019 (6 months) | December 31, 2019 (12 months) |
| Net cash provided by/(used in) operating activities | 3,926 | | 3,179 | | 7,744 | |
| Acquisitions of property, plant and equipment and software | (534) | | (684) | | (1,405) | |
Acquisitions of intangible assets, equity interests and other non-current financial assets (a) | (334) | | (204) | | (576) | |
Proceeds from disposals of property, plant and equipment, intangible assets and other non-current assets, net of tax (a) | 682 | | 199 | | 490 | |
| Repayment of lease liabilities | (121) | | (135) | | (267) | |
| Other items | (51) | | (218) | | 40 | |
| Free cash flow | 3,568 | | 2,137 | | 6,026 | |
(a) Free cash flow includes investments and divestments not exceeding a cap of €500 million per transaction.
| | |
| C.7. CONSOLIDATED BALANCE SHEET |
Total assets were €115,819 million as of June 30, 2020, compared with €112,736 million as of December 31, 2019, an increase of €3,083 million.
Net debt was €7,680 million as of June 30, 2020, versus €15,107 million as of December 31, 2019; this reduction was mainly due to cash flows generated by investing activities during the period, and in particular the net cash proceeds from the sale of Regeneron shares on May 29, 2020. We believe the presentation of this non-GAAP financial measure, which is reviewed by our management, provides useful information to measure our overall liquidity and capital resources. We define “net debt” as (i) the sum total of short-term debt, long-term debt, and interest rate derivatives and currency derivatives used to manage debt, minus (ii) the sum total of cash and cash equivalents and interest rate derivatives and currency derivatives used to manage cash and cash equivalents. Following the first-time application of IFRS 16 with effect from January 1, 2019, net debt no longer includes lease liabilities.
| | | | | | | | |
| (€ million) | June 30, 2020 | June 30, 2019 |
| Long-term debt | 20,404 | | 20,131 | |
| Short-term debt and current portion of long-term debt | 3,329 | | 4,554 | |
| Interest rate and currency derivatives used to manage debt | (173) | | (117) | |
| Total debt | 23,560 | | 24,568 | |
| Cash and cash equivalents | (15,969) | | (9,427) | |
| Interest rate and currency derivatives used to manage cash and cash equivalents | 89 | | (34) | |
Net debt (a) | 7,680 | | 15,107 | |
| Total equity | 63,486 | | 59,108 | |
| Gearing ratio | 12.1 | % | 25.6 | % |
(a)Net debt does not include lease liabilities, which amounted to €1,195 million as of June 30, 2020, compared with €1,248 million as of December 31, 2019.
To assess our financing risk, we use the “gearing ratio”, another non-GAAP financial measure. This ratio (which we define as the ratio of net debt to total equity) decreased from 25.6% as of December 31, 2019 to 12.1% as of June 30, 2020. Analyses of our debt as of June 30, 2020 and December 31, 2019 are provided in Note B.9. to the condensed half-year consolidated financial statements.
Because our net debt and gearing ratio are not standardized measures, they may not be directly comparable with the non-GAAP financial measures of other companies using the same or similar non-GAAP financial measures. Despite the use of non-GAAP measures by management in setting goals and measuring performance, these measures have no standardized meaning prescribed by IFRS.
We expect that the future cash flows generated by our operating activities will be sufficient to repay our debt. The financing arrangements in place as of June 30, 2020 at the Sanofi parent company level are not subject to covenants regarding financial ratios and do not contain any clauses linking credit spreads or fees to Sanofi’s credit rating.
Other key movements in the balance sheet are described below.
Total equity was €63,486 million as of June 30, 2020, versus €59,108 million as of December 31, 2019. The net change reflects the following principal factors:
•increases: our net income for the first half of 2020 (€9,301 million); and
| | | | | |
2020 Half-Year Financial Report - Sanofi | 59 |
•decreases: the dividend payout to our shareholders (€3,937 million), changes in currency translation differences (€944 million, mainly on the US dollar), share repurchases (€361 million) and the impact of actuarial losses recognized during the period (€146 million).
As of June 30, 2020 we held 2.59 million of our own shares, recorded as a deduction from equity and representing 0.207% of our share capital.
Goodwill and other intangible assets (€62,275 million in total) increased by €1,184 million, the main factors being:
•increases: movements related to our acquisition of Synthorx (€901 million of goodwill and €1,549 million of other intangible assets ); and
•decreases: amortization and impairment charged in the period (€1,280 million).
Investments accounted for using the equity method (€196 million) decreased by €3,395 million due to the divestment of our equity investment in Regeneron on May 29, 2020 (see Note B.1. to our condensed half-year consolidated financial statements).
Other non-current assets (€3,031 million) increased by €364 million, due mainly to the classification of the 400,000 Regeneron shares retained by Sanofi after the transaction of May 29, 2020 in “Equity instruments at fair value through other comprehensive income” (see Notes B.1.and B.6. to our condensed half-year consolidated financial statements).
Net deferred tax assets were €2,854 million as of June 30, 2020, compared with €3,140 million as of December 31, 2019. The decrease of €286 million mainly reflects deferred tax arising on the remeasurement of the acquired intangible assets of Synthorx.
Non-current provisions and other non-current liabilities (€9,785 million) rose by €464 million relative to December 31, 2019, due largely to an increase in restructuring provisions to cover headcount adjustment plans in Europe and an increase in provisions for pensions and other post-employment benefits.
Liabilities related to business combinations and to non-controlling interests (€656 million) decreased by €144 million. The main reasons for the change are fair value remeasurements of contingent consideration payable (i) to Bioverativ as a result of a transaction carried out by True North Therapeutics prior to Bioverativ’s acquisition by Sanofi, and (ii) to MSD further to the acquisition of Sanofi Pasteur operations carried on within the former Sanofi Pasteur MSD joint venture.
| | | | | |
| 60 | 2020 Half-Year Financial Report - Sanofi |
| | |
| D/ RISK FACTORS AND RELATED PARTY TRANSACTIONS |
|
| D.1. RISK FACTORS |
The main risk factors to which Sanofi is exposed are described in our Annual Report on Form 20-F for the year ended December 31, 2019, filed with the US Securities and Exchange Commission on March 5, 2020.
With respect to the COVID-19 pandemic, we are unable to predict the extent to which the pandemic and related developments will continue to adversely impact our business, operations and financial performance. The degree to which COVID-19 impacts our results will depend on future developments, including, but not limited to, the duration and spread of the outbreak, its severity, the actions taken to contain the virus or treat its impact, and how quickly and to what extent normal economic and operating conditions can resume.
The pandemic may reduce our sales in targeted markets due to lower healthcare spending on other diseases and fewer promotional activities, and could therefore significantly impact our business operations.
If the pandemic is prolonged, we may face delays in our clinical trials due to restrictions imposed on clinical trials sites and/or delays or disruptions related to regulatory approvals and/or delays in label expansions for existing products, any of which may have a negative impact on our product development and launches and hence, on future product sales, business and results of operations.
The global COVID-19 pandemic also exposes us to a slowdown or temporary suspension in production of our active pharmaceutical ingredients (API), raw materials and some of our other products. Any prolonged restrictive measures put in place in to control the pandemic may lead to manufacturing delay or disruption and supply chains interruptions (including as it may apply to our third-party suppliers) and may have an adverse effect on our business.
In addition, it is not certain that we will successfully develop a treatment or vaccine for COVID-19, nor that a product or vaccine candidates, if approved, would be commercially successful nor that demand for such a vaccine or product would still exist, despite significant R&D costs generated for its development.
The pandemic could also pose risks to the health and safety of our employees.
Finally, the COVID-19 pandemic, and the volatile global economic conditions stemming from the pandemic, could precipitate or amplify the other risk factors that we identify in the “Risk Factors” section of our 2019 Form 20-F, which could materially adversely affect our business, operations and financial conditions and results. If the pandemic is prolonged, our operations could also be adversely impacted by the work-from-home, lockdown and other restrictions that have been adopted in response to the pandemic.
Any of these risks, and others that we may not yet have identified, could materialize during the second half of 2020 or during subsequent period, and could cause actual results to differ materially from those described elsewhere in this reports.
| | |
| D.2. RELATED PARTY TRANSACTIONS |
Our principal related parties are defined in Note D.33. to the consolidated financial statements included in our 2019 Annual Report on Form 20-F (page F-94)7.
Note B.5. to the condensed half-year consolidated financial statements provides a description of the principal transactions and balances for the six months ended June 30, 2020 with equity-accounted entities that qualify as related parties.
Sanofi did not enter into any transactions with key management personnel during the first half of 2020.
Financial relations with the Group’s principal shareholders fall within the ordinary course of business and were immaterial in the first half of 2020.
7 This report is available on our corporate website: www.sanofi.com.
| | | | | |
2020 Half-Year Financial Report - Sanofi | 61 |
At constant exchange rates, we expect growth in 2020 full-year business earnings per share8 (business EPS) to be in a range from 6% to 7%9, barring major unforeseen adverse events. The impact of exchange rates on 2020 business EPS is estimated to be approximately -3% to -4%, based on July 2020 average exchange rates applied over the rest of the year.
Full-year business net income9 for 2020 was €7,050 million, giving business earnings per share of €5.64.
This guidance has been prepared using accounting methods consistent with those used in the preparation of our historical financial information, and with the accounting policies applied by Sanofi . It draws upon assumptions defined by Sanofi and its subsidiaries, in particular regarding the following factors:
•growth in the national markets in which we operate;
•healthcare reimbursement policies, pricing reforms, and other governmental measures affecting the pharmaceutical industry;
•developments in the competitive environment, in terms of innovative products and the introduction of generics;
•respect by others for our intellectual property rights;
•progress on our research and development programs;
•the impact of our operating cost control policy, and trends in our operating costs;
•trends in exchange rates and interest rates;
•the integration of contributions from our acquisitions; and
•the average number of shares outstanding.
Some of the information, assumptions and estimates concerned are derived from or based, in whole or in part, on judgments and decisions made by Sanofi management that may be liable to change or adjustment in future.
8 For a definition, see Section C.2., “Business net income” above.
9 2019 restated business EPS was €5.64, reflecting the discontinuation of equity method accounting for Sanofi’s investment in Regeneron.
| | | | | |
| 62 | 2020 Half-Year Financial Report - Sanofi |
| | |
| FORWARD-LOOKING STATEMENTS |
This document contains forward-looking statements as defined in the US Private Securities Litigation Reform Act of 1995, as amended. Forward-looking statements are statements that are not historical facts. These statements include projections and estimates and their underlying assumptions, statements regarding plans, objectives, intentions and expectations with respect to future financial results, events, operations, services, product development and potential, and statements regarding future performance. Forward-looking statements are generally identified by the words “expects”, “anticipates”, “believes”, “intends”, “estimates”, “plans” and similar expressions. Although Sanofi’s management believes that the expectations reflected in such forward-looking statements are reasonable, investors are cautioned that forward-looking information and statements are subject to various risks and uncertainties, many of which are difficult to predict and generally beyond the control of Sanofi, that could cause actual results and developments to differ materially from those expressed in, or implied or projected by, the forward-looking information and statements.
These risks and uncertainties include among other things, the uncertainties inherent in research and development, future clinical data and analysis, including post marketing, decisions by regulatory authorities, such as the FDA or the EMA, regarding whether and when to approve any drug, device or biological application that may be filed for any such product candidates as well as their decisions regarding labelling and other matters that could affect the availability or commercial potential of such product candidates, the fact that product candidates if approved may not be commercially successful, the future approval and commercial success of therapeutic alternatives, Sanofi’s ability to benefit from external growth opportunities, to complete related transactions and/or obtain regulatory clearances, risks associated with intellectual property and any related pending or future litigation and the ultimate outcome of such litigation, trends in exchange rates and prevailing interest rates, volatile economic and market conditions, cost containment initiatives and subsequent changes thereto, and the impact that COVID-19 will have on us, our customers, suppliers, vendors, and other business partners, and the financial condition of any one of them, as well as on our employees and on the global economy as a whole. Any material effect of COVID-19 on any of the foregoing could also adversely impact us. This situation is changing rapidly and additional impacts may arise of which we are not currently aware and may exacerbate other previously identified risks. The risks and uncertainties also include the uncertainties discussed or identified in the public filings with the SEC and the AMF made by Sanofi, including those listed under “Risk Factors” and “Cautionary Statement Regarding Forward-Looking Statements” in Sanofi’s annual report on Form 20-F for the year ended December 31, 201910. For an update on litigation, refer to Note B.14. “Legal and arbitration proceedings” (page 28) to our condensed half-year consolidated financial statements for the six months ended June 30, 2020, and to section “A.3.2. Legal and arbitration proceedings” (page 41) and section “D/ Risk factors and related party transactions” (pages 61) of this half-year management report.
Other than as required by applicable law, Sanofi does not undertake any obligation to update or revise any forward-looking information or statements.
10 See pages 3 to 13 of our 2019 Annual Report on Form 20-F, available on our corporate website: www.sanofi.com
| | | | | |
2020 Half-Year Financial Report - Sanofi | 63 |
| | |
| F/ APPENDIX - RESEARCH AND DEVELOPMENT PIPELINE |
| | | | | |
| 64 | 2020 Half-Year Financial Report - Sanofi |
| | | | | |
2020 Half-Year Financial Report - Sanofi | 65 |
| | |
| 3. STATUTORY AUDITORS’ REVIEW REPORT ON THE HALF-YEARLY FINANCIAL INFORMATION |
Period from January 1 to June 30, 2020
To the Shareholders,
In compliance with the assignment entrusted to us by your annual general meetings and in accordance with the requirements of article L. 451-1-2 III of the French monetary and financial code (Code monétaire et financier), we hereby report to you on:
▪the review of the accompanying condensed half-yearly consolidated financial statements of Sanofi, for the period from January 1 to June 30, 2020;
▪the verification of the information contained in the half-yearly management report.
These condensed half-yearly consolidated financial statements have been prepared on July 28th, 2020 under the responsibility of the board of directors on the basis on the information available at that date in an evolving context of the Covid-19 crisis and of difficulties in understanding its impact and prospects. Our role is to express a conclusion on these financial statements based on our review.
1. Conclusion on the financial statements
We conducted our review in accordance with professional standards applicable in France. A review of interim financial information consists of making inquiries, primarily of persons responsible for financial and accounting matters, and applying analytical and other review procedures. A review is substantially less in scope than an audit conducted in accordance with professional standards applicable in France and consequently does not enable us to obtain assurance that we would become aware of all significant matters that might be identified in an audit. Accordingly, we do not express an audit opinion.
Based on our review, nothing has come to our attention that causes us to believe that the accompanying condensed half-yearly consolidated financial statements are not prepared, in all material respects, in accordance with IAS 34 – the standard of IFRSs as adopted by the European Union applicable to interim financial information.
2. Specific verification
We have also verified the information presented in the half-yearly management report established on July 28th, 2020 on the condensed half-yearly consolidated financial statements subject to our review.
We have no matters to report as to its fair presentation and consistency with the condensed half-yearly consolidated financial statements.
Neuilly-sur-Seine and Paris-La Défense, July 28, 2020
| | | | | |
The statutory auditors
French original signed by | |
| |
| PricewaterhouseCoopers Audit | ERNST & YOUNG et Autres |
| Dominique Ménard Stéphane Basset | Alexis Hurtrel Pierre Chassagne |
* This is a free translation into English of the statutory auditors’ review report issued in French and is provided solely for the convenience of English-speaking users. This report includes information relating to the specific verification of information given in the group’s half-yearly management report. This report should be read in conjunction with, and construed in accordance with, French law and professional standards applicable in France.
| | | | | |
| 66 | 2020 Half-Year Financial Report - Sanofi |
| | |
| 4. RESPONSIBILITY STATEMENT OF THE CERTIFYING OFFICER – HALF-YEAR FINANCIAL REPORT |
“I hereby certify that, to the best of my knowledge, the condensed half-year consolidated financial statements have been prepared in accordance with the applicable accounting standards and present fairly the assets and liabilities, the financial position and the income of the Company and the entities included in the scope of consolidation, and that the half-year management report starting on page 38 provides an accurate overview of the significant events of the first six months of the financial year with their impact on the half-year consolidated financial statements, together with the major transactions with related parties and a description of the main risks and uncertainties for the remaining six months of the financial year.”
Paris, July 29, 2020
Paul Hudson
Chief Executive Officer
| | | | | |
2020 Half-Year Financial Report - Sanofi | 67 |