Exhibit 99.2
Table of Contents
| | | | | | | | | | | |
| 2 | HALF-YEAR MANAGEMENT REPORT | |
| | A/ Significant events of the first half of 2021 | |
| | B/ Events subsequent to June 30, 2021 | |
| | C/ Consolidated financial statements for the first half of 2021 | |
| | D/ Risk factors and related party transactions | |
| | E/ Outlook | |
| | F/ Appendix – Research and Development Pipeline | |
| 3 | STATUTORY AUDITORS’ REPORT | |
| 4 | RESPONSIBILITY STATEMENT OF THE CERTIFYING OFFICER – HALF-YEAR FINANCIAL REPORT | |
| | |
| 2. HALF-YEAR MANAGEMENT REPORT |
| | |
| A/ SIGNIFICANT EVENTS OF THE FIRST HALF OF 2021 |
|
| A.1. FIRST-HALF OVERVIEW |
During the first half of 2021, Sanofi continued to implement its new “Play to Win” strategy, involving major decisions and positive actions that will support and rebuild the competitive margins necessary for Sanofi to continue to deliver on its mission. Significant events connected with the implementation of that strategy are described below.
On January 11, 2021, Sanofi and Kymab, a clinical-stage biopharmaceutical company developing fully human monoclonal antibodies with a focus on immune-mediated diseases and immuno-oncology therapeutics, announced that they had entered into an agreement under which Sanofi would acquire Kymab for an upfront payment of approximately $1.1 billion and up to $350 million contingent upon attainment of certain development milestones. On April 9, 2021, Sanofi announced that it had successfully completed this acquisition, thereby obtaining full global rights to KY1005, a fully human monoclonal antibody that targets the key immune system regulator OX40L and has the potential to treat a wide variety of immune-mediated diseases and inflammatory disorders.
On January 12, 2021, Sanofi unveiled EUROAPI as the name of the new industry-leading European company dedicated to the development, production and marketing of active pharmaceutical ingredients (API). Sanofi also announced the appointment of Karl Rotthier as the future Chief Executive Officer of EUROAPI effective January 18, 2021. Karl Rotthier, aged 53, is a seasoned leader with strong API business experience. He was most recently Chief Executive Officer of Centrient Pharmaceuticals. During a 29-year international career in the Netherlands, Germany, Austria, Belgium and Singapore, he has successfully driven a number of operational carve-outs and spin-offs. Karl will lead the creation of EUROAPI, working with the new company's management team to help EUROAPI deliver on its growth ambitions. An IPO on Euronext Paris is envisaged by 2022, subject to market conditions.
On February 12, 2021, Sanofi announced an all-cash offer to all holders of Kiadis shares, to acquire their shares at an offer price of €5.45 (cum dividend). Completion of the acquisition was announced on April 16, 2021. Kiadis is a clinical-stage biopharmaceutical company developing natural killer (NK) cell therapies for patients with potentially life-threatening diseases. NK cells seek and identify malignant cancer cells and have broad application across various tumor types. Kiadis’s NK cell-based medicines will be developed alone and in combination with Sanofi’s existing pipeline and platforms.
On March 31, 2021, Sanofi announced an investment of over €600 million in construction of a new vaccine manufacturing facility at its existing site in Toronto, Canada. The new facility will provide additional antigen and filling capacity for Sanofi’s Fluzone® High-Dose quadrivalent influenza vaccine, helping to increase supply availability in Canada, the United States and Europe. Sanofi expects this new facility to be operational in 2026, following design, construction, testing and qualification of the facility and equipment. Fluzone® High-Dose quadrivalent influenza vaccine is currently manufactured exclusively by Sanofi Pasteur, Sanofi’s vaccines global business unit, at its Swiftwater, Pennsylvania site in the United States. Sanofi Pasteur has an ongoing investment program expanding its manufacturing capabilities for influenza vaccines. Two new facilities, in Swiftwater and in Val-de-Reuil (France), will start to operate in the coming years.
On April 7, 2021, Sanofi’s Chief Executive Officer Paul Hudson outlined several key projects that the company will implement to increase the impact of its Corporate Social Responsibility (CSR) strategy. Embedded in Sanofi's long-term strategy, the company’s commitment is based on four essential pillars in which Sanofi is uniquely positioned to make a difference: access to medicines, support for vulnerable communities, preservation of the environment, and inclusion and diversity of its employees.
On April 9, 2021, Sanofi acquired Tidal Therapeutics, a privately owned, pre-clinical stage biotech company with a novel mRNA-based approach for in vivo reprogramming of immune cells. The new technology platform will expand Sanofi’s research capabilities in immuno-oncology and inflammatory diseases, and may have applicability to other disease areas as well. Sanofi acquired Tidal Therapeutics for an upfront payment of $160 million and up to $310 million contingent upon attainment of certain development milestones.
On April 12, 2021, Sanofi announced a €400 million investment over five years to create a one-of-a-kind vaccine production center in Singapore, pushing the boundaries of operations through cutting edge digital manufacturing technologies. In partnership with the Singapore Economic Development Board (EDB), the new site will mainly supply the Asian region and complement existing Sanofi manufacturing capacities in Europe and North America.
On May 6, 2021, Sanofi announced that it had entered into a three-year research collaboration with Stanford University School of Medicine. Together, the two organizations and their scientists will work to advance the understanding of immunology and inflammation through open scientific exchange. Additionally, Sanofi will provide funding and scientific inputs into projects of mutual interest, crossing multiple therapeutic areas including autoimmune diseases and inflammatory conditions.
On June 3, 2021, as part of a long-standing commitment to reduce the environmental footprint of the company’s products and activities, Sanofi launched a €3 million Planet Mobilization fund to support employee ideas and projects that will further contribute to a healthier environment. This year, three Sanofi teams will have their projects funded.
| | | | | |
| 40 | 2020 Half-Year Financial Report - Sanofi |
On June 29, 2021, Sanofi announced that it will invest approximately €400 million annually in a first-of-its-kind mRNA vaccines Center of Excellence. The Center will work to accelerate the development and delivery of next-generation vaccines by bringing together approximately 400 dedicated employees and integrating end-to-end mRNA vaccine capabilities with dedicated R&D, digital, and Chemistry, Manufacturing and Controls (CMC) teams across sites at Cambridge, MA (US) and Marcy l’Etoile, Lyon (France).
Net sales for the first half of 2021 amounted to €17,335 million, 0.9% higher than in the first half of 2020. At constant exchange rates (CER)1, net sales rose by 7.2%, driven mainly by strong performances for Dupixent®. The year-on-year increase also reflects good performances by the Rare Diseases and Oncology franchises, and also from Vaccines as sales of Meningitis Vaccines picked up strongly relative to 2020. Sales of Consumer Healthcare products were up slightly year-on-year, with robust growth for the Digestive Wellness category more than offsetting lower sales in the Cough, Cold and Flu category.
Net income attributable to equity holders of Sanofi amounted to €2,776 million, versus €9,281 million in the first half of 2020. The decrease was mainly due to the recognition during the first half of 2020 of the €7,382 million gain on the divestment of Sanofi’s equity investment in Regeneron following the transaction of May 29, 2020. Apart from that impact, operating income increased year-on-year due to reductions in (i) impairment losses taken against intangible assets and (ii) reductions in restructuring costs and similar items compared with the first half of 2020. Earnings per share was €2.22, versus €7.41 for the first half of 2020. Business net income2 was €3,748 million, up 6.4% on the first half of 2020, while business earnings per share (business EPS2) was 6.8% higher than in the first half of 2020 at €3.00.
| | |
| A.2. RESEARCH AND DEVELOPMENT |
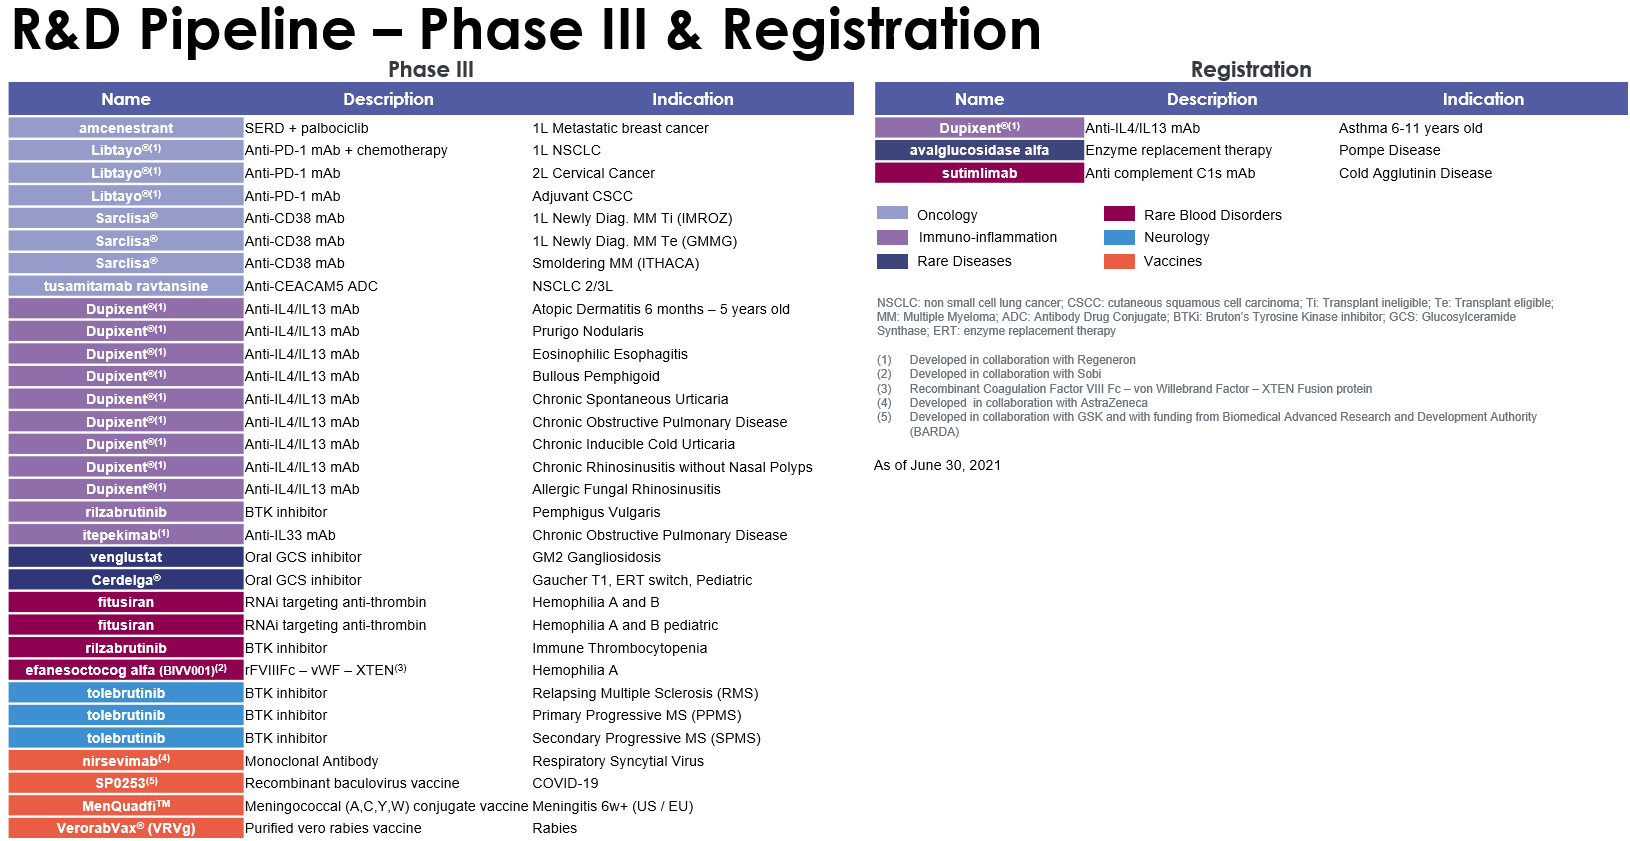
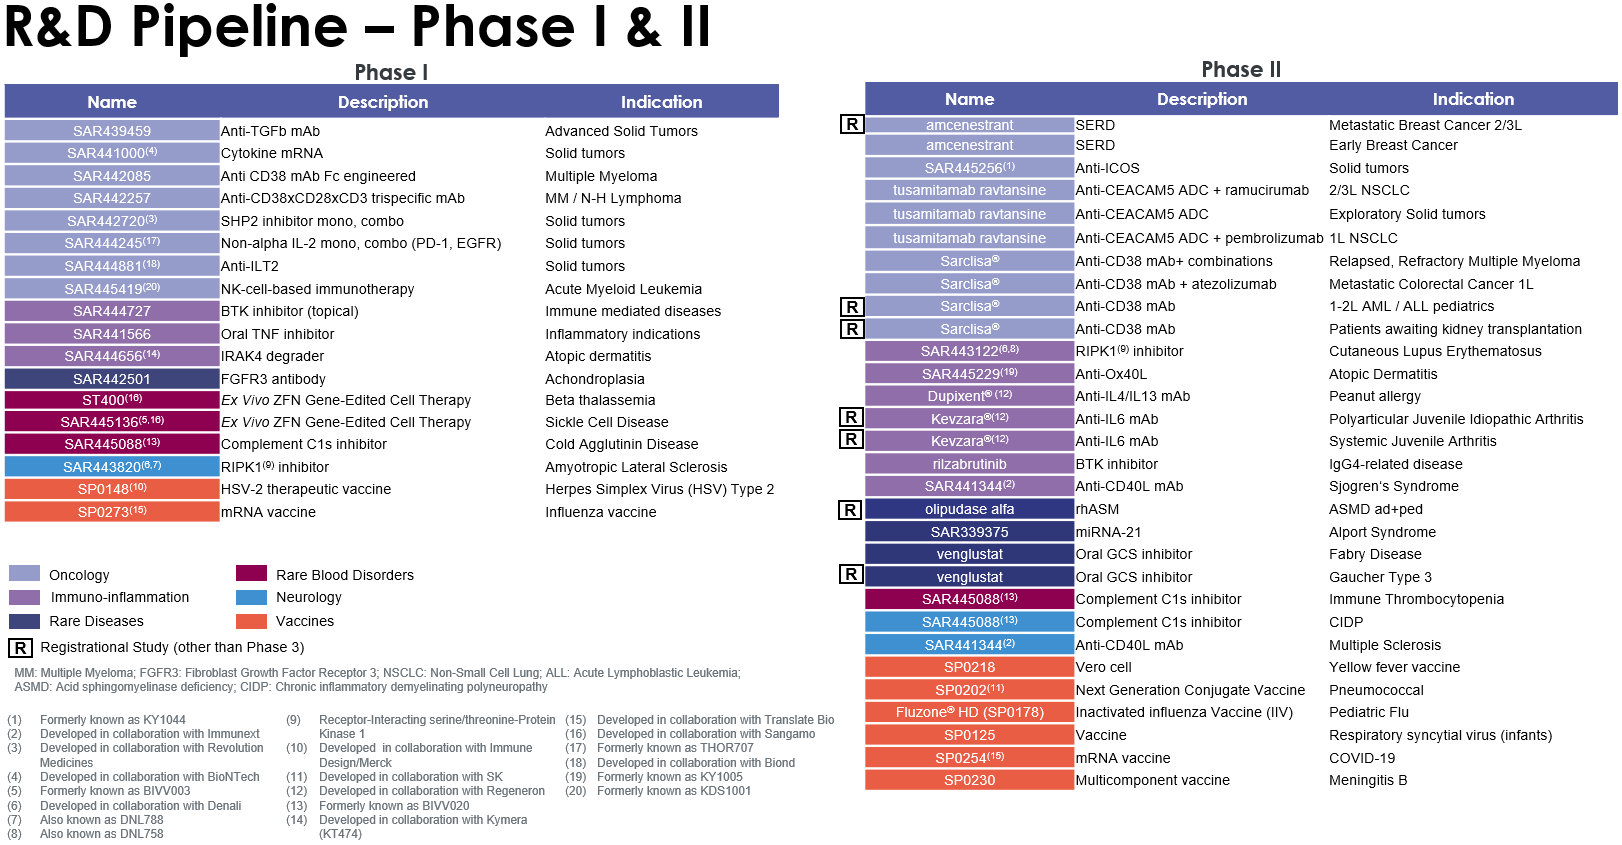
Highlights of Sanofi’s research and development efforts in the first half of 2021 in the Pharmaceuticals segment included the launch a Phase III trial (XTEND-Kids) evaluating efanesoctocog alfa (BIVV001) in pediatric hemophilia A patients, and of a second pivotal trial (AERIFY-2) evaluating itepekimab in chronic obstructive pulmonary disease (COPD). In the Vaccines segment, Sanofi and GSK announced the launch of their Phase III clinical study to assess the safety, efficacy, and immunogenicity of their adjuvanted recombinant-protein COVID-19 vaccine candidate. Following encouraging interim results from the recent Phase II study, the companies will also begin clinical studies to assess the ability of the adjuvanted recombinant-protein vaccine candidate to generate a strong booster response regardless of the initial vaccine platform received. The vaccine could be approved in the fourth quarter of 2021, subject to positive Phase III outcomes and regulatory reviews.
Sanofi obtained regulatory marketing approval for a number of products during the first half of 2021. In the United States, the PD-1 inhibitor Libtayo® (cemiplimab-rwlc) received full approval for locally advanced basal cell carcinoma (BCC) and accelerated approval in metastatic BCC, following a priority review by the US Food and Drug Administration (FDA). Libtayo® is now approved for the two most common advanced skin cancers in the United States. The European Commission also approved Libtayo® for the treatment of metastatic or locally advanced BCC in adults. The FDA and the European Commission approved Libtayo® for the first-line treatment of patients with advanced non-small cell lung cancer (NSCLC) whose tumors have high PD-L1 expression. The FDA and the European Commission approved Sarclisa® (isatuximab-irfc), in combination with carfilzomib and dexamethasone, for adult patients with relapsed and refractory multiple myeloma who have received one to three prior therapies. The European Commission approved Aubagio® (teriflunomide) for the treatment of pediatric patients aged 10 to 17 years with relapsing-remitting multiple sclerosis (MS). The approval confirms Aubagio® as the first oral therapy for first-line treatment of children and adolescents with MS in the European Union.
For an update on our research and development pipeline, refer to Section F of this half-year management report.
1 Non-GAAP financial measure: see definition in C.3., “Net sales”.
2 Non-GAAP financial measure: see definition in C.2., “Business net income”.
| | | | | |
2021 Half-Year Financial Report - Sanofi | 41 |
| | |
| A.3. OTHER SIGNIFICANT EVENTS |
|
| A.3.1 CORPORATE GOVERNANCE |
The Annual General Meeting of Sanofi shareholders was held on April 30, 2021 behind closed doors, in accordance with exceptional measures implemented by the French authorities to adapt the rules for holding shareholder meetings in light of the COVID-19 crisis. The meeting, chaired by Serge Weinberg, took place at Sanofi’s Paris headquarters. All the resolutions put to the vote were passed. The Annual General Meeting approved the individual company financial statements and the consolidated financial statements for the year ended December 31, 2020, along with the distribution of a cash dividend of €3.20 per share paid on May 7, 2021. The meeting approved the reappointment of Fabienne Lecorvaisier and Melanie Lee as directors; ratified the co-opting of Gilles Schnepp as a director; and approved the appointment of Barbara Lavernos to replace Laurent Attal as a director. On a proposal from the Appointments, Governance and CSR Committee, Rachel Duan was appointed as a member of the Compensation Committee; Lise Kingo as a member of the Appointments, Governance and CSR Committee; and Gilles Schnepp as a member of the Strategy Committee. The Board of Directors also noted the designation of Wolfgang Laux and Yann Tran as directors representing employees, replacing Marion Palme and Christian Senectaire respectively. Following the Annual General Meeting, the Board of Directors has 15 members, seven of whom are women and two of whom are employee representatives. The Board retains a substantial majority of independent directors.
| | |
| A.3.2. LEGAL AND ARBITRATION PROCEEDINGS |
For a description of the most significant developments in legal and arbitration proceedings since publication of the financial statements for the year ended December 31, 2020, refer to Note B.14. to the condensed half-year consolidated financial statements.
The following events have occurred in respect of litigation, arbitration and other legal proceedings in which Sanofi and its affiliates are involved:
•Lantus® Mylan Patent Litigation (United States)
Regarding the ongoing US Patent Trial and Appeal Board (PTAB) proceedings brought by Mylan challenging the validity of certain claims of U.S. Patent Nos. 8,603,044, 8,679,069, 8,992,486, 9,526,844, and 9,604,008, in May 2021, Mylan’s cross appeal concerning U.S. Patent No. 9,604,008 was dismissed by the US Court of Appeals for the Federal Circuit (CAFC).
Regarding the ongoing PTAB proceedings brought by Mylan challenging the validity of the claims of U.S. Patent No. RE47,614, in March 2021, the PTAB issued a written decision invalidating all claims of this patent. In May 2021, Sanofi appealed to the CAFC and the appeal is underway.
•Cerdelga® Patent Litigation (United States)
Sanofi-Genzyme has settled the case with all of the defendants (Cipla Limited; Zenara Pharma Private Limited; Teva Pharmaceuticals USA, Inc.; Dr. Reddy's Laboratories, Ltd.; Apotex Inc.; Aizant Drug Research Solutions Private Limited). The case is closed.
| | |
| GOVERNMENT INVESTIGATIONS AND RELATED LITIGATION |
In September 2019, Sanofi US received a Civil Investigative Demand (CID) from the US Department of Justice concerning Dupixent®, Kevzara®, Praluent® and Zaltrap®. In June 2021, the government declined to intervene in the underlying complaint which was filed in November 2018, and unsealed upon the government declination. The Relators who filed the complaint have until September 1, 2021 to serve the complaint on Regeneron and Sanofi, if they choose to proceed. The government investigation into this matter is now closed.
Insulin related litigation (United States)
In In re Direct Purchaser Insulin Pricing Litigation, in July 2021, the court issued an order dismissing the antitrust claims against defendants, but allowing the claims under the federal Racketeer Influenced and Corrupt Organizations Act to proceed.
There are two new insulin related litigation matters filed against Sanofi US or its affiliates (and other defendants) regarding the pricing of Lantus®, Apidra®, and Toujeo®. The two lawsuits allege some combination of violations of state unfair/deceptive trade practices statutes, violations of antitrust laws, unjust enrichment, common-law fraud, and civil conspiracy. The status of these matters is as follows.
•Mississippi vs. Sanofi Aventis US LLC et al (Mississippi Chancery Court of Hinds County, filed June 7, 2021)
◦Sanofi US has not yet been served with the complaint.
| | | | | |
| 42 | 2021 Half-Year Financial Report - Sanofi |
•Miami, Florida vs. Sanofi US Services, Inc. et al (State Court in Miami-Dade County, filed June 16, 2021)
◦Sanofi US Services, Inc. was served with the complaint on July 8, 2021.
On June 7, 2021, Sanofi launched “Action 2021”, a global employee stock ownership plan open to 92,000 employees across 73 countries. This new plan, in line with similar plans implemented since 2013, clearly demonstrates the ongoing commitment of Sanofi and its Board of Directors to involve all employees, across all geographies, in the company’s future development and results.
The shares were offered at a subscription price of €69.38, representing a 20% discount to the average of the 20 opening prices of Sanofi shares from May 6 through June 2, 2021. In addition, for every five shares subscribed, employees are entitled to receive one free share (up to a maximum of four free shares per employee). Finally, each employee is able to subscribe for up to 1,500 Sanofi shares subject to a statutory cap on the amount subscribed, set at 25% of their gross annual salary minus any voluntary payments already made under employee savings schemes (Group Savings Plan and/or Group Retirement Savings Plan) during 2021.
| | |
| B/ EVENTS SUBSEQUENT TO JUNE 30, 2021 |
On July 13, 2021, Sanofi announced becoming a Premium Partner of Paris 2024 for the Olympic and Paralympic Games being held in Paris in 2024. For Sanofi, whose headquarters are based in Paris, this commitment to Paris 2024 is a unique opportunity to engage its 100,000 employees in one of the largest sporting events in the world. Sanofi’s commitment to Paris 2024 also highlights the company’s societal impact strategy and affirms its commitment to the values of inclusion, diversity and openness to the world, as well as its environmental ambition. The company welcomes the desire of Paris 2024 to foster the values of the Games to increase their accessibility to the public and make them more sustainable and intends to contribute by highlighting the benefits of physical activity on health.
On July 29, 2021, Sanofi announced that a pivotal Phase 3 trial evaluating Dupixent® (dupilumab) in patients with moderate-to-severe chronic spontaneous urticaria (CSU), an inflammatory skin disease, met its primary endpoints and all key secondary endpoints at 24 weeks. Adding Dupixent® to standard-of-care antihistamines significantly reduced itch and hives for biologic-naïve patients, compared to those treated with antihistamines alone (placebo) in Study A (the first of two trials) of the LIBERTY CUPID clinical program.
On July 29, 2021, Sanofi announced that Karen Linehan and Philippe Luscan, who have led Legal, Ethics & Business Integrity (LEBI) and Industrial Affairs at Sanofi for the last 14 and 13 years respectively have decided to retire. Karen will retire on December 31, 2021 and Philippe later in 2022. Sanofi has appointed Roy Papatheodorou and Brendan O’Callaghan as their respective replacements, joining the company’s Executive Committee. Additionally, Viviane Monges will join EUROAPI, a future leading European company dedicated to the development, production, and marketing of active pharmaceutical ingredients (API), as an independent non-executive Chair of the Supervisory Board. She will serve as Chair of the Board of Directors upon transformation of EUROAPI into a société anonyme, in compliance with applicable corporate governance regulations. Together, these appointments underscore the company’s strategy to further increase the diversity and cultural backgrounds of the executives leading Sanofi’s modernization.
| | | | | |
2021 Half-Year Financial Report - Sanofi | 43 |
| | |
| C/ CONSOLIDATED FINANCIAL STATEMENTS FOR THE FIRST HALF OF 2021 |
Unless otherwise indicated, all financial data in this report are presented in accordance with international financial reporting standards (IFRS), including international accounting standards and interpretations (see Note A.1. to the condensed half-year consolidated financial statements).
Consolidated income statements for the six months ended June 30, 2020 and June 30, 2021 | | | | | | | | | | | | | | |
| (€ million) | June 30, 2021 (6 months) | as % of net sales | June 30, 2020 (6 months) | as % of net sales |
| Net sales | 17,335 | | 100.0 | % | 17,180 | | 100.0 | % |
| Other revenues | 596 | | 3.4 | % | 574 | | 3.3 | % |
| Cost of sales | (5,541) | | (32.0) | % | (5,543) | | (32.3) | % |
| Gross profit | 12,390 | | 71.5 | % | 12,211 | | 71.1 | % |
| Research and development expenses | (2,663) | | (15.4) | % | (2,692) | | (15.7) | % |
| Selling and general expenses | (4,530) | | (26.1) | % | (4,607) | | (26.8) | % |
| Other operating income | 409 | |
| 281 | | |
| Other operating expenses | (709) | |
| (693) | | |
| Amortization of intangible assets | (775) | |
| (883) | | |
| Impairment of intangible assets | (178) | |
| (323) | | |
| Fair value remeasurement of contingent consideration | (4) | |
| 54 | | |
| Restructuring costs and similar items | (327) | |
| (758) | | |
| Other gains and losses, and litigation | — | |
| 136 | | |
| Gain on Regeneron investment arising from transaction of May 29, 2020 | — | | | 7,382 | | |
| Operating income | 3,613 | | 20.8 | % | 10,108 | | 58.8 | % |
| Financial expenses | (189) | |
| (198) | | |
| Financial income | 28 | |
| 31 | | |
| Income before tax and investments accounted for using the equity method | 3,452 | | 19.9 | % | 9,941 | | 57.9 | % |
| Income tax expense | (682) | |
| (994) | | |
| Share of profit/(loss) from investments accounted for using the equity method | 26 | |
| 354 | | |
| Net income | 2,796 | | 16.1 | % | 9,301 | | 54.1 | % |
| Net income attributable to non-controlling interests | 20 | |
| 20 | |
|
| Net income attributable to equity holders of Sanofi | 2,776 | | 16.0 | % | 9,281 | | 54.0 | % |
| Average number of shares outstanding (million) | 1,250.3 | |
| 1,251.7 | |
|
| Average number of shares after dilution (million) | 1,255.6 | |
| 1,258.2 | |
|
▪Basic earnings per share (in euros) | 2.22 | |
| 7.41 | |
|
▪Diluted earnings per share (in euros) | 2.21 | |
| 7.38 | |
|
| | | | | |
| 44 | 2021 Half-Year Financial Report - Sanofi |
| | |
| C.1. SEGMENT INFORMATION |
|
| C.1.1. OPERATING SEGMENTS |
In accordance with IFRS 8 (Operating Segments), the segment information reported by Sanofi is prepared on the basis of internal management data provided to our Chief Executive Officer, who is the chief operating decision maker of Sanofi. The performance of those segments is monitored individually using internal reports and common indicators. The operating segment disclosures required under IFRS 8 are provided in Note B.20. to the condensed half-year consolidated financial statements.
Sanofi has three operating segments: Pharmaceuticals, Vaccines, and Consumer Healthcare.
The Pharmaceuticals segment comprises, for all geographical territories, the commercial operations of the following global franchises: Specialty Care (Dupixent®, Neurology & Immunology, Rare Diseases, Oncology, and Rare Blood Disorders) and General Medicines (Diabetes, Cardiovascular, and Established Prescription Products), together with research, development and production activities dedicated to the Pharmaceuticals segment. This segment also includes associates whose activities are related to pharmaceuticals. Following the transaction of May 29, 2020, Regeneron is no longer an associate of Sanofi (see Note D.1. to our consolidated financial statements for the year ended December 31, 2020). Consequently, the Pharmaceuticals segment no longer includes Sanofi’s equity-accounted share of Regeneron’s profits for all the periods presented in that note.
The Vaccines segment comprises, for all geographical territories, the commercial operations of Sanofi Pasteur, together with research, development and production activities dedicated to vaccines.
The Consumer Healthcare segment comprises, for all geographical territories, the commercial operations for Sanofi’s Consumer Healthcare products, together with research, development and production activities dedicated to those products.
Inter-segment transactions are not material.
The costs of Sanofi’s global support functions (External Affairs, Finance, Human Resources, Legal Affairs, Information Solutions & Technologies, Sanofi Business Services, etc.) are mainly managed centrally at group-wide level. The costs of those functions are presented within the “Other” category. That category also includes other reconciling items such as retained commitments in respect of divested activities.
Following the Capital Markets Day held in February 2021, Sanofi changed the presentation of net sales for certain products in the Pharmaceuticals segment (within the General Medicines GBU) and the Consumer Healthcare segment, and also reallocated certain expenses. In particular, IT costs relating to our new digital organization – previously allocated to the Pharmaceutical, Vaccines, and Consumer Healthcare segments – are now included within the “Other” segment. The 2020 segmental results presented below have been amended for comparative purposes in order to reflect those adjustments.
| | |
| C.1.2. BUSINESS OPERATING INCOME |
We report segment results on the basis of “Business operating income”. This indicator is used internally by Sanofi’s chief operating decision maker to measure the performance of each operating segment and to allocate resources. For a definition of “Business operating income”, and a reconciliation between that indicator and Income before tax and investments accounted for using the equity method, refer to Note B.20.1.2. to our condensed half-year consolidated financial statements.
In the first half of 2021, “Business operating income” amounted to €4,903 million (versus €4,683 million for the first half of 2020), while “Business operating income margin” was 28.3% (versus 27.3% for the first half of 2020). “Business operating income margin” is a non-GAAP financial measure that we define as the ratio of “Business net income” to our consolidated net sales.
Because our “Business operating income” and “Business operating income margin” are not standardized measures, they may not be directly comparable with the non-GAAP financial measures of other companies using the same or similar non-GAAP financial measures. Despite the use of non-GAAP measures by management in setting goals and measuring performance, these are non-GAAP measures that have no standardized meaning prescribed by IFRS.
| | | | | |
2021 Half-Year Financial Report - Sanofi | 45 |
We believe that understanding of our operational performance by our management and our investors is enhanced by reporting “Business net income”. This non-GAAP financial measure represents “Business operating income”, less net financial expenses and the relevant income tax effects.
“Business net income” for the first half of 2021 amounted to €3,748 million, 6.4% more than in the first half of 2020 (€3,521 million). That represents 21.6% of net sales, versus 20.5% for the first half of 2020.
We also report “Business earnings per share” (business EPS), a non-GAAP financial measure which we define as business net income divided by the weighted average number of shares outstanding.
Business EPS was €3.00 for the first half of 2021, 6.8% higher than the 2020 first-half figure of €2.81, based on an average number of shares outstanding of 1,250.3 million for the first half of 2021 and 1,251.7 million for the first half of 2020.
The table below reconciles our “Business operating income” to our “Business net income”:
| | | | | | | | | | | | | | | | | |
| (€ million) | June 30, 2021 (6 months) | June 30, 2020 (6 months) |
| December 31, 2020 (12 months) |
|
| Business operating income | 4,903 | | 4,683 | | | 9,762 | | |
| Financial income and expenses | (161) | | (167) | | | (337) | | |
| Income tax expense | (994) | | (995) | | | (2,078) | | |
| Business net income | 3,748 | | 3,521 | | | 7,347 | | |
We define “Business net income” as Net income attributable to equity holders of Sanofi determined under IFRS, excluding the following items:
▪amortization and impairment losses charged against intangible assets (other than software and other rights of an industrial or operational nature);
▪fair value remeasurements of contingent consideration relating to business combinations or divestments;
▪other impacts associated with acquisitions (including impacts of acquisitions on investments accounted for using the equity method);
▪restructuring costs and similar items (presented within the line item Restructuring costs and similar items);
▪other gains and losses, including gains and losses on major disposals of non-current assets (presented within the line item Other gains and losses, and litigation);
▪for 2020, the gain on the divestment of Regeneron shares dated May 29, 2020 (not including the gain on the remeasurement of the 400,000 retained shares at market value as of that date);
▪other costs and provisions related to litigation (presented within the line item Other gains and losses, and litigation);
▪the tax effects of the items listed above, and the impact of major tax disputes;
▪for 2020, the effects of the discontinuation of accounting by the equity method for the investment in Regeneron (see Note D.1. to our consolidated financial statements for the year ended December 31, 2020; and
▪the portion attributable to non-controlling interests of the items listed above.
| | | | | |
| 46 | 2021 Half-Year Financial Report - Sanofi |
The table below reconciles our “Business net income” to Net income attributable to equity holders of Sanofi:
| | | | | | | | | | | | | | | | | |
| (€ million) | June 30, 2021 (6 months) | June 30, 2020 (6 months) |
| December 31, 2020 (12 months) |
|
| Net income attributable to equity holders of Sanofi | 2,776 | | 9,281 | | | 12,314 | | |
Amortization of intangible assets (a) | 775 | | 883 | | | 1,681 | | |
Impairment of intangible assets (b) | 178 | | 323 | | | 330 | | |
| Fair value remeasurement of contingent consideration | 4 | | (54) | | | (124) | | |
| Expenses arising from the impact of acquisitions on inventories | — | | 36 | | | 53 | | |
| | | | | |
| Restructuring costs and similar items | 327 | | 758 | | | 1,064 | | |
Other gains and losses, and litigation (c) | — | | (136) | | | (136) | | |
Gain on divestment of Regeneron shares on May 29, 2020 (d) | — | | (7,225) | | | (7,225) | | |
| Tax effects of the items listed above: | (311) | | (1) | | | (264) | | |
▪amortization and impairment of intangible assets | (230) | | (302) | | | (541) | | |
▪fair value remeasurement of contingent consideration | 3 | | 2 | | | 39 | | |
▪expenses arising from the impact of acquisitions on inventories | — | | (5) | | | (8) | | |
| | | | | |
▪tax effects of restructuring costs and similar items | (84) | | (232) | | | (293) | | |
▪ gain on divestment of Regeneron shares on May 29, 2020 | — | | 475 | | | 477 | | |
▪other tax effects | — | | 61 | | | 62 | | |
| Share of items listed above attributable to non-controlling interests | (1) | | (1) | | | (3) | | |
| Investments accounted for using the equity method: restructuring costs and expenses arising from the impact of acquisitions | — | | (30) | | | (30) | | |
Effect of discontinuation of equity method for investment in Regeneron (e) | — | | (313) | | | (313) | | |
| | | | | |
| Business net income | 3,748 | | 3,521 | | | 7,347 | | |
| Average number of shares outstanding (million) | 1,250.3 | | 1,251.7 | | | 1,253.6 | | |
| Basic earnings per share (in euros) | 2.22 | | 7.41 | | | 9.82 | | |
| Reconciling items per share (in euros) | 0.78 | | (4.60) | | | (3.96) | | |
| Business earnings per share (in euros) | 3.00 | | 2.81 | | | 5.86 | | |
(a)Includes amortization expense related to accounting for business combinations: €729 million in the six months ended June 30, 2021; €839 million in the six months ended June 30, 2020; and €1,592 million in the year ended December 31, 2020.
(b)This line mainly includes impairment losses related to in-house and partnered R&D programs within the Specialty Care and Vaccines GBUs, and for the six months ended June 30, 2020 to the discontinuation of certain R&D programs and collaboration agreements in Diabetes in line with the strategy announced by Sanofi in December 2019.
(c)For the six months ended June 30, 2020, this line mainly comprises the gain on the sale of operations related to the Seprafilm® product to Baxter.
(d)This line includes, for the six months ended June 30, 2020, the gain on the sale of (i) 13 million shares of Regeneron common stock in the registered public offering and (ii) the 9.8 million shares repurchased by Regeneron, but does not include the gain arising from the remeasurement of the 400,000 retained shares at market value as of May 29, 2020.
(e)“Business net income” no longer includes Sanofi’s share of profits from its equity investment in Regeneron (see Note D.1. to our consolidated financial statements for the year ended December 31, 2020), which is reflected on this line.
The most significant reconciling items between “Business net income” and Net income attributable to equity holders of Sanofi relate to (i) the purchase accounting effects of our acquisitions and business combinations, particularly the amortization and impairment of intangible assets (other than software and other rights of an industrial or operational nature) and (ii) the impacts of restructurings or transactions regarded as non-recurring, where the amounts involved are particularly significant. We believe that excluding those impacts enhances an investor’s understanding of our underlying economic performance, because it gives a better representation of our recurring operating performance.
We believe that eliminating charges related to the purchase accounting effect of our acquisitions and business combinations (particularly amortization and impairment of some intangible assets) enhances comparability of our ongoing operating performance relative to our peers. Those intangible assets (principally rights relating to research, development and commercialization of products) are accounted for in accordance with IFRS 3 (Business Combinations) and hence may be subject to remeasurement. Such remeasurements are not made other than in a business combination.
We also believe that eliminating the other effects of business combinations (such as the incremental cost of sales arising from the workdown of acquired inventories remeasured at fair value in business combinations) gives a better understanding of our recurring operating performance.
Eliminating restructuring costs and similar items enhances comparability with our peers because those costs are incurred in connection with reorganization and transformation processes intended to optimize our operations.
| | | | | |
2021 Half-Year Financial Report - Sanofi | 47 |
Finally, we believe that eliminating the effects of transactions that we regard as non-recurring and that involve particularly significant amounts (such as major gains and losses on disposals, and costs and provisions associated with major litigation and other major non-recurring items) improves comparability from one period to the next.
We remind investors, however, that “Business net income” should not be considered in isolation from, or as a substitute for, Net income attributable to equity holders of Sanofi reported in accordance with IFRS. In addition, we strongly encourage investors and potential investors not to rely on any single financial measure but to review our financial statements, including the notes thereto, carefully and in their entirety.
We compensate for the material limitations described above by using “Business net income” only to supplement our IFRS financial reporting and by ensuring that our disclosures provide sufficient information for a full understanding of all adjustments included in “Business net income”.
Because our “Business net income” and “Business EPS” are not standardized measures, they may not be directly comparable with the non-GAAP financial measures of other companies using the same or similar non-GAAP financial measures.
| | | | | |
| 48 | 2021 Half-Year Financial Report - Sanofi |
Net sales for the first half of 2021 amounted to €17,335 million, 0.9% higher than in the first half of 2020. Exchange rate fluctuations had a negative effect of 6.3 percentage points overall, due mainly to adverse trends in the euro exchange rate against the US dollar, Brazilian real and Japanese yen. At constant exchange rates (CER, see definition below), net sales rose by 7.2%, driven mainly by strong performances for Dupixent®. The year-on-year increase also reflects good performances by the Rare Diseases and Oncology franchises, and also from Vaccines as sales of Meningitis Vaccines picked up strongly relative to 2020. Sales of Consumer Healthcare products were up slightly year-on-year, with robust growth for the Digestive Wellness category more than offsetting lower sales in the Cough, Cold and Flu category.
Reconciliation of net sales to net sales at constant exchange rates
| | | | | | | | | | | |
| (€ million) | June 30, 2021 (6 months) | June 30, 2020 (6 months) | Change |
| Net sales | 17,335 | | 17,180 | | +0.9 | % |
| Effect of exchange rates | 1,075 | | | |
| Net sales at constant exchange rates | 18,410 | | 17,180 | | +7.2 | % |
When we refer to changes in our net sales at constant exchange rates (CER), that means that we have excluded the effect of exchange rates by recalculating net sales for the relevant period using the exchange rates that were used for the previous period.
When we refer to changes in our net sales on a constant structure (CS) basis, that means that we eliminate the effect of changes in structure by restating the net sales for the previous period as follows:
▪by including sales generated by entities or product rights acquired in the current period for a portion of the previous period equal to the portion of the current period during which we owned them, based on historical sales information we receive from the party from whom we make the acquisition;
▪similarly, by excluding sales for a portion of the previous period when we have sold an entity or rights to a product in the current period; and
▪for a change in consolidation method, by recalculating the previous period on the basis of the method used for the current period.
To facilitate analysis and comparisons with prior periods, some figures are given at constant exchange rates and on a constant structure basis (CER/CS).
| | |
| C.3.1. NET SALES BY GLOBAL BUSINESS UNIT (GBU) |
Our net sales comprise the net sales generated by our Pharmaceuticals, Vaccines and Consumer Healthcare segments. The table below also presents net sales by Global Business Unit (GBU).
| | | | | | | | | | | | | | | | | |
| (€ million) | June 30, 2021 (6 months) | June 30, 2020 (6 months) | | Change on
a reported
basis | Change at
constant
exchange rates |
| Specialty Care GBU | 5,978 | | 5,402 | | | +10.7 | % | +18.7 | % |
| General Medicines GBU | 7,218 | | 7,618 | | | -5.3 | % | -0.1 | % |
| Pharmaceuticals segment | 13,196 | | 13,020 | | | +1.4 | % | +7.7 | % |
| Vaccines GBU/segment | 1,937 | | 1,836 | | | +5.5 | % | +10.8 | % |
| Consumer Healthcare GBU/segment | 2,202 | | 2,324 | | | -5.2 | % | +1.2 | % |
| Total net sales | 17,335 | | 17,180 | | | +0.9 | % | +7.2 | % |
| | |
| C.3.2. NET SALES BY GEOGRAPHICAL REGION AND PRODUCT |
Following our February 2021 Capital Markets Day, we have changed how we present our sales within the General Medicines and Consumer Healthcare GBUs. We have introduced a separate line for “Industrial sales”, which essentially comprises sales of active ingredients and semi-finished products to third parties. Such sales were previously reported within the Diabetes and Cardiovascular & Established Prescription Products franchises on the line for the relevant product, and on the “Generics” line. For the Consumer Healthcare GBU, we have adopted a more granular presentation by introducing new sub-categories that reflect consumer trends and the strengths and opportunities of our portfolio.
| | | | | |
2021 Half-Year Financial Report - Sanofi | 49 |
For comparative purposes, the 2020 figures used to compute the year-on-year movements presented below have been adjusted to reflect those changes.
| | | | | | | | | | | | | | | | | | | | | | | | | | | | | |
| (€ million) | Net sales | Change
(CER) | Change
(reported) | United
States | Change
(CER) | Europe | Change
(CER) | Rest of
the World | Change
(CER) |
Dupixent® | 2,290 | | +51.4 | % | +40.1 | % | 1,740 | | +45.5 | % | 289 | | +65.5 | % | 261 | | +86.7 | % |
Aubagio® | 994 | | -0.7 | % | -6.9 | % | 666 | | -5.9 | % | 264 | | +14.3 | % | 64 | | +8.1 | % |
Lemtrada® | 43 | | -30.9 | % | -36.8 | % | 20 | | -37.1 | % | 11 | | -38.9 | % | 12 | | -6.7 | % |
Kevzara® | 113 | | +1.7 | % | -3.4 | % | 50 | | -14.1 | % | 41 | | +10.8 | % | 22 | | +43.8 | % |
| Total Neurology & Immunology | 1,150 | | -2.2 | % | -8.2 | % | 736 | | -7.8 | % | 316 | | +10.5 | % | 98 | | +11.8 | % |
Cerezyme® | 343 | | +1.4 | % | -6.8 | % | 83 | | +1.1 | % | 124 | | -0.8 | % | 136 | | +3.3 | % |
Cerdelga® | 123 | | +13.9 | % | +7.0 | % | 64 | | +11.1 | % | 51 | | +13.3 | % | 8 | | +42.9 | % |
Myozyme®/ Lumizyme® | 483 | | +7.4 | % | +2.3 | % | 180 | | +10.7 | % | 200 | | +3.6 | % | 103 | | +8.9 | % |
Fabrazyme® | 412 | | +6.8 | % | -0.2 | % | 190 | | +1.0 | % | 111 | | +13.3 | % | 111 | | +11.9 | % |
Aldurazyme® | 123 | | +8.2 | % | +0.8 | % | 26 | | +7.7 | % | 43 | | +10.3 | % | 54 | | +7.0 | % |
| Total Rare Diseases | 1,529 | | +6.5 | % | -0.2 | % | 543 | | +5.5 | % | 530 | | +6.0 | % | 456 | | +8.3 | % |
Jevtana® | 240 | | -5.9 | % | -11.4 | % | 119 | | +5.7 | % | 75 | | -18.5 | % | 46 | | -10.7 | % |
Fasturtec® | 74 | | +8.3 | % | +2.8 | % | 43 | | +4.4 | % | 22 | | +10.0 | % | 9 | | +28.6 | % |
Libtayo® | 59 | | +122.2 | % | +118.5 | % | — | | — | | 48 | | +100.0 | % | 11 | | +300.0 | % |
Sarclisa® | 74 | | +1460.0 | % | +1380.0 | % | 28 | | +500.0 | % | 27 | | — | | 19 | | — | |
| Total Oncology | 447 | | +25.6 | % | +19.2 | % | 190 | | +19.7 | % | 172 | | +26.5 | % | 85 | | +39.4 | % |
Alprolix® | 200 | | -4.0 | % | -11.5 | % | 162 | | +9.9 | % | — | | — | | 38 | | -38.5 | % |
Eloctate® | 278 | | -8.5 | % | -15.8 | % | 216 | | +0.9 | % | — | | — | | 62 | | -31.3 | % |
Cablivi® | 84 | | +71.2 | % | +61.5 | % | 43 | | +42.4 | % | 40 | | +110.5 | % | 1 | | — | |
| Total Rare Blood Disorders | 562 | | — | % | -7.6 | % | 421 | | +7.5 | % | 40 | | +110.5 | % | 101 | | -32.9 | % |
| Specialty Care GBU | 5,978 | | +18.7 | % | +10.7 | % | 3,630 | | +18.7 | % | 1,347 | | +20.7 | % | 1,001 | | +16.3 | % |
Lantus® | 1,289 | | -3.2 | % | -9.0 | % | 429 | | -0.8 | % | 246 | | -12.1 | % | 614 | | -1.2 | % |
Toujeo® | 500 | | +6.5 | % | +0.8 | % | 120 | | -7.7 | % | 195 | | +3.7 | % | 185 | | +21.8 | % |
Soliqua® / Suliqua® | 90 | | +29.3 | % | +20.0 | % | 53 | | +23.4 | % | 14 | | +27.3 | % | 23 | | +47.1 | % |
| Other Diabetes | 442 | | -2.3 | % | -7.9 | % | 87 | | -5.0 | % | 130 | | -3.7 | % | 225 | | -0.4 | % |
| Total Diabetes | 2,321 | | -0.1 | % | -6.0 | % | 689 | | -1.2 | % | 585 | | -4.7 | % | 1,047 | | +3.2 | % |
Lovenox® | 768 | | +27.6 | % | +21.9 | % | 15 | | +13.3 | % | 368 | | +24.5 | % | 385 | | +31.2 | % |
Plavix® | 485 | | -1.2 | % | -4.5 | % | 5 | | +25.0 | % | 60 | | -7.6 | % | 420 | | -0.5 | % |
Multaq® | 151 | | +6.5 | % | -1.9 | % | 132 | | +6.7 | % | 12 | | — | % | 7 | | +14.3 | % |
Praluent® | 104 | | -27.4 | % | -28.8 | % | 5 | | -91.2 | % | 75 | | +33.9 | % | 24 | | +13.6 | % |
Aprovel® | 200 | | -32.7 | % | -34.6 | % | 3 | | -75.0 | % | 47 | | -11.3 | % | 150 | | -35.3 | % |
Mozobil® | 110 | | +17.2 | % | +11.1 | % | 60 | | +12.1 | % | 29 | | +11.5 | % | 21 | | +46.7 | % |
Thymoglobulin® | 172 | | +22.8 | % | +15.4 | % | 101 | | +25.0 | % | 16 | | +23.1 | % | 55 | | +18.8 | % |
| Generics | 394 | | +4.5 | % | -6.4 | % | 70 | | +2.7 | % | 4 | | — | % | 320 | | +5.0 | % |
| Other Prescription Products | 2,133 | | -5.4 | % | -9.8 | % | 158 | | -15.9 | % | 697 | | -12.1 | % | 1,278 | | +0.1 | % |
| Total Cardiovascular & Established Prescription Products | 4,517 | | -0.4 | % | -5.5 | % | 549 | | -9.2 | % | 1,308 | | -0.7 | % | 2,660 | | +1.8 | % |
| Industrial Sales | 380 | | +5.1 | % | +2.2 | % | 24 | | -15.6 | % | 335 | | +17.1 | % | 21 | | -54.2 | % |
| General Medicines GBU | 7,218 | | -0.1 | % | -5.3 | % | 1,262 | | -5.1 | % | 2,228 | | +0.5 | % | 3,728 | | +1.5 | % |
| Total Pharmaceuticals | 13,196 | | +7.7 | % | +1.4 | % | 4,892 | | +11.4 | % | 3,575 | | +7.3 | % | 4,729 | | +4.4 | % |
| Polio / Pertussis / Hib vaccines | 1,053 | | +3.8 | % | -0.6 | % | 241 | | +43.7 | % | 145 | | -9.9 | % | 667 | | -3.4 | % |
| Adult Booster vaccines | 206 | | +11.9 | % | +6.7 | % | 113 | | +28.1 | % | 66 | | -10.8 | % | 27 | | +17.4 | % |
| Meningitis / Pneumonia vaccines | 314 | | +53.2 | % | +42.7 | % | 207 | | +76.6 | % | 1 | | — | % | 106 | | +20.9 | % |
| Influenza vaccines | 196 | | +14.0 | % | +9.5 | % | — | | -100.0 | % | 18 | | +260.0 | % | 178 | | +15.5 | % |
| Travel and Other Endemics vaccines | 133 | | -9.7 | % | -13.6 | % | 36 | | -7.0 | % | 13 | | -65.8 | % | 84 | | +17.8 | % |
| Total Vaccines | 1,937 | | +10.8 | % | +5.5 | % | 626 | | +39.1 | % | 244 | | -12.8 | % | 1,067 | | +3.9 | % |
| Allergy | 343 | | -2.6 | % | -10.0 | % | 200 | | +2.8 | % | 34 | | -5.6 | % | 109 | | -10.7 | % |
| Cough, Cold and Flu | 110 | | -46.0 | % | -47.9 | % | — | | — | % | 46 | | -56.9 | % | 64 | | -34.3 | % |
| Pain | 528 | | +2.4 | % | -3.8 | % | 91 | | +2.0 | % | 250 | | +3.3 | % | 187 | | +1.4 | % |
| Digestive Wellness | 573 | | +24.6 | % | +16.7 | % | 61 | | +86.1 | % | 200 | | +5.2 | % | 312 | | +30.4 | % |
| Physical Wellness | 159 | | -4.6 | % | -8.6 | % | — | | — | % | 13 | | +8.3 | % | 146 | | -5.6 | % |
| Mental Wellness | 107 | | +21.3 | % | +13.8 | % | 23 | | +8.7 | % | 55 | | +21.7 | % | 29 | | +32.0 | % |
| Personal Care | 252 | | +1.5 | % | -6.7 | % | 191 | | +0.5 | % | 2 | | — | % | 59 | | +5.0 | % |
| Other | 130 | | -10.4 | % | -15.6 | % | 4 | | — | % | 53 | | -30.3 | % | 73 | | +9.5 | % |
| Total Consumer Healthcare | 2,202 | | +1.2 | % | -5.2 | % | 570 | | +7.2 | % | 653 | | -8.1 | % | 979 | | +4.2 | % |
| Total Sanofi | 17,335 | | +7.2 | % | +0.9 | % | 6,088 | | +13.3 | % | 4,472 | | +3.4 | % | 6,775 | | +4.3 | % |
| | | | | |
| 50 | 2021 Half-Year Financial Report - Sanofi |
| | |
| C.3.3. PHARMACEUTICALS SEGMENT |
In the first half of 2021, net sales for our Pharmaceuticals segment reached €13,196 million, up 1.4% on a reported basis and 7.7% at constant exchange rates.
The year-on-year rise of €176 million builds in negative exchange rate effects of €829 million, and the following effects at constant exchange rates:
▪positive performances from Dupixent® (+€840 million), the Rare Diseases franchise (+€100 million), the Oncology franchise
(+€96 million), and Industrial Sales (+€19 million); and
▪negative performances from the Neurology & Immunology franchise (-€27 million), the Cardiovascular & Established Prescription Products franchise (-€20 million) and the Diabetes franchise (-€3 million).
Comments on the performances of our major Pharmaceuticals segment products are provided below.
DUPIXENT®
Dupixent® (developed in collaboration with Regeneron) generated net sales of €2,290 million in the first half of 2021, up 40.1% on a reported basis and 51.4% at constant exchange rates. In the United States, sales of Dupixent® reached €1,740 million in the first half of 2021, driven by continuing strong demand in the treatment of atopic dermatitis in adults, adolescents and children aged 6 to 11 years, and by ongoing uptake in asthma and nasal polyps. In Europe, the product’s net sales for the first half of 2021 totaled €289 million, up 65.5% CER, driven by further growth in atopic dermatitis in key markets and launches in asthma in new European markets. In the Rest of the World region, Dupixent® posted net sales of €261 million (+86.7% CER), including €128 million in Japan. In China, Dupixent® was approved in June 2020 for the treatment of moderate-to-severe atopic dermatitis in adults, and has been included in the National Drug Reimbursement List (NDRL) since March 2021. The product generated net sales of €18 million in China in the first half of 2021. By the end of the first half of 2021, Dupixent® had been launched in 53 countries.
NEUROLOGY AND IMMUNOLOGY
In the first half of 2021, the Neurology and Immunology franchise reported net sales of €1,150 million, down 8.2% on a reported basis and 2.2% CER, mainly on lower sales of Lemtrada®.
Net sales of Aubagio® amounted to €994 million, down 0.7% CER. This reflected a decrease in sales in the United States (-5.9% CER at €666 million) due to increased competition, though the effect was partly offset by the performance in Europe (+14.3% CER at €264 million), driven by increased demand following clinical trials and by price increases. In June 2021, the European Commission approved Aubagio® for the treatment of pediatric patients aged 10 to 17 years with relapsing-remitting multiple sclerosis (MS).
First-half net sales of Lemtrada® were down 30.9% CER at €43 million, on lower sales in the United States (-37.1% CER at €20 million) and in Europe (-38.9% CER at €11 million), primarily due to the COVID-19 pandemic, which has led to a decrease in infused immune reconstitution therapies such as Lemtrada®.
First-half net sales of Kevzara® (developed in collaboration with Regeneron) were €113 million (+1.7% CER). Growth in net sales of the product in Europe (+10.8% CER at €41 million) and the Rest of the World region (+43.8% CER at €22 million) more than compensated for a decrease in US sales (-14.1% CER at €50 million) following the recent strategic decision to reduce promotional efforts.
RARE DISEASES
In the first half of 2021, net sales of the Rare Diseases franchise were €1,529 million, down 0.2% on a reported basis but up 6.5% at constant exchange rates. Sales rose across all three geographies: by 6.0% CER to €530 million in Europe, by 5.5% CER to €543 million in the United States, and by 8.3% CER to €456 million in the Rest of the World region.
Net sales of Cerezyme® rose slightly in the first half of 2021 (+1.4% CER at €343 million), helped by a solid performance in the Rest of the World region (+3.3% CER at €136 million). Sales of Cerdelga® increased sharply (+13.9% CER at €123 million), driven by new patient accruals in the three geographic regions. Overall, sales for the Gaucher disease franchise (Cerezyme® and Cerdelga®) were up 4.3% CER at €466 million.
Net sales of Myozyme® / Lumizyme® for the treatment of Pompe disease increased by 7.4% CER in the first half of 2021 to €483 million, supported by sales growth in all three geographies, especially the United States (+10.7% CER at €180 million) and the Rest of the World region (+8.9% CER at €103 million), supported primarily by new patient accruals and improved treatment compliance.
In the first half of 2021, net sales of the Fabry disease treatment Fabrazyme® amounted to €412 million, up 6.8% CER, driven by Europe (+13.3% CER at €111 million) and the Rest of the World region (+11.9% CER at €111 million). Sales in the United States were relatively stable year-on-year, rising by 1.0% CER to €190 million.
| | | | | |
2021 Half-Year Financial Report - Sanofi | 51 |
ONCOLOGY
First-half net sales for the Oncology franchise were up 19.2% on a reported basis and by 25.6% at constant exchange rates at €447 million, as launches of Sarclisa® and Libtayo® more than offset the effects of generic competition for Jevtana® in Europe.
Jevtana® reported net sales of €240 million in the first half of 2021, down 5.9% CER, following the launch of competing generics in some European countries after the March 2021 loss of regulatory exclusivity in Europe, where sales were down 18.5% CER at €75 million. Sales of the product also decreased in the Rest of the World region (-10.7% CER at €46 million). In the United States, sales rose by 5.7% CER to €119 million. Between May and July 2020, Sanofi filed patent infringement suits against all generic filers on Jevtana® under Hatch-Waxman in the U.S. District Court for the District of Delaware asserting two method of use patents (US 10,583,110 and US 10, 716,777), both of which expire in October 2030. Sanofi has reached settlement agreements with some of the defendants and the suit against the remaining defendants currently stayed.
Sales of Libtayo® (developed in collaboration with Regeneron) outside the United States amounted to €59 million (+122.2% CER) in the first half of 2021, driven by increased demand in the treatment of metastatic cutaneous squamous cell carcinoma (CSCC) and by the launch of the product for that indication in new countries. In Europe, Libtayo® posted net sales of €48 million (+100.0% CER), and was approved by the European Commission as the first immunotherapy indicated for patients with advanced basal cell carcinoma and as first-line treatment of patients with advanced non-small cell lung cancer (NSCLC) with ≥50% PD-L1 expression. In the United States, where Libtayo® was also approved in those two new indications during the period, sales of the product are consolidated by Regeneron under the terms of our alliance with Regeneron (see Note C.1. “Alliance arrangements with Regeneron Pharmaceuticals, Inc. (Regeneron)” to our consolidated financial statements for the year ended December 31, 2020, at Item 18 of our 2020 Annual Report on Form 20-F).
Sarclisa® generated net sales of €74 million in the first half of 2021, driven by product launches in new countries. Sales reached €28 million in the United States, €27 million in Europe, and €19 million in the Rest of the World region driven by strong performance in Japan. Sarclisa®, initially approved in 2020 for the treatment of adults with relapsed or refractory multiple myeloma (RRMM) who have received at least two prior therapies, was also approved by the United States FDA and the European Commission in the first half of 2021 in combination with carfilzomib and dexamethasone, for adult patients with RRMM.
RARE BLOOD DISORDERS
In the first half of 2021, the Rare Blood Disorders franchise generated net sales of €562 million, down 7.6% on a reported basis but unchanged at constant exchange rates. Excluding industrial sales of Alprolix® and Eloctate® to Swedish Orphan Biovitrum AB (Sobi), which commercializes the two products in Europe, Russia, the Middle East and some North African countries, sales for the Rare Blood Disorders franchise rose by 11.1% CER in the first half of 2021, boosted by the performances of Cablivi® and Alprolix®. As previously announced, industrial sales of Alprolix® and Eloctate® to Sobi are expected to be significantly lower in 2021 than in 2020, due to a change in the supply agreement.
Eloctate®, indicated in the treatment of hemophilia A, generated net sales of €278 million in the first half of 2021, down 8.5% at constant exchange rates. Excluding industrial sales to Sobi, net sales of Eloctate® were up 1.7% CER at €276 million. In the United States, sales were €216 million (+0.9% CER). In the Rest of the World region, Eloctate® sales (excluding industrial sales to Sobi) were up 4.9% CER at €60 million.
In the first half of 2021, sales of Alprolix®, indicated in the treatment of hemophilia B, amounted to €200 million, down 4.0% CER. Excluding industrial sales to Sobi, net sales of Alprolix® were up 9.3% CER at €195 million. Growth was driven by the United States, where sales of the product were up 9.9% CER at €162 million; this reflects mainly patient switches from standard half-life factors and prophylaxis conversion. In the Rest of the World region, Alprolix® sales (excluding industrial sales to Sobi) advanced by 6.1% CER to €33 million, of which €23 million (+4.2% CER) was generated in Japan.
Cablivi®, a treatment for adults with the rare blood disorder acquired thrombotic thrombocytopenic purpura (aTTP), posted net sales of €84 million in the first half of 2021 (+71.2% CER), including €43 million in the United States (+42.4% CER) due to growing awareness of the disease and treatment, and new recommendations on aTTP from the International Society on Thrombosis and Haemostasis (ISTH). In Europe, sales reached €40 million (+110.5%), propelled by launches in new countries.
In the first half of 2021, net sales of the General Medicines GBU were virtually unchanged year-on-year at €7,218 million. Following the February 2021 Capital Markets Day, Sanofi decided to prioritize core products within its General Medicines portfolio that have differentiated or established profiles and significant opportunity for growth in key markets; these include Toujeo®, Soliqua®, Praluent®, Multaq®, Lovenox® and Plavix®. Sales of core products in the first half of 2021 were up 7.9% CER at €2,902 million, driven by a good performance from Lovenox®. Non-core products posted sales of €3,936 million, down 5.6% CER, reflecting a streamlining of the portfolio and lower sales of Lantus® and Aprovel®/Avapro®. First-half industrial sales, mainly comprising sales of active ingredients and semi-finished products to third parties, rose by 5.1% CER to €380 million. Excluding portfolio streamlining, first-half General Medicines GBU sales were up 1.2% CER.
DIABETES
In the first half of 2021, global Diabetes sales were €2,321 million, down 6.0% on a reported basis and 0.1% at constant exchange rates, as lower sales of Lantus® were partly offset by the performances of Toujeo® and Soliqua®. Sales in the Rest of the World region were up 3.2% CER at €1,047 million, propelled by the launch of Toujeo® in China and the performance of Soliqua®. Diabetes
| | | | | |
| 52 | 2021 Half-Year Financial Report - Sanofi |
net sales in the United States totaled €689 million, down 1.2% CER, reflecting an ongoing decline in average net prices of insulin glargines in the territory. Over the same period, European sales were down 4.7% CER at €585 million on lower sales of Lantus®.
Toujeo® posted 2021 first-half net sales of €500 million, up 6.5% CER, boosted by strong performances in the Rest of the World region (+21.8% CER at €185 million) driven by the product’s launch in China and Europe (+3.7% CER at €195 million), as patients switched from Lantus® to Toujeo®. Sales in the United States were down 7.7% CER at €120 million, mainly due to net price decreases and in spite of continued volume growth.
Net sales of Lantus® in the first half of 2021 were down 3.2% CER at €1,289 million. In the United States, net sales of the product were down slightly (-0.8% CER at €429 million), as higher volumes partly offset lower average net selling prices that are in turn tending to stabilize. In Europe, net sales of Lantus® amounted to €246 million (-12.1% CER), reflecting competition from biosimilars and patients switching to Toujeo®. In the Rest of the World region, first-half net sales of Lantus® were down 1.2% CER at €614 million, largely on lower sales in China as patients switched to Toujeo®.
In the first half of 2021, net sales of Soliqua® 100/33/Suliqua® (insulin glargine 100 units/ml and lixisenatide 33 mcg/ml injectable) rose by 29.3% CER to €90 million. Sales of the product were higher in all geographies, reaching €53 million in the United States (+23.4% CER); €23 million in the Rest of the World region (+47.1% CER), where the product was launched in a number of countries; and €14 million in Europe (+27.3% CER).
CARDIOVASCULAR & ESTABLISHED PRESCRIPTION PRODUCTS
Net sales of the Cardiovascular & Established Prescription Products franchise for the first half of 2021 were €4,517 million, down 5.5% on a reported basis and 0.4% at constant exchange rates. Key factors included the impact of divestments and lower sales of Aprovel®/Avapro®, which were only partly offset by strong growth in sales of Lovenox® across all geographies.
Net sales of Lovenox® reached €768 million, up 27.6% CER, driven by the Rest of the World region (+31.2% CER at €385 million) and Europe (24.5% CER at €368 million): increased demand as a result of recent recommendations on the use of low molecular weight heparins in patients hospitalized with COVID-19 more than offset the effect of competition from biosimilars.
In the first half of 2021, net sales of Plavix® were €485 million, down 1.2% CER, mainly due to lower sales in Europe (-7.6% CER at €60 million) and Japan (-27.6% CER at €39 million) due to lower prices and competition from generics. In China, first-half net sales of Plavix® were up 3.9% CER at €211 million.
Net sales of Aprovel®/Avapro® for the first half of 2021 were €200 million, down 32.7% CER, primarily as a result of temporary supply shortages. Sales in China were down 28.4% CER at €78 million due to net price adjustments related to the Value Based Procurement (VBP) program, as previously announced.
In the first half of 2021, net sales of Praluent® were €104 million, down 27.4% CER, on lower sales in the United States following the restructuring of the alliance with Regeneron. Since April 1, 2020, Sanofi has sole responsibility for Praluent® outside the United States, while Regeneron has sole responsibility for Praluent® in the United States (see Note C.1. “Alliance arrangements with Regeneron Pharmaceuticals, Inc. (Regeneron)” to our consolidated financial statements for the year ended December 31, 2020, at Item 18 of our 2020 Annual Report on Form 20-F). That effect was partly offset by stronger sales in the Rest of the World region (+13.6% CER at €24 million), due largely to the product’s launch in China in April 2020; and in Europe, where Praluent® sales rose by 33.9% CER to €75 million. Praluent® was relaunched in Germany at the start of April 2021.
Net sales of Multaq® totaled €151 million in the first half of 2021, up 6.5% CER, mainly on a recovery in US sales (€132 million, +6.7% CER), supported by increased medical consultations and demand for antiarrhythmic drugs with the recovery from the COVID-19 pandemic.
| | |
| C.3.4. VACCINES SEGMENT/GBU |
In the first half of 2021, the Vaccines segment posted net sales of €1,937 million, up 5.5% on a reported basis and 10.8% CER. A recovery in sales of Menactra® and Adult Booster Vaccines relative to the first half of 2020, coupled with good performances from Polio/Pertussis/Hib Vaccines in the United States and Influenza Vaccines in the Rest of the World region, more than offset the adverse impact of COVID-19 on Travel Vaccines sales.
Net sales of Polio/Pertussis/Hib vaccines in the first half of 2021 were €1,053 million, up 3.8% CER, due mainly to stronger sales in the United States (+43.7% CER at €241 million), reflecting a favorable pattern of CDC orders for Pentacel® and a soft comparative in the first half of 2020 due to the COVID-19 pandemic. Conversely, the franchise saw sales decrease in the Rest of the World region (-3.4% CER at €667 million), especially in China (-23.0% CER at €183 million), and also in Europe (-9.9% CER at €145 million). VaxelisTM, a vaccine co-developed in an alliance between Sanofi and Merck, has been available in the United States since June 2021. VaxelisTM is the first and only hexavalent vaccine approved in the United States to protect infants and children against six diseases: diphtheria, tetanus, pertussis, polio, hepatitis B, and invasive diseases caused by Hemophilus Influenzae type b. Finished product sales of VaxelisTM are consolidated by the MSP Vaccine Company joint venture. As Vaxelis™ is expected to partially replace current Pentacel® sales in the United States, Polio/Pertussis/Hib sales in that country are expected to decrease going forward.
Sales of Meningitis/Pneumonia vaccines in the first half of 2021 rose by 53.2% CER to €314 million, driven by a recovery in sales of Menactra® in the United States (+76.6% CER at €207 million) relative to 2020, and also by sales growth in the Rest of the World region (+20.9% CER at €106 million) due largely to a successful tender in Brazil. MenQuadfi®, the only quadrivalent meningococcal vaccine approved by the FDA for people aged 2 years and older, was launched in the United States in March 2021.
| | | | | |
2021 Half-Year Financial Report - Sanofi | 53 |
Net sales of Adult Booster vaccines for the period were up 11.9% CER at €206 million on a recovery in sales relative to 2020 in the United States (+28.1% CER at €113 million) and the Rest of the World region (+17.4% CER at €27 million); this more than offset lower sales in Europe (-10.8% CER at €66 million), mainly reflecting the negative effect of COVID-19.
First-half sales of Influenza vaccines were up year-on-year (+14.0% CER at €196 million), reflecting sales growth in the Rest of the World zone (+15.5% CER at €178 million) due to strong demand in the southern hemisphere.
First-half net sales of Travel and Other Endemics vaccines were €133 million, down 9.7% CER, reflecting travel restrictions associated with the Covid-19 pandemic.
| | |
| C.3.5. CONSUMER HEALTHCARE SEGMENT/GBU |
Net sales from the Consumer Healthcare (CHC) segment for the first half of 2021 were down 5.2% on a reported basis but up 1.2% at constant exchange rates, at €2,202 million. Strong sales growth for the Digestive Wellness category (+24.6% CER at €573 million) more than offset lower sales in the Cough, Cold and Flu category (-46.0% CER at €110 million) associated with social distancing and mask-wearing, and with the effects of a high base for comparison in the first half of 2020 reflecting inventory build-ups related to the COVID-19 pandemic.
In the United States, Consumer Healthcare first-half net sales increased by 7.2% CER to €570 million, reflecting growth across all categories and especially in Digestive Wellness (+86.1% CER at €61 million) mainly due to the performance of Dulcolax®, as well as in the Allergy category (+2.8% CER at €200 million).
In Europe, Consumer Healthcare net sales were down 8.1% CER in the first half of 2021 at €653 million, mainly as a result of weak demand for Cough, Cold and Flu category products associated with social distancing and mask-wearing, and with the effects of a high base for comparison in the first half of 2020 reflecting inventory build-ups related to the COVID-19 pandemic. First-half sales also reflect the impact of divestments of non-core products.
In the Rest of the World region, first-half Consumer Healthcare net sales increased by 4.2% CER to €979 million, boosted by strong growth for the Digestive Wellness category (+30.4% CER at €312 million), especially from Enterogermina®, Essentiale® and Buscopan®; this more than offset lower sales in the Cough, Cold and Flu category (-34.3% CER at €64 million) and the Allergy category (-10.7% CER at €109 million).
As part of the efforts to reduce the complexity of our Consumer Healthcare portfolio and accelerate our growth trajectory, Sanofi signed an agreement with STADA in June 2021 to divest 16 Consumer Healthcare products commercialized in Europe. A further agreement was signed with Hypera S.A. in July 2021 to divest eight products commercialized in Latin America.
| | |
| C.3.6. NET SALES BY GEOGRAPHICAL REGION |
| | | | | | | | | | | | | | | | | |
| (€ million) | June 30, 2021 (6 months) | June 30, 2020 (6 months) | | Change on
a reported
basis | Change at
constant
exchange rates |
| United States | 6,088 | | 5,880 | | | +3.5 | % | +13.3 | % |
| Europe | 4,472 | | 4,345 | | | +2.9 | % | +3.4 | % |
| Rest of the World | 6,775 | | 6,955 | | | -2.6 | % | +4.3 | % |
| of which China | 1,380 | | 1,307 | | | +5.6 | % | +6.3 | % |
| of which Japan | 830 | | 926 | | | -10.4 | % | -2.6 | % |
| of which Brazil | 453 | | 460 | | | -1.5 | % | +17.4 | % |
| of which Russia | 300 | | 364 | | | -17.6 | % | -4.9 | % |
| Total net sales | 17,335 | | 17,180 | | | +0.9 | % | +7.2 | % |
In the first half of 2021, net sales in the United States reached €6,088 million, up 3.5% on a reported basis and 13.3% at constant exchange rates. In the Pharmaceuticals segment, this reflects a strong performance by Dupixent® (+45.5% CER at €1,740 million), which more than offset lower sales from the General Medicines GBU (-5.1% CER at €1,262 million). Net sales from the Vaccines segment for the period were sharply higher (+39.1% CER at €626 million), mainly due to increased sales of Meningitis and Polio/Pertussis/Hib vaccines.
In Europe, 2021 first-half net sales increased by 2.9% on a reported basis and 3.4% at constant exchange rates, to €4,472 million. Strong sales growth for Dupixent®, combined with increased sales for all Specialty Care franchises and Lovenox® plus a rise in industrial sales, more than offset a decrease in sales for the Vaccines and Consumer Healthcare GBUs.
In the Rest of the World region, first-half net sales were down 2.6% on a reported basis, but rose by 4.3% to €6,775 million at constant exchange rates on solid performances from Dupixent®, Lovenox®, Vaccines and Consumer Healthcare. This more than compensated for reduced sales of Aprovel®/Avapro® and in Rare Blood Disorders. In China, net sales advanced by 6.3% CER to €1,380 million, as sales growth for Dupixent®, the Cardiovascular & Established Prescription Products franchise and the Consumer Healthcare GBU more than offset lower sales in Vaccines. In Japan, net sales were down 2.6% CER in the first half at €830 million on lower sales for the Cardiovascular & Established Prescription Products franchise (especially Plavix® and Aprovel®), for Consumer Healthcare products and Vaccines, though the effect was lessened by strong growth in sales of Dupixent® and Sarclisa®.
| | | | | |
| 54 | 2021 Half-Year Financial Report - Sanofi |
.
| | |
| C.4. OTHER INCOME STATEMENT ITEMS |
|
| C.4.1. OTHER REVENUES |
Other revenues increased by 3.8% to €596 million in the first half of 2021 (versus €574 million in the first half of 2020). This line item mainly comprises VaxServe sales of non-Sanofi products (€454 million, versus €471 million for the first half of 2020, within the Vaccines segment). This line item also includes revenues arising from the distribution of Eloctate® and Alprolix® (mainly in Europe) under Sanofi’s agreements with Swedish Orphan Biovitrum AB (Sobi).
Gross profit for the first half of 2021 was €12,390 million, versus €12,211 million for the first half of 2020, a rise of 1.5%. Gross margin was also higher, at 71.5% for the first half of 2021 compared with 71.1% for the first half of 2020.
In the Pharmaceuticals segment, gross margin for the first half of 2021 was up 0.6 of a percentage point at 75.0%, driven by positive effects from good performances in the Specialty Care GBU and industrial productivity gains.
In the Vaccines segment, gross margin for the first half of 2021 was down 2.7 percentage points at 59.1%, reflecting an unfavorable product mix effect and the destruction of vaccine inventories that had become date expired due to the COVID-19 pandemic.
In the Consumer Healthcare segment, gross margin for the first half of 2021 was 0.7 of a percentage point lower at 67.0%, although at constant exchange rates it was broadly unchanged year-on-year (down 0.2 of a percentage point).
| | |
| C.4.3. RESEARCH AND DEVELOPMENT EXPENSES |
Research and development expenses (R&D expenses) in the first half of 2021 totaled €2,663 million (versus €2,692 million in the first half of 2020). That represents 15.4% of net sales, compared with 15.7% in the first half of 2020. R&D expenses decreased by 1.1%, but rose by 2.7% at constant exchange rates as increased spend on priority development projects (Specialty Care, Vaccines, and recent acquisitions) was only partly offset by cost savings in other areas.
| | |
| C.4.4. SELLING AND GENERAL EXPENSES |
Selling and general expenses amounted to €4,530 million in the first half of 2021 (26.1% of net sales), versus €4,607 million in the first half of 2020 (26.8% of net sales), a reduction of 1.7%. However at constant exchange rates, selling and general expenses were up 3.6% year-on-year, as higher selling expenses in Specialty Care only partly offset the effects of global cost containment and operational excellence measures.
| | |
| C.4.5. OTHER OPERATING INCOME AND EXPENSES |
In the first half of 2021, Other operating income amounted to €409 million (versus €281 million in the first half of 2020), and Other operating expenses to €709 million (versus €693 million in the first half of 2020).
Overall, other operating income and expenses represented a net expense of €300 million in the first half of 2021, compared with a net expense of €412 million in the first half of 2020.
| | | | | | | | | | | |
| (€ million) | June 30, 2021 | June 30, 2020 | Change |
| Other operating income | 409 | | 281 | | +128 | |
| Other operating expenses | (709) | | (693) | | -16 | |
| Other operating income/(expenses), net | (300) | | (412) | | 112 | |
The overall positive change of €112 million reflects a payment of €119 million from Daiichi Sankyo related to the ending of a vaccines collaboration in Japan, plus higher gains on disposals as a result mainly of divestments of mature products (€156 million in the first half of 2021, versus €147 million in the first half of 2020).
This line item also reflects net expenses with our pharmaceutical alliance partners (€549 million in the first half of 2021, versus €433 million in the first half of 2020), which mainly include the share of profits/losses generated by the alliance with Regeneron under our collaboration agreement (see Note C.1. to our consolidated financial statements for the year ended December 31, 2020), mainly on sales of Dupixent®.
| | | | | |
2021 Half-Year Financial Report - Sanofi | 55 |
The table below sets forth the contribution from the Regeneron alliance to this line item:
| | | | | | | | | | | |
| (€ million) | June 30, 2021 (6 months) | June 30, 2020 (6 months) | December 31, 2020 (12 months) |
| Income & expense related to (profit)/loss sharing under the Monoclonal Antibody Alliance | (521) | | (341) | | (727) | |
| Additional share of profit paid by Regeneron towards development costs | 51 | | 35 | | 75 | |
| Reimbursement to Regeneron of selling expenses incurred | (116) | | (176) | | (349) | |
| Total: Monoclonal Antibody Alliance | (586) | | (482) | | (1,001) | |
| Immuno-Oncology Alliance | 37 | | 44 | | 89 | |
| Other (mainly Zaltrap®) | (6) | | (8) | | (14) | |
| Other operating income/(expenses), net related to Regeneron Alliance | (555) | | (446) | | (926) | |
For 2020, this line item does not include the €157 million gain arising from the remeasurement at market value effective May 29, 2020 of the 400,000 Regeneron shares retained by Sanofi to support its ongoing collaboration with Regeneron. That amount is included within the “Other operating income and expenses” line in the segment results of the Pharmaceuticals segment (see Note B.20.1 to our condensed half-year consolidated financial statements).
| | |
| C.4.6. AMORTIZATION OF INTANGIBLE ASSETS |
Amortization charged against intangible assets in the first half of 2021 was €775 million, versus €883 million in the first half of 2020. This €108 million decrease was mainly due to a reduction in amortization expense generated by (i) intangible assets recognized in connection with the acquisitions of Aventis (€25 million, versus €68 million in the first half of 2020) and of Genzyme (€252 million, versus €295 million in the first half of 2020), as certain products reached the end of their life cycles; (ii) intangible assets recognized in connection with the acquisition of Bioverativ (€158 million, versus €170 million in the first half of 2020); and (iii) the impact of exchange rates on intangible assets denominated in currencies other than the euro.
| | |
| C.4.7. IMPAIRMENT OF INTANGIBLE ASSETS |
In the first half of 2021, this line item showed an impairment loss of €178 million (versus a net impairment loss of €323 million in the first half of 2020), most of which related to in-house and partnered development projects in Specialty Care and Vaccines.
In the first half of 2020, the net impairment loss related mainly to in-house and partnered development projects in Specialty Care and to the discontinuation of a number of R&D programs and collaboration agreements in Diabetes, in line with the strategic roadmap announced in December 2019.
| | |
| C.4.8. FAIR VALUE REMEASUREMENT OF CONTINGENT CONSIDERATION |
Fair value remeasurements of contingent consideration assets and liabilities relating to business combinations (recognized in accordance with IFRS 3) represented a net expense of €4 million in the first half of 2021 versus a net gain of €54 million in the first half of 2020.
This line item mainly comprises remeasurements of contingent consideration (i) payable to Bayer as a result of an acquisition made by Genzyme prior to the latter’s acquisition by Sanofi (gain of €20 million in the first half of 2021, versus a loss of €11 million in the first half of 2020); (ii) arising from the dissolution of the Sanofi Pasteur MSD joint venture (net loss of €52 million, versus a net loss of €6 million a year earlier) and (iii) payable to the former shareholders of True North Therapeutics as a result of the acquisition of that company by Bioverativ prior to Sanofi’s acquisition of Bioverativ in 2018 (gain of €27 million in the first half of 2021, versus gain of €71 million in the first half of 2020). See Note B.11. to our condensed half-year consolidated financial statements.
| | |
| C.4.9. RESTRUCTURING COSTS AND SIMILAR ITEMS |
Restructuring costs and similar items amounted to a charge of €327 million in the first half of 2021, compared with a charge of €758 million in the first half of 2020. Employee-related expenses were reduced year-on-year (€72 million, versus €642 million in the first half of 2020), reflecting separation costs booked following the June 2020 announcement of plans to adapt Sanofi’s organization (primarily in Europe) in line with the new “Play to Win” strategy. That effect was partly offset by increased costs relating to transformational projects, primarily those associated with the creation of the new standalone Consumer Healthcare entity and of EUROAPI (the new European market leader in active pharmaceutical ingredients) and with the implementation of Sanofi’s new digital strategy.
| | |
| C.4.10. OTHER GAINS AND LOSSES, AND LITIGATION |
No items were recorded within Other gains and losses, and litigation in the first half of 2021. This compares with a net gain of €136 million in the first half of 2020, mainly comprising a gain on the sale to Baxter of operations related to the Seprafilm® product..
| | | | | |
| 56 | 2021 Half-Year Financial Report - Sanofi |
Operating income amounted to €3,613 million in the first half of 2021, versus €10,108 million in the first half of 2020. The decrease was mainly due to the recognition during the first half of 2020 of the €7,382 million gain on the divestment of Sanofi’s equity investment in Regeneron following the transaction of May 29, 2020. Apart from that impact, operating income also increased year-on-year due to reductions in (i) impairment losses taken against intangible assets and (ii) reductions in restructuring costs and similar items compared with the first half of 2020.
| | |
| C.4.12. FINANCIAL INCOME AND EXPENSES |
Net financial expenses were €161 million for the first half of 2021, €6 million lower than the 2020 first-half figure of €167 million.
Our cost of net debt (see the definition in Section C.7., “Consolidated balance sheet” below) increased to €138 million in the first half of 2021, versus €100 million in the first half of 2020.
In addition, movements in net financial expenses included:
•the fair value remeasurement of certain financial assets (gain of €12 million in the first half of 2021, versus an expense of €13 million in the first half of 2020); and
•a reduction in the net interest cost of pension plans, mainly in France and Germany (€23 million, versus €32 million in the first half of 2020).
| | |
| C.4.13. INCOME BEFORE TAX AND INVESTMENTS ACCOUNTED FOR USING THE EQUITY METHOD |
Income before tax and investments accounted for using the equity method for the first half of 2021 was €3,452 million, versus €9,941 million for the first half of 2020.
| | |
| C.4.14. INCOME TAX EXPENSE |
Income tax expense totaled €682 million in the first half of 2021, versus €994 million in the first half of 2020, giving an effective tax rate (based on consolidated net income) of 0.2%, compared with 0.1% in the first half of 2020. The variation in income tax expense and effective tax rate was mainly due to tax effects on the gain on sale of Regeneron shares recognized in the first half of 2020 (€475 million). The year-on-year change is also related to the amortization and impairment of intangible assets (€230 million in the first half of 2021, versus €302 million in the first half of 2020) and to restructuring costs (€84 million in the first half of 2021, versus €232 million in the first half of 2020), as well as to tax effects relating to contingencies arising from business divestitures.
The effective tax rate on our “Business net income”3 is a non-GAAP financial measure. It is calculated on the basis of business operating income, minus net financial expenses and before (i) the share of profit/loss from investments accounted for using the equity method and (ii) net income attributable to non-controlling interests. We believe the presentation of this measure, used by our management, is also useful for investors as it provides a means to analyze the effective tax cost of our current business activities. It should not be seen as a substitute for the effective tax rate based on consolidated net income.
When calculated on business net income, our effective tax rate was 21.0% in the first half of 2021, compared with 22.0% in the first half of 2020 and 22.0% for 2020 as a whole.
| | |
| C.4.15. SHARE OF PROFIT/(LOSS) FROM INVESTMENTS ACCOUNTED FOR USING THE EQUITY METHOD |
Share of profit/(loss) from investments accounted for using the equity method contributed net income of €26 million in the first half of 2021, versus net income of €354 million in the comparable period of 2020. In the first half of 2020, this line item mainly comprised our share of the profits of Regeneron (€343 million). On May 29, 2020, Sanofi sold its entire equity investment in Regeneron (except for 400,000 Regeneron shares retained by Sanofi to support our ongoing collaboration with Regeneron), which then ceased to be accounted for by the equity method, explaining the significant reduction in this line item in the first half of 2021.
Net income amounted to €2,796 million in the first half of 2021, versus €9,301 million in the first half of 2020.
| | |
| C.4.17. NET INCOME ATTRIBUTABLE TO NON-CONTROLLING INTERESTS |
Net income attributable to non-controlling interests for the first half of 2021 was €20 million, against €20 million for the first half of 2020.
3 See definition in section C.2., “Business net income”.
| | | | | |
2021 Half-Year Financial Report - Sanofi | 57 |
| | |
| C.4.18. NET INCOME ATTRIBUTABLE TO EQUITY HOLDERS OF SANOFI |
Net income attributable to equity holders of Sanofi amounted to €2,776 million in the first half of 2021, compared with €9,281 million in the first half of 2020.
Basic earnings per share (EPS) was €2.22 euros, compared with €7.41 for the first half of 2020, based on an average number of shares outstanding of 1,250.3 million for the first half of 2021 and 1,251.7 million for the first half of 2020. Diluted earnings per share was €2.21, versus €7.38 for the first half of 2020, based on an average number of shares after dilution of 1,255.6 million for the first half of 2021 and 1,258.2 million for the first half of 2020.
In the first half of 2021, our “Business operating income” (see Note B.20.1. to our condensed half-year consolidated financial statements for a definition and further details) was €4,903 million (versus €4,683 million for the first half of 2020), an increase of 4.7%, while “Business operating income margin” was 28.3% (versus 27.3% for the first half of 2020).
The table below shows our “Business operating income” for the six-month periods ended June 30, 2021 and 2020:
| | | | | | | | | | | | | | |
| (€ million) | June 30, 2021 | June 30, 2020 | (a) | Change |
| Pharmaceuticals segment | 4,911 | | 5,068 | | | -3.1 | % |
| Vaccines segment | 598 | | 450 | | | +32.9 | % |
| Consumer Healthcare segment | 731 | | 784 | | | -6.8 | % |
| Other | (1,337) | | (1,619) | | | -17.4 | % |
| Business operating income | 4,903 | | 4,683 | | | +4.7 | % |
(a)2020 figures have been adjusted to take account of the reallocation of certain expenses (in particular IT costs related to Sanofi’s new digital organization) from the Pharmaceuticals, Vaccines and Consumer Healthcare operating segments to the “Other” segment.
| | | | | |
| 58 | 2021 Half-Year Financial Report - Sanofi |
| | |
| C.6. CONSOLIDATED STATEMENTS OF CASH FLOWS |
Summarized consolidated statements of cash flows | | | | | | | | | | | |
| (€ million) | June 30, 2021 (6 months) | June 30, 2020 (6 months) | December 31, 2020 (12 months) |
| Net cash provided by/(used in) operating activities | 4,754 | | 3,926 | | 7,449 | |
| Net cash provided by/(used in) investing activities | (2,339) | | 8,075 | | 3,588 | |
| | | |
| Net cash provided by/(used in) financing activities | (6,616) | | (5,402) | | (6,485) | |
| Impact of exchange rates on cash and cash equivalents | 8 | | (57) | | (64) | |
| Net change in cash and cash equivalents | (4,193) | | 6,542 | | 4,488 | |
Net cash provided by/(used in) operating activities represented a net cash inflow of €4,754 million in the first half of 2021, against €3,926 million in the first half of 2020.
Operating cash flow before changes in working capital for the first half of 2021 was €4,219 million, versus €4,320 million in the first half of 2020.
Working capital requirements decreased by €535 million in the first half of 2021 (versus an increase of €394 million in the first half of 2020), due largely to a €821 million increase in inventories (mainly of Vaccines and Dupixent®), partly offset by a significant reduction in accounts receivable (€751 million), as well as provisions for discounts, rebates and sales returns.
Net cash provided by/(used in) investing activities represented a net cash outflow of €2,339 million in the first half of 2021, due mainly to the acquisitions of Kymab for €922 million, Kiadis for €319 million and Tidal for €135 million (see Note B.1. to our condensed half-year consolidated financial statements). That compares with a net cash inflow of €8,075 million in the first half of 2020, resulting primarily from the divestment of Regeneron shares on May 29, 2020.
Acquisitions of property, plant and equipment and intangible assets totaled €1,018 million, versus €682 million in the first half of 2020. There were €668 million of acquisitions of property, plant and equipment (versus €502 million in the first half of 2020), most of which (€445 million) were in the Pharmaceuticals segment, primarily in industrial facilities. The Vaccines segment accounted for €196 million of the acquisitions of property, plant and equipment during the period. Acquisitions of intangible assets (€350 million, versus €180 million in the first half of 2020) mainly comprised contractual payments for intangible rights, primarily under license and collaboration agreements.
After-tax proceeds from disposals amounted to €299 million in the first half of 2021, and relate mainly to divestments of various established prescription products. In the first half of 2020, after-tax proceeds from disposals amounted to €709 million, mainly from (i) the sale of operations relating to the Seprafilm® product to Baxter for €313 million; (ii) the divestment of some established prescription products for €105 million; and (iii) contingent consideration of €167 million relating to a past divestment.
Net cash provided by/(used in) financing activities represented a net cash outflow of €6,616 million in the first half of 2021, compared with a net outflow of €5,402 million in the first half of 2020. The 2021 first-half figure includes the dividend payout to our shareholders of €4,008 million (versus €3,937 million in the first half of 2020); net external debt repayments of €2,450 million (versus €1,138 million in the first half of 2020); and movements in Sanofi’s share capital (purchases and disposals of treasury shares, net of capital increases) that represented a net outflow of €117 million (versus a net outflow of €323 million in the first half of 2020).
The net change in cash and cash equivalents in the first half of 2021 was a decrease of €4,193 million, versus an increase of €6,542 million in the first half of 2020.
“Free cash flow” is a non-GAAP financial measure which is reviewed by our management, and which we believe provides useful information to measure the net cash generated from the Company’s operations that is available for strategic investments4 (net of divestments1), for debt repayment, and for payments to shareholders. Free cash flow is determined from business net income5 after adding back (in the case of expenses and losses) or deducting (in the case of income and gains) the following items: depreciation, amortization and impairment, share of undistributed earnings from investments accounted for using the equity method, gains & losses on disposals of non-current assets, net change in provisions (including pensions and other post-employment benefits), deferred taxes, share-based payment expense and other non-cash items. It also includes net changes in working capital, capital expenditures and other asset acquisitions6 net of disposal proceeds3 and payments related to restructuring and similar items. Free Cash Flow is not defined by IFRS, and is not a substitute for Net cash provided by/(used in) operating activities as reported under IFRS. Management recognizes that the term “Free Cash Flow” may be interpreted differently by other companies and under different circumstances.
4 Above a cap of €500 million per transaction.
5 Non-GAAP financial measure, as defined in “Business net income” above.
6 Not exceeding a cap of €500 million per transaction.
| | | | | |
2021 Half-Year Financial Report - Sanofi | 59 |
The table below sets forth a reconciliation between Net cash provided by/(used in) operating activities and Free Cash Flow:
| | | | | | | | |
| (€ million) | June 30, 2021 (6 months) | June 30, 2020 (6 months) |
| Net cash provided by/(used in) operating activities | 4,754 | | 3,926 | |
| Acquisitions of property, plant and equipment and software | (673) | | (534) | |
Acquisitions of intangible assets, equity interests and other non-current financial assets (a) | (902) | | (334) | |
Proceeds from disposals of property, plant and equipment, intangible assets and other non-current assets, net of tax (a) | 247 | | 682 | |
| Repayment of lease liabilities | (106) | | (121) | |
| Other items | 33 | | (51) | |
| Free cash flow | 3,353 | | 3,568 | |
(a)Free cash flow includes investments and divestments not exceeding a cap of €500 million per transaction.
| | |
| C.7. CONSOLIDATED BALANCE SHEET |
Total assets were €112,321 million as of June 30, 2021, compared with €114,529 million as of December 31, 2020, a decrease of €2,208 million.
Net debt was €10,467 million as of June 30, 2021, versus €8,790 million as of December 31, 2020. We believe the presentation of this non-GAAP financial measure, which is reviewed by our management, provides useful information to measure our overall liquidity and capital resources. We define “net debt” as (i) the sum total of short-term debt, long-term debt, and interest rate derivatives and currency derivatives used to manage debt, minus (ii) the sum total of cash and cash equivalents and interest rate derivatives and currency derivatives used to manage cash and cash equivalents.
| | | | | | | | |
| (€ million) | June 30, 2021 | December 31, 2020 |
| Long-term debt | 17,935 | | 19,745 | |
| Short-term debt and current portion of long-term debt | 2,225 | | 2,767 | |
| Interest rate and currency derivatives used to manage debt | 70 | | 119 | |
| Total debt | 20,230 | | 22,631 | |
| Cash and cash equivalents | (9,722) | | (13,915) | |
| Interest rate and currency derivatives used to manage cash and cash equivalents | (41) | | 74 | |
Net debt (a) | 10,467 | | 8,790 | |
| Total equity | 63,364 | | 63,147 | |
| Gearing ratio | 16.5 | % | 13.9 | % |
(a)Net debt does not include lease liabilities, which amounted to €1,490 million as of June 30, 2021 and €1,163 million as of December 31, 2020.
To assess our financing risk, we use the “gearing ratio”, another non-GAAP financial measure. This ratio (which we define as the ratio of net debt to total equity) rose from 13.9% as of December 31, 2020 to 16.5% as of June 30, 2021. Analyses of our debt as of June 30, 2021 and December 31, 2020 are provided in Note B.9. to the condensed half-year consolidated financial statements.
Because our net debt and gearing ratio are not standardized measures, they may not be directly comparable with the non-GAAP financial measures of other companies using the same or similar non-GAAP financial measures. Despite the use of non-GAAP measures by management in setting goals and measuring performance, these measures have no standardized meaning prescribed by IFRS.
We expect that the future cash flows generated by our operating activities will be sufficient to repay our debt. The financing arrangements in place as of June 30, 2021 at the Sanofi parent company level are not subject to covenants regarding financial ratios and do not contain any clauses linking credit spreads or fees to Sanofi’s credit rating.
Other key movements in the balance sheet are described below.
Total equity was €63,364 million as of June 30, 2021, versus €63,147 million as of December 31, 2020. The net change reflects the following principal factors:
•increases: our net income for the first half of 2021 (€2,796 million), and changes in currency translation differences (€1,061 million, mainly on the US dollar) ; and
•decreases: the dividend payout to our shareholders (€4,008 million) paid on May 7, 2021.
| | | | | |
| 60 | 2021 Half-Year Financial Report - Sanofi |
As of June 30, 2021 we held 8.25 million of our own shares, recorded as a deduction from equity and representing 0.655% of our share capital.
Goodwill and other intangible assets (€64,445 million in total) increased by €1,660 million, the main factors being the movements related to our acquisitions of Kymab (€956 million), Kiadis (€333 million) and Tidal (€130 million), reflected in the line item Other intangible assets.
Investments accounted for using the equity method (€214 million) increased by €13 million.
Other non-current assets (€2,699 million) decreased by €35 million.
Net deferred tax assets were €2,566 million as of June 30, 2021, compared with €2,442 million as of December 31, 2020, an increase of €124 million.
Non-current provisions and other non-current liabilities (€7,022 million) decreased by €514 million relative to December 31, 2020, due largely to a reduction in provisions for pensions and other post-employment benefits that arose mainly from actuarial gains of €328 million on defined-benefit plans.
Liabilities related to business combinations and to non-controlling interests (€447 million) decreased by €158 million. The main reason for the change is the settlement during the first half of 2021 of the contingent consideration liability due to True North Therapeutics as a result of Sanofi’s acquisition of Bioverativ.
| | | | | |
2021 Half-Year Financial Report - Sanofi | 61 |
| | |
| D/ RISK FACTORS AND RELATED PARTY TRANSACTIONS |
|
| D.1. RISK FACTORS |
The main risk factors to which Sanofi is exposed are described in our Annual Report on Form 20-F for the year ended December 31, 2020, filed with the US Securities and Exchange Commission on March 4, 2021.
Any of those risks, and others that we may not yet have identified, could materialize during the second half of 2021 or during subsequent periods, and could cause actual results to differ materially from those described elsewhere in this report.
| | |
| D.2. RELATED PARTY TRANSACTIONS |
Our principal related parties are defined in Note D.33. to the consolidated financial statements included in our 2020 Annual Report on Form 20-F (page F-90).
Note B.5. to the condensed half-year consolidated financial statements provides a description of the principal transactions and balances for the six months ended June 30, 2021 with equity-accounted entities that qualify as related parties.
Sanofi did not enter into any transactions with key management personnel during the first half of 2021.
Financial relations with the Group’s principal shareholders fall within the ordinary course of business and were immaterial in the first half of 2021.
| | | | | |
| 62 | 2021 Half-Year Financial Report - Sanofi |
At constant exchange rates, we expect growth in 2021 full-year business earnings per share7 (business EPS) to be around 12%, barring major unforeseen adverse events. The impact of exchange rates on 2021 business EPS is estimated to be approximately -4% to -5%, based on July 2021 average exchange rates applied over the rest of the year.
Full-year business net income1 for 2020 was €7,347 million, giving business earnings per share of €5.86.
This guidance has been prepared using accounting methods consistent with those used in the preparation of our historical financial information, and with the accounting policies applied by Sanofi . It draws upon assumptions defined by Sanofi and its subsidiaries, in particular regarding the following factors:
•growth in the national markets in which we operate;
•healthcare reimbursement policies, pricing reforms, and other governmental measures affecting the pharmaceutical industry;
•developments in the competitive environment, in terms of innovative products and the introduction of generics;
•respect by others for our intellectual property rights;
•progress on our research and development programs;
•the impact of our operating cost control policy, and trends in our operating costs;
•trends in exchange rates and interest rates;
•the integration of contributions from our acquisitions; and
•the average number of shares outstanding.
Some of the information, assumptions and estimates concerned are derived from or based, in whole or in part, on judgments and decisions made by Sanofi management that may be liable to change or adjustment in future.
7 For a definition, see Section C.2., “Business net income” above.
| | | | | |
2021 Half-Year Financial Report - Sanofi | 63 |
| | |
| FORWARD-LOOKING STATEMENTS |
This document contains forward-looking statements as defined in the US Private Securities Litigation Reform Act of 1995, as amended. Forward-looking statements are statements that are not historical facts. These statements include projections and estimates and their underlying assumptions, statements regarding plans, objectives, intentions and expectations with respect to future financial results, events, operations, services, product development and potential, and statements regarding future performance. Forward-looking statements are generally identified by the words “expects”, “anticipates”, “believes”, “intends”, “estimates”, “plans” and similar expressions. Although Sanofi’s management believes that the expectations reflected in such forward-looking statements are reasonable, investors are cautioned that forward-looking information and statements are subject to various risks and uncertainties, many of which are difficult to predict and generally beyond the control of Sanofi, that could cause actual results and developments to differ materially from those expressed in, or implied or projected by, the forward-looking information and statements.
These risks and uncertainties include among other things, the uncertainties inherent in research and development, future clinical data and analysis, including post marketing, decisions by regulatory authorities, such as the FDA or the EMA, regarding whether and when to approve any drug, device or biological application that may be filed for any such product candidates as well as their decisions regarding labelling and other matters that could affect the availability or commercial potential of such product candidates, the fact that product candidates if approved may not be commercially successful, the future approval and commercial success of therapeutic alternatives, Sanofi’s ability to benefit from external growth opportunities, to complete related transactions and/or obtain regulatory clearances, risks associated with intellectual property and any related pending or future litigation and the ultimate outcome of such litigation, trends in exchange rates and prevailing interest rates, volatile economic and market conditions, cost containment initiatives and subsequent changes thereto, and the impact that COVID-19 will have on us, our customers, suppliers, vendors, and other business partners, and the financial condition of any one of them, as well as on our employees and on the global economy as a whole. Any material effect of COVID-19 on any of the foregoing could also adversely impact us. This situation is changing rapidly and additional impacts may arise of which we are not currently aware and may exacerbate other previously identified risks. The risks and uncertainties also include the uncertainties discussed or identified in the public filings with the Securities and Exchange Commission (SEC) and the Autorité des marchés financiers (AMF) made by Sanofi, including those listed under “Risk Factors” and “Cautionary Statement Regarding Forward-Looking Statements” in Sanofi’s Annual Report on Form 20-F for the year ended December 31, 2020. For an update on litigation, refer to Note B.14. “Legal and arbitration proceedings” to our condensed half-year consolidated financial statements for the six months ended June 30, 2021, and to section “A.3.2. Legal and arbitration proceedings”, and section “D/ Risk factors and related party transactions”, of this half-year management report.
Other than as required by applicable law, Sanofi does not undertake any obligation to update or revise any forward-looking information or statements.
| | | | | |
| 64 | 2021 Half-Year Financial Report - Sanofi |
| | |
| F/ APPENDIX - RESEARCH AND DEVELOPMENT PIPELINE |
| | | | | |
2021 Half-Year Financial Report - Sanofi | 65 |
| | | | | |
| 66 | 2021 Half-Year Financial Report - Sanofi |
| | |
| 3. STATUTORY AUDITORS’ REVIEW REPORT ON THE HALF-YEARLY FINANCIAL INFORMATION |
Period from January 1 to June 30, 2021
To the Shareholders,
In compliance with the assignment entrusted to us by your annual general meetings and in accordance with the requirements of article L. 451-1-2 III of the French monetary and financial code ("code monétaire et financier"), we hereby report to you on:
•the review of the accompanying (condensed) half-yearly consolidated financial statements of Sanofi, for the period from January 1 to June 30, 2021;
•the verification of the information presented in the half-yearly management report.
Due to the global crisis related to the Covid-19 pandemic, the condensed half-yearly consolidated financial statements of this period have been prepared and reviewed under specific conditions. Indeed, this crisis and the exceptional measures taken in the context of the state of sanitary emergency have had numerous consequences for companies, particularly on their operations and their financing, and have led to greater uncertainties on their future prospects. Those measures, such as travel restrictions and remote working, have also had an impact on the companies' internal organization and the performance of our procedures.
These condensed half-yearly consolidated financial statements are the responsibility of the Board of Directors. Our role is to express a conclusion on these financial statements based on our review.
1. Conclusion on the financial statements
We conducted our review in accordance with professional standards applicable in France. A review of interim financial information consists of making inquiries, primarily of persons responsible for financial and accounting matters, and applying analytical and other review procedures. A review is substantially less in scope than an audit conducted in accordance with professional standards applicable in France and consequently does not enable us to obtain assurance that we would become aware of all significant matters that might be identified in an audit. Accordingly, we do not express an audit opinion.
Based on our review, nothing has come to our attention that causes us to believe that the accompanying condensed half-yearly consolidated financial statements are not prepared, in all material respects, in accordance with IAS 34 – standard of the IFRSs as adopted by the European Union applicable to interim financial information.
2. Specific verification
We have also verified the information presented in the half-yearly management report on the condensed half-yearly consolidated financial statements subject to our review.
We have no matters to report as to its fair presentation and consistency with the condensed half-yearly consolidated financial statements.
Neuilly-sur-Seine and Paris-La Défense, July 29, 2021
| | | | | |
The statutory auditors
French original signed by |
| |
| PricewaterhouseCoopers Audit | ERNST & YOUNG et Autres |
| Dominique Ménard Cédric Mazille | Alexis Hurtrel Pierre Chassagne |
* This is a free translation into English of the statutory auditors' review report on the half-yearly financial information issued in French and is provided solely for the convenience of English-speaking users. This report includes information relating to the specific verification of information given in the Group’s half-yearly management report. This report should be read in conjunction with, and construed in accordance with, French law and professional standards applicable in France
| | | | | |
2021 Half-Year Financial Report - Sanofi | 67 |
| | |
| 4. RESPONSIBILITY STATEMENT OF THE CERTIFYING OFFICER – HALF-YEAR FINANCIAL REPORT |
“I hereby certify that, to the best of my knowledge, the condensed half-year consolidated financial statements have been prepared in accordance with the applicable accounting standards and present fairly the assets and liabilities, the financial position and the income of the Company and the entities included in the scope of consolidation, and that the half-year management report starting on page 40 provides an accurate overview of the significant events of the first six months of the financial year with their impact on the half-year consolidated financial statements, together with the major transactions with related parties and a description of the main risks and uncertainties for the remaining six months of the financial year.”
Paris, July 29, 2021
Paul Hudson
Chief Executive Officer
| | | | | |
| 68 | 2021 Half-Year Financial Report - Sanofi |