Press Release 
Strong Q1 growth driven by Specialty Care, Vaccines and CHC
Paris, April 27, 2023
Q1 2023 sales growth of 5.5% at CER and business EPS(1) growth of 11.9% at CER
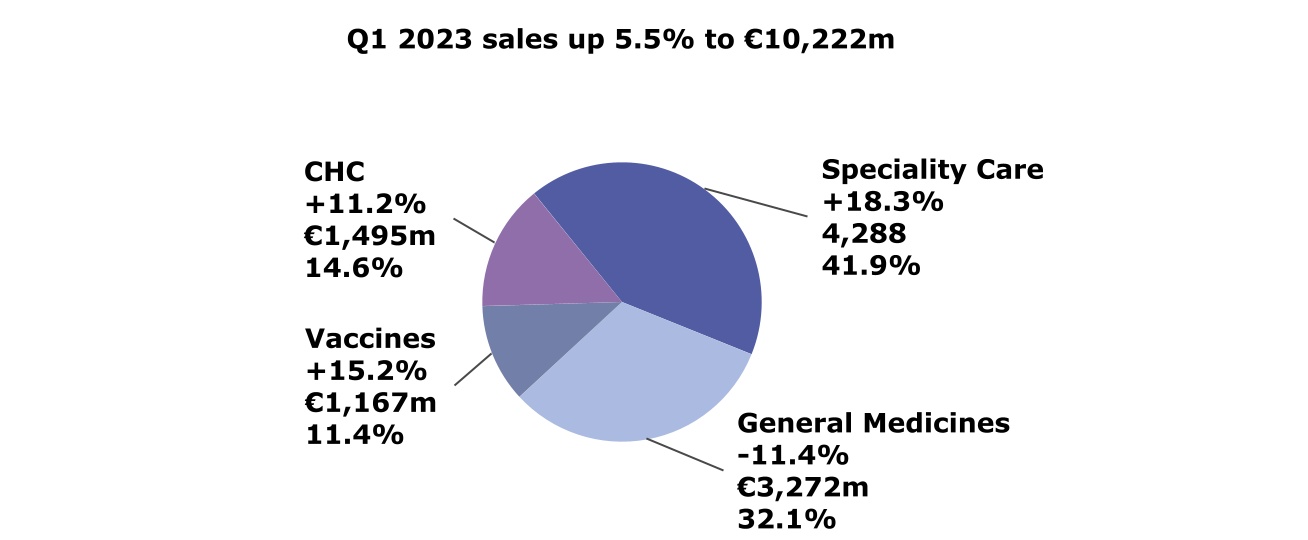
•Specialty Care grew 18.3% driven by Dupixent® (€2,316 million, +39.7%) and Rare Disease
•Vaccines up 15.2% reflecting recovery of Booster and Travel vaccines and COVID vaccine shipments in Europe
•General Medicines sales lower (-11.4%) mainly due to Lantus® and divestments, core assets growing 1.6%
•CHC sales of €1,495 million increased by 11.2% with price and favorable phasing as main contributors
•Business EPS(1) of €2.16 up 11.3% on a reported basis and 11.9% at CER
•IFRS EPS of €1.60 (down 0.6%)
Key R&D milestones and regulatory achievements in Q1
•ALTUVIIIO™ approved by the FDA for the treatment of adults and children with hemophilia A
•Two additional approvals for Dupixent® in Europe (EoE from 12 years and AD in 6 months and older)
•Dupixent® accepted for review in the U.S. and Japan for the treatment of CSU
•Dupixent® met primary and all secondary endpoints in its first phase 3 study in patients with COPD
Progress on Corporate Social Responsibility strategy in Q1
•Sanofi partnering with Ghana Ministry of Health to improve affordable access to diabetes care
•Net Zero(2) by 2045 and updated scope 3 targets validated by Science Based Targets Initiative (SBTi)
Full-year 2023 business EPS guidance confirmed
•Sanofi expects 2023 business EPS(1) to grow low single digit(3) at CER, barring unforeseen major adverse events. Applying average April 2023 exchange rates, the currency impact on 2023 business EPS is estimated between -5.5% to -6.5%
Paul Hudson, Sanofi Chief Executive Officer, commented:
“We have started 2023 with strong results, delivering double-digit sales growth across our Specialty Care, Vaccines and Consumer Healthcare businesses. Dupixent® continues its compelling performance and is on track to achieve its €10 billion sales objective for this year. The unique product profile of Dupixent® was further underscored by highly positive pivotal results in uncontrolled chronic obstructive pulmonary disease, which we are looking forward to discuss with regulators. We are also advancing our early-to-mid stage pipeline and plan to feature several promising candidates at upcoming R&D investor events. For the remainder of the year, we are confident in our business outlook, while navigating the impact from generic versions of Aubagio®, our last meaningful patent expiry this decade, with generics entering the U.S. market at the end of Q1. With the U.S. launch of ALTUVIIIO™ now underway and the anticipated roll-out of Beyfortus® in time for the RSV season later this year, we keep executing on our Play to Win growth strategy.”
| | | | | | | | | | | | | | |
| Q1 2023 | Change | Change
at CER | | | |
| IFRS net sales reported | €10,222m | +5.7% | +5.5% | | | |
| IFRS net income reported | €1,995m | -0.7% | _ | | | |
| IFRS EPS reported | €1.60 | -0.6% | _ | | | |
Free cash flow(4) | €1,537m | -10.0% | _ | | | |
| Business operating income | €3,333m | +8.7% | +9.3% | | | |
Business net income(1) | €2,699m | +11.3% | +11.9% | | | |
Business EPS(1) | €2.16 | +11.3% | +11.9% | | | |
Changes in net sales are expressed at constant exchange rates (CER) unless otherwise indicated (definition in Appendix 7). (1) In order to facilitate an understanding of operational performance, Sanofi comments on the business net income statement. Business net income is a non-GAAP financial measure (definition in Appendix 7). The consolidated income statement for Q1 2023 is provided in Appendix 3 and a reconciliation of reported IFRS net income to business net income is set forth in Appendix 4; (2) refer to ESG section for Sanofi Net Zero definition; (3) 2022 business EPS was €8.26; (4) Free cash flow is a non-GAAP financial measure (definition in Appendix 7)
.
2023 first-quarter summary
----------------------------
Unless otherwise indicated, all percentage changes in sales in this press release are stated at CER1
---------------------
In the first quarter of 2023, Sanofi sales were €10,222 million, up 5.7% on a reported basis. Exchange rate movements had a positive effect of 0.2 percentage points. At CER, company sales were up 5.5%.
Global Business Units
First-quarter 2023 net sales by Global Business Unit (variation at CER; € million; % of total sales)
Business operating income
First-quarter 2023 business operating income (BOI) increased 8.7% to €3,333 million. At CER, BOI increased 9.3%. The ratio of BOI to net sales increased 0.9 percentage point (ppt) to 32.6% (32.8% at CER).
Acquisitions and major collaborations
On March 13, 2023, Sanofi and Provention Bio entered into an agreement under which Sanofi agreed to acquire Provention Bio for $25.00 per share in cash, representing an equity value of approximately $2.9 billion. The transaction will add TZIELDTM (teplizumab-mzwv), an innovative, fully owned, first-in-class therapy in type 1 diabetes to Sanofi’s core asset portfolio in General Medicines. The acquisition is a strategic fit for Sanofi at the intersection of the company’s growth in immune-mediated diseases and disease-modifying therapies in areas of high unmet need, and its expertise in diabetes. This transaction is subject to customary closing conditions and is expected to close in the second quarter of 2023.
On April 11, 2023, Sanofi announced a simplification of the contractual arrangements relating to the development and commercialization of Beyfortus® (nirsevimab) in the U.S. Under the new and updated arrangements, Sobi has terminated its participation agreement with AstraZeneca, and Sanofi and AstraZeneca have updated the Collaboration Agreement so that Sanofi has full commercial control of Beyfortus® in the U.S. Consequently, Sanofi has recorded an intangible asset for the Fair Value of the additional U.S. rights acquired from AstraZeneca, which will be amortized below Business Net Income. Sanofi has simultaneously entered into a direct royalty agreement with Sobi, whereby Sanofi will pay Sobi a royalty on U.S. net sales of Beyfortus®. This transaction with Sobi is a financial transaction, whereby Sanofi transfers a royalty interest and recognizes a financial liability for the Fair Value of the U.S. royalties in the balance sheet. The liability will reduce over time as we pay the U.S. royalties to Sobi. Subsequent re-measurement of the liability will be accounted for through income statement below Business Net Income.
With respect to territories outside the U.S., the existing Collaboration Agreement between AstraZeneca and Sanofi continues to govern that relationship (with the exception of China, which is now defined as a “major market”, with a 50/50 profit/loss share with AstraZeneca).
1 See Appendix 7 for definitions of financial indicators
Sales by geographic region
| | | | | | | | | | |
| Sanofi sales (€ million) | Q1 2023 | Change
at CER | | |
| United States | 4,069 | | +11.8 | % | | |
| Europe | 2,576 | | +8.4 | % | | |
| Rest of the World | 3,577 | | -2.1 | % | | |
| of which China | 755 | | -14.0 | % | | |
In the U.S., first-quarter sales increased 11.8% (to €4,069 million), supported by the strong performance of Specialty Care driven by Dupixent® more than offsetting sales decline of Lantus®.
In Europe, first-quarter sales were up 8.4% (to €2,576 million) driven by Dupixent®, Nexviadyme®, Praluent®, and COVID vaccine shipments as well as double-digit growth of CHC.
In the Rest of World region, first-quarter sales decreased 2.1% (to €3,577 million), mainly reflecting lower sales in China which was partially offset by the growth of Specialty Care driven by Dupixent® and Rare Disease as well as CHC in the region. Sales in China decreased 14.0% to €755 million reflecting a COVID-driven slow start early in the year. In addition, sales of Lantus® were negatively impacted by the Volume Based Procurement (VBP) related price cuts, partially offset by higher sales of Specialty Care products and Praluent®.
Biopharma
The Biopharma segments include the Global Business Units Specialty Care, General Medicine and Vaccines. Please also see Appendix 1 and 2 for the comprehensive segment reporting.
Specialty Care
| | | | | | | | | | |
| Net sales (€ million) | Q1 2023 | Change
at CER | | |
Dupixent® | 2,316 | | +39.7 | % | | |
Aubagio® | 419 | | -16.9 | % | | |
Myozyme® / Lumizyme® | 228 | | -3.0 | % | | |
Fabrazyme® | 246 | | +11.8 | % | | |
Cerezyme® | 196 | | +26.7 | % | | |
Eloctate® | 118 | | -15.9 | % | | |
Alprolix® | 125 | | +12.0 | % | | |
Aldurazyme® | 78 | | +14.5 | % | | |
Nexviazyme®/Nexviadyme® | 81 | | +163.3 | % | | |
Jevtana® | 79 | | -21.4 | % | | |
Sarclisa® | 87 | | +33.8 | % | | |
Cablivi® | 58 | | +23.9 | % | | |
EnjaymoTM | 16 | | — | | | |
| | | | |
In the first quarter, Dupixent® (collaboration with Regeneron) sales increased 39.7% to €2,316 million. In the U.S., Dupixent® sales of €1,759 million (up 43.3%) were driven by continued strong demand in the approved indications, atopic dermatitis (AD), asthma, chronic rhinosinusitis with nasal polyposis (CRSwNP), eosinophilic esophagitis and prurigo nodularis. Dupixent® total prescriptions (TRx) increased 32% (year-over-year) and new-to-brand prescriptions (NBRx) grew 45%. In Europe, first-quarter Dupixent® sales grew 32.2% to €277 million reflecting continued growth in AD, asthma and CRSwNP. In the Rest of the World region, first-quarter sales reached €280 million, up 27.8%, driven mainly by sales in Japan and China.
Aubagio® sales decreased 16.9% in the first quarter to €419 million reflecting the expected entry of generics in the U.S. from mid-March. Sales in the Rest of the World region were down as a result of generic competition in Canada. In Europe, teriflunomide generic competition is expected in the fourth quarter of 2023.
First-quarter sales of Nexviazyme®/Nexviadyme® were €81 million, up 163.3% in the first quarter (of which €56 million in the U.S.) driven by Myozyme®/Lumizyme conversion in the eligible Pompe population (late-onset disease) and new patient accruals. Myozyme®/Lumizyme® sales decreased 3.0% to €228 million reflecting conversion in Nexviazyme®/Nexviadyme® partially offset by favorable purchasing patterns in the Rest of the World region.
First-quarter Fabrazyme® sales increased 11.8% to €246 million, reflecting new patient accruals and growth in all three geographic regions.
Cerezyme® sales were up 26.7% to €196 million, driven by strong sales growth in the Rest of the World region benefitting from favorable purchasing patterns.
Eloctate® sales were €118 million in the first quarter, down 15.9% reflecting lower sales in the U.S. due to competitive pressure and fluctuation in inventory levels.
ALTUVIIIOTM, a once-weekly new class of factor VIII therapy for hemophilia A that offers significant bleed protection, was launched at the end of March in the U.S.
First-quarter Alprolix® sales were up 12.0% to €125 million driven by the U.S. and the Rest of the World region.
Sarclisa® sales were €87 million, up 33.8%, reflecting growth in all three geographic regions.
First-quarter Jevtana® sales decreased 21.4% to €79 million due to the entry of generic competition in Europe at the end of March 2021 and lower sales in the U.S., reflecting increased competition. In the U.S., Jevtana® is currently covered by four Orange Book listed patents US 7,241,907, US 8,927,592, US 10,583,110 and US 10,716,777. Sanofi filed patent infringement suits under Hatch-Waxman against generic filers asserting the ‘110 patent, the ‘777 patent and the '592 patent in the US District Court for the District of Delaware. Sanofi has reached settlement agreements with most of the defendants and the suit against the only remaining defendant Sandoz is ongoing. In August 2022, the district court dismissed Sanofi’s infringement claim related to the ‘592 patent. A 3-day trial took place on January 11-13, 2023, and Sandoz has agreed not to launch any generic cabazitaxel product until the earlier of a district court decision in favor of Sandoz or four months after the completion of the post-trial briefing.
Cablivi® sales increased by 23.9% to €58 million in the first quarter supported by the performance across geographies.
Sales of XenpozymeTM, the first and only enzyme replacement therapy for the treatment of non-Central Nervous System (CNS) manifestations of Acid Sphingomyelinase, were €18 million in the first quarter generated in the U.S. and Europe.
First-quarter sales of Enjaymo™, the first approved treatment for patients with cold agglutinin disease were €16 million mainly generated in the U.S. and Japan.
General Medicines
Core assets2
| | | | | | | | | | |
| Net sales (€ million) | Q1 2023 | Change
at CER | | |
Lovenox® | 323 | | -11.9 | % | | |
Toujeo® | 289 | | +4.4 | % | | |
Plavix® | 236 | | -6.5 | % | | |
Thymoglobulin® | 109 | | +11.3 | % | | |
Praluent® | 98 | | +42.0 | % | | |
Multaq® | 84 | | -6.9 | % | | |
Rezurock® | 67 | | +56.1 | % | | |
In the first quarter core assets sales increased 1.6% (to €1,617 million), mainly driven by double-digit growth of Praluent®, Rezurock®, Thymoglobulin® and Soliqua®, offset by lower sales of Lovenox® and Plavix®.
First-quarter Lovenox® sales decreased 11.9% to €323 million, reflecting lower COVID-19 related demand compared to the first quarter of 2022, and increased competition from biosimilars.
First-quarter Toujeo® sales increased 4.4% to €289 million, driven by Europe and the U.S. In the Rest of the World region performance reflected lower sales in China mainly due to a high base in the first quarter of 2022 ahead of the VBP implementation.
Plavix® sales were down 6.5% in the first quarter at €236 million, due to a mandatory price cut in Japan in April 2022. In China, sales were down 1.6% to €117 million, reflecting the impact from provincial VBP renewal.
2 Sanofi has prioritized core assets in its General Medicines portfolio with differentiated and/or established profiles that have significant opportunity for growth in key markets.
Praluent® first-quarter sales were €98 million, up 42.0%, driven by strong performance in Europe and China.
Sales of Rezurock® were €67 million, up 56.1% in the first quarter driven by new patient adoption and improved adherence. Since launch more than 1,580 patients have been treated with Rezurock®.
Non-core assets
In the first quarter, non-core assets sales decreased 20.5% to €1,520 million mainly reflecting divestments (-2.2 ppt) and lower sales of Lantus®.
Lantus® sales were €447 million, down 32.6% in the first quarter. In the U.S., sales decreased 39.4%, impacted by the continued erosion of the basal insulin market combined with lower average net price. In Rest of the World region, sales were down 34.8% reflecting lower price due to the insulin VBP implementation in China in addition to a quarterly high base for comparison.
Vaccines
| | | | | | | | | | |
| Net sales (€ million) | Q1 2023 | Change
at CER | | |
| Polio/Pertussis/Hib vaccines | 537 | | -11.3 | % | | |
| Meningitis, Travel and endemic vaccines | 249 | | +16.7 | % | | |
| Booster vaccines | 124 | | +11.9 | % | | |
| | | | |
| Influenza vaccines | 63 | | +6.1 | % | | |
| Others | 194 | | +781.8% | | |
First-quarter Vaccines sales increased 15.2% (to €1,167 million) notably reflecting contractual sales of VidPrevtyn® Beta (€167 million), a recombinant COVID-19 booster vaccine in Europe, recorded in “others”. In addition, Booster and Travel vaccines product sales continued to recover following the COVID-19 related slowdown in the years 2020 and 2021, leading to double-digit growth of the respective franchises. The sales of Japanese Encephalitis vaccine (recorded in Traveler & Endemic vaccines and divested in the fourth quarter of 2022) were €19 million in the first quarter of 2022.
In the first quarter, Polio/Pertussis/Hib (PPH) vaccines sales decreased 11.3% to €537 million mainly reflecting lower sales in the Rest of the World region due to product discontinuation and a high base for comparison for injectable polio vaccine in the first quarter of 2022 due to favorable phasing. In the U.S. Vaxelis® continues to capture market share progressively replacing pentavalent vaccines (including Pentacel®) in the primary series of infant immunization. As a reminder, Vaxelis® in-market sales are not consolidated and the profits are shared equally between Sanofi and Merck & Co.
Meningitis, Travel and endemic vaccines sales grew 16.7% (to €249 million) driven by sales of meningitis vaccines in the Rest of the World region and the continued recovery of Travel-related vaccines that are reaching almost their pre-COVID levels.
Booster vaccines sales increased 11.9% in the first quarter to €124 million, driven by the U.S. and Europe.
Biopharma business operating income
In the first quarter, business operating income (BOI) of Biopharma increased 12.2% to €2,789 million (up 12.6% at CER) driven by gross profit improvement and higher capital gains than the first quarter of 2022, partly offset by higher SG&A costs due to product launch costs in Specialty Care. The ratio of BOI to net sales increased by 2.1 ppts to 32.0% (32.2% at CER).
R&D update at the end of the first quarter 2023
Regulatory update
•The U.S. Food and Drug Administration (FDA) approved ALTUVIIIOTM (efanesoctocog alfa), a first-in-class, high-sustained factor VIII replacement therapy, indicated for routine prophylaxis and on-demand treatment to control bleeding episodes, as well as perioperative management (surgery) for adults and children with hemophilia A. ALTUVIIIOTM is the first and only hemophilia A treatment that delivers normal to near-normal factor activity levels (over 40%) for most of the week with once-weekly dosing, and significantly reduces bleeds compared to prior factor VIII prophylaxis.
The approval is based on data from the pivotal XTEND-1 Phase 3 study in adults and adolescents with hemophilia A recently published in the New England Journal of Medicine.
Additionally, the XTEND-Kids Phase 3 pivotal study evaluating the safety, efficacy and pharmacokinetics of ALTUVIIIOTM as once-weekly prophylaxis in previously treated children younger than 12 years with severe hemophilia A met its primary endpoint of safety, with no FVIII inhibitors detected.
•The FDA accepted for review the supplemental Biologics License Application (sBLA) for Dupixent® (dupilumab) to treat adults and adolescents aged 12 years and older with chronic spontaneous urticaria (CSU), not adequately controlled with the current standard of care (H1 antihistamine treatment), with a PDUFA date of October 22, 2023. An application was also submitted to the Pharmaceuticals and Medical Devices Agency (PDMA) in Japan.
•The European Commission (EC) approved Dupixent® in the European Union to treat severe atopic dermatitis in children aged 6 months to 5 years old who are candidates for systemic therapy. With this approval, Dupixent® is the first and only targeted medicine indicated to treat these young children in Europe and the U.S.
•The EC expanded the marketing authorization for Dupixent®, in the European Union to treat eosinophilic esophagitis (EoE) in adults and adolescents 12 years and older, weighing at least 40 kg, who are inadequately controlled by, are intolerant to, or who are not candidates for conventional medicinal therapy. With this approval, Dupixent® is the first and only targeted medicine specifically indicated to treat EoE in Europe and the U.S.
Portfolio update
Phase 3:
•Dupixent® demonstrated a clinically meaningful and highly significant reduction (30%) in moderate or severe acute exacerbations of COPD (rapid and acute worsening of respiratory symptoms) in the pivotal BOREAS study. Significant improvements in lung function, quality of life and COPD respiratory symptoms. Efficacy and safety results from this trial will be presented at The American Thoracic Society (ATS) Conference. The second, replicate Phase 3 trial of Dupixent® in COPD (NOTUS) is ongoing with data expected in 2024.
A Phase 3 study evaluating Dupixent® in Chronic Inducible Cold Urticaria (LIBERTY-CINDU) did not meet the required efficacy endpoints to continue this program.
Dupixent® programs in Allergic Fungal Rhinosinusitis (AFRS) and Chronic Rhinosinusitis without Nasal Polyps (CRsNP) will be discontinued due to portfolio prioritization. The ongoing studies will be amended and completed.
•New data for tolebrutinib from a collaborative research and development partnership with the National Institute of Neurological Disorders and Stroke (NINDS) showed the significant impact on neuroinflammatory biomarkers in the central nervous system associated with disease progression and addressing disability accumulation, which is a significant unmet need in multiple sclerosis. The data were presented at the Americas Committee for Treatment and Research in Multiple Sclerosis (ACTRIMS) Forum 2023.
•Results from the ATLAS-INH and ATLAS A/B studies evaluating the efficacy and safety of fitusiran, an investigational siRNA therapy for the prophylactic treatment of adults and adolescents with hemophilia A or B, reinforcing the potential of this investigational therapy to transform the current standard of care and address unmet needs for all types of hemophilia, regardless of inhibitor status, were published respectively in The Lancet and The Lancet Haematology.
•Long-term extension data from the Phase 3 COMET study showing sustained treatment effect of Nexviazyme® over nearly three years in late-onset Pompe disease patients, who were treatment-naïve as well as those who switched from long-time standard of care alglucosidase alfa, were presented at WORLDSymposiumTM.
Phase 2:
•The study assessing the efficacy, tolerability, and safety of the RIPK1 inhibitor SAR443820 in patients with multiple sclerosis enrolled its first participants.
•The development of atuzabrutinib, a topical BTKi, was discontinued based on results of the study evaluating the compound in patients with mild to moderate atopic dermatitis, due to efficacy and sub-optimal pharmacokinetics.
•The study evaluating the safety, pharmacokinetics, and efficacy of subcutaneous Sarclisa® in adults With Warm Autoimmune Hemolytic Anemia (wAIHA), was discontinued based on the preliminary results and portfolio prioritization.
•Studies evaluating the efficacy and safety of Dupixent® in Ulcerative Colitis (UC, NCT05731128) and Eosinophilic Gastritis (EG, NCT05831176) have been initiated.
Phase 1:
•The study evaluating the safety, tolerability, and pharmacokinetics of SAR444419 (anti-TNFa/IL-6 Nanobody® VHH) in healthy subjects, was discontinued based on the benefit/risk assessment.
Organizational update
On February 13th, Sanofi announced the departure of John Reed, former Global Head of R&D. An internal and external search to identify the successor is ongoing. Dietmar Berger, Chief Medical Officer and Global Head of Development has taken on the role of Global Head of R&D ad interim.
An update of the R&D pipeline as of March 31, 2023, is available on our website: https://www.sanofi.com/en/science-and-innovation/research-and-development
Consumer Healthcare
| | | | | | | | | | |
| Net sales (€ million) | Q1 2023 | Change at CER | | |
| Allergy | 276 | | +17.0 | % | | |
| Cough & Cold | 145 | | +22.3 | % | | |
| Pain Care | 306 | | +4.7 | % | | |
| Digestive Wellness | 425 | | +21.5 | % | | |
| Physical and Mental Wellness | 154 | | -2.6 | % | | |
| Personal Care | 150 | | +12.3 | % | | |
In the first quarter, Consumer Healthcare (CHC) sales increased 11.2% to €1,495 million driven by growth in all regions and also includes approximately €40 million of positive phasing effect of inventory in trade. This global performance includes a positive price effect of 6.6 ppts. The divestments of non-core products had a negative impact of 1.5 ppt mainly impacting the non-core/others category. As a result, the CHC organic sales growth was 12.7% in the first quarter.
In the U.S., first-quarter CHC sales increased 14.5% to €371 million driven by double-digit growth of Digestive Wellness Allergy and Personal Care categories and included a positive phasing effect of inventory in trade.
In Europe, first-quarter CHC sales increased 11.6% to €448 million mainly reflecting double-digit growth of Cough & Cold, Digestive Wellness and Allergy categories.
In Rest of World, first-quarter CHC sales increased 9.2% to €676 million, supported by double-digit growth of the Digestive, Pain Care and Allergy categories and included a positive phasing effect of inventory in trade.
CHC business operating income
In accordance with the progress of the CHC stand-alone setup within Sanofi, the CHC segment reporting now reflects the fully integrated R&D, manufacturing and supply activities as well as related Global Support Functions.
In the first quarter, business operating income (BOI) of CHC increased 0.6% (up 2.4% at CER) to €534 million reflecting strong sales growth in part driven by stock in trade stockpile phasing. This was offset by lower capital gains related to divestments versus the first quarter of 2022, increased R&D expenses (up 29.3%) linked to phasing of projects and higher stand-alone costs.
The ratio of BOI to net sales decreased 3.5 ppts to 35.7% (36.1% at CER) versus the first quarter of 2022.
Corporate Social Responsibility update at the end of the first quarter 2023
Access to healthcare
Sanofi partnering with the Ghana Ministry of Health to improve affordable access to diabetes care
In order to offer solutions adapted to local needs, Sanofi is piloting a new business model in selected low-and middle-income countries to increase access to insulin. Countries are chosen based on their governments committing to tackle non-communicable diseases (NCDs); the priority of diabetes on their healthcare agenda; and government interest in incorporating analog insulins, recently included in the WHO EML (WHO Model List of Essential Medicines).
These innovative partnerships with healthcare authorities will provide the blueprint to scale up the program within the pilot country, as well as to expand to other countries over the next three to five years. By rolling out this new business model, we are aiming to improve the lives of 190,000 people living with either Type 1 or Type 2 diabetes within the next 5 years.
The recently signed Ghana-Sanofi partnership delivered through Sanofi’s General Medicines Business Unit and in close collaboration with the Ministry of Health of Ghana and other stakeholders and partners includes high-quality analogue insulins at affordable price (included in WHO EML now), patient disease awareness, HCP training, regional care centers, and digital solutions.
Sanofi capping its insulin to a $35 out-of-pocket costs in the U.S.
Sanofi has decided that it will cut the list price of Lantus® (insulin glargine injection), its most widely prescribed insulin in the U.S., by 78%. The company will also establish a $35 cap on out-of-pocket costs for Lantus® for all patients with commercial insurance, underscoring its longstanding commitment to offer affordable access to medicines. These steps will become effective January 1st, 2024.
Sanofi will continue to provide different programs to ensure access and affordability to diabetes patients depending on their coverage situations and will continue to monitor policy and market changes. Our suite of innovative programs includes:
–100% of commercially insured people are eligible for Sanofi’s copay assistance programs, regardless of income or insurance plan design, which, in 2022 limited out-of-pocket expenses for a majority of participating patients to $15 or less for their diabetes medicines for a 30-day supply.
–100% of uninsured people are eligible for the Insulins Valyou Savings Program – regardless of income level – enabling them to buy one or multiple Sanofi insulins at $35 for a 30-day supply.
–We also provide free medications to qualified low- and middle-income patients through the Sanofi Patient Connection program. Some people facing an unexpected financial hardship may be eligible for a one-time, immediate month’s supply of their Sanofi medicine as they wait for their application to be processed.
Learn more about Sanofi’s transparent approach to pricing in the U.S. in the company 2023 U.S. Pricing Principles Report.
Launch of “A Million Conversations”
A Million Conversations is Sanofi’s global initiative to rebuild trust in healthcare with the underrepresented, especially with Black and ethnic minority groups, women, people with disabilities, and LGBTQ+ communities. Sanofi aims to help build the next generation of diverse healthcare leaders.
In partnership with leading higher education institutions across the world, the Sanofi NextGen Scholarship will identify up to 100 new students from marginalized communities each year. Selected Scholars will be awarded funding to cover partial university fees and living costs. And they will receive development support, mentorship, internship opportunities, and potential employment once they graduate.
Environment
Net Zero emissions by 2045 and updated scope 3 targets validated by Science Based Targets Initiative (SBTi)
Sanofi announced in Q4 2022 it accelerates its efforts to address climate change and has built an ambitious path to achieve Net Zero emissions across all operations (scope 1 & 2) and the entire value chain (scope 3) by 2045. This target has been vetted by SBTi as well our updated scope 3 reduction target of achieving -30% GHG emissions by 2030 vs our 2019 baseline.
Net Zero emissions means achieving a scale of value chain emissions reductions consistent with the depth for abatement at the point of reaching global net-zero in 1.5°C pathways and neutralizing the impact of any residual emissions by permanently removing an equivalent volume of CO2e.
Sanofi inaugurated its first self-consumption photovoltaic park on its Montpellier site in France
Sanofi and EDF ENR inaugurated a new 3.3-hectare photovoltaic park at Sanofi's research and development site in Montpellier. The park is producing electricity that is fully self-consumed by the site since February 2023.
With an annual electricity production of 5,490 MWh, i.e. the equivalent of the consumption of a city of 4,000 people, this photovoltaic park, which will be supplemented by a ground-based power station in 2024 covers 17.5% of the annual electricity needs from the site. The rest of these needs are covered by a supply of 100% renewable electricity.
This project is part of our larger ambition to use 100% renewable electricity by 2030 worldwide. Beyond the Montpellier site, other large-scale solar power plant installations are planned for the Aramon site in July 2023, the Ambarès site in 2024 and the Sisteron site in the near future. Similar plants are already in operation at the sites of Virginia in Australia, Goa in India and Scoppito in Italy.
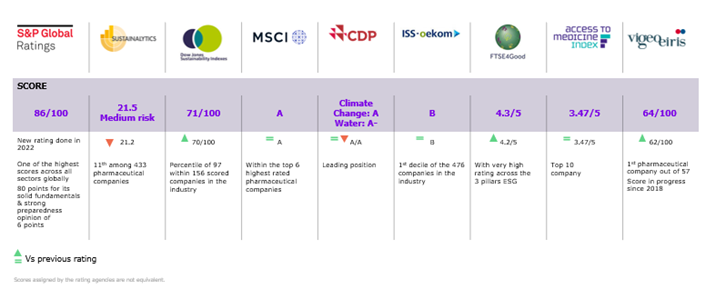
ESG ratings
Here are the latest Sanofi ESG rankings:
First-quarter 2023 financial results
Business Net Income3
In the first quarter of 2023, Sanofi generated net sales of €10,222 million, an increase of 5.7% (up 5.5% at CER).
First-quarter other revenues increased 69.1% (up 61.7% at CER) to €641 million, including increased VaxServe sales of non-Sanofi products of €390 million (up 30.8% at CER), COVID-19 vaccine related revenues (€62 million) and favorable phasing.
First-quarter Gross Profit increased 8.5% (up 8.1% at CER) to €7,784 million. The gross margin ratio increased 1.9 ppt to 76.1% versus the same period of 2022, mainly reflecting improvement of the Biopharma gross margin ratio (which increased from 75.2% to 77.7%) driven by favorable product mix and the deconsolidation of EUROAPI. CHC gross margin ratio increased 0.4 ppt to 67.0%.
Research and Development (R&D) expenses were up 5.0% (up 3.9% at CER) to €1,563 million in the first quarter, mainly reflecting increased expenses in vaccines, especially for the mRNA Center of Excellence.
First-quarter selling general and administrative expenses (SG&A) increased 9.6% to €2,607 million. At CER, SG&A expenses were up 8,7%, reflecting increased commercial investments and launch costs in Specialty Care and further investments in CHC. In the first quarter, the ratio of SG&A to sales increased 0.9 ppt to 25.5% compared to the prior year.
First-quarter operating expenses were €4,170 million (up 7.8% and 6.9% at CER).
First-quarter other current operating income net of expenses was €-304 million versus €-265 million in the first quarter of 2022. Other current operating income net of expenses included an expense of €674 million (versus an expense of €477 million in the first quarter of 2022) corresponding to the share of profit to Regeneron of the monoclonal antibodies Alliance, additional share of profit paid by Regeneron towards development costs (which increased from 10% to 20% from April 1, 2022) and the reimbursement of commercialization-related expenses incurred by Regeneron. In the first quarter, this line also included €307 million of net capital gains related to portfolio streamlining compared to €232 million in the same period of 2022.
The first-quarter share of profit from associates was €33 million versus €30 million in the same periods of 2022 and included the share of U.S. profit related to Vaxelis®.
First-quarter business operating income3 (BOI) increased 8.7% to €3,333 million. At CER, BOI increased 9.3%. The ratio of BOI to net sales increased 0.9 ppt to 32.6%.
Net financial expenses were €-7 million in the first quarter, versus €-78 million in the same period of 2022, reflecting increased short-term interest rate on the cash & cash equivalents.
First-quarter effective tax rate was stable at 19.0% versus the same period of 2022. Sanofi expects its effective tax rate to be around 19% in 2023.
First-quarter business net income3 increased 11.3% to €2,699 million and increased 11.9% at CER. The ratio of business net income to net sales increased 1.3 ppts to 26.4% versus the first quarter of 2022.
In the first quarter of 2023, business earnings per share3 (EPS) was €2.16, up 11.3% on a reported basis (up 11.9% at CER). The average number of shares outstanding was 1,249.3 million versus 1,249.2 million in the first quarter of 2022.
Reconciliation of IFRS net income reported to business net income (see Appendix 4)
In the first quarter of 2023, the IFRS net income was €1,995 million. The main items excluded from the business net income were:
•An amortization charge of €489 million related to fair value remeasurement on intangible assets of acquired companies (primarily Bioverativ: €152 million, Genzyme: €107 million, Boehringer Ingelheim CHC business: €48 million, Ablynx: €42 million and Kadmon €39 million) and to acquired intangible assets (licenses/products: €30 million). These items have no cash impact on the Company.
•Restructuring costs and similar items of €240 million related to streamlining initiatives.
3See Appendix 3 for 2023 first-quarter consolidated income statement; see Appendix 7 for definitions of financial indicators, and Appendix 4 for reconciliation of IFRS net income reported to business net income.
•Other gains and losses, and litigation charge of €88 million, mainly including costs related to a settlement of a Bioverativ shareholders litigation.
•A €168 million tax effect arising from the items listed above, mainly comprising €94 million of deferred taxes generated by amortization and impairments of intangible assets and €49 million associated with restructuring costs and similar items (see Appendix 4).
Capital Allocation
In the first quarter of 2023, free cash flow before restructuring, acquisitions and disposals decreased by 12.2% to €1,754 million, after net changes in working capital (€-627 million) and capital expenditures (€-447 million). After acquisitions4 (€-292 million), proceeds from disposals4 (€408 million) and payments related to restructuring and similar items (-€333 million), free cash flow5 decreased 10.0% to €1,537 million. Net debt decreased from €6,437 million on December 31, 2022 to €5,305 million on March 31, 2023 (amount net of €12,064 million cash and cash equivalents).
4 Not exceeding €500 million per transaction (inclusive of all payments related to the transaction).
5 non-GAAP financial measure (definition in Appendix 7).
Forward-Looking Statements
This press release contains forward-looking statements as defined in the Private Securities Litigation Reform Act of 1995, as amended. Forward-looking statements are statements that are not historical facts. These statements include projections and estimates and their underlying assumptions, statements regarding plans, objectives, intentions and expectations with respect to future financial results, events, operations, services, product development and potential, and statements regarding future performance. Forward-looking statements are generally identified by the words “expects”, “anticipates”, “believes”, “intends”, “estimates”, “plans” and similar expressions. Although Sanofi’s management believes that the expectations reflected in such forward-looking statements are reasonable, investors are cautioned that forward-looking information and statements are subject to various risks and uncertainties, many of which are difficult to predict and generally beyond the control of Sanofi, that could cause actual results and developments to differ materially from those expressed in, or implied or projected by, the forward-looking information and statements. These risks and uncertainties include among other things, the uncertainties inherent in research and development, future clinical data and analysis, including post marketing, decisions by regulatory authorities, such as the FDA or the EMA, regarding whether and when to approve any drug, device or biological application that may be filed for any such product candidates as well as their decisions regarding labelling and other matters that could affect the availability or commercial potential of such product candidates, the fact that product candidates if approved may not be commercially successful, the future approval and commercial success of therapeutic alternatives, Sanofi’s ability to benefit from external growth opportunities, to complete related transactions and/or obtain regulatory clearances, risks associated with intellectual property and any related pending or future litigation and the ultimate outcome of such litigation, trends in exchange rates and prevailing interest rates, volatile economic and market conditions, cost containment initiatives and subsequent changes thereto, and the impact that pandemics or other global crises may have on us, our customers, suppliers, vendors, and other business partners, and the financial condition of any one of them, as well as on our employees and on the global economy as a whole. The risks and uncertainties also include the uncertainties discussed or identified in the public filings with the SEC and the AMF made by Sanofi, including those listed under “Risk Factors” and “Cautionary Statement Regarding Forward-Looking Statements” in Sanofi’s annual report on Form 20-F for the year ended December 31, 2022. Other than as required by applicable law, Sanofi does not undertake any obligation to update or revise any forward-looking information or statements.
Appendices
| | | | | |
| |
| |
| |
| |
| |
| |
| |
| |
| |
| Appendix 6: | Currency sensitivity |
| |
| Appendix 8: | CSR Dashboards |
Media Relations
Sandrine Guendoul | + 33 6 25 09 14 25 | sandrine.guendoul@sanofi.com
Nicolas Obrist | + 33 6 77 21 27 55 | nicolas.obrist@sanofi.com
Victor Rouault | + 33 6 70 93 71 40 | victor.rouault@sanofi.com
Sally Bain | + 1 617 834 6026 | sally.bain@sanofi.com
Evan Berland | +1 215 432 0234 | evan.berland@sanofi.com
Investor Relations
Eva Schaefer-Jansen | + 33 7 86 80 56 39 | eva.schaefer-jansen@sanofi.com
Arnaud Delépine | + 33 6 73 69 36 93 | arnaud.delepine@sanofi.com
Corentine Driancourt | + 33 6 40 56 92 21 | corentine.driancourt@sanofi.com
Felix Lauscher | + 1 908 612 7239 | felix.lauscher@sanofi.com
Nathalie Pham | + 33 7 85 93 30 17 | nathalie.pham@sanofi.com
Tarik Elgoutni| + 1 617 710 3587 | Tarik.Elgoutni@sanofi.com
Appendix 1: 2023 first-quarter net sales by GBU, franchise, geographic region and product
| | | | | | | | | | | | | | | | | | | | | | | | | | | | | | | | | | | | | | |
| Q1 2023 (€ million) | Total Sales | % CER | % reported | | United States | % CER | | Europe | % CER | | Rest of the world | % CER |
| Dupixent | 2,316 | +39.7 | % | +43.5 | % | | 1,759 | +43.3 | % | | 277 | +32.2 | % | | 280 | +27.8 | % |
| Aubagio | 419 | -16.9 | % | -14.7 | % | | 273 | -20.7 | % | | 120 | -8.3 | % | | 26 | -13.3 | % |
| Myozyme | 228 | -3.0 | % | -3.0 | % | | 69 | -19.5 | % | | 95 | -6.8 | % | | 64 | +32.0 | % |
| Fabrazyme | 246 | +11.8 | % | +11.8 | % | | 123 | +12.4 | % | | 62 | +8.6 | % | | 61 | +14.0 | % |
| Cerezyme | 196 | +26.7 | % | +18.8 | % | | 47 | 0.0 | % | | 60 | 0.0 | % | | 89 | +73.3 | % |
| Eloctate | 118 | -15.9 | % | -14.5 | % | | 85 | -25.0 | % | | — | 0.0 | % | | 33 | +16.7 | % |
| Alprolix | 125 | +12.0 | % | +15.7 | % | | 107 | +10.9 | % | | — | 0.0 | % | | 18 | +18.8 | % |
| Nexviazyme/Nexviadzyme | 81 | +163.3 | % | +170.0 | % | | 56 | +107.7 | % | | 17 | +1600.0 | % | | 8 | +166.7 | % |
| Jevtana | 79 | -21.4 | % | -19.4 | % | | 55 | -22.1 | % | | 4 | -63.6 | % | | 20 | +5.3 | % |
| Sarclisa | 87 | +33.8 | % | +33.8 | % | | 37 | +40.0 | % | | 28 | +27.3 | % | | 22 | +33.3 | % |
| Kevzara | 73 | -23.2 | % | -23.2 | % | | 36 | -32.0 | % | | 27 | -3.6 | % | | 10 | -29.4 | % |
| Cerdelga | 73 | +7.5 | % | +9.0 | % | | 40 | +8.3 | % | | 29 | +7.4 | % | | 4 | 0.0 | % |
| Aldurazyme | 78 | +14.5 | % | +13.0 | % | | 18 | +30.8 | % | | 21 | -12.5 | % | | 39 | +28.1 | % |
| Cablivi | 58 | +23.9 | % | +26.1 | % | | 28 | +18.2 | % | | 27 | +17.4 | % | | 3 | +300.0 | % |
| Fasturtec | 45 | +10.0 | % | +12.5 | % | | 27 | +8.3 | % | | 13 | +8.3 | % | | 5 | +25.0 | % |
| Enjaymo | 16 | +1500.0 | % | +1500.0 | % | | 9 | +700.0 | % | | 1 | 0.0 | % | | 6 | 0.0 | % |
| Xenpozyme | 18 | +1700.0 | % | +1700.0 | % | | 10 | 0.0 | % | | 8 | +700.0 | % | | — | 0.0 | % |
| | | | | | | | | | | | |
| Others | 31 | -61.4 | % | -62.7 | % | | 5 | -54.5 | % | | 6 | -85.0 | % | | 20 | -34.4 | % |
| Specialty Care | 4,288 | +18.3 | % | +20.2 | % | | 2,785 | +20.4 | % | | 795 | +6.2 | % | | 708 | +25.3 | % |
| | | | | | | | | | | | |
| Toujeo | 289 | +4.4 | % | +5.5 | % | | 65 | +6.9 | % | | 109 | +5.8 | % | | 115 | +1.8 | % |
| Lovenox | 323 | -11.9 | % | -14.3 | % | | 4 | -20.0 | % | | 174 | -4.3 | % | | 145 | -19.3 | % |
| Plavix | 236 | -6.5 | % | -9.6 | % | | 2 | -33.3 | % | | 24 | -7.7 | % | | 210 | -6.0 | % |
| Thymoglobulin | 109 | +11.3 | % | +12.4 | % | | 69 | +17.9 | % | | 10 | +25.0 | % | | 30 | -3.0 | % |
| Multaq | 84 | -6.9 | % | -3.4 | % | | 76 | -6.4 | % | | 3 | -40.0 | % | | 5 | +25.0 | % |
| Praluent | 98 | +42.0 | % | +42.0 | % | | (1) | 0.0 | % | | 71 | +34.0 | % | | 28 | +75.0 | % |
| Rezurock | 67 | +56.1 | % | +63.4 | % | | 66 | +53.7 | % | | 1 | 0.0 | % | | — | 0.0 | % |
| Mozobil | 67 | +13.8 | % | +15.5 | % | | 42 | +29.0 | % | | 17 | +20.0 | % | | 8 | -33.3 | % |
| Soliqua/iGlarLixi | 63 | +15.1 | % | +18.9 | % | | 32 | +3.3 | % | | 8 | +12.5 | % | | 23 | +40.0 | % |
| Others core assets | 281 | +1.1 | % | +1.4 | % | | 36 | -15.4 | % | | 99 | +4.2 | % | | 146 | +3.5 | % |
| Core Assets | 1,617 | +1.6 | % | +1.4 | % | | 391 | +9.4 | % | | 516 | +4.6 | % | | 710 | -3.8 | % |
| Lantus | 447 | -32.6 | % | -33.4 | % | | 132 | -39.4 | % | | 96 | -13.4 | % | | 219 | -34.8 | % |
| Aprovel | 110 | -12.0 | % | -12.0 | % | | 1 | 0.0 | % | | 20 | -4.8 | % | | 89 | -13.6 | % |
| Others non-core assets | 963 | -14.4 | % | -17.1 | % | | 64 | -33.7 | % | | 256 | -13.7 | % | | 643 | -12.3 | % |
| Non-Core Assets | 1,520 | -20.5 | % | -22.4 | % | | 197 | -37.5 | % | | 372 | -13.2 | % | | 951 | -18.8 | % |
| Industrial Sales | 135 | -27.5 | % | -25.8 | % | | 1 | -90.0 | % | | 127 | -26.2 | % | | 7 | +75.0 | % |
| General Medicines | 3,272 | -11.4 | % | -12.4 | % | | 589 | -13.9 | % | | 1,015 | -7.1 | % | | 1,668 | -12.9 | % |
| | | | | | | | | | | | |
| | | | | | | | | | | | |
| Influenza vaccines | 63 | +6.1 | % | -4.5 | % | | 6 | -50.0 | % | | 5 | +25.0 | % | | 52 | +18.0 | % |
| Polio/Pertussis/Hib vaccines | 537 | -11.3 | % | -12.4 | % | | 129 | -0.8 | % | | 71 | -7.7 | % | | 337 | -15.1 | % |
| Meningitis, Travel and endemic vaccines | 249 | +16.7 | % | +18.6 | % | | 101 | -2.0 | % | | 34 | +78.9 | % | | 114 | +23.9 | % |
| Booster vaccines | 124 | +11.9 | % | +13.8 | % | | 67 | +20.8 | % | | 37 | +19.4 | % | | 20 | -16.0 | % |
| RSV | — | 0.0 | % | 0.0 | % | | — | 0.0 | % | | — | 0.0 | % | | — | 0.0 | % |
| Vaccines | 1,167 | +15.2 | % | +14.4 | % | | 324 | +1.6 | % | | 318 | +139.8 | % | | 525 | -6.2 | % |
| Biopharma | 8,727 | +4.6 | % | +4.9 | % | | 3,698 | +11.5 | % | | 2,128 | +7.8 | % | | 2,901 | -4.4 | % |
| | | | | | | | | | | | |
| Allergy | 276 | +17.0 | % | +17.4 | % | | 162 | +18.3 | % | | 23 | +41.2 | % | | 91 | +10.3 | % |
| Cough and Cold | 145 | +22.3 | % | +19.8 | % | | — | 0.0 | % | | 94 | +43.9 | % | | 51 | -3.6 | % |
| Pain Care | 306 | +4.7 | % | +3.7 | % | | 45 | -6.5 | % | | 138 | +2.2 | % | | 123 | +12.3 | % |
| Digestive Wellness | 425 | +21.5 | % | +18.7 | % | | 41 | +34.5 | % | | 144 | +14.1 | % | | 240 | +24.4 | % |
| Physical and Mental Wellness | 154 | -2.6 | % | -1.3 | % | | 13 | +8.3 | % | | 36 | -10.0 | % | | 105 | -1.0 | % |
| Personal Care | 150 | +12.3 | % | +15.4 | % | | 114 | +14.6 | % | | — | -100.0 | % | | 36 | +9.1 | % |
| Non-Core / Others | 39 | -32.2 | % | -33.9 | % | | (4) | +25.0 | % | | 13 | -26.3 | % | | 30 | -29.5 | % |
| Consumer Healthcare | 1,495 | +11.2 | % | +10.4 | % | | 371 | +14.5 | % | | 448 | +11.6 | % | | 676 | +9.2 | % |
| | | | | | | | | | | | |
| Company | 10,222 | +5.5 | % | +5.7 | % | | 4,069 | +11.8 | % | | 2,576 | +8.4 | % | | 3,577 | -2.1 | % |
Appendix 2: Business net income statement
| | | | | | | | | | | | | | | | | | | | | | | | | | | | | | | | | | | | | | |
| First quarter 2023 | Biopharma | Consumer Healthcare | Other | Total Group |
| € million | Q1 2023 | Q1 2022 | Change | Q1 2023 | Q1 2022 | Change | Q1 2023 | Q1 2022 | Change | Q1 2023 | Q1 2022 | Change |
| Net sales | 8,727 | 8,320 | 4.9% | 1,495 | 1,354 | 10.4% | — | — | —% | 10,222 | 9,674 | 5.7% |
| Other revenues | 626 | 365 | 71.5% | 15 | 14 | 7.1% | — | — | —% | 641 | 379 | 69.1% |
| Cost of Sales | (2,569) | (2,428) | 5.8% | (508) | (466) | 9.0% | (2) | 16 | -112.5% | (3,079) | (2,878) | 7.0% |
| As % of net sales | (29.4)% | (29.2)% | | (34.0)% | (34.4)% | | | | | (30.1)% | (29.7)% | |
| Gross Profit | 6,784 | 6,257 | 8.4% | 1,002 | 902 | 11.1% | (2) | 16 | -112.5% | 7,784 | 7,175 | 8.5% |
| As % of net sales | 77.7% | 75.2% | | 67.0% | 66.6% | | | | | 76.1% | 74.2% | |
| Research and development expenses | (1,510) | (1,451) | 4.1% | (53) | (41) | 29.3% | — | 3 | -100.0% | (1,563) | (1,489) | 5.0% |
| As % of net sales | (17.3)% | (17.4)% | | (3.5)% | (3.0)% | | | | | (15.3)% | (15.4)% | |
| Selling and general expenses | (2,124) | (1,936) | 9.7% | (484) | (447) | 8.3% | 1 | 4 | -75.0% | (2,607) | (2,379) | 9.6% |
| As % of net sales | (24.3)% | (23.3)% | | (32.4)% | (33.0)% | | | | | (25.5)% | (24.6)% | |
| Other current operating income/expenses | (386) | (413) | | 71 | 123 | | 11 | 25 | | (304) | (265) | |
| Share of profit/loss of associates* and joint ventures | 30 | 30 | | 3 | — | | — | — | | 33 | 30 | |
| Net income attributable to non controlling interests | (5) | (1) | | (5) | (6) | | — | — | | (10) | (7) | |
| Business operating income | 2,789 | 2,486 | 12.2% | 534 | 531 | 0.6% | 10 | 48 | -79.2% | 3,333 | 3,065 | 8.7% |
| As % of net sales | 32.0% | 29.9% | | 35.7% | 39.2% | | | | | 32.6% | 31.7% | |
| | | | | | | | | | | | |
| | | | Financial income and expenses | (7) | (78) | |
| | | | Income tax expenses | | (627) | (563) | |
| | | | Tax rate** | | 19.0% | 19.0% | |
| | | | Business net income | | 2,699 | 2,424 | 11.3% |
| | | | As % of net sales | | 26.4% | 25.1% | |
| | | | | | | | |
| | | | Business earnings / share(in euros)*** | 2.16 | 1.94 | 11.3% |
* Net of tax.
** Determined on the basis of Business income before tax, associates, and non-controlling interests.
*** Based on an average number of shares outstanding of 1,249.3 million in the first quarter of 2023 and 1,249.2 million in the first quarter of 2022.
Appendix 3: Consolidated income statements
| | | | | | | | | | |
| € million | Q1 2023 | Q1 2022 | | |
| Net sales | 10,222 | | 9,674 | | | |
| Other revenues | 641 | | 379 | | | |
| Cost of sales | (3,079) | | (2,880) | | | |
| Gross profit | 7,784 | | 7,173 | | | |
| Research and development expenses | (1,563) | | (1,489) | | | |
| Selling and general expenses | (2,607) | | (2,379) | | | |
| Other operating income | 436 | | 390 | | | |
| Other operating expenses | (740) | | (655) | | | |
| Amortization of intangible assets | (489) | | (449) | | | |
| Impairment of intangible assets | (15) | | (5) | | | |
| Fair value remeasurement of contingent consideration | (15) | | 4 | | | |
| Restructuring costs and similar items | (240) | | (175) | | | |
| Other gains and losses, and litigation | (88) | | (18) | | | |
| | | | |
| Operating income | 2,463 | | 2,397 | | | |
| Financial expenses | (168) | | (88) | | | |
| Financial income | 161 | | 10 | | | |
| Income before tax and associates and joint ventures | 2,456 | | 2,319 | | | |
| Income tax expense | (459) | | (332) | | | |
| Share of profit/(loss) of associates and joint ventures | 12 | | 30 | | | |
| | | | |
| | | | |
| Net income | 2,009 | | 2,017 | | | |
| Net income attributable to non-controlling interests | 14 | | 8 | | | |
| Net income attributable to equity holders of Sanofi | 1,995 | | 2,009 | | | |
| Average number of shares outstanding (million) | 1,249.3 | | 1,249.2 | | | |
| | | | |
| IFRS Earnings per share (in euros) | 1.60 | | 1.61 | | | |
Appendix 4: Reconciliation of Net income attributable to equity holders of Sanofi to Business net income
| | | | | | | | | | |
| € million | Q1 2023 | Q1 2022 | | |
| Net income attributable to equity holders of Sanofi | 1,995 | | 2,009 | | | |
Amortization of intangible assets (1) | 489 | | 449 | | | |
| Impairment of intangible assets | 15 | | 5 | | | |
| Fair value remeasurement of contingent consideration | 19 | | (3) | | | |
| Expenses arising from the impact of acquisitions on inventories | — | | 3 | | | |
| | | | |
| Restructuring costs and similar items | 240 | | 175 | | | |
| Other gains and losses, and litigation | 88 | | 18 | | | |
| | | | |
| Tax effect of the items listed above: | (168) | | (232) | | | |
| Amortization and impairment of intangible assets | (94) | | (96) | | | |
| Fair value remeasurement of contingent consideration | (5) | | (7) | | | |
| | | | |
| Restructuring costs and similar items | (49) | | (46) | | | |
| | | | |
| Other tax effects | (20) | | (83) | | | |
| | | | |
| Other items | 21 | | — | | | |
| | | | |
| | | | |
| | | | |
| Business net income | 2,699 | | 2,424 | | | |
IFRS earnings per share (2) (in euros) | 1.60 | | 1.61 | | | |
(1)Of which related to amortization expense generated by the remeasurement of intangible assets as part of business combinations: €459 million in the first quarter of 2023 and €420 million in the first quarter of 2022.
(2)Based on an average number of shares outstanding of 1,249.3 million in the first quarter of 2023 and 1,249.2 million in the first quarter of 2022.
Appendix 5: Change in net debt
| | | | | | | | |
| € million | Q1 2023 | Q1 2022 |
| Business net income | 2,699 | | 2,424 | |
| Depreciation & amortization & impairment of property, plant and equipment and software | 370 | | 361 | |
| Other items | (241) | | 37 | |
| Operating cash flow | 2,828 | | 2,822 | |
| Changes in Working Capital | (627) | | (468) | |
| Acquisitions of property, plant and equipment and software | (447) | | (356) | |
| Free cash flow before restructuring, acquisitions and disposals | 1,754 | | 1,998 | |
Acquisitions of intangibles assets, investments and other long-term financial assets (1) | (292) | | (277) | |
| Restructuring costs and similar items paid | (333) | | (361) | |
Proceeds from disposals of property, plant and equipment, intangible assets and other non-current assets net of taxes (1) | 408 | | 347 | |
| Free cash flow | 1,537 | | 1,707 | |
Acquisitions of investments in consolidated undertakings including assumed debt (2) | — | | (823) | |
| | |
| Issuance of Sanofi shares | 16 | | 13 | |
| Acquisition of treasury shares | (363) | | (360) | |
| | |
| Other items | (58) | | 14 | |
| Change in net debt | 1,132 | | 551 | |
| Beginning of period | 6,437 | | 9,983 | |
| Closing of net debt | 5,305 | | 9,432 | |
(1)Free cash flow includes investments and divestments not exceeding a cap of €500 million per transaction (inclusive of all payments related to the transaction).
(2)Includes transactions that are above a cap of €500 million per transaction (inclusive of all payments related to the transaction).
Appendix 6: Currency sensitivity
2023 business EPS currency sensitivity
| | | | | | | | |
| Currency | Variation | Business EPS Sensitivity |
| U.S. Dollar | +0.05 USD/EUR | -EUR 0.17 |
| Japanese Yen | +5 JPY/EUR | -EUR 0.02 |
| Chinese Yuan | +0.2 CNY/EUR | -EUR 0.03 |
| Brazilian Real | +0.4 BRL/EUR | -EUR 0.02 |
| Russian Ruble | +10 RUB/EUR | -EUR 0.02 |
Currency exposure on Q1 2023 sales
| | | | | |
| Currency | Q1 2023 |
| US $ | 41.1 | % |
| Euro € | 22.0 | % |
| Chinese Yuan | 6.7 | % |
| Japanese Yen | 3.9 | % |
| Brazilian Real | 2.8 | % |
| Russian ruble | 1.5 | % |
| Mexican pesos | 1.4 | % |
| Australian $ | 1.3 | % |
| Canadian $ | 1.1 | % |
| British Pound | 1.1 | % |
| Others | 17.1 | % |
Currency average rates
| | | | | | | | | | | | | | |
| Q1 2022 | Q1 2023 | Change | | | |
| €/$ | 1.123 | | 1.073 | | -4.4 | % | | | |
| €/Yen | 130.473 | | 142.049 | | +8.9 | % | | | |
| €/Yuan | 7.135 | | 7.349 | | +3.0 | % | | | |
| €/Real | 5.883 | | 5.575 | | -5.2 | % | | | |
| €/Ruble | 97.949 | | 78.351 | | -20.0 | % | | | |
Appendix 7: Definitions of non-GAAP financial indicators
Company sales at constant exchange rates (CER)
When we refer to changes in our net sales “at constant exchange rates” (CER), this means that we exclude the effect of changes in exchange rates.
We eliminate the effect of exchange rates by recalculating net sales for the relevant period at the exchange rates used for the previous period.
Reconciliation of net sales to Company sales at constant exchange rates for the first quarter 2023
| | | | | | |
| € million | Q1 2023 | |
| Net sales | 10,222 | | |
| Effect of exchange rates | 16 | | |
| Company sales at constant exchange rates | 10,206 | | |
Business net income
Sanofi publishes a key non-GAAP indicator. Business net income is defined as net income attributable to equity holders of Sanofi excluding:
•amortization of intangible assets,
•impairment of intangible assets,
•fair value remeasurement of contingent consideration related to business combinations or to disposals,
•expenses arising from the impact of acquisitions on inventories
•other impacts associated with acquisitions (including impacts of acquisitions on associates and joint ventures),
•restructuring costs and similar items(1),
•other gains and losses (including gains and losses on disposals of non-current assets(1)),
•costs or provisions associated with litigation(1),
•upfront payments and regulatory milestone payments recognized in the line item Other operating income and arising from transactions outside the scope of Sanofi's ordinary activities,
•the share of profits/losses from investments accounted for using the equity method, except for joint ventures and associates with which Sanofi has a strategic alliance,
•tax effects related to the items listed above as well as effects of major tax disputes,
•net income attributable to non-controlling interests related to the items listed above.
(1) Reported in the line items Restructuring costs and similar items and Gains and losses on disposals, and litigation, which are defined in Notes B.19. and B.20. to our consolidated financial statements.
Free cash flow
Free cash flow is a non-GAAP financial indicator which is reviewed by our management, and which we believe provides useful information to measure the net cash generated from the Company’s operations that is available for strategic investments1 (net of divestments1), for debt repayment, and for capital return to shareholders. Free Cash Flow is determined from the Business Net Income adjusted for depreciation, amortization and impairment, share of profit/loss in associates and joint ventures net of dividends received, gains & losses on disposals, net change in provisions including pensions and other post-employment benefits, deferred taxes, share-based expense and other non-cash items. It comprises net changes in working capital, capital expenditures and other asset acquisitions2 net of disposal proceeds2, and payments related to restructuring and similar items. Free cash flow is not defined by IFRS and it is not a substitute measure for the IFRS aggregate net cash flows in operating activities.
1 Amount of the transaction above a cap of €500 million per transaction (inclusive of all payments related to the transaction).
2 Not exceeding a cap of €500 million per transaction (inclusive of all payments related to the transaction).
Appendix 8: CSR dashboards
| | | | | | | | |
| Affordable access | | |
| Sanofi Global Health Unit |
| Q1 2022 | Q1 2023 |
| NCD | •46,300 patients treated •12 countries | •54,396 patients treated •19 countries |
| Malaria | •1,024,170 patients treated
| •2,725,117 patients treated |
| Tuberculosis | •35,094 patients treated | •3,022 patients treated |
| Rare disease vials donation |
| Q1 2022 | Q1 2023 |
| # Patients treated | 998 | 1,065 |
| #Vials donated | 22,682 | 21,542 |
| Global access Plan |
| Q4 2022 | Q1 2023 |
| # of access plan | Global access plan initiated for 2 assets | 6 Global Access Plans initiated or developed covering more than 10 indications
|
| | | | | | | | |
| R&D for unmet needs |
| Polio eradication |
| Q1 2022 | Q1 2023 |
| # Inactivated Polio Vaccine (IPV) doses supplied | 16 million IPV doses supplied to UNICEF for GAVI countries | 7 million IPV doses supplied to UNICEF for GAVI countries
|
Sleeping sickness elimination
|
| FY 2021 | FY 2022 |
| # Patients tested | 2 million | Data updated annually at Q2 23 |
| # Patients treated | 805 |
| Pediatric cancer treatment development |
| Q4 2022 | Q1 2023 |
| # of assets identified | • 1 asset pre-clinical assessment complete • 1 asset in protocol preparation for clinical study • 1 additional asset identified for clinical development
| •2 assets in protocol preparation for clinical study
|
| | | | | | | | | | | |
| Planet Care |
| Blister free syringe vaccines |
| FY 2022 | FY 2023 |
| % blister free syringe vaccines | 33% of blister free syringe produced | Data updated annually in Q4 23
|
| Eco design |
| Q4 2022 | Q1 2023 |
| # of Life Cycle Analysis (LCA) since 2021 | 7 LCAs completed & 1 in progress Eco-design digital solution launched | 7 LCAs completed & 4 in progress (new products and marketed product)
|
| Scope 1 & 2 GHG emissions reduction |
| Q4 2022 | Q1 2023 |
| GHG reduction vs 2019 % | -29.4% | -30.5% |
Renewable electricity
|
| Q4 2022 | Q1 2023 |
| % electricity consumption from renewable sources | 62.0% | 62.6% |
| Eco car fleet |
| Q4 2022 | Q1 2023 |
| % eco car fleet on total car fleet | 34.1% eco-fleet | 34.9% eco-fleet |
| | | | | | | | | | | |
| In and beyond the workplace |
| Q4 2022 | Q1 2023 |
| Diverse Senior Leadership |
| % of women | 37.2% of our executives 41.7% of our senior leaders were women | 37.5% of our executives 42.1% of our senior leaders were women |
| Engagement with communities |
| Q4 2022 | Q1 2023 |
| # volunteers | 4,975 volunteers | Next update in Q2 2023
|
| # hours | 26,906 hours |
| From Leaders to Citizens |
| Q4 2022 | Q1 2023 |
| KPI | More than half of the leaders have completed the initial eLearning phase | 65% of the leaders have completed the eLearning phase
9% of the leaders have completed the full program
|