Press Release 
Sanofi Q1: robust 7% sales growth driven by launches, underpins full-year guidance
Paris, April 25, 2024
Sales growth of 6.7% at CER and business EPS(1) of €1.78
•Dupixent sales up 24.9% to €2,835 million, on target to deliver ~€13bn in 2024
•Pharma launches up 90.5% to €606 million, led by Nexviazyme and ALTUVIIIO
•Vaccines sales up 5.6%, boosted by Beyfortus
•Consumer Healthcare (CHC) up 9.0%, benefiting from the Qunol acquisition in Physical and Mental Wellness and strong Digestive Wellness performance
•R&D expenses grew 11.8%, reflecting strategic shift of resources into development
•SG&A expenses grew 2.9%, less than sales growth
•Business EPS(1) of €1.78, down 17.6% reported and 7.4% at CER
•IFRS EPS of €0.91, down 43.1% reported
R&D transformation advanced further
•Three regulatory approvals: new Dupixent indications in the US and Japan and Beyfortus in Japan
•Positive phase 3 results for rilzabrutinib in immune thrombocytopenia, a rare disease
•Reaffirming increasing pipeline news flow over 2024-2025, including 12 phase 3 data readouts
Corporate Social Responsibility progress
•Sanofi Global Health Unit: making a difference for patients in low- and middle-income countries
•Cancer and work: Sanofi supporting health and wellbeing in the workplace
Business EPS guidance reiterated
•Sanofi expects 2024 business EPS(1) to remain roughly stable excluding the impact of an expected effective tax rate increase to 21% and decrease low single-digit(2) at CER including the higher expected tax rate, barring unforeseen major adverse events. Applying average April 2024 exchange rates, the currency impact on 2024 business EPS is estimated between -5.5% to -6.5%.
Paul Hudson, Chief Executive Officer, commented:
“We are off to an excellent start in 2024, delivering on our strategic priorities and a transformation of our portfolio of medicines and vaccines to become a development-driven, tech-powered biopharma company committed to serving patients and accelerating growth. Continued strong performance by Dupixent and our new launches drove sales growth of seven percent. In parallel, we are delivering on our promise of increased investments in our late-stage pipeline to fully realize its value for patients and Sanofi. We are awaiting regulatory decisions for Dupixent in COPD, a progressive disease with limited effective treatment options. If approved, Dupixent will be the first biologic treatment in COPD. With the robust progress in our portfolio transformation, we reaffirm our financial guidance for 2024.”
| | | | | | | | | | | | | | |
| Q1 2024 | Change | Change
at CER | | | |
| IFRS net sales reported | €10,464m | +2.4% | +6.7% | | | |
| IFRS net income reported | €1,133m | -43.2% | _ | | | |
| IFRS EPS reported | €0.91 | -43.1% | _ | | | |
Free cash flow(3) | €(309)m | -120.1% | _ | | | |
| Business operating income | €2,843m | -14.7% | -4.2% | | | |
Business net income(1) | €2,219m | -17.8% | -7.4% | | | |
Business EPS(1) | €1.78 | -17.6% | -7.4% | | | |
Changes in net sales are expressed at constant exchange rates (CER) unless otherwise indicated (definition in Appendix 7). (1) In order to facilitate an understanding of operational performance, Sanofi comments on the business net income statement. Business net income is a non-IFRS financial measure (definition in Appendix 7). The consolidated income statement for Q1 2024 is provided in Appendix 3 and a reconciliation of reported IFRS net income to business net income is set forth in Appendix 4; (2) 2023 business EPS was €8.11; (3) Free cash flow is a non-IFRS financial measure (definition in Appendix 7).
Q1 2024 summary
----------------------------
The performance shown in this press release covers the three-month period to 31 March 2024 (the quarter or Q1 2024) compared to the three-month period to 31 March 2023 (Q1 2023) respectively and all percentage changes in sales in this press release are at CER1, unless stated otherwise.
---------------------
In Q1 2024, on a reported basis, Sanofi sales were €10,464 million, an increase of 2.4%. Exchange rate movements had a negative effect of 4.3 percentage points (pp). At CER, sales increased by 6.7%.
Sales breakdown
| | | | | | | | | | | | | | |
| Net sales (€ million) | Q1 2024 | Change
at CER | % of total sales | | | |
| Biopharma | 8,939 | | +6.3 | % | 85.4 | % | | | |
| Pharma | 7,762 | | +6.4 | % | 74.2 | % | | | |
| Vaccines | 1,177 | | +5.6 | % | 11.2 | % | | | |
| CHC | 1,525 | | +9.0 | % | 14.6 | % | | | |
| Total Sales | 10,464 | | +6.7 | % | 100 | % | | | |
Business operating income
Business operating income (BOI) decreased by 14.7% to €2,843 million. At CER, BOI decreased by 4.2%. The ratio of BOI to net sales decreased 5.4pp to 27.2% (down 3.3pp to 29.3% at CER).
Acquisitions and major collaborations
On January 23, Sanofi and Inhibrx, Inc., entered into an agreement under which Sanofi has agreed to acquire Inhibrx following the spin-off of non-INBRX-101 assets into New Inhibrx for $30.0 in cash, a contingent value right of $5.0 and 0.25 shares of a new publicly traded company that will retain Inhibrx’s non-INBRX-101 assets. INBRX-101 is a human recombinant protein that holds the promise of allowing alpha-1 antitrypsin deficiency patients to achieve normalization of serum AAT levels with less frequent dosing. The acquisition supports Sanofi’s strategy and complements 30-years of heritage in rare diseases and proven industry leadership in immunology and inflammation. This acquisition is subject to customary closing conditions and is expected to close in Q2 2024.
Sales by geographic region
| | | | | | | | | | |
| Net sales (€ million) | Q1 2024 | Change
at CER | | |
| United States | 4,316 | | +7.3 | % | | |
| Europe | 2,480 | | -4.0 | % | | |
| Rest of World | 3,668 | | +13.8 | % | | |
| of which China | 757 | | +6.2 | % | | |
US sales increased by 7.3% to €4,316 million. The strong performance of Dupixent as well as the Pharma launches and Beyfortus late-season deliveries were partially offset by the impact of generic competition on Aubagio as well as lower sales of Lantus.
Europe sales decreased by 4.0% to €2,480 million reflecting the impact of generic competition on Aubagio, lower sales of Lovenox and a high base of comparison for Vaccines due to COVID-19 vaccine sales recorded in Q1 2023 which more than offset the strong performance of Dupixent.
Rest of World sales increased by 13.8% to €3,668 million, mainly driven by Dupixent, Beyfortus launch in two Southern Hemisphere countries and CHC. Sales in China increased by 6.2% to €757 million driven by Dupixent, Toujeo and Plavix.
1 See Appendix 9 for definitions of financial indicators.
Biopharma
The Biopharma segment includes Pharma and Vaccines. Sales increased by 6.3% to €8,939 million, driven by continued strong performance of Dupixent, Pharma launches and Vaccines. The divestments of medicines/portfolio streamlining had a negative impact of 0.7pp.
Pharma
Dupixent
| | | | | | | | | | |
| Net sales (€ million) | Q1 2024 | Change
at CER | | |
| Dupixent | 2,835 | | +24.9 | % | | |
Dupixent (collaboration with Regeneron) sales increased by 24.9% to 2,835 million. In the US, in-market performance was strong with total prescriptions up by 25% (year-over-year) and new-to-brand prescriptions up by 22%, impacted by the customary dynamics of the annual reset of insurance plans. Sales increased by 16.8% to €2,030 million and were driven by continued strong demand in the approved indications: atopic dermatitis (AD), asthma, chronic rhinosinusitis with nasal polyposis (CRSwNP), eosinophilic esophagitis and prurigo nodularis. In Europe, Dupixent sales increased by 33.6% to €371 million reflecting continued growth in AD, asthma and CRSwNP. In the Rest of World region, sales reached €434 million, an increase of 67.5%, driven mainly by sales in Japan and China.
Pharma launches
| | | | | | | | | | |
| Net sales (€ million) | Q1 2024 | Change
at CER | | |
| Nexviazyme/Nexviadyme | 152 | | +96.3 | % | | |
| ALTUVIIIO | 122 | | — | % | | |
| Sarclisa | 106 | | +28.7 | % | | |
| Rezurock | 93 | | +40.3 | % | | |
| Cablivi | 59 | | +3.4 | % | | |
| Xenpozyme | 35 | | +100.0 | % | | |
| Enjaymo | 29 | | +87.5 | % | | |
| TZIELD | 10 | | — | % | | |
| Total Pharma launches | 606 | | +90.5 | % | | |
| | | | |
Nexviazyme/Nexviadyme sales were €152 million, including €85 million in the US, and increased by 96.3% driven by the conversion from Myozyme/Lumizyme in the eligible late-onset Pompe disease population and by new patients. Pompe franchise (Nexviazyme/Nexviadyme + Myozyme/Lumizyme) sales were at €343 million, an increase of 15.2%. Nexviazyme/Nexviadyme sales now represent 44% of the Pompe franchise.
ALTUVIIIO (hemophilia A) was launched at the end of March 2023 and generated sales of €122 million, mainly in the US where ALTUVIIIO growth was driven by patient switches, the majority coming from medicines other than Eloctate. The hemophilia A franchise (ALTUVIIIO + Eloctate) sales were €208 million and increased by 79.0%, improving Sanofi’s share in the factor and the overall hemophilia A market.
Sarclisa (multiple myeloma) sales were €106 million, an increase of 28.7%, driven by strong growth in the US and the Rest of World.
Rezurock (chronic graft-versus-host disease) sales were €93 million, an increase of 40.3%, driven by improved patient adherence and new patients in the US as well as launches in China and UK.
Cablivi (acquired thrombotic thrombocytopenic purpura) sales increased by 3.4% to €59 million, primarily driven by use in the US.
Xenpozyme (acid sphingomyelinase deficiency) sales were €35 million, an increase of 100.0%, driven by use in the US and Europe.
Enjaymo (cold agglutinin disease) sales were €29 million, mainly generated in the US and Japan.
TZIELD (delay onset of type 1 diabetes) sales were €10 million driven by increased screenings and infusions. The launch continues to be supported by targeted investments, improved awareness and availability of guidelines.
Other main medicines
| | | | | | | | | | |
| Net sales (€ million) | Q1 2024 | Change
at CER | | |
| Lantus | 360 | | -15.4 | % | | |
| Toujeo | 321 | | +18.0 | % | | |
| Lovenox | 262 | | -13.9 | % | | |
| Fabrazyme | 253 | | +7.7 | % | | |
| Plavix | 238 | | +6.8 | % | | |
| Cerezyme | 214 | | +23.0 | % | | |
| Myozyme/Lumizyme | 191 | | -13.6 | % | | |
| Alprolix | 130 | | +6.4 | % | | |
| Praluent | 121 | | +25.5 | % | | |
| Thymoglobulin | 117 | | +12.8 | % | | |
| Aubagio | 102 | | -74.7 | % | | |
| Eloctate | 86 | | -24.6 | % | | |
| Cerdelga | 83 | | +15.1 | % | | |
| | | | |
Lantus sales were €360 million, a decrease of 15.4%. In the US, sales decreased by 13.6% to €112 million, reflecting a high comparison in Q1 2023 ahead of an adjustment to reflect increasing sales to government customers. These developments more than offset an increase in volume due to a competitor medicine withdrawing from the US market. In China, sales decreased by 52.5% million to €27 million as patients are shifting to Toujeo.
Toujeo sales increased by 18.0% to €321 million driven by China where the market share now exceeds that of Lantus. In the US, sales decreased mainly due to a shift in sales channel mix, resulting in a lower average net price, more than offsetting an increase in volume and market share.
Lovenox sales decreased by 13.9% to €262 million, reflecting an impact from volume-based procurement in China as well as biosimilar competition, which was largely offset by growth in some other countries.
Fabrazyme sales increased by 7.7% to €253 million, driven by the Rest of World.
Plavix sales increased by 6.8% to €238 million driven by use in China.
Cerezyme sales increased by 23.0% to €214 million, reflecting growth in high-inflation countries (Argentina and Turkey), part of the Rest of World. Gaucher disease franchise (Cerezyme + Cerdelga) sales were €297 million, an increase of 20.8%.
Myozyme/Lumizyme sales decreased by 13.6% to €191 million reflecting the conversion to Nexviazyme/Nexviadyme mentioned above.
Alprolix sales were €130 million, an increase of 6.4%, driven by the Rest of World.
Praluent sales were €121 million, an increase of 25.5%, driven by Europe and China.
Thymoglobulin sales were €117 million, an increase of 12.8%, driven by China.
Aubagio sales decreased by 74.7% to €102 million, reflecting the loss of exclusivity in the US in March 2023 and the competition from generics across all regions, including Europe where generics entered the market at the end of September 2023. The negative impact is anticipated to continue during 2024 as the losses of exclusivity annualize.
Eloctate sales were €86 million, a decrease of 24.6%, reflecting patients converting to ALTUVIIIO.
Cerdelga sales were €83 million, an increase of 15.1%, reflecting continued growth in the US, Europe and favorable shipment pattern.
Vaccines
| | | | | | | | | | |
| Net sales (€ million) | Q1 2024 | Change
at CER | | |
| Polio/Pertussis/Hib vaccines incl. Boosters | 636 | | -0.5 | % | | |
| Meningitis, Travel and endemic vaccines | 286 | | +7.7 | % | | |
| RSV (Beyfortus) | 182 | | — | % | | |
| Influenza vaccines | 73 | | +38.1 | % | | |
| | | | |
| Others | — | | -100.0% | | |
Vaccines sales increased by 5.6% to €1,177 million driven by strong Beyfortus uptake partly offset by the absence of COVID-19 vaccines sales this quarter compared to €167 million in Q1 2023.
Polio/Pertussis/Hib (PPH) vaccines sales, including Boosters, decreased by 0.5% to €636 million. Positive Rest of World sales driven by performance and favorable phasing were offset by declining sales in the US, where Vaxelis became market leader in the three-dose primary series market at the end of 2023. Vaxelis in-market sales are not consolidated by Sanofi but profits are shared equally between Sanofi and Merck & Co.
Meningitis, Travel and endemic vaccines sales increased by 7.7% to €286 million reflecting a favorable US Centers for Disease Control and Prevention buying pattern and increased MenQuadfi penetration in Europe.
Beyfortus sales reached €182 million, reflecting late deliveries in the US and new implementation of “All Infant Protection” programs in Chile and Australia. No Beyfortus sales are expected in Q2 2024 due to the early delivery in Q1 and the specific seasonality.
Influenza vaccines sales reached €73 million, benefiting from positive phasing with earlier deliveries to Southern Hemisphere countries compared to Q1 2023.
Biopharma business operating income
BOI of Biopharma decreased by 15.2% to €2,365 million. At CER, Biopharma BOI decreased by 5.7% reflecting lower gross profit ratio, higher R&D expenses, and lower capital gains from divestments of medicines/portfolio streamlining as compared to Q1 2023. The ratio of BOI to net sales decreased by 5.5pp to 26.5% (28.3% at CER).
Pipeline update
Sanofi has 77 projects in a pipeline across four main therapeutic areas (Immunology, Rare diseases, Neurology, and Oncology) and Vaccines, including 39 potential new medicines (NMEs) and vaccines. The following section highlights significant developments in the late- and mid-stage pipeline in the quarter and recently:
Highlights of the quarter
| | | | | |
| Regulatory approvals | Dupixent – pediatric eosinophilic esophagitis (EoE) (US) Dupixent – chronic spontaneous urticaria (CSU) (JP) Beyfortus – RSV prevention (JP) |
| Regulatory submission acceptance | Dupixent – COPD (US, EU, CN) (US priority review, PDUFA June 27) |
| Phase 3 data readouts | rilzabrutinib - immune thrombocytopenia (ITP) (primary endpoint met) |
| Major pipeline advancements | SP0125 – toddler RSV vaccine (phase 3) |
Immunology
Dupixent (dupilumab)
•The US Food and Drug Administration (FDA) updated the label for Dupixent in atopic dermatitis (AD), adding efficacy and safety data for patients aged 12 years and older with AD with uncontrolled moderate-to-severe hand and/or foot involvement.
•The FDA approved Dupixent for the treatment of pediatric patients aged 1 to 11 years, weighing at least 15 kg, with eosinophilic esophagitis (EoE). Dupixent is now the first and only medicine approved in the US specifically indicated to treat these patients.
•The Ministry of Health, Labour and Welfare in Japan granted regulatory approval for Dupixent for the treatment of chronic spontaneous urticaria (CSU) in people aged 12 years and older whose disease is not adequately controlled with existing therapy. Japan is the first country to approve Dupixent for CSU, emphasizing the value of Dupixent as a novel treatment option to manage this disease in patients with unmet medical needs. A regulatory submission is also under review in the European Union based on data from the LIBERTY-CUPID clinical study program.
•The FDA accepted for Priority Review the supplemental Biologics License Application for Dupixent in a sixth potential indication as an add-on maintenance treatment in certain adult patients with uncontrolled chronic obstructive pulmonary disease (COPD). The target action date for the FDA decision is June 27, 2024. Regulatory submissions are also under review in the European Union and China.
amlitelimab (OX40L mAb)
Positive results from part 2 of amlitelimab STREAM-AD phase 2b study showed sustained improvement of signs and symptoms for 28 weeks in adults with moderate-to-severe AD who previously responded to amlitelimab and continued treatment. High responder rates were also observed in participants who were taken off amlitelimab. The safety profile was consistent with part 1 of the study with amlitelimab being well-tolerated and no new safety concerns identified. These results were presented as part of a late-breaking session at the American Academy of Dermatology 2024 Conference in San Diego and support the dosing of once every 12 weeks now being assessed in a larger phase 3 clinical program (OCEANA). Enrollment of the four main AD studies is on track and designed to evaluate the on- and off-treatment efficacy and safety in adults and adolescents, with a regulatory submission anticipated in 2027.
itepekimab (IL33 mAb)
The first participants were treated in the phase 2 study evaluating itepekimab in patients with bronchiectasis (clinical study identifier: NCT06280391).
rilzabrutinib (BTK inhibitor)
Positive results from the RILECSU phase 2 study showed that rilzabrutinib significantly improved itch, hives and urticaria in adults with moderate-to-severe CSU whose symptoms are not adequately controlled by H1-antihistamines. The data were presented in a late-breaking poster at the 2024 American
Academy of Allergy, Asthma and Immunology Annual Meeting in Washington, DC, US and form the basis for the phase 3 program which is on track to start in H2 2024.
Additionally, results from the second (high-dose) cohort of the ACT17208 phase 2 study of rilzabrutinib showed a higher relative reduction magnitude in loss of asthma control and confirmed meaningful improvement in symptoms with overall good safety in patients with moderate-to-severe asthma. The data are anticipated to be presented at the upcoming American Thoracic Society International Conference.
frexalimab (CD40L mAb)
The development of frexalimab in Sjögren’s Syndrome (SjS), an immunological disorder with currently no approved disease-modifying treatments, was discontinued based on the findings of a phase 2 study. The 84-patient study evaluated the therapeutic efficacy of one dose level of frexalimab versus placebo over 12 weeks in adult patients with primary SjS, assessed by the change of the EULAR SjS Disease Activity Index (ESSDAI). The data confirmed pharmacologic activity and well-tolerated safety profile but not the necessary efficacy outcomes to continue to move forward the development in this indication. Development of frexalimab continues in relapsing multiple sclerosis (RMS) and secondary-progressive multiple sclerosis (SPMS) in phase 3, and type 1 diabetes and systemic lupus erythematosus in phase 2.
Rare diseases
Nexviazyme (avalglucosidase alfa)
New data from the Mini-COMET phase 2 long-term extension study of Nexviazyme in pediatric patients with infantile-onset Pompe disease (IOPD), suggested that it meaningfully improved ptosis, or drooping eyelid, over nearly three years. Data were featured at the 20th annual WORLDSymposiumTM, along with positive safety debut data from the Baby-COMET phase 3 study, the first study in never-before-treated patients with IOPD, and the first study in over 20 years of any treatment in naïve IOPD patients. The phase 3 Baby-COMET study is currently ongoing and is expected to read out in 2025, followed by a regulatory submission later in the year.
venglustat (GCS inhibitor)
The AMETHIST phase 3 study of venglustat for the treatment of GM2 gangliosidosis was discontinued based on the absence of positive trends on clinical endpoints. The data reinforced the favorable safety profile and do not impact the other indications currently being tested.
rilzabrutinib (BTK inhibitor)
In April, rilzabrutinib met the primary endpoint of durable platelet response in the LUNA 3 phase 3 study in adult patients with persistent or chronic immune thrombocytopenia (ITP), showing clinically and statistically significant result in a population of patients with primary ITP that had been refractory to prior therapy. The safety profile of rilzabrutinib was favorable and consistent with that reported in previous studies. Regulatory submission is planned for H2 2024. Previously, rilzabrutinib was granted Fast Track Designation and Orphan Drug Designation by the US FDA.
Neurology
oditrasertib (RIPK1 inhibitor)
The phase 2 study of oditrasertib (also known as SAR443820) in amyotrophic lateral sclerosis (ALS) was discontinued due to the primary endpoint of improvement based on ALS Functional Rating Scale-Revised (ALSFRS-R), the conventional assessment of physical function in activities of daily living for patients, not being met. The parties are committed to sharing the full efficacy and safety data at a forthcoming medical meeting.
Sanofi will continue the K2 phase 2 study of oditrasertib in participants with MS.
frexalimab (CD40L mAb)
Phase 2 data for frexalimab in MS were published in The New England Journal of Medicine, demonstrating that frexalimab significantly slowed disease activity in people with RMS, corresponding to an 89 percent and 79 percent reduction in new Gd+ T1 brain lesions at 12 weeks in the high- and low-dose treatment arms compared to placebo, meeting the study’s primary endpoint. Findings also showed both doses of frexalimab provided a significant reduction in new or enlarging T2 lesions, a secondary endpoint of the
study. Phase 3 studies in RMS and non-relapsing secondary-progressive MS (nrSPMS) are initiated with regulatory submission expected in 2027.
Vaccines
Beyfortus (nirsevimab)
Beyfortus, a long-acting monoclonal antibody, was approved in Japan for the prophylaxis of lower respiratory tract disease (LRTD) caused by respiratory syncytial virus (RSV) in all neonates, infants and children entering their first RSV season, and the prevention of RSV LRTD in neonates, infants and children at risk of serious RSV infection entering their first or second RSV season.
SP0125 (live attenuated RSV vaccine for toddlers)
The study evaluating SP0125 for the prevention of respiratory syncytial virus (RSV) in toddlers entered phase 3.
Anticipated major upcoming pipeline milestones
| | | | | | | | | | | |
| Medicine/vaccine | Indication | Description |
| H1 2024 | Dupixent | COPD | Regulatory decision (US) |
| CSU | Regulatory submission (EU) |
| Kevzara | Polyarticular juvenile idiopathic arthritis | Regulatory decision (US) |
| Sarclisa | Multiple myeloma (MM), front line (1L) (IMROZ study) | Regulatory submission (US) |
| MenQuadfi | Meningitis six weeks+ | Phase 3 data |
| H2 2024 | Dupixent | COPD | Regulatory decision (EU) |
| CSU | Phase 3 data |
| Bullous pemphigoid (BP) | Phase 3 data |
| rilzabrutinib | ITP | Regulatory submission |
| IgG4-related disease | Phase 2 data |
| Warm autoimmune hemolytic anemia | Phase 2 data |
| amlitelimab | Asthma | Phase 2 data |
| Anti-TL1A | Inflammatory bowel disease | Phase 2 data (interim analysis) |
| fitusiran | Hemophilia A/B | Regulatory submission (US) |
| tolebrutinib | RMS | Phase 3 data
Regulatory submission (US) |
|
| nrSPMS | Phase 3 data
Regulatory submission (US) |
|
| Sarclisa | MM, relapsed/refractory (R/R) (IRAKLIA study), subcutaneous | Phase 3 data |
| MM, newly diagnosed (GMMG study) | Phase 3 data |
| MenQuadfi | Meningitis six weeks+ | Regulatory submission (US) |
| 2025 | Dupixent | COPD | Regulatory decision (CN) |
| CSU | Regulatory submission (US) |
| BP | Regulatory submission (US) |
| itepekimab | COPD | Phase 3 data
Regulatory submission (US) |
| amlitelimab | Hidradenitis suppurativa (HS) | Phase 2 data |
| Alopecia areata | Phase 2 data |
| eclitasertib | Ulcerative colitis | Phase 2 data |
| frexalimab | Systemic lupus erythematosus | Phase 2 data |
| IRAK4 degrader | AD | Phase 2 data |
| HS | Phase 2 data |
| Oral TNFR1si | Psoriasis | Phase 2 data |
| Rheumatoid arthritis | Phase 2 data |
| lunsekimig | Asthma | Phase 2 data |
| TNFa/OX40L | HS | Phase 2 data |
| Nezviazyme | IOPD | Phase 3 data
Regulatory submission (US) |
| venglustat | Fabry disease | Phase 3 data
Regulatory submission (US) |
| tolebrutinib | Primary progressive MS | Phase 3 data
Regulatory submission (US) |
| Sarclisa | MM, R/R (IRAKLIA study), subcutaneous | Regulatory submission (US) |
| MM, newly diagnosed (GMMG study) | Regulatory submission (US) |
| SP0256 | RSV older adults | Phase 2 data |
| SP0087 | Rabies | Phase 3 data
Regulatory submission (US) |
An update of the Sanofi pipeline as of March 31, 2024, is available at: https://www.sanofi.com/en/our-science/our-pipeline.
Consumer Healthcare
| | | | | | | | | | |
| Net sales (€ million) | Q1 2024 | Change at CER | | |
| Seasonal symptoms & pain relief | 693 | | -1.0 | % | | |
| Wellness brands | 660 | | +26.3% | | |
| Others | 172 | | -5.8 | % | | |
Consumer Healthcare (CHC) sales increased by 9.0% to €1,525 million supported by growth in the Rest of World region and the US which included the acquisition of Qunol. The divestments of non-core products had a negative impact of -1.6pp, mainly reflected in the Others category in the first quarter. Excluding divestments and the Qunol acquisition, CHC sales growth was 5% in the quarter.
CHC business operating income
BOI of CHC decreased by 11.6% to €472 million. At CER, the BOI of CHC was up 3.0% mainly reflecting the consolidation of Qunol. The ratio of BOI to net sales decreased by 4.7pp to 31.0% (33.8% at CER) compared to Q1 2023.
During the quarter, Sanofi reached an agreement in principle to resolve the vast majority of Zantac personal injury state court cases in US state courts outside of Delaware. Assuming the agreement concludes in due course, Sanofi is settling these cases, not because Sanofi believes the claims have any merit, but rather to avoid expenses and ongoing distraction of the litigation, and with no concession of liability. This resolution is not anticipated to have any material financial impact.
Corporate Social Responsibility update at the end of the Q1 2024
Access to healthcare
Sanofi Global Health Unit: making a difference for our patients in low- and middle-income countries
Sanofi’s Global Health Unit (GHU) works to address today’s many growing healthcare challenges – with a focus on countries with the highest unmet medical needs – through a self-sustained not-for-profit social business model.
Sanofi’s GHU aims to provide access to a broad portfolio of medicines in 40 countries with the highest unmet medical needs. To that end the GHU created Impact, a unique not-for-profit brand with 30 standard-of-care medicines produced by Sanofi, some of which are considered essential by the World Health Organization (WHO). The Impact medicines cover a wide range of therapeutic areas including diabetes, cardiovascular disease, tuberculosis, malaria and cancer.
Sanofi's GHU aims to reach two million people with non-communicable disease (NCD) care in its 40 countries in scope by 2030. Since its creation in 2021, the GHU has made significant progress towards its objective, having already treated 506,130 NCD patients in 31 countries as of the end of March 2024.
To support the set up and development of sustainable healthcare systems, the GHU is also working closely with local communities, authorities and non-governmental organizations to develop disease awareness programs and establish partnerships to drive better care through:
–strengthening supply chains;
–conducting medical training;
–providing services to patients.
Sanofi's GHU has engaged with Ministries of Health and other partners in several countries, including Rwanda, Uganda, Tanzania and Cambodia. As of March 2024, the GHU pilots 44 active partnerships in 21 countries. Selected examples of projects supported are described below:
| | | | | | | | | | | | | | |
| Name | Therapeutic Area | Country(s) | Activity pillar(s) | Overview and progress in numbers |
| PharmAccess | Cardio
Diabetes | Zanzibar | Patient Care model | The project is an integrated patient-centered model of care aiming at improving diagnosis and disease management for patients with cardio-metabolic diseases through a care bundle consisting of access to patient group meetings, digital self-management support, remote care and medications. |
| CHAZ FBO Zambia | Cardio
Diabetes | Zambia | Scaling Patient Care services with
faith-based organizations | The primary goal is to institutionalize NCD Prevention WHO Best Buys as a standard of care within the church health institutions participating in the project. It includes building the capacity of health workers and community educators in church health institutions in diabetes and hypertension prevention and management, raising awareness of common NCD risk factors, and providing diabetes and hypertension diagnostic and treatment services in the selected church health institutions. |
| WCEA | Cardio
Diabetes | Malawi, Tanzania, Sierre Leone, Zimbabwe, Uganda | Online HCP Training | Online NCD training of healthcare professionals across multiple countries. |
| CNSS | Cardio
Diabetes | Djibouti | Empowering HCPs and supply chain actors | The specific objectives of this partnership are focused on strengthening advocacy and knowledge about NCDs, increasing the capacity of healthcare professionals for better management of NCDs and of supply chain actors, while building a sustainable procurement mechanism for affordable access to treatment. |
| Touch Foundation | Cardio
Diabetes | Tanzania | Strengthen Supply Chain | The primary goal is to improve supply chain management for NCD medicines and patient tracking at each facility to ensure patients are adhering to treatment. |
| | | | | | | | | | | | | | |
| Action 4 Diabetes (A4D) | Diabetes (type 1) | Cambodia, Laos, Myanmar | Care for Type 1 Diabetes Patients | Action 4 Diabetes focuses on type 1 diabetes patients and includes healthcare professional training, patient services, support in monitoring blood glucose levels and access to insulins, to increase efficiency in the management of type 1 diabetes patients. A4D also holds diabetes camps for patients and their families to build awareness and understanding. |
| City Cancer Challenge | Oncology | Cambodia
Rwanda | Health System Strengthening | Working with City Cancer, the objectives are to create city-wide oncology stakeholder leadership groups and complete situational analysis and needs assessments of oncology services (including digital oncology services), forming the basis for a successful approach to empower and strengthen the health system. |
Cancer and work: Sanofi supporting health and wellbeing in the workplace
Sanofi has launched ‘Cancer & Work: Acting Together’, a program which covers all Sanofi employees in the world if they are diagnosed with cancer or critical illnesses1. It provides social, emotional and financial support and secures the job, salary and benefits of any employee for up to twelve months, no matter the role or geographical location.
It will allow employees to incorporate further flexible work arrangements to better navigate cancer and work and will have access to a network of volunteer colleagues trained to help them navigate from initial diagnosis through the treatment journey and return to work. The program is also designed to better equip managers to support members of their team who are affected by cancer. Throughout 2024, Sanofi also intends to implement coverage of miscellaneous non-medical expenses. Moreover, Sanofi permanent employees will become eligible for an unpaid caregiver leave which allows them to carry out caregiving duties for their close family member suffering from a critical illness1.
In 2017, several volunteer employees in France, with complementary expert skills and experience as patients, caregivers or managers, started the initiative. The program has since grown to a network of 27 partner teams with one team at each Sanofi site in France, with 150 members who share feedback and best practice. More than 350 employees have benefited (42% sick employees, 30% caregivers, 28% managers).
The program “Cancer & Work” has started to roll out globally in early 2024 and is part of our programs supporting health and wellbeing in the workplace. This complements other initiatives already launched for employees such as the gender-neutral parental leave, allowing all new parents 14 weeks of paid leave to welcome a new child into their lives.
1. Specific criteria identifying the conditions and circumstances that are eligible for coverage under this program might be governed by the terms and conditions of country-specific policies or legal requirements.
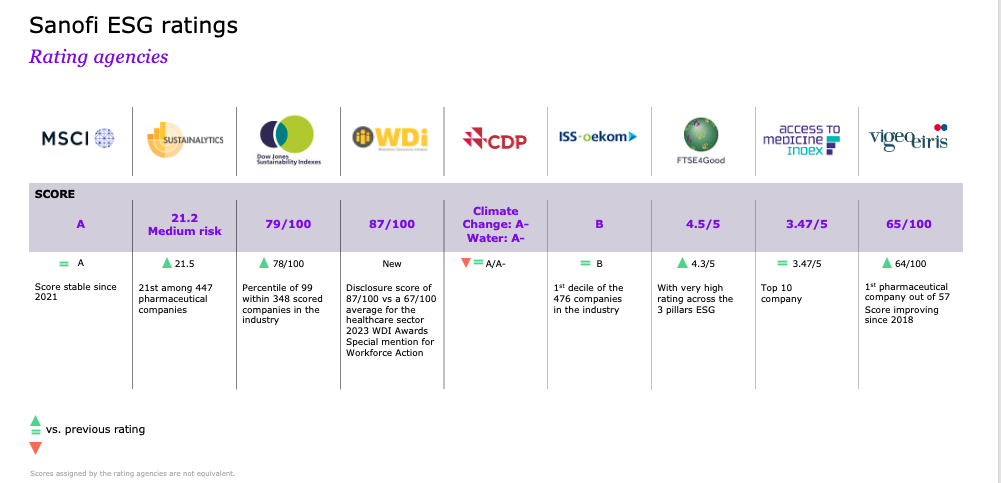
ESG ratings
Latest Sanofi ESG rankings:
Q1 2024 financial results
Business net income2
Sanofi generated net sales of €10,464 million, an increase of 2.4% (up 6.7% at CER).
Other revenues increased by 2.0% (up 9.8% at CER) to €654 million, including higher VaxServe sales of non-Sanofi products of €407 million (up 5.6% at CER).
Gross Profit decreased by 1.2% (up 4.2% at CER) to €7,694 million. The gross margin ratio decreased by 2.6pp to 73.5% (74.4% at CER) compared with Q1 2023. This decrease mainly reflected a deterioration of the Biopharma gross margin ratio (from 77.7% to 75.1%) due to the product mix evolution (e.g. sales decrease of Aubagio, COVID sales) and unfavorable currency evolution. CHC gross margin ratio decreased from 67.0% to 63.9% due to product and country mix, as well as unfavorable currency evolution.
Research and Development (R&D) expenses increased by 10.0% to €1,719 million. At CER, R&D expenses increased by 11.8%, reflecting increased expenses in Vaccines (mRNA) and Pharma (pipeline acceleration).
Selling, general and administrative expenses (SG&A) decreased by 0.1% to €2,605 million. At CER, SG&A expenses increased by 2.9%, reflecting increased commercial investments and launch costs in Biopharma and Vaccines as well as higher CHC commercial expenses. The ratio of SG&A to sales decreased by 0.6pp to 24.9% compared to Q1 2023.
Operating expenses were €4,324 million (up 3.7% and up 6.2% at CER).
Other current operating income net of expenses were -€562 million compared to -€304 million in Q1 2023. Other current operating income net of expenses included an expense of €825 million (compared to an expense of €674 million in Q1 2023) corresponding to the share of profit to Regeneron from the monoclonal antibodies alliance, the share of profit paid by Regeneron towards development costs and the reimbursement of commercialization-related expenses incurred by Regeneron. This line also included €199 million of capital gains from divestments of medicines/portfolio streamlining, compared to €307million in Q1 2023. Sanofi expects the amount of capital gains from divestments of medicines/portfolio streamlining to exceed €500 million in 2024.
Share of profit from associates was €44 million compared to €33 million in Q1 2023 and included the share of US profit related to Vaxelis.
Business operating income5 (BOI) decreased by 14.7% to €2,843 million. At CER, BOI decreased by 4.2%. The ratio of BOI to net sales decreased by 5.4pp to 27.2% (down 3.3pp at CER).
Net financial expenses were €43 million compared to €7 million in Q1 2023.
The effective tax rate increased to 21.0% from 19.0% in Q1 2023. Sanofi expects its effective tax rate to be around 21% in 2024.
Business net income5 decreased by 17.8% to €2,219 million and decreased by 7.4% at CER. The ratio of business net income to net sales decreased by 5.2pp to 21.2% compared to Q1 2023 (down 3.5pp at CER).
Business earnings per share5 (EPS) was €1.78, down 17.6% on a reported basis (down 7.4% at CER). The average number of shares outstanding was 1,248.8 million compared to 1,249.3 million in Q1 2023.
Reconciliation of IFRS net income reported to business net income (see Appendix 4)
The IFRS net income was €1,133 million. The main items excluded from the business net income were:
•An amortization charge of €562 million related to fair value remeasurement on intangible assets: 547 million (primarily Bioverativ: €160 million, Genzyme: €94 million, Provention Bio: €53 million, Boehringer Ingelheim CHC business: €45 million, Ablynx: €42 million, Kadmon: €41 million, Beyfortus: €28 million and Qunol: €20 million) and to intangible assets from separate acquisitions - measured initially at acquisition cost (licenses/products): €15 million. These items have no cash impact.
•Restructuring costs and similar items of €740 million mainly related to redundancy plans announced during Q1 2024 and separation costs of the CHC business.
•Other gains and losses, and litigation charge of €79 million related to change in provision for litigation.
2See Appendix 3 for Q1 2024 consolidated income statement; see Appendix 7 for definitions of financial indicators, and Appendix 4 for reconciliation of IFRS net income reported to business net income.
•A financial charge of €59 million related to the remeasurement of expected future royalty of Beyfortus US sales.
•A €424 million tax effect arising from the items listed above, mainly comprising €105 million of deferred taxes generated by amortization of intangible assets and €272 million associated with restructuring costs and similar items (see Appendix 4).
•A loss of €81 million corresponding to the equity stake in EUROAPI.
Capital allocation
Q1 2024 free cash flow before restructuring, acquisitions and disposals amounted to -€78 million, after negative change of net working capital (-€1,764 million), notably including the decrease of US rebates provisions (€980 million) following decision to cut Lantus list price effective January 1, 2024 and capital expenditures (-€512 million). After acquisitions3 (-€253 million), proceeds from disposals4 (€478 million) and payments related to restructuring and similar items (-€456 million), Q1 2024 free cash flow4 was -€309 million. The net debt increased from €7,793 million on December 31, 2023 to €8,534 million on March 31, 2024 (amount net of €9,181 million cash and cash equivalents).
3 Not exceeding €500 million per transaction (inclusive of all payments related to the transaction).
4 Non-IFRS financial measure (definition in Appendix 7).
Forward-Looking Statements
This press release contains forward-looking statements as defined in the Private Securities Litigation Reform Act of 1995, as amended. Forward-looking statements are statements that are not historical facts. These statements include projections and estimates and their underlying assumptions, statements regarding plans, business transformations, objectives, intentions and expectations with respect to future financial results, events, operations, services, product development and potential, and statements regarding future performance. Forward-looking statements are generally identified by the words “expects”, “anticipates”, “believes”, “intends”, “estimates”, “plans”, “potential”, “outlook”, “guidance” and similar expressions. Although Sanofi’s management believes that the expectations reflected in such forward-looking statements are reasonable, investors are cautioned that forward-looking information and statements are subject to various risks and uncertainties, many of which are difficult to predict and generally beyond the control of Sanofi, that could cause actual results and developments to differ materially from those expressed in, or implied or projected by, the forward-looking information and statements. These risks and uncertainties include among other things, the uncertainties inherent in research and development, future clinical data and analysis, including post marketing, decisions by regulatory authorities, such as the FDA or the EMA, regarding whether and when to approve any drug, device or biological application that may be filed for any such product candidates as well as their decisions regarding labelling and other matters that could affect the availability or commercial potential of such product candidates, the fact that product candidates if approved may not be commercially successful, the future approval and commercial success of therapeutic alternatives, Sanofi’s ability to benefit from external growth opportunities, to complete capital markets or other transactions and/or obtain regulatory clearances, risks associated with developing standalone businesses, risks associated with intellectual property and any related pending or future litigation and the ultimate outcome of such litigation, trends in exchange rates and prevailing interest rates, volatile economic and capital market conditions, cost containment initiatives and subsequent changes thereto, and the impact that pandemics, political disruption or armed conflicts or other global crises may have on us, our customers, suppliers, vendors, and other business partners, and the financial condition of any one of them, as well as on our employees and on the global economy as a whole. The risks and uncertainties also include the uncertainties discussed or identified in the public filings with the SEC and the AMF made by Sanofi, including those listed under “Risk Factors” and “Cautionary Statement Regarding Forward-Looking Statements” in Sanofi’s annual report on Form 20-F for the year ended December 31, 2023. Other than as required by applicable law, Sanofi does not undertake any obligation to update or revise any forward-looking information or statements.
All trademarks mentioned in this document are protected.
Appendices
| | | | | |
| |
| |
| |
| |
| |
| |
| |
| Appendix 6: | Currency sensitivity |
| |
| Appendix 8 | CSR Dashboards |
Media Relations
Sandrine Guendoul | + 33 6 25 09 14 25 | sandrine.guendoul@sanofi.com
Nicolas Obrist | + 33 6 77 21 27 55 | nicolas.obrist@sanofi.com
Victor Rouault | + 33 6 70 93 71 40 | victor.rouault@sanofi.com
Sally Bain | + 1 617 834 6026 | sally.bain@sanofi.com
Evan Berland | +1 215 432 0234 | evan.berland@sanofi.com
Investor Relations
Thomas Kudsk Larsen | +44 7545 513 693 | thomas.larsen@sanofi.com
Alizé Kaisserian | +33 6 47 04 12 11 | alize.kaisserian@sanofi.com
Arnaud Delépine | + 33 6 73 69 36 93 | arnaud.delepine@sanofi.com
Corentine Driancourt | + 33 6 40 56 92 21 | corentine.driancourt@sanofi.com
Felix Lauscher | + 1 908 612 7239 | felix.lauscher@sanofi.com
Nathalie Pham | + 33 7 85 93 30 17 | nathalie.pham@sanofi.com
Tarik Elgoutni | + 1 617 710 3587 | tarik.elgoutni@sanofi.com
Appendix 1: Q1 2024 net sales by medicine/vaccine/business and geographic region
| | | | | | | | | | | | | | | | | | | | | | | | | | | | | | | | | | | | | | |
| Q1 2024 (€ million) | Total Sales | % CER | % reported | | United States | % CER | | Europe | % CER | | Rest of World | % CER |
| Dupixent | 2,835 | +24.9 | % | +22.4 | % | | 2,030 | +16.8 | % | | 371 | +33.6 | % | | 434 | +67.5 | % |
| Nexviazyme/Nexviadyme | 152 | +96.3 | % | +87.7 | % | | 85 | +53.6 | % | | 43 | +147.1 | % | | 24 | +287.5 | % |
| Sarclisa | 106 | +28.7 | % | +21.8 | % | | 49 | +32.4 | % | | 31 | +10.7 | % | | 26 | +45.5 | % |
| Altuviio | 122 | +12300.0 | % | +12100.0 | % | | 115 | +11600.0 | % | | — | 0.0 | % | | 7 | 0.0 | % |
| Rezurock | 93 | +40.3 | % | +38.8 | % | | 84 | +28.8 | % | | 5 | +400.0 | % | | 4 | 0.0 | % |
| Cablivi | 59 | +3.4 | % | +1.7 | % | | 32 | +14.3 | % | | 23 | -14.8 | % | | 4 | +66.7 | % |
| Xenpozyme | 35 | +100.0 | % | +94.4 | % | | 18 | +80.0 | % | | 12 | +50.0 | % | | 5 | 0.0 | % |
| Enjaymo | 29 | +87.5 | % | +81.3 | % | | 15 | +66.7 | % | | 6 | +500.0 | % | | 8 | +50.0 | % |
| Tzield | 10 | 0.0 | % | 0.0 | % | | 10 | 0.0 | % | | — | 0.0 | % | | — | 0.0 | % |
| Total Pharma launches | 606 | +90.5 | % | +84.8 | % | | 408 | +99.0 | % | | 120 | +45.1 | % | | 78 | +141.0 | % |
| Toujeo | 321 | +18.0 | % | +11.1 | % | | 56 | -13.8 | % | | 119 | +9.2 | % | | 146 | +44.3 | % |
| Lantus | 360 | -15.4 | % | -19.5 | % | | 112 | -13.6 | % | | 92 | -5.2 | % | | 156 | -21.0 | % |
| Lovenox | 262 | -13.9 | % | -18.9 | % | | 3 | -25.0 | % | | 155 | -11.5 | % | | 104 | -16.6 | % |
| Plavix | 238 | +6.8 | % | +0.8 | % | | 2 | 0.0 | % | | 23 | -4.2 | % | | 213 | +8.1 | % |
| Fabrazyme | 253 | +7.7 | % | +2.8 | % | | 126 | +3.3 | % | | 63 | +1.6 | % | | 64 | +23.0 | % |
| Myozyme | 191 | -13.6 | % | -16.2 | % | | 60 | -13.0 | % | | 76 | -21.1 | % | | 55 | -3.1 | % |
| Alprolix | 130 | +6.4 | % | +4.0 | % | | 109 | +2.8 | % | | — | 0.0 | % | | 21 | +27.8 | % |
| Cerezyme | 214 | +23.0 | % | +9.2 | % | | 48 | +4.3 | % | | 65 | +8.3 | % | | 101 | +42.7 | % |
| Aubagio | 102 | -74.7 | % | -75.7 | % | | 41 | -85.0 | % | | 52 | -56.7 | % | | 9 | -50.0 | % |
| Praluent | 121 | +25.5 | % | +23.5 | % | | — | -100.0 | % | | 83 | +16.9 | % | | 38 | +42.9 | % |
| Thymoglobulin | 117 | +12.8 | % | +7.3 | % | | 73 | +7.2 | % | | 10 | 0.0 | % | | 34 | +30.0 | % |
| Aprovel | 105 | -0.9 | % | -4.5 | % | | — | -100.0 | % | | 18 | -10.0 | % | | 87 | +2.2 | % |
| Kevzara | 87 | +23.3 | % | +19.2 | % | | 45 | +27.8 | % | | 29 | +7.4 | % | | 13 | +50.0 | % |
| Eloctate | 86 | -24.6 | % | -27.1 | % | | 62 | -25.9 | % | | — | 0.0 | % | | 24 | -21.2 | % |
| Multaq | 78 | -6.0 | % | -7.1 | % | | 70 | -6.6 | % | | 3 | 0.0 | % | | 5 | 0.0 | % |
| Jevtana | 68 | -10.1 | % | -13.9 | % | | 47 | -12.7 | % | | 2 | -50.0 | % | | 19 | +5.0 | % |
| Cerdelga | 83 | +15.1 | % | +13.7 | % | | 46 | +15.0 | % | | 32 | +10.3 | % | | 5 | +50.0 | % |
| Aldurazyme | 83 | +12.8 | % | +6.4 | % | | 18 | 0.0 | % | | 23 | +9.5 | % | | 42 | +20.5 | % |
| Soliqua/iGlarLixi | 58 | -4.8 | % | -7.9 | % | | 20 | -37.5 | % | | 11 | +37.5 | % | | 27 | +26.1 | % |
| Fasturtec | 42 | -6.7 | % | -6.7 | % | | 27 | +3.7 | % | | 11 | -15.4 | % | | 4 | -40.0 | % |
| Mozobil | 25 | -61.2 | % | -62.7 | % | | 3 | -92.9 | % | | 16 | -5.9 | % | | 6 | -12.5 | % |
| Others | 1,140 | -6.1 | % | -10.6 | % | | 86 | -15.2 | % | | 335 | -7.5 | % | | 719 | -4.3 | % |
| Industrial Sales | 157 | +16.3 | % | +16.3 | % | | 1 | 0.0 | % | | 156 | +23.6 | % | | — | -114.3 | % |
| Total other medicines | 4,321 | -7.9 | % | -12.1 | % | | 1,055 | -24.1 | % | | 1,374 | -5.5 | % | | 1,892 | +1.6 | % |
| Pharma | 7,762 | +6.4 | % | +2.7 | % | | 3,493 | +4.8 | % | | 1,865 | +2.8 | % | | 2,404 | +11.6 | % |
| Influenza vaccines | 73 | +38.1 | % | +15.9 | % | | 5 | -16.7 | % | | 1 | -80.0 | % | | 67 | +55.8 | % |
| Polio/Pertussis/Hib vaccines & Boosters | 636 | -0.5 | % | -3.8 | % | | 164 | -15.3 | % | | 109 | 0.0 | % | | 363 | +7.6 | % |
| RSV (Beyfortus) | 182 | 0.0 | % | 0.0 | % | | 114 | 0.0 | % | | 7 | 0.0 | % | | 61 | 0.0 | % |
| Meningitis, Travel and endemic vaccines | 286 | +7.7 | % | +5.1 | % | | 137 | +14.0 | % | | 48 | +38.2 | % | | 101 | -7.7 | % |
| Vaccines | 1,177 | +5.6 | % | +0.9 | % | | 420 | +30.9 | % | | 165 | -48.4 | % | | 592 | +22.7 | % |
| Biopharma | 8,939 | +6.3 | % | +2.4 | % | | 3,913 | +7.1 | % | | 2,030 | -4.9 | % | | 2,996 | +13.6 | % |
| Consumer Healthcare | 1,525 | +9.0 | % | +2.0 | % | | 403 | +10.0 | % | | 450 | 0.0 | % | | 672 | +14.3 | % |
| Company | 10,464 | +6.7 | % | +2.4 | % | | 4,316 | +7.3 | % | | 2,480 | -4.0 | % | | 3,668 | +13.8 | % |
Appendix 2: Business net income statement
| | | | | | | | | | | | | | | | | | | | | | | | | | | | | | | | | | | | | | |
| Q1 2024 | Biopharma | Consumer Healthcare | Other | Total Group |
| € million | Q1 2024 | Q1 2023 | Change | Q1 2024 | Q1 2023 | Change | Q1 2024 | Q1 2023 | Change | Q1 2024 | Q1 2023 | Change |
| Net sales | 8,939 | 8,727 | 2.4% | 1,525 | 1,495 | 2.0% | — | — | —% | 10,464 | 10,222 | 2.4% |
| Other revenues | 639 | 626 | 2.1% | 15 | 15 | —% | — | — | —% | 654 | 641 | 2.0% |
| Cost of Sales | (2,862) | (2,569) | 11.4% | (565) | (508) | 11.2% | 3 | (2) | -250.0% | (3,424) | (3,079) | 11.2% |
| As % of net sales | (32.0%) | (29.4%) | | (37.0%) | (34.0%) | | | | | (32.7%) | (30.1%) | |
| Gross Profit | 6,716 | 6,784 | -1.0% | 975 | 1,002 | -2.7% | 3 | (2) | -250.0% | 7,694 | 7,784 | -1.2% |
| As % of net sales | 75.1% | 77.7% | | 63.9% | 67.0% | | | | | 73.5% | 76.1% | |
| Research and development expenses | (1,675) | (1,510) | 10.9% | (44) | (53) | -17.0% | — | — | —% | (1,719) | (1,563) | 10.0% |
| As % of net sales | (18.7%) | (17.3%) | | (2.9%) | (3.5%) | | | | | (16.4%) | (15.3%) | |
| Selling and general expenses | (2,093) | (2,124) | -1.5% | (514) | (484) | 6.2% | 2 | 1 | 100.0% | (2,605) | (2,607) | -0.1% |
| As % of net sales | (23.4%) | (24.3%) | | (33.7%) | (32.4%) | | | | | (24.9%) | (25.5%) | |
| Other current operating income/expenses | (617) | (386) | | 54 | 71 | | 1 | 11 | | (562) | (304) | |
| Share of profit/loss of associates* and joint ventures | 38 | 30 | | 6 | 3 | | — | — | | 44 | 33 | |
| Net income attributable to non controlling interests | (4) | (5) | | (5) | (5) | | — | — | | (9) | (10) | |
| Business operating income | 2,365 | 2,789 | -15.2% | 472 | 534 | -11.6% | 6 | 10 | -40.0% | 2,843 | 3,333 | -14.7% |
| As % of net sales | 26.5% | 32.0% | | 31.0% | 35.7% | | | | | 27.2% | 32.6% | |
| | | | | | | | | | | | |
| | | | Financial income and expenses | (43) | (7) | |
| | | | Income tax expenses | | (581) | (627) | |
| | | | Tax rate** | | 21.0% | 19.0% | |
| | | | Business net income | | 2,219 | 2,699 | -17.8% |
| | | | As % of net sales | | 21.2% | 26.4% | |
| | | | | | | | |
| | | | Business earnings / share(in euros)*** | 1.78 | 2.16 | -17.6% |
* Net of tax.
** Determined on the basis of Business income before tax, associates, and non-controlling interests.
*** Based on an average number of shares outstanding of 1,248.8 million in the first quarter of 2024 and 1,249.3 million in the first quarter of 2023.
Appendix 3: Consolidated income statements
| | | | | | | | | | |
| € million | | | Q1 2024 | Q1 2023 |
| Net sales | | | 10,464 | | 10,222 | |
| Other revenues | | | 654 | | 641 | |
| Cost of sales | | | (3,439) | | (3,079) | |
| Gross profit | | | 7,679 | | 7,784 | |
| Research and development expenses | | | (1,719) | | (1,563) | |
| Selling and general expenses | | | (2,605) | | (2,607) | |
| Other operating income | | | 444 | | 436 | |
| Other operating expenses | | | (1,006) | | (740) | |
| Amortization of intangible assets | | | (562) | | (489) | |
| Impairment of intangible assets | | | 17 | | (15) | |
| Fair value remeasurement of contingent consideration | | | 20 | | (15) | |
| Restructuring costs and similar items | | | (740) | | (240) | |
| Other gains and losses, and litigation | | | (79) | | (88) | |
| | | | |
| Operating income | | | 1,449 | | 2,463 | |
| Financial expenses | | | (253) | | (168) | |
| Financial income | | | 151 | | 161 | |
| Income before tax and associates and joint ventures | | | 1,347 | | 2,456 | |
| Income tax expense | | | (164) | | (459) | |
| Share of profit/(loss) of associates and joint ventures | | | (37) | | 12 | |
| | | | |
| | | | |
| Net income | | | 1,146 | | 2,009 | |
| Net income attributable to non-controlling interests | | | 13 | | 14 | |
| Net income attributable to equity holders of Sanofi | | | 1,133 | | 1,995 | |
| Average number of shares outstanding (million) | | | 1,248.8 | | 1,249.3 | |
| | | | |
| IFRS Earnings per share (in euros) | | | 0.91 | | 1.60 | |
Appendix 4: Reconciliation of Net income attributable to equity holders of Sanofi to Business net income
| | | | | | | | | | |
| € million | | | Q1 2024 | Q1 2023 |
| Net income attributable to equity holders of Sanofi | | | 1,133 | | 1,995 | |
Amortization of intangible assets (1) | | | 562 | | 489 | |
| Impairment of intangible assets | | | (17) | | 15 | |
| Fair value remeasurement of contingent consideration | | | (16) | | 19 | |
| Expenses arising from the impact of acquisitions on inventories | | | 15 | | — | |
| | | | |
| Restructuring costs and similar items | | | 740 | | 240 | |
| Other gains and losses, and litigation | | | 79 | | 88 | |
| Financial (income) / expense related to liabilities carried at amortized cost other than net indebtedness | | | 59 | | — | |
| | | | |
| Tax effect of the items listed above: | | | (424) | | (173) | |
| Amortization and impairment of intangible assets | | | (101) | | (94) | |
| Fair value remeasurement of contingent consideration | | | 3 | | (5) | |
| Expenses arising from the impact of acquisitions on inventories | | | (3) | | — | |
| Restructuring costs and similar items | | | (272) | | (49) | |
| | | | |
| Other items | | | (51) | | (25) | |
| | | | |
| Other tax effects | | | 7 | | 5 | |
| Other items | | | 81 | | 21 | |
| | | | |
| | | | |
| | | | |
| Business net income | | | 2,219 | | 2,699 | |
IFRS earnings per share (2) (in euros) | | | 0.91 | | 1.60 | |
(1)Of which related to amortization expense generated by the intangible assets measured at their acquisition-date fair values: €547 million in the first quarter of 2024 and €468 million in the first quarter of 2023.
(2)Based on an average number of shares outstanding of 1,248.8 million in the first quarter of 2024 and 1,249.3 million in the first quarter of 2023.
Appendix 5: Change in net debt
| | | | | | | | |
| € million | Q1 2024 | Q1 2023 |
| Business net income | 2,219 | | 2,699 | |
| Depreciation & amortization & impairment of property, plant and equipment and software | 349 | | 370 | |
| Other items | (370) | | (323) | |
| Operating cash flow | 2,198 | | 2,746 | |
| Changes in Working Capital | (1,764) | | (627) | |
| Acquisitions of property, plant and equipment and software | (512) | | (447) | |
| Free cash flow before restructuring, acquisitions and disposals | (78) | | 1,672 | |
Acquisitions of intangibles assets, investments and other long-term financial assets (1) | (253) | | (210) | |
| Restructuring costs and similar items paid | (456) | | (333) | |
Proceeds from disposals of property, plant and equipment, intangible assets and other non-current assets net of taxes (1) | 478 | | 408 | |
| Free cash flow | (309) | | 1,537 | |
Acquisitions of investments in consolidated undertakings including assumed debt (2) | (83) | | — | |
| | |
| Issuance of Sanofi shares | 14 | | 16 | |
| Acquisition of treasury shares | (302) | | (363) | |
| | |
| Other items | (61) | | (58) | |
| Change in net debt | (741) | | 1,132 | |
| Beginning of period | 7,793 | | 6,437 | |
| Closing of net debt | 8,534 | | 5,305 | |
(1)Free cash flow includes investments and divestments not exceeding a cap of €500 million per transaction (inclusive of all payments related to the transaction).
(2)Includes transactions that are above a cap of €500 million per transaction (inclusive of all payments related to the transaction).
Appendix 6: Currency sensitivity
2024 business EPS currency sensitivity
| | | | | | | | |
| Currency | Variation | Business EPS Sensitivity |
| US Dollar | +0.05 USD/EUR | -EUR 0.17 |
| Japanese Yen | +5 JPY/EUR | -EUR 0.02 |
| Chinese Yuan | +0.2 CNY/EUR | -EUR 0.02 |
| Brazilian Real | +0.4 BRL/EUR | -EUR 0.01 |
| Russian Ruble | +10 RUB/EUR | -EUR 0.01 |
Currency exposure on Q1 2024 sales
| | | | | |
| Currency | Q1 2024 |
| US $ | 42.6 | % |
| Euro € | 20.6 | % |
| Chinese Yuan | 6.6 | % |
| Japanese Yen | 3.7 | % |
| Brazilian Real | 2.6 | % |
| Mexican pesos | 1.8 | % |
| Russian ruble | 1.7 | % |
| British Pound | 1.4 | % |
| Australian $ | 1.3 | % |
| Canadian $ | 1.2 | % |
| Others | 16.5 | % |
Currency average rates
| | | | | | | | | | | | | | |
| Q1 2023 | Q1 2024 | Change | | | |
| €/$ | 1.073 | | 1.085 | | +1.2 | % | | | |
| €/Yen | 142.049 | | 161.152 | | +13.4% | | | |
| €/Yuan | 7.349 | | 7.821 | | +6.4% | | | |
| €/Real | 5.575 | | 5.375 | | -3.6 | % | | | |
| €/Ruble | 78.351 | | 98.637 | | +25.9% | | | |
Appendix 7: Definitions of non-IFRS financial indicators
Company sales at constant exchange rates (CER)
When we refer to changes in our net sales “at constant exchange rates” (CER), this means that we exclude the effect of changes in exchange rates.
We eliminate the effect of exchange rates by recalculating net sales for the relevant period at the exchange rates used for
the previous period.
Reconciliation of net sales to Company sales at constant exchange rates for Q1 2024.
| | | | | | |
| € million | Q1 2024 | |
| Net sales | 10,464 | | |
| Effect of exchange rates | (444) | | |
| Company sales at constant exchange rates | 10,908 | | |
Business net income
Sanofi publishes a key non-IFRS indicator. Business net income is defined as net income attributable to equity holders of Sanofi excluding:
•amortization of intangible assets,
•impairment of intangible assets,
•fair value remeasurement of contingent consideration related to business combinations or to disposals,
•expenses arising from the impact of acquisitions on inventories
•restructuring costs and similar items(1),
•other gains and losses (including gains and losses on disposals of non-current assets(1)),
•costs or provisions associated with litigation(1),
•upfront payments and regulatory milestone payments recognized in the line item Other operating income and arising from transactions outside the scope of Sanofi's ordinary activities,
•financial (income)/expense related to liabilities carried at amortized cost other than net indebtedness,
•tax effects related to the items listed above as well as effects of major tax disputes,
•the share of profits/losses from investments accounted for using the equity method, except for joint ventures and associates with which Sanofi has a strategic alliance,
•net income attributable to non-controlling interests related to the items listed above.
(1) Reported in the line items Restructuring costs and similar items and Gains and losses on disposals, and litigation, which are defined in Notes B.16. and B.17. to our consolidated financial statements.
Free cash flow
Free cash flow is a non-IFRS financial indicator which is reviewed by our management, and which we believe provides useful information to measure the net cash generated from Sanofi’s operations that is available for strategic investments1 (net of divestments1), for debt repayment, and for capital return to shareholders. Free cash flow is determined from the Business net income adjusted for depreciation, amortization and impairment, share of profit/loss in associates and joint ventures net of dividends received, gains & losses on disposals, net change in provisions including pensions and other post-employment benefits, deferred taxes, share-based expense and other non-cash items. It comprises net changes in working capital, capital expenditures and other asset acquisitions2 net of disposal proceeds2, and payments related to restructuring and similar items. Free cash flow is not defined by IFRS and it is not a substitute measure for the IFRS aggregate net cash flows in operating activities.
1 Amount of the transaction above a cap of €500 million per transaction (inclusive of all payments related to the transaction).
2 Not exceeding a cap of €500 million per transaction (inclusive of all payments related to the transaction).
Appendix 8: CSR dashboards
Data are presented in YTD unless stated otherwise.
| | | | | | | | | | | | |
| Topic | Ambition | Progress | |
| Affordable access | |
| | Q1 2024 | Q1 2023 | |
| Sanofi Global Health | Reach 1.5 million NCD patients by 2026 (cumulative since 2022) and 2 million by 2030
| 57,889 patients treated in 18 countries
44 active healthcare partnerships in 21 countries
4 investments signed through the Impact Fund (cumulative since launch) | 54,396 patients treated in 19 countries
13 active healthcare partnerships in 14 countries
1 investment signed through the Impact Fund | |
| | Q1 2024 | Q1 2023 | |
| Vials donations | Donate 100,000 vials a year to treat people with rare diseases | 1,112 patients treated 17,287 vials donated | 1,065 patients treated
21,542 vials donated | |
| | Q1 2024 | Q4 2023 | |
| Global Access Plans | Develop a Global Access Plan for all new products to make them available within two years after first launch | 10 Global Access Plans initiated or developed covering more than 14 indications | 8 Global Access Plans initiated or developed covering more than 12 indications | |
| R&D for unmet needs | |
| FY 2023 | FY2022 | |
| Sleeping sickness | Develop and supply innovative treatments to support the elimination of sleeping sickness by 2030
| Data updated annually, next update in Q2 2024 | 1.5 million patients tested
837 patients treated | |
| | Q1 2024 | Q1 2023 | |
| Polio | Provide inactivated polio vaccines (IPV) to UNICEF for GAVI countries to support polio eradication efforts | 9.4 million IPV doses supplied to UNICEF for GAVI countries | 7 million IPV doses supplied to UNICEF for GAVI countries | |
| | Q1 2024 | Q4 2023 | |
Pediatric cancer treatment development
| Develop innovative treatments to eliminate cancer death in children | 3 assets undergoing pre-clinical assessment
1 asset in clinical study | 3 assets undergoing pre-clinical assessment
First pediatric patient dosed with 1 clinical asset in a clinical study (less than 2 years after the 1st adult patient was dosed with this compound) | |
| Planet Care | |
| | Q1 2024 | Q4 2023 | |
Climate change - Carbon footprint (CO2 emissions) | 55% reduction in scope 1&2 greenhouse gas emissions (CO2 equivalent) by 2030 (cumulative vs 2019 baseline) to contribute to carbon neutrality by 2030 and net zero emissions by 2045 (all scopes) | 42% GHG reduction vs 2019 | 38% GHG reduction vs 2019 | |
| Renewable electricity | 100% of renewable electricity in all our sites by 2030
| 84% | 79% | |
| Eco-car fleet | 100% eco-car fleet in 2030
| 44% eco-car fleet | 43% eco-car fleet | |
| Blister free syringe vaccines | 100% blister free syringe vaccines by 2027 | Next update at Q4 2024 | 39% blister free syringe vaccines | |
| | | | | | | | | | | | |
| Eco-design | All new products to be eco-designed by 2025
| 13 LCAs completed & 5 in progress (new and marketed products) | 13 LCAs completed & 2 in progress (new and
marketed products) | |
In and beyond the workplace
| |
| | Q1 2024 | Q4 2023 | |
| Global Gender balance | Ambition of 50% of women in senior leadership roles by 2025 | 45% | 44% | |
| Ambition of 40% of women in executive roles by 2025 | 41% | 40% | |
Engagement with communities
| Engage socially and economically with all communities where we operate
| Next update in Q2 2024 | 12,240 volunteers
75,376 hours | |
From Leaders to Citizens
| 100% of Sanofi leaders have CSR in their development path | 70% of the leaders have completed the eLearning phase
30% of the leaders have completed the full program | 71% of the leaders have completed the eLearning phase
30% of the leaders have completed the full program | |
End.