Exhibit 99.2
2017
HALF-YEAR MANAGEMENT REPORT
CONTENTS
2 HALF-YEAR MANAGEMENT REPORT | 38 | |||
A/ Significant events of the first half of 2017 | 39 | |||
B/ Events subsequent to June 30, 2017 | 42 | |||
C/ Consolidated financial statements for the first half of 2017 | 43 | |||
D/ Risk factors and related party transactions | 65 | |||
E/ Outlook | 65 | |||
F/ Appendix — Definition of Financial Indicators | 67 | |||
G/ Appendix — Research and Development Pipeline | 69 | |||
2 HALF-YEAR MANAGEMENT REPORT
A/ Significant events of the first half of 2017
A.1. PHARMACEUTICALS
On January 1, 2017, Sanofi and Boehringer Ingelheim (BI) finalized the strategic transaction agreed in June 2016, involving the exchange of Sanofi’s Animal Health business (Merial) for BI’s Consumer Healthcare business in most countries. After taking account of preliminary enterprise value adjustments, the exchange values of the two businesses as effectively transferred during the first half of 2017 were determined at €10,320 million for Sanofi’s Animal Health business and €6,271 million for BI’s Consumer Healthcare business. Finalization of the divestment of Merial in Mexico is expected in the second half of 2017. The divestment of the Animal Health business has generated an after-tax gain of €4.4 billion in 2017, excluding the effect of price adjustments and delayed business transfers (see Note B.1. to the condensed half-year consolidated financial statements).
A.1.1. Acquisitions and alliances
On February 27, 2017, Sanofi and Lonza announced a strategic partnership to build and operate a large-scale mammalian cell culture facility for monoclonal antibody production in Visp, Switzerland. An initial investment of approximately €0.3 billion to finance construction of the facility will be made 50/50 by the two partners. In addition, Sanofi could pay Lonza in the region of €0.8 billion over the next fifteen years, partly as its share of operating expenses and of the cost of producing future batches, and partly to reserve capacity in the new facility.
A.1.2. Filings for marketing authorization for new products
| • | On January 4, 2017,Soliqua® 100/33 (once-daily fixed-dose injectable combination of insulin glargine 100 units/ml and lixisenatide 33 mcg/ml) became available in US pharmacies on medical prescription. Soliqua® 100/33 is indicated for the treatment of adults with type 2 diabetes inadequately controlled on basal insulin (less than 60 units daily) or lixisenatide alone. On January 18, 2017, the European Commission granted marketing authorization in Europe forSuliqua® (the brand name for the same product in Europe) for the treatment of adults with type 2 diabetes. Suliqua® is authorized for use in combination with metformin to improve control over blood sugar levels when this has not been provided by metformin alone or metformin combined with another oral glucose-lowering medicinal product or with basal insulin. |
| • | At the start of February 2017, the US Food and Drug Administration (FDA) approvedXyzal® Allergy 24HR as an over-the-counter (OTC) treatment for the relief of symptoms associated with seasonal and year-round allergies. Two formulations of Xyzal® are now approved for OTC use: 5 mg tablets for ages 6 years and older, and 0.5 mg/mL oral solution for ages 2 years and older. Xyzal® is an oral antihistamine with a proven 24-hour effect. |
| • | On March 28, 2017, Sanofi and Regeneron Pharmaceuticals, Inc. announced that the FDA had approvedDupixent® (dupilumab) injectable solution, the first and only biologic medicine approved for the treatment of adults with moderate-to-severe atopic dermatitis whose disease is not adequately controlled with topical prescription therapies, or when those therapies are not advisable. |
| • | On May 19, 2017, Sanofi announced that the Committee for Medicinal Products for Human Use (CHMP) of the European Medicines Agency (EMA) had adopted a positive opinion for the marketing authorization ofInsulin lispro Sanofi® (insulin lispro 100 units/ml). The CHMP recommended the use of Insulin lispro Sanofi® to treat adults and children who have diabetes and need insulin to control their blood sugar level, including those patients whose diabetes has just been diagnosed. Approval for the product was obtained from the European Commission on July 19, 2017. |
| • | On May 22, 2017, Sanofi and Regeneron Pharmaceuticals, Inc. announced that the FDA had approvedKevzara® (sarilumab) for the treatment of adult patients with moderately to severely active rheumatoid arthritis who have had an inadequate response or intolerance to one or more disease modifying antirheumatic drugs (DMARDs), such as methotrexate1. Kevzara® was also approved in the European Union on June 27, 2017 for the same indication. The product may be used as monotherapy in the event of intolerance or contra-indication of methotrexate. The first country to approve the product was Canada, on February 1, 2017. |
| 1 | Prescribing Information Kevzara® (sarilumab). May 2017 |
2017Half-Year Financial Report • Sanofi | 39
A.1.3. Research and development
For an update on our research and development (R&D) pipeline, refer to the appendix in Section G of this half-year management report.
The principal R&D announcements during the first half of 2017 were as follows:
Phase IV:
| • | On June 11, 2017, positive results were announced from two Phase IIIb/IV trials (ODYSSEY-DM) evaluatingPraluent® in patients with diabetes and hypercholesterolemia. In the studies, Praluent®, when administered on top of maximally tolerated doses of statins, significantly reduced low-density lipoprotein cholesterol (LDL-C) (ODYSSEY DM-INSULIN study) and non-high-density lipoprotein cholesterol (non-HDL-C) (ODYSSEY DM-DYSLIPIDEMIA study). Both studies also found that a majority of patients reached their lipid goals with Praluent® 75 mg every two weeks, with an overall safety profile comparable to the ODYSSEY Phase III program. |
Phase III:
| • | On March 4, 2017, Sanofi and Regeneron Pharmaceuticals, Inc. presented detailed results from the one-year Phase III CHRONOS study, which showed that patients receiving the investigational drugDupixent® (dupilumab) with topical corticosteroids (TCS) achieved significantly improved measures of overall disease severity compared to TCS alone in adults with uncontrolled moderate-to-severe atopic dermatitis. |
| • | Results from the CAFÉ study evaluatingdupilumab in the treatment of cyclosporine-resistant adults with moderate-to-severe atopic dermatitis were positive, and showed a satisfactory safety profile. |
| • | Two phase III studies withdupilumab were initiated during the first half of 2017, one in the treatment of persistent asthma in children aged 6 to 11 years and the other in the treatment of atopic dermatitis in adolescents aged 12 to 17 years. |
| • | SAR439684 (PD-1 inhibitor), developed in collaboration with Regeneron, entered Phase III in the treatment of non small cell lung cancer. |
Phase II:
| • | SP0232/MEDI8897(collaboration with MedImmune), a monoclonal antibody for the prevention of Respiratory Syncytial Virus (RSV) associated illness in newborns and infants, entered the pipeline in Phase II. |
| • | SAR566658, a maytansine-loaded anti-CA6 monoclonal antibody, entered Phase II in the treatment of triple negative breast cancer. |
| • | GZ402671/venglustat, a glucosylceramide synthase inhibitor, entered Phase IIb for the treatment of Gaucher disease type 3. The product also entered Phase IIa in the treatment of Fabry disease. |
| • | Two Phase II studies have begun to evaluateisatuximab in acute lymphoblastic leukemia and latent multiple myeloma. |
| • | A Phase II study has begun evaluatingSAR439684 (PD-1), developed in collaboration with Regeneron, in the treatment of basocellular carcinoma. |
Phase I:
| • | SAR440181/MYK491 (collaboration with MyoKardia) entered Phase I in the treatment of dilated cardiomyopathy (DCM1 myosin activation). |
| • | SAR439459 (TGFb inhibitor, monoclonal antibody) entered Phase I as monotherapy and in combination with SAR439684 in the treatment of metastatic melanoma. |
40 | Sanofi •2017 Half-Year Financial Report
A.2. HUMAN VACCINES (VACCINES)
At the end of December 2016, Sanofi Pasteur and MSD (known as Merck in the United States and Canada) ended their European joint venture Sanofi Pasteur MSD (SPMSD). This transaction was treated as a divestment of our share in the joint venture, and the acquisition of the vaccines portfolio reverting to Sanofi. With effect from January 1, 2017, the additional net sales generated by this transaction are reflected in our 2017 first-half consolidated net sales. The amount of those additional net sales for the first half of 2016 is estimated at €97 million.
A.2.1. Partnerships and collaborations
On March 3, 2017, Sanofi and its vaccines global business unit Sanofi Pasteur announced an agreement withMedImmune, the global biologics research and development arm of AstraZeneca, to develop and commercialize a monoclonal antibody called MEDI8897 for the prevention of Respiratory Syncytial Virus (RSV) associated illness in newborns and infants. According to the US Centers for Disease Control and Prevention, RSV is the most common cause of lower respiratory tract infections in children aged under 1 in the United States and worldwide.
A.2.2. Research and development
| • | Volunteers are being recruited to a Phase III clinical trial evaluating the efficacy of the vaccine againstClostridium difficile symptomatic infections. |
| • | A Phase III trial of the high-dose quadrivalent inactivated influenza vaccineFluzone® QIV HD in patients aged over 65 years is currently in preparation. |
| • | Phase III clinical trials are ongoing for the second-generation meningococcal ACYW conjugate vaccineMen Quad TT, indicated for a broader population (from children to seniors). |
A.3. OTHER SIGNIFICANT EVENTS OF THE FIRST HALF OF 2017
A.3.1. Corporate governance
The Annual General Meeting of Sanofi shareholders was held in Paris on May 10, 2017. All of the resolutions submitted to the vote were adopted. The meeting approved a cash dividend of €2.96 per share, payable on May 18, 2017. The meeting also approved the appointment of Melanie Lee and Bernard Charlès as independent directors, and the reappointment of Fabienne Lecorvaisier as a director, to serve for a four-year term expiring at the Annual General Meeting called to approve the 2020 financial statements. In addition, the meeting voted to amend the Articles of Association to allow for the appointment of two employee directors. Further to that amendment, Marion Palme (a German citizen) and Christian Senectaire (a French citizen) were designated as employee directors in June 2017. The new Board of Directors has 16 members, 7 of them women. A substantial majority of the directors are independent.
A.3.2. Legal and arbitration proceedings
For a description of the most significant developments in legal and arbitration proceedings since publication of the financial statements for the year ended December 31, 2016, refer to Note B.14. to the condensed half-year consolidated financial statements.
The following events have occurred in respect of litigation, arbitration and other legal proceedings in which Sanofi and its affiliates are involved:
Patents
| • | Lantus® Mylan Inter Partes Review Petition in the US |
In June 2017, Mylan Pharmaceuticals, Inc. filed petitions forInter Partes Review (IPR) for US Patent Nos. 7,476,652 and 7,713,930 regarding Lantus® with the United States Patent Office Patent Trial and Appeal Board (PTAB). In these petitions, Mylan attacks the validity of all claims of these patents.
| • | Lantus® Merck Patent Litigation in the US |
In the patent litigation against Merck on Lantus®, the claim construction hearing has been rescheduled for September 20, 2017 and briefing on Summary Judgment Motions on certain issues pertaining to some of the patents-in-suit is now scheduled to begin on November 17, 2017.
2017Half-Year Financial Report • Sanofi | 41
| • | Multaq® Patent Litigation in the US |
In April 2017, Sanofi and Lupin settled the ongoing patent litigation on Multaq® and Sanofi went to trial on the ‘900 patent against Sandoz and Watson.
Government Investigations and Related Litigation
In March 2017, the Washington State Attorney General’s office issued a civil investigative demand calling for the production of documents and information relating to pricing and trade practices for Lantus®, Toujeo®, Apidra® and Soliqua®, from January 1, 2005 through present. Sanofi US is cooperating with this investigation.
In March and April 2017, two additional actions were filed against Sanofi in New Jersey court on behalf of putative class of diabetes patients alleging violations of the Racketeer Influenced and Corrupt Organizations Act, in connection with the pricing of Lantus®.
B/ Events subsequent to June 30, 2017
| • | On July 10, 2017, Sanofi Genzyme and Alnylam Pharmaceuticals, Inc., the leading RNAi therapeutics company, announced new positive results from the ongoing phase II open-label extension study withfitusiran in patients with hemophilia A and B, with or without inhibitors. Based on those results, Sanofi and Alnylam have announced the launch of a Phase III program (ATLAS) on fitusiran in patients with hemophilia A and B, with or without inhibitors. |
| • | On July 11, 2017, Sanofi announced that it will acquireProtein Sciences, a privately held biotechnology company based in Meriden, Connecticut in the United States. Under the terms of the agreement between the two companies, Sanofi will make an upfront payment of $650 million and could pay up to a further $100 million upon attainment of certain milestones. In October 2016, Protein Sciences obtained FDA approval for its Flublok® quadrivalent influenza vaccine. Flublok® is the only recombinant protein-based influenza vaccine approved by the FDA. The acquisition is expected to close in the third quarter of 2017, subject to customary regulatory approvals. |
| • | On July 21, 2017, the Committee for Medicinal Products for Human Use (CHMP) of the European Medicines Agency (EMA) adopted a positive opinion on the market authorization application forDupixent® (dupilumab) for the treatment of adults with moderate-to-severe atopic dermatitis. |
| • | On July 31, 2017, 1,621,098 shares (approximately 0.13% of the share capital) were issued in connection withAction 2017, a global employee share ownership plan intended to give Sanofi employees a greater stake in the company’s results and future development. A total of 25,758 employees signed up to the plan between June 19 and June 30, 2017, subscribing for Sanofi shares at a price of €70.01 per share. For each tranche of five shares applied for, the applicant received one additional new share by way of employer’s contribution; and for each application for 20 or more shares, the applicant received an additional four new shares by way of employer’s contribution. |
42 | Sanofi •2017 Half-Year Financial Report
C/ Consolidated financial statements for the first half of 2017
For definitions of financial indicators, refer to the appendix in Section F of this report. Unless otherwise indicated, all financial data in this report are presented in accordance with international financial reporting standards (IFRS), including international accounting standards and interpretations (see Note A.1 to the condensed half-year consolidated financial statements).
C.1. CONSOLIDATED RESULTS FOR THE FIRST HALF OF 2017
Consolidated income statements for the six months ended June 30, 2016 and June 30, 2017
| (€ million) | June 30, 2017 (6 months)(a) | as % of net sales | June 30, 2016 (6 months)(a) | as % of net sales | ||||||||||||
Net sales | 17,311 | 100.0 | % | 15,926 | 100.0 | % | ||||||||||
Other revenues | 519 | 3.0 | % | 310 | 1.9 | % | ||||||||||
Cost of sales | (5,670 | ) | (32.8 | %) | (4,970 | ) | (31.2 | %) | ||||||||
Gross profit | 12,160 | 70.2 | % | 11,266 | 70.7 | % | ||||||||||
Research and development expenses | (2,667 | ) | (15.4 | %) | (2,514 | ) | (15.8 | %) | ||||||||
Selling and general expenses | (5,046 | ) | (29.1 | %) | (4,609 | ) | (28.9 | %) | ||||||||
Other operating income | 173 | 265 | ||||||||||||||
Other operating expenses | (71 | ) | (195 | ) | ||||||||||||
Amortization of intangible assets | (990 | ) | (877 | ) | ||||||||||||
Impairment of intangible assets | (12 | ) | (52 | ) | ||||||||||||
Fair value remeasurement of contingent consideration | (100 | ) | (67 | ) | ||||||||||||
Restructuring costs and similar items | (364 | ) | (627 | ) | ||||||||||||
Other gains and losses, and litigation | (7 | ) | — | |||||||||||||
Operating income | 3,076 | 17.8 | % | 2,590 | 16.3 | % | ||||||||||
Financial expenses | (218 | ) | (241 | ) | ||||||||||||
Financial income | 95 | 50 | ||||||||||||||
Income before tax and associates and joint ventures | 2,953 | 17.1 | % | 2,399 | 15.1 | % | ||||||||||
Income tax expense | (610 | ) | (497 | ) | ||||||||||||
Share of profit/(loss) of associates and joint ventures | 38 | 98 | ||||||||||||||
Net income excluding the exchanged/held-for-exchange Animal Health business | 2,381 | 13.8 | % | 2,000 | 12.6 | % | ||||||||||
Net income/(loss) of the exchanged/held-for-exchange Animal Health business | 4,421 | 286 | ||||||||||||||
Net income | 6,802 | 2,286 | ||||||||||||||
Net income attributable to non-controlling interests | 64 | 41 | ||||||||||||||
Net income | ||||||||||||||||
Attributable to equity holders of Sanofi | 6,738 | 38.9 | % | 2,245 | 14.1 | % | ||||||||||
Average number of shares outstanding (million) | 1,260.3 | 1,287.6 | ||||||||||||||
Average number of shares outstanding after dilution (million) | 1,270.6 | 1,296.6 | ||||||||||||||
– Basic earnings per share (in euros) | 5.35 | 1.74 | ||||||||||||||
– Basic earnings per share excluding the exchanged/held-for-exchange Animal Health business (in euros) | 1.84 | 1.52 | ||||||||||||||
– Diluted earnings per share (in euros) | 5.30 | 1.73 | ||||||||||||||
– Diluted earnings per share excluding the exchanged/held-for-exchange Animal Health business (in euros) | 1.82 | 1.51 | ||||||||||||||
| (a) | The results of the Animal Health business for 2016, and the gain on the divestment of that business in 2017, are presented separately in accordance with IFRS 5 (Non-Current Assets Held for Sale and Discontinued Operations); see Note B.21. |
2017Half-Year Financial Report • Sanofi | 43
C.2. SEGMENT INFORMATION
C.2.1. Operating segments
In accordance with IFRS 8 (Operating Segments), the segment information reported by Sanofi is prepared on the basis of internal management data provided to the Chief Executive Officer, who is the chief operating decision maker. The performance of those segments is monitored individually using internal reports and common indicators. The operating segment disclosures required under IFRS 8 are provided in Note B.20. to the condensed half-year consolidated financial statements.
Sanofi has two operating segments: Pharmaceuticals and Human Vaccines (Vaccines).
The Pharmaceuticals segment comprises the commercial operations of the following franchises: Specialty Care (Rare Diseases, Multiple Sclerosis, Oncology), Diabetes & Cardiovascular, Established Prescription Products, Consumer Healthcare, and Generics, and dedicated research and development, production and marketing activities for all of Sanofi’s pharmaceuticals operations. This segment also includes all associates whose activities are related to pharmaceuticals, in particular Regeneron, Onduo and the entities majority owned by Bristol Myers Squibb (BMS).
The Vaccines segment is wholly dedicated to vaccines and includes the commercial operations of Sanofi Pasteur and dedicated research and development, production and marketing activities for Sanofi’s vaccines operations. This segment included the Sanofi Pasteur MSD joint venture until December 30, 2016, the date on which the joint venture ended.
Each segment includes global support function costs as allocated for internal reporting purposes within Sanofi.
The “Other” segment includes all activities that do not qualify as reportable segments under IFRS 8. This segment includes the effects of retained commitments in respect of divested activities.
Inter-segment transactions are not material.
C.2.2. Business operating income
We report segment results on the basis of “business operating income”. This indicator is used internally by the chief operating decision maker to measure the performance of each operating segment and to allocate resources. For a definition of “business operating income”, and a reconciliation between that indicator andIncome before tax and associates and joint ventures, refer to Note B.20.1 to our condensed half-year consolidated financial statements.
C.2.3. Business net income
We believe that understanding of our operational performance by our management and our investors is enhanced by reporting “business net income”. This non-GAAP financial measure1 represents business operating income, less net financial expenses and the relevant income tax effects. For the six months ended June 30, 2016 and the year ended December 31, 2016, “Business net income” consists of (i) “Business net income excluding Animal Health”, determined as described above, and (ii) “Animal Health business net income”, determined on a similar and comparable basis.
| 1 | Refer to the appendix in section F for a definition. |
44 | Sanofi •2017 Half-Year Financial Report
The table below reconciles our business operating income to our business net income:
| (€ million) | June 30, 2017 (6 months) | June 30, 2016 (6 months) | December 31, 2016 (12 months) | |||||||||
Business operating income | 4,741 | 4,216 | 9,285 | |||||||||
Financial income and expenses(a) | (123 | ) | (191 | ) | (399 | ) | ||||||
Income tax expense | (1,127 | ) | (922 | ) | (2,054 | ) | ||||||
Business net income excluding Animal Health | 3,491 | 3,103 | 6,832 | |||||||||
Animal Health business net income | — | 299 | 476 | |||||||||
Business net income | 3,491 | 3,402 | 7,308 | |||||||||
| (a) | For 2016, this line does not include the €457 million impairment loss charged against Sanofi’s equity investment in Alnylam. |
The table below reconciles our business net income toNet income attributable to equity holders of Sanofi:
| (€ million) | June 30, (a) 2017 (6 months) | June 30, (a) 2016 (6 months) | December 31, (a) 2016 (12 months) | |||||||||
Net income attributable to equity holders of Sanofi | 6,738 | 2,245 | 4,709 | |||||||||
Amortization of intangible assets(b) | 990 | 877 | 1,692 | |||||||||
Impairment of intangible assets | 12 | 52 | 192 | |||||||||
Fair value remeasurement of contingent consideration | 100 | 67 | 135 | |||||||||
Expenses arising from the impact of acquisitions on inventories | 176 | — | — | |||||||||
Restructuring costs and similar items | 364 | 627 | 879 | |||||||||
Impairment loss charged against the equity investment in Alnylam | — | — | 457 | |||||||||
Other gains and losses, and litigation(c) | 7 | — | (211 | ) | ||||||||
Tax effects of the items listed above(d): | (628 | ) | (548 | ) | (841 | ) | ||||||
amortization of intangible assets | (345 | ) | (307 | ) | (647 | ) | ||||||
impairment of intangible assets | (4 | ) | (16 | ) | (47 | ) | ||||||
fair value remeasurement of contingent consideration | (31 | ) | (15 | ) | (24 | ) | ||||||
expenses arising from the impact of acquisitions on inventories | (56 | ) | — | — | ||||||||
restructuring costs and similar expenses | (126 | ) | (210 | ) | (95 | ) | ||||||
other tax effects | (66 | ) | — | (28 | ) | |||||||
Other tax items | 111 | 113 | 113 | |||||||||
Share of items listed above attributable to non-controlling interests | (1 | ) | (9 | ) | (22 | ) | ||||||
Associates and joint ventures: restructuring costs and expenses arising from the impact of acquisitions | 43 | (54 | ) | (9 | ) | |||||||
Items relating to the Animal Health business(e) | (4,421 | ) | 13 | 162 | ||||||||
Other Sanofi Pasteur MSD items(f) | — | 19 | 52 | |||||||||
Business net income | 3,491 | 3,402 | 7,308 | |||||||||
| (a) | The results of the Animal Health business for 2016, and the gain arising on the divestment of that business in 2017, are presented separately in accordance with IFRS 5 (Non-Current Assets Held for Sale and Discontinued Operations). |
| (b) | Includes amortization expense generated by the remeasurement of intangible assets in connection with business combinations: €919 million in the first half of 2017 and €809 million in the first half of 2016. |
| (c) | This line comprises (i) for the first half of 2017, the separation costs associated with the process of disinvesting from the Generics business in Europe, before tax effects and (ii) for 2016, the pre-tax gain on the divestment of Sanofi’s interest in the Sanofi Pasteur MSD joint venture. |
| (d) | For the year ended December 31, 2016, this line includes the impact on deferred tax assets and liabilities arising from the reconciling items (in particular amortization and impairment of intangible assets, and restructuring costs) as a result of changes in tax rates, mainly in France (28% standard rate effective as of January 1, 2020) and in Japan. |
| (e) | For 2017, this line shows the gains arising on the divestment of the Animal Health business. For 2016, this line shows the elimination of (i) the impact of the discontinuation of depreciation and impairment of property, plant & equipment with effect from the start date of IFRS 5 application; (ii) the impact of the amortization and impairment of intangible assets until the start date of IFRS 5 application; (iii) costs directly incurred as a result of the divestment; and (iv) tax effects of those items. |
| (f) | For 2016, this line shows the elimination of Sanofi’s share of the business net income of Sanofi Pasteur MSD from the date when Sanofi and MSD announced their intention to end their joint venture. |
2017Half-Year Financial Report • Sanofi | 45
C.3. ANALYSIS OF CONSOLIDATED RESULTS FOR THE FIRST HALF OF 2017
C.3.1. Net sales
Consolidated net sales for the first half of 2017 amounted to €17,311 million, 8.7% higher than in the first half of 2016. Exchange rate fluctuations had a positive effect of 1.7 percentage points overall; the favorable trends in the euro rate against the US dollar and Brazilian real outweighed unfavorable trends in the Egyptian pound, the Turkish lira and the pound sterling. At constant exchange rates (CER)1, net sales were up 7.0%, reflecting the acquisition of BI’s Consumer Healthcare business and the first-time consolidation of Sanofi’s European Vaccines business. At constant exchange rates and on a constant structure basis1, net sales rose by 2.0%.
Analysis of impact on net sales of changes in structure
| (€ million) | June 30, 2016 (6 months) | |||
BI Consumer Healthcare net sales(a) | 689 | |||
Net sales effect of first-time consolidation of European vaccines business (SPMSD)(a) | 97 | |||
Total impact of BI and SPMSD | 786 | |||
Other items | (8 | ) | ||
Total impact on net sales of changes in structure | 778 | |||
| (a) | Based on an unaudited sales estimate. |
Reconciliation of net sales to net sales at constant exchange rates and on a constant structure basis:
| (€ million) | June 30, 2017 (6 months) | June 30, 2016 (6 months) | Change | |||||||||
Net sales | 17,311 | 15,926 | +8.7 | % | ||||||||
Effect of exchange rates | (270 | ) | ||||||||||
Net sales at constant exchange rates | 17,041 | 15,926 | +7.0 | % | ||||||||
Impact of changes in structure | 778 | |||||||||||
Net sales at constant exchange rates and on a constant structure basis | 17,041 | 16,704 | +2.0 | % | ||||||||
| 1 | Refer to the appendix in section F for a definition. |
46 | Sanofi •2017 Half-Year Financial Report
C.3.1.1. Net sales by business segment
Our net sales comprise the net sales generated by our Pharmaceuticals and Human Vaccines (Vaccines) segments.
| (€ million) | June 30, 2017 (6 months) | June 30, 2016 (6 months) | Change | |||||||||
Pharmaceuticals | 15,511 | 14,504 | +6.9 | % | ||||||||
Vaccines | 1,800 | 1,422 | +26.6 | % | ||||||||
Net sales | 17,311 | 15,926 | +8.7 | % | ||||||||
C.3.1.2. Net Sales by Global Business Unit (GBU)
The table below presents net sales for our Global Business Units (GBUs), reflecting the new structure intended to streamline our organization, sharpen our focus and concentrate our efforts on growth drivers. Within that structure, Emerging Markets sales of Diabetes & Cardiovascular and Specialty Care products are included in the General Medicines & Emerging Markets GBU. Following the creation of the Consumer Healthcare GBU, sales of that GBU’s products (previously included in the General Medicines & Emerging Markets GBU) are presented on a separate line for information purposes.
| (€ million) | June 30, 2017 (6 months) | June 30, 2016 (6 months) | Change on a reported basis | Change at constant exchange rates | ||||||||||||
Sanofi Genzyme GBU(a) (Specialty Care)(b) | 2,818 | 2,414 | +16.7 | % | +14.9 | % | ||||||||||
Diabetes & Cardiovascular GBU(a) | 2,805 | 3,102 | -9.6 | % | -11.4 | % | ||||||||||
General Medicines & Emerging Markets GBU(c)(d) | 7,384 | 7,283 | +1.4 | % | +0.5 | % | ||||||||||
Consumer Healthcare GBU | 2,504 | 1,705 | +46.9 | % | +42.6 | % | ||||||||||
Total Pharmaceuticals | 15,511 | 14,504 | +6.9 | % | +5.3 | % | ||||||||||
Sanofi Pasteur (Vaccines) GBU | 1,800 | 1,422 | +26.6 | % | +24.5 | % | ||||||||||
Total | 17,311 | 15,926 | +8.7 | % | +7.0 | % | ||||||||||
| (a) | Does not include Emerging Markets net sales. |
| (b) | Rare Diseases, Multiple Sclerosis, Oncology and Immunology. |
| (c) | Includes net sales in Emerging Markets of Specialty Care and Diabetes & Cardiovascular products. |
| (d) | Emerging Markets: World excluding United States, Canada, Western and Eastern Europe (apart from Russia, Ukraine, Georgia, Belarus, Armenia and Turkey), Japan, South Korea, Australia, New Zealand and Puerto Rico. |
2017Half-Year Financial Report • Sanofi | 47
C.3.1.3. Net Sales by Franchise
The table below sets forth our 2017 first-half net sales by franchise in order to facilitate direct comparisons with our peers. For a detailed reconciliation of net sales by franchise and net sales by GBU for our Pharmaceuticals segment, refer to the table later in this report showing Pharmaceuticals segment net sales by geographical region.
| (€ million) | June 30, 2017 (6 months) | June 30, 2016 (6 months) | Change on a reported basis | Change at constant exchange | ||||||||||||
Rare Diseases | 1,464 | 1,353 | +8.2 | % | +6.7 | % | ||||||||||
Multiple Sclerosis | 1,045 | 790 | +32.3 | % | +30.0 | % | ||||||||||
Oncology | 795 | 721 | +10.3 | % | +8.6 | % | ||||||||||
Immunology | 27 | — | — | — | ||||||||||||
Total Specialty Care | 3,331 | 2,864 | +16.3 | % | +14.5 | % | ||||||||||
of which Developed Markets (Sanofi Genzyme GBU) | 2,818 | 2,414 | +16.7 | % | +14.9 | % | ||||||||||
of which Emerging Markets(a)(b) | 513 | 450 | +14.0 | % | +12.7 | % | ||||||||||
Diabetes | 3,310 | 3,591 | -7.8 | % | -9.2 | % | ||||||||||
Cardiovascular | 257 | 203 | +26.6 | % | +23.2 | % | ||||||||||
Total Diabetes & Cardiovascular | 3,567 | 3,794 | -6.0 | % | -7.5 | % | ||||||||||
of which Developed Markets (Diabetes & Cardiovascular GBU) | 2,805 | 3,102 | -9.6 | % | -11.4 | % | ||||||||||
of which Emerging Markets(a)(b) | 762 | 692 | +10.1 | % | +10.4 | % | ||||||||||
Established Prescription Products(a) | 5,199 | 5,208 | -0.2 | % | -0.9 | % | ||||||||||
Generics(a) | 910 | 933 | -2.5 | % | -5.0 | % | ||||||||||
Consumer Healthcare (Consumer Healthcare GBU) | 2,504 | 1,705 | +46.9 | % | +42.6 | % | ||||||||||
Total Pharmaceuticals | 15,511 | 14,504 | +6.9 | % | +5.3 | % | ||||||||||
Vaccines (Sanofi Pasteur GBU) | 1,800 | 1,422 | +26.6 | % | +24.5 | % | ||||||||||
Total | 17,311 | 15,926 | +8.7 | % | +7.0 | % | ||||||||||
| (a) | These items are aggregated to form the General Medicines and Emerging Markets GBU. |
| (b) | Emerging Markets: World excluding United States, Canada, Western and Eastern Europe (apart from Russia, Ukraine, Georgia, Belarus, Armenia and Turkey), Japan, South Korea, Australia, New Zealand and Puerto Rico. |
C.3.1.4. Pharmaceuticals segment
Net sales of thePharmaceuticalssegment were €15,511 million in the first half of 2017, up 6.9% on a reported basis and 5.3% at constant exchange rates. At constant exchange rates and on a constant structure basis, net sales growth was 0.6%.
Theyear-on-year increase of €1,007 million mainly reflects the impact of the acquisition of BI’s Consumer Healthcare business (€689 million) and positive exchange rate effects of €240 million, along with the following effects at constant exchange rates and on a constant structure basis:
| • | higher net sales for the Multiple Sclerosis franchise (+€237 million), the Rare Diseases franchise (+€92 million) and the Oncology franchise (+€62 million), and for Consumer Healthcare (+€57 million); |
| • | lower net sales for the Diabetes franchise (-€330 million) and for Established Prescription Products (-€61 million). |
48 | Sanofi •2017 Half-Year Financial Report
Net sales by product and franchise
| (€ million) | Indication | June 30, 2017 (6 months) | June 30, 2016 (6 months) | Change a reported basis | Change at constant exchange | |||||||||||||
Cerezyme® | Gaucher disease | 369 | 381 | -3.1 | % | -3.4 | % | |||||||||||
Cerdelga® | Gaucher disease | 62 | 49 | +26.5 | % | +24.5 | % | |||||||||||
Myozyme®/Lumizyme® | Pompe disease | 393 | 348 | +12.9 | % | +11.5 | % | |||||||||||
Fabrazyme® | Fabry disease | 367 | 316 | +16.1 | % | +13.6 | % | |||||||||||
Aldurazyme® | Mucopolysaccharidosis | 109 | 98 | +11.2 | % | +10.2 | % | |||||||||||
Other | 164 | 161 | +1.9 | % | -0.6 | % | ||||||||||||
Total Rare Diseases | 1,464 | 1,353 | +8.2 | % | +6.7 | % | ||||||||||||
Aubagio® | Multiple sclerosis | 796 | 594 | +34.0 | % | +31.3 | % | |||||||||||
Lemtrada® | Multiple sclerosis | 249 | 196 | +27.0 | % | +26.0 | % | |||||||||||
Sub-total: Multiple sclerosis | 1,045 | 790 | +32.3 | % | +30.0 | % | ||||||||||||
Jevtana® | Prostate cancer | 197 | 178 | +10.7 | % | +9.0 | % | |||||||||||
Thymoglobulin® | Organ rejection | 148 | 134 | +10.4 | % | +8.2 | % | |||||||||||
Taxotere® | Breast, lung, prostate, stomach, and head & neck cancers | 91 | 92 | -1.1 | % | -2.2 | % | |||||||||||
Eloxatin® | Colorectal cancer | 90 | 86 | +4.7 | % | +3.5 | % | |||||||||||
Mozobil® | Hematologic malignancies | 80 | 72 | +11.1 | % | +9.7 | % | |||||||||||
Zaltrap® | Colorectal cancer | 34 | 34 | 0.0 | % | 0.0 | % | |||||||||||
Other | 155 | 125 | +24.0 | % | +21.6 | % | ||||||||||||
Total Oncology | 795 | 721 | +10.3 | % | +8.6 | % | ||||||||||||
Dupixent® | Atopic dermatitis | 26 | — | — | — | |||||||||||||
Kevzara® | Rheumatoid arthritis | 1 | — | — | — | |||||||||||||
Total Immunology | 27 | — | — | — | ||||||||||||||
Total Specialty Care | 3,331 | 2,864 | +16.3 | % | +14.5 | % | ||||||||||||
Lantus® | Diabetes | 2,423 | 2,860 | -15.3 | % | -16.7 | % | |||||||||||
Toujeo® | Diabetes | 402 | 244 | +64.8 | % | +59.8 | % | |||||||||||
Apidra® | Diabetes | 191 | 178 | +7.3 | % | +5.6 | % | |||||||||||
Amaryl® | Diabetes | 174 | 181 | -3.9 | % | 0.0 | % | |||||||||||
Insuman® | Diabetes | 55 | 66 | -16.7 | % | -15.2 | % | |||||||||||
Blood glucose meters | Diabetes | 33 | 34 | -2.9 | % | -2.9 | % | |||||||||||
Lyxumia® | Diabetes | 14 | 17 | -17.6 | % | -17.6 | % | |||||||||||
Soliqua® | Diabetes | 9 | — | — | — | |||||||||||||
Tofogliflozin | Diabetes | 9 | 7 | +28.6 | % | +28.6 | % | |||||||||||
Other | Diabetes | — | 4 | N/A | N/A | |||||||||||||
Total Diabetes | 3,310 | 3,591 | -7.8 | % | -9.2 | % | ||||||||||||
Multaq® | Atrial fibrillation | 181 | 170 | +6.5 | % | +3.5 | % | |||||||||||
Praluent® | Hypercholesterolemia | 76 | 33 | +130.3 | % | +124.2 | % | |||||||||||
Total Cardiovascular | 257 | 203 | +26.6 | % | +23.2 | % | ||||||||||||
Total Diabetes & Cardiovascular | 3,567 | 3,794 | -6.0 | % | -7.5 | % | ||||||||||||
Lovenox® | Thrombosis | 817 | 818 | -0.1 | % | -0.1 | % | |||||||||||
Plavix® | Atherothrombosis | 765 | 780 | -1.9 | % | -1.0 | % | |||||||||||
Renagel®/Renvela® | Hyperphosphatemia | 494 | 442 | +11.8 | % | +9.0 | % | |||||||||||
Aprovel® / Avapro® | Hypertension | 383 | 344 | +11.3 | % | +11.0 | % | |||||||||||
Depakine® | Epilepsy | 221 | 206 | +7.3 | % | +8.3 | % | |||||||||||
Synvisc® / Synvisc-One® | Arthritis | 206 | 197 | +4.6 | % | +2.0 | % | |||||||||||
Allegra® | Allergic rhinitis, urticaria | 102 | 114 | -10.5 | % | -13.2 | % | |||||||||||
Stilnox®/Ambien®/Myslee® | Sleep disorders | 137 | 148 | -7.4 | % | -10.8 | % | |||||||||||
Tritace® | Hypertension | 124 | 125 | -0.8 | % | +0.8 | % | |||||||||||
Targocid® | Bacterial infections | 72 | 75 | -4.0 | % | -4.0 | % | |||||||||||
Lasix® | Edema, hypertension | 71 | 77 | -7.8 | % | -7.8 | % | |||||||||||
Other | 1,807 | 1,882 | -4.0 | % | -5.1 | % | ||||||||||||
Total: established prescription products | 5,199 | 5,208 | -0.2 | % | -0.9 | % | ||||||||||||
Generics | 910 | 933 | -2.5 | % | -5.0 | % | ||||||||||||
Consumer Healthcare | 2,504 | 1,705 | +46.9 | % | +42.6 | % | ||||||||||||
Total Pharmaceuticals | 15,511 | 14,504 | +6.9 | % | +5.3 | % | ||||||||||||
2017Half-Year Financial Report • Sanofi | 49
Rare Diseases franchise
Net sales for theRare Diseases franchise reached €1,464 million in the first half of 2017, up 8.2% on a reported basis and 6.7% at constant exchange rates, reflecting an increase in the number of patients treated worldwide.
In Gaucher disease, net sales ofCerezyme® fell by 3.4% at constant exchange rates (CER) to €369 million, as sales decreased in Emerging Markets1 (-7.1% CER, at €116 million), the Rest of the World region2 (-12.5% CER, at €22 million) and in Europe3 (-1.4% CER, at €139 million) following the launch of Cerdelga®.Cerdelga® reported net sales of €62 million (+24.5% CER), of which €48 million (+20.5% CER) were generated in the United States. In Europe, net sales rose by 37.5% CER to €11 million, while in the Rest of the World region (where Cerdelga® is now available in Japan) net sales of the product were up 50.0% CER at €3 million.
Net sales ofMyozyme®/Lumizyme® rose by 11.5% CER to €393 million, driven by sales in the United States (+15.9% CER, at €135 million) and Europe (+5.5% CER, at €169 million). In Emerging Markets, sales were up 23.9% CER at €60 million. This growth reflects the rising number of patients diagnosed with, and treated for, Pompe disease.
Fabrazyme® posted net sales growth of 13.6% CER to €367 million. Sales are advancing in many countries due to the rising number of patients diagnosed with, and treated for, Fabry disease. The product saw sales growth in the United States (+11.6% CER, at €189 million), Emerging Markets (+48.1% CER, at €43 million), the Rest of the World region (+12.5% CER, at €54 million) and in Europe (+6.5% CER, at €81 million).
Multiple Sclerosis franchise
Net sales for theMultiple Sclerosisfranchise reached €1,045 million in the first half of 2017, up 32.3% on a reported basis and 30.0% at constant exchange rates, on strong performances byAubagio® andLemtrada® in the United States and Europe.
Aubagio® posted net sales of €796 million in the first half of 2017, up 31.3% CER, driven by the United States (+30.7% CER, at €544 million) and Europe (+33.1% CER, at €205 million). The product accounted for 9.0% of total prescriptions in the United States in the first quarter of 2017, rising to 9.3% in the second quarter (source: IMS NPA TRX – Q1 & Q2 2017).
Net sales ofLemtrada® totaled €249 million (+26.0% CER) in the first half of 2017, including €130 million in the United States (+23.5% CER) and €92 million in Europe (+26.7% CER).
Oncology franchise
TheOncology franchise generated net sales of €795 million, up 10.3% on a reported basis and 8.6% at constant exchange rates, thanks largely to public-sector orders for Leukine® in the United States, a good performance for the franchise in Emerging Markets, and overall growth in sales of Jevtana® and Thymoglobulin®.
Jevtana® achieved net sales of €197 million in the first half of 2017, up 9.0% CER, reflecting sales growth in Japan (+21.1% CER, at €23 million), Europe (+5.6% CER, at €75 million), the United States (+4.0% CER, at €81 million) and Emerging Markets (+27.3% CER, at €15 million).
Net sales ofThymoglobulin® rose by 8.2% CER to €148 million, on good performances in the United States (+7.9% CER, at €85 million) and in Emerging Markets (+18.5% CER, at €32 million).
Taxotere® saw net sales fall by 2.2% CER to €91 million, mainly on the impact of competition from generics in Japan (-46.7% CER, at €8 million), though the effect was partly offset by stronger sales in Emerging Markets (+10.9% CER, at €70 million) and especially in China (+17.2% CER, at €33 million).
Net sales ofEloxatin® rose by 3.5% CER to €90 million. This reflects stronger sales in Emerging Markets (+12.1% CER, at €73 million), especially in China (+10.6% CER, at €51 million), which more than offset a slump in Canadian sales due to competition from generics.
| 1 | World excluding United States, Canada, Western and Eastern Europe (apart from Russia, Ukraine, Georgia, Belarus, Armenia and Turkey), Japan, South Korea, Australia, New Zealand and Puerto Rico. |
| 2 | Japan, South Korea, Canada, Australia, New Zealand and Puerto Rico. |
| 3 | Western Europe and Eastern Europe excluding Eurasia (Russia, Ukraine, Georgia, Belarus, Armenia and Turkey). |
50 | Sanofi •2017 Half-Year Financial Report
Immunology franchise
Dupixent®(dupilumab, developed in collaboration with Regeneron), a major scientific breakthrough in the treatment of adults with moderate to severe atopic dermatitis, was approved by the US Food and Drug Administration on March 28, 2017 and made available in the US market. In just a few months, the product achieved net sales of €26 million, driven by significant unmet medical need and rapid access to the market. In Europe, Dupixent® received a positive opinion from the CHMP of the EMA on July 21, 2017.
Kevzara® (sarilumab, developed in collaboration with Regeneron), a treatment for rheumatoid arthritis, was approved by the FDA on May 22, 2017 and made available in the US market, where it has already generated €1 million of net sales.
Diabetes franchise
Net sales for theDiabetes franchise amounted to €3,310 million in the first half of 2017, down 7.8% on a reported basis and 9.2% at constant exchange rates. The main factor was a fall in sales of Lantus® in the United States, where Diabetes franchise sales were down 19.1% CER at €1,653 million. We expect the decline in Diabetes franchise sales in the United States to accelerate over the remainder of the year, mainly due to exclusion from the commercial formularies of two of the country’s leading healthcare providers: United Healthcare (from April 1, 2017) and CVS. Outside the United States, Diabetes franchise net sales also fell in Europe (-3.0% CER, at €651 million), but advanced in Emerging Markets (+10.2% CER, at €756 million).
Net sales ofinsulin glargines (Lantus® and Toujeo®) fell by 10.7% CER to €2,825 million.
Net sales of Lantus® fell by 16.7% CER in the first half to €2,423 million. In the United States, sales were down 24.6% CER at €1,350 million, due mainly to a lower average net price, the switching of patients to Toujeo®, and the effect of exclusions from commercial formularies as described above. Net sales in Europe fell by 14.4% CER to €393 million, due largely to the launch of a biosimilar of Lantus® and the switching of patients to Toujeo®. In Emerging Markets, sales were up 7.5% CER at €515 million.
Toujeo®, a new-generation basal insulin, posted net sales of €402 million in the first half of 2017, including €237 million in the United States and €100 million in Europe.
Net sales ofAmaryl® were stable CER at €174 million, reflecting growth in Emerging Markets (+2.8% CER, at €142 million) but also a weaker performance in Europe (-31.3% CER, at €11 million).
First-half net sales ofApidra® rose by 5.6% to €191 million. Lower sales in the United States (-1.8% CER, at €56 million) were compensated for by sales growth in Europe (+6.3% CER, at €67 million) and Emerging Markets (+17.5% CER, at €47 million).
Soliqua® 100/33 (injectable insulin glargine 100 units/ml and lixisenatide 33 mcg/ml combination1) has been available in the United States since January 2017. Net sales of Soliqua® 100/33 reached €9 million in the first half of 2017.
Cardiovascular franchise
In the first half of 2017, net sales ofPraluent® (alirocumab, developed in collaboration with Regeneron) reached €76 million, of which €53 million was generated in the United States and €19 million in Europe. The relatively limited rise in sales during the period reflects significant restrictions by US payers and restricted access to the European market (for further information about ongoing Praluent® litigation, see Note B.14. to the condensed half-year consolidated financial statements).
Net sales ofMultaq® reached €181 million (+3.5% CER), of which €154 million was generated in the United States (+4.2% CER).
| 1 | Lixisenatide was in-licensed from Zealand Pharma A/S. |
2017Half-Year Financial Report • Sanofi | 51
Established Prescription Products
Net sales ofEstablished Prescription Products in the first half of 2017 amounted to €5,199 million, down 0.2% on a reported basis and 0.9% at constant exchange rates. This reflects a solid performance in Emerging Markets (+5.8% CER, at €1,973 million), but weaker sales in Europe (-4.2% CER, at €1,788 million) and reduced sales of Plavix® in Japan. In the United States, Established Prescription Products net sales were down 1.9% CER at €750 million.
Net sales ofLovenox® in the first half of 2017 were stable at €817 million. Stronger sales in Emerging Markets (+11.9% CER, at €243 million) offset a drop in sales in Europe (-4.4% CER, at €500 million) reflecting competition from biosimilars containing enoxaparin sodium. Net sales of Lovenox® also fell in the Rest of the World region (-6.4% CER, at €45 million) and in the United States (-3.4% CER, at €29 million).
Net sales ofPlavix® in the first half of 2017 were €765 million, a drop of 1.0% CER, reflecting competition from generics in Japan (-32.4% CER, at €128 million) and Europe (-8.2% CER, at €78 million), although the effect was partly offset by another strong performance in Emerging Markets (+11.8% CER, at €528 million), especially China (+13.8%, at €390 million). Sales of Plavix® in the United States and Puerto Rico are handled by BMS under the terms of theSanofi-BMS alliance1.
First-half 2017 net sales ofRenvela®/Renagel® were up 9.0% CER at €494 million. The main growth driver was the sales performance in the United States (+11.0% CER, at €416 million), where the first generics of the product were authorized in powder form in June 2017 and in tablet form in July 2017. Generics of this product are now being sold in some European countries, as a result of which net sales of Renvela®/Renagel® in Europe slipped by 14.0% to €37 million.
First-half 2017 net sales ofAprovel®/Avapro® reached €383 million, up 11.0% CER, largely on sales growth in the Rest of the World region (+45.9% CER, at €91 million) and Emerging Markets (+7.6% CER, at €226 million). In Europe, sales of Aprovel®/Avapro® were down 9.1% at €60 million.
Generics
Net sales ofGenerics for the first half of 2017 totaled €910 million, down 2.5% on a reported basis and 5.0% at constant exchange rates.
Emerging Markets generated net sales of €389 million, down 3.7% CER, due mainly to the divestment of a distribution business in China and the timing of sales in Latin America. Sales of generics also fell in Europe (-5.3% CER, at €388 million) and the United States (-28.7% CER, at €69 million). These negative effects were partly offset by stronger sales in the Rest of the World region (+34.8% CER, at €64 million).
In line with our “Strategic Roadmap 2020”, we have been examining all options for our Generics business in Europe, and have committed to a phased withdrawal from this business that we expect to be complete by the end of 2018. We have however reiterated our commitment to our Generics business in other parts of the world, and will sharpen our focus on Emerging Markets.
| 1 | See Note C.2 to our consolidated financial statements for the year ended December 31, 2016, on page F-32 of our Annual Report on Form 20-F; this document is available on our corporate website,www.sanofi.com. |
52 | Sanofi •2017 Half-Year Financial Report
Consumer Healthcare
Net sales ofConsumer Healthcare products reached €2,504 million in the first half of 2017, up 46.9% on a reported basis and 42.6% at constant exchange rates, reflecting the acquisition of BI’s Consumer Healthcare business on January 1, 2017. On a constant structure basis and at constant exchange rates, Consumer Healthcare net sales rose by 2.4%.
| (€ million) | June 30, 2017 (6 months) | June 30, 2016 (6 months) | Change on a reported basis | Change at constant exchange | ||||||||||||
Allegra® | 251 | 237 | +5.9 | % | +2.1 | % | ||||||||||
Mucosolvan® | 53 | — | — | — | ||||||||||||
Other | 365 | 193 | +89.1 | % | +86.5 | % | ||||||||||
Allergy, cough and cold | 669 | 430 | +55.6 | % | +52.1 | % | ||||||||||
Doliprane® | 156 | 154 | +1.3 | % | +1.9 | % | ||||||||||
Buscopan® | 80 | — | — | — | ||||||||||||
Other | 385 | 275 | +40.0 | % | +33.5 | % | ||||||||||
Pain relief | 621 | 429 | +44.8 | % | +40.8 | % | ||||||||||
Dulcolax® | 103 | — | — | — | ||||||||||||
Enterogermina® | 89 | 85 | +4.7 | % | +3.5 | % | ||||||||||
Essentiale® | 75 | 71 | +5.6 | % | -2.8 | % | ||||||||||
Zantac® | 57 | — | — | — | ||||||||||||
Other | 144 | 112 | +28.6 | % | +25.0 | % | ||||||||||
Digestive Health | 468 | 268 | +74.6 | % | +69.4 | % | ||||||||||
Pharmaton® | 48 | — | — | — | ||||||||||||
Other | 286 | 220 | +30.0 | % | +23.2 | % | ||||||||||
Food supplements | 334 | 220 | +51.8 | % | +45.0 | % | ||||||||||
Gold Bond® | 100 | 94 | +6.4 | % | +3.2 | % | ||||||||||
Other | 312 | 264 | +18.2 | % | +14.8 | % | ||||||||||
Other products | 412 | 358 | +15.1 | % | +11.7 | % | ||||||||||
Total Consumer Healthcare | 2,504 | 1,705 | +46.9 | % | +42.6 | % | ||||||||||
In Emerging Markets, net sales for the Consumer Health Care business rose by 27.2% at constant exchange rates in the first half of 2017 to €805 million. On a constant structure basis and at constant exchange rates (CS/CER), net sales rose by 3.0%, driven by growth for Allergy, Cough and Cold (+8.5% CS/CER, at €170 million) and Pain Relief (+3.0% CS/CER, at €219 million), though the effect was mitigated by lower sales in Digestive Health (-1.7% CS/CER, at €185 million).
In Europe, net sales rose by 57.1% CER to €714 million. On a constant structure basis and at constant exchange rates, net sales were up 1.6%, propelled by growth for Allergy, Cough and Cold (+5.7% CS/CER, at €166 million) and Pain Relief (+2.4% CS/CER, at €252 million), which more than offset lower sales in Digestive Health (-1.2% CS/CER, at €161 million) and Food Supplements (-4.5% CS/CER, at €63 million).
In the United States, net sales advanced by 21.1% CER to €641 million. On a constant structure basis and at constant exchange rates, net sales rose by 2.5%, largely as a result of the launch of Xyzal® Allergy 24HR (net sales of €51 million), which was authorized for OTC sale in February 2017. Higher sales for Allergy, Cough and Cold (+13.0% CS/CER, at €242 million) and Pain Relief (+13.0% CS/CER, at €90 million) more than offset lower sales in Digestive Health (-14.2% CS/CER, at €94 million).
In the Rest of the World region, first-half Consumer Healthcare net sales were €344 million, up 142.3% CER. On a constant structure basis and at constant exchange rates, net sales rose by 2.8%, driven by Digestive Health (+21.7% CS/CER, at €28 million) and Pain Relief (+3.6% CS/CER, at €60 million).
2017Half-Year Financial Report • Sanofi | 53
2017 first-half Pharmaceuticals net sales by geographical region
| (€ million) | Total GBUs | Europe(a) | Change at CER | United States | Change at CER | Rest of the world(b) | Change at CER | Emerging Markets(c) | Change at CER | Total Franchise | Change at CER | |||||||||||||||||||||||||||||||||
Cerezyme® | 253 | 139 | -1.4 | % | 92 | +1.1 | % | 22 | -12.5 | % | 116 | -7.1 | % | 369 | -3.4 | % | ||||||||||||||||||||||||||||
Cerdelga® | 62 | 11 | +37.5 | % | 48 | +20.5 | % | 3 | +50.0 | % | — | — | 62 | +24.5 | % | |||||||||||||||||||||||||||||
Myozyme®/Lumizyme® | 333 | 169 | +5.5 | % | 135 | +15.9 | % | 29 | +7.7 | % | 60 | +23.9 | % | 393 | +11.5 | % | ||||||||||||||||||||||||||||
Fabrazyme® | 324 | 81 | +6.5 | % | 189 | +11.6 | % | 54 | +12.5 | % | 43 | +48.1 | % | 367 | +13.6 | % | ||||||||||||||||||||||||||||
Aldurazyme® | 72 | 38 | — | 22 | — | 12 | — | 37 | +37.0 | % | 109 | +10.2 | % | |||||||||||||||||||||||||||||||
Other | 143 | 35 | -2.8 | % | 61 | — | 47 | -2.2 | % | 21 | +5.3 | % | 164 | -0.6 | % | |||||||||||||||||||||||||||||
Total Rare Diseases | 1,187 | 473 | +3.0 | % | 547 | +9.5 | % | 167 | +3.2 | % | 277 | +10.6 | % | 1,464 | +6.7 | % | ||||||||||||||||||||||||||||
Aubagio® | 777 | 205 | +33.1 | % | 544 | +30.7 | % | 28 | +35.0 | % | 19 | +25.0 | % | 796 | +31.3 | % | ||||||||||||||||||||||||||||
Lemtrada® | 238 | 92 | +26.7 | % | 130 | +23.5 | % | 16 | +45.5 | % | 11 | +25.0 | % | 249 | +26.0 | % | ||||||||||||||||||||||||||||
Sub-total: Multiple Sclerosis | 1,015 | 297 | +31.0 | % | 674 | +29.2 | % | 44 | +38.7 | % | 30 | +25.0 | % | 1,045 | +30.0 | % | ||||||||||||||||||||||||||||
Jevtana® | 182 | 75 | +5.6 | % | 81 | +4.0 | % | 26 | +28.6 | % | 15 | +27.3 | % | 197 | +9.0 | % | ||||||||||||||||||||||||||||
Thymoglobulin® | 116 | 20 | — | 85 | +7.9 | % | 11 | — | 32 | +18.5 | % | 148 | +8.2 | % | ||||||||||||||||||||||||||||||
Taxotere® | 21 | 2 | — | 1 | -50.0 | % | 18 | -33.3 | % | 70 | +10.9 | % | 91 | -2.2 | % | |||||||||||||||||||||||||||||
Eloxatin® | 17 | 2 | — | — | — | 15 | -27.8 | % | 73 | +12.1 | % | 90 | +3.5 | % | ||||||||||||||||||||||||||||||
Mozobil® | 77 | 22 | +4.8 | % | 49 | +6.8 | % | 6 | +133.3 | % | 3 | -25.0 | % | 80 | +9.7 | % | ||||||||||||||||||||||||||||
Zaltrap® | 30 | 26 | +8.3 | % | 4 | -42.9 | % | — | -100.0 | % | 4 | +100.0 | % | 34 | — | |||||||||||||||||||||||||||||
Other | 146 | 27 | +7.7 | % | 109 | +30.9 | % | 10 | -9.1 | % | 9 | +14.3 | % | 155 | +21.6 | % | ||||||||||||||||||||||||||||
Total Oncology | 589 | 174 | +5.4 | % | 329 | +11.6 | % | 86 | -5.6 | % | 206 | +13.8 | % | 795 | +8.6 | % | ||||||||||||||||||||||||||||
Dupixent® | 26 | — | — | 26 | — | — | — | — | — | 26 | — | |||||||||||||||||||||||||||||||||
Kevzara® | 1 | — | — | 1 | — | — | — | — | — | 1 | — | |||||||||||||||||||||||||||||||||
Total Immunology | 27 | — | — | 27 | — | — | — | — | — | 27 | — | |||||||||||||||||||||||||||||||||
Sanofi Genzyme (Specialty Care) | 2,818 | 944 | +10.9 | % | 1,577 | +19.8 | % | 297 | +4.3 | % | 513 | +12.7 | % | 3,331 | +14.5 | % | ||||||||||||||||||||||||||||
Lantus® | 1,908 | 393 | -14.4 | % | 1,350 | -24.6 | % | 165 | -11.2 | % | 515 | +7.5 | % | 2,423 | -16.7 | % | ||||||||||||||||||||||||||||
Toujeo® | 367 | 100 | +117.4 | % | 237 | +25.0 | % | 30 | +123.1 | % | 35 | +3000.0 | % | 402 | +59.8 | % | ||||||||||||||||||||||||||||
Apidra® | 144 | 67 | +6.3 | % | 56 | -1.8 | % | 21 | — | 47 | +17.5 | % | 191 | +5.6 | % | |||||||||||||||||||||||||||||
Amaryl® | 32 | 11 | -31.3 | % | 1 | — | 20 | +5.3 | % | 142 | +2.8 | % | 174 | — | ||||||||||||||||||||||||||||||
Insuman® | 41 | 40 | -7.0 | % | 1 | — | — | — | 14 | -31.8 | % | 55 | -15.2 | % | ||||||||||||||||||||||||||||||
Blood glucose meters | 32 | 32 | -3.0 | % | — | — | — | -100.0 | % | 1 | — | 33 | -2.9 | % | ||||||||||||||||||||||||||||||
Lyxumia® | 13 | 8 | -18.2 | % | — | — | 5 | — | 1 | -50.0 | % | 14 | -17.6 | % | ||||||||||||||||||||||||||||||
Soliqua® | 9 | — | — | 9 | — | — | — | — | — | 9 | — | |||||||||||||||||||||||||||||||||
Tofogliflozin | 9 | — | — | — | — | 9 | +28.6 | % | — | — | 9 | +28.6 | % | |||||||||||||||||||||||||||||||
Other | -1 | — | — | -1 | -133.3 | % | — | — | 1 | — | — | — | ||||||||||||||||||||||||||||||||
Total Diabetes | 2,554 | 651 | -3.0 | % | 1,653 | -19.1 | % | 250 | -0.8 | % | 756 | +10.2 | % | 3,310 | -9.2 | % | ||||||||||||||||||||||||||||
Multaq® | 177 | 22 | -4.3 | % | 154 | +4.2 | % | 1 | +100.0 | % | 4 | — | 181 | +3.5 | % | |||||||||||||||||||||||||||||
Praluent® | 74 | 19 | +216.7 | % | 53 | +92.6 | % | 2 | — | 2 | — | 76 | +124.2 | % | ||||||||||||||||||||||||||||||
Total Cardiovascular | 251 | 41 | +41.4 | % | 207 | +18.2 | % | 3 | +200.0 | % | 6 | +66.7 | % | 257 | +23.2 | % | ||||||||||||||||||||||||||||
Total Diabetes & Cardiovascular | 2,805 | 692 | -1.1 | % | 1,860 | -16.1 | % | 253 | — | 762 | +10.4 | % | 3,567 | -7.5 | % | |||||||||||||||||||||||||||||
Lovenox® | 817 | 500 | -4.4 | % | 29 | -3.4 | % | 45 | -6.4 | % | 243 | +11.9 | % | 817 | -0.1 | % | ||||||||||||||||||||||||||||
Plavix® | 765 | 78 | -8.2 | % | — | -100.0 | % | 159 | -27.0 | % | 528 | +11.8 | % | 765 | -1.0 | % | ||||||||||||||||||||||||||||
Renagel®/Renvela® | 494 | 37 | -14.0 | % | 416 | +11.0 | % | 19 | +26.7 | % | 22 | +10.0 | % | 494 | +9.0 | % | ||||||||||||||||||||||||||||
Aprovel®/CoAprovel® | 383 | 60 | -9.1 | % | 6 | — | 91 | +45.9 | % | 226 | +7.6 | % | 383 | +11.0 | % | |||||||||||||||||||||||||||||
Depakine® | 221 | 81 | +1.2 | % | — | — | 6 | — | 134 | +13.6 | % | 221 | +8.3 | % | ||||||||||||||||||||||||||||||
Synvisc® / Synvisc-One® | 206 | 17 | — | 158 | +2.0 | % | 8 | +14.3 | % | 23 | — | 206 | +2.0 | % | ||||||||||||||||||||||||||||||
Allegra® | 102 | 6 | +20.0 | % | — | — | 96 | -14.7 | % | — | — | 102 | -13.2 | % | ||||||||||||||||||||||||||||||
Stilnox®/Ambien®/ Myslee® | 137 | 20 | -9.1 | % | 28 | -30.8 | % | 57 | -8.3 | % | 32 | +11.1 | % | 137 | -10.8 | % | ||||||||||||||||||||||||||||
Tritace® | 124 | 78 | -2.5 | % | — | — | 2 | +50.0 | % | 44 | +4.5 | % | 124 | +0.8 | % | |||||||||||||||||||||||||||||
Targocid® | 72 | 35 | -10.3 | % | — | — | 3 | — | 34 | +3.0 | % | 72 | -4.0 | % | ||||||||||||||||||||||||||||||
Lasix® | 71 | 37 | -2.6 | % | — | — | 6 | -58.3 | % | 28 | +7.4 | % | 71 | -7.8 | % | |||||||||||||||||||||||||||||
Other | 1,807 | 839 | -3.4 | % | 113 | -27.9 | % | 196 | -3.7 | % | 659 | -2.4 | % | 1,807 | -5.1 | % | ||||||||||||||||||||||||||||
Total Established Prescription Products | 5,199 | 1,788 | -4.2 | % | 750 | -1.9 | % | 688 | -8.4 | % | 1,973 | +5.8 | % | 5,199 | -0.9 | % | ||||||||||||||||||||||||||||
Generics | 910 | 388 | -5.3 | % | 69 | -28.7 | % | 64 | +34.8 | % | 389 | -3.7 | % | 910 | -5.0 | % | ||||||||||||||||||||||||||||
Total Emerging Markets—Specialty Care | 513 | 513 | +12.7 | % | ||||||||||||||||||||||||||||||||||||||||
Total Emerging Markets—Diabetes & Cardiovascular | 762 | 762 | +10.4 | % | ||||||||||||||||||||||||||||||||||||||||
General Medicines & Emerging Markets | 7,384 | 2,176 | -4.4 | % | 819 | -4.9 | % | 752 | -5.8 | % | 3,637 | +6.6 | % | |||||||||||||||||||||||||||||||
Allergy, cough and cold | 669 | 166 | +163.5 | % | 242 | +13.0 | % | 91 | +166.7 | % | 170 | +30.7 | % | 669 | +52.1 | % | ||||||||||||||||||||||||||||
Pain relief | 621 | 252 | +33.9 | % | 90 | +13.0 | % | 60 | +625.0 | % | 219 | +32.9 | % | 621 | +40.8 | % | ||||||||||||||||||||||||||||
Digestive health | 468 | 161 | +62.6 | % | 94 | +550.0 | % | 28 | +1300.0 | % | 185 | +13.7 | % | 468 | +69.4 | % | ||||||||||||||||||||||||||||
Food supplements | 334 | 63 | +23.5 | % | 2 | — | 129 | +65.3 | % | 140 | +41.3 | % | 334 | +45.0 | % | |||||||||||||||||||||||||||||
Consumer Healthcare | 2,504 | 714 | +57.1 | % | 641 | +21.1 | % | 344 | +142.3 | % | 805 | +27.2 | % | 2,504 | +42.6 | % | ||||||||||||||||||||||||||||
Total Pharmaceuticals | 15,511 | 4,526 | +5.7 | % | 4,897 | -0.6 | % | 1,646 | +11.3 | % | 4,442 | +9.7 | % | 15,511 | +5.3 | % | ||||||||||||||||||||||||||||
| (a) | Western Europe and Eastern Europe excluding Eurasia (Russia, Ukraine, Georgia, Belarus, Armenia and Turkey). |
| (b) | Japan, South Korea, Canada, Australia, New Zealand and Puerto Rico. |
| (c) | World excluding United States, Canada, Western and Eastern Europe (apart from Eurasia), Japan, South Korea, Australia, New Zealand and Puerto Rico. |
54 | Sanofi •2017 Half-Year Financial Report
C.3.1.5. Human Vaccines (Vaccines) Segment
In the first half of 2017, net sales for theVaccinessegment were €1,800 million, up 26.6% on a reported basis and 24.5% at constant exchange rates, reflecting the ending of the Sanofi Pasteur MSD (SPMSD) joint venture in Europe. On a constant structure basis and at constant exchange rates, Vaccines net sales rose by 16.5%, driven mainly by the performance of the Polio/Pertussis/Hib franchise across all geographical regions. In the United States, Vaccines net sales increased by 13.0% CER to €665 million. Net sales for the Vaccines segment in Emerging Markets were up 17.3% CER at €730 million. In Europe, Vaccines net sales reached €235 million (+126.7% CER, reflecting the ending of the SPMSD joint venture). On a constant structure basis and at constant exchange rates, Vaccines net sales in Europe advanced by 18.4%.
| (€ million) | June 30, 2017 (6 months) | June 30, 2016 (6 months) | Change on a reported basis | Change at constant exchange | ||||||||||||
Polio/Pertussis/Hib Vaccines (including Pentacel®, Pentaxim® & Imovax®) | 901 | 627 | +43.7 | % | +41.3 | % | ||||||||||
Meningitis/Pneumonia Vaccines (including Menactra®) | 290 | 261 | +11.1 | % | +8.8 | % | ||||||||||
Travel and Other Endemics Vaccines | 219 | 184 | +19.0 | % | +17.4 | % | ||||||||||
Adult Booster Vaccines (including Adacel®) | 194 | 184 | +5.4 | % | +4.3 | % | ||||||||||
Influenza Vaccines (including Vaxigrip® & Fluzone®) | 136 | 116 | +17.2 | % | +14.7 | % | ||||||||||
Dengvaxia® | 18 | 20 | -10.0 | % | -5.0 | % | ||||||||||
Other vaccines | 42 | 30 | +40.0 | % | +33.3 | % | ||||||||||
Total Vaccines | 1,800 | 1,422 | +26.6 | % | +24.5 | % | ||||||||||
Polio/Pertussis/Hib vaccinesposted 2017 first-half net sales of €901 million, up 41.3% CER. On a constant structure basis and at constant exchange rates, net sales for this franchise were up 34.4% on the resumption of normal supply levels of Pentacel®, the timing of orders from the US Centers for Disease Control and Prevention (CDC), and increased deliveries of batches of Pentaxim® in China.
Net sales ofMeningitis/Pneumonia vaccinestotaled €290 million, up 8.8% CER, due mainly to trends in orders forMenactra® from the CDC in the United States and increased sales in Australia following an outbreak of meningitis.
Travel and Other Endemics vaccines posted a 17.4% rise in net sales to €219 million in the first half of 2017. On a constant structure basis and at constant exchange rates, net sales rose by 3.8%.
First-half 2017 net sales ofAdult Booster vaccines were €194 million, up 4.3% CER. On a constant structure basis and at constant exchange rates, net sales were down 13.9% due to supply chain issues for Repevax® in Europe.
Net sales ofInfluenza vaccines advanced by 14.7% CER to €136 million, largely on sales growth in Brazil.
Net sales ofDengvaxia® for the first half of 2017 were down 5.0% CER at €18 million, reflecting the end of the public vaccination program initiated in the Philippines in early 2016.
2017Half-Year Financial Report • Sanofi | 55
2017 first-half Vaccines net sales by geographical region
| (€ million) | Europe (a) | Change at CER | United States | Change at CER | Rest of world (b) | Change at CER | Emerging Markets (c) | Change at CER | ||||||||||||||||||||||||
Polio/Pertussis/Hib Vaccines (including Pentacel®, Pentaxim® & Imovax®) | 140 | +143.1 | % | 219 | +43.9 | % | 83 | +27.0 | % | 459 | +26.3 | % | ||||||||||||||||||||
Meningitis/Pneumonia Vaccines (including Menactra®) | 1 | -66.7 | % | 219 | +5.4 | % | 22 | +162.5 | % | 48 | +2.2 | % | ||||||||||||||||||||
Adult Booster Vaccines (including Adacel®) | 46 | +84.6 | % | 121 | -7.1 | % | 13 | — | 14 | -27.8 | % | |||||||||||||||||||||
Travel and Other Endemics Vaccines | 43 | +175.0 | % | 71 | — | 28 | +21.7 | % | 77 | -1.3 | % | |||||||||||||||||||||
Influenza Vaccines (including Vaxigrip® & Fluzone®) | — | -100.0 | % | 3 | — | 19 | -5.0 | % | 114 | +20.7 | % | |||||||||||||||||||||
Dengvaxia® | — | — | — | — | — | — | 18 | -5.0 | % | |||||||||||||||||||||||
Other vaccines | 5 | +300.0 | % | 32 | +33.3 | % | 5 | — | — | -50.0 | % | |||||||||||||||||||||
Total Vaccines | 235 | +126.7 | % | 665 | +13.0 | % | 170 | +26.2 | % | 730 | +17.3 | % | ||||||||||||||||||||
| (a) | Western Europe and Eastern Europe excluding Eurasia (Russia, Ukraine, Georgia, Belarus, Armenia and Turkey). |
| (b) | Japan, South Korea, Canada, Australia, New Zealand and Puerto Rico. |
| (c) | World excluding United States, Canada, Western and Eastern Europe (apart from Eurasia), Japan, South Korea, Australia, New Zealand and Puerto Rico. |
C.3.1.6. Net Sales by Geographical Region
| (€ million) | June 30, 2017 (6 months) | June 30, 2016 (6 months) | Change on a reported basis | Change at constant exchange | ||||||||||||
United States | 5,562 | 5,356 | +3.8 | % | +0.9 | % | ||||||||||
Emerging Markets(a) | 5,172 | 4,599 | +12.5 | % | +10.7 | % | ||||||||||
of which Asia (including South Asia(b)) | 1,917 | 1,700 | +12.8 | % | +12.6 | % | ||||||||||
of which Latin America | 1,405 | 1,146 | +22.6 | % | +13.9 | % | ||||||||||
of which Africa and Middle East | 1,172 | 1,170 | +0.2 | % | +3.2 | % | ||||||||||
of which Eurasia(c) | 610 | 515 | +18.4 | % | +16.1 | % | ||||||||||
Europe(d) | 4,761 | 4,412 | +7.9 | % | +8.6 | % | ||||||||||
Rest of the world(e) | 1,816 | 1,559 | +16.5 | % | +12.6 | % | ||||||||||
of which Japan | 1,001 | 850 | +17.8 | % | +14.9 | % | ||||||||||
of which South Korea | 211 | 170 | +24.1 | % | +17.1 | % | ||||||||||
Total net sales | 17,311 | 15,926 | +8.7 | % | +7.0 | % | ||||||||||
| (a) | World excluding United States, Canada, Europe, Japan, South Korea, Australia, New Zealand and Puerto Rico. |
| (b) | India, Bangladesh and Sri Lanka. In 2016, South Asia was included in the Africa, Middle East and South Asia region. The presentation of 2016 net sales has been amended accordingly in the interests of comparability. |
| (c) | Russia, Ukraine, Georgia, Belarus, Armenia and Turkey. |
| (d) | Western Europe and Eastern Europe (excluding Eurasia). |
| (e) | Japan, South Korea, Canada, Australia, New Zealand and Puerto Rico. |
In theUnited States, 2017 first-half net sales were up slightly year-on-year at €5,562 million (+0.9% CER). Solid performances from the Specialty Care franchise (+19.8% CER at €1,577 million), Vaccines (+13.0% CER, at €665 million) and Consumer Healthcare (+21.1% CER, +2.5% CS/CER, at €641 million) offset a 19.1% drop in net sales for the Diabetes franchise to €1,653 million.
InEmerging Markets, net sales reached €5,172 million (+10.7% CER). Good performances from Vaccines (+17.3% CER, at €730 million), the Specialty Care franchise (+12.7% CER, at €513 million), Diabetes (+10.2% CER, at €756 million) and Established Prescription Products (+5.8% CER, at €1,973 million) outweighed lower sales of Generics (-3.7% CER, at €389 million). In Asia, 2017 first-half net sales rose by 12.6% CER to €1,917 million, driven by a good performance in China (+17.1% CS/CER, at €1,147 million). In Latin America, net sales were €1,405 million, up 13.9% CER, with strong growth in Argentina (+38.4% CER) and Brazil (+11.1% CER). The Africa and Middle East region posted 2017 first-half net sales of €1,172 million, up 3.2% CER, as fine performances in Egypt (+39.3% CER) and South Africa (+14.7% CER) more than compensated for lower sales in Saudi Arabia (-31.6% CER) and Morocco (-9.3% CER). Net sales in the Eurasia region advanced by 16.1% CER to €610 million, the strongest performers being Turkey (+17.3% CER) and Russia (+16.7% CER).
56 | Sanofi •2017 Half-Year Financial Report
In Europe, net sales for the first half of 2017 were €4,761 million, up 8.6% CER and up 0.4% on a constant structure basis. Sales growth for the Specialty Care franchise (+10.9% CER), Vaccines (+126.7% CER, or +18.4% CS/CER) and Consumer Healthcare (+57.1% CER, or +1.6% CS/CER) offset a fall in sales of Established Prescription Products (-4.2% CER), Diabetes(-3.0% CER) and Generics (-5.3% CER).
In the Rest of the World region, net sales rose by 12.6% CER to €1,816 million. In Japan, net sales for the first half of 2017 reached €1,001 million, up 14.9% CER, mainly as a result of the acquisition of BI’s Consumer Healthcare business. On a constant structure basis, sales in Japan were down 4.0%, due mainly to competition from generics of Plavix®.
C.3.2. Other revenues
Other revenues advanced by 67.4% to €519 million in the first half of 2017 (versus €310 million in the first half of 2016). This year-on-year increase reflects a higher level of sales of non-Sanofi products by VaxServe, which have been recorded withinOther revenues since 2016.
C.3.3. Gross profit
Gross profit amounted to €12,160 million in the first half of 2017 (70.2% of net sales), versus €11,266 million in the first half of 2016 (70.7% of net sales, a year-on-year decrease of 0.5 of a percentage point). The 2017 first-half figure includes an expense of €176 million arising mainly from the consequences of acquiring the inventories of the BI Consumer Healthcare business.
The Pharmaceuticals segment improved gross margin by 0.5 of a percentage point to 72.8%, thanks largely to the performance of the General Medicines and Emerging Markets GBU (especially in Latin America and China), and more generally to positive sales trends. Gross margin was also boosted by the performance of the Multiple Sclerosis franchise, which partly offset the negative effect of lower sales for the Diabetes franchise in the United States.
The Vaccines segment improved its gross margin by 2.6 percentage points to 57.7%.
C.3.4. Research and development expenses
Research and development (R&D) expenses amounted to €2,667 million in the first half of 2017 (versus €2,514 million in the first half of 2016) and represented 15.4% of net sales (versus 15.8% in the first half of 2016).
Overall, R&D expenses rose by €153 million (+6.1%), comprising €127 million for Pharmaceuticals (+5.7%) and €26 million for Vaccines (+9.7%). The year-on-year increase in R&D expenses was due partly to the integration of BI Consumer Healthcare products and of Sanofi products that were previously in the SPMSD portfolio, and partly to progress on development projects in oncology (isatixumab, PD-1) and for sotagliflozin.
C.3.5. Selling and general expenses
Selling and general expenses were €5,046 million in the first half of 2017 (29.1% of net sales), compared with €4,609 million for the first half of 2016 (28.9% of net sales).
By segment, the year on-year increase was €348 million (+8.2%) for Pharmaceuticals and €89 million (+25.6%) for Vaccines. This rise mainly reflects the launch costs of Dupixent®, Kevzara® and Xyzal®, plus investment in marketing and sales efforts in key emerging markets and in the European vaccines business.
C.3.6. Other operating income and expenses
Other operating income for the first half of 2017 reached €173 million (versus €265 million in the first half of 2016), while other operating expenses totaled €71 million (versus €195 million in the first half of 2016).
In the first half of 2017, the main component of other operating income was gains on asset disposals, which amounted to €57 million.
Overall, other operating income and expenses represented a net gain of €102 million in the first half of 2017, compared with a net gain of €70 million a year earlier, a net year-on-year improvement of €32 million.
2017Half-Year Financial Report • Sanofi | 57
C.3.7. Amortization of intangible assets
Amortization charged against intangible assets in the first half of 2017 was €990 million, versus €877 million in the comparable period of 2016. The €113 million year-on-year increase mainly reflects a €133 million rise in amortization expense during the period following the recognition of intangible assets in connection with the exchange transaction with BI finalized on January 1, 2017, based on the provisional purchase price allocation. This increase was partly offset by a reduction in amortization charged against intangible assets recognized on the acquisitions of Genzyme (€458 million in the first half of 2017, versus €431 million in the first half of 2016) and Aventis (€204 million in the first half of 2017, versus €276 million in the first half of 2016) as some assets reached the end of their life cycles.
C.3.8. Impairment of intangible assets
In the first half of 2017, this line item comprises impairment losses of €12 million taken against various Pharmaceuticals segment intangible assets.
For the first half of 2016, this line item showed impairment losses of €52 million comprising (i) impairment losses taken against rights relating to a number of marketed products in the Pharmaceuticals segment (€32 million) and the Vaccines segment (€1 million) and (ii) net impairment losses of €19 million taken against various R&D projects in the Pharmaceuticals and Vaccines segments.
C.3.9. Fair value remeasurement of contingent consideration
Fair value remeasurements of contingent consideration, mainly relating to acquisitions (in accordance with the revised IFRS 3), represented a net expense of €100 million in the first half of 2017 versus a net expense of €67 million in the first half of 2016.
Those remeasurements relate to contingent consideration payable to Bayer as a result of an acquisition made by Genzyme prior to the latter’s acquisition by Sanofi (€84 million), and to the contingent consideration arising from the dismantling of the Sanofi Pasteur MSD joint venture (€16 million); see Note B.11. to our condensed half-year consolidated financial statements.
C.3.10. Restructuring costs and similar expenses
Restructuring costs and similar expenses amounted to €364 million in the first half of 2017, compared with €627 million in the first half of 2016. In the first half of 2017, restructuring costs mainly comprised write-downs of industrial assets in Europe and the United States, andemployee-related expenses arising from headcount adjustment plans in Europe.
C.3.11. Other gains and losses, and litigation
In the first half of 2017, the line itemOther gains and losses, and litigation represents separation costs associated with the process of disinvesting from the Generics business in Europe, before tax effects.
C.3.12. Operating income
Operating income for the first half of 2017 was €3,076 million, 18.8% higher than the 2016 first-half figure of €2,590 million. Thisyear-on-year change reflects an improvement in gross margin and lower restructuring costs, which outweighed the effects of increases in R&D expenses and in selling and general expenses.
C.3.13. Financial income and expenses
Net financial expense was €123 million for the first half of 2017, an improvement of €68 million relative to the 2016 first-half figure of €191 million.
Financial expenses directly related to our debt, net of cash and cash equivalents (see the definition in section C.5. below) amounted to €110 million, down from €118 million in the first half of 2016.
Theyear-on-year change in net financial expense was attributable mainly to:
| • | a higher level of gains on disposals of financial assets (€52 million, versus €19 million for the first half of 2016); |
| • | a reduction in the net interest cost on pension plans (€47 million, versus €58 million for the first half of 2016). |
58 | Sanofi •2017 Half-Year Financial Report
C.3.14. Income before tax and associates and joint ventures
Income before tax and associates and joint ventures for the first half of 2017 was €2,953 million, compared with €2,399 million for the first half of 2016, a rise of 23.1%.
C.3.15. Income tax expense
Income tax expense was €610 million in the first half of 2017, versus €497 million a year earlier, giving an effective tax rate stable year-on-year at 20.7%. The increase in income tax expense was mainly due to the higher level of income before tax and associates and joint ventures.
The level of income tax expense is also significantly impacted by tax effects of amortization and impairment of intangible assets (€349 million in the first half of 2017, versus €323 million in the first half of 2016) and of restructuring costs (€126 million in the first half of 2017, versus €210 million in the first half of 2016).
The effective tax rate on our business net income1 is a non-GAAP financial measure. It is calculated on the basis of business operating income, minus net financial expenses and before the share of profit/loss of associates and joint ventures and net income attributable to non-controlling interests. We believe the presentation of this measure, used by our management, is also useful for investors as it provides a means to analyze the effective tax cost of our current business activities. It should not be seen as a substitute for the effective tax rate on consolidated net income. The effective tax rate based on business net income was 24.5% for the first half of 2017, versus 22.9% for the first half of 2016 and 23.3% for 2016 as a whole.
C.3.16. Share of profit/(loss) of associates and joint ventures
Associates and joint ventures contributed net income of €38 million in the first half of 2017, versus net income of €98 million in the comparable period of 2016.
This line item includes Sanofi’s share of the profits and losses of Regeneron, including the impact of the fair value remeasurement of our share of the acquired intangible assets of Regeneron.
C.3.17. Net income excluding the exchanged/held-for-exchange Animal Health business
Net income excluding the exchanged/held-for-exchange Animal Health business amounted to €2,381 million in the first half of 2017, versus €2,000 million in the first half of 2016.
C.3.18. Net income/(loss) of the exchanged/held-for-exchange Animal Health business
In accordance with IFRS 5, the net income or loss of the Animal Health business is presented within a separate line item,Net income/(loss) of the exchanged/held-for-exchange Animal Health business, for the 2016 comparative periods. On January 2, 2017, Sanofi and Boehringer Ingelheim (BI) confirmed that they had finalized the strategic transaction agreed in June 2016, involving the exchange of Sanofi’s Animal Health business (Merial) for BI’s Consumer Healthcare business in most countries2. Consequently, for the first half of 2017 this line item shows the gain of €4,421 million on the divestment of the Animal Health business, net of taxes and before the impact of price adjustments and delayed business transfers.
C.3.19. Net income
Net income for the first half of 2017 was €6,802 million, versus €2,286 million for the first half of 2016.
| 1 | Refer to the appendix in section F for a definition. |
| 2 | The transfer of the business in Mexico is due to be finalized during 2017. |
2017Half-Year Financial Report • Sanofi | 59
C.3.20. Net income attributable to non-controlling interests
Net income attributable to non-controlling interests for the first half of 2017 amounted to €64 million, against €41 million for the first half of 2016. This line item mainly comprises the share of pre-tax profits paid to BMS from territories managed by Sanofi (€43 million, versus €44 million in the first half of 2016); the year-on-year fall was directly related to competition from generics of clopidogrel (the active ingredient of Plavix®) and of irbesartan (the active ingredient of Aprovel®) in Europe.
C.3.21. Net income attributable to equity holders of Sanofi
Net income attributable to equity holders of Sanofi amounted to €6,738 million in the first half of 2017, compared with €2,245 million in the first half of 2016.
Basic earnings per share (EPS) was €5.35, compared with €1.74 for the first half of 2016, based on an average number of shares outstanding of 1,260.3 million for the first half of 2017 and 1,287.6 million for the first half of 2016. Diluted EPS was €5.30, compared with €1.73 for the first half of 2016, based on an average number of shares after dilution of 1,270.6 million for the first half of 2017 and 1,296.6 million for the first half of 2016.
C.3.22. Segment results
1/ Business operating income
Business operating income (as defined in Note B.20.1. to the condensed half-year consolidated financial statements) amounted to €4,741 million in the first half of 2017 versus €4,216 million in the first half of 2016, an increase of 12.5%. It represented 27.4% of net sales, compared with 26.5% in the first half of 2016.
The table below shows business operating income for the six-month periods ended June 30, 2017 and 2016:
| (€ million) | June 30, 2017 (6 months) | June 30, 2016 (6 months) | Change | |||||||||
Pharmaceuticals | 4,454 | 4,080 | +9.2 | % | ||||||||
Vaccines | 309 | 175 | +76.6 | % | ||||||||
Other | (22 | ) | (39 | ) | -43.6 | % | ||||||
Business operating income | 4,741 | 4,216 | +12.5 | % | ||||||||
The following tables present our segment results for the first half of 2017, the first half of 2016, and the year ended December 31, 2016:
First half of 2017
| June 30, 2017 (6 months) | ||||||||||||||||
| (€ million) | Pharmaceuticals | Vaccines | Other | Total | ||||||||||||
Net sales | 15,511 | 1,800 | — | 17,311 | ||||||||||||
Other revenues | 149 | 370 | — | 519 | ||||||||||||
Cost of sales | (4,363 | ) | (1,131 | ) | — | (5,494 | ) | |||||||||
Research and development expenses | (2,373 | ) | (294 | ) | — | (2,667 | ) | |||||||||
Selling and general expenses | (4,609 | ) | (437 | ) | — | (5,046 | ) | |||||||||
Other operating income and expenses | 122 | 2 | (22 | ) | 102 | |||||||||||
Share of profit/(loss) of associates and joint ventures | 82 | (1 | ) | — | 81 | |||||||||||
Net income attributable to non-controlling interests | (65 | ) | — | — | (65 | ) | ||||||||||
Business operating income | 4,454 | 309 | (22 | ) | 4,741 | |||||||||||
60 | Sanofi •2017 Half-Year Financial Report
First half of 2016
| June 30, 2016 (6 months) | ||||||||||||||||
| (€ million) | Pharmaceuticals | Vaccines | Other | Total | ||||||||||||
Net sales | 14,504 | 1,422 | — | 15,926 | ||||||||||||
Other revenues | 122 | 188 | — | 310 | ||||||||||||
Cost of sales | (4,143 | ) | (827 | ) | — | (4,970 | )) | |||||||||
Research and development expenses | (2,246 | ) | (268 | ) | — | (2,514 | )) | |||||||||
Selling and general expenses | (4,261 | ) | (348 | ) | — | (4,609 | )) | |||||||||
Other operating income and expenses | 110 | (1 | ) | (39 | ) | 70 | ||||||||||
Share of profit/(loss) of associates and joint ventures | 44 | 9 | — | 53 | ||||||||||||
Net income attributable to non-controlling interests | (50 | ) | — | — | (50 | ) | ||||||||||
Business operating income | 4,080 | 175 | (39 | ) | 4,216 | |||||||||||
Year ended December 31, 2016
| December 31, 2016 (12 months) | ||||||||||||||||
| (€ million) | Pharmaceuticals | Vaccines | Other | Total | ||||||||||||
Net sales | 29,244 | 4,577 | — | 33,821 | ||||||||||||
Other revenues | 274 | 613 | — | 887 | ||||||||||||
Cost of sales | (8,349 | ) | (2,353 | )) | — | (10,702 | )) | |||||||||
Research and development expenses | (4,618 | ) | (554 | ) | — | (5,172 | )) | |||||||||
Selling and general expenses | (8,743 | ) | (743 | ) | — | (9,486 | )) | |||||||||
Other operating income and expenses | (1 | ) | (14 | ) | (112 | ) | (127 | ) | ||||||||
Share of profit/(loss) of associates and joint ventures | 129 | 48 | — | 177 | ||||||||||||
Net income attributable to non-controlling interests | (112 | ) | (1 | ) | — | (113 | ) | |||||||||
Business operating income | 7,824 | 1,573 | (112 | ) | 9,285 | |||||||||||
The tables below provide an analysis of business operating income for the Pharmaceuticals and Vaccines segments.
Pharmaceuticals segment first-half business operating income, 2017 and 2016
| (€ million) | June 30, 2017 (6 months) | as % of net sales | June 30, 2016 (6 months) | as % of net sales | Change | |||||||||||||||
Net sales | 15,511 | 100.0 | % | 14,504 | 100.0 | % | +6.9 | % | ||||||||||||
Other revenues | 149 | 1.0 | % | 122 | 0.8 | % | +22.1 | % | ||||||||||||
Cost of sales | (4,363 | ) | (28.1 | )% | (4,143 | ) | (28.6 | )% | +5.3 | % | ||||||||||
Gross profit | 11,297 | 72.8 | % | 10,483 | 72.3 | % | +7.8 | % | ||||||||||||
Research and development expenses | (2,373 | ) | (15.3 | )% | (2,246 | ) | (15.5 | )% | +5.7 | % | ||||||||||
Selling and general expenses | (4,609 | ) | (29.7 | )% | (4,261 | ) | (29.4 | )% | +8.2 | % | ||||||||||
Other operating income and expenses | 122 | 110 | ||||||||||||||||||
Share of profit/(loss) of associates and joint ventures | 82 | 44 | ||||||||||||||||||
Net income attributable to non-controlling interests | (65 | ) | (50 | ) | ||||||||||||||||
Business operating income | 4,454 | 28.7 | % | 4,080 | 28.1 | % | +9.2 | % | ||||||||||||
2017Half-Year Financial Report • Sanofi | 61
Vaccines segment first-half business operating income, 2017 and 2016
| (€ million) | June 30, 2017 (6 months) | as % of net sales | June 30, 2016 (6 months) | as % of net sales | Change | |||||||||||||||
Net sales | 1,800 | 100 | % | 1,422 | 100.0 | % | +26.6 | % | ||||||||||||
Other revenues | 370 | 20.6 | % | 188 | 13.2 | % | +96.8 | % | ||||||||||||
Cost of sales | (1,131 | ) | (62.8 | )% | (827 | ) | (58.2 | )% | +36.8 | % | ||||||||||
Gross profit | 1,039 | 57.7 | % | 783 | 55.1 | % | +32.7 | % | ||||||||||||
Research and development expenses | (294 | ) | (16.3 | )% | (268 | ) | (18.8 | )% | +9.7 | % | ||||||||||
Selling and general expenses | (437 | ) | (24.3 | )% | (348 | ) | (24.5 | )% | +25.6 | % | ||||||||||
Other operating income and expenses | 2 | (1 | ) | |||||||||||||||||
Share of profit/(loss) of associates and joint ventures | (1 | ) | 9 | |||||||||||||||||
Net income attributable to non-controlling interests | — | — | ||||||||||||||||||
Business operating income | 309 | 17.2 | % | 175 | 12.3 | % | +76.6 | % | ||||||||||||
2/ Business net income
Business net income is a non-GAAP financial measure that we use to evaluate our operational performance. For a definition of “Business net income” and a reconciliation withNet income attributable to equity holders of Sanofi, see Section “C.2.3. Business net income” and Section “F/ Appendix – Definition of financial indicators”.
Business net income for the first half of 2017 was €3,491 million, 2.6% higher than in the first half of 2016 (€3,402 million, including €299 million of Animal Health business net income). Business net income excluding Animal Health amounted to €3,491 million, compared with €3,103 million in the first half of 2016. That represents 20.2% of net sales, compared with 19.5% in the first half of 2016.
3/ Business Earnings Per Share
We also report “business earnings per share”, a non-GAAP financial measure which we define as business net income divided by the weighted average number of shares outstanding.
Business earnings per share was €2.77 for the first half of 2017, 4.9% higher than the 2016 first-half figure of €2.64, based on an average number of shares outstanding of 1,260.3 million for the first half of 2017 and 1,287.6 million for the first half of 2016.
62 | Sanofi •2017 Half-Year Financial Report
C.4. CONSOLIDATED STATEMENTS OF CASH FLOWS
Summarized consolidated statements of cash flows
| (€ million) | June 30, 2017 (6 months) | June 30, 2016 (6 months) | December 31, 2016 (12 months) | |||||||||
Net cash provided by/(used in) operating activities | 2,556 | 2,539 | 7,838 | |||||||||
Net cash provided by / (used in) investing activities (a) | (1,062 | ) | (1,414 | ) | (2,511 | ) | ||||||
Net cash inflow from the exchange of the Animal Health business for BI’s Consumer Healthcare business | 4,349 | — | — | |||||||||
Net cash provided by/(used in) financing activities | (5,192 | ) | (4,094 | ) | (4,101 | ) | ||||||
Impact of exchange rates on cash and cash equivalents | (47 | ) | (103 | ) | (101 | ) | ||||||
Net change in cash and cash equivalents | 604 | (3,072 | ) | 1,125 | ||||||||
| (a) | The main cash effect of the exchange of the Animal Health business for BI’s Consumer Healthcare business was the receipt by Sanofi of a balancing cash payment of €4,207 million. Consequently, all of the cash flows arising from that exchange transaction during the first half of 2017 are presented in a separate line item, “Net cash inflow from the exchange of the Animal Health business for BI’s Consumer Healthcare business”. |
Net cash provided by operating activities came to €2,556 million in the first half of 2017, against €2,539 million in the first half of 2016.
Operating cash flow before changes in working capital for the first half of 2017 was €3,832 million, versus €2,849 million in the first half of 2016. Working capital requirements rose by €1,276 million in the first half of 2017, as opposed to an increase of €310 million in the first half of 2016, mainly as a result of movements in other current assets, current financial assets and other current liabilities (€1,034 million).
Net cash used in investing activities totaled €1,062 million in the first half of 2017, compared with €1,414 million in the first half of 2016.
Acquisitions of property, plant and equipment and intangible assets totaled €998 million, versus €1,200 million in the first half of 2016. There were €638 million of acquisitions of property, plant and equipment, most of which (€393 million) were in the Pharmaceuticals segment, primarily in industrial facilities (€290 million). The Vaccines segment accounted for €142 million of acquisitions of property, plant and equipment during the period. Acquisitions of intangible assets (€360 million, versus €612 million in the first half of 2016) mainly comprised contractual payments for intangible rights under license and collaboration agreements.
Acquisitions of investments during the first half of 2017 totaled €486 million, net of cash acquired and after including assumed liabilities and commitments; this compares with €468 million in the first half of 2016. The main items in the first half of 2017 were the acquisition of the SPMSD vaccines portfolio (€152 million), purchases of additional shares in Regeneron (€87 million), contingent consideration paid to Bayer in connection with the acquisition of Genzyme (€84 million), and an equity injection into Onduo (€56 million).
After-tax proceeds from disposals amounted to €440 million in the first half of 2017, and arose mainly from the sale of some Consumer Healthcare products to Ipsen (€83 million) and the divestment of the equity interest in SPMSD (€127 million). After-tax proceeds from disposals in the first half of 2016 amounted to €264 million and arose from the sale of the equity interest in Nichi-Iko Pharmaceutical Co., Inc. and the sale of product rights relating to Oenobiol®.
Net cash inflow from the exchange of the Animal Health business for BI’s Consumer Healthcare business comprises the following items for the first half of 2017: (i) the receipt by Sanofi of a balancing cash payment of €4,207 million; (ii) reimbursements of intragroup accounts with Merial entities totaling €967 million; (iii) a partial payment of €934 million of the tax on the gain arising on the divestment; and (iv) the cash held by the BI subsidiaries acquired by Sanofi. The total consideration for the sale of the Animal Health business to BI was €10,320 million (see Note B.21. to the condensed half-year consolidated financial statements), and the consideration for the acquisition of BI’s Consumer Healthcare business was €6,271 million (see Note B.1. to the condensed half-year consolidated financial statements).
Net cash used in financing activities amounted to €5,192 million in the first half of 2017, compared with €4,094 million in the first half of 2016. The 2017 first-half figure includes the dividend payout to our shareholders of €3,710 million (versus €3,759 million in the first half of 2016) and the effect of changes in our share capital (repurchases of own shares, net of capital increases), amounting to €1,601 million (versus €1,387 million in the first half of 2016).
Thenet change in cash and cash equivalents in the first half of 2017 was an increase of €604 million, compared with a decrease of €3,072 million in the first half of 2016.
2017Half-Year Financial Report • Sanofi | 63
C.5. CONSOLIDATED BALANCE SHEET
Total assets were €101,870 million as of June 30, 2017, versus €104,672 million as of December 31, 2016, a decrease of €2,802 million.
Ourdebt, net of cash and cash equivalents was €7,463 million as of June 30, 2017, compared with €8,206 million as of December 31, 2016. We believe the presentation of this non-GAAP financial indicator, which is reviewed by our management, provides useful information to measure our overall liquidity and capital resources. We define “debt, net of cash and cash equivalents” as (i) the sum total of short term debt, long term debt, and interest rate derivatives and currency derivatives used to hedge debt, minus (ii) the sum total of cash and cash equivalents and interest rate derivatives and currency derivatives used to hedge cash and cash equivalents.
To assess our financing risk, we use the “gearing ratio”, another non-GAAP financial measure. This ratio (which we define as the ratio of debt, net of cash and cash equivalents, to total equity) fell from 14.2% as of December 31, 2016 to 12.9% as of June 30, 2017. Analyses of our debt as of June 30, 2017 and December 31, 2016 are provided in Note B.9. to the condensed half-year consolidated financial statements.
We expect that the future cash flows generated by our operating activities will be sufficient to repay our debt. The financing arrangements in place as of June 30, 2017 at the Sanofi parent company level are not subject to covenants regarding financial ratios and do not contain any clauses linking credit spreads or fees to Sanofi’s credit rating.
Other key movements in the balance sheet are described below.
Totalequitywas €57,792 million as of June 30, 2017, versus €57,724 million as of December 31, 2016. The year-on-year change reflects the following principal factors:
| • | an increase of €6,738 million representing net income for the first half of 2017; |
| • | decreases: the dividend payout to our shareholders (€3,710 million), currency translation differences (€2,011 million, mainly on the US dollar), and repurchases of our own shares (€1,697 million). |
As of June 30, 2017 we held 5.0 million of our own shares, recorded as a deduction from equity and representing 0.40% of our share capital.
Goodwill andOther intangible assets (€54,813 million in total) rose by €3,647 million year-on-year, the main factors being:
| • | increases: movements related to the acquisition of BI’s Consumer Healthcare business (€2,123 million of goodwill and €3,985 million of other intangible assets); and |
| • | decreases: amortization and impairment charged during the period (€1,082 million) and movements in currency translation differences (€1,884 million, mainly on the US dollar). |
Investments in associates and joint ventures (€2,841 million) decreased by €49 million.
Other non-current assets were €108 million higher at €2,928 million. The main movements during the year were a €373 million appreciation in the value of the equity investment in Alnylam.
Net deferred tax assets were €2,428 million as of June 30, 2017 versus €2,377 million as of December 31, 2016, a rise of €51 million.
Provisions and othernon-current liabilities (€8,412 million) fell by €422 million, mainly due to the impact of net changes in defined-benefit pension plan obligations (€282 million).
Liabilities related to business combinations and tonon-controlling interests decreased by €55 million to €1,521 million. The main reason for changes in this item is the impact of contingent consideration payable to Bayer as a result of an acquisition made by Genzyme prior to the latter’s acquisition by Sanofi.
64 | Sanofi •2017 Half-Year Financial Report
D/ Risk factors and related party transactions
D.1. RISK FACTORS
The risk factors to which Sanofi is exposed are described in our Annual Report on Form 20-F for the year ended December 31, 2016, filed with the US Securities and Exchange Commission on March 3, 2017. The nature of these risks has not significantly changed during the first half of 2017. These risks may materialize during the second half of 2017 or during subsequent periods.
D.2. RELATED PARTY TRANSACTIONS
Our principal related parties are defined in Note D.33. to the consolidated financial statements included at item 18 of our Annual Report on Form 20-F for the year ended December 31, 2016 (page F-96)1.
Note B.5. to the condensed half-year consolidated financial statements provides a description of the principal transactions and balances for the six months ended June 30, 2017 with associates and joint ventures that qualify as related parties.
The Group did not enter into any transactions with key management personnel during the first half of 2017.
Financial relations with the Group’s principal shareholders fall within the ordinary course of business and were immaterial in the first half of 2017.
E/ Outlook
At constant exchange rates, we expect 2017 full-year business earnings per share2 (EPS) to be broadly stable relative to 2016, barring major unforeseen adverse events. The currency impact on 2017 business EPS is estimated to be approximately +1% at June 2017 average exchange rates. We are therefore raising our previously announced guidance, which was for business EPS to be in a range from-3% to stable relative to 2016.
Full-year business net income2 for 2016 was €7,308 million, giving business earnings per share of €5.68.
This guidance has been prepared using accounting methods consistent with those used in the preparation of our historical financial information. It draws upon assumptions defined by Sanofi and its subsidiaries, in particular regarding the following factors:
| • | growth in the national markets in which we operate; |
| • | healthcare reimbursement policies, pricing reforms, and other governmental measures affecting the pharmaceutical industry; |
| • | developments in the competitive environment, in terms of innovative products and the introduction of generics; |
| • | respect by others for our intellectual property rights; |
| • | progress on our research and development programs; |
| • | the impact of our operating cost control policy, and trends in our operating costs; |
| • | trends in exchange rates and interest rates; and |
| • | the average number of shares outstanding. |
Some of the information, assumptions and estimates concerned are derived from or based, in whole or in part, on judgments and decisions made by Sanofi management that may be liable to change or adjustment in future.
| 1 | This report is available on our corporate website: www.sanofi.com. |
| 2 | Refer to the appendix in section F for a definition. |
2017Half-Year Financial Report • Sanofi | 65
Forward-Looking Statements
This document contains forward-looking statements as defined in the US Private Securities Litigation Reform Act of 1995, as amended. Forward-looking statements are statements that are not historical facts. These statements include projections and estimates and their underlying assumptions, statements regarding plans, objectives, intentions and expectations with respect to future financial results, events, operations, services, product development and potential, and statements regarding future performance. Forward-looking statements are generally identified by the words “expects,” “anticipates,” “believes,” “intends,” “estimates,” “plans” and similar expressions. Although Sanofi’s management believes that the expectations reflected in such forward-looking statements are reasonable, investors are cautioned that forward-looking information and statements are subject to various risks and uncertainties, many of which are difficult to predict and generally beyond the control of Sanofi, that could cause actual results and developments to differ materially from those expressed in, or implied or projected by, the forward-looking information and statements.
These risks and uncertainties include among other things, the uncertainties inherent in research and development, future clinical data and analysis including post marketing, decisions by regulatory authorities such as the FDA or the EMA regarding whether and when to approve any drug, device or biological application that may be filed for any such product candidates as well as their decisions regarding labeling and other matters that could affect the availability or commercial potential of such product candidates, the absence of guarantee that the product candidates if approved will be commercially successful, the future approval and commercial success of therapeutic alternatives, Sanofi’s ability to benefit from external growth opportunities and/or obtain regulatory clearances, risks associated with intellectual property and current and future intellectual property litigation and the outcome thereof, trends in exchange rates and prevailing interest rates, the instability of economic conditions, the impact of cost containment initiatives and subsequent changes thereto, and the average number of shares outstanding, as well as those discussed or identified in the public filings with the Securities and Exchange Commission (SEC) and theAutorité des marchés financiers (AMF) made by Sanofi, including those listed under “Risk Factors”1 and “Cautionary Statement Regarding Forward-Looking Statements” in Sanofi’s annual report on Form 20-F for the year ended December 31, 2016. For an update on litigation, refer to Note B.14. “Legal and arbitration proceedings” to our condensed half-year consolidated financial statements for the six months ended June 30, 2017, and to section “A.3.2. Legal and arbitration proceedings” and section “D/ Risk factors and related party transactions” on pages 40 and 64 respectively of our half-year management report.
Other than as required by applicable law, Sanofi does not undertake any obligation to update or revise any forward-looking information or statements.
| 1 | See pages 4 to 18 of our 2016 Annual Report on Form 20-F, available on our corporate website: www.sanofi.com |
66 | Sanofi •2017 Half-Year Financial Report
F/ Appendix – Definition of Financial Indicators
F.1. NET SALES ON A CONSTANT STRUCTURE BASIS AND AT CONSTANT EXCHANGE RATES
When we refer to changes in our net salesat constant exchange rates (CER), that means that we have excluded the effect of exchange rates by recalculating net sales for the relevant period using the exchange rates that were used for the previous period.
When we refer to changes in our net saleson a constant structure basis, that means that we eliminate the effect of changes in structure by restating the net sales for the previous period as follows:
| • | by including sales generated by entities or product rights acquired in the current period for a portion of the previous period equal to the portion of the current period during which we owned them, based on sales information we receive from the party from whom we make the acquisition; |
| • | similarly, by excluding sales for a portion of the previous period when we have sold an entity or rights to a product in the current period; and |
| • | for a change in consolidation method, by recalculating the previous period on the basis of the method used for the current period. |
F.2. BUSINESS INCOME
F.2.1. Business operating income
We report segment results on the basis of “Business operating income”. This indicator is used internally by our chief operating decision maker to measure the performance of each operating segment and to allocate resources. For a definition of “business operating income”, and a reconciliation between that indicator andIncome before tax and associates and joint ventures, refer to Note B.20.1 to our condensed half-year consolidated financial statements.
F.2.2. Business net income
We believe that investors’ understanding of our operational performance is enhanced by reporting “business net income”. This non-GAAP financial measure represents business operating income, less net financial expenses and the relevant income tax effects. For the year ended December 31, 2016 and comparative periods, “Business net income” consists of (i) “Business net income excluding Animal Health”, determined as described above and (ii) “Animal Health business net income”, determined on a similar and comparable basis.
We also report “business earnings per share”, a non-GAAP financial measure which we define as business net income divided by the weighted average number of shares outstanding.
Business net income is defined asNet income attributable to equity holders of Sanofi determined under IFRS, excluding the following items:
| • | amortization and impairment losses charged against intangible assets (other than software and other rights of an industrial or operational nature); |
| • | fair value remeasurement of contingent consideration relating to business combinations; |
| • | other impacts associated with acquisitions (including impacts of acquisitions on associates and joint ventures); |
| • | restructuring costs and similar expenses1; |
| • | other gains and losses (including gains and losses on major disposals of non-current assets2); |
| • | other costs and provisions related to litigation2; |
| • | the tax effects of the items listed above; |
| • | the effects of major tax disputes; |
| • | the 3% tax on the distribution of dividends to equity holders of Sanofi; |
| 1 | Presented in the line itemRestructuring costs and similar expenses in the consolidated income statement. |
| 2 | Presented in the line itemOther gains and losses, and litigation in the consolidated income statement. |
2017Half-Year Financial Report • Sanofi | 67
| • | those Animal Health items that are not included in business net income1; |
| • | the portion attributable to non-controlling interests of the items listed above; and |
| • | the impairment loss taken in 2016 against our shares in Alnylam, which reflected a decline in the market value of those shares as of December 31, 2016 relative to their historical cost, most of the decline having occurred when Alnylam decided to discontinue the revusiran development program on October 5, 2016. |
Business net income also includes Sanofi’s share of the business net income of Sanofi Pasteur MSD from the date when Sanofi and MSD announced their intention to end their joint venture.
The most significant reconciling items between our business net income andNet income attributable to equity holders of Sanofi relate to the purchase accounting effects of our acquisitions and business combinations, particularly the amortization and impairment of intangible assets (other than software and other rights of an industrial or operational nature). We believe that excluding those non-cash charges enhances an investor’s understanding of our underlying economic performance, because we do not consider that the excluded charges reflect the combined entity’s ongoing operating performance. Rather, we believe that each of the excluded charges reflects the decision to acquire the businesses concerned.
The principal purchase accounting effects of acquisitions and business combinations on net income are:
| • | amortization and net impairment losses charged against intangible assets (other than software and other rights of an industrial or operational nature), net of taxes and non-controlling interests; and |
| • | the incremental cost of sales incurred on the workdown of acquired inventories remeasured at fair value, net of taxes. |
We believe (subject to the limitations described below) that disclosing our business net income enhances the comparability of our operating performance, for the following reasons:
| • | the elimination of charges related to the purchase accounting effect of our acquisitions and business combinations (particularly amortization and impairment of finite-lived intangible assets, other than software and other rights of an industrial or operational nature) enhances the comparability of our ongoing operating performance relative to our peers in the pharmaceutical industry that carry those intangible assets (principally patents and trademarks) at low book values either because they are the result of in-house research and development that has already been expensed in prior periods or because they were acquired through business combinations that were accounted for as poolings-of-interest; |
| • | the elimination of selected items such as the incremental cost of sales arising from the workdown of inventories remeasured at fair value, major gains and losses on disposals, and costs and provisions associated with major litigation improves comparability from one period to the next; and |
| • | the elimination of restructuring costs and similar items enhances comparability because those costs are incurred in connection with reorganization and transformation processes intended to optimize our operations. |
We remind investors, however, that business net income should not be considered in isolation from, or as a substitute for,Net income attributable to equity holders of Sanofi reported in accordance with IFRS. In addition, we strongly encourage investors and potential investors not to rely on any single financial measure but to review our financial statements, including the notes thereto, carefully and in their entirety.
We compensate for the material limitations described above by using business net income only to supplement our IFRS financial reporting and by ensuring that our disclosures provide sufficient information for a full understanding of all adjustments included in business net income.
Because our business net income is not a standardized measure, it may not be comparable with the non-GAAP financial measures of other companies using the same or a similar non-GAAP financial measure.
| 1 | Comprises (i) impact of the discontinuation of depreciation and impairment of property, plant & equipment with effect from the start date of application of IFRS 5 (Discontinued and Held-for-Sale Operations) included in business net income; (ii) impact of the amortization and impairment of intangible assets until the start date of IFRS 5 application; (iii) costs directly incurred as a result of the divestment; and (iv) tax effects of those items. |
68 | Sanofi •2017 Half-Year Financial Report
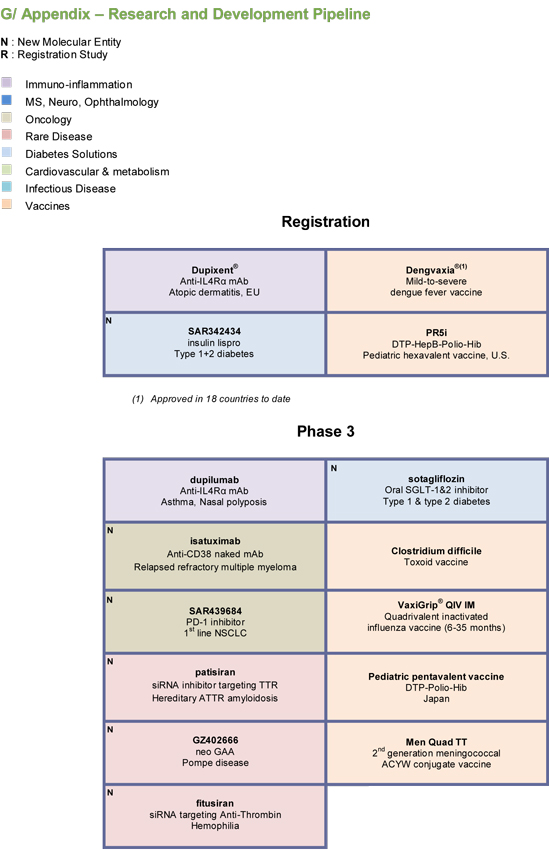
G/ Appendix – Research and Development Pipeline N : New Molecular Entity R : Registration Study Immuno-inflammation MS, Neuro, Ophthalmology Oncology Rare Disease Diabetes Solutions Cardiovascular & metabolism Infectious Disease Vaccines Registration Dupixent® Anti-IL4Rá mAb Atopic dermatitis, EU Dengvaxia®(1) Mild-to-severe dengue fever vaccine N SAR342434 insulin lispro Type 1+2 diabetes PR5i DTP-HepB-Polio-Hib Pediatric hexavalent vaccine, U.S. (1) Approved in 18 countries to date Phase 3 dupilumab Anti-IL4Rá mAb Asthma, Nasal polyposis N sotagliflozin Oral SGLT-1&2 inhibitor Type 1 & type 2 diabetes N isatuximab Anti-CD38 naked mAb Relapsed refractory multiple myeloma Clostridium difficile Toxoid vaccine N SAR439684 PD-1 inhibitor 1st line NSCLC VaxiGrip® QIV IM Quadrivalent inactivated influenza vaccine (6-35 months) N patisiran siRNA inhibitor targeting TTR Hereditary ATTR amyloidosis Pediatric pentavalent vaccine DTP-Polio-Hib Japan N GZ402666 neo GAA Pompe disease Men Quad TT 2nd generation meningococcal ACYW conjugate vaccine N fitusiran siRNA targeting Anti-Thrombin Hemophilia
2017Half-Year Financial Report • Sanofi | 69

Phase 2 dupilumab Anti-IL4Rá mAb Eosinophilic oesophagitis N efpeglenatide Long-acting GLP-1 receptor agonist Type 2 diabetes Rabies VRVg Purified vero rabies vaccine N SAR156597 IL4/IL13 Bi-specific mAb IPF, Systemic Scleroderma N SAR425899 GLP-1R/GCGR dual agonist Type 2 diabetes Tuberculosis Recombinant subunit vaccine N GZ389988 TRKA antagonist Osteoarthritis R SAR439684 PD-1 inhibitor Advanced CSCC (Skin cancer) Fluzone® QIV HD Quadrivalent inactivated influenza vaccine – High dose N SAR100842 LPA1 receptor antagonist Systemic sclerosis SAR439684 PD-1 inhibitor Advanced BCC Adacel+ Tdap booster sarilumab Anti-IL6R mAb Uveitis isatuximab Anti-CD38 naked mAb Acute lymphoblastic leukemia Shan 6 DTP-HepB-Polio-Hib Pediatric hexavalent vaccine N SAR422459 ABCA4 gene therapy Stargardt disease N SAR566658 Maytansin-loaded anti-CA6 mAb Solid tumors HIV Viral vector prime & rgp120 boost vaccine N - R olipudase alfa rhASM Deficiency Acid sphingomyelinase deficiency(1) N SAR439152 Myosin inhibitor Hypertrophic cardiomyopathy SP0232(2) Respiratory syncytial virus mAb N venglustat Oral GCS inhibitor Gaucher related Parkinson’s disease, Gaucher disease type 3, Fabry disease N - R Combination ferroquine / OZ439 Antimalarial (1) Also known as Niemann Pick type B (2) Also known as MEDI8897
Phase 1 N SAR440340 Anti-IL33 mAb Asthma & COPD N SAR408701 Maytansin-loaded anti-CEACAM5 mAb Solid tumors N SAR440181(1) DCM1 Myosin activation Cardiovascular indication N SAR439794 TLR4 agonist Peanut allergy N SAR428926 Maytansin-loaded anti-Lamp1 mAb Cancer N SAR247799 S1P1 agonist Cardiovascular indication N GZ402668 GLD52 (anti-CD52 mAb) Relapsing multiple sclerosis N SAR439459 TGFb inhibition mAb Metastatic melanoma N SAR407899 rho kinase Microvascular angina N UshStat® Myosin 7A gene therapy Usher syndrome 1B N SAR438335 GLP-1R/GIPR dual agonist Type 2 diabetes Herpes Simplex Virus Type 2 HSV-2 vaccine N SAR228810 Anti-protofibrillar AB mAb Alzheimer’s disease N SAR341402 Rapid acting insulin Diabetes Zika Inactivated Zika vaccine Respiratory syncytial virus Infants (1)Also known as MYK491
70 | Sanofi •2017 Half-Year Financial Report