Exhibit 99.1

Paris, October 31, 2019
Sanofi Q3 well on track
| | | | | | | | | | | | | | | | | | | | | | | | |
| | | Q3 2019 | | | Change | | | Change
at CER | | | 9M 2019 | | | Change | | | Change
at CER | |
IFRS net sales reported | | € | 9,499m | | | | +1.1 | % | | | -1.1 | % | | € | 26,518m | | | | +4.1 | % | | | +2.2 | % |
IFRS net income reported | | € | 1,766m | | | | -22.3 | % | | | — | | | € | 2,816m | | | | -30.5 | %(2) | | | — | |
IFRS EPS reported | | € | 1.49 | | | | -18.6 | % | | | — | | | € | 2.33 | | | | -28.3 | %(2) | | | — | |
Business net income(1) | | € | 2,399m | | | | +4.3 | % | | | +0.2 | % | | € | 5,805m | | | | +6.4 | % | | | +4.1 | % |
Business EPS(1) | | € | 1.92 | | | | +4.3 | % | | | 0.0 | % | | € | 4.65 | | | | +6.4 | % | | | +4.1 | % |
Third-quarter 2019 sales performance(3) led by Sanofi Genzyme and Emerging Markets
| | • | | Net sales were €9,499 million, up 1.1% on a reported basis, down 1.1%(3) at CER and up 0.5% at CER/CS(4). |
| | • | | Sanofi Genzyme sales increased 19.5% driven by continued strong uptake of Dupixent®. |
| | • | | Vaccines sales decreased 9.8% reflecting anticipated weighting of U.S. flu vaccines supply towards fourth quarter. |
| | • | | CHC sales up 0.4%, impacted by Zantac® voluntary recall,non-core divestments and increased regulatory requirements. |
| | • | | Primary Care sales declined 12.7% at CER/CS due to lower sales in Diabetes and Established Products. |
| | • | | Emerging Markets(5) sales grew 9.7% due to strong performance in most regions. |
Full-year business EPS guidance confirmed
| | • | | Q3 2019 business net income increased 4.3% to €2,399 million and 0.2% at CER. |
| | • | | Q3 2019 business EPS(1) was stable at CER at €1.92. |
| | • | | Q3 2019 IFRS EPS was €1.49, down 18.6% reflecting the capital gain on the European generics divestment in Q3 2018. |
| | • | | Sanofi expects 2019 business EPS(1) to grow approximately 5% at CER(6) barring unforeseen major adverse events. Applying the average October 2019 exchange rates, the currency impact on 2019 business EPS is estimated to be around +3%. |
Key R&D and regulatory milestones achieved
| | • | | Dupixent® approved by European Commission for severe chronic rhinosinusitis with nasal polyposis. |
| | • | | Dupixent® approved by European Commission for adolescents withmoderate-to-severe atopic dermatitis. |
| | • | | Dupixent®demonstrated positive topline phase 3 results in children aged 6 to 11 years with severe atopic dermatitis. |
| | • | | MenQuadfiTM, a meningococcal vaccine candidate, submitted in EU. |
| | • | | Flublok®, a quadrivalent influenza vaccine, submitted in EU. |
Sanofi Chief Executive Officer, Paul Hudson, commented:
“Since joining Sanofi only two months ago, I am increasingly excited about the strength of our businesses, our ability to develop transformative medicines and the diverse talent of our teams across the organization. Building on this foundation, Sanofi delivered a resilient underlying performance in the third quarter with strong sales in Specialty Care, largely driven by the continued outstanding performance of Dupixent®. I am encouraged by the organization’s early achievements in our efficiency initiatives, which will allow us to further drive innovation in our business. I’m looking forward to discussing Sanofi‘s strategic priorities at our Capital Markets Day in Cambridge, MA on December 10”.
| (1) | In order to facilitate an understanding of operational performance, Sanofi comments on the business net income statement. Business net income is anon-GAAP financial measure (see Appendix 8 for definitions). The consolidated income statement for Q3 2019 is provided in Appendix 3 and a reconciliation of reported IFRS net income to business net income is set forth in Appendix 4; (2) including in Q2 2019 a€1.8 billion impairment charge mainly related to Eloctate®; (3) Changes in net sales are expressed at constant exchange rates (CER) unless otherwise indicated (see Appendix 8); (4) Constant Structure: Adjusted for divestment of European generics business and sales of Bioverativ products to SOBI; (5) See definition page 9; (6) 2018 business EPS was€5.47. |
|
Investor Relations: (+) 33 1 53 77 45 45 -E-mail: IR@sanofi.com -Media Relations: (+) 33 1 53 77 46 46 -E-mail: MR@sanofi.com Website: www.sanofi.comMobile app: SANOFI IR available on the App Store and Google Play |
1
2019 third-quarter and first nine months Sanofi sales
Unless otherwise indicated, all percentage changes in sales in this press release are stated at CER(7).
In the third quarter of 2019, Company sales were €9,499 million, up 1.1% on a reported basis. Exchange rate movements had a positive effect of 2.2 percentage points mainly driven by the strength of the U.S. dollar which was partially offset by the negative impact from the Argentine Peso. At CER, Company sales decreased 1.1%.
First nine months Company sales reached €26,518 million, up 4.1% on a reported basis. Exchange rate movements had a favorable effect of 1.9 percentage points. At CER, Company sales were up 2.2%.
Global Business Units
The table below presents sales by Global Business Unit (GBU). Please note that Emerging Markets sales for Specialty Care and Primary Care are included in the China & Emerging Markets GBU.
| | | | | | | | | | | | | | | | |
Net Sales by GBU (€ million) | | Q3 2019 | | | Change
at CER | | | 9M 2019 | | | Change
at CER | |
Sanofi Genzyme (Specialty Care)(a) | | | 2,359 | | | | +19.5 | % | | | 6,670 | | | | +23.5 | %(c) |
Primary Care(a) | | | 2,185 | | | | -17.5 | %(d) | | | 6,751 | | | | -16.7 | %(e) |
China & Emerging Markets(b) | | | 1,890 | | | | +10.0 | % | | | 5,739 | | | | +9.1 | % |
Total Pharmaceuticals | | | 6,434 | | | | +1.5 | % | | | 19,160 | | | | +2.1 | % |
Consumer Healthcare (CHC) | | | 1,136 | | | | +0.4 | % | | | 3,535 | | | | +0.7 | % |
Sanofi Pasteur (Vaccines) | | | 1,929 | | | | -9.8 | % | | | 3,823 | | | | +3.9 | % |
Total net sales | | | 9,499 | | | | -1.1 | % | | | 26,518 | | | | +2.2 | %(f) |
| (a) | Does not include China & Emerging Markets sales - see definition page 10; (b) Includes Emerging Markets sales for Primary Care and Specialty Care; (c) +19.2% at CS -Adjusted for Bioverativ acquisition and sales of Bioverativ products to SOBI – see page 5; (d)-12.7% at CS; (e)-11.6% at CS; (f) +3.2% at CS - Adjusted for Bioverativ and sales of Bioverativ products to SOBI and European Generics. |
Global Franchises
The tables below present third-quarter and first nine months 2019 sales by global franchise, including Emerging Markets sales, to facilitate comparisons. Appendix 1 provides a reconciliation of sales by GBU and franchise.
| | | | | | | | | | | | | | | | | | | | | | | | |
Net sales by Franchise (€ million) | | Q3 2019 | | | Change
at CER | | | Developed Markets | | | Change
at CER | | | Emerging Markets | | | Change
at CER | |
Specialty Care franchises | | | 2,654 | | | | +19.8 | % | | | 2,359 | | | | +19.5 | % | | | 295 | | | | +21.9 | % |
Rare Disease | | | 774 | | | | +6.5 | % | | | 637 | | | | +2.8 | % | | | 137 | | | | +24.2 | % |
Multiple Sclerosis | | | 551 | | | | +2.1 | % | | | 534 | | | | +2.2 | % | | | 17 | | | | 0.0 | % |
Oncology | | | 424 | | | | +9.2 | % | | | 297 | | | | +7.4 | % | | | 127 | | | | +13.5 | % |
Immunology | | | 619 | | | | +140.1 | % | | | 610 | | | | +138.8 | % | | | 9 | | | | ns | |
Rare Blood Disorder | | | 286 | | | | -3.9 | %(1) | | | 281 | | | | -5.7 | %(2) | | | 5 | | | | ns | |
Primary Care franchises | | | 3,780 | | | | -8.3 | %(3) | | | 2,185 | | | | -17.5 | %(4) | | | 1,595 | | | | +7.9 | % |
Established Rx Products(5) | | | 2,371 | | | | -7.3 | %(6) | | | 1,207 | | | | -17.9 | %(7) | | | 1,164 | | | | +6.9 | % |
Diabetes | | | 1,261 | | | | -9.9 | % | | | 837 | | | | -17.7 | % | | | 424 | | | | +10.1 | % |
Cardiovascular | | | 148 | | | | -10.6 | % | | | 141 | | | | -12.2 | % | | | 7 | | | | +40.0 | % |
Consumer Healthcare | | | 1,136 | | | | +0.4 | % | | | 722 | | | | -3.3 | % | | | 414 | | | | +7.3 | % |
Vaccines | | | 1,929 | | | | -9.8 | % | | | 1,448 | | | | -15.2 | % | | | 481 | | | | +10.7 | % |
Total net sales | | | 9,499 | | | | -1.1 | %(8) | | | 6,714 | | | | -5.1 | %(9) | | | 2,785 | | | | +9.7 | % |
| (1) | +1.1% atCS- see page 5; (2)-0.7% atCS- see page 5; (3)-5.0% at CS; (4)-12.7% at CS; (5) including Generics; (6)-1.8% at CS; (7)-8.9% at CS; (8) +0.5% at CS; (9)-2.9% at CS |
| (7) | See Appendix 8 for definitions of financial indicators. |
2
| | | | | | | | | | | | | | | | | | | | | | | | |
Net sales by Franchise (€ million) | | 9M 2019 | | | Change
at CER | | | Developed Markets | | | Change
at CER | | | Emerging Markets | | | Change
at CER | |
Specialty Care franchises | | | 7,601 | | | | +24.2 | %(1) | | | 6,670 | | | | +23.5 | % | | | 931 | | | | +28.5 | % |
Rare Disease | | | 2,350 | | | | +8.3 | % | | | 1,890 | | | | +3.2 | % | | | 460 | | | | +31.1 | % |
Multiple Sclerosis | | | 1,620 | | | | +3.5 | % | | | 1,563 | | | | +3.2 | % | | | 57 | | | | +12.5 | % |
Oncology | | | 1,254 | | | | +10.4 | % | | | 872 | | | | +6.7 | % | | | 382 | | | | +19.5 | % |
Immunology | | | 1,526 | | | | +158.9 | % | | | 1,507 | | | | +157.1 | % | | | 19 | | | | ns | |
Rare Blood Disorder | | | 851 | | | | +33.0 | %(2) | | | 838 | | | | +30.8 | %(3) | | | 13 | | | | ns | |
Primary Care franchises | | | 11,559 | | | | -8.4 | %(4) | | | 6,751 | | | | -16.7 | %(5) | | | 4,808 | | | | +5.8 | % |
Established Rx Products(6) | | | 7,283 | | | | -8.9 | %(7) | | | 3,789 | | | | -18.3 | %(8) | | | 3,494 | | | | +3.7 | % |
Diabetes | | | 3,845 | | | | -7.9 | % | | | 2,551 | | | | -15.6 | % | | | 1,294 | | | | +11.2 | % |
Cardiovascular | | | 431 | | | | -4.6 | % | | | 411 | | | | -6.6 | % | | | 20 | | | | +66.7 | % |
Consumer Healthcare | | | 3,535 | | | | +0.7 | % | | | 2,308 | | | | -1.7 | % | | | 1,227 | | | | +5.2 | % |
Vaccines | | | 3,823 | | | | +3.9 | % | | | 2,550 | | | | -5.6 | % | | | 1,273 | | | | +28.7 | % |
Total net sales | | | 26,518 | | | | +2.2 | %(9) | | | 18,279 | | | | -1.6 | %(10) | | | 8,239 | | | | +11.1 | % |
| (1) | +20.4 % atCS- Adjusted for Bioverativ and sales of products to SOBI – see page 5; (2) +1.5% atCS- see page 5; (3)-0.1% at CS-see page 5; (4)-5.0% at CS;(5)-11.6% at CS; (6) including Generics; (7)-3.4% at CS; (8)-9.2% at CS; (9) +3.2% atCS- Adjusted for Bioverativ and sales of Bioverativ products to SOBI and European Generics;(10)-0.1% at CS - Adjusted for Bioverativ and sales of Bioverativ products to SOBI and European Generics |
Pharmaceuticals
Third-quarter Pharmaceutical sales were up 1.5% (up 4.1% at CS) to €6,434 million mainly driven by Dupixent® which was partially offset by Diabetes and Established Rx Products including the disposal of the European generics business at the end of third-quarter 2018. First nine months sales for Pharmaceuticals increased 2.1% (up 3.6% at CS) to €19,160 million.
Specialty Care franchises
Immunology franchise
| | | | | | | | | | | | | | | | |
| Net sales (€ million) | | Q3 2019 | | | Change
at CER | | | 9M 2019 | | | Change
at CER | |
Dupixent® | | | 570 | | | | +142.2 | % | | | 1,395 | | | | +160.6 | % |
Kevzara® | | | 49 | | | | +118.2 | % | | | 131 | | | | +142.3 | % |
Total Immunology | | | 619 | | | | +140.1 | % | | | 1,526 | | | | +158.9 | % |
Dupixent® (collaboration with Regeneron) generated sales of €570 million in the third quarter (up 142%). In the U.S., Dupixent® sales of €455 million (up 130%) were driven by continued growth in atopic dermatitis which benefited from launch in the adolescent age group (12 to 17 years of age) inmid-March, rapid uptake in asthma and launch in chronic rhinosinusitis with nasal polyposis (approved in the U.S. in June). Dupixent® U.S. NBRx and TRx were respectively up 15% and 21% sequentially. In Europe, third-quarter sales were €54 million (up 170%). In Rest of the World region, Dupixent® sales were €52 million (up 243%) mainly generated in Japan. Dupixent® is now launched in 30 countries, 7 of which have multiple indications launched. First nine months Dupixent® sales increased 161% to €1,395 million. Long term 76 week data was recently published in the Journal of the American Academy of Dermatology with a safety profile that was consistent with previous clinical trials and sustained efficacy. This data is supportive of continuous long term use of Dupixent®.
Kevzara® (collaboration with Regeneron) sales were €49 million (up 118%) in the third quarter, of which €33 million was in the U.S. (up 78%) reflecting increased adoption and category share. First nine months Kevzara® sales increased 142% to €131 million.
Multiple Sclerosis franchise
| | | | | | | | | | | | | | | | |
| Net sales (€ million) | | Q3 2019 | | | Change
at CER | | | 9M 2019 | | | Change
at CER | |
Aubagio® | | | 494 | | | | +12.4 | % | | | 1,397 | | | | +11.7 | % |
Lemtrada® | | | 57 | | | | -42.4 | % | | | 223 | | | | -28.4 | % |
Total Multiple Sclerosis | | | 551 | | | | +2.1 | % | | | 1,620 | | | | +3.5 | % |
3
Third-quarterMultiple Sclerosis (MS) sales increased 2.1% to €551 million, driven by double-digit growth of Aubagio® in the U.S. and Europe, partially offset by lower Lemtrada®sales. First nine months MS sales increased 3.5% to €1,620 million.
Third-quarterAubagio®sales increased 12.4% to €494 million, supported by the U.S. performance (up 13.8% to €363 million) and Europe (up 10.8% to €103 million). First nine months Aubagio® sales increased 11.7% to €1,397 million.
Beginning January 1, 2020, Aubagio® will be excluded from the ESI National Preferred Formulary.
In the third quarter,Lemtrada® sales decreased 42.4% to €57 million due to lower U.S. sales (down 33.3% to €34 million) and European sales (down 60.5% to €15 million), reflecting increased global competition and the update to the EU label. First nine months Lemtrada® sales decreased 28.4% to €223 million.
On October 30, 2019, Sanofi entered into an agreement to settle, without any admission of liability or wrongdoing, the previously disclosed action initiated against Sanofi by the Trustee relating to Sanofi’s publicly-traded Contingent Value Rights. As part of the settlement agreement, Sanofi will pay a total of $315 million. The settlement agreement is subject to, among other things, final court approval.
Oncology franchise
| | | | | | | | | | | | | | | | |
| Net sales (€ million) | | Q3 2019 | | | Change
at CER | | | 9M 2019 | | | Change
at CER | |
Jevtana® | | | 119 | | | | +8.5 | % | | | 356 | | | | +11.7 | % |
Thymoglobulin® | | | 90 | | | | +18.7 | % | | | 265 | | | | +17.8 | % |
Eloxatin® | | | 52 | | | | +6.1 | % | | | 161 | | | | +15.1 | % |
Mozobil® | | | 50 | | | | +14.3 | % | | | 143 | | | | +11.3 | % |
Taxotere® | | | 42 | | | | -4.5 | % | | | 131 | | | | +0.8 | % |
Zaltrap® | | | 26 | | | | +13.6 | % | | | 71 | | | | +2.9 | % |
Others | | | 45 | | | | +4.8 | % | | | 127 | | | | +1.7 | % |
Total Oncology | | | 424 | | | | +9.2 | % | | | 1,254 | | | | +10.4 | % |
Third-quarterOncology sales increased 9.2% to €424 million driven by Emerging Markets (up 13.5% to €127 million) and the U.S. (up 9.7% to €152 million). First nine months Oncology sales increased 10.4% to €1,254 million.
Third-quarterJevtana® sales increased 8.5% to €119 million driven by the U.S. and Japan. First nine months Jevtana® sales were up 11.7% to €356 million. In the third quarter,Thymoglobulin® sales increased 18.7% to €90 million, reflecting the performance in Emerging Markets. Over the period,Eloxatin® sales grew 6.1% to €52 million driven by China. First nine months sales of Thymoglobulin® and Eloxatin® increased 17.8% (to €265 million) and 15.1% (to €161 million), respectively.
Libtayo® (collaboration with Regeneron) was approved in the U.S. in September 2018 for the treatment of patients with metastatic cutaneous squamous cell carcinoma (CSCC) or locally advanced CSCC who are not candidates for curative surgery or curative radiation. U.S. Libtayo® sales are reported by Regeneron. Libtayo® was approved in Brazil at the end of March and in Canada in April. In late June, Libtayo® was approved in the European Union for adult patients with metastatic or locally advanced CSCC who are not candidates for curative surgery or curative radiation and launched in July in the UK, Germany, and Austria.Ex-U.S. Libtayo® sales were €4 million in the third quarter.
Rare Disease franchise
| | | | | | | | | | | | | | | | |
| Net sales (€ million) | | Q3 2019 | | | Change
at CER | | | 9M 2019 | | | Change
at CER | |
Myozyme®/ Lumizyme® | | | 226 | | | | +7.7 | % | | | 680 | | | | +9.8 | % |
Fabrazyme® | | | 202 | | | | +3.7 | % | | | 598 | | | | +6.4 | % |
Cerezyme® | | | 168 | | | | +6.7 | % | | | 531 | | | | +6.1 | % |
Aldurazyme® | | | 49 | | | | 0.0 | % | | | 170 | | | | +12.5 | % |
Cerdelga® | | | 53 | | | | +26.8 | % | | | 151 | | | | +27.8 | % |
Others Rare Disease | | | 76 | | | | +2.8 | % | | | 220 | | | | +0.5 | % |
Total Rare Disease | | | 774 | | | | +6.5 | % | | | 2,350 | | | | +8.3 | % |
4
In the third quarter,Rare Disease sales increased 6.5% to €774 million, driven by Emerging Markets (up 24.2% to €137 million). In the U.S., third-quarter Rare Disease sales grew 4.8% to €298 million. In Europe, over the period, sales increased 4.1% to €253 million. First nine months Rare Disease sales increased 8.3% to €2,350 million.
Third-quarterGaucher (Cerezyme® and Cerdelga®)sales were up 10.7% to €221 million, supported by the increasing penetration of Cerdelga® in Europe and the U.S. and the sustained growth of Cerezyme® in Emerging Markets. Third-quarter Cerdelga® sales increased 26.8% to €53 million, with sales up 53.8% in Europe (to €19 million) and up 12.0% in the U.S. (to €30 million). First nine months Gaucher sales were €682 million, up 10.1%.
Third-quarterPompe (Myozyme®/Lumizyme®) sales grew 7.7% to €226 million, supported by positive trends in naïve patient accruals. This performance was driven by the U.S. (up 8.3% to €81 million) and Emerging Markets (up 18.8% to €34 million). First nine months Myozyme®/Lumizyme® sales increased 9.8% to €680 million.
Third-quarterFabry (Fabrazyme®) sales grew 3.7% to €202 million, driven by Emerging Markets (up 33.3% to €22 million) and Europe (up 7.0% to €46 million). Over the period, U.S. sales were stable at €105 million. First nine months Fabrazyme® sales were up 6.4% to €598 million.
Rare Blood Disorder franchise
| | | | | | | | | | | | | | | | |
| Net sales (€ million) | | Q3 2019 | | | Change
at CER | | | 9M 2019 | | | Change
at CER | |
Eloctate® | | | 162 | | | | -20.2 | %* | | | 507 | | | | +15.8 | %* |
Alprolix® | | | 104 | | | | +12.5 | %** | | | 304 | | | | +51.1 | %** |
Cablivi® | | | 20 | | | | — | | | | 40 | | | | — | |
Total Rare Blood Disorder | | | 286 | | | | -3.9 | %*** | | | 851 | | | | +33.0 | %*** |
| * | -17.6% at CS in Q3 2019 and-11.2% in 9M 2019 at CS - see footnotes 8 and 9; **+23.8% at CS in Q3 2019 and +13.9% at CS in 9M 2019 – see footnotes 8 and 9; |
| *** | +1.1% at CS in Q3 2019 and +1.5% in 9M 2019 at CS - see footnotes 8 and 9 |
Bioverativ was consolidated in Sanofi’s Financial Statements from March 9, 2018. Third-quarter sales of the Rare Blood Disorder franchise were €286 million, up 1.1% at CS(8). Third-quarter U.S. sales were €214 million, down 5.6%. Non U.S. sales were €72 million with Japan as the primary contributor. First nine months sales of the Rare Blood Disorder franchise were €851 million, up 1.5% at CS(9).
Eloctate® sales were €162 million in the third quarter, down 17.6% at CS(8). In the U.S., sales of the product decreased 23.5% to €122 million, reflecting ongoing competitive pressure. In the Rest of the World region, third-quarter Eloctate® sales decreased 8.6% at CS(8) to €35 million. First nine months Eloctate® sales were €507 million, down 11.2% at CS(9).
Alprolix® sales were €104 million in the third quarter, up 23.8% at CS(8). In the U.S., sales of the product increased 17.5% to €79 million. In the Rest of the World region, Alprolix® sales increased 47.1% at CS(8) to €25 million due to growth in product sales to SOBI and Japan. First nine months Alprolix® sales were €304 million, up 13.9% at CS(9).
Cablivi® for the treatment of adults with acquired thrombotic thrombocytopenic purpura (aTTP) generated third-quarter sales of €20 million. In the U.S., where Cablivi® was launched in April, sales were €13 million. In Europe, where the product is commercially available in Germany, Denmark, Austria, Belgium and the Netherlands, sales were €6 million. Cablivi® has a temporary license to be sold in France. First nine months Cablivi® sales were €40 million.
Primary Care franchises
Cardiovascular franchise
| | | | | | | | | | | | | | | | |
| Net sales (€ million) | | Q3 2019 | | | Change
at CER | | | 9M 2019 | | | Change
at CER | |
Praluent® | | | 61 | | | | -11.8 | % | | | 183 | | | | -0.6 | % |
Multaq® | | | 87 | | | | -9.7 | % | | | 248 | | | | -7.5 | % |
Total cardiovascular franchise | | | 148 | | | | -10.6 | % | | | 431 | | | | -4.6 | % |
5
Third-quarterPraluent® (collaboration with Regeneron) sales decreased 11.8% to €61 million, reflecting lower sales in the U.S. (down 31.7% to €29 million) which were impacted by significantly higher rebates. In Europe, Praluent® sales increased 4.5% to €22 million despite the suspension of sales in Germany in August following the Regional Court of Dusseldorf ruling in the ongoing patent litigation. First nine months Praluent® sales decreased 0.6% to €183 million. In August, the U.S. District Court for the District of Delaware ruled in favor of Sanofi and Regeneron in the ongoing Praluent® (alirocumab) patent litigation. The Court found as a matter of law that Amgen’s asserted patent claims for antibodies targeting PCSK9 (proprotein convertase subtilisin/kexin type 9) are invalid based on lack of enablement. U.S. payer coverage for Praluent® in 2020 is expected to be lower for insured lives across Medicare plans.
| (8) | Sales of products to SOBI were initially recorded in “other revenues” in H1 2018” and in sales from H2 2018; the H1 2018 reclassification was reflected in Q3 2018. H1 2018 and Q3 2018 sales were adjusted accordingly for calculation of CS. Unaudited data. (9) Growth comparing first nine months 2019 sales versus full first nine months 2018 sales at CER. Sales of products to SOBI were initially recorded in “other revenues” in H1 2018” and in sales from H2 2018; the H1 2018 reclassification was reflected in Q3 2018. H1 2018 and Q3 2018 sales were adjusted accordingly for calculation of CS. Unaudited data. |
6
Diabetes franchise
| | | | | | | | | | | | | | | | |
| Net sales (€ million) | | Q3 2019 | | | Change
at CER | | | 9M 2019 | | | Change
at CER | |
Lantus® | | | 751 | | | | -17.5 | % | | | 2,283 | | | | -17.0 | % |
Toujeo® | | | 218 | | | | 0.0 | % | | | 649 | | | | +1.4 | % |
Total glargine | | | 969 | | | | -14.1 | % | | | 2,932 | | | | -13.5 | % |
Amaryl® | | | 84 | | | | -8.0 | % | | | 255 | | | | -2.7 | % |
Apidra® | | | 83 | | | | -2.4 | % | | | 256 | | | | -4.1 | % |
Admelog® | | | 51 | | | | +84.6 | % | | | 194 | | | | ns | |
Soliqua® | | | 33 | | | | +55.0 | % | | | 83 | | | | +71.7 | % |
Insuman® | | | 19 | | | | -4.8 | % | | | 62 | | | | -5.9 | % |
Total Diabetes | | | 1,261 | | | | -9.9 | % | | | 3,845 | | | | -7.9 | % |
In the third quarter, globalDiabetes sales decreased 9.9% to €1,261 million, due to lower glargine (Lantus® and Toujeo®) sales in the U.S. Third-quarter U.S. Diabetes sales were down 24.7% to €451 million, reflecting the increased contribution to the coverage gap related to Medicare Part D and a continued decline in average U.S. glargine net prices. Third-quarter sales in Emerging Markets increased 10.1% to €424 million. Third-quarter sales in Europe decreased 3.0% to €295 million despite Toujeo® growth (up 18.3% to €84 million). First nine months global Diabetes sales decreased 7.9% to €3,845 million. Broad U.S. payer coverage for key Diabetes brands is expected to be largely maintained in 2020.
In the third quarter,Lantus® sales were €751 million, down 17.5%. In the U.S., Lantus® sales decreased 32.5% to €295 million, mainly reflecting lower average net price and the increased contribution to the coverage gap related to Medicare Part D. In Europe, third-quarter Lantus® sales were €140 million, down 13.0% due to biosimilar glargine competition and patients switching to Toujeo®. In Emerging Markets, third-quarter Lantus® sales were up 9.5% to €264 million. First nine months Lantus® sales decreased 17.0% to €2,283 million.
Third-quarterToujeo® sales were stable at €218 million. In the U.S., third-quarter Toujeo® sales were €73 million, down 25.0% mainly reflecting lower average net price and the increased contribution to the coverage gap related to Medicare Part D. In Europe and Emerging Markets, third-quarter Toujeo® sales were €84 million (up 18.3%) and €43 million (up 26.5%), respectively. First nine months Toujeo® sales increased 1.4% to €649 million.
Third-quarter and first nine monthsAmaryl® sales were €84 million (down 8.0%) and €255 million (down 2.7%), respectively.
Third-quarterApidra® sales decreased 2.4% to €83 million. Lower sales in the U.S. (down 35.3% to €11 million) offset growth in Emerging Markets (up 23.1% to €32 million). First nine months Apidra® sales were €256 million, down 4.1%.
Admelog® (insulin lispro injection) generated sales of €51 million (up 85%) in the third quarter. Admelog® sales in the U.S. were €47 million, up 80% versus the third quarter of 2018, but down 34% versus the second quarter of 2019 due to the WAC price adjustment of-44% which took effect on July 1. First nine months Admelog® sales were €194 million versus €36 million in the same period of 2018.
Third-quarter and first nine monthsSoliqua® 100/33 (insulin glargine 100 Units/mL & lixisenatide 33 mcg/mL injection) andSuliqua™ sales increased 55% (to €33 million) and 72% (to €83 million), respectively.
Established Rx Products
| | | | | | | | | | | | | | | | |
| Net sales (€ million) | | Q3 2019 | | | Change
at CER | | | 9M 2019 | | | Change
at CER | |
Lovenox® | | | 334 | | | | -5.4 | % | | | 1,024 | | | | -8.5 | % |
Plavix® | | | 356 | | | | -0.6 | % | | | 1,122 | | | | -0.4 | % |
Aprovel®/Avapro® | | | 169 | | | | +5.7 | % | | | 543 | | | | +7.2 | % |
Synvisc®/Synvisc-One® | | | 73 | | | | -2.8 | % | | | 228 | | | | -6.5 | % |
Renvela®/Renagel® | | | 84 | | | | -28.9 | % | | | 229 | | | | -29.8 | % |
Myslee®/Ambien®/Stilnox® | | | 56 | | | | -1.8 | % | | | 163 | | | | -8.1 | % |
Allegra® | | | 18 | | | | -5.6 | % | | | 100 | | | | -3.1 | % |
Generics | | | 268 | | | | -32.1 | % | | | 804 | | | | -33.9 | % |
Other | | | 1,013 | | | | -1.2 | % | | | 3,070 | | | | -3.3 | % |
Total Established Rx Products | | | 2,371 | | | | -7.3 | % | | | 7,283 | | | | -8.9 | % |
7
In the third quarter,Established Rx Productssales decreased 7.3% to €2,371 million, primarily reflecting the divestment of the European generics business Zentiva at the end of the third quarter of 2018. Excluding the generics divestment, Established Rx Products sales decreased 1.8% in the third quarter, reflecting generic competition to Renvela®/Renagel® (sevelamer) in the U.S. and lower Lovenox sales in Europe®. First nine months Established Rx Products sales decreased 8.9% to €7,283 million (down 3.4% at CS).
Third-quarterLovenox®sales decreased 5.4% to €334 million, reflecting lower Mature Markets sales (down 16.2% to €191 million) due to biosimilar competition in several countries in Europe. In Emerging Markets, Lovenox® sales grew 14.6% to €143 million. First nine months Lovenox® sales were down 8.5% to €1,024 million.
In the third quarter,Plavix®sales decreased 0.6% to €356 million due to generic competition in Japan (sales down 23.1% to €32 million). In China, Plavix® sales increased 3.5% to €209 million despite the implementation of the volume based procurement program (VBP) in key cities in China at the beginning of the second quarter. First nine months Plavix® sales decreased 0.4% to €1,122 million.
Third-quarterAprovel®/Avapro® sales increased 5.7% to €169 million driven by Emerging Markets sales (up 3.6% to €117 million). In China, Aprovel®/Avapro® sales were up 1.4% to €74 million despite the implementation of the VBP in key cities in China at the beginning of the second quarter. First nine months Aprovel®/Avapro® sales increased 7.2% to €543 million.
In September 2019, Plavix® andCo-Aprovel® were among the bidding winners of the nationwide VBP program. Sanofi expects the nationwide implementation of the VBP program to begin in December. As a result, Q4 2019 sales of Plavix® and Aprovel® family products are expected to decrease significantly due to net price adjustments of inventory in the channel. In 2020, Sanofi expects sales of Plavix® and the Aprovel® family in China to decline around 50%.
Third-quarterRenvela®/Renagel®(sevelamer) sales decreased 28.9% to €84 million, due to generic competition in the U.S. (down 50.7% to €39 million) and despite growth in China. First nine months Renvela®/Renagel® sales decreased 29.8% to €229 million.
In the third quarter,Generics sales decreased 32.1% to €268 million, reflecting the divestment of the European generics business Zentiva at the end of the third quarter of 2018. At CS, third-quarter Generics sales increased 7.9%, reflecting 6.8% growth in Emerging Markets (€176 million). First nine months Generics sales were €804 million, down 33.9% and up 5.4% at CS.
Consumer Healthcare
CHC sales by geography and category are provided in Appendix 1.
| | | | | | | | | | | | | | | | |
| Net sales (€ million) | | Q3 2019 | | | Change
at CER | | | 9M 2019 | | | Change
at CER | |
Allergy Cough & Cold | | | 287 | | | | +1.4 | % | | | 898 | | | | +2.3 | % |
of which Allegra® | | | 98 | | | | +8.0 | % | | | 341 | | | | +3.5 | % |
of which Mucosolvan® | | | 28 | | | | -16.1 | % | | | 71 | | | | -12.5 | % |
of which Xyzal® | | | 12 | | | | +10.0 | % | | | 39 | | | | +19.4 | % |
Pain | | | 300 | | | | +3.8 | % | | | 930 | | | | +2.6 | % |
of which Doliprane® | | | 73 | | | | -2.7 | % | | | 229 | | | | -3.0 | % |
of which Buscopan® | | | 41 | | | | +14.6 | % | | | 139 | | | | +7.6 | % |
Digestive | | | 229 | | | | -4.7 | % | | | 777 | | | | +4.7 | % |
of which Dulcolax® | | | 55 | | | | +3.8 | % | | | 171 | | | | +5.0 | % |
of which Enterogermina® | | | 54 | | | | +26.2 | % | | | 169 | | | | +23.5 | % |
of which Essentiale® | | | 42 | | | | 0.0 | % | | | 141 | | | | +8.5 | % |
of which Zantac® | | | 14 | | | | -58.1 | % | | | 83 | | | | -16.1 | % |
Nutritionals | | | 178 | | | | +1.8 | % | | | 492 | | | | -3.0 | % |
Other | | | 142 | | | | -2.1 | % | | | 438 | | | | -8.5 | % |
of which Gold Bond® | | | 49 | | | | +2.1 | % | | | 149 | | | | -2.1 | % |
Total Consumer Healthcare | | | 1,136 | | | | +0.4 | % | | | 3,535 | | | | +0.7 | % |
In the third quarter,Consumer Healthcare (CHC) sales increased 0.4% to €1,136 million, with growth coming from the Pain, Nutritionals, and Allergy, Cough & Cough categories, supported by performance in Emerging Markets (up 7.3% to €414 million). In the first nine months, CHC sales grew 0.7% to €3,535 million. Strengthening of regulatory requirements, particularly in Europe, as well as the continued effect ofnon-core divestments impacted growth in the third quarter. These factors are expected to have a dampening effect on CHC performance during the remainder of the year and
8
through the first part of 2020. Additionally, in October Sanofi decided to conduct a precautionary voluntary recall of Zantac® in the U.S. and Canada. In September, the U.S. Food and Drug Administration (FDA) and Health Canada issued public statements alerting that some ranitidine medicines, including Zantac OTC, could contain NDMA at low levels and asked manufacturers to conduct testing. Evaluations are ongoing on both drug substance (active ingredient) and finished drug product. Due to inconsistencies in preliminary test results of the active ingredient used in the U.S. and Canadian products, Sanofi decided to conduct the voluntary recall in the U.S. and Canada as the investigation continues. In the third quarter, Zantac® sales were down 58.1% to €14 million, reflecting the impact of this recall.
InEurope, third-quarter CHC sales decreased 7.0% to €306 million reflecting divestments ofnon-strategic brands and strengthening regulatory requirements. First nine months CHC sales in Europe were down 4.5% to €986 million.
In the U.S., third-quarter CHC sales decreased 4.4% to €252 million, reflecting the impact of the Zantac® recall. First nine months CHC sales in the U.S. were down 0.4% to €840 million.
InEmerging Markets, third-quarter CHC sales increased 7.3% to €414 million, driven by performance in Latin America. First nine months CHC sales in Emerging Markets increased 5.2% to €1,227 million.
Vaccines
| | | | | | | | | | | | | | | | |
| Net sales (€ million) | | Q3 2019 | | | Change
at CER | | | 9M 2019 | | | Change
at CER | |
Influenza vaccines(incl. Vaxigrip®, Fluzone HD® & Fluzone®) | | | 735 | | | | -28.5 | % | | | 852 | | | | -25.9 | % |
Polio/Pertussis/Hib vaccines(incl. Hexaxim® / Hexyon®, Pentacel®,Pentaxim®and Imovax®) | | | 515 | | | | -1.2 | % | | | 1,503 | | | | +19.3 | % |
Meningitis/Pneumo vaccines(incl. Menactra®) | | | 310 | | | | +8.8 | % | | | 558 | | | | +12.3 | % |
Adult Booster vaccines(incl. Adacel®) | | | 182 | | | | +17.4 | % | | | 416 | | | | +20.0 | % |
Travel and other endemic vaccines | | | 159 | | | | +20.8 | % | | | 416 | | | | +14.2 | % |
Other vaccines | | | 28 | | | | +33.3 | % | | | 78 | | | | +19.4 | % |
Total Vaccines | | | 1,929 | | | | -9.8 | % | | | 3,823 | | | | +3.9 | % |
Third-quarterVaccines sales decreased 9.8% to €1,929 million. This anticipated decrease was impacted by the timing of flu vaccine delivery in the U.S. which will be significantly weighted towards the fourth quarter due to the roughlyone-month delay in strain selection by the WHO at the beginning of the year. As a consequence, U.S. third-quarter Vaccines sales were down 19.5% to €1,122 million. In Emerging Markets and Europe, third-quarter Vaccines sales were up 10.7% (to €481 million) and up 7.8% (to €235 million), respectively. First nine months Vaccines sales were up 3.9% to €3,823 million.
In the third quarter,Polio/Pertussis/Hib (PPH) vaccines sales decreased 1.2% to €515 million, reflecting CDC inventory variation in the U.S. (down 37.8% to €78 million) which offset the strong performance in Emerging Markets (up 18.2% to €330 million). In Europe, PPH vaccines sales were stable at €73 million. First nine months PPH vaccines sales were up 19.3% to €1,503 million.
Influenza vaccines sales decreased 28.5% to €735 million in the third quarter, reflecting lower sales in the U.S. (down 32.6% to €580 million) due to the aforementioned delay in delivery. As already announced, Sanofi expects influenza vaccine sales to be significantly weighted towards the fourth quarter. First nine months influenza vaccines sales were down 25.9% to €852 million. Sanofi expects full-year 2019 influenza vaccines sales to exceed the prior year level, driven by its differentiated portfolio.
Third-quarterMenactra® sales increased 8.8% to €310 million, driven by the U.S. First nine months Menactra® sales increased 12.3% to €558 million.
Third-quarterTravel and other endemic vaccines sales were €159 million up 20.8%, supported by favorable phasing of yellow fever vaccine sales. First nine months Travel and other endemic vaccines sales were up 14.2% to €416 million.
Third-quarterAdult Booster vaccines sales were up 17.4% to €182 million, reflecting strong demand for Repevax® in Europe and favorable phasing for Adacel®in the U.S. First nine months Adult Booster vaccines sales increased 20.0% to €416 million.
9
Company sales by geographic region
| | | | | | | | | | | | | | | | |
Sanofi sales (€ million) | | Q3 2019 | | | Change
at CER | | | 9M 2019 | | | Change
at CER | |
United States | | | 3,671 | | | | -4.5 | % | | | 9,072 | | | | +2.4 | % |
Emerging Markets(a) | | | 2,785 | | | | +9.7 | % | | | 8,239 | | | | +11.1 | % |
of which Asia | | | 1,172 | | | | +10.8 | % | | | 3,510 | | | | +14.0 | % |
of which Latin America | | | 685 | | | | +21.4 | % | | | 1,990 | | | | +12.6 | % |
of which Africa, Middle East | | | 564 | | | | -8.0 | % | | | 1,673 | | | | +1.2 | % |
of which Eurasia(b) | | | 318 | | | | +13.5 | % | | | 952 | | | | +16.3 | % |
Europe(c) | | | 2,157 | | | | -7.5 | % | | | 6,508 | | | | -8.1 | % |
Rest of the World(d) | | | 886 | | | | -1.7 | % | | | 2,699 | | | | +3.5 | % |
of which Japan | | | 456 | | | | +2.2 | % | | | 1,453 | | | | +5.9 | % |
Total Sanofi sales | | | 9,499 | | | | -1.1 | % | | | 26,518 | | | | +2.2 | % |
| (a) | World excluding U.S., Canada, Western & Eastern Europe (except Eurasia), Japan, South Korea, Australia, New Zealand and Puerto Rico |
| (b) | Russia, Ukraine, Georgia, Belarus, Armenia and Turkey |
| (c) | Western Europe + Eastern Europe except Eurasia |
| (d) | Japan, South Korea, Canada, Australia, New Zealand, Puerto Rico |
Third-quarter sales in theU.S. decreased 4.5% to €3,671 million, reflecting the expected delay in flu vaccines supply which offset Dupixent®performance. In the U.S., first nine months sales increased 2.4% to €9,072 million.
Third-quarter sales inEmerging Markets grew 9.7% to €2,785 million, driven by Established Products (up 6.9%), Vaccines (up 10.7%), Diabetes (up 10.1%) and Rare Disease (up 24.2%). In Asia, third-quarter sales were up 10.8% to €1,172 million. In China, sales increased 13.7% to €744 million, driven by Pharmaceuticals and Vaccines. In Latin America, third-quarter sales increased 21.4% to €685 million. Third-quarter sales in Brazil were up 10.5% to €261 million. In Africa and the Middle East region, third-quarter sales were €564 million, down 8.0% reflecting order phasing in the Middle East. Third-quarter sales in the Eurasia region increased 13.5% to €318 million, supported by strong growth in Turkey. Third-quarter sales in Russia were €166 million up 9.0%. In Emerging Markets, first nine months sales increased 11.1% to €8,239 million.
Third-quarter sales inEurope were €2,157 million, down 7.5% reflecting divestment of the European generics business. At CS, third-quarter sales decreased 1.5% mainly reflecting lower Lovenox®, Lemtrada® and CHC sales which were partially offset by Dupixent® and Vaccines performance. In Europe, first nine months sales decreased 8.1%(-1.8% at CS) to €6,508 million.
Sales in Japanincreased 2.2% to €456 million in the third quarter, driven by Dupixent® which largely offset lower sales of Plavix® due to generic competition. In Japan, first nine months sales increased 5.9% to €1,453 million.
R&D update
Consult Appendix 6 for full overview of Sanofi’s R&D pipeline
Regulatory update
Regulatory updates since July 29, 2019 include the following:
| | • | | In October, the European Commission approvedDupixent® (collaboration with Regeneron) as anadd-on therapy with intranasal corticosteroids for the treatment of adults with severe chronic rhinosinusitis with nasal polyposis (CRSwNP) for whom therapy with systemic corticosteroids and/or surgery do not provide adequate disease control. |
| | • | | In October, MenQuadfiTM, a meningococcal quadrivalent conjugate vaccine, was submitted in the European Union for the prevention of invasive meningococcal disease in individuals 12 months of age and older. |
| | • | | In October, a quadrivalent recombinant influenza vaccine was submitted in the European Union for the prevention of influenza disease in persons 18 years of age and older (vaccine registered in the U.S. under the trade nameFlublok®). |
10
| | • | | In August,Dupixent® was approved by the European Commission for adolescents 12 to 17 years of age withmoderate-to-severe atopic dermatitis who are candidates for systemic therapy. |
At the end of October 2019, the R&D pipeline contained 85 projects, including 37 new molecular entities in clinical development (or that have been submitted to the regulatory authorities). 34 projects are in phase 3 or have been submitted to the regulatory authorities for approval.
Portfolio update
Phase 3:
| | • | | In September, the findings from the CARD study ofJevtana® (cabazitaxel) were presented at the 2019 European Society of Medical Oncology (ESMO) Congress. Data were also published in the New England Journal of Medicine and showed that patients with metastatic castration-resistant prostate cancer (mCRPC) previously treated with docetaxel and who progressed within 12 months on an androgen receptor targeted agent (abiraterone or enzalutamide) experienced significantly longer radiographic progression free survival (rPFS) with Jevtana® plus prednisone compared with abiraterone plus prednisone or enzalutamide. Overall survival (OS) with Jevtana® was also significantly longer. |
| | • | | In August, positive topline phase 3 results forDupixent® in children aged 6 to 11 years with severe atopic dermatitis were announced. |
Phase 2
| | • | | In the third quarter, the NSCLC and Prostate Cancer combination cohorts withcemiplimab and isatuximab were discontinued due to efficacy considerations. This decision was not safety related. The ongoing combination trials in Multiple Myeloma and Lymphoma as well as combination trials with isatuximab and atezolizumab in solid tumors continue. |
Phase 1:
| | • | | A phase 1 trial evaluatingSAR442085, an anti-CD38 monoclonal antibody, was initiated in multiple myeloma. |
| | • | | SAR443122, a RIPK1 inhibitor (collaboration with Denali) entered into phase 1. |
| | • | | BIVV020, a complement C1s inhibitor, entered phase 1. |
| | • | | The combinationSAR442720 (SHP2 inhibitor) and cobimetinib entered phase 1. |
| | • | | SAR441255, a trigonal GLP1R/GIPR/GCGR agonist was discontinued. |
Collaboration
In September, Sanofi and Abbott announced a partnership to integrate glucose sensing and insulin delivery technologies that would help to further simplify how people with diabetes manage their condition.
Corporate Social Responsibility
Sanofi’s commitment to good corporate citizenship is rooted in its heritage. The company recognizes that its core business creates value for society, and it works to ensure that the benefits of this societal value are accessible to as many people around the world as possible. The company also has a longstanding commitment to the communities where it operates and to minimizing its impact on the environment.
Sanofi’s corporate social responsibility (CSR) approach was recognized during the third quarter of 2019 by the Dow Jones Sustainability Index (DJSI) for the 13th consecutive year. In 2019, Sanofi ranked as the third most sustainable pharmaceutical company with a score of 82 out of 100, up from 76 last year. The DJSI selects the best companies in each sector based on economic, social and environmental performance.
On October 15, 2019, Sanofi opened a digitally-enabled manufacturing facility in Framingham, one of the first of its kind, to develop transformative treatments for patients while significant reducing environmental waste. The facility will produce 80% less CO2 emissions compared to traditional technologies and reduce water and chemical usage by 91% and 94% respectively.
11
2019 third-quarter and first nine months financial results(10)
Business Net Income(10)
In the third quarter of 2019, Sanofi generated net sales of €9,499 million, an increase of 1.1% (down 1.1% at CER). First nine months sales were €26,518 million, up 4.1% on a reported basis (up 2.2% at CER).
Third-quarterother revenues increased 19.9% (up 14.8% at CER) to €422 million, reflecting the VaxServe sales contribution ofnon-Sanofi products (€372 million, up 18.7% at CER). First nine months other revenues increased 23.8% (up 17.2% at CER) to €1,096 million, driven by the VaxServe sales contribution ofnon-Sanofi products (€915 million, up 24.0% at CER) and the consolidation of collaboration revenues from Swedish Orphan Biovitrum AB (SOBI).
Third-quarterGross Profit increased 0.9% to €6,787 million (down 1.8% at CER). The gross margin ratio decreased 0.2 percentage points to 71.4% (71.2% at CER) versus the third quarter of 2018. The favorable effects from Dupixent® and the divestment of the European generics business were more than offset by the negative impact from U.S. Diabetes net price evolution, the decline in Established Rx Products sales in Mature Markets as well as the impact of Vaccines and the Zantac® recall. In the third quarter of 2019, the gross margin ratio of segments were 74.8% for Pharmaceuticals (up 1.2 percentage points), 64.8% for CHC (down 2.0 percentage points) and 67.4% for Vaccines (down 2.7 percentage points). First nine months Gross Profit increased 5.1% to €19,095 million (up 2.8% at CER). In the first nine months of 2019, the gross margin ratio increased 0.7 percentage points to 72.0% (71.8% at CER) versus the same period of 2018. Sanofi expects its full-year 2019 gross margin ratio to be between 70% and 71% at CER.
Research and Development(R&D)expenses decreased 6.8% to €1,362 million in the third quarter of 2019. At CER, R&D expenses decreased 8.1%, reflecting favorable phasing of expenses, lower research costs resulting from restructuring of the immuno-oncology collaboration with Regeneron as well as a €45 million payment from SOBI related to the BIV001opt-in. In the third quarter, the ratio of R&D to sales decreased 1.3 percentage points to 14.3% compared to the third quarter of 2018. First nine months R&D expenses increased 2.8% to €4,335 million (up 0.5% at CER). In the first nine months of 2019, the ratio of R&D to sales was 0.3 percentage points lower at 16.3% compared to the same period of 2018.
Third-quarterselling general and administrative expenses (SG&A) increased 0.6% to €2,314 million. At CER, SG&A expenses were down 1.5%, reflecting cost efficiency measures notably in Primary Care in Mature Markets and support functions as well as the impact of the European generics disposal which more than offset increased investments in Specialty Care. In the third quarter, the ratio of SG&A to sales decreased 0.1 percentage points to 24.4% compared to the third quarter of 2018. First nine months SG&A expenses increased 0.6% to €7,156 million (down 1.4% at CER). In the first nine months of 2019, the ratio of SG&A to sales was 0.9 percentage points lower at 27.0% compared to the same period of 2018.
Third-quarteroperating expenses were €3,676 million, a decrease of 2.3% and 4.1% at CER. Excluding the payment from SOBI and the disposal of European generics business, operating expenses decreased 1.9% at CER in the third quarter. First nine months operating expenses were €11,491 million, an increase of 1.5% and down 0.7% at CER.
Third-quarterother current operating income net of expenses was -€119 million versus -€74 million in the third quarter of 2018. This line includes the share of profit to Regeneron of the monoclonal antibodies Alliance, reimbursement of development costs by Regeneron and the reimbursement of commercialization-related expenses incurred by Regeneron. This line also includes the share of profit/loss related to the immuno-oncology Alliance. In the third quarter of 2019, a total of €23 million of capital gains onnon-strategic CHC brand disposals was also recorded. First nine months other current operating income net of expenses was -€312 million versus €84 million in the same period of 2018.
Theshare of profits from associateswas €132 million in the third quarter versus €153 million for the same period of 2018, mainly reflecting the share of profits in Regeneron. In the first nine months, the share of profits from associates was broadly stable at €301 million versus the same period of 2018.
In the third quarter,non-controlling interestswere-€12 million versus -€26 million in the third quarter of 2018, reflecting the end ofnon-controlling interests related to the Alliance with Bristol-Myers Squibb on Plavix® and Avapro®. First nine monthsnon-controlling interests were -€27 million versus -€84 million for the same period of 2018.
Third-quarterbusiness operating income increased 3.1% to €3,112 million. At CER, business operating income decreased 0.9%. The ratio of business operating income to net sales increased 0.7 percentage points to 32.8% versus the third quarter of 2018. Over the period, the business operating income ratio of segments were 39.0% for Pharmaceuticals (up 3.4 percentage points), 32.0% for CHC (down 1.2 percentage points) and 50.0% for Vaccines (down 5.3 percentage points).
| (10) | See Appendix 3 for 2019 third-quarter consolidated income statement; see Appendix 8 for definitions of financial indicators, and Appendix 4 for reconciliation of IFRS net income reported to business net income. |
12
First nine months business operating income was €7,566 million, up 5.9% (up 3.7% at CER). In the first nine months of 2019, the ratio of business operating income to net sales increased 0.4 percentage points to 28.5%.
Net financial expenses were -€71 million in the third quarter versus -€106 million in the same period of 2018, reflecting lower cost of net debt. First nine months net financial expenses were -€201 million versus -€211 million in the same period of 2018.
Third-quarter and first nine monthseffective tax rate was stable at 22.0%. Sanofi is currently actively engaged with the Chinese Ministry of Finance to support and cooperate with a Pharmaceutical sector audit process underway.
Third-quarterbusiness net income(10) increased 4.3% to €2,399 million and increased 0.2% at CER. The ratio of business net income to net sales increased 0.8 percentage points to 25.3% versus the third quarter of 2018. First nine months 2019 business net income(10) increased 6.4% to €5,805 million and increased 4.1% at CER. The ratio of business net income to net sales increased 0.5 percentage points to 21.9% versus the first nine months of 2018.
In the third quarter of 2019, business earnings per share(10)(EPS) increased 4.3% to €1.92 on a reported basis and was stable at CER. The average number of shares outstanding was 1,252.2 million versus 1,247.1 million in the third quarter of 2018.
In the first nine months of 2019, business earnings per share(10) was €4.65, up 6.4% on a reported basis and up 4.1% at CER. The average number of shares outstanding was 1,248.9 million in the first nine months of 2019 versus 1,247.6 million in the first nine months of 2018.
Reconciliation of IFRS net income reported to business net income (see Appendix 4)
In the first nine months of 2019, the IFRS net income was €2,816 million. The main items excluded from the business net income were:
| | • | | An amortization charge of €1,636 million related to fair value remeasurement on intangible assets of acquired companies (primarily Genzyme: €550 million, Bioverativ: €380 million, Boehringer Ingelheim CHC business: €184 million, Aventis: €153 million) and to acquired intangible assets (licenses/products: €80 million). An amortization charge of €520 million related to fair value remeasurement on intangible assets of acquired companies (primarily Genzyme: €182 million, Bioverativ: €108 million, Boehringer Ingelheim CHC business: €62 million, Aventis: €46 million) and to acquired intangible assets (licenses/products: €24 million) was recorded in the third quarter. These items have no cash impact on the Company. |
| | • | | An impairment of intangible assets of €2,023 million (of which €1,835 million in the second quarter mainly related to Eloctate®and €183 million in the third quarter which included an impairment related to Zantac®). |
| | • | | Restructuring costs and similar items of €904 million (of which €157 million in the third quarter) mainly related to streamlining initiatives in Japan, Europe and the U.S. |
| | • | | An income of €242 million mainly reflecting a contingent price adjustment on the disposal of SP MSD. |
| | • | | A net income of €260 million (of which a charge of €57 million in the third quarter) mainly related to litigation. |
| | • | | A €1,279 million tax effect arising from the items listed above, mainly comprising €906 million of deferred taxes generated by amortization and impairments of intangible assets and €247 million associated with restructuring costs and similar items. The third quarter tax effect was €374 million, including €195 million of deferred taxes generated by amortization and impairments of intangible assets and €50 million associated with restructuring costs and similar items (see Appendix 4). |
| | • | | An expense of €94 million net of tax (of which €41 million in the third quarter) related to restructuring costs of associates and joint ventures and expenses arising from the impact of acquisitions on associates and joint ventures. |
| (10) | See Appendix 3 for 2019 Third-quarter consolidated income statement; see Appendix 8 for definitions of financial indicators, and Appendix 4 for reconciliation of IFRS net income reported to business net income. |
13
Capital Allocation
In the first nine months of 2019, net cash generated by operating activities increased 58.2% to €4,976 million after capital expenditures of €992 million and an increase in working capital of €1,365 million (which compared with an increase of €1,925 million over the first nine months of 2018). Over the period, the dividend paid by Sanofi was €3,834 million, restructuring costs and similar itemscash-out was €917 million and acquisitions and partnerships net of disposals reflecting a netcash-in during the period were €525 million. As a consequence, net debt decreased from €17,628 million at December 31, 2018, to €16,910 million at September 30, 2019 (amount net of €8,606 million cash and cash equivalents).
Forward-Looking Statements
This press release contains forward-looking statements as defined in the Private Securities Litigation Reform Act of 1995, as amended. Forward-looking statements are statements that are not historical facts. These statements include projections and estimates and their underlying assumptions, statements regarding plans, objectives, intentions and expectations with respect to future financial results, events, operations, services, product development and potential, and statements regarding future performance. Forward-looking statements are generally identified by the words “expects”, “anticipates”, “believes”, “intends”, “estimates”, “plans” and similar expressions. Although Sanofi’s management believes that the expectations reflected in such forward-looking statements are reasonable, investors are cautioned that forward-looking information and statements are subject to various risks and uncertainties, many of which are difficult to predict and generally beyond the control of Sanofi, that could cause actual results and developments to differ materially from those expressed in, or implied or projected by, the forward-looking information and statements. These risks and uncertainties include among other things, the uncertainties inherent in research and development, future clinical data and analysis, including post marketing, decisions by regulatory authorities, such as the FDA or the EMA, regarding whether and when to approve any drug, device or biological application that may be filed for any such product candidates as well as their decisions regarding labelling and other matters that could affect the availability or commercial potential of such product candidates, the absence of guarantee that the product candidates if approved will be commercially successful, the future approval and commercial success of therapeutic alternatives, Sanofi’s ability to benefit from external growth opportunities, to complete related transactions and/or obtain regulatory clearances, risks associated with intellectual property and any related pending or future litigation and the ultimate outcome of such litigation, trends in exchange rates and prevailing interest rates, volatile economic conditions, the impact of cost containment initiatives and subsequent changes thereto, the average number of shares outstanding as well as those discussed or identified in the public filings with the SEC and the AMF made by Sanofi, including those listed under “Risk Factors” and “Cautionary Statement Regarding Forward-Looking Statements” in Sanofi’s annual report on Form20-F for the year ended December 31, 2018. Other than as required by applicable law, Sanofi does not undertake any obligation to update or revise any forward-looking information or statements.
Appendices
List of appendices
| | |
| Appendix 1: | | 2019 third-quarter and first nine months net sales by GBU, franchise, geographic region and product |
| |
| Appendix 2: | | 2019 third-quarter and first nine months business net income statement |
| |
| Appendix 3: | | 2019 third-quarter and first nine months consolidated income statement |
| |
| Appendix 4: | | Reconciliation of IFRS net income reported to business net income |
| |
| Appendix 5 | | Currency sensitivity |
| |
| Appendix 6: | | R&D pipeline |
| |
| Appendix 7: | | Expected R&D milestones |
| |
| Appendix 8: | | Definitions ofnon-GAAP financial indicators |
14
Appendix 1: 2019 third-quarter net sales by GBU, franchise, geographic region and product
| | | | | | | | | | | | | | | | | | | | | | | | | | | | | | | | | | | | | | | | | | | | | | | | | | | | | | | | | | | | | | | | | | | | | | | | | | | | |
Q3 2019
(€ million) | | Total
GBUs | | | % CER | | | %
reported | | | | | | Europe | | | % CER | | | | | | United
States | | | % CER | | | | | | Rest of
the World | | | % CER | | | | | | Emerging
Markets | | | % CER | | | | | | Total
Franchises | | | % CER | | | %
reported | |
Aubagio | | | 482 | | | | 12.8 | % | | | 16.7 | % | | | | | | | 103 | | | | 10.8 | % | | | | | | | 363 | | | | 13.8 | % | | | | | | | 16 | | | | 6.7 | % | | | | | | | 12 | | | | 0.0 | % | | | | | | | 494 | | | | 12.4 | % | | | 16.0 | % |
Lemtrada | | | 52 | | | | -45.2 | % | | | -44.1 | % | | | | | | | 15 | | | | -60.5 | % | | | | | | | 34 | | | | -33.3 | % | | | | | | | 3 | | | | -50.0 | % | | | | | | | 5 | | | | 0.0 | % | | | | | | | 57 | | | | -42.4 | % | | | -42.4 | % |
Total MS | | | 534 | | | | 2.2 | % | | | 5.5 | % | | | | | | | 118 | | | | -9.9 | % | | | | | | | 397 | | | | 7.0 | % | | | | | | | 19 | | | | -5.3 | % | | | | | | | 17 | | | | 0.0 | % | | | | | | | 551 | | | | 2.1 | % | | | 5.0 | % |
Cerezyme | | | 114 | | | | -4.2 | % | | | -3.4 | % | | | | | | | 60 | | | | -4.7 | % | | | | | | | 46 | | | | 2.3 | % | | | | | | | 8 | | | | -30.0 | % | | | | | | | 54 | | | | 34.0 | % | | | | | | | 168 | | | | 6.7 | % | | | 1.8 | % |
Cerdelga | | | 51 | | | | 25.0 | % | | | 27.5 | % | | | | | | | 19 | | | | 53.8 | % | | | | | | | 30 | | | | 12.0 | % | | | | | | | 2 | | | | 0.0 | % | | | | | | | 2 | | | | 100.0 | % | | | | | | | 53 | | | | 26.8 | % | | | 29.3 | % |
Myozyme | | | 192 | | | | 5.6 | % | | | 8.5 | % | | | | | | | 94 | | | | 4.4 | % | | | | | | | 81 | | | | 8.3 | % | | | | | | | 17 | | | | 0.0 | % | | | | | | | 34 | | | | 18.8 | % | | | | | | | 226 | | | | 7.7 | % | | | 8.1 | % |
Fabrazyme | | | 180 | | | | 0.6 | % | | | 4.0 | % | | | | | | | 46 | | | | 7.0 | % | | | | | | | 105 | | | | 0.0 | % | | | | | | | 29 | | | | -6.7 | % | | | | | | | 22 | | | | 33.3 | % | | | | | | | 202 | | | | 3.7 | % | | | 5.8 | % |
Aldurazyme | | | 36 | | | | 2.9 | % | | | 5.9 | % | | | | | | | 19 | | | | 5.6 | % | | | | | | | 12 | | | | 9.1 | % | | | | | | | 5 | | | | -20.0 | % | | | | | | | 13 | | | | -6.7 | % | | | | | | | 49 | | | | 0.0 | % | | | 0.0 | % |
Total Rare Disease | | | 637 | | | | 2.8 | % | | | 5.8 | % | | | | | | | 253 | | | | 4.1 | % | | | | | | | 298 | | | | 4.8 | % | | | | | | | 86 | | | | -6.9 | % | | | | | | | 137 | | | | 24.2 | % | | | | | | | 774 | | | | 6.5 | % | | | 6.6 | % |
Jevtana | | | 112 | | | | 9.1 | % | | | 13.1 | % | | | | | | | 41 | | | | 5.1 | % | | | | | | | 50 | | | | 8.9 | % | | | | | | | 21 | | | | 20.0 | % | | | | | | | 7 | | | | 0.0 | % | | | | | | | 119 | | | | 8.5 | % | | | 12.3 | % |
Mozobil | | | 45 | | | | 10.0 | % | | | 12.5 | % | | | | | | | 12 | | | | 9.1 | % | | | | | | | 28 | | | | 8.0 | % | | | | | | | 5 | | | | 25.0 | % | | | | | | | 5 | | | | 100.0 | % | | | | | | | 50 | | | | 14.3 | % | | | 19.0 | % |
Thymoglobulin | | | 64 | | | | 10.7 | % | | | 14.3 | % | | | | | | | 9 | | | | 0.0 | % | | | | | | | 49 | | | | 14.6 | % | | | | | | | 6 | | | | 0.0 | % | | | | | | | 26 | | | | 42.1 | % | | | | | | | 90 | | | | 18.7 | % | | | 20.0 | % |
Taxotere | | | 7 | | | | -11.1 | % | | | -22.2 | % | | | | | | | 1 | | | | — | | | | | | | | 0 | | | | -100.0 | % | | | | | | | 6 | | | | -12.5 | % | | | | | | | 35 | | | | -2.9 | % | | | | | | | 42 | | | | -4.5 | % | | | -4.5 | % |
Eloxatine | | | 7 | | | | -12.5 | % | | | -12.5 | % | | | | | | | 0 | | | | -100.0 | % | | | | | | | 0 | | | | — | | | | | | | | 7 | | | | 0.0 | % | | | | | | | 45 | | | | 9.8 | % | | | | | | | 52 | | | | 6.1 | % | | | 6.1 | % |
Total Oncology | | | 297 | | | | 7.4 | % | | | 10.4 | % | | | | | | | 91 | | | | 5.8 | % | | | | | | | 152 | | | | 9.7 | % | | | | | | | 54 | | | | 4.1 | % | | | | | | | 127 | | | | 13.5 | % | | | | | | | 424 | | | | 9.2 | % | | | 11.6 | % |
Dupixent | | | 561 | | | | 140.8 | % | | | 151.6 | % | | | | | | | 54 | | | | 170.0 | % | | | | | | | 455 | | | | 130.2 | % | | | | | | | 52 | | | | 242.9 | % | | | | | | | 9 | | | | 300.0 | % | | | | | | | 570 | | | | 142.2 | % | | | 153.3 | % |
Kevzara | | | 49 | | | | 118.2 | % | | | 122.7 | % | | | | | | | 12 | | | | 300.0 | % | | | | | | | 33 | | | | 77.8 | % | | | | | | | 4 | | | | 300.0 | % | | | | | | | 0 | | | | — | | | | | | | | 49 | | | | 118.2 | % | | | 122.7 | % |
Total immunology | | | 610 | | | | 138.8 | % | | | 149.0 | % | | | | | | | 66 | | | | 187.0 | % | | | | | | | 488 | | | | 125.6 | % | | | | | | | 56 | | | | 246.7 | % | | | | | | | 9 | | | | 300.0 | % | | | | | | | 619 | | | | 140.1 | % | | | 150.6 | % |
Alprolix | | | 104 | | | | 12.5 | % | | | 18.2 | % | | | | | | | 0 | | | | — | | | | | | | | 79 | | | | 17.5 | % | | | | | | | 25 | | | | 0.0 | % | | | | | | | 0 | | | | — | | | | | | | | 104 | | | | 12.5 | % | | | 18.2 | % |
Eloctate | | | 157 | | | | -22.8 | % | | | -18.7 | % | | | | | | | 0 | | | | — | | | | | | | | 122 | | | | -23.5 | % | | | | | | | 35 | | | | -20.0 | % | | | | | | | 5 | | | | — | | | | | | | | 162 | | | | -20.2 | % | | | -16.1 | % |
Cablivi | | | 20 | | | | — | | | | — | | | | | | | | 6 | | | | 500.0 | % | | | | | | | 13 | | | | — | | | | | | | | 1 | | | | — | | | | | | | | 0 | | | | — | | | | | | | | 20 | | | | — | | | | — | |
Total Rare Blood Disorder | | | 281 | | | | -5.7 | % | | | -0.4 | % | | | | | | | 6 | | | | 500.0 | % | | | | | | | 214 | | | | -5.6 | % | | | | | | | 61 | | | | -13.8 | % | | | | | | | 5 | | | | — | | | | | | | | 286 | | | | -3.9 | % | | | 1.4 | % |
Sanofi Genzyme (Specialty Care) | | | 2,359 | | | | 19.5 | % | | | 23.9 | % | | | | | | | 534 | | | | 10.3 | % | | | | | | | 1,549 | | | | 25.3 | % | | | | | | | 276 | | | | 9.8 | % | | | | | | | 295 | | | | 21.9 | % | | | | | | | 2,654 | | | | 19.8 | % | | | 22.9 | % |
Lantus | | | 487 | | | | -27.5 | % | | | -25.5 | % | | | | | | | 140 | | | | -13.0 | % | | | | | | | 295 | | | | -32.5 | % | | | | | | | 52 | | | | -31.1 | % | | | | | | | 264 | | | | 9.5 | % | | | | | | | 751 | | | | -17.5 | % | | | -16.3 | % |
Toujeo | | | 175 | | | | -5.0 | % | | | -3.3 | % | | | | | | | 84 | | | | 18.3 | % | | | | | | | 73 | | | | -25.0 | % | | | | | | | 18 | | | | 5.6 | % | | | | | | | 43 | | | | 26.5 | % | | | | | | | 218 | | | | 0.0 | % | | | 1.4 | % |
Apidra | | | 51 | | | | -13.6 | % | | | -13.6 | % | | | | | | | 31 | | | | -3.1 | % | | | | | | | 11 | | | | -35.3 | % | | | | | | | 9 | | | | -10.0 | % | | | | | | | 32 | | | | 23.1 | % | | | | | | | 83 | | | | -2.4 | % | | | -2.4 | % |
Amaryl | | | 10 | | | | -25.0 | % | | | -16.7 | % | | | | | | | 3 | | | | -40.0 | % | | | | | | | 0 | | | | — | | | | | | | | 7 | | | | -14.3 | % | | | | | | | 74 | | | | -5.3 | % | | | | | | | 84 | | | | -8.0 | % | | | -4.5 | % |
Admelog | | | 51 | | | | 84.6 | % | | | 96.2 | % | | | | | | | 4 | | | | 33.3 | % | | | | | | | 47 | | | | 80.0 | % | | | | | | | 0 | | | | -50.0 | % | | | | | | | 0 | | | | — | | | | | | | | 51 | | | | 84.6 | % | | | 96.2 | % |
Total Diabetes | | | 837 | | | | -17.7 | % | | | -15.5 | % | | | | | | | 295 | | | | -3.0 | % | | | | | | | 451 | | | | -24.7 | % | | | | | | | 91 | | | | -21.7 | % | | | | | | | 424 | | | | 10.1 | % | | | | | | | 1,261 | | | | -9.9 | % | | | -8.3 | % |
Praluent | | | 56 | | | | -15.4 | % | | | -13.8 | % | | | | | | | 22 | | | | 4.5 | % | | | | | | | 29 | | | | -31.7 | % | | | | | | | 5 | | | | 100.0 | % | | | | | | | 5 | | | | 66.7 | % | | | | | | | 61 | | | | -11.8 | % | | | -10.3 | % |
Multaq | | | 85 | | | | -9.9 | % | | | -6.6 | % | | | | | | | 10 | | | | -16.7 | % | | | | | | | 74 | | | | -10.1 | % | | | | | | | 1 | | | | — | | | | | | | | 2 | | | | 0.0 | % | | | | | | | 87 | | | | -9.7 | % | | | -6.5 | % |
Total Cardiovascular | | | 141 | | | | -12.2 | % | | | -9.6 | % | | | | | | | 32 | | | | -2.9 | % | | | | | | | 103 | | | | -17.5 | % | | | | | | | 6 | | | | 150.0 | % | | | | | | | 7 | | | | 40.0 | % | | | | | | | 148 | | | | -10.6 | % | | | -8.1 | % |
Plavix | | | 86 | | | | -4.5 | % | | | -3.4 | % | | | | | | | 36 | | | | 5.9 | % | | | | | | | 0 | | | | — | | | | | | | | 50 | | | | -10.9 | % | | | | | | | 270 | | | | 0.8 | % | | | | | | | 356 | | | | -0.6 | % | | | 1.4 | % |
Lovenox | | | 191 | | | | -16.2 | % | | | -16.2 | % | | | | | | | 164 | | | | -17.5 | % | | | | | | | 8 | | | | -22.2 | % | | | | | | | 19 | | | | 0.0 | % | | | | | | | 143 | | | | 14.6 | % | | | | | | | 334 | | | | -5.4 | % | | | -4.8 | % |
Renagel / Renvela | | | 59 | | | | -42.3 | % | | | -39.2 | % | | | | | | | 13 | | | | -7.1 | % | | | | | | | 39 | | | | -50.7 | % | | | | | | | 7 | | | | -25.0 | % | | | | | | | 25 | | | | 47.1 | % | | | | | | | 84 | | | | -28.9 | % | | | -26.3 | % |
Aprovel | | | 52 | | | | 10.6 | % | | | 10.6 | % | | | | | | | 28 | | | | 7.7 | % | | | | | | | 6 | | | | 200.0 | % | | | | | | | 18 | | | | -5.3 | % | | | | | | | 117 | | | | 3.6 | % | | | | | | | 169 | | | | 5.7 | % | | | 7.0 | % |
Synvisc / Synvisc one | | | 59 | | | | -5.1 | % | | | 0.0 | % | | | | | | | 5 | | | | 0.0 | % | | | | | | | 50 | | | | -7.8 | % | | | | | | | 4 | | | | 33.3 | % | | | | | | | 14 | | | | 7.7 | % | | | | | | | 73 | | | | -2.8 | % | | | 1.4 | % |
Allegra | | | 18 | | | | -5.6 | % | | | 0.0 | % | | | | | | | 2 | | | | 0.0 | % | | | | | | | 0 | | | | — | | | | | | | | 16 | | | | -6.3 | % | | | | | | | 0 | | | | — | | | | | | | | 18 | | | | -5.6 | % | | | 0.0 | % |
Stilnox | | | 41 | | | | -4.8 | % | | | -2.4 | % | | | | | | | 10 | | | | 25.0 | % | | | | | | | 12 | | | | 0.0 | % | | | | | | | 19 | | | | -17.4 | % | | | | | | | 15 | | | | 7.1 | % | | | | | | | 56 | | | | -1.8 | % | | | 0.0 | % |
Depakine | | | 44 | | | | 4.8 | % | | | 4.8 | % | | | | | | | 41 | | | | 2.5 | % | | | | | | | 0 | | | | — | | | | | | | | 3 | | | | 50.0 | % | | | | | | | 73 | | | | 0.0 | % | | | | | | | 117 | | | | 1.8 | % | | | 3.5 | % |
Tritace | | | 35 | | | | -2.8 | % | | | -2.8 | % | | | | | | | 35 | | | | 0.0 | % | | | | | | | 0 | | | | — | | | | | | | | 0 | | | | -50.0 | % | | | | | | | 18 | | | | 12.5 | % | | | | | | | 53 | | | | 1.9 | % | | | 1.9 | % |
Generics | | | 92 | | | | -60.4 | % | | | -58.6 | % | | | | | | | 29 | | | | -82.8 | % | | | | | | | 36 | | | | 12.9 | % | | | | | | | 27 | | | | 9.1 | % | | | | | | | 176 | | | | 6.8 | % | | | | | | | 268 | | | | -32.1 | % | | | -30.0 | % |
Other other Rx | | | 530 | | | | -7.5 | % | | | -5.7 | % | | | | | | | 392 | | | | -9.0 | % | | | | | | | 43 | | | | 10.3 | % | | | | | | | 95 | | | | -7.6 | % | | | | | | | 313 | | | | 9.5 | % | | | | | | | 843 | | | | -1.8 | % | | | -0.4 | % |
Total Established Rx Products | | | 1,207 | | | | -17.9 | % | | | -16.3 | % | | | | | | | 755 | | | | -21.6 | % | | | | | | | 194 | | | | -14.7 | % | | | | | | | 258 | | | | -6.9 | % | | | | | | | 1,164 | | | | 6.9 | % | | | | | | | 2,371 | | | | -7.3 | % | | | -5.7 | % |
Primary Care | | | 2,185 | | | | -17.5 | % | | | -15.6 | % | | | | | | | 1,082 | | | | -16.8 | % | | | | | | | 748 | | | | -21.3 | % | | | | | | | 355 | | | | -10.6 | % | | | | | | | 1,595 | | | | 7.9 | % | | | | | | | 3,780 | | | | -8.3 | % | | | -6.7 | % |
China and Emerging Markets | | | 1,890 | | | | 10.0 | % | | | 10.0 | % | | | | | | | | | | | | | | | | | | | | | | | | | | | | | | | | | | | | | | | | | | | 1,890 | | | | 10.0 | % | | | | | | | | | | | | | | | | |
| | | | | | | | | | | | | | | | | | | | | | | | | | | | | | | | | | | | | | | | | | | | | | | | | | | | | | | | | | | | | | | | | | | | | | | | | | | | |
Total Pharmaceuticals | | | 6,434 | | | | 1.5 | % | | | 3.6 | % | | | | | | | 1,616 | | | | -9.4 | % | | | | | | | 2,297 | | | | 5.0 | % | | | | | | | 631 | | | | -2.8 | % | | | | | | | 1,890 | | | | 10.0 | % | | | | | | | 6,434 | | | | 1.5 | % | | | 3.6 | % |
| | | | | | | | | | | | | | | | | | | | | | | | | | | | | | | | | | | | | | | | | | | | | | | | | | | | | | | | | | | | | | | | | | | | | | | | | | | | |
Allergy, Cough and Cold | | | 287 | | | | 1.4 | % | | | 4.0 | % | | | | | | | 84 | | | | -4.5 | % | | | | | | | 72 | | | | 0.0 | % | | | | | | | 33 | | | | 14.3 | % | | | | | | | 98 | | | | 4.4 | % | | | | | | | 287 | | | | 1.4 | % | | | 4.0 | % |
Pain | | | 300 | | | | 3.8 | % | | | 3.4 | % | | | | | | | 112 | | | | -6.7 | % | | | | | | | 45 | | | | 2.4 | % | | | | | | | 36 | | | | 20.7 | % | | | | | | | 107 | | | | 12.1 | % | | | | | | | 300 | | | | 3.8 | % | | | 3.4 | % |
Digestive | | | 229 | | | | -4.7 | % | | | -2.1 | % | | | | | | | 68 | | | | -2.9 | % | | | | | | | 33 | | | | -34.0 | % | | | | | | | 14 | | | | -7.1 | % | | | | | | | 114 | | | | 7.8 | % | | | | | | | 229 | | | | -4.7 | % | | | -2.1 | % |
Nutritional | | | 178 | | | | 1.8 | % | | | 4.1 | % | | | | | | | 28 | | | | -6.7 | % | | | | | | | 10 | | | | 0.0 | % | | | | | | | 71 | | | | 0.0 | % | | | | | | | 69 | | | | 8.2 | % | | | | | | | 178 | | | | 1.8 | % | | | 4.1 | % |
Consumer Healthcare | | | 1,136 | | | | 0.4 | % | | | 2.1 | % | | | | | | | 306 | | | | -7.0 | % | | | | | | | 252 | | | | -4.4 | % | | | | | | | 164 | | | | 6.6 | % | | | | | | | 414 | | | | 7.3 | % | | | | | | | 1,136 | | | | 0.4 | % | | | 2.1 | % |
| | | | | | | | | | | | | | | | | | | | | | | | | | | | | | | | | | | | | | | | | | | | | | | | | | | | | | | | | | | | | | | | | | | | | | | | | | | | |
Polio / Pertussis / Hib | | | 515 | | | | -1.2 | % | | | 0.8 | % | | | | | | | 73 | | | | 0.0 | % | | | | | | | 78 | | | | -37.8 | % | | | | | | | 34 | | | | -25.6 | % | | | | | | | 330 | | | | 18.2 | % | | | | | | | 515 | | | | -1.2 | % | | | 0.8 | % |
Adult Booster Vaccines | | | 182 | | | | 17.4 | % | | | 22.1 | % | | | | | | | 42 | | | | 40.0 | % | | | | | | | 122 | | | | 17.0 | % | | | | | | | 8 | | | | 20.0 | % | | | | | | | 10 | | | | -28.6 | % | | | | | | | 182 | | | | 17.4 | % | | | 22.1 | % |
Meningitis/Pneumonia | | | 310 | | | | 8.8 | % | | | 13.6 | % | | | | | | | 0 | | | | — | | | | | | | | 275 | | | | 14.8 | % | | | | | | | 5 | | | | 0.0 | % | | | | | | | 30 | | | | -25.0 | % | | | | | | | 310 | | | | 8.8 | % | | | 13.6 | % |
Influenza Vaccines | | | 735 | | | | -28.5 | % | | | -25.4 | % | | | | | | | 86 | | | | 3.6 | % | | | | | | | 580 | | | | -32.6 | % | | | | | | | 27 | | | | -16.1 | % | | | | | | | 42 | | | | -22.6 | % | | | | | | | 735 | | | | -28.5 | % | | | -25.4 | % |
Travel And Other Endemic Vaccines | | | 159 | | | | 20.8 | % | | | 22.3 | % | | | | | | | 33 | | | | 6.5 | % | | | | | | | 41 | | | | -2.6 | % | | | | | | | 16 | | | | 38.5 | % | | | | | | | 69 | | | | 44.7 | % | | | | | | | 159 | | | | 20.8 | % | | | 22.3 | % |
Vaccines | | | 1,929 | | | | -9.8 | % | | | -6.8 | % | | | | | | | 235 | | | | 7.8 | % | | | | | | | 1,122 | | | | -19.5 | % | | | | | | | 91 | | | | -8.2 | % | | | | | | | 481 | | | | 10.7 | % | | | | | | | 1,929 | | | | -9.8 | % | | | -6.8 | % |
Total Company | | | 9,499 | | | | -1.1 | % | | | 1.1 | % | | | | | | | 2,157 | | | | -7.5 | % | | | | | | | 3,671 | | | | -4.5 | % | | | | | | | 886 | | | | -1.7 | % | | | | | | | 2,785 | | | | 9.7 | % | | | | | | | 9,499 | | | | -1.1 | % | | | 1.1 | % |
15
2019 first nine months net sales by GBU, franchise, geographic region and product
| | | | | | | | | | | | | | | | | | | | | | | | | | | | | | | | | | | | | | | | | | | | | | | | | | | | | | | | | | | | | | | | | | | | | | | | | | | | |
First 9M 2019
(€ million) | | Total
GBUs | | | % CER | | | %
reported | | | | | | Europe | | | % CER | | | | | | United
States | | | % CER | | | | | | Rest of
the World | | | % CER | | | | | | Emerging
Markets | | | % CER | | | | | | Total
Franchises | | | % CER | | | % reported | |
Aubagio | | | 1,359 | | | | 11.8 | % | | | 16.9 | % | | | | | | | 306 | | | | 10.5 | % | | | | | | | 1,008 | | | | 12.2 | % | | | | | | | 45 | | | | 12.5 | % | | | | | | | 38 | | | | 7.9 | % | | | | | | | 1,397 | | | | 11.7 | % | | | 16.3 | % |
Lemtrada | | | 204 | | | | -31.6 | % | | | -29.2 | % | | | | | | | 78 | | | | -40.0 | % | | | | | | | 117 | | | | -22.9 | % | | | | | | | 9 | | | | -42.9 | % | | | | | | | 19 | | | | 22.2 | % | | | | | | | 223 | | | | -28.4 | % | | | -27.1 | % |
| Total MS | | | 1,563 | | | | 3.2 | % | | | 7.7 | % | | | | | | | 384 | | | | -5.7 | % | | | | | | | 1,125 | | | | 7.1 | % | | | | | | | 54 | | | | -1.9 | % | | | | | | | 57 | | | | 12.5 | % | | | | | | | 1,620 | | | | 3.5 | % | | | 7.5 | % |
Cerezyme | | | 342 | | | | -5.6 | % | | | -3.4 | % | | | | | | | 183 | | | | -7.1 | % | | | | | | | 134 | | | | 0.0 | % | | | | | | | 25 | | | | -20.7 | % | | | | | | | 189 | | | | 31.1 | % | | | | | | | 531 | | | | 6.1 | % | | | 1.9 | % |
Cerdelga | | | 147 | | | | 25.7 | % | | | 30.1 | % | | | | | | | 53 | | | | 54.3 | % | | | | | | | 87 | | | | 12.5 | % | | | | | | | 7 | | | | 16.7 | % | | | | | | | 4 | | | | 150.0 | % | | | | | | | 151 | | | | 27.8 | % | | | 31.3 | % |
Myozyme | | | 575 | | | | 6.3 | % | | | 9.3 | % | | | | | | | 286 | | | | 2.9 | % | | | | | | | 243 | | | | 11.7 | % | | | | | | | 46 | | | | 2.3 | % | | | | | | | 105 | | | | 30.7 | % | | | | | | | 680 | | | | 9.8 | % | | | 10.7 | % |
Fabrazyme | | | 529 | | | | 3.0 | % | | | 7.3 | % | | | | | | | 136 | | | | 4.6 | % | | | | | | | 304 | | | | 2.5 | % | | | | | | | 89 | | | | 2.4 | % | | | | | | | 69 | | | | 35.7 | % | | | | | | | 598 | | | | 6.4 | % | | | 8.9 | % |
Aldurazyme | | | 114 | | | | 5.7 | % | | | 8.6 | % | | | | | | | 58 | | | | 3.6 | % | | | | | | | 38 | | | | 12.5 | % | | | | | | | 18 | | | | 0.0 | % | | | | | | | 56 | | | | 27.7 | % | | | | | | | 170 | | | | 12.5 | % | | | 11.8 | % |
Total Rare Disease | | | 1,890 | | | | 3.2 | % | | | 6.7 | % | | | | | | | 764 | | | | 2.5 | % | | | | | | | 874 | | | | 5.4 | % | | | | | | | 252 | | | | -1.6 | % | | | | | | | 460 | | | | 31.1 | % | | | | | | | 2,350 | | | | 8.3 | % | | | 8.6 | % |
Jevtana | | | 335 | | | | 11.4 | % | | | 15.5 | % | | | | | | | 127 | | | | 8.5 | % | | | | | | | 151 | | | | 10.9 | % | | | | | | | 57 | | | | 20.5 | % | | | | | | | 21 | | | | 16.7 | % | | | | | | | 356 | | | | 11.7 | % | | | 15.6 | % |
Mozobil | | | 132 | | | | 8.5 | % | | | 12.8 | % | | | | | | | 36 | | | | 2.9 | % | | | | | | | 82 | | | | 10.0 | % | | | | | | | 14 | | | | 16.7 | % | | | | | | | 11 | | | | 57.1 | % | | | | | | | 143 | | | | 11.3 | % | | | 15.3 | % |
Thymoglobulin | | | 189 | | | | 10.4 | % | | | 16.0 | % | | | | | | | 27 | | | | -3.6 | % | | | | | | | 144 | | | | 14.3 | % | | | | | | | 18 | | | | 6.3 | % | | | | | | | 76 | | | | 39.3 | % | | | | | | | 265 | | | | 17.8 | % | | | 21.0 | % |
Taxotere | | | 22 | | | | -15.4 | % | | | -15.4 | % | | | | | | | 3 | | | | 50.0 | % | | | | | | | -1 | | | | -150.0 | % | | | | | | | 20 | | | | -9.1 | % | | | | | | | 109 | | | | 4.9 | % | | | | | | | 131 | | | | 0.8 | % | | | 2.3 | % |
Eloxatine | | | 17 | | | | -29.2 | % | | | -29.2 | % | | | | | | | 1 | | | | -50.0 | % | | | | | | | -4 | | | | — | | | | | | | | 20 | | | | -9.1 | % | | | | | | | 144 | | | | 24.3 | % | | | | | | | 161 | | | | 15.1 | % | | | 15.8 | % |
Total Oncology | | | 872 | | | | 6.7 | % | | | 10.5 | % | | | | | | | 272 | | | | 3.8 | % | | | | | | | 439 | | | | 8.6 | % | | | | | | | 161 | | | | 6.9 | % | | | | | | | 382 | | | | 19.5 | % | | | | | | | 1,254 | | | | 10.4 | % | | | 13.3 | % |
Dupixent | | | 1,377 | | | | 158.8 | % | | | 172.7 | % | | | | | | | 136 | | | | 195.7 | % | | | | | | | 1,124 | | | | 143.9 | % | | | | | | | 117 | | | | 358.3 | % | | | | | | | 18 | | | | 466.7 | % | | | | | | | 1,395 | | | | 160.6 | % | | | 174.6 | % |
Kevzara | | | 130 | | | | 140.4 | % | | | 150.0 | % | | | | | | | 30 | | | | 275.0 | % | | | | | | | 81 | | | | 87.8 | % | | | | | | | 19 | | | | 500.0 | % | | | | | | | 1 | | | | — | | | | | | | | 131 | | | | 142.3 | % | | | 151.9 | % |
Total immunology | | | 1,507 | | | | 157.1 | % | | | 170.6 | % | | | | | | | 166 | | | | 207.4 | % | | | | | | | 1,205 | | | | 139.1 | % | | | | | | | 136 | | | | 374.1 | % | | | | | | | 19 | | | | 500.0 | % | | | | | | | 1,526 | | | | 158.9 | % | | | 172.5 | % |
Alprolix | | | 304 | | | | 51.1 | % | | | 60.0 | % | | | | | | | 0 | | | | — | | | | | | | | 223 | | | | 43.2 | % | | | | | | | 81 | | | | 77.3 | % | | | | | | | 0 | | | | — | | | | | | | | 304 | | | | 51.1 | % | | | 60.0 | % |
Eloctate | | | 494 | | | | 12.6 | % | | | 19.9 | % | | | | | | | 0 | | | | — | | | | | | | | 394 | | | | 9.1 | % | | | | | | | 100 | | | | 29.2 | % | | | | | | | 13 | | | | — | | | | | | | | 507 | | | | 15.8 | % | | | 23.1 | % |
Cablivi | | | 40 | | | | — | | | | — | | | | | | | | 15 | | | | — | | | | | | | | 24 | | | | — | | | | | | | | 1 | | | | — | | | | | | | | 0 | | | | — | | | | | | | | 40 | | | | — | | | | — | |
Total Rare Blood Disorder | | | 838 | | | | 30.8 | % | | | 39.0 | % | | | | | | | 15 | | | | — | | | | | | | | 641 | | | | 24.1 | % | | | | | | | 182 | | | | 47.4 | % | | | | | | | 13 | | | | — | | | | | | | | 851 | | | | 33.0 | % | | | 41.1 | % |
Sanofi Genzyme (Specialty Care) | | | 6,670 | | | | 23.5 | % | | | 29.0 | % | | | | | | | 1,601 | | | | 9.0 | % | | | | | | | 4,284 | | | | 29.7 | % | | | | | | | 785 | | | | 27.4 | % | | | | | | | 931 | | | | 28.5 | % | | | | | | | 7,601 | | | | 24.2 | % | | | 27.9 | % |
Lantus | | | 1,466 | | | | -28.2 | % | | | -25.4 | % | | | | | | | 438 | | | | -15.1 | % | | | | | | | 863 | | | | -34.3 | % | | | | | | | 165 | | | | -24.4 | % | | | | | | | 817 | | | | 12.9 | % | | | | | | | 2,283 | | | | -17.0 | % | | | -15.4 | % |
Toujeo | | | 517 | | | | -5.1 | % | | | -2.5 | % | | | | | | | 247 | | | | 16.0 | % | | | | | | | 212 | | | | -24.3 | % | | | | | | | 58 | | | | 5.6 | % | | | | | | | 132 | | | | 36.4 | % | | | | | | | 649 | | | | 1.4 | % | | | 3.2 | % |
Apidra | | | 160 | | | | -16.0 | % | | | -14.9 | % | | | | | | | 97 | | | | -4.9 | % | | | | | | | 36 | | | | -40.4 | % | | | | | | | 27 | | | | -6.9 | % | | | | | | | 96 | | | | 23.8 | % | | | | | | | 256 | | | | -4.1 | % | | | -4.5 | % |
Amaryl | | | 32 | | | | -13.9 | % | | | -11.1 | % | | | | | | | 11 | | | | -15.4 | % | | | | | | | 1 | | | | 0.0 | % | | | | | | | 20 | | | | -13.6 | % | | | | | | | 223 | | | | -0.9 | % | | | | | | | 255 | | | | -2.7 | % | | | -1.2 | % |
Admelog | | | 194 | | | | 405.6 | % | | | 438.9 | % | | | | | | | 11 | | | | 120.0 | % | | | | | | | 183 | | | | 437.5 | % | | | | | | | 0 | | | | 0.0 | % | | | | | | | 0 | | | | — | | | | | | | | 194 | | | | 405.6 | % | | | 438.9 | % |
Total Diabetes | | | 2,551 | | | | -15.6 | % | | | -12.6 | % | | | | | | | 903 | | | | -5.1 | % | | | | | | | 1,357 | | | | -21.8 | % | | | | | | | 291 | | | | -15.4 | % | | | | | | | 1,294 | | | | 11.2 | % | | | | | | | 3,845 | | | | -7.9 | % | | | -6.2 | % |
Praluent | | | 169 | | | | -4.7 | % | | | -1.7 | % | | | | | | | 83 | | | | 31.7 | % | | | | | | | 73 | | | | -32.4 | % | | | | | | | 13 | | | | 71.4 | % | | | | | | | 14 | | | | 100.0 | % | | | | | | | 183 | | | | -0.6 | % | | | 2.2 | % |
Multaq | | | 242 | | | | -8.0 | % | | | -3.2 | % | | | | | | | 30 | | | | -9.1 | % | | | | | | | 209 | | | | -7.9 | % | | | | | | | 3 | | | | 0.0 | % | | | | | | | 6 | | | | 20.0 | % | | | | | | | 248 | | | | -7.5 | % | | | -2.7 | % |
Total Cardiovascular | | | 411 | | | | -6.6 | % | | | -2.6 | % | | | | | | | 113 | | | | 17.7 | % | | | | | | | 282 | | | | -15.8 | % | | | | | | | 16 | | | | 50.0 | % | | | | | | | 20 | | | | 66.7 | % | | | | | | | 431 | | | | -4.6 | % | | | -0.7 | % |
Plavix | | | 255 | | | | -9.5 | % | | | -7.3 | % | | | | | | | 105 | | | | -4.5 | % | | | | | | | 0 | | | | — | | | | | | | | 150 | | | | -12.7 | % | | | | | | | 867 | | | | 2.5 | % | | | | | | | 1,122 | | | | -0.4 | % | | | 0.9 | % |
Lovenox | | | 620 | | | | -18.6 | % | | | -18.4 | % | | | | | | | 539 | | | | -19.5 | % | | | | | | | 26 | | | | -17.2 | % | | | | | | | 55 | | | | -8.3 | % | | | | | | | 404 | | | | 12.8 | % | | | | | | | 1,024 | | | | -8.5 | % | | | -8.5 | % |
Renagel / Renvela | | | 160 | | | | -42.3 | % | | | -39.6 | % | | | | | | | 39 | | | | -15.2 | % | | | | | | | 98 | | | | -53.1 | % | | | | | | | 23 | | | | -4.3 | % | | | | | | | 69 | | | | 36.0 | % | | | | | | | 229 | | | | -29.8 | % | | | -27.3 | % |
Aprovel | | | 159 | | | | 6.8 | % | | | 7.4 | % | | | | | | | 82 | | | | 1.2 | % | | | | | | | 20 | | | | 171.4 | % | | | | | | | 57 | | | | -5.0 | % | | | | | | | 384 | | | | 7.4 | % | | | | | | | 543 | | | | 7.2 | % | | | 8.4 | % |
Synvisc / Synvisc one | | | 183 | | | | -8.9 | % | | | -3.7 | % | | | | | | | 19 | | | | 5.6 | % | | | | | | | 153 | | | | -11.1 | % | | | | | | | 11 | | | | 0.0 | % | | | | | | | 45 | | | | 4.8 | % | | | | | | | 228 | | | | -6.5 | % | | | -1.7 | % |
Allegra | | | 100 | | | | -3.1 | % | | | 2.0 | % | | | | | | | 8 | | | | 14.3 | % | | | | | | | 0 | | | | — | | | | | | | | 92 | | | | -4.4 | % | | | | | | | 0 | | | | — | | | | | | | | 100 | | | | -3.1 | % | | | 2.0 | % |
Stilnox | | | 117 | | | | -11.1 | % | | | -7.1 | % | | | | | | | 27 | | | | -3.6 | % | | | | | | | 30 | | | | -15.2 | % | | | | | | | 60 | | | | -12.3 | % | | | | | | | 46 | | | | 0.0 | % | | | | | | | 163 | | | | -8.1 | % | | | -5.2 | % |
Depakine | | | 131 | | | | -1.5 | % | | | -1.5 | % | | | | | | | 121 | | | | -2.4 | % | | | | | | | 0 | | | | — | | | | | | | | 10 | | | | 11.1 | % | | | | | | | 222 | | | | 4.8 | % | | | | | | | 353 | | | | 2.3 | % | | | 2.9 | % |
Tritace | | | 109 | | | | -1.8 | % | | | -1.8 | % | | | | | | | 106 | | | | -0.9 | % | | | | | | | 0 | | | | — | | | | | | | | 3 | | | | -25.0 | % | | | | | | | 53 | | | | -3.6 | % | | | | | | | 162 | | | | -2.4 | % | | | -3.0 | % |
Generics | | | 306 | | | | -58.5 | % | | | -56.8 | % | | | | | | | 90 | | | | -83.2 | % | | | | | | | 115 | | | | 38.0 | % | | | | | | | 101 | | | | 2.2 | % | | | | | | | 498 | | | | 0.0 | % | | | | | | | 804 | | | | -33.9 | % | | | -34.1 | % |
Other other Rx | | | 1,649 | | | | -6.5 | % | | | -5.3 | % | | | | | | | 1,227 | | | | -6.8 | % | | | | | | | 136 | | | | -8.6 | % | | | | | | | 286 | | | | -3.9 | % | | | | | | | 906 | | | | 0.5 | % | | | | | | | 2,555 | | | | -4.1 | % | | | -3.9 | % |
Total Established Rx Products | | | 3,789 | | | | -18.3 | % | | | -16.8 | % | | | | | | | 2,363 | | | | -22.3 | % | | | | | | | 578 | | | | -15.8 | % | | | | | | | 848 | | | | -5.9 | % | | | | | | | 3,494 | | | | 3.7 | % | | | | | | | 7,283 | | | | -8.9 | % | | | -8.2 | % |
Primary Care | | | 6,751 | | | | -16.7 | % | | | -14.5 | % | | | | | | | 3,379 | | | | -17.4 | % | | | | | | | 2,217 | | | | -19.6 | % | | | | | | | 1,155 | | | | -8.1 | % | | | | | | | 4,808 | | | | 5.8 | % | | | | | | | 11,559 | | | | -8.4 | % | | | -7.3 | % |
China and Emerging Markets | | | 5,739 | | | | 9.1 | % | | | 7.5 | % | | | | | | | | | | | | | | | | | | | | | | | | | | | | | | | | | | | | | | | | | | | 5,739 | | | | 9.1 | % | | | | | | | | | | | | | | | | |
| | | | | | | | | | | | | | | | | | | | | | | | | | | | | | | | | | | | | | | | | | | | | | | | | | | | | | | | | | | | | | | | | | | | | | | | | | | | |
Total Pharmaceuticals | | | 19,160 | | | | 2.1 | % | | | 4.1 | % | | | | | | | 4,980 | | | | -10.4 | % | | | | | | | 6,501 | | | | 7.3 | % | | | | | | | 1,940 | | | | 3.5 | % | | | | | | | 5,739 | | | | 9.1 | % | | | | | | | 19,160 | | | | 2.1 | % | | | 4.1 | % |
| | | | | | | | | | | | | | | | | | | | | | | | | | | | | | | | | | | | | | | | | | | | | | | | | | | | | | | | | | | | | | | | | | | | | | | | | | | | |
Allergy, Cough and Cold | | | 898 | | | | 2.3 | % | | | 4.9 | % | | | | | | | 247 | | | | -3.1 | % | | | | | | | 259 | | | | 0.4 | % | | | | | | | 121 | | | | 10.4 | % | | | | | | | 271 | | | | 6.3 | % | | | | | | | 898 | | | | 2.3 | % | | | 4.9 | % |
Pain | | | 930 | | | | 2.6 | % | | | 1.3 | % | | | | | | | 366 | | | | -1.9 | % | | | | | | | 138 | | | | 8.3 | % | | | | | | | 99 | | | | 9.3 | % | | | | | | | 327 | | | | 3.8 | % | | | | | | | 930 | | | | 2.6 | % | | | 1.3 | % |
Digestive | | | 777 | | | | 4.7 | % | | | 6.4 | % | | | | | | | 235 | | | | 1.3 | % | | | | | | | 136 | | | | -10.6 | % | | | | | | | 42 | | | | -2.4 | % | | | | | | | 364 | | | | 15.0 | % | | | | | | | 777 | | | | 4.7 | % | | | 6.4 | % |
Nutritional | | | 492 | | | | -3.0 | % | | | -1.8 | % | | | | | | | 90 | | | | -1.1 | % | | | | | | | 29 | | | | 0.0 | % | | | | | | | 193 | | | | -2.1 | % | | | | | | | 180 | | | | -5.3 | % | | | | | | | 492 | | | | -3.0 | % | | | -1.8 | % |
Consumer Healthcare | | | 3,535 | | | | 0.7 | % | | | 2.0 | % | | | | | | | 986 | | | | -4.5 | % | | | | | | | 840 | | | | -0.4 | % | | | | | | | 482 | | | | 2.6 | % | | | | | | | 1,227 | | | | 5.2 | % | | | | | | | 3,535 | | | | 0.7 | % | | | 2.0 | % |
| | | | | | | | | | | | | | | | | | | | | | | | | | | | | | | | | | | | | | | | | | | | | | | | | | | | | | | | | | | | | | | | | | | | | | | | | | | | |
Polio / Pertussis / Hib | | | 1,503 | | | | 19.3 | % | | | 20.7 | % | | | | | | | 224 | | | | 5.2 | % | | | | | | | 270 | | | | -14.2 | % | | | | | | | 144 | | | | 10.5 | % | | | | | | | 865 | | | | 42.1 | % | | | | | | | 1,503 | | | | 19.3 | % | | | 20.7 | % |
Adult Booster Vaccines | | | 416 | | | | 20.0 | % | | | 24.2 | % | | | | | | | 127 | | | | 32.3 | % | | | | | | | 246 | | | | 18.3 | % | | | | | | | 21 | | | | 11.1 | % | | | | | | | 22 | | | | -8.3 | % | | | | | | | 416 | | | | 20.0 | % | | | 24.2 | % |
Meningitis/Pneumonia | | | 558 | | | | 12.3 | % | | | 16.7 | % | | | | | | | 0 | | | | — | | | | | | | | 450 | | | | 10.6 | % | | | | | | | 12 | | | | 0.0 | % | | | | | | | 96 | | | | 22.2 | % | | | | | | | 558 | | | | 12.3 | % | | | 16.7 | % |
Influenza Vaccines | | | 852 | | | | -25.9 | % | | | -23.4 | % | | | | | | | 88 | | | | 4.8 | % | | | | | | | 584 | | | | -32.6 | % | | | | | | | 47 | | | | -14.5 | % | | | | | | | 133 | | | | -10.6 | % | | | | | | | 852 | | | | -25.9 | % | | | -23.4 | % |
Travel And Other Endemic Vaccines | | | 416 | | | | 14.2 | % | | | 16.2 | % | | | | | | | 100 | | | | 11.1 | % | | | | | | | 115 | | | | 6.9 | % | | | | | | | 46 | | | | 17.1 | % | | | | | | | 155 | | | | 21.4 | % | | | | | | | 416 | | | | 14.2 | % | | | 16.2 | % |
Vaccines | | | 3,823 | | | | 3.9 | % | | | 6.5 | % | | | | | | | 542 | | | | 10.6 | % | | | | | | | 1,731 | | | | -11.5 | % | | | | | | | 277 | | | | 5.5 | % | | | | | | | 1,273 | | | | 28.7 | % | | | | | | | 3,823 | | | | 3.9 | % | | | 6.5 | % |
Total Company | | | 26,518 | | | | 2.2 | % | | | 4.1 | % | | | | | | | 6,508 | | | | -8.1 | % | | | | | | | 9,072 | | | | 2.4 | % | | | | | | | 2,699 | | | | 3.5 | % | | | | | | | 8,239 | | | | 11.1 | % | | | | | | | 26,518 | | | | 2.2 | % | | | 4.1 | % |
16
Appendix 2: Business net income statement
| | | | | | | | | | | | | | | | | | | | | | | | | | | | | | | | | | | | | | | | | | | | | | | | | | | | | | | | | | |
| Third Quarter 2019 | | Pharmaceuticals | | | Consumer Healthcare | | | | | | Vaccines | | | | | | Others(1) | | Total Group | |
| € million | | Q3
2019 | | | Q3
2018 | | | Change | | | Q3
2019 | | | Q3
2018 | | | Change | | | Q3
2019 | | | Q3 2018 | | | Change | | | Q3
2019 | | | Q3
2018 | | | Change | | Q3
2019 | | | Q3
2018 | | | Change | |
Net sales | | | 6,434 | | | | 6,210 | | | | 3.6 | % | | | 1,136 | | | | 1,113 | | | | 2.1 | % | | | 1,929 | | | | 2,069 | | | | (6.8 | )% | | | — | | | | — | | | | | | 9,499 | | | | 9,392 | | | | 1.1 | % |
Other revenues | | | 49 | | | | 51 | | | | (3.9 | )% | | | — | | | | — | | | | | | | | 373 | | | | 301 | | | | 23.9 | % | | | — | | | | — | | | | | | 422 | | | | 352 | | | | 19.9 | % |
Cost of Sales | | | (1,673 | ) | | | (1,688 | ) | | | (0.9 | )% | | | (400 | ) | | | (370 | ) | | | 8.1 | % | | | (1,002 | ) | | | (920 | ) | | | 8.9 | % | | | (59 | ) | | | (39 | ) | | 51.3% | | | (3,134 | ) | | | (3,017 | ) | | | 3.9 | % |
As % of net sales | | | (26.0 | )% | | | (27.2 | )% | | | | | | | (35.2 | )% | | | (33.2 | )% | | | | | | | (51.9 | )% | | | (44.5 | )% | | | | | | | | | | | | | | | | | (33.0 | )% | | | (32.1 | )% | | | | |
Gross Profit | | | 4,810 | | | | 4,573 | | | | 5.2 | % | | | 736 | | | | 743 | | | | (0.9 | )% | | | 1,300 | | | | 1,450 | | | | (10.3 | )% | | | (59 | ) | | | (39 | ) | | | | | 6,787 | | | | 6,727 | | | | 0.9 | % |
As % of net sales | | | 74.8 | % | | | 73.6 | % | | | | | | | 64.8 | % | | | 66.8 | % | | | | | | | 67.4 | % | | | 70.1 | % | | | | | | | | | | | | | | | | | 71.4 | % | | | 71.6 | % | | | | |
Research and development expenses | | | (1,024 | ) | | | (1,148 | ) | | | (10.8 | )% | | | (33 | ) | | | (37 | ) | | | (10.8 | )% | | | (156 | ) | | | (125 | ) | | | 24.8 | % | | | (149 | ) | | | (151 | ) | | (1.3)% | | | (1,362 | ) | | | (1,461 | ) | | | (6.8 | )% |
As % of net sales | | | (15.9 | )% | | | (18.5 | )% | | | | | | | (2.9 | )% | | | (3.3 | )% | | | | | | | (8.1 | )% | | | (6.0 | )% | | | | | | | | | | | | | | | | | (14.3 | )% | | | (15.6 | )% | | | | |
Selling general and administrative expenses | | | (1,237 | ) | | | (1,298 | ) | | | (4.7 | )% | | | (368 | ) | | | (337 | ) | | | 9.2 | % | | | (190 | ) | | | (174 | ) | | | 9.2 | % | | | (519 | ) | | | (492 | ) | | 5.5% | | | (2,314 | ) | | | (2,301 | ) | | | 0.6 | % |
As % of net sales | | | (19.2 | )% | | | (20.9 | )% | | | | | | | (32.4 | )% | | | (30.3 | )% | | | | | | | (9.8 | )% | | | (8.4 | )% | | | | | | | | | | | | | | | | | (24.4 | )% | | | (24.5 | )% | | | | |
Other current operating income/expenses | | | (154 | ) | | | (46 | ) | | | | | | | 33 | | | | 3 | | | | | | | | 1 | | | | (3 | ) | | | | | | | 1 | | | | (28 | ) | | | | | (119 | ) | | | (74 | ) | | | | |
Share of profit/loss of associates* and joint ventures | | | 123 | | | | 155 | | | | | | | | — | | | | 1 | | | | | | | | 9 | | | | (3 | ) | | | | | | | — | | | | — | | | | | | 132 | | | | 153 | | | | | |
Net income attributable tonon-controlling interests | | | (7 | ) | | | (23 | ) | | | | | | | (5 | ) | | | (3 | ) | | | | | | | — | | | | — | | | | | | | | — | | | | — | | | | | | (12 | ) | | | (26 | ) | | | | |
Business operating income | | | 2,511 | | | | 2,213 | | | | 13.5 | % | | | 363 | | | | 370 | | | | (1.9 | )% | | | 964 | | | | 1,145 | | | | (15.8 | )% | | | (726 | ) | | | (710 | ) | | 2.3% | | | 3,112 | | | | 3,018 | | | | 3.1 | % |
As % of net sales | | | 39.0 | % | | | 35.6 | % | | | | | | | 32.0 | % | | | 33.2 | % | | | | | | | 50.0 | % | | | 55.3 | % | | | | | | | | | | | | | | | | | 32.8 | % | | | 32.1 | % | | | | |
| | | | | | | | | | | | | | | | | | | | | | | | | | | Financial income and expenses | | | (71 | ) | | | (106 | ) | | | | |
| | | | | | | | | | | | | | | | | | | | | | | | | | | Income tax expenses | | | | | | (642 | ) | | | (613 | ) | | | | |
| | | | | | | | | | | | | | | | | | | | | | | | | | | Tax rate** | | | | | | 22.0 | % | | | 22.0 | % | | | | |
| | | | | | | | | | | | | | | | | | | | | | | | | | | Business net income | | | 2,399 | | | | 2,299 | | | | 4.3 | % |
| | | | | | | | | | | | | | | | | | | | | | | | | | | As % of net sales | | | | | | 25.3 | % | | | 24.5 | % | | | | |
| | | | | | | | | | | | | | | | | | | | | | | | | | | Business earnings / share (in euros)*** | | | 1.92 | | | | 1.84 | | | | 4.3 | % |
| ** | Determined on the basis of Business income before tax, associates, andnon-controlling interests. |
| *** | Based on an average number of shares outstanding of 1,252.2 million in the third quarter of 2019 and 1,247.1 million in the third quarter of 2018. |
| (1) | Others include the cost of Global Support Functions (Medical Affairs, External Affairs, Finance, Human Resources, Information Solution & Technologies, Sanofi Business Services, etc…). |
17
| | | | | | | | | | | | | | | | | | | | | | | | | | | | | | | | | | | | | | | | | | | | | | | | | | | | | | | | | | | | |
Nine Months 2019 | | Pharmaceuticals | | | Consumer Healthcare | | | Vaccines | | | Others (1) | | | Total Group | |
| € million | | 9M
2019 | | | 9M
2018 | | | Change | | | 9M
2019 | | | 9M
2018 | | | Change | | | 9M
2019 | | | 9M
2018 | | | Change | | | 9M
2019 | | | 9M
2018 | | | Change | | | 9M
2019 | | | 9M
2018 | | | Change | |
Net sales | | | 19,160 | | | | 18,409 | | | | 4.1 | % | | | 3,535 | | | | 3,466 | | | | 2.0 | % | | | 3,823 | | | | 3,591 | | | | 6.5 | % | | | — | | | | — | | | | | | | | 26,518 | | | | 25,466 | | | | 4.1 | % |
Other revenues | | | 178 | | | | 185 | | | | (3.8 | )% | | | 1 | | | | — | | | | | | | | 917 | | | | 700 | | | | 31.0 | % | | | — | | | | — | | | | | | | | 1,096 | | | | 885 | | | | 23.8 | % |
Cost of Sales | | | (4,915 | ) | | | (4,918 | ) | | | (0.1 | )% | | | (1,173 | ) | | | (1,133 | ) | | | 3.5 | % | | | (2,261 | ) | | | (1,988 | ) | | | 13.7 | % | | | (170 | ) | | | (144 | ) | | | 18.1 | % | | | (8,519 | ) | | | (8,183 | ) | | | 4.1 | % |
As % of net sales | | | (25.7 | )% | | | (26.7 | )% | | | | | | | (33.2 | )% | | | (32.7 | )% | | | | | | | (59.1 | )% | | | (55.4 | )% | | | | | | | | | | | | | | | | | | | (32.1 | )% | | | (32.1 | )% | | | | |
Gross Profit | | | 14,423 | | | | 13,676 | | | | 5.5 | % | | | 2,363 | | | | 2,333 | | | | 1.3 | % | | | 2,479 | | | | 2,303 | | | | 7.6 | % | | | (170 | ) | | | (144 | ) | | | | | | | 19,095 | | | | 18,168 | | | | 5.1 | % |
As % of net sales | | | 75.3 | % | | | 74.3 | % | | | | | | | 66.8 | % | | | 67.3 | % | | | | | | | 64.8 | % | | | 64.1 | % | | | | | | | | | | | | | | | | | | | 72.0 | % | | | 71.3 | % | | | | |
Research and development expenses | | | (3,330 | ) | | | (3,261 | ) | | | 2.1 | % | | | (103 | ) | | | (95 | ) | | | 8.4 | % | | | (458 | ) | | | (393 | ) | | | 16.5 | % | | | (444 | ) | | | (467 | ) | | | (4.9 | )% | | | (4,335 | ) | | | (4,216 | ) | | | 2.8 | % |
As % of net sales | | | (17.4 | )% | | | (17.7 | )% | | | | | | | (2.9 | )% | | | (2.7 | )% | | | | | | | (12.0 | )% | | | (10.9 | )% | | | | | | | | | | | | | | | | | | | (16.3 | )% | | | (16.6 | )% | | | | |
Selling, general and administrative expenses | | | (3,891 | ) | | | (3,946 | ) | | | (1.4 | )% | | | (1,145 | ) | | | (1,125 | ) | | | 1.8 | % | | | (548 | ) | | | (500 | ) | | | 9.6 | % | | | (1,572 | ) | | | (1,539 | ) | | | 2.1 | % | | | (7,156 | ) | | | (7,110 | ) | | | 0.6 | % |
As % of net sales | | | (20.3 | )% | | | (21.4 | )% | | | | | | | (32.4 | )% | | | (32.5 | )% | | | | | | | (14.3 | )% | | | (13.9 | )% | | | | | | | | | | | | | | | | | | | (27.0 | )% | | | (27.9 | )% | | | | |
Other current operating income/expenses | | | (388 | ) | | | 86 | | | | | | | | 138 | | | | 85 | | | | | | | | (5 | ) | | | (3 | ) | | | | | | | (57 | ) | | | (84 | ) | | | | | | | (312 | ) | | | 84 | | | | | |
Share of profit/loss of associates* and joint ventures | | | 292 | | | | 305 | | | | | | | | — | | | | 1 | | | | | | | | 9 | | | | (4 | ) | | | | | | | — | | | | — | | | | | | | | 301 | | | | 302 | | | | | |
Net income attributable tonon-controlling interests | | | (16 | ) | | | (75 | ) | | | | | | | (11 | ) | | | (9 | ) | | | | | | | — | | | | — | | | | | | | | — | | | | — | | | | | | | | (27 | ) | | | (84 | ) | | | | |
Business operating income | | | 7,090 | | | | 6,785 | | | | 4.5 | % | | | 1,242 | | | | 1,190 | | | | 4.4 | % | | | 1,477 | | | | 1,403 | | | | 5.3 | % | | | (2,243 | ) | | | (2,234 | ) | | | 0.4 | % | | | 7,566 | | | | 7,144 | | | | 5.9 | % |
As % of net sales | | | 37.0 | % | | | 36.9 | % | | | | | | | 35.1 | % | | | 34.3 | % | | | | | | | 38.6 | % | | | 39.1 | % | | | | | | | | | | | | | | | | | | | 28.5 | % | | | 28.1 | % | | | | |
| | | | | | | | | | | | | | | | | | | | | | | | | | | Financial income and expenses | | | | (201 | ) | | | (211 | ) | | | | |
| | | | | | | | | | | | | | | | | | | | | | | | | | | Income tax expenses | | | | (1,560 | ) | | | (1,478 | ) | | | | |
| | | | | | | | | | | | | | | | | | | | | | | | | | | Tax rate** | | | | 22.0 | % | | | 22.0 | % | | | | |
| | | | | | | | | | | | | | | | | | | | | | | | | | | Business net income | | | | 5,805 | | | | 5,455 | | | | 6.4 | % |
| | | | | | | | | | | | | | | | | | | | | | | | | | | As % of net sales | | | | 21.9 | % | | | 21.4 | % | | | | |
| | | | | | | | | | | | | | | | | | | | | | | | | | | Business earnings / share (in euros)*** | | | | 4.65 | | | | 4.37 | | | | 6.4 | % |
| ** | Determined on the basis of Business income before tax, associates, andnon-controlling interests. |
| *** | Based on an average number of shares outstanding of 1,248.9 million in the nine first months of 2019 and 1,247.6 million in the nine first months of 2018. |
| (1) | Other includes the cost of global support functions (Medical Affairs, External Affairs, Finance, Human Resources, Information Solution & Technologies, Sanofi Business Services, etc…). |
18
Appendix 3: Consolidated income statements
| | | | | | | | | | | | | | | | | | |
| € million | | Q3 2019 | | | Q3 2018 | | | | | 9M 2019 | | | 9M 2018 | |
Net sales | | | 9,499 | | | | 9,392 | | | | | | 26,518 | | | | 25,466 | |
Other revenues | | | 422 | | | | 352 | | | | | | 1,096 | | | | 885 | |
Cost of sales | | | (3,134 | ) | | | (3,032 | ) | | | | | (8,519 | ) | | | (8,297 | ) |
Gross profit | | | 6,787 | | | | 6,712 | | | | | | 19,095 | | | | 18,054 | |
Research and development expenses | | | (1,360 | ) | | | (1,461 | ) | | | | | (4,332 | ) | | | (4,216 | ) |
Selling and general expenses | | | (2,311 | ) | | | (2,310 | ) | | | | | (7,146 | ) | | | (7,129 | ) |
Other operating income | | | 123 | | | | 78 | | | | | | 396 | | | | 401 | |
Other operating expenses | | | (242 | ) | | | (152 | ) | | | | | (708 | ) | | | (317 | ) |
Amortization of intangible assets | | | (520 | ) | | | (537 | ) | | | | | (1,636 | ) | | | (1,536 | ) |
Impairment of intangible assets | | | (183 | ) | | | (191 | ) | | | | | (2,023 | ) | | | (292 | ) |
Fair value remeasurement of contingent consideration | | | 52 | | | | 107 | | | | | | 242 | | | | 117 | |
Restructuring costs and similar items | | | (157 | ) | | | (108 | ) | | | | | (904 | ) | | | (715 | ) |
Other gains and losses, and litigation(1) | | | (57 | ) | | | 576 | | | | | | 260 | | | | 509 | |
Operating income | | | 2,132 | | | | 2,714 | | | | | | 3,244 | | | | 4,876 | |
Financial expenses | | | (109 | ) | | | (130 | ) | | | | | (353 | ) | | | (332 | ) |
Financial income | | | 29 | | | | 24 | | | | | | 123 | | | | 121 | |
Income before tax and associates and joint ventures | | | 2,052 | | | | 2,608 | | | | | | 3,014 | | | | 4,665 | |
Income tax expense | | | (268 | ) | | | (427 | ) | | | | | (281 | ) | | | (724 | ) |
Share of profit/(loss) of associates and joint ventures | | | 91 | | | | 123 | | | | | | 207 | | | | 198 | |
Net income excluding theexchanged/held-for-exchange Animal Health business | | | 1,875 | | | | 2,304 | | | | | | 2,940 | | | | 4,139 | |
Net income/(loss) of theexchanged/held-for-exchange Animal Health business | | | (100 | ) | | | (4 | ) | | | | | (100 | ) | | | (4 | ) |
Net income | | | 1,775 | | | | 2,300 | | | | | | 2,840 | | | | 4,135 | |
Net income attributable tonon-controlling interests | | | 9 | | | | 26 | | | | | | 24 | | | | 83 | |
Net income attributable to equity holders of Sanofi | | | 1,766 | | | | 2,274 | | | | | | 2,816 | | | | 4,052 | |
Average number of shares outstanding (million) | | | 1,252.2 | | | | 1,247.1 | | | | | | 1,248.9 | | | | 1,247.6 | |
Earnings per share excluding theexchanged/held-for-exchange Animal Health business (in euros) | | | 1.49 | | | | 1.83 | | | | | | 2.33 | | | | 3.25 | |
| | | | | | | | | | | | | | | | | | |
IFRS Earnings per share (in euros) | | | 1.41 | | | | 1.82 | | | | | | 2.25 | | | | 3.25 | |
| (1) | In 2019, mainly related to litigation. In 2018,pre-tax capital gain arising on the divestment of European generics business (completed September 30, 2018). |
19
Appendix 4: Reconciliation of Net income attributable to equity holders of Sanofi to Business net income
| | | | | | | | | | | | |
| € million | | Q3 2019 | | | Q3 2018 | | | Change | |
Net income attributable to equity holders of Sanofi | | | 1,766 | | | | 2,274 | | | | (22.3 | )% |
Amortization of intangible assets(1) | | | 520 | | | | 537 | | | | | |
Impairment of intangible assets | | | 183 | | | | 191 | | | | | |
Fair value remeasurement of contingent consideration | | | (52 | ) | | | (107 | ) | | | | |
Expenses arising from the impact of acquisitions on inventories | | | — | | | | 15 | | | | | |
Other expenses related to business combinations | | | — | | | | 9 | | | | | |
Restructuring costs and similar items | | | 157 | | | | 108 | | | | | |
Other gains and losses, and litigation(2) | | | 57 | | | | (576 | ) | | | | |
Effects of IFRS 16 on Lease contracts(3) | | | 4 | | | | — | | | | | |
Tax effect of the items listed above: | | | (374 | ) | | | (147 | ) | | | | |
Amortization and impairment of intangible assets | | | (195 | ) | | | (176 | ) | | | | |
Fair value remeasurement of contingent consideration | | | (20 | ) | | | 24 | | | | | |
Expenses arising from the impact of acquisitions on inventories | | | — | | | | (4 | ) | | | | |
Restructuring costs and similar items | | | (50 | ) | | | (32 | ) | | | | |
Other tax effects | | | (109 | ) | | | 41 | | | | | |
Other tax items(4) | | | — | | | | (39 | ) | | | | |
Share of items listed above attributable tonon-controlling interests | | | (3 | ) | | | — | | | | | |
Restructuring costs of associates and joint ventures, and expenses arising from the impact of acquisitions on associates and joint ventures | | | 41 | | | | 30 | | | | | |
Animal Health items | | | 100 | | | | 4 | | | | | |
Business net income | | | 2,399 | | | | 2,299 | | | | 4.3 | % |
IFRS earnings per share(5)(in euros) | | | 1.41 | | | | 1.82 | | | | | |
| (1) | Of which related to amortization expense generated by the remeasurement of intangible assets as part of business combinations: €496 million in the third quarter of 2019 and €505 million in the third quarter of 2018. |
| (2) | In 2019, mainly related to litigation. In 2018,pre-tax capital gain arising on the divestment of European generics business (completed September 30, 2018). |
| (3) | Impact of new lease standard IFRS 16, is effective January 1, 2019 using the modified retrospective transition method (no restatement of prior periods), since Business Net Income remains reported as previously under IAS 17 and related interpretations for comparison purposes. |
| (4) | In 2018, adjustments made to our preliminary analysis of the direct and indirect impact of US tax reform. |
| (5) | Based on an average number of shares outstanding of 1,252.2 million in the third quarter of 2019 and 1,247.1 million in the third quarter of 2018. |
20
| | | | | | | | | | | | |
| € million | | 9M 2019 | | | 9M 2018 | | | Change | |
Net income attributable to equity holders of Sanofi | | | 2,816 | | | | 4,052 | | | | (30.5 | )% |
Amortization of intangible assets(1) | | | 1,636 | | | | 1,536 | | | | | |
Impairment of intangible assets(2) | | | 2,023 | | | | 292 | | | | | |
Fair value remeasurement of contingent consideration | | | (242 | ) | | | (117 | ) | | | | |
Expenses arising from the impact of acquisitions on inventories | | | 3 | | | | 114 | | | | | |
Other expenses related to business combinations | | | — | | | | 19 | | | | | |
Restructuring costs and similar items | | | 904 | | | | 715 | | | | | |
Other gains and losses, and litigation(3) | | | (260 | ) | | | (509 | ) | | | | |
Effects of IFRS 16 on Lease contracts(4) | | | 13 | | | | — | | | | | |
Tax effect of the items listed above: | | | (1,279 | ) | | | (622 | ) | | | | |
Amortization and impairment of intangible assets | | | (906 | ) | | | (451 | ) | | | | |
Fair value remeasurement of contingent consideration | | | 4 | | | | 35 | | | | | |
Expenses arising from the impact of acquisitions on inventories | | | — | | | | (27 | ) | | | | |
Restructuring costs and similar items | | | (247 | ) | | | (215 | ) | | | | |
Other tax effects | | | (130 | ) | | | 36 | | | | | |
Other tax items(5) | | | — | | | | (132 | ) | | | | |
Share of items listed above attributable tonon-controlling interests | | | (3 | ) | | | (1 | ) | | | | |
Restructuring costs of associates and joint ventures, and expenses arising from the impact of acquisitions on associates and joint ventures | | | 94 | | | | 104 | | | | | |
Animal Health items | | | 100 | | | | 4 | | | | | |
Business net income | | | 5,805 | | | | 5,455 | | | | 6.4 | % |
IFRS earnings per share(6)(in euros) | | | 2.25 | | | | 3.25 | | | | | |
| (1) | Of which related to amortization expense generated by the remeasurement of intangible assets as part of business combinations: €1,556 million in the nine first months of 2019 and €1,437 million in the nine first months of 2018. |
| (2) | In 2019, €1,835 million mainly related to Eloctate impairment. |
| (3) | In 2019, mainly related to litigation. In 2018,pre-tax capital gain arising on the divestment of European Generics business (completed September 30, 2018). |
| (4) | Impact of new lease standard IFRS 16, is effective January 1, 2019 using the modified retrospective transition method (no restatement of prior periods), since Business Net Income remains reported as previously under IAS 17 and related interpretations for comparison purposes. |
| (5) | In 2018, adjustment made to our preliminary analysis of the direct and indirect impacts of US tax reform. |
| (6) | Based on an average number of shares outstanding of 1,248.9 million in the nine first months of 2019 and 1,247.6 million in the nine first months of 2018. |
21
Appendix 5: Currency sensitivity
2019 business EPS currency sensitivity
| | | | |
| Currency | | Variation | | Business EPS Sensitivity |
U.S. Dollar | | +0.05 USD/EUR | | -EUR 0.10 |
Japanese Yen | | +5 JPY/EUR | | -EUR 0.02 |
Chinese Yuan | | +0.2 CNY/EUR | | -EUR 0.02 |
Brazilian Real | | +0.4 BRL/EUR | | -EUR 0.01 |
Russian Ruble | | +10 RUB/EUR | | -EUR 0.03 |
Currency exposure on Q3 2019 sales
| | | | |
| Currency | | Q3 2019 | |
US $ | | | 39.7 | % |
Euro € | | | 20.5 | % |
Chinese Yuan | | | 7.8 | % |
Japanese Yen | | | 4.7 | % |
Brazilian Real | | | 2.6 | % |
Mexican Peso | | | 1.8 | % |
Russian Ruble | | | 1.6 | % |
British Pound | | | 1.5 | % |
Canadian $ | | | 1.5 | % |
Australian $ | | | 1.3 | % |
Others | | | 17.0 | % |
Currency average rates
| | | | | | | | | | | | |
| | | Q3 2018 | | | Q3 2019 | | | Change | |
€/$ | | | 1.16 | | | | 1.11 | | | | -4.4 | % |
€/Yen | | | 129.66 | | | | 119.33 | | | | -8.0 | % |
€/Yuan | | | 7.92 | | | | 7.81 | | | | -1.4 | % |
€/Real | | | 4.60 | | | | 4.42 | | | | -4.1 | % |
€/Ruble | | | 76.28 | | | | 71.86 | | | | -5.8 | % |
22
Appendix 6: R&D Pipeline
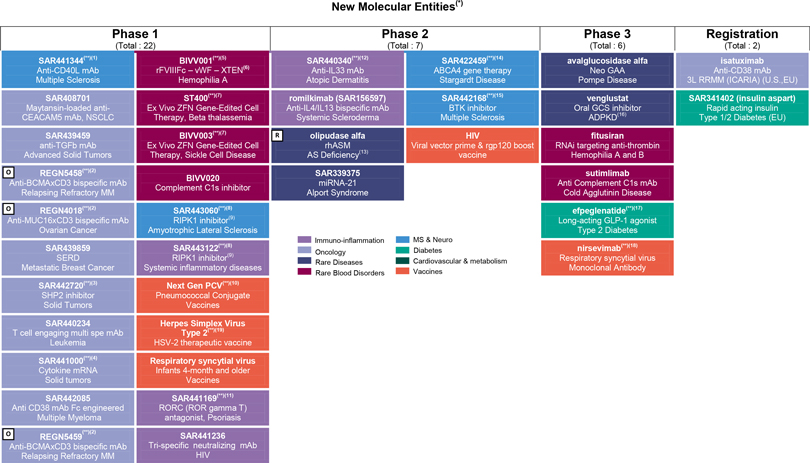
Phase 1 (Total : 22) Phase 2 (Total : 7) Phase 3 (Total : 6) Registration (Total : 2) SAR441344(**)(1) Anti-CD40L mAb Multiple Sclerosis BIVV001(**)(5) rFVIIIFc - vWF -Hemophilia A SAR440340(**)(12) Anti-IL33 mAb Atopic Dermatitis SAR422459(**)(14) ABCA4 gene therapy Stargardt Disease avalglucosidase alfa Neo GAA Pompe Disease isatuximab Anti-CD38 mAb 3L RRMM (ICARIA) (U.S.,EU) SAR408701 Maytansin-loaded anti-CEACAM5 mAb, NSCLC ST400(**)(7) Ex Vivo ZFN Gene-Edited Cell Therapy, Beta thalassemia romilkimab (SAR156597) Anti-IL4/IL13 bispecific mAb Systemic Scleroderma SAR442168(**)(15) BTK inhibitor Multiple Sclerosis venglustat Oral GCS inhibitor ADPKD(16) SAR341402 (insulin aspart) Rapid acting insulin Type 1/2 Diabetes (EU) SAR439459 anti-TGFb mAb Advanced Solid Tumors BIVV003(**)(7) Ex Vivo ZFN Gene-Edited Cell Therapy, Sickle Cell Disease olipudase alfa rhASM AS Deficiency(13) HIV Viral vector prime & rgp120 boost vaccine fitusiran RNAi targeting anti-thrombin Hemophilia A and B REGN5458(**)(2) Anti-BCMAxCD3 bispecific mAb Relapsing Refractory MM BIVV020 Complement C1s inhibitor SAR339375 miRNA-21 Alport Syndrome sutimlimab Anti Complement C1s mAb Cold Agglutinin Disease REGN4018(**)(2) Anti-MUC16xCD3 bispecific mAb Ovarian Cancer SAR443060(**)(8) RIPK1 inhibitor(9) Amyotrophic Lateral Sclerosis efpeglenatide(**)(17) Long-acting GLP-1 agonist Type 2 Diabetes SAR439859 SERD Metastatic Breast Cancer SAR443122(**)(8) RIPK1 inhibitor(9) Systemic inflammatory diseases nirsevimab(**)(18) Respiratory syncytial virus Monoclonal Antibody SAR442720(**)(3) SHP2 inhibitor Solid Tumors Next Gen PCV(**)(10) Pneumococcal Conjugate Vaccines SAR440234 T cell engaging multi spe mAb Leukemia Herpes Simplex Virus Type 2(**)(19) HSV-2 therapeutic vaccine SAR441000(**)(4) Cytokine mRNA Solid tumors Respiratory syncytial virus Infants 4-month and older Vaccines SAR442085 Anti CD38 mAb Fc engineered Multiple Myeloma SAR441169(**)(11) RORC (ROR gamma T) antagonist, PsoriasisREGN5459(**)(2) Anti-BCMAxCD3 bispecific mAb Relapsing Refractory MM SAR441236 Tri-specific neutralizing mAb HIV (1) Developed in collaboration with Immunext (2) Regeneron product for which Sanofi has opt-in rights (3) Developed in collaboration with Revolution Medicines (4) Developed in collaboration with BioNtech (5) Developed in collaboration with SOBI (6) Recombinant Coagulation Factor VIII Fc - von Willebrand Factor - XTEN Fusion protein (7) Developed in collaboration with Sangamo (8) Developed in collaboration with Denali (9) Receptor-interacting serine/threonine-protein kinase 1 (10) Developed in collaboration with SK (11) Developed in collaboration with Lead Pharma (12) Developed in collaboration with Regeneron (13) Acid Sphingomyelinase Deficiency also known as Niemann Pick type B (14) Identification of out-licensing partner ongoing (15) Developed in collaboration with Principia (16) Autosomal Dominant Polycystic Kidney Disease (17) Developed in collaboration with Hanmi (18) Developed in collaboration with AstraZeneca (19) Developed in collaboration with Immune Design/Merck O : Opt-in rights products for which rights have not been exercised yet R : Registrational Study (other than Phase 3) (*) Phase of projects determined by clinicaltrials.gov disclosure timing when relevant (**) Partnered and/or in collaboration - Sanofi may have limited or shared rights on some of these products mAb = monoclonal antibody; MM = Multiple Myeloma; RR = Relapsing Refractory; GCS = glucosylceramide synthase
| (1) | Developed in collaboration with Immunext |
| (2) | Regeneron product for which Sanofi hasopt-in rights |
| (3) | Developed in collaboration with Revolution Medicines |
| (4) | Developed in collaboration with BioNtech |
| (5) | Developed in collaboration with SOBI |
| (6) | Recombinant Coagulation Factor VIII Fc – von Willebrand Factor – XTEN Fusion protein |
| (7) | Developed in collaboration with Sangamo |
| (8) | Developed in collaboration with Denali |
| (9) | Receptor-interacting serine/threonine-protein kinase 1 |
| (10) | Developed in collaboration with SK |
| (11) | Developed in collaboration with Lead Pharma |
| (12) | Developed in collaboration with Regeneron |
| (13) | Acid Sphingomyelinase Deficiency also known as Niemann Pick type B |
| (14) | Identification ofout-licensing partner ongoing |
| (15) | Developed in collaboration with Principia |
| (16) | Autosomal Dominant Polycystic Kidney Disease |
| (17) | Developed in collaboration with Hanmi |
| (18) | Developed in collaboration with AstraZeneca |
| (19) | Developed in collaboration with Immune Design/Merck |
| O : | Opt-in rights products for which rights have not been exercised yet |
| R : | Registrational Study (other than Phase 3) |
| (*) | Phase of projects determined by clinicaltrials.gov disclosure timing when relevant |
| (**) | Partnered and/or in collaboration – Sanofi may have limited or shared rights on some of these products |
mAb = monoclonal antibody; MM = Multiple Myeloma; RR = Relapsing Refractory; GCS = glucosylceramide synthase
23
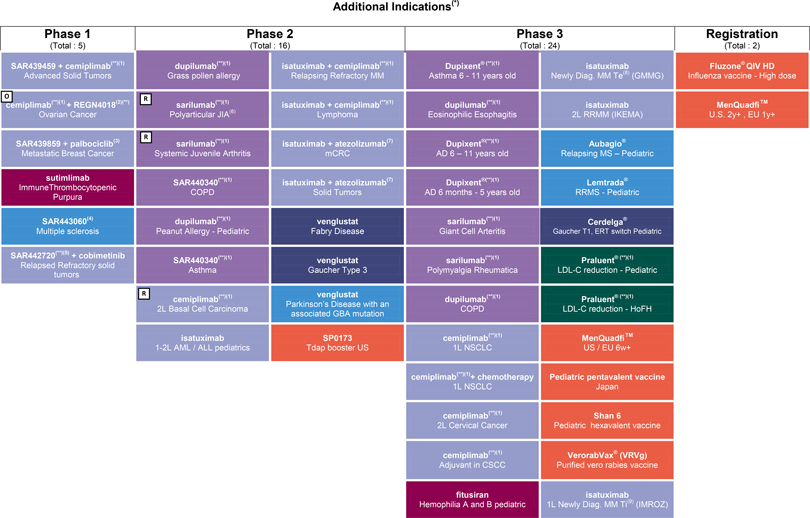
Phase 1 (Total : 5) Phase 2 (Total : 16) Phase 3 (Total : 24) Registration (Total : 2) SAR439459 + cemiplimab(**)(1) Advanced Solid Tumors dupilumab(**)(1) Grass pollen allergy isatuximab + cemiplimab(**)(1) Relapsing Refractory MM Dupixent(R) (**)(1) Asthma 6 - 11 years old isatuximab Newly Diag. MM Te(8) (GMMG) Fluzone(R) QIV HD Influenza vaccine - High dose cemiplimab(**)(1) + REGN4018(2)(**) Ovarian Cancer sarilumab(**)(1) Polyarticular JIA(6) isatuximab + cemiplimab(**)(1) Lymphoma dupilumab(**)(1) Eosinophilic Esophagitis isatuximab 2L RRMM (IKEMA) MenQuadfi TM U.S. 2y+ , EU 1y+ SAR439859 + palbociclib(3) Metastatic Breast Cancer sarilumab(**)(1) Systemic Juvenile Arthritis isatuximab + atezolizumab(7) mCRC Dupixent(R)(**)(1) AD 6 - 11 years old Aubagio(R) Relapsing MS - Pediatric sutimlimab ImmuneThrombocytopenic Purpura SAR440340(**)(1) COPD isatuximab + atezolizumab(7) Solid Tumors Dupixent(R)(**)(1) AD 6 months - 5 years old Lemtrada(R) RRMS - Pediatric SAR443060(4) Multiple sclerosis dupilumab(**)(1) Peanut Allergy - Pediatric venglustat Fabry Disease sarilumab(**)(1) Giant Cell Arteritis Cerdelga(R) Gaucher T1, ERT switch Pediatric SAR442720(**)(5) + cobimetinib Relapsed Refractory solid tumors SAR440340(**)(1) Asthma venglustat Gaucher Type 3 sarilumab(**)(1) Polymyalgia Rheumatica Praluent(R) (**)(1) LDL-C reduction - Pediatric cemiplimab(**)(1) 2L Basal Cell Carcinoma venglustat Parkinson's Disease with an associated GBA mutation dupilumab(**)(1) COPD Praluent(R) (**)(1) LDL-C reduction - HoFH isatuximab 1-2L AML / ALL pediatrics SP0173 Tdap booster US cemiplimab(**)(1) 1L NSCLC MenQuadfi TM US / EU 6w+ cemiplimab(**)(1)+ chemotherapy 1L NSCLC Pediatric pentavalent vaccine Japan cemiplimab(**)(1) 2L Cervical Cancer Shan 6 Pediatric hexavalent vaccine cemiplimab(**)(1) Adjuvant in CSCC VerorabVax(R) (VRVg) Purified vero rabies vaccine fitusiran Hemophilia A and B pediatric isatuximab 1L Newly Diag. MM Ti(9) (IMROZ) (1) Developed in collaboration with Regeneron (2) Regeneron product for which Sanofi has opt-in rights (3) Pfizer product (palbociclib) (4) Developed in collaboration with Denali (5) Developed in collaboration with Revolution Medicines - cobimetinib is a Genentech product (6) Polyarticular JIA = Polyarticular Juvenile Idiopathic Arthritis (7) Studies in collaboration with Genentech Inc. (atezolizumab) (8) Transplant eligible (9) Transplant ineligible (*) Phase of projects determined by clinicaltrials.gov disclosure timing when relevant (**) Partnered and/or in collaboration - Sanofi may have limited or shared rights on some of these products O : Opt-in rights products for which rights have not been exercised yet R : Registrational Study (other than Phase 3) COPD = chronic obstructive pulmonary disease; AML = acute myeloid leukemia; ALL = acute lymphoblastic leukemia; MM = multiple myloma;RRMS = Relapsing / Remitting Multiple Sclerosis
| (1) | Developed in collaboration with Regeneron |
| (2) | Regeneron product for which Sanofi hasopt-in rights |
| (3) | Pfizer product (palbociclib) |
| (4) | Developed in collaboration with Denali |
| (5) | Developed in collaboration with Revolution Medicines - cobimetinib is a Genentech product |
| (6) | Polyarticular JIA = Polyarticular Juvenile Idiopathic Arthritis |
| (7) | Studies in collaboration with Genentech Inc. (atezolizumab) |
| (*) | Phase of projects determined by clinicaltrials.gov disclosure timing when relevant |
| (**) | Partnered and/or in collaboration - Sanofi may have limited or shared rights on some of these products |
| O : | Opt-in rights products for which rights have not been exercised yet |
| R : | Registrational Study (other than Phase 3) |
COPD = chronic obstructive pulmonary disease; AML = acute myeloïd leukemia; ALL = acute lymphoblastic leukemia; MM = multiple myloma;RRMS = Relapsing / Remitting Multiple Sclerosis
24
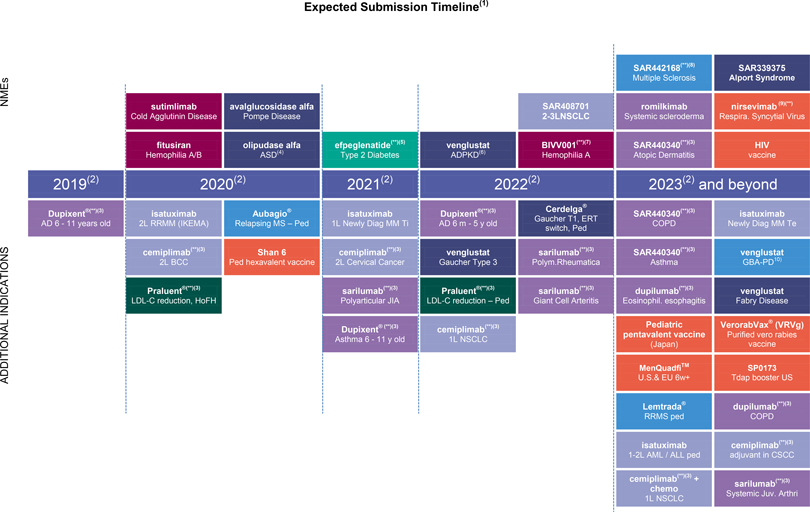
NMEs SAR442168(**)(8) Multiple Sclerosis SAR339375 Alport Syndrome sutimlimab Cold Agglutinin Disease avalglucosidase alfa Pompe Disease SAR408701 2-3LNSCLC romilkimab Systemic scleroderma nirsevimab (9)(**) Respira. Syncytial Virus fitusiran Hemophilia A/B olipudase alfa ASD(4) efpeglenatide(**)(5) Type 2 Diabetes venglustat ADPKD(6) BIVV001(**)(7) Hemophilia A SAR440340(**)(3) Atopic Dermatitis HIV vaccine 2019(2) 2020(2) 2021(2) 2022(2) 2023(2) and beyond ADDITIONAL INDICATIONS Dupixent(R)(**)(3) AD 6 - 11 years old isatuximab 2L RRMM (IKEMA) Aubagio(R) Relapsing MS - Ped isatuximab 1L Newly Diag MM Ti Dupixent(R)(**)(3) AD 6 m - 5 y old Cerdelga(R) Gaucher T1, ERT switch, Ped SAR440340(**)(3) COPD isatuximab Newly Diag MM Te cemiplimab(**)(3) 2L BCC Shan 6 Ped hexavalent vaccine cemiplimab(**)(3) 2L Cervical Cancer venglustat Gaucher Type 3 sarilumab(**)(3) Polym.Rheumatica SAR440340(**)(3) Asthma venglustat GBA-PD10) Praluent(R)(**)(3) LDL-C reduction, HoFH sarilumab(**)(3) Polyarticular JIA Praluent(R)(**)(3) LDL-C reduction - Ped sarilumab(**)(3) Giant Cell Arteritis dupilumab(**)(3) Eosinophil. esophagitis venglustat Fabry Disease Dupixent(R) (**)(3) Asthma 6 - 11 y old cemiplimab(**)(3) 1L NSCLC Pediatric pentavalent vaccine (Japan) VerorabVax(R) (VRVg) Purified vero rabies vaccine MenQuadfiTM U.S.& EU 6w+ SP0173 Tdap booster US Lemtrada(R) RRMS ped dupilumab(**)(3) COPD isatuximab 1-2L AML / ALL ped cemiplimab(**)(3) adjuvant in CSCC cemiplimab(**)(3) + chemo 1L NSCLC sarilumab(**)(3) Systemic Juv. Arthri
| (1) | Excluding Phase 1 without POC |
| (2) | Projects within a specified year are not arranged by submission timing |
| (3) | Developed in collaboration with Regeneron |
| (4) | Acid Sphingomyelinase Deficiency |
| (5) | Developed in collaboration with Hanmi |
| (6) | Autosomal Dominant Polycystic Kidney Disease |
| (7) | Developed in collaboration with SOBI |
| (8) | Developed in collaboration with Principia |
| (9) | Developed in collaboration with AstraZeneca |
| (10) | Parkinson’s Disease with an associated GBA mutation |
| (**) | Partnered and/or in collaboration – Sanofi may have limited or shared rights on some of these products |
25
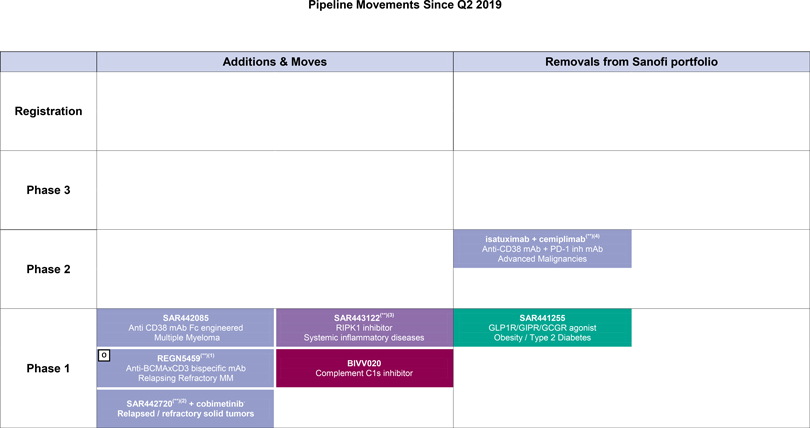
Additions & Moves Removals from Sanofi portfolio Registration Phase 3 Phase 2 isatuximab + cemiplimab(**)(4) Anti-CD38 mAb + PD-1 inh mAb Advanced Malignancies Phase 1 SAR442085 Anti CD38 mAb Fc engineered Multiple Myeloma SAR443122(**)(3) RIPK1 inhibitor Systemic inflammatory diseases SAR441255 GLP1R/GIPR/GCGR agonist Obesity / Type 2 Diabetes REGN5459(**)(1) Anti-BCMAxCD3 bispecific mAb Relapsing Refractory MM BIVV020 Complement C1s inhibitor SAR442720(**)(2) + cobimetinib. Relapsed / refractory solid tumors
| (1) | Regeneron product for which Sanofi hasopt-in rights |
| (2) | Developed in collaboration with Revolution Medicines |
| (3) | Developed in collaboration with Denali |
| (4) | Developed in collaboration with Regeneron |
| (**) | Partnered and/or in collaboration – Sanofi may have limited or shared rights on some of these products |
| O : | Opt-in rights products for which rights have not been exercised yet |
26
Appendix 7: Expected R&D milestones
| | | | |
| Products | | Expected milestones | | Timing |
Fluzone®QIV HD | | U.S. regulatory decision for³65-year old age group | | Q4 2019 |
sutimlimab | | Pivotal trialread-out in Cold Agglutinin Disease | | Q4 2019 |
SAR439859 (SERD) | | Proof of concept studyread-out in 3L metastatic Breast Cancer | | Q4 2019 |
sutimlimab | | Proof of concept studyread-out in ITP | | Q4 2019 |
SAR440340(**)(1) (anti-IL33 mAb) | | Proof of concept studyread-out in Chronic Obstructive Pulmonary Disease | | Q4 2019 |
isatuximab | | Pivotal trialread-out in 2L Relapsed-Refractory Multiple Myeloma (IKEMA) | | Q1 2020 |
olipudase alfa | | Pivotal trialread-out in Acid Sphingomyelinase Deficiency(3) | | Q1 2020 |
SAR442168(2)(**)(BTKi) | | Proof of concept studyread-out in Relapsing Multiple Sclerosis | | Q1 2020 |
cemiplimab | | Pivotal trialread-out in 2L Basal Cell Carcinoma | | H1 2020 |
isatuximab | | U.S./ EU regulatory decisions in 3L Relapsed-Refractory Multiple Myeloma | | Q2 2020 |
MenQuadfi™ | | U.S. regulatory decision for³ 2 year old age group | | Q2 2020 |
Fluzone®QIV HD | | EU regulatory decision for³65-years old age group | | Q2 2020 |
avalglucosidase alfa | | Pivotal trialread-out in Late Onset Pompe Disease | | Q2 2020 |
SAR440340(**)(1) (anti-IL33 mAb) | | Proof of concept studyread-out in Atopic Dermatitis | | Q3 2020 |
| (1) | Developed in collaboration with Regeneron |
| (2) | Developed in collaboration with Principia |
| (3) | Also known as Niemann Pick type B |
| (**) | Partnered and/or in collaboration – Sanofi may have limited or shared rights on some of these products |
QIV: Quadrivalent Influenza Vaccine; HD: High-Dose; ITP = ImmuneThrombocytopenic Purpura
27
Appendix 8: Definitions ofnon-GAAP financial indicators
Company
“Company” corresponds to Sanofi and its subsidiaries.
Company sales at constant exchange rates (CER)
When we refer to changes in our net sales “at constant exchange rates” (CER), this means that we exclude the effect of changes in exchange rates.
We eliminate the effect of exchange rates by recalculating net sales for the relevant period at the exchange rates used for the previous period.
Reconciliation of net sales to Company sales at constant exchange rates for the third quarter and first nine months of 2019
| | | | | | | | |
| € million | | Q3 2019 | | | 9M 2019 | |
Net sales | | | 9,499 | | | | 26,518 | |
Effect of exchange rates | | | 215 | | | | 504 | |
Company sales at constant exchange rates | | | 9,284 | | | | 26,014 | |
Business net income
Sanofi publishes a keynon-GAAP indicator.
Business net income is defined as net income attributable to equity holders of Sanofi excluding:
| | • | | amortization of intangible assets, |
| | • | | impairment of intangible assets, |
| | • | | fair value remeasurement of contingent consideration related to business combinations or to disposals, |
| | • | | other impacts associated with acquisitions (including impacts of acquisitions on associates and joint ventures), |
| | • | | restructuring costs and similar items(1), |
| | • | | other gains and losses (including gains and losses on disposals ofnon-current assets(1)), |
| | • | | effects of IFRS16 on lease accounting, |
| | • | | costs or provisions associated with litigation(1), |
| | • | | tax effects related to the items listed above as well as effects of major tax disputes, |
| | • | | net income attributable tonon-controlling interestsrelated to the items listed above, |
| (1) | Reported in the line itemsRestructuring costs and similar items andGains and losses on disposals, and litigation, which are defined in Notes B.19. and B.20. to our consolidated financial statements. |
28