UNITED STATES
SECURITIES AND EXCHANGE COMMISSION
Washington, D.C. 20549
Form N-CSR
CERTIFIED SHAREHOLDER REPORT OF REGISTERED
MANAGEMENT INVESTMENT COMPANIES
Investment Company Act File Number: 811-10067
Eaton Vance Variable Trust
(Exact Name of Registrant as Specified in Charter)
Two International Place, Boston, Massachusetts 02110
(Address of Principal Executive Offices)
Maureen A. Gemma
Two International Place, Boston, Massachusetts 02110
(Name and Address of Agent for Services)
(617) 482-8260
(Registrant’s Telephone Number)
December 31
Date of Fiscal Year End
June 30, 2017
Date of Reporting Period
Item 1. Reports to Stockholders

Eaton Vance
VT Floating-Rate Income Fund
Semiannual Report
June 30, 2017

Commodity Futures Trading Commission Registration. Effective December 31, 2012, the Commodity Futures Trading Commission (“CFTC”) adopted certain regulatory changes that subject registered investment companies and advisers to regulation by the CFTC if a fund invests more than a prescribed level of its assets in certain CFTC-regulated instruments (including futures, certain options and swap agreements) or markets itself as providing investment exposure to such instruments. The Fund has claimed an exclusion from the definition of the term “commodity pool operator” under the Commodity Exchange Act. Accordingly, neither the Fund nor the adviser with respect to the operation of the Fund is subject to CFTC regulation. Because of its management of other strategies, the Fund’s adviser is registered with the CFTC as a commodity pool operator and a commodity trading advisor.
Fund shares are not insured by the FDIC and are not deposits or other obligations of, or guaranteed by, any depository institution. Shares are subject to investment risks, including possible loss of principal invested.
This report is prepared for the general information of contract owners. It is authorized for distribution to prospective investors only when preceded or accompanied by a current summary prospectus or prospectus. Before investing, investors should consider carefully the investment objective, risks, and charges and expenses of the Fund. This and other important information is contained in the summary prospectus and prospectus, which can be obtained from a financial advisor. Prospective investors should read the prospectus carefully before investing. For further information, please call 1-800-262-1122.
Semiannual Report June 30, 2017
Eaton Vance
VT Floating-Rate Income Fund
Table of Contents
| | | | |
Performance | | | 2 | |
| |
Fund Profile | | | 2 | |
| |
Endnotes and Additional Disclosures | | | 3 | |
| |
Fund Expenses | | | 4 | |
| |
Financial Statements | | | 5 | |
| |
Board of Trustees’ Contract Approval | | | 30 | |
| |
Officers and Trustees | | | 34 | |
| |
Important Notices | | | 35 | |
Eaton Vance
VT Floating-Rate Income Fund
June 30, 2017
Performance1,2
Portfolio Managers Scott H. Page, CFA, Craig P. Russ and Andrew Sveen, CFA
| | | | | | | | | | | | | | | | | | | | | | | | |
| % Average Annual Total Returns | | Class
Inception Date | | | Performance
Inception Date | | | Six Months | | | One Year | | | Five Years | | | Ten Years | |
Initial Class at NAV | | | 05/02/2001 | | | | 05/02/2001 | | | | 1.79 | % | | | 6.44 | % | | | 3.52 | % | | | 3.62 | % |
ADV Class at NAV | | | 04/15/2014 | | | | 05/02/2001 | | | | 1.81 | | | | 6.70 | | | | 3.66 | | | | 3.69 | |
Institutional Class at NAV | | | 05/02/2016 | | | | 05/02/2001 | | | | 1.93 | | | | 7.04 | | | | 3.73 | | | | 3.73 | |
S&P/LSTA Leveraged Loan Index | | | — | | | | — | | | | 1.91 | % | | | 7.42 | % | | | 4.58 | % | | | 4.48 | % |
| | | | | | |
| | | | | | | | | | | | | | | | | | | | | | | | |
| % Total Annual Operating Expense Ratios3 | | | | | | | | | | | Initial
Class | | | ADV
Class | | | Institutional
Class | |
| | | | | | | | | | | | | | | 1.19 | % | | | 0.95 | % | | | 0.69 | % |
Fund Profile
Top 10 Issuers (% of total investments)4
| | | | |
| |
Valeant Pharmaceuticals International, Inc. | | | 1.3 | % |
| |
Reynolds Group Holdings, Inc. | | | 1.2 | |
| |
Calpine Corporation | | | 1.1 | |
| |
Virgin Media Bristol, LLC | | | 1.0 | |
| |
Envision Healthcare Corporation | | | 1.0 | |
| |
TransDigm, Inc. | | | 1.0 | |
| |
Asurion, LLC | | | 1.0 | |
| |
Albertsons, LLC | | | 0.9 | |
| |
Change Healthcare Holdings, Inc. | | | 0.9 | |
| |
Univision Communications, Inc. | | | 0.9 | |
| | | | | |
| |
Total | | | 10.3 | % |
Top 10 Sectors (% of total investments)4
| | | | |
| |
Health Care | | | 10.3 | % |
| |
Electronics/Electrical | | | 9.6 | |
| |
Business Equipment and Services | | | 8.4 | |
| |
Telecommunications | | | 4.8 | |
| |
Lodging and Casinos | | | 4.7 | |
| |
Drugs | | | 4.6 | |
| |
Chemicals and Plastics | | | 4.6 | |
| |
Industrial Equipment | | | 4.4 | |
| |
Retailers (Except Food and Drug) | | | 4.3 | |
| |
Cable and Satellite Television | | | 3.5 | |
| | | | | |
| |
Total | | | 59.2 | % |
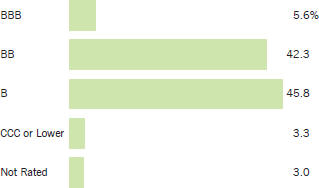
Credit Quality (% of bond and loan holdings)5
See Endnotes and Additional Disclosures in this report.
Past performance is no guarantee of future results. Returns are historical and are calculated by determining the percentage change in net asset value (NAV) or offering price (as applicable) with all distributions reinvested. Investment return and principal value will fluctuate so that shares, when redeemed, may be worth more or less than their original cost. Performance less than or equal to one year is cumulative. Performance is for the stated time period only; due to market volatility, the Fund’s current performance may be lower or higher than quoted. Returns are before taxes unless otherwise noted.
Eaton Vance
VT Floating-Rate Income Fund
June 30, 2017
Endnotes and Additional Disclosures
| 1 | S&P/LSTA Leveraged Loan Index is an unmanaged index of the institutional leveraged loan market. Unless otherwise stated, index returns do not reflect the effect of any applicable sales charges, commissions, expenses, taxes or leverage, as applicable. It is not possible to invest directly in an index. |
| 2 | There is no sales charge. Insurance-related charges are not included in the calculation of returns. If such charges were reflected, the returns would be lower. Please refer to the report for your insurance contract for performance data reflecting insurance-related charges. |
| | Performance prior to the inception date of a class may be linked to the performance of an older class of the Fund. This linked performance is not adjusted for class expense differences. If adjusted for such differences, the performance would be different. The performance of ADV Class is linked to Initial Class and the performance of Institutional Class is linked to ADV Class. Performance since inception for an index, if presented, is the performance since the Fund’s or oldest share class’ inception, as applicable. Performance presented in the Financial Highlights included in the financial statements is not linked. |
| 3 | Source: Fund prospectus. The expense ratios for the current reporting period can be found in the Financial Highlights section of this report. |
| 4 | Excludes cash and cash equivalents. |
| 5 | Credit ratings are categorized using S&P. Ratings, which are subject to change, apply to the creditworthiness of the issuers of the underlying securities and not to the Fund or its shares. Credit ratings measure the quality of a bond based on the issuer’s creditworthiness, with ratings ranging from AAA, being the highest, to D, being the lowest based on S&P’s measures. Ratings of BBB or higher by S&P are considered to be investment- grade quality. Credit ratings are based largely on the ratings agency’s analysis at the time of rating. The rating assigned to any particular security is not necessarily a reflection of the issuer’s current financial condition and does not necessarily reflect its assessment of the volatility of a security’s market value or of the liquidity of an investment in the security. Holdings designated as “Not Rated” are not rated by S&P. |
| | Fund profile subject to change due to active management. |
Eaton Vance
VT Floating-Rate Income Fund
June 30, 2017
Fund Expenses
Example: As a Fund shareholder, you incur ongoing costs, including management fees; distribution and/or service fees; and other Fund expenses. This Example is intended to help you understand your ongoing costs (in dollars) of Fund investing and to compare these costs with the ongoing costs of investing in other mutual funds. The Example is based on an investment of $1,000 invested at the beginning of the period and held for the entire period (January 1, 2017 – June 30, 2017).
Actual Expenses: The first section of the table below provides information about actual account values and actual expenses. You may use the information in this section, together with the amount you invested, to estimate the expenses that you paid over the period. Simply divide your account value by $1,000 (for example, an $8,600 account value divided by $1,000 = 8.6), then multiply the result by the number in the first section under the heading entitled “Expenses Paid During Period” to estimate the expenses you paid on your account during this period.
Hypothetical Example for Comparison Purposes: The second section of the table below provides information about hypothetical account values and hypothetical expenses based on the actual Fund expense ratio and an assumed rate of return of 5% per year (before expenses), which is not the actual Fund return. The hypothetical account values and expenses may not be used to estimate the actual ending account balance or expenses you paid for the period. You may use this information to compare the ongoing costs of investing in your Fund and other funds. To do so, compare this 5% hypothetical example with the 5% hypothetical examples that appear in the shareholder reports of the other funds.
Please note that the expenses shown in the table are meant to highlight your ongoing costs only and do not reflect expenses and charges which are, or may be imposed under the variable annuity contract or variable life insurance policy (variable contracts) (if applicable) through which your investment in the Fund is made. Therefore, the second section of the table is useful in comparing ongoing costs associated with an investment in vehicles which fund benefits under variable contracts and to qualified pension and retirement plans, and will not help you determine the relative total costs of investing in the Fund through variable contracts. In addition, if these expenses and charges imposed under the variable contracts were included, your costs would be higher.
| | | | | | | | | | | | | | | | |
| | | Beginning
Account Value
(1/1/17) | | | Ending
Account Value
(6/30/17) | | | Expenses Paid
During Period*
(1/1/17 – 6/30/17) | | | Annualized
Expense
Ratio | |
| | | | |
| | | | | | | | | | | | | | | | |
Actual | | | | | | | | | | | | | |
Initial Class | | $ | 1,000.00 | | | $ | 1,017.90 | | | $ | 5.85 | | | | 1.17 | % |
ADV Class | | $ | 1,000.00 | | | $ | 1,018.10 | | | $ | 4.60 | | | | 0.92 | % |
Institutional Class | | $ | 1,000.00 | | | $ | 1,019.30 | | | $ | 3.35 | | | | 0.67 | % |
| | | | | | | | | | | | | | | | | |
| | | | |
| | | | | | | | | | | | | | | | |
Hypothetical | | | | | | | | | | | | | | | | |
(5% return per year before expenses) | | | | | | | | | | | | | | | | |
Initial Class | | $ | 1,000.00 | | | $ | 1,019.00 | | | $ | 5.86 | | | | 1.17 | % |
ADV Class | | $ | 1,000.00 | | | $ | 1,020.20 | | | $ | 4.61 | | | | 0.92 | % |
Institutional Class | | $ | 1,000.00 | | | $ | 1,021.50 | | | $ | 3.36 | | | | 0.67 | % |
| * | Expenses are equal to the Fund’s annualized expense ratio for the indicated Class, multiplied by the average account value over the period, multiplied by 181/365 (to reflect the one-half year period). The Example assumes that the $1,000 was invested at the net asset value per share determined at the close of business on December 31, 2016. Expenses shown do not include insurance-related charges. |
Eaton Vance
VT Floating-Rate Income Fund
June 30, 2017
Portfolio of Investments (Unaudited)
| | | | | | | | |
| Senior Floating-Rate Loans — 91.1%(1) | |
| | |
| | | | | | | | |
| Borrower/Tranche Description | | Principal
Amount
(000’s omitted) | | | Value | |
| | | | | | | | |
|
Aerospace and Defense — 1.8% | |
IAP Worldwide Services, Inc. | | | | | | | | |
Revolving Loan, 1.38%, Maturing July 18, 2018(2) | | $ | 133 | | | $ | 131,161 | |
Term Loan - Second Lien, 8.00%, Maturing July 18, 2019(3) | | | 178 | | | | 142,350 | |
Silver II US Holdings, LLC | | | | | | | | |
Term Loan, 4.23%, Maturing December 13, 2019 | | | 3,134 | | | | 3,114,452 | |
TransDigm, Inc. | | | | | | | | |
Term Loan, 4.28%, Maturing February 28, 2020 | | | 3,141 | | | | 3,146,013 | |
Term Loan, 4.29%, Maturing June 4, 2021 | | | 1,164 | | | | 1,165,455 | |
Term Loan, 4.23%, Maturing June 9, 2023 | | | 2,222 | | | | 2,222,175 | |
Wesco Aircraft Hardware Corp. | | | | | | | | |
Term Loan, 4.23%, Maturing October 4, 2021 | | | 1,612 | | | | 1,614,707 | |
| | | | | | | | | |
| | | $ | 11,536,313 | |
| | | | | | | | | |
|
Automotive — 2.3% | |
American Axle and Manufacturing, Inc. | | | | | | | | |
Term Loan, 3.47%, Maturing April 6, 2024 | | $ | 2,277 | | | $ | 2,268,177 | |
CS Intermediate Holdco 2, LLC | | | | | | | | |
Term Loan, 3.55%, Maturing October 26, 2023 | | | 1,659 | | | | 1,662,037 | |
Dayco Products, LLC | | | | | | | | |
Term Loan, 6.18%, Maturing May 19, 2023 | | | 775 | | | | 774,031 | |
FCA US, LLC | | | | | | | | |
Term Loan, 3.16%, Maturing December 31, 2018 | | | 1,308 | | | | 1,316,184 | |
Federal-Mogul Holdings Corporation | | | | | | | | |
Term Loan, 4.93%, Maturing April 15, 2021 | | | 2,717 | | | | 2,727,651 | |
Goodyear Tire & Rubber Company (The) | | | | | | | | |
Term Loan - Second Lien, 3.12%, Maturing April 30, 2019 | | | 1,325 | | | | 1,336,869 | |
Horizon Global Corporation | | | | | | | | |
Term Loan, 5.73%, Maturing June 30, 2021 | | | 229 | | | | 230,615 | |
Sage Automotive Holdings, Inc. | | | | | | | | |
Term Loan, 6.23%, Maturing October 27, 2022 | | | 498 | | | | 501,231 | |
TI Group Automotive Systems, LLC | | | | | | | | |
Term Loan, 3.98%, Maturing June 30, 2022 | | | 1,732 | | | | 1,733,976 | |
Tower Automotive Holdings USA, LLC | | | | | | | | |
Term Loan, 3.88%, Maturing March 7, 2024 | | | 2,140 | | | | 2,143,601 | |
Visteon Corporation | | | | | | | | |
Term Loan, 3.55%, Maturing March 24, 2024 | | | 379 | | | | 381,181 | |
| | | | | | | | | |
| | | $ | 15,075,553 | |
| | | | | | | | | |
| | | | | | | | |
| Borrower/Tranche Description | | Principal
Amount
(000’s omitted) | | | Value | |
| | | | | | | | |
|
Beverage and Tobacco — 0.2% | |
Flavors Holdings, Inc. | | | | | | | | |
Term Loan, 7.05%, Maturing April 3, 2020 | | $ | 496 | | | $ | 471,141 | |
Term Loan - Second Lien, 11.30%, Maturing October 3, 2021 | | | 1,000 | | | | 750,000 | |
| | | | | | | | | |
| | | $ | 1,221,141 | |
| | | | | | | | | |
|
Brokerage / Securities Dealers / Investment Houses — 0.4% | |
Aretec Group, Inc. | | | | | | | | |
Term Loan, 8.00%, Maturing November 23, 2020 | | $ | 549 | | | $ | 557,661 | |
Term Loan - Second Lien, 6.50%, (2.00% Cash, 4.50% PIK), Maturing May 23, 2021 | | | 1,581 | | | | 1,564,826 | |
Salient Partners L.P. | | | | | | | | |
Term Loan, 9.66%, Maturing May 19, 2021 | | | 449 | | | | 435,894 | |
| | | | | | | | | |
| | | $ | 2,558,381 | |
| | | | | | | | | |
|
Building and Development — 2.7% | |
American Builders & Contractors Supply Co., Inc. | | | | | | | | |
Term Loan, 3.73%, Maturing October 31, 2023 | | $ | 1,746 | | | $ | 1,751,565 | |
Auction.com, LLC | | | | | | | | |
Term Loan, 6.23%, Maturing May 12, 2019 | | | 635 | | | | 640,935 | |
CPG International, Inc. | | | | | | | | |
Term Loan, 5.05%, Maturing May 3, 2024 | | | 1,373 | | | | 1,374,759 | |
DTZ U.S. Borrower, LLC | | | | | | | | |
Term Loan, 4.45%, Maturing November 4, 2021 | | | 3,302 | | | | 3,306,433 | |
Henry Company, LLC | | | | | | | | |
Term Loan, 5.73%, Maturing October 5, 2023 | | | 224 | | | | 227,653 | |
Ply Gem Industries, Inc. | | | | | | | | |
Term Loan, 4.30%, Maturing February 1, 2021 | | | 1,492 | | | | 1,502,507 | |
Quikrete Holdings, Inc. | | | | | | | | |
Term Loan, 3.98%, Maturing November 15, 2023 | | | 3,586 | | | | 3,584,000 | |
RE/MAX International, Inc. | | | | | | | | |
Term Loan, 4.05%, Maturing December 15, 2023 | | | 1,949 | | | | 1,960,844 | |
Realogy Corporation | | | | | | | | |
Term Loan, 3.48%, Maturing July 20, 2022 | | | 2,142 | | | | 2,159,144 | |
Summit Materials Companies I, LLC | | | | | | | | |
Term Loan, 3.98%, Maturing July 17, 2022 | | | 368 | | | | 371,003 | |
Werner Co. | | | | | | | | |
Term Loan, Maturing June 23, 2024(4) | | | 400 | | | | 399,000 | |
WireCo WorldGroup, Inc. | | | | | | | | |
Term Loan, 6.70%, Maturing September 30, 2023 | | | 372 | | | | 375,754 | |
| | | | | | | | | |
| | | $ | 17,653,597 | |
| | | | | | | | | |
| | | | |
| | 5 | | See Notes to Financial Statements. |
Eaton Vance
VT Floating-Rate Income Fund
June 30, 2017
Portfolio of Investments (Unaudited) — continued
| | | | | | | | |
| Borrower/Tranche Description | | Principal
Amount
(000’s omitted) | | | Value | |
| | | | | | | | |
|
Business Equipment and Services — 7.9% | |
Acosta Holdco, Inc. | | | | | | | | |
Term Loan, 4.48%, Maturing September 26, 2021 | | $ | 2,080 | | | $ | 1,883,854 | |
AlixPartners, LLP | | | | | | | | |
Term Loan, 4.30%, Maturing April 4, 2024 | | | 1,421 | | | | 1,429,788 | |
Altisource Solutions S.a.r.l. | | | | | | | | |
Term Loan, 4.73%, Maturing December 9, 2020 | | | 970 | | | | 843,618 | |
Brand Energy & Infrastructure Services, Inc. | | | | | | | | |
Term Loan, 5.49%, Maturing June 21, 2024 | | | 400 | | | | 399,300 | |
Camelot UK Holdco Limited | | | | | | | | |
Term Loan, 4.73%, Maturing October 3, 2023 | | | 794 | | | | 799,634 | |
Cast and Crew Payroll, LLC | | | | | | | | |
Term Loan, 4.80%, Maturing August 12, 2022 | | | 274 | | | | 274,651 | |
CCC Information Services, Inc. | | | | | | | | |
Term Loan, 4.23%, Maturing April 27, 2024 | | | 950 | | | | 948,813 | |
Change Healthcare Holdings, Inc. | | | | | | | | |
Term Loan, 3.98%, Maturing March 1, 2024 | | | 5,786 | | | | 5,793,634 | |
Commerce Merger Sub, Inc. | | | | | | | | |
Term Loan, Maturing May 31, 2024(4) | | | 500 | | | | 500,625 | |
Corporate Capital Trust, Inc. | | | | | | | | |
Term Loan, 4.56%, Maturing May 20, 2019 | | | 605 | | | | 611,097 | |
CPM Holdings, Inc. | | | | | | | | |
Term Loan, 5.48%, Maturing April 11, 2022 | | | 172 | | | | 174,420 | |
Crossmark Holdings, Inc. | | | | | | | | |
Term Loan, 4.80%, Maturing December 20, 2019 | | | 1,243 | | | | 884,559 | |
Education Management, LLC | | | | | | | | |
Term Loan, 5.66%, Maturing July 2, 2020(3) | | | 196 | | | | 139,361 | |
Term Loan, 8.66%, Maturing July 2, 2020(3) | | | 373 | | | | 0 | |
EIG Investors Corp. | | | | | | | | |
Term Loan, 5.24%, Maturing February 9, 2023 | | | 3,637 | | | | 3,654,177 | |
Extreme Reach, Inc. | | | | | | | | |
Term Loan, 7.55%, Maturing February 7, 2020 | | | 760 | | | | 760,911 | |
First Data Corporation | | | | | | | | |
Term Loan, 3.22%, Maturing June 2, 2020 | | | 1,925 | | | | 1,928,926 | |
Term Loan, 3.47%, Maturing July 8, 2022 | | | 3,466 | | | | 3,464,943 | |
Garda World Security Corporation | | | | | | | | |
Term Loan, 5.23%, Maturing May 24, 2024 | | | 1,435 | | | | 1,443,542 | |
Global Payments, Inc. | | | | | | | | |
Term Loan, 3.23%, Maturing April 22, 2023 | | | 232 | | | | 233,099 | |
IG Investment Holdings, LLC | | | | | | | | |
Term Loan, 5.30%, Maturing October 31, 2021 | | | 1,186 | | | | 1,198,580 | |
Information Resources, Inc. | | | | | | | | |
Term Loan, 5.47%, Maturing January 18, 2024 | | | 2,494 | | | | 2,506,608 | |
ION Trading Finance Limited | | | | | | | | |
Term Loan, 4.05%, Maturing August 11, 2023 | | | 1,704 | | | | 1,694,295 | |
| | | | | | | | |
| Borrower/Tranche Description | | Principal
Amount
(000’s omitted) | | | Value | |
| | | | | | | | |
|
Business Equipment and Services (continued) | |
J.D. Power and Associates | | | | | | | | |
Term Loan, 5.55%, Maturing September 7, 2023 | | $ | 471 | | | $ | 474,384 | |
KAR Auction Services, Inc. | | | | | | | | |
Term Loan, 3.56%, Maturing March 11, 2021 | | | 873 | | | | 879,166 | |
Kronos Incorporated | | | | | | | | |
Term Loan, 4.68%, Maturing November 1, 2023 | | | 5,062 | | | | 5,103,155 | |
Monitronics International, Inc. | | | | | | | | |
Term Loan, 6.80%, Maturing September 30, 2022 | | | 1,260 | | | | 1,274,004 | |
PGX Holdings, Inc. | | | | | | | | |
Term Loan, 6.48%, Maturing September 29, 2020 | | | 818 | | | | 821,760 | |
Prime Security Services Borrower, LLC | | | | | | | | |
Term Loan, 3.97%, Maturing May 2, 2022 | | | 1,145 | | | | 1,148,220 | |
ServiceMaster Company | | | | | | | | |
Term Loan, 3.73%, Maturing November 8, 2023 | | | 3,582 | | | | 3,606,612 | |
Spin Holdco, Inc. | | | | | | | | |
Term Loan, 4.97%, Maturing November 14, 2022 | | | 1,834 | | | | 1,827,542 | |
Tempo Acquisition, LLC | | | | | | | | |
Term Loan, 4.06%, Maturing May 1, 2024 | | | 625 | | | | 627,018 | |
Travelport Finance (Luxembourg) S.a.r.l. | | | | | | | | |
Term Loan, 4.43%, Maturing September 2, 2021 | | | 2,570 | | | | 2,579,989 | |
Vantiv, LLC | | | | | | | | |
Term Loan, 3.66%, Maturing October 14, 2023 | | | 326 | | | | 329,480 | |
Vestcom Parent Holdings, Inc. | | | | | | | | |
Term Loan, 5.22%, Maturing December 19, 2023 | | | 871 | | | | 874,978 | |
WASH Multifamily Laundry Systems, LLC | | | | | | | | |
Term Loan, 4.48%, Maturing May 14, 2022 | | | 587 | | | | 588,382 | |
| | | | | | | | | |
| | | $ | 51,703,125 | |
| | | | | | | | | |
|
Cable and Satellite Television — 3.3% | |
Charter Communications Operating, LLC | | | | | | | | |
Term Loan, 3.48%, Maturing January 15, 2024 | | $ | 1,259 | | | $ | 1,265,271 | |
CSC Holdings, LLC | | | | | | | | |
Term Loan, 3.46%, Maturing July 17, 2025 | | | 3,624 | | | | 3,618,558 | |
Mediacom Illinois, LLC | | | | | | | | |
Term Loan, 3.44%, Maturing February 15, 2024 | | | 317 | | | | 319,171 | |
Numericable Group S.A. | | | | | | | | |
Term Loan, 3.94%, Maturing July 31, 2025 | | | 1,400 | | | | 1,390,626 | |
Radiate Holdco, LLC | | | | | | | | |
Term Loan, 4.23%, Maturing February 1, 2024 | | | 499 | | | | 492,983 | |
Telenet Financing USD, LLC | | | | | | | | |
Term Loan, 3.91%, Maturing June 30, 2025 | | | 2,250 | | | | 2,255,446 | |
UPC Financing Partnership | | | | | | | | |
Term Loan, 3.91%, Maturing April 15, 2025 | | | 1,900 | | | | 1,904,512 | |
| | | | |
| | 6 | | See Notes to Financial Statements. |
Eaton Vance
VT Floating-Rate Income Fund
June 30, 2017
Portfolio of Investments (Unaudited) — continued
| | | | | | | | |
| Borrower/Tranche Description | | Principal
Amount
(000’s omitted) | | | Value | |
| | | | | | | | |
|
Cable and Satellite Television (continued) | |
Virgin Media Bristol, LLC | | | | | | | | |
Term Loan, 3.91%, Maturing January 31, 2025 | | $ | 6,725 | | | $ | 6,736,910 | |
Ziggo Secured Finance Partnership | | | | | | | | |
Term Loan, 3.66%, Maturing April 15, 2025 | | | 3,525 | | | | 3,520,594 | |
| | | | | | | | | |
| | | $ | 21,504,071 | |
| | | | | | | | | |
|
Chemicals and Plastics — 3.9% | |
A. Schulman, Inc. | | | | | | | | |
Term Loan, 4.32%, Maturing June 1, 2022 | | $ | 866 | | | $ | 867,337 | |
Alpha 3 B.V. | | | | | | | | |
Term Loan, 4.30%, Maturing January 31, 2024 | | | 400 | | | | 401,700 | |
Aruba Investments, Inc. | | | | | | | | |
Term Loan, 4.80%, Maturing February 2, 2022 | | | 205 | | | | 205,954 | |
Ashland, Inc. | | | | | | | | |
Term Loan, 3.21%, Maturing May 24, 2024 | | | 425 | | | | 427,391 | |
Axalta Coating Systems US Holdings, Inc. | | | | | | | | |
Term Loan, 3.30%, Maturing June 1, 2024 | | | 1,950 | | | | 1,958,654 | |
Emerald Performance Materials, LLC | | | | | | | | |
Term Loan, 4.73%, Maturing August 1, 2021 | | | 360 | | | | 363,399 | |
Ferro Corporation | | | | | | | | |
Term Loan, 3.73%, Maturing February 14, 2024 | | | 299 | | | | 301,120 | |
Flint Group GmbH | | | | | | | | |
Term Loan, 4.15%, Maturing September 7, 2021 | | | 248 | | | | 246,930 | |
Flint Group US, LLC | | | | | | | | |
Term Loan, 4.15%, Maturing September 7, 2021 | | | 1,502 | | | | 1,493,723 | |
GCP Applied Technologies, Inc. | | | | | | | | |
Term Loan, 4.48%, Maturing February 3, 2022 | | | 346 | | | | 347,785 | |
Gemini HDPE, LLC | | | | | | | | |
Term Loan, 4.17%, Maturing August 7, 2021 | | | 802 | | | | 807,349 | |
Huntsman International, LLC | | | | | | | | |
Term Loan, 3.87%, Maturing October 1, 2021 | | | 571 | | | | 574,343 | |
Term Loan, 4.12%, Maturing April 1, 2023 | | | 1,315 | | | | 1,322,040 | |
Ineos US Finance, LLC | | | | | | | | |
Term Loan, 3.98%, Maturing March 31, 2022 | | | 689 | | | | 691,566 | |
Term Loan, 3.98%, Maturing April 1, 2024 | | | 473 | | | | 475,284 | |
Kraton Polymers, LLC | | | | | | | | |
Term Loan, 5.23%, Maturing January 6, 2022 | | | 1,647 | | | | 1,664,862 | |
Kronos Worldwide, Inc. | | | | | | | | |
Term Loan, 4.30%, Maturing February 18, 2020 | | | 194 | | | | 194,387 | |
MacDermid, Inc. | | | | | | | | |
Term Loan, 4.73%, Maturing June 7, 2020 | | | 203 | | | | 204,277 | |
Term Loan, 4.23%, Maturing June 7, 2023 | | | 2,350 | | | | 2,358,769 | |
Minerals Technologies, Inc. | | | | | | | | |
Term Loan, 3.52%, Maturing February 14, 2024 | | | 1,111 | | | | 1,121,663 | |
| | | | | | | | |
| Borrower/Tranche Description | | Principal
Amount
(000’s omitted) | | | Value | |
| | | | | | | | |
|
Chemicals and Plastics (continued) | |
Orion Engineered Carbons GmbH | | | | | | | | |
Term Loan, 3.80%, Maturing July 25, 2021 | | $ | 344 | | | $ | 345,762 | |
OXEA Finance, LLC | | | | | | | | |
Term Loan, 4.40%, Maturing January 15, 2020 | | | 338 | | | | 333,739 | |
PolyOne Corporation | | | | | | | | |
Term Loan, 3.38%, Maturing November 12, 2022 | | | 320 | | | | 322,995 | |
PQ Corporation | | | | | | | | |
Term Loan, 5.48%, Maturing November 4, 2022 | | | 792 | | | | 800,790 | |
Solenis International L.P. | | | | | | | | |
Term Loan, 4.45%, Maturing July 31, 2021 | | | 217 | | | | 218,368 | |
Sonneborn Refined Products B.V. | | | | | | | | |
Term Loan, 4.98%, Maturing December 10, 2020 | | | 45 | | | | 45,225 | |
Sonneborn, LLC | | | | | | | | |
Term Loan, 4.98%, Maturing December 10, 2020 | | | 254 | | | | 256,274 | |
Tata Chemicals North America, Inc. | | | | | | | | |
Term Loan, 4.06%, Maturing August 7, 2020 | | | 536 | | | | 536,093 | |
Trinseo Materials Operating S.C.A. | | | | | | | | |
Term Loan, 4.48%, Maturing November 5, 2021 | | | 1,372 | | | | 1,386,720 | |
Tronox Pigments (Netherlands) B.V. | | | | | | | | |
Term Loan, 4.80%, Maturing March 19, 2020 | | | 1,965 | | | | 1,980,565 | |
Unifrax Corporation | | | | | | | | |
Term Loan, 5.05%, Maturing April 4, 2024 | | | 400 | | | | 404,500 | |
Univar, Inc. | | | | | | | | |
Term Loan, 3.98%, Maturing July 1, 2022 | | | 1,990 | | | | 1,993,627 | |
Venator Materials Corporation | | | | | | | | |
Term Loan, Maturing June 20, 2024(4) | | | 275 | | | | 274,312 | |
Versum Materials, Inc. | | | | | | | | |
Term Loan, 3.80%, Maturing September 29, 2023 | | | 422 | | | | 426,294 | |
Zep, Inc. | | | | | | | | |
Term Loan, 5.23%, Maturing June 27, 2022 | | | 221 | | | | 221,327 | |
| | | | | | | | | |
| | | $ | 25,575,124 | |
| | | | | | | | | |
|
Conglomerates — 0.2% | |
Penn Engineering & Manufacturing Corp. | | | | | | | | |
Term Loan, 3.97%, Maturing May 30, 2024 | | $ | 200 | | | $ | 201,000 | |
Spectrum Brands, Inc. | | | | | | | | |
Term Loan, 3.17%, Maturing June 23, 2022 | | | 1,238 | | | | 1,243,707 | |
| | | | | | | | | |
| | | $ | 1,444,707 | |
| | | | | | | | | |
|
Containers and Glass Products — 2.1% | |
Berry Plastics Group, Inc. | | | | | | | | |
Term Loan, 3.68%, Maturing October 1, 2022 | | $ | 1,450 | | | $ | 1,453,560 | |
BWAY Holding Company | | | | | | | | |
Term Loan, 4.33%, Maturing April 3, 2024 | | | 725 | | | | 725,259 | |
| | | | |
| | 7 | | See Notes to Financial Statements. |
Eaton Vance
VT Floating-Rate Income Fund
June 30, 2017
Portfolio of Investments (Unaudited) — continued
| | | | | | | | |
| Borrower/Tranche Description | | Principal
Amount
(000’s omitted) | | | Value | |
| | | | | | | | |
|
Containers and Glass Products (continued) | |
Consolidated Container Company, LLC | | | | | | | | |
Term Loan, 4.73%, Maturing May 22, 2024 | | $ | 300 | | | $ | 302,297 | |
Flex Acquisition Company, Inc. | | | | | | | | |
Term Loan, 4.40%, Maturing December 29, 2023 | | | 2,375 | | | | 2,387,469 | |
Libbey Glass, Inc. | | | | | | | | |
Term Loan, 4.10%, Maturing April 9, 2021 | | | 248 | | | | 228,160 | |
Pelican Products, Inc. | | | | | | | | |
Term Loan, 5.55%, Maturing April 11, 2020 | | | 1,580 | | | | 1,588,393 | |
Reynolds Group Holdings, Inc. | | | | | | | | |
Term Loan, 4.23%, Maturing February 5, 2023 | | | 5,044 | | | | 5,061,005 | |
SIG Combibloc US Acquisition, Inc. | | | | | | | | |
Term Loan, 4.23%, Maturing March 13, 2022 | | | 2,249 | | | | 2,264,370 | |
| | | | | | | | | |
| | | $ | 14,010,513 | |
| | | | | | | | | |
|
Cosmetics / Toiletries — 0.5% | |
Coty, Inc. | | | | | | | | |
Term Loan, 3.58%, Maturing October 27, 2022 | | $ | 543 | | | $ | 546,540 | |
Galleria Co. | | | | | | | | |
Term Loan, 4.13%, Maturing September 29, 2023 | | | 1,100 | | | | 1,108,421 | |
KIK Custom Products, Inc. | | | | | | | | |
Term Loan, 5.79%, Maturing August 26, 2022 | | | 943 | | | | 950,800 | |
Prestige Brands, Inc. | | | | | | | | |
Term Loan, 3.98%, Maturing January 26, 2024 | | | 607 | | | | 610,357 | |
| | | | | | | | | |
| | | $ | 3,216,118 | |
| | | | | | | | | |
|
Drugs — 4.1% | |
Albany Molecular Research, Inc. | | | | | | | | |
Term Loan, 5.91%, Maturing July 16, 2021 | | $ | 1,849 | | | $ | 1,860,414 | |
Alkermes, Inc. | | | | | | | | |
Term Loan, 3.97%, Maturing September 25, 2021 | | | 191 | | | | 192,410 | |
Amneal Pharmaceuticals, LLC | | | | | | | | |
Term Loan, 4.80%, Maturing November 1, 2019 | | | 2,921 | | | | 2,943,212 | |
Arbor Pharmaceuticals, Inc. | | | | | | | | |
Term Loan, 6.30%, Maturing July 5, 2023 | | | 1,055 | | | | 1,070,007 | |
Endo Luxembourg Finance Company I S.a.r.l. | | | | | | | | |
Term Loan, 5.50%, Maturing April 29, 2024 | | | 3,475 | | | | 3,508,391 | |
Horizon Pharma, Inc. | | | | | | | | |
Term Loan, 4.88%, Maturing March 29, 2024 | | | 621 | | | | 624,687 | |
Jaguar Holding Company II | | | | | | | | |
Term Loan, 4.01%, Maturing August 18, 2022 | | | 4,926 | | | | 4,933,019 | |
Mallinckrodt International Finance S.A. | | | | | | | | |
Term Loan, 4.05%, Maturing September 24, 2024 | | | 3,069 | | | | 3,064,517 | |
Patheon Holdings I B.V. | | | | | | | | |
Term Loan, 4.50%, Maturing April 20, 2024 | | | 1,950 | | | | 1,956,907 | |
| | | | | | | | |
| Borrower/Tranche Description | | Principal
Amount
(000’s omitted) | | | Value | |
| | | | | | | | |
|
Drugs (continued) | |
Valeant Pharmaceuticals International, Inc. | | | | | | | | |
Term Loan, 5.83%, Maturing April 1, 2022 | | $ | 6,430 | | | $ | 6,524,134 | |
| | | | | | | | | |
| | | $ | 26,677,698 | |
| | | | | | | | | |
|
Ecological Services and Equipment — 0.6% | |
Advanced Disposal Services, Inc. | | | | | | | | |
Term Loan, 3.94%, Maturing November 10, 2023 | | $ | 2,435 | | | $ | 2,449,812 | |
Clean Harbors, Inc. | | | | | | | | |
Term Loan, Maturing June 27, 2024(4) | | | 200 | | | | 200,750 | |
EnergySolutions, LLC | | | | | | | | |
Term Loan, 6.98%, Maturing May 29, 2020 | | | 607 | | | | 612,095 | |
GFL Environmental, Inc. | | | | | | | | |
Term Loan, 4.05%, Maturing September 29, 2023 | | | 571 | | | | 572,709 | |
| | | | | | | | | |
| | | $ | 3,835,366 | |
| | | | | | | | | |
|
Electronics / Electrical — 8.9% | |
Almonde, Inc. | | | | | | | | |
Term Loan, 4.74%, Maturing June 13, 2024 | | $ | 1,950 | | | $ | 1,952,814 | |
Answers Finance, LLC | | | | | | | | |
Term Loan - Second Lien, 9.00%, Maturing September 15, 2021 | | | 107 | | | | 105,249 | |
Aptean, Inc. | | | | | | | | |
Term Loan, 5.55%, Maturing December 20, 2022 | | | 1,871 | | | | 1,876,979 | |
Avast Software B.V. | | | | | | | | |
Term Loan, 4.55%, Maturing September 30, 2023 | | | 1,268 | | | | 1,280,909 | |
Campaign Monitor Finance Pty. Limited | | | | | | | | |
Term Loan, 6.55%, Maturing March 18, 2021 | | | 449 | | | | 426,297 | |
CommScope, Inc. | | | | | | | | |
Term Loan, 3.30%, Maturing December 29, 2022 | | | 504 | | | | 505,851 | |
Cypress Semiconductor Corporation | | | | | | | | |
Term Loan, 4.84%, Maturing July 5, 2021 | | | 698 | | | | 705,576 | |
Electrical Components International, Inc. | | | | | | | | |
Term Loan, 6.05%, Maturing May 28, 2021 | | | 2,121 | | | | 2,134,171 | |
Electro Rent Corporation | | | | | | | | |
Term Loan, 6.23%, Maturing January 19, 2024 | | | 896 | | | | 904,455 | |
Entegris, Inc. | | | | | | | | |
Term Loan, 3.48%, Maturing April 30, 2021 | | | 130 | | | | 130,990 | |
Excelitas Technologies Corp. | | | | | | | | |
Term Loan, 6.30%, Maturing October 31, 2020 | | | 498 | | | | 498,499 | |
Eze Castle Software, Inc. | | | | | | | | |
Term Loan, 4.30%, Maturing April 6, 2020 | | | 1,311 | | | | 1,320,731 | |
Go Daddy Operating Company, LLC | | | | | | | | |
Term Loan, 3.73%, Maturing February 15, 2024 | | | 3,996 | | | | 4,009,191 | |
Hyland Software, Inc. | | | | | | | | |
Term Loan, 4.48%, Maturing July 1, 2022 | | | 2,696 | | | | 2,715,293 | |
| | | | |
| | 8 | | See Notes to Financial Statements. |
Eaton Vance
VT Floating-Rate Income Fund
June 30, 2017
Portfolio of Investments (Unaudited) — continued
| | | | | | | | |
| Borrower/Tranche Description | | Principal
Amount
(000’s omitted) | | | Value | |
| | | | | | | | |
|
Electronics / Electrical (continued) | |
Infoblox, Inc. | | | | | | | | |
Term Loan, 6.23%, Maturing November 7, 2023 | | $ | 1,550 | | | $ | 1,562,594 | |
Infor (US), Inc. | | | | | | | | |
Term Loan, 4.05%, Maturing February 1, 2022 | | | 5,588 | | | | 5,561,825 | |
Informatica Corporation | | | | | | | | |
Term Loan, 4.80%, Maturing August 5, 2022 | | | 3,471 | | | | 3,471,261 | |
Lattice Semiconductor Corporation | | | | | | | | |
Term Loan, 5.33%, Maturing March 10, 2021 | | | 331 | | | | 330,167 | |
M/A-COM Technology Solutions Holdings, Inc. | | | | | | | | |
Term Loan, 3.46%, Maturing May 17, 2024 | | | 815 | | | | 812,751 | |
MA FinanceCo., LLC | | | | | | | | |
Term Loan, 3.67%, Maturing November 19, 2021 | | | 2,140 | | | | 2,141,154 | |
Term Loan, 3.96%, Maturing April 26, 2024 | | | 355 | | | | 355,089 | |
MH Sub I, LLC | | | | | | | | |
Term Loan, 4.75%, Maturing July 8, 2021(2) | | | 168 | | | | 169,193 | |
Term Loan, 4.98%, Maturing July 8, 2021 | | | 306 | | | | 308,596 | |
Term Loan, 4.98%, Maturing July 8, 2021 | | | 754 | | | | 762,290 | |
Microsemi Corporation | | | | | | | | |
Term Loan, 3.33%, Maturing January 15, 2023 | | | 332 | | | | 332,950 | |
MTS Systems Corporation | | | | | | | | |
Term Loan, 5.33%, Maturing July 5, 2023 | | | 868 | | | | 871,955 | |
Renaissance Learning, Inc. | | | | | | | | |
Term Loan, 5.05%, Maturing April 9, 2021 | | | 461 | | | | 463,126 | |
Rocket Software, Inc. | | | | | | | | |
Term Loan, 5.55%, Maturing October 14, 2023 | | | 819 | | | | 827,205 | |
Seattle Spinco, Inc. | | | | | | | | |
Term Loan, 4.03%, Maturing March 14, 2018 | | | 2,395 | | | | 2,398,005 | |
SGS Cayman L.P. | | | | | | | | |
Term Loan, 6.67%, Maturing April 23, 2021 | | | 138 | | | | 132,215 | |
SkillSoft Corporation | | | | | | | | |
Term Loan, 5.98%, Maturing April 28, 2021 | | | 2,881 | | | | 2,727,779 | |
Southwire Company | | | | | | | | |
Term Loan, 3.62%, Maturing February 10, 2021 | | | 241 | | | | 242,053 | |
SS&C Technologies, Inc. | | | | | | | | |
Term Loan, 3.48%, Maturing July 8, 2022 | | | 62 | | | | 62,834 | |
Term Loan, 3.48%, Maturing July 8, 2022 | | | 1,030 | | | | 1,035,925 | |
SurveyMonkey, Inc. | | | | | | | | |
Term Loan, 5.80%, Maturing April 13, 2024 | | | 1,250 | | | | 1,257,813 | |
Sutherland Global Services, Inc. | | | | | | | | |
Term Loan, 6.67%, Maturing April 23, 2021 | | | 592 | | | | 567,991 | |
Synchronoss Technologies, Inc. | | | | | | | | |
Term Loan, 4.08%, Maturing January 19, 2024 | | | 574 | | | | 565,389 | |
Syncsort Incorporated | | | | | | | | |
Term Loan, 6.55%, Maturing December 9, 2022 | | | 522 | | | | 524,824 | |
| | | | | | | | |
| Borrower/Tranche Description | | Principal
Amount
(000’s omitted) | | | Value | |
| | | | | | | | |
|
Electronics / Electrical (continued) | |
Uber Technologies | | | | | | | | |
Term Loan, 5.22%, Maturing July 13, 2023 | | $ | 3,403 | | | $ | 3,407,316 | |
VeriFone, Inc. | | | | | | | | |
Term Loan, 3.98%, Maturing July 8, 2021 | | | 1,940 | | | | 1,948,488 | |
Veritas Bermuda Ltd. | | | | | | | | |
Term Loan, 5.80%, Maturing January 27, 2023 | | | 864 | | | | 866,353 | |
VF Holding Corp. | | | | | | | | |
Term Loan, 4.55%, Maturing June 30, 2023 | | | 2,533 | | | | 2,536,134 | |
Wall Street Systems Delaware, Inc. | | | | | | | | |
Term Loan, 4.79%, Maturing August 26, 2023 | | | 1,269 | | | | 1,274,572 | |
Western Digital Corporation | | | | | | | | |
Term Loan, 3.98%, Maturing April 29, 2023 | | | 803 | | | | 808,749 | |
Zebra Technologies Corporation | | | | | | | | |
Term Loan, 3.72%, Maturing October 27, 2021 | | | 1,327 | | | | 1,334,109 | |
| | | | | | | | | |
| | | $ | 58,227,710 | |
| | | | | | | | | |
|
Equipment Leasing — 0.8% | |
Avolon TLB Borrower 1 (Luxembourg) S.a.r.l. | | | | | | | | |
Term Loan, 3.46%, Maturing September 20, 2020 | | $ | 200 | | | $ | 201,821 | |
Term Loan, 3.96%, Maturing March 20, 2022 | | | 4,975 | | | | 5,024,780 | |
| | | | | | | | | |
| | | $ | 5,226,601 | |
| | | | | | | | | |
|
Financial Intermediaries — 3.1% | |
Americold Realty Operating Partnership L.P. | | | | | | | | |
Term Loan, 4.98%, Maturing December 1, 2022 | | $ | 289 | | | $ | 292,893 | |
Armor Holding II, LLC | | | | | | | | |
Term Loan, 5.80%, Maturing June 26, 2020 | | | 1,321 | | | | 1,327,448 | |
Citco Funding, LLC | | | | | | | | |
Term Loan, 4.23%, Maturing March 31, 2022 | | | 1,292 | | | | 1,308,090 | |
Clipper Acquisitions Corp. | | | | | | | | |
Term Loan, 3.47%, Maturing February 6, 2020 | | | 263 | | | | 263,871 | |
Donnelley Financial Solutions, Inc. | | | | | | | | |
Term Loan, 5.08%, Maturing September 30, 2023 | | | 232 | | | | 234,560 | |
Focus Financial Partners, LLC | | | | | | | | |
Term Loan, Maturing May 22, 2024(4) | | | 825 | | | | 832,734 | |
Fortress Investment Group, LLC | | | | | | | | |
Term Loan, Maturing June 2, 2022(4) | | | 875 | | | | 881,198 | |
Freedom Mortgage Corporation | | | | | | | | |
Term Loan, 6.86%, Maturing February 23, 2022 | | | 848 | | | | 857,192 | |
Guggenheim Partners, LLC | | | | | | | | |
Term Loan, 3.97%, Maturing July 21, 2023 | | | 2,295 | | | | 2,313,575 | |
Harbourvest Partners, LLC | | | | | | | | |
Term Loan, 3.66%, Maturing February 4, 2021 | | | 903 | | | | 903,464 | |
| | | | |
| | 9 | | See Notes to Financial Statements. |
Eaton Vance
VT Floating-Rate Income Fund
June 30, 2017
Portfolio of Investments (Unaudited) — continued
| | | | | | | | |
| Borrower/Tranche Description | | Principal
Amount
(000’s omitted) | | | Value | |
| | | | | | | | |
|
Financial Intermediaries (continued) | |
LPL Holdings, Inc. | | | | | | | | |
Term Loan, 3.82%, Maturing March 11, 2024 | | $ | 998 | | | $ | 1,003,890 | |
MIP Delaware, LLC | | | | | | | | |
Term Loan, 4.30%, Maturing March 9, 2020 | | | 222 | | | | 222,422 | |
NXT Capital, Inc. | | | | | | | | |
Term Loan, 5.73%, Maturing November 22, 2022 | | | 1,821 | | | | 1,850,718 | |
Ocwen Financial Corporation | | | | | | | | |
Term Loan, 6.08%, Maturing December 5, 2020 | | | 268 | | | | 266,868 | |
Quality Care Properties, Inc. | | | | | | | | |
Term Loan, 6.48%, Maturing October 31, 2022 | | | 3,035 | | | | 3,062,570 | |
Sesac Holdco II, LLC | | | | | | | | |
Term Loan, 4.46%, Maturing February 23, 2024 | | | 399 | | | | 398,501 | |
Virtus Investment Partners, Inc. | | | | | | | | |
Term Loan, 4.95%, Maturing June 1, 2024 | | | 375 | | | | 380,625 | |
Walker & Dunlop, Inc. | | | | | | | | |
Term Loan, 5.48%, Maturing December 11, 2020 | | | 1,270 | | | | 1,282,651 | |
Walter Investment Management Corp. | | | | | | | | |
Term Loan, 4.98%, Maturing December 18, 2020 | | | 3,006 | | | | 2,763,202 | |
| | | | | | | | | |
| | | $ | 20,446,472 | |
| | | | | | | | | |
|
Food Products — 2.5% | |
Blue Buffalo Company Ltd. | | | | | | | | |
Term Loan, 3.22%, Maturing May 18, 2024 | | $ | 750 | | | $ | 757,500 | |
Del Monte Foods, Inc. | | | | | | | | |
Term Loan, 4.44%, Maturing February 18, 2021 | | | 1,218 | | | | 989,405 | |
Dole Food Company, Inc. | | | | | | | | |
Term Loan, 4.15%, Maturing April 6, 2024 | | | 1,275 | | | | 1,279,440 | |
High Liner Foods Incorporated | | | | | | | | |
Term Loan, 4.38%, Maturing April 24, 2021 | | | 491 | | | | 493,040 | |
HLF Financing S.a.r.l. | | | | | | | | |
Term Loan, 6.73%, Maturing February 13, 2023 | | | 1,104 | | | | 1,114,945 | |
Jacobs Douwe Egberts International B.V. | | | | | | | | |
Term Loan, 3.44%, Maturing July 2, 2022 | | | 1,513 | | | | 1,523,902 | |
JBS USA, LLC | | | | | | | | |
Term Loan, 5.75%, Maturing October 30, 2022 | | | 5,012 | | | | 4,892,610 | |
Nature’s Bounty Co. (The) | | | | | | | | |
Term Loan, 4.80%, Maturing May 5, 2023 | | | 2,947 | | | | 2,953,563 | |
Nomad Foods Europe Midco Limited | | | | | | | | |
Term Loan, 3.91%, Maturing April 18, 2024 | | | 425 | | | | 426,793 | |
Pinnacle Foods Finance, LLC | | | | | | | | |
Term Loan, 3.08%, Maturing February 2, 2024 | | | 572 | | | | 574,628 | |
Post Holdings, Inc. | | | | | | | | |
Term Loan, 3.47%, Maturing May 24, 2024 | | | 1,225 | | | | 1,228,063 | |
| | | | | | | | | |
| | | $ | 16,233,889 | |
| | | | | | | | | |
| | | | | | | | |
| Borrower/Tranche Description | | Principal
Amount
(000’s omitted) | | | Value | |
| | | | | | | | |
|
Food Service — 2.2% | |
1011778 B.C. Unlimited Liability Company | | | | | | | | |
Term Loan, 3.50%, Maturing February 16, 2024 | | $ | 5,028 | | | $ | 5,026,695 | |
Landry’s, Inc. | | | | | | | | |
Term Loan, 3.91%, Maturing October 4, 2023 | | | 1,749 | | | | 1,745,619 | |
Manitowoc Foodservice, Inc. | | | | | | | | |
Term Loan, 4.23%, Maturing March 3, 2023 | | | 564 | | | | 569,520 | |
NPC International, Inc. | | | | | | | | |
Term Loan, 4.72%, Maturing April 19, 2024 | | | 650 | | | | 653,656 | |
Seminole Hard Rock Entertainment, Inc. | | | | | | | | |
Term Loan, 4.05%, Maturing May 14, 2020 | | | 144 | | | | 144,750 | |
TKC Holdings, Inc. | | | | | | | | |
Term Loan, 5.38%, Maturing February 1, 2023 | | | 748 | | | | 747,657 | |
US Foods, Inc. | | | | | | | | |
Term Loan, 3.98%, Maturing June 27, 2023 | | | 1,496 | | | | 1,504,023 | |
Weight Watchers International, Inc. | | | | | | | | |
Term Loan, 4.38%, Maturing April 2, 2020 | | | 3,160 | | | | 3,054,673 | |
Yum! Brands, Inc. | | | | | | | | |
Term Loan, 3.21%, Maturing June 16, 2023 | | | 645 | | | | 648,493 | |
| | | | | | | | | |
| | | $ | 14,095,086 | |
| | | | | | | | | |
|
Food / Drug Retailers — 1.4% | |
Albertsons, LLC | | | | | | | | |
Term Loan, 3.98%, Maturing August 25, 2021 | | $ | 2,733 | | | $ | 2,702,608 | |
Term Loan, 4.25%, Maturing June 22, 2023 | | | 3,490 | | | | 3,455,021 | |
General Nutrition Centers, Inc. | | | | | | | | |
Term Loan, 3.73%, Maturing March 4, 2019 | | | 1,445 | | | | 1,364,417 | |
Rite Aid Corporation | | | | | | | | |
Term Loan - Second Lien, 5.98%, Maturing August 21, 2020 | | | 250 | | | | 251,719 | |
Term Loan - Second Lien, 5.11%, Maturing June 21, 2021 | | | 1,000 | | | | 1,005,625 | |
Supervalu, Inc. | | | | | | | | |
Term Loan, 4.73%, Maturing June 8, 2024 | | | 178 | | | | 172,571 | |
Term Loan, 4.73%, Maturing June 8, 2024 | | | 296 | | | | 287,619 | |
| | | | | | | | | |
| | | $ | 9,239,580 | |
| | | | | | | | | |
|
Forest Products — 0.1% | |
Expera Specialty Solutions, LLC | | | | | | | | |
Term Loan, 5.98%, Maturing November 3, 2023 | | $ | 720 | | | $ | 723,610 | |
| | | | | | | | | |
| | | $ | 723,610 | |
| | | | | | | | | |
|
Health Care — 9.4% | |
Acadia Healthcare Company, Inc. | | | | | | | | |
Term Loan, 3.98%, Maturing February 11, 2022 | | $ | 171 | | | $ | 172,251 | |
| | | | |
| | 10 | | See Notes to Financial Statements. |
Eaton Vance
VT Floating-Rate Income Fund
June 30, 2017
Portfolio of Investments (Unaudited) — continued
| | | | | | | | |
| Borrower/Tranche Description | | Principal
Amount
(000’s omitted) | | | Value | |
| | | | | | | | |
|
Health Care (continued) | |
ADMI Corp. | | | | | | | | |
Term Loan, 4.95%, Maturing April 30, 2022 | | $ | 1,109 | | | $ | 1,120,649 | |
Akorn, Inc. | | | | | | | | |
Term Loan, 5.50%, Maturing April 16, 2021 | | | 537 | | | | 543,408 | |
Alere, Inc. | | | | | | | | |
Term Loan, 4.48%, Maturing June 18, 2022 | | | 2,394 | | | | 2,401,650 | |
Alliance Healthcare Services, Inc. | | | | | | | | |
Term Loan, 4.44%, Maturing June 3, 2019 | | | 617 | | | | 618,174 | |
Ardent Legacy Acquisitions, Inc. | | | | | | | | |
Term Loan, 6.80%, Maturing August 4, 2021 | | | 318 | | | | 319,474 | |
Auris Luxembourg III S.a.r.l. | | | | | | | | |
Term Loan, 4.30%, Maturing January 17, 2022 | | | 2,517 | | | | 2,534,758 | |
BioClinica, Inc. | | | | | | | | |
Term Loan, 5.38%, Maturing October 20, 2023 | | | 473 | | | | 463,370 | |
CareCore National, LLC | | | | | | | | |
Term Loan, 5.23%, Maturing March 5, 2021 | | | 2,421 | | | | 2,454,776 | |
CeramTec Acquisition Corporation | | | | | | | | |
Term Loan, 3.95%, Maturing August 30, 2020 | | | 88 | | | | 88,728 | |
CHG Healthcare Services, Inc. | | | | | | | | |
Term Loan, 4.42%, Maturing June 7, 2023 | | | 1,457 | | | | 1,471,880 | |
Community Health Systems, Inc. | | | | | | | | |
Term Loan, 3.96%, Maturing December 31, 2019 | | | 1,799 | | | | 1,798,597 | |
Term Loan, 4.21%, Maturing January 27, 2021 | | | 1,792 | | | | 1,791,551 | |
Concentra, Inc. | | | | | | | | |
Term Loan, 4.21%, Maturing June 1, 2022 | | | 1,271 | | | | 1,274,044 | |
Convatec, Inc. | | | | | | | | |
Term Loan, 3.80%, Maturing October 31, 2023 | | | 398 | | | | 400,488 | |
CPI Holdco, LLC | | | | | | | | |
Term Loan, 5.30%, Maturing March 21, 2024 | | | 499 | | | | 500,620 | |
DaVita HealthCare Partners, Inc. | | | | | | | | |
Term Loan, 3.98%, Maturing June 24, 2021 | | | 2,037 | | | | 2,051,369 | |
DJO Finance, LLC | | | | | | | | |
Term Loan, 4.39%, Maturing June 8, 2020 | | | 2,395 | | | | 2,373,145 | |
Envision Healthcare Corporation | | | | | | | | |
Term Loan, 4.30%, Maturing December 1, 2023 | | | 6,521 | | | | 6,556,991 | |
Equian, LLC | | | | | | | | |
Term Loan, 4.93%, Maturing May 20, 2024 | | | 229 | | | | 231,491 | |
Term Loan, 5.01%, Maturing May 20, 2024(2) | | | 71 | | | | 71,228 | |
Faenza Acquisition GmbH | | | | | | | | |
Term Loan, 3.95%, Maturing August 30, 2020 | | | 223 | | | | 224,392 | |
Term Loan, 3.95%, Maturing August 30, 2020 | | | 732 | | | | 737,409 | |
Genoa, a QoL Healthcare Company, LLC | | | | | | | | |
Term Loan, 4.98%, Maturing October 28, 2023 | | | 422 | | | | 424,185 | |
Greatbatch Ltd. | | | | | | | | |
Term Loan, 4.71%, Maturing October 27, 2022 | | | 2,455 | | | | 2,466,899 | |
| | | | | | | | |
| Borrower/Tranche Description | | Principal
Amount
(000’s omitted) | | | Value | |
| | | | | | | | |
|
Health Care (continued) | |
Grifols Worldwide Operations USA, Inc. | | | | | | | | |
Term Loan, 3.44%, Maturing January 31, 2025 | | $ | 2,469 | | | $ | 2,475,607 | |
Iasis Healthcare, LLC | | | | | | | | |
Term Loan, 5.30%, Maturing February 16, 2021 | | | 694 | | | | 698,917 | |
Indivior Finance S.a.r.l. | | | | | | | | |
Term Loan, 7.25%, Maturing December 19, 2019 | | | 549 | | | | 554,108 | |
inVentiv Health, Inc. | | | | | | | | |
Term Loan, 4.95%, Maturing November 9, 2023 | | | 2,090 | | | | 2,099,202 | |
Kindred Healthcare, Inc. | | | | | | | | |
Term Loan, 4.69%, Maturing April 9, 2021 | | | 2,946 | | | | 2,963,661 | |
Kinetic Concepts, Inc. | | | | | | | | |
Term Loan, 4.55%, Maturing February 2, 2024 | | | 1,950 | | | | 1,943,093 | |
KUEHG Corp. | | | | | | | | |
Term Loan, 5.05%, Maturing August 13, 2022 | | | 1,283 | | | | 1,290,970 | |
Medical Depot Holdings, Inc. | | | | | | | | |
Term Loan, 6.80%, Maturing January 3, 2023 | | | 518 | | | | 476,638 | |
MMM Holdings, Inc. | | | | | | | | |
Term Loan, 10.25%, Maturing June 30, 2019 | | | 202 | | | | 197,577 | |
MPH Acquisition Holdings, LLC | | | | | | | | |
Term Loan, 4.30%, Maturing June 7, 2023 | | | 1,975 | | | | 1,977,589 | |
MSO of Puerto Rico, Inc. | | | | | | | | |
Term Loan, 10.25%, Maturing December 12, 2017 | | | 147 | | | | 143,637 | |
National Mentor Holdings, Inc. | | | | | | | | |
Term Loan, 4.30%, Maturing January 31, 2021 | | | 339 | | | | 340,741 | |
New Millennium Holdco, Inc. | | | | | | | | |
Term Loan, 7.73%, Maturing December 21, 2020 | | | 104 | | | | 62,888 | |
Onex Carestream Finance L.P. | | | | | | | | |
Term Loan, 5.28%, Maturing June 7, 2019 | | | 578 | | | | 575,171 | |
Opal Acquisition, Inc. | | | | | | | | |
Term Loan, 5.24%, Maturing November 27, 2020 | | | 1,390 | | | | 1,289,993 | |
Ortho-Clinical Diagnostics, Inc. | | | | | | | | |
Term Loan, 5.05%, Maturing June 30, 2021 | | | 2,591 | | | | 2,582,181 | |
Press Ganey Holdings, Inc. | | | | | | | | |
Term Loan, 4.48%, Maturing October 21, 2023 | | | 522 | | | | 524,497 | |
Quintiles IMS Incorporated | | | | | | | | |
Term Loan, 3.23%, Maturing March 7, 2024 | | | 361 | | | | 363,596 | |
RadNet, Inc. | | | | | | | | |
Term Loan, 4.41%, Maturing June 30, 2023 | | | 1,347 | | | | 1,353,606 | |
Select Medical Corporation | | | | | | | | |
Term Loan, 4.65%, Maturing March 6, 2024 | | | 1,222 | | | | 1,233,387 | |
Sterigenics-Nordion Holdings, LLC | | | | | | | | |
Term Loan, 4.15%, Maturing May 15, 2022 | | | 442 | | | | 441,313 | |
Surgery Center Holdings, Inc. | | | | | | | | |
Term Loan, Maturing June 6, 2024(4) | | | 2,250 | | | | 2,258,437 | |
| | | | |
| | 11 | | See Notes to Financial Statements. |
Eaton Vance
VT Floating-Rate Income Fund
June 30, 2017
Portfolio of Investments (Unaudited) — continued
| | | | | | | | |
| Borrower/Tranche Description | | Principal
Amount
(000’s omitted) | | | Value | |
| | | | | | | | |
|
Health Care (continued) | |
Team Health Holdings, Inc. | | | | | | | | |
Term Loan, 3.98%, Maturing February 6, 2024 | | $ | 1,471 | | | $ | 1,465,243 | |
Tecomet, Inc. | | | | | | | | |
Term Loan, 4.92%, Maturing May 2, 2024 | | | 575 | | | | 575,359 | |
U.S. Anesthesia Partners, Inc. | | | | | | | | |
Term Loan, 4.47%, Maturing June 23, 2024 | | | 725 | | | | 726,813 | |
| | | | | | | | | |
| | | $ | 61,705,751 | |
| | | | | | | | | |
|
Home Furnishings — 0.8% | |
Bright Bidco B.V. | | | | | | | | |
Term Loan, Maturing February 27, 2024(4) | | $ | 825 | | | $ | 837,891 | |
Serta Simmons Bedding, LLC | | | | | | | | |
Term Loan, 4.59%, Maturing November 8, 2023 | | | 4,090 | | | | 4,088,899 | |
| | | | | | | | | |
| | | $ | 4,926,790 | |
| | | | | | | | | |
|
Industrial Equipment — 4.2% | |
Apex Tool Group, LLC | | | | | | | | |
Term Loan, 4.50%, Maturing January 31, 2020 | | $ | 2,693 | | | $ | 2,625,543 | |
Clark Equipment Company | | | | | | | | |
Term Loan, 3.93%, Maturing May 18, 2024 | | | 1,646 | | | | 1,651,275 | |
Delachaux S.A. | | | | | | | | |
Term Loan, 4.80%, Maturing October 28, 2021 | | | 290 | | | | 291,599 | |
Element Materials Technology Group US Holdings, Inc. | | | | | | | | |
Term Loan, Maturing June 1, 2024(4) | | | 275 | | | | 277,525 | |
EWT Holdings III Corp. | | | | | | | | |
Term Loan, 5.05%, Maturing January 15, 2021 | | | 4,008 | | | | 4,032,879 | |
Filtration Group Corporation | | | | | | | | |
Term Loan, 4.48%, Maturing November 21, 2020 | | | 1,975 | | | | 1,990,749 | |
Gardner Denver, Inc. | | | | | | | | |
Term Loan, 4.55%, Maturing July 30, 2020 | | | 2,588 | | | | 2,597,477 | |
Gates Global, LLC | | | | | | | | |
Term Loan, 4.55%, Maturing April 1, 2024 | | | 2,831 | | | | 2,837,538 | |
Husky Injection Molding Systems Ltd. | | | | | | | | |
Term Loan, 4.48%, Maturing June 30, 2021 | | | 2,373 | | | | 2,388,233 | |
Milacron, LLC | | | | | | | | |
Term Loan, 4.23%, Maturing September 28, 2023 | | | 2,040 | | | | 2,047,399 | |
Paladin Brands Holding, Inc. | | | | | | | | |
Term Loan, 7.30%, Maturing August 16, 2019 | | | 1,059 | | | | 1,040,240 | |
Rexnord, LLC | | | | | | | | |
Term Loan, 3.97%, Maturing August 21, 2023 | | | 4,135 | | | | 4,141,382 | |
Signode Industrial Group US, Inc. | | | | | | | | |
Term Loan, 4.01%, Maturing May 4, 2021 | | | 573 | | | | 572,917 | |
STS Operating, Inc. | | | | | | | | |
Term Loan, 4.96%, Maturing February 12, 2021 | | | 187 | | | | 187,098 | |
| | | | | | | | |
| Borrower/Tranche Description | | Principal
Amount
(000’s omitted) | | | Value | |
| | | | | | | | |
|
Industrial Equipment (continued) | |
Tank Holding Corp. | | | | | | | | |
Term Loan, 5.54%, Maturing March 16, 2022 | | $ | 681 | | | $ | 681,894 | |
| | | | | | | | | |
| | | $ | 27,363,748 | |
| | | | | | | | | |
|
Insurance — 2.8% | |
Alliant Holdings I, Inc. | | | | | | | | |
Term Loan, 4.42%, Maturing August 12, 2022 | | $ | 1,498 | | | $ | 1,502,794 | |
AmWINS Group, Inc. | | | | | | | | |
Term Loan, 4.13%, Maturing January 25, 2024 | | | 1,567 | | | | 1,569,574 | |
AssuredPartners, Inc. | | | | | | | | |
Term Loan, 4.73%, Maturing October 21, 2022 | | | 1,585 | | | | 1,586,776 | |
Asurion, LLC | | | | | | | | |
Term Loan, 4.48%, Maturing August 4, 2022 | | | 3,245 | | | | 3,264,813 | |
Term Loan, 4.23%, Maturing November 3, 2023 | | | 1,581 | | | | 1,592,249 | |
Term Loan - Second Lien, 8.73%, Maturing March 3, 2021 | | | 1,400 | | | | 1,408,166 | |
Cunningham Lindsey U.S., Inc. | | | | | | | | |
Term Loan, 5.05%, Maturing December 10, 2019 | | | 938 | | | | 847,340 | |
Hub International Limited | | | | | | | | |
Term Loan, 4.42%, Maturing October 2, 2020 | | | 3,308 | | | | 3,324,452 | |
NFP Corp. | | | | | | | | |
Term Loan, 4.80%, Maturing January 8, 2024 | | | 1,620 | | | | 1,630,013 | |
USI, Inc. | | | | | | | | |
Term Loan, 4.18%, Maturing May 16, 2024 | | | 1,675 | | | | 1,666,834 | |
| | | | | | | | | |
| | | $ | 18,393,011 | |
| | | | | | | | | |
|
Leisure Goods / Activities / Movies — 3.0% | |
AMC Entertainment, Inc. | | | | | | | | |
Term Loan, 3.46%, Maturing December 15, 2022 | | $ | 1,354 | | | $ | 1,359,878 | |
Term Loan, 3.47%, Maturing December 15, 2023 | | | 374 | | | | 375,231 | |
Ancestry.com Operations, Inc. | | | | | | | | |
Term Loan, 4.34%, Maturing October 19, 2023 | | | 1,485 | | | | 1,500,547 | |
Bombardier Recreational Products, Inc. | | | | | | | | |
Term Loan, 4.23%, Maturing June 30, 2023 | | | 2,935 | | | | 2,955,955 | |
Bright Horizons Family Solutions, Inc. | | | | | | | | |
Term Loan, 3.48%, Maturing November 7, 2023 | | | 374 | | | | 376,712 | |
CDS U.S. Intermediate Holdings, Inc. | | | | | | | | |
Term Loan, 5.30%, Maturing July 8, 2022 | | | 1,264 | | | | 1,272,557 | |
ClubCorp Club Operations, Inc. | | | | | | | | |
Term Loan, 4.05%, Maturing December 15, 2022 | | | 1,760 | | | | 1,772,946 | |
Delta 2 (LUX) S.a.r.l. | | | | | | | | |
Term Loan, 4.50%, Maturing February 1, 2024 | | | 1,500 | | | | 1,503,047 | |
Emerald Expositions Holding, Inc. | | | | | | | | |
Term Loan, 4.30%, Maturing May 22, 2024 | | | 850 | | | | 860,625 | |
| | | | |
| | 12 | | See Notes to Financial Statements. |
Eaton Vance
VT Floating-Rate Income Fund
June 30, 2017
Portfolio of Investments (Unaudited) — continued
| | | | | | | | |
| Borrower/Tranche Description | | Principal
Amount
(000’s omitted) | | | Value | |
| | | | | | | | |
|
Leisure Goods / Activities / Movies (continued) | |
Live Nation Entertainment, Inc. | | | | | | | | |
Term Loan, 3.50%, Maturing October 31, 2023 | | $ | 167 | | | $ | 167,385 | |
Match Group, Inc. | | | | | | | | |
Term Loan, 4.37%, Maturing November 16, 2022 | | | 317 | | | | 318,773 | |
National CineMedia, LLC | | | | | | | | |
Term Loan, 3.98%, Maturing November 26, 2019 | | | 250 | | | | 250,508 | |
Nord Anglia Education Finance, LLC | | | | | | | | |
Term Loan, 4.70%, Maturing March 31, 2021 | | | 1,796 | | | | 1,801,828 | |
Sabre GLBL, Inc. | | | | | | | | |
Term Loan, 3.98%, Maturing February 22, 2024 | | | 518 | | | | 522,026 | |
SeaWorld Parks & Entertainment, Inc. | | | | | | | | |
Term Loan, 4.30%, Maturing March 31, 2024 | | | 1,448 | | | | 1,446,831 | |
SRAM, LLC | | | | | | | | |
Term Loan, 4.61%, Maturing March 15, 2024 | | | 1,275 | | | | 1,278,977 | |
UFC Holdings, LLC | | | | | | | | |
Term Loan, 4.47%, Maturing August 18, 2023 | | | 1,414 | | | | 1,419,995 | |
WMG Acquisition Corp. | | | | | | | | |
Term Loan, 3.72%, Maturing November 1, 2023 | | | 776 | | | | 776,968 | |
| | | | | | | | | |
| | | $ | 19,960,789 | |
| | | | | | | | | |
|
Lodging and Casinos — 3.7% | |
Amaya Holdings B.V. | | | | | | | | |
Term Loan, 4.80%, Maturing August 1, 2021 | | $ | 3,539 | | | $ | 3,549,920 | |
Boyd Gaming Corporation | | | | | | | | |
Term Loan, 3.69%, Maturing September 15, 2023 | | | 745 | | | | 747,222 | |
Caesars Entertainment Operating Company | | | | | | | | |
Term Loan, 0.00%, Maturing March 1, 2017(5) | | | 741 | | | | 882,644 | |
CityCenter Holdings, LLC | | | | | | | | |
Term Loan, 3.72%, Maturing April 18, 2024 | | | 1,475 | | | | 1,479,214 | |
Eldorado Resorts, LLC | | | | | | | | |
Term Loan, 3.38%, Maturing April 17, 2024 | | | 2,020 | | | | 2,008,260 | |
ESH Hospitality, Inc. | | | | | | | | |
Term Loan, 3.73%, Maturing August 30, 2023 | | | 3,873 | | | | 3,892,308 | |
Four Seasons Hotels Limited | | | | | | | | |
Term Loan, 3.73%, Maturing November 30, 2023 | | | 647 | | | | 650,995 | |
Gateway Casinos & Entertainment Limited | | | | | | | | |
Term Loan, 5.05%, Maturing February 22, 2023 | | | 300 | | | | 303,000 | |
Golden Nugget, Inc. | | | | | | | | |
Term Loan, 4.68%, Maturing November 21, 2019 | | | 354 | | | | 358,999 | |
Term Loan, 4.71%, Maturing November 21, 2019 | | | 826 | | | | 837,663 | |
Hilton Worldwide Finance, LLC | | | | | | | | |
Term Loan, 3.22%, Maturing October 25, 2023 | | | 3,301 | | | | 3,314,744 | |
La Quinta Intermediate Holdings, LLC | | | | | | | | |
Term Loan, 3.91%, Maturing April 14, 2021 | | | 1,985 | | | | 1,995,653 | |
| | | | | | | | |
| Borrower/Tranche Description | | Principal
Amount
(000’s omitted) | | | Value | |
| | | | | | | | |
|
Lodging and Casinos (continued) | |
MGM Growth Properties Operating Partnership L.P. | | | | | | | | |
Term Loan, 3.48%, Maturing April 25, 2023 | | $ | 1,259 | | | $ | 1,262,525 | |
Playa Resorts Holding B.V. | | | | | | | | |
Term Loan, 4.17%, Maturing April 5, 2024 | | | 775 | | | | 777,034 | |
RHP Hotel Properties L.P. | | | | | | | | |
Term Loan, 3.44%, Maturing May 11, 2024 | | | 623 | | | | 625,515 | |
Tropicana Entertainment, Inc. | | | | | | | | |
Term Loan, 4.30%, Maturing November 27, 2020 | | | 1,290 | | | | 1,296,520 | |
| | | | | | | | | |
| | | $ | 23,982,216 | |
| | | | | | | | | |
|
Nonferrous Metals / Minerals — 0.8% | |
Dynacast International, LLC | | | | | | | | |
Term Loan, 4.55%, Maturing January 28, 2022 | | $ | 864 | | | $ | 870,264 | |
Fairmount Santrol, Inc. | | | | | | | | |
Term Loan, 4.80%, Maturing September 5, 2019 | | | 2,038 | | | | 1,941,374 | |
Global Brass & Copper, Inc. | | | | | | | | |
Term Loan, 5.50%, Maturing July 18, 2023 | | | 546 | | | | 547,909 | |
Murray Energy Corporation | | | | | | | | |
Term Loan, 8.55%, Maturing April 16, 2020 | | | 1,246 | | | | 1,220,755 | |
New Day Aluminum, LLC | | | | | | | | |
Term Loan, 10.00%, (4.00% Cash, 6.00% PIK), Maturing October 28, 2020(3) | | | 14 | | | | 0 | |
Noranda Aluminum Acquisition Corporation | | | | | | | | |
Term Loan, 0.00%, Maturing February 28, 2019(3)(5) | | | 241 | | | | 39,660 | |
Oxbow Carbon, LLC | | | | | | | | |
Term Loan, 4.73%, Maturing January 19, 2020 | | | 494 | | | | 498,070 | |
| | | | | | | | | |
| | | $ | 5,118,032 | |
| | | | | | | | | |
|
Oil and Gas — 2.2% | |
Ameriforge Group, Inc. | | | | | | | | |
Term Loan, 14.30%, (9.30% Cash, 5.00% PIK), Maturing May 12, 2024 | | $ | 518 | | | $ | 545,378 | |
BCP Raptor, LLC | | | | | | | | |
Term Loan, 5.47%, Maturing June 6, 2024 | | | 525 | | | | 519,750 | |
Bronco Midstream Funding, LLC | | | | | | | | |
Term Loan, 5.17%, Maturing August 15, 2020 | | | 814 | | | | 824,695 | |
CITGO Holding, Inc. | | | | | | | | |
Term Loan, 9.80%, Maturing May 12, 2018 | | | 508 | | | | 512,942 | |
CITGO Petroleum Corporation | | | | | | | | |
Term Loan, 4.80%, Maturing July 29, 2021 | | | 1,258 | | | | 1,262,742 | |
Crestwood Holdings, LLC | | | | | | | | |
Term Loan, 9.21%, Maturing June 19, 2019 | | | 836 | | | | 819,015 | |
Energy Transfer Equity L.P. | | | | | | | | |
Term Loan, 3.83%, Maturing February 2, 2024 | | | 1,281 | | | | 1,275,900 | |
| | | | |
| | 13 | | See Notes to Financial Statements. |
Eaton Vance
VT Floating-Rate Income Fund
June 30, 2017
Portfolio of Investments (Unaudited) — continued
| | | | | | | | |
| Borrower/Tranche Description | | Principal
Amount
(000’s omitted) | | | Value | |
| | | | | | | | |
|
Oil and Gas (continued) | |
Fieldwood Energy, LLC | | | | | | | | |
Term Loan, 4.17%, Maturing September 28, 2018 | | $ | 636 | | | $ | 612,969 | |
Term Loan, 8.30%, Maturing August 31, 2020 | | | 125 | | | | 118,125 | |
Term Loan, 8.42%, Maturing September 30, 2020 | | | 165 | | | | 131,751 | |
Term Loan - Second Lien, 8.42%, Maturing September 30, 2020 | | | 260 | | | | 146,784 | |
Floatel International Ltd. | | | | | | | | |
Term Loan, 6.30%, Maturing June 27, 2020 | | | 232 | | | | 172,563 | |
MEG Energy Corp. | | | | | | | | |
Term Loan, 4.70%, Maturing December 31, 2023 | | | 3,580 | | | | 3,490,768 | |
Paragon Offshore Finance Company | | | | | | | | |
Term Loan, 6.00%, Maturing July 18, 2021 | | | 642 | | | | 248,325 | |
Seadrill Partners Finco, LLC | | | | | | | | |
Term Loan, 4.30%, Maturing February 21, 2021 | | | 2,291 | | | | 1,457,516 | |
Sheridan Investment Partners II L.P. | | | | | | | | |
Term Loan, 4.71%, Maturing December 16, 2020 | | | 22 | | | | 18,648 | |
Term Loan, 4.71%, Maturing December 16, 2020 | | | 59 | | | | 50,002 | |
Term Loan, 4.71%, Maturing December 16, 2020 | | | 425 | | | | 359,448 | |
Sheridan Production Partners I, LLC | | | | | | | | |
Term Loan, 4.73%, Maturing October 1, 2019 | | | 43 | | | | 37,255 | |
Term Loan, 4.73%, Maturing October 1, 2019 | | | 71 | | | | 60,994 | |
Term Loan, 4.73%, Maturing October 1, 2019 | | | 533 | | | | 460,301 | |
Southcross Energy Partners L.P. | | | | | | | | |
Term Loan, 5.55%, Maturing August 4, 2021 | | | 484 | | | | 432,500 | |
Southcross Holdings Borrower L.P. | | | | | | | | |
Term Loan, 9.00%, (3.50% Cash, 5.50% PIK), Maturing April 13, 2023 | | | 42 | | | | 37,364 | |
Ultra Resources, Inc. | | | | | | | | |
Term Loan, 4.12%, Maturing April 12, 2024 | | | 875 | | | | 870,352 | |
| | | | | | | | | |
| | | $ | 14,466,087 | |
| | | | | | | | | |
|
Publishing — 1.1% | |
Ascend Learning, LLC | | | | | | | | |
Term Loan, 5.73%, Maturing July 31, 2019 | | $ | 1,464 | | | $ | 1,467,283 | |
Getty Images, Inc. | | | | | | | | |
Term Loan, 4.80%, Maturing October 18, 2019 | | | 3,208 | | | | 2,966,111 | |
Harland Clarke Holdings Corp. | | | | | | | | |
Term Loan, 6.80%, Maturing February 9, 2022 | | | 298 | | | | 298,933 | |
LSC Communications, Inc. | | | | | | | | |
Term Loan, 7.23%, Maturing September 30, 2022 | | | 688 | | | | 694,375 | |
Merrill Communications, LLC | | | | | | | | |
Term Loan, 6.42%, Maturing June 1, 2022 | | | 368 | | | | 369,315 | |
ProQuest, LLC | | | | | | | | |
Term Loan, 5.48%, Maturing October 24, 2021 | | | 786 | | | | 792,384 | |
| | | | | | | | |
| Borrower/Tranche Description | | Principal
Amount
(000’s omitted) | | | Value | |
| | | | | | | | |
|
Publishing (continued) | |
Springer Science+Business Media Deutschland GmbH | | | | | | | | |
Term Loan, 4.80%, Maturing August 14, 2020 | | $ | 767 | | | $ | 768,788 | |
| | | | | | | | | |
| | | $ | 7,357,189 | |
| | | | | | | | | |
|
Radio and Television — 2.8% | |
ALM Media Holdings, Inc. | | | | | | | | |
Term Loan, 5.80%, Maturing July 31, 2020 | | $ | 303 | | | $ | 281,470 | |
AP NMT Acquisition B.V. | | | | | | | | |
Term Loan, 6.90%, Maturing August 13, 2021 | | | 316 | | | | 294,432 | |
CBS Radio, Inc. | | | | | | | | |
Term Loan, Maturing October 17, 2023(4) | | | 350 | | | | 351,896 | |
Term Loan, 4.72%, Maturing October 17, 2023 | | | 833 | | | | 839,745 | |
Cumulus Media Holdings, Inc. | | | | | | | | |
Term Loan, 4.48%, Maturing December 23, 2020 | | | 2,609 | | | | 2,110,040 | |
Entercom Radio, LLC | | | | | | | | |
Term Loan, 4.70%, Maturing November 1, 2023 | | | 668 | | | | 671,757 | |
Entravision Communications Corporation | | | | | | | | |
Term Loan, 3.80%, Maturing May 31, 2020 | | | 1,843 | | | | 1,847,211 | |
Gray Television, Inc. | | | | | | | | |
Term Loan, 3.55%, Maturing February 7, 2024 | | | 149 | | | | 150,407 | |
Hubbard Radio, LLC | | | | | | | | |
Term Loan, 4.48%, Maturing May 27, 2022 | | | 354 | | | | 353,971 | |
iHeartCommunications, Inc. | | | | | | | | |
Term Loan, 7.98%, Maturing January 30, 2019 | | | 453 | | | | 371,356 | |
Term Loan, 8.73%, Maturing July 30, 2019 | | | 146 | | | | 119,434 | |
Mission Broadcasting, Inc. | | | | | | | | |
Term Loan, 4.25%, Maturing January 17, 2024 | | | 207 | | | | 207,531 | |
Nexstar Broadcasting, Inc. | | | | | | | | |
Term Loan, 4.24%, Maturing January 17, 2024 | | | 2,092 | | | | 2,100,354 | |
Raycom TV Broadcasting, LLC | | | | | | | | |
Term Loan, 4.23%, Maturing August 4, 2021 | | | 424 | | | | 423,966 | |
Sinclair Television Group, Inc. | | | | | | | | |
Term Loan, 3.48%, Maturing January 3, 2024 | | | 2,214 | | | | 2,219,170 | |
Townsquare Media, Inc. | | | | | | | | |
Term Loan, 4.30%, Maturing April 1, 2022 | | | 2,095 | | | | 2,106,408 | |
Univision Communications, Inc. | | | | | | | | |
Term Loan, 3.98%, Maturing March 15, 2024 | | | 4,155 | | | | 4,085,786 | |
| | | | | | | | | |
| | | $ | 18,534,934 | |
| | | | | | | | | |
|
Retailers (Except Food and Drug) — 4.0% | |
Ascena Retail Group, Inc. | | | | | | | | |
Term Loan, 5.63%, Maturing August 21, 2022 | | $ | 1,440 | | | $ | 1,226,459 | |
Bass Pro Group, LLC | | | | | | | | |
Term Loan, 4.37%, Maturing June 5, 2020 | | | 1,468 | | | | 1,466,945 | |
Term Loan, 6.30%, Maturing December 16, 2023 | | | 900 | | | | 876,616 | |
| | | | |
| | 14 | | See Notes to Financial Statements. |
Eaton Vance
VT Floating-Rate Income Fund
June 30, 2017
Portfolio of Investments (Unaudited) — continued
| | | | | | | | |
| Borrower/Tranche Description | | Principal
Amount
(000’s omitted) | | | Value | |
| | | | | | | | |
|
Retailers (Except Food and Drug) (continued) | |
BJ’s Wholesale Club, Inc. | | | | | | | | |
Term Loan, 4.97%, Maturing February 3, 2024 | | $ | 700 | | | $ | 680,240 | |
CDW, LLC | | | | | | | | |
Term Loan, 3.30%, Maturing August 17, 2023 | | | 2,115 | | | | 2,125,725 | |
Coinamatic Canada, Inc. | | | | | | | | |
Term Loan, 4.48%, Maturing May 14, 2022 | | | 103 | | | | 103,043 | |
David’s Bridal, Inc. | | | | | | | | |
Term Loan, 5.30%, Maturing October 11, 2019 | | | 1,589 | | | | 1,231,352 | |
Evergreen Acqco 1 L.P. | | | | | | | | |
Term Loan, 5.00%, Maturing July 9, 2019 | | | 949 | | | | 903,647 | |
Harbor Freight Tools USA, Inc. | | | | | | | | |
Term Loan, 4.48%, Maturing August 18, 2023 | | | 1,537 | | | | 1,539,193 | |
J. Crew Group, Inc. | | | | | | | | |
Term Loan, 4.25%, Maturing March 5, 2021 | | | 1,941 | | | | 1,172,057 | |
LSF9 Atlantis Holdings, LLC | | | | | | | | |
Term Loan, 7.06%, Maturing May 1, 2023 | | | 725 | | | | 732,477 | |
Men’s Wearhouse, Inc. (The) | | | | | | | | |
Term Loan, 4.61%, Maturing June 18, 2021 | | | 552 | | | | 529,516 | |
Michaels Stores, Inc. | | | | | | | | |
Term Loan, 3.94%, Maturing January 30, 2023 | | | 1,872 | | | | 1,870,111 | |
Neiman Marcus Group Ltd., LLC | | | | | | | | |
Term Loan, 4.34%, Maturing October 25, 2020 | | | 1,598 | | | | 1,209,137 | |
Party City Holdings, Inc. | | | | | | | | |
Term Loan, 4.19%, Maturing August 19, 2022 | | | 2,539 | | | | 2,544,126 | |
PetSmart, Inc. | | | | | | | | |
Term Loan, 4.22%, Maturing March 11, 2022 | | | 2,708 | | | | 2,521,783 | |
PFS Holding Corporation | | | | | | | | |
Term Loan, 4.73%, Maturing January 31, 2021 | | | 1,113 | | | | 1,055,603 | |
Pier 1 Imports (U.S.), Inc. | | | | | | | | |
Term Loan, 4.80%, Maturing April 30, 2021 | | | 340 | | | | 328,042 | |
Pilot Travel Centers, LLC | | | | | | | | |
Term Loan, 3.23%, Maturing May 25, 2023 | | | 1,039 | | | | 1,045,994 | |
Rent-A-Center, Inc. | | | | | | | | |
Term Loan, 4.23%, Maturing March 19, 2021 | | | 77 | | | | 76,084 | |
Toys ‘R’ Us Property Company I, LLC | | | | | | | | |
Term Loan, 6.23%, Maturing August 21, 2019 | | | 2,054 | | | | 1,979,540 | |
Vivid Seats Ltd. | | | | | | | | |
Term Loan, Maturing June 21, 2024(4) | | | 775 | | | | 776,938 | |
| | | | | | | | | |
| | | $ | 25,994,628 | |
| | | | | | | | | |
|
Steel — 0.6% | |
Neenah Foundry Company | | | | | | | | |
Term Loan, 7.75%, Maturing April 26, 2019 | | $ | 566 | | | $ | 561,984 | |
Zekelman Industries, Inc. | | | | | | | | |
Term Loan, 4.79%, Maturing June 14, 2021 | | | 3,122 | | | | 3,150,594 | |
| | | | | | | | | |
| | | $ | 3,712,578 | |
| | | | | | | | | |
| | | | | | | | |
| Borrower/Tranche Description | | Principal
Amount
(000’s omitted) | | | Value | |
|
Surface Transport — 0.3% | |
Hertz Corporation (The) | | | | | | | | |
Term Loan, 3.98%, Maturing June 30, 2023 | | $ | 693 | | | $ | 692,080 | |
Kenan Advantage Group, Inc. | | | | | | | | |
Term Loan, 4.23%, Maturing July 31, 2022 | | | 115 | | | | 115,392 | |
Term Loan, 4.23%, Maturing July 31, 2022 | | | 379 | | | | 379,451 | |
PODS, LLC | | | | | | | | |
Term Loan, 4.34%, Maturing February 2, 2022 | | | 249 | | | | 250,278 | |
Stena International S.a.r.l. | | | | | | | | |
Term Loan, 4.30%, Maturing March 3, 2021 | | | 992 | | | | 865,247 | |
| | | | | | | | | |
| | | $ | 2,302,448 | |
| | | | | | | | | |
|
Telecommunications — 4.5% | |
CenturyLink, Inc. | | | | | | | | |
Term Loan, 1.38%, Maturing January 31, 2025 | | $ | 3,800 | | | $ | 3,763,357 | |
Ciena Corporation | | | | | | | | |
Term Loan, 3.71%, Maturing January 28, 2022 | | | 1,977 | | | | 1,987,187 | |
Colorado Buyer, Inc. | | | | | | | | |
Term Loan, 4.17%, Maturing May 1, 2024 | | | 1,600 | | | | 1,611,600 | |
Consolidated Communications, Inc. | | | | | | | | |
Term Loan, 4.23%, Maturing October 4, 2023 | | | 273 | | | | 274,780 | |
Term Loan, Maturing October 5, 2023(4) | | | 475 | | | | 477,494 | |
Digicel International Finance Limited | | | | | | | | |
Term Loan, 4.94%, Maturing May 28, 2024 | | | 575 | | | | 579,552 | |
Frontier Communications Corp. | | | | | | | | |
Term Loan, 4.91%, Maturing June 15, 2024 | | | 1,425 | | | | 1,405,406 | |
Global Eagle Entertainment, Inc. | | | | | | | | |
Term Loan, 8.32%, Maturing January 6, 2023 | | | 845 | | | | 749,660 | |
Intelsat Jackson Holdings S.A. | | | | | | | | |
Term Loan, 4.00%, Maturing June 30, 2019 | | | 5,000 | | | | 4,964,585 | |
IPC Corp. | | | | | | | | |
Term Loan, 5.68%, Maturing August 6, 2021 | | | 1,124 | | | | 1,067,919 | |
Level 3 Financing, Inc. | | | | | | | | |
Term Loan, 3.47%, Maturing February 22, 2024 | | | 1,925 | | | | 1,931,818 | |
Onvoy, LLC | | | | | | | | |
Term Loan, 5.80%, Maturing February 10, 2024 | | | 524 | | | | 525,215 | |
Sprint Communications, Inc. | | | | | | | | |
Term Loan, 3.75%, Maturing February 2, 2024 | | | 5,486 | | | | 5,492,126 | |
Switch, Ltd. | | | | | | | | |
Term Loan, Maturing June 20, 2024(4) | | | 200 | | | | 201,000 | |
Syniverse Holdings, Inc. | | | | | | | | |
Term Loan, 4.17%, Maturing April 23, 2019 | | | 843 | | | | 790,439 | |
Term Loan, 4.30%, Maturing April 23, 2019 | | | 639 | | | | 598,818 | |
Telesat Canada | | | | | | | | |
Term Loan, 4.30%, Maturing November 17, 2023 | | | 3,350 | | | | 3,373,456 | |
| | | | | | | | | |
| | | | | | $ | 29,794,412 | |
| | | | | | | | | |
| | | | |
| | 15 | | See Notes to Financial Statements. |
Eaton Vance
VT Floating-Rate Income Fund
June 30, 2017
Portfolio of Investments (Unaudited) — continued
| | | | | | | | |
| Borrower/Tranche Description | | Principal
Amount
(000’s omitted) | | | Value | |
| | | | | | | | |
|
Utilities — 1.9% | |
Calpine Construction Finance Company L.P. | | | | | | | | |
Term Loan, 3.73%, Maturing January 31, 2022 | | $ | 578 | | | $ | 576,546 | |
Calpine Corporation | | | | | | | | |
Term Loan, 2.98%, Maturing November 30, 2017 | | | 436 | | | | 436,909 | |
Term Loan, 2.98%, Maturing December 31, 2019 | | | 299 | | | | 299,554 | |
Term Loan, 4.05%, Maturing January 15, 2024 | | | 4,937 | | | | 4,937,215 | |
Dayton Power & Light Company (The) | | | | | | | | |
Term Loan, 4.48%, Maturing August 24, 2022 | | | 373 | | | | 379,300 | |
Granite Acquisition, Inc. | | | | | | | | |
Term Loan, 5.30%, Maturing December 19, 2021 | | | 78 | | | | 78,366 | |
Term Loan, 5.30%, Maturing December 19, 2021 | | | 1,728 | | | | 1,737,240 | |
Invenergy Thermal Operating I, LLC | | | | | | | | |
Term Loan, 6.80%, Maturing October 19, 2022 | | | 120 | | | | 115,677 | |
Lightstone Generation, LLC | | | | | | | | |
Term Loan, 5.72%, Maturing January 30, 2024 | | | 1,054 | | | | 1,032,223 | |
Term Loan, 5.73%, Maturing January 30, 2024 | | | 65 | | | | 63,841 | |
Lonestar Generation, LLC | | | | | | | | |
Term Loan, 5.45%, Maturing February 22, 2021 | | | 880 | | | | 721,670 | |
Longview Power, LLC | | | | | | | | |
Term Loan, 7.23%, Maturing April 13, 2021 | | | 1,152 | | | | 785,899 | |
Talen Energy Supply, LLC | | | | | | | | |
Term Loan, 5.23%, Maturing April 15, 2024 | | | 548 | | | | 511,108 | |
TPF II Power, LLC | | | | | | | | |
Term Loan, 5.23%, Maturing October 2, 2023 | | | 903 | | | | 903,653 | |
| | | | | | | | | |
| | | | | | $ | 12,579,201 | |
| | | | | | | | | |
| | |
Total Senior Floating-Rate Loans
(identified cost $601,945,047) | | | | | | $ | 596,396,469 | |
| | | | | | | | | |
|
| Corporate Bonds & Notes — 2.4% | |
| | |
| | | | | | | | |
| Security | | Principal
Amount
(000’s omitted) | | | Value | |
| | | | | | | | |
|
Chemicals and Plastics — 0.4% | |
Hexion, Inc. | | | | | | | | |
6.625%, 4/15/20 | | $ | 2,975 | | | $ | 2,729,562 | |
| | | | | | | | | |
| | | | | | $ | 2,729,562 | |
| | | | | | | | | |
|
Containers and Glass Products — 0.4% | |
Reynolds Group Issuer, Inc./Reynolds Group Issuer, LLC | | | | | | | | |
5.75%, 10/15/20 | | $ | 1,925 | | | $ | 1,972,336 | |
4.658%, 7/15/21(6)(7) | | | 650 | | | | 662,187 | |
| | | | | | | | | |
| | | | | | $ | 2,634,523 | |
| | | | | | | | | |
| | | | | | | | |
| Security | | Principal
Amount
(000’s omitted) | | | Value | |
| | | | | | | | |
|
Drugs — 0.3% | |
Valeant Pharmaceuticals International, Inc. | | | | | | | | |
6.50%, 3/15/22(6) | | $ | 712 | | | $ | 748,490 | |
7.00%, 3/15/24(6) | | | 925 | | | | 974,719 | |
| | | | | | | | | |
| | | | | | $ | 1,723,209 | |
| | | | | | | | | |
|
Electronics / Electrical — 0.2% | |
Western Digital Corp. | | | | | | | | |
7.375%, 4/1/23(6) | | $ | 950 | | | $ | 1,046,188 | |
| | | | | | | | | |
| | | | | | $ | 1,046,188 | |
| | | | | | | | | |
|
Health Care — 0.3% | |
CHS/Community Health Systems, Inc. | | | | | | | | |
6.25%, 3/31/23 | | $ | 1,100 | | | $ | 1,139,710 | |
RegionalCare Hospital Partners Holdings, Inc. | | | | | | | | |
8.25%, 5/1/23(6) | | | 875 | | | | 942,812 | |
| | | | | | | | | |
| | | | | | $ | 2,082,522 | |
| | | | | | | | | |
|
Lodging and Casinos — 0.3% | |
Caesars Entertainment Operating Co., Inc. | | | | | | | | |
8.50%, 2/15/20(5) | | $ | 1,107 | | | $ | 1,427,435 | |
9.00%, 2/15/20(5) | | | 615 | | | | 792,993 | |
| | | | | | | | | |
| | | | | | $ | 2,220,428 | |
| | | | | | | | | |
|
Radio and Television — 0.3% | |
iHeartCommunications, Inc. | |
9.00%, 12/15/19 | | $ | 181 | | | $ | 142,764 | |
Univision Communications, Inc. | | | | | | | | |
6.75%, 9/15/22(6) | | | 384 | | | | 400,320 | |
5.125%, 2/15/25(6) | | | 1,500 | | | | 1,490,625 | |
| | | | | | | | | |
| | | | | | $ | 2,033,709 | |
| | | | | | | | | |
|
Retailers (Except Food and Drug) — 0.1% | |
Fresh Market, Inc. (The) | | | | | | | | |
9.75%, 5/1/23(6) | | $ | 800 | | | $ | 673,000 | |
| | | | | | | | | |
| | | | | | $ | 673,000 | |
| | | | | | | | | |
|
Telecommunications — 0.0%(8) | |
Wind Acquisition Finance S.A. | | | | | | | | |
6.50%, 4/30/20(6) | | $ | 250 | | | $ | 259,063 | |
| | | | | | | | | |
| | | | | | $ | 259,063 | |
| | | | | | | | | |
| | | | |
| | 16 | | See Notes to Financial Statements. |
Eaton Vance
VT Floating-Rate Income Fund
June 30, 2017
Portfolio of Investments (Unaudited) — continued
| | | | | | | | |
| Security | | Principal
Amount
(000’s omitted) | | | Value | |
| | | | | | | | |
|
Utilities — 0.1% | |
Calpine Corp. | | | | | | | | |
5.25%, 6/1/26(6) | | $ | 700 | | | $ | 689,500 | |
| | | | | | | | | |
| | | | | | $ | 689,500 | |
| | | | | | | | | |
| |
Total Corporate Bonds & Notes
(identified cost $15,547,753) | | | $ | 16,091,704 | |
| | | | | | | | | |
|
| Common Stocks — 1.3% | |
| | |
| | | | | | | | |
| Security | | Shares | | | Value | |
| | |
Aerospace and Defense — 0.1% | | | | | | | | |
IAP Global Services, LLC(3)(9)(10) | | | 24 | | | $ | 384,257 | |
| | | | | | | | | |
| | | | | | $ | 384,257 | |
| | | | | | | | | |
|
Automotive — 0.1% | |
Dayco Products, LLC(3)(9)(10) | | | 15,250 | | | $ | 480,375 | |
| | | | | | | | | |
| | | | | | $ | 480,375 | |
| | | | | | | | | |
|
Business Equipment and Services — 0.0%(8) | |
Education Management Corp.(3)(9)(10) | | | 2,351,823 | | | $ | 0 | |
RCS Capital Corp.(9)(10) | | | 18,158 | | | | 295,067 | |
| | | | | | | | | |
| | | | | | $ | 295,067 | |
| | | | | | | | | |
|
Electronics / Electrical — 0.0%(8) | |
Answers Corp.(9)(10) | | | 20,672 | | | $ | 312,664 | |
| | | | | | | | | |
| | | | | | $ | 312,664 | |
| | | | | | | | | |
|
Health Care — 0.0%(8) | |
New Millennium Holdco, Inc.(9)(10) | | | 13,578 | | | $ | 25,459 | |
| | | | | | | | | |
| | | | | | $ | 25,459 | |
| | | | | | | | | |
|
Lodging and Casinos — 0.5% | |
Tropicana Entertainment, Inc.(9)(10) | | | 71,982 | | | $ | 3,066,433 | |
| | | | | | | | | |
| | | | | | $ | 3,066,433 | |
| | | | | | | | | |
|
Oil and Gas — 0.3% | |
Ameriforge Group, Inc.(3)(9)(10) | | | 33,640 | | | $ | 1,177,400 | |
Samson Resources II, LLC, Class A(9)(10) | | | 33,971 | | | | 803,981 | |
Southcross Holdings Group, LLC(3)(9)(10) | | | 44 | | | | 0 | |
Southcross Holdings L.P., Class A(9)(10) | | | 44 | | | | 25,190 | |
| | | | | | | | | |
| | | | | | $ | 2,006,571 | |
| | | | | | | | | |
| | | | | | | | |
| Security | | Shares | | | Value | |
| | | | | | | | |
|
Publishing — 0.3% | |
ION Media Networks, Inc.(3)(9) | | | 399 | | | $ | 201,643 | |
MediaNews Group, Inc.(3)(9)(10) | | | 45,600 | | | | 1,606,036 | |
Nelson Education, Ltd.(3)(9)(10) | | | 38,210 | | | | 0 | |
| | | | | | | | | |
| | | | | | $ | 1,807,679 | |
| | | | | | | | | |
| | |
Total Common Stocks
(identified cost $4,355,877) | | | | | | $ | 8,378,505 | |
| | | | | | | | | |
|
| Convertible Preferred Stocks — 0.0% | |
| | |
| | | | | | | | |
| Security | | Shares | | | Value | |
|
Business Equipment and Services — 0.0% | |
Education Management Corp., Series A-1, 7.50%(3)(9)(10) | | | 2,617 | | | $ | 0 | |
| | | | | | | | | |
| |
Total Convertible Preferred Stocks
(identified cost $184,700) | | | $ | 0 | |
| | | | | | | | | |
| |
Total Investments — 94.8%
(identified cost $622,033,377) | | | $ | 620,866,678 | |
| | | | | | | | | |
| |
Less Unfunded Loan Commitments — (0.0)% (8) | | | $ | (357,521 | ) |
| | | | | | | | | |
| |
Net Investments — 94.8%
(identified cost $621,675,856) | | | $ | 620,509,157 | |
| | | | | | | | | |
| |
Other Assets, Less Liabilities — 5.2% | | | $ | 34,277,743 | |
| | | | | | | | | |
| |
Net Assets — 100.0% | | | $ | 654,786,900 | |
| | | | | | | | | |
The percentage shown for each investment category in the Portfolio of Investments is based on net assets.
| | (1) | Senior floating-rate loans (Senior Loans) often require prepayments from excess cash flows or permit the borrowers to repay at their election. The degree to which borrowers repay, whether as a contractual requirement or at their election, cannot be predicted with accuracy. As a result, the actual remaining maturity may be substantially less than the stated maturities shown. However, Senior Loans will typically have an expected average life of approximately two to four years. The stated interest rate represents the weighted average interest rate of all contracts within the senior loan facility and includes commitment fees on unfunded loan commitments, if any. Senior Loans typically have rates of interest which are redetermined either daily, monthly, quarterly or semi-annually by reference to a base lending rate, plus a premium. These base lending rates are primarily the London Interbank Offered Rate (“LIBOR”) and secondarily, the prime rate offered by one or more major United States banks (the “Prime Rate”) and the certificate of deposit (“CD”) rate or other base lending rates used by commercial lenders. |
| | (2) | Unfunded or partially unfunded loan commitments. See Note 1F for description. |
| | (3) | For fair value measurement disclosure purposes, security is categorized as Level 3 (see Note 10). |
| | | | |
| | 17 | | See Notes to Financial Statements. |
Eaton Vance
VT Floating-Rate Income Fund
June 30, 2017
Portfolio of Investments (Unaudited) — continued
| | (4) | This Senior Loan will settle after June 30, 2017, at which time the interest rate will be determined. |
| | (5) | Currently the issuer is in default with respect to interest and/or principal payments. For a variable rate security, interest rate has been adjusted to reflect non-accrual status. |
| | (6) | Security exempt from registration pursuant to Rule 144A under the Securities Act of 1933, as amended. These securities may be sold in certain transactions in reliance on an exemption from registration (normally to qualified institutional buyers). At June 30, 2017, the aggregate value of these securities is $7,886,904 or 1.2% of the Fund’s net assets. |
| | (7) | Variable rate security. The stated interest rate represents the rate in effect at June 30, 2017. |
| | (8) | Amount is less than 0.05% or (0.05)%, as applicable. |
| | (9) | Security was acquired in connection with a restructuring of a Senior Loan and may be subject to restrictions on resale. |
| (10) | Non-income producing security. |
Abbreviations:
| | | | |
| | 18 | | See Notes to Financial Statements. |
Eaton Vance
VT Floating-Rate Income Fund
June 30, 2017
Statement of Assets and Liabilities (Unaudited)
| | | | |
| Assets | | June 30, 2017 | |
Investments, at value (identified cost, $621,675,856) | | $ | 620,509,157 | |
Cash | | | 45,485,391 | |
Interest receivable | | | 1,088,794 | |
Receivable for investments sold | | | 3,465,458 | |
Receivable for Fund shares sold | | | 92,165 | |
Prepaid expenses | | | 65,859 | |
Total assets | | $ | 670,706,824 | |
| |
| Liabilities | | | | |
Payable for investments purchased | | $ | 14,766,719 | |
Payable for Fund shares redeemed | | | 402,806 | |
Payable to affiliates: | | | | |
Investment adviser fee | | | 308,798 | |
Distribution fees | | | 133,593 | |
Trustees’ fees | | | 9,442 | |
Payable for shareholder servicing fees | | | 184,367 | |
Accrued expenses | | | 114,199 | |
Total liabilities | | $ | 15,919,924 | |
Net Assets | | $ | 654,786,900 | |
| |
| Sources of Net Assets | | | | |
Paid-in capital | | $ | 658,399,420 | |
Accumulated net realized loss | | | (6,326,941 | ) |
Accumulated undistributed net investment income | | | 3,881,120 | |
Net unrealized depreciation | | | (1,166,699 | ) |
Total | | $ | 654,786,900 | |
| |
| Initial Class Shares | | | | |
Net Assets | | $ | 651,441,906 | |
Shares Outstanding | | | 70,226,776 | |
Net Asset Value, Offering Price and Redemption Price Per Share | | | | |
(net assets ÷ shares of beneficial interest outstanding) | | $ | 9.28 | |
| |
| ADV Class Shares | | | | |
Net Assets | | $ | 3,343,964 | |
Shares Outstanding | | | 360,185 | |
Net Asset Value, Offering Price and Redemption Price Per Share | | | | |
(net assets ÷ shares of beneficial interest outstanding) | | $ | 9.28 | |
| |
| Institutional Class Shares | | | | |
Net Assets | | $ | 1,030 | |
Shares Outstanding | | | 111 | |
Net Asset Value, Offering Price and Redemption Price Per Share | | | | |
(net assets ÷ shares of beneficial interest outstanding) | | $ | 9.28 | |
| | | | |
| | 19 | | See Notes to Financial Statements. |
Eaton Vance
VT Floating-Rate Income Fund
June 30, 2017
Statement of Operations (Unaudited)
| | | | |
| Investment Income | | Six Months Ended June 30, 2017 | |
Interest and other income | | $ | 13,714,708 | |
Total investment income | | $ | 13,714,708 | |
| |
| Expenses | | | | |
Investment adviser fee | | $ | 1,827,419 | |
Distribution fees | | | | |
Initial Class | | | 790,928 | |
Shareholder servicing fees | | | | |
Initial Class | | | 707,711 | |
ADV Class | | | 3,234 | |
Trustees’ fees and expenses | | | 21,130 | |
Custodian fee | | | 120,133 | |
Transfer and dividend disbursing agent fees | | | 5,928 | |
Legal and accounting services | | | 127,835 | |
Printing and postage | | | 3,838 | |
Interest expense and fees | | | 81,538 | |
Miscellaneous | | | 16,124 | |
Total expenses | | $ | 3,705,818 | |
| |
Net investment income | | $ | 10,008,890 | |
| |
| Realized and Unrealized Gain (Loss) | | | | |
Net realized gain (loss) — | | | | |
Investment transactions | | $ | 55,466 | |
Net realized gain | | $ | 55,466 | |
Change in unrealized appreciation (depreciation) — | | | | |
Investments | | $ | 751,123 | |
Net change in unrealized appreciation (depreciation) | | $ | 751,123 | |
| |
Net realized and unrealized gain | | $ | 806,589 | |
| |
Net increase in net assets from operations | | $ | 10,815,479 | |
| | | | |
| | 20 | | See Notes to Financial Statements. |
Eaton Vance
VT Floating-Rate Income Fund
June 30, 2017
Statements of Changes in Net Assets
| | | | | | | | |
| Increase (Decrease) in Net Assets | | Six Months Ended June 30, 2017
(Unaudited) | | | Year Ended December 31, 2016 | |
From operations — | | | | | | | | |
Net investment income | | $ | 10,008,890 | | | $ | 19,648,983 | |
Net realized gain (loss) from investment transactions | | | 55,466 | | | | (2,224,492 | ) |
Net change in unrealized appreciation (depreciation) from investments | | | 751,123 | | | | 31,042,559 | |
Net increase in net assets from operations | | $ | 10,815,479 | | | $ | 48,467,050 | |
Distributions to shareholders — | | | | | | | | |
From net investment income | | | | | | | | |
Initial Class | | $ | (9,960,416 | ) | | $ | (19,557,087 | ) |
ADV Class | | | (48,985 | ) | | | (91,360 | ) |
Institutional Class | | | (18 | ) | | | (27 | ) |
Total distributions to shareholders | | $ | (10,009,419 | ) | | $ | (19,648,474 | ) |
Transactions in shares of beneficial interest — | | | | | | | | |
Proceeds from sale of shares | | | | | | | | |
Initial Class | | $ | 97,230,613 | | | $ | 215,567,063 | |
ADV Class | | | 1,177,234 | | | | 208,394 | |
Institutional Class | | | — | | | | 1,000 | |
Net asset value of shares issued to shareholders in payment of distributions declared | | | | | | | | |
Initial Class | | | 9,960,416 | | | | 19,557,087 | |
ADV Class | | | 48,957 | | | | 91,322 | |
Cost of shares redeemed | | | | | | | | |
Initial Class | | | (83,502,459 | ) | | | (170,971,111 | ) |
ADV Class | | | (417,404 | ) | | | (303,041 | ) |
Net increase in net assets from Fund share transactions | | $ | 24,497,357 | | | $ | 64,150,714 | |
| | |
Net increase in net assets | | $ | 25,303,417 | | | $ | 92,969,290 | |
| | |
| Net Assets | | | | | | | | |
At beginning of period | | $ | 629,483,483 | | | $ | 536,514,193 | |
At end of period | | $ | 654,786,900 | | | $ | 629,483,483 | |
| | |
Accumulated undistributed net investment income
included in net assets | | | | | | | | |
At end of period | | $ | 3,881,120 | | | $ | 3,881,649 | |
| | | | |
| | 21 | | See Notes to Financial Statements. |
Eaton Vance
VT Floating-Rate Income Fund
June 30, 2017
Financial Highlights
| | | | | | | | | | | | | | | | | | | | | | | | |
| | | Initial Class | |
| | | Six Months Ended
June 30, 2017
(Unaudited) | | | Year Ended December 31, | |
| | | | 2016 | | | 2015 | | | 2014 | | | 2013 | | | 2012 | |
Net asset value — Beginning of period | | $ | 9.260 | | | $ | 8.800 | | | $ | 9.190 | | | $ | 9.430 | | | $ | 9.460 | | | $ | 9.300 | |
| | | | | | |
| Income (Loss) From Operations | | | | | | | | | | | | | | | | | | | | | | | | |
Net investment income(1) | | $ | 0.145 | | | $ | 0.314 | | | $ | 0.306 | | | $ | 0.295 | | | $ | 0.327 | | | $ | 0.396 | |
Net realized and unrealized gain (loss) | | | 0.020 | | | | 0.460 | | | | (0.390 | ) | | | (0.240 | ) | | | 0.031 | | | | 0.270 | |
| | | | | | |
Total income (loss) from operations | | $ | 0.165 | | | $ | 0.774 | | | $ | (0.084 | ) | | $ | 0.055 | | | $ | 0.358 | | | $ | 0.666 | |
| | | | | | |
| Less Distributions | | | | | | | | | | | | | | | | | | | | | | | | |
From net investment income | | $ | (0.145 | ) | | $ | (0.314 | ) | | $ | (0.306 | ) | | $ | (0.295 | ) | | $ | (0.332 | ) | | $ | (0.396 | ) |
From net realized gain | | | — | | | | — | | | | — | | | | — | | | | (0.056 | ) | | | (0.110 | ) |
| | | | | | |
Total distributions | | $ | (0.145 | ) | | $ | (0.314 | ) | | $ | (0.306 | ) | | $ | (0.295 | ) | | $ | (0.388 | ) | | $ | (0.506 | ) |
| | | | | | |
Net asset value — End of period | | $ | 9.280 | | | $ | 9.260 | | | $ | 8.800 | | | $ | 9.190 | | | $ | 9.430 | | | $ | 9.460 | |
| | | | | | |
Total Return(2)(3) | | | 1.79 | %(4) | | | 8.95 | % | | | (0.99 | )% | | | 0.57 | % | | | 3.85 | % | | | 7.33 | % |
| | | | | | |
| Ratios/Supplemental Data | | | | | | | | | | | | | | | | | | | | | | | | |
Net assets, end of period (000’s omitted) | | $ | 651,442 | | | $ | 626,950 | | | $ | 534,104 | | | $ | 625,638 | | | $ | 585,888 | | | $ | 419,898 | |
Ratios (as a percentage of average daily net assets): | | | | | | | | | | | | | | | | | | | | | | | | |
Expenses(3) | | | 1.17 | %(5) | | | 1.18 | % | | | 1.16 | %(6) | | | 1.15 | %(6) | | | 1.15 | %(7) | | | 1.16 | %(6) |
Net investment income | | | 3.15 | %(5) | | | 3.48 | % | | | 3.34 | % | | | 3.15 | % | | | 3.45 | % | | | 4.21 | % |
Portfolio Turnover | | | 25 | %(4) | | | 44 | % | | | 19 | % | | | 29 | % | | | 38 | % | | | 42 | % |
| (1) | Computed using average shares outstanding. |
| (2) | Returns are historical and are calculated by determining the percentage change in net asset value with all distributions reinvested. |
| (3) | Excludes fees and expenses imposed by variable annuity contracts or variable life insurance policies. If included, performance would be lower. |
| (6) | Excludes the effect of custody fee credits, if any, of less than 0.005%. Effective September 1, 2015, custody fee credits, which were earned on cash deposit balances, were discontinued by the custodian. |
| (7) | Expenses after custodian fee reduction were 1.14%. |
| | | | |
| | 22 | | See Notes to Financial Statements. |
Eaton Vance
VT Floating-Rate Income Fund
June 30, 2017
Financial Highlights — continued
| | | | | | | | | | | | | | | | |
| | | ADV Class | |
| | | Six Months Ended
June 30, 2017
(Unaudited) | | | Year Ended December 31, | | | Period Ended December 31, 2014(1) | |
| | | | 2016 | | | 2015 | | |
Net asset value — Beginning of period | | $ | 9.270 | | | $ | 8.810 | | | $ | 9.190 | | | $ | 9.400 | |
|
| Income (Loss) From Operations | |
Net investment income(2) | | $ | 0.157 | | | $ | 0.337 | | | $ | 0.328 | | | $ | 0.234 | |
Net realized and unrealized gain (loss) | | | 0.010 | | | | 0.460 | | | | (0.379 | ) | | | (0.216 | ) |
| | | | |
Total income (loss) from operations | | $ | 0.167 | | | $ | 0.797 | | | $ | (0.051 | ) | | $ | 0.018 | |
|
| Less Distributions | |
From net investment income | | $ | (0.157 | ) | | $ | (0.337 | ) | | $ | (0.329 | ) | | $ | (0.228 | ) |
| | | | |
Total distributions | | $ | (0.157 | ) | | $ | (0.337 | ) | | $ | (0.329 | ) | | $ | (0.228 | ) |
| | | | |
Net asset value — End of period | | $ | 9.280 | | | $ | 9.270 | | | $ | 8.810 | | | $ | 9.190 | |
| | | | |
Total Return(3)(4) | | | 1.81 | %(5) | | | 9.21 | % | | | (0.63 | )% | | | 0.18 | %(5) |
|
| Ratios/Supplemental Data | |
Net assets, end of period (000’s omitted) | | $ | 3,344 | | | $ | 2,532 | | | $ | 2,410 | | | $ | 615 | |
Ratios (as a percentage of average daily net assets): | | | | | | | | | | | | | | | | |
Expenses(4) | | | 0.92 | %(6) | | | 0.94 | % | | | 0.91 | %(7) | | | 0.90 | %(6)(7) |
Net investment income | | | 3.40 | %(6) | | | 3.73 | % | | | 3.62 | % | | | 3.52 | %(6) |
Portfolio Turnover | | | 25 | %(5) | | | 44 | % | | | 19 | % | | | 29 | %(8) |
| (1) | For the period from commencement of operations on April 15, 2014 to December 31, 2014. |
| (2) | Computed using average shares outstanding. |
| (3) | Returns are historical and are calculated by determining the percentage change in net asset value with all distributions reinvested. |
| (4) | Excludes fees and expenses imposed by variable annuity contracts or variable life insurance policies. If included, performance would be lower. |
| (7) | Excludes the effect of custody fee credits, if any, of less than 0.005%. Effective September 1, 2015, custody fee credits, which were earned on cash deposit balances, were discontinued by the custodian. |
| (8) | For the year ended December 31, 2014. |
| | | | |
| | 23 | | See Notes to Financial Statements. |
Eaton Vance
VT Floating-Rate Income Fund
June 30, 2017
Financial Highlights — continued
| | | | | | | | |
| | | Institutional Class | |
| | | Six Months Ended
June 30, 2017
(Unaudited) | | | Period Ended December 31, 2016(1) | |
Net asset value — Beginning of period | | $ | 9.270 | | | $ | 9.010 | |
|
| Income (Loss) From Operations | |
Net investment income(2) | | $ | 0.163 | | | $ | 0.240 | |
Net realized and unrealized gain | | | 0.015 | | | | 0.266 | |
| | |
Total income from operations | | $ | 0.178 | | | $ | 0.506 | |
|
| Less Distributions | |
From net investment income | | $ | (0.168 | ) | | $ | (0.246 | ) |
| | |
Total distributions | | $ | (0.168 | ) | | $ | (0.246 | ) |
| | |
Net asset value — End of period | | $ | 9.280 | | | $ | 9.270 | |
| | |
Total Return(3)(4) | | | 1.93 | %(5) | | | 5.68 | %(5) |
|
| Ratios/Supplemental Data | |
Net assets, end of period (000’s omitted) | | $ | 1 | | | $ | 1 | |
Ratios (as a percentage of average daily net assets): | | | | | | | | |
Expenses(4) | | | 0.67 | %(6) | | | 0.69 | %(6) |
Net investment income | | | 3.53 | %(6) | | | 3.95 | %(6) |
Portfolio Turnover | | | 25 | %(5) | | | 44 | %(7) |
| (1) | For the period from commencement of operations on May 2, 2016 to December 31, 2016. |
| (2) | Computed using average shares outstanding. |
| (3) | Returns are historical and are calculated by determining the percentage change in net asset value with all distributions reinvested. |
| (4) | Excludes fees and expenses imposed by variable annuity contracts or variable life insurance policies. If included, performance would be lower. |
| (7) | For the year ended December 31, 2016. |
| | | | |
| | 24 | | See Notes to Financial Statements. |
Eaton Vance
VT Floating-Rate Income Fund
June 30, 2017
Notes to Financial Statements (Unaudited)
1 Significant Accounting Policies
Eaton Vance VT Floating-Rate Income Fund (the Fund) is a diversified series of Eaton Vance Variable Trust (the Trust). The Trust is a Massachusetts business trust registered under the Investment Company Act of 1940, as amended (the 1940 Act), as an open-end management investment company. The Fund’s investment objective is to provide a high level of current income. The Fund offers Initial Class, ADV Class and Institutional Class shares, which are offered at net asset value and are not subject to a sales charge. Each class represents a pro-rata interest in the Fund, but votes separately on class-specific matters and (as noted below) is subject to different expenses. Realized and unrealized gains and losses and net investment income and losses, other than class-specific expenses, are allocated daily to each class of shares based on the relative net assets of each class to the total net assets of the Fund. Each class of shares differs in its distribution plan and certain other class-specific expenses. The Fund is generally made available for purchase only to separate accounts established by participating insurance companies and qualified pension or retirement plans.
The following is a summary of significant accounting policies of the Fund. The policies are in conformity with accounting principles generally accepted in the United States of America (U.S. GAAP). The Fund is an investment company and follows accounting and reporting guidance in the Financial Accounting Standards Board (FASB) Accounting Standards Codification Topic 946.
A Investment Valuation — The following methodologies are used to determine the market value or fair value of investments.
Senior Floating-Rate Loans. Interests in senior floating-rate loans (Senior Loans) for which reliable market quotations are readily available are valued generally at the average mean of bid and ask quotations obtained from a third party pricing service. Other Senior Loans are valued at fair value by the investment adviser under procedures approved by the Trustees. In fair valuing a Senior Loan, the investment adviser utilizes one or more of the valuation techniques described in (i) through (iii) below to assess the likelihood that the borrower will make a full repayment of the loan underlying such Senior Loan relative to yields on other Senior Loans issued by companies of comparable credit quality. If the investment adviser believes that there is a reasonable likelihood of full repayment, the investment adviser will determine fair value using a matrix pricing approach that considers the yield on the Senior Loan. If the investment adviser believes there is not a reasonable likelihood of full repayment, the investment adviser will determine fair value using analyses that include, but are not limited to: (i) a comparison of the value of the borrower’s outstanding equity and debt to that of comparable public companies; (ii) a discounted cash flow analysis; or (iii) when the investment adviser believes it is likely that a borrower will be liquidated or sold, an analysis of the terms of such liquidation or sale. In certain cases, the investment adviser will use a combination of analytical methods to determine fair value, such as when only a portion of a borrower’s assets are likely to be sold. In conducting its assessment and analyses for purposes of determining fair value of a Senior Loan, the investment adviser will use its discretion and judgment in considering and appraising relevant factors. Fair value determinations are made by the portfolio managers of the Fund based on information available to such managers. The portfolio managers of other funds managed by the investment adviser that invest in Senior Loans may not possess the same information about a Senior Loan borrower as the portfolio managers of the Fund. At times, the fair value of a Senior Loan determined by the portfolio managers of other funds managed by the investment adviser that invest in Senior Loans may vary from the fair value of the same Senior Loan determined by the portfolio managers of the Fund. The fair value of each Senior Loan is periodically reviewed and approved by the investment adviser’s Valuation Committee and by the Trustees based upon procedures approved by the Trustees. Junior Loans (i.e., subordinated loans and second lien loans) are valued in the same manner as Senior Loans.
Debt Obligations. Debt obligations are generally valued on the basis of valuations provided by third party pricing services, as derived from such services’ pricing models. Inputs to the models may include, but are not limited to, reported trades, executable bid and asked prices, broker/dealer quotations, prices or yields of securities with similar characteristics, interest rates, anticipated prepayments, benchmark curves or information pertaining to the issuer, as well as industry and economic events. The pricing services may use a matrix approach, which considers information regarding securities with similar characteristics to determine the valuation for a security. Short-term obligations purchased with a remaining maturity of sixty days or less for which a valuation from a third party pricing service is not readily available may be valued at amortized cost, which approximates fair value.
Equity Securities. Equity securities listed on a U.S. securities exchange generally are valued at the last sale or closing price on the day of valuation or, if no sales took place on such date, at the mean between the closing bid and asked prices therefore on the exchange where such securities are principally traded. Equity securities listed on the NASDAQ Global or Global Select Market generally are valued at the NASDAQ official closing price. Unlisted or listed securities for which closing sales prices or closing quotations are not available are valued at the mean between the latest available bid and asked prices or, in the case of preferred equity securities that are not listed or traded in the over-the-counter market, by a third party pricing service that uses various techniques that consider factors including, but not limited to, prices or yields of securities with similar characteristics, benchmark yields, broker/dealer quotes, quotes of underlying common stock, issuer spreads, as well as industry and economic events.
Fair Valuation. Investments for which valuations or market quotations are not readily available or are deemed unreliable are valued at fair value using methods determined in good faith by or at the direction of the Trustees of the Fund in a manner that fairly reflects the security’s value, or the amount that the Fund might reasonably expect to receive for the security upon its current sale in the ordinary course. Each such determination is based on a consideration of relevant factors, which are likely to vary from one pricing context to another. These factors may include, but are not limited to, the type of security, the existence of any contractual restrictions on the security’s disposition, the price and extent of public trading in similar securities of the issuer or of comparable companies or entities, quotations or relevant information obtained from broker/dealers or other market participants, information obtained from the issuer, analysts, and/or the appropriate stock exchange (for exchange-traded securities), an analysis of the company’s or entity’s financial condition, and an evaluation of the forces that influence the issuer and the market(s) in which the security is purchased and sold.
B Investment Transactions — Investment transactions for financial statement purposes are accounted for on a trade date basis. Realized gains and losses on investments sold are determined on the basis of identified cost.
Eaton Vance
VT Floating-Rate Income Fund
June 30, 2017
Notes to Financial Statements (Unaudited) — continued
C Income — Interest income is recorded on the basis of interest accrued, adjusted for amortization of premium or accretion of discount. Fees associated with loan amendments are recognized immediately.
D Federal Taxes — The Fund’s policy is to comply with the provisions of the Internal Revenue Code applicable to regulated investment companies and to distribute to shareholders each year substantially all of its net investment income, and all or substantially all of its net realized capital gains. Accordingly, no provision for federal income or excise tax is necessary.
As of June 30, 2017, the Fund had no uncertain tax positions that would require financial statement recognition, de-recognition, or disclosure. The Fund files a U.S. federal income tax return annually after its fiscal year-end, which is subject to examination by the Internal Revenue Service for a period of three years from the date of filing.
E Expenses — The majority of expenses of the Trust are directly identifiable to an individual fund. Expenses which are not readily identifiable to a specific fund are allocated taking into consideration, among other things, the nature and type of expense and the relative size of the funds.
F Unfunded Loan Commitments — The Fund may enter into certain loan agreements all or a portion of which may be unfunded. The Fund is obligated to fund these commitments at the borrower’s discretion. These commitments are disclosed in the accompanying Portfolio of Investments. At June 30, 2017, the Fund had sufficient cash and/or securities to cover these commitments.
G Use of Estimates — The preparation of the financial statements in conformity with U.S. GAAP requires management to make estimates and assumptions that affect the reported amounts of assets and liabilities at the date of the financial statements and the reported amounts of income and expense during the reporting period. Actual results could differ from those estimates.
H Indemnifications — Under the Trust’s organizational documents, its officers and Trustees may be indemnified against certain liabilities and expenses arising out of the performance of their duties to the Fund. Under Massachusetts law, if certain conditions prevail, shareholders of a Massachusetts business trust (such as the Trust) could be deemed to have personal liability for the obligations of the Trust. However, the Trust’s Declaration of Trust contains an express disclaimer of liability on the part of Fund shareholders and the By-laws provide that the Trust shall assume the defense on behalf of any Fund shareholders. Moreover, the By-laws also provide for indemnification out of Fund property of any shareholder held personally liable solely by reason of being or having been a shareholder for all loss or expense arising from such liability. Additionally, in the normal course of business, the Fund enters into agreements with service providers that may contain indemnification clauses. The Fund’s maximum exposure under these arrangements is unknown as this would involve future claims that may be made against the Fund that have not yet occurred.
I Interim Financial Statements — The interim financial statements relating to June 30, 2017 and for the six months then ended have not been audited by an independent registered public accounting firm, but in the opinion of the Fund’s management, reflect all adjustments, consisting only of normal recurring adjustments, necessary for the fair presentation of the financial statements.
2 Distributions to Shareholders and Income Tax Information
The Fund declares dividends daily to shareholders of record at the time of declaration. Distributions are generally paid monthly. Distributions of realized capital gains are made at least annually. Distributions are declared separately for each class of shares. Shareholders may reinvest income and capital gain distributions in additional shares of the same class of the Fund at the net asset value as of the reinvestment date or, if an election is made on behalf of a separate account or qualified pension or retirement plan, to receive some or all of the distributions in cash. Distributions to shareholders are determined in accordance with income tax regulations, which may differ from U.S. GAAP. As required by U.S. GAAP, only distributions in excess of tax basis earnings and profits are reported in the financial statements as a return of capital. Permanent differences between book and tax accounting relating to distributions are reclassified to paid-in capital. For tax purposes, distributions from short-term capital gains are considered to be from ordinary income.
The cost and unrealized appreciation (depreciation) of investments of the Fund at June 30, 2017, as determined on a federal income tax basis, were as follows:
| | | | |
| |
Aggregate cost | | $ | 622,171,449 | |
| |
Gross unrealized appreciation | | $ | 8,175,945 | |
Gross unrealized depreciation | | | (9,838,237 | ) |
| |
Net unrealized depreciation | | $ | (1,662,292 | ) |
Eaton Vance
VT Floating-Rate Income Fund
June 30, 2017
Notes to Financial Statements (Unaudited) — continued
3 Investment Adviser Fee and Other Transactions with Affiliates
The investment adviser fee is earned by Eaton Vance Management (EVM) as compensation for investment advisory services rendered to the Fund. The fee is computed at an annual rate of 0.575% of the Fund’s average daily net assets up to $1 billion, 0.525% of average daily net assets from $1 billion but less than $2 billion, and at reduced rates on daily net assets of $2 billion or more, and is payable monthly. For the six months ended June 30, 2017, the investment adviser fee amounted to $1,827,419 or 0.575% (annualized) of the Fund’s average daily net assets. EVM also serves as administrator of the Fund, but receives no compensation. Eaton Vance Distributors, Inc. (EVD), the Fund’s principal underwriter and an affiliate of EVM, received distribution fees (see Note 4).
Trustees and officers of the Fund who are members of EVM’s organization receive remuneration for their services to the Fund out of the investment adviser fee. Certain officers and Trustees of the Fund are officers of EVM.
4 Distribution Plan
The Fund has in effect a distribution plan for Initial Class shares (Initial Class Plan) pursuant to Rule 12b-1 under the 1940 Act. Pursuant to the Initial Class Plan, the Fund pays EVD a distribution fee of 0.25% per annum of its average daily net assets attributable to Initial Class shares for the sale and distribution of Initial Class shares. Distribution fees paid or accrued to EVD for the six months ended June 30, 2017 amounted to $790,928. Insurance companies receive such fees from EVD based on the value of shares held by such companies. The insurance companies through which investors hold shares of the Fund may also pay fees to third parties in connection with the sale of variable contracts and for services provided to variable contract owners. The Fund, EVM or EVD are not a party to these arrangements. Investors should consult the prospectus and statement of additional information for their variable contracts for a discussion of these payments. EVD may, at its expense, provide promotional incentives to dealers that sell variable insurance products.
Distribution fees are subject to the limitations contained in the Financial Industry Regulatory Authority Rule 2341(d).
5 Shareholder Servicing Plan
The Trust, on behalf of the Fund, has adopted a Shareholder Servicing Plan (Servicing Plan) for Initial Class and ADV Class. The Servicing Plan allows the Trust to enter into shareholder servicing agreements with insurance companies, investment dealers, broker/dealers or other financial intermediaries that provide shareholder services relating to Fund shares and their shareholders, including variable contract owners or plan participants with interests in the Fund. Under the Servicing Plan, the Fund may make payments at an annual rate of up to 0.25% of its average daily net assets attributable to each class that are subject to shareholder servicing agreements. No shareholder servicing fees are levied on shares owned by EVM, its affiliates, or their respective employees or clients and may be waived under certain other limited conditions. For the six months ended June 30, 2017, shareholder servicing fees were equivalent to 0.22% per annum of each class’ average daily net assets and amounted to $707,711 and $3,234 for Initial Class and ADV Class, respectively.
6 Purchases and Sales of Investments
Purchases and sales of investments, other than short-term obligations and including maturities and principal repayments on Senior Loans, aggregated $192,579,772 and $148,609,990, respectively, for the six months ended June 30, 2017.
7 Shares of Beneficial Interest
The Fund’s Declaration of Trust permits the Trustees to issue an unlimited number of full and fractional shares of beneficial interest (without par value). Such shares may be issued in a number of different series (such as the Fund) and classes. Transactions in Fund shares were as follows:
| | | | | | | | |
| Initial Class | | Six Months Ended
June 30, 2017
(Unaudited) | | | Year Ended
December 31, 2016 | |
| | |
Sales | | | 10,470,437 | | | | 23,913,225 | |
Issued to shareholders electing to receive payments of distributions in Fund shares | | | 1,072,750 | | | | 2,165,577 | |
Redemptions | | | (8,994,660 | ) | | | (19,073,370 | ) |
| | |
Net increase | | | 2,548,527 | | | | 7,005,432 | |
Eaton Vance
VT Floating-Rate Income Fund
June 30, 2017
Notes to Financial Statements (Unaudited) — continued
| | | | | | | | |
| ADV Class | | Six Months Ended
June 30, 2017
(Unaudited) | | | Year Ended
December 31, 2016 | |
| | |
Sales | | | 126,690 | | | | 23,091 | |
Issued to shareholders electing to receive payments of distributions in Fund shares | | | 5,268 | | | | 10,109 | |
Redemptions | | | (44,925 | ) | | | (33,574 | ) |
| | |
Net increase (decrease) | | | 87,033 | | | | (374 | ) |
| | |
| | | | | | | | |
| Institutional Class | | Six Months Ended
June 30, 2017
(Unaudited) | | | Period Ended
December 31, 2016(1) | |
Sales | | | — | | | | 111 | |
| | |
Net increase | | | — | | | | 111 | |
| (1) | For the period from commencement of operations on May 2, 2016 to December 31, 2016. |
At June 30, 2017, separate accounts of 2 insurance companies each owned more than 10% of the value of the outstanding shares of the Fund aggregating 65.7%.
8 Line of Credit
The Fund participates with other portfolios managed by EVM and its affiliates in a $875 million ($900 million prior to March 13, 2017) unsecured line of credit agreement (Agreement) with a group of banks, which is in effect through March 12, 2018. Borrowings are made by the Fund solely to facilitate the handling of unusual and/or unanticipated short-term cash requirements. Interest is charged to the Fund based on its borrowings at an amount above a prime rate, the London Interbank Offered Rate (LIBOR) or the Federal Funds rate. In addition, a fee computed at an annual rate of 0.15% on the daily unused portion of the line of credit is allocated between the Fund and the other participating portfolios at the end of each quarter. Also included in interest expense is approximately $39,000 of amortization of upfront fees paid by the Fund in connection with the annual renewal of the Agreement. Because the line of credit is not available exclusively to the Fund, it may be unable to borrow some or all of its requested amounts at any particular time. The Fund did not have any significant borrowings during the six months ended June 30, 2017.
9 Credit Risk
The Fund invests primarily in below investment grade floating-rate loans, which are considered speculative because of the credit risk of their issuers. Changes in economic conditions or other circumstances are more likely to reduce the capacity of issuers of these securities to make principal and interest payments. Such companies are more likely to default on their payments of interest and principal owed than issuers of investment grade bonds. An economic downturn generally leads to a higher non-payment rate, and a loan or other debt obligation may lose significant value before a default occurs. Lower rated investments also may be subject to greater price volatility than higher rated investments. Moreover, the specific collateral used to secure a loan may decline in value or become illiquid, which would adversely affect the loan’s value.
10 Fair Value Measurements
Under generally accepted accounting principles for fair value measurements, a three-tier hierarchy to prioritize the assumptions, referred to as inputs, is used in valuation techniques to measure fair value. The three-tier hierarchy of inputs is summarized in the three broad levels listed below.
| • | | Level 1 – quoted prices in active markets for identical investments |
| • | | Level 2 – other significant observable inputs (including quoted prices for similar investments, interest rates, prepayment speeds, credit risk, etc.) |
| • | | Level 3 – significant unobservable inputs (including a fund’s own assumptions in determining the fair value of investments) |
In cases where the inputs used to measure fair value fall in different levels of the fair value hierarchy, the level disclosed is determined based on the lowest level input that is significant to the fair value measurement in its entirety. The inputs or methodology used for valuing securities are not necessarily an indication of the risk associated with investing in those securities.
Eaton Vance
VT Floating-Rate Income Fund
June 30, 2017
Notes to Financial Statements (Unaudited) — continued
At June 30, 2017, the hierarchy of inputs used in valuing the Fund’s investments, which are carried at value, were as follows:
| | | | | | | | | | | | | | | | |
| Asset Description | | Level 1 | | | Level 2 | | | Level 3* | | | Total | |
| | | | |
Senior Floating-Rate Loans (Less Unfunded Loan Commitments) | | $ | — | | | $ | 595,717,577 | | | $ | 321,371 | | | $ | 596,038,948 | |
Corporate Bonds & Notes | | | — | | | | 16,091,704 | | | | — | | | | 16,091,704 | |
Common Stocks | | | 3,066,433 | | | | 1,462,361 | | | | 3,849,711 | | | | 8,378,505 | |
Convertible Preferred Stocks | | | — | | | | — | | | | 0 | | | | 0 | |
| | | | |
Total Investments | | $ | 3,066,433 | | | $ | 613,271,642 | | | $ | 4,171,082 | | | $ | 620,509,157 | |
| * | None of the unobservable inputs for Level 3 assets, individually or collectively, had a material impact on the Fund. |
Level 3 investments at the beginning and/or end of the period in relation to net assets were not significant and accordingly, a reconciliation of Level 3 assets for the six months ended June 30, 2017 is not presented. At June 30, 2017, there were no investments transferred between Level 1 and Level 2 during the six months then ended.
11 Legal Proceedings
In May 2015, the Fund was served with an amended complaint filed in an adversary proceeding in the United States Bankruptcy Court for the Southern District of New York. The adversary proceeding was filed by the Motors Liquidation Company Avoidance Action Trust (“AAT”) against the former holders of a $1.5 billion term loan issued by General Motors Corp. (“GM”) in 2006 (the “Term Loan Lenders”) who received a full repayment of the term loan pursuant to a court order in the GM bankruptcy proceeding. The court order was made with the understanding that the term loan was fully secured at the time of GM’s bankruptcy filing in June 2009. The AAT is seeking (1) a determination from the Bankruptcy Court that the security interest held by the Term Loan Lenders was not perfected at the time GM filed for Chapter 11 Bankruptcy protection and thus the Term Loan Lenders should have been treated in the same manner as GM’s unsecured creditors, (2) disgorgement of any interest payments made to the Term Loan Lenders within ninety days of GM’s filing for Chapter 11 Bankruptcy protection, and (3) disgorgement of the $1.5 billion term loan repayment that was made to the Term Loan Lenders. The value of the payment received under the term loan agreement by the Fund is approximately $5,763,000 (equal to 0.88% of net assets at June 30, 2017). The Fund cannot predict the outcome of these proceedings or the effect, if any, on the Fund’s net asset value. The attorneys’ fees and costs related to these actions are expensed by the Fund as incurred.
Eaton Vance
VT Floating-Rate Income Fund
June 30, 2017
Board of Trustees’ Contract Approval
Overview of the Contract Review Process
The Investment Company Act of 1940, as amended (the “1940 Act”), provides, in substance, that each investment advisory agreement between a fund and its investment adviser will continue in effect from year to year only if its continuation is approved at least annually by the fund’s board of trustees, including by a vote of a majority of the trustees who are not “interested persons” of the fund (“Independent Trustees”), cast in person at a meeting called for the purpose of considering such approval.
At a meeting of the Boards of Trustees (each a “Board”) of the registered investment companies advised by either Eaton Vance Management or its affiliate, Boston Management and Research, (the “Eaton Vance Funds”) held on April 25, 2017, the Board, including a majority of the Independent Trustees, voted to approve continuation of existing investment advisory and sub-advisory agreements for the Eaton Vance Funds for an additional one-year period. In voting its approval, the Board relied upon the affirmative recommendation of its Contract Review Committee, which is a committee comprised exclusively of Independent Trustees. Prior to making its recommendation, the Contract Review Committee reviewed information furnished by each adviser to the Eaton Vance Funds (including information specifically requested by the Board) for a series of meetings of the Contract Review Committee held between February and April 2017. The Contract Review Committee also considered information received at prior meetings of the Board and its committees, as relevant to its annual evaluation of the investment advisory and sub-advisory agreements.
The information that the Board considered included, among other things, the following (for funds that invest through one or more underlying portfolio(s), references to “each fund” in this section may include information that was considered at the portfolio-level):
Information about Fees, Performance and Expenses
| • | | A report from an independent data provider comparing the advisory and related fees paid by each fund with fees paid by comparable funds as identified by the independent data provider (“comparable funds”); |
| • | | A report from an independent data provider comparing each fund’s total expense ratio and its components to comparable funds; |
| • | | A report from an independent data provider comparing the investment performance of each fund (including, where relevant, yield data, Sharpe ratios and information ratios) to the investment performance of comparable funds over various time periods; |
| • | | Data regarding investment performance in comparison to benchmark indices, as well as customized groups of peer funds and blended indices identified by the adviser in consultation with the Board; |
| • | | For each fund, comparative information concerning the fees charged and the services provided by each adviser in managing other accounts (including mutual funds, other collective investment funds and institutional accounts) using investment strategies and techniques similar to those used in managing such fund; |
| • | | Profitability analyses for each adviser with respect to each fund; |
Information about Portfolio Management and Trading
| • | | Descriptions of the investment management services provided to each fund, including the investment strategies and processes it employs; |
| • | | The procedures and processes used to determine the fair value of fund assets and actions taken to monitor and test the effectiveness of such procedures and processes; |
| • | | Information about each adviser’s policies and practices with respect to trading, including each adviser’s processes for monitoring best execution of portfolio transactions; |
| • | | Information about the allocation of brokerage transactions and the benefits received by each adviser as a result of brokerage allocation, including information concerning the acquisition of research through client commission arrangements and policies with respect to “soft dollars”; |
| • | | Data relating to portfolio turnover rates of each fund; |
Information about each Adviser
| • | | Reports detailing the financial results and condition of each adviser; |
| • | | Descriptions of the qualifications, education and experience of the individual investment professionals whose responsibilities include portfolio management and investment research for the funds, and information relating to their compensation and responsibilities with respect to managing other mutual funds and investment accounts; |
| • | | The Code of Ethics of each adviser and its affiliates, together with information relating to compliance with and the administration of such codes; |
| • | | Policies and procedures relating to proxy voting and the handling of corporate actions and class actions; |
| • | | Information concerning the resources devoted to compliance efforts undertaken by each adviser and its affiliates (including descriptions of various compliance programs) and their record of compliance; |
| • | | Information concerning the business continuity and disaster recovery plans of each adviser and its affiliates; |
| • | | A description of Eaton Vance Management’s procedures for overseeing third party advisers and sub-advisers, including with respect to regulatory and compliance issues, investment management and other matters; |
Eaton Vance
VT Floating-Rate Income Fund
June 30, 2017
Board of Trustees’ Contract Approval — continued
Other Relevant Information
| • | | Information concerning the nature, cost and character of the administrative and other non-investment advisory services provided by Eaton Vance Management and its affiliates; |
| • | | Information concerning management of the relationship with the custodian, subcustodians and fund accountants by each adviser or the funds’ administrator; and |
| • | | The terms of each investment advisory agreement. |
Over the course of the twelve-month period ended April 30, 2017, with respect to one or more funds, the Board met ten times and the Contract Review Committee, the Audit Committee, the Governance Committee, the Portfolio Management Committee and the Compliance Reports and Regulatory Matters Committee, each of which is a Committee comprised solely of Independent Trustees, met seven, thirteen, six, eight and ten times, respectively. At such meetings, the Trustees participated in investment and performance reviews with the portfolio managers and other investment professionals of each investment adviser relating to each fund, and considered various investment and trading strategies used in pursuing each fund’s investment objective, such as the use of derivative instruments, as well as risk management techniques. The Board and its Committees also evaluated issues pertaining to industry and regulatory developments, compliance procedures, fund governance and other issues with respect to the funds, and received and participated in reports and presentations provided by Eaton Vance Management and other fund advisers with respect to such matters. In addition to the formal meetings of the Board and its Committees, the Independent Trustees hold regular teleconferences in between meetings to discuss, among other topics, matters relating to the continuation of investment advisory and sub-advisory agreements.
For funds that invest through one or more underlying portfolios, the Board considered similar information about the portfolio(s) when considering the approval of investment advisory agreements. In addition, in cases where the fund’s investment adviser has engaged a sub-adviser, the Board considered similar information about the sub-adviser when considering the approval of any sub-advisory agreement.
The Contract Review Committee was assisted throughout the contract review process by Goodwin Procter LLP, independent legal counsel for the Independent Trustees. The members of the Contract Review Committee relied upon the advice of such counsel and their own business judgment in determining the material factors to be considered in evaluating each investment advisory and sub-advisory agreement and the weight to be given to each such factor. The conclusions reached with respect to each investment advisory and sub-advisory agreement were based on a comprehensive evaluation of all the information provided and not any single factor. Moreover, each member of the Contract Review Committee may have placed varying emphasis on particular factors in reaching conclusions with respect to each investment advisory and sub-advisory agreement. In evaluating each investment advisory and sub-advisory agreement, including the specific fee structures and other terms of the agreements, the Contract Review Committee was informed by multiple years of analysis and discussion among the Independent Trustees and the Eaton Vance Funds’ advisers and sub-advisers.
Results of the Process
Based on its consideration of the foregoing, and such other information as it deemed relevant, including the factors and conclusions described below, the Contract Review Committee concluded that the continuation of the investment advisory agreement of Eaton Vance VT Floating-Rate Income Fund (the “Fund”) with Eaton Vance Management (the “Adviser”), including its fee structure, is in the interests of shareholders and, therefore, the Contract Review Committee recommended to the Board approval of the agreement. The Board accepted the recommendation of the Contract Review Committee based on the material factors considered and conclusions reached by the Contract Review Committee with respect to the agreement. Accordingly, the Board, including a majority of the Independent Trustees, voted to approve continuation of the investment advisory agreement for the Fund.
Nature, Extent and Quality of Services
In considering whether to approve the investment advisory agreement of the Fund, the Board evaluated the nature, extent and quality of services provided to the Fund by the Adviser.
The Board considered the Adviser’s management capabilities and investment process with respect to the types of investments held by the Fund, including the education, experience and number of its investment professionals and other personnel who provide portfolio management, investment research, and similar services to the Fund. In particular, the Board considered the abilities and experience of the Adviser’s investment professionals in analyzing the special considerations relevant to investing in senior floating rate loans. Specifically, the Board noted the experience of the Adviser’s large group of bank loan investment professionals and other personnel who provide services to the Fund, including portfolio managers and analysts. The Board also took into account the resources dedicated to portfolio management and other services, as well as the compensation methods of the Adviser and other factors, such as the reputation and resources of the Adviser to recruit and retain highly qualified research, advisory and supervisory investment professionals. In addition, the Board considered the time and attention devoted to the Eaton Vance Funds, including the Fund, by senior management, as well as the infrastructure, operational capabilities and support staff in place to assist in the portfolio management and operations of the Fund, including the provision of administrative services. The Board also considered the business-related and other risks to which the Adviser or its affiliates may be subject in managing the Fund.
The Board considered the compliance programs of the Adviser and relevant affiliates thereof. Among other matters, the Board considered compliance and reporting matters relating to personal trading by investment professionals, selective disclosure of portfolio holdings, late trading, frequent trading, portfolio
Eaton Vance
VT Floating-Rate Income Fund
June 30, 2017
Board of Trustees’ Contract Approval — continued
valuation, business continuity and the allocation of investment opportunities. The Board also considered the responses of the Adviser and its affiliates to requests in recent years from regulatory authorities such as the Securities and Exchange Commission and the Financial Industry Regulatory Authority.
The Board was aware that on April 24, 2017 a former employee of the Adviser agreed to plead guilty to fraud charges arising from the individual’s prior activities as an equity options trader for certain Eaton Vance Funds. The Board was informed that the Adviser became aware of the matter on April 18, 2017, at which time management contacted federal authorities, alerted the Board and began an internal investigation. The Adviser represented to the Board that, based on information available as of April 25, 2017, management had no reason to believe that any other employee of the Adviser or its affiliates was involved in any wrongful activities or that any fund had been materially harmed. The Adviser agreed to keep the Board fully apprised as additional information is learned, and assured the Board that any fund harmed by the former employee’s wrongful activities will be made whole, as determined in consultation with the Board. The Board concluded that the Adviser’s actions in response to these events are appropriate and consistent with the Adviser’s commitment to protect and provide quality services to the Eaton Vance Funds.
The Board considered shareholder and other administrative services provided or managed by Eaton Vance Management and its affiliates, including transfer agency and accounting services. The Board evaluated the benefits to shareholders of investing in a fund that is a part of a large fund complex offering exposure to a variety of asset classes and investment disciplines, as well as the ability, in many cases, to exchange an investment among different funds without incurring additional sales charges.
After consideration of the foregoing factors, among others, the Board concluded that the nature, extent and quality of services provided by the Adviser, taken as a whole, are appropriate and consistent with the terms of the investment advisory agreement.
Fund Performance
The Board compared the Fund’s investment performance to that of comparable funds and appropriate benchmark indices, as well as a customized peer group of similarly managed funds. The Board’s review included comparative performance data for the one-, three-, five- and ten-year periods ended September 30, 2016 for the Fund. The Board concluded that the performance of the Fund was satisfactory.
Management Fees and Expenses
The Board considered contractual fee rates payable by the Fund for advisory and administrative services (referred to collectively as “management fees”). As part of its review, the Board considered the Fund’s management fees and total expense ratio for the one year period ended September 30, 2016, as compared to those of comparable funds, before and after giving effect to any undertaking to waive fees or reimburse expenses. The Board also received and considered information about the services offered and the fee rates charged by the Adviser to other types of clients with investment objectives and strategies that are substantially similar to and/or managed in a similar investment style as the Fund. In this regard, the Board received information about the differences in the nature and scope of services the Adviser provides to the Fund as compared to other types of clients and the material differences in compliance, reporting and other legal burdens and risks to the Adviser as between the Fund and other types of clients. The Board also considered factors that had an impact on Fund expense ratios relative to comparable funds.
After considering the foregoing information, and in light of the nature, extent and quality of the services provided by the Adviser, the Board concluded that the management fees charged for advisory and related services are reasonable.
Profitability and Other “Fall-Out” Benefits
The Board considered the level of profits realized by the Adviser and relevant affiliates thereof in providing investment advisory and administrative services to the Fund and to all Eaton Vance Funds as a group. The Board considered the level of profits realized without regard to marketing support or other payments by the Adviser and its affiliates to third parties in respect of distribution services. The Board also considered other direct or indirect fall-out benefits received by the Adviser and its affiliates in connection with their relationships with the Fund, including the benefits of research services that may be available to the Adviser as a result of securities transactions effected for the Fund and other investment advisory clients.
The Board concluded that, in light of the foregoing factors and the nature, extent and quality of the services rendered, the profits realized by the Adviser and its affiliates are deemed not to be excessive.
Economies of Scale
In reviewing management fees and profitability, the Board also considered the extent to which the Adviser and its affiliates, on the one hand, and the Fund, on the other hand, can expect to realize benefits from economies of scale as the assets of the Fund increase. The Board acknowledged the difficulty in accurately measuring the benefits resulting from economies of scale, if any, with respect to the management of any specific fund or group of funds. The Board reviewed data summarizing the increases and decreases in the assets of the Fund and of all Eaton Vance Funds as a group over various time periods, and evaluated the extent to which the total expense ratio of the Fund and the profitability of the Adviser and its affiliates may have been affected by such increases or decreases. Based upon the foregoing, the Board concluded that the Fund currently shares in any benefits from economies of scale.
Eaton Vance
VT Floating-Rate Income Fund
June 30, 2017
Board of Trustees’ Contract Approval — continued
The Board also concluded that, assuming reasonably foreseeable increases in the assets of the Fund, the structure of the advisory fee, which includes breakpoints at several asset levels, will allow the Fund to continue to benefit from any economies of scale in the future.
Eaton Vance
VT Floating-Rate Income Fund
June 30, 2017
Officers and Trustees
Officers of Eaton Vance VT Floating-Rate Income Fund
Payson F. Swaffield
President
Maureen A. Gemma
Vice President, Secretary and
Chief Legal Officer
James F. Kirchner
Treasurer
Paul M. O’Neil
Chief Compliance Officer
Trustees of Eaton Vance VT Floating-Rate Income Fund
William H. Park
Chairperson
Scott E. Eston
Thomas E. Faust Jr.*
Mark R. Fetting**
Cynthia E. Frost
George J. Gorman
Valerie A. Mosley
Helen Frame Peters
Susan J. Sutherland
Harriett Tee Taggart
Scott E. Wennerholm**
| ** | Messrs. Fetting and Wennerholm began serving as Trustees effective September 1, 2016. |
Eaton Vance Funds
IMPORTANT NOTICES
Privacy. The Eaton Vance organization is committed to ensuring your financial privacy. Each of the financial institutions identified below has in effect the following policy (“Privacy Policy”) with respect to nonpublic personal information about its customers:
| • | | Only such information received from you, through application forms or otherwise, and information about your Eaton Vance fund transactions will be collected. This may include information such as name, address, social security number, tax status, account balances and transactions. |
| • | | None of such information about you (or former customers) will be disclosed to anyone, except as permitted by law (which includes disclosure to employees necessary to service your account). In the normal course of servicing a customer’s account, Eaton Vance may share information with unaffiliated third parties that perform various required services such as transfer agents, custodians and broker-dealers. |
| • | | Policies and procedures (including physical, electronic and procedural safeguards) are in place that are designed to protect the confidentiality of such information. |
| • | | We reserve the right to change our Privacy Policy at any time upon proper notification to you. Customers may want to review our Privacy Policy periodically for changes by accessing the link on our homepage: www.eatonvance.com. |
Our pledge of privacy applies to the following entities within the Eaton Vance organization: the Eaton Vance Family of Funds, Eaton Vance Management, Eaton Vance Investment Counsel, Eaton Vance Distributors, Inc., Eaton Vance Trust Company, Eaton Vance Management (International) Limited, Eaton Vance Management’s Real Estate Investment Group and Boston Management and Research. In addition, our Privacy Policy applies only to those Eaton Vance customers who are individuals and who have a direct relationship with us. If a customer’s account (i.e., fund shares) is held in the name of a third-party financial advisor/broker-dealer, it is likely that only such advisor’s privacy policies apply to the customer. This notice supersedes all previously issued privacy disclosures. For more information about Eaton Vance’s Privacy Policy, please call 1-800-262-1122.
Delivery of Shareholder Documents. The Securities and Exchange Commission (SEC) permits funds to deliver only one copy of shareholder documents, including prospectuses, proxy statements and shareholder reports, to fund investors with multiple accounts at the same residential or post office box address. This practice is often called “householding” and it helps eliminate duplicate mailings to shareholders. Eaton Vance, or your financial advisor, may household the mailing of your documents indefinitely unless you instruct Eaton Vance, or your financial advisor, otherwise. If you would prefer that your Eaton Vance documents not be householded, please contact Eaton Vance at 1-800-262-1122, or contact your financial advisor. Your instructions that householding not apply to delivery of your Eaton Vance documents will typically be effective within 30 days of receipt by Eaton Vance or your financial advisor. Separate statements will be generated for each separate account and will be householded as described above.
Portfolio Holdings. Each Eaton Vance Fund and its underlying Portfolio(s) (if applicable) will file a schedule of portfolio holdings on Form N-Q with the SEC for the first and third quarters of each fiscal year. The Form N-Q will be available on the Eaton Vance website at www.eatonvance.com, by calling Eaton Vance at 1-800-262-1122 or in the EDGAR database on the SEC’s website at www.sec.gov. Form N-Q may also be reviewed and copied at the SEC’s public reference room in Washington, D.C. (call 1-800-732-0330 for information on the operation of the public reference room).
Proxy Voting. From time to time, funds are required to vote proxies related to the securities held by the funds. The Eaton Vance Funds or their underlying Portfolios (if applicable) vote proxies according to a set of policies and procedures approved by the Funds’ and Portfolios’ Boards. You may obtain a description of these policies and procedures and information on how the Funds or Portfolios voted proxies relating to portfolio securities during the most recent 12-month period ended June 30, without charge, upon request, by calling 1-800-262-1122 and by accessing the SEC’s website at www.sec.gov.
This Page Intentionally Left Blank
Investment Adviser and Administrator
Eaton Vance Management
Two International Place
Boston, MA 02110
Principal Underwriter*
Eaton Vance Distributors, Inc.
Two International Place
Boston, MA 02110
(617) 482-8260
Custodian
State Street Bank and Trust Company
State Street Financial Center, One Lincoln Street
Boston, MA 02111
Transfer Agent
State Street Bank and Trust Company
State Street Financial Center, One Lincoln Street
Boston, MA 02111
Fund Offices
Two International Place
Boston, MA 02110
| * | FINRA BrokerCheck. Investors may check the background of their Investment Professional by contacting the Financial Industry Regulatory Authority (FINRA). FINRA BrokerCheck is a free tool to help investors check the professional background of current and former FINRA-registered securities firms and brokers. FINRA BrokerCheck is available by calling 1-800-289-9999 and at www.FINRA.org. The FINRA BrokerCheck brochure describing this program is available to investors at www.FINRA.org. |
7733 6.30.17
Item 2. Code of Ethics
Not required in this filing.
Item 3. Audit Committee Financial Expert
Not required in this filing.
Item 4. Principal Accountant Fees and Services
Rule 2-01(c)(1)(ii)(A) of Regulation S-X (the “Loan Rule”) prohibits an accounting firm, such as the Trust’s principal accountant, Deloitte & Touche LLP (“D&T”), from having certain financial relationships with their audit clients and affiliated entities. Specifically, the Loan Rule provides, in relevant part, that an accounting firm generally would not be independent if it or a “covered person” of the accounting firm (within the meaning of applicable SEC rules relating to auditor independence) receives a loan from a lender that is a “record or beneficial owner of more than ten percent of the audit client’s equity securities.” Based on information provided to the Audit Committee of the Board of Trustees (the “Audit Committee”) of the Eaton Vance family of funds by D&T, certain relationships between D&T and its affiliates (“Deloitte Entities”) and one or more lenders who are record owners of shares of one or more funds within the Eaton Vance family of funds (the “Funds”) implicate the Loan Rule, calling into question D&T’s independence with respect to the Funds. The Funds are providing this disclosure to explain the facts and circumstances as well as D&T’s conclusions concerning D&T’s objectivity and impartiality with respect to the audits of the Funds notwithstanding the existence of one or more breaches of the Loan Rule.
On June 20, 2016, the U.S. Securities and Exchange Commission (the “SEC”) issued no-action relief to another mutual fund complex (see Fidelity Management & Research Company et al., No-Action Letter (June 20, 2016) (the “No-Action Letter”)) related to an auditor independence issue arising under the Loan Rule. In the No-Action Letter, the SEC indicated that it would not recommend enforcement action against the fund group if the auditor is not in compliance with the Loan Rule provided that: (1) the auditor has complied with PCAOB Rule 3526(b)(1) and 3526(b)(2); (2) the auditor’s non-compliance under the Loan Rule is with respect to certain lending relationships; and (3) notwithstanding such non-compliance, the auditor has concluded that it is objective and impartial with respect to the issues encompassed within its engagement as auditor of the funds. The SEC has indicated that the no-action relief will expire 18 months from its issuance.
Based on information provided by D&T to the Audit Committee, the requirements of the No-Action Letter appear to be met with respect to D&T’s lending relationships described above. Among other things, D&T has advised the Audit Committee of its conclusion that the consequences of the breach of the Loan Rule have been satisfactorily addressed, that D&T’s objectivity and impartiality in the planning and conduct of the audits of the Fund’s financial statements has not been compromised and that, notwithstanding the breach, D&T is in a position to continue as the auditor for the Funds and D&T does not believe any actions need to be taken with respect to previously issued reports by D&T. D&T has advised the Audit Committee that these conclusions were based in part on its consideration of the No-Action Letter and other relevant information communicated to the Audit Committee.
Item 5. Audit Committee of Listed Registrants
Not applicable.
Item 6. Schedule of Investments
Please see schedule of investments contained in the Report to Stockholders included under Item 1 of this Form N-CSR.
Item 7. Disclosure of Proxy Voting Policies and Procedures for Closed-End Management Investment Companies
Not applicable.
Item 8. Portfolio Managers of Closed-End Management Investment Companies
Not applicable.
Item 9. Purchases of Equity Securities by Closed-End Management Investment Company and Affiliated Purchasers
Not applicable.
Item 10. Submission of Matters to a Vote of Security Holders
No material changes.
Item 11. Controls and Procedures
(a) It is the conclusion of the registrant’s principal executive officer and principal financial officer that the effectiveness of the registrant’s current disclosure controls and procedures (such disclosure controls and procedures having been evaluated within 90 days of the date of this filing) provide reasonable assurance that the information required to be disclosed by the registrant has been recorded, processed, summarized and reported within the time period specified in the Commission’s rules and forms and that the information required to be disclosed by the registrant has been accumulated and communicated to the registrant’s principal executive officer and principal financial officer in order to allow timely decisions regarding required disclosure.
(b) There have been no changes in the registrant’s internal controls over financial reporting during the second fiscal quarter of the period covered by this report that has materially affected, or is reasonably likely to materially affect, the registrant’s internal control over financial reporting.
Item 12. Exhibits
| | |
| |
(a)(1) | | Registrant’s Code of Ethics – Not applicable (please see Item 2). |
| |
(a)(2)(i) | | Treasurer’s Section 302 certification. |
| |
(a)(2)(ii) | | President’s Section 302 certification. |
| |
(b) | | Combined Section 906 certification. |
Signatures
Pursuant to the requirements of the Securities Exchange Act of 1934 and the Investment Company Act of 1940, the registrant has duly caused this report to be signed on its behalf by the undersigned, thereunto duly authorized.
Eaton Vance Variable Trust
| | |
By: | | /s/ Payson F. Swaffield |
| | Payson F. Swaffield |
| | President |
| |
Date: | | August 24, 2017 |
Pursuant to the requirements of the Securities Exchange Act of 1934 and the Investment Company Act of 1940, this report has been signed below by the following persons on behalf of the registrant and in the capacities and on the dates indicated.
| | |
By: | | /s/ James F. Kirchner |
| | James F. Kirchner |
| | Treasurer |
| |
Date: | | August 24, 2017 |
| |
By: | | /s/ Payson F. Swaffield |
| | Payson F. Swaffield |
| | President |
| |
Date: | | August 24, 2017 |