UNITED STATES
SECURITIES AND EXCHANGE COMMISSION
WASHINGTON, D.C. 20549
FORM N-CSR
CERTIFIED SHAREHOLDER REPORT OF REGISTERED MANAGEMENT
INVESTMENT COMPANIES
Investment Company Act file number 811-10071
Oppenheimer Discovery Mid Cap Growth Fund
(Exact name of registrant as specified in charter)
6803 South Tucson Way, Centennial, Colorado 80112-3924
(Address of principal executive offices) (Zip code)
Arthur S. Gabinet
OFI Global Asset Management, Inc.
225 Liberty Street, New York, New York 10281-1008
(Name and address of agent for service)
Registrant’s telephone number, including area code: (303) 768-3200
Date of fiscal year end: October 31
Date of reporting period: 4/30/2015
Item 1. Reports to Stockholders.
| 3 | ||||||
| 6 | ||||||
| 9 | ||||||
| 11 | ||||||
| 15 | ||||||
| 17 | ||||||
| 18 | ||||||
| 19 | ||||||
| 29 | ||||||
Portfolio Proxy Voting Policies and Procedures; Updates to Statement of Investments | 41 | |||||
| 42 | ||||||
| 43 | ||||||
Class A Shares
AVERAGE ANNUAL TOTAL RETURNS AT 4/30/15
| Class A Shares of the Fund | ||||||||||
| Without Sales Charge | With Sales Charge | Russell Midcap Growth Index | ||||||||
6-Month | 8.70% | 2.45% | 7.77% | |||||||
| ||||||||||
1-Year | 19.33 | 12.47 | 16.46 | |||||||
| ||||||||||
5-Year | 15.24 | 13.88 | 15.59 | |||||||
| ||||||||||
10-Year | 10.41 | 9.76 | 10.55 | |||||||
| ||||||||||
Performance data quoted represents past performance, which does not guarantee future results. The investment return and principal value of an investment in the Fund will fluctuate so that an investor’s shares, when redeemed, may be worth more or less than their original cost. Fund returns include changes in share price, reinvested distributions, and a 5.75% maximum applicable sales charge except where “without sales charge” is indicated. Current performance may be lower or higher than the performance quoted. Returns do not consider capital gains or income taxes on an individual’s investment. Returns for periods of less than one year are cumulative and not annualized. For performance data current to the most recent month-end, visit oppenheimerfunds.com or call 1.800.CALL OPP (225.5677).
2 OPPENHEIMER DISCOVERY MID CAP GROWTH FUND
The Fund’s Class A shares (without sales charge) produced a return of 8.70% during the reporting period, outperforming the Russell Midcap Growth Index’s (the “Index”) return of 7.77% and the Lipper Mid-Cap Growth peer group’s return of 6.51% over the same period. The Fund’s Class A shares (without sales charge) ranked in the 23rd percentile (99 out of 441 ranked funds) in the Lipper Mid-Cap Growth category over the 6-month period ended April 30, 2015. Over the longer-term, the Fund ranked in the 5th (20 out of 424 funds), 20th (66 out of 334 funds), and 36th (84 out of 236 funds) percentiles for the 1-, 5- and 10-year periods ended April 30, 2015, respectively.
The Fund’s outperformance versus the Index stemmed primarily from stock selection in the information technology, consumer discretionary and industrials sectors, and an underweight position in the energy sector, which was the weakest performing sector of the Index. The Fund underperformed the Index in the health care and consumer staples sectors due to stock selection.
MARKET OVERVIEW
Domestic equities were among the top performing asset classes in 2014, outperforming foreign equities, including those domiciled in Europe, Japan and emerging markets. In the U.S., the Federal Reserve (the “Fed”) ended its bond-buying stimulus program in October 2014. Throughout 2014, the U.S. economy provided a favorable backdrop for the positive performance of equities with steady, albeit modest growth, continued little wage inflation, and interest rates that remained low — in fact, well below initial expectations. Under these economic conditions many companies were able to demonstrate ongoing improvement with the majority beating expectations — on both the top and bottom lines. The ride throughout the year, however, was anything but smooth. Macro influences
— particularly the strengthening dollar, flattening yield curve, and tumbling oil price — played a significant role in determining which equities did and did not perform well.
The first four months of 2015 were marked by cooling U.S. growth. The dollar continued to strengthen during this time against most of the U.S.’s major trading partners, which acted as a drag on growth. Businesses, especially U.S. firms with revenues dependent on exporting goods and services, cited this as a headwind. Against this backdrop, U.S. equities in general produced muted positive results so far in 2015. However, growth stocks outperformed value stocks year to date, and for the 6-month reporting period ended April 30, 2015.
3 OPPENHEIMER DISCOVERY MID CAP GROWTH FUND
FUND REVIEW
Top performing stocks this reporting period included Palo Alto Networks, Inc., AmerisourceBergen Corp. and O’Reilly Automotive, Inc.
Palo Alto Networks, which provides network security software and solutions, has been benefiting from a strong security backdrop and competitive displacement of incumbent vendors. The company also reported strong first quarter and second quarter results.
AmerisourceBergen, a leading pharmaceutical services company and one of the three largest drug distributors in the U.S., reported strong fourth quarter financial results, raised guidance for 2015 and announced the acquisition of MWI Veterinary Supply. We believe the acquisition should be accretive to earnings and boost AmerisourceBergen’s growth rate.
O’Reilly Automotive, Inc. reported strong financial results this reporting period, with continued strength in earnings per share (EPS) and same store sales. This remains one of the largest holdings in the Fund.
Detractors from performance this reporting period included Keurig Green Mountain, Inc., Salix Pharmaceuticals, Ltd. and United Rentals, Inc., each of which we exited.
Keurig Green Mountain is a specialty coffee and coffeemaker company that missed first quarter earnings and released a disappointing outlook. Surprisingly weak sales during the
2014 holiday season and confusion around the launch of a new coffee brewer caused the stock to underperform.
Salix Pharmaceuticals, a specialty pharmaceutical company focused on gastrointestinal drugs, reported disappointing financial results in November due to unexpectedly high distributor inventories of their key products. The company’s CFO also resigned due to these events. Given the uncertainty and increased controversy, we exited our position in accordance with our sell discipline.
United Rentals, an equipment rental company, reported solid financial results during the period. However, the stock underperformed due to fears that lower oil prices would cause a slowdown in their energy related business.
STRATEGY & OUTLOOK
Our long-term investment process remains the same. We seek dynamic companies with above-average and sustainable revenue and earnings growth that we believe are positioned to outperform. This includes leading firms in structurally attractive industries with committed management teams that have proven records of performance.
The macroeconomic environment is characterized by modest economic expansion, solid but decelerating profit growth and increased merger and acquisition activity. We believe that this is an environment that favors
4 OPPENHEIMER DISCOVERY MID CAP GROWTH FUND
growth companies and are optimistic regarding the Fund’s investment strategy. Our focus on well- established, higher quality growth companies has the potential to provide both upside participation and a degree of downside protection over the long term. At the end of the period, the Fund was overweight the health care and information technology sectors while underweight financials and materials.
 |
Ronald J. Zibelli, Jr., CFA Portfolio Manager |  |
Justin Livengood, CFA Portfolio Manager |


5 OPPENHEIMER DISCOVERY MID CAP GROWTH FUND
TOP TEN COMMON STOCK HOLDINGS
| ||||
O’Reilly Automotive, Inc. | 2.2 | % | ||
| ||||
Hanesbrands, Inc. | 1.9 | |||
| ||||
SBA Communications Corp., Cl. A | 1.8 | |||
| ||||
Wabtec Corp. | 1.8 | |||
| ||||
Dollar Tree, Inc. | 1.8 | |||
| ||||
Sherwin-Williams Co. (The) | 1.8 | |||
| ||||
Marriott International, Inc., Cl. A | 1.7 | |||
| ||||
Domino’s Pizza, Inc. | 1.6 | |||
| ||||
Under Armour, Inc., Cl. A | 1.6 | |||
| ||||
Palo Alto Networks, Inc. | 1.6 | |||
|
Portfolio holdings and allocations are subject to change. Percentages are as of April 30, 2015, and are based on net assets. For more current Fund holdings, please visit oppenheimerfunds.com.
TOP TEN COMMON STOCK INDUSTRIES
| ||||
Specialty Retail | 7.9 | % | ||
| ||||
Health Care Providers & Services | 6.1 | |||
| ||||
Software | 5.7 | |||
| ||||
Hotels, Restaurants & Leisure | 5.2 | |||
| ||||
Internet Software & Services | 4.7 | |||
| ||||
Machinery | 4.5 | |||
| ||||
Semiconductors & Semiconductor Equipment | 4.3 | |||
| ||||
Health Care Equipment & Supplies | 3.6 | |||
| ||||
Textiles, Apparel & Luxury Goods | 3.5 | |||
| ||||
Food Products | 3.3 | |||
|
Portfolio holdings and allocations are subject to change. Percentages are as of April 30, 2015, and are based on net assets.
SECTOR ALLOCATION
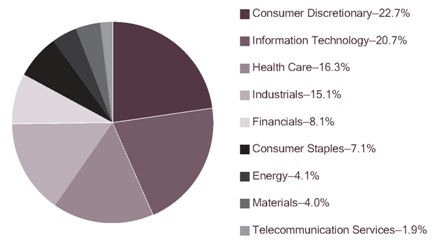
Portfolio holdings and allocations are subject to change. Percentages are as of April 30, 2015, and are based on the total market value of common stocks.
6 OPPENHEIMER DISCOVERY MID CAP GROWTH FUND
Share Class Performance
AVERAGE ANNUAL TOTAL RETURNS WITHOUT SALES CHARGE AS OF 4/30/15
| Inception Date | 6-Month | 1-Year | 5-Year | 10-Year | ||||||||
Class A (OEGAX) | 11/1/00 | 8.70% | 19.33% | 15.24% | 10.41% | |||||||
Class B (OEGBX) | 11/1/00 | 8.31% | 18.39% | 14.29% | 9.90% | |||||||
Class C (OEGCX) | 11/1/00 | 8.39% | 18.50% | 14.36% | 9.57% | |||||||
Class I (OEGIX) | 2/28/13 | 8.99% | 19.90% | 18.39%* | N/A | |||||||
Class R (OEGNX) | 3/1/01 | 8.62% | 19.01% | 14.94% | 10.13% | |||||||
Class Y (OEGYX) | 11/1/00 | 8.86% | 19.67% | 15.73% | 10.97% | |||||||
AVERAGE ANNUAL TOTAL RETURNS WITH SALES CHARGE AS OF 4/30/15
| ||||||||||||
| Inception Date | 6-Month | 1-Year | 5-Year | 10-Year | ||||||||
Class A (OEGAX) | 11/1/00 | 2.45% | 12.47% | 13.88% | 9.76% | |||||||
Class B (OEGBX) | 11/1/00 | 3.50% | 13.39% | 14.05% | 9.90% | |||||||
Class C (OEGCX) | 11/1/00 | 7.43% | 17.50% | 14.36% | 9.57% | |||||||
Class I (OEGIX) | 2/28/13 | 8.99% | 19.90% | 18.39%* | N/A | |||||||
Class R (OEGNX) | 3/1/01 | 7.65% | 18.01% | 14.94% | 10.13% | |||||||
Class Y (OEGYX) | 11/1/00 | 8.86% | 19.67% | 15.73% | 10.97% | |||||||
* Show performance since inception.
Performance data quoted represents past performance, which does not guarantee future results. The investment return and principal value of an investment in the Fund will fluctuate so that an investor’s shares, when redeemed, may be worth more or less than their original cost. Current performance may be lower or higher than the performance quoted. Returns do not consider capital gains or income taxes on an individual’s investment. For performance data current to the most recent month-end, visit oppenheimerfunds.com or call 1.800.CALL OPP (225.5677). Fund returns include changes in share price, reinvested distributions, and the applicable sales charge: for Class A shares, the current maximum initial sales charge of 5.75%; for Class B shares, the contingent deferred sales charge of 5% (1-year) and 2% (5-year); and for Class C shares, the contingent deferred sales charge (“CDSC”) of 1% for the 1-year period. Prior to 7/1/14, Class R shares were named Class N shares. Beginning 7/1/14, new purchases of Class R shares will no longer be subject to a CDSC upon redemption (any CDSC will remain in effect for purchases prior to 7/1/14). There is no sales charge for Class I and Class Y shares. Because Class B shares convert to Class A shares 72 months after purchase, the 10-year return for Class B shares uses Class A performance for the period after conversion. Returns for periods of less than one year are cumulative and not annualized.
The Fund’s performance is compared to the performance of the Russell Midcap Growth Index. The Russell Midcap Growth Index measures the performance of the mid-cap growth segment of the U.S. equity universe. It includes those Russell Midcap companies with higher price-to-book ratios and higher forecasted growth values. The Index is unmanaged and cannot be purchased directly by investors. While index comparisons may be useful to provide a benchmark for the Fund’s performance, it must be noted that the Fund’s investments are not limited to the investments comprising the Index. Index performance includes reinvestment of income, but does not reflect transaction costs, fees, expenses or taxes. Index performance is
7 OPPENHEIMER DISCOVERY MID CAP GROWTH FUND
shown for illustrative purposes only as a benchmark for the Fund’s performance, and does not predict or depict performance of the Fund. The Fund’s performance reflects the effects of the Fund’s business and operating expenses.
The Fund’s investment strategy and focus can change over time. The mention of specific fund holdings does not constitute a recommendation by Oppenheimer Funds, Inc. or its affiliates.
Before investing in any of the Oppenheimer funds, investors should carefully consider a fund’s investment objectives, risks, charges and expenses. Fund prospectuses and summary prospectuses contain this and other information about the funds, and may be obtained by asking your financial advisor, visiting oppenheimerfunds.com, or calling 1.800.CALL OPP (225.5677). Read prospectuses and summary prospectuses carefully before investing.
Shares of Oppenheimer funds are not deposits or obligations of any bank, are not guaranteed by any bank, are not insured by the FDIC or any other agency, and involve investment risks, including the possible loss of the principal amount invested.
8 OPPENHEIMER DISCOVERY MID CAP GROWTH FUND
Fund Expenses. As a shareholder of the Fund, you incur two types of costs: (1) transaction costs, which may include sales charges (loads) on purchase payments and/or contingent deferred sales charges on redemptions; and (2) ongoing costs, including management fees; distribution and service fees; and other Fund expenses. These examples are intended to help you understand your ongoing costs (in dollars) of investing in the Fund and to compare these costs with the ongoing costs of investing in other mutual funds.
The examples are based on an investment of $1,000.00 invested at the beginning of the period and held for the entire 6-month period ended April 30, 2015.
Actual Expenses. The first section of the table provides information about actual account values and actual expenses. You may use the information in this section for the class of shares you hold, together with the amount you invested, to estimate the expense that you paid over the period. Simply divide your account value by $1,000.00 (for example, an $8,600.00 account value divided by $1,000.00 = 8.60), then multiply the result by the number in the first section under the heading entitled “Expenses Paid During 6 Months Ended April 30, 2015” to estimate the expenses you paid on your account during this period.
Hypothetical Example for Comparison Purposes. The second section of the table provides information about hypothetical account values and hypothetical expenses based on the Fund’s actual expense ratio for each class of shares, and an assumed rate of return of 5% per year for each class before expenses, which is not the Fund’s actual return. The hypothetical account values and expenses may not be used to estimate the actual ending account balance or expenses you paid for the period. You may use this information to compare the ongoing costs of investing in the Fund and other funds. To do so, compare this 5% hypothetical example for the class of shares you hold with the 5% hypothetical examples that appear in the shareholder reports of the other funds.
Please note that the expenses shown in the table are meant to highlight your ongoing costs only and do not reflect any transactional costs, such as front-end or contingent deferred sales charges (loads). Therefore, the “hypothetical” section of the table is useful in comparing ongoing costs only, and will not help you determine the relative total costs of owning different funds. In addition, if these transactional costs were included, your costs would have been higher.
9 OPPENHEIMER DISCOVERY MID CAP GROWTH FUND
| Actual | Beginning Account Value | Ending Account Value | Expenses Paid During 6 Months Ended April 30, 2015 | |||||||||||||||
| ||||||||||||||||||
Class A | $ | 1,000.00 | $ | 1,087.00 | $ | 6.85 | ||||||||||||
| ||||||||||||||||||
Class B | 1,000.00 | 1,083.10 | 10.80 | |||||||||||||||
| ||||||||||||||||||
Class C | 1,000.00 | 1,083.90 | 10.75 | |||||||||||||||
| ||||||||||||||||||
Class I | 1,000.00 | 1,089.90 | 4.62 | |||||||||||||||
| ||||||||||||||||||
Class R | 1,000.00 | 1,086.20 | 8.15 | |||||||||||||||
| ||||||||||||||||||
Class Y | 1,000.00 | 1,088.60 | 5.61 | |||||||||||||||
| ||||||||||||||||||
Hypothetical (5% return before expenses) | ||||||||||||||||||
| ||||||||||||||||||
Class A | 1,000.00 | 1,018.25 | 6.63 | |||||||||||||||
| ||||||||||||||||||
Class B | 1,000.00 | 1,014.48 | 10.44 | |||||||||||||||
| ||||||||||||||||||
Class C | 1,000.00 | 1,014.53 | 10.39 | |||||||||||||||
| ||||||||||||||||||
Class I | 1,000.00 | 1,020.38 | 4.47 | |||||||||||||||
| ||||||||||||||||||
Class R | 1,000.00 | 1,017.01 | 7.88 | |||||||||||||||
| ||||||||||||||||||
Class Y | 1,000.00 | 1,019.44 | 5.42 | |||||||||||||||
| ||||||||||||||||||
Expenses are equal to the Fund’s annualized expense ratio for that class, multiplied by the average account value over the period, multiplied by 181/365 (to reflect the one-half year period). Those annualized expense ratios, excluding indirect expenses from affiliated funds, based on the 6-month period ended April 30, 2015 are as follows:
| Class | Expense Ratios | |||||
| ||||||
Class A | 1.32 | % | ||||
| ||||||
Class B | 2.08 | |||||
| ||||||
Class C | 2.07 | |||||
| ||||||
Class I | 0.89 | |||||
| ||||||
Class R | 1.57 | |||||
| ||||||
Class Y | 1.08 | |||||
The expense ratios reflect voluntary and/or contractual waivers and/or reimbursements of expenses by the Fund’s Manager. Some of these undertakings may be modified or terminated at any time, as indicated in the Fund’s prospectus. The “Financial Highlights” tables in the Fund’s financial statements, included in this report, also show the gross expense ratios, without such waivers or reimbursements and reduction to custodian expenses, if applicable.
10 OPPENHEIMER DISCOVERY MID CAP GROWTH FUND
STATEMENT OF INVESTMENTS April 30, 2015 Unaudited
| Shares | Value | |||||||||||
| ||||||||||||
Common Stocks—95.5% |
| |||||||||||
| ||||||||||||
Consumer Discretionary—21.6% |
| |||||||||||
| ||||||||||||
Auto Components—1.0% |
| |||||||||||
Delphi Automotive plc | 64,470 | $ | 5,351,010 | |||||||||
| ||||||||||||
Hotels, Restaurants & Leisure—5.2% |
| |||||||||||
Chipotle Mexican Grill, Inc., Cl. A1 | 4,150 | 2,578,561 | ||||||||||
| ||||||||||||
Domino’s Pizza, Inc. | 78,370 | 8,452,204 | ||||||||||
| ||||||||||||
Jack in the Box, Inc. | 41,670 | 3,615,706 | ||||||||||
| ||||||||||||
Marriott International, Inc., Cl. A | 115,870 | 9,275,394 | ||||||||||
| ||||||||||||
Norwegian Cruise Line Holdings Ltd.1 | 76,900 | 3,730,419 | ||||||||||
|
| |||||||||||
| 27,652,284 | ||||||||||||
| ||||||||||||
Household Durables—2.2% |
| |||||||||||
Harman International Industries, Inc. | 49,940 | 6,511,177 | ||||||||||
| ||||||||||||
Mohawk Industries, Inc.1 | 28,960 | 5,024,560 | ||||||||||
|
| |||||||||||
| 11,535,737 | ||||||||||||
| ||||||||||||
Multiline Retail—1.8% |
| |||||||||||
Dollar Tree, Inc.1 | 126,040 | 9,630,716 | ||||||||||
| ||||||||||||
Specialty Retail—7.9% |
| |||||||||||
L Brands, Inc. | 86,390 | 7,719,811 | ||||||||||
| ||||||||||||
O’Reilly Automotive, Inc.1 | 53,930 | 11,747,572 | ||||||||||
| ||||||||||||
Ross Stores, Inc. | 82,790 | 8,186,275 | ||||||||||
| ||||||||||||
Tractor Supply Co. | 83,730 | 7,205,804 | ||||||||||
| ||||||||||||
Ulta Salon, Cosmetics & Fragrance, Inc.1 | 48,580 | 7,339,952 | ||||||||||
|
| |||||||||||
| 42,199,414 | ||||||||||||
| ||||||||||||
Textiles, Apparel & Luxury Goods—3.5% |
| |||||||||||
Hanesbrands, Inc. | 330,868 | 10,283,377 | ||||||||||
| ||||||||||||
Under Armour, Inc., Cl. A1 | 107,550 | 8,340,503 | ||||||||||
|
| |||||||||||
| 18,623,880 | ||||||||||||
| ||||||||||||
Consumer Staples—6.8% |
| |||||||||||
| ||||||||||||
Beverages—2.6% |
| |||||||||||
Constellation Brands, Inc., Cl. A1 | 59,040 | 6,845,098 | ||||||||||
| Shares | Value | |||||||||||
| ||||||||||||
Beverages (Continued) |
| |||||||||||
| ||||||||||||
Monster Beverage Corp.1 | 49,070 | $ | 6,727,988 | |||||||||
|
| |||||||||||
| 13,573,086 | ||||||||||||
| ||||||||||||
Food & Staples Retailing—0.9% |
| |||||||||||
Kroger Co. (The) | 71,390 | 4,919,485 | ||||||||||
| ||||||||||||
Food Products—3.3% |
| |||||||||||
Hain Celestial Group, Inc. (The)1 | 72,800 | 4,385,472 | ||||||||||
| ||||||||||||
Hormel Foods Corp. | 99,190 | 5,390,976 | ||||||||||
| ||||||||||||
Mead Johnson Nutrition Co., Cl. A | 27,830 | 2,669,454 | ||||||||||
| ||||||||||||
WhiteWave Foods Co. (The), Cl. A1 | 116,930 | 5,141,412 | ||||||||||
|
| |||||||||||
| 17,587,314 | ||||||||||||
| ||||||||||||
Energy—3.9% |
| |||||||||||
| ||||||||||||
Energy Equipment & Services—1.0% |
| |||||||||||
Cameron International Corp.1 | 24,010 | 1,316,228 | ||||||||||
| ||||||||||||
Patterson-UTI Energy, Inc. | 181,850 | 4,064,348 | ||||||||||
|
| |||||||||||
| 5,380,576 | ||||||||||||
| ||||||||||||
Oil, Gas & Consumable Fuels—2.9% |
| |||||||||||
Cimarex Energy Co. | 43,340 | 5,391,496 | ||||||||||
| ||||||||||||
Concho Resources, Inc.1 | 65,660 | 8,316,496 | ||||||||||
| ||||||||||||
Memorial Resource Development Corp.1 | 76,434 | 1,543,202 | ||||||||||
|
| |||||||||||
| 15,251,194 | ||||||||||||
| ||||||||||||
Financials—7.7% |
| |||||||||||
| ||||||||||||
Capital Markets—2.4% |
| |||||||||||
Affiliated Managers Group, Inc.1 | 21,170 | 4,787,172 | ||||||||||
| ||||||||||||
Lazard Ltd., Cl. A2 | 85,250 | 4,520,808 | ||||||||||
| ||||||||||||
Legg Mason, Inc. | 69,920 | 3,681,288 | ||||||||||
|
| |||||||||||
| 12,989,268 | ||||||||||||
| ||||||||||||
Commercial Banks—2.9% |
| |||||||||||
| ||||||||||||
First Republic Bank | 46,300 | 2,698,827 | ||||||||||
| ||||||||||||
Signature Bank1 | 47,770 | 6,405,479 | ||||||||||
| ||||||||||||
SVB Financial Group1 | 48,840 | 6,483,999 | ||||||||||
|
| |||||||||||
| 15,588,305 | ||||||||||||
| ||||||||||||
Diversified Financial Services—0.6% |
| |||||||||||
Moody’s Corp. | 28,722 | 3,088,189 | ||||||||||
11 OPPENHEIMER DISCOVERY MID CAP GROWTH FUND
STATEMENT OF INVESTMENTS Unaudited / Continued
| Shares | Value | |||||||||||
| ||||||||||||
Real Estate Management & Development—1.8% |
| |||||||||||
CBRE Group, Inc., Cl. A1 | 149,257 | $ | 5,722,513 | |||||||||
| ||||||||||||
Jones Lang LaSalle, Inc. | 21,820 | 3,623,429 | ||||||||||
|
| |||||||||||
| 9,345,942 | ||||||||||||
| ||||||||||||
Health Care—15.6% |
| |||||||||||
| ||||||||||||
Biotechnology—2.9% |
| |||||||||||
Alnylam Pharmaceuticals, Inc.1 | 25,890 | 2,637,414 | ||||||||||
| ||||||||||||
BioMarin Pharmaceutical, Inc.1 | 32,450 | 3,636,022 | ||||||||||
| ||||||||||||
Incyte Corp.1 | 64,360 | 6,253,218 | ||||||||||
| ||||||||||||
Medivation, Inc.1 | 24,820 | 2,996,767 | ||||||||||
|
| |||||||||||
| 15,523,421 | ||||||||||||
| ||||||||||||
Health Care Equipment & Supplies—3.6% |
| |||||||||||
Cooper Cos., Inc. (The) | 22,250 | 3,962,057 | ||||||||||
| ||||||||||||
DexCom, Inc.1 | 70,240 | 4,746,117 | ||||||||||
| ||||||||||||
Edwards Lifesciences Corp.1 | 58,970 | 7,468,551 | ||||||||||
| ||||||||||||
STERIS Corp. | 42,030 | 2,794,995 | ||||||||||
|
| |||||||||||
| 18,971,720 | ||||||||||||
| ||||||||||||
Health Care Providers & Services—6.1% |
| |||||||||||
AmerisourceBergen Corp., Cl. A | 70,000 | 8,001,000 | ||||||||||
| ||||||||||||
Centene Corp.1 | 131,300 | 8,139,287 | ||||||||||
| ||||||||||||
Team Health Holdings, Inc.1 | 69,230 | 4,124,031 | ||||||||||
| ||||||||||||
Universal Health Services, Inc., Cl. B | 51,000 | 5,964,450 | ||||||||||
| ||||||||||||
VCA, Inc.1 | 122,060 | 6,221,398 | ||||||||||
|
| |||||||||||
| 32,450,166 | ||||||||||||
| ||||||||||||
Health Care Technology—1.2% |
| |||||||||||
Cerner Corp.1 | 89,850 | 6,452,129 | ||||||||||
| ||||||||||||
Life Sciences Tools & Services—1.3% |
| |||||||||||
Illumina, Inc.1 | 28,715 | 5,290,739 | ||||||||||
| ||||||||||||
Quintiles Transnational Holdings, Inc.1 | 20,730 | 1,365,692 | ||||||||||
|
| |||||||||||
| 6,656,431 | ||||||||||||
| ||||||||||||
Pharmaceuticals—0.5% |
| |||||||||||
Jazz Pharmaceuticals plc1 | 14,560 | 2,601,872 | ||||||||||
| Shares | Value | |||||||||||
| ||||||||||||
Industrials—14.4% |
| |||||||||||
| ||||||||||||
Aerospace & Defense—1.7% |
| |||||||||||
Hexcel Corp. | 52,180 | $ | 2,616,827 | |||||||||
| ||||||||||||
TransDigm Group, Inc. | 29,580 | 6,274,805 | ||||||||||
|
| |||||||||||
| 8,891,632 | ||||||||||||
| ||||||||||||
Airlines—1.0% |
| |||||||||||
Southwest Airlines Co. | 132,370 | 5,368,927 | ||||||||||
| ||||||||||||
Building Products—2.3% |
| |||||||||||
A.O. Smith Corp. | 100,620 | 6,429,618 | ||||||||||
| ||||||||||||
Lennox International, Inc. | 55,550 | 5,886,078 | ||||||||||
|
| |||||||||||
| 12,315,696 | ||||||||||||
| ||||||||||||
Electrical Equipment—1.5% |
| |||||||||||
Acuity Brands, Inc. | 47,040 | 7,853,328 | ||||||||||
| ||||||||||||
Industrial Conglomerates—1.0% |
| |||||||||||
Carlisle Cos., Inc. | 57,730 | 5,570,945 | ||||||||||
| ||||||||||||
Machinery—4.5% |
| |||||||||||
Middleby Corp. (The)1 | 66,370 | 6,725,936 | ||||||||||
| ||||||||||||
Snap-on, Inc. | 48,950 | 7,320,472 | ||||||||||
| ||||||||||||
Wabtec Corp. | 102,780 | 9,666,459 | ||||||||||
|
| |||||||||||
| 23,712,867 | ||||||||||||
| ||||||||||||
Professional Services—1.7% |
| |||||||||||
Robert Half International, Inc. | 111,440 | 6,179,348 | ||||||||||
| ||||||||||||
Verisk Analytics, Inc., Cl. A1 | 35,620 | 2,672,925 | ||||||||||
|
| |||||||||||
| 8,852,273 | ||||||||||||
| ||||||||||||
Road & Rail—0.7% |
| |||||||||||
Old Dominion Freight Line, Inc.1 | 54,820 | 3,899,347 | ||||||||||
| ||||||||||||
Information Technology—19.8% |
| |||||||||||
| ||||||||||||
Communications Equipment—1.6% |
| |||||||||||
Palo Alto Networks, Inc.1 | 56,350 | 8,324,022 | ||||||||||
| ||||||||||||
Electronic Equipment, Instruments, & Components—1.5% |
| |||||||||||
Amphenol Corp., Cl. A | 73,894 | 4,091,511 | ||||||||||
| ||||||||||||
IPG Photonics Corp.1 | 42,100 | 3,729,218 | ||||||||||
|
| |||||||||||
| 7,820,729 | ||||||||||||
12 OPPENHEIMER DISCOVERY MID CAP GROWTH FUND
| Shares | Value | |||||||||||
| ||||||||||||
Internet Software & Services—4.7% |
| |||||||||||
Akamai Technologies, Inc.1 | 75,070 | $ | 5,538,665 | |||||||||
| ||||||||||||
CoStar Group, Inc.1 | 36,460 | 7,453,518 | ||||||||||
| ||||||||||||
LinkedIn Corp., Cl. A1 | 24,680 | 6,222,568 | ||||||||||
| ||||||||||||
Rackspace Hosting, Inc.1 | 103,330 | 5,569,487 | ||||||||||
|
| |||||||||||
| 24,784,238 | ||||||||||||
| ||||||||||||
IT Services—2.0% |
| |||||||||||
Fiserv, Inc.1 | 85,130 | 6,606,088 | ||||||||||
| ||||||||||||
Global Payments, Inc. | 40,220 | 4,033,261 | ||||||||||
|
| |||||||||||
| 10,639,349 | ||||||||||||
| ||||||||||||
Semiconductors & Semiconductor Equipment—4.3% |
| |||||||||||
Avago Technologies Ltd., Cl. A | 56,740 | 6,631,771 | ||||||||||
| ||||||||||||
Lam Research Corp. | 57,370 | 4,336,025 | ||||||||||
| ||||||||||||
NXP Semiconductors NV1 | 70,640 | 6,789,917 | ||||||||||
| ||||||||||||
Skyworks Solutions, Inc. | 58,500 | 5,396,625 | ||||||||||
|
| |||||||||||
| 23,154,338 | ||||||||||||
| ||||||||||||
Software—5.7% |
| |||||||||||
Electronic Arts, Inc.1 | 114,180 | 6,632,716 | ||||||||||
| ||||||||||||
Fortinet, Inc.1 | 143,420 | 5,412,671 | ||||||||||
| ||||||||||||
ServiceNow, Inc.1 | 93,480 | 6,997,913 | ||||||||||
| ||||||||||||
Tableau Software, Inc., Cl. A1 | 61,590 | 6,025,965 | ||||||||||
| Shares | Value | |||||||||||
Software (Continued) |
| |||||||||||
Ultimate Software Group, Inc. | 31,850 | $ | 5,294,107 | |||||||||
|
| |||||||||||
| 30,363,372 | ||||||||||||
| ||||||||||||
Materials—3.9% |
| |||||||||||
| ||||||||||||
Chemicals—1.8% |
| |||||||||||
Sherwin-Williams Co. (The) | 33,730 | 9,376,940 | ||||||||||
| ||||||||||||
Construction Materials—1.1% |
| |||||||||||
Vulcan Materials Co. | 69,090 | 5,908,577 | ||||||||||
| ||||||||||||
Containers & Packaging—1.0% |
| |||||||||||
Sealed Air Corp. | 116,410 | 5,308,296 | ||||||||||
| ||||||||||||
Telecommunication Services—1.8% |
| |||||||||||
| ||||||||||||
Wireless Telecommunication Services—1.8% |
| |||||||||||
SBA Communications Corp., Cl. A1 | 84,560 | $ | 9,793,739 | |||||||||
|
| |||||||||||
| Total Common Stocks (Cost $384,184,602) | 507,310,754 | |||||||||||
| ||||||||||||
Investment Company—3.8% | ||||||||||||
| ||||||||||||
| Oppenheimer Institutional Money Market Fund, Cl. E, 0.13%3,4 (Cost $20,417,921) | 20,417,921 | 20,417,921 | ||||||||||
| Total Investments, at Value (Cost $404,602,523) | 99.3 | % | 527,728,675 | |||||||||
| ||||||||||||
Net Other Assets (Liabilities) | 0.7 | 3,892,525 | ||||||||||
|
| |||||||||||
Net Assets | 100.0 | % | $ | 531,621,200 | ||||||||
|
| |||||||||||
Footnotes to Statement of Investments
1. Non-income producing security.
2. Security is a Master Limited Partnership.
3. Is or was an affiliate, as defined in the Investment Company Act of 1940, as amended, at or during the period ended April 30, 2015, by virtue of the Fund owning at least 5% of the voting securities of the issuer or as a result of the Fund and the issuer having the same investment adviser. Transactions during the period in which the issuer was an affiliate are as follows:
| Shares October 31, 2014 | Gross Additions | Gross Reductions | Shares April 30, 2015 | |||||||||||||
| ||||||||||||||||
Oppenheimer Institutional Money Market Fund, Cl. E | 15,491,799 | 116,983,161 | 112,057,039 | 20,417,921 | ||||||||||||
13 OPPENHEIMER DISCOVERY MID CAP GROWTH FUND
STATEMENT OF INVESTMENTS Unaudited / Continued
Footnotes to Statement of Investments (Continued)
| Value | Income | |||||||
| ||||||||
Oppenheimer Institutional Money Market Fund, Cl. E | $ | 20,417,921 | $ | 7,141 | ||||
4. Rate shown is the 7-day yield as of April 30, 2015.
See accompanying Notes to Financial Statements.
14 OPPENHEIMER DISCOVERY MID CAP GROWTH FUND
STATEMENT OF ASSETS AND LIABILITIES April 30, 2015 Unaudited
| ||||
Assets | ||||
Investments, at value—see accompanying statement of investments: | ||||
Unaffiliated companies (cost $384,184,602) | $ | 507,310,754 | ||
Affiliated companies (cost $20,417,921) | 20,417,921 | |||
|
| |||
| 527,728,675 | ||||
| ||||
Cash | 100,000 | |||
| ||||
Receivables and other assets: | ||||
Investments sold | 12,948,750 | |||
Shares of beneficial interest sold | 973,093 | |||
Dividends | 93,287 | |||
Other | 26,969 | |||
|
| |||
Total assets | 541,870,774 | |||
| ||||
Liabilities | ||||
Payables and other liabilities: | ||||
Investments purchased | 9,420,286 | |||
Shares of beneficial interest redeemed | 693,364 | |||
Distribution and service plan fees | 97,080 | |||
Trustees’ compensation | 23,194 | |||
Other | 15,650 | |||
|
| |||
Total liabilities | 10,249,574 | |||
| ||||
Net Assets | $ | 531,621,200 | ||
|
| |||
| ||||
Composition of Net Assets | ||||
Par value of shares of beneficial interest | $ | 30,896 | ||
| ||||
Additional paid-in capital | 391,649,290 | |||
| ||||
Accumulated net investment loss | (6,725,453) | |||
| ||||
Accumulated net realized gain on investments | 23,540,315 | |||
| ||||
Net unrealized appreciation on investments | 123,126,152 | |||
|
| |||
Net Assets | $ | 531,621,200 | ||
|
| |||
15 OPPENHEIMER DISCOVERY MID CAP GROWTH FUND
STATEMENT OF ASSETS AND LIABILITIES Continued
| ||||
Net Asset Value Per Share | ||||
Class A Shares: | ||||
| Net asset value and redemption price per share (based on net assets of $334,131,380 and 18,980,871 shares of beneficial interest outstanding) | $ | 17.60 | ||
Maximum offering price per share (net asset value plus sales charge of 5.75% of offering price) | $ | 18.67 | ||
| ||||
Class B Shares: | ||||
| Net asset value, redemption price (excludes applicable contingent deferred sales charge) and offering price per share (based on net assets of $13,139,805 and 868,373 shares of beneficial interest outstanding) | $ | 15.13 | ||
| ||||
Class C Shares: | ||||
| Net asset value, redemption price (excludes applicable contingent deferred sales charge) and offering price per share (based on net assets of $91,742,809 and 6,021,645 shares of beneficial interest outstanding) | $ | 15.24 | ||
| ||||
Class I Shares: | ||||
| Net asset value, redemption price and offering price per share (based on net assets of $15,933,716 and 822,273 shares of beneficial interest outstanding) | $ | 19.38 | ||
| ||||
Class R Shares: | ||||
| Net asset value, redemption price (excludes applicable contingent deferred sales charge) and offering price per share (based on net assets of $28,606,760 and 1,708,950 shares of beneficial interest outstanding) | $ | 16.74 | ||
| ||||
Class Y Shares: | ||||
| Net asset value, redemption price and offering price per share (based on net assets of $48,066,730 and 2,493,516 shares of beneficial interest outstanding) | $ | 19.28 | ||
See accompanying Notes to Financial Statements.
16 OPPENHEIMER DISCOVERY MID CAP GROWTH FUND
STATEMENT OF OPERATIONS For the Six Months Ended April 30, 2015 Unaudited
| ||||||
Investment Income | ||||||
Dividends: | ||||||
Unaffiliated companies | $ | 1,398,129 | ||||
Affiliated companies | 7,141 | |||||
| ||||||
Interest | 73 | |||||
|
|
| ||||
Total investment income | 1,405,343 | |||||
| ||||||
Expenses | ||||||
Management fees | 2,083,219 | |||||
| ||||||
Distribution and service plan fees: | ||||||
Class A | 367,114 | |||||
Class B | 65,832 | |||||
Class C | 423,010 | |||||
Class R | 67,984 | |||||
| ||||||
Transfer and shareholder servicing agent fees: | ||||||
Class A | 333,622 | |||||
Class B | 14,515 | |||||
Class C | 93,193 | |||||
Class I | 2,019 | |||||
Class R | 29,987 | |||||
Class Y | 46,300 | |||||
| ||||||
Shareholder communications: | ||||||
Class A | 6,061 | |||||
Class B | 647 | |||||
Class C | 1,486 | |||||
Class I | 1 | |||||
Class R | 310 | |||||
Class Y | 604 | |||||
| ||||||
Trustees’ compensation | 3,898 | |||||
| ||||||
Custodian fees and expenses | 1,288 | |||||
| ||||||
Other | 19,190 | |||||
|
|
| ||||
Total expenses | 3,560,280 | |||||
Less waivers and reimbursements of expenses | (6,525) | |||||
Net expenses | 3,553,755 | |||||
| ||||||
Net Investment Loss | (2,148,412) | |||||
| ||||||
Realized and Unrealized Gain | ||||||
Net realized gain on investments from unaffiliated companies | 25,092,661 | |||||
|
|
| ||||
Net change in unrealized appreciation/depreciation on investments | 16,331,919 | |||||
| ||||||
Net Increase in Net Assets Resulting from Operations | $ | 39,276,168 | ||||
|
| |||||
See accompanying Notes to Financial Statements.
17 OPPENHEIMER DISCOVERY MID CAP GROWTH FUND
STATEMENTS OF CHANGES IN NET ASSETS
| Six Months Ended April 30, 2015 (Unaudited) | Year Ended October 31, 2014 | |||||||
| ||||||||
Operations | ||||||||
Net investment loss | $ | (2,148,412) | $ | (5,327,371) | ||||
| ||||||||
Net realized gain | 25,092,661 | 54,925,038 | ||||||
| ||||||||
Net change in unrealized appreciation/depreciation | 16,331,919 | (22,893,723) | ||||||
|
| |||||||
Net increase in net assets resulting from operations | 39,276,168 | 26,703,944 | ||||||
| ||||||||
Dividends and/or Distributions to Shareholders | ||||||||
Distributions from net realized gain: | ||||||||
Class A | (29,064,469) | (12,648,321) | ||||||
Class B | (1,500,275) | (884,424) | ||||||
Class C | (9,119,328) | (3,909,513) | ||||||
Class I | (1,130,297) | (557,539) | ||||||
Class R1 | (2,800,252) | (1,242,541) | ||||||
Class Y | (3,714,352) | (1,799,996) | ||||||
|
| |||||||
| (47,328,973) | (21,042,334) | |||||||
| ||||||||
Beneficial Interest Transactions | ||||||||
Net increase (decrease) in net assets resulting from beneficial interest transactions: | ||||||||
Class A | 45,087,059 | 9,328,782 | ||||||
Class B | (446,482) | (4,258,265) | ||||||
Class C | 12,299,718 | 4,496,927 | ||||||
Class I | 3,316,699 | (1,001,818) | ||||||
Class R1 | 1,927,003 | (378,510) | ||||||
Class Y | 7,524,194 | 20,990,935 | ||||||
|
| |||||||
| 69,708,191 | 29,178,051 | |||||||
| ||||||||
Net Assets | ||||||||
Total increase | 61,655,386 | 34,839,661 | ||||||
| ||||||||
Beginning of period | 469,965,814 | 435,126,153 | ||||||
|
| |||||||
End of period (including accumulated net investment loss of $6,725,453 and $4,577,041, respectively) | $ | 531,621,200 | $ | 469,965,814 | ||||
|
| |||||||
1. Effective July 1, 2014, Class N shares were renamed Class R. See Note 1 of the accompanying Notes.
See accompanying Notes to Financial Statements.
18 OPPENHEIMER DISCOVERY MID CAP GROWTH FUND
| Class A | Six Months Ended April 30, 2015 (Unaudited) | Year Ended October 31, 2014 | Year Ended October 31, 2013 | Year Ended October 31, 2012 | Year Ended October 31, 2011 | Year Ended October 29, 20101 | ||||||||||||||||||
| ||||||||||||||||||||||||
Per Share Operating Data | ||||||||||||||||||||||||
Net asset value, beginning of period | $ | 17.96 | $ | 17.65 | $ | 13.36 | $ | 12.13 | $ | 10.57 | $ | 8.31 | ||||||||||||
| ||||||||||||||||||||||||
Income (loss) from investment operations: | ||||||||||||||||||||||||
Net investment loss2 | (0.06) | (0.17) | (0.10) | (0.11)3 | (0.15) | (0.11) | ||||||||||||||||||
Net realized and unrealized gain | 1.47 | 1.26 | 4.39 | 1.34 | 1.71 | 2.37 | ||||||||||||||||||
|
| |||||||||||||||||||||||
Total from investment operations | 1.41 | 1.09 | 4.29 | 1.23 | 1.56 | 2.26 | ||||||||||||||||||
| ||||||||||||||||||||||||
Dividends and/or distributions to shareholders: | ||||||||||||||||||||||||
Distributions from net realized gain | (1.77) | (0.78) | 0.00 | 0.00 | 0.00 | 0.00 | ||||||||||||||||||
| ||||||||||||||||||||||||
Net asset value, end of period | $ | 17.60 | $ | 17.96 | $ | 17.65 | $ | 13.36 | $ | 12.13 | $ | 10.57 | ||||||||||||
|
| |||||||||||||||||||||||
| ||||||||||||||||||||||||
Total Return, at Net Asset Value4 | 8.70% | 6.56% | 32.11% | 10.14% | 14.76% | 27.20% | ||||||||||||||||||
| ||||||||||||||||||||||||
Ratios/Supplemental Data | ||||||||||||||||||||||||
Net assets, end of period (in thousands) | $ | 334,131 | $ | 293,373 | $ | 279,705 | $ | 213,421 | $ | 147,699 | $ | 83,169 | ||||||||||||
| ||||||||||||||||||||||||
Average net assets (in thousands) | $ | 309,275 | $ | 297,183 | $ | 239,530 | $ | 174,851 | $ | 132,902 | $ | 71,047 | ||||||||||||
| ||||||||||||||||||||||||
Ratios to average net assets:5 | ||||||||||||||||||||||||
Net investment loss | (0.75)% | (0.97)% | (0.68)% | (0.87)% | 3 | (1.23)% | (1.18)% | |||||||||||||||||
Total expenses6 | 1.32% | 1.39% | 1.47% | 1.51% | 1.54% | 1.77% | ||||||||||||||||||
| Expenses after payments, waivers and/or reimbursements and reduction to custodian expenses | 1.32% | 1.39% | 1.47% | 1.48% | 1.54% | 1.62% | ||||||||||||||||||
| ||||||||||||||||||||||||
Portfolio turnover rate | 51% | 116% | 89% | 76% | 99% | 103% | ||||||||||||||||||
19 OPPENHEIMER DISCOVERY MID CAP GROWTH FUND
FINANCIAL HIGHLIGHTS Continued
1. October 29, 2010 represents the last business day of the Fund’s reporting period.
2. Per share amounts calculated based on the average shares outstanding during the period.
3. Net investment income per share and the net investment income ratio include $0.03 and 0.20%, respectively, resulting from a special dividend from TransDigm Group, Inc. in October 2012.
4. Assumes an initial investment on the business day before the first day of the fiscal period, with all dividends and distributions reinvested in additional shares on the reinvestment date, and redemption at the net asset value calculated on the last business day of the fiscal period. Sales charges are not reflected in the total returns. Total returns are not annualized for periods less than one full year. Returns do not reflect the deduction of taxes that a shareholder would pay on fund distributions or the redemption of fund shares. The returns do not include adjustments in accordance with generally accepted accounting principles required at the period end for financial reporting purposes.
5. Annualized for periods less than one full year.
6. Total expenses including indirect expenses from affiliated fund fees and expenses were as follows:
Six Months Ended April 30, 2015 | 1.32 | % | ||||||
Year Ended October 31, 2014 | 1.39 | % | ||||||
Year Ended October 31, 2013 | 1.47 | % | ||||||
Year Ended October 31, 2012 | 1.51 | % | ||||||
Year Ended October 31, 2011 | 1.54 | % | ||||||
Year Ended October 29, 2010 | 1.77 | % |
See accompanying Notes to Financial Statements.
20 OPPENHEIMER DISCOVERY MID CAP GROWTH FUND
| Class B | Six Months Ended April 30, 2015 (Unaudited) | Year Ended October 31, 2014 | Year Ended October 31, 2013 | Year Ended October 31, 2012 | Year Ended October 31, 2011 | Year Ended October 29, 20101 | ||||||||||||||||||
| ||||||||||||||||||||||||
Per Share Operating Data | ||||||||||||||||||||||||
Net asset value, beginning of period | $ | 15.74 | $ | 15.70 | $ | 11.99 | $ | 10.97 | $ | 9.63 | $ | 7.64 | ||||||||||||
| ||||||||||||||||||||||||
Income (loss) from investment operations: | ||||||||||||||||||||||||
Net investment loss2 | (0.11) | (0.28) | (0.20) | (0.20)3 | (0.22) | (0.17) | ||||||||||||||||||
Net realized and unrealized gain | 1.27 | 1.10 | 3.91 | 1.22 | 1.56 | 2.16 | ||||||||||||||||||
|
| |||||||||||||||||||||||
Total from investment operations | 1.16 | 0.82 | 3.71 | 1.02 | 1.34 | 1.99 | ||||||||||||||||||
| ||||||||||||||||||||||||
Dividends and/or distributions to shareholders: | ||||||||||||||||||||||||
Distributions from net realized gain | (1.77) | (0.78) | 0.00 | 0.00 | 0.00 | 0.00 | ||||||||||||||||||
| ||||||||||||||||||||||||
Net asset value, end of period | $ | 15.13 | $ | 15.74 | $ | 15.70 | $ | 11.99 | $ | 10.97 | $ | 9.63 | ||||||||||||
|
| |||||||||||||||||||||||
| ||||||||||||||||||||||||
Total Return, at Net Asset Value4 | 8.31% | 5.62% | 30.94% | 9.30% | 13.92% | 26.05% | ||||||||||||||||||
| ||||||||||||||||||||||||
Ratios/Supplemental Data | ||||||||||||||||||||||||
Net assets, end of period (in thousands) | $ | 13,140 | $ | 14,021 | $ | 18,329 | $ | 18,520 | $ | 16,113 | $ | 11,066 | ||||||||||||
| ||||||||||||||||||||||||
Average net assets (in thousands) | $ | 13,447 | $ | 16,260 | $ | 17,710 | $ | 17,369 | $ | 15,321 | $ | 10,890 | ||||||||||||
| ||||||||||||||||||||||||
Ratios to average net assets:5 | ||||||||||||||||||||||||
Net investment loss | (1.49)% | (1.84)% | (1.50)% | (1.72)% | 3 | (2.02)% | (1.97)% | |||||||||||||||||
Total expenses6 | 2.08% | 2.28% | 2.51% | 2.54% | 2.58% | 2.88% | ||||||||||||||||||
| Expenses after payments, waivers and/or reimbursements and reduction to custodian expenses | 2.08% | 2.27% | 2.31% | 2.32% | 2.34% | 2.42% | ||||||||||||||||||
| ||||||||||||||||||||||||
Portfolio turnover rate | 51% | 116% | 89% | 76% | 99% | 103% | ||||||||||||||||||
21 OPPENHEIMER DISCOVERY MID CAP GROWTH FUND
| FINANCIAL HIGHLIGHTS Continued | ||||
1. October 29, 2010 represents the last business day of the Fund’s reporting period.
2. Per share amounts calculated based on the average shares outstanding during the period.
3. Net investment income per share and the net investment income ratio include $0.03 and 0.20%, respectively, resulting from a special dividend from TransDigm Group, Inc. in October 2012.
4. Assumes an initial investment on the business day before the first day of the fiscal period, with all dividends and distributions reinvested in additional shares on the reinvestment date, and redemption at the net asset value calculated on the last business day of the fiscal period. Sales charges are not reflected in the total returns. Total returns are not annualized for periods less than one full year. Returns do not reflect the deduction of taxes that a shareholder would pay on fund distributions or the redemption of fund shares. The returns do not include adjustments in accordance with generally accepted accounting principles required at the period end for financial reporting purposes.
5. Annualized for periods less than one full year.
6. Total expenses including indirect expenses from affiliated fund fees and expenses were as follows:
Six Months Ended April 30, 2015 | 2.08 | % | ||||||
Year Ended October 31, 2014 | 2.28 | % | ||||||
Year Ended October 31, 2013 | 2.51 | % | ||||||
Year Ended October 31, 2012 | 2.54 | % | ||||||
Year Ended October 31, 2011 | 2.58 | % | ||||||
Year Ended October 29, 2010 | 2.88 | % |
See accompanying Notes to Financial Statements.
22 OPPENHEIMER DISCOVERY MID CAP GROWTH FUND
| Class C | Six Months Ended April 30, 2015 (Unaudited) | Year Ended October 31, 2014 | Year Ended October 31, 2013 | Year Ended October 31, 2012 | Year Ended October 31, 2011 | Year Ended October 29, 20101 | ||||||||||||||||||
| ||||||||||||||||||||||||
Per Share Operating Data | ||||||||||||||||||||||||
Net asset value, beginning of period | $ | 15.83 | $ | 15.78 | $ | 12.04 | $ | 11.02 | $ | 9.67 | $ | 7.66 | ||||||||||||
| ||||||||||||||||||||||||
Income (loss) from investment operations: | ||||||||||||||||||||||||
Net investment loss2 | (0.11) | (0.27) | (0.20) | (0.20)3 | (0.22) | (0.17) | ||||||||||||||||||
Net realized and unrealized gain | 1.29 | 1.10 | 3.94 | 1.22 | 1.57 | 2.18 | ||||||||||||||||||
|
| |||||||||||||||||||||||
Total from investment operations | 1.18 | 0.83 | 3.74 | 1.02 | 1.35 | 2.01 | ||||||||||||||||||
| ||||||||||||||||||||||||
Dividends and/or distributions to shareholders: | ||||||||||||||||||||||||
Distributions from net realized gain | (1.77) | (0.78) | 0.00 | 0.00 | 0.00 | 0.00 | ||||||||||||||||||
| ||||||||||||||||||||||||
Net asset value, end of period | $ | 15.24 | $ | 15.83 | $ | 15.78 | $ | 12.04 | $ | 11.02 | $ | 9.67 | ||||||||||||
|
| |||||||||||||||||||||||
| ||||||||||||||||||||||||
Total Return, at Net Asset Value4 | 8.39% | 5.66% | 31.06% | 9.26% | 13.96% | 26.24% | ||||||||||||||||||
| ||||||||||||||||||||||||
Ratios/Supplemental Data | ||||||||||||||||||||||||
Net assets, end of period (in thousands) | $ | 91,743 | $ | 81,856 | $ | 76,999 | $ | 52,465 | $ | 40,485 | $ | 23,583 | ||||||||||||
| ||||||||||||||||||||||||
Average net assets (in thousands) | $ | 86,383 | $ | 82,724 | $ | 61,583 | $ | 47,571 | $ | 35,471 | $ | 21,239 | ||||||||||||
| ||||||||||||||||||||||||
Ratios to average net assets:5 | ||||||||||||||||||||||||
Net investment loss | (1.49)% | (1.74)% | (1.48)% | (1.70)% | 3 | (1.99)% | (1.93)% | |||||||||||||||||
Total expenses6 | 2.07% | 2.17% | 2.25% | 2.31% | 2.34% | 2.57% | ||||||||||||||||||
| Expenses after payments, waivers and/or reimbursements and reduction to custodian expenses | 2.07% | 2.17% | 2.25% | 2.29% | 2.30% | 2.37% | ||||||||||||||||||
| ||||||||||||||||||||||||
Portfolio turnover rate | 51% | 116% | 89% | 76% | 99% | 103% | ||||||||||||||||||
23 OPPENHEIMER DISCOVERY MID CAP GROWTH FUND
| FINANCIAL HIGHLIGHTS Continued | ||||
1. October 29, 2010 represents the last business day of the Fund’s reporting period.
2. Per share amounts calculated based on the average shares outstanding during the period.
3. Net investment income per share and the net investment income ratio include $0.03 and 0.20%, respectively, resulting from a special dividend from TransDigm Group, Inc. in October 2012.
4. Assumes an initial investment on the business day before the first day of the fiscal period, with all dividends and distributions reinvested in additional shares on the reinvestment date, and redemption at the net asset value calculated on the last business day of the fiscal period. Sales charges are not reflected in the total returns. Total returns are not annualized for periods less than one full year. Returns do not reflect the deduction of taxes that a shareholder would pay on fund distributions or the redemption of fund shares. The returns do not include adjustments in accordance with generally accepted accounting principles required at the period end for financial reporting purposes.
5. Annualized for periods less than one full year.
6. Total expenses including indirect expenses from affiliated fund fees and expenses were as follows:
Six Months Ended April 30, 2015 | 2.07 | % | ||||||
Year Ended October 31, 2014 | 2.17 | % | ||||||
Year Ended October 31, 2013 | 2.25 | % | ||||||
Year Ended October 31, 2012 | 2.31 | % | ||||||
Year Ended October 31, 2011 | 2.34 | % | ||||||
Year Ended October 29, 2010 | 2.57 | % |
See accompanying Notes to Financial Statements.
24 OPPENHEIMER DISCOVERY MID CAP GROWTH FUND
| Class I | Six Months Ended April 30, 2015 (Unaudited) | Year Ended October 31, 2014 | Period Ended October 31, 20131 | |||||||||||||||
| ||||||||||||||||||
Per Share Operating Data | ||||||||||||||||||
Net asset value, beginning of period | $ | 19.55 | $ | 19.06 | $ | 15.41 | ||||||||||||
| ||||||||||||||||||
Income (loss) from investment operations: | ||||||||||||||||||
Net investment loss2 | (0.03) | (0.09) | (0.03) | |||||||||||||||
Net realized and unrealized gain | 1.63 | 1.36 | 3.68 | |||||||||||||||
|
| |||||||||||||||||
Total from investment operations | 1.60 | 1.27 | 3.65 | |||||||||||||||
| ||||||||||||||||||
Dividends and/or distributions to shareholders: | ||||||||||||||||||
Distributions from net realized gain | (1.77) | (0.78) | 0.00 | |||||||||||||||
|
| |||||||||||||||||
Net asset value, end of period | $ | 19.38 | $ | 19.55 | $ | 19.06 | ||||||||||||
|
| |||||||||||||||||
| ||||||||||||||||||
Total Return, at Net Asset Value3 | 8.99% | 7.04% | 23.69% | |||||||||||||||
| ||||||||||||||||||
Ratios/Supplemental Data | ||||||||||||||||||
Net assets, end of period (in thousands) | $ | 15,933 | $ | 12,646 | $ | 13,435 | ||||||||||||
| ||||||||||||||||||
Average net assets (in thousands) | $ | 13,742 | $ | 13,617 | $ | 9,864 | ||||||||||||
| ||||||||||||||||||
Ratios to average net assets:4 | ||||||||||||||||||
Net investment loss | (0.32)% | (0.48)% | (0.24)% | |||||||||||||||
Total expenses5 | 0.89% | 0.91% | 0.92% | |||||||||||||||
| Expenses after payments, waivers and/or reimbursements and reduction to custodian expenses | 0.89% | 0.91% | 0.92% | |||||||||||||||
| ||||||||||||||||||
Portfolio turnover rate | 51% | 116% | 89% | |||||||||||||||
1. For the period from February 28, 2013 (inception of offering) to October 31, 2013.
2. Per share amounts calculated based on the average shares outstanding during the period.
3. Assumes an initial investment on the business day before the first day of the fiscal period, with all dividends and distributions reinvested in additional shares on the reinvestment date, and redemption at the net asset value calculated on the last business day of the fiscal period. Sales charges are not reflected in the total returns. Total returns are not annualized for periods less than one full year. Returns do not reflect the deduction of taxes that a shareholder would pay on fund distributions or the redemption of fund shares. The returns do not include adjustments in accordance with generally accepted accounting principles required at the period end for financial reporting purposes.
4. Annualized for periods less than one full year.
5. Total expenses including indirect expenses from affiliated fund fees and expenses were as follows:
Six Months Ended April 30, 2015 | 0.89 | % | ||||||
Year Ended October 31, 2014 | 0.91 | % | ||||||
Period Ended October 31, 2013 | 0.92 | % |
See accompanying Notes to Financial Statements.
25 OPPENHEIMER DISCOVERY MID CAP GROWTH FUND
| FINANCIAL HIGHLIGHTS Continued | ||||
| Class R | Six Months Ended April 30, 2015 (Unaudited) | Year Ended October 31, 2014 | Year Ended October 31, 2013 | Year Ended October 31, 2012 | Year Ended October 31, 2011 | Year Ended October 29, 20101 | ||||||||||||||||||
| ||||||||||||||||||||||||
Per Share Operating Data | ||||||||||||||||||||||||
Net asset value, beginning of period | $ | 17.18 | $ | 16.97 | $ | 12.88 | $ | 11.73 | $ | 10.24 | $ | 8.08 | ||||||||||||
| ||||||||||||||||||||||||
Income (loss) from investment operations: | ||||||||||||||||||||||||
Net investment loss2 | (0.08) | (0.21) | (0.14) | (0.15)3 | (0.17) | (0.13) | ||||||||||||||||||
Net realized and unrealized gain | 1.41 | 1.20 | 4.23 | 1.30 | 1.66 | 2.29 | ||||||||||||||||||
|
| |||||||||||||||||||||||
Total from investment operations | 1.33 | 0.99 | 4.09 | 1.15 | 1.49 | 2.16 | ||||||||||||||||||
| ||||||||||||||||||||||||
Dividends and/or distributions to shareholders: | ||||||||||||||||||||||||
Distributions from net realized gain | (1.77) | (0.78) | 0.00 | 0.00 | 0.00 | 0.00 | ||||||||||||||||||
| ||||||||||||||||||||||||
Net asset value, end of period | $ | 16.74 | $ | 17.18 | $ | 16.97 | $ | 12.88 | $ | 11.73 | $ | 10.24 | ||||||||||||
|
| |||||||||||||||||||||||
| ||||||||||||||||||||||||
Total Return, at Net Asset Value4 | 8.62% | 6.23% | 31.76% | 9.80% | 14.55% | 26.73% | ||||||||||||||||||
| ||||||||||||||||||||||||
Ratios/Supplemental Data | ||||||||||||||||||||||||
Net assets, end of period (in thousands) | $ | 28,607 | $ | 27,241 | $ | 27,318 | $ | 17,456 | $ | 15,818 | $ | 12,007 | ||||||||||||
| ||||||||||||||||||||||||
Average net assets (in thousands) | $ | 27,794 | $ | 28,141 | $ | 21,570 | $ | 16,529 | $ | 15,322 | $ | 10,371 | ||||||||||||
| ||||||||||||||||||||||||
Ratios to average net assets:5 | ||||||||||||||||||||||||
Net investment loss | (0.99)% | (1.23)% | (0.99)% | (1.19)% | 3 | (1.47)% | (1.43)% | |||||||||||||||||
Total expenses6 | 1.57% | 1.66% | 1.77% | 1.82% | 1.82% | 2.07% | ||||||||||||||||||
| Expenses after payments, waivers and/or reimbursements and reduction to custodian expenses | 1.57% | 1.66% | 1.76% | 1.78% | 1.79% | 1.86% | ||||||||||||||||||
| ||||||||||||||||||||||||
Portfolio turnover rate | 51% | 116% | 89% | 76% | 99% | 103% | ||||||||||||||||||
26 OPPENHEIMER DISCOVERY MID CAP GROWTH FUND
1. October 29, 2010 represents the last business day of the Fund’s reporting period.
2. Per share amounts calculated based on the average shares outstanding during the period.
3. Net investment income per share and the net investment income ratio include $0.03 and 0.20%, respectively, resulting from a special dividend from TransDigm Group, Inc. in October 2012.
4. Assumes an initial investment on the business day before the first day of the fiscal period, with all dividends and distributions reinvested in additional shares on the reinvestment date, and redemption at the net asset value calculated on the last business day of the fiscal period. Sales charges are not reflected in the total returns. Total returns are not annualized for periods less than one full year. Returns do not reflect the deduction of taxes that a shareholder would pay on fund distributions or the redemption of fund shares. The returns do not include adjustments in accordance with generally accepted accounting principles required at the period end for financial reporting purposes.
5. Annualized for periods less than one full year.
6. Total expenses including indirect expenses from affiliated fund fees and expenses were as follows:
Six Months Ended April 30, 2015 | 1.57 | % | ||||||
Year Ended October 31, 2014 | 1.66 | % | ||||||
Year Ended October 31, 2013 | 1.77 | % | ||||||
Year Ended October 31, 2012 | 1.82 | % | ||||||
Year Ended October 31, 2011 | 1.82 | % | ||||||
Year Ended October 29, 2010 | 2.07 | % |
See accompanying Notes to Financial Statements.
27 OPPENHEIMER DISCOVERY MID CAP GROWTH FUND
| FINANCIAL HIGHLIGHTS Continued | ||||
| Class Y | Six Months Ended April 30, 2015 (Unaudited) | Year Ended October 31, 2014 | Year Ended October 31, 2013 | Year Ended October 31, 2012 | Year Ended October 31, 2011 | Year Ended October 29, 20101 | ||||||||||||||||||
| ||||||||||||||||||||||||
Per Share Operating Data | ||||||||||||||||||||||||
Net asset value, beginning of period | $ | 19.48 | $ | 19.03 | $ | 14.35 | $ | 12.97 | $ | 11.23 | $ | 8.78 | ||||||||||||
| ||||||||||||||||||||||||
Income (loss) from investment operations: | ||||||||||||||||||||||||
Net investment loss2 | (0.05) | (0.13) | (0.03) | (0.05)3 | (0.09) | (0.06) | ||||||||||||||||||
Net realized and unrealized gain | 1.62 | 1.36 | 4.71 | 1.43 | 1.83 | 2.51 | ||||||||||||||||||
|
| |||||||||||||||||||||||
Total from investment operations | 1.57 | 1.23 | 4.68 | 1.38 | 1.74 | 2.45 | ||||||||||||||||||
| ||||||||||||||||||||||||
Dividends and/or distributions to shareholders: | ||||||||||||||||||||||||
Distributions from net realized gain | (1.77) | (0.78) | 0.00 | 0.00 | 0.00 | 0.00 | ||||||||||||||||||
| ||||||||||||||||||||||||
Net asset value, end of period | $ | 19.28 | $ | 19.48 | $ | 19.03 | $ | 14.35 | $ | 12.97 | $ | 11.23 | ||||||||||||
|
| |||||||||||||||||||||||
| ||||||||||||||||||||||||
Total Return, at Net Asset Value4 | 8.86% | 6.84% | 32.61% | 10.64% | 15.49% | 27.90% | ||||||||||||||||||
| ||||||||||||||||||||||||
Ratios/Supplemental Data | ||||||||||||||||||||||||
Net assets, end of period (in thousands) | $ | 48,067 | $ | 40,829 | $ | 19,340 | $ | 34,157 | $ | 17,197 | $ | 5,914 | ||||||||||||
| ||||||||||||||||||||||||
Average net assets (in thousands) | $ | 42,923 | $ | 42,835 | $ | 24,569 | $ | 24,900 | $ | 13,251 | $ | 4,904 | ||||||||||||
| ||||||||||||||||||||||||
Ratios to average net assets:5 | ||||||||||||||||||||||||
Net investment loss | (0.51)% | (0.70)% | (0.21)% | (0.39)% | 3 | (0.72)% | (0.61)% | |||||||||||||||||
Total expenses6 | 1.08% | 1.12% | 1.05% | 1.02% | 1.01% | 1.04% | ||||||||||||||||||
Expenses after payments, waivers and/or reimbursements and reduction to custodian expenses | 1.08% | 1.12% | 1.05% | 1.02% | 1.01% | 1.04% | ||||||||||||||||||
| ||||||||||||||||||||||||
Portfolio turnover rate | 51% | 116% | 89% | 76% | 99% | 103% | ||||||||||||||||||
1. October 29, 2010 represents the last business day of the Fund’s reporting period.
2. Per share amounts calculated based on the average shares outstanding during the period.
3. Net investment income per share and the net investment income ratio include $0.03 and 0.20%, respectively, resulting from a special dividend from TransDigm Group, Inc. in October 2012.
4. Assumes an initial investment on the business day before the first day of the fiscal period, with all dividends and distributions reinvested in additional shares on the reinvestment date, and redemption at the net asset value calculated on the last business day of the fiscal period. Sales charges are not reflected in the total returns. Total returns are not annualized for periods less than one full year. Returns do not reflect the deduction of taxes that a shareholder would pay on fund distributions or the redemption of fund shares. The returns do not include adjustments in accordance with generally accepted accounting principles required at the period end for financial reporting purposes.
5. Annualized for periods less than one full year.
6. Total expenses including indirect expenses from affiliated fund fees and expenses were as follows:
Six Months Ended April 30, 2015 | 1.08 | % | ||||||
Year Ended October 31, 2014 | 1.12 | % | ||||||
Year Ended October 31, 2013 | 1.05 | % | ||||||
Year Ended October 31, 2012 | 1.02 | % | ||||||
Year Ended October 31, 2011 | 1.01 | % | ||||||
Year Ended October 29, 2010 | 1.04 | % |
See accompanying Notes to Financial Statements.
28 OPPENHEIMER DISCOVERY MID CAP GROWTH FUND
NOTES TO FINANCIAL STATEMENTS April 30, 2015 Unaudited
1. Organization
Oppenheimer Discovery Mid Cap Growth Fund (the “Fund”) is registered under the Investment Company Act of 1940 (“1940 Act”), as amended, as a diversified open-end management investment company. The Fund’s investment objective is to seek capital appreciation. The Fund’s investment adviser is OFI Global Asset Management, Inc. (“OFI Global” or the “Manager”), a wholly-owned subsidiary of OppenheimerFunds, Inc. (“OFI” or the “Sub-Adviser”). The Manager has entered into a sub-advisory agreement with OFI.
The Fund offers Class A, Class C, Class I, Class R and Class Y shares, and previously offered Class B shares for new purchase through June 29, 2012. Subsequent to that date, no new purchases of Class B shares are permitted, however reinvestment of dividend and/or capital gain distributions and exchanges of Class B shares into and from other Oppenheimer funds will be allowed. As of July 1, 2014, Class N shares were renamed Class R shares. Class N shares subject to a contingent deferred sales charge (“CDSC”) on July 1, 2014, will continue to be subject to a CDSC after the shares are renamed. Purchases of Class R shares occurring on or after July 1, 2014, will not be subject to a CDSC upon redemption. Class A shares are sold at their offering price, which is normally net asset value plus a front-end sales charge. Class C and Class R shares are sold, and Class B shares were sold, without a front-end sales charge but may be subject to a contingent deferred sales charge (“CDSC”). Class R shares are sold only through retirement plans. Retirement plans that offer Class R shares may impose charges on those accounts. Class I and Class Y shares are sold to certain institutional investors or intermediaries without either a front-end sales charge or a CDSC, however, the intermediaries may impose charges on their accountholders who beneficially own Class I and Class Y shares. All classes of shares have identical rights and voting privileges with respect to the Fund in general and exclusive voting rights on matters that affect that class alone. Earnings, net assets and net asset value per share may differ due to each class having its own expenses, such as transfer and shareholder servicing agent fees and shareholder communications, directly attributable to that class. Class A, B, C and R shares have separate distribution and/or service plans under which they pay fees. Class I and Class Y shares do not pay such fees. Class B shares will automatically convert to Class A shares 72 months after the date of purchase.
The following is a summary of significant accounting policies followed in the Fund’s preparation of financial statements in accordance with accounting principles generally accepted in the United States (“U.S. GAAP”).
2. Significant Accounting Policies
Security Valuation. All investments in securities are recorded at their estimated fair value, as described in Note 3.
Allocation of Income, Expenses, Gains and Losses. Income, expenses (other than those attributable to a specific class), gains and losses are allocated on a daily basis to each class of shares based upon the relative proportion of net assets represented by such class. Operating expenses directly attributable to a specific class are charged against the operations of that class.
29 OPPENHEIMER DISCOVERY MID CAP GROWTH FUND
| NOTES TO FINANCIAL STATEMENTS Unaudited / Continued | ||||
| ||||
| 2. Significant Accounting Policies (Continued) | ||||
Dividends and Distributions to Shareholders. Dividends and distributions to shareholders, which are determined in accordance with income tax regulations and may differ from U.S. generally accepted accounting principles, are recorded on the ex-dividend date. Income and capital gain distributions, if any, are declared and paid annually or at other times as deemed necessary by the Manager.
The tax character of distributions is determined as of the Fund’s fiscal year end. Therefore, a portion of the Fund’s distributions made to shareholders prior to the Fund’s fiscal year end may ultimately be categorized as a tax return of capital.
Investment Income. Dividend income is recorded on the ex-dividend date or upon ex-dividend notification in the case of certain foreign dividends where the ex-dividend date may have passed. Non-cash dividends included in dividend income, if any, are recorded at the fair market value of the securities received. Interest income is recognized on an accrual basis. Discount and premium, which are included in interest income on the Statement of Operations, are amortized or accreted daily.
Custodian Fees. “Custodian fees and expenses” in the Statement of Operations may include interest expense incurred by the Fund on any cash overdrafts of its custodian account during the period. Such cash overdrafts may result from the effects of failed trades in portfolio securities and from cash outflows resulting from unanticipated shareholder redemption activity. The Fund pays interest to its custodian on such cash overdrafts, to the extent they are not offset by positive cash balances maintained by the Fund, at a rate equal to the Federal Funds Rate plus 0.50%. The “Reduction to custodian expenses” line item, if applicable, represents earnings on cash balances maintained by the Fund during the period. Such interest expense and other custodian fees may be paid with these earnings.
Security Transactions. Security transactions are recorded on the trade date. Realized gains and losses on securities sold are determined on the basis of identified cost.
Indemnifications. The Fund’s organizational documents provide current and former Trustees and officers with a limited indemnification against liabilities arising in connection with the performance of their duties to the Fund. In the normal course of business, the Fund may also enter into contracts that provide general indemnifications. The Fund’s maximum exposure under these arrangements is unknown as this would be dependent on future claims that may be made against the Fund. The risk of material loss from such claims is considered remote.
Federal Taxes. The Fund intends to comply with provisions of the Internal Revenue Code applicable to regulated investment companies and to distribute substantially all of its investment company taxable income to shareholders. Therefore, no federal income or excise tax provision is required. The Fund files income tax returns in U.S. federal and applicable state
30 OPPENHEIMER DISCOVERY MID CAP GROWTH FUND
| ||||
| 2. Significant Accounting Policies (Continued) | ||||
jurisdictions. The statute of limitations on the Fund’s tax return filings generally remain open for the three preceding fiscal reporting period ends.
During the fiscal year ended October 31, 2014, the Fund did not utilize any capital loss carryforward to offset capital gains realized in that fiscal year.
Net investment income (loss) and net realized gain (loss) may differ for financial statement and tax purposes. The character of dividends and distributions made during the fiscal year from net investment income or net realized gains are determined in accordance with federal income tax requirements, which may differ from the character of net investment income or net realized gains presented in those financial statements in accordance with GAAP. Also, due to timing of dividends and distributions, the fiscal year in which amounts are distributed may differ from the fiscal year in which the income or net realized gain was recorded by the Fund.
The aggregate cost of securities and other investments and the composition of unrealized appreciation and depreciation of securities and other investments for federal income tax purposes as of April 30, 2015 are noted in the following table. The primary difference between book and tax appreciation or depreciation of securities and other investments, if applicable, is attributable to the tax deferral of losses or tax realization of financial statement unrealized gain or loss.
Federal tax cost of securities | $ | 405,558,483 | ||
|
| |||
Gross unrealized appreciation | $ | 124,780,055 | ||
Gross unrealized depreciation | (2,609,863) | |||
|
| |||
Net unrealized appreciation | $ | 122,170,192 | ||
|
|
Use of Estimates. The preparation of financial statements in conformity with accounting principles generally accepted in the United States of America requires management to make estimates and assumptions that affect the reported amounts of assets and liabilities and disclosure of contingent assets and liabilities at the date of the financial statements and the reported amounts of increases and decreases in net assets from operations during the reporting period. Actual results could differ from those estimates.
3. Securities Valuation
The Fund calculates the net asset value of its shares as of the close of the New York Stock Exchange (the “Exchange”), normally 4:00 P.M. Eastern time, on each day the Exchange is open for trading.
The Fund’s Board has adopted procedures for the valuation of the Fund’s securities and has delegated the day-to-day responsibility for valuation determinations under those procedures to the Manager. The Manager has established a Valuation Committee which is responsible for determining a “fair valuation” for any security for which market quotations are not “readily available.” The Valuation Committee’s fair valuation determinations are subject to review, approval and ratification by the Fund’s Board at its next regularly scheduled meeting covering the calendar quarter in which the fair valuation was determined.
31 OPPENHEIMER DISCOVERY MID CAP GROWTH FUND
| NOTES TO FINANCIAL STATEMENTS Unaudited / Continued | ||||
| ||||
| 3. Securities Valuation (Continued) | ||||
Valuation Methods and Inputs
Securities are valued using unadjusted quoted market prices, when available, as supplied primarily by third party pricing services or dealers.
The following methodologies are used to determine the market value or the fair value of the types of securities described below:
Securities traded on a registered U.S. securities exchange (including exchange-traded derivatives other than futures and futures options) are valued based on the last sale price of the security reported on the principal exchange on which it is traded, prior to the time when the Fund’s assets are valued. In the absence of a sale, the security is valued at the last sale price on the prior trading day, if it is within the spread of the current day’s closing “bid” and “asked” prices, and if not, at the current day’s closing bid price. A security of a foreign issuer traded on a foreign exchange, but not listed on a registered U.S. securities exchange, is valued based on the last sale price on the principal exchange on which the security is traded, as identified by the third party pricing service used by the Manager, prior to the time when the Fund’s assets are valued. If the last sale price is unavailable, the security is valued at the most recent official closing price on the principal exchange on which it is traded. If the last sales price or official closing price for a foreign security is not available, the security is valued at the mean between the bid and asked price per the exchange or, if not available from the exchange, obtained from two dealers. If bid and asked prices are not available from either the exchange or two dealers, the security is valued by using one of the following methodologies (listed in order of priority): (1) using a bid from the exchange, (2) the mean between the bid and asked price as provided by a single dealer, or (3) a bid from a single dealer.
Shares of a registered investment company that are not traded on an exchange are valued at that investment company’s net asset value per share.
Corporate and government debt securities (of U.S. or foreign issuers) and municipal debt securities, event-linked bonds, loans, mortgage-backed securities, collateralized mortgage obligations, and asset-backed securities are valued at the mean between the “bid” and “asked” prices utilizing evaluated prices obtained from third party pricing services or broker-dealers who may use matrix pricing methods to determine the evaluated prices.
Short-term money market type debt securities with a remaining maturity of sixty days or less are valued at cost adjusted by the amortization of discount or premium to maturity (amortized cost), which approximates market value. Short-term debt securities with a remaining maturity in excess of sixty days are valued at the mean between the “bid” and “asked” prices utilizing evaluated prices obtained from third party pricing services or broker-dealers.
A description of the standard inputs that may generally be considered by the third party pricing vendors in determining their evaluated prices is provided below.
32 OPPENHEIMER DISCOVERY MID CAP GROWTH FUND
| ||||
| 3. Securities Valuation (Continued) | ||||
| Security Type | Standard inputs generally considered by third-party pricing vendors | |
Corporate debt, government debt, municipal, mortgage-backed and asset-backed securities | Reported trade data, broker-dealer price quotations, benchmark yields, issuer spreads on comparable securities, the credit quality, yield, maturity, and other appropriate factors. | |
Loans | Information obtained from market participants regarding reported trade data and broker-dealer price quotations. | |
Event-linked bonds | Information obtained from market participants regarding reported trade data and broker-dealer price quotations. |
If a market value or price cannot be determined for a security using the methodologies described above, or if, in the “good faith” opinion of the Manager, the market value or price obtained does not constitute a “readily available market quotation,” or a significant event has occurred that would materially affect the value of the security, the security is fair valued either (i) by a standardized fair valuation methodology applicable to the security type or the significant event as previously approved by the Valuation Committee and the Fund’s Board or (ii) as determined in good faith by the Manager’s Valuation Committee. The Valuation Committee considers all relevant facts that are reasonably available, through either public information or information available to the Manager, when determining the fair value of a security. Fair value determinations by the Manager are subject to review, approval and ratification by the Fund’s Board at its next regularly scheduled meeting covering the calendar quarter in which the fair valuation was determined. Those fair valuation standardized methodologies include, but are not limited to, valuing securities at the last sale price or initially at cost and subsequently adjusting the value based on: changes in company specific fundamentals, changes in an appropriate securities index, or changes in the value of similar securities which may be further adjusted for any discounts related to security-specific resale restrictions. When possible, such methodologies use observable market inputs such as unadjusted quoted prices of similar securities, observable interest rates, currency rates and yield curves. The methodologies used for valuing securities are not necessarily an indication of the risks associated with investing in those securities nor can it be assured that the Fund can obtain the fair value assigned to a security if it were to sell the security.
To assess the continuing appropriateness of security valuations, the Manager, or its third party service provider who is subject to oversight by the Manager, regularly compares prior day prices, prices on comparable securities, and sale prices to the current day prices and challenges those prices exceeding certain tolerance levels with the third party pricing service or broker source. For those securities valued by fair valuations, whether through a standardized fair valuation methodology or a fair valuation determination, the Valuation Committee reviews and affirms the reasonableness of the valuations based on such methodologies and fair valuation determinations on a regular basis after considering all relevant information that is reasonably available.
Classifications
Each investment asset or liability of the Fund is assigned a level at measurement date based on the significance and source of the inputs to its valuation. Various data inputs are used in determining the value of each of the Fund’s investments as of the reporting period end. These
33 OPPENHEIMER DISCOVERY MID CAP GROWTH FUND
| NOTES TO FINANCIAL STATEMENTS Unaudited / Continued | ||||
| ||||
| 3. Securities Valuation (Continued) | ||||
data inputs are categorized in the following hierarchy under applicable financial accounting standards:
1) Level 1-unadjusted quoted prices in active markets for identical assets or liabilities (including securities actively traded on a securities exchange)
2) Level 2-inputs other than unadjusted quoted prices that are observable for the asset or liability (such as unadjusted quoted prices for similar assets and market corroborated inputs such as interest rates, prepayment speeds, credit risks, etc.)
3) Level 3-significant unobservable inputs (including the Manager’s own judgments about assumptions that market participants would use in pricing the asset or liability).
The inputs used for valuing securities are not necessarily an indication of the risks associated with investing in those securities.
The table below categorizes amounts that are included in the Fund’s Statement of Assets and Liabilities as of April 30, 2015 based on valuation input level:
| Level 3— | ||||||||||||||||
| Level 1— | Level 2— | Significant | ||||||||||||||
| Unadjusted | Other Significant | Unobservable | ||||||||||||||
| Quoted Prices | Observable Inputs | Inputs | Value | |||||||||||||
| ||||||||||||||||
Assets Table | ||||||||||||||||
Investments, at Value: | ||||||||||||||||
Common Stocks | ||||||||||||||||
Consumer Discretionary | $ | 114,993,041 | $ | — | $ | — | $ | 114,993,041 | ||||||||
Consumer Staples | 36,079,885 | — | — | 36,079,885 | ||||||||||||
Energy | 20,631,770 | — | — | 20,631,770 | ||||||||||||
Financials | 41,011,704 | — | — | 41,011,704 | ||||||||||||
Health Care | 82,655,739 | — | — | 82,655,739 | ||||||||||||
Industrials | 76,465,015 | — | — | 76,465,015 | ||||||||||||
Information Technology | 105,086,048 | — | — | 105,086,048 | ||||||||||||
Materials | 20,593,813 | — | — | 20,593,813 | ||||||||||||
Telecommunication Services | 9,793,739 | — | — | 9,793,739 | ||||||||||||
Investment Company | 20,417,921 | — | — | 20,417,921 | ||||||||||||
|
| |||||||||||||||
Total Assets | $ | 527,728,675 | $ | — | $ | — | $ | 527,728,675 | ||||||||
|
| |||||||||||||||
Forward currency exchange contracts and futures contracts, if any, are reported at their unrealized appreciation/depreciation at measurement date, which represents the change in the contract’s value from trade date. All additional assets and liabilities included in the above table are reported at their market value at measurement date.
4. Investments and Risks
Investment in Oppenheimer Institutional Money Market Fund. The Fund is permitted to invest daily available cash balances in an affiliated money market fund. The Fund may invest the available cash in Class E shares of Oppenheimer Institutional Money Market Fund (“IMMF”) to seek current income while preserving liquidity or for defensive purposes. IMMF is a registered open-end management investment company, regulated as a money market fund under the 1940 Act. The Manager is the investment adviser of IMMF, and the Sub-Adviser provides investment and related advisory services to IMMF. When applicable, the Fund’s
34 OPPENHEIMER DISCOVERY MID CAP GROWTH FUND
| ||||
| 4. Investments and Risks (Continued) | ||||
investment in IMMF is included in the Statement of Investments. Shares of IMMF are valued at their net asset value per share. As a shareholder, the Fund is subject to its proportional share of IMMF’s Class E expenses, including its management fee. The Manager will waive fees and/or reimburse Fund expenses in an amount equal to the indirect management fees incurred through the Fund’s investment in IMMF.
Master Limited Partnerships (“MLPs”). MLPs issue common units that represent an equity ownership interest in a partnership and provide limited voting rights. MLP common units are registered with the Securities and Exchange Commission (“SEC”), and are freely tradable on securities exchanges such as the NYSE and the NASDAQ Stock Market (“NASDAQ”), or in the over-the-counter (“OTC”) market. An MLP consists of one or more general partners, who conduct the business, and one or more limited partners, who contribute capital. MLP common unit holders have a limited role in the partnership’s operations and management. The Fund, as a limited partner, normally would not be liable for the debts of the MLP beyond the amounts the Fund has contributed, but would not be shielded to the same extent that a shareholder of a corporation would be. In certain circumstances creditors of an MLP would have the right to seek return of capital distributed to a limited partner. This right of an MLP’s creditors would continue after the Fund sold its investment in the MLP.
Equity Security Risk. Stocks and other equity securities fluctuate in price. The value of the Fund’s portfolio may be affected by changes in the equity markets generally. Equity markets may experience significant short-term volatility and may fall sharply at times. Different markets may behave differently from each other and U.S. equity markets may move in the opposite direction from one or more foreign stock markets. Adverse events in any part of the equity or fixed-income markets may have unexpected negative effects on other market segments.
The prices of individual equity securities generally do not all move in the same direction at the same time and a variety of factors can affect the price of a particular company’s securities. These factors may include, but are not limited to, poor earnings reports, a loss of customers, litigation against the company, general unfavorable performance of the company’s sector or industry, or changes in government regulations affecting the company or its industry.
5. Shares of Beneficial Interest
The Fund has authorized an unlimited number of $0.001 par value shares of beneficial interest of each class. Transactions in shares of beneficial interest were as follows:
35 OPPENHEIMER DISCOVERY MID CAP GROWTH FUND
| NOTES TO FINANCIAL STATEMENTS Unaudited / Continued | ||||
| ||||
| 5. Shares of Beneficial Interest (Continued) | ||||
| Six Months Ended April 30, 2015 | Year Ended October 31, 2014 | |||||||||||||||
| Shares | Amount | Shares | Amount | |||||||||||||
Class A | ||||||||||||||||
Sold | 3,155,714 | $ | 55,751,253 | 4,863,338 | $ | 85,228,889 | ||||||||||
Dividends and/or distributions reinvested | 1,734,174 | 28,110,964 | 739,267 | 12,279,244 | ||||||||||||
Redeemed | (2,245,580 | ) | (38,775,158 | ) | (5,109,054 | ) | (88,179,351 | ) | ||||||||
|
| |||||||||||||||
Net increase | 2,644,308 | $ | 45,087,059 | 493,551 | $ | 9,328,782 | ||||||||||
|
| |||||||||||||||
Class B | ||||||||||||||||
Sold | 48,592 | $ | 743,292 | 87,112 | $ | 1,359,229 | ||||||||||
Dividends and/or distributions reinvested | 105,378 | 1,472,122 | 59,310 | 870,076 | ||||||||||||
Redeemed | (176,469 | ) | (2,661,896 | ) | (422,864 | ) | (6,487,570 | ) | ||||||||
|
| |||||||||||||||
Net decrease | (22,499 | ) | $ | (446,482 | ) | (276,442 | ) | $ | (4,258,265 | ) | ||||||
|
| |||||||||||||||
Class C | ||||||||||||||||
Sold | 814,900 | $ | 12,418,800 | 1,462,948 | $ | 22,641,563 | ||||||||||
Dividends and/or distributions reinvested | 629,511 | 8,857,218 | 256,914 | 3,786,920 | ||||||||||||
Redeemed | (592,500 | ) | (8,976,300 | ) | (1,430,643 | ) | (21,931,556 | ) | ||||||||
|
| |||||||||||||||
Net increase | 851,911 | $ | 12,299,718 | 289,219 | $ | 4,496,927 | ||||||||||
|
| |||||||||||||||
Class I | ||||||||||||||||
Sold | 148,998 | $ | 2,891,227 | 131,309 | $ | 2,517,932 | ||||||||||
Dividends and/or distributions reinvested | 63,400 | 1,129,148 | 30,946 | 557,030 | ||||||||||||
Redeemed | (36,925 | ) | (703,676 | ) | (220,270 | ) | (4,076,780 | ) | ||||||||
|
| |||||||||||||||
Net increase (decrease) | 175,473 | $ | 3,316,699 | (58,015 | ) | $ | (1,001,818 | ) | ||||||||
|
| |||||||||||||||
Class R1 | ||||||||||||||||
Sold | 230,365 | $ | 3,858,422 | 465,087 | $ | 7,738,590 | ||||||||||
Dividends and/or distributions reinvested | 174,560 | 2,693,460 | 75,467 | 1,202,182 | ||||||||||||
Redeemed | (281,342 | ) | (4,624,879 | ) | (565,008 | ) | (9,319,282 | ) | ||||||||
|
| |||||||||||||||
Net increase (decrease) | 123,583 | $ | 1,927,003 | (24,454 | ) | $ | (378,510 | ) | ||||||||
|
| |||||||||||||||
Class Y | ||||||||||||||||
Sold | 529,905 | $ | 10,277,432 | 2,203,564 | $ | 41,922,025 | ||||||||||
Dividends and/or distributions reinvested | 204,147 | 3,619,533 | 97,999 | 1,761,036 | ||||||||||||
Redeemed | (336,964 | ) | (6,372,771 | ) | (1,221,468 | ) | (22,692,126 | ) | ||||||||
|
| |||||||||||||||
Net increase | 397,088 | $ | 7,524,194 | 1,080,095 | $ | 20,990,935 | ||||||||||
|
| |||||||||||||||
1. Effective July 1, 2014, Class N shares were renamed Class R.
36 OPPENHEIMER DISCOVERY MID CAP GROWTH FUND
| ||||
| 6. Purchases and Sales of Securities | ||||
The aggregate cost of purchases and proceeds from sales of securities, other than short-term obligations and investments in IMMF, for the six months ended April 30, 2015 were as follows:
| Purchases | Sales | |||||||
| ||||||||
Investment securities | $ | 248,923,619 | $ | 242,339,462 | ||||
7. Fees and Other Transactions with Affiliates
Management Fees. Under the investment advisory agreement, the Fund pays the Manager a management fee based on the daily net assets of the Fund at an annual rate as shown in the following table:
| Fee Schedule | ||||
| ||||
Up to $ 200 million | 0.90% | |||
Next $ 200 million | 0.85 | |||
Next $ 200 million | 0.80 | |||
Over $600 million | 0.75 | |||
The Fund’s effective management fee for the six months ended April 30, 2015 was 0.85% of average annual net assets before any applicable waivers.
Sub-Adviser Fees. The Manager has retained the Sub-Adviser to provide the day-to-day portfolio management of the Fund. Under the Sub-Advisory Agreement, the Manager pays the Sub-Adviser an annual fee in monthly installments, equal to a percentage of the investment management fee collected by the Manager from the Fund, which shall be calculated after any investment management fee waivers. The fee paid to the Sub-Adviser is paid by the Manager, not by the Fund.
Transfer Agent Fees. OFI Global (the “Transfer Agent”) serves as the transfer and shareholder servicing agent for the Fund. The Fund pays the Transfer Agent a fee based on annual net assets. Fees incurred and average net assets for each class with respect to these services are detailed in the Statement of Operations and Financial Highlights, respectively.
Sub-Transfer Agent Fees. The Transfer Agent has retained Shareholder Services, Inc., a wholly-owned subsidiary of OFI (the “Sub-Transfer Agent”), to provide the day-to-day transfer agent and shareholder servicing of the Fund. Under the Sub-Transfer Agency Agreement, the Transfer Agent pays the Sub-Transfer Agent an annual fee in monthly installments, equal to a percentage of the transfer agent fee collected by the Transfer Agent from the Fund, which shall be calculated after any applicable fee waivers. The fee paid to the Sub-Transfer Agent is paid by the Transfer Agent, not by the Fund.
Trustees’ Compensation. The Fund has adopted an unfunded retirement plan (the “Plan”) for the Fund’s Independent Trustees. Benefits are based on years of service and fees paid to each Trustee during their period of service. The Plan was frozen with respect to adding new participants effective December 31, 2006 (the “Freeze Date”) and existing Plan Participants as of the Freeze Date will continue to receive accrued benefits under the Plan. Active
37 OPPENHEIMER DISCOVERY MID CAP GROWTH FUND
| NOTES TO FINANCIAL STATEMENTS Unaudited / Continued | ||||
| ||||
| 7. Fees and Other Transactions with Affiliates (Continued) | ||||
Independent Trustees as of the Freeze Date have each elected a distribution method with respect to their benefits under the Plan. During the six months ended April 30, 2015, the Fund’s projected benefit obligations, payments to retired Trustees and accumulated liability were as follows:
Projected Benefit Obligations Increased | $ | — | ||
Payments Made to Retired Trustees | 978 | |||
Accumulated Liability as of April 30, 2015 | 7,751 |
The Fund’s Board of Trustees (“Board”) has adopted a compensation deferral plan for Independent Trustees that enables Trustees to elect to defer receipt of all or a portion of the annual compensation they are entitled to receive from the Fund. For purposes of determining the amount owed to the Trustee under the plan, deferred amounts are treated as though equal dollar amounts had been invested in shares of the Fund or in other Oppenheimer funds selected by the Trustee. The Fund purchases shares of the funds selected for deferral by the Trustee in amounts equal to his or her deemed investment, resulting in a Fund asset equal to the deferred compensation liability. Such assets are included as a component of “Other” within the asset section of the Statement of Assets and Liabilities. Deferral of Trustees’ fees under the plan will not affect the net assets of the Fund and will not materially affect the Fund’s assets, liabilities or net investment income per share. Amounts will be deferred until distributed in accordance with the compensation deferral plan.
Distribution and Service Plan (12b-1) Fees. Under its General Distributor’s Agreement with the Fund, OppenheimerFunds Distributor, Inc. (the “Distributor”) acts as the Fund’s principal underwriter in the continuous public offering of the Fund’s classes of shares.
Service Plan for Class A Shares. The Fund has adopted a Service Plan (the “Plan”) for Class A shares pursuant to Rule 12b-1 under the 1940 Act. Under the Plan, the Fund reimburses the Distributor for a portion of its costs incurred for services provided to accounts that hold Class A shares. Reimbursement is made periodically at an annual rate of up to 0.25% of the daily net assets of Class A shares of the Fund. The Distributor currently uses all of those fees to pay dealers, brokers, banks and other financial institutions periodically for providing personal service and maintenance of accounts of their customers that hold Class A shares. Any unreimbursed expenses the Distributor incurs with respect to Class A shares in any fiscal year cannot be recovered in subsequent periods. Fees incurred by the Fund under the Plan are detailed in the Statement of Operations.
Distribution and Service Plans for Class B, Class C and Class R Shares. The Fund has adopted Distribution and Service Plans (the “Plans”) for Class B, Class C and Class R shares pursuant to Rule 12b-1 under the 1940 Act to compensate the Distributor for distributing those share classes, maintaining accounts and providing shareholder services. Under the Plans, the Fund pays the Distributor an annual asset-based sales charge of 0.75% on Class B and Class C shares daily net assets and 0.25% on Class R shares daily net assets. The Fund also pays a service fee under the Plans at an annual rate of 0.25% of daily net assets. The Plans continue in effect from year to year only if the Fund’s Board of Trustees vote annually to
38 OPPENHEIMER DISCOVERY MID CAP GROWTH FUND
| ||||
| 7. Fees and Other Transactions with Affiliates (Continued) | ||||
approve its continuance at an in person meeting called for that purpose. Fees incurred by the Fund under the Plans are detailed in the Statement of Operations.
Sales Charges. Front-end sales charges and CDSC do not represent expenses of the Fund. They are deducted from the proceeds of sales of Fund shares prior to investment or from redemption proceeds prior to remittance, as applicable. The sales charges retained by the Distributor from the sale of shares and the CDSC retained by the Distributor on the redemption of shares is shown in the following table for the period indicated.
| Six Months Ended | Class A Front-End Sales Charges Retained by Distributor | Class A Contingent Deferred Sales Charges Retained by Distributor | Class B Contingent Deferred Sales Charges Retained by Distributor | Class C Contingent Deferred Sales Charges Retained by Distributor | Class R Contingent Deferred Sales Charges Retained by Distributor | |||||||||||||||
April 30, 2015 | $ | 126,777 | $ | 2,564 | $ | 6,164 | $ | 4,104 | $ | 893 | ||||||||||
Waivers and Reimbursements of Expenses. The Manager will waive fees and/or reimburse Fund expenses in an amount equal to the indirect management fees incurred through the Fund’s investment in IMMF. During the six months ended April 30, 2015, the Manager waived fees and/or reimbursed the Fund $6,525 for IMMF management fees.
Waivers and/or reimbursements may be modified or terminated as set forth according to the terms in the prospectus.
8. Pending Litigation
In 2009, seven class action lawsuits were filed in the U.S. District Court for the District of Colorado against OppenheimerFunds, Inc. (“OFI”), OppenheimerFunds Distributor, Inc., the Fund’s principal underwriter and distributor (the “Distributor”), and certain funds (but not including the Fund) advised by OFI Global Asset Management, Inc. and distributed by the Distributor (the “Defendant Funds”). The lawsuits also named as defendants certain officers and current and former trustees of the respective Defendant Funds. The lawsuits raised claims under federal securities laws and alleged, among other things, that the disclosure documents of the respective Defendant Funds contained misrepresentations and omissions and that the respective Defendant Funds’ investment policies were not followed. The plaintiffs in these actions sought unspecified damages, equitable relief and awards of attorneys’ fees and litigation expenses. The Defendant Funds’ Boards of Trustees also engaged counsel to represent the Funds and the present and former Independent Trustees named in those suits. In March 2014, the parties in six of these lawsuits executed stipulations and agreements of settlement resolving those actions. In July 2014, the court entered an order and final judgment approving the settlements as fair, reasonable and adequate. The settlements do not resolve a seventh outstanding lawsuit relating to Oppenheimer Rochester California Municipal Fund (the “California Fund Suit”). OFI believes the California Fund Suit is without legal merit and is defending the suit vigorously. While it is premature to render any opinion as to the outcome in the California Fund Suit, or whether any costs that OFI may bear in defending the California Fund Suit might not be reimbursed by insurance, OFI believes the California Fund
39 OPPENHEIMER DISCOVERY MID CAP GROWTH FUND
| NOTES TO FINANCIAL STATEMENTS Unaudited / Continued | ||||
| ||||
| 8. Pending Litigation (Continued) | ||||
Suit should not impair the ability of OFI or the Distributor to perform their respective duties to the Fund, and that the outcome of the California Fund Suit should not have any material effect on the operations of any of the Oppenheimer funds.
40 OPPENHEIMER DISCOVERY MID CAP GROWTH FUND
PORTFOLIO PROXY VOTING POLICIES AND PROCEDURES;
UPDATES TO STATEMENTS OF INVESTMENTS Unaudited
The Fund has adopted Portfolio Proxy Voting Policies and Procedures under which the Fund votes proxies relating to securities (“portfolio proxies”) held by the Fund. A description of the Fund’s Portfolio Proxy Voting Policies and Procedures is available (i) without charge, upon request, by calling the Fund toll-free at 1.800.CALL OPP (225.5677), (ii) on the Fund’s website at www.oppenheimerfunds.com, and (iii) on the SEC’s website at www.sec.gov. In addition, the Fund is required to file Form N-PX, with its complete proxy voting record for the 12 months ended June 30th, no later than August 31st of each year. The Fund’s voting record is available (i) without charge, upon request, by calling the Fund toll-free at 1.800.CALL OPP (225.5677), and (ii) in the Form N-PX filing on the SEC’s website at www.sec.gov.
The Fund files its complete schedule of portfolio holdings with the SEC for the first quarter and the third quarter of each fiscal year on Form N-Q. The Fund’s Form N-Q filings are available on the SEC’s website at www.sec.gov. Those forms may be reviewed and copied at the SEC’s Public Reference Room in Washington, D.C. Information on the operation of the Public Reference Room may be obtained by calling 1-800-SEC-0330.
Householding—Delivery of Shareholder Documents
This is to inform you about OppenheimerFunds’ “householding” policy. If more than one member of your household maintains an account in a particular fund, OppenheimerFunds will mail only one copy of the fund’s prospectus (or, if available, the fund’s summary prospectus), annual and semiannual report and privacy policy. The consolidation of these mailings, called householding, benefits your fund through reduced mailing expense, and benefits you by reducing the volume of mail you receive from OppenheimerFunds. Householding does not affect the delivery of your account statements.
Please note that we will continue to household these mailings for as long as you remain an OppenheimerFunds shareholder, unless you request otherwise. If you prefer to receive multiple copies of these materials, please call us at 1.800.CALL-OPP (225-5677). You may also notify us in writing or via email. We will begin sending you individual copies of the prospectus (or, if available, the summary prospectus), reports and privacy policy within 30 days of receiving your request to stop householding.
41 OPPENHEIMER DISCOVERY MID CAP GROWTH FUND
OPPENHEIMER DISCOVERY MID CAP GROWTH FUND
© 2015 OppenheimerFunds, Inc. All rights reserved.
42 OPPENHEIMER DISCOVERY MID CAP GROWTH FUND
As an Oppenheimer fund shareholder, you are entitled to know how we protect your personal information and how we limit its disclosure.
Information Sources
We obtain nonpublic personal information about our shareholders from the following sources:
| — | Applications or other forms |
| — | When you create a user ID and password for online account access |
| — | When you enroll in eDocs Direct, our electronic document delivery service |
| — | Your transactions with us, our affiliates or others |
| — | A software program on our website, often referred to as a “cookie,” which indicates which parts of our site you’ve visited |
| — | When you set up challenge questions to reset your password online |
If you visit oppenheimerfunds.com and do not log on to the secure account information areas, we do not obtain any personal information about you. When you do log on to a secure area, we do obtain your user ID and password to identify you. We also use this information to provide you with products and services you have requested, to inform you about products and services that you may be interested in and assist you in other ways.
We do not collect personal information through our website unless you willingly provide it to us, either directly by email or in those areas of the website that request information. In order to update your personal information (including your mailing address, email address and phone number) you must first log on and visit your user profile.
If you have set your browser to warn you before accepting cookies, you will receive the warning message with each cookie. You can refuse cookies by turning them off in your browser. However, doing so may limit your access to certain sections of our website.
We use cookies to help us improve and manage our website. For example, cookies help us recognize new versus repeat visitors to the site, track the pages visited, and enable some special features on the website. This data helps us provide a better service for our website visitors.
Protection of Information
We do not disclose any non-public personal information (such as names on a customer list) about current or former customers to anyone, except as permitted by law.
Disclosure of Information
Copies of confirmations, account statements and other documents reporting activity in your fund accounts are made available to your financial advisor (as designated by you). We may also use details about you and your investments to help us, our financial service affiliates, or firms that jointly market their financial products and services with ours, to better serve your investment needs or suggest financial services or educational material that may be of interest to you. If this requires us to provide you with an opportunity to “opt in” or “opt out” of such information sharing with a firm not affiliated with us, you will receive notification on how to do so, before any such sharing takes place.
Right of Refusal
We will not disclose your personal information to unaffiliated third parties (except as permitted by law), unless we first offer you a reasonable opportunity to refuse or “opt out” of such disclosure.
43 OPPENHEIMER DISCOVERY MID CAP GROWTH FUND
PRIVACY POLICY NOTICE Continued
Internet Security and Encryption
In general, the email services provided by our website are encrypted and provide a secure and private means of communication with us. To protect your own privacy, confidential and/or personal information should only be communicated via email when you are advised that you are using a secure website.
As a security measure, we do not include personal or account information in non-secure emails, and we advise you not to send such information to us in non-secure emails. Instead, you may take advantage of the secure features of our website to encrypt your email correspondence. To do this, you will need to use a browser that supports Secure Sockets Layer (SSL) protocol.
We do not guarantee or warrant that any part of our website, including files available for download, are free of viruses or other harmful code. It is your responsibility to take appropriate precautions, such as use of an anti-virus software package, to protect your computer hardware and software.
| — | All transactions, including redemptions, exchanges and purchases, are secured by SSL and 256-bit encryption. SSL is used to establish a secure connection between your PC and OppenheimerFunds’ server. It transmits information in an encrypted and scrambled format. |
| — | Encryption is achieved through an electronic scrambling technology that uses a “key” to code and then decode the data. Encryption acts like the cable converter box you may have on your television set. It scrambles data with a secret code so that no one can make sense of it while it is being transmitted. When the data reaches its destination, the same software unscrambles the data. |
| — | You can exit the secure area by either closing your browser, or for added security, you can use the Log Out button before you close your browser. |
Other Security Measures
We maintain physical, electronic and procedural safeguards to protect your personal account information. Our employees and agents have access to that information only so that they may offer you products or provide services, for example, when responding to your account questions.
How You Can Help
You can also do your part to keep your account information private and to prevent unauthorized transactions. If you obtain a user ID and password for your account, do not allow it to be used by anyone else. Also, take special precautions when accessing your account on a computer used by others.
Who We Are
This joint notice describes the privacy policies of the Oppenheimer funds, OppenheimerFunds, Inc., each of its investment adviser subsidiaries, OppenheimerFunds Distributor, Inc. and OFI Global Trust Co. It applies to all Oppenheimer fund accounts you presently have, or may open in the future, using your Social Security number—whether or not you remain a shareholder of our funds. This notice was last updated March 2015. In the event it is updated or changed, we will post an updated notice on our website at oppenheimerfunds.com. If you have any questions about this privacy policy, write to us at P.O. Box 5270, Denver, CO 80217-5270, email us by clicking on the Contact Us section of our website at oppenheimerfunds.com or call us at 1.800.CALL OPP (225.5677).
44 OPPENHEIMER DISCOVERY MID CAP GROWTH FUND
THIS PAGE INTENTIONALLY LEFT BLANK.
45 OPPENHEIMER DISCOVERY MID CAP GROWTH FUND
THIS PAGE INTENTIONALLY LEFT BLANK.
46 OPPENHEIMER DISCOVERY MID CAP GROWTH FUND
THIS PAGE INTENTIONALLY LEFT BLANK.
47 OPPENHEIMER DISCOVERY MID CAP GROWTH FUND
OppenheimerFunds® The Right Way to Invest
Visit us at oppenheimerfunds.com for 24-hr access to account information and transactions or call us at 800 CALL OPP (800 225 5677) for 24-hr automated information and automated transactions. Representatives also available Mon–Fri 8am–8pm ET. | ||||
Visit Us oppenheimerfunds.com
Call Us 800 225 5677
Follow Us
|
Oppenheimer funds are distributed by OppenheimerFunds Distributor, Inc. 225 Liberty Street, New York, NY 10281-1008 © 2015 OppenheimerFunds Distributor, Inc. All rights reserved.
RS0721.001.0415 June 25, 2015 | |||


Item 2. Code of Ethics.
Not applicable to semiannual reports.
Item 3. Audit Committee Financial Expert.
Not applicable to semiannual reports.
Item 4. Principal Accountant Fees and Services.
Not applicable to semiannual reports.
Item 5. Audit Committee of Listed Registrants
Not applicable.
Item 6. Schedule of Investments.
a) Not applicable. The complete schedule of investments is included in Item 1 of this Form N-CSR.
b) Not applicable.
Item 7. Disclosure of Proxy Voting Policies and Procedures for Closed-End Management Investment Companies.
Not applicable.
Item 8. Portfolio Managers of Closed-End Management Investment Companies.
Not applicable.
Item 9. Purchases of Equity Securities by Closed-End Management Investment Company and Affiliated Purchasers.
Not applicable.
Item 10. Submission of Matters to a Vote of Security Holders.
The Fund’s Governance Committee Provisions with Respect to Nominations of Directors/Trustees to the Respective Boards
None
Item 11. Controls and Procedures.
Based on their evaluation of the registrant’s disclosure controls and procedures (as defined in rule 30a-3(c) under the Investment Company Act of 1940 (17 CFR 270.30a-3(c)) as of 4/30/2015, the registrant’s principal executive officer and principal financial officer found the registrant’s disclosure controls and procedures to provide reasonable assurances that information required to be disclosed by the registrant in the reports that it files under the Securities Exchange Act of 1934 (a) is accumulated and communicated to registrant’s management, including its principal executive officer and principal financial officer, to allow timely decisions regarding required disclosure, and (b) is recorded, processed, summarized and reported, within the time periods specified in the rules and forms adopted by the U.S. Securities and Exchange Commission.
There have been no changes in the registrant’s internal controls over financial reporting that occurred during the registrant’s second fiscal quarter of the period covered by this report that have materially affected, or are reasonably likely to materially affect, the registrant’s internal control over financial reporting.
Item 12. Exhibits.
| (a) | (1) Not applicable to semiannual reports. |
(2) Exhibits attached hereto.
(3) Not applicable.
| (b) | Exhibit attached hereto. |
SIGNATURES
Pursuant to the requirements of the Securities Exchange Act of 1934 and the Investment Company Act of 1940, the registrant has duly caused this report to be signed on its behalf by the undersigned, thereunto duly authorized.
Oppenheimer Discovery Mid Cap Growth Fund
| By: | /s/ Arthur P. Steinmetz | |
| Arthur P. Steinmetz | ||
| Principal Executive Officer | ||
| Date: | 6/11/2015 |
Pursuant to the requirements of the Securities Exchange Act of 1934 and the Investment Company Act of 1940, this report has been signed below by the following persons on behalf of the registrant and in the capacities and on the dates indicated.
| By: | /s/ Arthur P. Steinmetz | |
| Arthur P. Steinmetz | ||
| Principal Executive Officer | ||
| Date: | 6/11/2015 |
| By: | /s/ Brian W. Wixted | |
| Brian W. Wixted | ||
| Principal Financial Officer | ||
| Date: | 6/11/2015 |