Exhibit 13.1
2014 Aetna Annual Report, Financial Report to Shareholders
Unless the context otherwise requires, references to the terms we, our, or us used throughout this 2014 Annual Report, Financial Report to Shareholders (the “Annual Report”) refer to Aetna Inc. (a Pennsylvania corporation) (“Aetna”) and its subsidiaries.
For your reference, we provide the following index to the Annual Report:
|
| |
| Page | Description |
| 2 - 72 | Management’s Discussion and Analysis of Financial Condition and Results of Operations (“MD&A”) - The MD&A provides a review of our operating results for the years 2012 through 2014, as well as our financial condition at December 31, 2014 and 2013. The MD&A should be read in conjunction with our consolidated financial statements and notes thereto. The MD&A includes the following: |
| 2 | Overview - We begin our MD&A with an overview of earnings, cash flows and significant developments for the last three years and our outlook for 2015. |
| 6 | Health Care - We discuss the factors affecting Health Care revenues and operating earnings in this section. |
| 11 | Group Insurance - We discuss the factors affecting Group Insurance operating earnings in this section. |
| 12 | Large Case Pensions - We discuss the factors affecting Large Case Pensions operating earnings and premiums, including the results of our discontinued products, in this section. |
| 14 | Investments - As an insurer, we have a significant investment portfolio to support our liabilities and capital. In this section, we discuss our investments and describe our evaluation of the risk of our market-sensitive instruments. |
| 16 | Liquidity and Capital Resources - In this section, we discuss our cash flows, financing resources, contractual obligations and other matters that may affect our liquidity and cash flows. |
| 20 | Critical Accounting Estimates - In this section, we discuss the accounting estimates we consider critical in preparing our financial statements. |
| 26 | Regulatory Environment - In this section, we discuss the regulatory environment in which we operate. |
| 42 | Forward-Looking Information/Risk Factors - We conclude our MD&A with a discussion of certain risks and uncertainties that, if developed into actual events, could have a material adverse impact on our business, cash flows, financial condition and/or operating results. |
| 73 | Selected Financial Data - We provide selected annual financial data for the most recent five years. |
| 74 | Consolidated Financial Statements - We include our consolidated balance sheets at December 31, 2014 and 2013 and the related consolidated statements of income, comprehensive income, shareholders’ equity and cash flows for each of the years 2012 through 2014. |
| 79 | Notes to Consolidated Financial Statements |
| 139 | Reports of Management and our Independent Registered Public Accounting Firm - We include a report on our responsibilities for internal control over financial reporting and financial statements, the oversight of our Audit Committee and KPMG LLP’s opinion on our consolidated financial statements and internal control over financial reporting. |
| 141 | Quarterly Data (unaudited) - We provide selected quarterly financial data for each of the last eight quarters. |
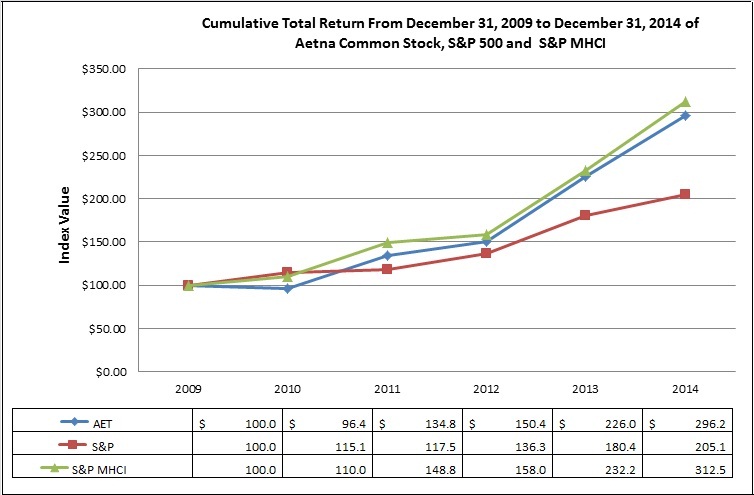
| 142 | Corporate Performance Graph - We provide a graph comparing the cumulative total shareholder return on our common stock to the cumulative total return on certain published indices for the years 2009 through 2014. |
Management’s Discussion and Analysis of Financial Condition and Results of Operations (“MD&A”)
OVERVIEW
We are one of the nation’s leading diversified health care benefits companies, serving an estimated 46 million people with information and resources to help them in consultation with their health care professionals make better informed decisions about their health care. We offer a broad range of traditional, voluntary and consumer-directed health insurance products and related services, including medical, pharmacy, dental, behavioral health, group life and disability plans, medical management capabilities, Medicaid health care management services, Medicare Advantage and Medicare supplement plans, workers’ compensation administrative services and health information technology products and services, such as Accountable Care Solutions (“ACS”). On May 7, 2013 (the “Acquisition Date”), we acquired Coventry Health Care, Inc. (“Coventry”). Our customers include employer groups, individuals, college students, part-time and hourly workers, health plans, health care providers (“providers”), governmental units, government-sponsored plans, labor groups and expatriates. Our operations are conducted in three business segments: Health Care, Group Insurance and Large Case Pensions.
The following MD&A provides a review of our financial condition at December 31, 2014 and December 31, 2013 and operating results for the years ended December 31, 2014, 2013 and 2012. Coventry’s results are recorded within our Health Care segment on and after the Acquisition Date for the year ended December 31, 2013 and for the entire year ended December 31, 2014. The Coventry acquisition significantly impacts the comparability of our results for 2014 to both 2013 and 2012, as only approximately eight months of Coventry’s results were included in 2013. This Overview should be read in conjunction with the entire MD&A, which contains detailed information that is important to understanding our operating results and financial condition, the consolidated financial statements and other data presented in this Annual Report. This Overview is qualified in its entirety by the full MD&A.
Summarized Results
|
| | | | | | | | | | | |
| (Millions) | 2014 |
| | 2013 |
| | 2012 |
|
| Revenue: | | | | | |
| Health Care | $ | 55,108.6 |
| | $ | 44,397.2 |
| | $ | 33,005.8 |
|
| Group Insurance | 2,489.8 |
| | 2,341.2 |
| | 2,147.5 |
|
| Large Case Pensions | 404.8 |
| | 556.2 |
| | 1,446.5 |
|
| Total revenue | 58,003.2 |
| | 47,294.6 |
| | 36,599.8 |
|
| Net income attributable to Aetna | 2,040.8 |
| | 1,913.6 |
| | 1,657.9 |
|
Operating earnings: (1) | | | | | |
| Health Care | 2,376.5 |
| | 2,267.4 |
| | 1,841.5 |
|
| Group Insurance | 171.0 |
| | 130.9 |
| | 164.4 |
|
| Large Case Pensions | 20.7 |
| | 21.2 |
| | 17.8 |
|
| Cash flows from operations | 3,372.8 |
| | 2,278.7 |
| | 1,824.9 |
|
| | | | | | |
| |
(1) | Our discussion of operating results for our reportable business segments is based on operating earnings, which is a non-GAAP measure of net income attributable to Aetna (the term “GAAP” refers to U.S. generally accepted accounting principles). Non-GAAP financial measures we disclose, such as operating earnings, should not be considered a substitute for, or superior to, financial measures determined or calculated in accordance with GAAP. Refer to “Segment Results and Use of Non-GAAP Measures in this Document” beginning on page 5 for a discussion of non-GAAP measures. Refer to pages 8, 12 and 13 for a reconciliation of operating earnings to net income attributable to Aetna for Health Care, Group Insurance and Large Case Pensions, respectively. |
We analyze our operating results based on operating earnings, which excludes from net income attributable to Aetna net realized capital gains and losses, amortization of other acquired intangible assets as well as other items, if any, that, neither relate to the ordinary course of our business nor reflect our underlying business performance. Operating earnings for the past three years were primarily generated from our Health Care segment.
Operating earnings in 2014 were higher than 2013 primarily due to the full-year effect of the inclusion of results from the May 2013 acquisition of Coventry, as well as higher underwriting margins (calculated as premiums less health care costs) in our Health Care segment and higher underwriting margins (calculated as premiums less current
and future benefits) in our Group Insurance segment, partially offset by increased investment spend to support our growth initiatives. Operating earnings in 2013 were higher than 2012 primarily due to the inclusion of results from the May 2013 acquisition of Coventry, as well as higher underwriting margins primarily in our Commercial Health Care business, partially offset by lower underwriting margins in our Government and Group Life businesses.
Total revenue increased in 2014 compared to 2013 primarily as a result of membership growth in our Health Care businesses and the effects of pricing actions designed to recover the fees and taxes mandated by the ACA (as defined below), as well as higher Health Care premiums from the May 2013 acquisition of Coventry. Total revenue increased in 2013 compared to 2012 primarily due to higher Health Care premiums from the May 2013 acquisition of Coventry as well as growth in our Medicare membership and increased Commercial Insured premiums, partially offset by lower group annuity conversion premium in our Large Case Pensions segment.
In 2014, our Health Care segment experienced higher medical Insured membership (where we assume all or a majority of the risk for medical and dental care costs) as well as higher medical membership in our administrative services contract (“ASC”) products (where the plan sponsor assumes all or a majority of the risk for medical and dental care costs). At December 31, 2014, we served approximately 23.5 million medical members (consisting of approximately 39% Insured members and 61% ASC members), 15.5 million dental members and 15.3 million pharmacy benefit management services members. At December 31, 2013, we served approximately 22.2 million medical members (consisting of approximately 39% Insured members and 61% ASC members), 14.1 million dental members and 14.2 million pharmacy benefit management services members. Refer to “Health Care - Membership” on page 10 for further information.
During the past three years our cash flows supported both new and ongoing initiatives.
We generated substantial cash flows in the past three years, which we used to support our ordinary course operating activities; growth strategies, including partially funding the Coventry acquisition, funding other acquisitions, and investing in our Government, Healthagen® and Consumer businesses; repurchasing our common stock; repurchasing our long-term debt; and increasing our shareholder dividend. During 2014, 2013 and 2012, we repurchased approximately 16 million, 23 million and 32 million shares of our common stock, respectively, at a cost of $1.2 billion in 2014 and $1.4 billion in both 2013 and 2012 under share repurchase programs authorized by Aetna’s Board of Directors (our “Board”).
Refer to “Liquidity and Capital” resources beginning on page 16 for additional information on our primary sources and uses of cash flows.
Health Care Reform
The Patient Protection and Affordable Care Act and the Health Care and Education Reconciliation Act of 2010 (collectively, “Health Care Reform” or “ACA”) has changed and will continue to make broad-based changes to the U.S. health care system which could significantly affect the U.S. economy and we expect will continue to significantly impact our business operations and financial results, including our pricing, our medical benefit ratios (“MBRs”) and the geographies in which our products are available. Health Care Reform presents us with new business opportunities, but also with new financial and regulatory challenges. It is reasonably possible that Health Care Reform, in the aggregate, could have a material adverse effect on our business operations and financial results.
On October 1, 2013, public health insurance exchanges (“Public Exchanges”) became available for consumers to access and begin the enrollment process for coverage beginning January 1, 2014.
We paid both our approximately $605 million portion of the ACA’s non tax-deductible health insurer fee and an approximately $298 million portion of our estimated 2014 ACA reinsurance contribution in 2014. Substantially all of these fees were recorded ratably each month within operating expenses. We project that our share of the 2015 Health Care Reform fees, assessments and taxes will be approximately $1.1 billion, which includes our share of the ACA’s health insurer fee, which we project will be approximately $900 million. Refer to Notes 2 and 5 of Notes to Consolidated Financial Statements beginning on pages 80 and 92, respectively, for additional information on the ACA’s health insurer fee and reinsurance program.
Federal budget negotiations, ongoing regulatory changes to Health Care Reform (such as the November 2013 action permitting renewal through 2014 of individual and small group insurance policies that do not comply with Health Care Reform and the March 2014 action permitting such renewal through 2017), pending efforts in the U.S. Congress to amend or restrict funding for various aspects of Health Care Reform and litigation challenging aspects of the law continue to create uncertainty about the ultimate impact of Health Care Reform. An example of this uncertainty is the litigation pending before the U.S. Supreme Court concerning whether the Internal Revenue Service may make tax credits available as a form of subsidy to individuals who purchase health insurance through Public Exchanges established by the federal government (“Federal Exchanges”). We will continue to enroll and insure members through the Federal Exchanges pending the resolution of this and other pending cases. If the payment of subsidies with respect to members who enroll through the Federal Exchanges ultimately is invalidated, it could result in a significant reduction in Aetna’s Public Exchange membership because almost all of Aetna’s Public Exchange membership is through Federal Exchanges, and most of those members benefit from a tax subsidy.
The availability of funding for the ACA’s risk corridor program is a second example of this uncertainty. In May 2014, the Centers for Medicare & Medicaid Services (“CMS”) published a final rule on Public Exchanges. The final rule provides that payments to health plans under the risk corridor program required by Health Care Reform will no longer be limited to the aggregate amount of the risk corridor collections received by the U.S. Department of Health and Human Services (“HHS”) over the duration of the risk corridor program. However, it is possible that payments to health plans under the risk corridor program will require additional appropriation legislation to be passed by the U.S. Congress. Additionally, in December 2014, the Consolidated and Further Continuing Appropriations Act was enacted, which among other things, prohibits HHS’s use of certain funds to pay HHS’s potential obligation under the ACA’s risk corridor program. As a result, we did not record any receivable under the ACA’s risk corridor program at December 31, 2014.
We cannot predict whether pending or future federal or state legislation or court proceedings, including future U.S. Congressional appropriations and the proceedings relating to tax credits for Federal Exchange members described above, will change various aspects of Health Care Reform or state level health care reform, nor can we predict the impact those changes will have on our business operations and/or financial results, but the effects could be materially adverse.
For additional information on Health Care Reform, refer to “Regulatory Environment” beginning on page 26, and for a discussion of certain factors that may cause our actual results to differ from currently anticipated results in connection with Health Care Reform, refer to “Forward-Looking Information/Risk Factors” beginning on page 42.
Outlook for 2015
2014 was a year of significant change for us and our industry, and we expect to continue to face significant business challenges and uncertainties in 2015. These challenges and uncertainties include: the continued collection in our premiums and fees or solving for the impact of the increase in 2015 fees, taxes and assessments imposed by Health Care Reform; the 2015 pricing of our Medicaid and Group Insurance businesses, which could negatively impact our 2015 underwriting margins as the 2015 pricing takes into account the strong performance we experienced in 2014; and the outcome of the pending U.S. Supreme Court case concerning the availability of tax credits for people who purchased health insurance through Public Exchanges established by the federal government. There is also the risk and uncertainty that medical cost trends could increase more than we project, including among other things, as a result of a more severe flu season than expected, as well as continued uncertainty around the operating results of our Health Care Reform compliant business.
On the other hand, we also believe there are opportunities for operating earnings growth in 2015, primarily from the continued impact of Coventry-related synergies; higher Medicare underwriting margins as a result of our investments made in the Medicare Advantage business; additional fixed cost leverage as we expect revenue to increase in 2015 and we continue to manage our operating expenses; and the potential for growth and underwriting margin improvement in our individual business.
Our primary goals for 2015 are to: continue to appropriately price our business and grow membership while continuing to solve for the financial impacts of the significant fees, taxes and assessments imposed on us by Health Care Reform; further simplify our products and processes; continue to execute on our Public Exchange and private health insurance exchange (“Private Exchange”) strategies; transform the provider business model through provider collaboration (including accountable care organizations (“ACOs”)), and continue to migrate the Coventry business and operations and achieve the related synergies.
Refer to “Forward-Looking Information/Risk Factors” beginning on page 42 for information regarding other important factors that may cause our actual results to differ from those currently projected in “Outlook for 2015” and/or otherwise materially affect us.
Board of Directors Update
Olympia J. Snowe was appointed to our Board in July 2014, for a term that will run until our 2015 Annual Meeting of Shareholders. Ms. Snowe is a former United States Senator and currently is Chairman and Chief Executive Officer of Olympia Snowe, LLC, a policy and communications consulting firm. She also serves on our Board’s Audit Committee and Medical Affairs Committee. With the addition of Ms. Snowe, our Board now consists of thirteen directors.
Management Update
In July 2014, Harold L. Paz, M.D., M.S., joined Aetna as Executive Vice President, Chief Medical Officer.
Effective January 1, 2015, Karen S. Rohan was appointed President of Aetna. In this role, Ms. Rohan will continue to lead our Local and Regional businesses, in addition to our National Accounts, Government and Specialty businesses.
2014 Acquisitions
During 2014, we completed the acquisitions of the InterGlobal group (“InterGlobal”) and bSwift LLC (“bSwift”).
•The InterGlobal group
In April 2014, we acquired InterGlobal, a company that specializes in international private medical insurance for groups and individuals in the Middle East, Asia, Africa and Europe. The purchase price was not material.
•bSwift LLC
In November 2014, we acquired bSwift for approximately $400 million. bSwift provides a technology platform that offers a retail shopping experience for health insurance exchanges and employees nationwide and benefit administration technology and services to employers.
Refer to Notes 3 and 7 of Notes to Consolidated Financial Statements beginning on pages 90 and 93, respectively for additional information.
Segment Results and Use of Non-GAAP Measures in this Document
The following discussion of operating results is presented based on our reportable segments in accordance with the accounting guidance for segment reporting and is consistent with our segment disclosure included in Note 19 of Notes to Consolidated Financial Statements beginning on page 132. Our operations are conducted in three business segments: Health Care, Group Insurance and Large Case Pensions. Our Corporate Financing segment is not a business segment; it is added to our business segments to reconcile our segment reporting to our consolidated results. The Corporate Financing segment includes interest expense on our outstanding debt and the financing components of our pension and other postretirement employee benefit plans (“OPEB”) expense (the service cost and prior service cost components of this expense are allocated to our business segments).
Our discussion of operating results is based on operating earnings. Operating earnings exclude from net income attributable to Aetna reported in accordance with GAAP, net realized capital gains or losses, amortization of other acquired intangible assets and other items, if any, that neither relate to the ordinary course of our business nor reflect our underlying business performance. Although the excluded items may recur, we believe excluding them from net income attributable to Aetna to arrive at operating earnings provides more meaningful information about our underlying business performance. Net realized capital gains and losses arise from various types of transactions, primarily in the course of managing a portfolio of assets that support the payment of liabilities. Amortization of other acquired intangible assets relates to our acquisition activities, including Coventry, InterGlobal and bSwift. These transactions and amortization do not directly relate to the underwriting or servicing of products for our customers and are not directly related to the core performance of our business operations. Operating earnings is the measure reported to our Chief Executive Officer for purposes of assessing financial performance and making operating decisions, such as the allocation of resources among our business segments. In each business segment discussion in this MD&A, we provide a table that reconciles operating earnings to net income attributable to Aetna. Each table details the net realized capital gains or losses, amortization of other acquired intangible assets and any other items excluded from net income attributable to Aetna, and the footnotes to each table describe the nature of each other item and why we believe it is appropriate to exclude that item from net income attributable to Aetna. Non-GAAP financial measures we disclose, such as operating earnings, should not be considered a substitute for, or superior to, financial measures determined or calculated in accordance with GAAP.
HEALTH CARE
Health Care consists of medical, pharmacy benefit management services, dental, behavioral health and vision plans offered on both an Insured basis and an ASC basis and Healthagen® products and services, such as ACS, that complement and enhance our medical products. Medical products include point-of-service (“POS”), preferred provider organization (“PPO”), health maintenance organization (“HMO”) and indemnity benefit plans. Medical products also include health savings accounts (“HSAs”) and Aetna HealthFund®, consumer-directed health plans that combine traditional POS or PPO and/or dental coverage, subject to a deductible, with an accumulating benefit account (which may be funded by the plan sponsor and/or the member in the case of HSAs). We also offer Medicare and Medicaid products and services and other medical products, such as medical management and data analytics services, medical stop loss insurance, workers’ compensation administrative services and products that provide access to our provider networks in select geographies. We separately track premiums and health care costs for Government businesses (which represents our combined Medicare and Medicaid products). All other medical, dental and other Health Care products are referred to as Commercial.
Operating Summary
|
| | | | | | | | | | | |
| (Millions) | 2014 |
| | 2013 |
| | 2012 |
|
| Premiums: | | | | | |
| Commercial | $ | 28,563.2 |
| | $ | 24,481.2 |
| | $ | 20,944.4 |
|
| Government | 20,999.0 |
| | 15,178.5 |
| | 7,927.6 |
|
| Total premiums | 49,562.2 |
| | 39,659.7 |
| | 28,872.0 |
|
| Fees and other revenue | 5,114.4 |
| | 4,425.5 |
| | 3,736.9 |
|
| Net investment income | 367.6 |
| | 309.3 |
| | 310.4 |
|
| Net realized capital gains | 64.4 |
| | 2.7 |
| | 86.5 |
|
| Total revenue | 55,108.6 |
| | 44,397.2 |
| | 33,005.8 |
|
| Health care costs | 40,746.7 |
| | 32,896.0 |
| | 23,728.9 |
|
| Operating expenses: | | | | | |
| Selling expenses | 1,536.9 |
| | 1,242.8 |
| | 1,015.7 |
|
| General and administrative expenses | 8,801.1 |
| | 7,061.8 |
| | 5,480.3 |
|
| Total operating expenses | 10,338.0 |
| | 8,304.6 |
| | 6,496.0 |
|
| Amortization of other acquired intangible assets | 242.2 |
| | 210.2 |
| | 137.6 |
|
| Total benefits and expenses | 51,326.9 |
| | 41,410.8 |
| | 30,362.5 |
|
| Income before income taxes | 3,781.7 |
| | 2,986.4 |
| | 2,643.3 |
|
| Income taxes | 1,587.2 |
| | 1,078.4 |
| | 950.5 |
|
| Net income including non-controlling interests | 2,194.5 |
| | 1,908.0 |
| | 1,692.8 |
|
| Less: Net income (loss) attributable to non-controlling interests | 1.1 |
| | (4.5 | ) | | .3 |
|
| Net income attributable to Aetna | $ | 2,193.4 |
| | $ | 1,912.5 |
| | $ | 1,692.5 |
|
| | | | | | |
The table presented below reconciles net income attributable to Aetna to operating earnings (1):
|
| | | | | | | | | | | |
| (Millions) | 2014 |
| | 2013 |
| | 2012 |
|
| Net income attributable to Aetna | $ | 2,193.4 |
| | $ | 1,912.5 |
| | $ | 1,692.5 |
|
| Net realized capital gains, net of tax | (41.5 | ) | | (.7 | ) | | (56.6 | ) |
| Amortization of other acquired intangible assets, net of tax | 157.4 |
| | 136.6 |
| | 89.4 |
|
| Transaction, integration-related and restructuring costs, net of tax | 134.2 |
| | 219.0 |
| | 14.1 |
|
| Release of litigation-related reserve, net of tax | (67.0 | ) | | — |
| | — |
|
| Litigation-related settlement, net of tax | — |
| | — |
| | 78.0 |
|
| Severance charge, net of tax | — |
| | — |
| | 24.1 |
|
| Operating earnings | $ | 2,376.5 |
| | $ | 2,267.4 |
| | $ | 1,841.5 |
|
| | | | | | |
| |
(1) | In addition to net realized capital gains and amortization of other acquired intangible assets, the following other items are excluded from operating earnings because we believe they neither relate to the ordinary course of our business nor reflect our underlying business performance: |
| |
| • | In 2014, we incurred transaction and integration-related costs related to the acquisitions of Coventry, InterGlobal and bSwift of $134.2 million ($200.7 million pretax), which was entirely recorded in the Health Care segment. In 2013 and 2012, we incurred transaction, integration-related and restructuring costs related to the acquisition of Coventry of $233.5 million ($332.8 million pretax) and $25.4 million ($32.6 million pretax), respectively, of which $219.0 million ($310.5 million pretax) and $14.1 million ($15.2 million pretax), respectively, were recorded in the Health Care segment. Restructuring costs, primarily comprised of severance and real estate consolidation costs, are related to the acquisition of Coventry and Aetna’s expense management and cost control initiatives. Transaction costs include advisory, legal and other professional fees which are not deductible for tax purposes and are reflected in our GAAP Consolidated Statements of Income in general and administrative expenses. Transaction costs also include transaction-related payments as well as expenses related to the negative cost of carry associated with the permanent financing that we obtained in November 2012 for the Coventry acquisition. Prior to the Acquisition Date, that negative cost of carry associated with the permanent financing was excluded from operating earnings. The components of the negative cost of carry are reflected in our GAAP Consolidated Statements of Income in interest expense, net investment income, and general and administrative expenses. On and after the Acquisition Date, the interest expense and general and administrative expenses associated with the permanent financing are no longer excluded from operating earnings. |
| |
| • | In 2012, we recorded a charge of $78.0 million ($120.0 million pretax) related to the settlement of purported class action litigation regarding Aetna’s payment practices related to out-of-network health care providers. That charge included the estimated cost of legal fees of plaintiffs’ counsel and the costs of administering the settlement. In 2014, we exercised our right to terminate the settlement agreement. As a result, we released the reserve established in connection with the settlement agreement, net of amounts due to the settlement administrator, which reduced 2014 other general and administrative expenses by $67.0 million ($103.0 million pretax). Refer to Note 18 beginning on page 127 for additional information on the termination of the settlement agreement. |
| |
| • | In 2012, we recorded a severance charge of $24.1 million ($37.0 million pretax) related to actions taken in 2012 and 2013. |
Operating earnings in 2014 increased compared to 2013.
In 2014, operating earnings increased compared to the corresponding period in 2013, primarily due to the May 2013 acquisition of Coventry, as well as higher underwriting margins in both our Government and Commercial businesses, partially offset by increased investment spend to support our growth initiatives, primarily in our Government, Healthagen® and Consumer businesses. In 2013, operating earnings increased compared to the corresponding period in 2012, primarily due to the acquisition of Coventry in May 2013, as well as higher underwriting margins primarily in our Commercial business, partially offset by lower underwriting margins in our Government business. Refer to our discussion of Commercial and Government results below for additional information.
We calculate our medical benefit ratio (“MBR”) by dividing health care costs by health care premiums. Our MBRs by product for the last three years were:
|
| | | | | | | | |
| | 2014 |
| | 2013 |
| | 2012 |
|
| Commercial | 80.2 | % | | 80.1 | % | | 81.1 | % |
| Government | 84.9 | % | | 87.5 | % | | 84.9 | % |
| Total | 82.2 | % | | 82.9 | % | | 82.2 | % |
| | | | | | |
Refer to our discussion of Commercial and Government results below for an explanation of the changes in our premiums and MBRs. In addition, the calculation of Health Care Costs Payable is a critical accounting estimate (refer to “Critical Accounting Estimates - Health Care Costs Payable” beginning on page 20 for additional information).
Commercial operating results for 2014 reflected improved underwriting margins as well as the full-year impact of the May 2013 acquisition of Coventry.
Commercial premiums were $4.1 billion higher in 2014 than 2013, primarily as a result of higher membership in our Commercial Insured business, the effects of pricing actions designed to recover fees and taxes mandated by the ACA and higher premium rates, as well as the full-year impact of the May 2013 acquisition of Coventry. Commercial premiums were $3.5 billion higher in 2013 than 2012, primarily from the acquisition of Coventry and higher premium rates in our Commercial Insured business.
Our Commercial MBRs were 80.2%, 80.1% and 81.1% for 2014, 2013 and 2012, respectively. Our Commercial MBR increased in 2014 compared to 2013, primarily due to costs associated with new hepatitis C treatments, the performance of our individual business, which reflects the impact of programs mandated by the ACA in 2014, and performance in the smaller middle-market business, partially offset by higher premiums driven in part by pricing actions designed to recover fees and taxes mandated by the ACA. In addition, we did not record any Health Care Reform risk corridor receivables at December 31, 2014. The improvement in our Commercial MBR in 2013 compared to 2012 is primarily due to the impact of increased favorable development of prior-years’ health care cost estimates in 2013.
Government operating results for 2014 reflect improved underwriting margins and the full-year impact of the May 2013 acquisition of Coventry.
Government premiums were $5.8 billion higher in 2014 than 2013 primarily as a result of membership growth in both our Medicare and Medicaid Insured products, as well as the full-year impact of the May 2013 acquisition of Coventry. Government premiums were $7.3 billion higher in 2013 compared to 2012 primarily due to membership growth in our Medicare business, the addition of Coventry membership, as well as Medicaid in-state expansions and growth in high acuity Medicaid populations.
Our Government MBRs were 84.9%, 87.5% and 84.9% for 2014, 2013 and 2012, respectively. The improvement in our Government MBR in 2014 compared with 2013 is primarily due to actions impacting revenue and medical costs designed to solve for the gap between Medicare premiums and medical costs and other expenses, including the health insurer fee, as well as increased favorable development of prior-year health care cost estimates in 2014. The increase in our Government MBR in 2013 compared with 2012 is primarily due to the effects of favorable 2012 experience being reflected in customer renewal premiums in 2013 as well as underperformance in two specific Medicare product offerings and the impacts of sequestration on Medicare reimbursement rates, partially offset by the inclusion of Coventry, which added geographies carrying relatively lower MBRs in our Medicaid products.
Fees and Other Revenue
Health Care fees and other revenue for 2014 increased approximately $689 million compared to 2013 due primarily to higher average fee yields and growth in our Commercial ASC membership, as well as the inclusion of Coventry’s service businesses for the full year. Health Care fees and other revenue for 2013 increased $689 million compared to 2012 due primarily to the inclusion of Coventry’s service businesses.
General and Administrative Expenses
General and administrative expenses increased by approximately $1.7 billion during 2014 compared to 2013 due primarily to the inclusion of fees mandated by the ACA in 2014, the inclusion of Coventry’s general and administrative expenses for the full year and increased investment spend to support our growth initiatives, primarily in our Government, Healthagen® and Consumer businesses, partially offset by continued execution of our expense initiatives, including execution on our Coventry-related cost synergies, and the favorable impact of releasing a litigation-related reserve during 2014, which reduced general and administrative expenses by $103 million pretax. General and administrative expenses increased by approximately $1.6 billion during 2013 compared to 2012 due
primarily to the inclusion of Coventry’s general and administrative expenses as well as transaction, integration-related and restructuring costs and growth in each of our businesses which were partially offset by continued execution of our expense reduction initiatives, including execution on our Coventry-related cost synergies.
Income taxes
Our effective tax rate was 42 percent in 2014 and 36 percent in both 2013 and 2012. The increase in our effective tax rate during 2014 reflects the impact of the ACA, including the non-deductibility of the health insurer fee.
Membership
Health Care’s membership at December 31, 2014 and 2013 was as follows:
|
| | | | | | | | | | | | | | | | | |
| | 2014 | | 2013 |
| (Thousands) | Insured | | ASC | | Total | | Insured | | ASC | | Total |
| Medical: | | | | | | | | | | | |
| Commercial | 6,314 |
| | 13,508 |
| | 19,822 |
| | 6,045 |
| | 12,776 |
| | 18,821 |
|
| Medicare | 1,140 |
| | — |
| | 1,140 |
| | 968 |
| | — |
| | 968 |
|
| Medicare Supplement | 462 |
| | — |
| | 462 |
| | 386 |
| | — |
| | 386 |
|
| Medicaid | 1,370 |
| | 754 |
| | 2,124 |
| | 1,216 |
| | 799 |
| | 2,015 |
|
| Total Medical Membership | 9,286 |
| | 14,262 |
| | 23,548 |
| | 8,615 |
| | 13,575 |
| | 22,190 |
|
| | | | | | | | | | | | |
Consumer-Directed Health Plans (1) | |
| | |
| | 3,830 |
| | | | | | 3,254 |
|
| | | | | | | | | | | | |
| Dental: | |
| | |
| | |
| | | | | | |
| Total Dental Membership | 6,138 |
| | 9,356 |
| | 15,494 |
| | 5,472 |
| | 8,673 |
| | 14,145 |
|
| | | | | | | | | | | | |
| Pharmacy: | |
| | |
| | |
| | |
| | |
| | |
| Commercial | |
| | |
| | 10,731 |
| | |
| | |
| | 10,191 |
|
| Medicare PDP (stand-alone) | |
| | |
| | 1,572 |
| | |
| | |
| | 2,166 |
|
| Medicare Advantage PDP | |
| | |
| | 754 |
| | |
| | |
| | 588 |
|
| Medicaid | |
| | |
| | 2,262 |
| | |
| | |
| | 1,214 |
|
| Total Pharmacy Benefit Management Services | | | | 15,319 |
| | | | | | 14,159 |
|
| | | | | | | | | | | | |
| |
(1) | Represents members in consumer-directed health plans who also are included in Commercial medical membership above. |
Total medical membership at December 31, 2014 increased compared to December 31, 2013, primarily reflecting growth in our Commercial, Medicare and Insured Medicaid products, which was partially offset by a reduction in our Medicaid ASC products.
Total dental membership at December 31, 2014 increased compared to December 31, 2013 primarily reflecting growth in our Medicaid ASC products as well as growth in our Insured dental products which was partially offset by a reduction in our Commercial ASC dental products.
Total pharmacy benefit management services membership increased at December 31, 2014 compared to December 31, 2013 primarily reflecting growth in both our Medicaid and Commercial products which was partially offset by a decline in our Medicare products.
GROUP INSURANCE
Group Insurance primarily includes group life insurance and group disability products. Group life insurance products are offered on an Insured basis and include basic and supplemental group term life, group universal life, supplemental or voluntary programs and accidental death and dismemberment coverage. Group disability products primarily consist of short-term and long-term disability products (and products which combine both), which are offered to employers on both an Insured and an ASC basis, and absence management services offered to employers, which include short-term and long-term disability administration and leave management. Group Insurance also includes long-term care products that were offered primarily on an Insured basis, which provide benefits covering the cost of care in private home settings, adult day care, assisted living or nursing facilities. We no longer solicit or accept new long-term care customers.
Operating Summary
|
| | | | | | | | | | | |
| (Millions) | 2014 |
| | 2013 |
| | 2012 |
|
| Premiums: | | | | | |
| Life | $ | 1,240.7 |
| | $ | 1,150.6 |
| | $ | 1,066.8 |
|
| Disability | 824.9 |
| | 742.4 |
| | 623.6 |
|
| Long-term care | 44.3 |
| | 44.9 |
| | 45.9 |
|
| Total premiums | 2,109.9 |
| | 1,937.9 |
| | 1,736.3 |
|
| Fees and other revenue | 104.3 |
| | 115.4 |
| | 105.7 |
|
| Net investment income | 261.2 |
| | 286.6 |
| | 282.8 |
|
| Net realized capital gains | 14.4 |
| | 1.3 |
| | 22.7 |
|
| Total revenue | 2,489.8 |
| | 2,341.2 |
| | 2,147.5 |
|
| Current and future benefits | 1,798.3 |
| | 1,811.2 |
| | 1,532.6 |
|
| Operating expenses: | | | | | |
| Selling expenses | 116.1 |
| | 105.8 |
| | 89.8 |
|
| General and administrative expenses | 337.2 |
| | 301.7 |
| | 280.5 |
|
| Reversal of allowance on reinsurance recoverable | — |
| | (42.2 | ) | | — |
|
| Total operating expenses | 453.3 |
| | 365.3 |
| | 370.3 |
|
| Amortization of other acquired intangible assets | 1.2 |
| | 4.4 |
| | 4.4 |
|
| Total benefits and expenses | 2,252.8 |
| | 2,180.9 |
| | 1,907.3 |
|
| Income before income taxes | 237.0 |
| | 160.3 |
| | 240.2 |
|
| Income taxes | 57.4 |
| | 32.3 |
| | 62.3 |
|
| Net income including non-controlling interests | 179.6 |
| | 128.0 |
| | 177.9 |
|
| Less: Net income attributable to non-controlling interests | — |
| | 2.8 |
| | 1.6 |
|
| Net income attributable to Aetna | $ | 179.6 |
| | $ | 125.2 |
| | $ | 176.3 |
|
The table presented below reconciles net income attributable to Aetna to operating earnings (1):
|
| | | | | | | | | | | |
| (Millions) | 2014 |
| | 2013 |
| | 2012 |
|
| Net income attributable to Aetna | $ | 179.6 |
| | $ | 125.2 |
| | $ | 176.3 |
|
| Net realized capital gains, net of tax | (9.4 | ) | | (.8 | ) | | (14.8 | ) |
| Amortization of other acquired intangible assets, net of tax | .8 |
| | 2.9 |
| | 2.9 |
|
| Charge for changes in life insurance claim payment practices, net of tax | — |
| | 35.7 |
| | — |
|
| Reversal of allowance and gain on sale of reinsurance recoverable, net of tax | — |
| | (32.1 | ) | | — |
|
| Operating earnings | $ | 171.0 |
| | $ | 130.9 |
| | $ | 164.4 |
|
| | | | | | |
| |
(1) | In addition to net realized capital gains and amortization of other acquired intangible assets, the following other items are excluded from operating earnings because we believe they neither relate to the ordinary course of our business nor reflect our underlying business performance: |
| |
| • | In the fourth quarter of 2013, we increased our estimated liability for unpaid life insurance claims with respect to insureds who passed away on or before December 31, 2013, and recorded in current and future benefits a charge of $35.7 million ($55.0 million pretax) as a result of changes during the fourth quarter of 2013 in our life insurance claim payment practices (including related escheatment practices) based on evolving industry practices and regulatory expectations and interpretations. Refer to Note 18 of Notes to Consolidated Financial Statements beginning on page 127 for additional information on the changes in our life insurance claim payment practices. |
| |
| • | In 2008, as a result of the liquidation proceedings of Lehman Re Ltd. (“Lehman Re”), a subsidiary of Lehman Brothers Holdings Inc., we recorded an allowance against our reinsurance recoverable from Lehman Re of $27.4 million ($42.2 million pretax). This reinsurance was placed in 1999 and was on a closed book of paid-up group whole life insurance business. In 2013, we sold our claim against Lehman Re to an unrelated third party (including the reinsurance recoverable) and terminated the reinsurance arrangement. Upon the sale of the claim and termination of the arrangement, we reversed the related allowance thereby reducing other general and administrative expenses by $27.4 million ($42.2 million pretax) and recognized a $4.7 million ($7.2 million pretax) gain on the sale in fees and other revenue. |
Operating earnings for 2014 increased by $40.1 million compared to 2013, primarily due to higher underwriting margins, reflecting improved experience in both our life and disability products, partially offset by lower net investment income due primarily to lower yields on debt securities. Operating earnings for 2013 declined by $33.5 million compared to 2012, primarily reflecting lower underwriting margins in our group life insurance products due to higher claim incidence, partially offset by higher underwriting margins in our disability products.
Our group benefit ratios, which represent current and future benefits divided by premiums, were 85.2% for 2014, 93.5% for 2013, and 88.3% for 2012. The improvement in our group benefit ratio in 2014 is primarily due to higher underwriting margins, reflecting improved experience in both our life and disability products. The increase in our group benefit ratio in 2013 is primarily due to the fourth quarter 2013 charge related to changes in our life insurance claim payment practices (including related escheatment practices) and lower underwriting margins in our group life insurance products from higher claim incidence, partially offset by higher underwriting margins in our disability products.
LARGE CASE PENSIONS
Large Case Pensions manages a variety of retirement products (including pension and annuity products) primarily for tax-qualified pension plans. These products provide a variety of funding and benefit payment distribution options and other services. The Large Case Pensions segment includes certain discontinued products.
Operating Summary
|
| | | | | | | | | | | |
| (Millions) | 2014 |
| | 2013 |
| | 2012 |
|
| Premiums | $ | 76.4 |
| | $ | 140.0 |
| | $ | 165.7 |
|
Group annuity contract conversion premium (1) | — |
| | 99.0 |
| | 941.4 |
|
| Net investment income | 317.1 |
| | 320.4 |
| | 329.0 |
|
| Other revenue | 9.7 |
| | 9.6 |
| | 10.9 |
|
| Net realized capital gains (losses) | 1.6 |
| | (12.8 | ) | | (.5 | ) |
| Total revenue | 404.8 |
| | 556.2 |
| | 1,446.5 |
|
| Current and future benefits | 366.7 |
| | 440.2 |
| | 477.5 |
|
Benefit expense on group annuity contract conversion (1) | — |
| | 99.0 |
| | 941.4 |
|
| General and administrative expenses | 12.4 |
| | 12.4 |
| | 12.6 |
|
| Reduction of reserve for anticipated future losses on discontinued products | — |
| | (86.0 | ) | | — |
|
| Total benefits and expenses | 379.1 |
| | 465.6 |
| | 1,431.5 |
|
| Income before income taxes | 25.7 |
| | 90.6 |
| | 15.0 |
|
| Income taxes (benefits) | .7 |
| | 21.8 |
| | (2.4 | ) |
| Net income including non-controlling interests | 25.0 |
| | 68.8 |
| | 17.4 |
|
| Less: Net income attributable to non-controlling interests | 3.3 |
| | — |
| | — |
|
| Net income attributable to Aetna | $ | 21.7 |
| | $ | 68.8 |
| | $ | 17.4 |
|
| | | | | | |
| |
(1) | In 2013 and 2012, pursuant to contractual rights exercised by the contract holders, certain existing group annuity contracts converted from participating to non-participating contracts. Upon conversion, we recorded $99.0 million and $941.4 million of non-cash group annuity conversion premium for these contracts and a corresponding $99.0 million and $941.4 million non-cash benefit expense on group annuity conversion for these contracts during 2013 and 2012, respectively. |
The table presented below reconciles net income attributable to Aetna to operating earnings:
|
| | | | | | | | | | | |
| (Millions) | 2014 |
| | 2013 |
| | 2012 |
|
| Net income attributable to Aetna | $ | 21.7 |
| | $ | 68.8 |
| | $ | 17.4 |
|
| Net realized capital (gains) losses, net of tax | (1.0 | ) | | 8.3 |
| | .4 |
|
Reduction of reserve for anticipated future losses on discontinued products, net of tax (1) | — |
| | (55.9 | ) | | — |
|
| Operating earnings | $ | 20.7 |
| | $ | 21.2 |
| | $ | 17.8 |
|
| | | | | | |
| |
(1) | In 1993, we discontinued the sale of our fully guaranteed large case pension products and established a reserve for anticipated future losses on these products, which we review quarterly. In 2013, we reduced the reserve for anticipated future losses on discontinued products by $55.9 million ($86.0 million pretax). We believe excluding any changes in the reserve for anticipated future losses on discontinued products from operating earnings provides more useful information as to our continuing products and is consistent with the treatment of the operating results of these discontinued products, which are credited or charged to the reserve and do not affect our operating results. Refer to Note 20 of Notes to Consolidated Financial Statements beginning on page 135 for additional information on the reduction of the reserve for anticipated future losses on discontinued products. |
Premiums decreased in 2014 when compared to the corresponding period in 2013, primarily as a result of the discontinuance of certain services under an existing customer contract in 2014, which also reduced current and future benefits by an equivalent amount for 2014.
Discontinued Products
Prior to 1993, we sold single-premium annuities (“SPAs”) and guaranteed investment contracts (“GICs”), primarily to employer sponsored pension plans. In 1993, we discontinued selling these products to Large Case Pensions customers, and now we refer to these products as discontinued products.
We discontinued selling these products because they were generating losses for us, and we projected that they would continue to generate losses over their life (which is currently greater than 30 years for SPAs); so we established a reserve for anticipated future losses at the time of discontinuance. At both December 31, 2014 and 2013, our remaining GIC liability was not material. We provide additional information on the reserve for anticipated future losses, including key assumptions and other important information, in Note 20 of Notes to Consolidated Financial Statements beginning on page 135.
The operating summary for Large Case Pensions above includes revenues and expenses related to our discontinued products, with the exception of net realized capital gains and losses which are recorded as part of current and future benefits. Since we established a reserve for anticipated future losses on discontinued products, as long as our expected future losses remain consistent with prior projections, the results of our discontinued products are applied against the reserve and do not impact net income attributable to Aetna. If actual or expected future losses are greater than we currently estimate, we may increase the reserve, which could adversely impact net income attributable to Aetna. If actual or expected future losses are less than we currently estimate, we may decrease the reserve, which could favorably impact net income attributable to Aetna. In those cases, we disclose such adjustment separately in the operating summary. Management reviews the adequacy of the discontinued products reserve quarterly. As a result of this review, $55.9 million ($86.0 million pretax) of the reserve was released in 2013. This reserve release was primarily due to favorable investment performance as well as favorable retirement experience compared to assumptions we previously made in estimating the reserve. The current reserve reflects management’s best estimate of anticipated future losses, and is included in future policy benefits on our balance sheet.
Refer to Note 20 of Notes to Consolidated Financial Statements beginning on page 135 for additional information on the activity in the reserve for anticipated future losses on discontinued products during 2014, 2013 and 2012.
INVESTMENTS
Our investment portfolio supported the following products at December 31, 2014 and 2013:
|
| | | | | | | |
| (Millions) | 2014 |
| | 2013 |
|
Experience-rated products (1) | $ | 1,492.4 |
| | $ | 1,458.1 |
|
Discontinued products (1) | 3,425.2 |
| | 3,443.5 |
|
| Remaining products | 19,871.5 |
| | 18,097.2 |
|
| Total investments | $ | 24,789.1 |
| | $ | 22,998.8 |
|
| | | | |
| |
(1) | Investment risks associated with our experience-rated and discontinued products generally do not impact our operating results. |
The risks associated with investments supporting experience-rated pension and annuity products in our Large Case Pensions business are assumed by the contract holders and not by us (subject to, among other things, certain minimum guarantees). Assets supporting experience-rated products may be subject to contract holder or participant withdrawals. Experience-rated contract holder and participant-directed withdrawals for the last three years were as follows:
|
| | | | | | | | | | | |
| (Millions) | 2014 |
| | 2013 |
| | 2012 |
|
Scheduled contract maturities and benefit payments (1) | $ | 145.4 |
| | $ | 237.1 |
| | $ | 236.2 |
|
| Contract holder withdrawals other than scheduled contract | |
| | | | |
| maturities and benefit payments | 7.6 |
| | 35.4 |
| | 4.7 |
|
Participant-directed withdrawals (2) | 4.1 |
| | 4.0 |
| | 2.3 |
|
| | | | | | |
| |
(1) | Includes payments made upon contract maturity and other amounts distributed in accordance with contract schedules. |
| |
(2) | Approximately $565.4 million, $556.9 million and $569.1 million at December 31, 2014, 2013 and 2012, respectively, of experience-rated pension contracts allowed for unscheduled contract holder withdrawals, subject to timing restrictions and formula-based market value adjustments. Further, approximately $77.4 million, $77.9 million and $84.8 million at December 31, 2014, 2013 and 2012, respectively, of experience-rated pension contracts supported by our general account assets could be withdrawn or transferred to other plan investment options at the direction of plan participants, without market value adjustment, subject to plan, contractual and income tax provisions. |
Debt and Equity Securities
The debt securities in our investment portfolio had an average credit quality rating of A at both December 31, 2014 and 2013, with approximately $4.6 billion and $4.5 billion at December 31, 2014 and 2013, respectively, rated AAA. The debt securities that were rated below investment grade (that is, having a credit quality rating below BBB-/Baa3) were $1.4 billion and $1.2 billion at December 31, 2014 and 2013, respectively (of which 14% and 17% at December 31, 2014 and 2013, respectively, supported our experience-rated and discontinued products).
At December 31, 2014 and 2013, we held approximately $811 million and $747 million, respectively, of municipal debt securities that were guaranteed by third parties, representing approximately 3% of our total investments at each date. These securities had an average credit quality rating of AA- and A at December 31, 2014 and 2013, respectively, with the guarantee. These securities had an average credit quality rating of A- and A at December 31, 2014 and 2013, respectively, without the guarantee. We do not have any significant concentration of investments with third party guarantors (either direct or indirect).
At both December 31, 2014 and 2013, less than 1% of our investment portfolio was comprised of investments that were either European sovereign, agency, or local government debt of countries which, in our judgment based on an analysis of market-yields, are experiencing economic, fiscal or political strains such that the likelihood of default may be higher than if those factors did not exist.
We classify our debt and equity securities as available for sale, and carry them at fair value on our balance sheet. Approximately 1% of our debt and equity securities at both December 31, 2014 and 2013 were valued using inputs that reflect our own assumptions (categorized as Level 3 inputs in accordance with GAAP). Refer to Note 10 of Notes to Consolidated Financial Statements beginning on page 102 for additional information on the methodologies and key assumptions we use to determine the fair value of investments.
Refer to Note 8 of Notes to Consolidated Financial Statements beginning on page 94 for details related to:
| |
| • | Our investment portfolio balances at December 31, 2014 and 2013; |
| |
| • | Gross unrealized capital gains and losses by major security type; |
| |
| • | Debt securities with unrealized capital losses (including the amounts related to experience-rated and discontinued products); |
| |
| • | Our net realized capital gains and losses; and |
| |
| • | Our mortgage loan portfolio. |
We regularly review our debt securities to determine if a decline in fair value below the carrying value is other-than-temporary. If we determine a decline in fair value is other-than-temporary, we will write down the carrying value of the security. The amount of the credit-related impairment is included in our operating results, and the non-credit component is included in other comprehensive income unless we intend to sell the security or it is more likely than not that we will be required to sell the debt security prior to its anticipated recovery of its amortized cost basis. Accounting for other-than-temporary impairment (“OTTI”) of our debt securities is considered a critical accounting estimate. Refer to “Critical Accounting Estimates - Other-Than-Temporary Impairment of Debt Securities” on page 25 for additional information.
Risk Management and Market-Sensitive Instruments
We manage interest rate risk by seeking to maintain a tight match between the durations of our assets and liabilities when appropriate. We manage credit risk by seeking to maintain high average credit quality ratings and diversified sector exposure within our debt securities portfolio. In connection with our investment and risk management objectives, we also use derivative financial instruments whose market value is at least partially determined by, among other things, levels of or changes in interest rates (short-term or long-term), duration, prepayment rates, equity markets or credit ratings/spreads. Our use of these derivatives is generally limited to hedging risk and has principally consisted of using interest rate swaps, forward contracts, futures contracts, warrants, put options and credit default swaps. These instruments, viewed separately, subject us to varying degrees of interest rate, equity price and credit risk. However, when used for hedging, we expect these instruments to reduce overall risk.
We regularly evaluate our risk from market-sensitive instruments by examining, among other things, levels of or changes in interest rates (short-term or long-term), duration, prepayment rates, equity markets or credit ratings/spreads. We also regularly evaluate the appropriateness of investments relative to our management-approved investment guidelines (and operate within those guidelines) and the business objectives of our portfolios.
On a quarterly basis, we review the impact of hypothetical net losses in our investment portfolio on our consolidated near-term financial position, operating results and cash flows assuming the occurrence of certain reasonably possible changes in near-term market rates and prices. Interest rate changes (whether resulting from changes in Treasury yields or credit spreads or other factors) represent the most material risk exposure category for us. We have estimated the impact on the fair value of our market sensitive instruments based on the net present value of cash flows using a representative set of likely future interest rate scenarios. The assumptions used were as follows: an immediate increase of 100 basis points in interest rates (which we believe represents a moderately adverse scenario and is approximately equal to the historical annual volatility of interest rate movements for our intermediate-term available-for-sale debt securities) and an immediate decrease of 15% in prices for domestic equity securities.
Assuming an immediate 100 basis point increase in interest rates and immediate decrease of 15% in the prices for domestic equity securities, the theoretical decline in the fair values of our market sensitive instruments at December 31, 2014 is as follows:
| |
| • | The fair value of our long-term debt would decline by approximately $479 million ($737 million pretax). Changes in the fair value of our long-term debt do not impact our financial position or operating results. |
| |
| • | The theoretical reduction in the fair value of our investment securities partially offset by the theoretical reduction in the fair value of interest rate sensitive liabilities would result in a net decline in fair value of approximately $272 million ($418 million pretax) related to our non-experience-rated products. Reductions in the fair value of our investment securities would be reflected as an unrealized loss in equity, as we classify these securities as available for sale. We do not record our liabilities at fair value. |
Based on our overall exposure to interest rate risk and equity price risk, we believe that these changes in market rates and prices would not materially affect our consolidated near-term financial position, operating results or cash flows as of December 31, 2014.
LIQUIDITY AND CAPITAL RESOURCES
Cash Flows
We meet our operating cash requirements by maintaining liquidity in our investment portfolio, using overall cash flows from premiums, fees and other revenue, deposits and income received on investments, issuing commercial paper and entering into repurchase agreements from time to time. We monitor the duration of our investment portfolio of highly marketable debt securities and mortgage loans, and execute purchases and sales of these investments with the objective of having adequate funds available to satisfy our maturing liabilities. Overall cash flows are used primarily for claim and benefit payments, operating expenses, share and debt repurchases, repayment of debt, acquisitions, contract withdrawals and shareholder dividends. We have committed short-term borrowing capacity of $2.0 billion through a revolving credit facility agreement that expires in March 2019.
Presented below is a condensed statement of cash flows for each of the last three years. On May 7, 2013, we completed the acquisition of Coventry, which is reflected in our cash flows for the full-year in 2014 and on and after the Acquisition Date for 2013. We present net cash flows used for operating activities and net cash flows provided by investing activities separately for our Large Case Pensions segment because changes in the insurance reserves for the Large Case Pensions segment (which are reported as cash used for operating activities) are funded from the sale of investments (which are reported as cash provided by investing activities). Refer to the Consolidated Statements of Cash Flows on page 78 for additional information.
|
| | | | | | | | | | | |
| (Millions) | 2014 |
| | 2013 |
| | 2012 |
|
| Cash flows from operating activities | | | | | |
| Health Care and Group Insurance | $ | 3,601.3 |
| | $ | 2,625.0 |
| | $ | 2,054.7 |
|
| Large Case Pensions | (228.5 | ) | | (346.3 | ) | | (229.8 | ) |
| Net cash provided by operating activities | 3,372.8 |
| | 2,278.7 |
| | 1,824.9 |
|
| Cash flows from investing activities | | | | | |
| Health Care and Group Insurance | (2,453.1 | ) | | (2,261.4 | ) | | (477.7 | ) |
| Large Case Pensions | 323.4 |
| | 341.6 |
| | 246.4 |
|
| Net cash used for investing activities | (2,129.7 | ) | | (1,919.8 | ) | | (231.3 | ) |
| Net cash (used for) provided by financing activities | (1,235.0 | ) | | (1,525.8 | ) | | 305.9 |
|
| Net increase (decrease) in cash and cash equivalents | $ | 8.1 |
| | $ | (1,166.9 | ) | | $ | 1,899.5 |
|
Cash Flow Analysis
Cash flows provided by operating activities for Health Care and Group Insurance were approximately $3.6 billion in 2014, $2.6 billion in 2013 and $2.1 billion in 2012. The increase during 2014 compared to 2013 is primarily attributable to the effect of growth in our Insured membership and the inclusion of results from the Coventry acquisition for the full-year in 2014, partially offset by the payment of both our portion of the ACA’s health insurer fee and a portion of our estimated 2014 ACA reinsurance contribution in 2014. The increase during 2013 compared to 2012 is primarily attributable to the inclusion of results from the Coventry acquisition, proceeds from the termination of a reinsurance arrangement with Lehman Re and sale of the related claim, as well as lower benefit payments under our 2011 voluntary early retirement program, offset somewhat by transaction, integration-related and restructuring costs associated with the Coventry acquisition (refer to Note 17 of the Notes to Consolidated Financial Statements on page 126 for more information on the Lehman Re reinsurance arrangement).
Cash flows used for investing activities were approximately $2.1 billion, $1.9 billion and $231.3 million for 2014, 2013 and 2012, respectively. The increase in cash used for investing activities in 2014 compared to 2013 was primarily a result of an increase in net purchases of investments in 2014 compared to net proceeds from the sales of investments in 2013, which was partially offset by a decline in cash used for acquisitions, as we completed the acquisition of Coventry during 2013. The increase in cash used for investing activities in 2013 compared to 2012 is primarily attributable to cash used to fund the Coventry acquisition, net of the cash acquired in connection with the acquisition, partially offset by an increase in net proceeds from sales and maturities of investments. Refer to Note 3 and 7 of Notes to Consolidated Financial Statements beginning on pages 90 and 93, respectively, for additional information.
Cash flows used for financing activities in 2014 and 2012 primarily reflected the issuance and repayment of debt, and cash used for financing activities in all periods reflected share repurchases and dividend payments. Refer to Note 14 and 15 of Notes to Consolidated Financial Statements beginning on pages 123 and 125, respectively, for additional information about debt issuances and repayments, share repurchases and dividend payments.
Long-Term and Short-Term Debt and Revolving Credit Facility
In support of our capital management goals, during 2014 we redeemed a portion of our long-term debt, issued new long-term and short-term debt, repaid maturing long-term debt and extended the maturity date of our revolving credit facility by one additional year. Refer to Note 14 of Notes to Consolidated Financial Statements beginning on page 123 for additional information on these transactions.
Other Liquidity Information
From time to time, we use short-term commercial paper borrowings and repurchase agreements to address timing differences between cash receipts and disbursements. At December 31, 2014, we had approximately $500 million of commercial paper outstanding with a weighted-average interest rate of .30%. At December 31, 2013, we did not have any commercial paper outstanding. The maximum amount of commercial paper borrowings outstanding during 2014 was approximately $766 million. Refer to Notes 2 and 10 of Notes to Consolidated Financial Statements beginning on pages 80 and 102, respectively, for additional information about our repurchase agreements.
Our debt to capital ratio (calculated as the sum of all short- and long-term debt outstanding (“total debt”) divided by the sum of total Aetna shareholders’ equity plus total debt) was approximately 37% at both December 31, 2014 and 2013, respectively. Our existing ratings and outlooks from the nationally recognized statistical ratings organizations that rate us include the consideration of our intention to lower our debt to capital ratio to approximately 35% during the 2015 calendar year. We continually monitor existing and alternative financing sources to support our capital and liquidity needs, including, but not limited to, debt issuance, preferred or common stock issuance, reinsurance and pledging or selling of assets.
Interest expense was $329 million, $334 million and $269 million for 2014, 2013 and 2012, respectively. The decrease in interest expense during 2014 compared to 2013 reflects interest expense savings from debt refinancings, partially offset by the full-year impact of Coventry’s debt that we assumed. The increase in interest expense during 2013 compared to 2012 reflects the inclusion of Coventry’s long-term debt on and after the Acquisition Date as well as higher average long-term debt levels as a result of the Coventry-related senior notes that were issued in November 2012.
We are a member of the Federal Home Loan Bank of Boston (“FHLBB”), and as a member we have the ability to obtain cash advances, subject to certain minimum collateral requirements. Our maximum borrowing capacity available from the FHLBB at December 31, 2014 was approximately $882 million. At December 31, 2014, we did not have any outstanding borrowings from the FHLBB.
Our current funding strategy for our tax-qualified noncontributory defined benefit pension plan (the “Aetna Pension Plan”) is to contribute an amount at least equal to the minimum funding requirement as determined under applicable law with consideration of factors such as the maximum tax deductibility of such amounts. Refer to Note 11 of Notes to Consolidated Financial Statements beginning on page 109 for additional information regarding our current funding strategy for the Aetna Pension Plan.
We paid both our approximately $605 million portion of the ACA’s non tax-deductible health insurer fee and an approximately $298 million portion of our estimated 2014 ACA reinsurance contribution in 2014. We project that our share of the 2015 Health Care Reform fees, assessments and taxes will be approximately $1.1 billion, which includes our share of the ACA’s health insurer fee, which we project will be approximately $900 million. Refer to Note 2 beginning on page 80 for additional information on fees mandated by the ACA and “Overview-Health Care Reform” beginning on page 3 for additional information.
Contractual Obligations
The following table summarizes certain estimated future obligations by period under our various contractual obligations at December 31, 2014. The table below does not include future payments of claims to health care providers or pharmacies because certain terms of these payments are not determinable at December 31, 2014 (for example, the timing and volume of future services provided under fee-for-service arrangements and future membership levels for capitated arrangements). We believe that funds from future operating cash flows, together with cash, investments and other funds available under the Facility or from public or private financing sources, will be sufficient to meet our existing commitments as well as our liquidity needs associated with future operations, including our strategic growth initiatives.
|
| | | | | | | | | | | | | | | |
| (Millions) | 2015 |
| 2016-2017 |
| 2018-2019 |
| Thereafter |
| Total |
|
| Long-term debt obligations, including interest | $ | 557.4 |
| $ | 1,766.8 |
| $ | 954.4 |
| $ | 9,476.8 |
| $ | 12,755.4 |
|
| Operating lease obligations | 139.3 |
| 177.1 |
| 94.6 |
| 66.7 |
| 477.7 |
|
| Purchase obligations | 314.8 |
| 340.2 |
| 87.0 |
| 2.8 |
| 744.8 |
|
Other liabilities reflected on our balance sheet: (1) | | | | | |
Future policy benefits (2) | 705.9 |
| 1,313.9 |
| 1,037.3 |
| 4,076.2 |
| 7,133.3 |
|
Unpaid claims (2) | 745.3 |
| 520.3 |
| 355.5 |
| 774.8 |
| 2,395.9 |
|
Policyholders’ funds (2) (3) | 1,984.5 |
| 71.7 |
| 80.8 |
| 617.5 |
| 2,754.5 |
|
Other liabilities (4) | 3,954.9 |
| 211.5 |
| 86.8 |
| 206.0 |
| 4,459.2 |
|
| Total | $ | 8,402.1 |
| $ | 4,401.5 |
| $ | 2,696.4 |
| $ | 15,220.8 |
| $ | 30,720.8 |
|
| | | | | | |
| |
(1) | Payments of other long-term liabilities exclude Separate Accounts liabilities of approximately $4.3 billion because these liabilities are supported by assets that are legally segregated and are not subject to claims that arise out of our business. |
| |
(2) | Total payments of future policy benefits, unpaid claims and policyholders’ funds include $544.5 million, $37.9 million and $152.1 million, respectively, of reserves for contracts subject to reinsurance. We expect the assuming reinsurance carrier to fund these obligations and have reflected these amounts as reinsurance recoverable assets on our consolidated balance sheet. |
| |
(3) | Customer funds associated with group life and health contracts of $278.4 million have been excluded from the table above because such funds may be used primarily at the customer’s discretion to offset future premiums and/or for refunds, and the timing of the related cash flows cannot be determined. Additionally, net unrealized capital gains on debt and equity securities supporting experience-rated products of $114.8 million, before tax, have been excluded from the table above. |
| |
(4) | Other liabilities in the table above include general expense accruals and other related payables and exclude the following: |
| |
| • | Employee-related benefit obligations of $732.6 million, including our pension and other postretirement and post-employment benefit obligations and certain deferred compensation arrangements. These liabilities do not necessarily represent future cash payments we will be required to make, or such payment patterns cannot be determined. However, other long-term liabilities include expected benefit payments of $353.5 million over the next ten years for our non-qualified supplemental pension plan and our postretirement benefit plans, which we primarily fund when paid by the plans. |
| |
| • | Deferred gains of $45.1 million which will be recognized in our earnings in the future in accordance with GAAP. |
| |
| • | Net unrealized capital gains of $316.1 million, before tax, supporting discontinued products. |
| |
| • | Non-controlling interests supporting our discontinued products of $70.8 million consisting of third party interests in our investment holdings. This amount does not represent future cash payments we will be required to make. |
| |
| • | Other payables of $64.3 million. |
Restrictions on Certain Payments
In addition to general state law restrictions on payments of dividends and other distributions to shareholders applicable to all corporations, HMOs and insurance companies are subject to further regulations that, among other things, may require those companies to maintain certain levels of equity (referred to as surplus) and restrict the amount of dividends and other distributions that may be paid to their equity holders. These regulations are not directly applicable to Aetna as a holding company, since Aetna is not an HMO or an insurance company. The additional regulations applicable to our HMO and insurance company subsidiaries are not expected to affect our ability to service our debt, meet our other financing obligations or pay dividends, or the ability of any of our subsidiaries to service other financing obligations. Under applicable regulatory requirements, at December 31, 2014, the amount of dividends that may be paid by our insurance and HMO subsidiaries without prior approval by regulatory authorities was approximately $2.2 billion in the aggregate.
We maintain capital levels in our operating subsidiaries at or above targeted and/or required capital levels and dividend amounts in excess of these levels to meet our liquidity requirements, including the payment of interest on debt and shareholder dividends. In addition, at our discretion, we use these funds for other purposes such as
funding share and debt repurchase programs, investments in new businesses and other purposes we consider advisable.
At December 31, 2014 and 2013, we held investments of approximately $778 million and $794 million, respectively, related to the 2012 conversion of an existing group annuity contract from a participating to a non-participating contract. These investments are included in the total investments of our Large Case Pensions segment supporting non-experience-rated products. Although these investments are not accounted for as separate accounts assets, they are legally segregated and are not subject to claims that arise out of our business and only support Aetna’s future policy benefits obligations under that group annuity contract.
Off-Balance Sheet Arrangements
We do not have any guarantees or other off-balance sheet arrangements that we believe, based on historical experience and current business plans, are reasonably likely to have a material impact on our current or future operating results, financial condition or cash flows (other than the guarantees described in Note 18 of Notes to Consolidated Financial Statements beginning on page 127 at December 31, 2014). In addition, refer to Note 8 of Notes to Consolidated Financial Statements beginning on page 94 for additional detail of our variable interest entities at December 31, 2014.
Solvency Regulation
The National Association of Insurance Commissioners (the “NAIC”) utilizes risk-based capital (“RBC”) standards for insurance companies that are designed to identify weakly-capitalized companies by comparing each company’s adjusted surplus to its required surplus (the “RBC Ratio”). The RBC Ratio is designed to reflect the risk profile of insurance companies. Within certain ratio ranges, regulators have increasing authority to take action as the RBC Ratio decreases. There are four levels of regulatory action, ranging from requiring an insurer to submit a comprehensive financial plan for increasing its RBC to the state insurance commissioner to requiring the state insurance commissioner to place the insurer under regulatory control. At December 31, 2014, the RBC Ratio of each of our primary insurance subsidiaries was above the level that would require regulatory action. The RBC framework described above for insurers has been extended by the NAIC to health organizations, including HMOs. Although not all states had adopted these rules at December 31, 2014, at that date, each of our active HMOs had a surplus that exceeded either the applicable state net worth requirements or, where adopted, the levels that would require regulatory action under the NAIC’s RBC rules. External rating agencies use their own RBC standards when they determine a company’s rating.
CRITICAL ACCOUNTING ESTIMATES
We prepare our consolidated financial statements in accordance with GAAP. The application of GAAP requires management to make estimates and assumptions that affect our consolidated financial statements and related notes. The accounting estimates described below are those we consider critical in preparing our consolidated financial statements. We use information available to us at the time the estimates are made; however, as described below, these estimates could change materially if different information or assumptions were used. Also, these estimates may not ultimately reflect the actual amounts that occur.
Health Care Costs Payable
Approximately 95% and 96% of health care costs payable are estimates of the ultimate cost of claims that have been incurred but not yet reported to us and of those which have been reported to us but not yet paid (collectively “IBNR”) at December 31, 2014 and 2013, respectively. The remainder of health care costs payable is primarily comprised of pharmacy and capitation payables and accruals for state assessments. We develop our estimate of IBNR using actuarial principles and assumptions that consider numerous factors. Of those factors, we consider the analysis of historical and projected claim payment patterns (including claims submission and processing patterns) and the assumed health care cost trend rate (the year-over-year change in per member per month health care costs) to be the most critical assumptions. In developing our estimate of IBNR, we consistently apply these actuarial principles and assumptions each period, with consideration to the variability of related factors.
We analyze historical claim payment patterns by comparing claim incurred dates (i.e., the date services were provided) to claim payment dates to estimate “completion factors.” We estimate completion factors by aggregating claim data based on the month of service and month of claim payment and estimating the percentage of claims incurred for a given month that are complete by each month thereafter. For any given month, substantially all claims are paid within six months of the date of service, but it can take up to 48 months or longer before all of the claims are completely resolved and paid. These historically-derived completion factors are then applied to claims paid through the financial statement date to estimate the ultimate claim cost for a given month’s incurred claim activity. The difference between the estimated ultimate claim cost and the claims paid through the financial statement date represents our estimate of claims remaining to be paid as of the financial statement date and is included in our health care costs payable. We use completion factors predominantly to estimate reserves for claims with claim incurred dates greater than three months prior to the financial statement date. The completion factors we use reflect judgments and possible adjustments based on data such as claim inventory levels, claim submission and processing patterns and, to a lesser extent, other factors such as changes in health care cost trend rates, changes in membership and changes in product mix. If claims are submitted or processed on a faster (slower) pace than prior periods, the actual claims may be more (less) complete than originally estimated using our completion factors, which may result in reserves that are higher (lower) than the ultimate cost of claims.
Because claims incurred within three months prior to the financial statement date are less mature, we use a combination of historically-derived completion factors and the assumed health care cost trend rate to estimate the ultimate cost of claims incurred for these months. We place a greater emphasis on the assumed health care cost trend rate for the most recent claim incurred dates as these months may be influenced by seasonal patterns and changes in membership and product mix.
Our health care cost trend rate is affected by changes in per member utilization of medical services as well as changes in the unit cost of such services. Many factors influence the health care cost trend rate, including our ability to manage health care costs through product design, negotiation of favorable provider contracts and medical management programs, as well as the mix of our business. The health status of our members, aging of the population and other demographic characteristics, advances in medical technology and other factors continue to contribute to rising per member utilization and unit costs. Changes in health care practices, inflation, new technologies, increases in the cost of prescription drugs (including specialty pharmacy drugs), direct-to-consumer marketing by pharmaceutical companies, clusters of high-cost cases, claim intensity, changes in the regulatory environment, health care provider or member fraud and numerous other factors also contribute to the cost of health care and our health care cost trend rate.
For each reporting period, we use an extensive degree of judgment in the process of estimating our health care costs payable, and as a result, considerable variability and uncertainty is inherent in such estimates; and the adequacy of such estimates is highly sensitive to changes in assumed completion factors and the assumed health care cost trend rates. For each reporting period we recognize our best estimate of health care costs payable considering the potential volatility in assumed completion factors and health care cost trend rates, as well as other factors. We believe our estimate of health care costs payable is reasonable and adequate to cover our obligations at December 31, 2014; however, actual claim payments may differ from our estimates. A worsening (or improvement) of our health care cost trend rates or changes in completion factors from those that we assumed in estimating health care costs payable at December 31, 2014 would cause these estimates to change in the near term, and such a change could be material.
Each quarter, we re-examine previously established health care costs payable estimates based on actual claim payments for prior periods and other changes in facts and circumstances. Given the extensive degree of judgment in this estimate, it is possible that our estimates of health care costs payable could develop either favorably (that is, our actual health care costs for the period were less than we estimated) or unfavorably. The changes in our estimate of health care costs payable may relate to a prior quarter, prior year or earlier periods. As reported in the rollforward of our health care costs payable in Note 6 of Notes to Consolidated Financial Statements on page 92, our prior year estimates of health care costs payable decreased by approximately $581 million, $449 million, and $147 million in 2014, 2013 and 2012, respectively. These reductions were offset by estimated current year health
care costs when we established our estimate of current period health care costs payable. Our reserving practice is to consistently recognize the actuarial best estimate of our ultimate liability for health care costs payable.
During 2014 and 2013 we observed an increase in our completion factors relative to those assumed at the prior year end. After considering the claims paid in 2014 and 2013 with dates of service prior to the fourth quarter of the previous year, we observed the assumed weighted average completion factors were 60 and 70 basis points higher, respectively, than previously estimated, resulting in a decrease of approximately $145 million and $117 million in 2014 and in 2013, respectively, in health care costs payable that related to the prior year. We have considered the pattern of changes in our completion factors when determining the completion factors used in our estimates of IBNR at December 31, 2014. However, based on our historical claim experience, it is reasonably possible that our estimated weighted average completion factor may vary by plus or minus 13 basis points from our assumed rates, which could impact health care costs payable by approximately plus or minus $132 million pretax.
Also during 2014 and 2013, we observed that our health care cost trend rates for claims with claim incurred dates of three months or less before the financial statement date were lower than previously estimated. Specifically, after considering the claims paid in 2014 and 2013 with claim incurred dates for the fourth quarter of the previous year, we observed health care cost trend rates that were approximately 4.9% and 5.3%, respectively, lower than previously estimated, resulting in a reduction of approximately $436 million in 2014 and $332 million in 2013 in health care costs payable that related to the prior year.
We consider historical health care cost trend rates together with our knowledge of recent events that may impact current trends when developing our estimates of current health care cost trend rates. When establishing our reserves at December 31, 2014, we increased our assumed health care cost trend rates for the most recent three months by 6% from health care cost trend rates recently observed. However, based on our historical claim experience, it is reasonably possible that our estimated health care cost trend rates may vary by plus or minus 3.5% from our assumed rates, which could impact health care costs payable by approximately plus or minus $295 million pretax.
Health care costs payable as of December 31, 2014 and 2013 consisted of the following products:
|
| | | | | | |
| (Millions) | 2014 |
| 2013 |
|
| Commercial | $ | 3,100.8 |
| $ | 2,745.5 |
|
| Government | 2,520.3 |
| 1,801.9 |
|
| Total health care costs payable | $ | 5,621.1 |
| $ | 4,547.4 |
|
| | | |
Other Insurance Liabilities
We establish insurance liabilities other than health care costs payable for benefit claims primarily related to our Group Insurance segment. We refer to these liabilities as other insurance liabilities. These liabilities primarily relate to our life, disability and long-term care products.
Life and Disability
The liabilities for our life and disability products reflect benefit claims that have been reported to us but not yet paid, estimates of claims that have been incurred but not yet reported to us, and future policy benefits earned under insurance contracts. We develop these reserves and the related benefit expenses using actuarial principles and assumptions that consider, among other things, discount, resolution and mortality rates. Completion factors are also evaluated when estimating our reserves for claims incurred but not yet reported for life products. We also consider the benefit payments from the U.S. Social Security Administration for which our disability members may be eligible and which may offset our liability for disability claims (this is known as the Social Security offset). Each period, we estimate these factors, to the extent relevant, based primarily on historical data, and use these estimates to determine the assumptions underlying our reserve calculations. Given the extensive degree of judgment and uncertainty used in developing these estimates, it is possible that our estimates could develop either favorably or unfavorably.
The discount rate is the interest rate at which future benefit cash flows are discounted to determine the present value of those cash flows. The discount rate we select is a critical estimate, because higher discount rates result in lower reserves. We determine the discount rate based on the current and estimated future yield of the asset portfolio supporting our life and disability reserves. If the discount rate we select in estimating our reserves is lower (higher) than our actual future portfolio returns, our reserves may be higher (lower) than necessary. The discount rates we selected for life insurance waiver of premiums and long-term disability reserves at December 31, 2014 were consistent with the rates used at December 31, 2013 and 2012. Based on our historical experience, it is reasonably possible that the assumed discount rates for our life and disability reserves may vary by plus or minus one-half percentage point from year to year. A one-half percentage point decrease in the discount rates selected for both our life insurance waiver of premium and disability reserves would have increased current and future life and disability benefit costs by approximately $39 million pretax for 2014.
For disability claims and a portion of our life claims, we must estimate the timing of benefit payments, which takes into consideration the maximum benefit period and the probabilities of recovery (i.e., recovery rate) or death (i.e., mortality rate) of the member. Benefit payments may also be affected by a change in employment status of a disabled member, for example, if the member returns to work on a part-time basis. Estimating the recovery and mortality rates of our members is complex. Our actuaries evaluate our current and historical claim patterns, the timing and amount of any Social Security offset (for disability only), as well as other factors including the relative ages of covered members and the duration of each member’s disability when developing these assumptions. For disability reserves, if our actual recovery and mortality rates are lower (higher) than our estimates, our reserves will be lower (higher) than required to cover future disability benefit payments. For certain life insurance premium waiver reserves, if the actual recovery rates are lower (higher) than our estimates or the actual mortality rates are higher (lower) than our estimates, our reserves will be lower (higher) than required to cover future life benefit payments. We use standard industry tables and our historical claim experience to develop our estimated recovery and mortality rates. Claim reserves for our disability and life products are sensitive to these assumptions. Our historical experience has been that our recovery or mortality rates for our life and disability reserves vary by less than ten percent during the course of a year. A ten percent less (more) favorable assumption for our recovery or mortality rates would have increased (decreased) current and future life and disability benefit costs by approximately $61 million pretax for 2014. When establishing our reserves at December 31, 2014, we set our estimates of recovery and mortality rates based on recent experience.
We estimate our reserve for claims incurred but not yet reported to us for life products largely based on completion factors. The completion factors we use are based on our historical experience and reflect judgments and possible adjustments based on data such as claim inventory levels, claim payment patterns, changes in business volume and other factors. If claims are submitted or processed on a faster (slower) pace than historical periods, the actual claims may be more (less) complete than originally estimated using our completion factors, which may result in reserves that are higher (lower) than required to cover future life benefit payments. At December 31, 2014, we held approximately $266 million in reserves for life claims incurred but not yet reported to us.
Long-term Care
We established reserves for future policy benefits for the long-term care products we issued based on the present value of estimated future benefit payments less the present value of estimated future net premiums. In establishing this reserve, we evaluated assumptions about mortality, morbidity, lapse rates and the rate at which new claims would be submitted to us. We estimated the future policy benefits reserve for long-term care products using these assumptions and actuarial principles. For long-term care insurance contracts, we use our original assumptions throughout the life of the policy and do not subsequently modify them unless we deem the reserves to be inadequate. A portion of our reserves for long-term care products also reflect our estimates relating to future payments to members currently receiving benefits. These reserves are estimated primarily using recovery and mortality rates, as described above.
Premium Deficiency Reserves on our Health Care and Group Insurance products
We recognize a premium deficiency loss when it is probable that expected future health care costs or expected future policy benefit costs will exceed our existing reserves plus anticipated future premiums and reinsurance recoveries. Anticipated investment income is considered in the calculation of expected losses for certain contracts. Any such reserves established would normally cover expected losses until the next policy renewal dates for the related policies. We did not have any premium deficiency reserves for our Health Care or Group Insurance business at December 31, 2014 or 2013.
Large Case Pensions Discontinued Products Reserve
We discontinued certain Large Case Pensions products in 1993 and established a reserve to cover losses expected during the run-off period. Since 1993, we have made several adjustments resulting in a reduction to this reserve that have increased net income attributable to Aetna. These adjustments occurred primarily because our investment experience as well as our mortality and retirement experience have been better than the experience we projected at the time we discontinued the products. There was no adjustment of this reserve in 2014 or 2012. In 2013, $86.0 million pretax, of the reserve was released as a result of favorable investment performance as well as favorable retirement experience compared to assumptions we previously made in estimating the reserve. There can be no assurance that adjustments to the discontinued products reserve will occur in the future or that they will increase net income attributable to Aetna. Future adjustments could positively or negatively impact net income attributable to Aetna.
Recoverability of Goodwill and Other Acquired Intangible Assets
We have made acquisitions that included a significant amount of goodwill and other intangible assets. When we complete an acquisition, we apply the acquisition method of accounting, which among other things, requires the recognition of goodwill (which represents the excess cost of the acquisition over the fair value of net assets acquired and identified intangible assets). Goodwill is subject to an annual (or under certain circumstances more frequent) impairment test based on its estimated fair value. Other intangible assets that meet certain criteria are amortized over their useful lives, except for the valuation of business acquired which amortizes in proportion to estimated premiums over the expected life of the acquired contracts, and are also subject to a periodic impairment test. For these impairment evaluations, we use an implied fair value approach, which uses a discounted cash flow analysis and other valuation methodologies. These impairment evaluations use many assumptions and estimates in determining an impairment loss, including certain assumptions and estimates related to future earnings. If we do not achieve our earnings objectives, the assumptions and estimates underlying these impairment evaluations could be adversely affected, which could result in an asset impairment charge that would negatively impact our operating results. There were no impairment losses recognized in any of the three years ended December 31, 2014, 2013 or 2012.
Measurement of Defined Benefit Pension and Other Postretirement Employee Benefit Plans
We sponsor defined benefit pension plans (“pension plans”) and other postretirement employee benefit (“OPEB”) plans for our employees and retirees. Effective December 31, 2010, our employees no longer earn future pension service credits in the Aetna Pension Plan, although the Aetna Pension Plan will continue to operate and account balances will continue to earn annual interest credits. Employees covered by our non-qualified supplemental pension plan stopped accruing benefits effective January 1, 2007, although interest credits continue to be credited on these cash balance accounts.
Major assumptions used in the accounting for our pension plans include the expected return on plan assets, if applicable, mortality rates and the discount rate. We select our assumptions based on our information and market indicators, and we evaluate our assumptions at each annual measurement date (December 31, for each year presented). A change in any of our assumptions would have an effect on our pension and OPEB plan costs. A discussion of our assumptions used to determine the expected return on plan assets and mortality rates can be found in Note 11 of Notes to Consolidated Financial Statements beginning on page 109.
The discount rates we used in accounting for our pension and OPEB plans were calculated using a yield curve as of our annual measurement date. The yield curve consisted of a series of individual discount rates, with each discount rate corresponding to a single point in time, based on high-quality bonds (that is, bonds with an average rating of
AA based on ratings from Standard and Poor’s and Fitch Ratings, and the equivalent ratings from Moody’s Investors Service). We project the benefits expected to be paid from each plan at each point in the future based on each participant’s current service (but reflecting expected future pay increases). These projected benefit payments are then discounted to the measurement date using the corresponding rate from the yield curve. A lower discount rate increases the present value of benefit obligations. In 2014, we decreased our weighted average discount rate to 4.12% for our pension plans from 4.96% used at the measurement date in 2013. In 2014, we decreased our weighted average discount rate on OPEB plans to 4.02% from 4.73% used at the measurement date in 2013. A one-percentage point decrease in the assumed discount rate would decrease our annual pension costs by approximately $9 million after-tax and would have a negligible effect on our annual OPEB costs.
At December 31, 2014, our pension and OPEB plans had aggregate pretax accumulated actuarial losses of $2.6 billion. Accumulated actuarial losses are primarily due to investment losses in 2008 and higher liabilities caused by lower discount rates used to determine the present value of future plan obligations. The accumulated actuarial loss is amortized over the weighted-average expected life of pension plan participants (estimated to be up to 30 years at December 31, 2014 for the pension plans) and the expected life of OPEB plan participants (estimated to be up to 18 years at December 31, 2014) to the extent the loss is outside of a corridor established in accordance with GAAP. The corridor is established based on the greater of 10% of the plan assets or 10% of the projected benefit obligation. At December 31, 2014, $1.9 billion of the actuarial loss was outside of the corridor, which will result in amortization of approximately $42 million after-tax in our 2015 pension and OPEB expense.
The expected return on plan assets and discount rate assumptions discussed above impacted the reported net periodic benefit costs and benefit obligations of our pension and OPEB plans, but did not impact the required contributions to these plans, if any. Refer to Note 11 of Notes to Consolidated Financial Statements beginning on page 109 for additional information on our defined benefit pension and other postretirement employee benefit plans, including our current funding strategy.
Other-Than-Temporary Impairment of Debt Securities
We regularly review our debt securities to determine whether a decline in fair value below the carrying value is other than temporary. If a decline in fair value is considered other than temporary, the cost basis or carrying amount of the debt security is written down. The write-down is then bifurcated into its credit and non-credit related components. The amount of the credit-related component is included in our operating results, and the amount of the non-credit related component is included in other comprehensive income, unless we intend to sell the security or it is more likely than not that we will be required to sell the security prior to its anticipated recovery of its amortized cost basis. We analyze all facts and circumstances we believe are relevant for each investment when performing this analysis, in accordance with applicable accounting guidance promulgated by the Financial Accounting Standards Board and the U.S. Securities and Exchange Commission (the “SEC”).
Among the factors we consider in evaluating whether a decline is other-than-temporary are whether the decline in fair value results from a change in the quality of the debt security itself, whether the decline results from a downward movement in the market as a whole, and the prospects for realizing the carrying value of the debt security based on the investment’s current and short-term prospects for recovery. For unrealized losses determined to be the result of market conditions (for example, increasing interest rates and volatility due to conditions in the overall market) or industry-related events, we determine whether we intend to sell the debt security or if it is more likely than not that we will be required to sell the debt security before recovery of its amortized cost basis. If either case is true, we recognize an other-than-temporary impairment, and the cost basis/carrying amount of the debt security is written down to fair value.
Debt securities in an unrealized loss position for which we believe we will not recover the amortized cost due to the quality of the debt security or the creditworthiness of the issuer are categorized as credit-related OTTI.
The risks inherent in assessing the impairment of a debt security include the risk that market factors may differ from our projections and the risk that facts and circumstances factored into our assessment may change with the passage of time. Unexpected changes to market factors and circumstances that were not present in past reporting periods
are among the factors that may result in a current period decision to sell debt securities that were not impaired in prior reporting periods.
Revenue Recognition and Allowance for Estimated Terminations and Uncollectible Accounts
Our revenue is principally derived from premiums and fees billed to customers in the Health Care and Group Insurance businesses. In Health Care, revenue is recognized based on customer billings, which reflect contracted rates per employee and the number of covered employees recorded in our records at the time the billings are prepared. Billings are generally sent monthly for coverage during the following month. In Group Insurance, premium for group life and disability products is recognized as revenue, net of allowances for uncollectible accounts, over the term of coverage. Amounts received before the period of coverage begins are recorded as unearned premiums.
Health Care billings may be subsequently adjusted to reflect enrollment changes due to terminations or other factors. These adjustments are known as retroactivity adjustments. In each period, we estimate the amount of future retroactivity and adjust the recorded revenue accordingly. In each period, we also estimate the amount of uncollectible receivables and establish an allowance for uncollectible amounts. We base such estimates on historical trends, premiums billed, the amount of contract renewal activity during the period and other relevant information. As information regarding actual retroactivity and uncollectible amounts becomes known, we refine our estimates and record any required adjustments to revenues in the period they arise. A significant difference in the actual level of retroactivity or uncollectible amounts compared to our estimated levels would have a significant effect on our operating results.
Additionally, premium revenue subject to the minimum MLR rebate requirements of Health Care Reform is recorded net of the estimated minimum MLR rebates for the current calendar year. We estimate the minimum MLR rebates by projecting MLRs for certain markets, as defined by Health Care Reform, for each state in which each of our insurance entities operate. The claims and premiums used in estimating such rebates are modified for certain adjustments allowed by Health Care Reform and include a statistical credibility adjustment for those states with a number of members that is not statistically credible.
Furthermore, premium revenue subject to Health Care Reform’s permanent risk adjustment program transfers funds from qualified individual and small group insurance plans with below average risk scores to plans with above average risk scores. Based on the risk of our qualified plan members relative to the average risk of members of other qualified plans in comparable markets, we estimate our ultimate 2014 risk adjustment receivable or payable and reflect the pro-rata year-to-date impact as an adjustment to our premium revenue. In this analysis, we consider the estimate of the average risk of members of other qualified plans in comparable markets the most critical assumption. We estimate this assumption using market risk data compiled by third party sources as well as pricing and other regulatory inputs. Refer to Note 2 of Notes to Consolidated Financial Statements beginning on page 80 for additional information on each of Health Care Reform’s risk adjustment, risk corridor and reinsurance programs.
NEW ACCOUNTING STANDARDS
Refer to Note 2 of Notes to Consolidated Financial Statements, beginning on page 80, for a discussion of recently issued accounting standards.
REGULATORY ENVIRONMENT
General
Our operations are subject to comprehensive United States federal, state and local and comparable multiple levels of international regulation in the jurisdictions in which we do business. The laws and rules governing our business and interpretations of those laws and rules continue to expand and become more restrictive each year and are subject to frequent change. Health Care Reform has made and will continue to make extensive changes to the U.S. health care system and significantly increases the regulation of our business. There also continues to be a heightened level of review by federal, state and international regulators of the health and related benefits industry’s business and reporting practices.
We must obtain and maintain regulatory approvals to price and market many of our products. Supervisory agencies, including CMS, and the Center for Consumer Information and Insurance Oversight (“CCIIO”), as well as state health, insurance, managed care and Medicaid departments and state boards of pharmacy have broad authority to take one or more of the following actions:
| |
| • | Grant, suspend and revoke our licenses to transact business; |
| |
| • | Suspend or exclude us from participation in government programs; |
| |
| • | Suspend or limit our authority to market products; |
| |
| • | Regulate many aspects of the products and services we offer, including the pricing and underwriting of many of our products and services; |
| |
| • | Audit us and our performance of our contracts; |
| |
| • | Assess damages, fines and/or penalties; |
| |
| • | Terminate our contract with the government agency and/or withhold payments from the government agency to us; |
| |
| • | Impose retroactive adjustments to premiums and require us to pay refunds to the government, customers and/or members; |
| |
| • | Restrict our ability to conduct acquisitions or dispositions; |
| |
| • | Require us to maintain minimum capital levels in our companies and monitor our solvency and reserve adequacy; |
| |
| • | Regulate our investment activities on the basis of quality, diversification and other quantitative criteria; and/or |
| |
| • | Exclude our plans from participating in Public Exchanges if they are deemed to have a history of “unreasonable” premium rate increases or fail to meet other criteria set by the U.S. Department of Health and Human Services (“HHS”) or the applicable state. |
Our operations, current and past business practices, current and past contracts, and accounts and other books and records are subject to routine, regular and special investigations, audits, examinations and reviews by, and from time to time we receive subpoenas and other requests for information from, federal, state and international supervisory and enforcement agencies, attorneys general and other state, federal and international governmental authorities and legislators. See “Audits and Investigations” beginning on page 38 for additional information on these matters.
Health Care Reform, enacted in March 2010, has changed and will continue to make broad-based changes to the U.S. health care system which could significantly affect the U.S. economy and we expect will continue to significantly impact our business operations and financial results, including our pricing, our MBRs and the geographies in which our products are available. Health Care Reform presents us with new business opportunities, but also with new financial and regulatory challenges. Since its enactment in 2010, key components of Health Care Reform have been phased in, including Public Exchanges, required minimum MLRs in commercial and Medicare products, the individual coverage mandate, guaranteed issue, rating limits in the individual and small group markets, significant new industry-wide fees, assessments and taxes, enhanced premium rate review and disclosure processes, reduced Medicare Advantage payment rates to insurers, and linking Medicare Advantage payments to a plan’s CMS quality performance ratings or “star ratings.” The effects of these changes are reflected in our financial results.
While key components of Health Care Reform will continue to be phased in through 2018, the most significant changes occurred in 2014. We are dedicating and will continue to be required to dedicate material resources and incur material expenses during 2015 to implement and comply with Health Care Reform as well as state level health care reform. While the federal government has issued a number of regulations implementing Health Care Reform, certain significant parts of Health Care Reform, including aspects of Public Exchanges, Medicaid expansion, enforcement related reporting for the individual and employer mandates, reinsurance, risk corridor, risk adjustment and the implementation of Medicare Advantage and Part D minimum MLRs, require further guidance and clarification at the federal level and/or in the form of regulations and actions by state legislatures to implement the
law. The federal government also has announced significant changes to and/or delays in effective dates of various aspects of Health Care Reform, and it is likely that further changes will be made at the federal and/or state level based on implementation experience. As a result, key aspects and impacts of Health Care Reform will not be known for several years, and given the inherent difficulty of foreseeing how individuals and businesses will respond to the choices afforded them by Health Care Reform, we cannot predict the full effect Health Care Reform will have on us. It is reasonably possible that Health Care Reform, in the aggregate, could have a material adverse effect on our business operations and financial results.
Federal budget negotiations, ongoing regulatory changes to Health Care Reform (such as the November 2013 action permitting renewal through 2014 of individual and small group insurance policies that do not comply with Health Care Reform and the March 2014 action permitting such renewal through 2017), pending efforts in the U.S. Congress to amend or restrict funding for various aspects of Health Care Reform and litigation challenging aspects of the law continue to create uncertainty about the ultimate impact of Health Care Reform. An example of this uncertainty is the litigation pending before the U.S. Supreme Court concerning whether the Internal Revenue Service may make tax credits available as a form of subsidy to individuals who purchase health insurance through Public Exchanges established by the federal government (“Federal Exchanges”). We will continue to enroll and insure members through the Federal Exchanges pending the resolution of this and other pending cases. If the payment of subsidies with respect to members who enroll through the Federal Exchanges ultimately is invalidated, it could result in a significant reduction in Aetna’s Public Exchange membership because almost all of Aetna’s Public Exchange membership is through Federal Exchanges, and most of those members benefit from a tax subsidy.
The availability of funding for the ACA’s risk corridor program is a second example of this uncertainty. In May 2014, CMS published a final rule on Public Exchanges. The final rule provides that payments to health plans under the risk corridor program required by Health Care Reform will no longer be limited to the aggregate amount of the risk corridor collections received by HHS over the duration of the risk corridor program. However, it is possible that payments to health plans under the risk corridor program will require additional appropriation legislation to be passed by the U.S. Congress. Additionally, in December 2014, the Consolidated and Further Continuing Appropriations Act was enacted, which among other things, prohibits HHS’s use of certain funds to pay HHS’s potential obligation under the ACA’s risk corridor program. As a result, we did not record any receivable under the ACA’s risk corridor program at December 31, 2014.
In addition, the federal and state governments continue to enact and seriously consider many other broad-based legislative and regulatory proposals that have impacted or could materially impact various aspects of the health care system. We cannot predict whether pending or future federal or state legislation or court proceedings, including future U.S. Congressional appropriations and the proceedings relating to tax credits for Federal Exchange members described above, will change various aspects of the health care system or Health Care Reform or the impact those changes will have on our business operations or financial results, but the effects could be materially adverse.
The expansion of health care coverage contemplated by Health Care Reform is being funded in part by significant fees, assessments and taxes on us and other health insurers, health plans and other market participants and individuals which began in 2014, as well as reductions to the reimbursements we and other health plans are paid by the federal government for our Medicare members, among other sources. Most of the significant provisions of Health Care Reform became effective prior to December 31, 2014. While not all-inclusive, the following are some of the key provisions of Health Care Reform (assuming it continues to be implemented in its current form) that become effective on or after January 1, 2015. We continue to evaluate these provisions and the related regulations and regulatory guidance to determine the impact that they will have on our business operations and financial results:
| |
| • | Closure of the gap in coverage for Medicare Part D prescription drug coverage (the so-called “donut hole”) which began to close in 2010 and will incrementally close until the coverage gap is eliminated in 2020. |
| |
| • | Freezing 2011 Medicare Advantage payment rates for payments to us at 2010 levels, with additional reductions (we and other plans will ultimately receive a range of 95% of Medicare fee-for-service rates in high cost areas to 115% of Medicare fee-for-service rates in low cost areas) over a two- to six-year period which began in 2012 based on regionally-adjusted benchmarks and the linking of Medicare Advantage |
payments to a plan’s CMS quality performance ratings or “star ratings.” These payment reductions and/or if we are unable to achieve and maintain acceptable star ratings could have a material adverse effect on our Medicare business and/or the geographies in which our Medicare products are available.
| |
| • | The imposition on us and other health insurers, health plans and other market participants of significant fees, assessments and taxes, including an annual non-deductible industry-wide $11.3 billion health insurer fee in 2015 and growing to $14.3 billion by 2018 and increasing annually thereafter, and industry-wide reinsurance assessments of $8 billion and $5 billion in 2015 and 2016, respectively. We project that our share of the 2015 Health Care Reform fees, assessments and taxes will be approximately $1.1 billion, which includes our share of the ACA’s health insurer fee, which we project will be approximately $900 million. We may not be able to recover all of these fees, assessments and taxes in our pricing or otherwise solve for them. In addition, our effective income tax rate is expected to increase in 2015 as a result of the increase over 2014 in the non-tax deductible health insurer fee. |
| |
| • | Establishment of employer penalties for certain large employers whose plans do not provide “minimum value” or are “unaffordable” and detailed public reporting and disclosure requirements for health plans, with enforcement of each of these penalties beginning in 2015. |
| |
| • | A non-deductible 40% excise tax on employer-sponsored health care benefits above a certain threshold beginning in 2018. |
Health Care Reform also specifies minimum MLRs for our Commercial and Medicare Insured products, specifies required benefit designs, limits individual and small group rating and pricing practices, encourages additional competition (including potential incentives for new market entrants) and significantly increases federal and state oversight of health plans, including regulations and processes that could delay or limit our ability to appropriately increase our health plan premium rates. This in turn could adversely affect our ability to continue to participate in certain product lines and/or geographies we serve today. The application of Health Care Reform’s minimum MLR and rating standards to our student health products may have an adverse effect on our ability to sell these products in the future.
In addition, certain provisions of Health Care Reform tie Medicare Advantage plans’ premiums to the achievement of favorable CMS quality performance measures (“star ratings”). In 2013 and 2014, Medicare Advantage plans with an overall star rating of three or more stars (out of five stars) are eligible for a quality bonus in their basic premium rates. Beginning in 2015, only Medicare Advantage plans with an overall star rating of four or more stars will be eligible for a quality bonus. As a result, our Medicare Advantage plans’ operating results in 2015 and going forward are likely to be significantly determined by their star ratings. For additional information on CMS’s stars program and our related performance, see “Medicare” beginning on page 35.
For additional discussion of certain risk factors that may cause our actual results to differ from currently anticipated results in connection with federal and state health care reform, refer to “Forward-Looking Information/Risk Factors” beginning on page 42.
In 2014, state legislatures focused on Health Care Reform (including Public Exchange implementation and premium rate review), state budget issues (including Medicaid funding) and tax legislation. At the state level, all U.S. states and the District of Columbia will hold regular legislative sessions in 2015. We expect additional state level legislation and regulatory activity that impacts our businesses to be enacted in 2015, including additional Health Care Reform-related and budget-related activity. In addition, independent of federal efforts, we expect many states to continue to consider legislation or regulations that affect privately-financed health insurance arrangements and/or public programs, including imposing requirements on the composition of our provider networks, requiring changes to health benefit product structure, requiring changes to pharmacy benefit product structure, mandating specific benefit coverages, requiring changes to stop loss insurance products, extending coverage to the uninsured through Medicaid expansion, mandating minimum MLRs, expanding the maximum size of “small group” business to larger groups, implementing rating reforms for groups and enhancing consumer transparency on cost and quality of care. For example, regulators or legislatures in a number of states have implemented or are considering limits on premium rate increases, either enforcing existing legal requirements more stringently or proposing different regulatory standards or procedures for reviewing proposed premium rate changes; requiring us and other health
plans to price prospectively to specified minimum medical loss ratios and demonstrate that pricing in rate filings; and imposing taxes on insurers and other health plans to finance Public Exchanges, Medicaid and other state programs.
We cannot predict what provisions legislation or regulation will contain in any state or what effect legislation or regulation will have on our business operations or financial results, but the effect could be materially adverse.
Health Care Regulation
General
Federal, state, local and foreign governments have adopted comprehensive laws and regulations that govern our business activities in various ways. These laws and regulations, including Health Care Reform, restrict how we conduct our business and result in additional burdens and costs to us.
In addition to the expanded regulation created by Health Care Reform discussed above, significant areas of governmental regulation include premium rates and rating methodologies, underwriting rules and procedures, required benefits, sales and marketing activities, health care provider rates of payment, restrictions on health plans’ ability to limit providers’ participation in their networks and/or remove providers from their networks, pharmacy and pharmacy benefit management operations and financial condition (including reserves and minimum capital or risk based capital requirements). These laws and regulations are different in each jurisdiction.
Each health insurer and HMO must file periodic financial and operating reports with the states in which it does business. In addition, health insurers and HMOs are subject to state examination and periodic license renewal. Applicable laws also restrict the ability of our regulated subsidiaries to pay dividends, and certain dividends require prior regulatory approval. In addition, some of our business and related activities may be subject to PPO, managed care organization, utilization review or third-party administrator-related licensure requirements and regulations. These licensure requirements and regulations differ from state to state, but may contain health care provider network, contracting, product and rate, financial and reporting requirements. There also are laws and regulations that set specific standards for our delivery of services, payment of claims, fraud prevention, protection of consumer health information, payment for covered benefits and services and escheatment of funds to states. Our pharmacy benefit management (“PBM”) services suppliers, including CVS Health Corporation, also are subject to extensive federal and state regulation, including many of the items described above.
Pricing and Underwriting Restrictions
Pricing and underwriting regulation by states limits our underwriting and rating practices and those of other health insurers, particularly for small employer groups and individuals. Beginning in 2014, as a result of Health Care Reform, health insurers cannot vary small group or individual premium rates based on individual members’ characteristics except for geography and limited variation for age and tobacco use. By 2016, as a result of Health Care Reform, the small group rating category will be expanded to cover groups of up to 100 employees. States can choose to implement these changes prior to 2016. Pricing and underwriting laws and regulations vary by state. In general, they apply to certain customer segments and limit our ability to set prices for new or renewal business, or both, based on specific characteristics of the group or the group’s prior claim experience. In some states, these laws and regulations restrict our ability to price for the risk we assume and/or reflect reasonable costs in our pricing.
Health Care Reform expanded the premium rate review process by, among other things, requiring our rates to be reviewed for “reasonableness” at either the state or the federal level. HHS established a federal premium rate review process that generally applies to proposed premium rate increases equal to or exceeding 10% (or a state specified threshold). HHS’s rate review process imposes additional public disclosure requirements as well as additional review on filings requesting premium rate increases equal to or exceeding this “reasonableness” threshold. These combined state and federal review requirements may prevent, further delay or otherwise affect our ability to price for the risk we assume, which could adversely affect us particularly during periods of increased utilization of medical services and/or medical cost trend or when such utilization and/or trend exceeds our projections.
Health Care Reform also specifies minimum MLRs of 85% for the large group commercial market, 80% for the individual and small group commercial markets and 85% for Medicare Advantage and Medicare Part D plans. Because Health Care Reform is structured as a “floor” for many of its requirements, states have the latitude to enact more stringent rules governing its various restrictions. For commercial products, states may adopt higher minimum MLR requirements, use more stringent definitions of “medical loss ratio,” incorporate minimum MLR requirements into prospective premium rate filings, require prior approval of premium rates, or impose other requirements related to minimum MLR. For example, Texas has expanded from 50 to 100 the maximum size of “small groups” that are subject to its minimum MLR requirements, and New York, New Jersey and California all have established state-specific minimum MLR requirements. State-specific minimum MLR requirements and similar actions further limit the level of margin we can earn in our Insured business while leaving us exposed to medical costs that are higher than those reflected in our pricing.
In addition, we requested significant increases in our premium rates in our individual and small group Health Care businesses for 2014 and 2015 and expect to continue to request significant increases in those rates for 2016 and beyond in order to adequately price for projected medical cost trends, the expanded coverages and rating limits required by Health Care Reform and the significant assessments, fees and taxes imposed by Health Care Reform. These significant increases heighten the risks of adverse public and regulatory action and adverse selection and the likelihood that our requested premium rate increases will be denied, reduced or delayed, which could lead to operating margin compression.
Many of these laws and regulations also limit the differentials in premium rates insurers and other carriers may charge between new and renewal business, and/or between groups or individuals based on differing characteristics. They may also require that carriers disclose to customers the basis on which the carrier establishes new business and renewal premium rates and limit the ability of a carrier to terminate customers’ coverage. In addition, HHS’ rules on rates impose additional public disclosure requirements on any rate filings that exceed the “reasonableness” threshold and require additional review of those rates.
In addition, a number of states provide for a voluntary reinsurance mechanism to spread small group risk among participating insurers and other carriers. In a small number of states, participation in this pooling mechanism is mandatory for all small group carriers. In general, we have elected not to participate in voluntary pools. However, even in the voluntary pool states, we may be subject to certain supplemental assessments related to the state’s small group experience.
HIPAA Administrative Simplification, GLBA and Other Privacy, Security and Confidentiality Requirements
Federal, state and international privacy and security requirements change periodically because of legislation, regulations and judicial or administrative interpretation. The regulations under the administrative simplification provisions of the Health Insurance Portability and Accountability Act of 1996 (“HIPAA”), as further modified by the American Recovery and Reinvestment Act of 2009 (“ARRA”) and Health Care Reform, also impose a number of additional obligations on issuers of health insurance coverage and health benefit plan sponsors.
HIPAA’s administrative simplification requirements apply to self-funded group health plans, health insurers and HMOs, health care clearinghouses and health care providers who transmit health information electronically (“Covered Entities”). Regulations adopted to implement administrative simplification also require that “business associates” acting for or on behalf of these Covered Entities be contractually obligated to meet HIPAA standards. The administrative simplification regulations establish significant criminal penalties and civil sanctions for noncompliance.
Under administrative simplification, HHS also has published rules requiring the use of standardized code sets and unique identifiers for employers and health care providers. The federal government has mandated that by October 2015 the health and related benefits industry, including health insurers, health care providers and laboratories, upgrade to an updated and expanded set of standardized diagnosis and procedure codes used for describing health
conditions, known as ICD-10. Implementing ICD-10 will continue to require substantial investments from the health and related benefits industry, including us.
The HIPAA privacy regulations adopted by HHS establish limits on the use and disclosure of medical records and other individually identifiable health information (protected health information or “PHI”) by Covered Entities. Further, ARRA requires us and other Covered Entities to report any breaches of PHI to impacted individuals and to HHS and to notify the media in any states where 500 or more people are impacted by the unauthorized release or use of or access to PHI. Business associates (e.g., entities that provide services to health plans, such as electronic claims clearinghouses, print and fulfillment vendors, consultants, and us for the administrative services we provide to our ASC customers) must also comply with certain HIPAA provisions. In addition, ARRA establishes greater civil and criminal penalties for Covered Entities and business associates who fail to comply with HIPAA’s provisions and gives new enforcement rights to state attorneys general. Additional regulations under HIPAA remain pending. We will continue to assess the impact of these regulations on our business as they are issued.
The HIPAA privacy regulations do not preempt more stringent state laws and regulations that may apply to us and other Covered Entities, including laws that place stricter controls on the release of information relating to specific diseases or conditions and requirements to notify members of unauthorized release or use of or access to PHI. Complying with additional state requirements could require us to make additional investments beyond those we have made to comply with the HIPAA regulations. HHS also has adopted security regulations designed to protect member health information from unauthorized use or disclosure. HHS has begun to audit health plans, providers and other parties to enforce HIPAA compliance, including with respect to data security.
The HIPAA privacy regulations provide patients with new rights to understand and control how their health information is used. States also have adopted regulations to implement provisions of the Financial Modernization Act of 1999 (also known as Gramm-Leach-Bliley Act (“GLBA”)) which generally require insurers to provide customers with notice regarding how their non-public personal health and financial information is used and the opportunity to “opt out” of certain disclosures before the insurer shares such information with a non-affiliated third party. The GLBA regulations apply to health, life and disability insurance. Like HIPAA, GLBA sets a “floor” standard, allowing states to adopt more stringent requirements governing privacy protection.
While there is no over-arching federal data security law, several states have begun to enact more comprehensive privacy regulations addressing consumer rights to data protection or transparency. The widely-reported large scale U.S. commercial data breaches during 2014 and early 2015 increase the likelihood that federal data security legislation will be considered in 2015. These regulatory developments will impact the design and operation of our businesses, including the consumer business we are creating, our privacy and security strategy and our web-based and mobile assets.
Other Legislative Initiatives and Regulatory Initiatives
In addition to the Health Care Reform, HIPAA and ARRA measures discussed above, the U.S. federal and state governments, as well as governments in other countries where we do business, continue to enact and seriously consider many other broad-based legislative and regulatory proposals that have had a material impact on or could materially impact various aspects of the health care and related benefits system. For example:
| |
| • | Under the Budget Control Act of 2011 (the “BCA”) and the American Taxpayer Relief Act of 2012 (the “ATRA”) automatic across-the-board budget cuts (also known as “sequestration”) began in March 2013, including Medicare spending cuts of not more than 2% of total program costs per year through 2024. In addition, CMS’s Medicare Advantage and prescription drug program (“PDP”) premium rates for 2015 reflect a reduction in 2015 premiums compared to 2014 for Medicare Advantage and PDP plans, and represent an aggregate high single digit percentage funding decrease during 2014 and 2015 and a meaningful revenue and operating results challenge for us. This 2015 rate reduction is in addition to the challenge we face from the impact of the industry-wide health insurer fee that became effective January 1, 2014. Based on our preliminary analysis, CMS’s preliminary 2016 Medicare Advantage benchmark |
payment rates would decrease funding for our Medicare Advantage business by approximately one percent in 2016 compared to 2015. Significant uncertainty remains as to whether and how the Congress will proceed with actions that create additional federal revenue and/or with entitlement reform. We cannot predict future Medicare funding levels or the impact that future federal budget actions or entitlement program reform, if it occurs, will have on our business, operations or operating results, but the effects could be materially adverse, particularly on our Medicare and/or Medicaid revenues and operating results.
| |
| • | A number of states have enacted or introduced legislation or regulations requiring life insurers to take additional steps to identify unreported deceased policyholders and make other changes to their claim payment and related escheat practices. For additional information on these life insurance matters, refer to “Life and Disability Insurance” beginning on page 22. |
Other significant legislative and/or regulatory measures which are or recently have been under consideration include the following:
| |
| • | Amending or supplementing the Employee Retirement Income Security Act of 1974 (“ERISA”) to impose greater requirements on the administration of employer-funded benefit plans or limit the scope of current ERISA pre-emption, which would among other things expose us and other health plans to expanded liability for punitive and other extra-contractual damages and additional state regulation. |
| |
| • | Imposing assessments on (or to be collected by) health plans or health carriers, which may or may not be passed onto their customers. These assessments may include assessments for insolvency, the uninsured, uncompensated care, Medicaid funding or defraying health care provider medical malpractice insurance costs. |
| |
| • | Reducing federal and/or state government funding of government-sponsored health programs in which we participate, including Medicare and Medicaid programs. |
| |
| • | Restricting or mandating health plan or life insurer claim processing, review, payment and/or related procedures. |
| |
| • | Extending malpractice and other liability exposure for decisions made by health plans. |
| |
| • | Mandating coverage for additional conditions and/or specified procedures, drugs or devices (for example, high cost pharmaceuticals, experimental pharmaceuticals and oral chemotherapy regimens). |
| |
| • | Imposing requirements and restrictions on the administration of pharmacy benefits, including restricting or eliminating the use of formularies for prescription drugs; restricting our ability to place certain specialty or other drugs in the higher cost tiers of our pharmacy formularies; restricting our ability to make changes to drug formularies and/or our clinical programs; limiting or eliminating rebates on pharmaceuticals; restricting our ability to configure our pharmacy networks; and restricting or eliminating the use of certain drug pricing methodologies. |
| |
| • | Restricting our ability to require members to obtain prescription drugs through mail order or specialty pharmacies. |
| |
| • | Restricting our ability to limit providers’ participation in our networks and/or remove providers from our networks (including in our Medicare, Public Exchange and other Commercial products). |
| |
| • | Regulating e-connectivity. |
| |
| • | Mandating or regulating the disclosure of health care provider fee schedules and other data about our payments to providers. |
| |
| • | Mandating or regulating disclosure of health care provider outcome and/or efficiency information. |
| |
| • | Assessing the medical device status of health information technology (“HIT”) products and/or solutions, mobile consumer wellness tools and clinical decision support tools, which may require compliance with U.S. Food and Drug Administration (“FDA”) requirements in relation to some of these products, solutions and/or tools. |
| |
| • | Imposing payment levels for services rendered to our members by health care providers who do not have contracts with us. |
| |
| • | Enabling the creation of new types of health plans or health carriers, which in some instances would not be subject to the regulations or restrictions that govern our operations. |
| |
| • | Extending the life of or repurposing the assessments we and other insurers are required to pay for state-sponsored health benefit purchasing risk pools. |
| |
| • | Restricting the ability of health plans to establish member financial responsibility. |
Some of the changes, if enacted, could provide us with business opportunities. However, it is uncertain whether we can counter the potential adverse effects of such potential legislation or regulation, including whether we can recoup, through higher premium rates, expanded membership or other measures, the increased costs of mandated coverage or benefits, assessments or other increased costs, including the cost of modifying our systems to implement any enacted legislation or regulations.
Our business also may be affected by other legislation and regulations. The Dodd-Frank Wall Street Reform and Consumer Protection Act (the “Financial Reform Act”) was signed into law in July 2010. The Financial Reform Act creates incentives for whistleblowers to speak directly to the government rather than utilizing internal compliance programs, reduces the burden of proof under the Foreign Corrupt Practices Act of 1977 (the “FCPA”) and creates a Federal Insurance Office (“FIO”) within the U.S. Department of the Treasury (the “Treasury”) with powers that include information-gathering and subpoena authority. Although the FIO does not have authority over health insurance, it may have authority over other parts of our business, primarily life insurance. In December 2013, the FIO released a Financial Reform Act mandated report to Congress on how to modernize and improve the system of insurance regulation in the United States. The report includes recommendations for reforms to the existing state-based regulatory regime as well as proposed elements of additional federal involvement in insurance regulation. We cannot predict whether future legislative or regulatory action will result from this report.
Health savings accounts, health reimbursement arrangements and flexible spending accounts and certain of the tax, fee and subsidy provisions of Health Care Reform are also regulated by the Treasury and the Internal Revenue Service (the “IRS”).
We also may be adversely impacted by court and regulatory decisions that expand or revise the interpretations of existing statutes and regulations or impose medical malpractice or bad faith liability. Among other issues, in 2015 the U.S. Supreme Court will consider whether individuals who buy health insurance on a Public Exchange established by the federal government will receive assistance in the form of federal tax credits or subsidies. Other federal and state courts continue to consider cases addressing group and individual life insurance payment practices and the pre-emptive effect of ERISA on state laws.
The Employee Retirement Income Security Act of 1974
The provision of services to certain employee benefit plans, including certain Health Care, Group Insurance and Large Case Pensions benefit plans, is subject to ERISA, a complex set of laws and regulations subject to interpretation and enforcement by the IRS and the U.S. Department of Labor (the “DOL”). ERISA regulates certain aspects of the relationships between us and employers who maintain employee benefit plans subject to ERISA. Some of our administrative services and other activities may also be subject to regulation under ERISA. ERISA generally preempts all state and local laws that relate to employee benefit plans, but the extent of the pre-emption continues to be reviewed by courts.
Certain Large Case Pensions and Group Insurance products and services are also subject to potential issues raised by certain judicial interpretations relating to ERISA. Under those interpretations, together with DOL regulations, we may have ERISA fiduciary duties with respect to certain general account assets held under contracts that are not guaranteed benefit policies. As a result, certain transactions related to those assets are subject to conflict of interest and other restrictions, and we must provide certain disclosures to policyholders annually. We must comply with these restrictions or face substantial penalties.
Federal Employees Health Benefits (“FEHB”) Program
Our subsidiaries contract with the Office of Personnel Management (the “OPM”) to provide managed health care services under the FEHB program in their service areas. These contracts with the OPM and applicable government regulations establish premium rating arrangements for this program. OPM regulations require that community-rated FEHB plans meet a FEHB program-specific MLR by plan code and market. Managing to these rules is complicated by the simultaneous application of the minimum MLR standards and associated premium rebate
requirements of Health Care Reform. As a result of the Coventry acquisition, we also manage certain FEHB plans on a “cost-plus” basis. The OPM conducts periodic audits of its contractors to, among other things, verify that the premiums established under its insured contracts and costs allocated pursuant to its cost-based contracts are in compliance with the requirements of the applicable FEHB program. The OPM may seek premium refunds or institute other sanctions against us if we fail to comply with the FEHB program requirements.
Medicare
We continue to expand the Medicare markets we serve and Medicare products we offer. We expect to further expand our Medicare business in 2015 and are seeking to substantially grow our Medicare business over the next several years, including our Medicare Supplement products, which are regulated at the state level. The expansion of the Medicare markets we serve and Medicare products we offer and the Medicare-related provisions of Health Care Reform increase our exposure to changes in government policy with respect to and/or regulation of the various Medicare programs in which we participate, including changes in the amounts payable to us under those programs and/or new reforms or surcharges on existing programs. For example, sequestration began in 2013 and resulted in an automatic reduction in Medicare reimbursements to health plans of not more than 2% of total program costs per year through 2024. In addition, Health Care Reform contains further significant reductions in the reimbursements we receive for our Medicare Advantage members, including freezing 2011 rates based on 2010 levels, with additional reductions in future years based on regionally adjusted benchmarks. Beginning with the 2014 contract year, Health Care Reform also requires minimum MLRs for Medicare Advantage and Medicare Part D plans of 85%.
CMS’s Medicare Advantage and PDP premium rates for 2015 reflect a reduction in 2015 premiums compared to 2014 for Medicare Advantage and PDP plans and represent an aggregate high single digit percentage funding decrease during 2014 and 2015 and a meaningful revenue and operating results challenge for us. This 2015 rate reduction is in addition to the challenge we face from the impact of the industry-wide health insurer fee that became effective January 1, 2014. Based on our preliminary analysis, CMS’s preliminary Medicare Advantage benchmark payment rates would decrease funding for our Medicare Advantage business by approximately one percent in 2016 compared to 2015.
Our Medicare Advantage and Part D products are regulated by CMS. The regulations and contractual requirements applicable to us and other participants in Medicare programs are complex, expensive to comply with and subject to change. For example, in the second quarter of 2014, CMS issued a final rule implementing the Health Care Reform requirements that Medicare Advantage and PDP plans report and refund to CMS overpayments that those plans receive from CMS. During 2014, CMS also issued a final rule that changes in some respects how we can pay pharmacies and impacts our Medicare Advantage and PDP products. We have invested significant resources to comply with Medicare standards, and our Medicare compliance efforts will continue to require significant resources. CMS may seek premium and other refunds, prohibit us from continuing to market and/or enroll members in or refuse to passively enroll members in one or more of our Medicare or Medicare-Medicaid demonstration (historically known as “dual eligible”) plans, exclude us from participating in one or more Medicare or dual eligible programs and/or institute other sanctions against us if we fail to comply with CMS regulations or our Medicare contractual requirements.
CMS regularly audits our performance to determine our compliance with CMS’s regulations and our contracts with CMS and to assess the quality of services we provide to Medicare beneficiaries. Refer to “CMS Actions” in Note 18 of Notes to Consolidated Financial Statements for information on certain pending CMS audits.
Since 2012, a portion of each Medicare Advantage plan’s reimbursement has been tied to the plan’s “star ratings.” The star rating system considers a variety of measures adopted by CMS, including quality of preventative services, chronic illness management and overall customer satisfaction. In 2013 and 2014, those plans that received an overall star rating of three or more stars were eligible for a quality bonus in their basic premium rates. Beginning in 2015, Medicare Advantage plans must have an overall star rating of four stars or higher to qualify for a quality bonus. CMS released our 2015 star ratings in October 2014. Our 2015 star ratings will be used to determine which of our Medicare Advantage plans have ratings of four stars or higher and qualify for bonus payments in 2016. Our
average 2015 star rating is 4.00. Based on our membership at December 31, 2014, 79.4% of our Medicare Advantage members were in plans with 2015 star ratings of at least 4.0 stars. CMS will release updated stars ratings in October 2015 that will be used to determine the portion of our Medicare Advantage membership that will reside in plans with ratings of four stars or higher and qualify for bonus payments in 2017. In 2015 and going forward, our Medicare Advantage plans’ operating results are likely to continue to be significantly determined by their star ratings. Despite our success in improving our star ratings and other quality measures for 2015 and the continuation of our improvement efforts, there can be no assurances that we will be successful in maintaining or improving our star ratings in future years. Accordingly, our plans may not be eligible for full level quality bonuses, which could adversely affect the benefits such plans can offer, reduce membership and/or reduce profit margins.
We cannot predict future Medicare funding levels or the impact that future federal budget actions or entitlement program reform, if it occurs, will have on our business, operations or operating results, but the effects could be materially adverse, particularly on our Medicare and/or Medicaid revenues and operating results. For example, the Federal government may seek to impose restrictions on the configuration of pharmacy or other provider networks for Medicare Advantage and/or PDP plans, or otherwise restrict the ability of these plans to alter benefits, negotiate prices or establish other terms to improve affordability or maintain viability of products. We currently believe that the payments we receive and will receive in the near term are adequate to justify our continued participation in the Medicare program, although there are economic and political pressures to continue to reduce spending on the program, and this outlook could change.
Going forward, we expect CMS and the U.S. Congress to continue to closely scrutinize each component of the Medicare program (including Medicare Part D drug benefits), modify the terms and requirements of the program and possibly seek to limit private insurers’ role. It is not possible to predict the outcome of this Congressional or regulatory activity, either of which could adversely affect us.
Medicaid
We are seeking to substantially grow our Medicaid and dual eligible businesses over the next several years. As a result, we also are increasing our exposure to changes in government policy with respect to and/or regulation of the various Medicaid and dual eligible programs in which we participate, including changes in the amounts payable to us under those programs.
The impact of Medicaid expansion under Health Care Reform is uncertain. States may opt out of the elements of Health Care Reform requiring expansion of Medicaid coverage without losing their current federal Medicaid funding, and governors and/or legislatures in over a dozen states have indicated that they may not support the implementation of Medicaid expansion under Health Care Reform. At least 26 states have expanded Medicaid coverage, and some governors are supporting alternative Medicaid expansion plans that are subject to further CMS approval. In addition, the election of new governors and/or state legislatures may impact states’ previous decisions regarding Medicaid expansion.
The economic aspects of the Medicaid and dual eligible business vary from state to state and are subject to frequent change. Medicaid premiums are paid by each state and differ from state to state. The federal government and certain states are also considering proposals and legislation for Medicaid and dual eligible program reforms or redesigns, including further program, population and/or geographic expansions of risk-based managed care, changes to benefits, reimbursement, or payment levels, eligibility criteria, provider network adequacy requirements (including requiring the inclusion of specified high cost providers in our networks) and program structure. In some states, current Medicaid and dual eligible funding and premium revenue may not be adequate for us to continue program participation due to state and federal budgetary constraints and continuing efforts to reduce health care costs. In addition, our Medicaid and dual eligible contracts with states (or sponsors of Medicaid managed care plans) are subject to cancellation by the state (or the sponsors of the managed care plans) after a short notice period without cause (for example, when a state discontinues a managed care program) or in the event of insufficient state funding.
Our Medicaid and dual eligible products also are regulated by CMS and state Medicaid agencies, which have the right to audit our performance to determine compliance with CMS contracts and regulations. Our Medicaid products, dual eligible products and Children’s Health Insurance Program (“CHIP”) contracts also are subject to federal and state regulations and oversight by state Medicaid agencies regarding the services we provide to Medicaid enrollees, payment for those services, network requirements (including mandatory inclusion of specified high-cost providers), and other aspects of these programs, and by external review organizations which audit Medicaid plans on behalf of the state Medicaid agencies. The laws, regulations and contractual requirements applicable to us and other participants in Medicaid and dual eligible programs, including requirements that we submit encounter data to the applicable state agency, are extensive, complex and subject to change. We have invested significant resources to comply with these standards, and our Medicaid and dual eligible program compliance efforts will continue to require significant resources. CMS and/or state Medicaid agencies may fine us, withhold payments to us, seek premium and other refunds, terminate our existing contracts, elect not to award us new contracts or renew our existing contracts, prohibit us from continuing to market and/or enroll members in or refuse to auto assign members to one or more of our Medicaid or dual eligible products, exclude us from participating in one or more Medicaid or dual eligible programs and/or institute other sanctions against us if we fail to comply with CMS or state regulations or our contractual requirements.
We cannot predict whether pending or future federal or state legislation or court proceedings will change various aspects of the Medicaid program, nor can we predict the impact those changes will have on our business operations or financial results, but the effects could be materially adverse.
HMO, Insurance Holding Company and Other State Laws
A number of states, including Pennsylvania and Connecticut, regulate affiliated groups of insurers and HMOs such as the Company under holding company statutes. These laws may, among other things, require us and our subsidiaries to maintain certain levels of equity. We expect the states in which our insurance and HMO subsidiaries are licensed to continue to expand their regulation of the corporate governance and internal control activities of our insurance companies and HMOs.
The states of domicile of our regulated subsidiaries have statutory risk-based capital, or “RBC”, requirements for health and other insurance companies and HMOs based on the RBC Model Act. These RBC requirements are intended to assess the capital adequacy of life and health insurers and HMOs, taking into account the risk characteristics of a company’s investments and products. The RBC Model Act sets forth the formula for calculating RBC requirements, which are designed to take into account asset risks, insurance risks, interest rate risks and other relevant risks with respect to an individual company’s business. In general, under these laws, an insurance company or HMO must submit a report of its RBC level to the insurance department or insurance commissioner of its state of domicile for each calendar year.
The RBC Model Act requires increasing degrees of regulatory oversight and intervention as a company’s RBC declines and provides for four different levels of regulatory action depending on the ratio of a company’s total adjusted capital (defined as the total of its statutory capital, surplus and asset valuation reserve) to its risk-based capital. The level of regulatory action ranges from requiring the company to submit a comprehensive financial plan for increasing its RBC to the domiciliary state insurance commissioner, to mandatory regulatory intervention requiring a company to be placed under regulatory control in a rehabilitation or liquidation proceeding. At December 31, 2014, the RBC level of each of our insurance and HMO subsidiaries was above the level that would require regulatory action.
In addition, changes to regulations or the interpretation of those regulations due to regulators’ increasing concerns regarding insurance company and/or HMO solvency due, among other things, to the current adverse and uncertain economic environment, could negatively impact our business in various ways, including through increases in solvency fund assessments, requirements that the Company hold greater levels of capital and/or delays in approving dividends from regulated subsidiaries.
For information regarding restrictions on certain payments of dividends or other distributions by our HMO and insurance company subsidiaries, refer to Note 16 of Notes to Consolidated Financial Statements on page 126.
The holding company laws for the states of domicile of Aetna and certain of its subsidiaries also restrict the ability of any person to obtain control of an insurance company or HMO without prior regulatory approval. Under those statutes, without such approval (or an exemption), no person may acquire any voting security of an insurance holding company (such as our parent company, Aetna Inc.) that controls an insurance company or HMO, or merge with such a holding company, if as a result of such transaction such person would control the insurance holding company. Control is generally defined as the direct or indirect power to direct or cause the direction of the management and policies of a person and is presumed to exist if a person directly or indirectly owns or controls 10% or more of the voting securities of another person.
Our workers’ compensation business includes the comparison of medical claims data against the applicable state’s fee schedule pricing, including applicable regulations and clinical guidelines. State fee schedules, which typically represent the maximum reimbursement for medical services provided to the injured worker, differ by state and change as state laws and regulations are passed and/or amended. Our workers’ compensation business also includes PBM and care management services, both of which are regulated at the state level. Our workers’ compensation customers include insurance carriers and TPA’s who also are regulated at the state level. The laws and regulations applicable to us and other participants in the workers’ compensation business are extensive, complex and subject to change. We have invested significant resources to comply with these standards, and our workers’ compensation compliance efforts will continue to require significant resources. We may be subject to significant fines, penalties and litigation if we fail to comply with those laws and regulations.
Audits and Investigations
We typically have been, are currently and may in the future be involved in various governmental investigations, audits, examinations, reviews, subpoenas and other requests for information, the intensity and scope of which continue to increase. These include routine, regular and special investigations, audits, examinations and reviews by, as well as subpoenas and other requests for information from, CMS, HHS, various state insurance and health care regulatory authorities, state attorneys general and offices of inspector general, the CCIIO, the Office of the Inspector General (the “OIG”), the OPM, the DOL, the Treasury, the FDA, committees, subcommittees and members of the U.S. Congress, the U.S. Department of Justice (the “DOJ”), the U.S. Federal Trade Commission (the “FTC”), U.S. attorneys and other state, federal and international governmental authorities. For example, certain of our Medicare Advantage plans are currently under audit for, among other things, compliance with coding and other requirements under the Medicare risk adjustment model; our Commercial business is currently under audit by both state and federal regulators related to Health Care Reform’s minimum MLR requirements; and our Commercial business is subject to audits related to Health Care Reform’s risk adjustment and reinsurance data since those programs were implemented in 2014. HHS also has begun to audit health plans, providers and other parties to enforce HIPAA compliance, including with respect to data security. Such government actions may, among other things, prevent or delay us from implementing planned premium rate increases and have resulted and may result in restrictions on our business, changes to or clarifications of our business practices, retroactive adjustments to premiums, refunds to members or the government, withholding of premium payments to us by government agencies, payments under insurance policies prior to those payments being due under the terms of the policy, assessments of damages, civil or criminal fines or penalties (including under the federal false claims act (the “False Claims Act”)), or other sanctions, including the possible suspension or loss of licensure and/or suspension or exclusion from participation in government programs. For example, effective April 2010 through June 2011, CMS imposed intermediate sanctions on us suspending the enrollment of and marketing to new members of all Aetna Medicare Advantage and Standalone PDP contracts.
A significant number of states are investigating life insurers’ claims payment and related escheat practices. For additional information on these life insurance matters, refer to “Life and Disability Insurance” beginning on page 22.
Refer to “Litigation and Regulatory Proceedings” in Note 18 of Notes to Consolidated Financial Statements beginning on page 129 for more information regarding pending audits and investigations.
Federal and State Reporting
We are subject to extensive financial and business reporting requirements, including penalties for inaccuracies and/or omissions, at both the state and federal level. Health Care Reform significantly expanded these reporting requirements and added additional penalties for inaccuracies and omissions. In some instances, our ability to comply with these requirements will depend on receipt of information from third parties that may not be readily available or reliably provided in all instances. We are and will continue to be required to modify our information systems, dedicate significant resources and incur significant expenses to comply with these requirements. However, we cannot eliminate the risks of unavailability of or errors in our reports.
Fraud, Waste and Abuse Laws
Federal and state governments have made investigating and prosecuting health care fraud, waste and abuse a priority. Fraud, waste and abuse prohibitions encompass a wide range of activities, including kickbacks or other inducements for referral of members or for the coverage of products (such as prescription drugs) by a plan, billing for unnecessary medical services by a health care provider, improper marketing, and violations of patient privacy rights. Companies involved in public health care programs such as Medicare and/or Medicaid are required to maintain compliance programs to detect and deter fraud, waste and abuse, and are often the subject of fraud, waste and abuse investigations and audits. The regulations and contractual requirements applicable to us and other participants in these public-sector programs are complex and subject to change. Although our compliance program is designed to meet all statutory and regulatory requirements, our policies and procedures are frequently under review and subject to updates, and our training and education programs continue to evolve. We have invested significant resources to comply with Medicare and Medicaid program standards. Ongoing vigorous law enforcement and the highly technical regulatory scheme mean that our compliance efforts in this area will continue to require significant resources.
Federal and State Laws and Regulations Governing Submission of Information and Claims to Agencies
We are subject to federal and state laws and regulations that apply to the submission of information and claims to various government agencies. For example, the False Claims Act provides, in part, that the federal government may bring a lawsuit against any person or entity who the government believes has knowingly presented, or caused to be presented, a false or fraudulent request for payment from the federal government, or who has made a false statement or used a false record to get a claim approved. There also is False Claims Act liability for knowingly or improperly avoiding repayment of an overpayment received from the government and/or failing to promptly report and return any such overpayment. The federal government, whistleblowers and some courts have taken the position that claims presented in violation of other statutes, such as the federal anti-kickback statute, may be considered a violation of the False Claims Act. In addition, Health Care Reform may have expanded the jurisdiction of, and our exposure to, the False Claims Act to products sold on Public Exchanges. Violations of the False Claims Act are punishable by treble damages and penalties of up to a specified dollar amount per false claim. In addition, a special provision under the False Claims Act allows a private person (for example, a “whistleblower” such as a disgruntled current or former competitor, member or employee) to bring an action under the False Claims Act on behalf of the government alleging that a company has defrauded the federal government and permits the private person to share in any settlement of, or judgment entered in, the lawsuit.
A number of states, including states in which we operate, have adopted their own false claims acts and whistleblower provisions that are similar to the False Claims Act. From time to time, companies in the health and related benefits industry, including ours, may be subject to actions under the False Claims Act or similar state laws.
Product Design and Administration and Sales Practices
State and/or federal regulatory scrutiny of life and health insurance company and HMO product design and administration and marketing and advertising practices, including the filing of insurance policy forms and the adequacy of disclosure regarding products and their administration, is increasing as are the penalties being imposed for inappropriate practices. Medicare, Medicaid and dual eligible products and products offering more limited benefits, such as some of our student health plans, in particular continue to attract increased regulatory scrutiny.
Guaranty Fund Assessments/Solvency Protection
Under guaranty fund laws existing in all states, insurers doing business in those states can be assessed (up to prescribed limits) for certain obligations of insolvent insurance companies to policyholders and claimants. The health insurance guaranty associations in which we participate that operate under these laws respond to insolvencies of long-term care insurers as well as health insurers. Our assessments generally are based on a formula relating to our premiums in the state compared to the premiums of other insurers. Certain states allow assessments to be recovered as offsets to premium taxes. Some states have similar laws relating to HMOs and/or other payors such as not-for-profit consumer governed health plans established under Health Care Reform. Refer to “Guaranty Fund Assessments, Market Stabilization and Other Non-Voluntary Risk Sharing Pools” in Note 18 of Notes to Consolidated Financial Statements beginning on page 127 for more information on the pending rehabilitation of Penn Treaty Network America Insurance Company and one of its subsidiaries (collectively, “Penn Treaty”) and certain assessments to which our HMOs are subject. It is reasonably possible that in future reporting periods we may record a liability and expense relating to Penn Treaty or other insolvencies which could have a material adverse effect on our operating results, financial condition and cash flows. While we have historically recovered more than half of guaranty fund assessments through statutorily permitted premium tax offsets, significant increases in assessments could lead to legislative and/or regulatory actions that may limit future offsets.
Regulation of Pharmacy Operations
CVS Health Corporation has provided certain PBM services to us and certain of our customers and members since January 1, 2011. As amended, our PBM agreement with CVS Health Corporation has a term ending in December 2022, although we have certain termination rights beginning in January 2020. Express Scripts also provides certain PBM services to certain of our customers and members under agreements with terms ending in 2015 for Medicare members and 2016 for Commercial and Medicaid members.
Notwithstanding our contracting with our PBM services suppliers, we remain responsible to regulators and members for the delivery of PBM services. In addition, we continue to operate two mail order pharmacy facilities and one specialty pharmacy facility (our “Pharmacies”) and utilize certain pharmacies of our PBM services suppliers. Our Pharmacies dispense pharmaceuticals throughout the U.S. and are participating providers in Medicare, Medicare Part D and various Medicaid programs. The pharmacy practice is generally regulated at the state level by state boards of pharmacy. Our Pharmacies are required to be licensed in the state where they are located, as well as the states that require registration or licensure of mail order pharmacies with the state’s board of pharmacy or similar regulatory body. Our Pharmacies also must register with the U.S. Drug Enforcement Administration and individual state controlled substance authorities in order to dispense controlled substances and must comply with applicable Medicare, Medicaid and other provider rules and regulations, including the False Claims Act, state false claims acts and federal and state anti-kickback laws. Our PBM services suppliers’ owned and contracted pharmacies are subject to these same licensing requirements and other laws and regulations. The loss or suspension of any such licenses or registrations could have a material adverse effect on our ability to meet our contractual obligations to our customers, which could, in turn, have a material adverse effect on our pharmacy business and/or operating results.
Regulation of Pharmacy Benefit Management Operation
Our PBM services are regulated directly and indirectly at the federal and state levels, including being subject to the False Claims Act and state false claims acts and federal and state anti-kickback laws. These laws and regulations govern, and proposed legislation and regulations may govern, critical PBM practices, including disclosure, receipt and retention of rebates and other payments received from pharmaceutical manufacturers; use of, administration of, and/or changes to drug formularies, maximum allowable cost list pricing, average wholesale prices and/or clinical programs; disclosure of data to third parties; drug utilization management practices; the level of duty a PBM owes its customers; configuration of pharmacy networks; the operations of our Pharmacies (including audits of our Pharmacies); disclosure of negotiated provider reimbursement rates; disclosure of fees associated with administrative service agreements and patient care programs that are attributable to members’ drug utilization; and registration or licensing of PBMs. Failure by us or one of our PBM services suppliers to comply with these laws or regulations could result in material fines and/or sanctions and could have a material adverse effect on our operating results.
Life and Disability Insurance
Our life and disability insurance operations are subject to extensive regulation. Changes in these regulations, such as expanding the definition of disability or mandating changes to claim payment, determination and/or settlement practices, could have a material adverse impact on our life insurance and/or disability insurance operations and/or operating results. Since 2011, legislation has been enacted or introduced in a number of states requiring life insurers to take additional steps to identify unreported deceased policy holders, and make other changes to their claim payment and related escheat practices, including consultation of certain databases. A significant number of states are investigating life insurers’ claims payment and related escheat practices, and these investigations have resulted in significant charges to earnings by other life insurers in connection with related settlement agreements. We have received requests for information from a number of states, and certain of our subsidiaries are being audited, with respect to our life insurance claim payment and related escheat practices. In the fourth quarter of 2013, we made changes to our life insurance claim payment practices (including related escheatment practices) based on evolving industry practices and regulatory expectations and interpretations, including expanding our existing use of the Social Security Administration’s Death Master File to identify additional potentially unclaimed death benefits and locate applicable beneficiaries. As a result of these changes, in the fourth quarter of 2013, we increased our estimated liability for unpaid life insurance claims with respect to insureds who passed away on or before December 31, 2013, and recorded in current and future benefits a charge of $35.7 million ($55.0 million pretax). Given the legal and regulatory uncertainty with respect to life insurance claim payment and related escheat practices, it is reasonably possible that we may incur additional liability related to those practices, whether as a result of further changes in our business practices, litigation, government actions or otherwise, which could adversely affect our operating results and cash flows.
Consumer Protection Laws
The consumer business we are creating and certain of our other businesses participate in direct-to-consumer activities, and we increasingly offer mobile and web-based solutions to our members and to other consumers. We are therefore subject to federal and state regulations applicable to electronic communications and to other general consumer protection laws and regulations. In particular, the FTC is aggressively exercising its enforcement authority in the areas of consumer privacy and data security with a focus on web-based, mobile products and “big data.” As a result of the widely-reported large scale U.S. commercial data breaches during 2014 and early 2015, the FTC and state regulators are expected to increase their enforcement activity in these regimes. These enforcement developments will impact the design, management and operation of our businesses, including the consumer business we are creating, our privacy and security strategy and our web-based and mobile assets.
International Regulation
We expect to continue to expand our Health Care operations in foreign countries through both organic growth and acquisitions. We currently have insurance licenses in several foreign jurisdictions and do business directly or through local affiliations in numerous countries around the world. These international operations are subject to different, and sometimes more stringent, legal and regulatory requirements, which vary widely by jurisdiction, including anti-corruption laws; economic sanctions laws; various privacy, insurance, tax, tariff and trade laws and regulations; corporate governance, privacy, data protection, data mining, data transfer, labor and employment, intellectual property, consumer protection and investment laws and regulations; discriminatory licensing procedures; compulsory cessions of reinsurance; required localization of records and funds; higher premium and income taxes; and requirements for local participation in an insurer’s ownership. In addition, the expansion of our operations into foreign countries increases our exposure to the anti-bribery, anti-corruption and anti-money laundering provisions of U.S. law, including the FCPA, and foreign laws, including the U.K. Bribery Act 2010 (the “UK Bribery Act”).
The FCPA prohibits offering, promising or authorizing others to give anything of value to a foreign government official to obtain or retain business or otherwise secure a business advantage. We also are subject to applicable anti-corruption laws of the jurisdictions in which we operate. In many countries outside the U.S., health care professionals are employed by the government. Therefore, our dealings with them are subject to regulation under the FCPA. Violations of the FCPA and other anti-corruption laws may result in severe criminal and civil sanctions as well as other penalties, and the SEC and the DOJ have increased their enforcement activities with respect to the
FCPA. The UK Bribery Act is an anti-corruption law that is broader in scope than the FCPA and applies to all companies with a nexus to the United Kingdom. Disclosures of FCPA violations may be shared with the UK authorities, thus potentially exposing companies to liability and potential penalties in multiple jurisdictions. We have internal control policies and procedures and conduct training and compliance programs for our employees to deter prohibited practices. However, if our employees or agents fail to comply with applicable laws governing our international operations, we may face investigations, prosecutions and other legal proceedings and actions which could result in civil penalties, administrative remedies and criminal sanctions. See “As we expand our international operations, we will increasingly face political, legal and compliance, operational, regulatory, economic and other risks that we do not face or are more significant than in our domestic operations. Our exposure to these risks is expected to increase” beginning on page 70 for a discussion of the risks related to operating globally.
Anti-Money Laundering Regulations
Certain of our lines of business are subject to Treasury anti-money laundering regulations. Those lines of business have implemented anti-money laundering policies designed to insure their compliance with the regulations. We also may be subject to anti-money laundering laws in non-U.S. jurisdictions where we operate.
Office of Foreign Assets Control
We also are subject to regulation by the Office of Foreign Assets Control (“OFAC”) of the Treasury. OFAC administers and enforces economic and trade sanctions based on U.S. foreign policy and national security goals against targeted foreign countries and regimes, terrorists, international narcotics traffickers, those engaged in activities related to the proliferation of weapons of mass destruction, and other threats to the national security, foreign policy or economy of the United States. In addition, we may be subject to similar regulations in the non-U.S. jurisdictions in which we operate.
FORWARD-LOOKING INFORMATION/RISK FACTORS
The Private Securities Litigation Reform Act of 1995 (the “1995 Act”) provides a “safe harbor” for forward-looking statements, so long as (1) those statements are identified as forward-looking, and (2) the statements are accompanied by meaningful cautionary statements that identify important factors that could cause actual results to differ materially from those discussed in the statement. We want to take advantage of these safe harbor provisions.
Certain information contained in this MD&A and elsewhere in the Annual Report and our Annual Report on Form 10-K is forward-looking within the meaning of the 1995 Act or SEC rules. This information includes, but is not limited to: the “Outlook for 2015” on page 4, “Risk Management and Market-Sensitive Instruments” beginning on page 15 and “Regulatory Environment” beginning on page 26 of the Annual Report and this “Forward-Looking Information/Risk Factors” section. In addition, throughout this MD&A and elsewhere, we use the following words, or variations or negatives of these words and similar expressions, when we intend to identify forward-looking statements:
|
| | | | | | | | | |
| · | Expects | · | Intends | · | Seeks | · | Will | · | Potential |
| · | Projects | · | Plans | · | Estimates | · | Should | · | Continue |
| · | Anticipates | · | Believes | · | May | · | Could | · | View |
| · | Outlook | · | Guidance | · | Predict | · | Likely | · | Probable |
| · | Forecast | · | Can | | | | | | |
Forward-looking statements rely on a number of estimates, assumptions and projections concerning future events, and are subject to a number of significant uncertainties and other factors that could cause actual results to differ materially from those statements. Many of these uncertainties and other factors are outside our control. Certain of these uncertainties and other factors are described under “Risk Factors” below. You should not put undue reliance on forward-looking statements. Any forward-looking statement speaks only as of the date of this report, and we
disclaim any intention or obligation to update or revise forward-looking statements, whether as a result of new information, future events, uncertainties or otherwise.
Risk Factors
You should carefully consider each of the following risks and uncertainties and all of the other information set forth in this MD&A or elsewhere in our Annual Report or our Annual Report on Form 10-K. These risks and uncertainties and other factors may affect forward-looking statements, including those we make in this MD&A or elsewhere, such as in news releases or investor or analyst calls, meetings or presentations. The risks and uncertainties described below are not the only ones we face. Additional risks and uncertainties not presently known to us or that we currently believe to be immaterial may also adversely affect our business. Any of these risks or uncertainties could cause our actual results to differ materially from our expectations and the expected results discussed in our forward-looking statements. You should not consider past results to be an indication of future performance.
If any of the following risks or uncertainties develops into actual events or if the circumstances described in the risks or uncertainties occur or continue to occur, these events or circumstances could have a material adverse effect on our business, cash flows, financial condition or operating results. In that case, the trading price of our common stock could decline materially, among other effects on us.
Health Care Reform implementation (including the collection of, or other solutions to, the significant assessments, fees and taxes first imposed on us in 2014; and participation on Public Exchanges); Medicare Advantage and PDP rates for 2015; and U.S. government fiscal policy present overarching risks to our enterprise in 2015.
We expect to face significant business challenges and uncertainties in 2015. We will become subject to significant additional assessments, fees and taxes imposed by Health Care Reform. If we are unable to include these assessments, fees and taxes in our premiums and fees or otherwise adjust our business model to solve for them, these assessments, fees and taxes could have a material adverse effect on our operating results, financial condition and/or cash flows. We have only limited prior experience with pricing Public Exchange products or utilization of medical and/or other covered services by Public Exchange product members. There can be no assurance regarding the accuracy of the health care benefit cost, membership or other projections reflected in our Public Exchange product pricing. CMS’s final Medicare Advantage and PDP premium rates for 2015 are significantly below 2014 rates and present a meaningful challenge to our 2015 revenues and operating results. U.S. government fiscal policy is subject to change and can adversely affect us, including as a result of reductions in Health Care Reform funding, failure to raise the U.S. federal government’s debt ceiling or any sustained U.S. federal government shutdown. There can be no assurance that U.S. government fiscal policy, the implementation of Health Care Reform or additional changes to the U.S. health care system will not adversely affect our business, cash flows, financial condition or operating results. For additional background on these risks, see:
| |
| • | “Outlook for 2015”, beginning on page 4; |
| |
| • | “Regulatory Environment - General”, beginning on page 26; |
| |
| • | “We are subject to potential changes in public policy (in respect of Health Care Reform or otherwise) that can adversely affect the markets for our products and services and our business, operations and financial results”, beginning on page 44; |
| |
| • | “If we are unable to include the significant assessments, fees and taxes imposed on us by Health Care Reform in our premiums and fees or otherwise solve for them, our operating results, financial condition and/or cash flows would be materially and adversely affected. The inclusion of these assessments, fees and taxes in our premiums also could adversely affect our ability to grow and/or maintain our medical membership”, beginning on page 48; |
| |
| • | “Key aspects of Health Care Reform have yet to take full effect, are unclear, or are subject to change, making their practical effects difficult to predict. Our business and operating results may be materially and adversely affected by Health Care Reform even if we correctly predict its effects”, beginning on page 45; |
| |
| • | “Our ability to anticipate medical cost trends and achieve appropriate pricing on Insurance Exchanges could adversely affect our operating results. There can be no assurance that the future health care benefit costs of our Insurance Exchange products will not exceed our projections”, beginning on page 59; |
| |
| • | “Recent legislative changes and Medicare Advantage and PDP rates for 2015 and proposed rates for 2016 create significant challenges to our Medicare Advantage and PDP revenues and operating results, and proposed changes to these programs could create significant additional challenges. Entitlement program reform, if it occurs, could have a material adverse effect on our business, operations or operating results”, beginning on page 46; and |
| |
| • | “Programs funded by the U.S. federal government account for a substantial portion of our revenue and operating earnings. A delay by Congress in raising the federal government’s debt ceiling could lead to a delay, reduction, suspension or cancellation of federal government spending and a significant increase in interest rates that could, in turn, have a material adverse effect on our businesses, operating results and cash flows”, beginning on page 55. |
While we consider the foregoing to be the overarching risks we face in 2015, they are not the only material risks we face. We face numerous other challenges, as described elsewhere in this Annual Report, including below in this “Forward-Looking Information and Risk Factors” discussion, and other unanticipated risks may develop.
Our strategy may not be an effective response to the changing dynamics in the health and related benefits industry, or we may not be able to implement our strategy and related strategic projects effectively.
Our strategy includes effectively investing our capital and human resources in appropriate strategic projects, current operations and acquisitions to respond to changing dynamics in the health and related benefits industry, including the shift toward the direct-to-consumer marketing and operating model contemplated by Public Exchanges and Private Exchanges (collectively, “Insurance Exchanges”), the declining number of commercially insured people and the potential shift to a defined contribution model for health benefits. Our strategic projects include, among other things: significant investments in human and technology resources to grow our Healthagen® business, create a consumer business and compete effectively in a direct-to-consumer marketplace; transforming our business model through consumer engagement, ACOs and collaborative provider networks; participating in Insurance Exchanges; optimizing our business platforms; managing certain significant technology projects; further improving relations with health care providers; negotiating contract changes with customers and providers; and implementing other business process improvements. Implementing our strategic initiatives will require significant investments of capital and human resources. Among other things, we will need to simultaneously acquire and develop new personnel, products and systems to serve existing and new markets, particularly the consumer business we are creating, and enhance our existing customer service, information technology, control and compliance processes and systems. The future performance of our businesses will depend in large part on our ability to design and implement our strategic initiatives, some of which will occur over several years. If these initiatives do not achieve their objectives, our operating results could be adversely affected.
Our strategy may not be an effective response to the changing dynamics in the health and related benefits industry, and we may fail to recognize and position ourselves to capitalize upon market opportunities. We may not have sufficient advance notice and resources to develop and effectively implement an alternative strategy. Competitors who develop a superior strategy, or more effectively implement their strategy, may develop capabilities, competitive advantages and competitive positions that are difficult to match or overcome.
Health Care Reform and Other Legal and Regulatory Risks
We are subject to potential changes in public policy (in respect of Health Care Reform or otherwise) that can adversely affect the markets for our products and services and our business, operations and financial results.
The political environment in which we operate remains uncertain. It is reasonably possible that our business operations and financial results could be materially adversely affected by public policy changes at the state or federal level, which include Health Care Reform but also extend to many other public policy initiatives. Such changes may present us with new financial and other challenges and may, for example, cause membership in our health plans to decrease or make doing business in particular states less attractive. If we fail to adequately respond to such changes, including by implementing effective operational and strategic initiatives, or do not do so as effectively as our competitors, our business, operations and financial results may be materially adversely affected.
In addition to Health Care Reform, we expect the federal and state governments to continue to enact and seriously consider many broad-based legislative and regulatory proposals that will or could materially impact various aspects of the health care system and our business, including additional health care reforms such as mandating lower out of pocket costs for members who are prescribed high cost drugs. The federal and many state governments are also considering changes in the interpretation, enforcement and/or application of existing laws and regulations. At the state level, all U.S. states and the District of Columbia will hold regular legislative sessions in 2015. In 2014, state legislatures focused on Health Care Reform (including Public Exchange implementation and premium rate review), state budget issues (including Medicaid funding) and tax legislation. We expect state legislatures to focus on these issues again in 2015.
We cannot predict the enactment or content of new legislation and regulations or changes to existing laws or regulations or their enforcement, interpretation or application, or the effect they will have on our business operations or financial results, which could be materially adverse. Even if we could predict such matters, it is not possible to eliminate the adverse impact of public policy changes that would fundamentally change the dynamics of our industry. Examples of such change include: the federal or one or more state governments fundamentally restructuring or reducing the funding available for Medicare, Medicaid, or dual eligible programs, changing the tax treatment of health or related benefits, or significantly altering Health Care Reform, such as eliminating or reducing funding for Health Care Reform’s risk corridors. The likelihood of adverse changes is increasing due to state and federal budgetary pressures, and our business and operating results could be materially and adversely affected by such changes, even if we correctly predict their occurrence. For more information on these matters, refer to “Regulatory Environment” beginning on page 26.
Key aspects of Health Care Reform have yet to take full effect, are unclear, or are subject to change, making their practical effects difficult to predict. Our business and operating results may be materially and adversely affected by Health Care Reform even if we correctly predict its effects.
Although Health Care Reform was enacted in 2010, key components will continue to be phased in over the next several years. Federal budget negotiations, ongoing regulatory changes to Health Care Reform (such as the November 2013 action permitting renewal through 2014 of individual and small group insurance policies that do not comply with Health Care Reform and the March 2014 action permitting such renewal through 2017), pending efforts in the U.S Congress to amend or restrict funding for various aspects of Health Care Reform (including risk corridors) and litigation challenging aspects of the law (including a case pending before the U.S. Supreme Court challenging federal government subsidies to individuals who purchase coverage through Federal Exchanges), continue to create uncertainty about the ultimate impact of the legislation. For example, if the payment of subsidies with respect to members who enroll through the Federal Exchanges ultimately is invalid, it could result in a significant reduction in our Public Exchange membership because almost all of our Public Exchange membership is through Federal Exchanges, and most of those members benefit from a tax subsidy. While the most significant changes occurred in 2014, key components of Health Care Reform will continue to be phased in through 2018. In addition, certain significant parts of the legislation, including aspects of Public Exchanges, Medicaid expansion, enforcement related reporting for the individual and employer mandates, reinsurance, risk corridor, risk adjustment and the implementation of Medicare Advantage and Part D minimum MLRs, have not been fully implemented and require further guidance and clarification at the federal level and/or in the form of regulations and actions by state legislatures to implement the law. It is likely that further changes will be made to Health Care Reform as issues arise and its practical effects become clearer. Growing state and federal budgetary pressures are making it more likely that any changes will be adverse to us.
Accordingly, many of the specifics of Health Care Reform will not be known for several years, and given the inherent difficulty of foreseeing how individuals and businesses will respond to the choices afforded to them by Health Care Reform, we cannot predict the full effect of Health Care Reform on us or the impact of future changes. Further, even if we correctly predict how parts of Health Care Reform will develop and affect us, our business and operating results may still be materially and adversely affected. For example, we anticipate that some aspects of Health Care Reform and other existing measures and new measures, if enacted, could materially adversely affect our health care operations and/or operating results by, among other things:
| |
| • | Reducing our ability to obtain adequate premium rates for the risk we assume (including denial of or delays in obtaining regulatory approval for and implementation of those rates); |
| |
| • | Significantly reducing the level of Medicare program payments; |
| |
| • | Restricting our ability to price for the risk we assume and/or reflect reasonable costs or profits in our pricing, and/or limiting the level of margin we can earn, including by mandating minimum medical loss ratios and/or requiring us to price prospectively to minimum medical loss ratios; |
| |
| • | Reducing our ability to manage health care or other benefit costs (including by mandating benefits, restricting an ability to manage our provider network and/or retroactively reducing the amount our members pay for high cost drugs and thus increasing our expenditures on those drugs); |
| |
| • | Increasing health care or other benefit costs and operating expenses (including duplicate expenses resulting from changes in regulations during implementation); |
| |
| • | Increasing our exposure to lawsuits and other adverse legal proceedings; |
| |
| • | Adversely affecting our product mix; and/or |
| |
| • | Imposing new or increasing existing taxes and financial assessments. |
Recent legislative changes and Medicare Advantage and PDP rates for 2015 and proposed rates for 2016 create significant challenges to our Medicare Advantage and PDP revenues and operating results, and proposed changes to these programs could create significant additional challenges. Entitlement program reform, if it occurs, could have a material adverse effect on our business, operations or operating results.
From time to time the federal government alters the level of funding for government health care programs, including Medicare. Under the BCA and the ATRA, significant, automatic across-the-board budget cuts (known as sequestration) to several federal government programs started in March 2013. These include Medicare spending cuts of up to 2% of total program costs per year through 2024. The ATRA also contained additional reductions to Medicare reimbursements to health plans that commenced in April 2013 and eliminated funding for certain Health Care Reform programs. These reductions could adversely affect us, our customers and our providers.
In addition, the final Medicare Advantage and PDP premium rates for 2015 reflect a significant reduction in 2015 premiums compared to 2014, and are in addition to the challenge we face from the impact of the industry-wide health insurer fee that became effective January 1, 2014. The final 2015 rates represent a meaningful revenue and operating results challenge for us and other Medicare Advantage and PDP plans, as well as providers. We expect these challenges to continue in 2016 as our preliminary analysis indicates CMS’s preliminary 2016 Medicare Advantage benchmark payment rates would decrease funding for our Medicare Advantage business by approximately one percent in 2016 compared to 2015. We cannot predict changes in future Medicare funding levels, the impact of future federal budget actions or ensure that such changes or actions will not have an adverse effect on our Medicare operating results.
In addition, the “star ratings” from CMS for our Medicare Advantage plans will continue to have a significant impact on our plans’ operating results, since beginning in 2015, only Medicare Advantage plans with an overall star rating of four or more stars will be eligible for a quality bonus in their basic premium rates. If our star ratings fall below expectations, do not match the performance of our competitors, the star rating standards are raised, or the quality bonuses are reduced or eliminated, our revenues and operating results may be adversely affected.
During 2014, CMS issued a final rule that changes in some respects how we can pay pharmacies and impacts our Medicare Advantage and PDP products. This final rule, which takes effect in 2016, may limit our ability to realize anticipated cost savings.
If entitlement program reform occurs, it could have a material adverse effect on our business, operations or operating results, particularly on our Medicare and/or Medicaid revenues, medical benefit ratio and operating results.
We may not be able to obtain adequate premium rate increases, which would have an adverse effect on our revenues, medical benefit ratios and operating results and could magnify the adverse impact of increases in health care and other benefit costs and of Health Care Reform assessments, fees and taxes.
Premium rates generally must be filed with state insurance regulators and are subject to their approval, which creates risk for us in the current political and regulatory environment. Health Care Reform generally requires a review by HHS in conjunction with state regulators of premium rate increases of 10% or more (or another state-specific threshold set by states determined by HHS to have adequate processes). Rate reviews can magnify the adverse impact on our operating margins and operating results of increases in health care and other benefit costs, increased utilization of covered services, and Health Care Reform assessments, fees and taxes, by restricting our ability to reflect these increases and/or these assessments, fees and taxes in our pricing. The risk of increases in utilization of medical and/or other covered services and/or in health care and other benefit costs is particularly acute during and following periods (such as 2010-2013), when utilization has been below recent historical levels. Further, our ability to reflect Health Care Reform assessments, fees and taxes in our Medicare rates is limited; and our ability to reflect them in our Medicaid and/or CHIP premium rates is likely to be limited due, among other things, to the budgetary pressures currently facing many state governments. This could magnify the adverse impact on our operating margins and operating results of increases in utilization of medical and other covered services, health care and other benefit costs and/or medical cost trends that exceed our projections.
In 2013 and 2014, HHS issued determinations to health plans that their rate increases were unreasonable, and we continued to experience challenges to appropriate premium rate increases in certain states. Regulators or legislatures in a number of states have implemented or are considering limits on premium rate increases, whether by enforcing existing legal requirements more stringently or proposing different regulatory standards. Regulators or legislatures in a number of states also have conducted hearings on proposed premium rate increases, which could result in substantial delays in implementing proposed rate increases even if they ultimately are approved. Since 2014, our plans can be excluded from participating in Public Exchanges if they are deemed to have a history of “unreasonable” rate increases. We have requested significant increases in our premium rates in our individual and small group Health Care businesses for 2015 and expect to continue to request significant increases in those rates for 2016 and beyond in order to adequately price for projected medical cost trends, the expanded coverages and rating limits required by Health Care Reform and the significant assessments, fees and taxes imposed by Health Care Reform. These significant rate increases heighten the risks of adverse public and regulatory reaction and the risk that our products will be selected by people with a higher risk profile or utilization rate than the pool of participants we anticipated when we established the pricing for the applicable products (also known as “adverse selection”) and the likelihood that our requested premium rate increases will be denied, reduced or delayed, which could lead to operating margin compression.
We anticipate continued regulatory and legislative action to increase regulation of premium rates in our Insured business. There is no guarantee that we will be able to obtain rate increases that are actuarially justified or that are sufficient to make our policies profitable in any product line or geography. If we are unable to obtain adequate rate increases, it could materially and adversely affect our operating margins and our ability to earn adequate returns on Insured business in one or more states or cause us to withdraw from certain geographies and/or products.
Minimum MLR rebate requirements limit the level of margin we can earn in our Commercial Insured and Medicare Insured businesses while leaving us exposed to higher than expected medical costs. Challenges to our minimum MLR rebate methodology and/or reports could adversely affect our operating results.
Health Care Reform requires us to pay minimum MLR rebates each year with respect to prior years. These minimum MLR rebate requirements limit the level of margin we can earn in our Commercial Insured and Medicare Insured businesses, while leaving us exposed to medical costs that are higher than those reflected in our pricing. Refer to “Revenue Recognition” in Note 2 of Notes to Consolidated Financial Statements beginning on page 80 for more information. Certain portions of our FEHBP program business are subject to minimum MLR rebate requirements separate from those imposed by Health Care Reform. The process supporting the management and determination of the amount of rebates payable is complex and requires judgment, and the rebate reporting requirements are detailed. As a result, challenges to our methodology and/or reports relating to minimum MLR
rebates by federal and state regulators and private litigants are reasonably possible. The outcome of these challenges could adversely affect our operating results.
Additionally, we are required to pay minimum MLR rebates in a limited number of states in which we offer Medicaid coverage. These rebates are not required by Health Care Reform; they are mandated by the our Medicaid contracts.
We may be subject to regulatory actions or suffer reputational harm if we do not or cannot adequately implement Health Care Reform and related legislation, which may have a material adverse effect on our business.
Health Care Reform enacted in 2010, legislated broad-based changes to the U.S. health care system. To date the constitutionality of Health Care Reform has been upheld, although significant portions of the law are subject to pending litigation. We have dedicated, and will continue to dedicate, material resources and incur material expenses to implement and comply with Health Care Reform and any future changes in Health Care Reform at both the state and federal level, including complying with the implementation timeframe set by the government each year for developing and pricing our Public Exchange products for the following year (which is significantly shorter for 2016 than for 2015) and implementing and complying with future regulations that will provide guidance on and clarification of and changes to significant parts of the legislation. If we fail to effectively implement Health Care Reform and our related operational and strategic initiatives, or do not do so as effectively as our competitors, our business, operating results and reputation may be materially adversely affected, we may lose customers and we may be subject to penalties, sanctions or other regulatory actions.
If we are unable to include the significant assessments, fees and taxes imposed on us by Health Care Reform in our premiums and fees or otherwise solve for them, our operating results, financial condition and/or cash flows would be materially and adversely affected. The inclusion of these assessments, fees and taxes in our premiums also could adversely affect our ability to grow and/or maintain our medical membership.
Health Care Reform imposes significant assessments, fees and taxes on us and other health insurers, health plans and other industry participants. We project that our share of the 2015 Health Care Reform assessments, fees and taxes will be approximately $1.1 billion. As we are one of the nation’s largest health care benefits companies, we expect our share of the Health Care Reform fees, assessments and taxes to continue to be significant. There is some uncertainty whether we will be able to include all of these assessments, fees and taxes in our premium rates. For example, our ability to reflect Health Care Reform assessments, fees and taxes in our Medicare rates is limited; and our ability to reflect them in our Medicaid and CHIP rates is likely to be limited due, among other things, to the budgetary pressures currently facing many state governments. If we are unable to include the Health Care Reform assessments, fees and taxes in our premiums and fees or otherwise adjust our business model to solve for them, these assessments, fees and taxes could have a material adverse effect on our operating results, financial condition and/or cash flows. The increases in our prices caused by including all of these assessments, fees and taxes in our premiums and fees also could adversely affect our ability to profitably grow and/or maintain our medical membership if, for example, our competitors do not seek to include all or a significant portion of these assessments, fees and taxes in their premiums or fees.
Our business activities are highly regulated. Our Medicare, Medicaid, mail order pharmacy, Public Exchange and certain other products are subject to particularly extensive and complex regulations. If we fail to comply with applicable laws and regulations, we could be subject to significant adverse regulatory actions or suffer reputational harm which may have a material adverse effect on our business. Compliance with future laws, regulations and/or judicial decisions may reduce our profitability and limit our growth.
Our business is subject to extensive regulation and oversight by state, federal and international governmental authorities. The laws and regulations governing our operations and interpretations of those laws and regulations are increasing in number and complexity, change frequently (as evidenced by Health Care Reform and administrative changes in, and pending litigation regarding, the implementation of Health Care Reform as well as other new federal and state laws and regulations), can be inconsistent or conflicting and generally are designed to benefit and protect members and providers rather than us or our investors. In addition, the governmental authorities that
administer our business have broad latitude to make, interpret and enforce the laws and regulations that govern us and continue to interpret and enforce those laws and regulations more strictly and more aggressively each year.
Our Medicare, Medicaid, dual eligible, Public Exchange, specialty pharmacy and mail order pharmacy products are more highly regulated than our other Health Care products. The laws and regulations governing participation in Medicare, Medicaid and dual eligible programs are complex, are subject to interpretation and can expose us to penalties for non-compliance, including penalties under the False Claims Act and state false claims acts. In addition, Health Care Reform may have expanded the jurisdiction of, and our exposure to, the False Claims Act to products sold on Public Exchanges, which began to operate in 2014. Claims under federal and state false claims acts can be brought by the government or by private individuals on behalf of the government through a qui tam or “whistleblower” suit. If we are convicted of fraud or other criminal conduct in the performance of a health program or if there is an adverse decision against us under the False Claims Act, we may be temporarily or permanently suspended from participating in government health care programs, including Medicare, Medicaid and dual eligible programs.
If we fail to comply with laws and regulations that apply to government programs, we could be subject to criminal fines, civil penalties, premium refunds, prohibitions on marketing or active or passive enrollment of members, corrective actions, termination of our contracts or other sanctions which could have a material adverse effect on our ability to participate in Medicare, Medicaid, dual eligible and other programs, cash flows, financial condition and operating results. For example, from April 2010 through June 2011, we were subject to intermediate sanctions that CMS imposed on us that required us to suspend the enrollment of and marketing to new members of all Aetna Medicare Advantage and PDP contracts. As a result of these sanctions, our 2011 Medicare membership and operating results were adversely affected because we did not participate in the annual enrollment process for 2011 and were not again eligible to receive automatic assignments of low income subsidy PDP members from CMS until September 2012.
Our products providing PBM and specialty and mail order pharmacy services are subject to:
| |
| • | The risks inherent in the dispensing, packaging and distribution of pharmaceuticals and other health care products, including claims related to purported dispensing and other operational errors (any failure by us or one of our PBM services suppliers to adhere to the laws and regulations applicable to the dispensing of pharmaceuticals could subject our PBM and/or pharmacy subsidiaries to civil and criminal penalties). |
| |
| • | Federal and state anti-kickback and other laws that govern our relationship with pharmaceutical manufacturers, customers and consumers. |
| |
| • | Compliance requirements under ERISA, including fiduciary obligations in connection with the development and implementation of items such as drug formularies and preferred drug listings. |
| |
| • | Federal and state legislative proposals and/or regulatory activity that could adversely affect pharmacy benefit industry practices, including the management and breadth of provider networks, the regulation of the development and use of drug formularies (such as the 2014 regulatory activity requiring us and certain other payors to place certain high cost drugs in preferred positions in our drug formularies) and/or maximum allowable cost list pricing, legislation, regulations or regulatory activity imposing additional rights to access to drugs for individuals enrolled in health care benefit plans or reducing the cost of such drugs to those individuals, the receipt or required disclosure of rebates from pharmaceutical manufacturers, and restrictions on the use of average wholesale prices. |
Our business, profitability and growth also may be adversely impacted by (i) judicial and regulatory decisions that change and/or expand the interpretations of existing statutes and regulations, impose medical or bad faith liability, increase our responsibilities under ERISA or the remedies available under ERISA, or reduce the scope of ERISA pre-emption of state law claims or (ii) other legislation and regulations, including new legislation or regulations that apply to Private Exchanges. For more information regarding these matters, refer to “Regulatory Environment” beginning on page 26 and “Litigation and Regulatory Proceedings” in Note 18 of Notes to Consolidated Financial Statements beginning on page 129.
We frequently are subject to regular and special governmental audits, investigations and reviews that could result in changes to our business practices, and also could result in material refunds, fines, penalties, civil liabilities, criminal liabilities and other sanctions.
As one of the largest national health and related benefits providers, we frequently are subject to regular and special governmental market conduct and other audits, investigations and reviews by, and we receive subpoenas and other requests for information from, various federal and state agencies, regulatory authorities, attorneys general, committees, subcommittees and members of the U.S. Congress and other state, federal and international governmental authorities. Several such audit, investigations and reviews currently are pending, some of which may be resolved in 2015, and the results of which may be adverse to us.
There continues to be a heightened level of review by federal, state and international regulators of the health and related benefits industry’s business and reporting practices, including premium rate increases, provider network adequacy, pharmacy formulary tiering, pharmacy network structures, utilization management and payment of providers with whom the payor does not have a contract and other health and life insurance claim payment practices. In addition, a significant number of states are investigating life insurers’ claims payment and related escheat practices, and these investigations have resulted in significant charges to earnings by other life insurers in connection with related settlement agreements. We have received requests for information from a number of states, and certain of our subsidiaries are being audited, with respect to our life insurance claim payment and related escheat practices. In the fourth quarter of 2013, we made changes to our life insurance claim payment practices (including related escheatment practices) based on evolving industry practices and regulatory expectations and interpretations, including expanding our existing use of the Social Security Administration’s Death Master File to identify additional potentially unclaimed death benefits and locate applicable beneficiaries. As a result of these changes, in the fourth quarter of 2013, we increased our estimated liability for life insurance claims with respect to insureds who passed away on or before December 31, 2013, and recorded in current and future benefits a charge of $35.7 million ($55.0 million pre-tax). Given the legal and regulatory uncertainty with respect to life insurance claim payment and related escheat practices, it is reasonably possible that we may incur additional liability related to those practices, whether as a result of further changes in our business practices, litigation, government actions or otherwise, which could adversely affect our operating results and cash flows. For additional information on these life insurance matters, refer to “Life and Disability Insurance” beginning on page 22.
Federal and state governments have made investigating and prosecuting health care and other insurance fraud, waste and abuse a priority. Fraud, waste and abuse prohibitions encompass a wide range of activities, including kickbacks for referral of members, billing for unnecessary medical and/or other covered services, improper marketing and violations of patient privacy rights. The regulations and contractual requirements applicable to us and other market participants are complex and subject to change, making it necessary for us to invest significant resources in complying with our regulatory and contractual requirements. Ongoing vigorous law enforcement and the highly technical regulatory scheme mean that our compliance efforts in this area will continue to require significant resources.
Regular and special governmental audits, investigations and reviews could result in changes to our business practices, and also could result in significant or material premium refunds, fines, penalties, civil liabilities, criminal liabilities or other sanctions, including suspension or exclusion from participation in government programs and suspension or loss of licensure. Any of these could have a material adverse effect on our financial condition, operating results or business or result in significant liabilities and negative publicity for our company. Our Commercial business is subject to audits related to Health Care Reform’s risk adjustment and reinsurance data since those programs were implemented in 2014. For more information on certain CMS and other audits, see “We are subject to retroactive adjustments to and/or withholding of certain premiums and fees, including as a result of CMS RADV audits. We generally rely on health care providers to appropriately code claim submissions and document their medical records. If these records do not appropriately support our risk adjusted premiums, CMS may require us to refund premium payments”, beginning on page 53.
For more information regarding these matters, refer to “Regulatory Environment” beginning on page 26 and “Litigation and Regulatory Proceedings” in Note 18 of Notes to Consolidated Financial Statements beginning on page 127.
If our compliance systems and processes fail or are deemed inadequate, we may suffer reputational harm and become subject to regulatory actions or litigation which could adversely affect our business, cash flows, operating results or financial condition.
Our businesses are subject to extensive and complex regulations, and many of our contracts with customers include detailed requirements. In order to be eligible to offer certain products or bid on certain contracts, we must demonstrate that we have robust systems in place to ensure that we comply with all applicable legal, regulatory and contractual requirements. These systems are frequently reviewed and audited by our customers and regulators. If our systems and processes designed to maintain compliance with applicable requirements, and to prevent and detect instances of, or the potential for, non-compliance fail or are deemed inadequate, we may suffer reputational harm and be subject to regulatory actions, litigation and other proceedings which may result in fines, suspension or loss of licensure, suspension or exclusion from participation in government programs and/or other penalties, any of which could adversely affect our business, cash flows, operating results or financial condition.
Our litigation and regulatory risk profile is changing as we offer new products and expand in business areas beyond our historical core business of providing Commercial managed care and health insurance products in the United States.
Historically, we focused primarily on providing Commercial managed care and health insurance products in the United States. In comparison, our Medicare and Medicaid businesses were significantly smaller. In 2014, our Medicare and Medicaid businesses accounted for approximately 42% of total health care premiums. Our business is now changing due to the following:
| |
| • | Expansion within the health care marketplace: We are expanding our presence in various sectors of the health care marketplace, including Medicare, Medicaid, dual eligibles, Commercial individual, international, and certain customers who are not subject to ERISA’s limits on state law remedies and working to deliver innovative products in those sectors. |
| |
| • | Entry into new business and new product lines: We are in the process of creating a consumer business. Over the last several years we have entered into new product lines, including Insurance Exchanges, dual eligible programs, support services for ACOs, recruitment for clinical trials and HIT. |
| |
| • | Acquisitions: Our 2013 acquisition of Coventry significantly expanded our Medicare, Medicaid, Commercial individual, network access and Workers Compensation businesses. Our 2014 acquisition of the InterGlobal group expanded our international business. |
These new products and the increased volume of business in areas beyond our historical core business subject us to litigation and regulatory risks that are different from the risks of providing Commercial managed care and health insurance products and significantly increase our exposure to other risks.
For additional information about these risks, see:
| |
| • | “Our business activities are highly regulated. Our Medicare, Medicaid, mail order pharmacy, Public Exchange and certain other products are subject to particularly extensive and complex regulations. If we fail to comply with applicable laws and regulations, we could be subject to significant adverse regulatory actions or suffer reputational harm which may have a material adverse effect on our business. Compliance with future laws, regulations and/or judicial decisions may reduce our profitability and limit our growth”, beginning on page 48; |
| |
| • | “We may not be able to compete effectively in the HIT business and earn a profit. Our HIT business increases our risk of patent infringement and other intellectual property litigation and may become subject to significant regulation in the future”, beginning on page 66; and |
| |
| • | “As we expand our international operations, we will increasingly face political, legal and compliance, operational, regulatory, economic and other risks that we do not face or are more significant than in our domestic operations. Our exposure to these risks is expected to increase”, beginning on page 70. |
We are routinely subject to litigation and adverse legal proceedings, including class actions. Many of these proceedings seek substantial damages which may not be covered by insurance. These proceedings may be costly to defend, result in changes in our business practices, harm our reputation and adversely affect our business and operating results.
We are routinely involved in numerous claims, lawsuits, regulatory audits, investigations and other legal proceedings arising in the ordinary course of our businesses. Certain of the lawsuits against us are purported to be class actions. The majority of these proceedings relate to the conduct of our health care operations and allege various violations of law. In addition, we operate in jurisdictions outside the United States, where contractual rights, tax positions and applicable regulations may be subject to interpretation or uncertainty to a greater degree than in the United States, and therefore more likely to be subject to dispute by customers, members, governmental authorities and others. We are incurring expenses to resolve these proceedings. The outcome of litigation and other adverse legal proceedings is always uncertain, and outcomes that are not justifiable by the evidence or existing law or regulation can and do occur.
Litigation may be brought against us by private individuals on behalf of the government through a qui tam or “whistleblower” suit. When a private individual brings a whistleblower suit, the defendant often will not be made aware of the suit for many months or even years, until the government commences its own investigation or determines whether it will intervene. Whistleblower suits have resulted in significant settlements between governmental agencies and health care companies. The significant incentives and protections provided under the Dodd-Frank Wall Street Reform and Consumer Protection Act increase the risk of whistleblower suits.
Many of the legal proceedings against us seek substantial damages (including non-economic or punitive damages and treble damages), and certain of these proceedings also seek changes in our business practices. For example, since 2007, we have been in class action litigation with non-participating providers over our payments to them, and during 2009, we settled a matter with the New York Attorney General that caused us to transition to different databases to determine the amount we pay non-participating providers under certain benefit plan designs. While we currently have insurance coverage for some potential liabilities, other potential liabilities may not be covered by insurance, insurers may dispute coverage, or the amount of our insurance may not be enough to cover the damages awarded or costs incurred. In addition, some types of damages, like punitive damages, may not be covered by insurance, and in some jurisdictions the coverage of punitive damages is prohibited. Insurance coverage for all or some forms of liability may become unavailable or prohibitively expensive in the future.
Litigation and other adverse legal proceedings could materially adversely affect our business or operating results because of reputational harm to us caused by such proceedings, the costs of defending such proceedings, the costs of settlement or judgments against us, or the changes in our operations that could result from such proceedings. Refer to “Litigation and Regulatory Proceedings” in Note 18 of Notes to Consolidated Financial Statements beginning on page 127 for more information.
Our use and disclosure of sensitive member and customer information is subject to complex regulations at multiple levels. We would be adversely affected if we or our business associates or other vendors fail to adequately protect sensitive member and customer information.
Our information systems are critical to the operation of our business. We collect, process, maintain, retain, evaluate, utilize and distribute large amounts of personal health and financial information and other confidential and sensitive data about our members and customers in the ordinary course of our business. Some of our information systems rely upon third party systems to accomplish these tasks. The use and disclosure of such information is regulated at the federal, state and international levels, and these laws, rules and regulations are subject to change and increased enforcement activity, such as the audit program implemented by HHS under HIPAA. In some cases, such laws, rules and regulations also apply to our vendors and/or may hold us liable for any violations by our vendors. International laws, rules and regulations governing the use and disclosure of such information are generally more stringent than in the United States, and they vary from jurisdiction to jurisdiction. Noncompliance with any privacy or security laws or regulations, or any security breach, cyber-attack or cyber security breach, and any incident
involving the theft, misappropriation, loss or other unauthorized disclosure of, or access to, sensitive or confidential member information, whether by us, by one of our vendors or by another third party, could require us to expend significant resources to remediate any damage, interrupt our operations and damage our reputation, and could also result in investigations, regulatory enforcement actions, material fines and penalties, loss of customers, litigation or other actions which could have a material adverse effect on our business, brand, reputation, cash flows and operating results.
In addition, while we have prepared for the transition to ICD-10, if unforeseen circumstances arise, it is possible that we could be exposed to investigations and allegations of noncompliance, which could have a material adverse effect on our results of operations, financial condition and cash flows. In addition, if some providers continue to use ICD-9 codes on claims after the final implementation date (currently October 1, 2015), we will have to reject such claims, which may lead to claim resubmissions, increased call volume and provider and customer dissatisfaction. Further, providers may use ICD-10 codes differently than they used ICD-9 codes in the past, which could result in lost revenues under risk adjustment. During the transition to ICD-10, certain claims processing and payment information we have historically used to establish our reserves may not be reliable or available in a timely manner. If we do not adequately implement the new ICD-10 coding set, or if providers do not adequately transition to the new ICD-10 coding set, our results of operations, financial condition and cash flows may be materially adversely affected.
Our business depends on our members’ and customers’ willingness to entrust us with their health related and other sensitive personal information. Events that negatively affect that trust, including failing to keep our information technology systems and our members’ and customers’ sensitive information secure from significant attack, theft, damage, loss or unauthorized disclosure or access, whether as a result of our action or inaction or that of our business associates, vendors or other third parties, including our PBM services suppliers, could adversely affect our reputation, membership and revenues and also expose us to mandatory disclosure to the media, litigation (including class action litigation) and other enforcement proceedings, material fines, penalties and/or remediation costs, and compensatory, special, punitive and statutory damages, consent orders, adverse actions against our licenses to do business and/or injunctive relief, any of which could adversely affect our business, cash flows, operating results or financial condition. There can be no assurance that any such failure will not occur, or if any does occur, that we will detect it or that it can be sufficiently remediated.
We are subject to retroactive adjustments to and/or withholding of certain premiums and fees, including as a result of CMS RADV audits. We generally rely on health care providers to appropriately code claim submissions and document their medical records. If these records do not appropriately support our risk adjusted premiums, CMS may require us to refund premium payments.
Premiums and/or fees for Medicare members, certain federal government employee groups and Medicaid beneficiaries are subject to retroactive adjustments and/or withholding by the federal and applicable state governments. Our Public Exchange business, including amounts payable to us or payable by us under the Health Care Reform premium stabilization programs and our risk adjustment and reinsurance data, also is subject to audit by governmental authorities. CMS regularly audits our performance to determine our compliance with CMS’s regulations and our contracts with CMS and to assess the quality of the services we provide to our Medicare members.
CMS uses various payment mechanisms to allocate and adjust premium payments to our and other companies’ Medicare plans by considering the applicable health status of Medicare members as supported by information prepared, maintained and provided by health care providers. We collect claim and encounter data from providers and generally rely on providers to appropriately code their submissions to us and document their medical records, including the diagnosis data submitted to us with claims. CMS pays increased premiums to Medicare Advantage plans and PDPs for members who have certain medical conditions identified with specific diagnosis codes. Federal regulators review and audit the providers’ medical records to determine whether those records support the related diagnosis codes that determine the members’ health status and the resulting risk-adjusted premium payments to us. In that regard, CMS has instituted risk adjustment data validation (“RADV”) audits of various Medicare Advantage plans, including certain of the Company’s plans, to validate coding practices and supporting medical
record documentation maintained by health care providers and the resulting risk adjusted premium payments to the plans. CMS may require us to refund premium payments if our risk adjusted premiums are not properly supported by medical record data. The OIG also is auditing risk adjustment data of other companies, and we expect CMS and the OIG to continue auditing risk adjustment data.
CMS revised its audit methodology for RADV audits to determine refunds payable by Medicare Advantage plans for contract year 2011 and forward. Under the revised methodology, among other things, CMS will project the error rate identified in the audit sample of approximately 200 members to all risk adjusted premium payments made under the contract being audited. Historically, CMS did not project sample error rates to the entire contract. As a result, the revised methodology may increase our exposure to premium refunds to CMS based on incomplete medical records maintained by providers.
During 2013, CMS selected certain of our Medicare Advantage contracts for contract year 2011 for audit. We are currently unable to predict which of our Medicare Advantage contracts will be selected for future audit, the amounts of any retroactive refunds of, or prospective adjustments to, Medicare Advantage premium payments made to us, the effect of any such refunds or adjustments on the actuarial soundness of our Medicare Advantage bids, or whether any RADV audit findings would require us to change to our method of estimating future premium revenue in future bid submissions to CMS or compromise premium assumptions made in our bids for prior contract years or the current contract year. For additional information, refer to “Regulatory Environment - Medicare” beginning on page 35.
If we fail to report and correct errors discovered through our own auditing procedures or during a CMS audit or otherwise fail to comply with the applicable laws and regulations, we could be subject to fines, civil penalties or other sanctions which could have a material adverse effect on our ability to participate in these programs, and on our financial condition, cash flows and operating results. CMS’s recent statements in formalized guidance regarding “overpayments” to Medicare Advantage plans appear to be inconsistent with CMS’s prior RADV audit guidance. These statements, contained in the preamble to CMS’ final rule release regarding Medicare Advantage and Part D prescription drug benefit program regulations for Contract Year 2015, appear to equate each Medicare Advantage risk adjustment data error with an “overpayment” without reconciliation to the principles underlying the fee for service adjustment comparison contemplated by CMS’s RADV audit methodology. If Medicare Advantage plans were not paid based on payment model principles that align with the requirements of the Social Security Act or such payments were not implemented correctly, it could have a material adverse effect on our results of operations, financial condition or cash flows.
Certain of our Medicaid contracts require the submission of complete and correct encounter data. The accurate and timely reporting of encounter data is increasingly important to the success of our Medicaid programs because more states are using encounter data to determine compliance with performance standards and, in part, to set premium rates. We have expended and may continue to expend additional effort and incur significant additional costs to collect accurate, or to correct inaccurate or incomplete, encounter data and have been and could be exposed to premium withholding, operating sanctions and financial fines and penalties for noncompliance. We have experienced challenges in obtaining complete and accurate encounter data due to difficulties with providers and third-party vendors submitting claims in a timely fashion in the proper format, and with state agencies in coordinating such submissions. As states increase their reliance on encounter data, these difficulties could affect the Medicaid premium rates we receive and how Medicaid membership is assigned to us, which could have a material adverse effect on our Medicaid operating results, cash flows and/or our ability to bid for, and continue to participate in, certain Medicaid programs.
Any premium or fee refunds, adjustments or withholding resulting from regulatory audits, whether as a result of RADV, Public Exchange related or other audits by CMS, the OIG, HHS or otherwise, including audits of our minimum medical loss ratio rebates, methodology and/or reports, could be material and could adversely affect our operating results, financial condition and cash flows. For more information see “Regulatory Environment” beginning on page 26.
If our service providers fail to meet their contractual obligations to us or to comply with applicable laws or regulations, we may be exposed to reputational harm, litigation or regulatory action. This risk is particularly high in our Medicare, Medicaid and dual eligible programs.
We contract with various third parties to perform certain functions and services and provide us with certain information technology systems. Our arrangements with these third parties may expose us to public scrutiny, adversely affect our reputation, expose us to litigation or regulatory action, and otherwise make our operations vulnerable if we fail to adequately monitor and regulate their performance or if they fail to meet their contractual obligations to us or to comply with applicable laws or regulations. For example, certain of our vendors have been responsible for releases of sensitive information of our members and employees, which has caused us to incur additional expenses and given rise to litigation against us.
These risks are particularly high in our Medicare, Medicaid and dual eligible programs, where third parties perform pharmacy benefit management, medical management and other member related services for us. Any failure of our or these third parties’ prevention, detection or control systems related to regulatory compliance, compliance with our internal policies, data security and/or cybersecurity or any incident involving the theft, misappropriation, loss or other unauthorized disclosure of, or access to, sensitive member information could require us to expend significant resources to remediate any damage, interrupt our operations and adversely affect our reputation and also expose us to whistleblower, class action and other litigation, other proceedings, prohibitions on marketing or active or passive enrollment of members, corrective actions, fines, sanctions and/or penalties, any of which could adversely affect our business, cash flows, operating results or financial condition. For more information on these matters, see “Our business activities are highly regulated. Our Medicare, Medicaid, mail order pharmacy, Public Exchange and certain other products are subject to particularly extensive and complex regulations. If we fail to comply with applicable laws and regulations, we could be subject to significant adverse regulatory actions or suffer reputational harm which may have a material adverse effect on our business. Compliance with future laws, regulations and/or judicial decisions may reduce our profitability and limit our growth”, beginning on page 48.
Programs funded by the U.S. federal government account for a substantial portion of our revenue and operating earnings. A delay by Congress in raising the federal government’s debt ceiling could lead to a delay, reduction, suspension or cancellation of federal government spending and a significant increase in interest rates that could, in turn, have a material adverse effect on our businesses, operating results and cash flows.
The federal government’s “debt ceiling”, or the amount of debt the federal government is permitted to borrow to meet its legal obligations (including, among other things, interest on the national debt, Medicare and Medicaid premiums, Social Security benefits and contributions to the Federal Employees Health Benefits Program), is limited by statute and can only be raised by an act of Congress.
If Congress does not raise the debt ceiling before the federal government’s current obligations approach or exceed its cash on hand and incoming receipts, federal government spending may be subject to delay, reduction, suspension or cancellation, including a federal government shutdown, which may be prolonged. A significant portion of our revenues are derived from health care coverage programs that are funded in whole or in part by the federal government, including the Medicare, Medicaid, and dual eligible programs, CHIP and the Federal Employees Health Benefits Program and subsidies for qualified individuals and families purchasing health insurance through Public Exchanges. If federal spending is delayed, suspended or curtailed, we would continue to receive claims from providers providing services to beneficiaries of these programs, and we could be liable for, and be required to fund, such claims. Furthermore, the terms of our disability products often provide that the benefits due to beneficiaries are reduced by the amount of certain federal benefits they receive, most notably Social Security Disability Insurance payments. If such payments are suspended or reduced due to a failure to timely raise the debt ceiling, our disability payment obligations would be increased accordingly. If beneficiaries subsequently receive such payments from the federal government, we would seek reimbursement or attempt to offset a portion of such payments against future disability benefit payments. We may not be successful in recovering the amount sought. A failure to timely raise the debt ceiling could have a material adverse effect on our businesses, operating results, cash flows and reputation and, in the case of a prolonged failure to raise the debt ceiling, our financial condition.
If the United States defaults on its obligations due to a failure to timely raise the debt ceiling or otherwise, or its credit rating is downgraded by any of the credit rating agencies, interest rates could rise, financial markets could become volatile and/or the availability of credit (and short-term credit in particular) could be adversely affected, thereby increasing our borrowing costs, negatively impacting the value of our investment portfolio, and/or adversely affecting our ability to access the capital markets, which could have a material adverse effect on our operating results, financial condition and cash flows and could adversely affect our liquidity.
Risks Related to Our Business
We may not be able to accurately forecast health care and other benefit costs, which could adversely affect our operating results. We may not able to obtain appropriate pricing on new or renewal business.
Premiums for our insured Health Care Products, which comprised approximately 85% and 84% of our total consolidated revenues for 2014 and 2013, respectively, are priced in advance based on our forecasts of health care and other benefit costs during a fixed premium period, which is generally one year. These forecasts are typically developed several months before the fixed premium period begins, are influenced by historical data (and recent historical data in particular), are dependent on our ability to anticipate and detect medical cost trends, and require a significant degree of judgment. For example, our revenue on Medicare policies is based on bids submitted in June of the year before the contract year. Cost increases in excess of our projections cannot be recovered in the fixed premium period through higher premiums. As a result, our profits are particularly sensitive to the accuracy of our forecasts and our ability to anticipate and detect medical cost trends. Even relatively small differences between predicted and actual health care and other benefit costs as a percentage of premium revenues can result in significant adverse changes in our operating results.
Our health care and other benefit costs can be affected by external events that we cannot forecast or project and over which we have little or no control, such as emerging changes in the economy and/or public policy, government mandated benefits or other regulatory changes, influenza related health care costs (which may be substantial and are projected to be higher in 2014-2015 than in 2013-2014), epidemics, pandemics, terrorist attacks or other man-made disasters, natural disasters or other events that materially increase utilization of medical and/or other covered services, as well as changes in members’ behavior and healthcare utilization patterns and provider billing practices. Our health care and other benefit costs also can be affected by changes in our business mix, products, contracts with providers, medical management, underwriting, rating and/or claims processing methods and processes, and our medical management initiatives may not deliver the reduction in utilization and/or medical cost trend that we project.
It is particularly difficult to accurately anticipate, detect, forecast, manage and reserve for medical cost trends and utilization of medical and/or other covered services during and following periods when such utilization and/or trends are below recent historical levels and during periods of changing economic conditions and employment levels. For example, during calendar year 2014, medical costs in our smaller middle market and individual businesses were higher than we projected, and during the calendar years 2010-2013, medical costs and members’ utilization of medical and/or other covered services were lower than we projected and members’ utilization was below recent historical levels. The recent favorable experience is not projected to continue in 2015, as we expect utilization to increase in 2015 when compared to 2014.
We have implemented price increases for 2015. If health care and other benefit costs are higher than the levels reflected in our pricing or if we are not able to obtain appropriate pricing on new or renewal business, our prices will not reflect the risk we assume, and our operating results will be adversely affected. If health care and other benefit costs are lower than we predict, our prices may be higher than those of our competitors, which may cause us to lose membership. For more information, see “Critical Accounting Estimates - Health Care Costs Payable” beginning on page 20.
Competitive and economic pressures may limit our ability to increase pricing to reflect higher costs or may force us to accept lower margins. If customers elect to self-insure, reduce benefits or adversely renegotiate or amend their agreements with us, our revenues and operating results will be negatively affected.
Our customer contracts are generally for a period of one year, and our customers have considerable flexibility in moving between us and our competitors. One of the key factors on which we compete for customers, especially in light of the current adverse and uncertain economic environment, is overall cost. We are therefore under pressure to contain premium price increases despite being faced with increasing health care and other benefit costs and increasing operating costs. If we are unable to increase our prices to reflect increasing costs, our profitability will be adversely affected. If we are unable to limit our price increases, we may lose members to competitors with more favorable pricing, adversely affecting our revenues and operating results.
In response to rising prices, our customers may elect to self-insure or to reduce benefits in order to limit increases in their benefit costs. Alternatively, our customers may purchase different types of products from us that are less profitable. Such elections may result in reduced membership in our more profitable Insured products and/or lower premiums for our Insured products, which may adversely affect our revenues and operating results, although such elections also may reduce our health care and other benefit costs.
In addition, our Medicare, Medicaid and CHIP products are subject to termination without cause, periodic re-bid, rate adjustment and program redesign, as customers seek to contain their benefit costs, particularly in a slow economy. These actions may adversely affect our membership, revenues and operating results.
If we fail to compete effectively in the geographies and product areas in which we operate, including maintaining or increasing membership in our Health Care business, our operating results, financial condition and cash flows could be materially and adversely affected.
Our businesses face significant competition in all of the geographies and product areas in which we operate. In our Health Care business, we compete on the basis of many factors, including perceived overall quality, quality of service, comprehensiveness of coverage, cost (including premium, provider discounts and member out-of-pocket costs), product design, financial stability and ratings, breadth and quality of provider networks, providers available in such networks, and quality of member support and care management programs. Our competitors in our Health Care business include, among others, United HealthGroup, Inc., Anthem, Inc., Humana Inc., Cigna Corporation, WellCare Health Plans, Inc., Centene Corporation, Health Net, Inc., Kaiser Permanente, health system owned health plans, and numerous for-profit and not-for-profit organizations operating under licenses from the Blue Cross and Blue Shield Association. Additional competitors in our businesses include other types of medical and dental provider organizations, various specialty service providers (including pharmacy benefit management services providers), health care consultants, integrated health care delivery organizations, third-party administrators, HIT companies and, for certain plans, programs sponsored by the federal or state governments. In particular geographies, competitors may have greater capabilities, resources or membership; a more established reputation; superior supplier or health care professional arrangements; better business relationships; or other factors that give such competitors a competitive advantage. We have begun to compete for sales on Insurance Exchanges and to build a consumer business, where we face additional risks from existing and new competitors (including our vendors) who have lower cost structures, greater experience marketing to consumers and/or who target the higher margin portions of our business. Among our international and HIT competitors, many have longer operating histories, better brand recognition and greater market presence in many of the areas in which we are seeking to expand and more experience at rapidly innovating products. If we do not compete effectively in the geographies and product areas in which we operate, our business, operating results, financial condition and cash flows could be materially and adversely affected.
For more information on these risks, see:
| |
| • | “Our strategy may not be an effective response to the changing dynamics in the health and related benefits industry, or we may not be able to implement our strategy and related strategic projects effectively”, beginning on page 44; |
| |
| • | “Competitive and economic pressures may limit our ability to increase pricing to reflect higher costs or may force us to accept lower margins. If customers elect to self-insure, reduce benefits or adversely renegotiate or amend their agreements with us, our revenues and operating results will be negatively affected”, beginning on page 57; |
| |
| • | “In order to be competitive in the growing marketplace for direct-to-consumer sales and on public and private health insurance exchanges, we will need to create a consumer business and make investments in consumer engagement, reduce our cost structure and face new competitors. If we are unsuccessful, our future growth and profitability may be adversely impacted”, beginning on page 65; |
| |
| • | “If we fail to develop new products, differentiate our products from those of our competitors or demonstrate the value of our products to our customers, our ability to retain or grow profitable membership may be adversely affected”, beginning on page 66; |
| |
| • | “Our competitive position and ability to differentiate our products will be adversely affected if we cannot demonstrate that our products and processes result in our members receiving quality affordable care”, beginning on page 67; |
| |
| • | “Continuing consolidation and integration among providers and other suppliers may increase our medical and other covered benefits costs, make it difficult for us to compete in certain geographies and create new competitors”, beginning on page 68; and |
| |
| • | “We may not be able to compete effectively in the HIT business and earn a profit. Our HIT business increases our risk of patent infringement and other intellectual property litigation and may become subject to significant regulation in the future”, beginning on page 66. |
A number of factors, many of which are beyond our control, contribute to rising health care and other benefit costs. If we are unable to satisfactorily manage our health care and other benefit costs, our operating results and competitiveness will be adversely affected.
A number of factors contribute to rising health care and other benefit costs, including newly insured members entering the health care system, changes in members’ behavior and healthcare utilization patterns, government mandated benefits or other regulatory changes, the aging of the population and other changing demographic characteristics, advances in medical technology, increases in the cost of prescription drugs (including specialty pharmacy drugs such as hepatitis C treatments), direct-to-consumer marketing by pharmaceutical companies, the increasing influence of social media, inflation and government-imposed limitations on Medicare and Medicaid reimbursements to health plans and providers, which have caused the private sector to bear a greater share of increasing health care and other benefits costs over time. Other factors that affect our health care and other benefit costs include changes as a result of Health Care Reform and other changes in the regulatory environment, the shift to a consumer driven business model, implementation of ICD-10, changes in health care practices, general economic conditions (such as inflation and employment levels), new technologies, clusters of high-cost cases, epidemics or pandemics, health care provider and member fraud, and numerous other factors that are or may be beyond our control.
Our operating results and competitiveness depend in large part on our ability to appropriately manage future health care and other benefit costs through underwriting criteria, product design, provider network configuration, negotiation of favorable provider contracts and medical management programs. Our medical cost management programs may not be successful and may have a smaller impact on health care and benefit costs than we expect. The factors described above may adversely affect our ability to predict and manage health care and other benefit costs, which can adversely affect our competitiveness and operating results.
The U.S. federal government and our government customers may reduce funding for health care or other programs, cancel or decline to renew contracts with us, or may make changes that affect the number of persons eligible for certain programs, the services provided to enrollees in such programs, our premiums and our administrative and health care and other benefit costs.
Our revenues from government-funded health and other programs, including our Medicare, Medicaid and dual eligible businesses and our government customers in our Commercial business, are dependent on annual funding by the federal government and/or applicable state or local governments. Federal, state and local governments have the
right to cancel or not to renew their contracts with us on short notice without cause or if funds are not available. Funding for these programs is dependent on many factors outside our control, including general economic conditions, continuing government efforts to contain health care costs and budgetary constraints at the federal or applicable state or local level and general political issues and priorities.
For example, while Health Care Reform significantly expanded the number of people who qualify to enroll in Medicaid beginning in 2014, most states currently face significant budget challenges, several states are currently seeking to reduce their Medicaid expenditures and other states may take similar action. Our government customers also determine the premium levels and other aspects of Medicare, Medicaid and dual eligible programs that affect the number of persons eligible for or enrolled in these programs, the services provided to enrollees under the programs, and our administrative and health care and other benefit costs under these programs. In the past, determinations of this type have adversely affected our financial results from and willingness to participate in such programs, and they may do so again in the future. For example, effective January 1, 2015, we terminated our Insured Medicaid contract in Delaware because we did not believe the premium level was adequate. If a government customer reduces premium levels or increases premiums by less than the increase in our costs (such as by not allowing us to recover applicable Health Care Reform fees, taxes and assessments), and we cannot offset the impact of these actions with supplemental premiums and/or changes in benefit plans, then our business and operating results could be adversely affected. In addition, if states allow certain programs to expire or choose to opt out of Medicaid expansion, we could experience reduced Medicaid enrollment or reduced Medicaid enrollment growth, which would adversely affect our business, revenues and operating results.
In addition, the terms of our disability products often provide that the benefits due to beneficiaries are reduced by the amount of certain federal benefits they receive, most notably Social Security Disability Insurance (“SSDI”) payments. If such payments are suspended or reduced for any reason, including due to funding shortfalls for the SSDI program, our disability payment obligations would be increased accordingly, and such increase could be material.
Our ability to anticipate medical cost trends and achieve appropriate pricing on Insurance Exchanges could adversely affect our operating results. There can be no assurance that the future health care benefit costs of our Insurance Exchange products will not exceed our projections.
Unanticipated increases in our Insurance Exchange product health care benefit costs could adversely affect our operating results. Coverage under Public Exchange products commenced on January 1, 2014. We do not have prior experience with pricing Public Exchange products or utilization of medical and/or other covered services by Public Exchange product members. We have set 2015 premium rates for our Public Exchange products based on our projections, including as to the funding for Health Care Reform’s risk corridors and other premium stabilization programs (which programs provide us with less protection in 2015 than 2014), the health status and quantity of Public Exchange membership and utilization of medical and/or other covered services by Public Exchange product members.
The premium rates for our Insurance Exchange products are set in advance and fixed for one-year periods. As a result, health care benefit costs in excess of the projections reflected in our Insurance Exchange product pricing cannot be recovered in the fixed premium period through higher premiums. Although, assuming they are funded, in certain circumstances, federal risk adjustment mechanisms could help offset health care benefit costs in excess of our projections in our Public Exchange products, the profitability of our Insurance Exchange products is particularly sensitive to the accuracy of our forecasts of health care benefit costs. Those forecasts were made several months before the fixed premium period began, require a significant degree of judgment and are dependent on our ability to detect medical cost trends as well as accuracy.
There can be no assurance regarding the accuracy of the health care benefit cost, membership or other projections reflected in our Insurance Exchange product pricing or that we will receive any payments under the risk corridors or any other federal risk adjustment mechanism with respect to our Public Exchange membership. The risks related to the accuracy of projections reflected in our pricing are magnified by adverse selection among individuals who require or utilize more expensive medical and/or other covered services and legislation, or regulations or
enforcement activity that cause Insurance Exchanges to operate in a manner different than what we projected in setting our Insurance Exchange product premium rates, such as ongoing initiatives in several states to force insurers to allow members to pay insurers less for certain high cost drugs than the amounts assumed in pricing of their Public Exchange products. For additional information on certain of the medical cost trend, pricing and economic conditions risks associated with our Insurance Exchange and other Health Care products, see “We may not be able to accurately forecast health care and other benefit costs, which could adversely affect our operating results. We may not able to obtain appropriate pricing on new or renewal business”, beginning on page 56; and “We may not be able to obtain adequate premium rate increases, which would have an adverse effect on our revenues, medical benefit ratios and operating results and could magnify the adverse impact of increases in health care and other benefit costs and of Health Care Reform assessments, fees and taxes”, beginning on page 47.
Bids for non-Commercial business in our Health Care segment are increasingly subject to challenge, which may adversely affect contracts initially awarded to us and may result in increased costs.
We continue to increase our focus on the non-Commercial portion of our Health Care segment as part of our business diversification efforts, and that portion of our business increased as a percentage of our total business due to the Coventry acquisition in 2013. We are seeking to substantially grow our Medicare, Medicaid and dual eligibles business over the next several years. In many instances, to acquire and retain our non-Commercial business, we must bid against our competitors in an increasingly competitive environment. Winning bids increasingly are being challenged successfully. In cases where our bid is successful, we may incur unreimbursed implementation and other costs to meet contractual deadlines even if we ultimately lose the challenge.
The reserves we hold for expected claims are based on estimates that involve an extensive degree of judgment and are inherently variable. If actual claims exceed our estimates, our operating results could be materially adversely affected and our ability to take timely corrective actions to limit future costs may be limited.
A large portion of health care claims are not submitted to us until after the end of the quarter in which services are rendered by providers to our members. Our reported health care costs payable for any particular period reflect our estimates of the ultimate cost of such claims as well as claims that have been reported to us but not yet paid. We also must estimate the amount of rebates payable under Health Care Reform’s minimum MLR rules and the amounts of payable by us to, and receivable by us from, the U.S. federal government under Health Care Reform’s premium stabilization programs.
Our estimates of health care costs payable are based on a number of factors, including those derived from historical claim experience, but this estimation process also makes use of extensive judgment. Considerable variability is inherent in such estimates, and the accuracy of the estimates is highly sensitive to changes in medical claims submission and processing patterns and/or procedures, changes in membership and product mix, changes in the utilization of medical and/or other covered services, changes in medical cost trends, changes in our medical management practices and the introduction of new benefits and products. We estimate health care costs payable periodically, and any resulting adjustments are reflected in current-period operating results within health care costs. A worsening (or improvement) of health care cost trend rates or changes in claim payment patterns from those that we assumed in estimating health care costs payable at December 31, 2014 would cause these estimates to change in the near term, and such a change could be material.
Furthermore, if we are not able to accurately and promptly anticipate and detect medical cost trends or accurately estimate the cost of incurred but not yet reported claims or reported claims that have not been paid, our ability to take timely corrective actions to limit future costs and reflect our current benefit cost experience in our pricing process may be limited, which would further exacerbate the extent of any negative impact on our operating results. These risks are particularly acute during and following periods (such as calendar years 2010-2013) when utilization of medical and/or other covered services and/or medical cost trends are below recent historical levels and such risks are further magnified by Health Care Reform and other legislation and regulations that limit our ability to price for our projected and/or experienced increases in utilization and/or medical cost trends.
Refer to our discussion of “Critical Accounting Estimates - Health Care Costs Payable” beginning on page 20 for more information.
Our medical membership remains concentrated in certain geographic areas and industries, exposing us to unfavorable changes in local benefit costs, reimbursement rates, competition and economic conditions.
Our medical membership remains concentrated in certain geographic areas in the United States and in certain industries. Unfavorable changes in health care or other benefit costs or reimbursement rates or increased competition in those geographic areas where our membership is concentrated could therefore have a disproportionately adverse effect on our operating results. Our membership has been and may continue to be affected by workforce reductions by our customers due to unfavorable general economic conditions, especially in the U.S. geographies and industries where our membership is concentrated. As a result, we may not be able to profitably grow and diversify our membership geographically, by product type or by customer industry, and our revenue and operating results may be disproportionately affected by adverse changes affecting our customers.
A change in our health care product mix may impact our profit margins.
Our health care products that involve greater potential risk generally tend to be more profitable than administrative services contract products. Individuals and small employer groups are more likely to purchase our higher-risk health care products because such purchasers are generally unable or unwilling to bear greater liability for health care expenditures. Typically, government-sponsored programs also involve our higher-risk health care products and have lower profit margins than our Insured Commercial products. It is not yet clear whether our products sold on the Public Exchanges will be more or less profitable. A shift of enrollees from more profitable products to less profitable products could have a material adverse effect on our operating results.
Extreme events, or the threat of extreme events, could materially increase our health care (including behavioral health), life insurance and disability costs and impact our business continuity. We cannot predict whether or when any such events will occur.
Nuclear, biological or other attacks, whether as a result of war or terrorism, other man-made disasters, natural disasters, epidemics, pandemics and other extreme events can affect the U.S. economy in general, our industry and us specifically. In particular, such extreme events or the threat of such extreme events could result in significant health care (including behavioral health), life insurance and disability costs, which would also be affected by the government’s actions and the responsiveness of public health agencies and other insurers. In addition, our life insurance members and our employees and those of our vendors are concentrated in certain large, metropolitan areas which may be particularly exposed to these events. Such events could adversely affect our business, cash flows, and operating results, and, in the event of extreme circumstances, our financial condition or viability.
Our business could also be adversely affected if we do not maintain adequate procedures to ensure disaster recovery and business continuity during and after such events. Other than obtaining insurance coverage for our facilities and limited reinsurance of our Health Care and/or Group Insurance liabilities, there are few, if any, commercial options through which to transfer the exposure from terrorism or other extreme events away from us.
Risks Related to Our Operations
Unless we are able to develop alternative sources of revenue and earnings and achieve transformational change in our business model, our ability to profitably grow our business could be adversely affected.
We operate in a highly competitive environment and in an industry that is subject to significant ongoing changes from marketplace pressures brought about by public policy forces, Health Care Reform, Insurance Exchanges, customer demands, business consolidations, strategic alliances, new market entrants, legislative and regulatory changes and marketing practices. As a result of Health Care Reform, the declining number of commercially insured people and other factors, our ability to grow profitably through the sale of traditional Insured health care and related benefits products in the United States may be limited. In order to profitably grow our business in the future, we
need to diversify the sources of our revenue and earnings and transform our business model, including through creating a consumer business, making investments in consumer engagement capabilities and our Healthagen technology and other services for health systems and provider organizations (including ACOs and collaborative provider networks), optimizing our business platforms and expanding internationally.
Achieving these goals will require us to devote significant senior management and other resources to acquisitions or other transactions and to develop internally or acquire new products, solutions and technology before any significant revenues or earnings are generated from such initiatives. If we are not able to acquire and/or develop and launch new products and solutions, including internationally, our ability to profitably grow our business could be adversely affected.
We may not be able to effectively manage our general and administrative expenses to competitive levels, which may reduce our membership or profitability, or we may need to implement expense reduction measures that adversely affect our future growth potential.
Our operating results depend in part on our ability to manage our general and administrative expenses to competitive levels while delivering improved customer and member service and expanding our marketplace presence and accomplishing our strategic initiatives, including creating a consumer business. Controlling general and administrative expenses is particularly important in our Health Care businesses that are subject to regulatory changes that may restrict our underwriting margins, such as minimum MLR requirements. We have significant fixed costs, and our ability to reduce variable costs in the short term is limited. We attempt to manage general and administrative expenses by, among other things, reducing the number of products we offer and controlling costs for salaries and related benefits, information technology and other general and administrative costs. However, we may not be successful in achieving the intended benefits of the cost-cutting initiatives we undertake. In addition, these cost saving measures may adversely affect our ability to implement Health Care Reform and other regulatory requirements, attract and retain key employees, maintain robust management practices and controls, implement improvements in technology and achieve our strategic goals, including profitable membership growth. Given the foregoing, we can provide no assurance that we will be able to manage our general and administrative expenses to competitive levels, which may reduce our membership, profitability and operating results and adversely affect our business and future growth potential.
We are dependent on our ability to recruit, retain and develop a very large and diverse workforce. We must transform our culture in order to successfully grow our business.
Our products and services and our operations require a large number of employees, and a significant number of employees have joined us in recent years as a result of our acquisitions and our entry into new businesses. Our success is dependent on our ability to transform our culture, engage our employees and inspire our employees to be open to change, to innovate and to maintain consumer-focus when delivering services to our customers. Our business would be adversely affected if we fail to adequately plan for succession of our executives and senior management, effectively recruit, integrate, retain and develop key talent and/or align our talent with our business needs, particularly given the current environment, which is rapidly changing. While we have succession plans in place and we have employment arrangements with a limited number of key executives, these do not guarantee that the services of these or suitable successor executives will continue to be available to us. In addition, as we expand internationally, we face the challenge of recruiting, integrating, educating, managing, retaining and developing a more culturally diverse workforce.
We have experienced cyber attacks. We can provide no assurance that we will be able to identify, prevent or contain the effects of such attacks or other cybersecurity risks or threats in the future.
We have experienced a variety of cyber attacks, and we expect to continue to experience cyber attacks going forward. Among other things, we have experienced automated attempts to gain access to our public facing networks, brute force and distributed denial of service attacks, attempted virus infections, mass reconnaissance attempts, malware or injection attempts, phishing, PHP injection and cross-site scripting. Although the impact of such attacks has not been material through December 31, 2014, we can provide no assurance that we will be able to
identify, prevent or contain the effects of such attacks or other cybersecurity risks or threats in the future. As we expand our Healthagen® business, including through our growth of ACS, Medicity, and Active Health, increase the amount of information we make available to members, consumers and providers on mobile devices, expand our use of vendors, expand internationally and expand our use of social media, our exposure to these data security and related cybersecurity risks, including the risk of undetected attacks, damage, loss or unauthorized disclosure or access to and/or disruption of our systems and the customer, member, provider, employee, ACO, vendor and other third party information they contain, increases, and the cost of attempting to protect against these risks also increases.
The costs of attempting to protect against the foregoing risks and the costs of responding to a cyber-incident are significant. Following a cyber-incident, our remediation efforts may not be successful, and a cyber-incident could result in interruptions, delays or cessation of service, and loss of existing or potential customers. In addition, breaches of our security measures and the unauthorized dissemination of sensitive personal information or proprietary information or confidential information about us, our customers or other third-parties, could expose our customers’ private information and our customers to the risk of financial or medical identity theft, or expose us or other third parties to a risk of loss or misuse of this information, and result in investigations, regulatory enforcement actions, material fines and penalties, loss of customers, litigation or other actions which could have a material adverse effect on our business, brand, reputation, cash flows and operating results.
Our business success and operating results depend in part on effective information technology systems and on continuing to develop and implement improvements in technology.
We have many different information and other technology systems supporting our businesses, and we have more systems supporting our businesses as a result of the Coventry, InterGlobal and bSwift acquisitions. Our businesses depend in large part on these systems to adequately price our products and services; accurately establish reserves, process claims and report financial results; and interact with providers, employer plan sponsors, members and vendors, including our PBM services suppliers, in an efficient and uninterrupted fashion. Certain of our technology systems (including software) are older, legacy systems that are less flexible, less efficient and require a significant ongoing commitment of capital and human resources to maintain, protect and enhance them and to integrate them with our other systems. We must re-engineer and reduce the number of these systems to meet changing consumer and vendor preferences and needs and improve our productivity. We also need to develop or acquire new technology systems or modify certain of our existing systems to support the consumer business we are creating and/or to meet current and developing industry and regulatory standards, including with regard to minimum MLR rebates, Public Exchanges, and other aspects of Health Care Reform, and Private Exchanges, and to keep pace with continuing changes in information processing technology and emerging cybersecurity risks and threats. If we fail to achieve these objectives, our ability to profitably grow our business and/or our operating results may be adversely affected.
Our business strategy involves providing customers with differentiated, easy to use, secure products and solutions that leverage information to meet customer needs. The types of technology and levels of service that are acceptable to customers and members today will not necessarily be acceptable in the future, requiring us to anticipate and meet marketplace demands for technology. Our success therefore is dependent in large part on our ability, within the context of a limited budget of human resources and capital and our existing business relationships, to timely secure, integrate, develop, redesign and enhance our technology systems that support our business strategy initiatives and processes in a compliant, secure, and cost and resource efficient manner. Integration of our recent acquisitions, including Coventry, InterGlobal and bSwift, increases these challenges, and we may not be successful in integrating various systems in a timely or cost-effective manner.
Information technology projects are long-term in nature and may take longer to complete and cost more than we expect and may not deliver the benefits we project once they are complete. If we do not effectively and efficiently secure, manage, integrate and enhance our technology portfolio, we could, among other things, have problems determining health care cost and other benefit cost estimates and/or establishing appropriate pricing, meeting the needs of providers, employer plan sponsors and members, operating our consumer business or keeping pace with industry and regulatory standards, and our operating results may be adversely affected.
In order to remain competitive, we must further integrate our businesses, processes and systems. Pursuing multiple initiatives simultaneously could make this integration significantly more challenging.
Many of our businesses, processes and systems, both those we have acquired and those we have developed or are developing, are not integrated, are complex or require disproportionate resources in order to work together effectively. Businesses, processes and systems that are excessively complex or are not effectively integrated may adversely affect our ability to compete by, among other things, increasing our costs relative to competitors, reducing our flexibility and limiting our ability to react quickly to market opportunities or changing circumstances. Accordingly, we must effectively and efficiently simplify and integrate these businesses, processes and systems to meet changing consumer and vendor needs and improve our productivity. This task is significantly more difficult when we pursue multiple transactions or other initiatives, such as significant acquisitions (including the Coventry acquisition), strategic alliances, joint ventures and multi-year strategic projects (including creating our consumer business and implementing new provider support programs), simultaneously. Our existing business partnership relationships and a limited budget of human resources and capital present further challenges.
If we are unable to successfully simplify and integrate our businesses, processes and systems, including those from acquisitions (such as Coventry, InterGlobal and bSwift), to realize anticipated economic and other benefits in a timely manner, it could result in substantial costs or delays and adversely affect our business, operations and operating results.
Sales of our products and services are dependent on our ability to attract and motivate internal sales personnel and independent third-party brokers, consultants and agents. We may be subject to penalties or other regulatory actions as a result of the marketing practices of brokers and agents selling our products.
Our products are sold primarily through our sales personnel, who frequently work with independent brokers, consultants and agents who assist in the production and servicing of business. The independent brokers, consultants and agents generally are not dedicated to us exclusively and may frequently recommend and/or market health care benefits products of our competitors. Accordingly, we must compete intensely for their services and allegiance. Our sales could be adversely affected if we are unable to attract, retain or motivate sales personnel and third-party brokers, consultants and agents, or if we do not adequately provide support, training and education to this sales network regarding our complex product portfolio, or if our sales strategy is not appropriately aligned across distribution channels. This risk is heightened as we create our consumer business and our business model evolves to include a greater focus on consumers and direct-to-consumer sales, such as competing for sales on Insurance Exchanges.
In addition, there have been a number of investigations regarding the marketing practices of brokers and agents selling health care and other insurance products and the payments they receive. These investigations have resulted in enforcement actions against companies in our industry and brokers and agents marketing and selling those companies’ products. For example, CMS and state departments of insurance have increased their scrutiny of the marketing practices of brokers and agents who market Medicare products. These investigations and enforcement actions could result in penalties and the imposition of corrective action plans and/or changes to industry practices, which could adversely affect our ability to market our products.
We face a wide range of risks, and our success depends on our ability to identify, prioritize and appropriately manage our enterprise risk exposures.
As a large company operating in multiple complex industries and in a growing number of countries, we encounter a variety of risks. The risks we face include, among other matters, the range of industry, competitive, regulatory, financial, operational or external risks identified in this “Forward Looking Information/ Risk Factors” discussion. We continue to devote resources to further develop and integrate our enterprise-wide risk management processes. Failure to identify, prioritize and appropriately manage or mitigate these risks, including risk concentrations across different businesses (e.g., Insured vs. ASC) industries, segments, customers and geographies, can adversely affect
our operating results, our ability to retain or grow business, or, in the event of extreme circumstances, our financial condition or business operations.
We also face other risks that could adversely affect our business, operating results or financial condition, which include:
| |
| • | Health care benefits provider fraud that is not prevented or detected and impacts our medical cost trends or those of our self-insured customers. In addition, in an uncertain economic environment, whether in the United States or abroad, our businesses may see increased fraudulent claims volume, which may lead to additional costs because of an increase in disputed claims and litigation; |
| |
| • | Assessments under guaranty fund laws for obligations of insolvent insurance companies (including Penn Treaty Network America Insurance Company and one of its subsidiaries), HMOs and other payors to policyholders and claimants; |
| |
| • | Failure of our corporate governance policies or procedures, for example significant financial decisions being made at an inappropriate level in our organization; |
| |
| • | Inappropriate application of accounting principles or a significant failure of internal control over financial reporting, which could lead to a restatement of our financial results and/or a deterioration in the soundness and accuracy of our reported financial results; |
| |
| • | Financial loss from inadequate insurance coverage due to self-insurance levels or unavailability of insurance and reinsurance coverage for credit or other reasons; |
| |
| • | Failure to protect our proprietary information, including as a result of cyber-attacks on us, one or more providers and/or one or more of our vendors; and |
| |
| • | Failure to adequately manage our run-off businesses and/or our financial exposure to businesses we have sold. |
Risks Related to Customer Perceptions of our Products and Services
In order to be competitive in the growing marketplace for direct-to-consumer sales and on public and private health insurance exchanges, we will need to create a consumer business and make investments in consumer engagement, reduce our cost structure and face new competitors. If we are unsuccessful, our future growth and profitability may be adversely impacted.
Historically, employers have been our most significant customers. Our direct-to-consumer sales have been limited, and our individual Health Care business has been small relative to the other businesses in our Health Care segment. We are creating a consumer business, and we are now competing for sales on Insurance Exchanges, which are projected to increase as a percentage of our Health Care business over time. To create our consumer business and compete effectively on Insurance Exchanges, we will be required to develop or acquire the technology systems and tools and talent necessary to interact with Insurance Exchanges and engage individual consumers using Insurance Exchanges and social media, increase our focus on individual consumers and expand and improve our consumer-focused sales and marketing channels, customer interfaces, customer service and product offerings.
We also will have to respond to pricing and other actions taken by existing competitors and regulators as well as potentially disruptive new entrants which could reduce our profit margins. Due to the price transparency provided by Insurance Exchanges, in the market for individual health insurance we face competitive pressures from existing and new competitors (including our vendors) who have lower cost structures. Other competitors may bring their consumer products to market more quickly, have greater experience marketing to consumers and/or may be targeting the higher margin portions of our business. These risks may be enhanced if employers shift to defined contribution health care benefits plans and make greater utilization of Private Exchanges or encourage their employees to purchase health insurance on the Public Exchanges. We can provide no assurance that we will be able to create a successful or profitable consumer business or compete successfully on Public Exchanges or Private Exchanges or that we will be able to benefit from any opportunities presented by Public Exchanges or Private Exchanges. If we do not create a competitive consumer business, are not competitive on these Insurance Exchanges or are unsuccessful in reducing our cost structure, our future growth and profitability may be adversely impacted.
We may not be able to compete effectively in the HIT business and earn a profit. Our HIT business increases our risk of patent infringement and other intellectual property litigation and may become subject to significant regulation in the future.
With our 2014 acquisition of bSwift, our 2011 acquisition of Medicity and our current focus on consumer engagement, ACOs, collaborative provider networks and optimizing our business platforms, we have increased our commitment to HIT products and solutions, a business that is rapidly changing and highly competitive. There is no assurance that we will be able to successfully adapt to changes to the HIT marketplace, or compete effectively and earn a profit in our HIT business. Our technology products and solutions may not operate as intended. Moreover, we may not have identified and mitigated, or be able to identify and mitigate, the significant risks of pursuing the HIT business, including the risk that we will be unable to protect our proprietary rights and the risks of patent infringement and other intellectual property litigation against us. Certain of our HIT products and/or solutions are subject to the patent litigation, which is often associated with significant litigations costs, damages and/or injunctions.
In addition, although the HIT industry is not currently subject to significant regulation, we face an uncertain and rapidly evolving federal, state and international legislative and regulatory framework and certain of our HIT products and/or solutions could be subject to FDA regulation. New legislation and/or regulation may make it difficult to achieve and maintain compliance and could adversely affect both our ability to compete in the HIT business and the operating results of our HIT business.
If we fail to develop new products, differentiate our products from those of our competitors or demonstrate the value of our products to our customers, our ability to retain or grow profitable membership may be adversely affected.
We operate in a quickly evolving industry. Our customers generally, and our larger customers in particular, are well-informed and organized and, along with our individual customers, can easily move between us and our competitors. This requires us to differentiate our products and solutions, anticipate changes in customer preferences and innovate and deliver new and existing products and solutions that demonstrate value to our customers, particularly in response to marketplace changes from public policy. Any failure to do so may adversely affect our ability to retain or grow profitable membership, which can adversely affect our operating results.
Our reputation is one of our most important assets; negative public perception of the health and related benefits industry, or of the industry’s or our practices, can adversely affect our operating results.
The health and related benefits industry regularly is subject to negative publicity, including as a result of the ongoing public debate over Health Care Reform, actual or perceived shortfalls regarding the industry’s or our own products and/or business practices (including social media activities). This risk will increase further as we continue to implement significant increases in premium rates to price for the expanded benefits required by, and the fees, assessments and taxes imposed by, Health Care Reform and any acceleration in medical cost inflation. This risk may be increased as states and the federal government implement and continue to debate Health Care Reform, as we continue to offer products (including products for people who are eligible for Medicaid or dually eligible for Medicare and Medicaid) beyond those in our core Commercial business and as our business model becomes more focused on consumers and direct-to-consumer sales, including as a result of us creating a consumer business and competing for sales on Insurance Exchanges. Negative publicity of the health and related benefits industry in general, or Aetna or its key vendors in particular, can further increase our costs of doing business and adversely affect our operating results and our stock price by:
| |
| • | Adversely affecting the Aetna brand; |
| |
| • | Adversely affecting our ability to market and sell our products and/or services and/or retain our existing customers and members; |
| |
| • | Requiring us to change our products and/or services; and/or |
| |
| • | Increasing the regulatory and legislative requirements with which we must comply. |
If we or our vendors fail to provide our customers with quality service that meets their expectations, our ability to retain and grow our membership will be adversely affected.
Our ability to attract and retain membership is dependent upon providing cost effective, quality customer service operations (such as call center operations, claim processing, outsourced PBM functions, mail order pharmacy prescription delivery, specialty pharmacy prescription delivery, customer case installation and on-line access and tools) that meet or exceed our customers’ and members’ expectations. As we seek to reduce general and administrative expenses, we must balance the potential impact of cost-savings measures on our customer and other service and performance. If we misjudge the effects of such measures, customer and other service may be adversely impacted. We depend on third parties for certain of our customer service, PBM and prescription delivery operations. For example, CVS Health Corporation and Express Scripts provide us with certain PBM services. If we or our vendors fail to provide service that meets our customers’ and members’ expectations, we may have difficulty retaining or growing profitable membership, which can adversely affect our operating results. For example, noncompliance with any privacy or security laws or regulations or any security breach involving one of our third party vendors could have a material adverse effect on our businesses, operating results and/or reputation.
Our competitive position and ability to differentiate our products will be adversely affected if we cannot demonstrate that our products and processes result in our members receiving quality affordable care.
One of the key factors on which we compete for customers is the degree to which our products and processes (including our disease management and patient safety programs and our provider credentialing and other quality of care and information management initiatives) result in our members receiving quality affordable care from providers, our vendors (including our PBM services suppliers) and us. If our products and process do not result in our members receiving quality affordable care, or if we are unable to demonstrate that our members receive quality affordable care, then our competitive position and ability to differentiate our product and/or solution offerings from those of our competitors would be adversely affected, which in turn could adversely affect our operating results.
Risks Related to Our Relationships with Providers, Suppliers and Vendors
If we are unable to enter into collaborative risk-sharing agreements with health care providers on satisfactory terms, it may have an adverse effect on our ability to enhance our provider networks, contain our medical costs, grow our business and/or develop alternative sources of revenue and earnings.
We are seeking to enhance our health care provider networks by entering into collaborative risk-sharing arrangements, including ACOs, with health care providers. Providers’ willingness to enter these arrangements with us depends upon, among other things, our ability to provide them with up to date quality of care data to support these value-based contracts. These arrangements are designed to give providers incentives to engage in population health management and optimize delivery of health care to our members. These arrangements also may allow us to expand into new geographies, target new customer groups, increase membership, reduce medical costs and, if we provide technology or other services to the relevant health system or provider organization, may contribute to our revenue and earnings from alternative sources. If we fail to attract health care providers to such arrangements, or are less successful at implementing such arrangements than our competitors, our medical costs may not be competitive and may be higher than we project, our attractiveness to customers may be reduced, we may lose or be unable to grow membership, and our ability to profitably grow our business and/or our operating results may be adversely affected.
While we believe ACOs and other new health care provider organizational structures present opportunities for us, the implementation of our ACS and ACO strategies may not achieve the intended results, which could adversely affect our operating results and cash flows.
Continuing consolidation and integration among providers and other suppliers may increase our medical and other covered benefits costs, make it difficult for us to compete in certain geographies and create new competitors.
Hospitals and other provider and health systems continue to consolidate across the industry. While this consolidation is expected to increase efficiency and has the potential to improve the delivery of health care services, it may also reduce competition and the number of potential contracting parties in certain locations. These health systems are also increasingly considering forming health plans to directly offer health insurance in competition with us, a process that has been accelerated by Health Care Reform, including Insurance Exchanges. In addition, ACOs, practice management companies, consolidation among and by integrated health systems and other changes in the organizational structures that physicians, hospitals and other health care providers adopt may change the way these providers interact with us and may change the competitive landscape in which we operate. These changes may increase our medical and other covered benefits costs, may affect the way we price our products and services and estimate our medical and other covered benefits costs and may require us to change our operations, including by withdrawing from certain geographies where we do not have a significant presence or are unable to contract with providers on acceptable terms. Each of these changes may adversely affect our business and operating results.
Our operating results may be adversely affected if we are unable to contract with providers on competitive terms and develop and maintain attractive networks with high quality providers.
Our operating results are dependent in part upon our ability simultaneously to contract competitively with and develop and maintain favorable relationships with hospitals, physicians, pharmaceutical benefit management service providers, pharmaceutical manufacturers and other health care benefits providers. Our relationships with providers are affected by the rates we pay them for services rendered to our members (including financial incentives to deliver quality services in a cost-effective manner), by our business practices and processes, by our acquisitions, and by our payment and other provider relations practices (including whether we include providers in the various provider network options we make available to our customers). Our relationships with providers are also affected by factors that impact these providers, but are not directly related to us, such as consolidations and strategic relationships among providers and/or among our competitors, changes in Medicare and/or Medicaid reimbursement levels to health care providers (including reductions due to the ATRA and sequestration), and increasing revenue and other financial pressures on providers, including ongoing reductions by CMS and state governments (including reductions due to the ATRA and sequestration) in amounts payable to providers, particularly hospitals, for services provided to Medicare and Medicaid enrollees.
The breadth and quality of our networks of available providers and our ability to offer different provider network options are important factors when customers consider our products and services. Our customers, particularly our self-insured customers, also consider our hospital and other medical provider discounts when evaluating our products and services. For certain of our businesses, we must maintain provider networks that satisfy applicable access to care and/or network adequacy requirements. Regulators also consider the breadth and nature of our provider networks when assessing whether such networks meet network adequacy requirements which, in some cases, are becoming more stringent. Our contracts with providers generally may be terminated by either party without cause on short notice.
The failure to maintain or to secure new cost-effective health care provider contracts, including as a result of our efforts to integrate our provider networks following the Coventry acquisition, may result in a loss of or inability to grow membership, higher health care or other benefits costs (which we may not be able to reflect in our pricing due to rate reviews or other factors), health care provider network disruptions, less desirable products for our customers and/or difficulty in meeting regulatory or accreditation requirements, any of which could adversely affect our operating results.
We may experience increased medical and other benefit costs, litigation risk and customer and member dissatisfaction when providers that do not have contracts with us render services to our members.
Some providers that render services to our members do not have contracts with us. In those cases, we do not have a pre-established understanding with these providers as to the amount of compensation that is due to them for services rendered to our members. In some states, the amount of compensation due to these non-participating providers is defined by law or regulation, but in most instances it is either not defined or it is established by a standard that is not clearly translatable into dollar terms. In such instances providers may believe that they are underpaid for their services and may either litigate or arbitrate their dispute with us or try to recover the difference between what we have paid them and the amount they charged us from our members, which may result in customer and member dissatisfaction. For example, since 2007, we have been in class litigation with non-participating providers over our payments to them, and during 2009, we settled a matter with the New York Attorney General that caused us to transition to different databases to determine the amount we pay non-participating providers under certain benefit plan designs. Such disputes may cause us to pay higher medical or other benefit costs than we projected.
Certain of these matters are described in more detail in “Litigation and Regulatory Proceedings” in Note 18 of Notes to Consolidated Financial Statements beginning on page 127.
We could become overly dependent on key service providers, which could expose us to operational risks and cause us to lose core competencies. If their services become unavailable, we may experience service disruptions, reduced service quality and increased costs and may be unable to meet our obligations to our customers.
We contract with various third parties to perform certain functions and services and provide us with certain information technology systems. These third parties include our PBM services suppliers, information technology system providers, independent practice associations, accountable care organizations and call center and claim and billing service providers. Certain of these third parties provide us with significant portions of our requirements, and we could become overly dependent on key vendors, which could cause us to lose core competencies. Certain third parties to whom we delegated selected functions, such as independent practice associations and specialty services providers, have experienced financial difficulties, including bankruptcy. Furthermore, certain legislative authorities have in recent years discussed or proposed legislation that would restrict outsourcing. A termination of our agreements with, or disruption in the performance of, one or more of these service providers could result in service disruption or unavailability, reduced service quality and effectiveness, increased or duplicative costs, an inability to meet our obligations to our customers or require us to seek alternative service providers on less favorable contract terms, any of which can adversely affect our business, reputation and/or operating results. Furthermore, where our arrangements with these service providers are not acceptable to our customers, we must make alternate arrangements, which may be more costly and difficult to implement.
In particular, we have entered into agreements with our PBM services suppliers to provide us and certain of our customers and members with certain PBM services. Our operating results would be adversely affected if we cannot successfully complete the implementation of our PBM agreement with CVS Health Corporation on a timely basis and/or achieve projected operating efficiencies from the agreement. If our PBM agreement with CVS Health Corporation or our agreements with our other PBM services supplier were to terminate for any reason or one of our PBM services supplier’s ability to perform their respective obligations under their agreements with us were impaired, we may not be able to find an alternative supplier in a timely manner or on acceptable financial terms. As a result, our costs may increase, we would not realize the anticipated benefits of our PBM agreement with CVS Health Corporation or our other agreements for PBM services (including projected operating efficiencies), and we may not be able to meet the full demands of our customers, any of which could have a material adverse effect on our business, reputation and/or operating results.
Risks Related to Our Acquisitions and International Operations
We expect to continue to pursue acquisitions and other inorganic growth opportunities, which may be unsuccessful, cause us to assume unanticipated liabilities, disrupt our existing business, be dilutive or lead us to assume significant debt, among other things.
We completed the bSwift and Interglobal group acquisitions in 2014 and the Coventry acquisition in 2013 and expect to continue to pursue acquisitions, joint ventures, strategic alliances and other inorganic growth opportunities as part of our growth strategy. In addition to integration risks, some other risks we face with respect to acquisitions and other inorganic growth strategies include:
| |
| • | We frequently compete with other firms, some of which may have greater financial and other resources and a greater tolerance for risk, to acquire attractive companies; |
| |
| • | The acquired businesses may not perform as projected; |
| |
| • | The goodwill or other intangible assets established as a result of our acquisitions may be incorrectly valued or may become non-recoverable; |
| |
| • | We may not obtain the projected synergies as we integrate the acquired businesses (including Coventry); |
| |
| • | We may assume unanticipated liabilities, including those that were not disclosed to us or which we underestimated; |
| |
| • | We may experience difficulties in integrating acquired businesses into our existing operations (including our internal control environment), be unable to integrate acquired businesses successfully or as quickly as expected, and be unable to realize anticipated economic, operational and/or other benefits in a timely manner or at all, which could result in substantial costs and delays or other operational, technical or financial problems; |
| |
| • | The acquired businesses, or the pursuit of other inorganic growth strategies, could disrupt or compete with our existing businesses, distract management, result in the loss of key employees, divert resources, result in tax costs or inefficiencies and make it difficult to maintain our current business standards, controls, information technology systems, policies, procedures and performance; |
| |
| • | We may finance future acquisitions and other inorganic growth strategies by issuing common stock for some or all of the purchase price, which would dilute the ownership interests of our shareholders; |
| |
| • | We may incur significant debt (whether to finance acquisitions or by assuming debt from the businesses we acquire); |
| |
| • | We may not have the expertise to manage and profitably grow the businesses we acquire, and we may need to rely on the retention of key personnel and other suppliers of companies we acquire, which may be difficult to accomplish; |
| |
| • | We may enter into merger or purchase agreements but, due to reasons within or outside our control, fail to complete the related transactions, which could result in termination fees or other penalties that could be material, material disruptions to our business and operations and negatively affect our reputation; |
| |
| • | In order to complete a proposed acquisition, we may be required to divest certain portions of our business; and |
| |
| • | We may be involved in litigation related to mergers or acquisitions, which may be costly to defend and may result in adverse rulings against us that could be material. |
As we expand our international operations, we will increasingly face political, legal and compliance, operational, regulatory, economic and other risks that we do not face or are more significant than in our domestic operations. Our exposure to these risks is expected to increase.
As we expand our international operations, including through our 2014 acquisition of the InterGlobal group, we will increasingly face political, legal and compliance, operational, regulatory, economic and other risks that we do not face or that are more significant than in our domestic operations. These risks vary widely by country and include varying regional and geopolitical business conditions and demands, government intervention and censorship, discriminatory regulation, nationalization or expropriation of assets and pricing constraints. Our international products need to meet country-specific customer and member preferences as well as country-specific legal requirements, including those related to privacy, data storage, location, protection and security.
Our international operations increase our exposure to, and require us to devote significant management resources to implement controls and systems to comply with, the privacy laws of non-U.S. jurisdictions and the anti-bribery, anti-corruption and anti-money laundering laws of the United States (including the FCPA) and the United Kingdom (including the Bribery Act 2010) and similar laws in other jurisdictions. Implementing our compliance policies, internal controls and other systems upon our expansion into new countries and geographies may require the investment of considerable management time and management, financial and other resources over a number of years before any significant revenues or profits are generated. Violations of these laws and regulations could result in fines, criminal sanctions against us, our officers or employees, restrictions or outright prohibitions on the conduct of our business, and significant reputational harm. We must regularly reassess the size, capability and location of our global infrastructure and make appropriate changes, and must have effective change management processes and internal controls in place to address changes in our business and operations. Our success depends, in part, on our ability to anticipate these risks and manage these difficulties, and the failure to do so could have a material adverse effect on our business, operating results, financial condition, reputation and/or long-term growth.
Our international operations require us to overcome logistical and other challenges based on differing languages, cultures, legal and regulatory schemes and time zones. Our international operations encounter labor laws, customs and employee relationships that can be difficult, less flexible than in our domestic operations and expensive to modify or terminate. In some countries we are required to, or choose to, operate with local business partners, which requires us to manage our partner relationships and may reduce our operational flexibility and ability to quickly respond to business challenges.
In some countries we may be exposed to currency exchange controls or other restrictions that prevent us from transferring funds internationally or converting local currencies into U.S. dollars or other currencies. Fluctuations in foreign currency exchange rates may have an impact on our revenues, operating results and cash flows from our international operations. Some of our operations are, and are increasingly likely to be, in emerging markets where these risks are heightened. Any measures we may implement to reduce the effect of volatile currencies and other risks on our international operations may not be effective.
Our exposure to all of the above risks is expected to increase as we seek to grow our foreign operations over the next several years.
Financial Risks
We would be adversely affected if we do not effectively deploy our capital. Downgrades or potential downgrades in our credit ratings, should they occur, could adversely affect our reputation, business, cash flows, financial condition and operating results.
Our operations generate significant capital, and we have the ability to raise additional capital. The manner in which we deploy our capital, including investments in our businesses, our operations (such as information technology and other strategic and capital projects), dividends, acquisitions, share and/or debt repurchases, reinsurance or other capital uses, impacts our financial strength, claims paying ability and credit ratings issued by recognized rating organizations. Credit ratings issued by nationally-recognized organizations are broadly distributed and generally used throughout our industry. Our ratings reflect each rating organization’s opinion of our financial strength, operating performance and ability to meet our debt obligations or obligations to our insureds. We believe our credit ratings and the financial strength and claims paying ability of our principal insurance and HMO subsidiaries are important factors in marketing our products to certain of our customers. In addition, our credit ratings impact the cost and availability of future borrowings, and accordingly our cost of capital.
Each of the ratings organizations reviews our ratings periodically, and there can be no assurance that our current ratings will be maintained in the future. Among other things, our ratings may be affected by the assumption of debt in connection with an acquisition. For example, one of the nationally-recognized rating agencies reduced its rating of our long-term senior debt upon the closing of the Coventry acquisition. Downgrades or potential downgrades in
our ratings, should they occur, could adversely affect our reputation, business, cash flows, financial condition and operating results.
Adverse conditions in the U.S. and global capital markets can significantly and adversely affect the value of our investments in debt and equity securities, mortgage loans, alternative investments and other investments, our operating results and/or our financial condition.
The global capital markets, including credit markets, continue to experience volatility and uncertainty. As an insurer, we have a substantial investment portfolio that supports our policy liabilities and surplus and is comprised largely of debt securities of issuers located in the United States. As a result, the income we earn from our investment portfolio is largely driven by the level of interest rates in the United States, and to a lesser extent the international financial markets; and volatility, uncertainty and/or disruptions in the global capital markets, particularly the United States credit markets, and governments’ monetary policy, particularly United States monetary policy, can significantly and adversely affect the value of our investment portfolio, our operating results and/or our financial condition by:
| |
| • | Significantly reducing the value and/or liquidity of the debt securities we hold in our investment portfolio and creating realized capital losses that reduce our operating results and/or unrealized capital losses that reduce our shareholders’ equity; |
| |
| • | Keeping interest rates low on high-quality short-term or medium-term debt securities (such as we have experienced during recent years) and thereby materially reducing our net investment income and operating results as the proceeds from securities in our investment portfolio that mature or are otherwise disposed of continue to be reinvested in lower yielding securities; |
| |
| • | Reducing the fair values of our investments if interest rates rise; |
| |
| • | Causing non-performance or defaults on their obligations to us by third parties, including customers, issuers of securities in our investment portfolio, mortgage borrowers and/or reinsurance and/or derivatives counterparties; |
| |
| • | Making it more difficult to value certain of our investment securities, for example if trading becomes less frequent, which could lead to significant period-to-period changes in our estimates of the fair values of those securities and cause period-to-period volatility in our net income and shareholders’ equity; |
| |
| • | Reducing our ability to issue short-term debt securities at attractive interest rates, thereby increasing our interest expense and decreasing our operating results; and |
| |
| • | Reducing our ability to issue other securities. |
Although we seek, within guidelines we deem appropriate, to match the duration of our assets and liabilities and to manage our credit and counterparty exposures, a failure to adequately do so could adversely affect our net income and our financial condition and, in extreme circumstances, our cash flows.
Our pension plan expenses are affected by general financial market conditions, interest rates and the accuracy of actuarial estimates of future benefit costs.
We have pension plans that cover a large number of current employees and retirees. Even though our employees stopped earning future pension service credits in the Aetna Pension Plan effective December 31, 2010, the Aetna Pension Plan continues to operate. Therefore, unfavorable investment performance, interest rate changes or changes in estimates of benefit costs, if significant, could adversely affect our operating results or financial condition by significantly increasing our pension plan expense and obligations.
Selected Financial Data
|
| | | | | | | | | | | | | | | | | | | |
| | For the Years Ended December 31, |
| (Millions, except per common share data) | 2014 |
| | 2013 |
| | 2012 |
| | 2011 |
| | 2010 |
|
| Total revenue | $ | 58,003.2 |
| | $ | 47,294.6 |
| | $ | 36,599.8 |
| | $ | 33,782.2 |
| | $ | 34,252.0 |
|
| Net income attributable to Aetna | 2,040.8 |
| | 1,913.6 |
| | 1,657.9 |
| | 1,985.7 |
| | 1,766.8 |
|
| Net realized capital gains (losses), net of tax | 51.9 |
| | (6.8 | ) | | 71.0 |
| | 109.1 |
| | 183.8 |
|
| Total assets | 53,402.1 |
| | 49,764.8 |
| | 41,387.5 |
| | 38,593.1 |
| | 37,739.4 |
|
| Short-term debt | 500.0 |
| | — |
| | — |
| | 425.9 |
| | — |
|
| Long-term debt | 8,081.3 |
| | 8,252.6 |
| | 6,481.3 |
| | 3,977.7 |
| | 4,382.5 |
|
| Total Aetna shareholders’ equity | 14,482.6 |
| | 14,025.5 |
| | 10,405.8 |
| | 10,120.2 |
| | 9,890.8 |
|
| | | | | | | | | | |
| Per common share data: | | | | | | | | | |
| Cumulative annual dividends declared | $ | .925 |
| (1) | $ | .825 |
| (1) | $ | .725 |
| (1) | $ | .625 |
| (1) | $ | .04 |
|
| Net income attributable to Aetna: | | | | | | | | | |
| Basic | 5.74 |
| | 5.38 |
| | 4.87 |
| | 5.33 |
| | 4.25 |
|
| Diluted | 5.68 |
| | 5.33 |
| | 4.81 |
| | 5.22 |
| | 4.18 |
|
| | | | | | | | | | |
| |
(1) | In February 2011, we announced that our Board of Directors (our “Board”) increased our cash dividend to shareholders to $.15 per share and moved us to a quarterly dividend payment cycle. In December 2011, our Board increased our quarterly cash dividend to shareholders to $.175 per common share. In November 2012, our Board increased our quarterly cash dividend to shareholders to $.20 per common share. In December 2013, our Board increased our quarterly cash dividend to shareholders to $.225 per common share. In November 2014, our Board increased our quarterly cash dividend to $.25 per common share. |
See Notes to Consolidated Financial Statements and MD&A for significant events affecting the comparability of results as well as material uncertainties regarding Aetna’s future financial condition and results of operations. We acquired Coventry Health Care, Inc. (“Coventry”) in May 2013, which impacts the comparability of financial results for the years ended December 31, 2014 and 2013 to prior periods.
Consolidated Statements of Income
|
| | | | | | | | | | | | | | |
| | | | | For the Years Ended December 31, |
| (Millions, except per common share data) | | 2014 |
| | 2013 |
| | 2012 |
|
| Revenue: | | | | | | | | |
| Health care premiums | | | | $ | 49,562.2 |
| | $ | 39,659.7 |
| | $ | 28,872.0 |
|
| Other premiums | | | | 2,186.3 |
| | 2,077.9 |
| | 1,902.0 |
|
| Group annuity contract conversion premium | | | | — |
| | 99.0 |
| | 941.4 |
|
Fees and other revenue (1) | | | | 5,228.4 |
| | 4,550.5 |
| | 3,853.5 |
|
| Net investment income | | | | 945.9 |
| | 916.3 |
| | 922.2 |
|
| Net realized capital gains (losses) | | | | 80.4 |
| | (8.8 | ) | | 108.7 |
|
| Total revenue | | | | 58,003.2 |
| | 47,294.6 |
| | 36,599.8 |
|
| Benefits and expenses: | | | | | | | | |
Health care costs (2) | | | | 40,746.7 |
| | 32,896.0 |
| | 23,728.9 |
|
| Current and future benefits | | | | 2,165.0 |
| | 2,251.4 |
| | 2,010.1 |
|
| Benefit expense on group annuity contract conversions | | | | — |
| | 99.0 |
| | 941.4 |
|
| Operating expenses: | | | | | | | | |
| Selling expenses | | | | 1,653.0 |
| | 1,348.6 |
| | 1,105.5 |
|
| General and administrative expenses | | | | 9,184.7 |
| | 7,296.8 |
| | 5,770.9 |
|
| Total operating expenses | | | | 10,837.7 |
| | 8,645.4 |
| | 6,876.4 |
|
| Interest expense | | | | 329.3 |
| | 333.7 |
| | 268.8 |
|
| Amortization of other acquired intangible assets | | | | 243.4 |
| | 214.6 |
| | 142.0 |
|
| Loss on early extinguishment of long-term debt | | | | 181.2 |
| | — |
| | 84.9 |
|
| Reduction of reserve for anticipated future losses | | | | | | | | |
| on discontinued products | | | | — |
| | (86.0 | ) | | — |
|
| Total benefits and expenses | | | | 54,503.3 |
| | 44,354.1 |
| | 34,052.5 |
|
| Income before income taxes | | | | 3,499.9 |
| | 2,940.5 |
| | 2,547.3 |
|
| Income taxes | | | | 1,454.7 |
| | 1,028.6 |
| | 887.5 |
|
| Net income including non-controlling interests | | | | 2,045.2 |
| | 1,911.9 |
| | 1,659.8 |
|
| Less: Net income (loss) attributable to non-controlling interests | | | | 4.4 |
| | (1.7 | ) | | 1.9 |
|
| Net income attributable to Aetna | | | | $ | 2,040.8 |
| | $ | 1,913.6 |
| | $ | 1,657.9 |
|
| Earnings per common share: | | | | | | | | |
| Basic | | | | $ | 5.74 |
| | $ | 5.38 |
| | $ | 4.87 |
|
| Diluted | | | | $ | 5.68 |
| | $ | 5.33 |
| | $ | 4.81 |
|
| | | | | | | | | |
| |
(1) | Fees and other revenue include administrative services contract member co-payments and plan sponsor reimbursements related to our mail order and specialty pharmacy operations of $102 million, $86 million and $79 million (net of pharmaceutical and processing costs of $1.3 billion, $1.1 billion and $1.2 billion) for 2014, 2013 and 2012, respectively. |
| |
(2) | Health care costs have been reduced by Insured member co-payments related to our mail order and specialty pharmacy operations of $107 million, $110 million and $127 million for 2014, 2013 and 2012, respectively. |
Refer to accompanying Notes to Consolidated Financial Statements.
Consolidated Statements of Comprehensive Income
|
| | | | | | | | | | | |
| | | | | | |
| | For the Years Ended December 31, |
| (Millions) | 2014 |
| | 2013 |
| | 2012 |
|
| Net income including non-controlling interests | $ | 2,045.2 |
| | $ | 1,911.9 |
| | $ | 1,659.8 |
|
| Other comprehensive income (loss), net of tax: | | | | | |
Previously impaired debt securities: (1) | | | | | |
| Net unrealized gains (losses) | | | | | |
| ($1.4, $(72.6), and $3.7 pretax) | .9 |
| | (47.2 | ) | | 2.4 |
|
| Less: reclassification of gains (losses) to earnings | | | | | |
| ($.3, $(37.1), and $5.1 pretax) | .2 |
| | (24.1 | ) | | 3.3 |
|
Total previously impaired debt securities (1) | .7 |
| | (23.1 | ) | | (.9 | ) |
| All other securities: | | | | | |
| Net unrealized gains (losses) | | | | | |
| ($364.5, $(803.2), and $468.3 pretax) | 236.9 |
| | (522.1 | ) | | 304.4 |
|
| Less: reclassification of (losses) gains to earnings | | | | | |
| ($(6.6), $(36.5), and $113.8 pretax) | (4.3 | ) | | (23.7 | ) | | 74.4 |
|
| Total all other securities | 241.2 |
| | (498.4 | ) | | 230.0 |
|
| Foreign currency and derivatives: | | | | | |
| Net unrealized (losses) gains | | | | | |
| ($(90.2), $40.6, and $1.4 pretax) | (58.6 | ) | | 26.4 |
| | .9 |
|
| Less: reclassification of gains (losses) to earnings | | | | | |
| ($4.2, $(5.4), and $(5.0) pretax) | 2.7 |
| | (3.5 | ) | | (3.3 | ) |
| Total foreign currency and derivatives | (61.3 | ) | | 29.9 |
| | 4.2 |
|
| Pension and other postretirement employee benefit (“OPEB”) plans: | | | | | |
| Unrealized net actuarial (losses) gains arising during the period | | | | | |
| ($(739.4), $869.3, and $(189.8) pretax) | (480.6 | ) | | 565.1 |
| | (123.4 | ) |
Pension settlement charge (2) | | | | | |
| ($(111.6) pretax) | 72.5 |
| | — |
| | — |
|
| Amortization of net actuarial losses | | | | | |
| ($(47.6), $(77.7), and $(74.7) pretax) | 31.0 |
| | 50.5 |
| | 48.6 |
|
| Amortization of prior service credit | | | | | |
| ($4.0, $4.1, and $4.1 pretax) | (2.7 | ) | | (2.7 | ) | | (2.7 | ) |
| Total pension and OPEB plans | (379.8 | ) | | 612.9 |
| | (77.5 | ) |
| Other comprehensive (loss) income | (199.2 | ) | | 121.3 |
| | 155.8 |
|
| Comprehensive income including non-controlling interests | 1,846.0 |
| | 2,033.2 |
| | 1,815.6 |
|
| Less: Comprehensive income (loss) attributable to non-controlling interests | 4.4 |
| | (1.7 | ) | | 1.9 |
|
| Comprehensive income attributable to Aetna | $ | 1,841.6 |
| | $ | 2,034.9 |
| | $ | 1,813.7 |
|
| | | | | | |
| |
(1) | Represents unrealized (losses) gains on the non-credit related component of impaired debt securities that we do not intend to sell and subsequent changes in the fair value of any previously impaired debt security. |
| |
(2) | During 2014, we recorded a non-cash pension settlement charge of $72.5 million ($111.6 million pretax) in connection with our tax-qualified noncontributory defined benefit pension plan (the “Aetna Pension Plan”). We did not record any non-cash pension settlement charges during 2013 or 2012. Refer to Note 11 beginning on page 109 for additional information on the pension settlement charge. |
Refer to accompanying Notes to Consolidated Financial Statements.
Consolidated Balance Sheets
|
| | | | | | | | | | |
| | | | | At December 31, |
| (Millions) | | 2014 |
| | 2013 |
|
| Assets: | | | | | | |
| Current assets: | | | | | | |
| Cash and cash equivalents | | | | $ | 1,420.4 |
| | $ | 1,412.3 |
|
| Investments | | | | 2,595.2 |
| | 2,063.8 |
|
| Premiums receivable, net | | | | 1,623.0 |
| | 1,331.2 |
|
| Other receivables, net | | | | 2,065.9 |
| | 1,780.8 |
|
| Accrued investment income | | | | 223.9 |
| | 211.1 |
|
| Collateral received under securities loan agreements | | | | 826.9 |
| | 792.6 |
|
| Income taxes receivable | | | | 372.7 |
| | 69.2 |
|
| Deferred income taxes | | | | 443.0 |
| | 521.5 |
|
| Other current assets | | | | 2,193.0 |
| | 1,429.4 |
|
| Total current assets | | | | 11,764.0 |
| | 9,611.9 |
|
| Long-term investments | | | | 22,193.9 |
| | 20,935.0 |
|
| Reinsurance recoverables | | | | 751.4 |
| | 782.7 |
|
| Goodwill | | | | 10,613.2 |
| | 10,227.5 |
|
| Other acquired intangible assets, net | | | | 1,948.3 |
| | 2,094.1 |
|
| Property and equipment, net | | | | 669.8 |
| | 721.9 |
|
| Other long-term assets | | | | 1,130.0 |
| | 1,419.2 |
|
| Separate Accounts assets | | | | 4,331.5 |
| | 3,972.5 |
|
| Total assets | | | | $ | 53,402.1 |
| | $ | 49,764.8 |
|
| | | | | | | |
| Liabilities and shareholders’ equity: | | | | |
| | |
|
| Current liabilities: | | | | |
| | |
|
| Health care costs payable | | | | $ | 5,621.1 |
| | $ | 4,547.4 |
|
| Future policy benefits | | | | 705.9 |
| | 734.4 |
|
| Unpaid claims | | | | 745.3 |
| | 705.4 |
|
| Unearned premiums | | | | 519.5 |
| | 458.7 |
|
| Policyholders’ funds | | | | 1,984.5 |
| | 1,620.3 |
|
| Collateral payable under securities loan and repurchase agreements | | | | 1,028.6 |
| | 792.6 |
|
| Short term debt | | | | 500.0 |
| | — |
|
| Current portion of long-term debt | | | | 229.3 |
| | 387.3 |
|
| Accrued expenses and other current liabilities | | | | 4,022.3 |
| | 3,226.9 |
|
| Total current liabilities | | | | 15,356.5 |
| | 12,473.0 |
|
| Future policy benefits | | | | 6,427.4 |
| | 6,656.8 |
|
| Unpaid claims | | | | 1,650.6 |
| | 1,619.3 |
|
| Policyholders’ funds | | | | 1,163.2 |
| | 1,188.0 |
|
| Long-term debt, less current portion | | | | 7,852.0 |
| | 7,865.3 |
|
| Deferred income taxes | | | | 867.5 |
| | 864.2 |
|
| Other long-term liabilities | | | | 1,201.6 |
| | 1,047.5 |
|
| Separate Accounts liabilities | | | | 4,331.5 |
| | 3,972.5 |
|
| Total liabilities | | | | 38,850.3 |
| | 35,686.6 |
|
| Commitments and contingencies (Note 18) | | | |
|
| |
|
|
| Shareholders’ equity: | | | | | | |
|
| Common stock ($.01 par value; 2.6 billion shares authorized and 349.8 million shares issued | | | | |
|
| and outstanding in 2014; 2.6 billion shares authorized and 362.2 million shares issued and | | | | |
|
| outstanding in 2013) and additional paid-in capital | | 4,542.2 |
| | 4,382.2 |
|
| Retained earnings | | | | 11,051.7 |
| | 10,555.4 |
|
| Accumulated other comprehensive loss | | | | (1,111.3 | ) | | (912.1 | ) |
| Total Aetna shareholders’ equity | | | | 14,482.6 |
| | 14,025.5 |
|
| Non-controlling interests | | | | 69.2 |
| | 52.7 |
|
| Total equity | | | | 14,551.8 |
| | 14,078.2 |
|
| Total liabilities and shareholders’ equity | | | | $ | 53,402.1 |
| | $ | 49,764.8 |
|
| | | | | | | |
Refer to accompanying Notes to Consolidated Financial Statements.
Consolidated Statements of Shareholders’ Equity
|
| | | | | | | | | | | | | | | | | | | | | | | | | | |
| | | | Attributable to Aetna | | | | |
| (Millions) | Number of Common Shares Outstanding |
| | Common Stock and Additional Paid-in Capital |
| | Retained Earnings |
| | Accumulated Other Comprehensive Loss |
| | Total Aetna Shareholders’ Equity |
| | Non-Controlling Interests |
| | Total Equity |
|
| Balance at December 31, 2011 | 349.7 |
| | $ | 962.8 |
| | $ | 10,346.6 |
| | $ | (1,189.2 | ) | | $ | 10,120.2 |
| | $ | 24.4 |
| | $ | 10,144.6 |
|
| Net income | — |
| | — |
| | 1,657.9 |
| | — |
| | 1,657.9 |
| | 1.9 |
| | 1,659.8 |
|
| Other decreases in non- | | | | | | | | | | | | | |
| controlling interest | — |
| | — |
| | — |
| | — |
| | — |
| | (2.9 | ) | | (2.9 | ) |
| Other comprehensive income (Note 9) | — |
| | — |
| | — |
| | 155.8 |
| | 155.8 |
| | — |
| | 155.8 |
|
| Common shares issued for benefit plans, | | | | | | | | | | | | | |
| including tax benefits | 10.2 |
| | 132.8 |
| | — |
| | — |
| | 132.8 |
| | — |
| | 132.8 |
|
| Repurchases of common shares | (32.3 | ) | | (.3 | ) | | (1,417.2 | ) | | — |
| | (1,417.5 | ) | | — |
| | (1,417.5 | ) |
| Dividends declared | — |
| | — |
| | (243.4 | ) | | — |
| | (243.4 | ) | | — |
| | (243.4 | ) |
| Balance at December 31, 2012 | 327.6 |
| | 1,095.3 |
| | 10,343.9 |
| | (1,033.4 | ) | | 10,405.8 |
| | 23.4 |
| | 10,429.2 |
|
| Net income (loss) | — |
| | — |
| | 1,913.6 |
| | — |
| | 1,913.6 |
| | (1.7 | ) | | 1,911.9 |
|
| Other (decreases) increases in non- | | | | | | | | | | | | | |
| controlling interest | — |
| | (8.7 | ) | | — |
| | — |
| | (8.7 | ) | | 31.0 |
| | 22.3 |
|
| Other comprehensive income (Note 9) | — |
| | — |
| | — |
| | 121.3 |
| | 121.3 |
| | — |
| | 121.3 |
|
| Common shares issued to | | | | | | | | | | | | | |
| acquire Coventry | 52.2 |
| | 3,064.6 |
| | — |
| | — |
| | 3,064.6 |
| | — |
| | 3,064.6 |
|
| Common shares issued for benefit plans, | | | | | | | | | | | | | |
| including tax benefits | 5.4 |
| | 231.2 |
| | — |
| | — |
| | 231.2 |
| | — |
| | 231.2 |
|
| Repurchases of common shares | (23.0 | ) | | (.2 | ) | | (1,407.5 | ) | | — |
| | (1,407.7 | ) | | — |
| | (1,407.7 | ) |
| Dividends declared | — |
| | — |
| | (294.6 | ) | | — |
| | (294.6 | ) | | — |
| | (294.6 | ) |
| Balance at December 31, 2013 | 362.2 |
| | 4,382.2 |
| | 10,555.4 |
| | (912.1 | ) | | 14,025.5 |
| | 52.7 |
| | 14,078.2 |
|
| Net income | — |
| | — |
| | 2,040.8 |
| | — |
| | 2,040.8 |
| | 4.4 |
| | 2,045.2 |
|
| Other increases in | | | | | | | | | | | | | |
| non-controlling interest | — |
| | — |
| | — |
| | — |
| | — |
| | 12.1 |
| | 12.1 |
|
| Other comprehensive loss (Note 9) | — |
| | — |
| | — |
| | (199.2 | ) | | (199.2 | ) | | — |
| | (199.2 | ) |
| Common shares issued for benefit plans, | | | | | | | | | | | | |
|
|
| including tax benefits | 3.5 |
| | 160.1 |
| | — |
| | — |
| | 160.1 |
| | — |
| | 160.1 |
|
| Repurchases of common shares | (15.9 | ) | | (.1 | ) | | (1,218.0 | ) | | — |
| | (1,218.1 | ) | | — |
| | (1,218.1 | ) |
| Dividends declared | — |
| | — |
| | (326.5 | ) | | — |
| | (326.5 | ) | | — |
| | (326.5 | ) |
| Balance at December 31, 2014 | 349.8 |
| | $ | 4,542.2 |
| | $ | 11,051.7 |
| | $ | (1,111.3 | ) | | $ | 14,482.6 |
| | $ | 69.2 |
| | $ | 14,551.8 |
|
| | | | | | | | | | | | | | |
Refer to accompanying Notes to Consolidated Financial Statements.
Consolidated Statements of Cash Flows
|
| | | | | | | | | | | | | | |
| | | | | For the Years Ended December 31, |
| (Millions) | | 2014 |
| | 2013 |
| | 2012 |
|
| Cash flows from operating activities: | | | | | | | | |
| Net income including non-controlling interests | | | | $ | 2,045.2 |
| | $ | 1,911.9 |
| | $ | 1,659.8 |
|
| Adjustments to reconcile net income to net cash provided by operating activities: | | | | |
| Net realized capital (gains) losses | | | | (80.4 | ) | | 8.8 |
| | (108.7 | ) |
| Depreciation and amortization | | | | 629.0 |
| | 569.1 |
| | 449.9 |
|
| Debt fair value amortization | | | | (53.2 | ) | | (39.4 | ) | | — |
|
| Equity in earnings of affiliates, net | | | | (39.4 | ) | | (43.6 | ) | | (46.9 | ) |
| Stock-based compensation expense | | | | 163.8 |
| | 127.1 |
| | 122.2 |
|
| Reduction of reserve for anticipated future losses on discontinued products | | — |
| | (86.0 | ) | | — |
|
| Reversal of allowance and gain on sale of reinsurance recoverable | | | | — |
| | (49.4 | ) | | — |
|
| Amortization of net investment premium | | | | 71.6 |
| | 58.5 |
| | 21.7 |
|
| Loss on early extinguishment of long-term debt | | | | 181.2 |
| | — |
| | 84.9 |
|
| Pension settlement charge | | | | 111.6 |
| | — |
| | — |
|
| Changes in assets and liabilities: | | | | | | | | |
| Accrued investment income | | | | (12.8 | ) | | 2.5 |
| | 12.1 |
|
| Premiums due and other receivables | | | | (866.4 | ) | | (261.7 | ) | | (163.7 | ) |
| Income taxes | | | | (154.1 | ) | | 52.0 |
| | 98.6 |
|
| Other assets and other liabilities | | | | 551.8 |
| | 28.9 |
| | (340.2 | ) |
| Health care and insurance liabilities | | | | 825.7 |
| | 2.4 |
| | 25.5 |
|
| Other, net | | | | (.8 | ) | | (2.4 | ) | | 9.7 |
|
| Net cash provided by operating activities | | | | 3,372.8 |
| | 2,278.7 |
| | 1,824.9 |
|
| Cash flows from investing activities: | | | | |
| | |
| | |
| Proceeds from sales and maturities of investments | | | | 9,484.3 |
| | 13,382.0 |
| | 11,181.6 |
|
| Cost of investments | | | | (10,803.9 | ) | | (13,178.4 | ) | | (11,066.1 | ) |
| Additions to property, equipment and software | | | | (369.6 | ) | | (479.1 | ) | | (338.2 | ) |
| Cash used for acquisitions, net of cash acquired | | | | (450.5 | ) | | (1,646.8 | ) | | (8.6 | ) |
| Other, net | | | | 10.0 |
| | 2.5 |
| | — |
|
| Net cash used for investing activities | | | | (2,129.7 | ) | | (1,919.8 | ) | | (231.3 | ) |
| Cash flows from financing activities: | | | | |
| | |
| | |
| Repayment of long-term debt | | | | (1,797.8 | ) | | — |
| | (277.2 | ) |
| Issuance of long-term debt | | | | 1,482.4 |
| | — |
| | 2,664.8 |
|
| Net issuance (repayment) of short-term debt | | | | 500.0 |
| | — |
| | (425.9 | ) |
| Deposits and interest credited for investment contracts | | | | 5.3 |
| | 5.2 |
| | 5.7 |
|
| Withdrawals of investment contracts | | | | (3.6 | ) | | (10.7 | ) | | (17.0 | ) |
| Common shares issued under benefit plans, net | | | | (60.3 | ) | | 11.8 |
| | (44.5 | ) |
| Stock-based compensation tax benefits | | | | 41.3 |
| | 83.4 |
| | 50.3 |
|
| Proceeds from repurchase agreements | | | | 201.6 |
| | — |
| | — |
|
| Common shares repurchased | | | | (1,218.1 | ) | | (1,407.7 | ) | | (1,417.5 | ) |
| Dividends paid to shareholders | | | | (320.6 | ) | | (278.7 | ) | | (239.1 | ) |
| Collateral on interest rate swaps | | | | (77.3 | ) | | 39.9 |
| | 9.2 |
|
| Contributions (distributions), non-controlling interests | | | | 12.1 |
| | 31.0 |
| | (2.9 | ) |
| Net cash (used for) provided by financing activities | | | | (1,235.0 | ) | | (1,525.8 | ) | | 305.9 |
|
| Net increase (decrease) in cash and cash equivalents | | | | 8.1 |
| | (1,166.9 | ) | | 1,899.5 |
|
| Cash and cash equivalents, beginning of period | | | | 1,412.3 |
| | 2,579.2 |
| | 679.7 |
|
| Cash and cash equivalents, end of period | | | | $ | 1,420.4 |
| | $ | 1,412.3 |
| | $ | 2,579.2 |
|
Refer to accompanying Notes to Consolidated Financial Statements.
Notes to Consolidated Financial Statements
We conduct our operations in three business segments:
| |
| • | Health Care consists of medical, pharmacy benefit management services, dental, behavioral health and vision plans offered on both an Insured basis (where we assume all or a majority of the risk for medical and dental care costs) and an employer-funded basis (where the plan sponsor under an administrative services contract (“ASC”) assumes all or a majority of this risk) and products and services, such as Accountable Care Solutions (“ACS”), that complement and enhance our medical products. Medical products include point-of-service (“POS”), preferred provider organization (“PPO”), health maintenance organization (“HMO”) and indemnity benefit (“Indemnity”) plans. Medical products also include health savings accounts (“HSAs”) and Aetna HealthFund®, consumer-directed health plans that combine traditional POS or PPO and/or dental coverage, subject to a deductible, with an accumulating benefit account (which may be funded by the plan sponsor and/or the member in the case of HSAs). We also offer Medicare and Medicaid products and services and other medical products, such as medical management and data analytics services, medical stop loss insurance, workers’ compensation administrative services and products that provide access to our provider network in select geographies. |
| |
| • | Group Insurance primarily includes group life insurance and group disability products. Group life insurance products are offered on an Insured basis, and include basic and supplemental group term life, group universal life, supplemental or voluntary programs and accidental death and dismemberment coverage. Group disability products consist primarily of short-term and long-term disability products (and products which combine both), which are offered to employers on both an Insured and an ASC basis, and absence management services offered to employers, which include short-term and long-term disability administration and leave management. Group Insurance also includes long-term care products that were offered primarily on an Insured basis, which provide benefits covering the cost of care in private home settings, adult day care, assisted living or nursing facilities. We no longer solicit or accept new long-term care customers. |
| |
| • | Large Case Pensions manages a variety of retirement products (including pension and annuity products) primarily for tax-qualified pension plans. These products provide a variety of funding and benefit payment distribution options and other services. Large Case Pensions also includes certain discontinued products (refer to Note 20 beginning on page 135 for additional information). |
Our three business segments are distinct businesses that offer different products and services. Our Chief Executive Officer evaluates financial performance and makes resource allocation decisions at these segment levels. The accounting policies of the segments are the same as those described in the summary of significant accounting policies in Note 2, below. We evaluate the performance of these business segments based on operating earnings (net income or loss attributable to Aetna, excluding net realized capital gains or losses and other items, if any) (refer to Note 19 beginning on page 132 for segment financial information).
On May 7, 2013 (the “Acquisition Date”), we completed the acquisition of Coventry Health Care, Inc. (“Coventry”) in a transaction valued at approximately $8.7 billion, including the fair value of Coventry’s outstanding debt. Refer to Note 3 beginning on page 90 for additional information.
| |
| 2. | Summary of Significant Accounting Policies |
Principles of Consolidation
The accompanying consolidated financial statements have been prepared in accordance with U.S. generally-accepted accounting principles (“GAAP”) and include the accounts of Aetna and the subsidiaries that we control. All significant intercompany balances have been eliminated in consolidation. The Company has evaluated subsequent events from the balance sheet date through the date the financial statements were issued and determined there were no other items to disclose other than as disclosed in Note 21 beginning on page 138.
Reclassifications
Certain reclassifications were made to 2012 and 2013 financial information to conform with 2014 presentation.
New Accounting Standards
Fees Paid to the Federal Government by Health Insurers
Effective January 1, 2014, we adopted new accounting guidance relating to the recognition and income statement reporting of the mandated fee to be paid to the federal government by health insurers. This guidance applies to the new health insurer fee (“HIF”) included in Health Care Reform. This new accounting guidance resulted in the establishment on January 1, 2014, of a liability for our portion of the entire estimated 2014 annual HIF. This amount is reflected in accrued expenses and other current liabilities with a corresponding amount reflected in other current assets. The estimated annual HIF is amortized into general and administrative expenses on a straight-line basis with a corresponding reduction in other current assets. The HIF for 2014 was paid in September 2014 and is not tax deductible.
Amendments to the Scope, Measurement and Disclosure Requirements of Investment Companies
Effective January 1, 2014, we adopted new accounting guidance relating to the approach for determining whether an entity is considered an investment company for accounting purposes. This guidance clarified the characteristics and set measurement and disclosure requirements for an investment company for accounting purposes. The adoption of this new guidance did not have an impact on our financial position or operating results.
Future Application of Accounting Standards
Accounting for Investments in Qualified Affordable Housing Projects
Effective January 1, 2015, we were permitted to make an accounting policy election to adopt new accounting guidance relating to the recognition of amortization of investments in qualified affordable housing projects. The guidance sets forth a new method of measurement, referred to as the proportional amortization method, under which income and expense items related to qualified affordable housing projects would be recorded in the income taxes line item. We will not be making the accounting policy election to adopt this new accounting guidance.
Reporting Discontinued Operations and Disclosures of Disposals of Components of an Entity
Effective January 1, 2015, we will adopt amended accounting guidance related to when an entity reports a discontinued operation in its financial position and operating results. The guidance clarifies that a discontinued operation is required to be reported if the disposal represents a significant shift that has (or will have) a major effect on an entity’s operations and financial results when a component of an entity or a group of components of an entity are either classified as held for sale or are disposed of by sale. The amendments also require additional disclosures about discontinued operations. If we have a discontinued operation after January 1, 2015, these changes could result in increased reporting and disclosure requirements in our financial statements.
Revenue from Contracts with Customers
Effective January 1, 2017, we will adopt new accounting guidance related to revenue recognition from contracts with customers. This new guidance removes most industry-specific revenue recognition requirements (insurance contracts are not covered by this guidance) and requires that an entity recognize revenue for the transfer of goods or services to a customer at an amount that reflects the consideration to which an entity expects to be entitled in exchange for the goods or services. The new guidance also requires additional disclosures regarding the nature, amount, timing and uncertainty of revenue and cash flows arising from customer contracts. The new guidance
allows an entity to adopt the standard either through a full retrospective approach or a modified retrospective approach with a cumulative effect adjustment to retained earnings. We are still assessing the impact of this standard on our financial position and operating results in addition to evaluating the transition method we will use when we adopt this standard.
Repurchase-to-Maturity Transactions, Repurchase Financings, and Disclosures
Effective January 1, 2015, we will adopt new accounting guidance related to the accounting for repurchase-to-maturity transactions and repurchase financing arrangements. This guidance aligns the accounting for repurchase-to-maturity transactions and repurchase agreements executed as repurchase financings with other typical repurchase agreements, resulting in these transactions generally being accounted for as secured borrowings. The guidance also requires additional disclosures about repurchase agreements and other similar transactions. The adoption of this new guidance is not expected to have a material impact on our financial position or operating results.
Accounting for Share-Based Payments When the Terms of an Award Provide That a Performance Target Could Be Achieved after the Requisite Service Period
Effective January 1, 2016, we will adopt new accounting guidance related to the accounting for share-based payments when the terms of an award provide that a performance target could be achieved after the requisite service period. This guidance clarifies that awards with these provisions should be treated as performance conditions that affect vesting, and do not impact the award’s estimated grant-date fair value. Early adoption for this new guidance is permitted. The adoption of this new guidance will not have an impact on our financial position or operating results.
Disclosure of Uncertainties About an Entity’s Ability to Continue as a Going Concern
Effective December 31, 2016, we will adopt amended accounting guidance related to management’s evaluation of whether there is substantial doubt about an entity’s ability to continue as a going concern and the related disclosures. The adoption of this new guidance will not have a material impact on our financial position or operating results.
Determining Whether the Host Contract in a Hybrid Financial Instrument Issued in the Form of a Share Is More Akin to Debt or to Equity
Effective December 31, 2015, we will adopt amended accounting guidance related to the approach used in determining whether the host contract in a hybrid financial instrument issued in the form of a share is more akin to debt or equity. Early adoption for this new guidance is permitted. The adoption of this new guidance is not expected to have a material impact on our financial position or operating results.
Simplifying Income Statement Presentation by Eliminating the Concept of Extraordinary Items
Effective January 1, 2016, we will adopt amended accounting guidance related to the presentation of extraordinary items. The amendment eliminates the concept of extraordinary items which represent events that are both unusual and infrequent. Presentation and disclosure of items that are unusual or infrequent will be retained, and will be expanded to include items that are both unusual and infrequent. The adoption of this new guidance is not expected to have a material impact on our financial position or operating results.
Use of Estimates
The preparation of the accompanying consolidated financial statements in conformity with GAAP requires the use of estimates and assumptions that affect the amounts reported in these consolidated financial statements and notes. We consider the following accounting estimates critical in the preparation of the accompanying consolidated financial statements: health care costs payable, other insurance liabilities, recoverability of goodwill and other acquired intangible assets, measurement of defined benefit pension and other postretirement employee benefit plans, other-than-temporary impairment of debt securities and revenue recognition, and allowance for estimated terminations and uncollectible accounts. We use information available to us at the time estimates are made; however, these estimates could change materially if different information or assumptions were used. Additionally, these estimates may not ultimately reflect the actual amounts of the final transactions that occur.
Cash and Cash Equivalents
Cash and cash equivalents include cash on-hand and debt securities with an original maturity of three months or less when purchased. The carrying value of cash equivalents approximates fair value due to the short-term maturity of these investments.
Investments
Debt and Equity Securities
Debt and equity securities consist primarily of U.S. Treasury and agency securities, mortgage-backed securities, corporate and foreign bonds and other debt and equity securities. Debt securities are classified as either current or long-term investments based on their contractual maturities unless we intend to sell an investment within the next twelve months, in which case it is classified as current on our balance sheets. We have classified our debt and equity securities as available for sale and carry them at fair value. Refer to Note 10 beginning on page 102 for additional information on how we estimate the fair value of these investments. The cost for mortgage-backed and other asset-backed securities is adjusted for unamortized premiums and discounts, which are amortized using the interest method over the estimated remaining term of the securities, adjusted for anticipated prepayments. We regularly review our debt and equity securities to determine whether a decline in fair value below the carrying value is other-than-temporary. When a debt or equity security is in an unrealized capital loss position, we monitor the duration and severity of the loss to determine if sufficient market recovery can occur within a reasonable period of time. If a decline in the fair value of a debt security is considered other-than-temporary, the cost basis or carrying value of the debt security is written down. The write-down is then bifurcated into its credit and non-credit related components. The amount of the credit-related component is included in our operating results, and the amount of the non-credit related component is included in other comprehensive income, unless we intend to sell the debt security or it is more likely than not that we will be required to sell the debt security prior to its anticipated recovery of its amortized cost basis. We do not accrue interest on debt securities when management believes the collection of interest is unlikely.
We lend certain debt and equity securities from our investment portfolio to other institutions for short periods of time using securities lending transactions and repurchase agreements. Under securities lending transactions, borrowers must post cash collateral in the amount of 102% to 105% of the fair value of the loaned securities, and the fair value of the loaned securities is monitored on a daily basis, with additional collateral obtained or refunded as the fair value of the loaned securities fluctuates. Under securities lending transactions, the collateral is retained and invested by a lending agent according to our investment guidelines to generate additional income for us. We primarily utilize repurchase agreements for short-term borrowings to meet liquidity needs. Under repurchase agreements, we receive cash in an amount that approximates the fair value of our collateralized debt securities.
Mortgage Loans
We carry the value of our mortgage loan investments on our balance sheets at the unpaid principal balance, net of impairment reserves. A mortgage loan may be impaired when it is a problem loan (i.e., more than 60 days delinquent, in bankruptcy or in process of foreclosure), a potential problem loan (i.e., high probability of default) or a restructured loan. For impaired loans, a specific impairment reserve is established for the difference between the recorded investment in the loan and the estimated fair value of the collateral. We apply our loan impairment policy individually to all loans in our portfolio.
The quarterly impairment evaluation described above also considers characteristics and risk factors attributable to the aggregate portfolio. We would establish an additional allowance for loan losses if it were probable that there would be a credit loss on a group of similar mortgage loans. We consider the following characteristics and risk factors when evaluating if a credit loss is probable: loan to value ratios, property type (e.g., office, retail, apartment, industrial), geographic location, vacancy rates and property condition. As a result of that evaluation, we determined that a credit loss was not probable and did not record any additional allowance for loan losses with respect to performing mortgage loans in 2014, 2013 or 2012.
We record full or partial charge-offs of loans at the time an event occurs affecting the legal status of the loan, typically at the time of foreclosure or upon a loan modification giving rise to forgiveness of debt. Interest income on
an impaired loan is accrued to the extent we deem it collectible and the loan continues to perform under its original or restructured terms. Interest income on problem loans is recognized on a cash basis. Cash payments on loans in the process of foreclosure are treated as a return of principal. Mortgage loans with a maturity date or a committed prepayment date within twelve months are classified as current on our balance sheets.
Other Investments
Other investments consist primarily of the following:
| |
| • | Alternative investments, which are comprised of private equity and hedge fund limited partnerships. We typically do not have a controlling ownership in our alternative investments, and therefore we apply the equity method of accounting for these investments. |
| |
| • | Investment real estate, which is carried on our balance sheets at depreciated cost, including capital additions, net of write-downs for other-than-temporary declines in fair value. Depreciation is calculated using the straight-line method based on the estimated useful life of each asset. If any of our real estate investments is considered held-for-sale, we carry it at the lower of its carrying value or fair value less estimated selling costs. We generally estimate fair value using a discounted future cash flow analysis in conjunction with comparable sales information. At the time of the sale, we record the difference between the sales price and the carrying value as a realized capital gain or loss. |
| |
| • | Privately-held equity securities, which are carried at cost on our balance sheets. We do not estimate the fair value of these securities if there are no identified events or changes in circumstances that may have a significant adverse effect on the fair value of the investment. Additionally, as a member of the Federal Home Loan Bank of Boston (“FHLBB”), we are required to purchase and hold shares of the FHLBB. These shares are restricted and also carried at cost. |
| |
| • | Bank loans, which are carried on our balance sheets at amortized cost, net of any allowance for impairments. If any of our bank loans are considered held-for-sale, we carry those loans at the lower of cost or fair value. |
| |
| • | Derivatives, which we make limited use of in order to manage interest rate, foreign exchange, price risk and credit exposure. The derivatives we use consist primarily of interest rate swaps, forward contracts, futures contracts, warrants, put options, and credit default swaps. Derivatives are reflected at fair value on our balance sheets. When we enter into a derivative contract, if certain criteria are met, we may designate it as one of the following: a hedge of the fair value of a recognized asset or liability or of an unrecognized firm commitment; a hedge of a forecasted transaction or of the variability of cash flows to be received or paid related to a recognized asset or liability; or a foreign currency fair value or cash flow hedge. |
Net Investment Income and Realized Capital Gains and Losses
Net investment income on investments supporting Health Care and Group Insurance liabilities and Large Case Pensions products (other than experience-rated and discontinued products) are reflected in our operating results.
Experience-rated products are products in the Large Case Pensions business where the contract holder, not us, assumes investment and other risks, subject to, among other things, minimum guarantees provided by us. The effect of investment performance on experience-rated products is allocated to contract holders’ accounts daily, based on the underlying investment experience and, therefore, does not impact our operating results (as long as minimum guarantees are not triggered).
When we discontinued the sale of our fully-guaranteed Large Case Pensions products, we established a reserve for anticipated future losses from these discontinued products and segregated the related investments. Investment performance on this separate portfolio is ultimately credited/charged to the reserve and, generally, does not impact our operating results.
Net investment income supporting Large Case Pensions’ experience-rated and discontinued products is included in net investment income in our statements of income and is credited to contract holders’ accounts or the reserve for anticipated future losses through a charge to current and future benefits.
Realized capital gains and losses on investments supporting Health Care and Group Insurance liabilities and Large Case Pensions products (other than experience-rated and discontinued products) are reflected in our operating results. Realized capital gains and losses are determined on a specific identification basis. We reflect purchases and sales of debt and equity securities and alternative investments on the trade date. We reflect purchases and sales of mortgage loans and investment real estate on the closing date.
Realized capital gains and losses on investments supporting Large Case Pensions’ experience-rated and discontinued products are not included in realized capital gains and losses in our statements of income and instead are credited directly to contract holders’ accounts, in the case of experience-rated products, or allocated to the reserve for anticipated future losses established at discontinuance, in the case of discontinued products. The contract holders’ accounts are reflected in policyholders’ funds, and the reserve for anticipated future losses is reflected in future policy benefits on our balance sheets.
Unrealized capital gains and losses on investments supporting Health Care and Group Insurance liabilities and Large Case Pensions products (other than experience-rated and discontinued products) are reflected in shareholders’ equity, net of tax, as a component of accumulated other comprehensive loss.
Unrealized capital gains and losses on investments supporting Large Case Pensions’ experience-rated products are credited directly to contract holders’ accounts, which are reflected in policyholders’ funds on our balance sheets. Net unrealized capital gains and losses on discontinued products are reflected in other long-term liabilities on our balance sheets.
Refer to Note 20 beginning on page 135 for additional information on our discontinued products.
Reinsurance
We utilize reinsurance agreements primarily to reduce our required capital and to facilitate the acquisition or disposition of certain insurance contracts. Ceded reinsurance agreements permit us to recover a portion of our losses from reinsurers, although they do not discharge our primary liability as the direct insurer of the risks reinsured. Failure of reinsurers to indemnify us could result in losses; however, we do not expect charges for unrecoverable reinsurance to have a material effect on our operating results or financial condition. We evaluate the financial condition of our reinsurers and monitor concentrations of credit risk arising from similar geographic regions, activities or economic characteristics of our reinsurers. At December 31, 2014, our reinsurance recoverables consisted primarily of amounts due from third parties that are rated consistent with companies that are considered to have the ability to meet their obligations.
We enter into agreements with other insurance companies under which we assume reinsurance, primarily related to our group life and health products. We do not transfer any portion of the financial risk associated with our Commercial HMO products to third parties, except in areas where we participate in state-mandated health insurance pools. We did not have material premiums ceded to or assumed from unrelated insurance companies in the three years ended December 31, 2014.
Refer to “Reinsurance” on page 88 for information about Health Care Reform’s temporary three-year reinsurance program.
Goodwill
We have made acquisitions that included a significant amount of goodwill and other intangible assets. When we complete an acquisition, we apply the acquisition method of accounting, which among other things, requires the recognition of goodwill (which represents the excess cost of the acquisition over the fair value of net assets acquired and identified intangible assets).
We evaluate goodwill for impairment (at the reporting unit level) annually, or more frequently if circumstances indicate a possible impairment, by comparing an estimate of the fair value of the applicable reporting unit to its carrying value, including goodwill. If the carrying value exceeds fair value, we compare the implied fair value of
the applicable goodwill to its carrying amount to measure the amount of goodwill impairment, if any. Impairments, if any, would be classified as an operating expense. There were no goodwill impairment losses recognized, and the fair value of each reporting unit substantially exceeded its carrying value in each of the three years ended December 31, 2014, 2013 or 2012.
Our annual impairment tests were based on an evaluation of future discounted cash flows. These evaluations utilized the best information available to us at the time, including supportable assumptions and projections we believe are reasonable. Collectively, these evaluations were our best estimates of projected future cash flows. Our discounted cash flow evaluations used discount rates that correspond to a weighted-average cost of capital consistent with a market-participant view. The discount rates are consistent with those used for investment decisions and take into account the operating plans and strategies of the Health Care and Group Insurance segments. Certain other key assumptions utilized, including changes in membership, revenue, health care costs, operating expenses, impacts of health care reform fees, assessments and taxes and effective tax rates, are based on estimates consistent with those utilized in our annual planning process that we believe are reasonable. If we do not achieve our earnings objectives, the assumptions and estimates underlying these goodwill impairment evaluations could be adversely affected, and we may impair a portion of our goodwill, which would adversely affect our operating results in the period of impairment.
Property and Equipment and Other Acquired Intangible Assets
We report property and equipment and other acquired intangible assets at historical cost, net of accumulated depreciation or amortization. At December 31, 2014 and 2013, the historical cost of property and equipment was approximately $807 million and $852 million, respectively, and the related accumulated depreciation was approximately $137 million and $130 million, respectively. Refer to Note 7 beginning on page 93 for cost and accumulated amortization associated with other acquired intangibles. We calculate depreciation and amortization primarily using the straight-line method over the estimated useful lives of the respective assets ranging from three to forty years.
In connection with the acquisition of Genworth Financial, Inc.’s (“Genworth’s”) Medicare Supplement and related blocks of in-force business we recognized an asset for the valuation of business acquired (“VOBA”). VOBA represents the present value of the future profits embedded in the acquired businesses, and was determined by estimating the net present value of future cash flows from the contracts in force at the date of acquisition. VOBA is amortized in proportion to estimated premiums arising from the acquired contracts over their expected life.
We regularly evaluate whether events or changes in circumstances indicate that the carrying value of property and equipment or other acquired intangible assets may not be recoverable. If we determine that the carrying value of an asset may not be recoverable, we group the asset with other assets and liabilities at the lowest level for which independent identifiable cash flows are available and estimate the future undiscounted cash flows expected to result from future use of the asset group and its eventual disposition. If the sum of the expected undiscounted future cash flows is less than the carrying value of the asset group, we recognize an impairment loss for the amount by which the carrying value of the asset group exceeds its fair value. There were no material impairment losses recognized in the three years ended December 31, 2014, 2013 or 2012.
Separate Accounts
Separate Accounts assets and liabilities in the Large Case Pensions business represent funds maintained to meet specific objectives of contract holders who bear the investment risk. These assets and liabilities are carried at fair value. Net investment income and net realized capital gains and losses accrue directly to such contract holders. The assets of each account are legally segregated and are not subject to claims arising from our other businesses. Deposits, withdrawals, net investment income and net realized and net unrealized capital gains and losses on Separate Accounts assets are not reflected in our statements of income or cash flows. Management fees charged to contract holders are included in fees and other revenue and recognized over the period earned.
Health Care and Other Insurance Liabilities
Health care costs payable
Health care costs payable consist principally of unpaid fee-for-service medical, dental and pharmacy claims, capitation costs and other amounts due to health care providers pursuant to risk-sharing arrangements related to Health Care’s POS, PPO, HMO, Indemnity, Medicare and Medicaid products. Unpaid health care claims include our estimate of payments we will make on claims reported to us but not yet paid and for health care services rendered to members but not yet reported to us as of the balance sheet date (collectively, “IBNR”). Also included in these estimates is the cost of services that will continue to be rendered after the balance sheet date if we are obligated to pay for such services in accordance with contractual or regulatory requirements. Such estimates are developed using actuarial principles and assumptions which consider, among other things, historical and projected claim submission and processing patterns, assumed and historical medical cost trends, historical utilization of medical services, claim inventory levels, changes in membership and product mix, seasonality and other relevant factors. We reflect changes in these estimates in health care costs in our operating results in the period they are determined. Capitation costs represent contractual monthly fees paid to participating physicians and other medical providers for providing medical care, regardless of the medical services provided to the member. Approximately five percent of our health care costs related to capitated arrangements in each of the last three years. Amounts due under risk-sharing arrangements are based on the terms of the underlying contracts with the providers and consider claims experience under the contracts through the balance sheet date.
Future policy benefits
Future policy benefits consist primarily of reserves for limited payment pension and annuity contracts in the Large Case Pensions business and long-duration group life and long-term care insurance contracts in the Group Insurance business. Reserves for limited payment contracts are computed using actuarial principles that consider, among other things, assumptions reflecting anticipated mortality, retirement, expense and interest rate experience. Such assumptions generally vary by plan, year of issue and policy duration. Assumed interest rates on such contracts ranged from .8% to 11.3% and 1.3% to 11.3% in 2014 and 2013, respectively. We periodically review mortality assumptions against both industry standards and our experience. Reserves for long-duration group life and long-term care contracts represent our estimate of the present value of future benefits to be paid to or on behalf of policyholders less the present value of future net premiums. Assumed interest rates on such contracts ranged from 2.5% to 8.8% in both 2014 and 2013. Our estimate of the present value of future benefits under such contracts is based upon mortality, morbidity and interest rate assumptions.
Unpaid claims
Unpaid claims consist primarily of reserves associated with certain short-duration group disability and term life insurance contracts in the Group Insurance business, including an estimate for IBNR as of the balance sheet date. Reserves associated with certain short-duration group disability and term life insurance contracts are based upon our estimate of the present value of future benefits, which is based on assumed investment yields and assumptions regarding mortality, morbidity and recoveries from the U.S. Social Security Administration. We develop our estimate of IBNR using actuarial principles and assumptions which consider, among other things, contractual requirements, claim incidence rates, claim recovery rates, seasonality and other relevant factors. We discount certain claim liabilities related to group long-term disability and life insurance waiver of premium contracts. The discounted unpaid claim liabilities were $2.0 billion and $1.9 billion at December 31, 2014 and 2013, respectively. The undiscounted value of these unpaid claim liabilities was $2.7 billion and $2.6 billion at December 31, 2014 and 2013, respectively. The discount rates generally reflect our expected investment returns for the investments supporting all incurral years of these liabilities and ranged from 3.0% to 6.0% in 2014 and 3.3% to 6.0% in 2013. The discount rates for retrospectively-rated contracts are set at contractually specified levels. Our estimates of unpaid claims are subject to change due to changes in the underlying experience of the insurance contracts, changes in investment yields or other factors, and these changes are recorded in current and future benefits in our statements of income in the period they are determined.
Policyholders’ funds
Policyholders’ funds consist primarily of reserves for pension and annuity investment contracts in the Large Case Pensions business and customer funds associated with group life and health contracts in the Health Care and Group
Insurance businesses. Reserves for such contracts are equal to cumulative deposits less withdrawals and charges plus credited interest thereon, net of experience-rated adjustments. In 2014, interest rates for pension and annuity investment contracts ranged from 3.6% to 16.7%, and interest rates for group life and health contracts ranged from 0% to 2.8%. In 2013, interest rates for pension and annuity investment contracts ranged from 3.8% to 12.2%, and interest rates for group life and health contracts ranged from 0% to 3.2%. Reserves for contracts subject to experience rating reflect our rights as well as the rights of policyholders and plan participants.
We also hold funds for health savings accounts (“HSAs”) on behalf of members associated with high deductible health plans. These amounts are held to pay for qualified health care expenses incurred by these members. The HSA balances were approximately $1.3 billion and $920 million at December 31, 2014 and 2013, respectively, and are reflected in other current assets with a corresponding liability in policyholder funds.
We review health care and other insurance liabilities periodically. We reflect any necessary adjustments during the current period in operating results. While the ultimate amount of claims and related expenses are dependent on future developments, it is management’s opinion that the liabilities that have been established are adequate to cover such costs. The health care and other insurance liabilities that are expected to be paid within twelve months are classified as current on our balance sheets.
Premium Deficiency Reserves
We evaluate our insurance contracts to determine if it is probable that a loss will be incurred. We recognize a premium deficiency loss when it is probable that expected future claims, including maintenance costs (for example, claim processing costs), will exceed existing reserves plus anticipated future premiums and reinsurance recoveries. Anticipated investment income is considered in the calculation of premium deficiency losses for short-duration contracts. For purposes of determining premium deficiency losses, contracts are grouped in a manner consistent with our method of acquiring, servicing and measuring the profitability of such contracts. We did not have any premium deficiency reserves at December 31, 2014 or 2013.
Health Care Contract Acquisition Costs
Health care benefits products included in the Health Care segment are cancelable by either the customer or the member monthly upon written notice. Acquisition costs related to our prepaid health care and health indemnity contracts are generally expensed as incurred. At December 31, 2014 and 2013, the balance of our deferred acquisition costs was approximately $222 million and $137 million, respectively, comprised primarily of commissions paid on our Medicare Supplement products. Deferred acquisition costs are amortized over the estimated life of the contracts.
Revenue Recognition and Allowance for Estimated Terminations and Uncollectible Accounts
Health care premiums are recognized as income in the month in which the enrollee is entitled to receive health care services. Health care premiums are reported net of an allowance for estimated terminations and uncollectible amounts. Additionally, premium revenue subject to the minimum MLR rebate requirements of Health Care Reform is recorded net of the estimated minimum MLR rebates for the current calendar year. Other premium revenue for group life, long-term care and disability products is recognized as income, net of allowances for termination and uncollectible accounts, over the term of the coverage. Other premium revenue for Large Case Pensions’ limited payment pension and annuity contracts is recognized as revenue in the period received. Premiums related to unexpired contractual coverage periods are reported as unearned premiums in our balance sheets.
The balance of the allowance for estimated terminations and uncollectible accounts on premiums receivable was $141 million and $90 million at December 31, 2014 and 2013, respectively, and is reflected as a reduction of premiums receivable in our balance sheets. The balance of the allowance for uncollectible accounts on other receivables was $17 million and $34 million at December 31, 2014 and 2013, respectively, and is reflected as a reduction of other receivables in our balance sheets.
Some of our contracts allow for premiums to be adjusted to reflect actual experience or the relative health status of members. Such adjustments are reasonably estimable at the outset of the contract, and adjustments to those
estimates are made based on actual experience of the customer emerging under the contract and the terms of the underlying contract.
Fees and other revenue consists primarily of ASC fees which are received in exchange for performing certain claim processing and member services for health and disability members and are recognized as revenue over the period the service is provided. Fees and other revenue also includes fees related to our workers’ compensation administrative services products and services. Some of our contracts include guarantees with respect to certain functions, such as customer service response time, claim processing accuracy and claim processing turnaround time, as well as certain guarantees that a plan sponsor’s benefit claim experience will fall within a certain range. With any of these guarantees, we are financially at risk if the conditions of the arrangements are not met, although the maximum amount at risk is typically limited to a percentage of the fees otherwise payable to us by the customer involved. Each period we estimate our obligations under the terms of these guarantees and record it as an offset to our ASC fees.
In addition, fees and other revenue also include charges assessed against contract holders’ funds for contract fees, participant fees and asset charges related to pension and annuity products in the Large Case Pensions business. Other amounts received on pension and annuity investment-type contracts are reflected as deposits and are not recorded as revenue. Some of our Large Case Pension contract holders have the contractual right to purchase annuities with life contingencies using the funds they maintain on deposit with us. Since these products are considered an insurance contract, when the contract holder makes this election, we treat the accumulated investment balance as a single premium and reflect it as both premiums and current and future benefits in our statements of income.
Accounting for certain provisions of the Patient Protection and Affordable Care Act and the Health Care and Education Reconciliation Act of 2010 (collectively, “Health Care Reform” or the “ACA”)
We are participating in certain public health insurance exchanges established pursuant to Health Care Reform (“Public Exchanges”). Under regulations established by the U.S. Department of Health and Human Services (“HHS”), HHS pays us a portion of the premium (“Premium Subsidy”) and a portion of the health care costs (“Cost Sharing Subsidy”) for low-income individual Public Exchange members. In addition, HHS administers certain risk management programs as described below.
We recognize monthly premiums received from Public Exchange members and the Premium Subsidy as premium revenue ratably over the contract period. The Cost Sharing Subsidy offsets health care costs when incurred. We record a liability if the Cost Sharing Subsidy is paid in advance or a receivable if incurred health care costs exceed the Cost Sharing Subsidy received to date.
Accounting for Health Care Reform’s Reinsurance, Risk Adjustment and Risk Corridor (the “3Rs”)
Reinsurance
Health Care Reform established a temporary three-year reinsurance program, under which all issuers of major medical commercial insurance products and self-insured plan sponsors are required to contribute funding in amounts set by HHS. Funds collected will be utilized to reimburse issuers’ high claims costs incurred for qualified individual members. The expense related to this required funding is reflected in general and administrative expenses for all of our insurance products with the exception of products associated with qualified individual members; this expense for qualified individual members is reflected as a reduction of premium revenue. When annual claim costs incurred by our qualified individual members exceed a specified attachment point, we are entitled to certain reimbursements from this program. We record a receivable and offset health care costs to reflect our estimate of these recoveries. At December 31, 2014, we recorded a receivable under the temporary three-year reinsurance program of approximately $338 million.
Risk Adjustment
Health Care Reform established a permanent risk adjustment program to transfer funds from qualified individual and small group insurance plans with below average risk scores to plans with above average risk scores. Based on the risk of our qualified plan members relative to the average risk of members of other qualified plans in comparable markets, we estimate our ultimate 2014 risk adjustment receivable or payable and reflect the pro-rata
year-to-date impact as an adjustment to our premium revenue. At December 31, 2014, we recorded a net payable of approximately $230 million under the risk adjustment program.
Risk Corridor
Health Care Reform established a temporary three-year risk sharing program for qualified individual and small group insurance plans. Under this program we make (or receive) a payment to (or from) HHS based on the ratio of allowable costs to target costs (as defined by Health Care Reform). We record a risk corridor receivable or payable as an adjustment to premium revenue on a pro-rata year-to-date basis based on our estimate of the ultimate 2014 risk sharing amount. At December 31, 2014, we did not record any Health Care Reform risk corridor receivables because payments from HHS under this program are uncertain, and we recorded an immaterial Health Care Reform risk corridor payable.
We will perform a final reconciliation and settlement with HHS of the 2014 Cost Sharing Subsidy and 3Rs during 2015.
Accounting for the Medicare Part D Prescription Drug Program Plans (“PDPs”)
We were selected by the Centers for Medicare & Medicaid Services (“CMS”) to be a national provider of PDP in all 50 states to both individuals and employer groups in 2014, 2013 and 2012. Under these annual contracts, CMS pays us a portion of the premium, a portion of, or a capitated fee for, catastrophic drug costs and a portion of the health care costs for low-income Medicare beneficiaries and provides a risk-sharing arrangement to limit our exposure to unexpected expenses.
We recognize premiums received from, or on behalf of, members or CMS and capitated fees as premium revenue ratably over the contract period. We expense the cost of covered prescription drugs as incurred. Costs associated with low-income Medicare beneficiaries (deductible, coinsurance, etc.) and the catastrophic drug costs paid in advance by CMS are recorded as a liability and offset health care costs when incurred. For individual PDP coverage, the risk-sharing arrangement provides a risk corridor whereby the amount we received in premiums from members and CMS based on our annual bid is compared to our actual drug costs incurred during the contract year. Based on the risk corridor provision and PDP activity-to-date, an estimated risk-sharing receivable or payable is recorded on a quarterly basis as an adjustment to premium revenue. We perform a reconciliation of the final risk-sharing, low-income subsidy and catastrophic amounts after the end of each contract year.
Allocation of Operating Expenses
We allocate to the business segments centrally-incurred costs associated with specific internal goods or services provided to us, such as employee services, technology services and rent, based on a reasonable method for each specific cost (such as membership, usage, headcount, compensation or square footage occupied). Interest expense on third-party borrowings and the financing components of our pension and other post-retirement benefit plan expense are not allocated to the reporting segments, since they are not used as a basis for measuring the operating performance of the segments. Such amounts are reflected in Corporate Financing in our segment financial information. Refer to Note 19 beginning on page 132 for additional information.
Income Taxes
We are taxed at the statutory corporate income tax rates after adjusting income reported for financial statement purposes for certain items. We recognize deferred income tax assets and liabilities for the differences between the financial and income tax reporting basis of assets and liabilities based on enacted tax rates and laws. Valuation allowances are provided when it is considered more likely than not that deferred tax assets will not be realized. Deferred income tax expense or benefit primarily reflects the net change in deferred income tax assets and liabilities during the year.
Our current income tax provision reflects the tax results of revenues and expenses currently taxable or deductible. Penalties and interest on our tax positions are classified as a component of our income tax provision.
| |
| 3. | Acquisitions; Completed Disposition |
Acquisition of bSwift LLC
In November 2014, we acquired bSwift LLC (“bSwift”) for approximately $400 million. bSwift provides a technology platform that offers a retail shopping experience for health insurance exchanges and employees nationwide, and provides benefit administration technology and services to employers. We preliminarily recorded goodwill related to this transaction of approximately $318 million, none of which will be tax deductible. All of the goodwill related to this acquisition was assigned to our Health Care segment.
Acquisition of the InterGlobal Group
In April 2014, we acquired the InterGlobal group (“InterGlobal”), a company that specializes in international private medical insurance for groups and individuals in the Middle East, Asia, Africa and Europe. The purchase price was not material, and the goodwill related to this acquisition was assigned to our Health Care segment.
Acquisition of Coventry
On the Acquisition Date, we acquired Coventry in a transaction (the “Merger”) valued at approximately $8.7 billion, including the $1.8 billion fair value of Coventry’s outstanding long-term debt.
Pro Forma Impact of the Acquisition of Coventry
The following table presents supplemental pro forma information for the years ended December 31, 2013 and 2012, as if the Merger had occurred on January 1, 2012. The pro forma consolidated results are not necessarily indicative of what our consolidated results would have been had the Merger been completed on January 1, 2012. In addition, the pro forma consolidated results do not purport to project the future results of the combined company nor do they reflect the expected realization of any cost savings associated with the Merger.
|
| | | | | | | | | |
| | | | Year Ended December 31, |
| (Millions, except per common share data) | | | 2013 | | 2012 |
| Total revenue | | | $ | 52,089.3 |
| | $ | 50,282.6 |
|
| Net income attributable to Aetna | | | 2,144.6 |
| | 2,115.1 |
|
| Earnings per share: | | | | | |
| Basic | | | 5.75 |
| | 5.39 |
|
| Diluted | | | 5.69 |
| | 5.33 |
|
| | | | | | |
The unaudited pro forma consolidated results for the years ended December 31, 2013 and 2012 reflect the following pro forma adjustments:
| |
| • | Elimination of intercompany transactions between Aetna and Coventry, primarily related to network rental fees. |
| |
| • | Foregone interest income associated with cash and cash equivalents and investments assumed to have been used to partially fund the Merger. |
| |
| • | Foregone interest income associated with adjusting the amortized cost of Coventry’s investment portfolio to fair value as of the completion of the Merger. |
| |
| • | Elimination of historical Coventry intangible asset amortization expense and capitalized internal-use software amortization expense and addition of intangible asset amortization expense relating to intangibles valued as part of the acquisition. |
| |
| • | Additional interest expense from the long-term debt Aetna issued in November 2012 as well as the interest expense on short-term debt Aetna issued in March and April 2013. Interest expense was reduced for the amortization of the fair value adjustment to long-term debt. |
| |
• | Elimination of transaction-related costs incurred by Aetna and Coventry during 2013 and 2012. |
| |
• | Adjustment of the above pro forma adjustments for the applicable tax impact. |
| |
• | Conforming adjustments to align Coventry’s presentation to Aetna’s accounting policies. |
| |
• | Elimination of revenue and directly identifiable costs related to the sale of Aetna’s Missouri Medicaid business, Missouri Care, Incorporated (“Missouri Care”), to WellCare Health Plans, Inc. on March 31, 2013. |
Completed Disposition
In connection with the acquisition of Coventry, on March 31, 2013, we completed the sale of Missouri Care to WellCare Health Plans, Inc. The sale price was not material, and the transaction did not have a material impact on our financial condition or operating results.
| |
| 4. | Earnings Per Common Share |
Basic earnings per share (“EPS”) is computed by dividing net income attributable to Aetna by the weighted average number of common shares outstanding during the reporting period. Diluted EPS is computed in a similar manner, except that the weighted average number of common shares outstanding is adjusted for the dilutive effects of our outstanding stock-based compensation awards, but only if the effect is dilutive.
The computations of basic and diluted EPS for 2014, 2013 and 2012 are as follows:
|
| | | | | | | | | | | |
| (Millions, except per common share data) | 2014 |
| | 2013 |
| | 2012 |
|
| Net income attributable to Aetna | $ | 2,040.8 |
| | $ | 1,913.6 |
| | $ | 1,657.9 |
|
| Weighted average shares used to compute basic EPS | 355.5 |
| | 355.4 |
| | 340.1 |
|
| Dilutive effect of outstanding stock-based compensation awards | 3.6 |
| | 3.8 |
| | 4.9 |
|
| Weighted average shares used to compute diluted EPS | 359.1 |
| | 359.2 |
| | 345.0 |
|
| Basic EPS | $ | 5.74 |
| | $ | 5.38 |
| | $ | 4.87 |
|
| Diluted EPS | $ | 5.68 |
| | $ | 5.33 |
| | $ | 4.81 |
|
| | | | | | |
The stock-based compensation awards excluded from the calculation of diluted EPS for 2014, 2013 and 2012 are as follows:
|
| | | | | | | | |
| (Millions) | 2014 |
| | 2013 |
| | 2012 |
|
Stock appreciation rights (“SARs”) (1) | .3 |
| | 1.7 |
| | 8.3 |
|
Other stock-based compensation awards (2) | 1.2 |
| | 1.8 |
| | .7 |
|
| | | | | | |
| |
(1) | SARs are excluded from the calculation of diluted EPS if the exercise price is greater than the average market price of Aetna common shares during the period (i.e., the awards are anti-dilutive). |
| |
(2) | Performance stock units ("PSUs"), certain market stock units ("MSUs") with performance conditions, and performance stock appreciation rights ("PSARs") are excluded from the calculation of diluted EPS if all necessary performance conditions have not been satisfied at the end of the reporting period (refer to Note 12 beginning on page 117 for additional information about PSARs). |
All outstanding stock options were included in the calculation of diluted EPS for 2014 and 2013, and the stock options not included in the calculation of diluted EPS for 2012 were not material.
In connection with the May 7, 2013 acquisition of Coventry, we issued approximately 52.2 million Aetna common shares in exchange for all the outstanding shares of Coventry common stock. Those Aetna common shares were outstanding, net of any subsequent share repurchases, and included in the calculation of weighted average shares used to compute basic EPS for the entire year ended December 31, 2014 and from the Acquisition Date through December 31, 2013 for the year ended December 31, 2013, and weighted accordingly.
For 2014, 2013 and 2012, selling expenses (which include broker commissions, the variable component of our internal sales force compensation and premium taxes) and general and administrative expenses were as follows:
|
| | | | | | | | | | | |
| (Millions) | 2014 |
| | 2013 |
| | 2012 |
|
| Selling expenses | $ | 1,653.0 |
| | $ | 1,348.6 |
| | $ | 1,105.5 |
|
| General and administrative expenses: | | | | | |
| Salaries and related benefits | 4,543.5 |
| | 4,139.5 |
| | 3,115.3 |
|
Other general and administrative expenses (1) | 4,641.2 |
| | 3,157.3 |
| | 2,655.6 |
|
Total general and administrative expenses (2) | 9,184.7 |
| | 7,296.8 |
| | 5,770.9 |
|
| Total operating expenses | $ | 10,837.7 |
| | $ | 8,645.4 |
| | $ | 6,876.4 |
|
| | | | | | |
| |
(1) | In 2014, includes fees mandated by the ACA comprised primarily of the HIF of $605.3 million and our estimated contribution to the funding of the reinsurance program of $335.5 million. Refer to Note 2 beginning on page 80 for additional information on fees mandated by the ACA. |
| |
(2) | In 2014, includes: a non-cash settlement charge incurred in connection with the Aetna Pension Plan of $111.6 million; transaction and integration-related costs of $200.7 million and a release of a litigation-related reserve of $103.0 million. In 2013, includes: transaction, integration-related and restructuring costs of $314.6 million and a reduction of expenses related to reversal of an allowance on a reinsurance recoverable of $42.2 million. In 2012, includes: a litigation-related charge of $120.0 million, transaction and integration-related costs of $16.2 million and a severance and facilities charge of $37.0 million. |
Refer to the reconciliation of operating earnings to net income attributable to Aetna in Note 19 beginning on page 132 for additional information.
| |
| 6. | Health Care Costs Payable |
The following table shows the components of the change in health care costs payable during 2014, 2013 and 2012:
|
| | | | | | | | | | | |
| (Millions) | 2014 |
| | 2013 |
| | 2012 |
|
| Health care costs payable, beginning of the period | $ | 4,547.4 |
| | $ | 2,992.5 |
| | $ | 2,675.5 |
|
| Less: Reinsurance recoverables | 8.5 |
| | 3.8 |
| | 3.3 |
|
| Health care costs payable, beginning of the period, net | 4,538.9 |
| | 2,988.7 |
| | 2,672.2 |
|
| Acquisition of businesses | 29.2 |
| | 1,417.2 |
| | — |
|
| Add: Components of incurred health care costs | | | | | |
| Current year | 41,327.5 |
| | 33,344.8 |
| | 23,875.6 |
|
| Prior years | (580.8 | ) | | (448.8 | ) | | (146.7 | ) |
| Total incurred health care costs | 40,746.7 |
| | 32,896.0 |
| | 23,728.9 |
|
| Less: Claims paid | | | | | |
| Current year | 35,850.7 |
| | 30,112.7 |
| | 21,067.7 |
|
| Prior years | 3,848.8 |
| | 2,608.0 |
| | 2,344.7 |
|
| Total claims paid | 39,699.5 |
| | 32,720.7 |
| | 23,412.4 |
|
| Disposition of business | — |
| | (42.3 | ) | | — |
|
| Health care costs payable, end of period, net | 5,615.3 |
| | 4,538.9 |
| | 2,988.7 |
|
| Add: Reinsurance recoverables | 5.8 |
| | 8.5 |
| | 3.8 |
|
| Health care costs payable, end of the period | $ | 5,621.1 |
| | $ | 4,547.4 |
| | $ | 2,992.5 |
|
| | | | | | |
Our estimates of prior years’ health care costs payable decreased by approximately $581 million, $449 million and $147 million in 2014, 2013 and 2012, respectively, resulting from claims being settled for amounts less than originally estimated, primarily due to lower health care cost trends as well as the actual claim submission time being faster than we assumed in establishing our health care costs payable in the prior year. This development does not directly correspond to an increase in our current year operating results as these reductions were offset by estimated current period health care costs when we established our estimate of the current year health care costs payable.
The acquisition of Coventry resulted in a $1.4 billion increase in health care costs payable at the Acquisition Date which significantly impacts the year-over-year comparability of changes in health care costs payable (refer to Note 3 beginning on page 90 for additional information).
| |
| 7. | Goodwill and Other Acquired Intangible Assets |
As discussed in Note 3, we completed the acquisitions of InterGlobal and bSwift in 2014 as well as the Coventry acquisition in 2013. In accordance with applicable accounting guidance, we allocated the amount paid to the fair value of the net assets acquired, with any excess amounts recorded as goodwill. The change in goodwill in 2014 and 2013 is as follows:
|
| | | | | | | |
| (Millions) | 2014 |
| | 2013 |
|
| Balance, beginning of the period | $ | 10,227.5 |
| | $ | 6,214.4 |
|
| Goodwill acquired: | | | |
bSwift (1) | 318.0 |
| | — |
|
| InterGlobal | 67.7 |
| | — |
|
| Coventry | — |
| | 4,014.8 |
|
| Other | — |
| | (1.7 | ) |
Balance, end of the period (2) | $ | 10,613.2 |
| | $ | 10,227.5 |
|
| | | | |
| |
(1) | Goodwill related to the acquisition of bSwift is considered preliminary, pending the final allocation of the applicable purchase price. |
| |
(2) | At both December 31, 2014 and 2013, approximately $113 million was assigned to the Group Insurance segment, with the remainder assigned to the Health Care segment. |
Other acquired intangible assets at December 31, 2014 and 2013 were comprised of the following:
|
| | | | | | | | | | | | | | | | |
| (Millions) | Cost |
| | Accumulated Amortization | | | Net Balance |
| Amortization Period (Years) | | |
| 2014 | | | | | | | | | |
| Provider networks | $ | 1,254.1 |
| | | $ | 570.4 |
| | $ | 683.7 |
| | 12-25 |
| (1) |
| Customer lists | 1,319.5 |
| (2) | | 413.6 |
| | 905.9 |
| | 5-14 |
| (1) |
| Value of business acquired | 149.2 |
| | | 65.3 |
| | 83.9 |
| | 20 |
| (3) |
| Technology | 188.2 |
| (2) | | 74.0 |
| | 114.2 |
| | 4-10 |
| |
| Other | 10.5 |
| | | 2.7 |
| | 7.8 |
| | 2-15 |
| |
| Definite-lived trademarks | 172.4 |
| (2) | | 41.9 |
| | 130.5 |
| | 5-20 |
| |
| Indefinite-lived trademarks | 22.3 |
| | | — |
| | 22.3 |
| | |
| |
| Total other acquired intangible assets | $ | 3,116.2 |
| | | $ | 1,167.9 |
| | $ | 1,948.3 |
| | |
| |
| 2013 | |
| | | |
| | |
| | |
| |
| Provider networks | $ | 1,253.2 |
| | | $ | 508.8 |
| | $ | 744.4 |
| | 12-25 |
| (1) |
| Customer lists | 1,347.0 |
| | | 361.8 |
| | 985.2 |
| | 5-14 |
| (1) |
| Value of business acquired | 149.2 |
| | | 48.5 |
| | 100.7 |
| | 20 |
| (3) |
| Technology | 146.6 |
| | | 49.5 |
| | 97.1 |
| | 4-10 |
| |
| Other | 6.7 |
| | | 1.8 |
| | 4.9 |
| | 2-15 |
| |
| Definite-lived trademarks | 165.0 |
| | | 25.5 |
| | 139.5 |
| | 9-20 |
| |
| Indefinite-lived trademarks | 22.3 |
| | | — |
| | 22.3 |
| | |
| |
| Total other acquired intangible assets | $ | 3,090.0 |
| | | $ | 995.9 |
| | $ | 2,094.1 |
| | |
| |
| | | | | | | | | | |
| |
(1) | The amortization period for our provider networks and customer lists includes an assumption of renewal or extension of these arrangements. At both December 31, 2014 and 2013, the periods prior to the next renewal or extension for our provider networks primarily ranged from 1 to 3 years, and the period prior to the next renewal or extension for our customer lists was approximately 1 year. Any costs related to the renewal or extension of these contracts are expensed as incurred. |
| |
(2) | As a result of our acquisition of bSwift in 2014, we preliminarily assigned $41.6 million to technology, $25.8 million to customer lists, and $6.2 million to definite-lived trademarks. |
| |
(3) | VOBA is being amortized over the expected life of the acquired contracts in proportion to estimated premium. |
We estimate annual pretax amortization for other acquired intangible assets over the next five years to be as follows:
|
| | | |
| (Millions) | |
| 2015 | $ | 254.5 |
|
| 2016 | 248.0 |
|
| 2017 | 233.6 |
|
| 2018 | 197.6 |
|
| 2019 | 191.6 |
|
Total investments at December 31, 2014 and 2013 were as follows:
|
| | | | | | | | | | | | | | | | | | | | | | | |
| | 2014 | | 2013 |
| (Millions) | Current |
| | Long-term |
| | Total |
| | Current |
| | Long-term |
| | Total |
|
| Debt and equity securities available for sale | $ | 2,463.8 |
| | $ | 18,977.9 |
| | $ | 21,441.7 |
| | $ | 1,977.4 |
| | $ | 17,753.0 |
| | $ | 19,730.4 |
|
| Mortgage loans | 124.2 |
| | 1,438.0 |
| | 1,562.2 |
| | 84.9 |
| | 1,464.7 |
| | 1,549.6 |
|
| Other investments | 7.2 |
| | 1,778.0 |
| | 1,785.2 |
| | 1.5 |
| | 1,717.3 |
| | 1,718.8 |
|
| Total investments | $ | 2,595.2 |
| | $ | 22,193.9 |
| | $ | 24,789.1 |
| | $ | 2,063.8 |
| | $ | 20,935.0 |
| | $ | 22,998.8 |
|
At December 31, 2014, approximately $202 million of investments were pledged as collateral under repurchase agreements. We did not have any repurchase agreements outstanding at December 31, 2013. At December 31, 2014 and 2013, approximately $798 million and $766 million, respectively, of investments were pledged under securities loan agreements.
At December 31, 2014 and 2013, we held investments of approximately $778 million and $794 million, respectively, related to the 2012 conversion of an existing group annuity contract from a participating to a non-participating contract. These investments are included in the total investments of our Large Case Pensions segment supporting non-experience-rated products. Although these investments are not accounted for as separate accounts assets, they are legally segregated and are not subject to claims that arise out of our business and only support Aetna’s future policy benefits obligations under that group annuity contract. Refer to Notes 2 and 19 beginning on pages 80 and 132 for additional information.
Debt and Equity Securities
Debt and equity securities available for sale at December 31, 2014 and 2013 were as follows:
|
| | | | | | | | | | | | | | | | |
| (Millions) | Amortized Cost |
| | Gross Unrealized Gains |
| | Gross Unrealized Losses |
| | | Fair Value |
|
| December 31, 2014 | | | | | | | | |
| Debt securities: | | | | | | | | |
| U.S. government securities | $ | 1,301.2 |
| | $ | 96.3 |
| | $ | (.6 | ) | | | $ | 1,396.9 |
|
| States, municipalities and political subdivisions | 4,540.0 |
| | 277.2 |
| | (7.8 | ) | | | 4,809.4 |
|
| U.S. corporate securities | 8,033.2 |
| | 606.8 |
| | (33.6 | ) | | | 8,606.4 |
|
| Foreign securities | 3,343.6 |
| | 267.0 |
| | (18.3 | ) | | | 3,592.3 |
|
| Residential mortgage-backed securities | 902.7 |
| | 28.9 |
| | (3.9 | ) | | | 927.7 |
|
| Commercial mortgage-backed securities | 1,324.6 |
| | 52.8 |
| | (1.6 | ) | (1) | | 1,375.8 |
|
| Other asset-backed securities | 644.7 |
| | 5.8 |
| | (6.5 | ) | (1) | | 644.0 |
|
| Redeemable preferred securities | 56.8 |
| | 12.5 |
| | — |
| | | 69.3 |
|
| Total debt securities | 20,146.8 |
| | 1,347.3 |
| | (72.3 | ) | | | 21,421.8 |
|
| Equity securities | 23.3 |
| | .4 |
| | (3.8 | ) | | | 19.9 |
|
Total debt and equity securities (2) | $ | 20,170.1 |
| | $ | 1,347.7 |
| | $ | (76.1 | ) | | | $ | 21,441.7 |
|
| December 31, 2013 | |
| | |
| | |
| | | |
|
| Debt securities: | |
| | |
| | |
| | | |
|
| U.S. government securities | $ | 1,396.8 |
| | $ | 68.7 |
| | $ | (3.0 | ) | | | $ | 1,462.5 |
|
| States, municipalities and political subdivisions | 4,118.5 |
| | 126.6 |
| | (82.8 | ) | | | 4,162.3 |
|
| U.S. corporate securities | 7,559.0 |
| | 493.7 |
| | (110.1 | ) | | | 7,942.6 |
|
| Foreign securities | 3,209.6 |
| | 198.9 |
| | (53.0 | ) | | | 3,355.5 |
|
| Residential mortgage-backed securities | 928.4 |
| | 16.9 |
| | (21.1 | ) | | | 924.2 |
|
| Commercial mortgage-backed securities | 1,323.5 |
| | 88.2 |
| | (4.7 | ) | (1) | | 1,407.0 |
|
| Other asset-backed securities | 343.4 |
| | 8.3 |
| | (2.1 | ) | (1) | | 349.6 |
|
| Redeemable preferred securities | 56.8 |
| | 8.6 |
| | — |
| | | 65.4 |
|
| Total debt securities | 18,936.0 |
| | 1,009.9 |
| | (276.8 | ) | | | 19,669.1 |
|
| Equity securities | 38.5 |
| | 26.5 |
| | (3.7 | ) | | | 61.3 |
|
Total debt and equity securities (2) | $ | 18,974.5 |
| | $ | 1,036.4 |
| | $ | (280.5 | ) | | | $ | 19,730.4 |
|
| | | | | | | | | |
| |
(1) | At December 31, 2014 and 2013, we held securities for which we previously recognized $18.6 million and $22.8 million, respectively, of non-credit related impairments in accumulated other comprehensive loss. These securities had a net unrealized capital gain at December 31, 2014 and 2013 of $3.6 million and $6.6 million, respectively. |
| |
(2) | Investment risks associated with our experience-rated and discontinued products generally do not impact our operating results (refer to Note 20 beginning on page 135 for additional information on our accounting for discontinued products). At December 31, 2014, debt and equity securities with a fair value of approximately $3.6 billion, gross unrealized capital gains of $391.3 million and gross unrealized capital losses of $16.7 million and, at December 31, 2013, debt and equity securities with a fair value of approximately $3.7 billion, gross unrealized capital gains of $291.3 million and gross unrealized capital losses of $60.3 million were included in total debt and equity securities, but support our experience-rated and discontinued products. Changes in net unrealized capital gains (losses) on these securities are not reflected in accumulated other comprehensive income. |
The fair value of debt securities at December 31, 2014 is shown below by contractual maturity. Actual maturities may differ from contractual maturities because securities may be restructured, called or prepaid.
|
| | | |
| (Millions) | Fair Value |
|
| Due to mature: | |
| Less than one year | $ | 1,163.4 |
|
| One year through five years | 5,551.6 |
|
| After five years through ten years | 5,754.8 |
|
| Greater than ten years | 6,004.5 |
|
| Residential mortgage-backed securities | 927.7 |
|
| Commercial mortgage-backed securities | 1,375.8 |
|
| Other asset-backed securities | 644.0 |
|
| Total | $ | 21,421.8 |
|
Mortgage-Backed and Other Asset-Backed Securities
All of our residential mortgage-backed securities at December 31, 2014 were issued by the Government National Mortgage Association, the Federal National Mortgage Association or the Federal Home Loan Mortgage Corporation and carry agency guarantees and explicit or implicit guarantees by the U.S. Government. At December 31, 2014, our residential mortgage-backed securities had an average credit quality rating of AAA and a weighted average duration of 3.6 years.
Our commercial mortgage-backed securities have underlying loans that are dispersed throughout the United States. Significant market observable inputs used to value these securities include loss severity and probability of default. At December 31, 2014, these securities had an average credit quality rating of AA+ and a weighted average duration of 2.0 years.
Our other asset-backed securities have a variety of underlying collateral (e.g., automobile loans, credit card receivables, home equity loans and commercial loans). Significant market observable inputs used to value these securities include the unemployment rate, loss severity and probability of default. At December 31, 2014, these securities had an average credit quality rating of A+ and a weighted average duration of 1.7 years.
Unrealized Capital Losses and Net Realized Capital Gains (Losses)
When a debt or equity security is in an unrealized capital loss position, we monitor the duration and severity of the loss to determine if sufficient market recovery can occur within a reasonable period of time. We recognize an other-than-temporary impairment (“OTTI”) when we intend to sell a debt security that is in an unrealized capital loss position or if we determine a credit-related loss on a debt or equity security has occurred.
Summarized below are the debt and equity securities we held at December 31, 2014 and 2013 that were in an unrealized capital loss position, aggregated by the length of time the investments have been in that position:
|
| | | | | | | | | | | | | | | | | | | | | | | |
| | Less than 12 months | | Greater than 12 months | | Total (1) |
| (Millions) | Fair Value |
| | Unrealized Losses |
| | Fair Value |
| | Unrealized Losses |
| | Fair Value |
| | Unrealized Losses |
|
| December 31, 2014 | | | | | | | | | | | |
| Debt securities: | | | | | | | | | | | |
| U.S. government securities | $ | 20.6 |
| | $ | .1 |
| | $ | 19.8 |
| | $ | .5 |
| | $ | 40.4 |
| | $ | .6 |
|
| States, municipalities and political subdivisions | 457.4 |
| | 2.2 |
| | 347.4 |
| | 5.6 |
| | 804.8 |
| | 7.8 |
|
| U.S. corporate securities | 1,074.1 |
| | 19.9 |
| | 515.2 |
| | 13.7 |
| | 1,589.3 |
| | 33.6 |
|
| Foreign securities | 540.0 |
| | 12.8 |
| | 148.0 |
| | 5.5 |
| | 688.0 |
| | 18.3 |
|
| Residential mortgage-backed securities | 3.9 |
| | .1 |
| | 166.9 |
| | 3.8 |
| | 170.8 |
| | 3.9 |
|
| Commercial mortgage-backed securities | 181.5 |
| | .7 |
| | 69.0 |
| | .9 |
| | 250.5 |
| | 1.6 |
|
| Other asset-backed securities | 373.1 |
| | 6.1 |
| | 21.3 |
| | .4 |
| | 394.4 |
| | 6.5 |
|
| Redeemable preferred securities | 3.0 |
| | — |
| | — |
| | — |
| | 3.0 |
| | — |
|
| Total debt securities | 2,653.6 |
| | 41.9 |
| | 1,287.6 |
| | 30.4 |
| | 3,941.2 |
| | 72.3 |
|
| Equity securities | 8.0 |
| | — |
| | 1.4 |
| | 3.8 |
| | 9.4 |
| | 3.8 |
|
Total debt and equity securities (1) | $ | 2,661.6 |
| | $ | 41.9 |
| | $ | 1,289.0 |
| | $ | 34.2 |
| | $ | 3,950.6 |
| | $ | 76.1 |
|
| December 31, 2013 | |
| | |
| | |
| | |
| | |
| | |
|
| Debt securities: | |
| | |
| | |
| | |
| | |
| | |
|
| U.S. government securities | $ | 555.9 |
| | $ | 2.7 |
| | $ | 13.4 |
| | $ | .3 |
| | $ | 569.3 |
| | $ | 3.0 |
|
| States, municipalities and political subdivisions | 1,779.9 |
| | 73.1 |
| | 132.4 |
| | 9.7 |
| | 1,912.3 |
| | 82.8 |
|
| U.S. corporate securities | 2,196.8 |
| | 88.0 |
| | 170.0 |
| | 22.1 |
| | 2,366.8 |
| | 110.1 |
|
| Foreign securities | 875.2 |
| | 43.5 |
| | 90.9 |
| | 9.5 |
| | 966.1 |
| | 53.0 |
|
| Residential mortgage-backed securities | 541.1 |
| | 17.3 |
| | 35.0 |
| | 3.8 |
| | 576.1 |
| | 21.1 |
|
| Commercial mortgage-backed securities | 162.4 |
| | 4.2 |
| | 25.0 |
| | .5 |
| | 187.4 |
| | 4.7 |
|
| Other asset-backed securities | 87.8 |
| | 1.9 |
| | 7.7 |
| | .2 |
| | 95.5 |
| | 2.1 |
|
| Redeemable preferred securities | 4.4 |
| | — |
| | — |
| | — |
| | 4.4 |
| | — |
|
| Total debt securities | 6,203.5 |
| | 230.7 |
| | 474.4 |
| | 46.1 |
| | 6,677.9 |
| | 276.8 |
|
| Equity securities | — |
| | — |
| | 16.2 |
| | 3.7 |
| | 16.2 |
| | 3.7 |
|
Total debt and equity securities (1) | $ | 6,203.5 |
| | $ | 230.7 |
| | $ | 490.6 |
| | $ | 49.8 |
| | $ | 6,694.1 |
| | $ | 280.5 |
|
| | | | | | | | | | | | |
| |
(1) | At December 31, 2014 and 2013, debt and equity securities in an unrealized capital loss position of $16.7 million and $60.3 million, respectively, and with related fair value of $402.7 million and $1.0 billion, respectively, related to experience-rated and discontinued products. |
We reviewed the securities in the tables above and concluded that these are performing assets generating investment income to support the needs of our business. In performing this review, we considered factors such as the quality of the investment security based on research performed by our internal credit analysts and external rating agencies and the prospects of realizing the carrying value of the security based on the investment’s current prospects for recovery. At December 31, 2014, we did not intend to sell these securities, and we did not believe it was more likely than not that we would be required to sell these securities prior to anticipated recovery of their amortized cost basis.
The maturity dates for debt securities in an unrealized capital loss position at December 31, 2014 were as follows:
|
| | | | | | | | | | | | | | | | | | | | | | | |
| | Supporting discontinued and experience-rated products | | Supporting remaining products | | Total |
| (Millions) | Fair Value |
| | Unrealized Losses |
| | Fair Value |
| | Unrealized Losses |
| | Fair Value |
| | Unrealized Losses |
|
| Due to mature: | | | | | | | | | | | |
| Less than one year | $ | — |
| | $ | — |
| | $ | 69.5 |
| | $ | .3 |
| | $ | 69.5 |
| | $ | .3 |
|
| One year through five years | 50.4 |
| | .4 |
| | 1,055.5 |
| | 9.5 |
| | 1,105.9 |
| | 9.9 |
|
| After five years through ten years | 182.7 |
| | 5.2 |
| | 1,150.2 |
| | 23.5 |
| | 1,332.9 |
| | 28.7 |
|
| Greater than ten years | 152.8 |
| | 7.2 |
| | 464.4 |
| | 14.2 |
| | 617.2 |
| | 21.4 |
|
| Residential mortgage-backed securities | — |
| | — |
| | 170.8 |
| | 3.9 |
| | 170.8 |
| | 3.9 |
|
| Commercial mortgage-backed securities | 15.4 |
| | — |
| | 235.1 |
| | 1.6 |
| | 250.5 |
| | 1.6 |
|
| Other asset-backed securities | — |
| | — |
| | 394.4 |
| | 6.5 |
| | 394.4 |
| | 6.5 |
|
| Total | $ | 401.3 |
| | $ | 12.8 |
| | $ | 3,539.9 |
| | $ | 59.5 |
| | $ | 3,941.2 |
| | $ | 72.3 |
|
| | | | | | | | | | | | |
Net realized capital gains (losses) for the three years ended December 31, 2014, 2013 and 2012, excluding amounts related to experience-rated contract holders and discontinued products, were as follows:
|
| | | | | | | | | | | |
| (Millions) | 2014 |
| | 2013 |
| | 2012 |
|
| OTTI losses on debt securities | $ | (4.6 | ) | | $ | (36.6 | ) | | $ | (10.9 | ) |
Portion of OTTI losses on debt securities recognized in other comprehensive income | — |
| | — |
| | .1 |
|
| Net OTTI losses on debt securities recognized in earnings | (4.6 | ) | | (36.6 | ) | | (10.8 | ) |
| Net realized capital gains, excluding OTTI losses on debt securities | 85.0 |
| | 27.8 |
| | 119.5 |
|
| Net realized capital gains (losses) | $ | 80.4 |
| | $ | (8.8 | ) | | $ | 108.7 |
|
The net realized capital gains in 2014 were primarily attributable to gains from the sales of debt and equity securities. The net realized capital losses in 2013 were primarily attributable to yield-related OTTI on debt securities, primarily on U.S. Treasury securities that we had the intent to sell, partially offset by gains from the sales of debt securities. The net realized capital gains in 2012 were primarily attributable to the sale of debt securities partially offset by losses on derivative transactions.
Yield-related impairments are recognized in other comprehensive income unless we have the intention to sell the security in an unrealized loss position, in which case the yield-related OTTI is recognized in earnings. Yield-related OTTI losses were not significant in 2014 or 2012. In 2013, we recognized yield-related OTTI losses of $33 million related to our debt securities. We had no other individually material realized capital losses on debt or equity securities that impacted our operating results during 2014, 2013 or 2012.
Excluding amounts related to experience-rated and discontinued products, proceeds from the sale of debt securities and the related gross realized capital gains and losses for 2014, 2013 and 2012 were as follows:
|
| | | | | | | | | | | |
| (Millions) | 2014 |
| | 2013 |
| | 2012 |
|
| Proceeds on sales | $ | 4,727.7 |
| | $ | 6,524.8 |
| | $ | 5,819.2 |
|
| Gross realized capital gains | 91.1 |
| | 113.9 |
| | 171.7 |
|
| Gross realized capital losses | 35.5 |
| | 100.0 |
| | 17.4 |
|
| | | | | | |
Mortgage Loans
Our mortgage loans are collateralized by commercial real estate. During 2014 and 2013 we had the following activity in our mortgage loan portfolio:
|
| | | | | | | |
| (Millions) | 2014 |
| | 2013 |
|
| New mortgage loans | $ | 217.0 |
| | $ | 195.0 |
|
| Mortgage loans fully-repaid | 133.7 |
| | 222.0 |
|
| Mortgage loans foreclosed | — |
| | 8.5 |
|
| | | | |
At December 31, 2014 and 2013, we had no material problem, restructured or potential problem mortgage loans. We also had no material impairment reserves on these loans at December 31, 2014 or 2013.
We assess our mortgage loans on a regular basis for credit impairments, and annually assign a credit quality indicator to each loan. Our credit quality indicator is internally developed and categorizes our portfolio on a scale from 1 to 7. Category 1 represents loans of superior quality, and Categories 6 and 7 represent loans where collections are potentially at risk. The vast majority of our mortgage loans fall into the Level 2 to 4 ratings. These ratings represent loans where credit risk is minimal to acceptable; however, these loans may display some susceptibility to economic changes. Category 5 represents loans where credit risk is not substantial but these loans warrant management’s close attention. These indicators are based upon several factors, including current loan to value ratios, property condition, market trends, creditworthiness of the borrower and deal structure. Based upon our most recent assessments at December 31, 2014 and 2013, our mortgage loans were given the following credit quality indicators:
|
| | | | | | |
| (In Millions, except credit ratings indicator) | 2014 |
| 2013 |
|
| 1 | $ | 59.7 |
| $ | 69.2 |
|
| 2 to 4 | 1,443.4 |
| 1,399.6 |
|
| 5 | 18.6 |
| 30.6 |
|
| 6 and 7 | 40.5 |
| 50.2 |
|
| Total | $ | 1,562.2 |
| $ | 1,549.6 |
|
| | | |
At December 31, 2014 scheduled mortgage loan principal repayments were as follows:
|
| | | |
| (Millions) | |
| 2015 | $ | 127.6 |
|
| 2016 | 188.3 |
|
| 2017 | 220.5 |
|
| 2018 | 171.2 |
|
| 2019 | 100.3 |
|
| Thereafter | 763.0 |
|
Variable Interest Entities
In determining whether to consolidate a variable interest entity (“VIE”), we consider several factors including whether we have the power to direct activities, the obligation to absorb losses and the right to receive benefits that could potentially be significant to the VIE. We have relationships with certain real estate partnerships and one hedge fund partnership that are considered VIEs, but are not consolidated. We record the amount of our investment in these partnerships as long-term investments on our balance sheets and recognize our share of partnership income or losses in earnings. Our maximum exposure to loss as a result of our investment in these partnerships is our investment balance at December 31, 2014 and 2013 of approximately $209 million and $205 million, respectively, and the risk of recapture of tax credits related to the real estate partnerships previously recognized, which we do not consider significant. We do not have a future obligation to fund losses or debts on behalf of these investments; however, we may voluntarily contribute funds. The real estate partnerships construct, own and manage low-income housing developments and had total assets of approximately $5.7 billion and $5.8 billion at December 31, 2014 and 2013, respectively. The hedge fund partnership had total assets of approximately $7.1 billion and $7.0 billion at December 31, 2014 and 2013, respectively.
Non-controlling (Minority) Interests
At December 31, 2014 and 2013, continuing business non-controlling interests were approximately $69 million and $53 million, respectively, primarily related to third party interests in our investment holdings as well as third party interests in certain of our operating entities. The non-controlling entities’ share was included in total equity. In 2014 and 2012, net income attributable to non-controlling interests was $4.4 million and $1.9 million, respectively. Net loss attributable to non-controlling interests was $1.7 million in 2013. These non-controlling interests did not have a material impact on our financial condition or operating results.
Net Investment Income
Sources of net investment income for 2014, 2013 and 2012 were as follows:
|
| | | | | | | | | | | |
| (Millions) | 2014 |
| | 2013 |
| | 2012 |
|
| Debt securities | $ | 800.8 |
| | $ | 768.5 |
| | $ | 763.7 |
|
| Mortgage loans | 108.2 |
| | 99.4 |
| | 122.4 |
|
| Other investments | 76.4 |
| | 86.1 |
| | 70.7 |
|
| Gross investment income | 985.4 |
| | 954.0 |
| | 956.8 |
|
| Investment expenses | (39.5 | ) | | (37.7 | ) | | (34.6 | ) |
Net investment income (1) | $ | 945.9 |
| | $ | 916.3 |
| | $ | 922.2 |
|
| | | | | | |
| |
(1) | Net investment income includes $289.1 million, $293.5 million and $324.2 million for 2014, 2013 and 2012, respectively, related to investments supporting our experience-rated and discontinued products. |
| |
| 9. | Other Comprehensive (Loss) Income |
Shareholders’ equity included the following activity in accumulated other comprehensive loss in 2014, 2013 and 2012:
|
| | | | | | | | | | | | | | | | | | | |
| | Net Unrealized Gains (Losses) | | | Total Accumulated Other
Comprehensive (Loss) Income | |
| | Securities | Foreign Currency
and
Derivatives | | | Pension and OPEB Plans |
|
| (Millions) | Previously Impaired (1) |
| | All Other |
|
| Balance at December 31, 2011 | $ | 58.2 |
| | $ | 595.2 |
| | $ | (33.7 | ) | | $ | (1,808.9 | ) | | $ | (1,189.2 | ) |
| Other comprehensive (loss) income | (.9 | ) | | 230.0 |
| | 4.2 |
| | (77.5 | ) | | 155.8 |
|
| Balance at December 31, 2012 | 57.3 |
| | 825.2 |
| | (29.5 | ) | | (1,886.4 | ) | | (1,033.4 | ) |
| Other comprehensive (loss) income | | | | | | | | | |
| before reclassifications | (47.2 | ) | | (522.1 | ) | | 26.4 |
| | 565.1 |
| | 22.2 |
|
| Amounts reclassified from accumulated | | | | | | | | | |
| other comprehensive income | 24.1 |
| (2) | 23.7 |
| (2) | 3.5 |
| (3) | 47.8 |
| (4) | 99.1 |
|
| Other comprehensive (loss) income | (23.1 | ) | | (498.4 | ) | | 29.9 |
| | 612.9 |
| | 121.3 |
|
| Balance at December 31, 2013 | 34.2 |
| | 326.8 |
| | .4 |
| | (1,273.5 | ) | | (912.1 | ) |
| Other comprehensive income (loss) | | | | | | | | | |
| before reclassifications | .9 |
| | 236.9 |
| | (58.6 | ) | | (480.6 | ) | | (301.4 | ) |
| Amounts reclassified from accumulated | | | | | | | | | |
| other comprehensive income | (.2 | ) | (2) | 4.3 |
| (2) | (2.7 | ) | (3) | 100.8 |
| (4) | 102.2 |
|
| Other comprehensive income (loss) | .7 |
| | 241.2 |
| | (61.3 | ) | | (379.8 | ) | | (199.2 | ) |
| Balance at December 31, 2014 | $ | 34.9 |
| | $ | 568.0 |
| | $ | (60.9 | ) | | $ | (1,653.3 | ) | | $ | (1,111.3 | ) |
| | | | | | | | | | |
| |
(1) | Represents unrealized gains on the non-credit related component of impaired debt securities that we do not intend to sell and subsequent changes in the fair value of any previously impaired security. |
| |
(2) | Reclassifications out of accumulated other comprehensive income for previously impaired debt securities and all other securities are reflected in net realized capital gains (losses) within the Consolidated Statements of Income. |
| |
(3) | Reclassifications out of accumulated other comprehensive income for foreign currency gains (losses) and derivatives are reflected in net realized capital gains (losses) within the Consolidated Statements of Income, except for the effective portion of derivatives related to interest rate swaps which are reflected in interest expense and were not material during 2014 or 2013. Refer to Note 14 of Notes to Consolidated Financial Statements beginning on page 123 for additional information. |
| |
(4) | Reclassifications out of accumulated other comprehensive income for pension and OPEB plan expenses are reflected in general and administrative expenses within the Consolidated Statements of Income. During 2014, our reclassifications out of accumulated other comprehensive income for the Aetna Pension Plan reflect a pension settlement charge of $72.5 million ($111.6 million pretax). (Refer to Note 11 beginning on page 109 for additional information). |
Refer to the Consolidated Statements of Comprehensive Income on page 75 for additional information regarding reclassifications out of accumulated other comprehensive income on a pretax basis.
The components of our pension and other postretirement employee benefit (“OPEB”) plans included the following activity in accumulated other comprehensive loss in 2014, 2013 and 2012:
|
| | | | | | | | | | | | | | | | | | | | |
| | Pension Plans | | OPEB Plans | |
| | Unrecognized | | | Unrecognized |
| | Unrecognized | | | Unrecognized |
| |
| | Net Actuarial | | | Prior Service |
| | Net Actuarial | | | Prior Service |
| |
| (Millions) | | Losses |
| | Credits |
| | | Losses |
| | Credits |
| Total |
|
| Balance at December 31, 2011 | | $ | (1,778.3 | ) | | $ | 1.5 |
| | | $ | (56.3 | ) | | $ | 24.2 |
| $ | (1,808.9 | ) |
| Unrealized net losses arising during | | | | | | | | | | |
| the period ($(189.8) pretax) | | (130.4 | ) | | — |
| | | 7.0 |
| | — |
| (123.4 | ) |
| Reclassification to earnings ($(70.6) pretax) | | 45.7 |
| | (.3 | ) | | | 2.9 |
| | (2.4 | ) | 45.9 |
|
| Balance at December 31, 2012 | | (1,863.0 | ) | | 1.2 |
| | | (46.4 | ) | | 21.8 |
| (1,886.4 | ) |
| Unrealized net gains arising during | | | | | | | | | | |
| the period ($869.3 pretax) | | 550.1 |
| | — |
| | | 15.0 |
| | — |
| 565.1 |
|
| Reclassification to earnings ($(73.6) pretax) | | 49.0 |
| | (.3 | ) | | | 1.5 |
| | (2.4 | ) | 47.8 |
|
| Balance at December 31, 2013 | | (1,263.9 | ) | | .9 |
| | | (29.9 | ) | | 19.4 |
| (1,273.5 | ) |
| Unrealized net losses arising during | | | | | | | | | | |
| the period ($(739.4) pretax) | | (460.0 | ) | | — |
| | | (20.6 | ) | | — |
| (480.6 | ) |
| Reclassification to earnings ($(155.2) pretax) | | 102.9 |
| | (.2 | ) | | | .6 |
| | (2.5 | ) | 100.8 |
|
| Balance at December 31, 2014 | | $ | (1,621.0 | ) | | $ | .7 |
| | | $ | (49.9 | ) | | $ | 16.9 |
| $ | (1,653.3 | ) |
| | | | | | | | | | | |
The preparation of our consolidated financial statements in accordance with GAAP requires certain of our assets and liabilities to be reflected at their fair value, and others on another basis, such as an adjusted historical cost basis. In this note, we provide details on the fair value of financial assets and liabilities and how we determine those fair values. We present this information for those financial instruments that are measured at fair value for which the change in fair value impacts net income attributable to Aetna or other comprehensive income separately from other financial assets and liabilities.
Financial Instruments Measured at Fair Value in our Balance Sheets
Certain of our financial instruments are measured at fair value in our balance sheets. The fair values of these instruments are based on valuations that include inputs that can be classified within one of three levels of a hierarchy established by GAAP. The following are the levels of the hierarchy and a brief description of the type of valuation information (“inputs”) that qualifies a financial asset or liability for each level:
| |
| ◦ | Level 1 – Unadjusted quoted prices for identical assets or liabilities in active markets. |
| |
| ◦ | Level 2 – Inputs other than Level 1 that are based on observable market data. These include: quoted prices for similar assets in active markets, quoted prices for identical assets in inactive markets, inputs that are observable that are not prices (such as interest rates and credit risks) and inputs that are derived from or corroborated by observable markets. |
| |
| ◦ | Level 3 – Developed from unobservable data, reflecting our own assumptions. |
Financial assets and liabilities are classified based upon the lowest level of input that is significant to the valuation. When quoted prices in active markets for identical assets and liabilities are available, we use these quoted market prices to determine the fair value of financial assets and liabilities and classify these assets and liabilities in Level 1. In other cases where a quoted market price for identical assets and liabilities in an active market is either not available or not observable, we estimate fair value using valuation methodologies based on available and observable market information or by using a matrix pricing model. These financial assets and liabilities would then be classified in Level 2. If quoted market prices are not available, we determine fair value using broker quotes or an internal analysis of each investment’s financial performance and cash flow projections. Thus, financial assets and liabilities may be classified in Level 3 even though there may be some significant inputs that may be observable.
The following is a description of the valuation methodologies used for our financial assets and liabilities that are measured at fair value, including the general classification of such assets and liabilities pursuant to the valuation hierarchy.
Debt Securities – Where quoted prices are available in an active market, our debt securities are classified in Level 1 of the fair value hierarchy. Our Level 1 debt securities are comprised primarily of U.S. Treasury securities.
The fair values of our Level 2 debt securities are obtained using models such as matrix pricing, which use quoted market prices of debt securities with similar characteristics, or discounted cash flows to estimate fair value. We review these prices to ensure they are based on observable market inputs that include, but are not limited to, quoted prices for similar assets in active markets, quoted prices for identical assets in inactive markets and inputs that are observable but not prices (for example, interest rates and credit risks). We also review the methodologies and the assumptions used to calculate prices from these observable inputs. On a quarterly basis, we select a sample of our Level 2 debt securities’ prices and compare them to prices provided by a secondary source. Variances over a specified threshold are identified and reviewed to confirm the price provided by the primary source represents an appropriate estimate of fair value. In addition, our internal investment team consistently compares the prices obtained for select Level 2 debt securities to the team’s own independent estimates of fair value for those securities. We obtained one price for each of our Level 2 debt securities and did not adjust any of these prices at December 31, 2014 or 2013.
We also value certain debt securities using Level 3 inputs. For Level 3 debt securities, fair values are determined by outside brokers or, in the case of certain private placement securities, are priced internally. Outside brokers determine the value of these debt securities through a combination of their knowledge of the current pricing environment and market flows. We obtained one non-binding broker quote for each of these Level 3 debt securities and did not adjust any of these quotes at December 31, 2014 or 2013. The total fair value of our broker quoted debt securities was approximately $126 million and $103 million at December 31, 2014 and 2013, respectively. Examples of these broker quoted Level 3 debt securities include certain U.S. and foreign corporate securities and certain of our commercial mortgage-backed securities as well as other asset-backed securities. For some of our private placement securities, our internal staff determines the value of these debt securities by analyzing spreads of corporate and sector indices as well as interest spreads of comparable public bonds. Examples of these private placement Level 3 debt securities include certain U.S. and foreign securities and certain tax-exempt municipal securities.
Equity Securities – We currently have two classifications of equity securities: those that are publicly traded and those that are privately held. Our publicly-traded securities are classified in Level 1 because quoted prices are available for these securities in an active market. For privately-held equity securities, there is no active market; therefore, we classify these securities in Level 3 because we price these securities through an internal analysis of each investment’s financial statements and cash flow projections. Significant unobservable inputs consist of earnings and revenue multiples, discount for lack of marketability and comparability adjustments. An increase or decrease in any of these unobservable inputs would result in a change in the fair value measurement, which may be significant.
Derivatives – Where quoted prices are available in an active market, our derivatives are classified in Level 1. Certain of our derivative instruments are valued using models that primarily use market observable inputs and therefore are classified in Level 2 because they are traded in markets where quoted market prices are not readily available.
Financial assets and liabilities measured at fair value on a recurring basis in our balance sheets at December 31, 2014 and 2013 were as follows:
|
| | | | | | | | | | | | | | | |
| | | | | | | | |
| (Millions) | Level 1 |
| | Level 2 |
| | Level 3 |
| | Total |
|
| December 31, 2014 | | | | | | | |
| Assets: | | | | | | | |
| Debt securities: | | | | | | | |
| U.S. government securities | $ | 1,198.4 |
| | $ | 198.5 |
| | $ | — |
| | $ | 1,396.9 |
|
| States, municipalities and political subdivisions | — |
| | 4,808.2 |
| | 1.2 |
| | 4,809.4 |
|
| U.S. corporate securities | — |
| | 8,548.2 |
| | 58.2 |
| | 8,606.4 |
|
| Foreign securities | — |
| | 3,560.7 |
| | 31.6 |
| | 3,592.3 |
|
| Residential mortgage-backed securities | — |
| | 927.7 |
| | — |
| | 927.7 |
|
| Commercial mortgage-backed securities | — |
| | 1,368.3 |
| | 7.5 |
| | 1,375.8 |
|
| Other asset-backed securities | — |
| | 602.5 |
| | 41.5 |
| | 644.0 |
|
| Redeemable preferred securities | — |
| | 65.2 |
| | 4.1 |
| | 69.3 |
|
| Total debt securities | 1,198.4 |
| | 20,079.3 |
| | 144.1 |
| | 21,421.8 |
|
| Equity securities | 1.8 |
| | — |
| | 18.1 |
| | 19.9 |
|
| Derivatives | — |
| | .3 |
| | — |
| | .3 |
|
| Total | $ | 1,200.2 |
| | $ | 20,079.6 |
| | $ | 162.2 |
| | $ | 21,442.0 |
|
| Liabilities: | |
| | |
| | |
| | |
|
| Derivatives | $ | — |
| | $ | 53.4 |
| | $ | — |
| | $ | 53.4 |
|
| December 31, 2013 | |
| | |
| | |
| | |
|
| Assets: | |
| | |
| | |
| | |
|
| Debt securities: | |
| | |
| | |
| | |
|
| U.S. government securities | $ | 1,237.5 |
| | $ | 225.0 |
| | $ | — |
| | $ | 1,462.5 |
|
| States, municipalities and political subdivisions | — |
| | 4,161.0 |
| | 1.3 |
| | 4,162.3 |
|
| U.S. corporate securities | — |
| | 7,911.4 |
| | 31.2 |
| | 7,942.6 |
|
| Foreign securities | — |
| | 3,311.6 |
| | 43.9 |
| | 3,355.5 |
|
| Residential mortgage-backed securities | — |
| | 924.2 |
| | — |
| | 924.2 |
|
| Commercial mortgage-backed securities | — |
| | 1,399.5 |
| | 7.5 |
| | 1,407.0 |
|
| Other asset-backed securities | — |
| | 317.3 |
| | 32.3 |
| | 349.6 |
|
| Redeemable preferred securities | — |
| | 61.3 |
| | 4.1 |
| | 65.4 |
|
| Total debt securities | 1,237.5 |
| | 18,311.3 |
| | 120.3 |
| | 19,669.1 |
|
| Equity securities | 17.1 |
| | — |
| | 44.2 |
| | 61.3 |
|
| Derivatives | — |
| | 49.1 |
| | — |
| | 49.1 |
|
| Total | $ | 1,254.6 |
| | $ | 18,360.4 |
| | $ | 164.5 |
| | $ | 19,779.5 |
|
| Liabilities: | |
| | |
| | |
| | |
|
| Derivatives | $ | — |
| | $ | 1.9 |
| | $ | — |
| | $ | 1.9 |
|
| | | | | | | | |
There were no transfers between Levels 1 and 2 during the years ended December 31, 2014 and 2013.
The changes in the balances of Level 3 financial assets during 2014 were as follows:
|
| | | | | | | | | | | | | | | | | | | |
| (Millions) | Foreign Securities |
| | U.S. corporate securities |
| | Equity Securities |
| | Other |
| | Total |
|
| Beginning balance | $ | 43.9 |
| | $ | 31.2 |
| | $ | 44.2 |
| | $ | 45.2 |
| | $ | 164.5 |
|
| Net realized and unrealized capital gains (losses): | | | | | | | | | |
|
Included in earnings | (.5 | ) | | (4.0 | ) | | (.1 | ) | | (.1 | ) | | (4.7 | ) |
| Included in other comprehensive income | .5 |
| | (2.0 | ) | | (26.0 | ) | | .1 |
| | (27.4 | ) |
Other (1) | .4 |
| | (.4 | ) | | 4.3 |
| | — |
| | 4.3 |
|
| Purchases | 10.5 |
| | 42.9 |
| | 5.0 |
| | 16.6 |
| | 75.0 |
|
| Sales | (12.4 | ) | | (1.5 | ) | | (9.2 | ) | | — |
| | (23.1 | ) |
| Settlements | (1.1 | ) | | (2.3 | ) | | (.1 | ) | | (7.5 | ) | | (11.0 | ) |
| Transfers out of Level 3, net | (9.7 | ) | | (5.7 | ) | | — |
| | — |
| | (15.4 | ) |
| Ending balance | $ | 31.6 |
| | $ | 58.2 |
| | $ | 18.1 |
| | $ | 54.3 |
| | $ | 162.2 |
|
| | | | | | | | | | |
| |
(1) | Reflects realized and unrealized capital gains and losses on investments supporting our experience-rated and discontinued products, which do not impact our operating results. |
The changes in the balances of Level 3 financial assets during 2013 were as follows:
|
| | | | | | | | | | | | | | | | | | | |
| (Millions) | Foreign Securities |
| | Commercial Mortgage-backed Securities |
| | Equity Securities |
| | Other |
| | Total |
|
| Beginning balance | $ | 52.7 |
| | $ | 20.1 |
| | $ | 22.1 |
| | $ | 100.9 |
| | $ | 195.8 |
|
| Net realized and unrealized capital gains (losses): | | | | | | | | | |
|
Included in earnings | .5 |
| | 4.0 |
| | 2.8 |
| | (3.7 | ) | | 3.6 |
|
| Included in other comprehensive income | (3.4 | ) | | (3.8 | ) | | 21.2 |
| | (4.0 | ) | | 10.0 |
|
Other (1) | (.2 | ) | | — |
| | 11.2 |
| | 1.1 |
| | 12.1 |
|
| Purchases | 41.5 |
| | 3.1 |
| | 13.0 |
| | 31.9 |
| | 89.5 |
|
| Sales | (27.2 | ) | | (2.5 | ) | | (26.1 | ) | | (13.8 | ) | | (69.6 | ) |
| Settlements | (5.4 | ) | | (10.4 | ) | | — |
| | (16.0 | ) | | (31.8 | ) |
| Transfers out of Level 3, net | (14.6 | ) | | (3.0 | ) | | — |
| | (27.5 | ) |
| (45.1 | ) |
| Ending balance | $ | 43.9 |
| | $ | 7.5 |
| | $ | 44.2 |
| | $ | 68.9 |
| | $ | 164.5 |
|
| | | | | | | | | | |
| |
(1) | Reflects realized and unrealized capital gains and losses on investments supporting our experience-rated and discontinued products, which do not impact our operating results. |
The total gross transfers into (out of) Level 3 during the years ended December 31, 2014 and 2013 were as follows:
|
| | | | | | |
| (Millions) | 2014 | 2013 |
| Gross transfers into Level 3 | $ | 1.9 |
| $ | 3.8 |
|
| Gross transfers out of Level 3 | (17.3 | ) | (48.9 | ) |
| Net transfers out of Level 3 | $ | (15.4 | ) | $ | (45.1 | ) |
| | | |
Gross transfers out of Level 3 during 2014 primarily related to foreign debt securities and U.S. corporate securities, while gross transfers into Level 3 during 2014 primarily related to other asset-backed securities. Gross transfers out of Level 3 during 2013 primarily related to securities of States, municipalities and political subdivisions; U.S. corporate debt securities; and Foreign debt securities, while gross transfers into Level 3 during 2013 primarily related to foreign debt securities. The fair value of securities transferred out of Level 3 during 2014 and 2013 had been based on broker quotes and is now based primarily on a matrix pricing model, which uses quoted market prices of debt securities with similar characteristics. Gross transfers into Level 3 during 2014 and 2013 primarily were due to quoted prices for certain securities no longer being available in active markets.
Financial Instruments Not Measured at Fair Value in our Balance Sheets
The following is a description of the valuation methodologies used for estimating the fair value of our financial assets and liabilities that are carried on our balance sheets at adjusted cost or contract value.
Mortgage loans: Fair values are estimated by discounting expected mortgage loan cash flows at market rates that reflect the rates at which similar loans would be made to similar borrowers. These rates reflect our assessment of the credit worthiness of the borrower and the remaining duration of the loans. The fair value estimates of mortgage loans of lower credit quality, including problem and restructured loans, are based on the estimated fair value of the underlying collateral.
Bank loans: Where fair value is determined by quoted market prices of bank loans with similar characteristics, our bank loans are classified in Level 2. For bank loans classified in Level 3, fair value is determined by outside brokers using their internal analyses through a combination of their knowledge of the current pricing environment and market flows.
Equity securities: Certain of our equity securities are carried at cost. The fair values of our cost-method investments are not estimated if there are no identified events or changes in circumstances that may have a significant adverse effect on the fair value of the investment.
Investment contract liabilities:
•With a fixed maturity: Fair value is estimated by discounting cash flows at interest rates currently
being offered by, or available to, us for similar contracts.
•Without a fixed maturity: Fair value is estimated as the amount payable to the contract holder upon
demand. However, we have the right under such contracts to delay payment of withdrawals that
may ultimately result in paying an amount different than that determined to be payable on demand.
Long-term debt: Fair values are based on quoted market prices for the same or similar issued debt or, if no quoted market prices are available, on the current rates estimated to be available to us for debt of similar terms and remaining maturities.
The carrying value and estimated fair value classified by level of fair value hierarchy for certain of our financial instruments at December 31, 2014 and 2013 were as follows:
|
| | | | | | | | | | | | | | | | |
| | Carrying Value |
| | Estimated Fair Value |
| (Millions) | | Level 1 |
| Level 2 |
| Level 3 |
| Total |
|
| December 31, 2014 | | | | | | |
| Assets: | | | | | | |
| Mortgage loans | $ | 1,562.2 |
| | $ | — |
| $ | — |
| $ | 1,621.4 |
| $ | 1,621.4 |
|
| Bank loans | 231.2 |
| | — |
| 217.6 |
| 9.4 |
| 227.0 |
|
Equity securities (1) | 34.9 |
| | N/A |
| N/A |
| N/A |
| N/A |
|
| Liabilities: | | | | | | |
| Investment contract liabilities: | | | | | | |
| With a fixed maturity | 16.6 |
| | — |
| — |
| 16.6 |
| 16.6 |
|
| Without a fixed maturity | 557.5 |
| | — |
| — |
| 551.5 |
| 551.5 |
|
| Long-term debt | 8,081.3 |
| | — |
| 8,764.8 |
| — |
| 8,764.8 |
|
| | | | | | | |
|
| | | | | | | | | | | | | | | | |
| | Carrying Value |
| | Estimated Fair Value |
| (Millions) | | Level 1 |
| Level 2 |
| Level 3 |
| Total |
|
| December 31, 2013 | | | | | | |
| Assets: | | | | | | |
| Mortgage loans | $ | 1,549.6 |
| | $ | — |
| $ | — |
| $ | 1,584.8 |
| $ | 1,584.8 |
|
| Bank loans | 181.7 |
| | — |
| 171.5 |
| 9.8 |
| 181.3 |
|
| Liabilities: | | | | | | |
| Investment contract liabilities: | | | | | | |
| With a fixed maturity | 8.9 |
| | — |
| — |
| 8.9 |
| 8.9 |
|
| Without a fixed maturity | 572.3 |
| | — |
| — |
| 553.2 |
| 553.2 |
|
| Long-term debt | 8,252.6 |
| | — |
| 8,670.6 |
| — |
| 8,670.6 |
|
| | | | | | | |
| |
(1) | It was not practical to estimate the fair value of these cost-method investments as it represents shares of unlisted companies. |
Separate Accounts Measured at Fair Value in our Balance Sheets
Separate Accounts assets in our Large Case Pensions business represent funds maintained to meet specific objectives of contract holders. Since contract holders bear the investment risk of these assets, a corresponding Separate Accounts liability has been established equal to the assets. These assets and liabilities are carried at fair value. Net investment income and capital gains and losses accrue directly to such contract holders. The assets of each account are legally segregated and are not subject to claims arising from our other businesses. Deposits, withdrawals, net investment income and realized and unrealized capital gains and losses on Separate Accounts assets are not reflected in our statements of income, shareholders’ equity or cash flows.
Separate Accounts assets include debt and equity securities and derivative instruments. The valuation methodologies used for these assets are similar to the methodologies described beginning on page 103. Separate Accounts assets also include investments in common/collective trusts that are carried at fair value. Common/collective trusts invest in other investment funds otherwise known as the underlying funds. The Separate Accounts’ interests in the common/collective trust funds are based on the fair values of the investments of the underlying funds and therefore are classified in Level 2. The assets in the underlying funds primarily consist of equity securities. Investments in common/collective trust funds are valued at their respective net asset value per share/unit on the valuation date.
Separate Accounts financial assets at December 31, 2014 and 2013 were as follows:
|
| | | | | | | | | | | | | | | | | | | | | | | | | | | | | | | |
| | 2014 | | 2013 |
| (Millions) | Level 1 |
| | Level 2 |
| | Level 3 |
| | Total |
| | Level 1 |
| | Level 2 |
| | Level 3 |
| | Total |
|
| Debt securities | $ | 876.0 |
| | $ | 2,495.0 |
| | $ | 2.9 |
| | $ | 3,373.9 |
| | $ | 726.4 |
| | $ | 2,227.0 |
| | $ | .6 |
| | $ | 2,954.0 |
|
| Equity securities | 173.3 |
| | 5.7 |
| | — |
| | 179.0 |
| | 188.4 |
| | 3.3 |
| | — |
| | 191.7 |
|
| Derivatives | — |
| | .2 |
| | — |
| | .2 |
| | — |
| | .8 |
| | — |
| | .8 |
|
| Common/collective trusts | — |
| | 574.0 |
| | — |
| | 574.0 |
| | — |
| | 710.4 |
| | — |
| | 710.4 |
|
Total (1) | $ | 1,049.3 |
| | $ | 3,074.9 |
| | $ | 2.9 |
| | $ | 4,127.1 |
| | $ | 914.8 |
| | $ | 2,941.5 |
| | $ | .6 |
| | $ | 3,856.9 |
|
| | | | | | | | | | | | | | | | |
| |
(1) | Excludes $204.4 million and $115.6 million of cash and cash equivalents and other receivables at December 31, 2014 and 2013, respectively. |
During 2014 and 2013, we had an immaterial amount of Level 3 Separate Accounts financial assets. Gross transfers of Separate Accounts financial assets out of Level 3 during 2014 and 2013 were $.1 million and $4.6 million, respectively. During 2014 and 2013, there were no transfers of Separate Accounts financial assets between Levels 1 and 2 and no transfers of Separate Accounts financial assets into Level 3.
Offsetting Financial Assets and Liabilities
Certain financial assets and liabilities are offset in our balance sheets or are subject to master netting arrangements or similar agreements with the applicable counterparty. Financial assets, including derivative assets, subject to offsetting and enforceable master netting arrangements as of December 31, 2014 and December 31, 2013 were as follows:
|
| | | | | | | | | | | | |
| | Gross Amounts of Recognized Assets (1) | Gross Amounts Not Offset In the Balance Sheets | |
| | Financial Instruments | Cash Collateral Received | |
| (Millions) | Net Amount |
| December 31, 2014 | | | | |
| Derivatives | $ | .3 |
| $ | 10.2 |
| $ | — |
| $ | 10.5 |
|
| Total | $ | .3 |
| $ | 10.2 |
| $ | — |
| $ | 10.5 |
|
| | | | | |
| December 31, 2013 | | | | |
| Derivatives | $ | 49.1 |
| $ | 13.3 |
| $ | (47.1 | ) | $ | 15.3 |
|
| Total | $ | 49.1 |
| $ | 13.3 |
| $ | (47.1 | ) | $ | 15.3 |
|
| | | | | |
(1) There were no amounts offset in our balance sheets at December 31, 2014 or December 31, 2013.
Financial liabilities, including derivative liabilities, subject to offsetting and enforceable master netting arrangements as of December 31, 2014 and December 31, 2013 were as follows: |
| | | | | | | | | | | | |
| | Gross Amounts of Recognized Liabilities (1) | Gross Amounts Not Offset In the Balance Sheets | |
| | Financial Instruments | Cash Collateral Paid | |
| (Millions) | Net Amount |
| December 31, 2014 | | | | |
| Derivatives | $ | 53.4 |
| $ | .9 |
| $ | (49.0 | ) | $ | 5.3 |
|
| Securities lending | 826.9 |
| (826.9 | ) | — |
| — |
|
| Repurchase agreements | 201.7 |
| — |
| — |
| 201.7 |
|
| Total | $ | 1,082.0 |
| $ | (826.0 | ) | $ | (49.0 | ) | $ | 207.0 |
|
| | | | | |
| December 31, 2013 | | | | |
| Derivatives | $ | 1.9 |
| $ | — |
| $ | (.7 | ) | $ | 1.2 |
|
| Securities lending | 792.6 |
| (792.6 | ) | — |
| — |
|
| Total | $ | 794.5 |
| $ | (792.6 | ) | $ | (.7 | ) | $ | 1.2 |
|
| | | | | |
(1) There were no amounts offset in our balance sheets at December 31, 2014 or December 31, 2013.
| |
| 11. | Pension and Other Postretirement Plans |
Defined Benefit Retirement Plans
We sponsor various defined benefit plans, including two pension plans, and other postretirement employee benefit (“OPEB”) plans that provide certain health care and life insurance benefits for retired employees, including those of our former parent company.
During 2014 we did not make any contribution to the Aetna Pension Plan. During both 2013 and 2012 we made voluntary cash contributions of $60 million to the Aetna Pension Plan. Effective December 31, 2010, our employees no longer earn future pension service credits in the Aetna Pension Plan (i.e., the Plan was “frozen” effective December 31, 2010), although the Aetna Pension Plan will continue to operate and account balances will continue to earn annual interest credits.
In July 2014, we enhanced the Aetna Pension Plan. Effective December 1, 2014, we permitted certain current and future former employees with deferred vested Aetna Pension Plan balances to elect to receive a 100% lump-sum distribution. This election is a permanent addition to the Aetna Pension Plan. In addition, in July 2014, we announced a limited-time offer permitting certain former employees with deferred vested Aetna Pension Plan balances to elect a 100% lump-sum distribution. These distributions in 2014 were funded from existing Aetna Pension Plan assets and exceeded the total 2014 service and interest cost. As a result, we performed a remeasurement of the Aetna Pension Plan, and we recorded a pretax non-cash settlement charge of approximately $112 million in 2014 in general and administrative expenses.
We also sponsor a non-qualified supplemental pension plan (the “Non-qualified Pension Plan”) that, prior to January 1, 2007, had been used to provide benefits for wages above the Internal Revenue Code wage limits applicable to tax qualified pension plans (such as the Aetna Pension Plan). Effective January 1, 2007, no new benefits accrue under the Non-qualified Pension Plan, but interest will continue to be credited on outstanding supplemental cash balance accounts; and the plan may continue to be used to credit special pension arrangements.
In addition, we currently provide certain medical and life insurance benefits for retired employees, including those of our former parent company. We provide subsidized health care benefits to certain eligible employees who terminated employment prior to December 31, 2006. There is a cap on our portion of the cost of providing medical and dental benefits to our retirees. All current and future retirees and employees who terminate employment at age 45 or later with at least five years of service are eligible to participate in our group health plans at their own cost.
The information set forth in the following tables is based upon current actuarial reports using the annual measurement dates (December 31, for each year presented) for our pension and OPEB plans.
The following table shows the changes in the benefit obligations during 2014 and 2013 for our pension and OPEB plans.
|
| | | | | | | | | | | | | |
| | Pension Plans | | OPEB Plans |
| (Millions) | 2014 |
| 2013 |
| | 2014 |
| 2013 |
|
| Benefit obligation, beginning of year | $ | 5,965.3 |
| $ | 6,665.8 |
| | $ | 260.9 |
| $ | 292.4 |
|
| Service cost | — |
| — |
| | .1 |
| .1 |
|
| Interest cost | 288.3 |
| 271.5 |
| | 11.9 |
| 11.1 |
|
| Actuarial loss (gain) | 847.6 |
| (653.7 | ) | | 30.0 |
| (22.5 | ) |
| Settlements paid | (295.2 | ) | — |
| | — |
| — |
|
| Benefits paid | (301.2 | ) | (318.3 | ) | | (25.7 | ) | (20.2 | ) |
| Benefit obligation, end of year | $ | 6,504.8 |
| $ | 5,965.3 |
| | $ | 277.2 |
| $ | 260.9 |
|
| | | | | | |
The increase in the pension plans’ benefit obligation in 2014 was primarily due to actuarial losses arising as a result of the new mortality table and a lower discount rate as further described below.
The Aetna Pension Plan comprises approximately 96% of the pension plans’ total benefit obligation at December 31, 2014. The discount rates used to determine the benefit obligation of our pension and OPEB plans were calculated using a yield curve as of our annual measurement date. The yield curve consisted of a series of individual discount rates, with each discount rate corresponding to a single point in time, based on high-quality bonds. Projected benefit payments are discounted to the measurement date using the corresponding rate from the yield curve. The weighted average discount rate for our pension plans was 4.12% and 4.96% for 2014 and 2013, respectively. The discount rate for our OPEB plans was 4.02% and 4.73% for 2014 and 2013, respectively. The discount rates differ for our pension and OPEB plans due to the duration of the projected benefit payments for each plan.
Additionally, based on the mortality experience of our pension and OPEB plans, in 2014 we utilized the RP-2014 Mortality Table with a generational projection of future mortality improvements using Scale MP-2014. In 2013, we used the Retirement Plan 2000 mortality table with a generational projection of future mortality improvements using Scale AA.
The following table reconciles the beginning and ending balances of the fair value of plan assets during 2014 and 2013 for the pension and OPEB plans:
|
| | | | | | | | | | | | | |
| | Pension Plans | | OPEB Plans |
| (Millions) | 2014 |
| 2013 |
| | 2014 |
| 2013 |
|
| Fair value of plan assets, beginning of year | $ | 6,157.8 |
| $ | 5,805.0 |
| | $ | 61.1 |
| $ | 62.1 |
|
| Actual return on plan assets | 562.2 |
| 589.0 |
| | 1.5 |
| 2.9 |
|
| Employer contributions | 23.4 |
| 82.1 |
| | 21.6 |
| 16.3 |
|
| Settlements paid | (295.2 | ) | — |
| | — |
| — |
|
| Benefits paid | (301.2 | ) | (318.3 | ) | | (25.7 | ) | (20.2 | ) |
| Fair value of plan assets, end of year | $ | 6,147.0 |
| $ | 6,157.8 |
| | $ | 58.5 |
| $ | 61.1 |
|
| | | | | | |
The difference between the fair value of plan assets and the plan’s benefit obligation is referred to as the plan’s funded status. This funded status is an accounting-based calculation and is not indicative of our mandatory funding requirements, which are described on page 18.
The funded status of our pension and OPEB plans at the measurement date for 2014 and 2013 were as follows:
|
| | | | | | | | | | | | | |
| | Pension Plans | | OPEB Plans |
| (Millions) | 2014 |
| 2013 |
| | 2014 |
| 2013 |
|
| Benefit obligation | $ | (6,504.8 | ) | $ | (5,965.3 | ) | | $ | (277.2 | ) | $ | (260.9 | ) |
| Fair value of plan assets | 6,147.0 |
| 6,157.8 |
| | 58.5 |
| 61.1 |
|
| Funded status | $ | (357.8 | ) | $ | 192.5 |
| | $ | (218.7 | ) | $ | (199.8 | ) |
| | | | | | |
The amounts in accumulated other comprehensive loss that have not yet been recognized in net periodic benefit cost as of December 31, 2014 and 2013 were as follows:
|
| | | | | | | | | | | | | |
| | Pension Plans | | OPEB Plans |
| (Millions) | 2014 |
| 2013 |
| | 2014 |
| 2013 |
|
| Unrecognized prior service credit | $ | (1.2 | ) | $ | (1.6 | ) | | $ | (26.1 | ) | $ | (29.7 | ) |
| Unrecognized net actuarial losses | 2,493.0 |
| 1,943.5 |
| | 76.8 |
| 46.1 |
|
| Amount recognized in accumulated other comprehensive loss | $ | (2,491.8 | ) | $ | (1,941.9 | ) | | $ | (50.7 | ) | $ | (16.4 | ) |
| | | | | | |
The (liabilities) assets recognized on our balance sheets at December 31, 2014 and 2013 for our pension and OPEB plans were comprised of the following:
|
| | | | | | | | | | | | | |
| | Pension Plans | | OPEB Plans |
| (Millions) | 2014 |
| 2013 |
| | 2014 |
| 2013 |
|
| Accrued benefit assets reflected in other long-term assets | $ | — |
| $ | 425.0 |
| | $ | — |
| $ | — |
|
| Accrued benefit liabilities reflected in other current liabilities | (21.6 | ) | (22.3 | ) | | (14.5 | ) | — |
|
| Accrued benefit liabilities reflected in other long-term liabilities | (336.2 | ) | (210.2 | ) | | (204.2 | ) | (199.8 | ) |
| Net amount of (liabilities) assets recognized at December 31, | $ | (357.8 | ) | $ | 192.5 |
| | $ | (218.7 | ) | $ | (199.8 | ) |
| | | | | | |
At December 31, 2014, we had approximately $2.5 billion and $77 million of net actuarial losses for our pension and OPEB plans, respectively, and approximately $1 million and $26 million of prior service credits for our pension and OPEB plans, respectively, that have not been recognized as components of net periodic benefit costs. We expect to recognize approximately $61 million and $3 million in amortization of net actuarial losses for our pension and OPEB plans, respectively, and approximately $4 million in amortization of prior service credits for our OPEB plans in 2015. Our amortization of prior service credits for our pension plans in 2015 is not expected to be material.
Components of the net periodic benefit (income) cost of our defined benefit pension plans and OPEB plans for the years ended December 31, 2014, 2013 and 2012 were as follows:
|
| | | | | | | | | | | | | | | | | | | | | | | |
| | Pension Plans | | OPEB Plans |
| (Millions) | 2014 |
| | 2013 |
| | 2012 |
| | 2014 |
| | 2013 |
| | 2012 |
|
| Service cost | $ | — |
| | $ | — |
| | $ | — |
| | $ | — |
| | $ | .1 |
| | $ | .1 |
|
| Amortization of prior service credit | (.4 | ) | | (.4 | ) | | (.4 | ) | | (3.6 | ) | | (3.7 | ) | | (3.7 | ) |
| Interest cost | 288.3 |
| | 271.5 |
| | 298.4 |
| | 11.9 |
| | 11.1 |
| | 14.4 |
|
| Expected return on plan assets | (422.3 | ) | | (396.4 | ) | | (387.3 | ) | | (3.1 | ) | | (2.4 | ) | | (2.7 | ) |
| Recognized net actuarial losses | 46.6 |
| | 75.4 |
| | 70.2 |
| | 1.0 |
| | 2.3 |
| | 4.5 |
|
| Settlement charge | 111.6 |
| | — |
| | — |
| | — |
| | — |
| | — |
|
| Net periodic benefit cost (income) | $ | 23.8 |
| | $ | (49.9 | ) | | $ | (19.1 | ) | | $ | 6.2 |
| | $ | 7.4 |
| | $ | 12.6 |
|
| | | | | | | | | | | | |
The weighted average assumptions used to determine net periodic benefit (income) cost in 2014, 2013 and 2012 for the pension and OPEB plans were as follows:
|
| | | | | | | | | | | | | | | | | |
| | Pension Plans | | OPEB Plans |
| | 2014 |
| | 2013 |
| | 2012 |
| | 2014 |
| | 2013 |
| | 2012 |
|
| Discount rate | 4.96 | % | | 4.17 | % | | 4.98 | % | | 4.73 | % | | 3.94 | % | | 4.78 | % |
| Expected long-term return on plan assets | 7.00 |
| | 7.00 |
| | 7.50 |
| | 5.30 |
| | 4.10 |
| | 4.25 |
|
| Rate of increase in future compensation levels | N/A |
| | N/A |
| | N/A |
| | — |
| | — |
| | — |
|
| | | | | | | | | | | | |
We assume different health care cost trend rates for medical costs and prescription drug costs in estimating the expected costs of our OPEB plans. The assumed medical cost trend rate for 2015 is 8.5%, decreasing gradually to 4.5% by 2023. The assumed prescription drug cost trend rate for 2015 is 8.5%, decreasing gradually to 4.5% by 2023. These assumptions reflect our historical as well as expected future trends for retirees. In addition, the trend assumptions reflect factors specific to our retiree medical plan, such as plan design, cost-sharing provisions, benefits covered and the presence of subsidy caps. A one-percentage point increase in both the assumed medical cost and assumed prescription drug cost trend rates would result in an approximately $.4 million pretax increase in the aggregate of the service and interest cost components of OPEB costs and an approximately $10 million increase in the OPEB benefit obligation. A one-percentage point decrease in both the assumed medical cost and assumed prescription drug cost trend rates would result in an approximately $.4 million pretax decrease in the aggregate of the service and interest cost components of OPEB costs and an approximately $9 million decrease in the OPEB benefit obligation.
Our current funding strategy for the Aetna Pension Plan is to fund an amount at least equal to the minimum funding requirement as determined under applicable regulatory requirements with consideration of factors such as the maximum tax deductibility of such amounts. Minimum funding requirements for the Aetna Pension Plan were met in 2014 and 2013, and we were not required to make cash contributions for either of those years. We do not have any required contribution to the Aetna Pension Plan in 2015, although we may voluntarily contribute approximately $60 million in 2015. Employer contributions related to the supplemental pension and OPEB plans represent payments to retirees for current benefits. We have no plans to return any pension or OPEB plan assets to the Company in 2015. Our non-qualified supplemental pension plan and OPEB plans do not have minimum funding requirements.
Expected benefit payments, which reflect future employee service, as appropriate, of the pension and OPEB plans to be paid for each of the next five years and in the aggregate for the next five years thereafter at December 31, 2014 were as follows:
|
| | | | | | |
| (Millions) | Pension Plans |
| OPEB Plans |
|
| 2015 | $ | 348.7 |
| $ | 18.3 |
|
| 2016 | 352.6 |
| 18.1 |
|
| 2017 | 357.9 |
| 17.9 |
|
| 2018 | 366.2 |
| 17.8 |
|
| 2019 | 367.7 |
| 17.5 |
|
| 2020-2024 | 1,890.5 |
| 83.4 |
|
Assets of the Aetna Pension Plan
The assets of the Aetna Pension Plan (“Pension Assets”) primarily include debt and equity securities held in separate accounts, as well as common/collective trusts and real estate investments. The valuation methodologies used to price these debt and equity securities and common/collective trusts are similar to the methodologies described beginning on pages 103 and 106. Pension Assets also include investments in other assets that are carried at fair value. The following is a description of the valuation methodology used to price real estate investments and these additional investments, including the general classification pursuant to the valuation hierarchy.
Real Estate - Real estate investments are valued by independent third party appraisers. The appraisals comply with the Uniform Standards of Professional Appraisal Practice, which includes, among other things, the income, cost, and sales comparison approaches to estimating property value. Therefore, these investments are classified in Level 3.
Other Assets - Other assets consist of derivatives and private equity and hedge fund limited partnerships. Derivatives are either valued with models that primarily use market observable inputs and therefore are classified in Level 2 because they are traded in markets where quoted market prices are not readily available or are classified in Level 1 because they are traded in markets where quoted market prices are readily available. The fair values of private equity and hedge fund limited partnerships are estimated based on the net asset value of the investment fund provided by the general partner or manager of the investments, the financial statements of which generally are audited. Management considers observable market data, valuation procedures in place, contributions and withdrawal restrictions collectively in validating the appropriateness of using the net asset value as a fair value measurement. Therefore, these investments are classified in Level 3.
Pension Assets with changes in fair value measured on a recurring basis at December 31, 2014 were as follows:
|
| | | | | | | | | | | | |
| (Millions) | Level 1 |
| Level 2 |
| Level 3 |
| Total |
|
| Debt securities: | | | | |
| U.S. government securities | $ | 452.1 |
| $ | 98.3 |
| $ | — |
| $ | 550.4 |
|
| States, municipalities and political subdivisions | — |
| 132.2 |
| — |
| 132.2 |
|
| U.S. corporate securities | — |
| 1,244.8 |
| 1.5 |
| 1,246.3 |
|
| Foreign securities | — |
| 161.5 |
| — |
| 161.5 |
|
| Residential mortgage-backed securities | — |
| 221.1 |
| — |
| 221.1 |
|
| Commercial mortgage-backed securities | — |
| 50.2 |
| .5 |
| 50.7 |
|
| Other asset-backed securities | — |
| 32.3 |
| — |
| 32.3 |
|
| Redeemable preferred securities | — |
| 8.2 |
| — |
| 8.2 |
|
| Total debt securities | 452.1 |
| 1,948.6 |
| 2.0 |
| 2,402.7 |
|
| Equity securities: | | | | |
| U.S. Domestic | 1,243.8 |
| 5.5 |
| — |
| 1,249.3 |
|
| International | 686.6 |
| — |
| — |
| 686.6 |
|
| Domestic real estate | 28.9 |
| — |
| — |
| 28.9 |
|
| Total equity securities | 1,959.3 |
| 5.5 |
| — |
| 1,964.8 |
|
| Other investments: | | | | |
| Real estate | — |
| — |
| 469.7 |
| 469.7 |
|
Common/collective trusts (1) | — |
| 610.0 |
| — |
| 610.0 |
|
| Other assets | — |
| .2 |
| 471.2 |
| 471.4 |
|
| Total other investments | — |
| 610.2 |
| 940.9 |
| 1,551.1 |
|
Total pension investments (2) | $ | 2,411.4 |
| $ | 2,564.3 |
| $ | 942.9 |
| $ | 5,918.6 |
|
| | | | | |
| |
(1) | The assets in the underlying funds of common/collective trusts are comprised of $337.4 million of equity securities and $272.6 million of debt securities. |
| |
(2) | Excludes $228.4 million of cash and cash equivalents and other payables. |
Pension Assets with changes in fair value measured on a recurring basis at December 31, 2013 were as follows:
|
| | | | | | | | | | | | |
| (Millions) | Level 1 |
| Level 2 |
| Level 3 |
| Total |
|
| Debt securities: | | | | |
| U.S. government securities | $ | 493.5 |
| $ | 113.2 |
| $ | — |
| $ | 606.7 |
|
| States, municipalities and political subdivisions | — |
| 126.8 |
| — |
| 126.8 |
|
| U.S. corporate securities | — |
| 1,135.7 |
| — |
| 1,135.7 |
|
| Foreign securities | — |
| 148.0 |
| .2 |
| 148.2 |
|
| Residential mortgage-backed securities | — |
| 174.6 |
| — |
| 174.6 |
|
| Commercial mortgage-backed securities | — |
| 44.0 |
| — |
| 44.0 |
|
| Other asset-backed securities | — |
| 26.5 |
| — |
| 26.5 |
|
| Redeemable preferred securities | — |
| 10.2 |
| — |
| 10.2 |
|
| Total debt securities | 493.5 |
| 1,779.0 |
| .2 |
| 2,272.7 |
|
| Equity securities: | | | | |
| U.S. Domestic | 1,342.5 |
| 3.1 |
| — |
| 1,345.6 |
|
| International | 825.2 |
| — |
| .1 |
| 825.3 |
|
| Domestic real estate | 25.7 |
| — |
| — |
| 25.7 |
|
| Total equity securities | 2,193.4 |
| 3.1 |
| .1 |
| 2,196.6 |
|
| Other investments: | | | | |
| Real estate | — |
| — |
| 497.5 |
| 497.5 |
|
Common/collective trusts (1) | — |
| 617.3 |
| — |
| 617.3 |
|
| Other assets | .3 |
| .7 |
| 395.9 |
| 396.9 |
|
| Total other investments | .3 |
| 618.0 |
| 893.4 |
| 1,511.7 |
|
Total pension investments (2) | $ | 2,687.2 |
| $ | 2,400.1 |
| $ | 893.7 |
| $ | 5,981.0 |
|
| | | | | |
| |
(1) | The assets in the underlying funds of common/collective trusts are comprised of $356.1 million of equity securities and $261.2 million of debt securities. |
| |
(2) | Excludes $176.8 million of cash and cash equivalents and other payables. |
The changes in the balances of Level 3 Pension Assets during 2014 and 2013 were as follows:
|
| | | | | | | | | |
| | 2014 |
| | Real Estate |
| Other |
| Total |
|
| Beginning balance | $ | 497.5 |
| $ | 396.2 |
| $ | 893.7 |
|
| Actual return on plan assets | 43.9 |
| 35.7 |
| 79.6 |
|
| Purchases, sales and settlements | (71.7 | ) | 41.3 |
| (30.4 | ) |
| Ending balance | $ | 469.7 |
| $ | 473.2 |
| $ | 942.9 |
|
| | | | |
|
| | | | | | | | | |
| | 2013 |
| | Real Estate |
| Other |
| Total |
|
| Beginning balance | $ | 469.0 |
| $ | 291.3 |
| $ | 760.3 |
|
| Actual return on plan assets | 40.5 |
| 26.6 |
| 67.1 |
|
| Purchases, sales and settlements | (12.0 | ) | 80.0 |
| 68.0 |
|
| Transfers out of Level 3 | — |
| (1.7 | ) | (1.7 | ) |
| Ending balance | $ | 497.5 |
| $ | 396.2 |
| $ | 893.7 |
|
The Aetna Pension Plan invests in a diversified mix of assets intended to maximize long-term returns while recognizing the need for adequate liquidity to meet ongoing benefit and administrative obligations. The risk of unexpected investment and actuarial outcomes is regularly evaluated. This evaluation is performed through forecasting and assessing ranges of investment outcomes over short- and long-term horizons, and by assessing the Aetna Pension Plan’s liability characteristics, our financial condition and our future potential obligations from both the pension and general corporate perspectives. Complementary investment styles and techniques are utilized by multiple professional investment firms to further improve portfolio and operational risk characteristics. Public and
private equity investments are used primarily to increase overall plan returns. Real estate investments are viewed favorably for their diversification benefits and above-average dividend generation. Fixed income investments provide diversification benefits and liability hedging attributes that are desirable, especially in falling interest rate environments.
At December 31, 2014, target investment allocations for the Aetna Pension Plan were: 38% in equity securities, 48% in debt securities, 7% in real estate, 4% in private equity limited partnerships and 3% in hedge funds. Actual asset allocations may differ from target allocations due to tactical decisions to overweight or underweight certain assets or as a result of normal fluctuations in asset values. Asset allocations are consistent with stated investment policies and, as a general rule, periodically rebalanced back to target asset allocations. Asset allocations and investment performance are formally reviewed periodically throughout the year by the plan’s Benefit Finance Committee. Forecasting of asset and liability growth is performed at least annually.
We have several benefit plans for retired employees currently supported by the OPEB plan assets. OPEB plan assets are directly and indirectly invested in a diversified mix of traditional asset classes, primarily high-quality fixed income securities.
The actual and target asset allocations of the OPEB plans used at December 31, 2014 and 2013 presented as a percentage of total plan assets, were as follows:
|
| | | | | | |
| | | Target | | Target |
| (Millions) | 2014 |
| Allocation | 2013 |
| Allocation |
| Equity securities | 11 | % | 5-15% | 10 | % | 5-15% |
| Debt securities | 84 | % | 80-90% | 84 | % | 80-90% |
| Real estate/other | 5 | % | 0-10% | 6 | % | 0-10% |
| | | | | |
Our expected return on plan assets assumption is based on many factors, including forecasted capital market real returns over a long-term horizon, forecasted inflation rates, historical compounded asset returns and patterns and correlations on those returns. Expectations for modest increases in interest rates, normal inflation trends and average capital market real returns led us to an expected return on the pension plan assets assumption of 7.00% for both 2014 and 2013 and 7.5% for 2012, and an expected return on OPEB plan assets assumption of 5.30%, 4.10% and 4.25% for 2014, 2013 and 2012, respectively. We regularly review actual asset allocations and periodically rebalance our investments to the mid-point of our targeted allocation ranges when we consider it appropriate.
401(k) Plan
Our employees are eligible to participate in a defined contribution retirement savings plan under which designated contributions may be invested in our common stock or certain other investments (the “Aetna 401(k) Plan”). In addition, former Coventry employees continued to be eligible to participate in the Coventry 401(k) plan during 2013, however, as of January 1, 2014, they became eligible to participate in the Aetna 401(k) Plan. Our 401(k) contribution to the Aetna 401(k) Plan provides for a match of 100% of up to 6% of the eligible pay contributed by the employee. Contributions to the Coventry 401(k) plan provided a match of 100% of up to 3% and 50% of the second 3% of the eligible pay contributed by the employee. During 2014, 2013 and 2012, we made $180 million, $148 million and $117 million, respectively, in aggregate of matching contributions to our 401(k) plans. The matching contributions are made in cash and invested according to each participant’s investment elections. The plan trustees held approximately 8 million shares, in aggregate, of our common stock for plan participants at December 31, 2014. At December 31, 2014, approximately 34 million shares of our common stock were reserved for issuance under the Aetna 401(k) Plan.
| |
| 12. | Stock-based Employee Incentive Plans |
Our stock-based employee compensation plans (collectively, the “Plans”) provide for awards of stock options, SARs, PSARs, restricted stock units (“RSUs”), MSUs, PSUs, deferred contingent common stock and the ability for employees to purchase common stock at a discount. At December 31, 2014, approximately 34 million common shares were available for issuance under the Plans. Executive, middle management and non-management employees may be granted RSUs, MSUs, PSUs, stock options, SARs and PSARs, each of which are described below:
RSUs - For each RSU granted, employees receive one share of common stock, net of taxes, at the end of the vesting period. RSUs generally become 100% vested approximately three years from the grant date, with one-third vesting each December.
MSUs - The number of vested MSUs (which could range from zero to 150% of the original number of units granted) is dependent on the weighted average closing price of our common stock for the thirty trading days prior to the vesting date, including the vesting date. Each vested MSU represents one share of common stock and will be paid in shares of common stock, net of taxes. MSUs representing 50% of the grant date fair value of the MSUs granted in 2012 were subject to a two-year vesting period while the remaining MSUs granted in 2012 are subject to a three-year vesting period. MSUs granted in 2014 and 2013 are subject to a three-year vesting period.
PSUs - The number of vested PSUs (which could range from zero to 200% of the original number of units granted) is dependent upon the degree to which we achieve performance goals, which for the most part, are set at the time of grant as determined by our Board’s Committee on Compensation and Talent Management (the “Compensation Committee”). Each vested PSU represents one share of common stock and will be paid in shares of common stock, net of taxes. Below is a summary of the performance period and vesting percentages for each tranche of PSUs granted by the Company:
PSUs granted in 2012 (“2012 PSUs”)
Half of the 2012 PSUs were subject to a one-year performance period that ended on December 31, 2012, and vested at 81.67% of the original number of units granted. The remaining half were subject to a one-year performance period that ended December 31, 2013, and vested at 119.12% of the original number of units granted. The 2012 PSUs were subject to a two-year vesting period.
PSUs granted in 2013 (“2013 PSUs”)
Certain PSUs granted in 2013 are subject to a single three-year performance period that will end on December 31, 2015, and are subject to a single vesting period that ends on January 5, 2016.
Certain PSUs granted in 2013 were subject to a two-year vesting period with two separate performance periods. Half of these PSUs were subject to a one-year performance period that ended on December 31, 2013, and vested at 127.08% of the original number of units granted. The remaining half were subject to a one-year performance period that ended on December 31, 2014, and vested at 131.62% of the original number of units granted.
PSUs granted in 2014 (“2014 PSUs”)
The 2014 PSUs have a two-year performance period that will end on December 31, 2015, and are subject to a three-year vesting period.
Stock Options and SARs - We have not granted stock options since 2005, but some remain outstanding.
Stock options were granted to purchase our common stock at or above the market price on the date of grant. SARs granted will be settled in stock, net of taxes, based on the appreciation of our stock price on the exercise date over the market price on the date of grant. SARs and stock options generally become 100% vested three years after the grant is made, with one-third vesting each year. Vested SARs and stock options may be exercised at any time during the ten years after grant, except in certain circumstances, generally
related to employment termination or retirement. At the end of the ten-year period, any unexercised SARs and stock options expire.
The SARs granted to certain employees during 2014 and described above had an estimated fair market value of $22.68 per unit. The fair value per unit was calculated on the grant date using a modified Black-Scholes option pricing model using the following assumptions:
|
| | | |
| Expected term (in years) | 5.72 |
|
| Volatility | 35.8 | % |
| Risk-free interest rate | 1.74 | % |
| Dividend yield | 1.36 | % |
| Initial price | $ | 72.26 |
|
| | |
We estimate the grant date fair value of SARs using a modified Black-Scholes option pricing model. We did not grant a material number of SARs in 2013 or 2012. The expected term is based on historical equity award activity. Volatility is based on a weighted average of the historical volatility of our stock price and implied volatility from traded options on our stock. The risk-free interest rate is based on a U.S. Treasury rate with a life equal to the expected life of the SARs grant. This rate was calculated by interpolating between the 5-year and 10-year U.S. Treasury rates. The dividend yield is based on our historical dividends declared in the 12 months prior to the grant date.
We use historical data to estimate the period of time that stock options or SARs are expected to be outstanding.
PSARs - PSARs represent the opportunity to vest in SARs. For the PSARs granted in 2013, the number of vested PSARs (which may range in specified increments from zero to 700,000 SARs) is dependent on Aetna’s total shareholder return over a three year performance period relative to a defined peer group of companies. The PSARs granted in 2013 are subject to a three-year vesting period.
The stock option, SAR and PSAR transactions during 2014, 2013 and 2012 were as follows:
|
| | | | | | | | | | | |
| (Millions, except exercise price and remaining life) | Number of Stock Options, SARs and PSARs |
| | Weighted Average Exercise Price |
| Weighted Average Remaining Contractual Life |
| Aggregate Intrinsic Value |
|
| | | | | | |
| 2012 | | | | | |
| Outstanding, beginning of year | 26.3 |
| | $ | 35.18 |
| 4.0 |
| $ | 246.3 |
|
| Granted | .1 |
| | 44.79 |
| — |
| — |
|
| Exercised | (6.7 | ) | | 22.73 |
| — |
| 148.0 |
|
| Expired or forfeited | (.3 | ) | | 43.02 |
| — |
| — |
|
| Outstanding, end of year | 19.4 |
| | $ | 39.34 |
| 3.5 |
| $ | 163.8 |
|
| | | | | | |
| Exercisable, end of year | 19.4 |
| | $ | 39.34 |
| 3.5 |
| $ | 163.8 |
|
| | | | | | |
| 2013 | | | | | |
| Outstanding, beginning of year | 19.4 |
| | $ | 39.34 |
| 3.5 |
| $ | 163.8 |
|
| Granted | .7 |
| (1) | 63.32 |
| — |
| — |
|
| Exercised | (9.3 | ) | | 36.58 |
| — |
| 203.4 |
|
| Expired or forfeited | (.3 | ) | | 47.11 |
| — |
| — |
|
| Outstanding, end of year | 10.5 |
| | $ | 43.27 |
| 3.5 |
| $ | 264.6 |
|
| | | | | | |
| Exercisable, end of year | 9.8 |
| | $ | 41.77 |
| 3.0 |
| $ | 261.6 |
|
| | | | | | |
| 2014 | | | | | |
| Outstanding, beginning of year | 10.5 |
| | $ | 43.27 |
| 3.5 |
| $ | 264.6 |
|
| Granted | 1.4 |
| | 72.36 |
| — |
| — |
|
| Exercised | (3.7 | ) | | 40.50 |
| — |
| 132.1 |
|
| Expired or forfeited | (.1 | ) | | 46.94 |
| — |
| — |
|
| Outstanding, end of year | 8.1 |
| | $ | 49.37 |
| 4.2 |
| $ | 318.3 |
|
| | | | | | |
| Exercisable, end of year | 6.1 |
| | $ | 42.86 |
| 2.6 |
| $ | 280.2 |
|
| | | | | | |
| |
(1) | PSARs are included in this table at the maximum amount that could potentially vest. |
The following is a summary of information regarding stock options, SARs and PSARs outstanding at December 31, 2014:
|
| | | | | | | | | | | | | | | | | | | | |
| | Outstanding | | Exercisable |
Range of Exercise Prices | Number Outstanding |
| Weighted Average Remaining Contractual Life (Years) |
| Weighted Average Exercise Price |
| Aggregate Intrinsic Value |
| | Number Exercisable |
| | Weighted Average Exercise Price |
| Aggregate Intrinsic Value |
|
| 20.00-30.00 | .1 |
| 3.2 |
| $ | 25.62 |
| $ | 2.9 |
| | .1 |
| | $ | 25.62 |
| $ | 2.9 |
|
| 30.00-40.00 | 1.9 |
| 3.4 |
| 32.74 |
| 104.5 |
| | 1.9 |
| | 32.74 |
| 104.5 |
|
| 40.00-50.00 | 2.0 |
| 2.0 |
| 43.92 |
| 91.2 |
| | 2.0 |
| | 43.92 |
| 91.2 |
|
| 50.00-60.00 | 2.1 |
| 2.4 |
| 50.54 |
| 80.9 |
| | 2.1 |
| | 50.54 |
| 80.9 |
|
| 60.00-70.00 | .7 |
| 8.6 |
| 64.25 |
| 17.2 |
| | — |
| | — |
| — |
|
| 70.00-80.00 | 1.3 |
| 9.0 |
| 72.32 |
| 21.6 |
| | — |
| (1) | 72.26 |
| .7 |
|
$20.00-$90.00 (2) | 8.1 |
| 4.2 |
| $ | 49.37 |
| $ | 318.3 |
| | 6.1 |
| | $ | 42.86 |
| $ | 280.2 |
|
| | | | | | | | | | |
| |
(1) | The number of exercisable stock options, SARs and PSARs with exercise prices between $70 and $80 rounded to zero. |
| |
(2) | The number of outstanding stock options, SARs and PSARs with exercise prices between $80 and $90 rounded to zero. |
The grant date fair values of RSUs and PSUs are based on the market price of our common stock on the date of grant. Beginning in 2010, we granted MSUs to certain employees. We estimate the grant date fair value of MSUs using a Monte Carlo simulation. MSUs granted in 2014 and 2013 had a weighted average per MSU grant date fair value of $74.99 and $49.31, respectively. MSUs granted in 2012 were valued using two separate performance periods, which resulted in a weighted average per MSU grant date fair value of $46.36 and $46.84, respectively, for the two-year and three-year vesting period tranches. The weighted-average per MSU grant date fair values listed above were calculated using the assumptions noted in the following table:
|
| | | | | | | | | | | | |
| | | | 2012 |
| | 2014 |
| 2013 |
| Two-year | Three-year |
| Dividend yield | 1.3 | % | 1.7 | % | 1.6 | % | 1.6 | % |
| Volatility | 26.4 | % | 28.1 | % | 31.2 | % | 37.5 | % |
| Risk-free interest rate | .7 | % | .4 | % | .2 | % | .3 | % |
| Initial price | $ | 72.26 |
| $ | 48.48 |
| $ | 44.79 |
| $ | 44.79 |
|
| | | | | |
The annualized volatility of the price of our common stock was calculated over the three-year period preceding the grant date for MSUs granted in 2014 and 2013. As the MSUs granted in 2012 have two separate performance periods (two years and three years), the annualized volatility of the price of our common stock was calculated over the two-year and three-year periods preceding the grant date. The risk-free interest rates for periods within the expected life of the MSUs are based on a constant maturity yield curve in effect on the grant date for MSUs granted in 2014, 2013 and 2012. The dividend yield assumptions for 2014, 2013 and 2012, respectively, were based on our expected 2014, 2013 and 2012 annual dividend payout, respectively.
RSU, MSU and PSU transactions in 2014, 2013 and 2012 were as follows (number of units in millions):
|
| | | | | | | | | | | | | | | | | | | | |
| | 2014 | | 2013 | | 2012 |
| | RSUs, MSUs and PSUs |
| | Weighted Average Grant Date Fair Value |
| | RSUs, MSUs and PSUs |
| | Weighted Average Grant Date Fair Value |
| | RSUs, MSUs and PSUs |
| | Weighted Average Grant Date Fair Value |
|
| RSUs, MSUs and PSUs at beginning of year | 5.3 |
| | $ | 48.82 |
| | 3.4 |
| | $ | 43.25 |
| | 6.7 |
| | $ | 33.62 |
|
| Granted | 2.7 |
| | 71.88 |
| | 3.6 |
| | 51.22 |
| | 4.6 |
| | 43.71 |
|
| Vested | (2.5 | ) | | 50.11 |
| | (1.3 | ) | | 41.56 |
| | (7.7 | ) | | 34.69 |
|
| Forfeited | (.4 | ) | | 56.89 |
| | (.4 | ) | | 46.65 |
| | (.2 | ) | | 37.37 |
|
| RSUs, MSUs and PSUs at end of year | 5.1 |
| | $ | 58.57 |
| | 5.3 |
| | $ | 48.82 |
| | 3.4 |
| | $ | 43.25 |
|
| | | | | | | | | | | | |
In 2013, we granted PSARs and estimated the fair value of those PSARs using a Monte Carlo simulation. The PSARs granted in 2013 had a grant date per PSAR fair value of $18.64. That grant date fair value was calculated using the assumptions noted in the following table:
|
| | | |
| | |
| Dividend yield | 1.25 | % |
| Expected settlement period (in years) | 6.12 |
|
| Volatility | 40.4 | % |
| Risk-free interest rate | .6 | % |
| Initial price | $ | 64.25 |
|
| | |
During 2014, 2013 and 2012, the following activity occurred under the Plans:
|
| | | | | | | | | |
| (Millions) | 2014 |
| 2013 |
| 2012 |
|
| Cash received from stock option exercises | $ | 32.4 |
| $ | 89.1 |
| $ | 89.8 |
|
| Intrinsic value of options/SARs exercised and stock units vested | 322.8 |
| 292.0 |
| 492.5 |
|
| Tax benefits realized for the tax deductions from stock options and SARs exercised and stock units vested | 87.1 |
| 98.9 |
| 172.4 |
|
Fair value of stock options, SARs and stock units vested (1) | 106.7 |
| 52.1 |
| 273.4 |
|
| | | | |
| |
(1) | The fair value represents the total dollar value of the stock options, SARs and stock units as of the respective grant dates. |
We settle our stock options, SARs, PSARs and stock units with newly-issued common stock and generally utilize the proceeds from stock options to repurchase our common stock in the open market in the same period.
In 2014, 2013 and 2012 we recorded share-based compensation expense of $164 million, $127 million and $122 million, respectively, in general and administrative expenses. We also recorded related tax benefits of $37 million, $35 million and $32 million in 2014, 2013 and 2012, respectively. At December 31, 2014, $174 million of total unrecognized compensation costs related to SARs, PSARs and stock units is expected to be recognized over a weighted-average period of 1.7 years.
The components of our income tax provision in 2014, 2013 and 2012 were as follows:
|
| | | | | | | | | |
| (Millions) | 2014 |
| 2013 |
| 2012 |
|
| Current taxes: | | | |
| Federal | $ | 1,233.0 |
| $ | 901.9 |
| $ | 731.5 |
|
| State | 84.0 |
| 55.7 |
| 48.4 |
|
| Total current taxes | 1,317.0 |
| 957.6 |
| 779.9 |
|
| Deferred taxes (benefits): | | | |
| Federal | 114.1 |
| 63.0 |
| 112.8 |
|
| State | 23.6 |
| 8.0 |
| (5.2 | ) |
| Total deferred income taxes | 137.7 |
| 71.0 |
| 107.6 |
|
| Total income taxes | $ | 1,454.7 |
| $ | 1,028.6 |
| $ | 887.5 |
|
| | | | |
Income taxes were different from the amount computed by applying the statutory federal income tax rate to income before income taxes as follows:
|
| | | | | | | | | |
| (Millions) | 2014 |
| 2013 |
| 2012 |
|
| Income before income taxes | $ | 3,499.9 |
| $ | 2,940.5 |
| $ | 2,547.3 |
|
| Tax rate | 35 | % | 35 | % | 35 | % |
| Application of the tax rate | 1,225.0 |
| 1,029.2 |
| 891.6 |
|
| Tax effect of: | | | |
| Health insurer fee | 211.9 |
| — |
| — |
|
| State income taxes | 78.2 |
| 44.2 |
| 26.3 |
|
| Other, net | (60.4 | ) | (44.8 | ) | (30.4 | ) |
| Income taxes | $ | 1,454.7 |
| $ | 1,028.6 |
| $ | 887.5 |
|
| | | | |
The significant components of our net deferred tax liabilities at December 31, 2014 and 2013 were as follows:
|
| | | | | | |
| (Millions) | 2014 |
| 2013 |
|
| Deferred tax assets: | | |
| Employee and postretirement benefits | $ | 290.9 |
| $ | 130.9 |
|
| Insurance reserves | 252.9 |
| 237.4 |
|
| Reserve for anticipated future losses on discontinued products | 199.1 |
| 225.2 |
|
| Net operating losses | 195.3 |
| 176.2 |
|
| Investments, net | 68.3 |
| 76.0 |
|
| Debt fair value adjustments | 43.4 |
| 62.0 |
|
| Severance and facilities | 9.9 |
| 30.1 |
|
| Deferred policy acquisition costs | 9.2 |
| 21.9 |
|
| Litigation-related settlement | 6.0 |
| 43.5 |
|
| Other | 94.9 |
| 106.3 |
|
| Gross deferred tax assets | 1,169.9 |
| 1,109.5 |
|
| Less: Valuation allowance | 147.9 |
| 139.3 |
|
| Deferred tax assets, net of valuation allowance | 1,022.0 |
| 970.2 |
|
| Deferred tax liabilities: | | |
| Goodwill and other acquired intangible assets | 868.4 |
| 861.9 |
|
| Unrealized gains on investment securities | 291.5 |
| 192.8 |
|
| Cumulative depreciation and amortization | 286.6 |
| 258.2 |
|
| Total gross deferred tax liabilities | 1,446.5 |
| 1,312.9 |
|
Net deferred tax liabilities (1) | $ | (424.5 | ) | $ | (342.7 | ) |
| | | |
| |
(1) | Includes $443.0 million and $521.5 million classified as current assets at December 31, 2014 and 2013, respectively. Includes $867.5 million and $864.2 million classified as long-term liabilities at December 31, 2014 and 2013, respectively. |
Valuation allowances are provided when we estimate that it is more likely than not that deferred tax assets will not be realized. A valuation allowance has been established on certain federal and state net operating losses. We base our estimates of the future realization of deferred tax assets primarily on historic taxable income and existing deferred tax liabilities.
We participate in the Compliance Assurance Process (the “CAP”) with the Internal Revenue Service (the “IRS”). Under the CAP, the IRS undertakes audit procedures during the tax year and as the return is prepared for filing. The IRS has concluded its CAP audit of our 2013 tax return as well as all the prior years. We expect the IRS will conclude its CAP audit of our 2014 tax return in 2015.
We are also subject to audits by state taxing authorities for tax years from 2000 through 2013. We believe we carry appropriate reserves for any exposure to state tax issues.
At both December 31, 2014 and December 31, 2013 we did not have material uncertain tax positions reflected in our consolidated balance sheets.
We paid net income taxes of approximately $1.6 billion, $891 million and $741 million in 2014, 2013 and 2012, respectively.
The carrying value of our long-term debt at December 31, 2014 and 2013 was as follows:
|
| | | | | | | |
| (Millions) | 2014 |
| | 2013 |
|
Senior notes, 6.3%, due 2014 (1) | $ | — |
| | $ | 387.3 |
|
| Senior notes, 6.125%, due 2015 | 229.3 |
| | 240.6 |
|
| Senior notes, 6.0%, due 2016 | — |
| | 748.9 |
|
| Senior notes, 5.95%, due 2017 | 418.3 |
| | 434.2 |
|
| Senior notes, 1.75%, due 2017 | 249.2 |
| | 248.9 |
|
| Senior notes, 1.5%, due 2017 | 498.6 |
| | 498.2 |
|
| Senior notes, 6.5%, due 2018 | — |
| | 494.9 |
|
| Senior notes, 2.2%, due 2019 | 374.7 |
| | — |
|
| Senior notes, 3.95%, due 2020 | 745.2 |
| | 744.3 |
|
| Senior notes, 5.45%, due 2021 | 688.6 |
| | 702.3 |
|
| Senior notes, 4.125%, due 2021 | 495.5 |
| | 494.8 |
|
| Senior notes, 2.75%, due 2022 | 986.8 |
| | 985.1 |
|
| Senior notes, 3.5%, due 2024 | 746.9 |
| | — |
|
| Senior notes, 6.625%, due 2036 | 769.8 |
| | 769.8 |
|
| Senior notes, 6.75%, due 2037 | 530.7 |
| | 530.6 |
|
| Senior notes, 4.5%, due 2042 | 480.8 |
| | 480.1 |
|
| Senior notes, 4.125%, due 2042 | 492.8 |
| | 492.6 |
|
| Senior notes, 4.75%, due 2044 | 374.1 |
| | — |
|
| Total long-term debt | 8,081.3 |
| | 8,252.6 |
|
Less current portion of long-term debt (2) | 229.3 |
| | 387.3 |
|
| Total long-term debt, less current portion | $ | 7,852.0 |
| | $ | 7,865.3 |
|
| | | | |
| |
(1) | The 6.3% senior notes were repaid in August 2014. These notes were classified as current in the consolidated balance sheet at December 31, 2013. |
| |
(2) | At December 31, 2014, our 6.125% senior notes due January 2015 are classified as current in the accompanying consolidated balance sheet. |
At December 31, 2014, we had approximately $500 million of commercial paper outstanding with a weighted-average interest rate of .30%. At December 31, 2013, we did not have any commercial paper outstanding.
We paid $379 million, $364 million and $242 million in interest in 2014, 2013 and 2012, respectively.
We are a member of the FHLBB, and as a member we have the ability to obtain cash advances, subject to certain minimum collateral requirements. Our maximum borrowing capacity available from the FHLBB at December 31, 2014 was approximately $882 million. At December 31, 2014, we did not have any outstanding borrowings from the FHLBB.
Early Extinguishment of Long-Term Debt
November 2014
On November 3, 2014, we announced the redemption for cash of the entire $495.6 million aggregate principal amount outstanding of our 6.50% senior notes due 2018. The redemption of these notes occurred on December 3, 2014 (the “December Redemption Date”) at a redemption price that included a make-whole premium, plus interest accrued and unpaid at the December Redemption Date. We financed the redemption by issuing $750 million of 3.5% senior notes due 2024 (the “November 2014 Senior Notes”). As a result of the redemption, in the fourth quarter of 2014, we recorded a loss on the early extinguishment of long-term debt of $58.1 million ($89.3 million pretax).
In April 2014, we entered into an interest rate swap with a notional value of $250 million. We designated this swap as a cash flow hedge against interest rate exposure related to the forecasted future issuance of fixed-rate debt to be primarily used to refinance long-term debt maturing in 2018. In November 2014, prior to issuing the November 2014 Senior Notes used to refinance our 6.50% senior notes due 2018 and for general corporate purposes, we terminated this swap and paid an aggregate of $15.2 million to the swap counterparty upon termination. We performed a final effectiveness test upon termination of this swap and determined there was approximately $3 million pretax of ineffectiveness that arose due to the actual debt issuance date being earlier than forecasted. The ineffectiveness was recorded as a realized capital loss in the fourth quarter of 2014. The effective portion of the hedge loss of approximately $12 million pretax was recorded in accumulated other comprehensive loss, net of tax, and is being amortized as an increase to interest expense over the first 20 semi-annual interest payments of the November 2014 Senior Notes.
March 2014
On February 7, 2014, we announced the redemption for cash of the entire $750 million aggregate principal amount outstanding of our 6.0% senior notes due 2016. The redemption of these notes occurred on March 14, 2014 (the “March Redemption Date”) at a redemption price that included a make-whole premium, plus interest accrued and unpaid at the March Redemption Date. We financed the redemption by issuing $375 million of 2.2% senior notes due 2019 and $375 million of 4.75% senior notes due 2044 (collectively, the “March 2014 Senior Notes”), together with other available resources. As a result of the redemption, in the first quarter of 2014, we recorded a loss on the early extinguishment of long-term debt of $59.7 million ($91.9 million pretax).
During June and July 2012, we entered into two interest rate swaps with an aggregate notional value of $375 million. We designated these swaps as cash flow hedges against interest rate exposure related to the forecasted future issuance of fixed-rate debt to refinance our 6.0% senior notes due 2016. In March 2014, prior to issuing the March 2014 Senior Notes used to refinance our 6.0% senior notes due 2016, we terminated these swaps and received an aggregate of $34.2 million from the swap counterparties upon termination. We performed a final effectiveness test upon termination of these swaps and determined there was approximately $12 million pretax of ineffectiveness that arose due to the actual debt issuance date being earlier than forecasted. The ineffectiveness was recorded as a realized capital gain in the first quarter of 2014. The effective portion of the hedge gain of approximately $22 million pretax was recorded in accumulated other comprehensive loss, net of tax, and is being amortized as a reduction to interest expense over the first 20 semi-annual interest payments associated with the $375 million of 4.75% senior notes due 2044.
2012
In 2012, we repurchased approximately $200 million par value of our outstanding senior notes and recorded a loss on the early extinguishment of this long-term debt of $55.2 million ($84.9 million pretax) during 2012.
Interest Rate Swaps
In March 2014, we entered into two interest rate swaps with an aggregate notional value of $500 million. We designated these swaps as cash flow hedges against interest rate exposure related to the forecasted future issuance of fixed-rate debt to be primarily used to refinance long-term debt maturing in 2017. At December 31, 2014, these interest rate swaps had a pretax fair value loss of $53.2 million, which was reflected net of tax in accumulated other comprehensive loss within shareholders’ equity.
Revolving Credit Facility
On March 27, 2012, we entered into an unsecured $1.5 billion five-year revolving credit agreement (the “Credit Agreement”) with several financial institutions. On September 24, 2012, in connection with the acquisition of Coventry, we entered into a First Amendment (the “First Amendment”) to the Credit Agreement and also entered into an Incremental Commitment Agreement (the “Incremental Commitment”, and together with the First Amendment and the Credit Agreement, resulting in the “Facility”). The Facility is an unsecured $2.0 billion revolving credit agreement. Upon our agreement with one or more financial institutions, we may expand the aggregate commitments under the Facility to a maximum of $2.5 billion. The Facility also provides for the issuance of up to $200 million of letters of credit at our request, which count as usage of the available commitments under
the Facility. In 2013, we extended the maturity date of the Facility by one year. On March 27, 2014, we extended the maturity date of the Facility by an additional year to March 27, 2019.
Various interest rate options are available under the Facility. Any revolving borrowings mature on the termination date of the Facility. We pay facility fees on the Facility ranging from .070% to .150% per annum, depending upon our long-term senior unsecured debt rating. The facility fee was .100% at December 31, 2014. The Facility contains a financial covenant that requires us to maintain a ratio of total debt to consolidated capitalization as of the end of each fiscal quarter at or below 50%. For this purpose, consolidated capitalization equals the sum of total shareholders’ equity, excluding any overfunded or underfunded status of our pension and OPEB plans and any net unrealized capital gains and losses, and total debt (as defined in the Facility). We met this requirement at December 31, 2014. There were no amounts outstanding under the Facility at any time during the year ended December 31, 2014 or 2013.
From time to time, our Board authorizes us to repurchase our common stock. The repurchases are effected from time to time in the open market, through negotiated transactions, including accelerated share repurchase agreements, and through plans designed to comply with Rule 10b5-1 under the Securities Exchange Act of 1934, as amended. The activity under Board authorized share repurchase programs in 2014, 2013 and 2012 was as follows:
|
| | | | | | | | | | | | | | | | | | | | | |
| | Purchase Not to Exceed |
| | Shares Purchased |
| | | 2014 | | 2013 | | 2012 |
| (Millions) | | Shares |
| Cost |
| | Shares |
| Cost |
| | Shares |
| Cost |
|
| Authorization date: | | | | | | | | | | |
| November 21, 2014 | $ | 1,000.0 |
| | — |
| $ | — |
| | — |
| $ | — |
| | — |
| $ | — |
|
| February 28, 2014 | 1,000.0 |
| | 7.6 |
| 621.0 |
| | — |
| — |
| | — |
| — |
|
| September 27, 2013 | 750.0 |
| | 8.3 |
| 597.0 |
| | 2.3 |
| 153.0 |
| | — |
| — |
|
| February 19, 2013 | 750.0 |
| | — |
| — |
| | 11.6 |
| 750.0 |
| | — |
| — |
|
| July 27, 2012 | 750.0 |
| | — |
| — |
| | 9.1 |
| 504.7 |
| | 5.3 |
| 245.3 |
|
| February 24, 2012 | 750.0 |
| | — |
| — |
| | — |
| — |
| | 17.8 |
| 750.0 |
|
| September 23, 2011 | 750.0 |
| | — |
| — |
| | — |
| — |
| | 9.2 |
| 422.2 |
|
| Total repurchases | N/A |
| | 15.9 |
| $ | 1,218.0 |
| | 23.0 |
| $ | 1,407.7 |
| | 32.3 |
| $ | 1,417.5 |
|
| | | | | | | | | | | |
| Repurchase authorization remaining at December 31, | | N/A |
| $ | 1,379.0 |
| | N/A |
| $ | 597.0 |
| | N/A |
| $ | 504.7 |
|
| | | | | | | | | | | |
As described above, from time to time we enter into accelerated share repurchase agreements with unrelated third party financial institutions. The number of shares repurchased under each agreement is based on the volume-weighted average price of our common stock during the purchase period. We have completed the following accelerated share repurchase programs with repurchase periods during the year ended December 31, 2014:
|
| | | | | | |
| Trade Date: | Value of Repurchase Program (Millions) |
| Repurchase Period | Number of Shares Repurchased (Millions) |
|
| May 16, 2014 | $ | 100.0 |
| July 2014 | 1.2 |
|
| August 5, 2014 | 100.0 |
| October 2014 | 1.3 |
|
| | | | |
Under the share repurchase program authorized by our Board, we entered into an accelerated share repurchase agreement with an unrelated third party financial institution on December 15, 2014 to repurchase an aggregate of $150 million of our outstanding common stock during January and February 2015. Under this agreement, we repurchased approximately 1.6 million shares of our common stock based on the volume-weighted average price of our common stock during the purchase period.
In December 2013, our Board increased our quarterly cash dividend to shareholders to $.225 per share. In November 2014, our Board increased our quarterly cash dividend to shareholders to $.25 per share.
In 2014 and 2013 our Board declared the following cash dividends:
|
| | | | | | | | | | |
| Date Declared | Dividend Amount Per Share | | Stockholders of Record Date | Date Paid/ To be Paid | Total Dividends (Millions) | |
| February 19, 2013 | | $ | .20 |
| April 11, 2013 | April 26, 2013 | | $ | 65.3 |
|
| May 17, 2013 | | .20 |
| July 11, 2013 | July 26, 2013 | | 74.4 |
|
| September 27, 2013 | | .20 |
| October 10, 2013 | October 25, 2013 | | 73.5 |
|
| December 6, 2013 | | .225 |
| January 16, 2014 | January 31, 2014 | | 81.6 |
|
| February 28, 2014 | | .225 |
| April 10, 2014 | April 25, 2014 | | 80.4 |
|
| May 30, 2014 | | .225 |
| July 10, 2014 | July 25, 2014 | | 79.6 |
|
| September 19, 2014 | | .225 |
| October 16, 2014 | October 31, 2014 | | 79.0 |
|
| November 21, 2014 | | .25 |
| January 15, 2015 | January 30, 2015 | | 87.5 |
|
| | | | | | | |
Declaration and payment of future dividends is at the discretion of our Board and may be adjusted as business needs or market conditions change.
In addition to the common stock disclosed on our balance sheets, approximately 8 million shares of Class A voting preferred stock, $.01 par value per share, have been authorized. At December 31, 2014, there were also approximately 439 million undesignated shares that our Board has the power to divide into such classes and series, with such voting rights, designations, preferences, limitations and special rights as our Board determines.
16. Dividend Restrictions and Statutory Surplus
Our business operations are conducted through subsidiaries that principally consist of HMOs and insurance companies. In addition to general state law restrictions on payments of dividends and other distributions to shareholders applicable to all corporations, HMOs and insurance companies are subject to further regulations that, among other things, may require those companies to maintain certain levels of equity and restrict the amount of dividends and other distributions that may be paid to their equity holders. The additional regulations applicable to our HMO and insurance company subsidiaries are not expected to affect our ability to service our debt, meet our other financing obligations or pay dividends.
Under applicable regulatory requirements, at December 31, 2014, the amount of dividends that may be paid by our insurance and HMO subsidiaries without prior approval by regulatory authorities was approximately $2.2 billion in the aggregate. There are no such restrictions on distributions from Aetna to its shareholders. During 2014, our insurance and HMO subsidiaries paid approximately $1.2 billion of dividends to the Company.
The combined statutory net income for the years ended and combined statutory capital and surplus at December 31, 2014, 2013 and 2012 for our insurance and HMO subsidiaries were as follows:
|
| | | | | | | | | |
| (Millions) | 2014 |
| 2013 |
| 2012 |
|
| Statutory net income | $ | 2,126.6 |
| $ | 1,750.1 |
| $ | 1,813.7 |
|
| Statutory capital and surplus | 9,405.8 |
| 8,431.0 |
| 6,372.8 |
|
Effective October 1, 1998, we reinsured certain policyholder liabilities and obligations related to individual life insurance (in conjunction with our former parent company’s sale of this business). These transactions were in the form of indemnity reinsurance arrangements, whereby the assuming companies contractually assumed certain policyholder liabilities and obligations, although we remain directly obligated to policyholders. The liability related to our obligation is recorded in future policy benefits and policyholders’ funds on our balance sheets.
Assets related to and supporting these policies were transferred to the assuming companies, and we recorded a reinsurance recoverable.
There is not a material difference between premiums on a written basis versus an earned basis. Reinsurance recoveries were approximately $189 million, $110 million and $98 million in 2014, 2013 and 2012, respectively. Reinsurance recoverables related to these obligations were approximately $1.2 billion at December 31, 2014, approximately $793 million at December 31, 2013 and approximately $919 million at December 31, 2012. At December 31, 2014, reinsurance recoverables with a carrying value of approximately $706 million were associated with two reinsurers. Additionally, at December 31, 2014, we recorded a receivable under Health Care Reform’s temporary three-year reinsurance program of approximately $338 million. Refer to Note 2 beginning on page 80 for additional information about Health Care Reform’s temporary three-year reinsurance program.
Effective January 1, 2012, we renewed our agreement with an unrelated insurer to reinsure fifty percent of our group term life and group accidental death and dismemberment insurance policies. During 2013 and 2012, we entered into agreements to reinsure certain Health Care insurance policies. We entered into these contracts to reduce the risk of catastrophic loss which in turn reduces our capital and surplus requirements. These contracts did not qualify for reinsurance accounting under GAAP, and consequently are accounted for using deposit accounting.
Effective 2014, 2013 and 2012, we entered into certain three to five-year reinsurance agreements with unrelated insurers (Vitality Re V, Vitality Re IV and Vitality Re III). At December 31, 2014, 2013 and 2012, these agreements allowed us to reduce our required capital and provided an aggregate of $500 million, $690 million and $540 million, respectively, of collateralized excess of loss reinsurance coverage on a portion of Aetna’s group Commercial Insured Health Care business.
In May 2013, we entered into two agreements with unrelated reinsurers to reinsure a portion of our Medicare Advantage business and a portion of our group Commercial Insured Health Care business, respectively. These contracts did not qualify for reinsurance accounting under GAAP, and consequently are accounted for using deposit accounting.
In 2008, as a result of the liquidation proceedings of Lehman Re, a subsidiary of Lehman Brothers Holdings Inc., we recorded an allowance against our reinsurance recoverable from Lehman Re of $27.4 million ($42.2 million pretax). This reinsurance was placed in 1999 and was on a closed book of paid-up group whole life insurance business. In September 2008, we took possession of assets supporting the reinsurance recoverable, which previously were held as collateral in a trust. In 2013, we sold our claim against Lehman Re to an unrelated third party (including the reinsurance recoverable) and terminated the reinsurance arrangement. Upon the sale of the claim and termination of the arrangement, we reversed the related allowance thereby reducing other general and administrative expenses by $27.4 million ($42.2 million pretax) and recognized a $4.7 million ($7.2 million pretax) gain on the sale in fees and other revenue.
| |
| 18. | Commitments and Contingencies |
Guarantees
We have the following significant guarantee and indemnification arrangements at December 31, 2014.
| |
| • | ASC Claim Funding Accounts - We have arrangements with certain banks for the processing of claim payments for our ASC customers. The banks maintain accounts to fund claims of our ASC customers. The customer is responsible for funding the amount paid by the bank each day. In these arrangements, we guarantee that the banks will not sustain losses if the responsible ASC customer does not properly fund its account. The aggregate maximum exposure under these arrangements is $250 million. We can limit our exposure to this guarantee by suspending the payment of claims for ASC customers that have not adequately funded the amount paid by the bank. |
| |
| • | Indemnification Agreements - In connection with certain acquisitions and dispositions of assets and/or businesses, our various issuances of long-term debt and our reinsurance relationships with Vitality Re III Limited, Vitality Re IV Limited and Vitality Re V Limited, we have incurred certain customary indemnification obligations to the applicable seller, purchaser, underwriters and/or various other participants. In general, we have agreed to indemnify the other party for certain losses relating to the assets or business that we or they purchased or sold or for other matters on terms that are customary for similar transactions. Certain portions of our indemnification obligations are capped at the applicable transaction price, while other arrangements are not subject to such a limit. At December 31, 2014, we do not believe that our future obligations under any of these agreements will be material to our financial condition. |
| |
| • | Separate Accounts assets - Certain Separate Accounts assets associated with the Large Case Pensions business represent funds maintained as a contractual requirement to fund specific pension annuities that we have guaranteed. Minimum contractual obligations underlying the guaranteed benefits in these Separate Accounts were $2.2 billion at both December 31, 2014 and 2013. Refer to Note 2 beginning on page 80 for additional information on Separate Accounts. Contract holders assume all investment and mortality risk and are required to maintain Separate Account balances at or above a specified level. The level of required funds is a function of the risk underlying the Separate Account’s investment strategy. If contract holders do not maintain the required level of Separate Account assets to meet the annuity guarantees, we would establish an additional liability. Contract holders’ balances in the Separate Accounts at December 31, 2014 exceeded the value of the guaranteed benefit obligation. As a result, we were not required to maintain any additional liability for our related guarantees at December 31, 2014. |
| |
| • | Minimum Volume Commitments - In connection with the Coventry acquisition we assumed certain supplier agreements with minimum volume commitments which require us to make payments to the suppliers if the level of medical membership subject to the agreements falls below specified levels. The maximum potential amount of future payments we could be required to make over the remaining terms of the agreements, assuming the medical membership subject to the agreements is zero, is $136 million. |
Guaranty Fund Assessments, Market Stabilization and Other Non-Voluntary Risk Sharing Pools
Under guaranty fund laws existing in all states, insurers doing business in those states can be assessed (up to prescribed limits) for certain obligations of insolvent insurance companies to policyholders and claimants. The life and health insurance guaranty associations in which we participate that operate under these laws respond to insolvencies of long-term care insurers as well as health insurers. Our assessments generally are based on a formula relating to our premiums in the state compared to the premiums of other insurers. Certain states allow assessments to be recovered as offsets to premium taxes. Some states have similar laws relating to HMOs and/or other payors such as not-for-profit consumer-governed health plans established under Health Care Reform. In 2009, the Pennsylvania Insurance Commissioner (the “Commissioner”) placed long-term care insurer Penn Treaty Network America Insurance Company and one of its subsidiaries (collectively, “Penn Treaty”) in rehabilitation, an intermediate action before insolvency, and subsequently petitioned a state court to convert the rehabilitation into a liquidation. In 2012, the state court denied the Commissioner’s petition for liquidation. The Commissioner has appealed the state court’s denial of the petition for liquidation, and the Pennsylvania Supreme Court held oral argument on that appeal in September 2014. The state court’s 2012 order directed the Commissioner to develop a plan of rehabilitation. The Commissioner filed an initial rehabilitation plan in April 2013, and filed amended plans in August 2014 and October 2014. In December 2014, the state court set a hearing for July 2015 to consider the Commissioner’s most recent proposed rehabilitation plan, which contemplates a partial liquidation of Penn Treaty. If Penn Treaty is placed in liquidation, we and other insurers likely would be assessed immediately or over a period of years by guaranty associations for the payments the guaranty associations are required to make to Penn Treaty policyholders. We are currently unable to predict the ultimate outcome of, or reasonably estimate the loss or range of losses resulting from, this potential insolvency because we cannot predict the extent to which rehabilitation efforts may succeed, the amount of the insolvency, the amount and timing of associated future guaranty association assessments or the amount or availability of potential offsets, such as premium tax offsets. It is reasonably possible that in future reporting periods we may record a liability and expense relating to Penn Treaty or other insolvencies which could have a material adverse effect on our operating results, financial condition and cash flows. While we
have historically recovered more than half of guaranty fund assessments through statutorily permitted premium tax offsets, significant increases in assessments could lead to legislative and/or regulatory actions that may limit future offsets.
HMOs in certain states in which we do business are subject to assessments, including market stabilization and other risk-sharing pools, for which we are assessed charges based on incurred claims, demographic membership mix and other factors. We establish liabilities for these assessments based on applicable laws and regulations. In certain states, the ultimate assessments we pay are dependent upon our experience relative to other entities subject to the assessment and the ultimate liability is not known at the balance sheet date. While the ultimate amount of the assessment is dependent upon the experience of all pool participants, we believe we have adequate reserves to cover such assessments.
Litigation and Regulatory Proceedings
Out-of-Network Benefit Proceedings
We are named as a defendant in several purported class actions and individual lawsuits arising out of our practices related to the payment of claims for services rendered to our members by health care providers with whom we do not have a contract (“out-of-network providers”). Among other things, these lawsuits allege that we paid too little to our health plan members and/or providers for these services, among other reasons, because of our use of data provided by Ingenix, Inc., a subsidiary of one of our competitors (“Ingenix”). Other major health insurers are the subject of similar litigation or have settled similar litigation.
Various plaintiffs who are health care providers or medical associations seek to represent nationwide classes of out-of-network providers who provided services to our members during the period from 2001 to the present. Various plaintiffs who are members in our health plans seek to represent nationwide classes of our members who received services from out-of-network providers during the period from 2001 to the present. Taken together, these lawsuits allege that we violated state law, the Employee Retirement Income Security Act of 1974, as amended (“ERISA”), the Racketeer Influenced and Corrupt Organizations Act and federal antitrust laws, either acting alone or in concert with our competitors. The purported classes seek reimbursement of all unpaid benefits, recalculation and repayment of deductible and coinsurance amounts, unspecified damages and treble damages, statutory penalties, injunctive and declaratory relief, plus interest, costs and attorneys’ fees, and seek to disqualify us from acting as a fiduciary of any benefit plan that is subject to ERISA. Individual lawsuits that generally contain similar allegations and seek similar relief have been brought by health plan members and out-of-network providers.
The first class action case was commenced on July 30, 2007. The federal Judicial Panel on Multi-District Litigation (the “MDL Panel”) has consolidated these class action cases in the U.S. District Court for the District of New Jersey (the “New Jersey District Court”) under the caption In re: Aetna UCR Litigation, MDL No. 2020 (“MDL 2020”). In addition, the MDL Panel has transferred the individual lawsuits to MDL 2020. On May 9, 2011, the New Jersey District Court dismissed the physician plaintiffs from MDL 2020 without prejudice. The New Jersey District Court’s action followed a ruling by the United States District Court for the Southern District of Florida (the “Florida District Court”) that the physician plaintiffs were enjoined from participating in MDL 2020 due to a prior settlement and release. The United States Court of Appeals for the Eleventh Circuit has dismissed the physician plaintiffs’ appeal of the Florida District Court’s ruling.
On December 6, 2012, we entered into an agreement to settle MDL No. 2020. Under the terms of the proposed nationwide settlement, we would have been released from claims relating to our out-of-network reimbursement practices from the beginning of the applicable settlement class period through August 30, 2013. The settlement agreement did not contain an admission of wrongdoing. The medical associations were not parties to the settlement agreement.
Under the settlement agreement, we would have paid up to $120 million to fund claims submitted by health plan members and health care providers who were members of the settlement classes. These payments also would have funded the legal fees of plaintiffs’ counsel and the costs of administering the settlement.
In connection with the proposed settlement, the Company recorded an after-tax charge to net income attributable to Aetna of approximately $78 million in the fourth quarter of 2012.
The settlement agreement provided us the right to terminate the agreement under certain conditions related to settlement class members who opted out of the settlement. Based on a report provided to the parties by the settlement administrator, the conditions permitting us to terminate the settlement agreement were satisfied. On March 13, 2014, we notified the New Jersey District Court and plaintiffs’ counsel that we were terminating the settlement agreement. Various legal and factual developments since the date of the settlement agreement led us to believe terminating the settlement agreement was in our best interests. We intend to vigorously defend ourselves against the claims brought by the plaintiffs. As a result of this termination, we released the reserve established in connection with the settlement agreement, net of amounts due to the settlement administrator, which reduced first quarter 2014 other general and administrative expenses by $67.0 million ($103.0 million pretax).
We also have received subpoenas and/or requests for documents and other information from, and been investigated by, attorneys general and other state and/or federal regulators, legislators and agencies relating to our out-of-network benefit payment and administration practices. It is reasonably possible that others could initiate additional litigation or additional regulatory action against us with respect to our out-of-network benefit payment and/or administration practices.
CMS Actions
The Centers for Medicare & Medicaid Services (“CMS”) regularly audits our performance to determine our compliance with CMS’s regulations and our contracts with CMS and to assess the quality of services we provide to Medicare beneficiaries. CMS uses various payment mechanisms to allocate and adjust premium payments to our and other companies’ Medicare plans by considering the applicable health status of Medicare members as supported by information prepared, maintained and provided by health care providers. We collect claim and encounter data from providers and generally rely on providers to appropriately code their submissions to us and document their medical records, including the diagnosis data submitted to us with claims. CMS pays increased premiums to Medicare Advantage plans and PDPs for members who have certain medical conditions identified with specific diagnosis codes. Federal regulators review and audit the providers’ medical records to determine whether those records support the related diagnosis codes that determine the members’ health status and the resulting risk-adjusted premium payments to us. In that regard, CMS has instituted risk adjustment data validation (“RADV”) audits of various Medicare Advantage plans, including certain of the Company’s plans, to validate coding practices and supporting medical record documentation maintained by health care providers and the resulting risk adjusted premium payments to the plans. CMS may require us to refund premium payments if our risk adjusted premiums are not properly supported by medical record data. The Office of Inspector General (the “OIG”) also is auditing risk adjustment data of other companies, and we expect CMS and the OIG to continue auditing risk adjustment data.
CMS revised its audit methodology for RADV audits to determine refunds payable by Medicare Advantage plans for contract year 2011 and forward. Under the revised methodology, among other things, CMS will project the error rate identified in the audit sample of approximately 200 members to all risk adjusted premium payments made under the contract being audited. Historically, CMS did not project sample error rates to the entire contract. As a result, the revised methodology may increase our exposure to premium refunds to CMS based on incomplete medical records maintained by providers. During 2013, CMS selected certain of our Medicare Advantage contracts for contract year 2011 for audit. We are currently unable to predict which of our Medicare Advantage contracts will be selected for future audit, the amounts of any retroactive refunds of, or prospective adjustments to, Medicare Advantage premium payments made to us, the effect of any such refunds or adjustments on the actuarial soundness of our Medicare Advantage bids, or whether any RADV audit findings would cause a change to our method of estimating future premium revenue in future bid submissions to CMS or compromise premium assumptions made in our bids for prior contract years or the current contract year. Any premium or fee refunds or adjustments resulting from regulatory audits, whether as a result of RADV, Public Exchange related or other audits by CMS, the OIG, HHS or otherwise, including audits of our minimum medical loss ratio rebates, methodology and/or reports, could be material and could adversely affect our operating results, financial condition and cash flows.
Other Litigation and Regulatory Proceedings
We are involved in numerous other lawsuits arising, for the most part, in the ordinary course of our business operations, including claims of or relating to bad faith, medical malpractice, non-compliance with state and federal regulatory regimes, marketing misconduct, failure to timely or appropriately pay or administer claims and benefits in our Health Care and Group Insurance businesses (including our post-payment audit and collection practices and reductions in payments to providers due to sequestration), provider network structure (including the use of
performance-based networks and termination of provider contracts), rescission of insurance coverage, improper disclosure of personal information, anticompetitive practices, patent infringement and other intellectual property litigation, other legal proceedings in our Health Care and Group Insurance businesses and employment litigation. Some of these other lawsuits are or are purported to be class actions. We intend to vigorously defend ourselves against the claims brought in these matters.
Awards to us and others of certain government contracts, particularly in our Medicaid business, are subject to increasingly frequent protests by unsuccessful bidders. These protests may result in awards to us being reversed, delayed or modified. The loss or delay in implementation of any government contract could adversely affect our operating results. We will continue to defend vigorously contract awards we receive.
In addition, our operations, current and past business practices, current and past contracts, and accounts and other books and records are subject to routine, regular and special investigations, audits, examinations and reviews by, and from time to time we receive subpoenas and other requests for information from, CMS, the U.S. Department of Health and Human Services, various state insurance and health care regulatory authorities, state attorneys general and offices of inspector general, the Center for Consumer Information and Insurance Oversight, OIG, the Office of Personnel Management, the U.S. Department of Labor, the U.S. Department of the Treasury, the U.S. Food and Drug Administration, committees, subcommittees and members of the U.S. Congress, the U.S. Department of Justice, the Federal Trade Commission, U.S. attorneys and other state, federal and international governmental authorities. These government actions include inquiries by, and testimony before, certain members, committees and subcommittees of the U.S. Congress regarding certain of our current and past business practices, including our overall claims processing and payment practices, our business practices with respect to our small group products, student health products or individual customers (such as market withdrawals, rating information, premium increases and medical benefit ratios), executive compensation matters and travel and entertainment expenses, as well as the investigations by, and subpoenas and requests from, attorneys general and others described above under “Out-of-Network Benefit Proceedings.”
A significant number of states are investigating life insurers’ claims payment and related escheat practices, and these investigations have resulted in significant charges to earnings by other life insurers in connection with related settlements. We have received requests for information from a number of states, and certain of our subsidiaries are being audited, with respect to our life insurance claim payment and related escheat practices. In the fourth quarter of 2013, we made changes to our life insurance claim payment practices (including related escheatment practices) based on evolving industry practices and regulatory expectations and interpretations, including expanding our existing use of the Social Security Administration’s Death Master File to identify additional potentially unclaimed death benefits and locate applicable beneficiaries. As a result of these changes, in the fourth quarter of 2013, we increased our estimated liability for unpaid life insurance claims with respect to insureds who passed away on or before December 31, 2013, and recorded in current and future benefits a charge of $35.7 million ($55.0 million pretax). Given the legal and regulatory uncertainty with respect to life insurance claim payment and related escheat practices, it is reasonably possible that we may incur additional liability related to those practices, whether as a result of further changes in our business practices, litigation, government actions or otherwise, which could adversely affect our operating results and cash flows.
There also continues to be a heightened level of review by regulatory authorities of, and increased litigation regarding, our and the rest of the health care and related benefits industry’s business and reporting practices, including premium rate increases, utilization management, development and application of medical policies, complaint, grievance and appeal processing, information privacy, provider network structure (including provider network adequacy, the use of performance-based networks and termination of provider contracts), calculation of
minimum medical loss ratios, delegated arrangements, rescission of insurance coverage, limited benefit health products, student health products, pharmacy benefit management practices (including the use of narrow networks and the placement of drugs in formulary tiers), sales practices, and claim payment practices (including payments to out-of-network providers and payments on life insurance policies).
As a leading national health and related benefits company, we regularly are the subject of government actions of the types described above. These government actions may prevent or delay us from implementing planned premium rate increases and may result, and have resulted, in restrictions on our business, changes to or clarifications of our business practices, retroactive adjustments to premiums, refunds or other payments to members, beneficiaries, states or the federal government, withholding of premium payments to us by government agencies, assessments of damages, civil or criminal fines or penalties, or other sanctions, including the possible suspension or loss of licensure and/or suspension or exclusion from participation in government programs.
Estimating the probable losses or a range of probable losses resulting from litigation, government actions and other legal proceedings is inherently difficult and requires an extensive degree of judgment, particularly where the matters involve indeterminate claims for monetary damages, may involve fines, penalties or punitive damages that are discretionary in amount, involve a large number of claimants or regulatory authorities, represent a change in regulatory policy, present novel legal theories, are in the early stages of the proceedings, are subject to appeal or could result in a change in business practices. In addition, because most legal proceedings are resolved over long periods of time, potential losses are subject to change due to, among other things, new developments, changes in litigation strategy, the outcome of intermediate procedural and substantive rulings and other parties’ settlement posture and their evaluation of the strength or weakness of their case against us. Except as specifically noted above under “Other Litigation and Regulatory Proceedings,” we are currently unable to predict the ultimate outcome of, or reasonably estimate the losses or a range of losses resulting from, the matters described above, and it is reasonably possible that their outcome could be material to us.
Other Obligations
We have operating leases for office space and certain computer and other equipment. Rental expenses for these items were $177 million, $170 million and $142 million in 2014, 2013 and 2012, respectively. The future net minimum payments under non-cancelable leases for 2015 through 2019 are estimated to be $139 million, $103 million, $74 million, $56 million and $39 million, respectively.
We also have funding obligations relating to equity limited partnership investments and real estate partnerships. The funding requirements for equity limited partnership investments and real estate partnerships for 2015 through 2019 are estimated to be $132 million, $87 million, $55 million, $33 million and $22 million, respectively.
Our operations are conducted in three business segments: Health Care, Group Insurance and Large Case Pensions. The acquired Coventry operations are reflected in our Health Care segment on and after May 7, 2013. Our Corporate Financing segment is not a business segment; it is added to our business segments to reconcile to our consolidated results. The Corporate Financing segment includes interest expense on our outstanding debt and the financing components of our pension and OPEB plan expense (the service cost and prior service cost components of this expense are allocated to our business segments). Non-GAAP financial measures we disclose, such as operating earnings, should not be considered a substitute for, or superior to, financial measures determined or calculated in accordance with GAAP.
Summarized financial information of our segment operations for 2014, 2013 and 2012 were as follows:
|
| | | | | | | | | | | | | | | |
| (Millions) | Health Care |
| Group Insurance |
| Large Case Pensions (2) |
| Corporate Financing |
| Total Company |
|
| 2014 | | | | | |
| Revenue from external customers | $ | 54,676.6 |
| $ | 2,214.2 |
| $ | 86.1 |
| $ | — |
| $ | 56,976.9 |
|
| Net investment income | 367.6 |
| 261.2 |
| 317.1 |
| — |
| 945.9 |
|
| Interest expense | — |
| — |
| — |
| 329.3 |
| 329.3 |
|
| Depreciation and amortization expense | 627.8 |
| 1.2 |
| — |
| — |
| 629.0 |
|
| Income taxes (benefits) | 1,587.2 |
| 57.4 |
| .7 |
| (190.6 | ) | 1,454.7 |
|
Operating earnings (loss) (1) | 2,376.5 |
| 171.0 |
| 20.7 |
| (163.6 | ) | 2,404.6 |
|
| Segment assets | 36,614.7 |
| 5,510.8 |
| 11,276.6 |
| — |
| 53,402.1 |
|
| 2013 | |
| |
| |
| |
| |
|
| Revenue from external customers | $ | 44,085.2 |
| $ | 2,053.3 |
| $ | 248.6 |
| $ | — |
| $ | 46,387.1 |
|
| Net investment income | 309.3 |
| 286.6 |
| 320.4 |
| — |
| 916.3 |
|
| Interest expense | — |
| — |
| — |
| 333.7 |
| 333.7 |
|
| Depreciation and amortization expense | 564.7 |
| 4.4 |
| — |
| — |
| 569.1 |
|
| Income taxes (benefits) | 1,078.4 |
| 32.3 |
| 21.8 |
| (103.9 | ) | 1,028.6 |
|
Operating earnings (loss) (1) | 2,267.4 |
| 130.9 |
| 21.2 |
| (178.4 | ) | 2,241.1 |
|
| Segment assets | 33,212.9 |
| 5,520.3 |
| 11,031.6 |
| — |
| 49,764.8 |
|
| 2012 | |
| |
| |
| |
| |
|
| Revenue from external customers | $ | 32,608.9 |
| $ | 1,842.0 |
| $ | 1,118.0 |
| $ | — |
| $ | 35,568.9 |
|
| Net investment income | 310.4 |
| 282.8 |
| 329.0 |
| — |
| 922.2 |
|
| Interest expense | — |
| — |
| — |
| 268.8 |
| 268.8 |
|
| Depreciation and amortization expense | 445.5 |
| 4.4 |
| — |
| — |
| 449.9 |
|
| Income taxes (benefits) | 950.5 |
| 62.3 |
| (2.4 | ) | (122.9 | ) | 887.5 |
|
Operating earnings (loss) (1) | 1,841.5 |
| 164.4 |
| 17.8 |
| (161.8 | ) | 1,861.9 |
|
| Segment assets | 24,138.9 |
| 5,697.5 |
| 11,551.1 |
| — |
| 41,387.5 |
|
| | | | | | |
| |
(1) | Operating earnings (loss) excludes net realized capital gains or losses, amortization of other acquired intangible assets and the other items described in the reconciliation on page 134. |
| |
(2) | In 2013 and 2012, pursuant to contractual rights exercised by the contract holders, certain existing group annuity contracts converted from participating to non-participating contracts. Upon conversion, we recorded $99.0 million and $941.4 million of non-cash group annuity conversion premium for these contracts and a corresponding $99.0 million and $941.4 million non-cash benefit expense on group annuity conversion for these contracts during 2013 and 2012, respectively. |
A reconciliation of operating earnings (1) to net income attributable to Aetna in 2014, 2013 and 2012 was as follows.
|
| | | | | | | | | | | |
| (Millions) | 2014 |
| | 2013 |
| | 2012 |
|
| Operating earnings | $ | 2,404.6 |
| | $ | 2,241.1 |
| | $ | 1,861.9 |
|
| Transaction, integration-related and restructuring costs, net of tax | (134.2 | ) | | (233.5 | ) | | (25.4 | ) |
| Loss on early extinguishment of long-term debt, net of tax | (117.8 | ) | | — |
| | (55.2 | ) |
| Pension settlement charge, net of tax | (72.5 | ) | | — |
| | — |
|
| Release of litigation-related reserve, net of tax | 67.0 |
| | — |
| | — |
|
| Charge for changes in our life insurance claim payment practices, net of tax | — |
| | (35.7 | ) | | — |
|
| Reduction of reserve for anticipated future losses on discontinued products, net of tax | — |
| | 55.9 |
| | — |
|
| Reversal of allowance and gain on sale of reinsurance recoverable, net of tax | — |
| | 32.1 |
| | — |
|
| Litigation-related settlement, net of tax | — |
| | — |
| | (78.0 | ) |
| Severance charge, net of tax | — |
| | — |
| | (24.1 | ) |
| Amortization of other acquired intangible assets, net of tax | (158.2 | ) | | (139.5 | ) | | (92.3 | ) |
| Net realized capital gains (losses), net of tax | 51.9 |
| | (6.8 | ) | | 71.0 |
|
| Net income attributable to Aetna | $ | 2,040.8 |
| | $ | 1,913.6 |
| | $ | 1,657.9 |
|
| | | | | | |
| |
(1) | In addition to net realized capital gains (losses) and amortization of other acquired intangible assets, the following other items are excluded from operating earnings because we believe they neither relate to the ordinary course of our business nor reflect our underlying business performance: |
| |
| • | We incurred transaction and integration-related costs of $134.2 million ($200.7 million pretax) related to the acquisitions of Coventry, bSwift and InterGlobal during 2014. We incurred transaction, integration-related and restructuring costs of $233.5 million ($332.8 million pretax) and $25.4 million ($32.6 million pretax) during 2013 and 2012, related to the acquisition of Coventry, respectively. Restructuring costs, primarily comprised of severance and real estate consolidation costs, are related to the acquisition of Coventry and our expense management and cost control initiatives. Transaction costs include advisory, legal and other professional fees which are not deductible for tax purposes and are reflected in our GAAP Consolidated Statements of Income in general and administrative expenses, as well as the cost of the bridge credit agreement that was in effect prior to the Coventry acquisition, which is reflected in the GAAP Consolidated Statements of Income in interest expense. Transaction costs also include transaction-related payments as well as expenses related to the negative cost of carry associated with the permanent financing that we obtained in November 2012 for the Coventry acquisition. Prior to the Acquisition Date, that negative cost of carry was excluded from operating earnings. The components of the negative cost of carry are reflected in our GAAP Consolidated Statements of Income in interest expense, net investment income, and general and administrative expenses. On and after the Acquisition Date, the interest expense and general and administrative expenses associated with the permanent financing are no longer excluded from operating earnings. |
| |
| • | In 2014 and 2012, we incurred losses on the early extinguishment of long-term debt of $117.8 million ($181.2 million pretax) and $55.2 million ($84.9 million pretax) related to the redemption and/or repurchase of certain of our outstanding senior notes, respectively. |
| |
| • | During 2014, we enhanced the Aetna Pension Plan to allow certain current and former employees to elect a 100% lump-sum distribution. In addition, we also announced a limited-time offer permitting certain former employees with deferred vested balances to elect a 100% lump-sum distribution. The distributions in 2014 were funded from existing Aetna Pension Plan assets and we recorded a related non-cash settlement charge of $72.5 million ($111.6 million pretax) during 2014 in general and administrative expenses. Refer to Note 11 beginning on page 109 for additional information on the pension settlement charge. |
| |
| • | In the fourth quarter of 2012, we recorded a charge of $78.0 million ($120.0 million pretax) related to the settlement of purported class action litigation regarding our payment practices related to out-of-network health care providers. That charge included the estimated cost of legal fees of plaintiffs’ counsel and the costs of administering the settlement. In the first quarter of 2014, we exercised our right to terminate the settlement agreement. As a result, we released the reserve established in connection with the settlement agreement, net of amounts due to the settlement administrator, which reduced first quarter 2014 other general and administrative expenses by $67.0 million ($103.0 million pretax). Refer to Note 18 beginning on page 127 for additional information on the termination of the settlement agreement. |
| |
| • | In the fourth quarter of 2013, we increased our estimated liability for unpaid life insurance claims with respect to insureds who passed away on or before December 31, 2013, and recorded in current and future benefits a charge of $35.7 million ($55.0 million pretax) as a result of changes during the fourth quarter of 2013 in our life insurance claim payment practices (including related escheatment practices) based on evolving industry practices and regulatory expectations and interpretations. Refer to Note 18 beginning on page 127 for additional information on the changes in our life insurance claim payment practices. |
| |
| • | We reduced the reserve for anticipated future losses on discontinued products by $55.9 million ($86.0 million pretax) in the second quarter of 2013. We believe excluding any changes in the reserve for anticipated future losses on discontinued products from operating earnings provides more useful information as to our continuing products and is consistent with the treatment of the operating results of these discontinued products, which are credited or charged to the reserve and do not affect our operating results. Refer to Note 20 beginning on page 135 for additional information on the reduction of the reserve for anticipated future losses on discontinued products. |
| |
| • | In 2008, as a result of the liquidation proceedings of Lehman Re, a subsidiary of Lehman Brothers Holdings Inc., we recorded an allowance against our reinsurance recoverable from Lehman Re of $27.4 million ($42.2 million pretax). This reinsurance was placed in 1999 and was on a closed book of paid-up group whole life insurance business. In 2013, we sold our claim against Lehman Re to an unrelated third party (including the reinsurance recoverable) and terminated the reinsurance arrangement. Upon the sale of the claim and termination of the arrangement, we reversed the related allowance thereby reducing other general and administrative expenses by $27.4 million ($42.2 million pretax) and recognized a $4.7 million ($7.2 million pretax) gain on the sale in fees and other revenue. |
| |
| • | In 2012, we recorded a severance charge of $24.1 million ($37.0 million pretax) related to actions taken in 2012 and 2013. |
Revenues from external customers by product in 2014, 2013 and 2012 were as follows:
|
| | | | | | | | | |
| (Millions) | 2014 |
| 2013 |
| 2012 |
|
| Health care premiums | $ | 49,562.2 |
| $ | 39,659.7 |
| $ | 28,872.0 |
|
| Health care fees and other revenue | 5,114.4 |
| 4,425.5 |
| 3,736.9 |
|
| Group life | 1,240.9 |
| 1,158.9 |
| 1,070.1 |
|
| Group disability | 929.0 |
| 849.5 |
| 726.0 |
|
| Group long-term care | 44.3 |
| 44.9 |
| 45.9 |
|
| Large case pensions, excluding group annuity contract conversion premium | 86.1 |
| 149.6 |
| 176.6 |
|
Group annuity contract conversion premium (1) | — |
| 99.0 |
| 941.4 |
|
Total revenue from external customers (2) (3) | $ | 56,976.9 |
| $ | 46,387.1 |
| $ | 35,568.9 |
|
| | | | |
| |
(1) | In 2013 and 2012, pursuant to contractual rights exercised by the contract holders, certain existing group annuity contracts converted from participating to non-participating contracts. Upon conversion, we recorded $99.0 million and $941.4 million of non-cash group annuity conversion premium for these contracts and a corresponding $99.0 million and $941.4 million non-cash benefit expense on group annuity conversion for these contracts during 2013 and 2012, respectively. |
| |
(2) | All within the U.S., except approximately $1.2 billion, $886 million and $775 million in 2014, 2013 and 2012, respectively, which were derived from foreign customers. |
| |
(3) | Revenue from the U.S. federal government was approximately $15.5 billion, $12.2 billion and $7.4 billion in 2014, 2013 and 2012, respectively, in the Health Care and Group Insurance segments. These amounts exceeded 10 percent of our total revenue from external customers in each of 2014, 2013 and 2012. |
The following is a reconciliation of revenue from external customers to total revenues included in our statements of income in 2014, 2013 and 2012:
|
| | | | | | | | | |
| (Millions) | 2014 |
| 2013 |
| 2012 |
|
| Revenue from external customers | $ | 56,976.9 |
| $ | 46,387.1 |
| $ | 35,568.9 |
|
| Net investment income | 945.9 |
| 916.3 |
| 922.2 |
|
| Net realized capital gains (losses) | 80.4 |
| (8.8 | ) | 108.7 |
|
| Total revenue | $ | 58,003.2 |
| $ | 47,294.6 |
| $ | 36,599.8 |
|
| | | | |
Long-lived assets, which are principally within the U.S., were $666 million and $718 million at December 31, 2014 and 2013, respectively.
Prior to 1993, we sold single-premium annuities (“SPAs”) and guaranteed investment contracts (“GICs”), primarily to employer sponsored pension plans. In 1993, we discontinued selling these products to Large Case Pensions customers, and now we refer to these products as discontinued products.
We discontinued selling these products because they were generating losses for us, and we projected that they would continue to generate losses over their life (which is currently greater than 30 years for SPAs); so we established a reserve for anticipated future losses at the time of discontinuance. At both December 31, 2014 and 2013, our remaining GIC liability was not material. This reserve represents the present value (at the risk-free rate of return at the time of discontinuance, consistent with the duration of the liabilities) of the difference between the expected cash flows from the assets supporting these products and the cash flows expected to be required to meet the obligations of the outstanding contracts.
Key assumptions in setting the reserve for anticipated future losses include future investment results, payments to retirees, mortality and retirement rates and the cost of asset management and customer service. In 2014, we modified the mortality tables used in order to reflect the more up-to-date 2014 Retired Pensioner’s Mortality table. The mortality tables were previously modified in 2012, in order to reflect the more up-to-date 2000 Retired Pensioner’s Mortality table, and in 1995, in order to reflect the more up-to-date 1994 Uninsured Pensioner’s Mortality table. In 1997, we began the use of a bond default assumption to reflect historical default experience. Other than these changes, since 1993 there have been no significant changes to the assumptions underlying the reserve.
We review the adequacy of this reserve quarterly based on actual experience. As long as our expected future losses remain consistent with prior projections, the results of the discontinued products are applied against the reserve and do not impact net income attributable to Aetna. If actual or expected future losses are greater than we currently estimate, we may increase the reserve, which could adversely impact net income attributable to Aetna. If actual or expected future losses are less than we currently estimate, we may decrease the reserve, which could favorably impact net income attributable to Aetna. As a result of this review, $55.9 million ($86.0 million pretax) of the reserve was released during 2013. This reserve release was primarily due to favorable investment performance as well as favorable retirement experience compared to assumptions we previously made in estimating the reserve. The reserve at each of December 31, 2014 and 2013 reflects management’s best estimate of anticipated future losses, and is included in future policy benefits on our balance sheet.
The activity in the reserve for anticipated future losses on discontinued products in 2014, 2013 and 2012 was as follows (pretax):
|
| | | | | | | | | | | |
| (Millions) | 2014 |
| | 2013 |
| | 2012 |
|
| Reserve, beginning of period | $ | 979.5 |
| | $ | 978.5 |
| | $ | 896.3 |
|
| Operating income (loss) | 6.0 |
| | 1.0 |
| | (2.0 | ) |
| Net realized capital gains | 29.2 |
| | 86.0 |
| | 84.2 |
|
| Reserve reduction | — |
| | (86.0 | ) | | — |
|
| Reserve, end of period | $ | 1,014.7 |
| | $ | 979.5 |
| | $ | 978.5 |
|
| | | | | | |
During 2014, our discontinued products reflected operating income and net realized capital gains, primarily attributable to gains from the sale of debt securities. In 2013, our discontinued products reflected operating income and net realized capital gains, primarily attributable to gains from the sale of other investments and from the sale of debt and equity securities. In 2012, our discontinued products reflected operating losses and net realized capital gains, primarily attributable to gains from the sale of debt securities partially offset by losses from other investments. We evaluated these 2014 results against the expectations of future cash flows assumed in estimating the reserve for anticipated future losses and do not believe that an adjustment to the reserve was required at December 31, 2014.
The anticipated run-off of the discontinued products reserve balance at December 31, 2014 (assuming that assets are held until maturity and that the reserve run-off is proportional to the liability run-off) is as follows:
|
| | | |
| (Millions) | |
| 2015 | $ | 53.9 |
|
| 2016 | 52.9 |
|
| 2017 | 51.6 |
|
| 2018 | 50.2 |
|
| 2019 | 48.7 |
|
| Thereafter | 757.4 |
|
Assets and liabilities supporting discontinued products at 2014 and 2013 were as follows: (1)
|
| | | | | | | |
| (Millions) | 2014 |
| | 2013 |
|
| Assets: | | | |
| Debt and equity securities available for sale | $ | 2,376.2 |
| | $ | 2,372.6 |
|
| Mortgage loans | 386.8 |
| | 407.0 |
|
| Other investments | 662.2 |
| | 663.9 |
|
| Total investments | 3,425.2 |
| | 3,443.5 |
|
| Other assets | 112.9 |
| | 85.2 |
|
| Collateral received under securities loan agreements | 200.7 |
| | 204.4 |
|
| Current and deferred income taxes | — |
| | 14.4 |
|
Receivable from continuing products (2) | 566.5 |
| | 533.1 |
|
| Total assets | $ | 4,305.3 |
| | $ | 4,280.6 |
|
| Liabilities: | |
| | |
|
| Future policy benefits | $ | 2,645.8 |
| | $ | 2,804.8 |
|
| Reserve for anticipated future losses on discontinued products | 1,014.7 |
| | 979.5 |
|
| Collateral payable under securities loan agreements | 200.7 |
| | 204.4 |
|
| Current and deferred income taxes | 27.9 |
| | — |
|
Other liabilities (3) | 416.2 |
| | 291.9 |
|
| Total liabilities | $ | 4,305.3 |
| | $ | 4,280.6 |
|
| | | | |
| |
(1) | Assets supporting the discontinued products are distinguished from assets supporting continuing products. |
| |
(2) | At the time of discontinuance, a receivable from Large Case Pensions’ continuing products was established on the discontinued products balance sheet. This receivable represented the net present value of anticipated cash shortfalls in the discontinued products, which will be funded from continuing products. Interest on the receivable is accrued at the discount rate that was used to calculate the reserve. The offsetting payable, on which interest is similarly accrued, is reflected in continuing products. Interest on the payable generally offsets investment income on the assets available to fund the shortfall. These amounts are eliminated in consolidation. |
| |
(3) | Net unrealized capital gains on the available-for-sale debt securities are included in other liabilities and are not reflected in consolidated shareholders’ equity. |
The discontinued products investment portfolio has changed since inception. Mortgage loans have decreased from $5.4 billion (37% of the investment portfolio) at December 31, 1993 to $387 million (11% of the investment portfolio) at December 31, 2014. This was a result of maturities, prepayments and the securitization and sale of commercial mortgages. Also, real estate decreased from $500 million (4% of the investment portfolio) at December 31, 1993 to $74 million (2% of the investment portfolio) at December 31, 2014, primarily as a result of sales. The resulting proceeds were primarily reinvested in debt and equity securities. Over time, the then-existing mortgage loan and real estate portfolios and the reinvested proceeds have resulted in greater investment returns than we originally assumed in 1993.
At December 31, 2014, the expected run-off of the SPA and GIC liabilities, including future interest, was as follows: (1)
|
| | | |
| (Millions) | |
| 2015 | $ | 383.7 |
|
| 2016 | 367.8 |
|
| 2017 | 351.5 |
|
| 2018 | 335.3 |
|
| 2019 | 319.3 |
|
| Thereafter | 4,133.4 |
|
| | |
| |
(1) | At both December 31, 2014 and 2013, our remaining GIC liability was not material. |
The liability expected at December 31, 1993 and actual liability balances at December 31, 2014, 2013 and 2012 for the GIC and SPA liabilities were as follows:
|
| | | | | | | | | | | | | |
| | Expected | | Actual |
| (Millions) | GIC |
| SPA |
| | GIC |
| SPA |
|
| 2012 | $ | 16.1 |
| $ | 2,615.4 |
| | $ | 6.6 |
| $ | 2,857.6 |
|
| 2013 | 15.7 |
| 2,448.9 |
| | — |
| 2,804.8 |
|
| 2014 | 12.0 |
| 2,281.0 |
| | — |
| 2,645.8 |
|
The GIC balances were lower than expected in each period because several contract holders redeemed their contracts prior to contract maturity. The SPA balances in each period were higher than expected because of additional amounts received under existing contracts.
The distributions on our discontinued products consisted of scheduled contract maturities, settlements and benefit payments of $377.9 million, $391.5 million and $399.5 million for the years ended December 31, 2014, 2013 and 2012, respectively. Participant-directed withdrawals from our discontinued products were not significant in the years ended ended December 31, 2014, 2013 or 2012. Cash required to fund these distributions was provided by earnings and scheduled payments on, and sales of, invested assets.
On February 27, 2015, our Board declared a cash dividend of $.25 per share that will be paid on April 24, 2015 to shareholders of record at the close of business on April 9, 2015.
In January 2015, we entered into three-year reinsurance agreements with Vitality Re VI Limited, an unrelated insurer. The agreements allow us to reduce our required capital and provide $200 million of collateralized excess of loss reinsurance coverage on a portion of Aetna’s group Commercial Insured Health Care business. The Company’s similar reinsurance agreements with Vitality Re III Limited expired in January 2015.
Management’s Report on Internal Control Over Financial Reporting
Management is responsible for establishing and maintaining adequate internal control over financial reporting (“ICOFR”) for the Company. ICOFR is defined as a process designed to provide reasonable assurance regarding the reliability of financial reporting and the preparation of financial statements for external purposes in accordance with GAAP.
Our ICOFR process includes those policies and procedures that (i) pertain to the maintenance of records that, in reasonable detail, accurately and fairly reflect the transactions and dispositions of our assets; (ii) provide reasonable assurance that transactions are recorded as necessary to permit preparation of the consolidated financial statements in accordance with GAAP, and that our receipts and expenditures are being made only in accordance with authorizations of our management and directors; and (iii) provide reasonable assurance regarding prevention or timely detection of unauthorized acquisition, use or disposition of our assets that could have a material effect on our consolidated financial statements.
Because of its inherent limitations, ICOFR may not prevent or detect misstatements. Also, projections of any evaluation of effectiveness to future periods are subject to the risk that controls may become inadequate because of changes in conditions, or that the degree of compliance with the policies or procedures may deteriorate.
Under the supervision and with the participation of management, including our Chief Executive and Chief Financial Officers, management assessed the effectiveness of our ICOFR at December 31, 2014. In making this assessment, management used the framework set forth by the Committee of Sponsoring Organizations of the Treadway Commission in “Internal Control - Integrated Framework” (2013). Based on this assessment, management concluded that our ICOFR was effective at December 31, 2014. Our ICOFR as well as our consolidated financial statements have been audited by KPMG LLP, an independent registered public accounting firm, as stated in their report which is included on page 140.
Management’s Responsibility for Financial Statements
Management is responsible for our consolidated financial statements, which have been prepared in accordance with GAAP. Management believes the consolidated financial statements, and other financial information included in this report, fairly present in all material respects our financial position, results of operations and cash flows as of and for the periods presented in this report.
The financial statements are the product of a number of processes that include the gathering of financial data developed from the records of our day-to-day business transactions. Informed judgments and estimates are used for those transactions not yet complete or for which the ultimate effects cannot be measured precisely. We emphasize the selection and training of personnel who are qualified to perform these functions. In addition, our personnel are subject to rigorous standards of ethical conduct that are widely communicated throughout the organization.
The Audit Committee of Aetna’s Board of Directors engages KPMG LLP, an independent registered public accounting firm, to audit our consolidated financial statements and express their opinion thereon. Members of that firm also have the right of full access to each member of management in conducting their audits. The report of KPMG LLP on their audit of our consolidated financial statements appears on page 140.
Audit Committee Oversight
The Audit Committee of Aetna’s Board of Directors is comprised solely of independent directors. The Audit Committee meets regularly with management, our internal auditors and KPMG LLP to oversee and monitor the work of each and to inquire of each as to their assessment of the performance of the others in their work relating to our consolidated financial statements and ICOFR. Both KPMG LLP and our internal auditors have, at all times, the right of full access to the Audit Committee, without management present, to discuss any matter they believe should be brought to the attention of the Audit Committee.
Report of Independent Registered Public Accounting Firm
The Board of Directors and Shareholders
Aetna Inc.:
We have audited the accompanying consolidated balance sheets of Aetna Inc. and subsidiaries (the “Company”) as of December 31, 2014 and 2013, and the related consolidated statements of income, comprehensive income, shareholders’ equity and cash flows for each of the years in the three-year period ended December 31, 2014. We also have audited the Company’s internal control over financial reporting as of December 31, 2014, based on criteria established in Internal Control - Integrated Framework (2013) issued by the Committee of Sponsoring Organizations of the Treadway Commission (COSO). The Company’s management is responsible for these consolidated financial statements, for maintaining effective internal control over financial reporting, and for its assessment of the effectiveness of internal control over financial reporting, included in the accompanying Management’s Report on Internal Control Over Financial Reporting. Our responsibility is to express an opinion on these consolidated financial statements and an opinion on the Company’s internal control over financial reporting based on our audits.
We conducted our audits in accordance with the standards of the Public Company Accounting Oversight Board (United States). Those standards require that we plan and perform the audits to obtain reasonable assurance about whether the financial statements are free of material misstatement and whether effective internal control over financial reporting was maintained in all material respects. Our audits of the consolidated financial statements included examining, on a test basis, evidence supporting the amounts and disclosures in the financial statements, assessing the accounting principles used and significant estimates made by management, and evaluating the overall financial statement presentation. Our audit of internal control over financial reporting included obtaining an understanding of internal control over financial reporting, assessing the risk that a material weakness exists, and testing and evaluating the design and operating effectiveness of internal control based on the assessed risk. Our audits also included performing such other procedures as we considered necessary in the circumstances. We believe that our audits provide a reasonable basis for our opinions.
A company’s internal control over financial reporting is a process designed to provide reasonable assurance regarding the reliability of financial reporting and the preparation of financial statements for external purposes in accordance with generally accepted accounting principles. A company’s internal control over financial reporting includes those policies and procedures that (1) pertain to the maintenance of records that, in reasonable detail, accurately and fairly reflect the transactions and dispositions of the assets of the company; (2) provide reasonable assurance that transactions are recorded as necessary to permit preparation of financial statements in accordance with generally accepted accounting principles, and that receipts and expenditures of the company are being made only in accordance with authorizations of management and directors of the company; and (3) provide reasonable assurance regarding prevention or timely detection of unauthorized acquisition, use, or disposition of the company’s assets that could have a material effect on the financial statements.
Because of its inherent limitations, internal control over financial reporting may not prevent or detect misstatements. Also, projections of any evaluation of effectiveness to future periods are subject to the risk that controls may become inadequate because of changes in conditions, or that the degree of compliance with the policies or procedures may deteriorate.
In our opinion, the consolidated financial statements referred to above present fairly, in all material respects, the financial position of the Company as of December 31, 2014 and 2013, and the results of its operations and its cash flows for each of the years in the three-year period ended December 31, 2014, in conformity with U.S. generally accepted accounting principles. Also in our opinion, the Company maintained, in all material respects, effective internal control over financial reporting as of December 31, 2014, based on criteria established in Internal Control - Integrated Framework (2013) issued by COSO.
/s/ KPMG LLP
Hartford, Connecticut
February 27, 2015
Quarterly Data (unaudited)
|
| | | | | | | | | | | | | | | |
| (Millions, except per share and common stock data) | First |
| | Second |
| | Third |
| | Fourth |
|
| 2014 | | | | | | | |
| Total revenue | $ | 13,994.8 |
| | $ | 14,509.4 |
| | $ | 14,727.8 |
| | $ | 14,771.2 |
|
| | | | | | | | |
| Income before income taxes | $ | 1,149.7 |
| | $ | 924.6 |
| | $ | 996.9 |
| | $ | 428.7 |
|
| Income taxes | (480.3 | ) | | (377.4 | ) | | (398.1 | ) | | (198.9 | ) |
| Net income including non-controlling interests | 669.4 |
| | 547.2 |
| | 598.8 |
| | 229.8 |
|
| Less: Net income (loss) attributable to non-controlling interests | 3.9 |
| | (1.6 | ) | | 4.3 |
| | (2.2 | ) |
| Net income attributable to Aetna | $ | 665.5 |
| | $ | 548.8 |
| | $ | 594.5 |
| | $ | 232.0 |
|
| | | | | | | | |
Net income attributable to Aetna per share - basic (1) | $ | 1.84 |
| | $ | 1.54 |
| | $ | 1.68 |
| | $ | .66 |
|
Net income attributable to Aetna per share - diluted (1) | 1.82 |
| | 1.52 |
| | 1.67 |
| | .65 |
|
| | | | | | | | |
| Dividends declared per share | $ | .225 |
| | $ | .225 |
| | $ | .225 |
| | $ | .25 |
|
| Common stock prices, high | 75.71 |
| | 82.46 |
| | 84.94 |
| | 90.84 |
|
| Common stock prices, low | 65.15 |
| | 67.77 |
| | 75.22 |
| | 73.43 |
|
| | | | | | | | |
| 2013 | | | | | | | |
| Total revenue | $ | 9,538.9 |
| | $ | 11,537.4 |
| | $ | 13,035.6 |
| | $ | 13,182.7 |
|
| | | | | | | | |
| Income before income taxes | $ | 750.7 |
| | $ | 847.7 |
| | $ | 806.7 |
| | $ | 535.4 |
|
| Income taxes | (259.8 | ) | | (314.5 | ) | | (287.7 | ) | | (166.6 | ) |
| Net income including non-controlling interests | 490.9 |
| | 533.2 |
| | 519.0 |
| | 368.8 |
|
| Less: Net income (loss) attributable to non-controlling interests | .8 |
| | (2.8 | ) | | .4 |
| | (.1 | ) |
| Net income attributable to Aetna | $ | 490.1 |
| | $ | 536.0 |
| | $ | 518.6 |
| | $ | 368.9 |
|
| | | | | | | | |
Net income attributable to Aetna per share - basic (1) | $ | 1.50 |
| | $ | 1.50 |
| | $ | 1.40 |
| | $ | 1.01 |
|
Net income attributable to Aetna per share - diluted (1) | 1.48 |
| | 1.49 |
| | 1.38 |
| | 1.00 |
|
| | | | | | | | |
| Dividends declared per share | $ | .20 |
| | $ | .20 |
| | $ | .20 |
| | $ | .225 |
|
| Common stock prices, high | 51.46 |
| | 63.59 |
| | 68.71 |
| | 68.93 |
|
| Common stock prices, low | 44.38 |
| | 52.38 |
| | 61.54 |
| | 60.75 |
|
| | | | | | | | |
| |
(1) | Calculation of net income attributable to Aetna per share is based on weighted average shares outstanding during each quarter and, accordingly, the sum may not equal the total for the year. |
Corporate Performance Graph
The following graph compares the cumulative total shareholder return on our common stock (assuming reinvestment of dividends) with the cumulative total return on the published Standard & Poor’s 500 Stock Index (“S&P 500”) and the cumulative total return on the published Standard & Poor’s Supercomposite Managed Health Care Index (“S&P MHCI”) from December 31, 2009 through December 31, 2014. The graph assumes a $100 investment in shares of our common stock on December 31, 2009.
| |
(1) | At December 31, 2014, the companies included in the S&P MHCI were: Aetna Inc., Anthem, Inc. (formerly WellPoint, Inc.), Centene Corporation, CIGNA Corporation, Health Net, Inc., Humana Inc., Magellan Health Services, Inc., Molina Healthcare, Inc., UnitedHealth Group Incorporated and Wellcare Health Plans, Inc. |
Shareholder returns over the period shown on the corporate performance graph should not be considered indicative of future shareholder returns.