SECURITIES AND EXCHANGE COMMISSION
Washington, D.C. 20549
FORM 20-F
| REGISTRATION STATEMENT PURSUANT TO SECTION 12(b) OR 12(g) OF THE SECURITIES EXCHANGE ACT OF 1934 |
OR
| x | ANNUAL REPORT PURSUANT TO SECTION 13 OR 15(d) OF THE SECURITIES EXCHANGE ACT OF 1934 |
| | For the fiscal year ended December 31, 2008 |
OR
| o | TRANSITION REPORT PURSUANT TO SECTION 13 OR 15(d) OF THE SECURITIES EXCHANGE ACT OF 1934 |
OR
| o | SHELL COMPANY REPORT PURSUANT TO SECTION 13 OR 15(d) OF THE SECURITIES EXCHANGE ACT OF 1934 |
Commission file number: 001-16125
日月光半導體製造股份有限公司
(Exact Name of Registrant as Specified in Its Charter)
Advanced Semiconductor Engineering, Inc.
(Translation of Registrant’s Name into English)
REPUBLIC OF CHINA
(Jurisdiction of Incorporation or Organization)
26 Chin Third Road
Nantze Export Processing Zone
Nantze, Kaohsiung, Taiwan
Republic of China
(Address of Principal Executive Offices)
Joseph Tung
Room 1901, No. 333, Section 1 Keelung Rd.
Taipei, Taiwan, 110
Republic of China
Tel: 886-2-8780-5489
Fax: 882-2-2757-6121
Email: ir@aseglobal.com
(Name, Telephone, Email and/or Facsimile number and Address of Company Contact Person)
Securities registered or to be registered pursuant to Section 12(b) of the Act:
Title of Each Class Common Shares, par value NT$10.00 each | Name of Each Exchange on which Registered The New York Stock Exchange* |
*Traded in the form of American Depositary Receipts evidencing American Depositary Shares, each representing five Common Shares
(Title of Class)
Securities registered or to be registered pursuant to Section 12(g) of the Act:
None
Securities for which there is a reporting obligation pursuant to Section 15(d) of the Act:
None
(Title of Class)
Indicate the number of outstanding shares of each of the issuer’s classes of capital or common stock as of the close of the period covered by the annual report:
5,690,427,734 Common Shares, par value NT$10 each**
Indicate by check mark if the registrant is a well-known seasoned issuer, as defined in Rule 405 of the Securities Act.
Yes þ No ¨
If this report is an annual or transition report, indicate by check mark if the registrant is not required to file reports pursuant to Section 13 or 15(d) of the Securities Exchange Act of 1934.
Yes ¨ No þ
Indicate by check mark whether the Registrant (1) has filed all reports required to be filed by Section 13 or 15(d) of the Securities Exchange Act of 1934 during the preceding 12 months (or for such shorter period that the Registrant was required to file such reports) and (2) has been subject to such filing requirements for the past 90 days.
Yes þ No ¨
Indicate by check mark whether the registrant is a large accelerated filer, an accelerated filer, or a non-accelerated filer. See definition of “accelerated filer and large accelerated filer” in Rule 12b-2 of the Exchange Act. (Check one):
Large accelerated filer þ Accelerated filer ¨ Non-accelerated filer ¨
Indicate by check mark which basis of accounting the registrant has used to prepare the financial statements included in this filing:
U.S. GAAP ¨ International Financial Reporting Standards as issued by the International Accounting Standards Board ¨ Other þ
If “Other” has been checked in response to the previous question, indicate by check mark which financial statement item the registrant has elected to follow:
Item 17 ¨ Item 18 þ
If this is an annual report, indicate by check mark whether the registrant is a shell company (as defined in Rule 12b-2 of the Exchange Act).
Yes ¨ No þ
** As a result of the exercise of employee stock options and the cancellation of treasury stock subsequent to December 31, 2008, as of May 31, 2009, we had 5,547,064,694 shares outstanding.
Page
| 1 |
| 1 |
| 3 |
| 3 |
| 3 |
| 3 |
| 3 |
| 6 |
| 6 |
| 6 |
| 19 |
| 19 |
| 21 |
| 41 |
| 44 |
| 46 |
| 46 |
| 46 |
| 59 |
| 62 |
| 63 |
| 63 |
| 64 |
| 64 |
| 67 |
| 68 |
| 69 |
| 70 |
| 70 |
| 71 |
| 71 |
| 72 |
| 72 |
| 72 |
| 73 |
| 74 |
| 74 |
| 74 |
| 76 |
| 76 |
| 76 |
| 76 |
| 76 |
| 76 |
| 76 |
| 76 |
| 82 |
| 83 |
| 84 |
| 87 |
| 87 |
| 87 |
| 88 |
| 88 |
| 90 |
| 90 |
| 90 |
| 90 |
| 90 |
| 92 |
| 92 |
| 92 |
| 92 |
| 93 |
| 93 |
| 93 |
| 93 |
| 97 |
| 97 |
| 97 |
| 97 |
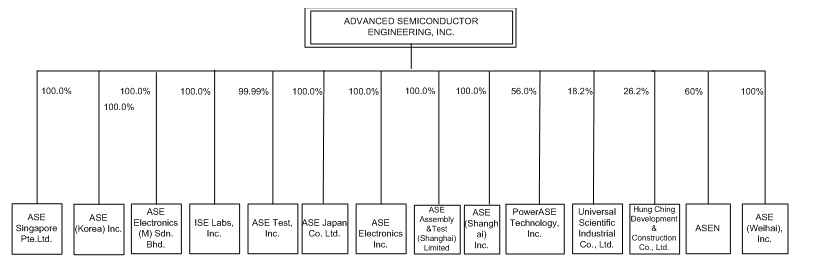
All references herein to (i) the “Company”, “ASE Group”, “ASE Inc.”, “we”, “us”, or “our” are to Advanced Semiconductor Engineering, Inc. and, unless the context requires otherwise, its subsidiaries, (ii) “ASE Test” are to ASE Test Limited, a company incorporated under the laws of Singapore, and its subsidiaries, (iii) “ASE Test Taiwan” are to ASE Test, Inc., a company incorporated under the laws of the ROC, (iv) “ASE Test Malaysia” are to ASE Electronics (M) Sdn. Bhd., a company incorporated under the laws of Malaysia, (v) “ISE Labs” are to ISE Labs, Inc., a corporation incorporated under the laws of the State of California, (vi) “ASE Korea” are to ASE (Korea) Inc., a company incorporated under the laws of the Republic of Korea, (vii) “ASE Japan” are to ASE Japan Co. Ltd., a company incorporated under the laws of Japan, (viii) “ASE Shanghai” are to ASE (Shanghai) Inc., a company incorporated under the laws of the PRC, (ix) “ASE Electronics” are to ASE Electronics Inc., a company incorporated under the laws of the ROC, (x) “PowerASE” are to PowerASE Technology, Inc., a company incorporated under the laws of the ROC, (xi) “ASESH AT” are to ASE Assembly & Test (Shanghai) Limited, formerly known as Global Advanced Packaging Technology Limited, a company incorporated under the laws of the PRC, or GAPT, (xii) “ASEN” are to Suzhou ASEN Semiconductors Co., Ltd., a company incorporated under the laws of the PRC, (xiii) “ASEWH” are to ASE (Weihai), Inc., a company incorporated under the laws of the PRC, (xiv) “Universal Scientific” are to Universal Scientific Industrial Co., Ltd., a company incorporated under the laws of the ROC, (xv) “Hung Ching” are to Hung Ching Development & Construction Co. Ltd., a company incorporated under the laws of the ROC, (xvi) “ASE Material” are to ASE Material Inc., a company previously incorporated under the laws of the ROC that merged into ASE Inc. on August 1, 2004, (xvii) “ASE Chung Li” are to ASE (Chung Li) Inc., a company previously incorporated under the laws of the ROC that merged into ASE Inc. on August 1, 2004, (xviii) the “Securities Act” are to the U.S. Securities Act of 1933, as amended, and (xix) the “Exchange Act” are to the U.S. Securities Exchange Act of 1934, as amended.
All references to the “Republic of China”, the “ROC” and “Taiwan” are to the Republic of China, including Taiwan and certain other possessions. All references to “Korea” or “South Korea” are to the Republic of Korea. All references to the “PRC” are to the People’s Republic of China and exclude Taiwan, Macau and Hong Kong.
We publish our financial statements in New Taiwan dollars, the lawful currency of the ROC. In this annual report, references to “United States dollars”, “U.S. dollars” and “US$” are to the currency of the United States; references to “New Taiwan dollars”, “NT dollars” and “NT$” are to the currency of the ROC; references to “RMB” are to the currency of the PRC; references to “JP¥” are to the currency of Japan; references to “EUR” are to the currency of the European Union; and references to “KRW” are to the currency of the Republic of Korea. Unless otherwise noted, all translations from NT dollars to U.S. dollars were made at the noon buying rate in The City of New York for cable transfers in NT dollars per U.S. dollar as certified for customs purposes by the Federal Reserve Bank of New York as of December 31, 2008, which was NT$32.76=US$1.00. All amounts translated into U.S. dollars in this annual report are provided solely for your convenience and no representation is made that the NT dollar or U.S. dollar amounts referred to herein could have been or could be converted into U.S. dollars or NT dollars, as the case may be, at any particular rate or at all. On June 1, 2009, the noon buying rate was NT$32.36=US$1.00.
This annual report on Form 20-F contains “forward-looking statements” within the meaning of Section 27A of the Securities Act and Section 21E of the Exchange Act, including statements regarding our future results of operations and business prospects. Although these forward-looking statements, which may include statements regarding our future results of operations, financial condition or business prospects, are based on our own information and information from other sources we believe to be reliable, you should not place undue reliance on these forward-looking statements, which apply only as of the date of this annual report. We were not involved in the preparation of these projections. The words “anticipate”, “believe”, “estimate”, “expect”, “intend”, “plan” and similar expressions, as they relate to us, are intended to identify these forward-looking statements in this annual report. Our actual results of operations, financial condition or business prospects may differ materially from those expressed or implied in these forward-looking statements for a variety of reasons, including risks associated with cyclicality and market conditions in the semiconductor industry; demand for the outsourced semiconductor
packaging and testing services we offer and for such outsourced services generally; the highly competitive semiconductor industry; our ability to introduce new packaging and testing technologies in order to remain competitive; international business activities; our business strategy; our future expansion plans and capital expenditures; the strained relationship between the ROC and the PRC; general economic and political conditions; the recent global economic crisis; possible disruptions in commercial activities caused by natural or human-induced disasters; fluctuations in foreign currency exchange rates; and other factors. For a discussion of these risks and other factors, see “Item 3. Key Information—Risk Factors.”
Not applicable.
Not applicable.
The selected consolidated statement of operations data and cash flow data for the years ended December 31, 2006, 2007 and 2008, and the selected consolidated balance sheet data as of December 31, 2007 and 2008, set forth below are derived from our audited consolidated financial statements included in this annual report and should be read in conjunction with, and are qualified in their entirety by reference to, these consolidated financial statements, including the notes thereto. The selected consolidated statement of operations data and cash flow data for the years ended December 31, 2004 and 2005 and the selected consolidated balance sheet data as of December 31, 2004, 2005 and 2006, set forth below, are derived from our audit consolidated financial statements not included herein.Our consolidated financial statements have been prepared and presented in accordance with accounting principles generally accepted in the ROC, or ROC GAAP, which differ in some material respects from accounting principles generally accepted in the United States of America, or U.S. GAAP. See note 32 to our consolidated financial statements for a description of the significant differences between ROC GAAP and U.S. GAAP for the periods covered by these consolidated financial statements.
| | | As of and for the Year Ended December 31, | |
| | | | | | | | | | | | | | | | |
| | | NT$ | | | NT$ | | | NT$ | | | NT$ | | | NT$ | | | US$ | |
| | | (in millions, except earnings per share and per ADS data) | |
| ROC GAAP: | | | | | | | | | | | | | | | | | | |
| Statement of Operations Data: | | | | | | | | | | | | | | | | | | |
| Net revenues | | | 75,237.7 | | | | 84,035.8 | | | | 100,423.6 | | | | 101,163.1 | | | | 94,430.9 | | | | 2,882.5 | |
| Cost of revenues | | | (59,641.1 | ) | | | (69,518.0 | ) | | | (71,643.3 | ) | | | (72,074.7 | ) | | | (71,901.7 | ) | | | (2,194.8 | ) |
| Gross profit | | | 15,596.6 | | | | 14,517.8 | | | | 28,780.3 | | | | 29,088.4 | | | | 22,529.2 | | | | 687.7 | |
| Total operating expenses | | | (8,639.8 | ) | | | (8,698.6 | ) | | | (8,333.9 | ) | | | (9,791.2 | ) | | | (10,729.7 | ) | | | (327.5 | ) |
| Income from operations | | | 6,956.8 | | | | 5,819.2 | | | | 20,446.4 | | | | 19,297.2 | | | | 11,799.5 | | | | 360.2 | |
| Non-operating income (expense) | | | (3,993.9 | ) | | | (11,493.0 | ) | | | 1,805.0 | | | | (1,945.3 | ) | | | (2,323.7 | ) | | | (71.0 | ) |
| Income (loss) before income tax | | | 2,962.9 | | | | (5,673.8 | ) | | | 22,251.4 | | | | 17,351.9 | | | | 9,475.8 | | | | 289.2 | |
| Income tax benefit (expense) | | | 1,397.0 | | | | 118.6 | | | | (2,084.8 | ) | | | (3,357.4 | ) | | | (2,268.3 | ) | | | (69.2 | ) |
| Income (loss) from continuing operations | | | 4,359.9 | | | | (5,555.2 | ) | | | 20,166.6 | | | | 13,994.5 | | | | 7,207.5 | | | | 220.0 | |
Discontinued operations(1) | | | 568.2 | | | | 353.7 | | | | — | | | | — | | | | — | | | | — | |
| Cumulative effect of change in accounting principle | | | (26.8 | ) (2) | | | — | | | | (342.5 | ) (3) | | | — | | | | — | | | | — | |
| Minority interest in net loss (income) of subsidiaries | | | (691.6 | ) | | | 510.3 | | | | (2,407.9 | ) | | | (1,829.2 | ) | | | (1,047.4 | ) | | | (32.0 | ) |
| Net income (loss) attributable to shareholders of parent company | | | 4,209.7 | | | | (4,691.2 | ) | | | 17,416.2 | | | | 12,165.3 | | | | 6,160.1 | | | | 188.0 | |
| Income from operations per common share | | | 1.36 | | | | 1.11 | | | | 3.86 | | | | 3.58 | | | | 2.19 | | | | 0.07 | |
| Income (loss) from continuing operations per common share | | | 0.71 | | | | (0.96 | ) | | | 3.36 | | | | 2.26 | | | | 1.14 | | | | 0.03 | |
Earnings (loss) per common share(4): | | | | | | | | | | | | | | | | | | | | | | | | |
| Basic | | | 0.82 | | | | (0.89 | ) | | | 3.29 | | | | 2.26 | | | | 1.14 | | | | 0.03 | |
| Diluted | | | 0.80 | | | | (0.89 | ) | | | 3.14 | | | | 2.18 | | | | 1.12 | | | | 0.03 | |
Dividends per common share(5) | | | 0.57 | | | | 1.10 | | | | — | | | | 2.96 | | | | 2.00 | | | | 0.06 | |
Earnings (loss) per equivalent ADS(4): | | | | | | | | | | | | | | | | | | | | | | | | |
| Basic | | | 4.11 | | | | (4.47 | ) | | | 16.46 | | | | 11.28 | | | | 5.71 | | | | 0.17 | |
| Diluted | | | 4.01 | | | | (4.47 | ) | | | 15.69 | | | | 10.90 | | | | 5.59 | | | | 0.17 | |
| | | As of and for the Year Ended December 31, | |
| | | | | | | | | | | | | | | | |
| | | NT$ | | | NT$ | | | NT$ | | | NT$ | | | NT$ | | | US$ | |
| | | (in millions, except earnings per share and per ADS data) | |
Number of common shares(6): | | | | | | | | | | | | | | | | | | | | | | | | |
| Basic | | | 5,121.9 | | | | 5,248.9 | | | | 5,291.6 | | | | 5,390.9 | | | | 5,392.9 | | | | 5,392.9 | |
| Diluted | | | 5,459.4 | | | | 5,248.9 | | | | 5,603.5 | | | | 5,633.1 | | | | 5,457.4 | | | | 5,457.4 | |
| Number of equivalent ADSs: | | | | | | | | | | | | | | | | | | | | | | | | |
| Basic | | | 1,024.4 | | | | 1,049.8 | | | | 1,058.3 | | | | 1,078.2 | | | | 1,078.6 | | | | 1,078.6 | |
| Diluted | | | 1,091.9 | | | | 1,049.8 | | | | 1,120.7 | | | | 1,126.6 | | | | 1,091.5 | | | | 1,091.5 | |
| Balance Sheet Data: | | | | | | | | | | | | | | | | | | | | | | | | |
| Current assets | | | 35,894.9 | | | | 47,544.0 | | | | 48,762.8 | | | | 56,902.0 | | | | 46,366.9 | | | | 1,415.3 | |
| Long-term investments | | | 4,907.4 | | | | 4,898.1 | | | | 5,734.5 | | | | 4,850.2 | | | | 4,327.0 | | | | 132.1 | |
| Property, plant and equipment, net | | | 82,339.9 | | | | 68,040.8 | | | | 73,543.8 | | | | 81,788.3 | | | | 84,758.0 | | | | 2,587.2 | |
| Intangible assets | | | 3,959.8 | | | | 3,589.1 | | | | 3,449.0 | | | | 4,732.3 | | | | 12,592.0 | | | | 384.4 | |
| Other assets | | | 6,848.9 | | | | 7,053.5 | | | | 5,550.8 | | | | 4,104.6 | | | | 4,146.1 | | | | 126.6 | |
| Total assets | | | 133,950.9 | | | | 131,125.5 | | | | 137,040.9 | | | | 152,377.4 | | | | 152,190.0 | | | | 4,645.6 | |
Short-term borrowings(7) | | | 6,852.8 | | | | 10,523.1 | | | | 8,499.1 | | | | 15,773.9 | | | | 11,473.2 | | | | 350.2 | |
Long-term debts(8) | | | 46,529.6 | | | | 42,862.1 | | | | 29,398.3 | | | | 23,936.0 | | | | 51,622.2 | | | | 1,575.8 | |
Other liabilities(9) | | | 20,851.9 | | | | 22,890.0 | | | | 22,016.7 | | | | 22,927.6 | | | | 17,133.8 | | | | 523.0 | |
| Total liabilities | | | 74,234.3 | | | | 76,275.2 | | | | 59,914.1 | | | | 62,637.5 | | | | 80,229.2 | | | | 2,449.0 | |
| Capital stock | | | 41,000.0 | | | | 45,573.7 | | | | 45,925.1 | | | | 54,475.6 | | | | 56,904.3 | | | | 1,737.0 | |
| Minority interest in consolidated subsidiaries | | | 8,404.8 | | | | 7,902.0 | | | | 11,106.9 | | | | 14,566.5 | | | | 2,288.7 | | | | 69.9 | |
| Total shareholders’ equity | | | 59,716.6 | | | | 54,850.3 | | | | 77,126.8 | | | | 89,739.9 | | | | 71,960.8 | | | | 2,196.6 | |
| Cash Flow Data: | | | | | | | | | | | | | | | | | | | | | | | | |
| Net cash outflow from acquisition of property, plant and equipment | | | (28,521.4 | ) | | | (15,611.5 | ) | | | (17,764.2 | ) | | | (17,190.4 | ) | | | (18,583.3 | ) | | | (567.3 | ) |
| Depreciation and amortization | | | 14,786.3 | | | | 15,032.8 | | | | 14,488.2 | | | | 16,626.2 | | | | 17,244.9 | | | | 526.4 | |
| Net cash inflow from operating activities | | | 19,206.7 | | | | 18,751.1 | | | | 37,310.8 | | | | 28,310.6 | | | | 30,728.8 | | | | 938.0 | |
| Net cash outflow from investing activities | | | (31,048.9 | ) | | | (11,632.0 | ) | | | (22,104.5 | ) | | | (18,108.4 | ) | | | (36,359.2 | ) | | | (1,109.9 | ) |
| Net cash inflow (outflow) from financing activities | | | 9,164.2 | | | | (91.8 | ) | | | (12,581.9 | ) | | | (8,492.7 | ) | | | 13,862.4 | | | | 423.2 | |
| Segment Data: | | | | | | | | | | | | | | | | | | | | | | | | |
| Net revenues: | | | | | | | | | | | | | | | | | | | | | | | | |
| Packaging | | | 58,261.8 | | | | 66,022.9 | | | | 76,820.5 | | | | 78,516.3 | | | | 73,391.6 | | | | 2,240.3 | |
| Testing | | | 16,473.9 | | | | 17,122.0 | | | | 21,429.6 | | | | 20,007.8 | | | | 19,021.4 | | | | 580.6 | |
| Others | | | 502.0 | | | | 890.9 | | | | 2,173.5 | | | | 2,639.0 | | | | 2,017.9 | | | | 61.6 | |
| Gross profit (loss): | | | | | | | | | | | | | | | | | | | | | | | | |
| Packaging | | | 11,146.0 | | | | 10,128.7 | | | | 19,280.8 | | | | 20,589.7 | | | | 14,700.1 | | | | 448.7 | |
| Testing | | | 4,332.7 | | | | 4,433.1 | | | | 8,728.2 | | | | 7,602.9 | | | | 6,467.4 | | | | 197.4 | |
| Others | | | 117.9 | | | | (44.0 | ) | | | 771.3 | | | | 895.8 | | | | 1,361.7 | | | | 41.6 | |
| | | As of and for the Year Ended December 31, | |
| | | 2004 | | | 2005 | | | 2006 | | | 2007 | | | 2008 | |
| | | NT$ | | | NT$ | | | NT$ | | | NT$ | | | NT$ | | | US$ | |
| | | (in millions, except earnings per share and per ADS data) | |
| U.S. GAAP: | | | | | | | | | | | | | | | | | | |
| Statement of Operations Data: | | | | | | | | | | | | | | | | | | |
| Net revenues | | | 75,237.7 | | | | 84,035.8 | | | | 100,423.6 | | | | 101,163.1 | | | | 94,430.9 | | | | 2,882.5 | |
| Cost of revenues | | | (60,030.0 | ) | | | (70,544.4 | ) | | | (73,366.9 | ) | | | (75,134.7 | ) | | | (73,109.9 | ) | | | (2,231.7 | ) |
| Gross profit | | | 15,207.7 | | | | 13,491.4 | | | | 27,056.7 | | | | 26,028.4 | | | | 21,321.0 | | | | 650.8 | |
| Total operating expenses | | | (7,227.6 | ) | | | (21,882.8 | ) | | | (10,113.8 | ) | | | (11,108.7 | ) | | | (10,820.7 | ) | | | (330.3 | ) |
| Income (loss) from operations | | | 7,980.1 | | | | (8,391.4 | ) | | | 16,942.9 | | | | 14,919.7 | | | | 10,500.3 | | | | 320.5 | |
| Non-operating income (expense) | | | (5,127.2 | ) | | | 1,958.5 | | | | 1,448.4 | | | | 71.4 | | | | (1,351.2 | ) | | | (41.2 | ) |
| Income tax benefit (expense) | | | 1,506.1 | | | | 190.3 | | | | (1,980.7 | ) | | | (3,262.5 | ) | | | (2,503.5 | ) | | | (76.4 | ) |
Discontinued operations(1) | | | 568.2 | | | | 353.7 | | | | — | | | | — | | | | — | | | | — | |
| Cumulative effect of change in accounting principle | | | (26.8 | )(2) | | | — | | | | (296.5 | )(10) | | | — | | | | — | | | | — | |
| Minority interest in net loss (income) of subsidiaries | | | (603.3 | ) | | | 358.4 | | | | (1,991.4 | ) | | | (1,797.5 | ) | | | (1,153.5 | ) | | | (35.2 | ) |
| Net income (loss) | | | 4,297.1 | | | | (5,530.5 | ) | | | 14,122.7 | | | | 9,931.1 | | | | 5,492.1 | | | | 167.7 | |
| | | As of and for the Year Ended December 31, | |
| | | 2004 | | | 2005 | | | 2006 | | | 2007 | | | 2008 | |
| | | NT$ | | | NT$ | | | NT$ | | | NT$ | | | NT$ | | | US$ | |
| | | (in millions, except earnings per share and per ADS data) | |
Earnings (loss) per common share(4): | | | | | | | | | | | | | | | | | | | | | | | | |
| Basic | | | 0.86 | | | | (1.08 | ) | | | 2.71 | | | | 1.87 | | | | 1.02 | | | | 0.03 | |
| Diluted | | | 0.84 | | | | (1.08 | ) | | | 2.60 | | | | 1.81 | | | | 1.01 | | | | 0.03 | |
Earnings (loss) per equivalent ADS(4): | | | | | | | | | | | | | | | | | | | | | | | | |
| Basic | | | 4.29 | | | | (5.38 | ) | | | 13.57 | | | | 9.34 | | | | 5.11 | | | | 0.16 | |
| Diluted | | | 4.18 | | | | (5.38 | ) | | | 12.98 | | | | 9.03 | | | | 5.04 | | | | 0.16 | |
Number of common shares(11): | | | | | | | | | | | | | | | | | | | | | | | | |
| Basic | | | 5,009.9 | | | | 5,141.1 | | | | 5,202.7 | | | | 5,317.7 | | | | 5,368.7 | | | | 5,368.7 | |
| Diluted | | | 5,340.1 | | | | 5,141.1 | | | | 5,505.5 | | | | 5,566.1 | | | | 5,405.3 | | | | 5,405.3 | |
Number of equivalent ADSs(11): | | | | | | | | | | | | | | | | | | | | | | | | |
| Basic | | | 1,002.0 | | | | 1,028.2 | | | | 1,040.5 | | | | 1,063.5 | | | | 1,073.7 | | | | 1,073.7 | |
| Diluted | | | 1,068.1 | | | | 1,028.2 | | | | 1,101.1 | | | | 1,113.2 | | | | 1,081.1 | | | | 1,081.1 | |
| Balance Sheet Data: | | | | | | | | | | | | | | | | | | | | | | | | |
| Current assets | | | 35,899.1 | | | | 47,560.3 | | | | 48,762.8 | | | | 56,902.0 | | | | 46,366.9 | | | | 1,415.3 | |
| Long-term investments | | | 3,377.6 | | | | 3,469.2 | | | | 4,266.9 | | | | 3,045.4 | | | | 2,842.7 | | | | 86.8 | |
| Property, plant and equipment, net | | | 81,849.1 | | | | 67,547.9 | | | | 70,894.1 | | | | 80,036.6 | | | | 82,694.5 | | | | 2,524.3 | |
| Intangible assets | | | 3,954.4 | | | | 4,112.6 | | | | 3,972.4 | | | | 5,255.8 | | | | 12,940.6 | | | | 395.0 | |
| Other assets | | | 7,008.5 | | | | 7,284.7 | | | | 5,834.9 | | | | 3,766.7 | | | | 3,963.5 | | | | 121.0 | |
| Total assets | | | 132,088.7 | | | | 129,974.7 | | | | 133,731.1 | | | | 149,006.5 | | | | 148,808.2 | | | | 4,542.4 | |
Short-term borrowings(7) | | | 6,852.8 | | | | 10,523.1 | | | | 8,499.1 | | | | 15,773.9 | | | | 11,473.2 | | | | 350.2 | |
Long-term debts(8) | | | 46,529.6 | | | | 42,862.1 | | | | 29,398.3 | | | | 23,936.0 | | | | 51,622.2 | | | | 1,575.8 | |
Other liabilities(9) | | | 21,465.2 | | | | 23,397.2 | | | | 24,228.3 | | | | 24,746.0 | | | | 18,307.1 | | | | 558.8 | |
| Total liabilities | | | 74,847.6 | | | | 76,782.4 | | | | 62,125.7 | | | | 64,455.9 | | | | 81,402.5 | | | | 2,484.8 | |
| Minority interest | | | 8,584.0 | | | | 8,233.0 | | | | 11,021.3 | | | | 14,449.2 | | | | 2,102.7 | | | | 64.2 | |
| Capital stock | | | 41,000.0 | | | | 45,573.7 | | | | 45,925.1 | | | | 54,475.6 | | | | 56,904.3 | | | | 1,737.0 | |
| Total shareholders’ equity | | | 48,657.1 | | | | 44,959.3 | | | | 60,584.1 | | | | 70,101.4 | | | | 65,303.0 | | | | 1,993.4 | |
| (1) | In October 2005, we disposed of our camera module assembly operations in Malaysia. Amount for 2005 includes income from discontinued operations of NT$121.0 million and gain on disposal of discontinued operations of NT$232.7 million, net of income tax expense. Such operations were formerly classified as part of our packaging operations. Information in this annual report from our consolidated statements of operations for the years ended December 31, 2004 and 2005 has been adjusted to reflect the reclassification of our camera module assembly operations as discontinued operations. Information from our consolidated statements of cash flows was appropriately not adjusted. |
| (2) | Represents the cumulative effect of our change from using the weighted-average method to using the moving-average method to price our raw materials and supplies. |
| (3) | Represents the cumulative effect of our adoption of ROC Statement of Financial Accounting Standards, or SFAS, No. 34 “Financial Instrument: Recognition and Measurement” and ROC SFAS, No. 36 “Financial Instruments: Disclosure and Presentation.” See note 3 to our consolidated financial statements included in this annual report. |
| (4) | The denominators for diluted earnings per common share and diluted earnings per equivalent ADS are calculated to account for the potential exercise of options and conversion of our convertible bonds into our common shares and American depositary shares, or ADSs. |
| (5) | Dividends per common share issued as a cash dividend and a stock dividend. |
| (6) | Represents the weighted average number of shares after retroactive adjustments to give effect to stock dividends and employee stock bonuses. Beginning in 2002, common shares held by consolidated subsidiaries are classified as “treasury stock”, and are deducted from the number of common shares outstanding. |
| (7) | Includes current portions of bonds payable, long-term bank loans and capital lease obligations. |
| (8) | Excludes current portions of bonds payable, long-term bank loans and capital lease obligations. |
| (9) | Includes current liabilities other than short-term borrowings. |
| (10) | Represents the cumulative effect of our adoption of U.S. SFAS No. 123R, “Share-Based Payment.” See note 33 to our consolidated financial statements included in this annual report. |
| (11) | Represents the weighted average number of common shares after retroactive adjustments to give effect to stock dividends. |
Exchange Rates
Fluctuations in the exchange rate between NT dollars and U.S. dollars will affect the U.S. dollar equivalent of the NT dollar price of the common shares on the Taiwan Stock Exchange and, as a result, will likely affect the market price of the ADSs. Fluctuations will also affect the U.S. dollar conversion by the depositary under our ADS deposit agreement referred to below of cash dividends paid in NT dollars on, and the NT dollar proceeds received by
the depositary from any sale of, common shares represented by ADSs, in each case, according to the terms of the deposit agreement dated September 29, 2000 and as amended and supplemented from time to time among us, Citibank N.A., as depositary, and the holders and beneficial owners from time to time of the ADSs, which we refer to as the deposit agreement.
The following table sets forth, for the periods indicated, information concerning the number of NT dollars for which one U.S. dollar could be exchanged based on the noon buying rate for cable transfers in NT dollars as certified for customs purposes by the Federal Reserve Bank of New York.
| | | NT Dollars per U.S. Dollar Noon Buying Rate | |
| | | | | | | | | | | | | |
| 2004 | | | 33.37 | | | | 34.16 | | | | 33.10 | | | | 33.24 | |
| 2005 | | | 32.13 | | | | 33.77 | | | | 30.65 | | | | 32.80 | |
| 2006 | | | 32.51 | | | | 33.31 | | | | 31.28 | | | | 32.59 | |
| 2007 | | | 32.85 | | | | 33.41 | | | | 32.26 | | | | 32.43 | |
| 2008 | | | 31.52 | | | | 33.58 | | | | 29.99 | | | | 32.76 | |
| December | | | 33.16 | | | | 33.58 | | | | 32.45 | | | | 32.76 | |
| 2009 | | | | | | | | | | | | | | | | |
| January | | | 33.37 | | | | 33.70 | | | | 32.82 | | | | 33.70 | |
| February | | | 34.24 | | | | 35.00 | | | | 33.61 | | | | 35.00 | |
| March | | | 34.30 | | | | 35.21 | | | | 33.75 | | | | 33.87 | |
| April | | | 33.60 | | | | 33.88 | | | | 32.99 | | | | 33.06 | |
| May | | | 32.87 | | | | 33.14 | | | | 32.55 | | | | 32.57 | |
Source: Federal Reserve Statistical Release, Board of Governors of the Federal Reserve System.
On June 1, 2009, the noon buying rate was NT$32.36=US$1.00.
Not applicable.
Not applicable.
Risks Relating to Our Business
The current global economic crisis has adversely affected the semiconductor industry and the demand for our products and services, and a protracted global economic crisis would have a material adverse effect on us.
Our customers include a range of companies in the semiconductor industry, whose success is linked to the health of the economy. As widely reported, the global financial markets have recently been experiencing extreme volatility and disruptions, which have severely diminished liquidity and credit availability. This market turmoil and tightening of credit have led to an increased level of commercial and consumer delinquencies, lack of consumer confidence, increased market volatility and widespread reduction of business activity generally. There can be no assurance that there will be no further deterioration in the global financial markets.
Our fourth quarter 2008 revenue decreased 36.8% over the prior year which reflected the contraction in demand for our services as a result of the global economic crisis. The protracted decline in the global economy and semiconductor industry may also cause our customers to do the following:
| · | cancel or reduce planned expenditures for our products and services; |
| · | seek to lower their costs by renegotiating their contracts with us; |
| · | consolidate the number of suppliers they use which may result in our loss of customers; and |
| · | switch to lower-priced products or services provided by our competitors. |
The current uncertainty in global economic conditions may also make it difficult for our customers to accurately forecast and plan future business activities. We cannot predict the timing, strength, or duration of the global economic slowdown and downturn in the semiconductor industry or subsequent recovery. There can be no assurance that the continuing or deteriorating trends in global economic conditions will not further adversely impact our results of operations, cash flow, financial position and/or prospects.
Since we are dependent on the highly cyclical semiconductor industry and conditions in the markets for the end-use applications of our products, our revenues and net income may fluctuate significantly.
Our semiconductor packaging and testing business is affected by market conditions in the highly cyclical semiconductor industry. All of our customers operate in this industry, and variations in order levels from our customers and service fee rates may result in volatility in our revenues and net income. From time to time, the semiconductor industry has experienced significant, and sometimes prolonged, downturns. As our business is, and will continue to be, dependent on the requirements of semiconductor companies for independent packaging and testing services, any future downturn in the semiconductor industry would reduce demand for our services. For example, in the fourth quarter of 2008, the global economic crisis resulted in a significant deterioration in demand for our customers’ products, which in turn affected demand for our services and adversely affected our operating results. Although demand has begun to recover in the second quarter of 2009, we expect there to be continued downward pressure on our average selling prices and continued volatility with respect to our sales volumes. If we cannot reduce our costs or adjust our product mix to sufficiently offset any decline in average selling prices, our profitability will suffer and we may incur losses.
Market conditions in the semiconductor industry depend to a large degree on conditions in the markets for the end-use applications of semiconductor products, such as communications, computer and consumer electronics products. Any deterioration of conditions in the markets, including the recent severe deterioration of global economic conditions, for the end-use applications of the semiconductors we package and test would reduce demand for our services, and would likely have a material adverse effect on our financial condition and results of operations. In 2006, approximately 37.2%, 24.7% and 37.3% of our net revenues were attributed to the packaging and testing of semiconductors used in communications, computer, and consumer electronics applications, respectively. In 2007, approximately 44.5%, 22.8% and 32.1% of our net revenues were attributed to the packaging and testing of semiconductors used in communications, computer, and consumer electronics applications, respectively. In 2008, approximately 44.7%, 22.8% and 32.1% of our net revenues were attributed to the packaging and testing of semiconductors used in communications, computer, and consumer electronics applications, respectively. Each of the markets for end-use applications is subject to intense competition and significant shifts in demand, which could put pricing pressure on the packaging and testing services provided by us and adversely affect our revenues and net income.
A reversal or slowdown in the outsourcing trend for semiconductor packaging and testing services could adversely affect our growth prospects and profitability.
In recent years, semiconductor manufacturers that have their own in-house packaging and testing capabilities, known as integrated device manufacturers, have increasingly outsourced stages of the semiconductor production process, including packaging and testing, to independent companies in order to reduce costs and shorten production cycles. In addition, the availability of advanced independent semiconductor manufacturing services has also enabled the growth of so-called “fabless” semiconductor companies that focus exclusively on design and marketing and outsource their manufacturing, packaging and testing requirements to independent companies. We cannot assure you that these integrated device manufacturers and fabless semiconductor companies will continue to outsource their packaging and testing requirements to third parties like us. Furthermore, during an economic downturn, these integrated device manufacturers typically rely more on their own in-house packaging and testing capabilities, therefore decreasing their need to outsource. A reversal of, or a slowdown in, this outsourcing trend could result in reduced demand for our services and adversely affect our growth prospects and profitability.
If we are unable to compete favorably in the highly competitive semiconductor packaging and testing markets, our revenues and net income may decrease.
The semiconductor packaging and testing markets are very competitive. We face competition from a number of sources, including other independent semiconductor packaging and testing companies, especially those that offer turnkey packaging and testing services. We believe that the principal competitive factors in the packaging and testing markets are:
| · | technological expertise; |
| · | the ability to provide total solutions to our customers; |
| · | range of package types and testing platforms available; |
| · | the ability to work closely with our customers at the product development stage; |
| · | responsiveness and flexibility; |
| · | diversity in facility locations; and |
We face increasing competition from other packaging and testing companies, as most of our customers obtain packaging or testing services from more than one source. In addition, some of our competitors may have access to more advanced technologies and greater financial and other resources than we do. Any erosion in the prices for our packaging and testing services could cause our revenues and net income to decrease and have a material adverse effect on our financial condition and results of operations.
Our profitability depends on our ability to respond to rapid technological changes in the semiconductor industry.
The semiconductor industry is characterized by rapid increases in the diversity and complexity of semiconductors. As a result, we expect that we will need to constantly offer more sophisticated packaging and testing technologies and processes in order to respond to competitive industry conditions and customer requirements. If we fail to develop, or obtain access to, advances in packaging or testing technologies or processes, we may become less competitive and less profitable. In addition, advances in technology typically lead to declining average selling prices for semiconductors packaged or tested with older technologies or processes. As a result, if we cannot reduce the costs associated with our services, the profitability of a given service and our overall profitability may decrease over time.
Our operating results are subject to significant fluctuations, which could adversely affect the market value of your investment.
Our operating results have varied significantly from period to period and may continue to vary in the future. Downward fluctuations in our operating results may result in decreases in the market price of our common shares and the ADSs. Among the more important factors affecting our quarterly and annual operating results are the following:
| · | changes in general economic and business conditions, particularly given the recent global economic crisis and the cyclical nature of the semiconductor industry and the markets served by our customers; |
| · | our ability to quickly adjust to unanticipated declines or shortfalls in demand and market prices for our packaging and testing services, due to our high percentage of fixed costs; |
| · | changes in prices for our packaging and testing services; |
| · | volume of orders relative to our packaging and testing capacity; |
| · | changes in costs and availability of raw materials, equipment and labor; |
| · | timing of capital expenditures in anticipation of future orders; |
| · | our ability to acquire or design and produce advanced and cost-competitive interconnect materials; |
| | fluctuations in the exchange rate between the NT dollar and foreign currencies, especially the U.S. dollar; and |
| | earthquakes, drought, epidemics and other natural disasters, as well as industrial and other incidents such as fires and power outages. |
Due to the factors listed above, our future operating results or growth rates may be below the expectations of research analysts and investors. If so, the market price of our common shares and the ADSs, and thus the market value of your investment, may fall.
If we are not successful in maintaining our in-house interconnect materials capabilities, our margins and profitability may be adversely affected.
We expect that we will need to maintain our interconnect materials designs and production processes in order to respond to competitive industry conditions and customer requirements. In particular, our competitive position will depend on our ability to design and produce interconnect materials that are comparable to or better than those produced by independent suppliers and others. Many of these independent suppliers have dedicated greater resources than we have for the research and development and design and production of interconnect materials. In addition, we may not be able to acquire the technology and personnel that would enable us to maintain our in-house expertise and our design and production capabilities. For more information on our interconnect materials operations, see “Item 4. Information on the Company—Business Overview—Principal Products and Services—Packaging Services—Interconnect Materials.” If we are unable to maintain our in-house interconnect materials expertise to offer interconnect materials that meet the requirements of our customers, we may become less competitive and our margins and profitability may suffer as a result.
Due to our high percentage of fixed costs, we will be unable to maintain our gross margin at past levels if we are unable to achieve relatively high capacity utilization rates.
Our operations, in particular our testing operations, are characterized by relatively high fixed costs. We expect to continue to incur substantial depreciation and other expenses in connection with our acquisitions of packaging and testing equipment and facilities. Our profitability depends not only on the pricing levels for our services, but also on utilization rates for our packaging and testing machinery and equipment, commonly referred to as “capacity utilization rates.” In particular, increases or decreases in our capacity utilization rates can significantly affect gross margins since the unit cost of packaging and testing services generally decreases as fixed costs are allocated over a larger number of units. In periods of low demand, we experience relatively low capacity utilization rates in our operations, which leads to reduced margins. For example, in the fourth quarter of 2008, we experienced lower than anticipated utilization rates in our operations due to a significant decline in worldwide demand for our packaging and testing services, which resulted in reduced margins during that period. We cannot assure you that we will be able to maintain or surpass our past gross margin levels if we cannot consistently achieve or maintain relatively high capacity utilization rates.
If we are unable to manage our expansion effectively, our growth prospects may be limited and our future profitability may be affected.
We have significantly expanded our packaging and testing operations in recent years, and expect to continue to expand our operations in the future. In particular, we intend to provide total solutions for the packaging and testing of semiconductors in order to attract new customers and broaden our product range to include products packaged
and tested for a variety of end-use applications. In the past, we have expanded through both internal growth and the acquisition of new operations. Rapid expansion puts strain on our managerial, technical, financial, operational and other resources. As a result of our expansion, we have implemented and will continue to implement additional operational and financial controls and hire and train additional personnel. Any failure to manage our growth effectively could lead to inefficiencies and redundancies and result in reduced growth prospects and profitability.
Because of the highly cyclical nature of our industry, our capital requirements are difficult to plan. If we cannot obtain additional capital when we need it, our growth prospects and future profitability may be adversely affected.
Our capital requirements are difficult to plan in our highly cyclical and rapidly changing industry. We will need capital to fund the expansion of our facilities as well as fund our research and development activities in order to remain competitive. We believe that our existing cash, marketable securities, expected cash flow from operations and existing credit lines under our loan facilities will be sufficient to meet our capital expenditures, working capital, cash obligations under our existing debt and lease arrangements, and other requirements for at least the next twelve months. However, future capacity expansions or market or other developments may cause us to require additional funds. Our ability to obtain external financing in the future is subject to a variety of uncertainties, including:
| · | our future financial condition, results of operations and cash flows; |
| · | general market conditions for financing activities by semiconductor companies; and |
| · | economic, political and other conditions in Taiwan and elsewhere. |
Furthermore, if global economic conditions in 2009 continue to deteriorate, we may incur significant net losses in 2009. This may in turn affect our ability to meet certain financial covenants contained in our loan agreements and thereby restrict our ability to access unutilized credit facilities or the global capital markets to meet our liquidity needs. If we are unable to obtain funding in a timely manner or on acceptable terms, our growth prospects and future profitability may decline.
Restrictive covenants and broad default provisions in our existing debt agreements may materially restrict our operations as well as adversely affect our liquidity, financial condition and results of operations.
We are a party to numerous loan and other agreements relating to the incurrence of debt, many of which include restrictive covenants and broad default provisions. In general, covenants in the agreements governing our existing debt, and debt we may incur in the future, may materially restrict our operations, including our ability to incur debt, pay dividends, make certain investments and payments, other than in connection with restructurings of consolidated entities, and encumber or dispose of assets. In the event of a prolonged downturn in the demand for our services as a result of a downturn in the worldwide semiconductor industry or otherwise, we cannot assure you that we will be able to remain in compliance with our financial covenants which, as a result, may lead to a default. Furthermore, a default under one agreement by us or one of our subsidiaries may also trigger cross-defaults under our other agreements. In the event of default, we may not be able to cure the default or obtain a waiver on a timely basis. An event of default under any agreement governing our existing or future debt, if not cured or waived, could have a material adverse effect on our liquidity, financial condition and results of operations.
We have on occasion failed to comply with certain financial covenants in some of our loan agreements. Such non-compliance may also have, through broadly worded cross-default provisions, resulted in default under some of the agreements governing our other existing debt. For example, we failed to comply with certain debt ratios in some of our loan agreements as a result of additional borrowings to fund our privatization of ASE Test in May 2008 and the distribution of cash dividends in August 2008. See “Item 4. Information on the Company—History and Development of the Company—ASE Test Share Acquisition and Privatization” for more information on ASE Test. By August 2008, we had either obtained waivers for, or refinanced on a long-term basis, all of the relevant loans, and are not in default under any of our existing debt. For these and other reasons, including our financial condition and our relationship with our lenders, no lender has to date sought and we do not believe that any of our lenders would seek to declare a default or enforce remedies in respect of our existing debt as a result of cross-default provisions or otherwise, although we cannot provide any assurance in this regard.
We depend on select personnel and could be affected by the loss of their services.
We depend on the continued service of our executive officers and skilled technical and other personnel. Our business could suffer if we lose the services of any of these personnel and cannot adequately replace them. Although some of these management personnel have entered into employment agreements with us, they may nevertheless leave before the expiration of these agreements. We are not insured against the loss of any of our personnel. In addition, we may be required to increase substantially the number of these employees in connection with our expansion plans, and there is intense competition for their services in the semiconductor industry. We may not be able to either retain our present personnel or attract additional qualified personnel as and when needed. In addition, we may need to increase employee compensation levels in order to attract and retain our existing officers and employees and the additional personnel that we expect to require. Furthermore, a portion of the workforce at our facilities in Taiwan are foreign workers employed by us under work permits which are subject to government regulations on renewal and other terms. Consequently, our business could also suffer if the Taiwan regulations relating to the employment of foreign workers were to become significantly more restrictive or if we are otherwise unable to attract or retain these workers at a reasonable cost.
If we are unable to obtain additional packaging and testing equipment or facilities in a timely manner and at a reasonable cost, our competitiveness and future profitability may be adversely affected.
The semiconductor packaging and testing businesses are capital intensive and require significant investment in expensive equipment manufactured by a limited number of suppliers. The market for semiconductor packaging and testing equipment is characterized, from time to time, by intense demand, limited supply and long delivery cycles. Our operations and expansion plans depend on our ability to obtain a significant amount of such equipment from a limited number of suppliers. From time to time we have also leased certain equipment. We have no binding supply agreements with any of our suppliers and acquire our packaging and testing equipment on a purchase order basis, which exposes us to changing market conditions and other substantial risks. For example, shortages of capital equipment could result in an increase in the price of equipment and longer delivery times. Semiconductor packaging and testing also require us to operate sizeable facilities. If we are unable to obtain equipment or facilities in a timely manner, we may be unable to fulfill our customers’ orders, which could adversely affect our growth prospects as well as financial condition and results of operations. See “Item 4. Information on the Company—Business Overview—Equipment.”
Fluctuations in exchange rates could result in foreign exchange losses.
Currently, the majority of our revenues from packaging and testing services are denominated in U.S. dollars, with a portion denominated in NT dollars and Japanese yen. Our cost of revenues and operating expenses associated with packaging and testing services, on the other hand, are incurred in several currencies, primarily NT dollars and U.S. dollars, as well as, to a lesser extent, Korean won, Japanese yen, Malaysian ringgit and Chinese yuan. In addition, a substantial portion of our capital expenditures, primarily for the purchase of packaging and testing equipment, has been, and is expected to continue to be, denominated in U.S. dollars, with much of the remainder in Japanese yen. Fluctuations in exchange rates, primarily among the U.S. dollar, the NT dollar, the Japanese yen and the Chinese yuan, will affect our costs and operating margins. In addition, these fluctuations could result in exchange losses and increased costs in NT dollar and other local currency terms. Despite hedging and mitigating techniques implemented by us, fluctuations in exchange rates have affected, and may continue to affect, our financial condition and results of operations. We incurred net foreign exchange gains of NT$92.8 million, NT$403.5 million and NT$282.0 million (US$8.6 million) in 2006, 2007 and 2008, respectively. See “Item 11. Quantitative and Qualitative Disclosures about Market Risk—Market Risk—Foreign Currency Exchange Rate Risk.”
The loss of a large customer or disruption of our strategic alliance or other commercial arrangements with semiconductor foundries and providers of other complementary semiconductor manufacturing services may result in a decline in our revenues and profitability.
Although we have over 200 customers, we have derived and expect to continue to derive a large portion of our revenues from a small group of customers during any particular period due in part to the concentration of market share in the semiconductor industry. Our five largest customers together accounted for approximately 26.0%, 24.8%
and 27.1% of our net revenues in 2006, 2007 and 2008, respectively. No customer accounted for more than 10% of our net revenues in 2006, 2007 and 2008. The demand for our services from a customer is directly dependent upon that customer’s level of business activity, which could vary significantly from year to year. Our key customers typically operate in the cyclical semiconductor business and, in the past, have varied, and may vary in the future, order levels significantly from period to period. Some of these companies are relatively small, have limited operating histories and financial resources, and are highly exposed to the cyclicality of the industry. We cannot assure you that these customers or any other customers will continue to place orders with us in the future at the same levels as in past periods. The loss of one or more of our significant customers, or reduced orders by any one of them, and our inability to replace these customers or make up for such orders could adversely affect our revenues and profitability. In addition, we have in the past reduced, and may in the future be requested to reduce, our prices to limit the level of order cancellations. Any price reduction would likely reduce our margins and profitability.
Since 1997, we have maintained a strategic alliance with Taiwan Semiconductor Manufacturing Company Limited, or TSMC, one of the world’s largest dedicated semiconductor foundries. TSMC designates us as their non-exclusive preferred provider of packaging and testing services for semiconductors manufactured by TSMC. In addition, on February 23, 2009, we and Advanced Microelectronic Products, Inc., or AMPI, a provider of foundry services, signed a memorandum of understanding to enter into a strategic alliance focused on providing semiconductor manufacturing turnkey services. These strategic alliances, as well as our other commercial arrangements with providers of other complementary semiconductor manufacturing services, enable us to offer total semiconductor manufacturing solutions to our customers. These strategic alliances and any of our other commercial arrangements may be terminated at any time. Any such termination, and our failure to enter into substantially similar strategic alliances or commercial arrangements, may adversely affect our competitiveness and our revenues and profitability.
Our revenues and profitability may decline if we are unable to obtain adequate supplies of raw materials in a timely manner and at a reasonable price.
Our packaging operations require that we obtain adequate supplies of raw materials on a timely basis. Shortages in the supply of raw materials experienced by the semiconductor industry have in the past resulted in occasional price increases and delivery delays. Raw materials such as advanced substrates are prone to supply shortages since such materials are produced by a limited number of suppliers such as Phoenix Precision Technology Corporation, Kinsus Interconnect Technology Corporation, SMI Electronic Devices Inc. and Nanya Printed Circuit Board Corporation. Our operations conducted through our wholly-owned subsidiary ASE Electronics and ASE Shanghai have improved our ability to obtain advanced substrates on a timely basis and at a reasonable cost. However, we do not expect that our internal interconnect materials operations will be able to meet all of our interconnect materials requirements. Consequently, we will remain dependent on market supply and demand for our raw materials. Recent fluctuations in gold prices have also affected the price at which we have been able to purchase gold wire, one of the principal raw materials we use in our packaging processes. We cannot guarantee that we will not experience shortages in the near future or that we will be able to obtain adequate supplies of raw materials in a timely manner or at a reasonable price. Our revenues and net income could decline if we are unable to obtain adequate supplies of high quality raw materials in a timely manner or if there are significant increases in the costs of raw materials that we cannot pass on to our customers.
Any environmental claims or failure to comply with any present or future environmental regulations, as well as any fire or other industrial accident, may require us to spend additional funds and may materially and adversely affect our financial condition and results of operations.
We are subject to various laws and regulations relating to the use, storage, discharge and disposal of chemical by-products of, and water used in, our packaging and interconnect materials production processes. Although we have not suffered material environmental claims in the past, the failure to comply with any present or future regulations could result in the assessment of damages or imposition of fines against us, suspension of production or a cessation of our operations. New regulations could require us to acquire costly equipment or to incur other significant expenses that we may not be able to pass on to our customers. See “Item 4. Information on the Company—Business Overview—Raw Materials and Suppliers—Packaging.” Additionally, any failure on our part to control the use, or adequately restrict the discharge, of hazardous substances could subject us to future liabilities that may have a material adverse effect on our financial condition and results of operations.
Our controlling shareholders may take actions that are not in, or may conflict with, our public shareholders’ best interest.
Members of the Chang family own, directly or indirectly, a controlling interest in our outstanding common shares. See “Item 7. Major Shareholders and Related Party Transactions—Major Shareholders.” Accordingly, these shareholders will continue to have the ability to exercise a controlling influence over our business, including matters relating to:
| · | our management and policies; |
| · | the timing and distribution of dividends; and |
| · | the election of our directors and supervisors. |
Members of the Chang family may take actions that you may not agree with or that are not in our or our public shareholders’ best interests.
We may be subject to intellectual property rights disputes, which could materially adversely affect our business.
Our ability to compete successfully and achieve future growth depends, in part, on our ability to develop and protect our proprietary technologies and to secure on commercially acceptable terms certain technologies that we do not own. We cannot assure you that we will be able to independently develop, obtain patents for, protect or secure from any third party, the technologies required for our packaging and testing services.
Our ability to compete successfully also depends, in part, on our ability to operate without infringing the proprietary rights of others. The semiconductor industry is characterized by frequent litigation regarding patent and other intellectual property rights. In January 2006, Tessera Inc. filed a suit against us and others alleging patent infringement. See “Item 8. Financial Information—Legal Proceedings.” Any litigation, whether as plaintiff or defendant and regardless of the outcome, is costly and diverts company resources.
Any of the foregoing could harm our competitive position and render us unable to provide some of our services operations.
We are an ROC company and, because the rights of shareholders under ROC law differ from those under U.S. law and the laws of certain other countries, you may have difficulty protecting your shareholder rights.
Our corporate affairs are governed by our Articles of Incorporation and by the laws governing corporations incorporated in the ROC. The rights of shareholders and the responsibilities of management and the members of the board of directors under ROC law are different from those applicable to a corporation incorporated in the United States and certain other countries. As a result, public shareholders of ROC companies may have more difficulty in protecting their interests in connection with actions taken by management or members of the board of directors than they would as public shareholders of a corporation in the United States or certain other countries.
We face risks associated with uncertainties in PRC laws and regulations.
We operate, among other things, packaging and testing facilities in the PRC through our subsidiaries and joint ventures incorporated in the PRC. Under PRC laws and regulations, foreign investment projects, such as our subsidiaries and joint ventures, must obtain certain approvals from the relevant governmental authorities in the provinces or special economic zones in which they are located and, in some circumstances, from the relevant authorities in the PRC’s central government. Foreign investment projects must also comply with certain regulatory requirements. However, PRC laws and regulations are often subject to varying interpretations and means of enforcement, and additional approvals from the relevant governmental authorities may be required for the operations of our PRC subsidiaries and joint ventures. If required, we cannot assure you that we will be able to obtain these approvals in a timely manner, if at all. Because the PRC government holds significant discretion in determining matters relating to foreign investment, we cannot assure you that the relevant governmental authorities will not take action that is materially adverse to our PRC operations.
Any impairment charges may have a material adverse effect on our net income.
Under ROC GAAP and U.S. GAAP, we are required to evaluate our assets, such as equipment, goodwill and investments, for possible impairment at least annually or whenever there is an indication of impairment. If certain criteria are met, we are required to record an impairment charge.
With respect to assets, in 2005 we recognized a loss of NT$13,479.1 million on damage to our property, plant and equipment caused by a fire at our facilities in Chung Li, Taiwan. In 2006, we reversed NT$2,190.6 million of the impairment loss recognized in 2005 under ROC GAAP due to an increase in the estimated service potential of the relevant assets. In 2007, we recognized an impairment charge of NT$994.7 million, primarily as a result of idle capacity in our flip-chip substrate production line caused by a lack of demand for certain applications. In 2008, we recognized impairment charges of NT$293.3 million (US$9.0 million) related to our other-than-temporary loss in our financial assets and impaired idle equipment. As of December 31, 2008, goodwill under ROC GAAP and U.S. GAAP amounted to NT$9,456.1 million (US$288.6 million) and NT$9,804.7 million (US$299.3 million), respectively. See “Item 5. Operating and Financial Review and Prospects—Operating Results and Trend Information—Critical Accounting Policies and Estimates—Realizability of Long-Lived Assets” and “—Goodwill.”
In addition, we may be required to record substantial impairment charges with respect to our subsidiary, PowerASE, a joint venture between us and Powerchip Semiconductor Corp., or Powerchip. Powerchip operates in the dynamic random access memory, or DRAM, industry and has suffered extensive losses recently. A substantial portion of PowerASE’s revenues are derived from Powerchip. In addition, we have also invested NT$450 million in Powerchip’s unsecured corporate bonds. Powerchip’s financial position and operations could render us unable to recover PowerASE’s accounts receivable and cause us to record an impairment charge with respect to PowerASE’s property, plant and equipment and corporate bonds, which could have a material adverse effect on our net income.
We are unable to estimate the extent and timing of any impairment charges for future years under ROC GAAP or U.S. GAAP, and we cannot give any assurance that impairment charges will not be required in periods subsequent to December 31, 2008. Any impairment charge could have a material adverse effect on our net income. The determination of an impairment charge at any given time is based significantly on our expected results of operations over a number of years in the future. As a result, an impairment charge is more likely to occur during a period in which our operating results and outlook are otherwise already depressed.
Risks Relating to Taiwan, ROC
Strained relations between the ROC and the PRC could negatively affect our business and the market value of your investment.
Our principal executive offices and our principal packaging and testing facilities are located in Taiwan and approximately 74.4%, 68.6% and 64.9% of our net revenues in 2006, 2007 and 2008, respectively, were derived from our operations in Taiwan. The ROC has a unique international political status. The government of the PRC asserts sovereignty over all of China, including Taiwan, and does not recognize the legitimacy of the ROC government. Although significant economic and cultural relations have been established in recent years between the ROC and the PRC, relations have often been strained and the PRC government has indicated that it may use military force to gain control over Taiwan in some circumstances, such as the declaration of independence by the ROC. Political uncertainty could adversely affect the prices of our common shares and ADSs. Relations between the ROC and the PRC and other factors affecting the political or economic conditions in Taiwan could have a material adverse effect on our financial condition and results of operations, as well as the market price and the liquidity of our common shares and ADSs.
Currently, we manufacture interconnect materials in the PRC through our wholly-owned subsidiary ASE Shanghai. We also provide wire bond packaging and testing services in the PRC through our subsidiaries, ASESH AT, ASEN and ASEWH. See “Item 4. Information on the Company—Organizational Structure—Our Consolidated Subsidiaries.” The ROC government currently restricts certain types of investments by ROC companies, including ourselves, in the PRC, including certain types of investments in facilities for the packaging and testing of semiconductors. In April 2006, these restrictions were amended to permit investments in facilities for certain less advanced wire bond packaging and testing services. We do not know when or if such laws and policies governing
investment in the PRC will be amended, and we cannot assure you that such ROC investment laws and policies will permit us to make further investments in the PRC in the future that we consider beneficial to us. Our growth prospects and profitability may be adversely affected if we are restricted from making certain additional investments in the PRC and are not able to fully capitalize on the growth of the semiconductor industry in the PRC.
As a substantial portion of our business and operations is located in Taiwan, we are vulnerable to earthquakes, typhoons, drought and other natural disasters, as well as power outages and other industrial incidents, which could severely disrupt the normal operation of our business and adversely affect our results of operations.
Taiwan is susceptible to earthquakes and has experienced severe earthquakes which caused significant property damage and loss of life, particularly in the central and eastern parts of Taiwan. Earthquakes have damaged production facilities and adversely affected the operations of many companies involved in the semiconductor and other industries. We have never experienced structural damage to our facilities or damage to our machinery and equipment as a result of these earthquakes. In the past, however, we have experienced interruptions to our production schedule primarily as a result of power outages caused by earthquakes.
Taiwan is also susceptible to typhoons, which may cause damage and business interruptions to companies with facilities located in Taiwan. In the third quarter of 2004, a typhoon caused a partial interruption for approximately two weeks in our water supply at ASE Chung Li’s substrate operations.
Taiwan has experienced severe droughts in the past. Although we have not been directly affected by droughts, we are dependent upon water for our packaging and substrates operations and a drought could interrupt such operations. In addition, a drought could interrupt the manufacturing process of the foundries located in Taiwan, in turn disrupting some of our customers’ production, which could result in a decline in the demand for our services. In addition, the supply of electrical power in Taiwan, which is primarily provided by Taiwan Power Company, the state-owned electric utility, is susceptible to disruption that could be prolonged and frequent, caused by overload as a result of high demand or other reasons.
Our production facilities as well as many of our suppliers and customers and providers of complementary semiconductor manufacturing services, including foundries, are located in Taiwan. If our customers are affected by an earthquake, a typhoon, a drought or any other natural disasters, or power outage or other industrial incidents, it could result in a decline in the demand for our packaging and testing services. If our suppliers or providers of complementary semiconductor manufacturing services are affected, our production schedule could be interrupted or delayed. As a result, a major earthquake, typhoon, drought, or other natural disaster in Taiwan, or a power outage or other industrial incident could severely disrupt the normal operation of our business and have a material adverse effect on our financial condition and results of operations.
Any outbreak of swine flu, avian flu or a recurrence of SARS or other contagious disease may have an adverse effect on the economies and financial markets of certain Asian countries and may adversely affect our results of operations.
In April 2009, outbreaks of swine flu caused by the H1N1 virus were first reported in Mexico and, subsequently, in several other locations including the U.S., the PRC and the ROC. Many of these cases were fatal and more cases have since been reported. In addition, the World Health Organization reported in January 2005 that “during 2004, large parts of Asia experienced unprecedented outbreaks of highly pathogenic avian influenza, caused by the H5N1 virus”, which moved the world closer than at any time since 1968 to an influenza pandemic “with high morbidity, excess mortality, and social and economic disruption.” There have continued to be cases of outbreaks of avian flu in certain regions of Asia, Europe and Africa with human casualties reported in countries such as Azerbaijan, Cambodia, Egypt, Indonesia, Iraq, the PRC, Thailand, Turkey and Vietnam. Additionally, in the first half of 2003, the PRC, Hong Kong, Taiwan, Singapore, Vietnam and certain other countries encountered an outbreak of severe acute respiratory syndrome, or SARS, which is a highly contagious form of atypical pneumonia. The SARS outbreak had an adverse effect on our results of operations for the first half of 2003, primarily due to the lower than expected demand for our packaging and testing services that resulted from the adverse effect of such SARS outbreak on the level of economic activity in the affected regions. There is no guarantee that an outbreak of swine flu, avian flu, SARS or other contagious disease will not occur again in the future and that any future outbreak of swine flu, avian flu, SARS or other contagious disease or the measures taken by the governments of the ROC,
Hong Kong, the PRC or other countries against such potential outbreaks, will not seriously interrupt our production operations or those of our suppliers and customers, which may have a material adverse effect on our results of operations. The perception that an outbreak of swine flu, avian flu, SARS or other contagious disease may occur again may have an adverse effect on the economic conditions of certain countries in Asia.
Risks Relating to Ownership of the ADSs
The market for the common shares and the ADSs may not be liquid.
Active, liquid trading markets generally result in lower price volatility and more efficient execution of buy and sell orders for investors, compared to less active and less liquid markets. Liquidity of a securities market is often a function of the volume of the underlying shares that are publicly held by unrelated parties.
There has been no trading market for the common shares outside the ROC and the only trading market for the common shares will be the Taiwan Stock Exchange. The outstanding ADSs are listed on the New York Stock Exchange. There is no assurance that the market for the common shares or the ADSs will be active or liquid.
Although ADS holders are entitled to withdraw the common shares underlying the ADSs from the depositary at any time, ROC law requires that the common shares be held in an account in the ROC or sold for the benefit of the holder on the Taiwan Stock Exchange. In connection with any withdrawal of common shares from our ADS facility, the ADSs evidencing these common shares will be cancelled. Unless additional ADSs are issued, the effect of withdrawals will be to reduce the number of outstanding ADSs. If a significant number of withdrawals are effected, the liquidity of our ADSs will be substantially reduced. We cannot assure you that the ADS depositary will be able to arrange for a sale of deposited shares in a timely manner or at a specified price, particularly during periods of illiquidity or volatility.
If a non-ROC holder of ADSs withdraws common shares, such holder of ADSs will be required to appoint a tax guarantor, local agent and custodian bank in the ROC and register with the Taiwan Stock Exchange in order to buy and sell securities on the Taiwan Stock Exchange.
When a non-ROC holder of ADSs elects to withdraw common shares represented by ADSs, such holder of the ADSs will be required to appoint an agent for filing tax returns and making tax payments in the ROC. Such agent will be required to meet the qualifications set by the ROC Ministry of Finance and, upon appointment, becomes the guarantor of the withdrawing holder’s tax payment obligations. Evidence of the appointment of a tax guarantor, the approval of such appointment by the ROC tax authorities and tax clearance certificates or evidentiary documents issued by such tax guarantor may be required as conditions to such holder repatriating the profits derived from the sale of common shares. We cannot assure you that a withdrawing holder will be able to appoint and obtain approval for a tax guarantor in a timely manner.
In addition, under current ROC law, such withdrawing holder is required to register with the Taiwan Stock Exchange and appoint a local agent in the ROC to, among other things, open a bank account and open a securities trading account with a local securities brokerage firm, pay taxes, remit funds and exercise such holder’s rights as a shareholder. Furthermore, such withdrawing holder must appoint a local bank to act as custodian for confirmation and settlement of trades, safekeeping of securities and cash proceeds and reporting and declaration of information. Without satisfying these requirements, non-ROC withdrawing holders of ADSs would not be able to hold or otherwise subsequently sell the common shares on the Taiwan Stock Exchange or otherwise.
The market value of your investment may fluctuate due to the volatility of the ROC securities market.
The trading price of our ADSs may be affected by the trading price of our common shares on the Taiwan Stock Exchange. The ROC securities market is smaller and more volatile than the securities markets in the United States and in many European countries. The Taiwan Stock Exchange has experienced substantial fluctuations in the prices and volumes of sales of listed securities and there are currently limits on the range of daily price movements on the Taiwan Stock Exchange. The Taiwan Stock Exchange Index peaked at 12,495.3 in February 1990, and subsequently fell to a low of 2,560.5 in October 1990. On March 13, 2000, the Taiwan Stock Exchange Index experienced a 617-point drop, which represented the single largest decrease in the Taiwan Stock Exchange Index in
its history. During the period from January 1, 2008 to December 31, 2008, the Taiwan Stock Exchange Index peaked at 9,295.2 on May 19, 2008, and reached a low of 4,089.9 on November 20, 2008. Over the same period, the trading price of our common shares ranged from NT$9.6 per share to NT$34.7 per share. On June 5, 2009, the Taiwan Stock Exchange Index closed at 6,767.10, and the closing value of our common shares was NT$20.05 per share.
The Taiwan Stock Exchange is particularly volatile during times of political instability, including when relations between Taiwan and the PRC are strained. Several investment funds affiliated with the ROC government have also from time to time purchased securities from the Taiwan Stock Exchange to support the trading level of the Taiwan Stock Exchange. Moreover, the Taiwan Stock Exchange has experienced problems such as market manipulation, insider trading and settlement defaults. The recurrence of these or similar problems could have an adverse effect on the market price and liquidity of the securities of ROC companies, including our common shares and ADSs, in both the domestic and international markets.
Holders of common shares and ADSs may incur dilution as a result of the practice among ROC technology companies of issuing stock bonuses and stock options to employees.
Similar to other ROC technology companies, we issue bonuses from time to time in the form of common shares. Prior to 2009, bonuses issued in the form of our common shares were valued at par. Beginning in 2009, bonuses in the form of our common shares are valued at the closing price of the common shares on the day prior to our shareholders’ meeting. In addition, under the revised ROC Company Law we may, upon approval from our board of directors and the ROC Securities and Futures Bureau of the Financial Supervisory Commission, Executive Yuan (formerly known as the Securities and Futures Commission), establish employee stock option plans. We currently maintain three employee stock option plans pursuant to which our full-time employees and the full-time employees of our domestic and foreign subsidiaries are eligible to receive stock option grants. As of December 31, 2008, 271,837,630 options were outstanding. See “Item 6. Directors, Senior Management and Employees—Compensation—ASE Inc. Employee Bonus and Stock Option Plans.” The issuance of our common shares pursuant to stock bonuses or stock options may have a dilutive effect on the holders of outstanding common shares and ADSs.
Restrictions on the ability to deposit our common shares into our ADS facility may adversely affect the liquidity and price of our ADSs.
The ability to deposit common shares into our ADS facility is restricted by ROC law. A significant number of withdrawals of common shares underlying our ADSs would reduce the liquidity of the ADSs by reducing the number of ADSs outstanding. As a result, the prevailing market price of our ADSs may differ from the prevailing market price of our common shares on the Taiwan Stock Exchange. Under current ROC law, no person or entity, including you and us, may deposit our common shares in our ADS facility without specific approval of the ROC Financial Supervisory Commission, Executive Yuan, unless:
| (1) | we pay stock dividends on our common shares; |
| (2) | we make a free distribution of common shares; |
| (3) | holders of ADSs exercise preemptive rights in the event of capital increases; or |
| (4) | to the extent permitted under the deposit agreement and the relevant custody agreement, investors purchase our common shares, directly or through the depositary, on the Taiwan Stock Exchange, and deliver our common shares to the custodian for deposit into our ADS facility, or our existing shareholders deliver our common shares to the custodian for deposit into our ADS facility. |
With respect to item (4) above, the depositary may issue ADSs against the deposit of those common shares only if the total number of ADSs outstanding following the deposit will not exceed the number of ADSs previously approved by the ROC Financial Supervisory Commission, Executive Yuan plus any ADSs issued pursuant to the events described in subparagraphs (1), (2) and (3) above.
In addition, in the case of a deposit of our common shares requested under item (4) above, the depositary will refuse to accept deposit of our common shares if such deposit is not permitted under any legal, regulatory or other restrictions notified by us to the depositary from time to time, which restrictions may include blackout periods during which deposits may not be made, minimum and maximum amounts and frequency of deposits.
The depositary will not offer holders of ADSs preemptive rights unless the distribution of both the rights and the underlying common shares to our ADS holders are either registered under the Securities Act or exempt from registration under the Securities Act.
Holders of ADSs will not have the same voting rights as our shareholders, which may affect the value of their ADSs.
The voting rights of a holder of ADSs as to the common shares represented by its ADSs are governed by the deposit agreement. Holders of ADSs will not be able to exercise voting rights on an individual basis. If holders representing at least 51% of the ADSs outstanding at the relevant record date instruct the depositary to vote in the same manner regarding a resolution, including the election of directors and supervisors, the depositary will cause all common shares represented by the ADSs to be voted in that manner. If the depositary does not receive timely instructions representing at least 51% of the ADSs outstanding at the relevant record date to vote in the same manner for any resolution, including the election of directors and supervisors, holders of ADSs will be deemed to have instructed the depositary or its nominee to authorize all the common shares represented by the ADSs to be voted at the discretion of our chairman or his designee, which may not be in the interest of holders of ADSs. Moreover, while shareholders who own 1% or more of our outstanding shares are entitled to submit one proposal to be considered at our annual general meetings of shareholders, only holders representing at least 51% of our ADSs outstanding at the relevant record date are entitled to submit one proposal to be considered at our annual general meetings of shareholders. Hence, only one proposal may be submitted on behalf of all ADS holders.
The right of holders of ADSs to participate in our rights offerings is limited, which could cause dilution to your holdings.
We may from time to time distribute rights to our shareholders, including rights to acquire our securities. Under the deposit agreement, the depositary will not offer holders of ADSs those rights unless both the distribution of the rights and the underlying securities to all our ADS holders are either registered under the Securities Act or exempt from registration under the Securities Act. Although we may be eligible to take advantage of certain exemptions under the Securities Act available to certain foreign issuers for rights offerings, we can give no assurances that we will be able to establish an exemption from registration under the Securities Act, and we are under no obligation to file a registration statement for any of these rights. Accordingly, holders of ADSs may be unable to participate in our rights offerings and may experience dilution of their holdings.
If the depositary is unable to sell rights that are not exercised or not distributed or if the sale is not lawful or reasonably practicable, it will allow the rights to lapse, in which case holders of ADSs will receive no value for these rights.
Changes in exchange controls which restrict your ability to convert proceeds received from your ownership of ADSs may have an adverse effect on the value of your investment.
Under current ROC law, the depositary, without obtaining approvals from the Central Bank of the Republic of China (Taiwan) or any other governmental authority or agency of the ROC, may convert NT dollars into other currencies, including U.S. dollars, for:
| · | the proceeds of the sale of common shares represented by ADSs or received as stock dividends from the common shares and deposited into the depositary receipt facility; and |
| · | any cash dividends or distributions received from the common shares. |
In addition, the depositary may also convert into NT dollars incoming payments for purchases of common shares for deposit in the ADS facility against the creation of additional ADSs. The depositary may be required to obtain foreign exchange approval from the Central Bank of the Republic of China (Taiwan) on a payment-by-
payment basis for conversion from NT dollars into foreign currencies of the proceeds from the sale of subscription rights for new common shares. Although it is expected that the Central Bank of the Republic of China (Taiwan) will grant this approval as a routine matter, we cannot assure you that in the future any approval will be obtained in a timely manner, or at all.
Under current ROC law, a holder of the ADSs, without obtaining further approval from the Central Bank of the Republic of China (Taiwan), may convert from NT dollars into other currencies, including U.S. dollars, the following:
| · | the proceeds of the sale of any underlying common shares withdrawn from the depositary receipt facility or received as a stock dividend that has been deposited into the depositary receipt facility; and |
| · | any cash dividends or distribution received from the common shares. |
However, such holder may be required to obtain foreign exchange approval from the Central Bank of the Republic of China (Taiwan) on a payment-by-payment basis for conversion from NT dollars into foreign currencies of the proceeds from the sale of subscription rights for new common shares. Although the Central Bank of the Republic of China (Taiwan) is generally expected to grant this approval as a routine matter, we cannot assure you that you will actually obtain this approval in a timely manner, or at all.
Under the ROC Foreign Exchange Control Law, the Executive Yuan of the ROC government may, without prior notice but subject to subsequent legislative approval, impose foreign exchange controls in the event of, among other things, a material change in international economic conditions. We cannot assure you that foreign exchange controls or other restrictions will not be introduced in the future.
The value of your investment may be reduced by possible future sales of common shares or ADSs by us or our shareholders.
While we are not aware of any plans by any major shareholders to dispose of significant numbers of common shares, we cannot assure you that one or more existing shareholders or owners of securities convertible or exchangeable into or exercisable for our common shares or ADSs will not dispose of significant numbers of common shares or ADSs. In addition, several of our subsidiaries and affiliates hold common shares, depositary shares representing common shares and options to purchase common shares or ADSs. We or they may decide to sell those securities in the future. See “Item 7. Major Shareholders and Related Party Transactions—Major Shareholders” for a description of our significant shareholders and affiliates that hold our common shares.
We cannot predict the effect, if any, that future sales of common shares or ADSs, or the availability of common shares or ADSs for future sale, will have on the market price of the common shares or the ADSs prevailing from time to time. Sales of substantial numbers of common shares or ADSs in the public market, or the perception that such sales may occur, could depress the prevailing market prices of the common shares or the ADSs.
Advanced Semiconductor Engineering, Inc. was incorporated on March 23, 1984 as a company limited by shares under the ROC Company Law, with facilities in the Nantze Export Processing Zone located in Kaohsiung, Taiwan. We were listed on the Taiwan Stock Exchange in 1989. Our principal executive offices are located at 26 Chin Third Road, Nantze Export Processing Zone, Nantze, Kaohsiung, Taiwan, ROC and our telephone number at the above address is (886) 7361-7131. Our common shares have been listed on the Taiwan Stock Exchange under the symbol “2311” since July 1989 and ADSs representing our common shares have been listed on the New York Stock Exchange under the symbol “ASX” since September 2000.
Acquisition of ASESH AT
On January 11, 2007, we completed the acquisition of 100.0% of GAPT, now known as ASESH AT, for a purchase price of US$60.0 million. Based in Shanghai, China, ASESH AT provides wire bond packaging and testing services for a wide range of semiconductors.
Joint Venture with NXP Semiconductors
On September 25, 2007, we entered into a joint venture with NXP B.V., or NXP Semiconductors, formerly known as Philips Semiconductors, by completing the acquisition of 60.0% of ASEN, formerly known as NXP Semiconductors Suzhou Ltd., from NXP Semiconductors for a purchase price of US$21.6 million. NXP Semiconductors holds the remaining 40.0% of ASEN. ASEN is based in Suzhou, China and is engaged in semiconductor packaging and testing.
Acquisition of ASE (Weihai), Inc.
On May 14, 2008, we completed the acquisition of 100.0% of Weihai Aimhigh Electronic Co. Ltd., now known as ASE (Weihai), Inc., from Aimhigh Global Corp. and TCC Steel for a purchase price of US$7.0 million. ASE (Weihai), Inc. is based in Shandong, China and is engaged in semiconductor packaging and testing.
ASE Test Share Acquisition and Privatization
Our subsidiary, ASE Test, was previously the holding company for the majority of our testing services. On September 4, 2007, we and ASE Test entered into a scheme implementation agreement under which we agreed to acquire, by way of a scheme of arrangement under Section 210 of the Companies Act, Chapter 50 of Singapore, or the Scheme, all the outstanding ordinary shares of ASE Test that we did not already directly or indirectly own. We sought to effect the Scheme in order to simplify our organizational structure, reduce costs and administrative burdens associated with filing and compliance requirements relating to ASE Test’s Nasdaq Global Market and Taiwan Stock Exchange listings and public company reporting obligations, enhance our brand recognition through the promotion of a single common brand, and increase our flexibility in making investments and allocating resources among our subsidiaries.
We reached an agreement with ASE Test on the terms of the Scheme following an evaluation by a special committee of ASE Test’s board of directors, comprised of two of ASE Test’s independent directors, that was established to, among other things, review, evaluate, negotiate and consider all matters arising in connection with the Scheme. The Scheme was unanimously approved on our behalf by our board of directors and unanimously approved by ASE Test’s independent directors at the recommendation of ASE Test’s special committee. On May 6, 2008, the Scheme was approved by a majority of ASE Test’s shareholders (other than us or our affiliates) present and voting, either in person or by proxy, at the shareholders meeting, who represented not less than 75% in value of the shares held by shareholders (other than us or our affiliates) present and voting, either in person or by proxy, at the shareholders meeting. The Scheme became effective on May 30, 2008 and ASE Test became our wholly-owned subsidiary.
Pursuant to the terms of the scheme implementation agreement, each ASE Test shareholder (other than us and our subsidiaries) received US$14.78 in cash for each ASE Test ordinary share held by the shareholder and listed on the Nasdaq Global Market, and NT$5.6314, the New Taiwan dollar equivalent of US$0.185 in cash based on the exchange rate as of May 29, 2008, for each ASE Test depositary share (representing 0.0125 ASE Test ordinary shares) held by the shareholder and listed on the Taiwan Stock Exchange. This acquisition price was a 25.6% premium above ASE Test’s closing price on the Nasdaq Global Market as of August 31, 2007, and was determined after arm’s length negotiations between us and the special committee of ASE Test’s board of directors.
Also pursuant to the terms of the scheme implementation agreement, each ASE Test option exercisable for ASE Test ordinary shares (whether or not vested) that had a per share exercise price lower than US$14.78 was deemed to have been exercised by ASE Test on behalf of the option holder on a cashless basis. We then acquired these newly issued ASE Test ordinary shares for US$14.78 per share in cash. As a result, each of these option holders received a cash payment per share equal to the excess of US$14.78 over the per share exercise price of their options, less any
interest, fees and charges. Each ASE Test option that had a per share exercise price equal to or higher than US$14.78 was cancelled without any payment to the option holder.
Through this transaction, we acquired a total of 58,438,944 shares of ASE Test, 7,843,663 of which were acquired from the mandatory option exercise. The total transaction value of the Scheme was US$863.9 million. In order to finance our acquisition of ASE Test’s shares, we entered into two syndicated loan agreements for term loan facilities of NT$24,750.0 million, which we and the lenders subsequently agreed to reduce to NT$17,500.0 million, and US$200.0 million, respectively. For a further description of these agreements, see “Item 5. Operating and Financial Review and Prospects—Liquidity and Capital Resources.”
ASE Test’s ordinary shares were delisted from the Nasdaq Global Market on June 12, 2008. ASE Test’s ordinary shares were deregistered under the Exchange Act effective September 10, 2008. ASE Test’s depositary shares were delisted from the Taiwan Stock Exchange on July 14, 2008.
Currently, ASE Test’s subsidiaries comprise ASE Test Malaysia, ISE Labs and ASE Singapore Pte. Ltd., all of which ASE Test wholly owns.
For more information on the Scheme, see the Schedule 13E-3, as amended, filed by ASE Test with the United States Securities and Exchange Commission, or the SEC, on May 30, 2008.
For more information on our history and development, see “-Organizational Structure.”
We are the world’s largest independent provider of semiconductor packaging and testing services based on 2008 revenues. Our services include semiconductor packaging, design and production of interconnect materials, front-end engineering testing, wafer probing and final testing services. We believe that, as a result of the following, we are better positioned than our competitors to meet the requirements of semiconductor companies worldwide for outsourced packaging and testing services across a wide range of end-use applications:
| · | our ability to provide a broad range of cost-effective semiconductor packaging and testing services on a large-scale turnkey basis in key centers of semiconductor manufacturing; |
| · | our expertise in developing and providing cost-effective packaging, interconnect materials and testing technologies and solutions; |
| · | our scale of operations and financial position, which enable us to make significant investments in capacity expansion and research and development as well as to make selective acquisitions; |
| · | our geographic presence in key centers of outsourced semiconductor and electronics manufacturing; and |
| · | our long-term relationships with providers of complementary semiconductor manufacturing services, including our strategic alliance with TSMC, one of the world’s largest dedicated semiconductor foundries. |
We believe that the trend for semiconductor companies to outsource their packaging and testing requirements is accelerating as semiconductor companies increasingly rely on independent providers of foundry and advanced packaging and testing services. In response to the increased pace of new product development and shortened product life and production cycles, semiconductor companies are increasingly seeking independent packaging and testing companies that can provide turnkey services in order to reduce time-to-market. We believe that our expertise and scale in advanced technology and our ability to integrate our broad range of solutions into turnkey services allow us to benefit from the accelerated outsourcing trend and better serve our existing and potential customers.
We believe that we have benefited, and will continue to benefit, from our geographic location in Taiwan. Taiwan is currently the largest center for outsourced semiconductor manufacturing in the world and has a high concentration of electronics manufacturing service providers, which are the end users of our customers’ products. Our close proximity to foundries and other providers of complementary semiconductor manufacturing services is attractive to our customers who wish to take advantage of the efficiencies of a total semiconductor manufacturing
solution by outsourcing several stages of their manufacturing requirements. Our close proximity to end users of our customers’ products is attractive to our customers who wish to take advantage of the logistical efficiencies of direct shipment services that we offer. We believe that, as a result, we are well positioned to meet the advanced semiconductor engineering and manufacturing requirements of our customers.
Our global base of over 200 customers includes leading semiconductor companies across a wide range of end-use applications, such as:
· Altera Corporation | · NEC Electronics Corporation |
· ATI Technologies, Inc. | · NVIDIA Corporation |
· Broadcom Corporation | · NXP Semiconductors |
· Cambridge Silicon Radio Limited | · Powerchip Semiconductor Corp. |
· Freescale Semiconductor, Inc. | · Qualcomm Incorporated |
· Infineon Technologies | · RF Micro Devices, Inc. |
· Kawasaki Microelectronics, Inc | · Silicon Integrated Systems |
· Marvell Technology Group Ltd. | · STMicroelectronics N.V. |
· Media Tek Inc. | · Zoran Corporation |
· Microsoft Corporation | |
Industry Background
General
Semiconductors are the basic building blocks used to create an increasing variety of electronic products and systems. Continuous improvements in semiconductor process and design technologies have led to smaller, more complex and more reliable semiconductors at a lower cost per function. These improvements have resulted in significant performance and price benefits to manufacturers of electronic products. As a result, semiconductor demand has grown substantially in our primary end-user markets for communications, computers and consumer electronics, and has experienced increased growth in other markets such as automotive products and industrial automation and control systems.
The semiconductor industry is characterized by strong long-term growth, with periodic and sometimes severe cyclical downturns. The Semiconductor Industry Association estimates that worldwide sales of semiconductors increased from approximately US$51 billion in 1990 to approximately US$255.3 billion in 2008. As a result of the global economic crisis, demand for semiconductors plummeted in the fourth quarter of 2008 and continued to deteriorate in the first quarter of 2009. Although the rate of growth may begin to slow, we believe that overall growth and cyclical fluctuations will continue over the long-term in the semiconductor industry.
Outsourcing Trends in Semiconductor Manufacturing
Historically, semiconductor companies designed, manufactured, packaged and tested semiconductors primarily in their own facilities. Over the past several years, there has been a trend in the industry to outsource stages in the manufacturing process. Virtually every significant stage of the manufacturing process can be outsourced. Wafer foundry services and semiconductor packaging and testing services are currently the largest segments of the independent semiconductor manufacturing services market. Most of the world’s major integrated device manufacturers use some independent manufacturing services to maintain a strategic mix of internal and external manufacturing capacity.
The availability of technologically advanced independent manufacturing services has also enabled the growth of “fabless” semiconductor companies that focus on semiconductor design and marketing and outsource their wafer fabrication, packaging and testing requirements to independent companies. We believe that the growth in the number and scale of fabless semiconductor companies that rely solely on independent companies to meet their manufacturing requirements will continue to be a driver of growth in the market for independent foundry, packaging and testing services. Similarly, the availability of technologically advanced independent manufacturing services has encouraged integrated device manufacturers, which had traditionally relied on in-house semiconductor
manufacturing capacity, to increasingly outsource their manufacturing requirements to independent semiconductor manufacturing companies.
We believe the outsourcing of semiconductor manufacturing services will increase in the future from current levels for many reasons, including the following:
Technological Expertise and Significant Capital Expenditure. Semiconductor manufacturing processes have become highly complex, requiring substantial investment in specialized equipment and facilities and sophisticated engineering and manufacturing expertise. Technical expertise becomes increasingly important as the industry transitions from one generation of technology to another, as evidenced by the current migration of the fabrication process from 8-inches to 12-inches in sub-micron technology and the size of technology nodes fabricated from 65 nm to 45 nm, as well as the integration of different functions into a single-chip service. In addition, product life cycles have been shortening, magnifying the need to continuously upgrade or replace manufacturing equipment to accommodate new products. As a result, new investments in in-house packaging, testing and fabrication facilities are becoming less desirable to integrated device manufacturers because of the high investment costs as well as the inability to achieve sufficient economies of scale and utilization rates necessary to be competitive with the independent service providers. Independent packaging, testing and foundry companies, on the other hand, are able to realize the benefits of specialization and achieve economies of scale by providing services to a large base of customers across a wide range of products. This enables them to reduce costs and shorten production cycles through high capacity utilization and process expertise. In the process, they are also able to focus on discrete stages of semiconductor manufacturing and deliver services of superior quality.
In recent years, semiconductor companies have significantly reduced their investment in in-house packaging and testing technologies and capacity. As a result, some semiconductor companies may have limited in-house expertise and capacity to accommodate large orders following a recovery in demand, particularly in the area of advanced technology. On the other hand, some semiconductor companies with in-house packaging and testing operations focusing on low-end leadframe-based packages are under increasing pressure to rationalize these operations by relocating to locations with lower costs or better infrastructure, such as the PRC, in order to lower manufacturing costs and shorten production cycle time. We expect semiconductor companies to increasingly outsource their packaging and testing requirements to take advantage of the advanced technology and scale of operations of independent packaging and testing companies.
Focus on Core Competencies. As the semiconductor industry becomes more competitive, semiconductor companies are expected to further outsource their semiconductor manufacturing requirements in order to focus their resources on core competencies, such as semiconductor design and marketing.
Time-to-Market Pressure. The increasingly short product life cycle has accelerated time-to-market pressure for semiconductor companies, leading them to rely increasingly on outsourced suppliers as a key source for effective manufacturing solutions.
Capitalize on the High Growth Rates in Emerging Markets. Emerging markets, and China in particular, have become both major manufacturing centers for the technology industry and growing markets for technology-based products. Thus, in order to gain direct access to the Chinese market, many semiconductor companies are seeking to establish manufacturing facilities in China by partnering with local subcontractors. As a result, certain stages of the semiconductor manufacturing process that were previously handled in-house will be increasingly outsourced in order to improve efficiency.
The Semiconductor Industry in Taiwan
The semiconductor industry in Taiwan has been a leader in, and a major beneficiary of, the trend in outsourcing. The growth of the semiconductor industry in Taiwan has been the result of several factors. First, semiconductor manufacturing companies in Taiwan typically focus on one or two stages of the semiconductor manufacturing process. As a result, these companies tend to be more efficient and are better able to achieve economies of scale and maintain higher capacity utilization rates. Second, semiconductor manufacturing companies in Taiwan that provide the major stages of the manufacturing process are located close to each other and typically enjoy close working relationships. This close network is attractive to customers who wish to outsource multiple stages of the
semiconductor manufacturing process. For instance, a customer could reduce production cycle time and unit cost and streamline logistics by outsourcing its foundry, packaging, testing and drop shipment services to electronics manufacturing companies in Taiwan. Third, Taiwan also has an educated labor pool and a large number of engineers suitable for sophisticated manufacturing industries such as semiconductors.
Notwithstanding the recent effects of the global economic crisis, the semiconductor industry in Taiwan has over the past decade made significant capital expenditures to expand capacity and technological capabilities. The ROC government has also provided tax incentives, long-term loans at favorable rates and research and development support, both directly and indirectly through support of research institutes and universities. As a result of investments made in recent years, Taiwan has achieved substantial market share in the outsourced semiconductor manufacturing industry. Furthermore, the growth of Taiwan’s electronics manufacturing industry, particularly in personal computer, mobile handset and digital camera design and manufacturing, has created substantial local demand for semiconductors.
The Semiconductor Industry in Other Asian Regions
Many of the factors that contributed to the growth of the semiconductor industry in Taiwan have also contributed to the recent development of the semiconductor industry in Southeast Asia. Access to expanding semiconductor foundry services in Singapore, convenient proximity to major downstream electronics manufacturing operations in Malaysia, Singapore and Thailand, government-sponsored infrastructure support, tax incentives and pools of skilled engineers and labor at relatively low cost have all encouraged the development of back-end semiconductor service operations in Southeast Asia. The downstream electronics manufacturers in Southeast Asia have typically focused on products used in the communications, industrial and consumer electronics and personal computer peripheral sectors. The proximity to both semiconductor foundries and end users has influenced local and international semiconductor companies increasingly to obtain packaging, testing and drop shipment services from companies in Southeast Asia.
In addition, the world’s leading electronics manufacturing service providers, many of them from Taiwan, are increasingly establishing manufacturing facilities in the PRC and Vietnam in order to take advantage of lower labor costs, government incentives for investment and the potential size of the domestic market for end users of electronics products. Many of the factors that contributed to the growth of the semiconductor industry in Taiwan are beginning to emerge in the PRC and may play an increasingly important role in the growth of its semiconductor industry over the long term.
Overview of Semiconductor Manufacturing Process
The manufacturing of semiconductors is a complex process that requires increasingly sophisticated engineering and manufacturing expertise. The manufacturing process may be divided into the following stages from circuit design to shipment:
We are involved in all stages of the semiconductor manufacturing process except circuit design and wafer fabrication.
| | |
| Circuit Design | | The design of a semiconductor is developed by laying out circuit components and interconnections. |
| | | |
| Front-End Engineering Test | | Throughout and following the design process, prototype semiconductors undergo front-end engineering testing, which involves software development, electrical design validation and reliability and failure analysis. |
| | | |
| Wafer Fabrication | | Process begins with the generation of a photomask through the definition of the circuit design pattern on a photographic negative, known as a mask, by an electron beam or laser beam writer. These circuit patterns are transferred to the wafers using various advanced processes. |
| | | |
| Wafer Probe | | Each individual die is electrically tested, or probed, for defects. Dies that fail this test are marked to be discarded. |
| | | |
| Packaging | | Packaging, also called assembly, is the processing of bare semiconductors into finished semiconductors and serves to protect the die and facilitate electrical connections and heat dissipation. The patterned silicon wafers received from our customers are diced by means of diamond saws into separate dies, also called chips. Each die is attached to a leadframe or a laminate (plastic or tape) substrate by epoxy resin. A leadframe is a |
| | |
| | | miniature sheet of metal, generally made of copper and silver alloys, on which the pattern of input/output leads has been cut. On a laminate substrate, typically used in ball grid array, or BGA, packages, the leads take the shape of small bumps or balls. Leads on the leadframe or the substrate are connected by extremely fine gold wires or bumps to the input/output terminals on the chips, through the use of automated machines known as “bonders.” Each chip is then encapsulated, generally in a plastic casing molded from a molding compound, with only the leads protruding from the finished casing, either from the edges of the package as in the case of the leadframe-based packages, or in the form of small bumps on a surface of the package as in the case of BGA or other substrate-based packages. |
| | | |
| Final Test | | Final testing is conducted to ensure that the packaged semiconductor meets performance specifications. Final testing involves using sophisticated testing equipment known as testers and customized software to electrically test a number of attributes of packaged semiconductors, including functionality, speed, predicted endurance and power consumption. The final testing of semiconductors is categorized by the functions of the semiconductors tested into logic/mixed-signal/RF final testing and memory final testing. Memory final testing typically requires simpler test software but longer testing time per device tested. |
Strategy
Our objective is to provide semiconductor packaging and testing services and interconnect materials design and production capabilities which set industry standards and to lead and facilitate the industry trend towards outsourcing semiconductor manufacturing requirements. The principal elements of our strategy are to:
Grow Our Advanced Packaging Services and Expand into the Legacy Packaging Market
We believe that an important factor in our ability to attract leading semiconductor companies as our customers has been our ability to fulfill demand for a broad range of packaging solutions on a large scale. We intend to continue to develop process and product technologies to meet the requirements of clients using our advanced packaging services. Our expertise in packaging technology has enabled us to develop advanced solutions such as fine-pitch wire bonding, stacked die packaging and bump chip carrier packaging. We are continuously investing in research and development in response to and in anticipation of migrations in technology and intend to continue to acquire access to new technologies through strategic alliances and licensing arrangements.
We also intend to expand our legacy leadframe-based packaging product offerings and services. We believe that our clients will continue to outsource their legacy packaging requirements. To capitalize on this trend, we plan to accelerate our single outline legacy packaging production in Shanghai and expand into the discrete packaging business by leveraging the existing assets of ASE (Weihai), Inc. in Shandong, China.
The increasing miniaturization of semiconductors and the growing complexity of interconnect technology have also resulted in the blurring of the traditional distinctions among assembly at different levels of integration: chip, module, board and system. We currently provide module assembly services primarily at our facilities in Korea. Our
approximately 18.2% ownership interest in Universal Scientific has provided us with access to process and product technologies at the levels of module, board and system assembly and test, which helps us to better anticipate industry trends and take advantage of potential growth opportunities.
Strategically Expand and Streamline Production Capacity
To capitalize on the growing demand for advanced and legacy packaging and testing services, we intend to strategically expand our production capacity, both through internal growth and through selective acquisitions and joint ventures, with a focus on providing cost competitive and innovative packaging and testing services.
For our advanced packaging and testing business, we intend to invest in trends that are essential to the development of the industry. We plan to expand our capacity with respect to, among other things, 12-inch wafer process, bumping, FC-CSP and system-in-a-package products to meet demand for smaller form factors, higher performance and higher packaging density. We believe rising commodity prices will expedite the migration from leadframe and BGA-based packaging to flip-chip packaging and wafer level packaging, as the cost differential narrows. We intend to increase our capacity for flip-chip packaging and wafer level packaging in order to cope with rising demand for these packaging technologies.
In addition, we intend to promote our copper wire solutions to our customers in addition to gold wire. Gold wire is a significant raw material for us. Gold prices, however, are subject to intense fluctuations, which have in the past impacted our profitability. We believe that replacing gold wire in some of our packages with the copper wire technology that we are developing will enable us to provide more value to our customers, which will enhance our competitiveness. We plan to focus initially on integrating copper wire into traditional leadframe-based packages and thereafter into higher end substrate-based packages.
For our legacy packaging and testing business, we expect to focus on providing cost competitive services through our China operations by leveraging China’s lower cost of labor and land and a rapidly growing end market. Our clients may also benefit from easier inventory management and savings in transportation costs and taxes by outsourcing their packaging and testing requirements to China. Through better management of capacity utilization and efficiency improvements, we plan to offer cost competitive legacy packaging and testing services on a large scale with the intention of driving more integrated device manufacturer outsourcing in the long-run.
We evaluate acquisition and joint venture opportunities on the basis of access to new markets and technology, the enhancement of our production capacity, economies of scale and management resources, and closer proximity to existing and potential customers. In July 2006, we entered into a joint venture with Powerchip, a DRAM manufacturer in Taiwan that focuses on the packaging and testing of memory semiconductors, in order to help develop our capabilities with respect to memory semiconductors and to benefit from future growth in the market for memory products. The joint venture began operations in December 2006. In January 2007, we completed the acquisition of GAPT, a company that provides wire bond packaging and testing services for a wide range of semiconductors. In February 2007, we and NXP Semiconductors formed a joint venture in Suzhou, China focused on semiconductor testing and packaging. We currently own a 60.0% interest in the joint venture. In May 2008, we completed the acquisition of ASE (Weihai), Inc., a company that also engages in semiconductor packaging and testing services.
Continue to Leverage Our Presence in Key Centers of Semiconductor and Electronics Manufacturing
We intend to continue leveraging our presence in key centers of semiconductor and electronics manufacturing to further grow our business. We have significant packaging and testing operations in Taiwan, currently the largest center for outsourced semiconductor manufacturing in the world. This presence enables our engineers to work closely with our customers as well as foundries and other providers of complementary semiconductor manufacturing services early in the semiconductor design process, enhances our responsiveness to the requirements of our customers and shortens production cycles. In addition, as a turnkey service provider, we are able to offer in Taiwan packaging and testing services, including interconnect materials solutions, all within relatively close geographic proximity to our customers, complementary service providers and the end users of our customers’ products. In addition to our current operations, we intend to expand our packaging and testing operations in Chung Li, Taiwan to
better serve our customers located in northern Taiwan and customers who request that we maintain the capability of packaging and testing their products at more than one location in Taiwan.
In addition to our locations in Taiwan, we have operations in the following locations:
● | PRC — a fast-growing market for semiconductor manufacturing for domestic consumption and our primary site for serving legacy packaging clients; |
● | Korea — an increasingly important center for the manufacturing of memory and communications devices; |
● | Malaysia and Singapore — an emerging center for outsourced semiconductor manufacturing in Southeast Asia; |
● | Silicon Valley in California — the preeminent center for semiconductor design, with a concentration of fabless customers; and |
● | Japan — an emerging market for semiconductor packaging and testing services as Japanese integrated device manufacturers increasingly outsource their semiconductor manufacturing requirements. |
Strengthen and Develop Strategic Relationships with Providers of Complementary Semiconductor Manufacturing Services
We intend to strengthen existing, and develop new, strategic relationships with providers of other complementary semiconductor manufacturing services, such as foundries, as well as equipment vendors, raw material suppliers and technology research institutes, in order to offer our customers total semiconductor manufacturing solutions covering all stages of the manufacturing of their products from design to shipment.
Since 1997, we have maintained a strategic alliance with TSMC, currently one of the world’s largest dedicated semiconductor foundries, which designates us as their non-exclusive preferred provider of packaging and testing services for semiconductors manufactured by TSMC. Through our strategic alliance with and close geographic proximity to TSMC, we are able to offer our customers a total semiconductor manufacturing solution that includes access to foundry services in addition to our packaging, testing and direct shipment services. In addition, on February 23, 2009, we and AMPI, a provider of foundry services, signed a memorandum of understanding to enter into a strategic alliance focused on providing semiconductor manufacturing turnkey services.
Principal Products and Services
We offer a broad range of advanced and legacy semiconductor packaging and testing services. Our package types employ either leadframes or substrates as interconnect materials. The semiconductors we package are used in a wide range of end-use applications, including communications, computers, consumer electronics, industrial, automotive and other applications. Our testing services include front-end engineering testing, which is performed during and following the initial circuit design stage of the semiconductor manufacturing process, wafer probe, final testing and other related semiconductor testing services. We focus on packaging and testing logic semiconductors. We offer our customers turnkey services which consist of packaging, testing and direct shipment of semiconductors to end users designated by our customers. In 2006, 2007 and 2008, our packaging revenues accounted for 76.5%, 77.6% and 77.7% of our net revenues, respectively, and our testing revenues accounted for 21.3%, 19.8% and 20.1% of our net revenues, respectively.
Packaging Services
We offer a broad range of package types to meet the requirements of our customers, with a focus on advanced packaging solutions. Within our portfolio of package types, we focus on the packaging of semiconductors for which there is expected to be strong demand. These include advanced leadframe-based package types such as quad flat
package, thin quad flat package, bump chip carrier and quad flat no-lead package, and package types based on substrates, such as flip-chip BGA and other BGA types as well as other advanced packages such as wafer-bumping products. We are among the leaders in such advanced packaging processes and technologies and are well positioned to lead the technology migration in the semiconductor packaging industry.
The semiconductor packaging industry has evolved to meet the advanced packaging requirements of high-performance semiconductors. The development of high-performance electronics products has spurred the innovation of semiconductor packages that have higher interconnect density and better electrical performance. As a part of this technology migration, semiconductor packages have evolved from leadframe-based packages to substrate-based packages. The key differences of these package types are:
| · | the size of the package; |
| · | the density of electrical connections the package can support; and |
| · | the thermal and electrical characteristics of the package. |
Leadframe-Based Packages. Leadframe-based packages are packaged by connecting the die, using wire bonders, to the leadframe with gold wire. As packaging technology improves, the number of leads per package increases. Packages have evolved from the lower pin-count plastic dual in-line packages to higher pin-count quad flat packages. In addition, improvements in leadframe-based packages have reduced the footprint of the package on the circuit board and improved the electrical performance of the package. The following table sets forth our principal leadframe-based packages.
| | | | | | |
| Quad Flat Package (QFP)/ Thin Quad Flat Package (TQFP) | | 44-256 | | Designed for advanced processors and controllers, application-specific integrated circuits and digital signal processors. | | Multimedia applications, cellular phones, personal computers, automotive and industrial products, hard disk drives, communication boards such as ethernet, integrated services digital networks and notebook computers. |
| | | | | | | |
| Quad Flat No-Lead Package (QFN)/Microchip Carrier (MCC) | | 12-84 | | QFN, also known as MCC, uses half-encapsulation technology to expose the rear side of the die pad and the tiny fingers, which are used to connect the chip and bonding wire with printed circuit boards. | | Cellular phones, wireless local access networks, personal digital assistant devices and digital cameras. |
| | | | | | | |
| Advanced Quad Flat No-Lead Package (aQFN) | | 104-248 | | aQFN allows for leadless, multi-row and fine-pitch leadframe packaging and is characterized by enhanced thermal and electrical performance. aQFN is a cost-effective packaging solution due to its cost-effective materials and simpler packaging process. | | Telecommunications products, wireless local access networks, personal digital assistants, digital cameras, low to medium lead count packaging information appliances. |
| | | | | | |
| Bump Chip Carrier (BCC) | | 16-156 | | BCC packages use plating metal pads to connect with printed circuit boards, creating enhanced thermal and electrical performance. | | Cellular phones, wireless local access networks, personal digital assistant devices and digital cameras. |
| | | | | | | |
| Small Outline Plastic Package (SOP)/Thin Small Outline Plastic Package (TSOP) | | 8-56 | | Designed for memory devices including static random access memory, or SRAM, dynamic random access memory, or DRAM, fast static RAM, also called FSRAM, and flash memory devices. | | Consumer audio/video and entertainment products, cordless telephones, pagers, fax machines, printers, copiers, personal computer peripherals, automotive parts, telecommunications products, recordable optical disks and hard disk drives. |
| | | | | | | |
| Small Outline Plastic J-Bend Package (SOJ) | | 20-44 | | Designed for memory and low pin-count applications. | | DRAM memory devices, microcontrollers, digital analog conversions and audio/video applications. |
| | | | | | | |
| Plastic Leaded Chip Carrier (PLCC) | | 28-84 | | Designed for applications that do not require low-profile packages with high density of interconnects. | | Personal computers, scanners, electronic games and monitors. |
| | | | | | | |
| Plastic Dual In-line Package (PDIP) | | 8-64 | | Designed for consumer electronic products. | | Telephones, televisions, audio/video applications and computer peripherals. |
Substrate-Based Packages. Substrate-based packages generally employ the BGA design, which utilizes a substrate rather than a leadframe. Whereas traditional leadframe technology places the electrical connection around the perimeter of the package, the BGA package type places the electrical connection at the bottom of the package surface in the form of small bumps or balls. These small bumps or balls are typically distributed evenly across the bottom surface of the package, allowing greater distance between individual leads and higher pin-counts.
The BGA package type was developed in response to the requirements of advanced semiconductors. The benefits of the BGA package type include:
| · | superior electrical signal transmission; and |
| · | better heat dissipation. |
The industry demand for BGA packages has grown significantly in recent years. BGA packages are generally used in applications where size, density and performance are important considerations, such as cellular handsets and high pin-count graphic chipsets. Our expertise in BGA packages also includes capabilities in stacked-die BGA, which assembles multiple dies into a single package. As an extension to stacked-die BGA, we also assemble system-in-a-package products, which involve the integration of more than one chip into the same package. We believe that we are among the leaders in these packaging technologies.
We believe that there will continue to be growing demand for packaging solutions with increased input/output density, smaller size and better heat dissipation characteristics. In anticipation of this demand, we have focused on developing our capabilities in some advanced packaging solutions, such as flip-chip BGA. Flip-chip BGA technology replaces wire bonding with wafer bumping for interconnections within the package. Wafer bumping involves the placing of tiny solder balls, instead of wires, on top of dies for connection to substrates. As compared with more traditional packages, which allow input/output connection only on the boundaries of the dies, flip-chip packages significantly enhance the input/output flow by allowing input/output connection over the entire surface of the dies.
The following table sets forth our principal substrate-based packages.
| | | | | | |
| Plastic BGA | | 5-1520 | | Designed for semiconductors which require the enhanced performance provided by plastic BGA, including personal computer chipsets, graphic controllers and microprocessors, application-specific integrated circuits, digital signal processors and memory devices. | | Telecommunications products, global positioning systems, notebook computers, disk drives and video cameras. |
| | | | | | | |
| Cavity Down BGA | | 256-1140 | | Designed for memory devices such as flash memory devices, SRAM, DRAM and FSRAM, microprocessors/controllers and high-value, application-specific integrated circuits requiring a low profile, light and small package. | | Telecommunications products, wireless and consumer systems, personal digital assistants, disk drives, notebook computers and memory boards. |
| | | | | | | |
| Stacked-Die BGA | | 44-591 | | Combination of multiple dies in a single package enables package to have multiple functions within a small surface area. | | Telecommunications products, local area networks, graphics processor applications, digital cameras and pagers. |
| | | | | | | |
| Flip-Chip BGA | | 16-2401 | | Using advanced interconnect technology, the flip-chip BGA package allows higher density of input/output connection over the entire surface of the dies. Designed for high-performance semiconductors that require high density of interconnects in a small package. | | High-performance networking, graphics and processor applications. |
| | | | | | | |
| Hybrid (Flip-Chip and Wire Bumping) | | 49-608 | | A package technology which stacks a die on top of a probed good die to integrate ASIC and | | Digital cameras, smartphones, Bluetooth applications and |
| | | | memory (flash, SRAM and DDR) into one package and interconnecting them with wire bonding and molding. This technology suffers from known good die issues (i.e., one bad die will ruin the entire module). Rework is also not an option in hybrid packages. | | personal digital assistants. |
| | | | | | | |
| Land Grid Array (LGA) | | 10-72 | | Leadless package which is essentially a BGA package without the solder balls. Based on laminate substrate, land grid array packages allow flexible routing and are capable of multichip module functions. | | High frequency integrated circuits such as wireless communications products, computers servers and personal computer peripherals. |
| | | | | | | |
| Flip-Chip Chip Scale Package (FC-CSP) | | 16-200 | | A lightweight package with a small, thin profile that provides better protection for chips and better solder joint reliability than other comparable package types. | | RFICs and memory ICs such as digital cameras, DVDs, devices that utilize WiMAX technology, cellular phones, GPS devices and personal computer peripherals. |
| | | | | | | |
| Package-on-Package (POP) | | 136-288 | | This technology places one package on top of another to integrate different functionalities while maintaining a compact size. It offers procurement flexibility, low cost of ownership, better total system cost and faster time to market. Designers typically use the topmost package for memory applications and the bottomost package for ASICs. By using this technology, the memory known good die issue can be mitigated and the development cycle time and cost can be reduced. | | Cellular phones, personal digital assistants and system boards. |
Wafer-Level Packages. Wafer-level packages typically have an area no greater than 1.2 times of the silicon die. Unlike substrate-based packages, where the die is usually mounted on an interposer which then contains electrical connections in the form of small bumps or balls, wafer-level packages do not include an interposer. The electrical connections are etched or printed directly onto the wafer itself, resulting in a package very close to the size of the silicon die.
We provide numerous technologies to meet various customer demands. The following table sets forth our principal wafer-level packaging products:
| | | | | | |
| Wafer Level Chip Scale Package (aCSP) | | 6-88 | | A wafer level chip scale package that can be directly attached to the circuit board. Provides shortest electrical path from the die pad to the circuit board, thereby enhancing electrical performance. | | Cellular phones, personal digital assistants, watches, MP3 players, digital cameras and camcorders. |
| | | | | | | |
| Advanced Wafer Level Package (aWLP) | | 189-364 | | This technology allows the “fanout” of the package I/Os using an area larger than the die size without the need for a separate substrate. It offers cost effective alternatives to flip-chip and wire bumping packaging. 2D and 3D multi-die packages can enable leadless, multi-row and fine-pitch leadframe packages with enhanced thermal and electrical performance. | | Telecommunications products, basebands and multiband transceivers. |
Module Assembly. We also offer module assembly services, which combine one or more packaged semiconductors with other components in an integrated module to enable increased functionality, typically using automated surface mount technology, or SMT, machines and other machinery and equipment for system-level assembly. End-use applications for modules include cellular phones, PDAs, wireless LAN applications, Bluetooth applications, camera modules, automotive applications and toys. We currently provide module assembly services primarily at our facilities in Korea for radio frequency and power amplifier modules used in wireless communications and automotive applications.
Interconnect Materials. Interconnect materials connect the input/output on the semiconductor dies to the printed circuit board. Interconnect materials include substrate, which is a multi-layer miniature printed circuit board, and is an important element of the electrical characteristics and overall performance of semiconductors. We produce substrates for use in our packaging operations.
The demand for higher performance semiconductors in smaller packages will continue to spur the development of advanced substrates that can support the advancement in circuit design and fabrication. As a result, we believe that the market for substrates will grow and the cost of substrates as a percentage of the total packaging process will increase. In the past, substrates we designed for our customers were produced by independent substrate manufacturers. Since 1997, we have been designing and producing a portion of our interconnect materials in-house. In 2008, our interconnect materials operations supplied approximately 51.7% of our consolidated substrate requirements by value.
The following table sets forth, for the periods indicated, the percentage of our packaging revenues accounted for by each principal type of packaging products or services.
| | | | |
| | | | | | | | | | |
| | | (percentage of packaging revenues) | |
| | | | | | | | | | |
Advanced substrate and leadframe-based packages(1) | | | 82.8 | % | | | 86.7 | % | | | 88.0 | % |
Traditional leadframe-based packages(2) | | | 5.2 | | | | 4.3 | | | | 4.7 | |
| Module assembly | | | 7.1 | | | | 6.2 | | | | 4.1 | |
| Other | | | 4.9 | | | | 2.8 | | | | 3.2 | |
| Total | | | 100.0 | % | | | 100.0 | % | | | 100.0 | % |
| (1) | Includes leadframe-based packages such as QFP/TQFP, QFN/MCC and BCC and substrate-based packages such as various BGA package types (including flip-chip and others) and LGA. |
| (2) | Includes leadframe-based packages such as SOP/TSOP, SOJ, PLCC and PDIP. |
Testing Services
We provide a complete range of semiconductor testing services, including front-end engineering testing, wafer probing, final testing of logic/mixed-signal/RF and memory semiconductors and other test-related services.
The testing of semiconductors requires technical expertise and knowledge of the specific applications and functions of the semiconductors tested as well as the testing equipment utilized. We believe that our testing services employ technology and expertise which are among the most advanced in the semiconductor industry. In addition to maintaining different types of testing equipment, which enables us to test a variety of semiconductor functions, we work closely with our customers to design effective testing and conversion programs on multiple equipment platforms for particular semiconductors.
In recent years, complex, high-performance logic/mixed-signal/RF semiconductors have accounted for an increasing portion of our testing revenues. As the testing of complex, high-performance semiconductors requires a large number of functions to be tested using more advanced testing equipment, these products generate higher revenues per unit of testing time, as measured in central processing unit seconds.
Front-End Engineering Testing. We provide front-end engineering testing services, including customized software development, electrical design validation, and reliability and failure analysis.
| · | Customized Software Development. Test engineers develop customized software to test the semiconductor using advanced testing equipment. Customized software, developed on specific testing platforms, is required to test the conformity of each particular semiconductor type to its unique functionality and specification. |
| · | Electrical Design Validation. A prototype of the designed semiconductor is subjected to electrical tests using advanced test equipment and customized software. These tests assess whether the prototype semiconductor complies with a variety of different operating specifications, including functionality, frequency, voltage, current, timing and temperature range. |
| · | Reliability Analysis. Reliability analysis is designed to assess the long-term reliability of the semiconductor and its suitability of use for intended applications. Reliability testing can include “burn-in” services, which electrically stress a device, usually at high temperature and voltage, for a period of time long enough to cause the failure of marginal devices. |
| · | Failure Analysis. In the event that the prototype semiconductor does not function to specifications during either the electrical design validation or reliability testing processes, it is typically subjected to failure analysis to determine the cause of the failure to perform as anticipated. As part of this analysis, the prototype semiconductor may be subjected to a variety of analyses, including electron beam probing and electrical testing. |
Wafer Probing. Wafer probing is the step immediately before the packaging of semiconductors and involves visual inspection and electrical testing of the processed wafer for defects to ensure that it meets our customers’ specifications. Wafer probing services require expertise and testing equipment similar to that used in final testing, and most of our testers can also be used for wafer probing.
Logic/Mixed-Signal/RF Final Testing. We conduct final tests of a wide variety of logic/mixed-signal/RF semiconductors, with the number of leads ranging from the single digits to over one thousand and operating frequencies of over 5 Gbps for digital semiconductors and 6 GHz for radio frequency semiconductors, which are at the high end of the range for the industry. The products we test include semiconductors used for networking and wireless communications, graphics and disk controllers for home entertainment and personal computer applications, as well as a variety of application-specific integrated circuits for various specialized applications.
Memory Final Testing. We provide final testing services for a variety of memory products, such as SRAM, DRAM, single-bit erasable programmable read-only memory semiconductors and flash memory semiconductors.
Other Test-Related Services. We provide a broad range of additional test-related services, including:
| · | Burn-in Testing. Burn-in testing is the process of electrically stressing a device, usually at high temperature and voltage, for a period of time to simulate the continuous use of the device to determine whether this use would cause the failure of marginal devices; |
| · | Module Sip Testing. We provide module sip testing through bench instrument testing and stand-alone testing to our customers with a complete solution with respect to wireless instruments, global positioning system devices, personal navigation devices and digital video broadcasting devices; |
| · | Dry Pack. Process which involves heating semiconductors in order to remove moisture before packaging and shipping to customers; |
| · | Tape and Reel. Process which involves transferring semiconductors from a tray or tube into a tape-like carrier for shipment to customers; and |
| · | Electric Interface Board and Mechanical Test Tool Design. Process of designing individualized testing apparatuses for unique semiconductor devices and packages. |
Drop Shipment Services. We offer drop shipment services for shipment of semiconductors directly to end users designated by our customers. Drop shipment services are provided mostly in conjunction with logic/mixed-signal/RF testing. We provide drop shipment services to a significant percentage of our testing customers. A substantial portion of our customers at each of our facilities have qualified these facilities for drop shipment services. Since drop shipment eliminates the additional step of inspection by the customer before shipment to the end user, quality of service is a key consideration. We believe that our ability to successfully execute our full range of services, including drop shipment services, is an important factor in maintaining existing customers as well as attracting new customers.
The following table sets forth, for the periods indicated, the percentage of our testing revenues accounted for by each type of testing service.
| | | | |
| | | | | | | | | | |
| | | (percentage of testing revenues) | |
| Testing Services: | | | | | | | | | |
| Front-end engineering testing | | | 4.7 | % | | | 3.6 | % | | | 3.2 | % |
| Wafer probing | | | 18.7 | | | | 20.1 | | | | 18.1 | |
| Final testing | | | 76.6 | | | | 76.3 | | | | 78.7 | |
| Total | | | 100.0 | % | | | 100.0 | % | | | 100.0 | % |
Seasonality
See “Item 5. Operating and Financial Review and Prospects—Operating Results and Trend Information—Quarterly Net Revenues, Gross Profit and Gross Margin.”
Sales and Marketing
Sales and Marketing Offices
We maintain sales and marketing offices in Taiwan, the United States, Austria, Belgium, France, Germany, Singapore, the Philippines, the PRC, Korea, Malaysia and Japan. Our sales and marketing offices in Taiwan are located in Hsinchu and Kaohsiung. We conduct marketing research through our customer service personnel and through our relationships with our customers and suppliers to keep abreast of market trends and developments. We also provide advice in the area of production process technology to our major customers planning the introduction of new products. In placing orders with us, our customers specify which of our facilities these orders will go to. Our customers conduct separate qualification and correlation processes for each of our facilities that they use. See “—Qualification and Correlation by Customers.”
Customers
Our global base of over 200 customers includes leading semiconductor companies across a wide range of end-use applications, such as:
· Altera Corporation | · NEC Electronics Corporation |
· ATI Technologies, Inc. | · NVIDIA Corporation |
· Broadcom Corporation | · NXP Semiconductors |
· Cambridge Silicon Radio Limited | · Powerchip Semiconductor Corp. |
· Freescale Semiconductor, Inc. | · Qualcomm Incorporated |
· Infineon Technologies | · RF Micro Devices, Inc. |
· Kawasaki Microelectronics, Inc | · Silicon Integrated Systems |
· Marvell Technology Group Ltd. | · STMicroelectronics N.V. |
· Media Tek Inc. | · Zoran Corporation |
· Microsoft Corporation | |
Our five largest customers together accounted for approximately 26.0% , 24.8% and 27.1% of our net revenues in 2006, 2007 and 2008, respectively. No customer accounted for more than 10% of our net revenues in 2006, 2007 and 2008.
We package and test for our customers a wide range of products with end-use applications in the communications, computers, consumer electronics, industrial and automotive sectors. The following table sets forth a breakdown of the percentage of our net revenues, for the periods indicated, by the principal end-use applications of the products which we packaged and tested.
| | | | |
| | | | | | | | | | |
| | | | | | | | | | |
| Communications | | | 37.2 | % | | | 44.5 | % | | | 44.7 | % |
| Computers | | | 24.7 | | | | 22.8 | | | | 22.8 | |
| Consumer electronics/industrial/automotive | | | 37.3 | | | | 32.1 | | | | 32.1 | |
| Other | | | 0.8 | | | | 0.6 | | | | 0.4 | |
| Total | | | 100.0 | % | | | 100.0 | % | | | 100.0 | % |
Many of our customers are leaders in their respective end-use markets. For example, we provide Freescale Semiconductor, Inc., an industry leader in automotive and wireless communications semiconductor products, with a substantial portion of its outsourced packaging and testing requirements. The following table sets forth some of our
largest customers, in alphabetical order, categorized by the principal end-use applications of the products which we package and test for them.
| | | | Consumer Electronics/Industrial/Automotive |
Broadcom Corporation Cambridge Silicon Radio Limited Freescale Semiconductor, Inc. Infineon Technologies Media Tek Inc. NXP Semiconductors Qualcomm Incorporated RF Micro Devices, Inc. | | ATI Technologies, Inc. NVIDIA Corporation Powerchip Semiconductor Corp. STMicroelectronics N.V. | | Freescale Semiconductor, Inc. Microsoft Corporation NEC Electronics Corporation STMicroelectronics N.V. Zoran Corporation |
We categorize our packaging and testing revenues geographically based on the country in which the customer is headquartered. The following table sets forth, for the periods indicated, the percentage breakdown by geographic regions of our packaging and testing revenues.
| | | | |
| | | | | | | | | | |
| | | | | | | | | | |
| America | | | 53.1 | % | | | 49.8 | % | | | 53.0 | % |
| Taiwan | | | 18.7 | | | | 21.2 | | | | 19.8 | |
| Asia | | | 15.7 | | | | 16.6 | | | | 13.7 | |
| Europe | | | 12.5 | | | | 12.4 | | | | 13.5 | |
| Other | | | * | | | | * | | | | * | |
| Total | | | 100.0 | % | | | 100.0 | % | | | 100.0 | % |
| * | Indicates percentage is less than 0.1% of net revenues. |
The majority of our testing revenues is accounted for by the testing of semiconductors that were also packaged at our packaging facilities. The balance represented testing revenues from customers who delivered packaged semiconductors directly to our facilities for testing services alone. The majority of our packaging revenues is accounted for by the packaging of semiconductors which were subsequently tested at our facilities. We expect that more customers of our packaging facilities will begin to contract for our packaging and testing services on a turnkey basis.
Qualification and Correlation by Customers
Customers generally require that our facilities undergo a stringent qualification process during which the customer evaluates our operations and production processes, including engineering, delivery control and testing capabilities. The qualification process typically takes up to eight weeks, but can take longer depending on the requirements of the customer. In the case of our testing operations, after we have been qualified by a customer and before the customer delivers semiconductors to us for testing in volume, a process known as correlation is undertaken. During the correlation process, the customer provides us with sample semiconductors to be tested and either provides us with the test program or requests that we develop a conversion program. In some cases, the customer also provides us with a data log of results of any testing of the semiconductors which the customer may have conducted previously. The correlation process typically takes up to two weeks, but can take longer depending on the requirements of the customer. We believe our ability to provide turnkey services reduces the amount of time spent by our customers in the qualification and correlation process. As a result, customers utilizing our turnkey services are able to achieve shorter production cycles.
Pricing
We price our packaging services primarily on a cost-plus basis with reference to prevailing market prices. We price our testing services primarily on the basis of the amount of time, measured in central processing unit seconds, taken by the automated testing equipment to execute the test programs specific to the products being tested, as well as the cost of the equipment, with reference to prevailing market prices. Prices for our packaging and testing services are confirmed at the time firm orders are received from customers, which is typically four to eight weeks before delivery.
Raw Materials and Suppliers
Packaging
The principal raw materials used in our packaging processes are interconnect materials such as leadframes and substrates, gold wire and molding compound. Interconnect materials, such as leadframes, substrates, gold wire and molding compound represented approximately 11.2%, 32.9%, 38.5% and 6.3%, respectively, of our total cost of packaging materials in 2008.
The silicon die, which is the functional unit of the semiconductor to be packaged, is supplied in the form of silicon wafers. Each silicon wafer contains a number of identical dies. We receive the wafers from the customers or the foundries on a consignment basis. Consequently, we generally do not incur inventory costs relating to the silicon wafers used in our packaging process.
We do not maintain large inventories of leadframes, substrates, gold wire or molding compound, but generally maintain sufficient stock of each principal raw material for approximately one month’s production based on blanket orders and rolling forecasts of near-term requirements received from customers. In addition, several of our principal suppliers dedicate portions of their inventories, typically in amounts equal to the average monthly amounts supplied to us, as reserves to meet our production requirements. However, shortages in the supply of materials experienced by the semiconductor industry have in the past resulted in occasional price adjustments and delivery delays. For example, in the first half of 2000, the industry experienced a shortage in the supply of advanced substrates used in BGA packages, which, at the time, were only available from a limited number of suppliers located primarily in Japan. Recent fluctuations in gold prices have also affected the price at which we have been able to purchase gold wire. We cannot guarantee that we will not experience shortages in the near future or that we will be able to obtain adequate supplies of raw materials in a timely manner and at a reasonable price. In the event of a shortage, we generally inform our customers and work together to accommodate changes in delivery schedules.
We produce substrates for use in our packaging operations. In 2008, our interconnect materials operations supplied approximately 51.7% of our consolidated substrate requirements by value. See “—Principal Products and Services—Packaging Services—Interconnect Materials.”
As a result of the “Directive 2002/95/EC on the restriction of the use of certain hazardous substances in electrical and electronic equipment”, or RoHS, which became effective on July 1, 2006, we have adjusted our purchases of raw materials and our production processes in order to use raw materials that comply with this legislation for part of our production. This legislation restricts the use in the European Union, or EU, of certain substances the EU deems harmful to consumers, which includes certain grades of molding compounds, solder and other raw materials that are used in our products. Manufacturers of electrical and electronic equipment must comply with this legislation in order to sell their products in an EU member state.
Testing
Apart from packaged semiconductors, no other raw materials are needed for the functional and burn-in testing of semiconductors. For the majority of our testing equipment, we often base our purchases on prior discussions with our customers about their forecast requirements. The balance consists of testing equipment on consignment from customers and which are dedicated exclusively to the testing of these customers’ specific products.
Equipment
Packaging
The most important equipment used in the semiconductor packaging process is the wire bonder. Wire bonders connect the input/output terminals on the silicon die using extremely fine gold wire to leads on leadframes or substrates. Typically, a wire bonder may be used, with minor modifications, for the packaging of different products. We purchase our wire bonders principally from Kulicke & Soffa Industries Inc. and Oerlikon Assembly Equipment Ltd. As of April 30, 2009, we operated an aggregate of 8,425 wire bonders, of which 7,705 were fine-pitch wire bonders. As of the same date, 58 of the wire bonders operated by us were consigned by customers. For the packaging of certain types of substrate-based packages, such as flip-chip BGA, die bonders are used in place of wire bonders. We purchase our die bonders principally from Hitachi High Technologies Corporation, Oerlikon Assembly Equipment Ltd and ASM Assembly Automation Ltd. The number of bonders at a given facility is commonly used as a measure of the packaging capacity of the facility. In addition to bonders, we maintain a variety of other types of packaging equipment, such as wafer grind, wafer mount, wafer saw, automated molding machines, laser markers, solder plate, pad printers, dejunkers, trimmers, formers, substrate saws and scanners. We purchase our molding machines principally from Towa Corporation, Fico B.V. and ASM Assembly Automation Ltd.
Testing
Testing equipment is the most capital intensive component of the testing process. We generally seek to purchase testers from different suppliers with similar functionality and the ability to test a variety of different semiconductors. We purchase testers from major international manufacturers, including Verigy Ltd., Teradyne, Inc., Credence Systems Corporation, LTX Corporation, Seiko Epson and Tokyo Electron Limited. Upon acquisition of new testers, we install, configure, calibrate, perform burn-in diagnostic tests on and establish parameters for the testers based on the anticipated requirements of existing and potential customers and considerations relating to market trends. As of April 30, 2009, we operated an aggregate of 1,571 testers, of which 315 were consigned by customers and 32 were leased under operating leases. In addition to testers, we maintain a variety of other types of testing equipment, such as automated handlers and probers (special handlers for wafer probing), scanners, reformers and computer workstations for use in software development. Each tester may be attached to a handler or prober. Handlers attach to testers and transport individual packaged semiconductor to the tester interface. Probers similarly attach to the tester and align each individual die on a wafer with the interface to the tester.
Test programs, which are the software that drive the testing of specific semiconductors, are written for a specific testing platform. We often perform test program conversions that enable us to test semiconductors on multiple test platforms. This portability between testers enables us to allocate semiconductors tested across our available test capabilities and thereby improve capacity utilization rates. In cases where a customer requires the testing of a semiconductor product that is not yet fully developed, the customer may provide personal computer workstations to us to test specific functions. In cases where a customer has specified testing equipment that was not widely applicable to other products which we test, we have required the customer to furnish the equipment on a consignment basis.
Intellectual Property
As of April 30, 2009, we held 1,400 Taiwan patents, 445 U.S. patents and 68 PRC patents related to various semiconductor packaging technologies. In addition, we registered “ASE” as a trademark and as a servicemark in Taiwan.
We have also entered into various non-exclusive technology license agreements with other companies involved in the semiconductor manufacturing process, including Freescale Semiconductor Inc., Tessera Inc., Fujitsu Limited, Flip Chip International, L.L.C., Mitsui High-Tec, Inc. and Infineon Technologies AG. We paid royalties under our license agreements in the amount of NT$282.3 million, NT$246.8 million and NT$199.2 million (US$6.1 million) in 2006, 2007 and 2008, respectively. The technology we license from these companies includes solder bumping, redistribution, ultra CSP assembly, advanced QFN assembly, wafer level packaging and other technologies used in the production of package types, such as BCC, flip-chip BGA, film BGA and QFN. The license agreement with Tessera Inc. will not expire until the expiration of the Tessera Inc. patents licensed by the agreement. For
information regarding our intellectual property dispute with Tessera, see “Item 8. Financial Information—Legal Proceedings.” Our license agreements with Freescale Semiconductor Inc. will expire on December 31, 2010. Our license agreements with Flip Chip International, L.L.C. will not expire until the expiration of the Flip Chip International, L.L.C. patents licensed by the agreement. Our license agreement with Infineon Technologies AG will expire on November 5, 2017, and our license agreement with Mitsui High-Tec, Inc. will expire on June 24, 2012. Our license agreement with Fujitsu Limited renews automatically each year unless the parties to the agreement agree otherwise.
Our success depends in part on our ability to obtain, maintain and protect our patents, licenses and other intellectual property rights, including rights under our license agreement with Freescale Semiconductor, Inc.
Quality Control
We believe that our advanced process technology and reputation for high quality and reliable services have been important factors in attracting and retaining leading international semiconductor companies as customers for our packaging and testing services. We maintain a quality control staff at each of our facilities. Our quality control staff typically includes engineers, technicians and other employees who monitor packaging and testing processes in order to ensure high quality. Our quality assurance systems impose strict process controls, statistical in-line monitors, supplier control, data review and management, quality controls and corrective action systems. Our quality control employees operate quality control stations along production lines, monitor clean room environments and follow up on quality through outgoing product inspection and interaction with customer service staff. We have established quality control systems which are designed to ensure high quality service to customers, high product and testing reliability and high production yields at our facilities. We also have established an environmental management system in order to ensure that we can comply with the environmental standards of our customers and the countries within which they operate. See “—Raw Materials and Suppliers—Packaging.” In addition, our packaging and testing facilities have been qualified by all of our major customers after satisfying stringent quality standards prescribed by these customers.
Our packaging and testing operations are undertaken in clean rooms where air purity, temperature and humidity are controlled. To ensure stability and integrity of our operations, we maintain clean rooms at our facilities that meet U.S. Federal Standard 209E class 1,000, 10,000 and 100,000 standards.
Our packaging, testing and interconnect materials facilities in Taiwan, Malaysia, Japan, the PRC, Singapore and Korea have been certified as meeting ISO/TS16949:2002 standards. Such standards were originally created by the International Automotive Task Force in conjunction with the International Standards Organization, or ISO. These standards provide for continuous improvement with an emphasis on the prevention of defects and reduction of variation and waste in the supply chain. The ISO/TS16949:2002 certification is required by some semiconductor manufacturers as a threshold indicator of company’s quality control standards.
Our packaging, testing and interconnect materials facilities in Taiwan, Japan, Korea, Malaysia, the PRC, California and Singapore have been certified as meeting the ISO 9001 quality standards set by the ISO. Our packing, testing and interconnect materials facilities in Taiwan, Japan, Korea, Malaysia, the PRC, California and Singapore have also been certified as meeting the ISO 14001 quality standards. In addition, our packaging facilities in Kaohsiung, Taiwan have been certified as meeting the ISO 17025:2005 quality standards set by the ISO. ISO certifications are required by many countries in connection with sales of industrial products.
Our packaging, testing and interconnect materials facilities in Taiwan, Korea, Singapore and the PRC have also been certified to be in compliance with OHSAS 18001, a set of standards designed upon collaboration with occupational health and safety experts and now offered by many certification organizations as an indication of compliance with certain standards for occupational health and safety.
ISE Labs’s testing facilities in Fremont, California have been approved by the U.S. military’s Defense Supply Center, Columbus, Sourcing and Qualifications Unit as a laboratory possessing the requisite level of performance, quality and reliability required of suppliers for the U.S. Department of Defense.
Our packaging, testing and interconnect materials facilities in Taiwan, Malaysia, the PRC and Korea have been certified as a “Sony Green Partner”, which indicates our compliance with the “Sony Green Package” standard requirements.
Our packaging, testing and interconnect material facilities in Taiwan, the PRC, Japan and Malaysia have been certified to be in compliance with IECQ HSPM QC080000, a certification designed to manage, reduce and eliminate hazardous substances.
In addition, we have received various vendor awards from our customers for the quality of our products and services.
Competition
We compete in the highly competitive independent semiconductor packaging and testing markets. We face competition from a number of sources, including other independent semiconductor packaging and testing companies. More importantly, we compete for the business of integrated device manufacturers with in-house packaging and testing capabilities and fabless semiconductor design companies with their own in-house testing capabilities. Some of these integrated device manufacturers have commenced, or may commence, in-house packaging and testing operations in Asia. Substantially all of the independent packaging and testing companies that compete with us have established operations in Taiwan.
Integrated device manufacturers that use our services continuously evaluate our performance against their own in-house packaging and testing capabilities. These integrated device manufacturers may have access to more advanced technologies and greater financial and other resources than we do. We believe, however, that we can offer greater efficiency at lower cost while maintaining equivalent or higher quality for several reasons. First, as we benefit from specialization and economies of scale by providing services to a large base of customers across a wide range of products, we are better able to reduce costs and shorten production cycles through high capacity utilization and process expertise. Second, as a result of our customer base and product offerings, our equipment generally has a longer useful life. Third, as a result of the continuing reduction of investments in in-house packaging and testing capacity and technology at integrated device manufacturers, we are better positioned to meet their advanced packaging and testing requirements on a large scale.
Environmental Matters
Our packaging and interconnect materials operations generate environmental wastes, including gaseous chemical, liquid and solid industrial wastes. We have installed various types of anti-pollution equipment for the treatment of liquid and gaseous chemical waste generated at all of our semiconductor packaging facilities. We believe that we have adopted adequate anti-pollution measures for the effective maintenance of environmental protection standards that are consistent with the industry practice in the countries in which our facilities are located. In addition, we believe we are in compliance in all material respects with present environmental laws and regulations applicable to our operations and facilities.
Insurance
We have insurance policies covering property damage and damage to our production facilities, buildings and machinery. In addition, we have insurance policies covering our public and product liabilities. Significant damage to any of our production facilities would have a material adverse effect on our results of operations.
We are not insured against the loss of key personnel.
The following chart illustrates our corporate structure and our effective equity interest in each of our principal operating subsidiaries and affiliates as of May 31, 2009. The following chart does not include wholly-owned intermediate holding companies.
Our Consolidated Subsidiaries
ASE Test Taiwan
ASE Test Taiwan, which was acquired in 1990, is our 99.99%-owned subsidiary. It is incorporated in Taiwan and is engaged in the testing of integrated circuits;
ASE Test Malaysia
ASE Test Malaysia, which was established in 1991, is our wholly-owned subsidiary. It is incorporated in Malaysia and is engaged in the packaging and testing of integrated circuits.
ISE Labs
ISE Labs is our wholly-owned subsidiary. It is a semiconductor company specializing in front-end engineering testing that is incorporated in the United States and has its principal facilities located in Fremont and Santa Clara, California. Through ASE Test, we acquired 70.0% of the outstanding shares of ISE Labs in 1999, and increased our holding to 100.0% through purchases made in 2000 and 2002.
ASE Singapore Pte. Ltd.
ASE Singapore Pte. Ltd. is incorporated in Singapore and provides testing services. It was previously our wholly-owned subsidiary through ISE Labs’s 100% interest. Through a restructuring in November 2008, we acquired 100% of ASE Singapore Pte. Ltd. through one of our wholly-owned intermediate holding companies.
ASE Electronics
ASE Material was established in 1997 as an ROC company for the design and production of interconnect materials, such as substrates, used in the packaging of semiconductors. We initially held a majority stake in ASE Material, but acquired the remaining equity by means of a merger of ASE Material with and into us in August 2004. In August 2006, we spun off the operations originally conducted through ASE Material into our wholly-owned subsidiary ASE Electronics. ASE Electronics currently supplies our packaging operations with a substantial portion of our substrate requirements. The facilities of ASE Electronics are primarily located in the Nantze Export Processing Zone near our packaging and testing facilities in Kaohsiung, Taiwan.
ASE Chung Li and ASE Korea
In July 1999, we purchased Motorola’s Semiconductor Products Sector operations in Chung Li, Taiwan and Paju, South Korea for the packaging and testing of semiconductors with principally communications, consumer and automotive applications, thereby forming ASE Chung Li and ASE Korea. In August 2004, we acquired all of the outstanding shares of ASE Chung Li that we did not already own by means of a merger of ASE Chung Li into us.
ASE Japan
ASE Japan, which we acquired from NEC Electronics Corporation in May 2004, is our wholly-owned subsidiary. It is incorporated in Japan and is engaged in the packaging and testing of semiconductors.
ASE Shanghai
ASE Shanghai was established in 2001 as a wholly-owned subsidiary of ASE Inc. and began operations in June 2004. ASE Shanghai primarily manufactures and supplies interconnect materials for our packaging operations.
PowerASE Technology, Inc.
In July 2006, we established PowerASE, a joint venture with Powerchip, focusing on the packaging and testing of memory semiconductors. PowerASE began operations in December 2006. Pursuant to the joint venture agreement, we invested US$30.0 million for 60.0% of the equity interest in PowerASE and Powerchip invested US$20.0 million for the remaining 40.0%. We currently own 56.0% of PowerASE and Powerchip owns 37.4%. The remaining 6.6% is owned by our employees and certain other individuals.
ASE Assembly & Test (Shanghai) Limited
We acquired 100.0% of GAPT, now known as ASESH AT, in January 2007. ASESH AT is a PRC company based in Shanghai, China that provides wire bond packaging and testing services for a wide range of semiconductors.
ASEN
In September 2007, we acquired 60.0% of ASEN from NXP Semiconductors. ASEN is based in Suzhou, China and is engaged in semiconductor packaging and testing.
ASE (Weihai), Inc.
In May 2008, we acquired 100.0% of the shares of ASE (Weihai), Inc. from Aimhigh Global Corp. and TCC Steel. ASE (Weihai), Inc. is based in Shandong, China and is engaged in semiconductor packaging and testing.
Our Unconsolidated Affiliates
As of May 31, 2009, we held approximately 18.2% of the outstanding shares of Universal Scientific and 26.2% of the outstanding shares of Hung Ching.
Universal Scientific
Universal Scientific, which is an ROC company, manufactures electronics products in varying degrees of system integration principally on a contract basis for original equipment manufacturers, including:
| · | electronic components such as thick film mixed-signal devices, thick film resistors, high frequency devices and automotive and power electronic devices; |
| · | board and sub-system assemblies such as customized surface mount technology board assemblies, mother boards for personal computers, wireless local area network cards and fax control boards; and |
| · | system assemblies such as portable computers, desktop personal computers, network computers and servers. |
Universal Scientific’s principal manufacturing facilities are located in Nantou, Taiwan. The shares of Universal Scientific are listed on the Taiwan Stock Exchange under the symbol “2350.”
We purchased 22.6% of the outstanding shares of Universal Scientific in 1999, principally through open market purchases on the Taiwan Stock Exchange. We subsequently increased our holding to 23.3% following open market
purchases of additional shares in 2000. As of May 31, 2009, we held approximately 18.2% of Universal Scientific’s outstanding equity shares. We exercise significant influence over Universal Scientific and therefore account for this investment by the equity method.
In 2006, Universal Scientific recorded net revenues of NT$53,211.5 million, operating income of NT$1,830.4 million and net income of NT$1,377.0 million. In 2007, Universal Scientific recorded net revenues of NT$65,124.1 million, operating income of NT$2,288.8 million and net income of NT$1,868.4 million. In 2008, Universal Scientific recorded net revenues of NT$64,809.4 million (US$1,978.3 million), operating income of NT$1,437.1 million (US$43.9 million) and net income of NT$342.6 million (US$10.5 million). As of May 31, 2009, Universal Scientific had a market capitalization of NT$12,955.4 million (US$395.5 million).
Hung Ching
Hung Ching is an ROC company engaged in the development and management of commercial, residential and industrial real estate properties in Taiwan. The shares of Hung Ching are listed on the Taiwan Stock Exchange under the symbol “2527.” Hung Ching was founded in 1986 by Chang Yao Hung-ying. Chang Yao Hung-ying is the mother of both Jason C.S. Chang, our Chairman and Chief Executive Officer, and Richard H.P. Chang, our Vice Chairman and President. As of May 31, 2009, we held 26.2% of Hung Ching’s outstanding equity shares.
In 2006, Hung Ching recorded net revenues of NT$1,663.5 million, operating income of NT$245.6 million and net income of NT$204.6 million. In 2007, Hung Ching recorded net revenues of NT$799.1 million, operating income of NT$46.9 million and net income of NT$62.5 million. In 2008, Hung Ching recorded net revenues of NT$859.7 million (US$26.2 million), operating loss of NT$14.1 million (US$0.4 million) and net income of NT$63.9 million (US$1.9 million). As of May 31, 2009, Hung Ching had a market capitalization of NT$2,957.9 million (US$90.3 million).
We operate a number of packaging and testing facilities in Asia and the United States. Our facilities provide varying types or levels of services with respect to different end-product focus, customers, technologies and geographic locations. With our diverse facilities we are able to tailor our packaging and testing solutions closely to our customers’ needs. The following table sets forth the location, commencement of operation, primary use, approximate floor space and ownership of our facilities as of April 30, 2009.
| | | | Commencement of Operation | | | | Approximate Floor Space (in sq. ft.) | | |
| ASE Inc. | | Kaohsiung, Taiwan | | March 1984 | | Our primary packaging facility, which offers complete semiconductor manufacturing solutions in conjunction with ASE Test Taiwan and foundries located in Taiwan. Focuses primarily on advanced packaging services, including flip-chip, wafer bumping and fine-pitch wire bonding. | | 2,924,000 | | Land: leased Buildings: owned and leased |
| | | | | | | | | | | |
| | | Chung Li, Taiwan | | Acquired in July 1999 | | An integrated packaging and testing facility that specializes in semiconductors for communications and consumer applications. | | 1,618,000 | | Land and buildings: owned |
| | | | Commencement of Operation | | | | Approximate Floor Space (in sq. ft.) | | |
| ASE Test Taiwan | | Kaohsiung, Taiwan | | December 1987 | | Our primary testing facilities, which offer complete semiconductor manufacturing solutions in conjunction with ASE Inc.’s facility in Kaohsiung and foundries located in Taiwan. Focuses primarily on advanced logic/mixed-signal/RF testing for integrated device manufacturers, fabless design companies and system companies. | | 986,000 | | Land: leased Buildings: owned and leased |
| | | | | | | | | | | |
| | | Chung Li, Taiwan | | October 2001 | | Our primary wafer probing testing facilities. | | 18,000 | | Land and building: leased |
| | | | | | | | | | | |
| ASE Test Malaysia | | Penang, Malaysia | | February 1991 | | An integrated packaging and testing facility that focuses primarily on the requirements of integrated device manufacturers. | | 828,000 | | Land: leased Buildings: owned |
| | | | | | | | | | | |
| ASE Korea | | Paju, Korea | | Acquired in July 1999 | | An integrated packaging and testing facility that specializes in semiconductors for radio frequency, sensor and automotive applications. | | 621,000 | | Land and buildings: owned |
| | | | | | | | | | | |
| ISE Labs | | Silicon Valley, California, Austin, Texas | | Acquired in May 1999 | | Front-end engineering and final testing facilities located in northern California in close proximity to some of the world’s largest fabless design companies. Testing facilities located in close proximity to integrated device manufacturers and fabless companies in Texas. | | 153,000 | | Land and buildings: owned and leased |
| | | | | | | | | | | |
| ASE Singapore | | Singapore | | Acquired in May 1999 | | An integrated testing, sorting and related backend supporting facility that specializes in semiconductors for communication, computers and consumer applications. | | 111,000 | | Land and buildings: leased |
| | | | | | | | | | | |
| ASE Shanghai | | Shanghai, China | | June 2004 | | Design and production of semiconductor packaging materials. | | 1,431,000 | | Land: leased Buildings: owned |
| | | | | | | | | | | |
| ASE Japan | | Takahata, Japan | | Acquired in May 2004 | | An integrated packaging and testing facility that specializes in semiconductors for cellular phone, household appliance and automotive applications. | | 298,000 | | Land and buildings: leased |
| | | | | | | | | | | |
| ASE Electronics | | Kaohsiung, Taiwan | | August 2006 | | Facilities for the design and production of interconnect materials such as substrates used in the packaging of semiconductors. | | 311,000 | | Buildings: leased |
| | | | | | | | | | | |
| | | Chung Li, Taiwan | | August 2006 | | Facilities for the design and production of interconnect materials such as substrates used in packaging of semiconductors. | | 337,000 | | Buildings: leased |
| | | | | | | | | | | |
| PowerASE | | Chung Li, Taiwan | | December 2006 | | An integrated packaging and testing facility that specializes in memory semiconductors for personal computer applications. | | 221,000 | | Buildings: leased |
| | | | | | | | | | | |
| ASESH AT | | Shanghai, China | | Acquired in | | An integrated packaging and testing | | 796,000 | | Land: leased |
| | | | Commencement of Operation | | | | Approximate Floor Space (in sq. ft.) | | |
| | | | | January 2007 | | facility that specializes in semiconductors for communications and consumer applications. | | | | Buildings: owned |
| | | | | | | | | | | |
| ASEN | | Suzhou, China | | Acquired in September 2007 | | An integrated packaging and testing facility that specializes in communication applications. | | 142,000 | | Land: leased Buildings: owned |
| | | | | | | | | | | |
| ASE (Weihai), Inc. | | Shandong, China | | Acquired in May 2008 | | An integrated packaging and testing facility that specializes in semiconductors for communications, computers and consumer applications. | | 168,000 | | Land: leased Buildings: owned |
Our leased property in Kaohsiung consists primarily of approximately twenty leases of land in the Kaohsiung Nantze Export Processing Zone between ASE Inc. and ASE Test Taiwan, as the lessees, and the Export Processing Zones Administration, or the EPZA, under the Ministry of Economic Affairs. The leases have ten year terms that expire between the middle of April 2010 and the end of September 2017. No sublease or lending of the land is allowed. The EPZA has the right to adjust the rental price in the event the government revalues the land. The leases are typically renewable with three months notice prior to the termination date.
For information on the aggregate capacity of our facilities in terms of the number of bonders and testers we operate, see “—Business Overview—Equipment.”
None.
The following discussion of our business, financial condition and results of operations should be read in conjunction with our consolidated financial statements, which are included elsewhere in this annual report. This discussion contains forward-looking statements that reflect our current views with respect to future events and financial performance. Our actual results may differ materially from those anticipated in these forward-looking statements as a result of any number of factors, such as those set forth under “Item 3. Key Information—Risk Factors” and elsewhere in this annual report. See “Special Note Regarding Forward-Looking Statements.”
Overview
We offer a broad range of semiconductor packaging and testing services. In addition to offering each service separately, we also offer turnkey services, which consist of the integrated packaging, testing and direct shipment of semiconductors to end users designated by our customers. Our net revenues decreased from NT$100,423.6 million in 2006 and NT$101,163.1 million in 2007 to NT$94,430.9 million (US$2,882.5 million) in 2008.
Discussed below are several factors that have had a significant influence on our financial results in recent years.
Global Economic Crisis
Through the first three quarters of 2008, demand for our services mirrored historical fluctuations. Beginning in late 2008, however, the global economy suffered an unprecedented crisis that had a significant adverse impact on the semiconductor industry. As a result, our clients substantially reduced their demand for our services and we experienced a significant deterioration in sales volume, which led to a corresponding decline in our revenues beginning in the fourth quarter of 2008 and into the first quarter of 2009. While we cannot accurately predict when worldwide demand will recover significantly, we believe that over the long-term, demand for our services will return to levels that we experienced prior to the economic crisis in 2008.
Pricing and Revenue Mix
We price our services on a cost-plus basis, taking into account the actual costs involved in providing these services, with reference to prevailing market prices. The majority of our prices and revenues are denominated in U.S. dollars. Any significant fluctuation in the exchange rates, especially between NT dollars and U.S. dollars will affect our costs and, in turn, our pricing.
In the case of semiconductor packaging, the cost of the silicon die, typically the most costly component of the packaged semiconductor, is usually not reflected in our costs (or revenues) since it is generally supplied by our customers on a consignment basis.
The semiconductor industry is characterized by a general trend towards declining prices for products and services of a given technology over time. In addition, during periods of intense competition and adverse conditions in the semiconductor industry, the pace of this decline may be more rapid than in other years. The average selling prices of our packaging and testing services have experienced sharp declines during such periods as a result of intense price competition from other independent packaging and testing companies that attempt to maintain high capacity utilization levels in the face of reduced demand.
The average selling prices of our testing services are more severely affected by a downturn in the semiconductor industry than the average selling prices of our packaging services. During an industry downturn, a decline in the average selling prices of our testing services is often exacerbated by a decrease in demand from our integrated device manufacturer customers, who typically maintain larger in-house testing capacity than in-house packaging capacity. These price declines are also exacerbated by intense price competition from other independent testing service providers, who typically offer large price discounts during periods of depressed demand in order to maintain higher capacity utilization rates to defray the high fixed costs associated with testing operations. In 2006, 2007 and 2008, packaging revenues, including revenues from module assembly, accounted for 76.5%, 77.6% and 77.7% while testing revenues accounted for 21.3%, 19.8% and 20.1%, respectively, of our net revenues.
We believe that, over the long term, the market for outsourced semiconductor testing services has more potential for growth than the market for outsourced semiconductor packaging services for two reasons. First, the portion of the semiconductor testing market that is currently accounted for by independent testing service providers is smaller than that for packaging. Second, the large capital expenditures needed for increasingly sophisticated testing equipment, as compared to less expensive packaging equipment, is also a driver for further outsourcing of testing services by integrated device manufacturers.
Declines in average selling prices have been partially offset over the last several years by changes in our revenue mix. In particular, revenues derived from packaging more advanced package types, such as flip-chip BGA, higher density packages with finer lead-to-lead spacing, or pitch, and testing of more complex, high-performance semiconductors have increased as a percentage of total revenues. We intend to continue to focus on packaging more advanced package types, such as BGA and flip-chip BGA, developing and offering new technologies in packaging and testing services and expanding our capacity to achieve economies of scale, as well as improving production efficiencies for older technologies, in order to mitigate the effects of declining average selling prices on our profitability.
Our profitability for a specific package type does not depend linearly on its average selling price. Some of our more traditional package types, which typically have low average selling prices, may well command steadier and sometimes higher margins than more advanced package types with higher average selling prices.
High Fixed Costs
Our operations, in particular our testing operations, are characterized by relatively high fixed costs. We expect to continue to incur substantial depreciation and other expenses as a result of our acquisitions of packaging and testing equipment and facilities. Our profitability depends in part not only on absolute pricing levels for our services, but also on utilization rates for our packaging and testing equipment, commonly referred to as “capacity utilization rates.” In particular, increases or decreases in our capacity utilization rates could have a significant effect on gross margins since the unit cost of packaging and testing services generally decreases as fixed costs are allocated over a
larger number of units. The capacity utilization rates of the machinery and equipment installed at our production facilities typically depend on factors such as the volume and variety of products packaged or tested using such machinery and equipment, the efficiency of our operations in terms of the loading and adjustment of machinery and equipment for the packaging or testing of different products, the complexity of the different products to be packaged or tested, the amount of time set aside for the maintenance and repair of the machinery and equipment, and the experience and schedule of work shifts of operators.
The current generation of advanced testers typically cost between US$1.0 million and US$3.0 million each, while wire bonders used in packaging typically cost between US$60,000 and US$70,000 each. In 2006, 2007 and 2008, our depreciation and amortization as a percentage of net revenues was 13.3%, 15.1% and 16.7%, respectively. The increase in depreciation and amortization as a percentage of net revenues in 2008 compared to 2007 was primarily a result of the depreciation of new equipment, particularly with respect to equipment acquired for newly-acquired or newly-formed subsidiaries. See “Item 4. Information on the Company—Business Overview—Equipment.” We begin depreciating our equipment when it is placed into service. There may sometimes be a time lag between when our equipment is placed into service and when it achieves high levels of utilization. In periods of depressed industry conditions, such as the fourth quarter of 2008, we may experience lower than expected demand from customers, resulting in an increase in depreciation relative to net revenues. In particular, the capacity utilization rates for our testing equipment are more severely affected during an industry downturn as a result of the decrease in outsourcing demand from integrated device manufacturers, which typically maintain larger in-house testing capacity than in-house packaging capacity.
In addition to purchasing testers, we also lease a portion of our testers, which we believe allows us to better manage our capacity utilization rates and cash flow. Since testers operated under operating leases can be replaced with more advanced testers upon the expiration of the lease, we believe that these operating leases have enabled us to improve our capacity utilization rates by allowing us to better align our capacity with changes in equipment technology. For more information about our testers, including the number of testers under lease, see “Item 4. Information on the Company—Business Overview—Equipment—Testing.”
Raw Material Costs
Substantially all of our raw material costs are accounted for by packaging and the production of interconnect materials, as testing requires minimal raw materials. In 2006, 2007 and 2008, raw material cost as a percentage of our net revenues was 29.2%, 27.6% and 28.9%, respectively.
Gold wire is one of the principal raw materials we use in our packaging processes. Recent volatility in the price of gold has affected our cost of revenues. In 2008, the spot rate for gold fluctuated from approximately US$700 per ounce to approximately US$1,000 per ounce. It may be difficult for us to adjust our average selling prices to account for fluctuations in the price of gold. We expect that gold wire will continue to be an important raw material for us and we therefore expect to continue to be subject to significant fluctuations in the price of gold.
ASE Test Share Acquisition and Privatization
On May 30, 2008, we acquired, by way of a scheme of arrangement under Singapore law, all the outstanding ordinary shares of ASE Test that we did not already directly or indirectly own, making ASE Test our wholly-owned subsidiary. See “Item 4. Information on the Company—History and Development of the Company—ASE Test Share Acquisition and Privatization.” Prior to this transaction, we held 50.3% of ASE Test and 50.3% of ASE Test’s net income or loss was reflected in our consolidated net income and the remaining 49.7% was reflected as minority interest. As a result of the transaction, beginning on June 1, 2008, 100.0% of ASE Test’s net income or loss has been reflected in our consolidated net income. Any losses at ASE Test therefore have a greater adverse affect on our net income than prior to the effectiveness of the scheme of arrangement.
Recent ROC GAAP Accounting Pronouncements
The ROC ARDF issued Interpretation 96-052, “Accounting for Bonuses to Employees, Directors and Supervisors”, or Interpretation 96-052, in March 2007, which requires companies to record bonuses paid to employees, directors and supervisors as an expense rather than an appropriation of earnings. Pursuant to
Interpretation 96-052, we accrued between 9% and 12% of our earnings as bonuses to our employees, directors and supervisors beginning on January 1, 2008.
The ROC ARDF revised ROC SFAS No. 10, “Accounting for Inventories”, or ROC SFAS No. 10, in November 2007, which requires inventories to be stated at the lower of cost or net realizable value item by item. Inventories are recorded by the specific identification method, first-in, first-out method or weighted average method. The last-in, first-out method is no longer permitted. The revised ROC SFAS No. 10 should be applied to financial statements for the fiscal years beginning on or after January 1, 2009. We believe that ROC SFAS No. 10 has no material impact on us.
Critical Accounting Policies and Estimates
Preparation of our consolidated financial statements requires us to make estimates and judgments in applying our critical accounting policies which have a significant impact on the results we report in our consolidated financial statements. We continually evaluate these estimates, including those related to revenue recognition, sales discounts and allowances for doubtful accounts, inventories, allowances for deferred income tax assets, losses on impairment of assets, goodwill and investments, bonuses to employees, directors and supervisors and purchase price allocations on our investments. We base our estimates on historical experience and other assumptions which we believe to be reasonable under the circumstances. Actual results may differ from these estimates under different assumptions and conditions. We have identified below the accounting policies that are the most critical to our consolidated financial statements.
Revenue Recognition. Revenues from semiconductor packaging and testing services are recognized upon completion of the services or shipment. We do not take ownership of:
| · | bare semiconductor wafers received from customers that we package into finished semiconductors; and |
| · | packaged semiconductors received from customers that we test for performance specifications. |
The title and risk of loss remains with the customer for those bare semiconductors and/or packaged semiconductors. Accordingly, the cost of customer-supplied semiconductor materials is not included in our consolidated financial statements. Other criteria that we use to determine when to recognize revenue are:
| · | existence of persuasive evidence of an arrangement; |
| · | the selling price is fixed or determinable; and |
| · | collectibility is reasonably assured. |
These policies are consistent with provisions in the Staff Accounting Bulletin No. 104 issued by the SEC. We do not provide warranties to our customers except in cases of defects in the packaging services provided and deficiencies in testing services provided. An appropriate sales discount is recognized in the period during which the sale is recognized, and is estimated based on historical experience.
Allowance for Doubtful Accounts. We periodically record a provision for doubtful accounts based on our evaluation of the collectibility of our accounts receivable. The total amount of this provision is determined by us as follows. We first identify the receivables of customers that are considered to be a higher credit risk based on their current overdue accounts with us, difficulties collecting from these customers in the past or their overall financial condition. For each of these customers, we estimate the extent to which the customer will be able to meet its financial obligations to us, and we record an allowance that reduces our accounts receivable for that customer to the amount that we reasonably believe will be collected. For all other customers, we maintain an allowance for doubtful accounts equal to a percentage of their aggregate accounts receivable. As of December 31, 2006, 2007 and 2008, the allowance we set aside for doubtful accounts was NT$244.4 million, NT$109.7 million and NT$99.2 million (US$3.0 million), respectively. Additional allowances may be required in the future if the financial condition of our customers or general economic conditions further deteriorate, and this additional allowance would reduce our net income.
Inventories. Inventories are recorded at cost when acquired and stated at the lower of moving or weighted average cost or market value. Unbilled processing charges incurred are included in finished goods and work in progress and are stated at actual cost. Market value for finished goods and work in process is estimated to be the net realizable value. Market value for raw materials, supplies and spare parts is the cost of replacement. Materials received from customers for processing, mainly of semiconductor wafers, are excluded from inventories, as title and risk of loss remains with the customers. An allowance for loss on decline in market value and obsolescence is provided based on the difference between the cost of inventory and the estimated market value based upon assumptions about future demand and market conditions. An additional inventory provision may be required if actual market conditions are less favorable than those projected.
Valuation Allowances for Deferred Income Tax Assets. Tax benefits arising from deductible temporary differences, unused tax credits and net operating loss carryforwards are recognized as deferred income tax assets. We record a valuation allowance to the extent that we believe it is more likely than not that deferred income tax assets will not be realized. We have considered future taxable income and ongoing prudent and feasible tax planning strategies in assessing the need and amount for the valuation allowance. In the event we were to determine that we would be able to realize our deferred income tax assets in the future in excess of our net recorded amount, an adjustment to our deferred income tax assets would increase income in the period such determination was made. Alternatively, should we determine that we would not be able to realize all or part of our deferred income tax assets in the future, an adjustment to our deferred income tax assets would decrease income in the period such determination was made.
Realizability of Long-Lived Assets. We are required to evaluate our equipment and other long-lived assets for impairment whenever there is an indication of impairment. If certain criteria are met, we are required to record an impairment charge.
In accordance with ROC SFAS No. 35, long-lived assets held and used by us are reviewed for impairment whenever events or changes in circumstances indicate that the carrying amount of an asset may not be recoverable. If the recoverable amount increases in a future period, the amount previously recognized as impairment will be reversed and recognized as a gain. However, the adjusted amount may not exceed the carrying amount that would have been determined, net of depreciation, had no impairment loss had been recognized.
In accordance with U.S. SFAS No. 144, long-lived assets held and used by us are reviewed for impairment whenever events or changes in circumstances indicate that the carrying amount of an asset may not be recoverable. For purposes of evaluating the recoverability of long-lived assets, the recoverability test is performed by comparing undiscounted net cash flows of the assets against the net book value of the assets. If the recoverability test indicates that an impairment has occurred, the impairment loss is the amount of the asset’s net book value in excess of the related fair value.
In 2005, we recognized a loss of NT$13,479.1 million on damage to our property, plant and equipment caused by a fire at our facilities in Chung Li, Taiwan. In 2006, we reversed NT$2,190.6 million of the impairment loss recognized in 2005 under ROC GAAP due to an increase in the estimated service potential of the relevant assets. See note 30 to our consolidated financial statements included in this annual report. Reversal of the amount is prohibited under U.S. GAAP. See note 32 to our consolidated financial statements included in this annual report for a reconciliation of the differences in the cost basis of the damaged machinery and associated depreciation expense. In 2007, we recognized impairment of NT$816.2 million, based on an independent appraiser’s assessment of fair value, on idle assets due to an impairment in our flip-chip substrate production line that was primarily the result of idle capacity, which was caused by lack of demand for certain applications. In 2008, we recognized impairment of NT$34.6 million (US$1.1 million) on idle assets. See note 15 to our consolidated financial statements included in this annual report.
Business Combinations. When we acquire businesses, we allocate the purchase price to tangible assets and liabilities and identifiable intangible assets acquired. Any residual purchase price is recorded as goodwill. The allocation of the purchase price requires management to make significant estimates in determining the fair values of assets acquired and liabilities assumed, especially with respect to intangible assets. These estimates are based on historical experience, information obtained from the management of the acquired companies and independent external service providers’ reports. These estimates can include, but are not limited to, the cash flows that an asset is
expected to generate in the future, the appropriate weighted-average cost of capital, and the synergistic benefits expected to be derived from the acquired business. These estimates are inherently uncertain and unpredictable. In addition, unanticipated events and circumstances may occur which may affect the accuracy or validity of such estimates.
In May 2008, we acquired from minority shareholders 58,438,944 shares of ASE Test. See “Item 4. Information on the Company—History and Development of the Company—ASE Test Share Acquisition and Privatization” for more information on the ASE Test share acquisition and privatization. Pursuant to ROC SFAS No. 25 “Business Combinations”, No. 37 “Intangible Assets”, U.S. SFAS No. 141 “Business Combinations” and U.S. SFAS No. 142 “Goodwill and Other Intangible Assets”, acquired tangible assets were valued at estimates of their current fair value. The valuation of acquired intangible assets was determined based on management’s estimates and consultation with an independent appraiser. Intangible assets of NT$1,675.1 million (US$51.1 million) consisted of patents, acquired special technology and customer relationships. These intangible assets are amortized on a straight-line basis over the estimated life of five to 11 years to reflect the pattern in which the economic benefits of the intangible asset are consumed or otherwise used up. In addition, we also recognized goodwill of NT$6,271.2 million (US$191.4 million). We paid a premium for this acquisition in order to fully consolidate ASE Test’s earnings with ours, simplify our organizational structure, reduce costs and administrative burdens associated with filing and compliance requirements relating to ASE Test’s Nasdaq Global Market and Taiwan Stock Exchange listings and public company reporting obligations, enhance our brand recognition through the promotion of a single common brand and increase our flexibility in making investments and allocating resources among our subsidiaries.
Goodwill. Goodwill is evaluated for impairment at least annually and we test for impairment between annual tests if an event occurs or circumstances change that would indicate that the carrying amount may be impaired. Goodwill is evaluated for impairment by comparing the recorded amount of the cash-generating unit to which the goodwill has been allocated to its recoverable amount. Recoverable amount is defined as the higher of a cash-generating unit’s fair value less costs to sell or its “value in use”, which is defined as the present value of the expected future cash flows generated by the assets. In conducting the future cash flow valuation, we make assumptions about future operating cash flows, the discount rate used to determine present value of future cash flows, and capital expenditures. Future operating cash flows assumptions include sales growth assumptions, which are based on our historical trends and industry trends, and gross margin and operating expense growth assumptions, which are based on the historical relationship of those measures compared to sales and certain cost cutting initiatives. An impairment charge is incurred to the extent the recorded amount exceeds the recoverable amount. As of December 31, 2008, we had goodwill of NT$9,456.1 million (US$288.6 million) and NT$9,804.7 million (US$299.3 million) under ROC GAAP and U.S. GAAP, respectively. Based on our analysis, we believe that our estimated fair value exceeded the carrying value of the goodwill and no impairment existed as of December 31, 2008. Our conclusion could, however, change in the future if actual results differ from our estimates and judgments under different assumptions and conditions.
Valuation of Long-term Investments. We hold significant long-term investments in public and non-public entities. We evaluate these long-term investments annually for impairment based on market prices, if available, the financial condition of the investee company, economic conditions in the industry, and our intent and ability to hold the investment for a long period of time. These assessments usually require a significant amount of judgment, as a significant decline in the market price may not be the best indicator of impairment. Under U.S. GAAP, we evaluate long-term investments using the above mentioned criteria and, to the extent any decline in the value of a long-term investment is determined to be other than temporary, an impairment charge is recorded in the current period. The methods to measure the amount of impairment under ROC GAAP and U.S. GAAP may be based on different estimates of fair value depending on the circumstances. Under U.S. GAAP, market price is to be used, if available, to determine the fair value. Under ROC GAAP, however, if the market price is deemed to be a result of an inactive market, other measures of fair value may be used. Several of the long-term investments held by us are accounted for under the equity method or cost method. Any significant decline in the operations of an equity method or cost method investee could affect the value of the long-term investment and an impairment charge may occur. In 2007, we recognized an impairment of NT$178.5 million on our investment in Taiwan Fixed Network Co., Ltd. We disposed of this investment in April 2007. In 2008, we recognized an impairment of NT$ 21.4 million (US$ 0.7 million) on our investment in ID Solutions, Inc.
Results of Operations
The following table sets forth, for the periods indicated, financial data from our consolidated statements of income, expressed as a percentage of net revenues.
| | | | |
| | | | | | | | | | |
| | | (percentage of net revenues) |
| ROC GAAP: | | | | | | | |
| Net revenues | | | 100.0 | % | | | 100.0 | % | | | 100.0 | % |
| Packaging | | | 76.5 | | | | 77.6 | | | | 77.7 | |
| Testing | | | 21.3 | | | | 19.8 | | | | 20.1 | |
| Others | | | 2.2 | | | | 2.6 | | | | 2.2 | |
| Cost of revenues | | | (71.3 | ) | | | (71.2 | ) | | | (76.1 | ) |
| Gross profit | | | 28.7 | | | | 28.8 | | | | 23.9 | |
| Operating expenses | | | (8.3 | ) | | | (9.7 | ) | | | (11.4 | ) |
| Income from operations | | | 20.4 | | | | 19.1 | | | | 12.5 | |
| Non-operating income (expense) | | | 1.8 | | | | (1.9 | ) | | | (2.5 | ) |
| Income before income tax | | | 22.2 | | | | 17.2 | | | | 10.0 | |
| Income tax expense | | | (2.1 | ) | | | (3.3 | ) | | | (2.4 | ) |
| Income before cumulative effect of change in accounting principle | | | 20.1 | | | | 13.9 | | | | 7.6 | |
| Cumulative effect of change in accounting principle | | | (0.4 | )(1) | | | — | | | | — | |
| Minority interest in net income of subsidiaries | | | (2.4 | ) | | | (1.8 | ) | | | (1.1 | ) |
| Net income of parent company’s shareholders | | | 17.3 | % | | | 12.1 | % | | | 6.5 | % |
| (1) | Represents the cumulative effect of our adoption of ROC SFAS No. 34 and ROC SFAS No. 36. See note 3 to our consolidated financial statements included in this annual report. |
The following table sets forth, for the periods indicated, the gross margins for our packaging and testing services and our total gross margin. Gross margin is calculated by dividing gross profits by net revenues.
| | | | |
| | | | | | | | | | |
| | | (percentage of net revenues) | |
| ROC GAAP: | | | | | | | | | |
| Gross margin | | | | | | | | | |
| Packaging | | | 25.1 | % | | | 26.2 | % | | | 20.0 | % |
| Testing | | | 40.7 | % | | | 38.0 | % | | | 34.0 | % |
| Overall | | | 28.7 | % | | | 28.8 | % | | | 23.9 | % |
The following table sets forth, for the periods indicated, a breakdown of our total cost of revenues and operating expenses, expressed as a percentage of net revenues.
| | | | |
| | | | | | | | | | |
| | | (percentage of net revenues) | |
| ROC GAAP: | | | | | | | | | |
| Cost of revenues | | | | | | | | | |
| Raw materials | | | 29.2 | % | | | 27.6 | % | | | 28.9 | % |
| Labor | | | 14.2 | | | | 14.5 | | | | 15.4 | |
| Depreciation and amortization | | | 13.3 | | | | 15.1 | | | | 16.7 | |
| Others | | | 14.6 | | | | 14.0 | | | | 15.1 | |
| Total cost of revenues | | | 71.3 | % | | | 71.2 | % | | | 76.1 | % |
| | | | |
| | | | | | | | | | |
| | | (percentage of net revenues) | |
| Operating expenses | | | | | | | | | | | | |
| Selling | | | 1.2 | % | | | 1.0 | % | | | 1.2 | % |
| General and administrative | | | 4.5 | | | | 5.5 | | | | 6.1 | |
| Research and development | | | 2.6 | | | | 3.2 | | | | 4.1 | |
| Total operating expenses | | | 8.3 | % | | | 9.7 | % | | | 11.4 | % |
Year Ended December 31, 2008 Compared to Year Ended December 31, 2007
Net Revenues. Net revenues decreased 6.7% to NT$94,430.9 million (US$2,882.5 million) in 2008 from NT$101,163.1 million in 2007, primarily due to a sharp decline in demand in the fourth quarter of 2008 as a result of the global economic crisis. Packaging revenues decreased 6.5% to NT$73,391.6 million (US$2,240.3 million) in 2008 from NT$78,516.3 million in 2007. Testing revenues decreased 4.9% to NT$19,021.4 million (US$580.6 million) in 2008 from NT$20,007.8 million in 2007. The decrease in packaging revenues was primarily due to a decrease in average selling prices for our packaging services and the appreciation of the NT dollar against the U.S. dollar. The decrease in testing revenues was primarily due to a decrease in average selling prices for our testing services and the appreciation of the NT dollar against the U.S. dollar, offset by an increase in testing volume. The decrease in average selling prices for our packaging and testing services was due to normal trends relating to the semiconductor industry. The increase in testing volume resulted primarily from the strong demand in the first three quarters of 2008 and newly-acquired subsidiaries that focus on providing testing services, offset by a significant decline in demand in the fourth quarter of 2008.
Gross Profit. Gross profit decreased 22.5% to NT$22,529.2 million (US$687.7 million) in 2008 from NT$29,088.4 million in 2007. Our gross profit as a percentage of net revenues, or gross margin, decreased to 23.9% in 2008 from 28.8% in 2007. Our gross margin for packaging decreased to 20.0% in 2008 from 26.2% in 2007. This decrease was primarily due to an increase in raw material costs, labor costs and depreciation expenses as a percentage of net packaging revenues. Our gross margin for testing decreased to 34.0% in 2008 from 38.0% in 2007. This decrease was primarily due to an increase in depreciation, utility expenses and labor costs as a percentage of net testing revenues. Raw material costs in 2008 were NT$27,275.6 million (US$832.6 million) compared to NT$27,913.1 million in 2007. As a percentage of net revenues, raw material costs increased to 28.9% in 2008 from 27.6% in 2007, primarily due to a change in our product mix toward packaging requiring more raw materials. Depreciation, amortization and rental expenses in 2008 was NT$16,370.6 million (US$499.7 million), compared to NT$16,358.7 million in 2007. As a percentage of net revenues, depreciation, amortization and rental expenses increased to 17.3% in 2008 from 16.1% in 2007. Labor cost in 2008 was NT$14,549.9 million (US$444.1 million) compared to NT$14,684.1 million in 2007. As a percentage of net revenues, labor cost increased to 15.4% in 2008 from 14.5% in 2007, primarily because of a change in an ROC accounting standard that requires us to record bonuses paid to employees, directors and supervisors as an expense rather than an appropriation of earnings. This increase in labor cost was partially offset by a decrease in our employee headcount.
Operating Income. Operating income decreased 38.9% to NT$11,799.5 million (US$360.2 million) in 2008 compared to NT$19,297.2 million in 2007. Operating expenses increased 9.6% to NT$10,729.7 million (US$327.5 million) in 2008 compared to NT$9,791.2 million in 2007. The increase in operating expenses was primarily due to an increase in research and development expense and, to a lesser extent, an increase in general and administrative expense and selling expense. General and administrative expense increased 3.3% to NT$5,694.2 million (US$173.8 million) in 2008 from NT$5,512.9 million in 2007. This increase was primarily the result of an increase in salaries and bonuses, which reflected the impact from a change in an ROC accounting standard that requires us to record bonuses paid to employees, directors and supervisors as an expense rather than an appropriation of earnings. General and administrative expense represented 6.1% of our net revenues in 2008 compared to 5.5 % in 2007. Research and development expense increased 18.0% to NT$3,876.8 million (US$118.3 million) in 2008 from NT$3,284.1 million in 2007. This increase was primarily due to increases in salaries and bonuses and depreciation expense. The increase in salaries and bonuses was due to the expanded scope of our research and development efforts and a change in an ROC accounting standard that requires us to record bonuses paid to employees, directors and
supervisors as an expense rather than an appropriation of earnings. The increase in depreciation expense was due to the purchase of new equipment and as a result of the expanded scope of our research and development efforts. Research and development expense accounted for 4.1% of our net revenues in 2008 compared to 3.2% in 2007. Selling expense increased 16.5% to NT$1,158.6 million (US$35.4 million) in 2008 from NT$994.2 million in 2007. This increase was primarily due to the rearrangement of the sales department’s functions. Selling expense as a percentage of net revenues increased to 1.2% in 2008 from 1.0% in 2007. Our operating income as a percentage of net revenues, or operating margin, decreased to 12.5% in 2008 from 19.1% in 2007, primarily as a result of an increase in operating expenses and a decrease in our net revenues.
Non-Operating Income (Expense). We incurred a net non-operating expense of NT$2,323.7 million (US$71.0 million) in 2008 compared to a net non-operating expense of NT$1,945.3 million in 2007. This overall increase was primarily the result of an increase in loss on the valuation of financial assets and liabilities offset by a foreign exchange gain, a decrease on the income earned from equity method investments and an increase in interest expense, partially offset by a decrease in impairment loss. In 2008, we recorded net loss on the valuation of financial assets and liabilities and foreign exchange of NT$163.3 million (US$5.0 million) in 2008 compared to a net gain of NT$580.9 million in 2007 primarily due to a decline in the market value of marketable finance instruments. We recognized income from equity method investments of NT$77.5 million (US$ 2.4 million) in 2008 compared to NT$345.7 million in 2007. The decrease was due to the weakened operating performance of such equity method investments. We recognized net interest expense of NT$ 1,486.5 million (US$45.4 million) in 2008 compared to NT$1,225.9 million, primarily due to additional loans we obtained in connection with the privatization of ASE Test. We recognized impairment losses of NT$293.3 million (US$9.0 million) compared to NT$994.7 million in 2007. The impairment of our flip-chip substrate production line in 2007 was primarily the result of idle capacity caused by lack of demand for certain applications.
Net Income. Net income decreased 49.4% to NT$6,160.1 million (US$188.0 million) in 2008 from NT$12,165.3 million in 2007. Our net income per ADS decreased to NT$5.6 (US$0.2) in 2008 compared to a net income per ADS of NT$10.9 in 2007 (retroactively adjusted to account for stock dividends issued in 2008). Our income tax expense decreased 32.4% to NT$2,268.3 million (US$69.2 million) in 2008 from NT$3,357.4 million in 2007, primarily due to a decrease in our pre-tax income.
Year Ended December 31, 2007 Compared to Year Ended December 31, 2006
Net Revenues. Net revenues increased 0.7% to NT$101,163.1 million in 2007 from NT$100,423.6 million in 2006. Packaging revenues increased 2.2% to NT$78,516.3 million in 2007 from NT$76,820.5 million in 2006. Testing revenues decreased 6.6% to NT$20,007.8 million in 2007 from NT$21,429.6 million in 2006. The increase in packaging revenues was primarily due to an increase in packaging volume. The decrease in testing revenues was primarily due to a decrease in testing volume. The increase in packaging volume resulted primarily from increased capacity as a result of new operations in the PRC acquired in 2007 and the commencement of our operations for the packaging of memory semiconductors in December 2006. The increase in packaging volume in 2007 is also attributable to the trend of increasing outsourcing of the packaging of semiconductor devices. The decrease in testing volume resulted primarily from the reduction of our customer base in order to allow us to focus on higher-margin customers.
Gross Profit. Gross profit increased 1.1% to NT$29,088.4 million in 2007 from NT$28,780.3 million in 2006. Our gross profit as a percentage of net revenues, or gross margin, remained largely unchanged in 2007 at 28.8%, versus 28.7% in 2006. Our gross margin for packaging increased to 26.2% in 2007 from 25.1% in 2006. This increase was primarily due to a decrease in raw material costs as a percentage of net packaging revenues. Our gross margin for testing decreased to 38.0% in 2007 from 40.7% in 2006. This decrease was primarily due to an increase in depreciation, partially offset by a decrease in rental expense, each as a percentage of net testing revenues. Raw material costs in 2007 were NT$27,913.1 million, compared to NT$29,296.2 million in 2006. As a percentage of net revenues, raw material costs decreased to 27.6% in 2007 from 29.2% in 2006, primarily because of a change in our product mix toward packages requiring less expensive raw materials. Depreciation, amortization and rental expenses in 2007 was NT$16,358.7 million, compared to NT$15,096.1 million in 2006. As a percentage of net revenues, depreciation, amortization and rental expenses increased to 16.1% in 2007 from 15.0% in 2006.
Operating Income. Operating income decreased 5.6% to NT$19,297.2 million in 2007 compared to NT$20,446.4 million in 2006. Operating expenses increased 17.5% to NT$9,791.2 million in 2007 compared to NT$8,333.9 million in 2006. The increase in operating expenses was primarily due to increases in general and administrative expense and research and development expense, partially offset by a decrease in selling expense. General and administrative expense increased 23.2% to NT$5,512.9 million in 2007 from NT$4,474.1 million in 2006. This increase was primarily the result of an increase in salaries and bonuses expense, primarily as a result of bonuses paid by ASE Test Taiwan under ROC earnings distribution requirements, and, to a lesser extent, an increase in professional fees and other expenses in connection with the privatization of ASE Test. General and administrative expense represented 5.5% of our net revenues in 2007 compared to 4.5% in 2006. Research and development expense increased 24.8% to NT$3,284.1 million in 2007 from NT$2,632.0 million in 2006. This increase was primarily due to increases in salaries and bonuses expense, depreciation and amortization and the cost of factory supplies, each in connection with our new operations in the PRC acquired in 2007. The research and development expenses of our PRC operations were made with a view towards qualifying for certain PRC tax incentives. Research and development expense accounted for 3.2% of our net revenues in 2007 compared to 2.6% in 2006. Selling expense decreased 19.0% to NT$994.2 million in 2007 from NT$1,227.8 million in 2006. This decrease was primarily due to a decrease in commission and sales fees as a result of our moving certain sales functions that were previously handled by a third-party sales agent in-house in 2007. Selling expense as a percentage of net revenues decreased to 1.0% in 2007 from 1.2% in 2006. Our operating income as a percentage of net revenues, or operating margin, decreased to 19.1% in 2007 from 20.4% in 2006, primarily as a result of an increase in operating expenses.
Non-Operating Income (Expense). We incurred a net non-operating expense of NT$1,945.3 million in 2007 compared to a net non-operating income of NT$1,805.0 million in 2006. This overall decrease was primarily a result of gain on insurance settlement and impairment recovery in 2006 and, to a lesser extent, impairment losses in 2007, partially offset by a decrease in 2007 in loss on inventory valuation and obsolescence and increases in 2007 in net gains on the valuation of financial assets and liabilities and net foreign exchange gains. In 2006, we recognized NT$4,574.5 million for gain on insurance settlement and impairment recovery in connection with the fire at our facilities in Chung Li, Taiwan in May 2005. For more information on the Chung Li fire, see note 30 to our consolidated financial statements included in this annual report. In 2007, we recognized impairment losses of NT$994.7 million, primarily in connection with our flip-chip substrate production line, whereas in 2006 we did not recognize any impairment loss. The impairment of our flip-chip substrate production line in 2007 was primarily the result of idle capacity caused by lack of demand for certain applications. We recorded a loss on inventory valuation and obsolescence of NT$634.4 million in 2007 compared to a loss on inventory valuation and obsolescence of NT$1,143.9 million in 2006, which resulted primarily from changes in our customer base in connection with our strategy of focusing on higher-margin customers. We recorded net gains on the valuation of financial assets and liabilities and foreign exchange of NT$580.9 million in 2007 compared to net loss of NT$167.8 million in 2006. The net gains in 2007 were primarily due to the appreciation of the RMB against the U.S. dollar and the fact that U.S. dollar liabilities exceed U.S. dollar assets for our operations in the PRC.
Net Income. Net income decreased 30.1% to NT$12,165.3 million in 2007 from NT$17,416.2 million in 2006. Our net income per ADS decreased to NT$10.9 in 2007 compared to a net income per ADS of NT$15.7 in 2006 (retroactively adjusted to account for stock dividends issued in 2007 and 2008). Our income tax expense increased 61.0% to NT$3,357.4 million in 2007 from NT$2,084.8 million in 2006, primarily due to the use of tax credits, a tax on undistributed earnings of our domestic subsidiaries and a withholding tax on dividends imposed on some of our foreign subsidiaries.
Quarterly Net Revenues, Gross Profit and Gross Margin
The following table sets forth our unaudited consolidated net revenues, gross profit and gross margin for the quarterly periods indicated. The unaudited quarterly results reflect all adjustments, consisting of normal recurring adjustments, that, in the opinion of management, are necessary for a fair presentation of the amounts, on a basis consistent with the audited consolidated financial statements included elsewhere in this annual report. You should read the following table in conjunction with the audited consolidated financial statements and related notes included elsewhere in this annual report. Our net revenues, gross profit and gross margin for any quarter are not necessarily indicative of the results for any future period. Our quarterly net revenues, gross profit and gross margin may fluctuate significantly.
| | | | |
| | | | | | | | | | | | | | | | | | | | | | | | | |
| | | NT$ | | | NT$ | | | NT$ | | | NT$ | | | NT$ | | | NT$ | | | NT$ | | | NT$ | |
| | | (in millions) | |
| Consolidated Net Revenues | | | | | | | | | | | | | | | | | | | | | | | | |
| Packaging | | | 18,029.5 | | | | 21,643.6 | | | | 22,560.7 | | | | 19,227.1 | | | | 20,033.3 | | | | 20,126.6 | | | | 14,004.6 | | | | 10,208.0 | |
| Testing | | | 4,724.5 | | | | 5,282.4 | | | | 5,676.9 | | | | 4,894.5 | | | | 5,101.6 | | | | 5,194.9 | | | | 3,830.4 | | | | 2,767.9 | |
| Others | | | 607.9 | | | | 806.9 | | | | 738.0 | | | | 573.1 | | | | 474.8 | | | | 493.6 | | | | 476.4 | | | | 421.1 | |
| Total | | | 23,361.9 | | | | 27,732.9 | | | | 28,975.6 | | | | 24,694.7 | | | | 25,609.7 | | | | 25,815.1 | | | | 18,311.4 | | | | 13,397.0 | |
| Consolidated Gross Profit (Loss) | | | | | | | | | | | | | | | | | | | | | | | | | | | | | | | | |
| Packaging | | | 4,518.6 | | | | 5,918.7 | | | | 6,562.0 | | | | 4,051.0 | | | | 4,224.5 | | | | 4,284.4 | | | | 2,140.2 | | | | 542.9 | |
| Testing | | | 1,632.5 | | | | 2,177.0 | | | | 2,547.1 | | | | 1,810.7 | | | | 1,937.5 | | | | 1,888.7 | | | | 830.5 | | | | 133.9 | |
| Others | | | 252.3 | | | | 334.2 | | | | 149.7 | | | | 325.9 | | | | 350.2 | | | | 456.5 | | | | 229.1 | | | | (18.6 | ) |
| Total | | | 6,403.4 | | | | 8,429.9 | | | | 9,258.8 | | | | 6,187.6 | | | | 6,512.2 | | | | 6,629.6 | | | | 3,199.8 | | | | 658.2 | |
| Consolidated Gross Margin | | | | | | | | | | | | | | | | | | | | | | | | | | | | | | | | |
| Packaging | | | 25.1 | % | | | 27.3 | % | | | 29.1 | % | | | 21.1 | % | | | 21.1 | % | | | 21.3 | % | | | 15.3 | % | | | 5.3 | % |
| Testing | | | 34.6 | % | | | 41.2 | % | | | 44.9 | % | | | 37.0 | % | | | 38.0 | % | | | 36.4 | % | | | 21.7 | % | | | 4.8 | % |
| Overall | | | 27.4 | % | | | 30.4 | % | | | 32.0 | % | | | 25.1 | % | | | 25.4 | % | | | 25.7 | % | | | 17.5 | % | | | 4.9 | % |
Our results of operations are affected by seasonality. Our first quarter net revenues have historically decreased over the preceding fourth quarter, primarily due to the combined effects of holidays in the United States, Taiwan and elsewhere in Asia. Moreover, the increase or decrease in net revenues of a particular quarter as compared with the immediately preceding quarter varies significantly. See “Item 3. Key Information—Risk Factors—Risks Relating to Our Business—Our operating results are subject to significant fluctuations, which could adversely affect the market value of your investment.”
Exchange Rate Fluctuations
For quantitative and qualitative disclosure of our exposure to foreign currency exchange rate risk, see “Item 11. Quantitative and Qualitative Disclosures about Market Risk—Market Risk—Foreign Currency Exchange Rate Risk.”
Taxation
The regular corporate income tax rate in the ROC applicable to us is 25%. Effective January 1, 2010, this rate will change to 20%. Under the ROC Statute of Upgrading Industries, which gives certain preferential tax treatment to companies that qualify as operating in a “newly-emerging important and strategic industry” or “manufacturing industry”, we may apply for tax holidays covering the portion of our income attributable to eligible machinery and equipment upon receipt of a cash infusion from our shareholders, including through rights offerings, if the proceeds of which are used to purchase eligible machinery and equipment. We may also apply for this tax holiday after the capitalization of retained earnings through the issuance of stock dividends. See note 24 to our consolidated financial statements included in this annual report. As of May 31, 2009, we had six five-year tax exemptions on income derived from a portion of our operations in Kaohsiung, Taiwan. Two such exemptions will expire on September 30, 2009 and December 31, 2013, respectively. We are in the process of applying for the use of the remaining four exemptions in connection with our operations in Kaohsiung, Taiwan, following the completion of related capacity expansions. As of May 31, 2009, we had also received two five-year tax exemptions for two cash injections from our shareholders in connection with our operations in Chung Li, Taiwan. Both exemptions will expire at the end of 2011.
ASE Test Taiwan has one five-year tax exemption that will expire at the end of 2010 on income derived from a portion of its testing operations. ASE Test Taiwan is also in the process of applying for two additional five-year exemptions following the completion of related capacity expansions.
PowerASE has one five-year tax exemption that will expire on September 30, 2012 on income derived from a portion of its testing and packaging operations. It also plans to apply for an additional five-year tax exemption following the completion of related capacity expansions.
Under the ROC Statute for Upgrading Industries, we are also entitled to tax credits for the purchase of qualifying manufacturing equipment. The tax credits were set at 7% for 2006, 2007 and 2008 and are expected to remain at 7% in 2009. We are also entitled to tax credits set at 30% of the amount spent on qualifying research and development expenses and employee training expenses. These tax credits generally expire five years following their respective grants and are available to reduce 50% of our income taxes payable in the first four years and 100% of such taxes payable in the fifth year, subject to the application of the Alternative Minimum Tax Act, or AMT Act, discussed below.
In addition, since we have facilities located in special export zones such as the Nantze Export Processing Zone in Taiwan, we enjoy exemptions from various import duties, commodity taxes and sales taxes on imported machinery, equipment, raw materials and components which are directly used for manufacturing finished goods. Finished goods produced by companies located in these zones and exported or sold to others within the zones are exempt from otherwise applicable commodity or business taxes in Taiwan.
Under the ROC Income Tax Act, all earnings generated in a year which are not distributed to shareholders as dividends in the following year will be assessed a 10% undistributed earnings tax. As a result, if we do not distribute all of our annual earnings as either cash or stock dividends in the following year, these undistributed earnings will be subject to the 10% undistributed earnings tax.
The ROC government enacted the AMT Act, which became effective on January 1, 2006. The alternative minimum tax, or AMT, imposed under the AMT Act is a supplemental tax of 10% of taxable income as defined under the AMT Act, which includes most income that is exempt from income tax under various legislation such as tax holidays. If the amount of income tax determined by the AMT Act falls below the amount of the AMT, any difference should be payable. The AMT rate for business entities is 10%. However, the AMT Act grandfathered certain tax exemptions granted prior to the enactment of the AMT Act.
In 2006, our effective income tax rate increased to 9% primarily due to an increase in taxable income and the AMT Act, which became effective in that year. In 2007, our effective income tax rate increased to 19% primarily due to the use of tax credits, undistributed earnings tax on our domestic subsidiaries and withholding tax on dividends imposed on some of our foreign subsidiaries. In 2008, our effective income tax rate increased to 24% due to an increase in the valuation allowance against the deferred tax assets and a decrease in tax-exempt income. We believe that our future estimated taxable income will be sufficient to realize the current and long-term portion of our net deferred tax assets recorded as of December 31, 2008.
Inflation
We do not believe that inflation in Taiwan or elsewhere has had a material impact on our results of operations.
U.S. GAAP Reconciliation
Our consolidated financial statements are prepared in accordance with ROC GAAP, which differ in certain material respects from U.S. GAAP. The following table sets forth a comparison of our net income and shareholders’ equity in accordance with ROC GAAP and U.S. GAAP as of and for the periods indicated.
| | | As of and For the Year Ended December 31, | |
| | | | | | | | | | |
| | | NT$ | | | NT$ | | | NT$ | | | US$ | |
| | | (in millions) | |
| Net income: | | | | | | | | | |
| ROC GAAP | | | 17,416.2 | | | | 12,165.3 | | | | 6,160.1 | | | | 188.0 | |
| U.S. GAAP | | | 14,122.7 | | | | 9,931.1 | | | | 5,492.1 | | | | 167.7 | |
| Total shareholders’ equity: | | | | | | | | | | | | | | | | |
| ROC GAAP | | | 77,126.8 | | | | 89,739.9 | | | | 71,960.8 | | | | 2,196.6 | |
| U.S. GAAP | | | 60,584.1 | | | | 70,101.4 | | | | 65,303.0 | | | | 1,993.4 | |
Note 32 to our consolidated financial statements included in this annual report provides a description of the significant differences between ROC GAAP and U.S. GAAP as they relate to us and a reconciliation of net income and shareholders’ equity. Significant differences between ROC GAAP and U.S. GAAP, include impairment loss reversal, undistributed earnings tax and compensation expense pertaining to bonuses to employees, directors and supervisors.
Recent U.S. GAAP Accounting Pronouncements
On January 1, 2008, we adopted U.S. SFAS No. 157, “Fair Value Measurements”, or U.S. SFAS No. 157, which defines fair value, establishes a framework for measuring fair value and expands disclosures about fair value measurements. U.S. SFAS No. 157 does not require any new fair value measurements, but provides guidance on how to measure fair value by providing a fair value hierarchy used to classify the source of the information. The adoption of U.S. SFAS No. 157 did not have a material impact on our consolidated financial position and results of operations.
In February 2008, the FASB issued FASB Staff Position 157-2, “Effective Date of FASB Statement No. 157”, or FSP 157-2, which delays the effective date of U.S. SFAS No. 157 to January 1, 2009 for all non-financial assets and non-financial liabilities, except for items that are recognized or disclosed at fair value in the financial statements on a recurring basis (at least annually). We believe that the adoption of the delayed items of U.S. SFAS No. 157 will not have a material impact on our consolidated financial position or results of operations.
In October 2008, the FASB issued FSP 157-3, “Determining the Fair Value of a Financial Asset When the Market for That Asset Is Not Active”, or FSP 157-3, which clarifies the application of U.S. SFAS No. 157 in a market that is not active and provides an example to illustrate key considerations in determining the fair value of a financial asset when the market for that financial asset is not active. We believe the adoption of FSP 157-3 will not have a material impact on our consolidated financial position and results of operations.
In April 2009, the FASB issued FSP 157-4, “Determining Fair Value When the Volume and Level of Activity for the Asset or Liability Have Significantly Decreased and Identifying Transactions That Are Not Orderly”, or FSP 157- 4, which clarifies the application of U.S. SFAS No. 157 when there is no active market or where the price inputs being used represent distressed sales. Additional guidance is provided regarding estimating the fair value of an asset or liability (financial and nonfinancial) when the volume and level of activity for the asset or liability have significantly decreased and identifying transactions that are not orderly. FSP 157-4 will be effective for interim and annual periods ending after June 15, 2009. We believe the adoption in fiscal 2009 will not have a material impact on our consolidated financial position and results of operations.
In February 2007, the FASB issued U.S. SFAS No. 159, “The Fair Value Option for Financial Assets and Financial Liabilities- Including an Amendment of FASB Statement No.115”, or U.S. SFAS No. 159. This statement permits companies to choose to measure eligible items at fair value at specified election dates and report unrealized gains and losses in earnings at each subsequent reporting date on items for which the fair value option has been elected. The objective of this statement is to improve financial reporting by providing companies with the opportunity to mitigate volatility in reported earnings caused by measuring related assets and liabilities differently without having to apply complex hedge accounting provisions. We may decide whether to elect the fair value option for each eligible item on its election date, subject to certain requirements described in the statement. This statement was effective beginning January 1, 2008. We did not elect the fair value option for any eligible financial asset or liability.
In December 2007, the FASB issued U.S. SFAS No. 141R, “Business Combination” (“U.S. SFAS No. 141R”) and U.S. SFAS No. 160, “Non-controlling Interests in Consolidated Financial Statements- An Amendment of ARB No. 51”, or U.S. SFAS No. 160. U.S. SFAS No. 141R requires most of the assets acquired and liabilities assumed in the business combination to be measured at fair value as of the acquisition date. In addition, the net assets of non-controlling interests’ share of the acquired subsidiaries should be recognized at fair value. U.S. SFAS No. 160 requires us to include non-controlling interests as a separate component of shareholders’ equity, instead of liability or temporary equity. U.S. SFAS No. 141R was effective for business combinations consummated on or after January 1, 2009 and U.S. SFAS No. 160 was effective beginning January 1, 2009. The adoption of U.S. SFAS No.
141R will change our accounting treatment for business combinations on a prospective basis. We believe the adoption of U.S. SFAS No. 160 has no material impact on our consolidated financial position or results of operations.
In March 2008, the FASB issued SFAS No. 161, “Disclosures about Derivative Instruments and Hedging Activities - an Amendment of FASB Statement No. 133”, or U.S. SFAS No. 161, which requires additional disclosures about the objectives of derivative instruments and hedging activities, the method of accounting for such instruments under U.S. SFAS No. 133 and its related interpretations, and a tabular disclosure of the effects of such instruments and related hedged items on our financial position, financial performance, and cash flows. U.S. SFAS No. 161 became effective on January 1, 2009. We believe the adoption of U.S. SFAS No. 161 will not have a material impact on our consolidated financial position or results of operations.
We have historically been able to satisfy our working capital needs from our cash flow from operations. We have historically funded our capacity expansion from internally generated cash and, to the extent necessary, the issuance of equity securities and long-term borrowings. If adequate funds are not available on satisfactory terms, we may be forced to curtail our expansion plans. Moreover, our ability to meet our working capital needs from cash flow from operations will be affected by the demand for our packaging and testing services, which in turn may be affected by several factors. Many of these factors are outside of our control, such as economic downturns and declines in the prices of our services caused by a downturn in the semiconductor industry. See “Item 3. Key Information—Risk Factors—Risks Relating to Our Business—Our operating results are subject to significant fluctuations, which could adversely affect the market value of your investment.” The average selling prices of our packaging and testing services are likely to be subject to further downward pressure in the future. To the extent we do not generate sufficient cash flow from our operations to meet our cash requirements, we will have to rely on external financing.
Net cash provided by operating activities amounted to NT$30,728.8 million (US$938.0 million) in 2008, primarily as a result of adjusting for non-cash depreciation and amortization of NT$17,244.9 million (US$526.4 million). Net cash provided by operating activities amounted to NT$28,310.6 million in 2007, primarily as a result of adjusting for non-cash depreciation and amortization of NT$16,626.2 million. Net cash provided by operating activities amounted to NT$37,310.8 million in 2006, partially as a result of adjusting for non-cash depreciation and amortization, and, to a lesser extent, for gain on insurance settlement and impairment recovery of NT$9,913.8 million. The increase in net cash provided by operating activities in 2008 compared to 2007 was primarily due to a net decrease in accounts receivable of NT$12,915.1 million (US$394.2 million) and a decrease in financial assets for trading of NT$1,108.6 million (US$33.8 million), partially offset by a decrease in net income to NT$6,160.1 million (US$188.0 million) in 2008 from NT$12,165.3 million in 2007 and a net decrease in accounts payable of NT$5,006.5 million (US$152.8 million). The decrease in net cash provided by operating activities in 2007 compared to 2006 was primarily due to a decrease in net income to NT$12,165.3 million in 2007 from NT$17,416.2 million in 2006 and a net increase in accounts receivable of NT$9,634.0 million, partially offset by non-cash gain on insurance settlement and impairment recovery of NT$4,574.5 million in 2006 and a net increase in accounts payable of NT$4,341.3 million.
Net cash used in investing activities amounted to NT$36,359.2 million (US$1,109.9 million) in 2008, primarily due to the acquisition of our subsidiaries for NT$ 26,490.5 million (US$ 808.6 million), the acquisition of property, plant and equipment, such as machinery and equipment for our packaging, testing and interconnect materials operations, of NT$ 18,583.3 million (US$567.3 million), offset by net proceeds from sales of available-for-sale financial assets of NT$9,021.6 million (US$275.4 million). Net cash used in investing activities amounted to NT$18,108.4 million in 2007, primarily due to the acquisition of property, plant and equipment, such as machinery and equipment for our packaging, testing and interconnect materials operations, of NT$17,190.4 million. Net cash used in investing activities amounted to NT$22,104.5 million in 2006, primarily due to the acquisition of property, plant and equipment, such as machinery and equipment for our packaging, testing and interconnect materials operations, of NT$17,764.2 million and, to a lesser extent, the net increase acquisition of available-for-sale financial assets of NT$9,134.1 million, partially offset by proceeds from insurance claims of NT$5,768.0 million.
Net cash provided by financing activities in 2008 amounted to NT$13,862.4 million (US$423.2 million). This amount reflected primarily net proceeds from long-term debts and capital lease obligations of NT$30,162.4 million (US$920.7 million), which was offset by the issuance of cash dividends of NT$ 8,826.6 million (US$269.4 million) and repayment of bonds payable of NT$5,550.0 million (US$169.4 million). Net cash used in financing activities in 2007 amounted to NT$8,492.7 million. This amount reflected primarily the issuance of cash dividends of NT$6,669.1 million and a decrease in long-term debts of NT$4,639.5 million, which was partially offset by an increase in short-term borrowings of NT$3,784.1 million. Net cash used in financing activities in 2006 amounted to NT$12,581.9 million. This amount reflected primarily a decrease in long-term debts of NT$13,745.7 million.
As of December 31, 2008, our primary source of liquidity was NT$26,138.9 million (US$797.9 million) of cash and NT$1,267.3 million (US$38.7 million) of financial assets—current. Our financial assets—current primarily consisted of quoted stocks and bond investments. As of December 31, 2008, we had total unused short-term credit lines of NT$51,041.4 million (US$1,558.0 million), and total unused long-term credit lines of NT$18,245.9 million (US$557.0 million). As of December 31, 2008, we had working capital of NT$21,096.2 million (US$644.0 million).
As of December 31, 2008, we had total borrowings of NT$62,703.7 million (US$1,914.0 million), NT$8,779.3 million (US$268.0 million) of which were short-term borrowings and NT$53,924.4 million (US$1,646.0 million) of which were long-term borrowings. The interest rate for borrowings under our short-term borrowings ranged from 1.50% to 8.59% per year as of December 31, 2008. Our short-term loans are primarily revolving facilities with a term of one year, each of which may be extended on an annual basis with lender consent. Our long-term borrowings consist primarily of bank loans, bonds payable and capital lease obligations. As of December 31, 2008, we had outstanding long-term borrowings, less current portion, of NT$51,230.5 million (US$1,563.8 million). As of December 31, 2008, the current portion of our long-term borrowings was NT$2,693.9 million (US$82.2 million). Our long-term borrowings carried variable interest rates which ranged between 1.35% and 7.56% per year as of December 31, 2008.
We have pledged a portion of our assets, with a carrying value of NT$4,355.4 million (US$132.9 million) as of December 31, 2008, to secure our obligations under our short-term and long-term facilities.
In March 2008, we entered into a syndicated loan agreement with a banking syndicate led by Citibank, N.A., Taipei Branch for a NT$24,750.0 million term loan facility, which we and the lenders subsequently agreed to reduce to NT$17,500.0 million to afford us more flexibility to request additional loans in the future. As of June 3, 2008, we had drawn down NT$17,500.0 million, the full amount of the facility, to finance a portion of the consideration for our acquisition, by way of a scheme of arrangement under Singapore law, of all the outstanding ordinary shares of ASE Test that we did not already directly or indirectly own. In May 2008, we entered into an additional syndicated loan agreement with a banking syndicate led by Citibank, N.A., Taipei Branch for a US$200.0 million term loan facility, also for the purposes of financing our acquisition of ASE Test’s outstanding ordinary shares. As of June 4, 2008, we had drawn down the entire balance of this facility.
In March 2005, ASE Shanghai entered into a US$119.0 million five-year syndicated credit facility for which the Hongkong and Shanghai Banking Corporation Limited, Shanghai Branch acted as arranger and agent. We agreed to act as guarantor for ASE Shanghai. We used US$119 million to refinance exiting credit facilities to fund our capital expenditure requirements. The facility bears interest at LIBOR plus 0.75% per annum.
In January 2004, we issued eleven series of secured non-convertible bonds in the aggregate principal amount of NT$2.75 billion. These bonds bear semi-annual interest at floating LIBOR-based rates. We repaid half of the aggregate principal amount of the bonds in January 2008 and the remaining half in January 2009. Our payment obligations under the bonds were secured by guarantees provided by syndicate banks pursuant to a guarantee agreement entered into in December 2003, for which Chinatrust Commercial Bank, Ltd. and The Hongkong and Shanghai Banking Corporation Limited, Taipei Branch acted as arrangers. As of December 31, 2008, we had obtained new long term credit lines payable on a long-term basis to refinance the bonds.
Our long-term loans and facilities contain various financial and other covenants that could trigger a requirement for early payment. Among other things, these covenants require the maintenance of certain financial ratios, such as liquidity ratio, indebtedness ratio, interest coverage ratio and other technical requirements. In general, covenants in the agreements governing our existing debt, and debt we may incur in the future, may materially restrict our