EXHIBIT 99.1
Stock code:2311
| | Advanced Semiconductor Engineering,Inc. Prospectus |
(2016 Statement of Issuance of New Shares Through Capital Increase)
| I. | Name of Company: Advanced Semiconductor Engineering, Inc. |
| II. | Purpose for the publication of this prospectus: 2016 Statement of Issuance of New Shares Through Capital Increase |
| (I) | Source of new shares: Cash capital increase. |
| (II) | New share type: Registered as ordinary shares, each share has the face value of NT$10. |
| (III) | Number of new shares: 300,000,000 shares. |
| (IV) | Amount of shares issued: NT$3,000,000,000. |
| (V) | Issuance condition: |
1. This is an issuance of 300,000,000 new shares through cash capital increase, with a par value of NT$10 per share. The price of each new share is NT$34.3. The amount of funds that can be raised is estimated at NT$10,290,000,000.
2. Pursuant to the provisions provided by Article 267 of the Company Act, 10% of the newly issued shares; or 30,000,000 shares; are reserved for employee subscription. In compliant with Article 28-1 of the Securities Exchange Act, 10% of the newly issued shares; or 30,000,000 shares; will be publicly offered. The remaining 80% of the newly issued shares; or 240,000,000 shares; will be subscribed by the existing shareholders based on the shareholding percentages on the base date. Shareholders will independently combine fractional shares within five days starting from the ex-dividend date for subscription. Existing shareholder and employee who have waived their right to subscribe or who hold fractional shares failing to combine will authorize the Chairman to contact a designated party for subscription.
3. The new shares issued by this cash capital increase shall have the same rights and obligations as those of the ordinary shares originally issued.
| (VI) | Publication underwriting ratio: 10% of the newly issued shares, or 30,000,000 shares will be publicly underwritten. |
| (VII) | Underwriting and rationing method: Method of underwriting is underwriting on a commitment basis, and the shares will be publicly offered for public underwriting. |
| III. | Summary of the purpose for the fund application plan and the potential benefits that may be generated: Please read page 144 of this prospectus. |
| IV. | Costs associated to this issuance |
| (I) | Underwriting costs: NT$5,000,000. |
| (II) | Other expenses: Approx. NT$1,000,000, including accountant fees, attorney fees, and printing fees. |
| V. | The effectiveness of the securities cannot be used as proof for declarations or as propaganda to guarantee the value of the securities. |
| VI. | In the event of any false statement or non-disclosure in this Prospectus, the issuer, its representative or any other persons who sign or endorses its name on the Prospectus shall be held liable therefor. |
| VII. | Investors shall read the contents of this prospectus in detail from the information reporting website designated by the Financial Supervisory Commission (FSC) and pay attention to risk related matters for the company: Please read page 8 of this prospectus. |
| VIII. | The par value of ordinary shares of the Company is NT$10 per share. |
| IX. | The review website for this prospectus: Market Observation Post System:http://mops.twse.com.tw |
Company website:http://www.aseglobal.com
Compiled by Advanced Semiconductor Engineering, Inc.
| Printed on | February 2,2017 |
| I. | Source of paid-up capital before this publication |
| Unit: NT$;% |
| capital source | Amount | As a percentage of paid-in capital |
| Startup | 100,000,000 | 0.12% |
| Capital increase by cash | 3,416,902,520 | 4.30% |
| Capital increase by earnings | 57,709,883,680 | 72.59% |
| Capital increase by employee bonus | 2,831,488,480 | 3.56% |
| Capital increase by capital reserve | 10,998,134,680 | 13.83% |
| Ordinary share converted from foreign convertible corporate bonds | 640,492,830 | 0.81% |
| Ordinary share converted from employee stock option | 4,584,181,900 | 5.77% |
| Consolidated capital increase | 2,823,154,370 | 3.55% |
| Treasury shares canceled | (3,604,490,000) | (4.53)% |
| Paid-up capital (total) | 79,499,748,460 | 100.00% |
| II. | Distribution of the Prospectus |
| (I) | Display locations: The Prospectus shall be distributed to regulatory authorities according to regulations, and it shall be stored in the Company and the Company's shareholder service agency. |
| (II) | Distribution method: In accordance with Article 31 of the Securities and Exchange Act |
| (III) | Obtaining method: Please visit the aforementioned display locations or visit the Market Observation Post System to download the electronic file.(http://mops.twse.com.tw) |
| III. | Securities underwriter's name, address, website, and telephone |
| Name: | KGI Securities Co., Ltd. | Website: | www.kgieworld.com.tw |
| Address: | No. 700, Mingshui Rd, Zhongshan District, Taipei City | Telephone: | (02)2181-8888 |
| IV. | Name, address, website, and telephone of the corporate bond guarantee institution: Not applicable. |
| V. | Name, address, website, and telephone of the corporate bond consigned institution: Not applicable. |
| VI. | Name, address, website, and telephone of the stock or corporate bond authenticating institution:Not applicable. |
| VII. | Name, address, website, and telephone of the stock transfer handling institution: |
| Name: | President Securities Corp. Department of Stock Affairs | Website: | www.uni-psg.com |
| Address: | B1, No. 8 Dongxing Road, Songshan District, Taipei City | Telephone: | (02)2746-3797 |
| VIII. | Name, address, website, and telephone of the credit rating institution: Not applicable. |
| IX. | Name, address, website, and telephone of the corporate bond authenticating certified public accountant, attorney, and firm: Not applicable. |
| X. | Name, address, website, and telephone of the firm and certified public accountant who issued the financial report for the most recent year. |
| Account name: | CPAs Chen Zhen-li and Jiang Jia-lin | ||
| Name of CPA firm: | Deloitte Touche | Website: | www.deloitte.com.tw |
| Address: | 3F., No. 88, Chenggong 2nd Rd, Qianzhen District, Kaohsiung City | Telephone: | (07)530-1888 |
| XI. | Name, law firm name, address, website, and telephone of the review attorney |
| Name of lawyer: | Qiu Ya-Wen | |||
| Name of law firm: | Handsome Attorneys-at-Law | Website: | www.fsi-law.com | |
| Address: | 8F, No. 6, Songde Road, Xinyi District, Taipei City | Telephone: | (02)2345-0016 | |
| XII. | Name, job title, contact telephone, and Email address of the spokesperson as well as the deputy spokesperson |
| Spokesperson name: | Tien Wu | Deputy Spokesperson name: | Joseph Tung |
| Title: | Chief Operating Officer | Title: | Chief Financial Officer |
| Telephone: | (02)8780-5489 | Telephone: | (02)8780-5489 |
| Email: | ir@aseglobal.com | Email: | ir@aseglobal.com |
| XIII. | Company website: http://www.aseglobal.com |
Prospectus Summary of Advanced Semiconductor Engineering, Inc.
| Paid-up Capital: NT$79,499,748,460 | Company address: No.26, Jing 3rd Rd., Nantz Processing Export Zone, Kaohsiung City | Telephone: (07)361-7131 |
| Date of establishment March 23, 1984 | Website:www.aseglobal.com |
| Listing date: July 19, 1989 | Over the counter date: N/A | Public offering date: May 1988 | Stock management date: N/A |
| Responsible person: | Chairman, Jason C.S. Chang President, Richard H.P. Chang | Spokesperson: Deputy Spokesperson: | Tien Wu Joseph Tung | (Title: Chief Operating Officer) (Title: Chief Financial Officer)
|
| Stock transfer agency: | Telephone:(02)2746-3797 | Website:www.uni-psg.com |
| Stock Affairs Agent for Advanced Semiconductor Engineering, Inc. | Address: B1, No. 8 Dongxing Road, Songshan District, Taipei City |
| Stock underwriting agency: | Telephone:(02)2181-8888 | Website:www.kgieworld.com.tw |
| KGI Securities Co., Ltd. | Address: No. 700, Mingshui Rd, Zhongshan District, Taipei City |
| Certified public accountant for the most recent year: Chen Zhen-li and Jiang Jia-lin | Telephone:(07)530-1888 | Website:www.deloitte.com.tw |
| Name of law firm: Deloitte Touche | Address: 3F., No. 88, Chenggong 2nd Rd, Qianzhen District, Kaohsiung City |
| Review attorney: Qiu Ya-Wen | Telephone:(02)2345-0016 | Website:www.fsi-law.com |
| Name of law firm: Handsome Attorneys-at-Law | Address: 8F, No. 6, Songde Road, Xinyi District, Taipei City |
| Credit rating agency: N/A Telephone: N/A | Website: N/A | Address: N/A |
| The rating of the subject | Issuing company:- | Noþ; Yes □, Rating date: - | Rating level:- |
| This corporate bond issuance:- | Noþ; Yes □, Rating date:- | Rating level:- |
| Director election date: June 23, 2015; term of office: 3 years | Supervisor election date: N/A (Currently the Company has no audit committee) |
| Shareholding ratio by all directors: 18.04% (December 31, 2016) | Shareholding ratio by all supervisors: N/A |
| Director, supervisor, shareholders holding over 10% of shares; and other shareholding ratios: (December 31, 2016) |
| Title | Name | Percentage of shares | Remarks | Title | Name | Percentage of shares | Remarks |
| Chairman | Jason C.S. Chang | 16.71% | Representative, ASE Enterprises Ltd. | Director | Rutherford Chang | 0.02% | - |
| Vice Chairman | Richard H.P. Chang | 1.31% | - | Director | Chen Tien-chi | 16.71% | Representative, ASE Enterprises Ltd. |
| Director | Tien Wu | 16.71% | Representative, ASE Enterprises Ltd. | Independent Directors | You Sheng-Fu | - | - |
| Director | Joseph Tung | 16.71% | Representative, ASE Enterprises Ltd. | Independent Directors | Ta-lin Hsu | - | - |
| Director | Raymond Lo | 16.71% | Representative, ASE Enterprises Ltd. | Independent Directors | Mei-yue Ho | - | - |
| Director | Jeffery Chen | 16.71% | Representative, ASE Enterprises Ltd. | Major shareholders holding over 10% of shares | A.S.E. Enterprises Limited | 16.71% | - |
| Factory Address: Please refer to page 1 of the prospectus | Telephone: Please refer to page 1 of the prospectus
|
Main Products: Manufacture, assembly, reprocessing, testing and export of integrated circuits of various types Market structure: Domestic sales 11.52%, export sales 88.48% | Refer to page 77 of the prospectus |
| Risk items | Please read this prospectus. | Refer to page 8 of the prospectus |
| .Last (2015) year | Operating revenue: NT$283,302,536,000 Net income (loss) before tax: NT$25,288,253,000 (note) Earnings per share: NT$2.55 (note) | Refer to page 163 of the prospectus. |
| The type and amount of the securities issued during this fund raising | Please refer to the cover page of this prospectus |
| Condition of issuance | Please refer to the cover page of this prospectus. |
| Purpose of fund raising and overview of the expected production benefits | Please refer to page 144 of the prospectus. |
| Date of printing for this prospectus: February 2, 2017 | Purpose of printing: Statement of Issuance of New Shares Through Capital Increase. |
| Brief description of other important matters and the pages of this text referenced: Please refer to the table of contents of this prospectus |
Note: As of September 30, 2016, the Company has identified the investment cost and the difference in the net fair value of assets and liabilities that can be recognized by SPIL, and these amounts were retroactively adjusted in the 2015 financial statement. Pre-tax net profit was NT$25,006,896,000 and earnings per share was retroactively adjusted to NT$2.51.
| Prospectus Table of Contents | |||
| I. Company Overview | 1 | ||
| 1. | Company Profile | 1 | |
| (1) | Date of establishment: March 23, 1984 | 1 | |
| (2) | Addresses and telephone numbers of the headquarter, branch companies, and | ||
| factories | 1 | ||
| (3) | Company History | 1 | |
| 2. | Risk items | 9 | |
| (1) | Risk factors | 9 | |
| (2) | Litigation or non-litigation events | 15 | |
| (3) | Company directors, supervisors, managers, or major shareholders holding over | ||
| 10% of the company's shares have involved in financial turnover difficulties or | |||
| suffer credit losses within the last two years and as of the printing of this | |||
| prospectus; and the effects on the company's financial conditions must be | |||
| specified: None. | 16 | ||
| (4) | Other important issues: None. | 16 | |
| 3. | Company Organization | 17 | |
| (1) | Organization system | 17 | |
| (2) | Affiliation chart | 21 | |
| (3) | Background information of President, Vice Presidents, Assistant Vice | ||
| Presidents, and heads of various departments and branches | 28 | ||
| (4) | Directors and Supervisors | 33 | |
| (5) | Sponsor: Not applicable.. | 37 | |
| (6) | Remunerations to directors, supervisors, president, and vice presidents in the | ||
| most recent year | 38 | ||
| 4. | Capital and Shares | 44 | |
| (1) | Type of stock | 44 | |
| Note: The above table does not include the number of shares converted for | |||
| employee stock options from October to November, 2016. | 44 | ||
| (2) | Share capital formation process | 44 | |
| (3) | Recent equity ownership dispersion status | 49 | |
| (4) | Stock price, net worth, earnings, dividends and related information for the | ||
| previous two years | 53 | ||
| (5) | Dividend policy and implementation status | 53 | |
| (6) | Effect of the proposed stock dividends in the current year on company | ||
| operating performance and earnings per share: Not applicable. | 54 | ||
| (7) | Remuneration of employees, directors and supervisors | 54 | |
| (8) | Stock buyback | 55 | |
| 5. | Issuance of corporate bonds (including overseas corporate bonds) | 57 | |
| 6. | Issuance of preferred stocks: None. | 62 | |
| 7. | Issuance of global depositary receipts (GDR) | 62 | |
| 8. | Exercise of employee stock option plan (ESOP): | 63 | |
| 9. | Restricted stock awards: None. | 66 | |
| 10 | Acquisitions and mergers: None. | 66 | |
| 11. Any issue of new shares in connection with any acquisition of shares of another | |
| company, where still in process: None. | 66 |
| II. Business Overview | 67 |
| 1. Company profile | 67 |
| (I) Business Content | 67 |
| (II) Market, production and sales | 99 |
| (3) Number of employees during the past 2 years | 118 |
| (4) Spending on environmental protection | 118 |
| (5) Employees-employer relations | 141 |
| 2. Property, plants and equipment and other real estate: | 145 |
| (1) Self-owned assets: | 145 |
| (2) Rental properties: | 146 |
| (3) Each plant's current condition and facility productivity ratio in the most recent | |
| 2 fiscal years: | 150 |
| 3. Reinvestment business | 152 |
| (1) Overview of reinvestment business: | 152 |
| (B) Comprehensive shareholding ratio: | 162 |
| (3) The status of the subsidiaries who have held or disposed of shares of this | |
| company during the most recent 2 fiscal years and up to the prospectus' | |
| publishing date and the status of the shares pledged, and setting forth the | |
| origin of capital and other influences on the company's financial performance | |
| and financial condition. There was no major impact on the company's financial | |
| performance and financial status. | 164 |
| (4) Any occurrences of the situations of Article 185 of the Company Act, or | |
| transferring part of the business operation or results of the research and | |
| development to a subsidiary during the most recent 2 fiscal years and up to the | |
| prospectus' publishing date, the status of waiving subscription rights to the | |
| cash capital increase in the subsidiary company, the name of the subscribing | |
| counter party, and the relationship with the company, the directors, | |
| supervisors and shareholders who hold more than 10 percent of the | |
| outstanding shares, and the number of the subscribed shares shall be disclosed. | |
| None | 165 |
| 4. Important contracts | 165 |
| III. Issuance Plans and Implementation | 167 |
| 1. I. The items that shall be included in the analysis regarding the allocation plan for capital raised through the previous cash capital increase, issuance of new shares to carry out a merger or acquisition, or to accept transfer of shares of another company; or issuance of corporate bonds: | 167 |
| 3. Assignment of new shares issued by other companies: Not applicable. | 195 |
| Matters that should be reported for the current issuance of new shares in connection with | |
| acquisition or merger: Not applicable. | 195 |
| IV. Financial Summary | 196 |
| 1. Financial information for the most recent 5 fiscal years (note) | 196 |
| (1) Condensed balance sheet and consolidated profit and loss statement | 196 |
| Current assets | 198 |
| Fund and investment | 198 |
| (2) Changes which affect the above condensed financial statements' consistency | |
| such as accounting changes, merger of companies or cessation of business |
| units and their impact on the current year's financial reports: None | 203 |
| (3) Names of auditors and audit opinions of the most recent 5 fiscal years | 203 |
| (4) Financial analysis | 203 |
| (6) Description of material changes in accounts Compare the accounts of the | |
| balance sheet and income statement of the most recent two fiscal years. If the | |
| change in the amount is 10% or more and the amount is 1% of the total assets | |
| of the current fiscal year, the reasons for the change should be analyzed in | |
| details. | 210 |
| II. Items that should be included in the financial report | 212 |
| (1) The financial statements and CPA audit reports for the two preceding fiscal | |
| years as of the time when the issuer registered the offering and issuance of | |
| securities, and the financial report for the most recent quarter publicly | |
| announced and reported: | 212 |
| (2) The issuer's parent company financial reports for the two most recent fiscal | |
| years, audited and certified by a CPA: | 213 |
| (3) If there are CPA audited and certified, or reviewed financial reports and parent | |
| company financial reports for the most recent period during the time after the | |
| issuer has registered the offering and issuance of securities and up to the date | |
| of publication of the prospectus, disclose these reports: None. | 213 |
| III. The information that should be included in the financial summary and other important | |
| matters | 213 |
| (1) If the company and its affiliated enterprises have experienced any financial | |
| difficulties in the most recent two fiscal years, or in the current year up to the | |
| date of publication of the prospectus, indicate the impact on the company's | |
| financial position. None. | 213 |
| (2) The information shall be disclosed, in case of occurrence of the events under | |
| Article 185 of the Company Act in the most recent two years and up to the | |
| date of publication of the prospectus: None. | 213 |
| (3) Subsequent events: None | 213 |
| (4) Others: None | 213 |
| IV. Review and analysis of the company's financial condition and operating performance .. 213 | |
| (1) Financial status | 213 |
| (2) Financial Performance | 213 |
| (3) Cash flow | 214 |
| (4) Impact of major capital spending on financial position and business operation | |
| in the previous year | 215 |
| (5) Reinvestment policy in the most recent year, the main reason for profit or loss, | |
| improvement plan, and investment plan for the coming year: | 215 |
| (6) Other material issues: None. | 216 |
| V. Special Notes | 217 |
| 1. Implementation of internal control system | 217 |
| 2. Those who have retained an FSC-approved or -recognized credit rating institution to | |
| conduct a credit rating/evaluation shall disclose the credit rating/evaluation report | |
| issued by the credit rating institution: Not applicable | 217 |
| 3. Summary opinion from the securities underwriter's assessment: Please read Page 100 | |
| of this Prospectus. | 217 |
| 4. Attorney's legal opinion: Please read Page 101 of this Prospectus. | 217 |
| 5. Summary opinion stated in the case checklist schedule written by the issuer and | |
| reviewed by a CPA: Not applicable. | 217 |
| 6. The improvement status of the items notified to be corrected, if at the time the company registered (or applied for approval of) the previous offering and issuance of | |
| securities the FSC had notified it to make self-correction on certain items: None. | 217 |
| 7. The items notified to be further disclosed, if at the time the company registered the | |
| current offering and issuance of securities the FSC had notified it to make | |
| supplemental disclosure on certain items: Not applicable. | 217 |
| 8. The statement or promised items disclosed in the prospectus from the company's registration (application) for offering and issuance of securities for the first time, the preceding time, and within the most recent three fiscal years, and the current state of | |
| fulfillment of such: None. | 217 |
| 9. The major content of any dissenting opinion of any director or supervisor regarding any material resolution passed by the board of directors, where there is a record or written statement of such opinion, for the most recent fiscal year and up to the date | |
| of publication of the prospectus. None. | 217 |
| 10. Any legal sanctions against the company or its internal personnel, or any disciplinary action taken by the company against its own personnel for violation of internal controls, during the most recent fiscal year or during the current fiscal year up to the date of publication of the prospectus; and a description of the main shortcomings in the company's internal control system as well as an indication of measures for improvement: None | 217 |
| 11. The statement issued by the securities underwriter, the issuer, and the issuer's directors, supervisors, General Manager, financial or accounting officer, and the managerial officers involved in the current registration for public offering and | |
| issuance of securities, specifying that no underwriting related fees will be refunded | |
| or collected: Please refer to Appendix 7. | 217 |
| 12. For a case that involves the issuer conducting a cash capital increase or an offering of corporate bonds with equity characteristics and adopting book building and public underwriting, the statement issued by the securities underwriter and issuer, | |
| specifying that allocation to related parties and insiders is prohibited. Not applicable. . 217 | |
| 13. Where depending on the nature of its operations, the issuer has engaged experts with | |
| professional knowledge and vast experience in technology, operations and finance | |
| etc. to conduct analysis and give opinions on the issuer's existing operating status | |
| and future development after current issuance of securities, the assessment opinions | |
| of such experts shall be disclosed: Not applicable. | 218 |
| 14. Other necessary supplemental information: None. | 218 |
| 15. Matters relating to the state of its implementation of corporate governance that should | |
| be recorded by a company listed on the stock exchange or traded on an OTC market: . 218 | |
| VI. Important Resolutions, Articles of Incorporation and Relevant Laws and Regulations . 244 | |
| 1. Key resolution records and text of resolution on the current issue: | 244 |
Annexes:1. Capital increase price calculation
| 2. | The consolidated financial statements and CPA audit reports of 2014 |
| 3. | The consolidated financial statements and CPA audit reports of 2015 |
| 4. | The Q3 consolidated financial statements and CPA audit reports of 2016 |
| 5. | The individual financial statements and CPA audit reports of 2014 |
| 6. | The individual financial statements and CPA audit reports of 2015 |
| 7. | Statement for non-refund underwriting costs |
I. Company Overview
1. Company Profile
(1) Date of establishment: March 23, 1984
(2) Addresses and telephone numbers of the headquarter, branch companies, and factories
Headquarter
Address: No.26, Jing 3rd Rd., Nantz Processing Export Zone, Kaohsiung City
Telephone:(07)3617131
Fax:(07)3613094、3614546
Taipei Office
Address: Rm. 1901, 19F, No. 333, Section 1, Keelung Rd, Xinyi District, Taipei City
Telephone:(02)87805489、66365678
Fax:(02)27576121
Zhongli Branch
Address: No. 550, Section 1, Zhonghua Rd, Zhongli District, Taoyuan City
Telephone:(03)4527121
Fax:(03)4628658
Nantou Branch
Address: No. 135, Lane 351, Section 1, Taiping Rd, Caotun Township, Nantou County
Telephone:(049)2350876
Fax:(049)2315924
Kaohsiung Factory
Address: No.26, Jing 3rd Rd., Nantz Processing Export Zone, Kaohsiung City
Telephone:(07)3617131
Zhongli Factory
Address: No. 516, 550, Section 1, Zhonghua Rd, Fuhua Village, Zhongli District, Taoyuan City
Telephone:(03)4527121
Nantou Factory
Address: No. 135, Lane 351, Section 1, Taiping Rd, Caotun Township, Nantou County
Telephone:(049)2350876
(4) Company History
The Company was founded on the spirit of contributing to the country through industrial development, a belief embraced by Jason Chang and Richard Chang, who actively supported the government's high-tech development policy, used cash and specialized technologies to raise capitals. The Company primarily engages in the manufacturing, assembly, reprocessing, testing, and export of integrated circuit of various types. Time line of the Company:
March 1984 The Company was established.
July 1984 The Company's first factory was opened.
August 1984 Began exporting Plastic Dual In-Line Package (PDIP) to European countries, North America, and Japan.
February 1985 Began exporting Ceramic Dual In-Line Package (CDIP) to Japan, European countries, and North America.
October 1985 Began exporting high-quality Plastic Leaded Chip Carriers (PLCC) to the United States.
May 1987 Began exporting high-quality Pin Grid Array (PGA) and plastic Pin Grid
Array (PPGA) to European countries and North America.
May–July 1989 Approved by the Securities and Futures Commission (1989) Tai-Cai-Zheng-1 No. 24594 and Taiwan Securities Exchange (1989) Shang-Zi No. 4461 to meet the ownership diversity standard on May 25, 1989, and began trading on the Taiwan Stock Exchange on July 19, 1989.
March 1990 Entered the semiconductor test market by acquiring 99.9% of the shares of ASE Test Inc., equivalent to NT$105,006,183.
March 1991 Established ASE Malaysia to engage in manufacture, reprocessing, assembly, testing, and export of integrated circuits of various types. Established ASE Hong Kong to facilitate transfer and acceptance of overseas (Malaysia) production base orders and customer service.
August 1991 Began mass production of Plastic Enhanced Quad Flat Package (EQFP).
November 1991 The Company's product received the Award of Excellence for Quality from Motorola.
April 1992 Achieved ISO9002 quality certificate.
July 1995 Issued 8,600,000 units of DRs to Asian, American, and European countries. Each DR represents five common shares of the Company. In total, 43,000,000 shares were issued, par value of NT$10 per share and sold at US$15.25 per unit. The funds raised were equivalent to NT$3.39 billion.
June 1996 ASE Test Limited began trading on NASDAQ.
September 1997 Issued Euro Convertible Bonds to the value of US$200 million.
November 1997 Passed the Semiconductor Assembly Council (SAC) certification.
January 1998 ASE Test Limited (Singapore) issued 120,000,000 TDRs by using 1,500,000 ordinary shares, and began trading on Taiwan Stock Exchange.
March 1998 Awarded QS 9000 certification for quality management.
September 1998 Awarded ISO 14001 certification for environment quality management.
March 1999 ASE Test Limited (Singapore) issued TDRs for the second time through issuing of 2,500,000 ordinary shares and began trading on Taiwan Stock Exchange.
May 1989 ASE Test Limited (Singapore) acquired 70% of the shares of ISE LAB.
July 1999 Acquired Motorola's manufacturing facilities in Chungli, Taiwan and Paju, Korea. This acquisition promoted the long-term strategic alliance between ASE and Motorola, strengthened ASE's vertical integration, and increased product scope.
February–July 1999 Obtained operating rights and 20.67% of the shares of Universal Scientific Industrial Co., Ltd. (USI), to broaden ASE's scope of OEM, increase service items for customers, and expand customer group.
September 2000 To enhance the Company's competitiveness in the global semiconductor market and thereby strengthen its image and international visibility, the Company issued 20,000,000 ADRs on September 25 in U.S. time, each representing five ordinary shares of the Company. In total, 100,000,000 ordinary shares were issued, with par value of NT$10. The
issue price was US$7 per unit, and the funds raised were equivalent to NT$4.38 billion.
September 2002 Won the 10th Outstanding Award from the Industrial Technology Development Award of Ministry of Economic Affairs.
July 2003 Combined wholly owned subsidiaries ASE New Investment Co., Ltd. and ASE Investment Co., Ltd.
September 2003 Issued Euro Convertible Bonds to the value of US$200 million.
October 2003 The Company's Board of Directors resolved to combine subsidiaries ASE Co., Ltd. and ASE Technology Co., Ltd. The conversion ratio was set as one share of ASE Co., Ltd. for 0.85 share of ASE Technology Co., Ltd. and as one share of ASE Technology Co., Ltd. for 0.5 share of the Company. The Company anticipated to combine and convert 282,315,437 shares.
February 2004 Signed the agreement to purchase the shares of NEC and acquired NEC Electronics' IC packaging and test operations in Takahata, Japan.
July 2004 Established ASE (Kunshan) Inc., which was resolved in the meeting of the board in June 2004. The amount invested was US$12 million. This establishment was approved by the Investment Commission on July 23, 2004.
August 2004 The Company merged with subsidiaries ASE Semiconductor Co., Ltd. and ASE Technology Co., Ltd., with the Company being the surviving company, and a Zhongli Branch was established. The Company acquired the ASE Semiconductor Co., Ltd. (Shanghai), which was a company set up in China by Omniquest Industrial Limited, a company invested by ASE Semiconductor Co., Ltd. This acquisition was approved by the Investment Commission on August 10, 2004. Established ASE Electronics Inc. (Shanghai), which was resolved in the meeting of the board in July 2004. The amount invested was US$12 million. This establishment was approved by the Investment Commission on August 20, 2004.
November 2004 The Board of Directors resolved in September 2004 to increase the capital of ASE (Shanghai) Inc. by US$30 million, and this resolution was approved by the Investment Commission on November 25, 2004.
June 2005 The Board of Directors resolved in May 2005 to increase the capital of ASE (Shanghai) Inc. by US$30 million, and this resolution was approved by the Investment Commission on June 30, 2005.
October 2005 Won the 13th Outstanding Award from the Industrial Technology Development Award of Ministry of Economic Affairs.
November 2005 The Board of Directors resolved in August 2005 to increase the capital of ASE (Shanghai) Inc. by US$30 million, and this resolution was approved by the Investment Commission on November 2, 2005. Won the Philippine President Award on the night of the award ceremony for Excellent International Manufacturers by the Philippine President.
December 2005 Established ASE New High-Tech (Shanghai), which was resolved in the meeting of the board in November 2005. The amount invested was US$15 million. This establishment was approved by the Investment Commission on December 21, 2005.
March 2006 Invested NT$30 million in establishing a wholly owned subsidiary, ASE Electronics Inc.
May 2006 Approved by the Board of Directors to transfer material business department to subsidiary ASE Electronics Inc. The conversion ratio was NT$10 of the operating value of the transferred material business department for one ordinary share of ASE Electronics Inc.
August 2006 Officially transferred material business department to ASE Electronics Inc., and obtained 294,929,700 ordinary shares of the ASE Electronics Inc. The Company was approved by the Board of Directors in June 2006 to increase the capital of ASE (Kunshan) Inc. by US$30 million. This capital increase was approved by the Investment Commission on August 1, 2006.
September 2006 Transferred 147,500,000 ordinary shares and 147,429,700 shares of the Company's ASE Electronics Inc. to subsidiaries ASE Labuan Inc. and ASE Mauritius Inc., respectively, in support of the company's global operation strategy and financial planning.
December 2006 Passed the resolution of the Board of Directors in November 2006 to adopt the US$60 million capital of subsidiary J&R Holding Limited to accept and transfer 100% of the shares of Weiyu Technology Testing Fengzhuang Limited Company in China. This adoption was approved by the Investment Commission on December 29, 2006. The Company's subsidiary ASE Mauritius Inc. transferred 147,429,700 shares of the Company's ASE Electronics Inc. to subsidiary ASE Labuan Inc. in support of the company's global operation strategy and financial planning.
June 2007 Transferred 3,000,000 ordinary shares of the Company's ASE Electronics Inc. to subsidiary ASE Labuan Inc. in support of the company's global operation strategy and financial planning.
July 2007 Acquired 60% of the shares of NXP Semiconductors Suzhou Ltd. held by NXPB.V. with its own capital of US$21,600,000 through its subsidiary J&R Holding Limited in March 2007. This acquisition was approved by the Investment Commission on July 2, 2007. (Approved on March 7, 2008, the name was changed to Suzhou ASE Semiconductor Ltd.)
August 2007 To integrate the name of the company group, the Company renamed the Weiyu Technology Testing Fengzhuang Limited Company in China to ASE Assembly & Test (Shanghai) Ltd., and this renaming was approved by the Investment Commission on August 29, 2007.
February 2008 Approved by the Board of Directors in October 2007 to increase the capital of ASE Assembly & Test (Shanghai) Ltd. by US$30 million. This capital increase was approved by the Investment Commission on February 20, 2008. Passed the resolution of the Board of Directors in January 2008 to adopt US$7 million in capital to accept and transfer 100% of the shares of Weihai Shiyi Electronic Co.,Ltd. in China through subsidiary J&R Holding Limited. This adoption was approved by the Investment Commission on February 15, 2008. (Approved on May 22, 2008, the name was changed to ASE Semiconductor Ltd. (Weihai)).
May 2008 Approved by the Board of Directors in March 2008 to increase the capital of ASE Assembly & Test (Shanghai) Ltd. by US$90 million. This capital increase was approved by the Investment Commission on May 16, 2008. Approved by the Board of Directors in June 2006 to increase the capital of ASE Semiconductor Ltd. (Weihai) by US$13 million. This capital increase was approved by the Investment Commission on May 22, 2008.
August 2008 Approved by the Board of Directors in July 2008 to increase the capital of ASE Electronics (Kunshan) Ltd. by US$6 million. This capital increase was approved by the Investment Commission on August 7, 2008.
November 2008 To safeguard the Company's credit and shareholders' rights and interests, the Company was approved by the Board of Directors in November 2008 to repurchase 144,037,000 ordinary shares for the first time and eliminate these shares accordingly.
January 2009 To safeguard the Company's credit and shareholders' rights and interests, the Company was approved by the Board of Directors in January 2009 to repurchase 73,937,000 ordinary shares for the second time and eliminate these shares accordingly.
February 2009 Approved by the Board of Directors in December 2008 to increase the capital of ASE Semiconductor Ltd. (Weihai) by US$20 million. This capital increase was approved by the Investment Commission on February 4, 2009.
July 2009 Approved by the Board of Directors in June 2009 to increase the capital of ASE Semiconductor Ltd. (Kunshan) by US$20 million. This capital increase was approved by the Investment Commission on July 31, 2009.
November 2009 Passed the resolution of the Board of Directors in November 2009 to publicly acquire the shares of Universal Scientific Industrial Co., Ltd. (USI) taking into consideration of cash and the Company's ordinary shares (306,596,000 shares) held by J&R Holding Limited (107,308,600 shares) and ASE Test Singapore Inc. (199,287,400 shares).
February 2010 The aforementioned public acquisition was completed on February 9, 2010. Through this acquisition, the Company obtained 641,669,316 ordinary shares of USI in addition to 192,944,213 existing ordinary shares of the company before acquisition. After acquisition, the Company holds 78.1% of the voting shares of USI.
August 2010 The application to terminate the shares of USI was approved by the Board of Directors in April 2010. Concurrently, the Company committed to acquiring the shares of USI. Public acquisition was completed on August 5, 2010, acquiring 222,243,661 outstanding shares of USI in addition to the 834,613,529 existing shares of USI prior to acquisition. After acquisition, the Company holds 98.9% of the voting shares of USI.
November 2010 To safeguard the Company's credit and shareholders' rights and interests, the Company was approved by the Board of Directors in November 2010 to repurchase 37,000,000 ordinary shares for the third time and eliminate these shares accordingly. To comply with government policies, the Company issued shares by way of scripless issue as of November 26, 2010.
January 2011 Considering the group's operation strategy, the Company was approved by the Board of Directors in January 2011 to setup a Nantou Branch that undertakes the existing micro-electronic assembly business of USI.
March 2011 Approved by the Board of Directors in November 2011 to increase the capital of ASE Semiconductor Ltd. (Weihai) by using its own fund of US$60 million through ASE (Korea) Inc. This capital increase was approved by the Investment Commission on March 1, 2011.
June 2011 Passed the resolution of the Board of Directors in June 2011 to raise mid-to-long-term funds, repaying short-term debts to improve the
Company's financial structure. Within the limit of NT$8 billion, the Company issued ordinary corporate bonds guaranteed by five banks, including the Bank of Taiwan.
August 2011 Issued guaranteed ordinary corporate bonds of NT$8 billion. To safeguard the Company's credit and shareholders' rights and interests, the Company was approved by the Board of Directors in August 2011 to repurchase 34,000,000 ordinary shares for the fourth time and eliminate these shares accordingly.
September 2011 To safeguard the Company's credit and shareholders' rights and interests, the Company was approved by the Board of Directors in September 2011 to repurchase 50,000,000 ordinary shares and 30,000,000 shares for the 5th and 6th time respectively and eliminate these shares accordingly.
November 2011 To strengthen the resources, labor, and technological integration of the subsidiary Power ASE Technology ("Power ASE"), the Company was approved by the Board of Directors on November 8, 2011 to publicly acquire the ordinary shares of Power ASE held by shareholders other than those of the Company at NT$18.5 per share. The Company completed the public acquisition on November 18, 2011, acquiring 105,697,703 ordinary shares of Power ASE, approximately NT$1.96 billion in value. In addition to the 55.7% shares of Power ASE originally held by the Company, the Company now holds 99.2% of the shares of Power ASE.
December 2011 Won the Contribution Award from the National Invention and Creation Award of Ministry of Economic Affairs.
May 2012 To integrate resources and enhance business benefit and competitiveness, the Company received approval from the Board of Directors in March 2012 to merge with Power ASE by cash. The Company is the surviving company following the merge, and Power ASE is the dissolved company. The base date of the merge was May 1, 2012.
November 2012 The Company's 2011 CSR Report won the Taiwan Corporate Sustainability Report Award: Copper Award by the Taiwan Institute for Sustainable Energy.
December 2012 Won the Award of Excellence in Intellectual Property Management and the Award for Best Intellectual Property Report by the Ministry of Economic Affairs.
Since 2009 the Company has incorporated green building standards in the construction and planning of building K12, using Taiwan EEWH diamond certification and LEED platinum certification as the design criteria. Following a series of processes, including planning, designing, construction, validation, written review, and onsite inspections, the Company successfully passed the evaluation by the Ministry of Interior in December 2012 and won the Taiwan EEWH diamond certification.
July 2013 Taking into consideration ASE resource integration and economies of scale of the industry, the Company combined its two subsidiaries in China, ASE (Kunshan) Inc. and ASE Electronics (Kunshan). The ASE (Kunshan) Inc. merged with ASE Electronics (Kunshan), with the ASE Electronics (Kunshan) as the dissolved company. After merger, ASE Electronics (Kunshan) conducted liquidation. ASE (Kunshan) Inc. recovered/canceled
an investment of US$24 million.
August 2013 To integrate resources and enhance business benefit and competitiveness, the Company received approval from the Board of Directors in July 2013 to merge with Yang Ting Tech Co., Ltd., a subsidiary in which the Company holds 100% of voting shares,
in accordance with the Business Mergers and Acquisitions Act and other relevant laws and regulations. The Company was the surviving company after the merge, and Yang Ting Tech was the dissolved company. The base date of the merge was August 30, 2013.
September 2013 Issued the 3rd Overseas Zero Coupon Convertible Bonds to the value of US$400 million.
Issued 130,000,000 ordinary shares for capital increase.
October 2013 Approved by the Board of Directors in August 2013 to increase the capital of ASE Semiconductor Ltd. (Weihai) by by means of debt for equity using US$25 million through ASE (Korea) Inc. This capital increase was approved by the Investment Commission on October 29, 2013.
July 2014 Approved by the Board of Directors in July 2014 to increase the capital of ASE Semiconductor Ltd. (Weihai) through ASE (Korea) Inc by using its own fund of US$20 million. This capital increase was approved by the Investment Commission on August 18, 2014.
September 2014 Awarded Forbes Asia Fabulous 50 companies 2014, the only listed company in Taiwan to receive this award in 2014.
October 2014 Re-applied with Kaohsiung Customs, Customs Administration, for Authorized Economic Operator (AEO) safety certification. The Company passed on-site verification and again acquired AEO qualification.
January 2015 The Company's Chairman and CEO, Jason Chang, as well as the COO, Wu Tien-Yu, were honored with the 2014 SEMI Award at the Industry Strategy Symposium (ISS) in 2015, which was held in California, United States. This award recognizes ASE's dedication in developing and studying technologies for surpassing traditional gold wire bonding technologies and introducing copper wire bonding technologies.
May 2015 ASE and TDK Corporation engaged in a joint venture to establish ASE Embedded Electronics Incorporated. Monetary value in NTD equivalent to US$39,490,000 was invested in this joint venture, aiding the Company to acquire approximately 51% of share ownership, while TDK Corporation obtained roughly 49% of share ownership.
The Company's subsidiary, ASE Zhongli, passed the customs' AEO certification.
July 2015 Issued the 4th Currency Linked Zero Coupon Convertible Bonds due 2018 to the value of US$200 million.
Won the Best Trade Contribution Award by the Bureau of Foreign Trade, Ministry of Economic Affairs.
October 2015 Approved by the Board of Directors in August 2015 to acquire, for the first time, the ordinary shares of Siliconware Precision Industries Co., Ltd. (SPIL). Completed public acquisition in October 2015, acquiring 779,000,000 outstanding ordinary shares of SPIL, which account for
24.99% of issued voting shares.
Kaohsiung Plants K11 and K12 obtained the Certification of Green Factory Label by the Industrial Development Bureau, Ministry of Economic Affairs, officially becoming a green factory that has been honored with the Green Factory label.
November 2015 In the Taiwan Corporate Sustainability Award competition held by the Taiwan Institute for Sustainable Energy in 2015, the Company won the Taiwan Top 50 Corporate Sustainability Report Silver Medal Awards in the Electronic Information Manufacturing Industry category.
The Company's Kaohsiung Plants, K4, K7, K8, K10, K11, and K12 obtained the ISO 15408 safety certification, EAL6 Site Certification, from the Germany Federal Office for Information Security (BSI), the only semiconductor wafer packaging and testing OEM plant across the world to obtain this certification.
December 2015 Rated by Fitch Ratings with a long-term credit rating of A+ (twn) on December 16, 2015.
Taking into consideration ASE resource integration and economies of scale of the industry, the Company completed the merge of its two subsidiaries in China, ASE (Shanghai) Inc. and ASE Electronics (Shanghai). To fulfill corporate social responsibility and strive toward sustainable develop, the Company was affirmed by the British Standards Institute four years in a row as of 2012 and won the received the 'Inclusive Green Growth Award' and the 'GRC (governance, risk management and compliance) Award'. The Company also obtained the Green Enterprise Paradigm Award, highlighting the Company's commitment in building a green enterprise.
Kaohsiung Plants K3 and K5 passed the green factory certification by the Industrial Development Bureau, Ministry of Economic Affairs, in December 2015. Kaohsiung Plant K9 passed the clean production certification on February 1, 2013, and obtained an extension of this certification by the Industrial Development Bureau, Ministry of Economic Affairs in December 2015.
January 2016 Kaohsiung Plant K8 passed the clean production certification on February 1, 2013, and obtained an extension of this certification by the Industrial Development Bureau, Ministry of Economic Affairs in January 2016.
March 2016 Approved by the Board of Directors in December 2015 to acquire, for the second time, the ordinary shares of Siliconware Precision Industries Co., Ltd. (SPIL). The Company will be acquiring 770,000,000 outstanding ordinary shares of SPIL, which account for 24.71% of issued voting shares. However, the Fair Trade Commission did not complete the review of this case by the end of the acquisition period. Therefore, the Company announced that the condition of acquisition was not met.
In accordance with the resolution of the Board of Directors, in March 2016 the Company paid NT$13,296,307,000 to acquire 201,548,000 ordinary shares and 9,690,000 depositary receipts in SPIL (each recognized as 5 ordinary shares), increasing the shareholding ratio from 24.99% to 33.02%.
April 2016 In accordance with the resolution of the Board of Directors, in April 2016 the Company acquired 8,300,000 ordinary in SPIL on the open market using NT$439,191,000 in cash, increasing the shareholding ratio from 33.02% to
33.29%.
Ranked as a Top 6% to Top 20% listed company in the 2015 (2nd) Corporate Governance Assessment
June 2016 ASE and SPIL jointly entered into the execution of a joint share exchange agreement, in which ASE will apply for the establishment of ASE Investment Holding, which will acquire 100% equity of both ASE and SPIL by means of joint share exchange.
July 2016 Selected as the component of the TWSE Corporate Governance 100 Index by TWSE.
September 2016 In response to the capital increase of ASE Embedded Electronics Inc., share subscription was performed by all existing shareholders based on their shareholding percentage of ASE and TDK Corporation. After subscription, the Company invested NT$765,000,000, with shareholding percentage maintaining at 51%.
October 2016 The Zhongli Plant was the first packaging and testing OEM plant in the world to pass the ISO 26262 certification.
November 2016 Made the CDP’s Climate A List in 2016, the only company in Taiwan to receive A rating in the CDP climate change assessment.
The Company passed the resolution of the Fair Trade Commission that approves a joint holding company between ASE and SPIL.
II. Risk items
(I) Risk factors
1. Within the last year and as of the printing of this prospectus, the effects that annual interest, exchange fluctuation, and inflation rates have on the profits and losses of the company as well as the future response measures
(1) The effects that annual interest have on company profits as well as the future response measures:
The Company and its subsidiaries have made appropriate flexible adjustments with regards to the cash position required for the company's operating activities. The financial costs for the first three quarters in 2015 and 2016 were respectively NT$2,312,143,000 and NT$1,746,585,000, accounting for 0.82% and 0.88% of the net operating income for the year. These results suggest a minimal impact of interest rate on company profits. In future, we will continue to closely monitor the trends of interest rate and to employ low-interest financing instruments and beneficial interest rate conditions in order to maintain minimal financing cost and active credit limit. Subsequently, interest rate risks that are likely to occur in business operations can be averted.
(2) The effects that exchange fluctuation have on company profits as well as the future response measures:
The Company and its subsidiaries conduct hedging by adopting natural hedging in conjunction with low-risk and safe hedge targets. The net profits on foreign currency exchange for Q3 in 2015 and 2016 were respectively NT$(713,213,000) and NT$2,235,621,000, accounting for (0.25)% and 1.13% of the net operating income. This suggests that the profits were not affected by exchange fluctuation. In future, we will pay attention to the global economy and changes in exchange rate and focus on reducing the risks of exchange rate variations as our main management practice.
Concurrently, we will also deliberately examine how the company allocate its funds and mitigate the effects of exchange rate fluctuations as a means of effective management.
(3) The effects that currency inflation have on company profits as well as the future response measures:
Currently inflation did not exert a material impact on the profits of the Company and its subsidiaries. In addition to closely monitoring price fluctuations in the market, the Company and its subsidiaries will maintain a positive interactive relation with their suppliers and customers and appropriately adjust product selling price and stock inventory. These efforts should be able to effectively mitigate the impact of currency inflation on the Company and its subsidiaries.
2. Within the last year and as of the printing of this prospectus, main policies for engaging in high-risk engagements, highly leveraged investments, endorsement guarantees, and derivative transaction policies; main reasons for profits and losses; and future response measures. The Company engages in the transactions listed in the preceding paragraph in accordance with relevant handling procedures as formulated by the Company.
The Company and its subsidiaries adopt robust, conservative operating strategy and abstain from engaging in high-risk, high-leverage investments. The Company has complied with laws and regulations of the Securities and Futures Bureau (SFB) in developing internal management guidelines and operating procedures that are based on a sound financial and operational plan, including the Procedure for Lending Funds to Other Parties, Procedure for Making Endorsements and Guarantees, and Procedure for the Acquisition or Disposal of Assets. In future, the Company will continue to abide by procedural regulations and perform all transactions in accordance with relevant regulations.
3. Future R&D plans and anticipated investments in R&D expenses
(1) Future R&D plans
Please read pages 46 to 49 of this prospectus.
(2) Anticipated investments in R&D expenses
The Company and its subsidiaries anticipate to invest NT$430,000,000 in R&D for the pilot production of their packaging products, and NT$3,864,000,000 in R&D of other packaging products. It is anticipated that NT$480,000,000 will be invested in R&D for the pilot production of packaging products, and NT$5,000,000 in the R&D of other packaging products. NT$37,000,000 in R&D expense will be invested in the testing and pilot production of module process technologies.
(3) Factors influencing the success of future R&D
| Ÿ | Development of advanced packaging technology capability and integration with existing packaging technologies |
| Ÿ | Optimal solution for minimizing the cost of producing existing packaging and testing technologies |
| Ÿ | Process and manufacturing standardization and industry chain integration |
| Ÿ | Verification and instant introduction of mass-produced new core facilities |
| Ÿ | Development and cultivation of packaging, testing, substrate, module, and system integration capabilities |
| Ÿ | Development and cultivation of substrate, element, and module design capabilities |
| Ÿ | Complete product R&D process and project management system |
| Ÿ | Integration of product development and existing production equipment to lower R&D costs |
| Ÿ | Customer-oriented organizational design and internal operation mechanism |
| Ÿ | Adequately monitor market supply and demand, and take the lead in developing advanced packaging, substrate, and testing technologies according to market dynamics and trends in order to ensure leading technological status and to provide customers with optimal solutions in a timely manner when new products are launched in the market |
| Ÿ | Strengthening of R&D talent cultivation |
| Ÿ | Implementation and reinforcement of knowledge management system |
| Ÿ | Strengthening of IP strategy and management |
| Ÿ | Designing, R&D, and manufacturing of Eco-design products that meet environmental protection regulations |
| Ÿ | Effective management of R&D benefits, risks, scheduling, and personnel |
| Ÿ | Formation of strategic alliance with benchmark customers, reduction of R&D costs and risks, and development of IC-package-system Co-design |
| Ÿ | Development and advancement of testing development capabilities |
| Ÿ | Development and advancement of R&D core technology capabilities |
4. Within the last year and as of the printing of this prospectus, the effects of the key domestic and international policy and law changes have on the financial operations of the company as well as the response measures:
(1) According to Jin-Guan-Zheng-Fa No. 1030029342 and Jin-Guan-Zheng-Fa No. 1030010325 announced by the FSC, the Company began adopting the 2013 IFRS, IAS, IFRIC, and SIC (collectively, the “IFRSs”), which are announced by the IASB and approved by the FSC, as of 2015 as well as the Regulations Governing the Preparation of Financial Reports by Securities Issuers, to compile its consolidated financial reports. In addition, the Company adopts the IFRSs announced by the IASB but not yet approved by the FSC. Concerning the impact on the consolidated financial reports, the Company will continue to evaluate these reports and complete such evaluation by the specified due date in accordance with the schedule provided by the FSC.
(2) In response to the amendments to the Company Act and Securities and Exchange Act, the Company examined and amended its management guidelines at all times to ensure that legal compliance.
5. Within the last year and as of the printing of this prospectus, the effects that technological changes and industry changes have on the financial operations of the company as well as the response measures
(1) The uncertainty and discontinuity of the global economy are a major challenge of the semiconductor industry. ASE overcomes this challenge by cooperating with customers and vendors to meet customer demands, reduce costs, mitigate risks, continuously observe market pulse, and maintain a closer interaction with customers to identify their needs and changes in their needs. Subsequently, we actively gathered and analyzed market information to alleviate the technological impact of changes in product requirements.
Customer competitiveness and the timing to launch a new product are the key to the success of introducing a new technology. ASE responds to this trend by monitoring market trends and supply/demand conditions, taking the lead to develop key technologies and patents according to market trends and product blueprint of benchmark customers in order to ensure a leading technological status. ASE also reduces R&D costs by ensuring that the process of product development is compatible with existing production equipment to provide customers with the best solution when new products are launched in the market.
(3) According to our experience in the R&D and innovation of new technologies, we found that R&D expenses and new core facilities are a critical component of these processes. Therefore, we respond by ensuring consistency between new technologies and ASE’s future blueprints, and by actively forming strategic alliance with customers to implement resource sharing and ultimately reduce R&D risks. ASE regularly visits its leading customers, participates in technological seminars, and works with benchmark customers to collectively plan product blueprints and product regulations that ensure that R&D technologies can facilitate meeting customers’ delivery deadline.
ASE Nantou Plant (ASENT) has long been devoted to developing electrical and electronic products, including military and industrial power modules for DC converters. The Plant offers multiple solutions to high-power electrical and electronic industrial applications. ASE actively interacts with its customers to determine their needs and changes in their needs. Moreover, the Company actively gathers and analyzes market information to mitigate the effects of technological changes. In future, ASE will place greater level of emphasis on intelligent energy conservation practices, using our extensive experiences and resources in the development of electrical and electronic products. We will also orient our development efforts toward incorporating insulated-gate bipolar transistor (IGBT) standard module packaging and IPM smart module.
6. Within the last year and as of the printing of this prospectus, the effects that corporate image have on corporate crisis management as well as the response measures
The Company and its subsidiaries have always operated under the concept of integrity, law-abiding, and fulfillment of social responsibility. In face of the accidental incident in 2013 involving leakage of wastewater from our Kaohsiung Plant, ASE faced the consequences of this incident with courage and proactively handled the situation, while continuing to make relevant improvements in order to endeavor to reshape the company's image.
7. Within the last year and as of the printing of this prospectus, expected benefits and possible risks of merger and acquisition as well as the response measures
(1) To engage in organizational adjustment and thereby enhance operational flexibility, subsidiary Universal Scientific Industrial Co., Ltd. (USI) passed the resolution of the meeting of the Board of Directors to take April 1, 2015 as the base date for the transfer of its investment business, and reducing the capital by NT$16,012,966,000, equivalent to eliminating 1,601,297,000 outstanding shares. The capital reduction ratio was 97.56%Regarding the operating value assumed by USI Inc. due to such transfer, 1,000,000,000 ordinary shares were issued to the existing shareholders of USI. The ratio was 609.27 ordinary shares per 1,000 shares held as of the base date. USI completed the registration for the capital reduction on April 17, 2015, and the new company was also registered on April 17, 2015. The transfer did not exert an influence on the Company’s net value per share and earnings per share or those of its subsidiaries, because the Company and its subsidiaries hold control over the USI Co.,
Ltd. and USI Inc.
Integrating the resources along the industry chain of the Company and its subsidiaries’ electronic manufacturing services (EMS), and establishing reasonable separations in the operational models of semiconductor packaging and testing and EMS, would enhance the efficiency of these two areas. To this end, in February 2016, the Company disposed of 39,603 shares of its subsidiary USI Co. Ltd. to subsidiary Universal Global Scientific Industrial Co., Ltd. at NT$20 per share, the total value of the transaction was NT$792,064,000. The shareholding ratio of the Company and its subsidiaries in USI Co. Ltd. was lowered from 99.0% to 76.5%. This transaction did not change the Company’s control over its subsidiary USI Co. Ltd., the transfer was conducted in the form of an equity transaction, and the recognized capital reserve was reduced by NT$20,552,000.
(2) To integrate group resources, subsidiary USI Electronics Inc. was approved by the Board of Directors on March 25, 2015 to merge with USI America Inc. (known as USI Manufacturing Services, Inc. before May 2015) and USI @Work, Inc. USI America Inc. served as the surviving company, and USI @Work, Inc. served as the dissolved company. USI @Work, Inc. was completely merged and eliminated in August 2015. Such merge is anticipated to help USI America Inc. lower management cost and increase business performance, which positively influence the net value per share and earnings per share of USI America Inc.
(3) Taking into consideration ASE resource integration and economies of scale of the industry, the two subsidiaries in China, ASE (Shanghai) Inc. and ASE Electronics (Shanghai) passed a resolution of the meeting of the Board on December 17, in which ASE (Shanghai) Inc. used RMB99,318,000 in new shareholdings and its original investment company trading in its equities in ASE Electronics (Shanghai) to acquire ASE Electronics (Shanghai), with ASE (Shanghai) Inc. being the surviving company and ASE Electronics (Shanghai) being the dissolved company. The base date of the acquisition was temporarily set on January 1, 2016. As of the printing date of this prospectus, the acquisition is still in progress because approval from the competent authority is still pending. The anticipated benefit of such acquisition is that ASE (Shanghai) Inc. can directly obtain the funds of ASE Electronics (Shanghai) to improve its financial structure and lower operational cost, which positively influence the net value per share and earnings per share of ASE (Shanghai) Inc..
(4) In September 2015, the Company acquired 779,000,000 ordinary shares of SPIL at NT$45 per share and 10,650,000 depositary receipts, each recognized as 5 ordinary shares. This accounts for a total shareholding of 24.99%, which has a major effect on SPIL. Between March and April 2016, the Company acquired ordinary shares in SPIL on the open market using NT$13,735,498 in cash and 258,300,000 depositary receipts (each recognized as 5 ordinary shares), increasing the shareholding ratio from 24.99% to 33.29%.
In response to the future development and sustainable management of the semiconductor industry, the Company received approval from the Board in June 2016 to enter a share exchange agreement with SPIL. The Company will submit application to setup an ASE Investment Holding (hereafter referred to as “ASE Investment”) and to engage in share transfer with SPIL so that the ASE Investment will obtain 100% share ownership to ASE and SPIL. The consideration of such share transfer is to exchange one ordinary share of ASE for 0.5 ordinary share of ASE Investment, and one ordinary share of SPIL for cash of NT$55 (adjusted to NT$51.2 following earnings distribution in 2016).
As of the date of printing of this prospectus, the share transfer will be performed in accordance with the collective share transfer agreement and still requires multiple prerequisite conditions before it can be achieved (including but are not limited to the approval of shareholders’ meeting of the Company and SPIL, and the approval or consent of relevant competent authorities for this transaction). Unless otherwise agreed by the Company and SPIL, if the aforementioned condition cannot be met or has been exempted before December 31, 2017, then this agreement will be terminated automatically.
Because of the aforementioned collective share transfer agreement, the Company will handle its existing treasury stocks and converted equity corporate bonds that have been issued by adopting the following principles:
A. For outstanding 3rd overseas non-guaranteed convertible bonds that are issued by the Company, unless these bonds had been redeemed or repurchased and canceled or the bond holder has exercised his/her conversion right before the base date of the share transfer, the holder may, after the Company has obtained the approval of competent authorities, convert these bonds into newly issued ordinary shares of ASE Investment on the base date of share transfer in accordance with relevant laws and regulations, the consignment agreement of these bonds, and the conversion ratio.
B. To support the issuance of the 4th overseas non-guaranteed convertible bonds, the Company has repurchased treasury stocks for conversion before the share transfer base date, converting them into shares of ASE Investment on the basis of the conversion rate. These shares will be held by the Company, and the conversion rate specified in the share transfer agreement will be adjusted as the conversion price for overseas non-guaranteed convertible corporate bonds.
C. Before signing the collective share transfer agreement, ASE Investment will fulfill the Company's obligations as of the share transfer base date with regards to the issued stock options that are approved by the competent authorities. The price and quantity of share transfer shall be changed to new ordinary shares of ASE Investment in accordance with the adjustment of conversion rate and object of contract execution. The remaining issuance condition and original issuance condition shall be identical. However, the specific method of execution shall be conducted by the ASE Investment following relevant laws and regulations and the instructions approved by the competent authorities.
8. Within the last year and as of the printing of this prospectus, expected benefits and possible risks of factory expansions as well as the response measures
Because the growth of the semiconductor market presented an optimistic prospect, the Company and its subsidiaries anticipate that the magnitude of growth in 2016 will exceed that of 2015. Regarding investment, to adequately and effectively utilize existing production capacities, the Company and its subsidiaries have increased their production capacity in the past few years to an extent that they can now fulfill most of their orders. To improve the return rate and reduce investment risks, the Company and its subsidiaries focused primarily on our existing production capacities and equipment as well as investments in new equipment in order to boost market growth. In addition to using new plants, we will incorporate new investments into consideration depending on the actual market demands.
9. Within the last year and as of the printing of this prospectus, the risks of concentrated procurement or sales as well as the response measures
(1) Overly concentrated procurements easily disrupt the supply process because of
production or quality abnormalities and also weaken suppliers' bargaining power. The Company and its subsidiaries have formulated policies for diversifying their suppliers of direct material and machinery equipment in order to identify the few alternative suppliers (2nd source) who can concentrate on supply resources and materials. Regarding the source of supply in a foreign oligopolistic market, we actively fostered domestic suppliers with potentials in technological R&D to disperse risks and reduce costs.
(2) The Company and its Subsidiaries were not involved in matters relating to concentrated sales.
10. Within the last year and as of the printing of this prospectus, the effects and risks that large-number transfers or replacements of directors, supervisors, or major shareholders holding over 10% of the company's shares have to the company as well as the response measures:
Within the last year and as of the printing of this prospectus, there were no large-number transfers or replacements of directors or major shareholders holding over 10% of the company's shares.
11. Within the last year and as of the printing of this prospectus, the effects and risks that operating rights changes have to the company as well as the response measures
In the most recent year and as of the printing date of this prospectus, the Company has never changed the operating rights.
12. Other important risks and response measures: None.
(II) Litigation or non-litigation events
1. Finalized judgments or pending litigations, non-litigations, or administrative disputes for the company in the last two years until the printing date of this prospectus whereby the results may have major impacts to the shareholders' rights or share prices
(1) The Company received a statement of charge from Taiwan Kaohsiung District Court in November 2015. The charge involved SPIL appealing to the Court for confirming the non-existence of the Company's right to request for being listed as a shareholder in the shareholders' roster of SPIL. Because SPIL did not pay the court fee by the specified deadline, the Taiwan Kaohsiung District Court dismissed the lawsuit, thus imposing no material influence on the consolidated financial status and financial performance of the Company and its subsidiaries.
(2) Kaohsiung City Government Environmental Protection Bureau (hereafter referred to as "EPB") fined the Company NT$102,014,000 (referred to as "Fine") for violating the Water Pollution Control Act. The Company filed an appeal against the said Fine and the appeal was dismissed by the Kaohsiung City Government. Subsequently, the Company filed an administrative lawsuit with the Kaohsiung High Administrative Court to request the Kaohsiung City Government to withdraw the decision and the Fine and to request the EPB to return the fine that the Company has already paid. The Kaohsiung High Administrative Court provided a ruling on March 22, 2016 to withdraw the decision and the Fine and to dismiss the remaining appeal (i.e., request for refund of the fine paid). On April 4, 2016, the Company lodged an appeal against the part of the ruling that negatively affects the Company. The case is currently being reviewed by the supreme administrative court.
Kaohsiung District Prosecutors Office filed a lawsuit against the Company in January 2014 for violating the Waste Disposal Act, and the Taiwan Kaohsiung District Court fined the Company NT$3,000,000 for violating Article 47 of the Waste Disposal Act. The Company appealed against the ruling in accordance with
legal procedures. The Taiwan High Court Kaohsiung Branch reached a verdict on September 29, 2015, ruling the Company not guilty.
2. Finalized judgments or pending litigations, non-litigations, or administrative disputes associated to the company's directors, supervisors, General Manager, responsible person, or major shareholders holding over 10% of the company's shares in the last two years until the printing date of this prospectus whereby the results may have major impacts to the shareholders' rights or share prices: None.
3. Company directors, supervisors, managers, or major shareholders holding over 10% of the company's shares have involved in matters described by Article 157 of the Securities and Exchange Act as well as the status of the case currently handled by the company within the last two years and as of the printing of this prospectus: None.
(III) Company directors, supervisors, managers, or major shareholders holding over 10% of the company's shares have involved in financial turnover difficulties or suffer credit losses within the last two years and as of the printing of this prospectus; and the effects on the company's financial conditions must be specified: None.
(IV) Other important issues: None.
3. Company Organization
(I) Organization system
1. Organization structure
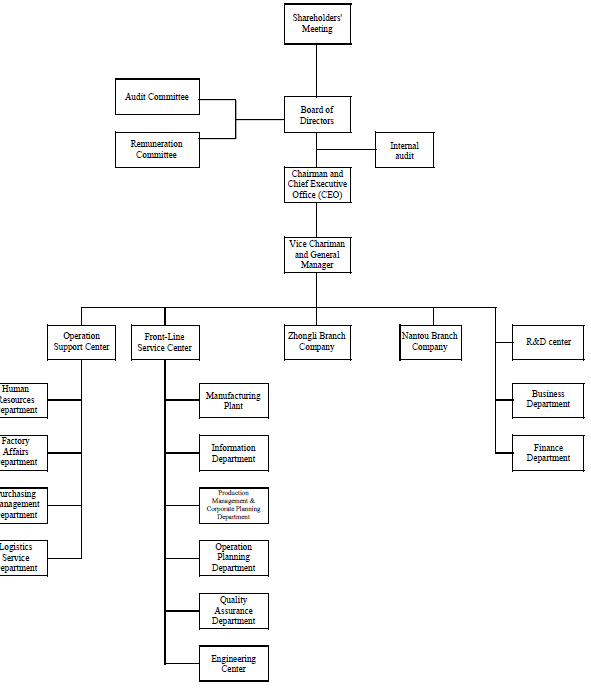
2. Business operations of the various key business departments
| Department | Duties | |
| Operation | Human | Human resource management and organizational |
| 17 |
| Department | Duties | |
| Support Center | Resource Division | development
Ÿ Human Resource Operation Service Division: Provide employee service, develop labor requirement plan, plan and manage employee recruitment, remuneration, welfare, and performance systems, and manage central security protection system
ŸHuman Resource Operation Development Division: Plan organizational development and strategies, strengthen employee care and concern, and participate in CSR and charity events
|
| Plant Affair Division: | Handle environmental protection tasks of plant and administrative areas, manage general affairs, and control and manage labor safety
ŸNew Construction Division: Devise plant expansion plans, monitor new construction works and manage construction acceptance tasks, and ensure operation development
ŸOccupational Safety Division: Integrate organization of plant areas and plant affairs, strengthen laws and regulation identification and standardize practices, and assume responsibility in occupational safety and environmental management and sustainable development
ŸPlant Affair Technological Integration Division: Integrate and strengthen the following aspects: supplier quality and reliability of plant affair system; integration and operation of plant safety and maintenance, introduction and planning of new technologies and equipment
| |
| Procurement Management Division | Procure, manage, and control machines and product materials
ŸProcurement Management Division 1: Integrate the procurement of production materials with supplier resource management
ŸProcurement Management Division 2: Allocate repair, general affairs, and procurement tasks and integrate and manage cross-department resources
ŸProcurement Management Division 3: Integrate mechanical equipment, procure resources, and develop and promote cross-unit systems
| |
| Logistic Service Division | Handle matters pertaining to storage, import/export activities, and insurance and tax accounting | |
| Front Line Service Center | Manufacturing Plant | Handle matters related to semiconductor packaging OEM, product production planning, product manufacturing, progress management, onsite management, and equipment maintenance |
| Information Division | Construct company information system and implement e-management strategies and system services
ŸAutomated and Engineering Information Division: Manage strategic development of automated and engineering information system, innovation, framework planning, system integration, and system design and maintenance
ŸTechnical Information Division: Evaluate, integrate, setup,
| |
| 18 |
| Department | Duties | |
and maintain software and hardware applications of the company information system
ŸOperation and Customer Information Division: Plan, develop, maintain, and manage corporate operation management and customer information service IT application system
ŸManufacturing Information Division: Manage strategic development of manufacturing information system, innovation, framework planning, system integration, and system design and maintenance
| ||
| Production and Management Planning Division | Manage production planning and operational efficiency | |
| Operation Planning Division | Plan operation and project proposals, and integrate and implement administrative resource plans | |
| Quality Assurance Division | Examine and ensure product qualities
ŸQuality Assurance Division: Ensure quality management mechanism and monitor product quality
ŸQuality System Division: Establish product reliability and assure the accuracy of measuring instruments
ŸQuality Engineering Division: Ensure customer communication and coordination, develop product testing process, and conduct quality control
| |
| Engineering Center | Develop substrate designs and production technologies
ŸDesign Engineering Division: Develop new technologies and materials, integrate and automate system processes, and provide local support design services to customers worldwide
ŸPackaging Engineering Division: Develop, introduce, and assess new equipment and materials, implement engineering tasks, and integrate systems
| |
| Others | R&D center | Research and develop advanced technologies, incorporate production technologies, develop design and manufacturing specifications, and research, develop, and assess new products and new technologies |
| Business Division | Promote business development and sell products in Asian, American, and European regions | |
| Finance Division | Conduct financial and accounting tasks, including fund management, asset management, cost and management accounting, rental tax planning, and shareholder operations | |
| Internal Audit | Formulate internal policies, processes, and auditing standards, assess the appropriateness of internal control systems, and evaluate validity of each department | |
| Zhongli Branch | Business units include administration, human resource and public relations, finance, quality assurance, production operation management, information, engineering development center, packaging and testing manufacturing facilities, wafer fabrication and packaging process, strategic | |
| 19 |
| Department | Duties |
| information and customer relation management | |
| Nantou Branch | Business units include human resource and general affairs, finance and accounting, quality management, sales operation, product engineering, information, manufacturing, production management, logistic management, information material, engineering, and environmental safety |
| 20 |

| 21 |
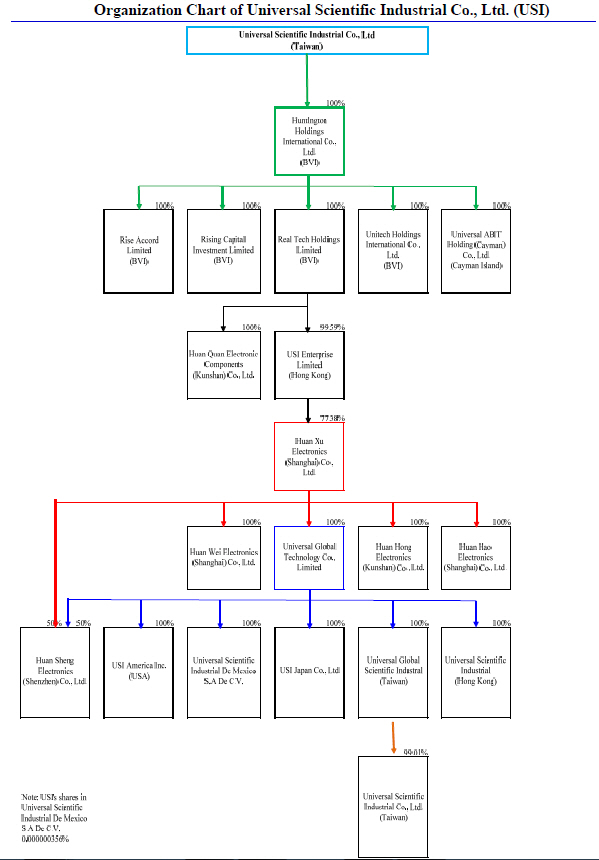
| 22 |
2. Relations between the company and its affiliates, mutual shareholding ratios, shares and actual investment amounts
September 30, 2016; Unit: NT$1,000, unless otherwise specified Shares
| Name of investment company: | Name of affiliate (Note 1) | Relationship | Actual investment amount | Shares of investment company | Company's Shares held by the invested company | ||
| Number of shares | Percentage (%) | Number of shares | Percentage (%) | ||||
| Advanced Semiconductor Engineering Inc. | A.S.E. Holding Limited | Subsidiary of the Company | US$ 283,966,000 | 243,966 | 100.00% | - | - |
| J & R Holding Limited | Subsidiary of the Company | US$ 479,693,000 | 435,128 | 100.00% | 46,703,763 | 0.59% | |
| ASE Marketing & Service Japan Co., Ltd. | Subsidiary of the Company | JPY 60,000,000 | 1,200 | 100.00% | - | - | |
| Omniquest Industrial Limited | Subsidiary of the Company | US$ 250,504,000 | 250,504,067 | 70.63% | - | - | |
| Innosource Limited | Subsidiary of the Company | US$ 86,000,000 | 86,000,000 | 100.00% | - | - | |
| ASE Test Inc. | Subsidiary of the Company | 20,698,867 | 1,131,452,502 | 100.00% | 10,978,776 | 0.14% | |
| Universal Scientific Industrial Inc. | Subsidiary of the Company | 20,836,477 | 1,112,236,706 | 99.17% | - | - | |
| LuZhu Development Inc. | Subsidiary of the Company | 1,366,238 | 131,961,457 | 67.11% | - | - | |
| ASE Test Inc. | Alto Enterprises Limited | Subsidiary of the Company | US$ 188,000,000 | 188,000,000 | 100.00% | - | - |
| Super Zone Holdings Limited | Subsidiary of the Company | US$ 100,000,000 | 100,000,000 | 100.00% | - | - | |
| LuZhu Development Inc. | Subsidiary of the Company | 372,504 | 37,250,448 | 18.94% | - | - | |
| TLJ Intertech Inc. | Subsidiary of the Company | 89,998 | 2,119,080 | 60.00% | - | - | |
| A.S.E. Holding Limited | ASE Test Limited | Subsidiary of the Company | US$ 84,889,000 | 11,148,000 | 10.19% | 88,200,472 | 1.11% |
| ASE Investment (Labuan) Inc. | Subsidiary of the Company | US$ 168,643,000 | 168,642,842 | 70.00% | - | - | |
| J & R Holding Limited | ASE Test Limited | Subsidiary of the Company | US$ 964,524,000 | 98,276,087 | 89.81% | 88,200,472 | 1.11% |
| Omniquest Industrial Limited | Subsidiary of the Company | US$ 30,200,000 | 30,200,000 | 8.51% | - | - | |
| ASE (Nanzih) Inc. | Subsidiary of the Company | US$ 51,344,000 | 170,000,006 | 100.00% | - | - | |
| ASE Japan Co., | Subsidiary | US$ 25,606,000 | 7,200 | 100.00% | - | - | |
| 23 |
| Name of investment company: | Name of affiliate (Note 1) | Relationship | Actual investment amount | Shares of investment company | Company's Shares held by the invested company | ||
| Number of shares | Percentage (%) | Number of shares | Percentage (%) | ||||
| Ltd. | of the Company | ||||||
| ASE (U.S.) Inc. | Subsidiary of the Company | US$ 4,600,000 | 1,000 | 100.00% | - | - | |
| Global Advanced Packaging Technology Ltd. | Subsidiary of the Company | US$ 190,000,000 | 190,000,000 | 100.00% | - | - | |
| Anstock Limited | Subsidiary of the Company | US$ 10,000 | 10,000 | 100.00% | - | - | |
| Anstock II Limited | Subsidiary of the Company | US$ 10,000 | 10,000 | 100.00% | - | - | |
| Suzhou ASEN Semiconductors Co., Ltd. | Subsidiary of the Company | US$ 21,600,000 | Note 1 | 60.00% | - | - | |
| ASE Investment (Labuan) Inc. | ASE (Korea) Inc. | Subsidiary of the Company | US$ 160,000,000 | 20,741,363 | 100.00% | - | - |
| ASE Test Limited | ASE Holdings (Singapore) PTE Ltd. | Subsidiary of the Company | US$ 65,520,000 | 71,428,902 | 100.00% | - | - |
| ASE Test Holdings, Ltd. | Subsidiary of the Company | US$ 222,399,000 | 5 | 100.00% | - | - | |
| ASE Investment (Labuan) Inc. | Subsidiary of the Company | US$ 72,304,000 | 72,304,040 | 30.00% | - | - | |
| ASE Singapore Pte. Ltd. | Subsidiary of the Company | US$ 55,815,000 | 30,100,000 | 100.00% | - | - | |
| ASE Test Holdings, Ltd. | ISE Labs, Inc. | Subsidiary of the Company | US$ 221,145,000 | 26,250,000 | 100.00% | - | - |
| ASE Holdings (Singapore) 2te Ltd | ASE Electronics (M) Sdn. Bhd. | Subsidiary of the Company | US$ 60,000,000 | 159,715,000 | 100.00% | - | - |
| Omniquest Industrial Limited | ASE Corporation | Subsidiary of the Company | US$ 352,784,000 | 352,784,067 | 100.00% | - | - |
| ASE Corporation | ASE Mauritius Inc. | Subsidiary of the Company | US$ 217,800,000 | 217,800,000 | 100.00% | - | - |
| ASE Labuan Inc. | Subsidiary of the Company | US$ 126,184,000 | 126,184,067 | 100.00% | - | - | |
| ASE Labuan Inc. | ASE Electronics Inc. | Subsidiary of the Company | US$ 125,813,000 | 398,981,900 | 100.00% | - | - |
| Innosource Limited | Omniquest Industrial Limited | Subsidiary of the Company | US$ 74,000,000 | 74,000,000 | 20.86% | - | - |
| ASE Electronics (Shanghai) Co., Ltd. | Subsidiary of the Company | US$ 12,000,000 | Note 1 | 100.00% | - | - | |
| 24 |
| Name of investment company: | Name of affiliate (Note 1) | Relationship | Actual investment amount | Shares of investment company | Company's Shares held by the invested company | |||
| Number of shares | Percentage (%) | Number of shares | Percentage (%) | |||||
| Universal Scientific Industrial Inc. | Huntington Holdings International Co., Ltd. | Subsidiary of the Company | 8,370,606 | 255,856,840 | 100.00% | - | - | |
| Huntington Holdings International Co.,Ltd. | Unitech Holdings International Co., Ltd. | Subsidiary of the Company | US$ 3,000,000 | 3,000,000 | 100.00% | - | - | |
| Real Tech Holdings Limited | Subsidiary of the Company | US$ 149,151,000 | 149,151,000 | 100.00% | - | - | ||
| Universal ABIT Holding(Cayman) Co., Ltd. | Subsidiary of the Company | US$ 28,125,000 | 90,000,000 | 100.00% | - | - | ||
| Rising Capital Investment Limited | Subsidiary of the Company | US$ 6,000,000 | 6,000,000 | 100.00% | - | - | ||
| Rise Accord Limited | Subsidiary of the Company | US$ 2,000,000 | 20,000 | 100.00% | - | - | ||
| Real Tech Holdings Limited | USI Enterprise Limited | Subsidiary of the Company | US$ 210,900,000 | 210,900,000 | 99.59% | - | - | |
| Universal Global Technology (Kunshan) Co., Ltd. | Subsidiary of the Company | US$ 12,000,000 | Note 1 | 100.00% | ||||
| USI Electronics Inc. | Universal Global Technology Co., Limited | Subsidiary of the Company | RMB 324,185,000 | 390,000,000 | 100.00% | - | - | |
| Universal Global Technology (Kunshan) Co., Ltd. | Subsidiary of the Company | RMB 250,000,000 | Note 1 | 100.00% | ||||
| Universal Global Electronics (Shanghai) Co., Ltd. | Subsidiary of the Company | RMB 1,330,000,000 | Note 1 | 100.00% | ||||
| Universal Global Technology (Shanghai) Co., Ltd. | Subsidiary of the Company | RMB 50,000,000 | Note 1 | 100.00% | ||||
| USI Electronics (Shenzhen) Co., Ltd. | Subsidiary of the Company | RMB 292,812,000 | Note 1 | 50.00% | ||||
| Universal Global Technology Co., Limited | Universal Technology Co., Ltd. | Subsidiary of the Company | US$ 11,000,000 | 85,800,000 | 100.00% | - | - | |
| Universal Global Scientific Industrial Co., Ltd. | Subsidiary of the Company | US$ 62,235,000 | 198,000,000 | 100.00% | - | - | ||
| USI Japan Co., Ltd. | Subsidiary of the Company | US$ 885,000 | 6,400 | 100.00% | - | - | ||
| Universal Scientific | Subsidiary of the | US$ 23,963,000 | 281,085,325 | 100.00% | - | - | ||
| 25 |
| Name of investment company: | Name of affiliate (Note 1) | Relationship | Actual investment amount | Shares of investment company | Company's Shares held by the invested company | |||
| Number of shares | Percentage (%) | Number of shares | Percentage (%) | |||||
| Industrial De Mexico S.A. De C.V. | Company | |||||||
| USI America Inc. | Subsidiary of the Company | US$ 9,500,000 | 250,000 | 100.00% | ||||
| USI Electronics (Shenzhen) Co., Ltd. | Subsidiary of the Company | US$ 37,500,000 | Note 1 | 50.00% | - | - | ||
| Universal Global Scientific Industrial Co., Ltd. | Universal Scientific Industrial Co., Ltd. | Subsidiary of the Company | 792,064 | 39,603,222 | 99.01% | - | - | |
| ASE Mauritius Inc. | ASE (Shanghai) | Subsidiary of the Company | US$ 140,542,000 | Note 1 | 100.00% | - | - | |
| ASE (Kunshan) Inc. | Subsidiary of the Company | US$ 80,000,000 | Note 1 | 29.85% | - | - | ||
| ASE Investment (Kunshan) Inc. | ASE (Kunshan) Inc. | Subsidiary of the Company | US$ 122,000,000 | Note 1 | 45.52% | |||
| Alto Enterprises Limited | ASE (Kunshan) Inc. | Subsidiary of the Company | US$ 66,000,000 | Note 1 | 24.63% | |||
| ASE (Korea) Inc. | ASE (Weihai) | Subsidiary of the Company | US$ 126,500,000 | Note 1 | 100.00% | - | - | |
| ASE (Shanghai) Inc. | Shanghai Ding Hui Real Estate Development Co., Ltd. | Subsidiary of the Company | RMB 1,441,000,000 | Note 1 | 40.03% | - | - | |
| Universal Scientific Industrial (Shanghai) Co., Ltd. | Subsidiary of the Company | RMB 12,900,000 | 18,098,476 | 0.83% | - | - | ||
| ASE (Hong Kong) Inc. | Subsidiary of the Company | US$ 1,000,000 | Note 1 | 100.00% | ||||
| Global Advanced Packaging Technology Limited, Cayman Islands | ASE Assembly & Test (Shanghai) Limited | Subsidiary of the Company | US$ 180,000,000 | Note 1 | 100.00% | |||
| Super Zone Holdings Limited | ASE Circuit Manufacturing Co., Ltd. (China) | Subsidiary of the Company | US$ 100,000,000 | Note 1 | 100.00% | - | - | |
| Alto Enterprises Limited | ASE Investment (Kunshan) Inc. | Subsidiary of the Company | US$ 122,000,000 | Note 1 | 100.00% | - | - | |
| ASE Assembly & Test (Shanghai) Limited | Wuxi Tongzhi Microelectronics Co., Ltd. | Subsidiary of the Company | RMB 70,000,000 | Note 1 | 100.00% | - | - | |
| ASE Trading | Subsidiary | RMB 500,000 | Note 1 | 100.00% | - | - | ||
| 26 |
| Name of investment company: | Name of affiliate (Note 1) | Relationship | Actual investment amount | Shares of investment company | Company’s Shares held by the invested company | ||
| Number of shares | Percentage (%) | Number of shares | Percentage (%) | ||||
| (Shanghai) Ltd. | of the Company | ||||||
| Shanghai Ding Hui Real Estate Development Co., Ltd. | Subsidiary of the Company | RMB 2,242,500,000 | Note 1 | 59.97% | |||
| Shanghai Ding Hui Real Estate Development Co., Ltd. | Shanghai Ding Qi Property Management Co., Ltd. | Subsidiary of the Company | RMB 1,000,000 | Note 1 | 100.00% | - | - |
| Shanghai Ding Wei Real Estate Development Co., Ltd. | Subsidiary of the Company | RMB 1,548,000,000 | Note 1 | 100.00% | |||
| Shanghai Ding Yu Real Estate Development Co., Ltd. | Subsidiary of the Company | RMB 1,100,000,000 | Note 1 | 100.00% | |||
| Kun Shan Ding Hong Real Estate Development Co., Ltd. | Subsidiary of the Company | RMB 670,000,000 | Note 1 | 100.00% | |||
| Kun Shan Ding Yue Real Estate Development Co., Ltd. | Subsidiary of the Company | RMB 330,000,000 | Note 1 | 100.00% | |||
| Shanghai Ding Wei Real Estate Development Co., Ltd. | Shanghai Ding Fan Department Store Co., Ltd. | Subsidiary of the Company | RMB 1,500,000 | Note 1 | 100.00% | - | - |
| USI Enterprise Limited | Universal Scientific Industrial (Shanghai) Co., Ltd. | Subsidiary of the Company | US$ 251,163,000 | 1,683,749,126 | 77.38% | - | - |
Note 1: The subsidiary is a corporation limited and therefore does not issue shares.
| 27 |
(3) Background information of President, Vice Presidents, Assistant Vice Presidents, and heads of various departments and branches.
December 31, 2016; Unit: Share; %
| Title | Nationality | Name | Date onboard | Number of shares held | Shares held by spouse and children | Shares held in the names of others | Main work (education) experiences | Concurrent positions in other companies | Manager who is a spouse or a relative within second degree | The condition of managers obtaining employee stock options | |||||
| Number of shares | Percentage of shares | Number of shares | Percentage of shares | Number of shares | Percentage of shares | Title | Name | Relationship | 31,929,000 shares
| ||||||
| CEO | Singapore | Jason C.S. Chang | 2003.05 | 85,070,931 | 1.07% | - | - | 1,693,208,250
(Note1)
| 21.31% | Bachelor in Electrical Engineering, National Taiwan University Master’s degree from the Illinois Institute of Technology | Note 3 | Vice Chairman
Director
| Richard H.P. Chang
Rutherford Chang
| Brother
Son
| |
| President | Hong Kong | Richard H.P. Chang | 2003.02 | 104,414,941 | 1.31% | 121,929,346 | 1.53% | - | - | Bachelor’s degree in industrial engineering, Chung Yuan Christian University in Taiwan Chairman of Universal Scientific Industrial Co., Ltd. (Shanghai) | Note 3 | Chairman | Jason C.S. Chang | Brother | |
| Chief Operating Officer | Republic of China | Tien Wu | 2007.02 | 4,953,386 | 0.06% | - | - | - | - | Doctorate degree in applied mechanics, University of Pennsylvania | Note 3 | None | None | None | |
| Chief Financial Officer | Republic of China | Joseph Tung | 1994.12 | 5,151,908 | 0.06% | 274,915 | 0.00% | - | - | Master’s degree in business administration, University of Southern California Vice President of Citibank | Note 3 | None | None | None | |
| President of ASE Kaohsiung | Republic of China | Raymond Lo | 2006.04 | 3,565,643 | 0.04% | 1,182 | 0.00% | - | - | Bachelor’s degree in electronic physics, National Chiao Tung University | Note 3 | None | None | None | |
| President of Shanghai Headquarter | Republic of China | Jeffery Chen | 2016.05 | 2,100,802 (Note2)
| 0.03% | - | - | - | - | Master’s degree in business administration, University of British Columbia in Canada Vice President of Bankers Trust Taipei | Note 3 | None | None | None | |
| Vice President | Republic of China | Xu-Rui Yu | 1999.08 | 519,259 | 0.01% | - | - | - | - | Department of Radio and Television, National Taiwan University of Arts Vice President of Eastern Broadcasting Co., Ltd. President of Xin Kai Broadcasting Co., Ltd. | Note 3 | None | None | None | |
| 28 |
| Title | Nationality | Name | Date onboard | Number of shares held | Shares held by spouse and children | Shares held in the names of others | Main work (education) experiences | Concurrent positions in other companies | Manager who is a spouse or a relative within second degree | The condition of managers obtaining employee stock options | |||||
| Number of shares | Percentage of shares | Number of shares | Percentage of shares | Number of shares | Percentage of shares | Title | Name | Relationship | 31,929,000 shares
| ||||||
| Vice President | Republic of China | Shih-Wen Lee | 2004.01 | 1,016,234 | 0.01% | - | - | - | - | Bachelor’s degree in electronic physics, National Cheng Kung University | None | None | None | None | |
| Vice President | Republic of China | Kwang-Chun Chou | 2004.01 | 82,203 | 0.00% | - | - | - | - | Bachelor's degree in mechanical engineering, National Cheng Kung University | None | None | None | None | |
| Vice President | Republic of China | Kuo-Tang Lin | 2004.08 | 2,037,773 | 0.03% | 3,242 | 0.00% | - | - | Bachelor's degree in eletrical engineering, Kun Shan University | None | None | None | None | |
| Vice President | Republic of China | Huan-Hua Mo | 2004.08 | 858 | 0.00% | - | - | - | - | Bachelor's degree in mechanical engineering, University of Birmingham | None | None | None | None | |
| Vice President | Republic of China | Ching-Kun Yeh | 2004.08 | 276,622 | 0.00% | - | - | - | - | Bachelor’s degree in physics, Soochow University | None | None | None | None | |
| President of ASE Zhongli | Republic of China | Tien-Chi Chen | 2015.08 | 1,492,504 | 0.02% | - | - | - | - | Bachelor’s degree in industrial engineering, Chung Yuan Christian University | Note 3 | None | None | None | |
| Vice President | Republic of China | Chen-Ming Cheng | 2006.07 | 6,416 | 0.00% | - | - | - | - | Bachelor's degree in mechanical engineering, Tamkang University | None | None | None | None | |
| Vice President | Republic of China | Song-Ching Hong | 2011.01 | 723,275 | 0.01% | - | - | - | - | Doctrate in Machinery, University of Texas System | None | None | None | None | |
| Vice President | Republic of China | Yen-Chieh Tsao | 2012.12 | - | - | - | - | - | - | Bachelor’s degree in physics, Chinese Culture University | None | None | None | None | |
| Vice President | Republic of China | Chih-Bing Hong | 2014.03 | 410,000 | 0.01% | 25,000 | 0.00% | - | - | Doctrate in electronics, University of Paisley | None | None | None | None | |
| Vice President and Chief of Accounting | Republic of China | Hong-Ming Kuo | 2014.08 | 46,000 | 0.00% | - | - | - | - | Master’s degree in business administration, Boston University | Note 3 | None | None | None | |
Note 1: Number of shares pledged was 248,471,522
Note 2: Number of shares pledged was 700,000
Note 3: Summary of concurrent positions in other companies
| Title | Name | Concurrent positions in other companies |
| CEO | Jason C.S. Chang | CEO, Chairman, Director (representative) of ASE Inc.; Chairman, Director (representative) of ASE (Nanzih) Inc.; Director of ASE Japan Co., Ltd.; Chairman, Director (representative) of ASE Test Inc.; Director of ASE Test Holding, Ltd.; Director of ASE (Korea) Inc.; Director of ISE Labs, Inc.; Director of A.S.E. Holding Ltd. (Bermuda); Director of J&R Holding Ltd. (Bermuda); Director of Innosource Ltd.; Director of ASE (Kunshan) Inc.; Chairman of ASE Test Limited (Singapore); Chairman of ASE |
| 29 |
| Title | Name | Concurrent positions in other companies |
| (Shanghai) Inc.; Director of ASE Electronics (Shanghai); Chairman of ASE Investment (Kunshan) Inc.; Chairman, Director (representative) of ASE Electronics Inc.; Director of ASE Mauritius Inc.; Director of ASE Corporation; Chairman of Suzhou ASEN Semiconductors Co., Ltd.; Director of ASE Labuan Inc.; Director of ASE Circuit Manufacturing Co., Ltd. (China); Director of ASE Singapore Pte. Ltd.; Director of Alto Enterprises Ltd.; Director of Super Zone Holdings Ltd.; Director of Anstock Limited; Director of Anstock II Limited; Director of USI Electronics Inc.; Director of Universal Scientific Industrial Co., Ltd. (Shanghai); Director of USI Co., Ltd.; Director of Sino Horizon Holdings Limited; Director of Wealthy Joy Co. Ltd.; Director of Beijing Ding Gu Ding Hao Enterprise Co., Ltd.; Director of Shanghai Ding Rong Real Estate Development Co., Ltd.; Director of Chongqing Ding Gu Real Estate Development Co., Ltd.; Director of Shanghai Ding Xing Property Ltd.; Supervisor of Kun Shan Ding Yao Real Estate Development Co., Ltd.; Supervisor of Shanghai Ding Jia Real Estate Development Co., Ltd.; Supervisor of Shanghai Ding Tong Real Estate Development Co., Ltd.; Supervisor of Shanghai Hong Xiang Property Ltd.; Supervisor of Shanghai Ming Long Construction Development Co., Ltd.; Director of Shanghai Ding Yi Real Estate Development Co., Ltd.; Director of True Elite Holdings Limited; Director of Wenzhou Hong De Construction Development Co., Ltd.; Director of ASE Enterprises; Director of Ding Chang Investment Inc.; Director of Ding Gu Investment Inc.; Chairman of Wan Chang Investment Inc.; Director of Wan Ya Investment Inc.; Director of Wei Dong Investment Inc.; Director of Rui Chang Investment Inc.; Director of Shao Chang Investment Inc.; Chairman of Jia Qing Investment Inc.; Chairman of Jia Ying Investment Inc.; Director of Ming Tong Investment Inc.; Director of Ming Xiang Investment Inc.; Director of Qi Chang Investment Inc. | ||
| President | Richard H.P. Chang | President and Vice Chairman of ASE Inc.; Director (representative) of ASE (Nanzih) Inc.; Director of Innosource Ltd.; Director of ASE (Shanghai) Inc.; Director (representative) of ASE Test Inc.; Director of Omniquest Industrial Ltd.; Director of ASE Test Limited (Singapore); Director of ASE (Korea) Inc.; Director of ASE Electronics (Malaysia), Sdn, Bhd.; Director of A.S.E. Holding Ltd. (Bermuda); Director of J&R Holding Ltd. (Bermuda); Chairman of ASE (Kunshan) Inc.; Chairman of ASE Electronics (Shanghai); Director of GAPT-Cayman; Director of ASE Assembly & Test (Shanghai) Ltd.; Director of ASE Japan Co., Ltd.; Chairman of ASE (Hong Kong) Inc.; Director of Suzhou ASEN Semiconductors Co., Ltd.; Director of ASE Labuan Inc.; Director of ASE Circuit Manufacturing Co., Ltd. (China); Director of Alto Enterprises Ltd.; Director of Super Zone Holdings Ltd.; Director of Anstock Limited; Director of RTH; Chairman of USI Electronics Inc.; Chairman of Universal Global Technology (Kunshan) Co., Ltd.; Chairman of USI Electronics (Shenzhen) Co., Ltd.; Chairman of Global Electronics Inc.; Director of Universal Technology Co., Ltd.; Director (representative) of Universal Global Scientific Industrial Co., Ltd.; Director of USI Enterprise Limited; Chairman of Universal Global Technology (Kunshan) Co., Ltd.; Director of Universal Scientific Industrial Co., Ltd. (Shanghai); Chairman of Huang Wei Electronics (Shanghai) Co., Ltd.; Chairman of Huang Hao Electronics (Shanghai) Co., Ltd.; Chairman of Sino Horizon Holdings Limited; Director of Wealthy Joy Co. Ltd.; Director of Peak Vision International Limited; Director of Great Sino Development Ltd.; Chairman of Beijing Ding Gu Ding Hao Enterprise Co., Ltd.; |
| 30 |
| Title | Name | Concurrent positions in other companies |
| Chairman of Shanghai Ding Gu Property Co., Ltd.; Chairman of Shanghai Ding Jia Real Estate Development Co., Ltd.; Chairman of Shanghai Ding Tong Real Estate Development Co., Ltd.; Chairman of Shanghai Hong Xiang Property Ltd.; Chairman of Shanghai Ming Long Construction Development Co., Ltd.; Chairman of Shanghai Ding Rong Real Estate Development Co., Ltd.; Chairman of Shanghai Ding Lin Real Estate Development Co., Ltd.; Chairman of Shanghai Ding Xing Property Ltd.; Chairman of Kun Shan Ding Yao Real Estate Development Co., Ltd.; Chairman of Chongqing Ding Gu Real Estate Development Co., Ltd.; Director of Shanghai ASE Department Store Co., Ltd.; President of Chongqing Ding Gu Property Management Co., Ltd.; Chairman of Shanghai Ding Yi Real Estate Development Co., Ltd.; Executive Director of Wuxi Ding Gu Real Estate Development Co., Ltd.; Executive Director of Shanghai McCain Hospitality Co., Ltd.; Director of Wenzhou Hong De Construction Development Co., Ltd.; Director of ASE Enterprises; Director of Wend Di Development Co., Ltd.; Director of Jia Ying Investment Inc.; Chairman of Ming Xiang Investment Inc.; Director of Ming Tong Investment Inc.; Supervisor of Rui Chang Investment Inc.; Director of Jia Qing Investment Inc.; Chairman of Wei Dong Investment Inc.; Director of Shao Chang Investment Inc.; Director of Qi Chang Investment Inc.; Chairman of Ding Chang Investment Inc.; Director of Wan Chang Investment Inc.; Director of Wan Ya Investment Inc.; Supervisor of Ding Gu Investment Inc. | ||
| Chief Operating Officer | Tien Wu | COO and Director (representative) of ASE Inc.; Director of ISE Labs, Inc.; Director of ASE Japan Co., Ltd.; Director of ASE Marketing & Service Japan Co., Ltd.; Director of GAPT-Cayman; Director of ASE Assembly & Test (Shanghai) Limited; Director of Suzhou ASEN Semiconductors Co., Ltd.; Director of ASE (Weihai) Inc.; Director of Wuxi Tongzhi Microelectronics Co., Ltd.; Director (representative) of Universal Scientific Industrial Co., Ltd. (Shanghai); Director (representative) of Universal Scientific Industrial Co., Ltd. |
| Chief Financial Officer | Joseph Tung | CFO and Director (representative) of ASE Inc.; Director (representative) of ASE (Nanzih) Inc.; Supervisor of ASE Japan Co., Ltd.; Director (representative) of ASE Test Inc.; Supervisor of ASE Marketing & Service Japan Co., Ltd.; Director of Innosource Ltd.-; Director of J&R Holding Ltd. (Bermuda); Director of ASE Investment (Labuan) Inc.; Director of Holding Ltd. (Bermuda); Director of Omniquest Industrial Ltd.; Director of ASE Test Holding, Ltd.; Director of ASE (Korea) Inc.; Director of ASE Electronics (Malaysia) Sdn. Bhd.; Director of ASE Mauritius Inc.; Director (representative) of ASE Electronics Inc.; Director of ASE Labuan Inc.; Director of ASE Corporation; Director of Alto Enterprises Ltd.; Director of Anstock Limited; Supervisor of Universal Scientific Industrial Co., Ltd.; Supervisor of Universal Scientific Industrial Inc.; Supervisor of USI Electronics Inc.; Supervisor (representative) of Universal Technology Co., Ltd.; Director (representative) of LuZhu Development Inc.; Supervisor of Wuxi Tongzhi Microelectronics Co., Ltd.; Director of ASE Trading (Shanghai) Ltd.; Director of H.R.SILVINE-CMC Co., Ltd.; Independent Director of Ta Chong Bank; Director (representative) of Advanced Microelectronic Products, Inc.; Director of TLJ Intertech Inc.; Director (representative) of Asia Pacific New Industry Entrepreneurial Investment Inc. |
| President of ASE Kaohsiung | Raymond Lo | Director (representative) of ASE Inc.; President of ASE Kaohsiung; Director (representative) and President of ASE Test Inc. |
Shanghai Headquarter President
| Jeffery Chen | Director (representative) of ASE Inc. ; Director (representative) of ASE Test Inc.; Director of ASE (Kunshan) Inc.; Director of ASE Test Limited (Singapore); Director of ASE Test Holdings Ltd.; Director of Omniquest Industrial Ltd.; Director of ISE Labs, Inc.; Director of ASE Investment (Labuan) Inc.; Director of ASE Electronics (Shanghai); Supervisor of ASE Assembly & Test (Shanghai) Ltd.; Chairman of Shanghai Ding Hui Real Estate Development Co., Ltd.; Director (representative) of ASE |
| 31 |
| Title | Name | Concurrent positions in other companies |
| Electronics Inc.; Director of ASE (Hong Kong) Inc.; Director of Suzhou ASEN Semiconductors Co., Ltd.; Chairman of Shanghai Ding Wei Real Estate Development Co., Ltd.; Chairman of Shanghai Ding Yu Real Estate Development Co., Ltd.; Chairman of Kunshan Ding Hong Real Estate Development Co., Ltd.; Chairman of Kunshan Ding Yue Real Estate Development Co., Ltd.; Chairman of Shanghai Ding Qi Property Co., Ltd.; Director of ASE Trading (Shanghai); Director of Super Zone Holdings Ltd.; Supervisor of USI Co., Ltd.; Supervisor of USI Inc.; Director of HHI; Independent Director and Compensation Committee Member of Mercuries & Associates, Holding Ltd.; Director of Jiangsu Longchen Greentech Co., Ltd. | ||
| Vice President | Xu-Rui Yu | Director of Shanghai Ding Hui Real Estate Development Co., Ltd.; Director of Ding Wei Real Estate Development Co., Ltd.; Director of Shanghai Ding Yu Real Estate Development Co., Ltd.; Director of Kunshan Ding Hong Real Estate Development Co., Ltd.; Director of Kunshan Ding Yue Real Estate Development Co., Ltd.; Director of Shanghai Ding Qi Property Co., Ltd.; Supervisor of USI Co., Ltd.; Supervisor of USI Inc.; Supervisor of Luzhu Development Co., Ltd. |
| President of ASE Zhongli | Chen Tien-chi | Director (representative of ASE Inc. and President of ASE Zhongli; Director (representative) of ASE Test Inc.; Director (representative) of Luzhu Development Co., Ltd.; Supervisor of Suzhou ASEN Semiconductors Co., Ltd. |
| Vice President and Chief of Accounting | Hong-Ming Kuo | Supervisor (representative) of ASE Test Inc.; Director of ASE Singapore Pte. Ltd.; Director of Anstock II Limited; Director of Luzhu Development Co., Ltd. |
| 32 |
(4) Directors and Supervisors
1. Directors
December 31, 2016; Unit: Shares
| Title | Name | Nationality | Date first elected | Date elected | Term | Number and percentage of shares held at the time of election | Current Holdings | Shares held by spouse and underage children | Shares held in the names of others | Main work (education) experiences | Current duties at the Company and at other companies | Spouse or relatives of second degree or closer acting as directors, supervisors, or other department heads | ||||||
| Number of shares | Percentage of shares | Number of shares | Percentage of shares | Number of shares | Percentage of shares | Number of shares | Percentage of shares | Title | Name | Relationship | ||||||||
| Director | Richard H.P. Chang (Vice Chairman)
| Hong Kong | 1984.03.11 | 2015.06.23 | 3 years | 104,414,941 | 1.32% | 104,414,941 | 1.31% | 121,929,346 | 1.53% | - | - | Bachelor’s degree in industrial engineering, Chung Yuan Christian University in Taiwan Chairman of Universal Scientific Industrial Co., Ltd. (Shanghai) | Note 2 | Chairman | Jason C.S. Chang | Brother |
| Director | Rutherford Chang | United States | 2009.06.25 | 2015.06.23 | 3 years | 1,779,708 | 0.02% | 1,779,708 | 0.02% | - | - | - | - | Bachelor’s degree in psychology, Wesleyan University | Note 2 | Chairman | Jason C.S. Chang | Father |
| Director | A.S.E. Enterprises Limited | Hong Kong | 1991.03.30 | 2015.06.23 | 3 years | 1,327,202,773
| 16.82%
| 1,327,202,773 (Note 1)
| 16.71%
| - | - | - | - | - | - | - | - | - |
| Director representative | Jason C.S. Chang (Chairman)
| Singapore | 3 years | Bachelor in Electrical Engineering, National Taiwan University Master’s degree from the Illinois Institute of Technology | Note 2 | Vice Chairman Director
| Richard H.P. Chang Rutherford Chang
| Brother Son
| ||||||||||
| Tien Wu | Republic of China | 3 years | Doctorate degree in applied mechanics, University of Pennsylvania | Note 2 | None | None | None | |||||||||||
| Joseph Tung | Republic of China | 3 years | Master’s degree in business administration, University of Southern California Vice President of Citibank | Note 2 | None | None | None | |||||||||||
| Raymond Lo | Republic of China | 3 years | Bachelor’s degree in electronic physics, National Chiao Tung University | Note 2 | None | None | None | |||||||||||
| Jeffery Chen | Republic of China | 3 years | Master’s degree in business administration, University of British Columbia in Canada Vice President of Bankers Trust Taipei | Note 2 | None | None | None | |||||||||||
| 33 |
| Title | Name | Nationality | Date first elected | Date elected | Term | Number and percentage of shares held at the time of election | Current Holdings | Shares held by spouse and underage children | Shares held in the names of others | Main work (education) experiences | Current duties at the Company and at other companies | Spouse or relatives of second degree or closer acting as directors, supervisors, or other department heads | ||||||
| Number of shares | Percentage of shares | Number of shares | Percentage of shares | Number of shares | Percentage of shares | Number of shares | Percentage of shares | Title | Name | Relationship | ||||||||
| Chen Tien-chi | Republic of China | 3 years | Bachelor’s degree in industrial engineering, Chung Yuan Christian University | Note 2 | None | None | None | |||||||||||
| Independent Directors | You Sheng-Fu | Republic of China | 2009.06.25 | 2015.06.23 | 3 years | - | - | - | - | 4,632 | 0.00% | - | - | Department of Accounting, National Taiwan University College of Management Master, Graduate Institute of Accounting, National Chengchi University | Note 2 | None | None | None |
| Independent Directors | Ta-lin Hsu | United States | 2009.06.25 | 2015.06.23 | 3 years | - | - | - | - | - | - | - | - | Bachelor of Physics, National Taiwan University Master of Physics, NYU Polytechnic School of Engineering Doctor of Electrical Engineering, University of California - Berkeley | Note 2 | None | None | None |
| Independent Directors | Mei-Yue Ho | Republic of China | 2015.06.23 | 2015.06.23 | 3 years | - | - | - | - | - | - | - | - | Bachelor of Agricultural Chemistry, National Taiwan University | Note 2 | None | None | None |
Note 1: Number of shares pledged was 248,471,522
Note 2: Summary of current duties at the Company and at other companies
| 34 |
| Name | Concurrent positions in other companies |
| Jason C.S. Chang | Please refer to Note 3 under (3) Background information of President, Vice Presidents, Assistant Vice Presidents, and heads of various departments and branches. |
| Richard H.P. Chang | Please refer to Note 3 under (3) Background information of President, Vice Presidents, Assistant Vice Presidents, and heads of various departments and branches. |
| Tien Wu | Please refer to Note 3 under (3) Background information of President, Vice Presidents, Assistant Vice Presidents, and heads of various departments and branches . |
| Joseph Tung | Please refer to Note 3 under (3) Background information of President, Vice Presidents, Assistant Vice Presidents, and heads of various departments and branches. |
| Raymond Lo | Please refer to Note 3 under (3) Background information of President, Vice Presidents, Assistant Vice Presidents, and heads of various departments and branches. |
| Jeffery Chen | Please refer to Note 3 under (3) Background information of President, Vice Presidents, Assistant Vice Presidents, and heads of various departments and branches. |
| Chen Tien-chi | Please refer to Note 3 under (3) Background information of President, Vice Presidents, Assistant Vice Presidents, and heads of various departments and branches. |
| Rutherford Chang | Director of ASE Inc.; Director of ASE (Shanghai) Inc.; Director of ASE Circuit Manufacturing Co., Ltd. (China); Director (representative) of ASE Test Inc.; ASE Assembly & Test (Shanghai) Ltd.; Supervisor of ASE (Kunshan) Inc.; Director of ASE (Weihai) Inc.; Director of Shanghai Ding Hui Real Estate Development Co., Ltd.; Director of Shanghai Ding Wei Real Estate Development Co., Ltd.; Director of Shanghai Ding Yu Real Estate Development Co., Ltd.; Director of Kunshan Ding Hong Real Estate Development Co., Ltd.; Director of Kunshan Ding Yue Real Estate Development Co., Ltd.; Director of USI Electronics Inc.; Director (representative) of USI Co., Ltd.; Director (representative) of USI Inc.; Director of Wuxi Tongzhi Microelectronics Co., Ltd.; Director of Beijing Ding Gu Ding Hao Enterprise Co., Ltd.; Director of ASE Investment (Kunshan) Co., Ltd. |
| You Sheng-Fu | Director of Arima Lasers Corp.; Supervisor of ; Supervisor of Dynapack International Technology Corporation; Supervisor of San Fu Chemical Co., Ltd.; Supervisor of Arima Communications Corp. |
| Ta-lin Hsu | Members of the Audit Committee and Compensation Committee; President and Founder of H&Q Asia Pacific; Chairman of Auspicious |
| Mei-yue Ho | Independent director and member of Audit Committee and Remuneration Committee of AU Optronics Corp.; Independent director and member of Audit Committee and Remuneration Committee of Bank of Kaohsiung; Independent director and member of Remuneration Committee of Kinpo Electronics, Inc.; Independent director of Ausnutria Dairy Corporation Ltd. |
| 35 |
2. Supervisors (N/A because the Company has setup an Audit Committee)
3. Major shareholders of corporate shareholders
February 29, 2016
| Name of the corporate shareholders | Major shareholders of corporate shareholders |
| A.S.E. Enterprises Limited | Aintree Limited(100%) |
4. The major shareholders of major corporate shareholders
February 29, 2016
| Name of corporate shareholders | Corporate shareholders' main shareholders |
| Aintree Limited | JC Holdings Limited(100%) |
5. The statuses of expertise and independence of the directors
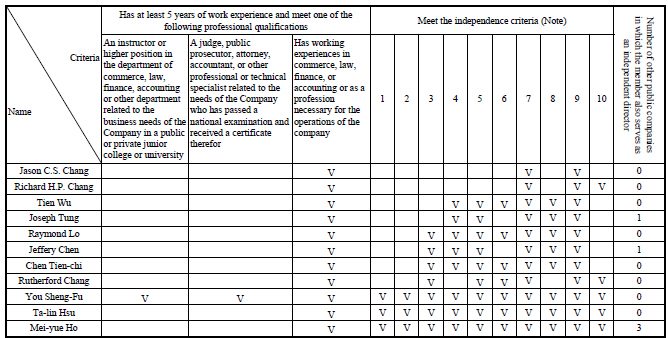
Note: Please fill-in a “ü” in the empty spaces for the various directors and supervisors who fits the following conditions two years prior to their appointments or during their tenures.
| 1. | Not an employee of the Company or any of its affiliates. |
| 2. | Not a director or supervisor of the Company's affiliates (the same does not apply, however, in cases where the member is an independent director of the Company, its parent company, or any subsidiary in which the Company holds, directly or indirectly, more than 50 percent of the voting shares). |
| 3. | Not a natural-person shareholder whose shareholding, together with those of his/her spouse, minor children, and shares held under others' names, exceed 1% of the total number of outstanding shares of the Company, or ranks the person in the top ten shareholders of the Company. |
| 4. | Not a spouse, relative within second degree of kinship, or lineal relative within third degree of kinship of any of the persons in the preceding three paragraphs. |
| 5. | Not a director, supervisor or employee of a juristic-person shareholder that holds directly 5% or more of the total number of outstanding shares of the Company or ranks in the top five shareholders. |
| 6. | Not a director, supervisor, manager or shareholder holding 5% or more of the shares of a specified company or institution that has a financial or business relationship with the Company. |
| 7. | Not a professional or an owner, partner, director, supervisor, manager or a spouse of the abovementioned who provides commercial, legal, financial, accounting services or consultation to the Company or an |
| 36 |
affiliate of the Company. excluding members of compensation committee who exercise power in accordance with Article 7 of the Regulations Governing the Appointment and Exercise of Powers by the Compensation committee of a Company Whose Stock is Listed on the Stock Exchange or Traded Over the Counter.
| 8. | Not having a marital relationship or a relative within the second degree of kinship to any other director of the Company. |
| 9. | With no conditions listed by Article 30 of Company Act. |
| 10. | Not a government agency, juristic person, or its representative set forth in Article 27 of the Company Act of the R.O.C. |
(5) Sponsor: Not applicable.
| 37 |
(6) Remunerations to directors, supervisors, president, and vice presidents in the most recent year
1. Remunerations to directors, supervisors, president, and vice presidents in the most recent year
(1) Remunerations to directors
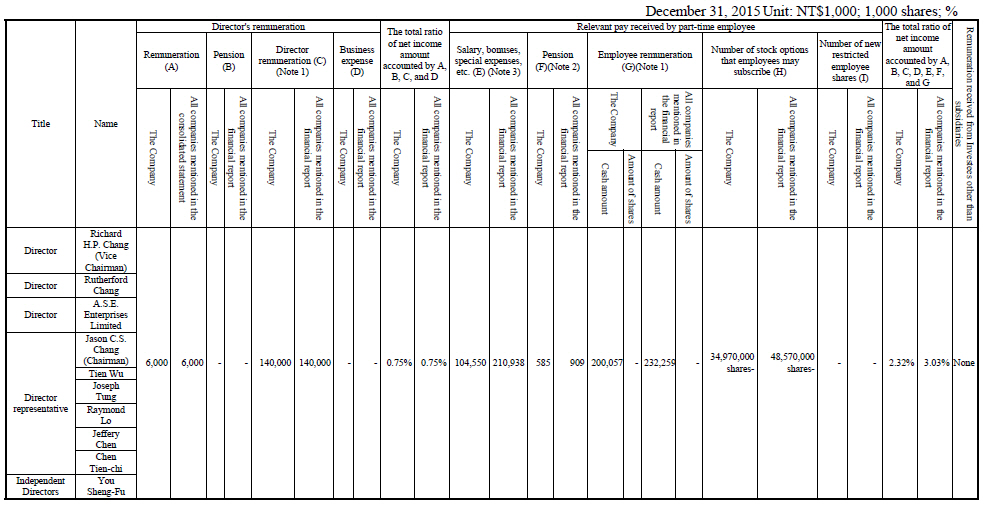
| 38 |

Note 1: The Company's shareholders' meeting passed a resolution on June 28, 2016 to distribute NT$140,000,000 as director remuneration for 2015 and NT$2,033,800,000 as employee remuneration for 2015 (in cash).
Note 2: The actual amount of pension paid by the Company for 2015 was NT$0; The pension amount specified represents the amount of pension contributed.
Note 3: This column excludes the employee stock option expense of the Company (NT$8,565,000) and the amount presented in the financial report (NT$15,532,000).
| 39 |
Remuneration grade table
| Range of remuneration paid to each director | Name of director | |||
| Total amount for the preceding four remunerations (A+B+C+D) | Total amount for the preceding seven remunerations (A+B+C+D+E+F+G) | |||
| The Company | All companies mentioned in the financial report | The Company | All companies mentioned in the financial report | |
| Less than NT$2,000,000 | - | - | - | - |
| NT$2,000,000 (inclusive) to NT$5,000,000 | Sheng-fu You, Ta-lin Hsu, Mei-yueh Ho | Sheng-fu You, Ta-lin Hsu, Mei-yueh Ho | Sheng-fu You, Ta-lin Hsu, Mei-yueh Ho | Sheng-fu You, Ta-lin Hsu, Mei-yueh Ho |
| NT$5,000,000 (inclusive) to NT$10,000,000 | - | - | - | - |
| NT$10,000,000 (inclusive) to NT$15,000,000 | - | - | - | - |
| NT$15,000,000 (inclusive) to NT$30,000,000 | Jason C.S. Chang, Richard H.P. Chang, Tien Wu, Joseph Tung, Raymond Lo, Jeffery Chen, TS Chen, Rutherford Chang | Jason C.S. Chang, Richard H.P. Chang, Tien Wu, Joseph Tung, Raymond Lo, Jeffery Chen, TS Chen, Rutherford Chang | Jeffery Chen | - |
| NT$30,000,000 (inclusive) to NT$50,000,000 | - | - | Richard H.P. Chang, Raymond Lo, TS Chen, Rutherford Chang | TS Chen, Rutherford Chang |
| NT$50,000,000 (inclusive) to NT$100,000,000 | - | - | Tien Wu, Joseph Tung | Richard H.P. Chang, Tien Wu, Joseph Tung, Raymond Lo, Jeffery Chen |
| Greater than NT$100,000,000 | - | - | Jason C.S. Chang | Jason C.S. Chang |
| Total | 11 person(s) | 11 person(s) | 11 person(s) | 11 person(s) |
| 40 |
(2) Supervisor remuneration
An Annual Shareholders' Meeting convened on June 23, 2015 passed a resolution to elect only directors. Three elected independent directors formed an Audit Committee to replace supervisors as of June 24, 2015.
(3) Remunerations to President and Vice Presidents
| 41 |
December 31, 2015 Unit: NT$1,000; %
| Title | Name | Salary (A) (Note 3) | Pension (B) (Note 2) | Bonuses, special expenses, etc. (C) | Employee remuneration (D) (Note 1) | The total ratio (%) of net income amount accounted by A, B, C, and D | Number of employee stock options obtained | Number of new restricted employee shares obtained | Remuneration received from Investees other than subsidiaries | |||||||||
| The Company | All companies mentioned in the financial report | The Company | All companies mentioned in the financial report | The Company | All companies mentioned in the financial report | The Company | All companies mentioned in the financial report | The Company | All companies mentioned in the financial report | The Company | All companies mentioned in the financial report | The Company | All companies mentioned in the financial report | |||||
| Cash amount | Amount of shares | Cash amount | Amount of shares | |||||||||||||||
| CEO | Jason C.S. Chang | 99,959 | 167,449 | 1,665 | 1,881 | 70,042 | 87,029 | 210,128 | - | 219,128 | - | 1.96% | 2.44% | 37,269,000 shares
| 50,519,000 shares
| - | - | None |
| President | Richard H.P. Chang | |||||||||||||||||
| Chief Operating Officer | Tien Wu | |||||||||||||||||
| Chief Financial Officer | Joseph Tung | |||||||||||||||||
| President of ASE Kaohsiung | Raymond Lo | |||||||||||||||||
| President of ASE Zhongli | Chen Tien-chi | |||||||||||||||||
| Vice President | Xu-Rui Yu | |||||||||||||||||
| Vice President | Dao-You Chen | |||||||||||||||||
| Vice President | Shih-Wen Lee | |||||||||||||||||
| Vice President | Kwang-Chun Chou | |||||||||||||||||
| Vice President | Kuo-Tang Lin | |||||||||||||||||
| Vice President | Huan-Hua Mo | |||||||||||||||||
| Vice President | Ching-Kun Yeh | |||||||||||||||||
| Vice President | Chen-Ming Cheng | |||||||||||||||||
| Vice President | Song-Ching Hong | |||||||||||||||||
| Vice President | Yen-Chieh Tsao | |||||||||||||||||
| Vice President | Chih-Bing Hong | |||||||||||||||||
| Vice President and Chief of Accounting | Hong-Ming Kuo | |||||||||||||||||
Note 1: The Company's shareholders' meeting passed a resolution on June 28, 2016 to distribute NT$140,000,000 as director remuneration for 2015 and NT$2,033,800,000 as employee remuneration for 2015 (in cash).
Note 2: The actual amount of pension paid by the Company for 2015 was NT$0; The pension amount specified represents the amount of pension contributed.
Note 3: This column excludes the employee stock option expense of the Company (NT$9,086,000) and the amount presented in the financial report (NT$15,834,000)
| 42 |
Remuneration grade table
| ange of remuneration paid to each president and vice president | Names President and Vice Presidents | |
| The Company | All companies mentioned in the financial report | |
| Less than NT$2,000,000 | - | - |
| NT$2,000,000 (inclusive) to NT$5,000,000 (exclusive) | Ching-Kun Yeh | Ching-Kun Yeh |
| NT$5,000,000 (inclusive) to NT$10,000,000 (exclusive) | Huan-Hua Mo, Xu-Rui Yu, Kwang-Chun Chou, Dao-You Chen, Chen-Ming Cheng, Kuo-Tang Lin, Yen-Chieh Tsao, Hong-Ming Ku, Chih-Bing Hong, Shih-Wen Lee | Huan-Hua Mo,Kwang-Chun Chou, Dao-You Chen, Chen-Ming Cheng, Kuo-Tang Lin, Hong-Ming Ku, Chih-Bing Hong, Shih-Wen Lee |
| NT$10,000,000 (inclusive) to NT$15,000,000 (exclusive) | Song-Ching Hong | Xu-Rui Yu, Yen-Chieh Tsao, Song-Ching Hong |
| NT$15,000,000 (inclusive) to NT$30,000,000 (exclusive) | Richard H.P. Chang, TS Chen | - |
| NT$30,000,000 (inclusive) to NT$50,000,000 (exclusive) | Joseph Tung, Raymond Lo | Richard H.P. Chang, TS Chen |
| NT$50,000,000 (inclusive) to NT$100,000,000 (exclusive) | Jason C.S. Chang, Tien Wu | Richard H.P. Chang, Tien Wu, Joseph Tung, Raymond Lo |
| Greater than NT$100,000,000 | - | - |
| Total | 18 person(s) | 18 person(s) |
(4) Names and employee remuneration allotment status of the managers
Unit: NT$ 1,000
| Title | Name | Amount of shares | Cash amount (Note) | Total | The total ratio (%)
of net income amount
| |
| Manager | CEO | Jason C.S. Chang | - | 210,128 | 210,128 | 1.08% |
| President | Richard H.P. Chang | |||||
| Chief Operating Officer | Tien Wu | |||||
| Chief Financial Officer | Joseph Tung | |||||
| President of ASE Kaohsiung | Raymond Lo | |||||
| President of ASE Zhongli | Chen Tien-chi | |||||
| Vice President | Xu-Rui Yu | |||||
| Vice President | Dao-You Chen | |||||
| Vice President | Shih-Wen Lee | |||||
| Vice President | Kwang-Chun Chou | |||||
| Vice President | Kuo-Tang Lin | |||||
| Vice President | Huan-Hua Mo | |||||
| Vice President | Ching-Kun Yeh | |||||
| Vice President | Chen-Ming Cheng | |||||
| Vice President | Song-Ching Hong | |||||
| Vice President | Yen-Chieh Tsao | |||||
| Vice President | Chih-Bing Hong | |||||
| Vice President and Chief of Accounting | Hong-Ming Kuo |
Note: The Company's shareholders' meeting passed a resolution on June 28, 2016 to distribute NT$140,000,000 as director remuneration for 2015 and NT$2,033,800,000 as employee remuneration for 2015 (in cash).
| 43 |
2. Separately compare and describe total remuneration, as a percentage of net income stated in the Company on financial reports or individual financial reports, as paid by the Company and by each other company included in the consolidated financial statements during the past 2 fiscal years to directors, supervisors, general managers, and assistant general managers, and analyze and describe remuneration policies, standards, and packages, the procedure for determining remuneration, and its linkage to operating performance and future risk exposure
(1) Total remuneration as a percentage of net income
| Title | 2014 | 2015 | ||
| The Company | All companies mentioned in the financial statement | The Company | All companies mentioned in the financial statement | |
| Directors and Supervisors (Note) | 2.42% | 2.94% | 2.32% | 3.03% |
| President and Vice Presidents | 2.02% | 2.27% | 1.96% | 2.44% |
Note: An Annual Shareholders' Meeting convened on June 23, 2015 passed a resolution to elect only directors. Three elected independent directors formed an Audit Committee to replace supervisors as of June 24, 2015.
(2) Remuneration policies, standards, and packages, the procedure for determining remuneration, and its linkage to operating performance and future risk exposure
The salary paid to the Company's CEO and President is resolved by the Board of Directors of the Company. President remuneration is based on the standard in the peer industry. Each year, the Company regularly examines and compares with its competitors to ensure the competitiveness of the Company's salary. The bonus given is dependent on the Company's earnings and individual performance and is set to an amount that can attract and retain talented employees.
Director remuneration is based on the order of distribution in years with profit and will be specified in the Company's Articles of Incorporation.
IV. Capital and Shares
(1) Type of stock
January 20, 2017; Unit: Share
| Type of stock | Authorized capital | Note | ||
| Shares issued and outstanding | Un-issued shares | Total | ||
| Registered as ordinary shares | 7,949,974,846 | 2,050,025,154 | 10,000,000,000 | Listed shares |
Note: The above table includes the number of shares converted for employee stock options from January 1 to January 20, 2017, but the registration has not yet been changed with the competent authority.
| 44 |
(2) Share capital formation process
1. Share capital formation process
Unit: Share; NT$
| Year Month | Issuance Price | Authorized capital | Paid-up capital | Remarks | ||||
| Number of shares | Amount | Number of shares | Amount | Share capital source | Subscriptions paid with property other than cash | Date and document number of approval | ||
| 84.03 | ─ | 17,200,000 | 172,000,000 | 10,000,000 | 100,000,000 | Startup (cash) | None | March 23, 1984 MOEA Export Processing Zone Administration (1984) She-Zi No. 414 |
| 84.05 | ─ | 20,000,000 | 200,000,000 | 20,000,000 | 200,000,000 | Cash capital increase of NT$100,000,000 | None | May 10, 1984 MOEA Export Processing Zone Administration (1984) Shang-Zi No. 3956 |
| 84.06 | ─ | 23,520,000 | 235,200,000 | 23,520,000 | 235,200,000 | Cash capital increase of NT$35,200,000 | Technology shares of 35,200,000 | June 20, 1984 MOEA Export Processing Zone Administration (1984) Shang-Zi No. 5246 |
| 86.08 | ─ | 33,121,625 | 331,216,250 | 33,121,625 | 331,216,250 | Cash capital increase of NT$96,016,250 | None | August 12, 1986 MOEA Export Processing Zone Administration (1986) Shang-Zi No. 7725 |
| 88.06 | ─ | 39,495,000 | 394,950,000 | 39,495,000 | 394,950,000 | Capital increase by earnings of 63,733,750 | None | June 14, 1988 MOEA Export Processing Zone Administration (1988) Shang-Zi No. 5457 |
| 88.09 | ─ | 50,000,000 | 500,000,000 | 50,000,000 | 500,000,000 | Capital increase by earnings of 105,050,000 | None | September 20, 1988 MOEA Export Processing Zone Administration (1988) Shang-Zi No. 8760 |
| 90.01 | ─ | 62,000,000 | 620,000,000 | 62,000,000 | 620,000,000 | Capital increase by earnings of 120,000,000 | None | January 31, 1990 MOEA Export Processing Zone Administration (1990) Shang-Zi No. 0184 |
| 91.01 | ─ | 75,024,000 | 750,240,000 | 75,024,000 | 750,240,000 | Capital increase by earnings and employee bonus of 117,840,000 Capital increase by capital reserve of 12,400,000 | None | January 7, 1991 MOEA Export Processing Zone Administration (1991) Shang-Zi No. 000046 |
| 91.08 | ─ | 125,000,000 | 1,250,000,000 | 105,607,373 | 1,056,073,730 | Capital increase by earnings and employee bonus of 80,761,730 Capital increase by capital reserve of 225,072,000 | None | August 15, 1991 MOEA Export Processing Zone Administration (1991) Shang-Zi No. 006582 |
| 92.05 | 38 | 125,000,000 | 1,250,000,000 | 125,000,000 | 1,250,000,000 | Cash capital increase of 193,926,270 | None | May 18, 1992 MOEA Export Processing Zone Administration (1992) Shang-Zi No. 004195 |
| 92.10 | ─ | 150,600,000 | 1,506,000,000 | 150,600,000 | 1,506,000,000 | Capital increase by earnings and employee bonus of 68,500,000 Capital increase by capital reserve of 187,500,000 | None | October 24, 1992 MOEA Export Processing Zone Administration (1992) Shang-Zi No. 009364 |
| 93.09 | ─ | 165,660,000 | 1,656,600,000 | 165,660,000 | 1,656,600,000 | Capital increase by capital reserve of 150,600,000 | None | September 10, 1993 MOEA Export Processing Zone Administration (1993) Shang-Zi No. 007782 |
| 94.05 | ─ | 260,000,000 | 2,600,000,000 | 233,824,000 | 2,338,240,000 | Capital increase by earnings and employee bonus of 491,131,000 Capital increase by capital reserve of 190,509,000
| None | May 30, 1994 MOEA Export Processing Zone Administration (1994) Shang-Zi No. 4655 |
| 95.02 | 60 | 260,000,000 | 2,600,000,000 | 260,000,000 | 2,600,000,000 | Cash capital increase of 261,760,000 | None | February 6, 1995 MOEA Export Processing Zone Administration (1995) Shang-Zi No. 000907 |
| 95.05 | ─ | 500,000,000 | 5,000,000,000 | 356,800,000 | 3,568,000,000 | Capital increase by earnings and employee bonus of 760,000,000 Capital increase by capital reserve of 208,000,000 | None | May 26, 1995 MOEA Export Processing Zone Administration (1995) Shang-Zi No. 4553 |
| 95.07 | 79.7 | 500,000,000 | 5,000,000,000 | 399,800,000 | 3,998,000,000 | Cash capital increase of 430,000,000 | None | July 29, 1995 MOEA Export Processing Zone Administration (1995) Shang-Zi No. 6711 |
| 45 |
| Year Month | Issuance Price | Authorized capital | Paid-up capital | Remarks | ||||
| Number of shares | Amount | Number of shares | Amount | Share capital source | Subscriptions paid with property other than cash | Date and document number of approval | ||
| reserve of 1,199,400,000 | ||||||||
| 97.06 | ─ | 1,400,000,000 | 14,000,000,000 | 1,017,000,000 | 10,170,000,000 | Capital increase by earnings and employee bonus of 1,640,700,000 Capital increase by capital reserve of 1,239,300,000 | None | June 11, 1997 MOEA Export Processing Zone Administration (1997) Shang-Zi No. 005745 |
| 98.05 | ─ | 2,200,000,000 | 22,000,000,000 | 1,780,000,000 | 17,800,000,000 | Capital increase by earnings and employee bonus of 6,409,600,000 Capital increase by capital reserve of 1,220,400,000 | None | May 8, 1998 MOEA Export Processing Zone Administration (1998) Shang-Zi No. 4310 |
| 99.08 | ─ | 2,200,000,000 | 22,000,000,000 | 1,980,000,000 | 19,800,000,000 | Capital increase by earnings and employee bonus of 1,483,800,000 Capital increase by capital reserve of 516,200,000 | None | August 11, 1999 MOEA Export Processing Zone Administration (1999) Shang-Zi No. 8494 |
| 00.06 | ─ | 2,400,000,000 | 24,000,000,000 | 1,980,355,086 | 19,803,550,860 | 3,550,860 ordinary shares that can be converted from overseas convertible corporate bonds | None | June 1, 2000 MOEA Export Processing Zone Administration (2000) Shang-Zi No. 005552 |
| 00.09 | ─ | 3,200,000,000 | 32,000,000,000 | 2,652,000,000 | 26,520,000,000 | Capital increase by earnings and employee bonus of 6,716,449,140 | None | September 17, 2000 MOEA Export Processing Zone Administration (2000) Shang-Zi No. 09740 |
| 00.10 | 43.81 | 3,200,000,000 | 32,000,000,000 | 2,752,000,000 | 27,520,000,000 | Capital increase by issuing 1,000,000,000 DRs | None | October 23, 2000 MOEA Export Processing Zone Administration (2000) Shang-Zi No. 011577 |
| 01.08 | ─ | 4,150,000,000 | 41,500,000,000 | 3,254,800,000 | 32,548,000,000 | Capital increase by earnings and employee bonus of 5,028,000,000 | None | August 10, 2001 MOEA Export Processing San-Shang-Zi No. 0900007451 |
| 03.09 | ─ | 5,150,000,000 | 51,500,000,000 | 3,580,280,000 | 35,802,800,000 | Capital increase by earnings of 97,644,000 Capital increase by capital reserve of 3,157,156,000 | None | September 18, 2003 MOEA Export Processing San-Shang-Zi No. 09200088290 |
| 04.09 | ─ | 5,150,000,000 | 51,500,000,000 | 3,862,595,437 | 38,625,954,370 | Capital increase by consolidation of 2,823,154,370 | None | September 3, 2004 MOEA Export Processing San-Shang-Zi No. 09301027080 |
| 04.09 | ─ | 5,150,000,000 | 51,500,000,000 | 4,100,000,000 | 41,000,000,000 | Capital increase by earnings of 2,219,773,600 Capital increase by employee bonus of 154,272,030 | None | September 15, 2004 MOEA Export Processing San-Shang-Zi No. 09300078780 |
| 05.01 | ─ | 5,150,000,000 | 51,500,000,000 | 4,100,660,600 | 41,006,606,000 | Conversion of 6,606,000 employee stock options | None | January 31, 2005 MOEA Export Processing San-Shang-Zi No. 09400004370 |
| 05.04 | ─ | 5,150,000,000 | 51,500,000,000 | 4,111,728,800 | 41,117,288,000 | Conversion of 110,682,000 employee stock options | None | April 21, 2005 MOEA Export Processing San-Shang-Zi No. 09400032410 |
| 05.07 | ─ | 5,150,000,000 | 51,500,000,000 | 4,113,744,200 | 41,137,442,000 | Conversion of 20,154,000 employee stock options | None | July 21, 2005 MOEA Export Processing San-Shang-Zi No. 09400059920 |
| 05.09 | ─ | 6,300,000,000 | 63,000,000,000 | 4,550,532,800 | 45,505,328,000 | Capital increase by earnings of 2,878,547,980 Capital increase by employee bonus of 255,674,600 Capital increase by capital reserve of 1,233,663,420 | None | September 29, 2005 MOEA Export Processing San-Shang-Zi No. 09400084400 |
| 05.10 | ─ | 6,300,000,000 | 63,000,000,000 | 4,557,372,300 | 45,573,723,000 | Conversion of 68,395,000 employee stock options | None | October 21, 2005 MOEA Export Processing San-Shang-Zi No. 09400091660
|
| 06.01 | ─ | 6,300,000,000 | 63,000,000,000 | 4,563,877,540 | 45,638,775,400 | Conversion of 65,052,400 employee stock options | None | January 19, 2006 MOEA Export Processing San-Shang-Zi No. 09500005220 |
| 06.04 | ─ | 6,300,000,000 | 63,000,000,000 | 4,573,895,020 | 45,738,950,200 | Conversion of 100,174,800 employee stock options | None | April 24, 2006 MOEA Export Processing San-Shang-Zi No. 09500030630 |
| 46 |
| Year Month | Issuance Price | Authorized capital | Paid-up capital | Remarks | ||||
| Number of shares | Amount | Number of shares | Amount | Share capital source | Subscriptions paid with property other than cash | Date and document number of approval | ||
| 06.07 | ─ | 6,300,000,000 | 63,000,000,000 | 4,577,568,780 | 45,775,687,800 | Conversion of 36,737,600 employee stock options | None | July 19, 2006 MOEA Export Processing San-Shang-Zi No. 09500059250 |
| 06.10 | ─ | 6,300,000,000 | 63,000,000,000 | 4,592,508,620 | 45,925,086,200 | Conversion of 149,398,400 employee stock options | None | October 17, 2006 MOEA Export Processing San-Shang-Zi No. 09500088730 |
| 07.01 | ─ | 6,300,000,000 | 63,000,000,000 | 4,611,311,450 | 46,113,114,500 | Conversion of 188,028,300 employee stock options | None | January 18, 2007 MOEA Export Processing San-Shang-Zi No. 09600005130 |
| 07.04 | ─ | 6,300,000,000 | 63,000,000,000 | 4,629,639,544 | 46,296,395,440 | Conversion of 39,956,440 overseas non-guaranteed convertible corporate bonds and conversion of 143,324,500 employee stock options | None | April 20, 2007 MOEA Export Processing San-Shang-Zi No. 09600034690 |
| 07.07 | ─ | 6,300,000,000 | 63,000,000,000 | 4,645,295,431 | 46,452,954,310 | Conversion of 85,688,270 overseas non-guaranteed convertible corporate bonds and conversion of 70,870,600 employee stock options | None | July 23, 2007 MOEA Export Processing San-Shang-Zi No. 09600063120 |
| 07.09 | ─ | 8,000,000,000 | 80,000,000,000 | 5,392,899,352 | 53,928,993,520 | Capital increase by earnings of 6,941,010,710 Capital increase by employee bonus of 535,028,500 | None | September 12, 2007 MOEA Export Processing San-Shang-Zi No. 09600079950 |
| 07.10 | ─ | 8,000,000,000 | 80,000,000,000 | 5,447,558,879 | 54,475,588,790 | Conversion of 251,542,070 overseas non-guaranteed convertible corporate bonds and conversion of 295,053,200 employee stock options | None | October 23, 2007 MOEA Export Processing San-Shang-Zi No. 09600090450 |
| 08.01 | ─ | 8,000,000,000 | 80,000,000,000 | 5,466,030,849 | 54,660,308,490 | Conversion of 145,603,600 overseas non-guaranteed convertible corporate bonds and conversion of 39,116,100 employee stock options | None | January 22, 2008 MOEA Export Processing San-Shang-Zi No. 09700004950 |
| 08.04 | ─ | 8,000,000,000 | 80,000,000,000 | 5,476,949,209 | 54,769,492,090 | Conversion of 19,863,200 overseas non-guaranteed convertible corporate bonds and conversion of 89,320,400 employee stock options | None | April 22, 2008 MOEA Export Processing San-Shang-Zi No. 09700033570 |
| 08.07 | ─ | 8,000,000,000 | 80,000,000,000 | 5,484,848,118 | 54,848,481,180 | Conversion of 61,524,590 overseas non-guaranteed convertible corporate bonds and conversion of 17,464,500 employee stock options | None | July 24, 2008 MOEA Export Processing San-Shang-Zi No. 09700063360 |
| 08.08 | ─ | 8,000,000,000 | 80,000,000,000 | 5,681,934,764 | 56,819,347,640 | Capital increase by capital reserve of 1,094,938,940 Capital increase by employee bonus of 383,205,000 and capital increase by earnings of 492,722,520 | None | August 28, 2008 MOEA Export Processing San-Shang-Zi No. 09700077400 |
| 08.10 | ─ | 8,000,000,000 | 80,000,000,000 | 5,690,427,734 | 56,904,277,340 | Conversion of 32,763,800 overseas non-guaranteed convertible corporate bonds and conversion of 52,165,900 employee stock options | None | October 21, 2008 MOEA Export Processing San-Shang-Zi No. 09700094250 |
| 09.01 | ─ | 8,000,000,000 | 80,000,000,000 | 5,690,742,134 | 56,907,421,340 | Conversion of 3,144,000 employee stock options | None | January 19, 2009 MOEA Export Processing San-Shang-Zi No. 09800005500 |
| 09.03 | ─ | 8,000,000,000 | 80,000,000,000 | 5,546,705,134 | 55,467,051,340 | Cancellation of 1,440,370,000 treasury stocks | None | March 16, 2009 MOEA Export Processing San-Shang-Zi No. 09800023510 |
| 09.04 | ─ | 8,000,000,000 | 80,000,000,000 | 5,547,064,694 | 55,470,646,940 | Conversion of 3,595,600 employee stock options | None | April 22, 2009 MOEA Export Processing San-Shang-Zi No. 09800037010 |
| 09.07 | ─ | 8,000,000,000 | 80,000,000,000 | 5,473,127,694 | 54,731,276,940 | Cancellation of 739,370,000 treasury stocks | None | July 14, 2009 MOEA Export Processing San-Shang-Zi No. 09800065960 |
| 47 |
| Year Month | Issuance Price | Authorized capital | Paid-up capital | Remarks | ||||
| Number of shares | Amount | Number of shares | Amount | Share capital source | Subscriptions paid with property other than cash | Date and document number of approval | ||
| 09.07 | ─ | 8,000,000,000 | 80,000,000,000 | 5,473,529,914 | 54,735,299,140 | Conversion of 4,022,200 employee stock options | None | July 21, 2009 MOEA Export Processing San-Shang-Zi No. 09800068350 |
| 09.10 | ─ | 8,000,000,000 | 80,000,000,000 | 5,479,878,254 | 54,798,782,540 | Conversion of 63,483,400 employee stock options | None | October 20, 2009 MOEA Export Processing San-Shang-Zi No. 09800103260 |
| 10.01 | ─ | 8,000,000,000 | 80,000,000,000 | 5,488,458,214 | 54,884,582,140 | Conversion of 85,799,600 employee stock options | None | January 25, 2010 MOEA Export Processing San-Shang-Zi No. 09900005410 |
| 10.04 | ─ | 8,000,000,000 | 80,000,000,000 | 5,495,212,494 | 54,952,124,940 | Conversion of 67,542,800 employee stock options | None | April 23, 2010 MOEA Export Processing San-Shang-Zi No. 09900039480 |
| 10.07 | ─ | 8,000,000,000 | 80,000,000,000 | 5,499,659,994 | 54,996,599,940 | Conversion of 44,475,000 employee stock options | None | July 19, 2010 MOEA Export Processing San-Shang-Zi No. 09900075180 |
| 10.08 | ─ | 8,000,000,000 | 80,000,000,000 | 6,049,157,072 | 60,491,570,720 | Capital increase by capital reserve of 879,195,320 Capital increase by shareholder dividend of 4,615,775,460 | None | August 9, 2010 MOEA Export Processing San-Shang-Zi No. 09900084320 |
| 10.10 | ─ | 8,000,000,000 | 80,000,000,000 | 6,051,987,182 | 60,519,871,820 | Conversion of 28,301,100 employee stock options | None | October 22, 2010 MOEA Export Processing San-Shang-Zi No. 09900113120 |
| 11.01 | ─ | 8,000,000,000 | 80,000,000,000 | 6,029,118,452 | 60,291,184,520 | Conversion of 141,312,700 employee stock options Cancellation of 370,000,000 treasury stocks | None | January 19, 2011 MOEA Export Processing San-Shang-Zi No. 10000006520 |
| 11.04 | ─ | 8,000,000,000 | 80,000,000,000 | 6,050,060,512 | 60,500,605,120 | Conversion of 209,420,600 employee stock options | None | April 21, 2011 MOEA Export Processing San-Shang-Zi No. 10000043460 |
| 11.07 | ─ | 8,000,000,000 | 80,000,000,000 | 6,052,219,212 | 60,522,192,120 | Conversion of 21,587,000 employee stock options | None | July 21, 2011 MOEA Export Processing San-Shang-Zi No. 10000083030 |
| 11.08 | ─ | 9,500,000,000 | 95,000,000,000 | 6,747,954,872 | 67,479,548,720 | Capital increase by shareholder dividend of 6,957,356,600 | None | August 30, 2011 MOEA Export Processing San-Shang-Zi No. 10000101280 |
| 11.10 | ─ | 9,500,000,000 | 95,000,000,000 | 6,753,563,242 | 67,535,632,420 | Conversion of 56,083,700 employee stock options | None | October 19, 2011 MOEA Export Processing San-Shang-Zi No. 10000124020 |
| 12.01 | ─ | 9,500,000,000 | 95,000,000,000 | 6,650,130,772 | 66,501,307,720 | Conversion of 20,425,300 employee stock options Cancellation of 1,054,750,000 treasury stocks | None | January 19, 2012 MOEA Export Processing San-Shang-Zi No. 10100007740 |
| 12.04 | ─ | 9,500,000,000 | 95,000,000,000 | 6,654,716,832 | 66,547,168,320 | Conversion of 45,860,600 employee stock options | None | April 20, 2012 MOEA Export Processing San-Shang-Zi No. 10100043500 |
| 12.07 | ─ | 9,500,000,000 | 95,000,000,000 | 6,657,855,052 | 66,578,550,520 | Conversion of 31,382,200 employee stock options | None | July 24, 2012 MOEA Export Processing San-Shang-Zi No. 10100081100 |
| 12.09 | ─ | 9,500,000,000 | 95,000,000,000 | 7,589,454,606 | 75,894,546,060 | Capital increase by shareholder dividend of 9,315,995,540 | None | September 4, 2012 MOEA Export Processing San-Shang-Zi No. 10100099460 |
| 12.10 | ─ | 9,500,000,000 | 95,000,000,000 | 7,594,149,626 | 75,941,496,260 | Conversion of 46,950,200 employee stock options | None | October 18, 2012 MOEA Export Processing San-Shang-Zi No. 10100117650 |
| 13.01 | ─ | 9,500,000,000 | 95,000,000,000 | 7,602,121,666 | 76,021,216,660 | Conversion of 79,720,400 employee stock options | None | January 18, 2013 MOEA Export Processing San-Shang-Zi No. 10200007680 |
| 48 |
| Year Month | Issuance Price | Authorized capital | Paid-up capital | Remarks | ||||
| Number of shares | Amount | Number of shares | Amount | Share capital source | Subscriptions paid with property other than cash | Date and document number of approval | ||
| 13.04 | - | 9,500,000,000 | 95,000,000,000 | 7,607,502,906 | 76,075,029,060 | Conversion of 53,812,400 employee stock options | None | April 17, 2013 MOEA Export Processing San-Shang-Zi No. 10200044490 |
| 13.07 | - | 9,600,000,000 | 96,000,000,000 | 7,609,816,206 | 76,098,162,060 | Conversion of 23,133,000 employee stock options | None | July 17, 2013 MOEA Export Processing San-Shang-Zi No. 10200082280 |
| 13.10 | 26.1 | 9,600,000,000 | 96,000,000,000 | 7,756,003,946 | 77,560,039,460 | Cash capital increase of 1,300,000,000 Conversion of 161,877,400 employee stock options | None | October 17, 2013 MOEA Export Processing San-Shang-Zi No. 10200118400 |
| 14.01 | - | 9,600,000,000 | 96,000,000,000 | 7,787,159,546 | 77,871,595,460 | Conversion of 311,556,000 employee stock options | None | January 21, 2014 MOEA Export Processing San-Shang-Zi No. 10300007950 |
| 14.04 | - | 9,600,000,000 | 96,000,000,000 | 7,810,454,946 | 78,104,549,460 | Conversion of 232,954,000 employee stock options | None | April 22, 2014 MOEA Export Processing San-Shang-Zi No. 10300046040 |
| 14.07 | - | 10,000,000,000 | 100,000,000,000 | 7,824,220,046 | 78,242,200,460 | Conversion of 137,651,000 employee stock options | None | July 18, 2014 MOEA Export Processing San-Shang-Zi No. 10300085480 |
| 14.10 | - | 10,000,000,000 | 100,000,000,000 | 7,852,537,846 | 78,525,378,460 | Conversion of 283,178,000 employee stock options | None | October 24, 2014 MOEA Export Processing San-Shang-Zi No. 10300125920 |
| 15.01 | - | 10,000,000,000 | 100,000,000,000 | 7,860,491,546 | 78,604,915,460 | Conversion of 79,537,000 employee stock options | None | January 20, 2015 MOEA Export Processing San-Shang-Zi No. 10400006750 |
| 15.04 | - | 10,000,000,000 | 100,000,000,000 | 7,887,881,546 | 78,878,815,460 | Conversion of 273,900,000 employee stock options | None | April 21, 2015 MOEA Export Processing San-Shang-Zi No. 10400040900 |
| 15.07 | - | 10,000,000,000 | 100,000,000,000 | 7,893,157,596 | 78,931,575,960 | Conversion of 52,760,500 employee stock options | None | July 16, 2015 MOEA Export Processing San-Shang-Zi No. 10400076760 |
| 15.10 | - | 10,000,000,000 | 100,000,000,000 | 7,902,928,996 | 79,029,289,960 | Conversion of 97,714,000 employee stock options | None | October 19, 2015 MOEA Export Processing San-Shang-Zi No. 10400114270 |
| 16.01 | - | 10,000,000,000 | 100,000,000,000 | 7,909,741,896 | 79,097,418,960 | Conversion of 68,129,000 employee stock options | None | January 20, 2016 MOEA Export Processing San-Shang-Zi No. 10500008440 |
| 16.04 | - | 10,000,000,000 | 100,000,000,000 | 7,918,272,896 | 79,182,728,960 | Conversion of 85,310,000 employee stock options | None | April 26, 2016 MOEA Export Processing San-Shang-Zi No. 10500040560 |
| 16.07 | - | 10,000,000,000 | 100,000,000,000 | 7,923,622,596 | 79,236,225,960 | Conversion of 53,497,000 employee stock options | None | July 20, 2016 MOEA Export Processing San-Shang-Zi No. 10500071110 |
| 16.10 | - | 10,000,000,000 | 100,000,000,000 | 7,936,473,546 | 79,364,735,460 | Conversion of 128,509,500 employee stock options | None | October 20, 2016 MOEA Export Processing San-Shang-Zi No. 10500105140 |
| 17.01 | - | 10,000,000,000 | 100,000,000,000 | 7,944,875,346 | 79, 448,753,460 | Conversion of 84,018,000 employee stock options | None | January 23, 2017
MOEA Export Processing San-Shang-Zi No 10600009350 |
| 49 |
2. Private fund raising ordinary share handling status for the last three years until the printing date of this prospectus: None.
(3) Recent equity ownership dispersion status
1. Shareholder structure
December 31, 2016; Unit: Shares
Shareholder structure
Quantity | Government institution | Financial institutions | other corporations | Individual investors | Foreign institutions and foreigners | Total |
| Number of people | 4 | 2 | 366 | 169,978 | 1,310 | 171,660 |
| Number of shares held | 199,812,127 | 117,226,000 | 1,234,764,734 | 844,394,333 | 5,548,678,152 | 7,944,875,346 |
| Shareholding ratio | 2.51% | 1.48% | 15.54% | 10.63% | 69.84%
(Note 1)
| 100% |
Note : Shareholding ratio of Chinese investors was 0.0182%.
2. Ownership diversity
December 31, 2016; Unit: Shares
| Shareholding rating | Number of shareholders | Number of shares held | Shareholding ratio |
| 1–999 | 83,118 | 22,356,984 | 0.281% |
| 1,000–5,000 | 57,624 | 136,106,084 | 1.713% |
| 5,001–10,000 | 14,636 | 107,563,234 | 1.354% |
| 10,001–15,000 | 5,440 | 67,042,096 | 0.844% |
| 15,001–20,000 | 3,035 | 53,754,652 | 0.677% |
| 20,001–30,000 | 2,502 | 61,649,956 | 0.776% |
| 30,001–50,000 | 2,173 | 83,166,727 | 1.047% |
| 50,001–100,000 | 1,395 | 97,641,335 | 1.229% |
| 100,001–200,000 | 622 | 87,485,389 | 1.101% |
| 200,001–400,000 | 339 | 94,417,975 | 1.188% |
| 400,001–600,000 | 147 | 72,516,682 | 0.913% |
| 600,001–800,000 | 101 | 69,988,481 | 0.881% |
| 800,001–1,000,000 | 63 | 56,281,182 | 0.708% |
| Over 1,000,001 | 465 | 6,934,904,569 | 87.288% |
| Total | 171,660 | 7,944,875,346 | 100.000% |
3. Name list for major shareholders:
The names of shareholders with more than a 5% ownership interest or shareholders with the top ten shareholding ratios, number of shares held, and the percentage of their holding interest:
December 31, 2016; Unit: Shares
Shares
Name of the main shareholders | Number of shares held | Shareholding ratio |
| A.S.E. Enterprises Limited | 1,327,202,773 | 16.71% |
| Citibank N.A. manages ASE's depositary receipts | 627,589,985 | 7.90% |
| HSBC is entrusted to manage the investment accounts of investment companies | 321,454,196 | 4.05% |
| Cathay Life Insurance Co., Ltd. | 224,554,000 | 2.83% |
| 50 |
Shares
Name of the main shareholders | Number of shares held | Shareholding ratio |
| Fubon Insurance Co., Ltd. | 155,510,000 | 1.96% |
| New labor pension fund system | 125,567,609 | 1.58% |
| Mei-Chen Feng | 121,929,346 | 1.53% |
| Nan Shan Life Insurance Co.., Ltd | 115,486,000 | 1.45% |
| Richard H.P. Chang | 104,414,941 | 1.31% |
Deutsche Bank Custodian University Retirement Equity Fund Investment Account | 100,939,968 | 1.27% |
4. The statuses of directors, supervisors, and shareholders with the shareholding ratio of over 10% for the past two years or the current year who have waived cash capital increase
(1) The statuses of directors, supervisors, and major shareholders who have waived cash capital increase: In the most recent year and as of the printing date of this prospectus, the Company did not increase its capital by cash.
(2) Subscription status of relevant personnel who have waived cash capital increase: None.
5. Equity transfer and equity pledge modification scenario of directors, supervisors, managers and shareholders holding more than 10% of the shares for the last two years until the printing date of this prospectus
(1) Changes in the equity of directors, supervisors, managers and shareholders holding more than 10% of the shares:
Unit: Shares
| Title | Name | 2014 | 2015 | As of December 31, 2016 | |||
| Increase (decrease) in the number of shares held | Increase (decrease) in the number of shares pledged | Increase (decrease) in the number of shares held | Increase (decrease) in the number of shares pledged | Increase (decrease) in the number of shares held | Increase (decrease) in the number of shares pledged | ||
| Directors and major shareholders | A.S.E. Enterprises Limited | - | - | - | - | - | - |
| Represented by: Jason C.S. Chang (Chairman and CEO) | 2,000,000 | - | - | - | - | - | |
| Represented by: Tien Wu (COO) | - | - | - | - | 1,100,000 | - | |
| Represented by: Joseph Tung (CFO) | 120,000 | - | - | - | 1,200,000 | - | |
Represented by: Raymond Lo (President of ASE Kaohsiung) (appointed on June 24, 2015) | - | - | - | - | 1,000,000 | - | |
Represented by: Jeffery Chen (President of Shanghai Headquarter; Note 1) (appointed on June 24, 2015) | (747,000) | - | - | - | 1,056,000 | - | |
| Represented by: TS Chen (President of ASE Zhongli; Note 2) | (530,000) | - | 900,000 | - | |||
| Director | Richard H.P. Chang (Vice Chairman and President) | - | - | - | - | - | - |
| Director | Rutherford Chang | - | - | - | - | - | - |
| Director | J&R Holding Ltd. (dismissed on June 23, 2015) | - | - | - | - | - | - |
Represented by: Raymond Lo (President of ASE Kaohsiung) (dismissed on June 23, 2015) | - | - | - | - | - | - | |
Represented by: Jeffery Chen (dismissed on June 23, 2015) | (747,000) | - | - | - | - | - | |
| Independent Directors | You Sheng-Fu | - | - | - | - | - | - |
| Independent Directors | Ta-lin Hsu | - | - | - | - | - | - |
| Independent Directors | Mei-yue Ho
(appointed on June 24, 2015)
| - | - | - | - | - | - |
| Supervisor | Jerry Chang (dismissed on June 23, 2015) | (612,000)- | - | - | - | - | - |
| 51 |
| Title | Name | 2014 | 2015 | As of December 31, 2016 | |||
| Increase (decrease) in the number of shares held | Increase (decrease) in the number of shares pledged | Increase (decrease) in the number of shares held | Increase (decrease) in the number of shares pledged | Increase (decrease) in the number of shares held | Increase (decrease) in the number of shares pledged | ||
| (dismissed on June 23, 2015) | |||||||
| Supervisor representative | Tseng Yuan-Yi (dismissed on June 23, 2015) | 90,000 | - | - | - | - | - |
Pan Shih-hua (dismissed on June 23, 2015) | - | - | - | - | - | - | |
Chen Tien-chi (dismissed on June 23, 2015) | 350,000 | - | - | - | - | - | |
Chun-che Lee (dismissed on June 23, 2015) | 350,000 | - | - | - | - | - | |
| Vice President | Xu-Rui Yu | (130,000) | - | (9,000) | - | 100,000 | - |
| Vice President | Dao-You Chen (transferred to other duties on November 30, 2016) | - | - | 100,000 | - | - | - |
| Vice President | Shih-Wen Lee | - | - | - | - | 380,000 | - |
| Vice President | Kwang-Chun Chou (Note 3) | - | - | 40,000 | - | - | - |
| Vice President | Kuo-Tang Lin | 100,000 | - | 100,000 | - | 100,000 | - |
| Vice President | Huan-Hua Mo | - | - | 100,000 | - | (109,000) | - |
| Vice President | Ching-Kun Yeh | 61,000 | - | 25,000 | - | 51,000 | - |
| Vice President | Chen-Ming Cheng | 180,000 | - | (60,000) | - | (114,000) | - |
| Vice President | Song-Ching Hong | - | - | 100,000 | - | 170,000 | - |
| Vice President | Yen-Chieh Tsao | - | - | - | - | - | - |
| Vice President | Chih-Bing Hong | 2,000 | - | 95,000 | - | 106,000 | - |
| Vice President | Kuo-An Tang (dismissed on February 28, 2015) | (70,000) | - | - | - | - | - |
| Vice President | Shih-Rong Lan (dismissed on July 31, 2015) | 1,000 | - | - | - | - | - |
| Vice President | He-Di Tseng (dismissed on August 4, 2015) | (150,000) | - | - | - | - | - |
| Vice President | Wen-Chih Shen (Note 4) (dismissed on August 10, 2015) | (72,000) | - | - | - | - | - |
| Vice President and Chief of Accounting | Hong-Ming Ku (Note 5) | - | - | 18,000 | - | - | - |
Note 1: Manager who is newly appointed in May 2016.
Note 2: Manager who is newly appointed in August 2015.
Note 3: Manager who is newly appointed in January 2014.
Note 4: Manager who is newly appointed in March 2014.
Note 5: Manager who is newly appointed in August 2014.
(2) Information on the counterparty in any transfer of equity interests who is a related party: None.
(3) Information on the counterparty in any pledge of equity interests who is a related party: None.
6. Information on the relationship between any of the top ten shareholders (related party, spouse, or kinship within the second degree)
December 31, 2016; Unit: Shares
| Name | Shareholding | Shares held by spouse and underage children | Total shareholding by nominee arrangement | Titles, names and relationships between top 10 shareholders who are a related party, spouse, or with kinship within the second degree. | Remarks |
| 52 |
| Number of shares | Percentage of shares | Number of shares | Percentage of shares | Number of shares | Percentage of shares | Title
(or name)
| Relationship | ||
| A.S.E. Enterprises Limited | 1,327,202,773 | 16.71% | - | - | - | - | |||
| Citibank N.A. manages ASE's depositary receipts | 627,589,985 | 7.90% | - | - | - | - | - | - | |
| HSBC is entrusted to manage the investment accounts of investment companies | 321,454,196 | 4.05% | - | - | - | - | - | - | |
| Cathay Life Insurance Co., Ltd. | 224,554,000 | 2.83% | - | - | - | - | - | - | |
| Fubon Insurance Co., Ltd. | 155,510,000 | 1.96% | - | - | - | - | - | - | |
| New labor pension fund system | 125,567,609 | 1.58% | - | - | - | - | - | - | |
| Mei-Chen Feng | 121,929,346 | 1.53% | 104,414,941 | 1.31% | - | - | Richard H.P. Chang | Spouse (husband) | |
| Nan Shan Life Insurance Co.., Ltd | 115,486,000 | 1.45% | - | - | - | - | - | - | |
| Richard H.P. Chang | 104,414,941 | 1.31% | 121,929,346 | 1.54% | - | - | Mei-Chen Feng | Spouse (wife) | |
Deutsche Bank Custodian University Retirement Equity Fund Investment Account | 100,939,968 | 1.27% | - | - | - | - | - | - |
(4) Stock price, net worth, earnings, dividends and related information for the previous two years
Unit: NT$; Shares
Year
Item
| 2014 | 2015 | As of November 30, 2016 | ||
| Stock price | Before retroaction | High | 42.15 | 48.05 | 39.90 |
| Low | 26.60 | 29.75 | 28.10 | ||
| After retroaction | High | 42.15 | 48.05 | - | |
| Low | 26.60 | 29.75 | - | ||
| Average | 35.06 | 39.22 | 35.53 | ||
| Net worth per share | Pre-distribution | 19.47 | 20.21 | 19.27 | |
| Post-distribution | 17.45 | 18.60 | - | ||
| Earnings per share | Weighted average shares | 8,220,694,389 shares | 8,250,064,481 shares | 8,272,938,978 shares (Note 4) | |
| Earnings per share | Before retroaction | 3.07 | 2.55 (Note 5) | 1.79 (Note 4) | |
| After retroaction | 3.07 | 2.55 (Note 5) | - | ||
| Dividends per share | Cash dividend | 2.00379984 | 1.59718596 | - | |
| Stock dividend | Earnings | - | - | - | |
| Capital surplus | - | - | - | ||
| Accumulated unpaid dividend | - | - | - | ||
Return on investment analysis | P/E ratio (Note 1) | 11.42 | 15.38 | 19.85 (Note 4) | |
| Price-dividend ratio (Note 2) | 17.50 | 24.56 | - | ||
| Cash dividend yield (Note 3) | 0.06% | 0.04% | - | ||
Note 1: P/E ratio=Average closing price per share for the year/earnings per share.
Note 2: Price-dividend ratio=Average closing price per share for the year/cash dividend per share.
Note 3: Cash dividend yield=Cash dividend per share/Average closing price per share for the year.
Note 4: Net worth per share and earnings per share were obtained from the financial report of the most recent quarter that is approved by the CFA.
Note 5: As of September 30, 2016, the Company has identified the investment cost and the difference in the net fair value of assets and liabilities that can be recognized by SPIL, and these amounts were retroactively adjusted in the 2015 financial statement. Earnings per share was retroactively adjusted to NT$2.51.
(5) Dividend policy and implementation status
1. Dividend policy according to the Articles of Incorporation
ASE is now at the stage of steady growth. To provide ASE with the funds it needs to expand and satisfy shareholders' desire for cash inflow, ASE adopts a Residual Dividend Policy. With which, cash dividends shall not fall below 30% of all dividends, with the remainder distributed in the form of stock dividends. Dividend distribution proposals shall
| 53 |
be drafted by the board and approved by the AGM before they are implemented.
2. Previous discussions regarding dividend distribution for the current year
The Company’s shareholders' meeting passed a resolution on June 28, 2016 to distribute a shareholder dividend of NT$12,476,779,033 in cash at NT$1.6 per share. The above distribution of dividends to shareholders and the cash and stock dividend distribution rates are calculated based on the number (7,797,986,896) of shares recorded in the Register of Shareholders as of March 23, 2016 after treasury stocks that were already bought back by ASE were subtracted. If at a later date ASE’s ECB holders exercise the right of conversion, or new shares are issued to employees against Employee Stock Option warrants, or new shares are issued by ASE for cash increase, or there is a buyback of ASE’s stock, or transfer or cancellation of ASE’s treasury stocks, which affects the cash distribution rate of the shareholders’ bonus, requiring adjustment, the management has requested the shareholders’ meeting to authorize the Chairman to handle the situation and make adjustments accordingly.
(6) Effect of the proposed stock dividends in the current year on company operating performance and earnings per share: Not applicable.
(7) Remuneration of employees, directors and supervisors
1. Percentages or ranges of remuneration of employees, directors, and supervisors under the Articles of Incorporation:
According to Article 23 of the Company's Articles of Incorporation, if there is surplus profit, the Company shall set aside 5.25% to 8.25% (both inclusive) as compensation to employees and no more than 0.75% (inclusive) as remuneration to the directors; However, if the Company has accumulated losses, the Company shall set aside a part of the surplus profit first for covering the losses.
Regarding the aforementioned employee remuneration, the 5.25% portion shall be distributed to all employees in accordance with the employee remuneration distribution rules, while the portion exceeding 5.25% shall be distributed to individual employees (having special contributions) in accordance with the rules made by the Board of Directors with the authority granted hereby. Where employee remuneration is distributed in the form of stock or cash, it shall be resolved by a majority vote at a meeting attended by more than two thirds of the directors and shall be reported at the shareholders' meeting.
Employees referred to in the three subparagraphs include employees of subsidiary companies that meet certain conditions, which are to be prescribed by the Board of Directors. According to Article 23-1 of the Articles of Incorporation, ASE’s net profits each year after the actual budget shall be distributed in the following order:
(1) Make up losses.
(2) Allocation of 10% as the legal surplus reserve.
(3) Allocation or reversal of a special surplus reserve in accordance with laws or regulations set forth by the relevant competent authority.
(4) Addition or deduction of the portion of retained earnings that are equity investment gains or losses that have been realized or measured at fair value through other overall gains or losses. The remaining balance shall be added to the previous-year undistributed earnings, and the Board of Directors shall devise a dividend distribution proposal, which shall be submitted to a meeting of shareholders for resolution.
2. Basis for estimating the amount of remuneration of employees, directors and supervisors, basis for calculating the number of shares to be distributed as employee remuneration, and the accounting treatment of the discrepancy, if any, between the actual distributed amount and the estimated amount, for the current period:
Estimations of employee remuneration and director remuneration payable for 2015 shall be
| 54 |
respectively calculated according to 8.25% and 0.75% of net profit before tax (in which employee remuneration and director remuneration have not been deducted). Handling of the difference: The difference was recognized as changes in accounting estimates at the time the board passed the resolution. In case of a significant change to the amounts approved by the board of directors after the year has ended, the change is applied to adjust the expenses in the year in which they are recognized. If the amount still changes after the day the financial statements are passed, it shall be treated as changes in accounting estimates and entered into accounts in the following year.
3. Remuneration proposals passed by the Board of Directors None.
4. Remuneration report and results at the shareholders meeting
(1) To pay remuneration of employees, directors and supervisors in cash or stock. In case of any discrepancy between the amounts and the amortized estimates for the year, the differences, reasons, and responses should be disclosed.
The Company passed a resolution at the meeting of the Board of Directors on April 1, 2016 and at the shareholders' meeting on June 28, 2016 to distribute NT$2,033,800,000 (all in cash) as employee remuneration and NT$ 140,000,000 as director remuneration. The difference between the amount to be distributed and the combined amount of employee remuneration of NT$2,033,937,757 and remuneration to directors of NT$184,903,432 is NT$45,041,189. Handling of the difference: The difference was recognized as changes in accounting estimates at the time the board passed the resolution. In case of a significant change to the amounts approved by the board of directors after the year has ended, the change is applied to adjust the expenses in the year in which they are recognized. If the amount still changes after the day the financial statements are passed, it shall be treated as changes in accounting estimates and entered into accounts in the following year.
(2) The percentage of remuneration of employees to be paid in stocks out of the sum of the net profit after tax and total employee remuneration for the current period: Not applicable because employee remuneration for 2015 was distributed in cash.
5. Any discrepancy between actual distribution of remuneration of employees, directors and supervisors (including the number of shares, the amount and stock price) and the recognized remuneration of employees, directors and supervisors and disclosure of the differences, reasons and responses:
Earnings distribution plan and actual distribution of remuneration for 2014 passed in the Annual Shareholders' Meeting on June 23, 2015:
(1) The actual distribution of employee remuneration was NT$2,335,600,000 and director and supervisor remuneration was NT$211,200,000.
(2) The difference between the amount actually distributed and the combined amount of employee remuneration of NT$2,335,785,851 and remuneration to directors of NT$212,344,171 is NT$1,330,022.
Reason for the difference: Accounting estimate adjustments.
Handling status: The difference was recognized as changes in accounting estimates at the time the board passed the resolution.
(8) Stock buyback
November 30, 2016
| Phase of repurchase | 7 |
| Purpose of repurchase | To change share ownership |
| Period of repurchase | 2015/03/03~2015/03/27 |
| Range of repurchase price | NT$42–47 |
| 55 |
| Type and quantity of repurchased shares | 120,000,000 common shares |
| Amount of repurchased shares | NT$5,333,405,737 |
| Quantity of shares eliminated and transferred | 0 shares |
| Accumulated quantity of ASE shares held | 120,000,000 shares |
| Accumulated quantity of ASE shares held to total outstanding shares (%) | 1.51% |
| 56 |
5. Issuance of corporate bonds (including overseas corporate bonds)
(1) Unredeemed corporate bonds and corporate bonds undergoing private placement
| Issuing company | Advanced Semiconductor Engineering, Inc. | ||
| Item | 3rd overseas non-guaranteed convertible corporate bonds | 4th overseas non-guaranteed convertible corporate bonds | 2015 1st non-guaranteed ordinary convertible bonds |
| Date of issue | September 5, 2013 | July 2, 2015 | January 12, 2016 |
| Par value | US$200,000 | US$200,000 | NT$1,000,000 |
| Issuing and trading location | Singapore Exchange (SGX) | Singapore Exchange (SGX) | Taipei Exchange (TPEx) |
| Issuing price | Issued at par value | Issued at par value | Issued at par value |
| Total | US$400,000,000 | US$200,000,000 | NT$900 million |
| Interest rate | 0% | 0% | Tranche A: Fixed annual interest rate of 1.30%
Tranche B: Fixed annual interest rate of 1.50%
|
| Period | 5 years
Maturity Date: September 5, 2018
| 2.75 years (2 years and 9 months)
Maturity Date: March 27, 2018
| Tranche A: 5 years, maturity date: January 12, 2021. Tranche B: 7 years, maturity date: January 12, 2023. |
| Guarantor institution | None | None | None |
| Trustee | Citicorp International Limited | Citicorp International Limited | Taipei Fubon Commercial Bank |
| Underwriting agency | Citigroup Global Markets Ltd,Credit Suisse(HK) Ltd,DBS Bank Ltd,CIMB Bank(L) Ltd | DBS, SC, CIMB, Citigroup and CS | Yuanta Securities Co., Ltd |
| Certified attorney | N/A | N/A | Yi & Cheng Attorneys-At-Law, Guo Hui-ji, Attorney at Law |
| CFA | N/A | N/A | Deloitte & Touche
CPAs Chen Zhen-li and Jiang Jia-ling
|
| Method of repayment | Bullet repayment | Bullet repayment | Bullet repayment for Tranche A and Tranche B |
| Unsettled amount | US$400,000,000 | US$200,000,000 | NT$900 million |
| 57 |
| Issuing company | Advanced Semiconductor Engineering, Inc. | ||
| Item | 3rd overseas non-guaranteed convertible corporate bonds | 4th overseas non-guaranteed convertible corporate bonds | 2015 1st non-guaranteed ordinary convertible bonds |
| Provisions on repurchase or early settlement | (1) After three years of issuing corporates bonds, if the TWSE closing price of the issuing company's ordinary shares for 20 consecutive trading days has been converted into USD according to the exchange rate at the time, and the closing price equals 130% of the conversion price (converted into USD at a fixed exchange rate of US$1:NT$29.956 on the pricing day), then the issuing company may repurchase parts or all of the bonds at the repurchase price in advance.
(2) When 90% of the Company's corporate bonds have been redeemed, repurchased and cancelled or the bond holder has exercised his/her conversion right, the issuing company may repurchase all of the bonds at the repurchase price in advance.
(3) When changes in Taiwan's tax laws and regulations incur a tax increase on the issuing company's corporate bonds in the future, the issuing company may repurchase all of the bonds at the repurchase price in advance.
| (1) As of March 19, 2015 after issuance of these bonds, if the TWSE closing price of the issuing company's ordinary shares for 20 consecutive trading days, out of 30 business days, has been converted into USD according to the exchange rate at the time, and the closing price equals more than 130% of the amount calculated as follows: the amount paid by the issuing company to repurchase the bonds in advance x the conversion price at the time (converted into USD at a fixed exchange rate on the pricing day) ÷ par value, then the issuing company may repurchase parts or all of the bonds at the repurchase price in advance (defined subsequently).
(2) If over 90% of the bonds have been redeemed, converted, repurchased, or cancelled, the issuing company may redeem all of the outstanding bonds in advance at the repurchase price. The actual price at which the issuing company can repurchase bonds in advance shall be determined collectively by the issuing company and lead foreign underwriter according to the market condition on the day on which the bond is priced.
(3) When changes in Taiwan's tax laws and regulations incur a tax increase, additional cost, or cost increase on the issuing company's corporate bonds in the future, the issuing company may repurchase all of the bonds at the repurchase price in advance in accordance with agreement. The actual price at which the issuing company can repurchase bonds in advance shall be determined collectively by the issuing company and lead foreign underwriter according to the market condition on the day on which the bond is priced. If a bond holder does not participate in redemption, the holder may not request the issuing company to bear additional tax or costs.
| None |
| Restriction clauses | None | None | Applicable to only professional investors specified under the Taipei Exchange Rules Governing Management of Foreign Currency Denominated International Bonds |
| Name of credit rating institution, date of rating, and rating level | None | None | Fitch Ratings Ltd., Taiwan Branch Date of rating: December 16, 2015 Rating level: A+ |
| 58 |
| Issuing company | Advanced Semiconductor Engineering, Inc. | |||
| Item | 3rd overseas non-guaranteed convertible corporate bonds | 4th overseas non-guaranteed convertible corporate bonds | 2015 1st non-guaranteed ordinary convertible bonds | |
| Other rights | Amount of ordinary shares that have been converted (exchanged or subscribed), DRs, or other securities | As of November 30, 2016, NT$0 corporate bonds have been converted into ordinary shares, for an accumulated total of 0 ordinary shares been converted. | As of November 30, 2016, NT$0 corporate bonds have been converted into ordinary shares, for an accumulated total of 0 ordinary shares been converted. | N/A |
| Issuance and conversion (exchange or subscription) guidelines | In accordance with the Company's Guidelines for Issuance and Conversion of 3rd Foreign Non-Guaranteed Convertible Corporate Bonds | In accordance with the Company's Guidelines for Issuance and Conversion of 4th Foreign Non-Guaranteed Convertible Corporate Bonds | N/A | |
| Possible dilution conditions and influence on shareholders' interests | The Company's unsettled principal for its foreign 3rd non-guaranteed convertible corporate bonds amounted to US$400,000,000 as of the end of November. According to the current conversion price of NT$28.99, it is anticipated that the corporate bonds can be converted to 413,328,734 shares, accounting for 5.21% of the total shares issued, which exert no material impact on shareholders' interests. | The Company's unsettled principal for its foreign 4th non-guaranteed convertible corporate bonds amounted to US$200,000,000 as of the end of November. According to the current conversion price of NT$49.52, it is anticipated that the corporate bonds can be converted to 124,911,147 shares, accounting for 1.57% of the total shares issued, which exert no material impact on shareholders' interests. | N/A | |
| Custodian | N/A | N/A | N/A | |
| 59 |
(2) Corporate bonds to mature within one year
| Issuing company | Anstock II Limited | |
| Item | 1st in 2014 | |
| Date of issue | July 24, 2014 | |
| Par value | US$200,000 | |
| Issuing and trading location | Singapore Exchange (SGX) | |
| Issuing price | Issued at par value | |
| Total | US$300,000,000 | |
| Interest rate | 2.125% | |
| Period | 3 years, maturity date: July 24, 2017 | |
| Guarantor institution | Guaranteed by ASE Inc. | |
| Trustee | The Hongkong and Shanghai Banking Corporation Limited | |
| Underwriting agency | The Hongkong and Shanghai Banking Corporation Limited、Citigroup Global Markets Limited、DBS Bank Ltd | |
| Certified attorney | Baker & McKenzie、Maples and Calder、Davis Polk & Wardwell | |
| CFA | Deloitte & Touche | |
| Method of repayment | Bullet repayment | |
| Unsettled amount | US$300,000,000 | |
| Provisions on repurchase or early settlement | 1. When a change in the controlling rights of the issuer and guarantor occurs, the issuer may, upon the request of the bond holder, redeem all issued bonds at a purchase price that equals 101% of the principal plus the accrued and unpaid interest (however, interest is calculated without including the day on which the change in controlling right occurred, and the day of redemption for the bond holder may be no later than 60 days after the day on which a change in the issuer's controlling right occurs.
2. When a change in both party's governmental tax policies causes a change in the principal and accrued interest, the bond issuer must notify the bond holder within 30 to 60 days.
| |
| Restriction clauses | None | |
| Name of credit rating institution, date of rating, and rating level | Fitch Ratings on July 11, 2014: BBB | |
| Other rights | Amount of ordinary shares that have been converted (exchanged or subscribed), DRs, or other securities | N/A |
| Issuance and conversion (exchange or subscription) guidelines | N/A | |
| Possible dilution conditions and influence on shareholders' interests | N/A | |
| Custodian | N/A | |
(3) For any issued convertible corporate bonds which are convertible to common shares, overseas depositary receipts or any other securities:
Unit: NT$
| Issuing company | Advanced Semiconductor Engineering, Inc. | |
| Type of Corporate Bonds | 3rd overseas non-guaranteed convertible corporate bonds | 4th overseas non-guaranteed convertible corporate bonds |
| 60 |
Year
Item | 2014 | 2015 | As of November 30, 2016 | 2014 | 2015 | As of November 30, 2016 | |
| Convertible corporate bond market | High | 129.227 | 144.915 | 128.867 | - | 101.065 | 98.527 |
| Low | 105.587 | 107.717 | 105.929 | - | 91.89 | 90.422 | |
| Average | 118.829 | 124.947 | 119.083 | - | 95.676 | 94.431 | |
| Conversion price | 28.99 (applicable as of August 21, 2016) | 49.52 (applicable as of August 21, 2016) | |||||
| Issuing date and conversion price at time of issue | Date of issue: September 5, 2013 Conversion price at time of issue: 33.085 | Date of issue: July 2, 2015 Conversion price at time of issue: 54.5465 | |||||
| Method for exercising of the conversion obligation | When a corporate bond holder exercises his/her conversion right, the issuing company shall, within five business days after receiving the conversion request, deliver new shares by the book entry of Taiwan Depository & Clearing Corporation. If the Company's bond holder who requested for conversion has not yet setup a foreign corporate bond depository account, the issuing company shall deliver new shares by book entry after the holder complete relevant account opening procedures. | When a corporate bond holder exercises his/her conversion right, the issuing company shall, within five business days after receiving the conversion request, deliver ordinary shares by the book entry of Taiwan Depository & Clearing Corporation. If the Company's bond holder who requested for conversion has not yet setup a foreign corporate bond depository account, the issuing company shall deliver ordinary shares by book entry after the holder complete relevant account opening procedures. | |||||
| 61 |
(4) The following matters shall be disclosed for any issued exchangeable corporate bonds: None.
(5) The following matters shall be disclosed if the company adopts the shelf registration method for the offering and issuance of ordinary corporate bonds: None.
(6) The following matters shall be disclosed for any issued corporate bonds with warrants: None.
(7) Status of private placements of corporate bonds in the three most recent years, and up to the date of publication of the prospectus: None.
6. Issuance of preferred stocks: None.
7. Issuance of global depositary receipts (GDR)
November 30, 2016 Unit: US$
Date of issue
Item | September 2000 | June 2003 | ||
| Date of issue | September 2000 | June 2003 | ||
| Issuing and trading location | U.S. New York Stock Exchange | U.S. New York Stock Exchange | ||
| Total amount of issuance | US$140,000,000 | US$86,808,000 | ||
| Unit issuing price | US$7 per unit | US$2.65 per unit | ||
| Total number of issuing unit | 20,000,000 units, each representing five ordinary shares of the Company | 32,757,600 units, each representing five ordinary shares of the Company | ||
| Source of securities | Ordinary shares issued for capital increase | The Company's issued ordinary shares that are held by the Company's shareholders | ||
| Number and value of securities | 100,000,000 ordinary shares, each share has a par value of NT$10. | 163,788,000 ordinary shares, each share has a par value of NT$10. | ||
| Rights and obligations of DR holders | Same as those of common share holders | |||
| Trustee | None | |||
| Depository bank | Citibank | |||
| Custodian bank | Citibank Taipei Branch | |||
| Outstanding | Up to the printing date of the prospectus, the number of outstanding DRs was 125,517,996 units, representing 627,589,985 common shares of the Company. | |||
| Apportionment of expenses for issuance and maintenance | None | |||
| Terms and conditions in the depository agreement and custody agreement | None | |||
| Market price per unit | 2013 | High | 5.38 | |
| Low | 3.87 | |||
| Average | 4.22 | |||
| 2014 | High | 6.89 | ||
| Low | 4.44 | |||
| Average | 5.77 | |||
| 2015 | High | 8.12 | ||
| Low | 4.54 | |||
| Average | 5.97 | |||
| As of November 30, 2016 | High | 6.23 | ||
| Low | 4.39 | |||
| Average | 5.52 | |||
| 62 |
8. Exercise of employee stock option plan (ESOP):
To attract and retain potential professionals, encourage employees, and improve their loyalty, the Company received approval from the competent authority in November 2007, April, 2010, and April 2015 to issue 200,000,000 units of the 3rd employee stock options, 200,000,000 units of the 4th employee stock options, and 100,000,000 units of the 5th employee stock options, respectively. Each unit is subscribed as one ordinary share of the Company, and the subscription price is based on the closing price of the ordinary share on the day of issue. (The 1st and 2nd employee stock options have expired)
(1) Handling status of unexpired employee stock options as of the printing date of the prospectus and influence on shareholders' interest
November 30, 2016
| Type of employee stock option | 3rd employee stock option | 4th employee stock option | 5th employee stock option | |
| First Grant | Second Grant | |||
| Effective date | 2007/11/22 | 2010/04/20 | 2015/04/17 | |
| Date of issue | 2007/12/19 | 2010/05/06 | 2011/04/15 | 2015/09/10 |
| Duration | The duration of these stock options is 10 years, and these options may not be transferred, except in the case of inheritance. At the end of the duration, any unexercised stock options will be considered to have been waived, and the holder may no longer make further claims. | |||
| Number of units for issuance as approved by the Board of Directors | 200,000,000 units | 200,000,000 units | 100,000,000 units | |
| The number of options that can be subscribed as a percentage of outstanding shares | 3.66% | 3.41% | 0.20% | 1.19% |
| Subscription period | 2009/12/19~2017/12/18 | 2012/05/06~2018/05/05 | 2013/04/15~2021/04/14 | 2017/09/10~2025/09/09 |
| Mode of implementation | The company will issue new common shares. | |||
| Vesting schedule (%) | Two years after the holder has been granted the employee stock options, the holder may subscribe these options according to the following vesting schedule.
Vesting period Maximum percentage of exercisable options
After 2 years 40% After 2.5 years 50% After 3 years 60% After 3.5 years 70% After 4 years 80% After 4.5 years 90% After 5 years 100% | |||
| Number of option shares exercised | 117,714,800 shares | 94,231,600 shares | 3, 928,500 shares | 0 shares |
| 63 |
| Type of employee stock option | 3rd employee stock option | 4th employee stock option | 5th employee stock option
| ||
| First Grant | Second Grant | ||||
| Value of option shares exercised | NT$ 2,614,674,479 | NT$ 1,923,148,820 | NT$ 88,784,100 | NT$ 0 | |
| Number of option shares unexercised | 43,707,700 shares | 77,695,900 shares | 7,187,500 shares | 87,845,000 shares | |
| Grant price per unexercised option share | NT$21.1 | NT$20.4 | NT$22.6 | NT$36.5 | |
| Percentage of Shares Unexercised to Total Number of Outstanding Shares (%) | 0.55% | 0.98% | 0.09% | 1.11% | |
| Influence on shareholders' interest | After the two-year holding period of these stock options, these options are exercised in three years, diluting the interests of the existing shareholders on a yearly basis. The dilution effect is limited. | ||||
| 64 |
(2) Employee stock options granted to management team and to top 10 employees
November 30, 2016
| Title | Name | Date of issue | Number of options granted | Percentage of Options Granted to Total Number of Outstanding Shares (%) | Exercised | Unexercised | |||||||
| Number of shares | Price of shares | Value of shares | Percentage of Options to Total Number of Outstanding Shares (%) | Number of shares | Price of shares | Value of shares | Percentage of Options to Total Number of Outstanding Shares (%) | ||||||
| Manager | CEO | Jason C.S. Chang | 2007.12.19 2010.05.06 2011.04.15 2015.09.10
| 39,325,000 | 0.50% | 7,396,000 | 21.47 | 158,780,900 | 0.09% | 31,929,000 | 20.83 (Note) | 665,071,600 | 0.41% |
| President | Richard H.P. Chang | ||||||||||||
| Chief Operating Officer | Tien Wu | ||||||||||||
| Chief Financial Officer | Joseph Tung | ||||||||||||
ASE Kaohsiung President
| Raymond Lo | ||||||||||||
Shanghai Headquarter President
| Jeffery Chen | ||||||||||||
| Vice President. Chungli Branch | Chen Tien-chi | ||||||||||||
Vice President | Xu-Rui Yu | ||||||||||||
| Vice President | Dao-You Chen | ||||||||||||
| Vice President | Shih-Wen Lee | ||||||||||||
| Vice President | Kwang-Chun Chou | ||||||||||||
| Vice President | Kuo-Tang Lin | ||||||||||||
| Vice President | Song-Ching Hong | ||||||||||||
| Vice President | Chih-Bing Hong | ||||||||||||
| Vice President | Huan-Hua Mo | ||||||||||||
| Vice President | Ching-Kun Yeh | ||||||||||||
| Vice President | Chen-Ming Cheng | ||||||||||||
| Vice President | Yen-Chieh Tsao | ||||||||||||
| Vice President and Chief of Accounting | Hong-Ming Kuo | ||||||||||||
| Employee Stock Options Granted to Top 10 Employees | Rutherford Chang | 96.12.19 99.05.06 100.04.15 104.09.10 | 11,020,000 | 0.14% | 4,760,000 | 23.47 | 111,723,500 | 0.06% | 6,260,000 | 20.70 (Note) | 129,566,000 | 0.08% | |
| Chun-che Lee | |||||||||||||
| Chang Hsiang Ching-Ping | |||||||||||||
| Zhi-qiang Lee | |||||||||||||
| Pan Shih-hua | |||||||||||||
| Jerry Chang | |||||||||||||
| Shih-Song Lee | |||||||||||||
| Rui-Ki Mi | |||||||||||||
| Kui-Wen Lee | |||||||||||||
| Dan-Ning Chang | |||||||||||||
| 65 |
Note: Range of share price: NT$20.4-36.5.
9. Restricted stock awards: None.
10. Acquisitions and mergers: None.
11. Any issue of new shares in connection with any acquisition of shares of another company, where still in process: None.
| 66 |
II. Business Overview
I. Company profile
(I) Business Content
1. Business Scope
(1) The Company and its subsidiaries primarily offer three main categories of service, namely semiconductor packaging and testing products, electronic assembly products, and other types of service.
Semiconductor packaging and testing products
A. Packaging: Packaging and module design, IC packaging, multi-chip packaging, micro and hybrid module, memory packaging.
B. Testing: Front-end testing, wafer probing, final testing.
‚Electronic assembly products
Module and mother board design, product and system design, system integration, and logistics management.
lOther
Packaging material sales, real estate development, construction, housing property management, and shopping mall rentals.
(2) Business components
Unit: NT$1,000; %
Year Item | 2014 | 2015 | ||
| Net operating income | Percentage | Net operating income | Percentage | |
| Packaging products | 121,336,453 | 47.29% | 116,607,314 | 41.16% |
| Testing products | 25,874,694 | 10.08% | 25,191,916 | 8.89% |
| EMS products | 105,784,427 | 41.23% | 138,242,100 | 48.80% |
| Others | 3,595,873 | 1.40% | 3,261,206 | 1.15% |
| Total | 256,591,447 | 100.00% | 283,302,536 | 100.00% |
(3) Current product/service lineup
The Company's current product (service) items mainly comprise packaging products, testing products, and electronic assembly products.
(4) New products (services) to be developed
jPackaging technology
| Name | Context |
| Advanced Technology | |
| 3D SiP | 1. Die-to-die, die-to-wafer stacking |
| 2. Fine pitch cu pillar fc solution | |
| 3. Si interposer sip technology | |
| 4. Si optical bench sip technology | |
| 5. Thermo-compression bonding technology | |
| 6. Wafer level mems packaging | |
| 7. Fan-in map pop technology | |
| 8. Fan-out map pop technology | |
| 9. Thin core fc pop technology | |
| 10. Integrated passive device | |
| 67 |
| Name | Context |
| 11. Embedded passive laminate substrate | |
| 12. Embedded passive Si substrate | |
| 13. Embedded active Si substrate | |
| 14. Heterogeneous chip integration SiP | |
| 15. Fine pitch CoC SiP solution | |
| 16. Compartment shielding technology | |
| 17. Double side selective molding technology | |
| 18. 2nd fine line/space substrate stacking | |
| 19. Panel level fan-out/pop technology | |
| 20. Flexible substrate & assembly technology | |
| Optoelectronic packaging (OEP) | 1. High power / high brightness led packaging solution |
| 2. Wafer level white light led packaging solution | |
| 3. Optical sensor packaging solution | |
| 4. Optical-electronic interconnection | |
| Wafer Level Chip Scale Packaging (WLCSP) | 1. Through silicon via |
| 2. Silicon substrate technology | |
| 3. 300mm wafer 2D fan-out WLP | |
| 4. 200mm wafer 3D fan-out WLP | |
| 5. Fine line Cu-plated RDL technology | |
| 6. 4-layer polymer, Cu-plated RDL technology | |
| 7. Low temperature cure polymer, Cu-plated RDL technology | |
| 8. Sawn wafer probing | |
| 9. High IO / Die shrinkage WLCSP | |
| 10. IR through backside lamination (BSL) | |
| 11. Wire redistribution process and protective layer stacking technology development | |
| 12. 5um/5um wire redistribution process technology development | |
| 13. Thin-film wafer BSL technology development | |
| 14. Technology for reducing cutting risks | |
Flip-chip packaging | 1. Coreless flip chip package |
| 2. 20 nm ELK wafer lead-free FC | |
| 3. 300mm TSV wafer 50 um CMP technology | |
| 4. SD laser technology on thin ELK wafer | |
| 5. Molded core embedded package | |
| 6. Molded pre-singulated package | |
| 7. Exposed mold under fill | |
| 8. Flip chip quad flat no leads | |
| 9. Very fine pitch cu pillar flip chip product | |
| 10. HBPOP package development | |
| 11. Cu bumping buried wiring substrates (<16-nm flip chip packaging) | |
| 12. Wafer level 20-nm flip chip packaging and fine substrate structure combination (N20) | |
| 13. High-order flip chip quad flat no-lead development (FC QFN development) | |
| 14. 1 Layer embedded trace substrate (1L ETS) assembly | |
| 15. 2.5D Advanced IC assembly |
| 68 |
| Name | Context |
Radio frequency (RF) Module | 1. MCU + BLE + AoP wireless connection module total solution |
| 2. Irregular FC Cu-pillar multi-band multi-mode SiP module solution | |
| 3. Embedded passive substrate wireless module | |
| Wire bond package | 1. 14-nm Cu / ELK wafer wire bond solution |
| 2. 15-um Cu wire bond technology development | |
| 3. New Cu wire bonding material technology development | |
| 4. New wire bonding material technology development | |
| 5. Low-cost, high-performance aS3 / aQFN | |
| 6. Single layer carrier package development | |
| 7. FC QFN for ATV development | |
| 8. High thermal HS evaluation | |
| 9. Cap on die | |
| Wireless communication SiP module | 1. Composite packaging SiP module integrated with BB+RF(Multi-Bands)+DRAM+PMIC and peripheral passive components with the latest composite wireless communication technology (multiple mode communication SiP module solution) |
| 2. Highly miniaturized and integrated SiP communication function module solution | |
| Bumping | |
| Plating | 1. Low Ag of Sn/Ag lead-free (LF) micro bump plating technology |
| 2. Single PI and single RDL for WLCSP | |
| 3. Micro Cu pillar bumping | |
| 4. RDL+LF bumping | |
| 5. RDL+Cu pillar | |
| 6. FOCoS Cu pllar | |
kTesting technology
| Name | Context |
| New TestTechnology | |
Wafer
probing
| 1. RF wafer probing testing technology |
| 2. High parallel site test solution | |
| 3. Wafer level photonic laser diode burn-in test | |
| 4. Pin coating technology for probe card | |
| 5. Film frame probing solution | |
| 6. Tri-temp wafer probing | |
| 7. Copper pillars probing solution | |
| 8. High parallel site test solution | |
| 9. Thin-wafer test solutions | |
Final
test
| 1. 802.11ac RF SOC test solution |
| 2. USB3.0/PCIE testing technology | |
| 3. G sensor testing technology | |
| 4. Gyro sensor testing technology | |
| 5. Universal wireless SiP test system development | |
| 6. Low cost non-ATE test methodology for low I/O count device test, IoT/wearable devices | |
| 7. High UPH power management IC tester development | |
| 8. Multi-channel multi-function, and multi-process SIP tester development | |
| 9. High channel density SOC tester development | |
| 69 |
| Name | Context |
| 10. Hardware module controlled platform and common tester user interface development | |
| 11. Optical sensor testing solution | |
| 12. Industrial/consumer sensing IC testing solution | |
| 13. USB3.0 Type-C testing technology | |
| 14. MEMS testing technology | |
| 15. SiP testing technology | |
| 16. Strip device testing technology | |
| 17. Tiny package testing technology | |
Test data analysis | Big data analysis/mining prototype system building |
l IPM process technology
| Name | Context |
| New Process Technology | |
Solder paste print die bond to lead frame | 1. >5-mm chip soldering in-line bonding for enhancing UPH. |
| 2. Solder paste interface with a pore size equaling 1% of the interface. | |
Solder paste print passive component bond to lead frame | 1. Solder paste once-off print and component bond to lead frame for enhancing UPH. |
| 2. Passive component solder paste bond to lead frame technology. | |
Al wire bonding to lead frame | >5-mil Al-wire in-line bonding for enhancing UPH. |
LF passive component and exposed Cu heatsink molding | 1. Void-free 50-µm passive component bond. |
| 2. Bonding technology to expose the backside of metal heatsink | |
m COB module process technology
| Name | Context |
| New Process Technology | |
Wire bonding on FPC | 1. Moldering ball bond on a 120-µm think soft circuit board. |
| 2. Enhancing the yield of moldering 0.9-mil Au-wire onto soft circuit board. | |
nElectronic assembly products
It is a longstanding belief that a top-notch process capability, rigorous quality control, and real-time feedback system are the key factors for gaining customer trust and affirmation of the company. In a competitive industrial environment, however, relying on these factors is inadequate for expediting the company's growth dynamic. A company must continuously improve its R&D capacity, increase activities of product R&D, and constantly maintain its leading status in the market. The Company recruits outstanding R&D professionals from Taiwan and China to inject elements of vitality in developing new technologies and products, to integrate software/hardware applications with miniaturization capabilities, and to improve product values and profitability. In addition, the Company will also steer its R&D focus on the following products:
A. Wireless communication module products.
B. Electric circuits for headlamps.
C. Continuing to develop applications for miniature products, including existing
| 70 |
products, IoT, and virtual reality products, and to persist in process improvement.
D. Targeting cloud calculation R&D and network storage technologies and collaborating with wafer companies to introduce high-performing solid state drive.
E. Constantly developing green design products to reduce material and energy consumption.
2. Industry overview
(1) Industry current trends and future outlook
Packaging and testing industry
The Company's packaging and testing products department leverages its core competency in advanced semiconductor packaging and testing technology and process R&D to provide advanced packaging and testing service for semiconductor manufacturers worldwide. The following describes the current status and development trend of the semiconductor industry:
Lukewarm global economic growth, the impact of Brexit, and the rebalancing of economic growth in China have led to predictions of lower economic growth in 2016 compared to 2015. However, the IMF has projected a gradual recovery in the global economy, driven by emerging markets and developing economies. Furthermore, the major economies such as the US, Europe, Japan and China have maintained stability. The IMF and HIS Global Insight both predict that global economic growth in 2017 will be better than 2016.
Predicted economic growth worldwide and in key economies
Unit: %
Year Region | IMF | IHS Global Insight | ||||
| 2015 | 2016 | 2017 | 2015 | 2016 | 2017 | |
| Global | 3.2 | 3.1 (3.1) | 3.4 (3.4) | 2.7 | 2.4 (2.4) | 2.8 (2.8) |
| Advanced economies | 2.1 | 1.6 (1.8) | 1.8 (1.8) | 2.1 | 1.5 (1.5) | 1.7 (1.8) |
| US | 2.6 | 1.6 (2.2) | 2.2 (2.5) | 2.6 | 1.4 (1.5) | 2.2 (2.4) |
| Eurozone | 1.9 | 1.7 (1.6) | 1.5 (1.4) | 1.9 | 1.6 (1.6) | 1.4 (1.3) |
| Japan | 0.5 | 0.5 (0.3) | 0.6 (0.1) | 0.5 | 0.6 (0.6) | 0.7 (0.7) |
| New and developing economies * | 4.0 | 4.2 (4.1) | 4.6 (4.6) | 3.9 | 3.9 (3.9) | 4.5 (4.5) |
| China | 6.9 | 6.6 (6.6) | 6.2 (6.2) | 6.9 | 6.6 (6.6) | 6.3 (6.3) |
Note: The numbers in parentheses are the IMF’s predictions in July of this year, while GI’s predictions were made in September, as well as the official published data for 2015 by each country.
* HIS Global Insight prediction for the economic growth of emerging markets
Source: 1. IMF, World Economic Outlook, Oct. 4, 2016
2. IHS Global Insight Inc., World Overview, Oct. 15, 2016
Gartner revised the sales value of the global semiconductor market for 2016 in October 2016 to US$ 331.8 billion, which reflects a decline of only 0.9% compared with the US$334.8 billion in 2015. This is due to a drop of 11% in the
| 71 |
memory market, including a fall of 20% in DRAM and a growth of 2% in Nand flash memory. Smart cars, electric cars, and the Internet of Things (IoT) will drive the development of semiconductor components in the direction of further miniaturization and low power consumption, leading to a rise in demand for semiconductors. The value is predicted to reach US$350.1 billion in 2017 (5.5% growth), US$365.1 billion in 2018 (4.3% growth), and US$372.6 billion in 2019 (2.1% growth). It is estimated that the scale of the global semiconductor market in 2020 will approach US$384.3 billion.
Forecasting of the global semiconductor market
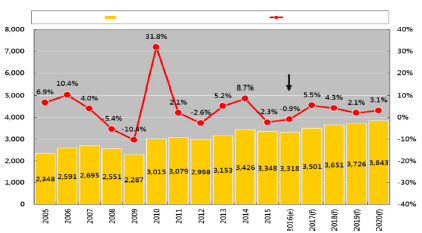
Source: Gartner; IEK (2016/11)
According to IEK's estimation, the semiconductor industry in Taiwan will produce an output of NT$2.43 trillion with a growth of 7.5%. In particular, the output of the design industry was NT$660.1 billion, a growth of 11.4% over 2015. This is mainly due to China's policy of subsidizing smartphones, the entry of memory control IC manufacturers into the global production chain, and panel driver IC manufacturers increasing their production output in high-resolution panels for LCD televisions. The output of the manufacturing industry amounted to NT$1311.7 billion, a growth of 6.6% from 2015. This was mainly due to an influx of orders from advanced processes into the wafer foundry industry, as well as a fall in demand for computer IT products and its subsequent influence on the memory industry. The output of the packaging industry amounted to NT$461 billion, a growth of 4.46% from 2015, with the output of the packaging industry and IC testing industry at NT$322 billion and NT$139 billion, respectively, a growth of 3.9% and 5.8% respectively compared to 2015. This was mainly due to a recovery in demand for advanced packaging among advanced semiconductor processes. The table below presents the operating performance of IC design, manufacturing, packaging and testing industry in Taiwan for the period 2012–2015 and the estimated performance for 2016:2012–2016 output value of IC sub-industries in Taiwan
Unit: NT$ 100 million
Year Detailed items
| 2012 | 2013 | 2014 | 2015 | 2016(e) |
| IC industry output in Taiwan | 16,342 | 18,886 | 22,033 | 22,640 | 24,328 |
| IC design in Taiwan | 4,115 | 4,811 | 5,763 | 5,927 | 6,601 |
| 72 |
Year Detailed items | 2012 | 2013 | 2014 | 2015 | 2016(e) |
| IC manufacturing in Taiwan | 8,292 | 9,965 | 11,731 | 12,300 | 13,117 |
| Foundry service | 6,483 | 7,592 | 9,140 | 10,093 | 11,345 |
| Memory device manufacturing | 1,809 | 2,373 | 2,591 | 2,207 | 1,772 |
| IC packaging and testing industry in Taiwan | 3,935 | 4,110 | 4,539 | 4,413 | 4,610 |
| IC packaging | 2,720 | 2,844 | 3,160 | 3,099 | 3,220 |
| IC testing | 1,215 | 1,266 | 1,379 | 1,314 | 1,390 |
Note: (e) Estimates
Source: TSIA, WSTS, IEK (2016/11)
According to the evolution of the output value of the IC industry in Taiwan in 2016, foundry service (accounting for 46.6%), IC design (accounting for 27.1%) IC packaging and testing (accounting for 18.9%) were the three main pillars of Taiwan’s semiconductor industry. Looking forward to 2017, economic recovery will drive demand in semiconductors, with associated growth in output for smartphone chips, PC chips (including Type-C), and SSD driver ICs. New applications such as vehicle ICs mean that IEK has predicted that the production output of Taiwan's semiconductor industry will grow by 7% in 2017, in which the output of the IC packaging (IC testing) industry will reach NT$343.5 billion (NT$153.3 billion), which reflects a growth of 6.7% (10.3%) compared with that in 2016. In summary, the IC packaging and testing industry in Taiwan will continue to growth 7.8% by 2017, thanks to a recovery in demand and a rise in the proportion of high-end packaging and testing products..
‚Overview of the electronic assembly product industry
The electronic assembly products of the Company and its subsidiaries fall under the electronic manufacturing services (EMS) category, also referred to as electronic contract manufacturing (ECM) or professional electronic OEM service. EMS refers to the provision of a service or multiple services other than brand sale service, including product development and design, material procurement, production and manufacturing, assembly, and after-sale service. EMS mode is classified into EMS and ODM depending on the scope of service, and EMS and ODM are collectively known as design manufacturing service (DMS). At the present stage, electronic domains generally define EMS and ODM modes differently, which are described in the table below.
| Category | Service Scope | ||||||
| Product Concept | R&D Design | Material Procurement | Production & Manufacturing | Logistics | Brand Sale | After-sales service | |
| EMS | No | No | Yes | Yes | Yes | No | Yes |
| 73 |
| Category | Service Scope | ||||||
| Product Concept | R&D Design | Material Procurement | Production & Manufacturing | Logistics | Brand Sale | After-sales service | |
| ODM | Autonomous or Joint | Autonomous or Joint | Yes | Yes | Yes | No | Yes |
Note: DMS providers generally offer services that are free of product concepts, whereas ODM service providers with particularly strong R&D capability provide services that incorporate product concepts.
In summary, DMS is the collective name given to a series of service modes, including product R&D design, product testing, material procurement, production and manufacturing, logistics, repair and maintenance, and other after-sales service, that are provided by electronic product brand owners. Concurrently, because manufacturing service providers and brand customers generally specify their service scope and specific requirements by entering a contract agreement that integrates framework agreement and order forms. Therefore, DMS (including EMS and ODM) is also incorporated in the scope of the manufacturing agreement.
Unlike OEM, EMS provides global transports and global assembly services. With such a global advantage, EMS can engage in production activities in a region without having their imports/exports being withheld by customs, and this advantages saves them from tax costs. Moreover, a global assembly plant and a global transport system can expedite the rate of assembly and delivery processes. In other words, EMS providers can perform optimally in terms of speed and cost. Thanks to its close relationship with part manufacturers (satellite system), EMS providers generally integrate related upstream part manufacturers (by merging or forming a strategic alliance) to further minimize their operation and procurement costs. The global supply chain has increased to a greater scale. To shorten the time required to deliver products to the end consumer market, OEM industries have also extended their supply chain globally. In other words, EMS providers have evolved from offering point-to-point service to a comprehensive support service that facilitates increasing their core value among their competitors.Forecasting of the global EMS income
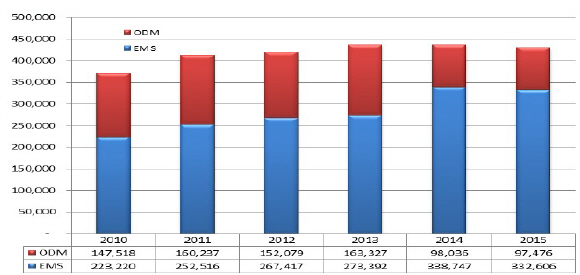
Unit: US$ million
| 74 |
Source: MMI, 2016/06
The global EMS industry grew rapidly in 2013 by 10.7% and then increased by 8% in 2014, after which it experienced a slight decline of 2.4% in 2015 primarily due to the decrease in demand for computer products. In the long run however, EMS remains highly potential, particularly in non-traditional outsourcing applications such as industrial applications, medical industry, automobile, national defense security, and aviation industry. According to the 2016 report published by NVR, the global EMS/ODM income was predicted to reach US$430 billion in 2015, and increasing to US$580 billion by 2020. This suggests an annual compound growth of approximately 6.2% between 2015 and 2020.
(2) Relationships with suppliers in the industry's supply chain
Packaging and testing industry:
In the entire semiconductor supply chain, the Company and its subsidiaries are primarily responsible for supplying materials needed for midstream packaging and testing and downstream packaging. The Company and its subsidiaries offer customers wafer packaging and testing services for semiconductors, purchases wafers primarily from internationally acclaimed semiconductor companies, and maintains a favorable long-term relation with these companies. By vertical division of labor, we are able to enhance our competitiveness as well as that of our strategic alliances and partners.
Structural diagram of the semiconductor industry in Taiwan
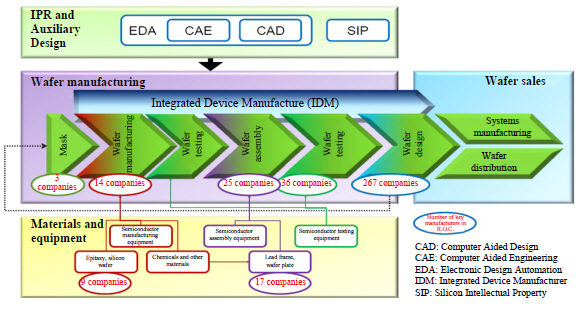
Note: Numbers in the figure represent number of companies
Source: MIC, 2016/01
‚EMS industry:
The upstream vendors of professional EMS providers primarily include material producers who specialize in PC boards, integrated circuits, other electronic components, etc. Their efficiency, quality, and price of material supplies will, to an extent, influence the delivery cycle, product quality, and price competitiveness of the EMS provider. The downstream vendors include brand owners who are involved in wireless network communication, household appliance, computers and servers, data storage, smart handheld devices for industrial use, commercial
| 75 |
sales, automobile electronics, etc. The changes in the demand of the downstream vendors directly influence the development and profitability of the EMS industry.
EMS industry needs to build a long-term, stable supply chain cooperative relationship with upstream suppliers and downstream brand owners. Through the integration of the entire supply chain resources, relationship coordination, and process optimization, a win-win outcome for members of the supply chain can be realized. Their value addition and competitiveness hinge on the intensity of their relationship with upstream and downstream vendors, and therefore these two factors a strongly associated with each other.
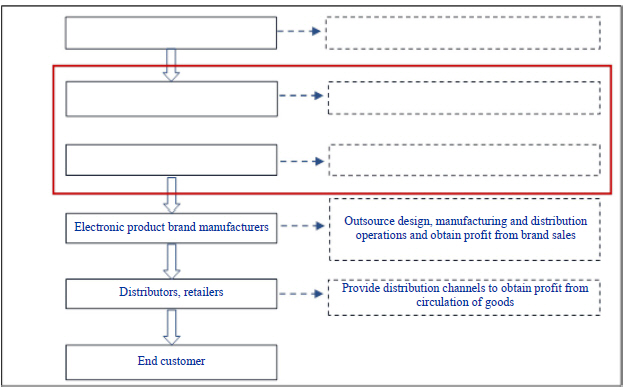
(3) Product development trends
Packaging and testing products
End electronic products have slowed in growth rate because of the increasing prevalence of electronic products ranging from personal computers smartphones. The next killer wave application that will dominate in the next 5 to 10 years is believed to be Internet of Things (IoT), in which the smart electronics will be the source of future business opportunities.
Compared with the billions of dollars of demands for semiconductors in computers or mobile devices, their demands in IoT will reach hundreds of billions. The market estimated that the world will have 30 billion internet-connecting devices by 2020, contributing to approximately US$1.9 trillion in value for IoT applications. Such tremendous opportunity has instigated intense competition among vendors around the world. A wide variety of smart applications, including smart city, smart car (Internet of Vehicles), smart home, smart medicine (telecare), smart individual (health and fitness), smart plant, and smart manufacturing, have been developed. In the future, the challenges that the IC industry will face are determining a method by which to extend PCs and mobile phones to other smart electronic applications, products, technologies, and markets.
| 76 |
Unlike the previous single killer end-application market, IoT cannot only focus on a single process or product. Instead, it seeks diversity in industrial characteristics, while focusing its semiconductor technologies on advanced, mature process technologies and integration capability. The IoT will therefore induce a revolutionary change in the development of the global IC industry.
The emergence of IoT steered the semiconductor component technology toward process miniaturization, second-generation communication, sensor integration, and high-order multi-visual computation, and in-memory operation. These aspects can serve as a basis for deducing the future orientation of core technologies and new applications as the IoT applications become prevalently used in the semiconductor industry. Regarding product demand, IoT products must feature heterogonous integration and ultra-low power consumption. These characteristics can disassemble IoT products into components that are lightweight, that feature lengthy battery life, and that can connect to the Internet while consuming minimal power.
The development of high-spec, low-cost mobile devices has become a trend. The ability of these devices to integrate diversity of functions is now a basic function contributing to a continual increase in SiP demand. This function will attract increasingly more vendors to invest in the R&D of SiP in 2016, which will gradually orient SiP technologies toward a generation that prevalently uses IoT applications.
Hardware development must be based on semiconductor components and sensor communication interface in order to improve the quality of life for humans. These components include processor, analog IC, communication IC, memory, and sensors, and relevant technologies comprise ultra-low power and SiP technologies, which subsequently enable the integration of different functional wafers in single miniaturized packaging bodies.
To enhance performance and reduce power consumption, the market tends toward stacking the processor with memory devices during packaging because this approach can achieve reduced area, reduced power (short path and minimal impedance), and increased transmission speed (shortened electronic transmission path). This method therefore resulted in the development of 3D IC and TSV technologies, which are aimed at connecting stacked ICs for heterogeneous integration of vertical stacks.
Under the developing trend of end products (e.g., IoT and wearable devices), hardware systems have transformed from previously large devices (e.g., PC) into mid-sized mobile phones and subsequently into smaller wearable devices (e.g., smart watch). Such system miniaturization restricted the use of spaces in hardware packaging. Multiple functions and limited space led to the rise of SiP applications, such as the S1 chip in Apple Watch. Specifically, embedded technologies for substrate-embedded wafer or passive components are characterized by small area, effective heat dissipation, and reduced noise signal, which make them an excellent tool for utilizing the added function of substrates during SiP process.
In addition to embedding wafers in the substrate to achieve reduced area, developers can place wafers on top of a passive component to make use of space. The semiconductor embedded in substrate (SESUB) of TDK technology is one example of this approach. Therefore, the Company engaged in a joint venture with the Japanese firm TDK to introduce embedded technology in SiP. The goal was to combine SiP with embedded board technology and to enhance yield rate. Attributed to its outstanding performance in saving space, electrical property, and
| 77 |
heat transfer, embedded boards became the top choice for developing IoT SiP technology, thereby serving as the basis for future end IoT products.
Looking ahead of the future, the next opportunity for the semiconductor industry will come from the Internet of Things (IoT). 2016 will be the year in which IoT is upgraded to Smart IoT level. At the CES show, large firms all focused on the Internet of Everything, striving toward an Internet of Life. International semiconductor firms have shifted from emphasizing high-performing wafer hardware technologies to stressing the importance of innovative living applications and a perfect user experience. Their product applications are concentrated on smart cars (autonomous driving and driverless concepts), unmanned vehicle, smart home, wearable devices, virtual reality, and robots. With their advantage in technologies as the core, large firms will target the three major technologies required for IoT systems, namely, smart computing, smart sensing, and smart transmission. Furthermore, they will attempt to build an open industrial ecology in which interconnecting platforms are established for seeking strong, powerful partners.
Another aspect worth mentioning is the automobile industry; vehicles are advancing toward smart, automated, electric, and shared applications, making them safer and more reliable (e.g., autonomous car systems and active safety systems), more comfortable and convenient (e.g., vehicle information communication system, communication between smartphones and cars, apps exclusive for vehicles, head up display, and innovative human-machine interface), and more energy-efficient and environmentally friendly (e.g., electric cars).
Although electric cars still account for a small portion of the automobile industry, they are increasing annually in double digits. Except for the complexity of managing the power and IC of electric cars, the overall design idea of electric cars is steering toward the concepts of connected cars and Internet of Vehicles (IoV), thereby substantially increasing the demand for IC compared with that required for traditional vehicles. The electronic automobile market will exhibit the strongest growth in the future, Gartner has estimated that in 2016 the vehicle IC market worldwide was worth US$31.4 billion, which will rise to US$41 billion in 2020. As vehicles become increasingly more “intelligent” the cost of automobile electronics will elevate further, which also increases the content of semiconductors in each vehicle on average.
‚Electronic assembly products
Influenced by the rapid development of upstream businesses, the global electronic market has successively produced a diversity of products that feature customized appearances. As new products diversify, market demands continuously increase, further aggravating the intensity of competitions in the industry. In particular, the rapidly evolving network communication industry and the rise of the consumer electronic industries intensified the competition in the electronic product market, which prompts brand owners to demand for improved technologies, new products, immediate market response, and adjustments to product portfolios in a timely manner. Numerous large international brands have continued to outsource their services in order to enhance their competitiveness in the global market and increase their share in the market. Therefore, the increase in the overall sales volume of EMS providers offers a greater room for developing stable cooperation among members of the supply chain. Subsequently, smartphones, tablets, and other electronic products will be in great demand in the global end electronic product market.
| 78 |
A. Global demand for outsourcing electronic products exhibits continuous growth trend
As the EMS mode matures and service quality improves, the global EMS industries continue to expand their service scope, which increases their OEM-based production volume both incrementally and annually. To meet the growing demand of brand owners, the scope of EMS increases incessantly, gradually covering the highest end of the product value chain. This trend provides a greater space for development to manufacturers, like us, who are equipped with the capability to plan, design, and research and develop products. It also motivates us to become the fastest growing manufacturer in the world.
B. The rapid development of wearable equipment expedites the development of miniature system modules
Wearable devices are devices that can be worn on the body as implants or accessories; these devices are integrated with multimedia, sensing, and multifunctional miniature technologies and support hand gesture and eye movements as a means of communication. Wearable devices are developed by employing wearable technologies to incorporate smart designs in people’s daily wearable accessories. Currently, wearable devices available in the market include smart bracelets, smart watch, smart spectacles, sports shoes, pace counter, apparels, and earphones. Attributable to 20 years of continuous efforts of industrial and academic experts, a wide variety of advanced wearable products and devices have been developed. Presently, technological leaders and small startup companies have entered the wearable device market, suggesting the powerful potential of this type of market.
C. The popularity of smart end devices accelerated the prevalence of wireless communication modules (WiFi)
A mature ecological system for electronic products and the diverse functions of application programs have increased people’s demand for better performing smartphones and tablet computers. Smart end devices have improved immensely in terms of function and complexity, from the most primitive functions such as camera functions to wireless data transfer via 3G, WiFi, and Bluetooth, to using GPS navigation functions, gyroscope, and speed sensors. Since 2013, 4G has become the standard network system in high-end smart devices, in addition to near field communication (NFC for mobile payment and data transmission) and fingerprint identification. Currently, increasingly more powerful functions such as enhanced photo color and motion sensor control are gradually maturing and have been integrated into mobile phones. Therefore, the functions of end smart devices are continuously improving.
Since its development, WiFi has been extensively applied to various types of digital mobile products, specifically smartphones and tablet computers. As the functions of end smart devices continue to improve, the smart mobile markets are also being rigorously developed, further increasing the demand for WiFi applications.
D. Division of labor in the electronic manufacturing industry and niche shift and clustering effect of manufacturing service industry
Influenced by the global economic integration, the division of labor in the electronic manufacturing profession, the continuously maturing EMS in Taiwan, and the relocation of the global EMS industry to Asia Pacific, particularly to China, the EMS industry in Taiwan has grown way faster than the entire electronic industry in the same period, and this trend will inevitably increase the overall market capacity and instigate a rapid development of the EMS industry.
| 79 |
The electronic industry has significantly clustered in China as the global EMS industry gradually relocates to the Asia Pacific. In addition, the upstream and downstream supply chain of the EMS industry have matured significantly, including their centralized procurement of basic electronic components, R&D design packages, and global logistic support service, all of which are able to facilitate the globalization of the EMS industry.
(4) Competition Status
Packaging and testing industry
The effects of emerging markets and saturation of end products on the global semiconductor market elucidate the low operating revenue of the semiconductor industry around the world, including Taiwan. From IC manufacturers’ perspectives, although they did not perform as well as they did in 2014, many vendors have used this opportunity to readjust their business goals, development strategies, and continual investment technologies, as well as to cooperate with international businesses.
However, the Chinese government invested billions of RMB to actively promote its semiconductor industry, which resulted in the rapid rise of a red semiconductor supply chain. South Korean government also proposed a revitalization project for its semiconductor industry, and this project is advantageous for the vertical integration of integrated device manufacturers (IDM). Furthermore, Japanese and European governments have strategically advanced toward developing value-added and differentiated semiconductor technologies for medical, industrial, agricultural, and automobile uses, combining and applying automobiles and robots to pave their way into aviation industry and ultimately the universe.
The rapidly changing economic environment and intensifying industry competition have made it difficult for Taiwan to maintain their fundamental business. With the United States leading the world, it is difficult for Taiwan to aim for the top. The merger and acquisition among the semiconductor industries remain frequent in recent years, which suggest that Taiwanese firms must have a corresponding strategy to expedite their transformation.
‚EMS industry
According to the 2015 global EMS supplier ranking announced by the Manufacturing Market Insider (MMI), our Company’s subsidiary, USI Electronics Inc. was ranked No. 9. The top 8 suppliers were Hon Hai Precision Industry/Foxconn, Pegatron, Flextronics, Jabil Circuit, Sanmina, Celestica, New Kinpo Group, Wistron.
3. Overview of Technology and R&D
(1) Technological level of company's operative business and R&D
Packaging and testing products
The prevalence of OEM industrial chain mode in the semiconductor industry, ASE has also followed the steps of major foundry service providers (e.g., TSMC, UMC) and advanced toward the R&D of high-order products, and advancement of its technologies in order to create multi-win outcomes. To accommodate the increasingly complex functions, miniaturization, and optimal cost effects, ASE has focused on specializing its advanced packaging and testing technologies, including 2.5D & 3D IC, SiP, CSP, flip chip, bumping, and WLP.
Orienting toward refining its existing technologies and developing advanced
| 80 |
products, ASE Group allocates 3 to 5% of its operating revenue to the R&D of technologies, which is also why the company has obtained over hundreds of patients every year. This is aimed at maintaining the company’s leading status in the industry and sustaining its competitive edge. In addition to taking the lead in the market share, ASE must also stay on top of their competitors in the research and development of technological applications.
kElectronic assembly products
To further improve their service and product quality, the Company and its subsidiaries have focused on developing a diversity of innovative products in order to raise their competitiveness. Capitalizing on their exclusive R&D professional knowledge, they endeavored to optimize their products to offer their expansive customers high-performing products and services with high price-performance ratio as well as exceptional engineering and manufacturing capabilities. Currently, the Company and its subsidiaries have developed products that are used in computers and casings, telecommunication systems, industrial electronic product manufacturing services, automobiles, storage, and server programs.
The Company and its subsidiaries have a significant advantage in the R&D and design of their primary products. Since their inception, they have established and reinforced a core development strategy that centers on autonomous R&D and technology, using their R&D center as the core of their business development. In terms of EMS technologies, the Company and its subsidiaries have built a team of over 1,800 R&D experts, each of whom is highly competent and experienced in product R&D and design.(2) Research & Development Personnel & Educational Qualifications
Unit: person; years
Year Item | 2013 | 2014 | 2015 | 2016 As of November | |
| Educational Qualifications | Ph.D | 69 | 81 | 101 | 109 |
| Masters | 1,572 | 1,925 | 2,351 | 2,428 | |
| Bachelors | 4,239 | 4,367 | 4,186 | 4,224 | |
| Senior High School | 427 | 578 | 542 | 734 | |
| Total | 6,307 | 6,951 | 7,180 | 7,495 | |
| Average years of service (years) | 8.48 | 8.18 | 8.80 | 8.80 | |
(3) R&D Expenses invested annually during the past 5 years
Unit: NT$1,000; %
Year Item | 2011 | 2012 | 2013 | 2014 | 2015 |
| Research expense | 7,117,964 | 7,877,408 | 9,069,018 | 10,289,684 | 10,937,566 |
| Net operating income | 185,347,206 | 193,972,392 | 219,862,446 | 256,591,447 | 283,302,536 |
| As a percentage of net operating income | 3.84% | 4.06% | 4.12% | 4.01% | 3.86% |
| 81 |
(4) Successfully-developed technologies and products during past 5 years
Packaging and testing products
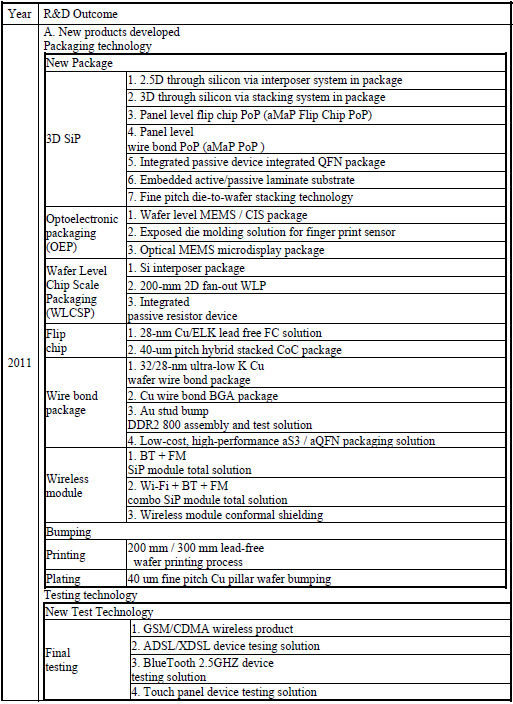
| 82 |
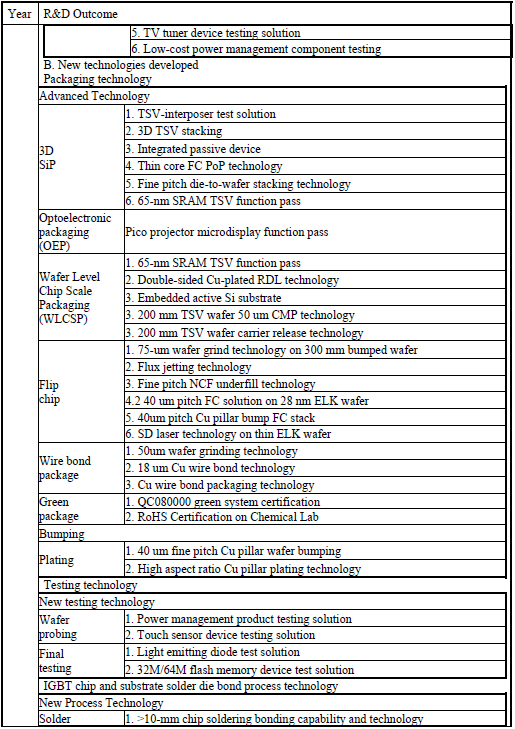
| 83 |
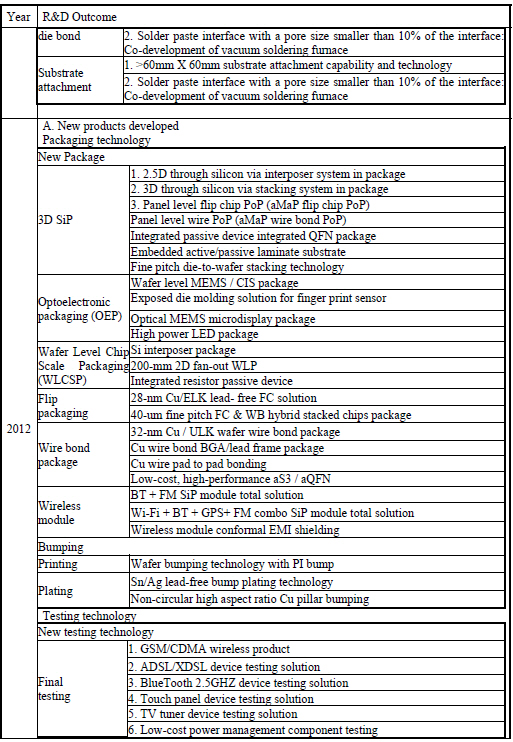
| 84 |
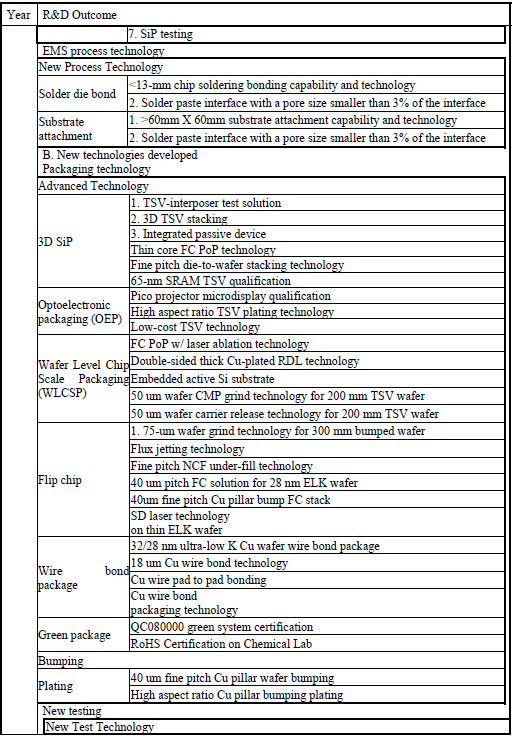
| 85 |
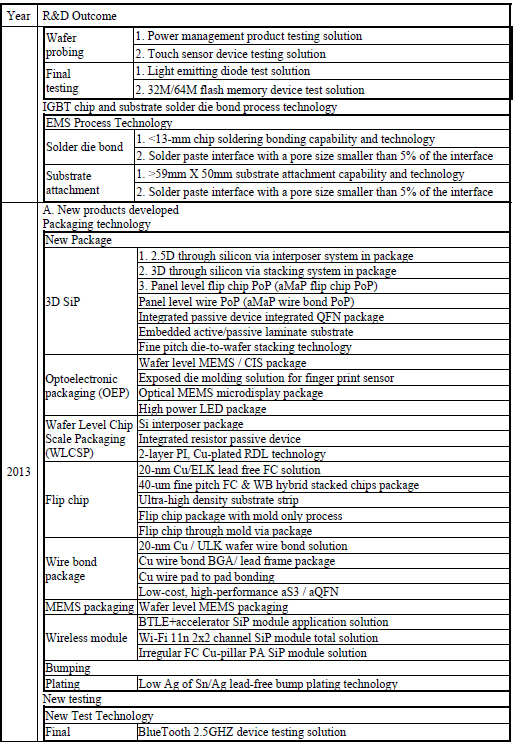
| 86 |
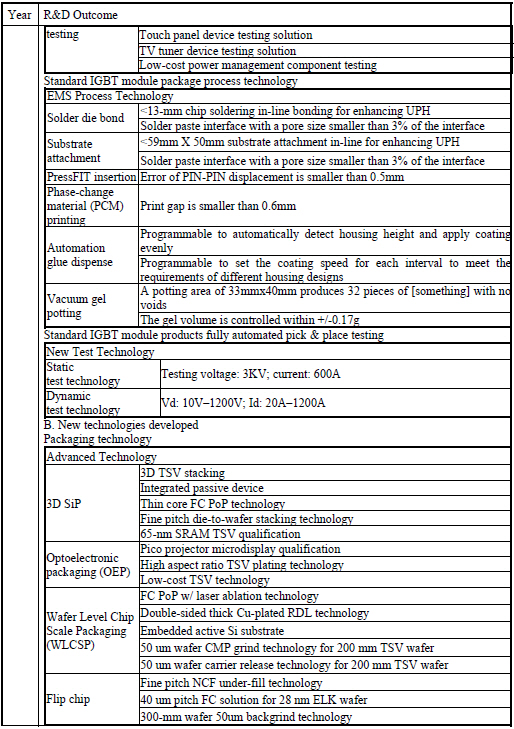
| 87 |
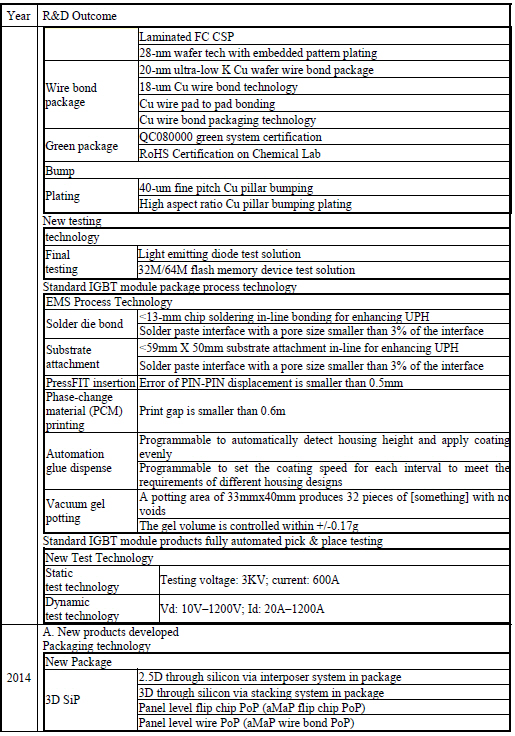
| 88 |
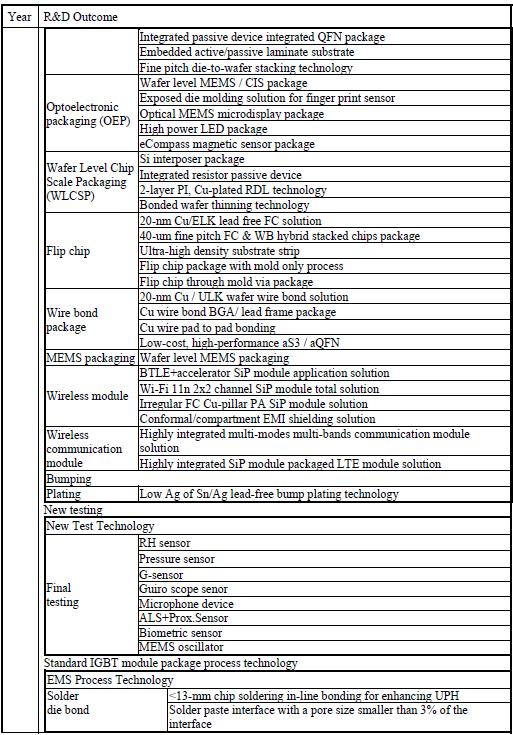
| 89 |
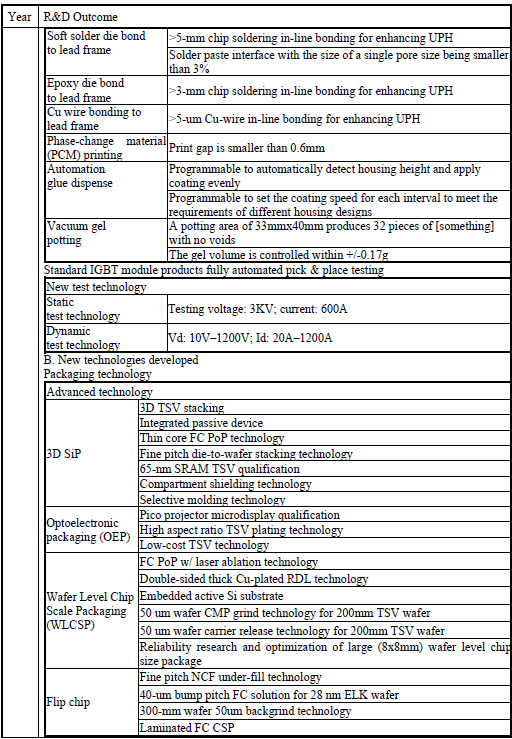
| 90 |
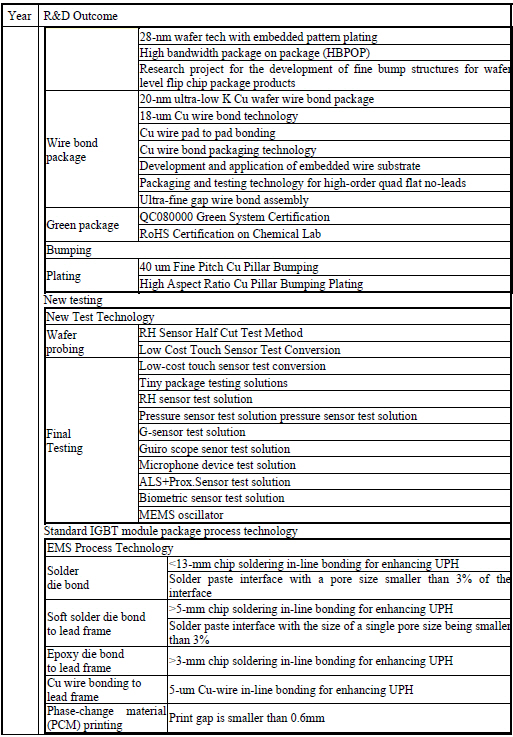
| 91 |
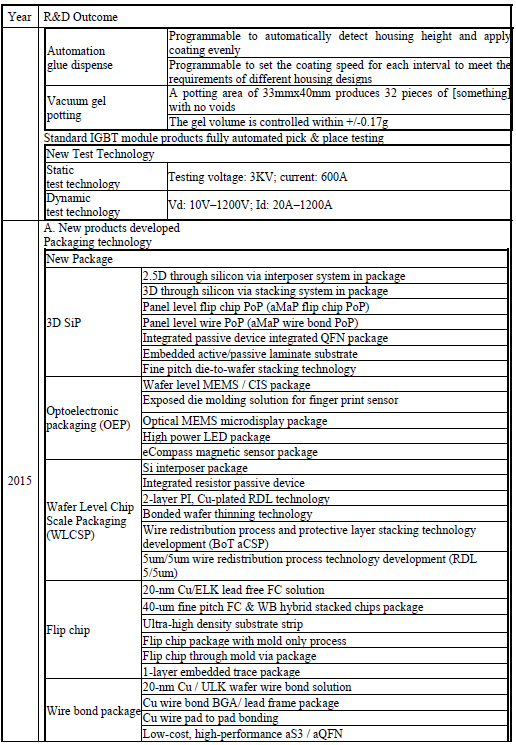
| 92 |

| 93 |
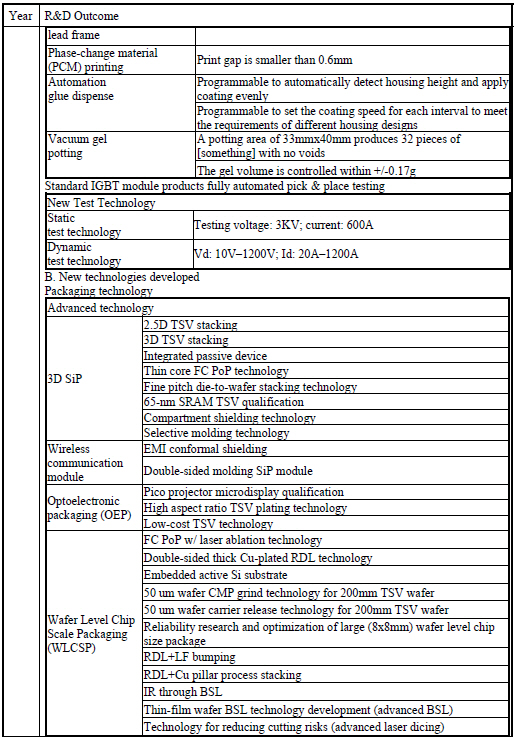
| 94 |

| 95 |
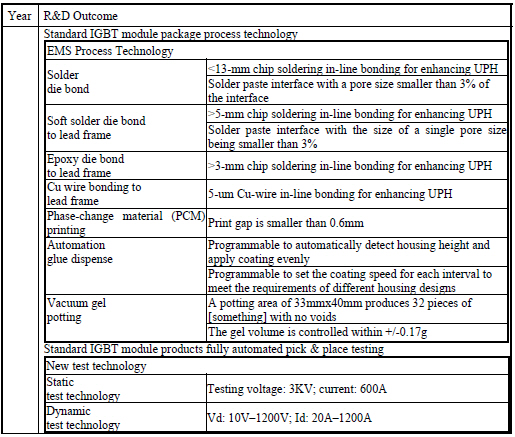
New technology developed
| WLCSP | 2.5D TVS stacking mass production |
| First in fan out packaging | |
| Wafer level system packaging | |
| Sensor TVS | |
| Passive component integration | |
| 40um fine pitch Sn/Ag/Cu pillar bump plating | |
| Flip Chip | 16nm Cu/ELK Lead Free FC Solution |
| Double side molding technology | |
| High density high bandwidth stacking packaging | |
| Multilayer thin line embedded coreless board | |
| 20/28 nm flip chip certification | |
| Wire Bond Package | Application development for embedded circuit substrates |
| High-end FC QFN packaging and testing | |
| Ultra-fine pitch and diameter Cu/Au wire weding technology | |
| 20/28 nm technology certification | |
| Wireless Module | Wireless sensor module packaging |
| Segmented electromagnetic interference masking | |
| Wireless Communication Module | High-density SiP packaging communication modules |
| Highly integrated multi-modes multi-bands 3G communication modules |
| 96 |
kElectronic assembly products
A. Communication
| Product Category | R&D Outcome |
| Wireless Modules | Wi-Fi, B, FM, GPS, WiMax, CMMB Combo (WiFi+BT, WiFi+BT+FM, WiFi+BT+GPS+FM) |
| Wireless network interface controller (NIC) module | Wi-Fi, BT, FM, GPS, WiMax, CMMB Combo (WiFi+BT, WiFi+BT+FM, WiFi+BT+GPS+FM) |
| Business wireless access point (WAP)-Indoor | 802.11n 2*2 multi(single)-module WAP 802.11n 3*3 multi(single)-module WAP |
| Business wireless access point (WAP)-Outdoor | 802.11n 2*2 multi(single)-module WAP 802.11n 3*3 multi(single)-module WAP |
B. Industrial Use
| Product Category | R&D Outcome |
| POS | - All-In-One POS - POS PC - KIOSK |
Computers | - A M MB |
| Smart Handheld Devices | - Rugged Handheld Mobile Computer - Enterprise Mobile Computer |
C. Computers and storage device
| Product Category | R&D Outcome |
| Storage device | |
| Network storage device | SMB: 1U4Bay/2U12Bay Rack Mount NAS |
| SOHO: Tower 2/ 4/ 5/ 6/ 8 Bay NAS | |
| DMP (Digital Media Player) | |
| Redundant array of independent disks (RAID) | SAS/SATA RAID Fiber RAID Disk assembly |
| Host bus adapter | SAS/SATA adapter SAS/SATA RAID card 10G Ethernet card Infiniband adapter |
| Network storage server | 2U24 IPS (Redbass) 2U12 SBB IPS (Thuban) |
| Solid state drive | 2.5” SATA II 1.8” SATA II 2.5” SATA III |
| Computer products | |
| Server motherboard | Single-core server motherboard Dual-core server motherboard Quad-core server motherboard |
| Server expansion card | SAS expansion card Ethernet expansion card Infiniband network expansion card |
| Server adapter | Various types of functional server adapter |
| Server backboard | Server power backboard Server back network backboard |
| 97 |
| Product Category | R&D Outcome |
| Computer peripherals | Touch screen control panel Color identification instrument |
D. Consumer electronics
| Product Category | R&D Outcome |
Liquid crystal display module Printed circuit board (PCB) assembly | - Notebook/monitor/TV liquid crystal display control panel - Notebook/monitor/TV LED light strip - Liquid crystal display source board LED driver board |
| TV Set PCBA | - TV motherboard - TV electrical power control panel - TV keyboard |
E. Automotive electronics
| Product Category | R&D Outcome |
| Design and manufacturing service | |
| Voltage Regulator | - Original Equipment Product - After-Market Product |
| Rectifier | - Original Equipment Product - After-Market Product |
| LED Lighting PCBA | - Daytime Running Lights (DRL) - Center High-Mounted Stop Lamp (CHMSL) - Rear Combination Lamp (RCL) - Fog Lights |
| Telematics Application | - Telematics Control Box (T-Box or TCU) - Wifi/Bluetooth modules |
| Manufacturing service | |
| Motor Controller PCBA | - Engine Cooling Fan, Sunroof, Wiper, Power Window, AFS |
| Driver Assistant PCBA | - Ultrasonic Parking Sensor and Parking Assistant Control Unit
- Blind Spot Radar Detector
|
| Climate Control PCBA | - HVAC Climate Controls Panels - Climate Control ECU |
| Security PCBA | - Electronic Steering Column Lock(ESCL) |
| Switch PCBA | - Window Regulator - Steering Wheel - Engine Switch - Stop & Start Switch - Hazard Warning |
| Sensor PCBA | - Torque Sensor |
| Control Unit PCBA | - Electronic Parking Brake - Shift Interlock |
4. Business plan - long-term and short-term
(1) Short-term business plan
Maintain existing customers and attract more IDM customers
‚Implement production strategies and obtain the most advantageous allocation
| 98 |
ƒSolicit orders for high-level packaging and increase profits
„Improve resource utilization rate and reduce resource consumption and wastage
nImprove production of green products and expedite product conversion rate to attract market opportunities
oAchieve mass production by test manufacturing
(2) Long-term business plan
Integrate group resources and provide complete services to customers
‚Improve cost structure and offer competitive prices
ƒImplement customer segmentation, strengthen customer satisfaction, increase overall production scale, pursue cost advantages, and increase price competitiveness
„Sustain our leading status in technological development to increase market share
(II) Market, production and sales
1. Market analysis
(1) Areas in which core products (services) are sold (provided)
Unit: NT$1,000; %
Year Sales Territory | 2014 | 2015 | |||
| Amount | % | Amount | % | ||
| Domestic | 36,747,699 | 14.32 | 32,631,149 | 11.52 | |
| Export | South & North America | 173,912,974 | 67.78 | 205,730,670 | 72.62 |
| Europe | 20,826,125 | 8.12 | 20,577,069 | 7.26 | |
| Others | 25,104,649 | 9.78 | 24,363,648 | 8.60 | |
| Subtotal | 219,843,748 | 85.68 | 250,671,387 | 88.48 | |
| Total | 256,591,447 | 100.00 | 283,302,536 | 100.00 | |
(2) Market Share
Packaging and testing products
Five Major Global Packaging and Testing Plants: Market Share of Outsourced Semiconductor Packaging and Testing Service for 2014-2015
| Five Major Global Packaging and Testing Plants (note) | Market Share (%)(based on the operating revenue on semiconductors) | |
| 2014 | 2015 | |
| ASE | 19.1 | 18.7 |
| Amkor Technology | 11.5 | 11.3 |
| SPIL | 10.1 | 10.2 |
| Jiangsu Changjiang Electronics Technology (JCET) | 3.6 | 6.6 |
| Powertech Technology | 4.9 | 5.2 |
Source: Compiled according to the research report of GartnerMarket Share: Semiconductor Assembly and Test Services, Worldwide, 2015 Published: 12 April 2016, Analyst(s): Maria Valenzuela, Jim Walker and Masatsune Yamaji.
Note: This table is based on Gartner's estimation of the operating revenue of global semiconductor manufacturers that outsource their packaging and testing service. The operating revenues of Amkor for 2014 and 2015 exclude those of
| 99 |
J-Devices. The operating revenue of JCET for 2015 includes the revenue of STATS ChipPAC for August to December 2015.
Influenced by the economy, the global semiconductor market that outsources its packaging and testing service projected a slight decline in its operating revenue for 2015. ASE’s market share decreased slightly to 18.7%, but it is still taking the lead. Amkor maintained in second place, with a market share of roughly 11.3%. However, it is expected that after Amkor merges officially with J-Devices, it will shorten its gap with the first place. SPIL remained in the No. 3 ranking in 2015, with a market share of approximately 10.2%. Because it completed merger with STATS ChipPAC in August 2015, JCET obtained a market share of 6.6%, entering the fourth place. Powertech Technology Inc. was ranked No. 5 with a market share of 5.2%. Surrounded by competitors who engage in merger and acquisition to increase their market share, the Company will continue to devote its effort in developing advanced processes and in strengthening our packaging and testing capabilities particularly in the system level, which will further widen the technological gap with our competitors. To accommodate for the requirements of electronic components, existing packaging technologies are oriented toward high density, high I/O number, low operating power, surface component modularization, and composite structure development so as to create highly integrated, affordable fine, lightweight products that feature multiple pins and multi-chip module packaging. These products include ultra-fine gap wire bond assembly, flip chip packaging, 2.5D and 3D stacking package, wafer level packaging, multi-chip module (MCM), system-in-package (SiP), copper process, and through-wafer via (TWV). Nevertheless, the Company and its subsidiaries have fully prepared themselves for the continual growth of production demands for high-order packaging and testing products, thanks to their extensive investments in technologies and production capacity. Looking forward to the future, we will continue to refine our process and simultaneously commit to improving our profits.
‚Electronic assembly products
According to NVR predictions, the global EMS income in 2015 was US$332.6 billion. The electronic assembly operating income of the electronic assembly department of our Company and its subsidiaries was NT$137,347,359,000 in 2015 (equivalent to US$4,292,105,000), accounting for 1.29% of the global EMS income.
(3) Future market demand-supply and growth potential
Packaging and testing products
A. Supply
Since 2015, the global top 10 packaging and testing plants have entered a merger and acquisition phase, leading to the rise of the three packaging and testing leaders: ASE and SPIL in Taiwan, Amkor and J-Devices in the United States, and STATS ChipPAC in China. These three leaders are all based on logic IC packaging and testing, with a stronger focus on packaging than on testing. The degree of centralization of King Yuan Electronics (8.9% of the global market share) was higher compared with that of other firms, which are still in a dispersed state. Wafer level packaging and testing technologies are primarily focused on logic products; however, because these types of products require higher capital expenditure for business expansion and sustenance, the governing rights remain in the hands of large firms, and merger and acquisition
| 100 |
are beneficial for the allocation of funds and production resources.
B. Demand
Negatively affected by the low demand for smartphones, tablet computers, and other electronic products, the semiconductor assembly and test services (SATS) projected a scale of US$25.5 billion in 2015, which is a 5.9% decline compared with that in 2015 (US%27.1 billion). We envision that as demands for new applications (e.g., IoT, wearable devices, automobile IC) mature, SATS will project an annual composite growth rate of approximately 4% between 2015 and 2020.
International IDMs are gradually outsourcing their packaging and testing services primarily because of the increasing diversity of consumer electronic products, which increases the complexity of customized packaging and testing designs. The rate at which system circuit boards can be miniaturized is no longer in sync with the fine processes, and these two factors rely only on packaging and testing technologies to bridge the gap between them. Furthermore, the costs and technical level of packaging and testing are increasing, which leads to a rise in the costs of packaging and testing R&D. Therefore, increasingly more wafer manufacturers are seeking to outsource packaging and testing tasks in order to reduce costs. This phenomenon simultaneously highlights the inability of large IDMs to invest in high-order packaging and testing equipment. Subsequently, outsourcing OEM will inevitably become more frequent.
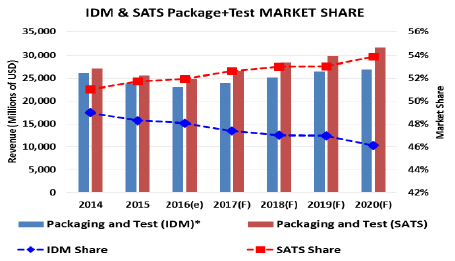
Source: Gartner and IEK (2016/06)
‚Electronic assembly products
A. Supply
MMI announced the top 50 EMS suppliers around the world in 2015. The operating revenue of the top 50 EMS companies registered a record high of US$272.5 billion, in which the operating revenue of Hong Hai Precision (Foxconn) accounted for approximately 52% of the total revenue of the top 50 EMS companies. The Company's subsidiary USI Electronics Inc., which was responsible for the electronic assembly product department, was ranked No. 9.
2014–2015 Ranking of Top 10 EMS Companies
| 101 |
Year Ranking | 2015 | 2014 |
| 1 | Hon Hai Precision Industry /Foxconn | Hon Hai Precision Industry /Foxconn |
| 2 | Pegatron | Pegatron |
| 3 | Flextronics | Flextronics |
| 4 | Jabil Circuit | Jabil Circuit |
| 5 | Sanmina | New Kinpo Group |
| 6 | Celestica | Sanmina |
| 7 | New Kinpo Group | Celestica |
| 8 | Wistron | Benchmark Electronics |
| 9 | Universal Scientific Industrial (USI) | Shenzhen Kaifa Technology |
| 10 | Plexus | Universal Scientific Industrial (USI) |
Source: MMI
B. Demand
The operating income of the Company’s electronic assembly product department is sourced from EMS OEM activities, in which the main customers are internationally acclaimed electronic companies that sell OEM products, including communication, consumer electronics, computers and storage devices, industrial-use products, and electronics for automobiles. According to NVR, the size of the global electronic assembly market in 2015 was US$1.3 trillion , in which communication products accounted for the highest at 29.2% (US$387.8 billion), followed by computer products at 24.8% (US$329.6 billion), consumer electronics at 20.3% (US$269.7 billion), and industrial-use products and electronics for automobiles at 8.7% (US$115.5 billion) and 7.3% (US$96.3 billion) respectively. It is estimated that the global electronics assembly market will reach US$1.6 trillion by 2020.Forecasting of global electronics assembly market scale (by product category)
Unit: US$ billion
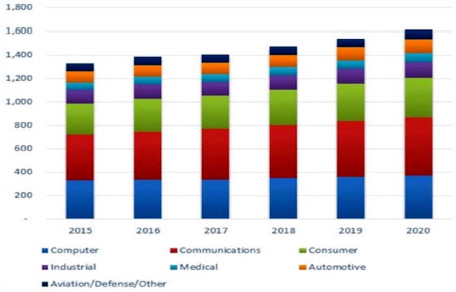
| 102 |
Source: NVR
(4) Competition niche
The overall market in 2016 will exhibit a slight decline. In response, the Company and its subsidiaries have attached a greater level of importance to our internal operation as well as enhancing our capability to develop technologies, in an effort to excel in our performance again amidst the global economy. An analysis of the competitive advantages of the Company and its subsidiaries is as follows:
jContinuously researching and developing technologies to sustain our leading status in high-order product technologies and quality
The prevalence of OEM industrial chain mode in the semiconductor industry, the Company has also followed the steps of major foundry service providers (e.g., TSMC, UMC) and advanced toward the R&D of high-order products, and advancement of its technologies in order to create multi-win outcomes. To accommodate the increasingly complex functions, miniaturization, and optimal cost effects, the Company has focused on specializing its advanced packaging and testing technologies, including 2.5D & 3D IC, SiP, CSP, flip chip, bumping, optical package, and WLP.
Orienting toward refining its existing technologies and developing advanced products, the Company and its subsidiaries allocate 3 to 5% of its operating revenue to the R&D of technologies, which is also why the company has obtained over hundreds of patients every year. This is aimed at maintaining the company’s leading status in the industry and sustaining its competitive edge. In addition to taking the lead in the market share, ASE must also stay on top of their competitors in the research and development of technological applications.
kActively engaging in development to capture business opportunities of IDMs in a timely manner
To maintain the efficiency of semiconductor management and reduce costs, international IDMs must focus on Fab lite development to build their foundation for increasing OEM outsourcing. To accommodate this increasing trend, the Company and its subsidiaries have constantly reviewed their business strategies to develop their business in China and to approach customers and the market in order to capture potential business opportunities. All international firms are vying for a stake in China yet they cannot find the appropriate partner. Nevertheless, our strategy is likely to encourage more firms to outsource their packaging and testing operations, which will attract more business opportunities without influencing the foundation that Taiwan has in this domain.
ƒ Integrated advantages
The electronic assembly product departments of the Company and its subsidiaries have the advantages of professional design and producuction expertise in a variety of electronic products (including electronic components, parts, and whole machines) as well as system assembly, as well as the advantages of strategic division and integration of product categories. We leverage the strategy of “selecting the finest” and careful observation of market developments, client demands, and trends in electronics and information technologies. Furthermore, the core advantages developed over many years by the Company allow it to target electronics and IT market segments with strong growth and large scale. The “selecting the finest” strategy forms the basis for the Company and its subsidiaries’ horizontal integration of segmented markets and
| 103 |
industries, to account for the trend of greater integration in the electronics industry. This allows the Company to have its finger on the pulse of market trends at every stage, thus dynamically creating the most advantageous product combinations and driving the stable growth of the Company. The Company and its subsidiaries strengthen their core competencies in the horizontal and vertical integration of the component and whole machine production chains, in order to emphasize service value and improve interactions with clients. This then leads to stronger strategic positions in the production chain.
(5) Favorable and adverse factors for long-term growth and response strategy
jFavorable factors
A. The gradually increasing demand for new products and new technologies is a highly profitable opportunity for the Company, due to its significant advantage in R&D and innovation.
B. The way that IDMs are managing their business is constantly contributing to the release of packaging and testing orders, which in future will continue to bring greater business opportunities to the IC packaging and testing industry.
C. Thin, lightweight, and small-sized products with high-performance and high efficiency will be the mainstream in the future, making 2.5D and 3D ICs an extremely crucial technology. The Company has invested a substantial amount of resources in the R&D of these technologies and has taken a lead among its peer industries in technologies that are unrelated to packaging.
D. AS a packaging and testing plant in Taiwan that owes a substrate production line and the capability to manufacture robust high-order substrates, which not only enable us to hold the key to high-order packaging materials but also effectively reduce IC manufacturing costs to enhance our profitability.
E. In addition to traditional VGA, QFP, and QFN packaging products, a wide range of high-order products such as chipsets, graphic cards, optoelectronic products, wireless communication modules, and other relevant chips, as well as potential customers, are a bigger, potential market with a profound development potential.
F. Chinese manufacturers will continue to demand for IC products in the next few years. Based on the principles of cluster effect and supply chain, the Company has fully prepared itself in terms of geographical location and resource utilization in order to embrace this growth and business opportunity.
G. Exceptional R&D technologies: An exceptional R&D technology ensures the future development of a high-tech company. Therefore, the Company has been committed to cultivating R&D personnel, introducing advanced technologies, and accumulating years of experience to improve its R&D outcomes. The Company has also acquired ISO9001 plant management quality certification as well as the US military performance specification (MIL-PRF-38534).
H. Complete management system: The Company has computerized all of its production operations, including order processing, materials management, production control, on-site management, warehouse system, and delivery operations, to monitor the entire process. In addition, a large quantity of automated equipment is used in place of manual operations to enhance product yield, reduce production cost, and improve product competitiveness.
kAdverse factors
| 104 |
A. The Company and its subsidiaries' local competitors have attempted to actively solicit our customers. In addition, the alliance mechanisms of our competitors are likely to influence the Company.
B. The gradual decline in the barrier to entry for new technologies, the progressive improvement in competitors’ ability to imitate, and the shortening of product profit cycle pose an imminent threat to a technology-oriented company such as us. Because the research and development of new technologies require substantial funds and labor, the subsequent prices charged for using these technologies are not flexible, which is a major challenge in a micro-profit generation.
C. Increasingly more customers are demanding for better quality standards in the backend stage of IC packaging and testing. If the Company wishes to grow significantly, it must exceed the expectations of its competitors and customers.
D. The backend packaging and testing activities of the semiconductor industry are considered a capital-intensive industry, rendering them vulnerable to the economic impact of the semiconductor market. The quality of their business operation is also easily influenced by the economy. IC packaging and testing industries must carefully assess their investment plans as well as their plans concerning personnel, machines, funds, and technologies. Doing so enables them to prepare themselves for the substantial orders which might arise when the economy is good and for the impact of reduced orders when the economy is bad.
E. Power electronic industries are mainly responsible for tasks involving DC-DC conversion, AC-DC conversion, and motor operation, which require lighter, smaller, more efficient, and more affordable products. Currently, four types of technologies are employed to meet these requirements: Silicon IGBT, Super Junction (SJ) MOSFETs, Gallium Nitride (GaN), and Silicon Carbide (SiC)-based devices.
F. GAN and SiC are currently not mature enough for the power electronics market, with the former requiring improved manufacturing techniques (particularly with regards to extension and thickness), while the latter is an expensive material that makes it unsuitable for use in the consumer market. Therefore, the IGBT remains the mainstream before 2015.
G. A number of GaN competitors have also entered the competition in the market because of the large quantity of hot money entering the market. Generally, developing and testing a type of semiconductor material are time-consuming; however, the successive investments by large firms around the world have increased the likelihood that GaN products will be commercialized in the next two to three years.
H. A large number of IGBT module manufacturers are fiercely competing against each other, which easily results in a price war that reduces the gross profit. To mitigate the effect of competition on company profits, it is critical that firms cooperate with one another to disperse risks and strengthen their cost control mechanisms, as well as increase the economies of scale of their production activity.
ƒResponse measures
A. Leverage our advantage to provide turnkey service, integrate group resources, and share technological information to create more values and greater economic
| 105 |
benefits, which help us strengthen our competitive advantage to capture more business opportunities in the future market.
B. Take advantage of the Company’s advanced processes, flexible production capacity, and diverse production lines to meet customers' demand for more new products, new technologies, and real-time services.
C. Develop a sound financial structure to facilitate providing stable and adequate supply of resources and funds that are required for developing new technologies and new products.
D. Leverage our advantage in technology to improve design deficiencies, build an optimal process, improve process stability, strengthen the competitiveness of the Company and its subsidiaries in terms of cost and quality, and vie for the greatest business opportunity in the market.
E. Capitalize on the Company’s advantages in advanced technology, capital, and integrated resources to cultivate existing customers and gain more potential customers to extend business development.
F. Encourage our plants to exchange information on advanced technologies and motivate different departments to coordinate with one another in order to increase synergy.
G. ASE has vertically integrated and horizontally linked various aspects of its business operation, including materials, packaging, testing, and systems. This not only enables ASE to reinforce its competitiveness and to provide comprehensive services, but also improves ASE's flexibility in adjusting and confronting external challenges at any time.
H. Continue to strengthen our technological advantage, satisfy the diverse needs of customers, improve service quality, and build a patent protective network to solidify the Company's competitive niche.
I. Motivate customers to use the Company’s turnkey service, accelerage solution integration, and offer customers the fastest and most satisfactory services with the most comprehensive framework.
J. Customize marketing service systems, enhance the dependent relationship and strategic alliance with customers and utilize our existing R&D capabilities and product marketing abilities to actively establish a body of supply chains that are competitively advantaged in production, marketing, and research, in order to sustain the Company's core advantages in the industry.
K. Actively improve processes and designs to enhance quality, meet a diversity of customer needs, shorten delivery waiting time, enhance product competitiveness, and actively explore new customer markets.
L. In addition to continuously developing packaging and testing of power chip modules, the Company will endeavor to build a competitive threshold with its high-standard technologies and product qualities to sustain our advantage and profitability.
M. Plan and implement improvements to our supplier (supply chain) management practice, with hopes of integrating upstream and downstream industry value chain and share information costs with cooperating vendors to obtain mutually beneficial and profitable outcomes that will lower production/sales-related costs and improve product competitiveness.
2. Major uses of core products and production processes:
| 106 |
(1) Major applications of core products
1 Packaging products
| Major packaging products | Major Applications |
| · Plastic dual in-line package (PDIP) | uPrimarily used in household appliance, communication device, automotive components, airplane, weapons, space shuttles, and other computer remote information system and navigation devices. |
· Plastic leaded chip carriers (PLCC) · Quad flat package (QFP) · Bump chip carrier (BCC) · Flip chip package · Low/thin profile quad flat package (L/TQFP) · Ball grid array (BGA, TFBGA, LBGA) · Flip-chip BGA (HFC BGA) · Thermally enhanced BGA (TE BGA) · Very fine pitch ball grid array (VF BGA) · Land grid array (LGA) · Exposed pad QFP · Heat slug BGA (HSBGA) · QFN grid array · Flip chip CSP
| uPrimarily used in microprocessor, communication device, automatic automotive components, personal computers, smartphone, tablet computers, and smart handheld device. uWireless communication network, PDA, digital camera, information household appliance, and mobile phones. uPersonal computers and notebooks. uTV games, DVD, MOD, etc. uPersonal computers, notebook, wireless communication network, PDA, digital camera, information household appliance and smartphones, smart handheld device, etc. uComputers—graphic/chip card, cloud computing server, PCS and server microprocessor, voltage regulator, flash memory, hard disk, and other peripheral products. uNetwork communication products—WAN and LAN servers, converters, switches, routers, and cellular network. uConsumer products—video camera, digital camera, DVD, TV games, set-top box, PDA, and MID. uOther products—automatic automotive components, telematics. |
· Small outline integrated circuits (SOP, SOJ) · Thin small outline integrated circuits (TSOP) · Super CSP | uPrimarily used in memory IC. uPersonal computers and peripheral equipment. uPrimarily used in memory IC. |
· 3D package · 2.5D package · Stacked BGA · Multi-chip module (MCM) BGA | uPrimarily used in various types of portable information products, including mobile phones, PDA, digital camera, etc. uPrimarily used in high-level and cloud computing servers, including graphic processor, network processor, etc. uNotebook and hard disks for personal computers, etc. |
107
| Major packaging products | Major Applications |
lWafer level CSP lFlip chip CSP lTSV technology lIntegrated passive device (IPD) lSi interposer lWafer level MEMS lFine Pitch 3D chip stacking technology lHeterogeneous chip integration SiP lFine pitch CoC SiP solution lEmbedded active/passive substrate leCompass magnetic sensor package | uPrimarily used in mobile phones, PDA, digital camera, etc. uPrimarily used in mobile phones, NBs, digital camera, etc. uPrimarily used in mobile phones, NB/network, digital camera, etc. uPrimarily used in wearable/portable consumer electronics, and NB/IoT uPrimarily used in portable consumer electronics. uPrimarily used in mobile phones, NBs, and network server. uPrimarily used in portable consumer electronics. uPrimarily used in NB, servers, and biomedical care. uPrimarily used in mobile phones and game console. uPrimarily used in portable consumer electronics. |
lMEMS-based micro display lSafety control sensing component lDDR2 800 memory lFan-out map pop technology lFan-out WLP lWireless connectivity SiP module lWireless communication SiP module lOptical communication module
| uPrimarily used in projectors and high definition (HD) TVs. uPrimarily used in personal computers, notebooks, network commercial applications, and other safety recognition device. uPrimarily used in memory devices for computer, communication, and consumer electronics (3C products). uPrimarily used in SiP products in 3C products (ASIC + MCP memory, BB+SDRAM) uPrimarily used in portable consumer electronics. uPrimarily used in wireless communication modules for 3C products, including BT, WiFi, GPS, DVB-H/T. uPrimarily used in NBs, personal tablet, network communication products, and communication application for IoT industrial product devices. uPrimarily used in optical transceivers, cloud server, data center, and communication application for high-speed computing server. |
| 108 |
2 New testing products
| Core Products | Core Products |
lQuad flat package (QFP) lBump chip carrier (BCC) lFlip chip package lLow/thin profile quad flat package (L/TQFP) lBall grid array (BGA, TFBGA, LBGA) lFlip-chip BGA (HFC BGA) lThermally enhanced BGA (TE BGA) lVery fine pitch ball grid array (VF BGA) lLand grid array (LGA) lExposed pad QFP lHeat slug BGA (HSBGA) lQFN grid array laQFN grid array lAdvanced single-sided substrate lSiP | lPrimarily used in microprocessor, communication device, automatic automotive components, personal computers, handheld communication module, chipset, etc. lWireless communication network, digital camera, information household appliance, liquid crystal TV, smartphone, etc. lPersonal computers and notebooks. lTV games, DVD, MOD, etc. lPersonal computers, notebook, wireless communication network, digital camera, information household appliance and smartphones, etc. lMobile phone chipset, MP3 processor. lConsumer products—video camera, digital camera, DVD, TV games, set-top box, PDA, and MID. lSmartphones. lWearable products. lTablet computers. lHealth management system, medical application. lCommercial application, IoT-related products. lAutomotive safety system. lIndustrial sensing component. |
lSmall outline integrated circuits (SOP, SOJ) lThin small outline integrated circuits (TSOP) lSuper CSP | lPrimarily used in memory IC. lPersonal computers and peripheral equipment. lPower management IC & portable device. |
3 Electronic assembly application
| Core Products | Core Products |
lDC/DC converter module lIGBT, standard IPM module package | lUsed in military aircraft or power systems on carriers, which require a higher standard of product quality and reliability; production process is based on application of electronic assembly involving die bond and wire bond. lUsed in electric cars and smart home appliance industry; production process is based on a variety of package technologies including SMT, die bond, wire bond, pressFIT insertion, and gel potting. |
mElectronic assembly products
| Product name | Product function | Scope of application |
| 1. Communications | ||
| Wireless communication module | Key parts of mobile electronics that integrate WiFi functions, Bluetooth, GPS, and digital | To accommodate the miniaturization of handheld and mobile electronics, primarily used |
| 109 |
| Product name | Product function | Scope of application |
| video; these parts have been developed into modules to accommodate products that are small and lightweight | in smartphones, game consoles, and personal audio/video entertainment devices, and other handheld electronics | |
| NIC | A part that links computers or other equipment to the Internet | Primarily used in wireless network communication for notebooks |
| Customer-provided equipment (CPE) | Terminal equipment that can transmit wireless network signals and provide wireless access point | Wireless signal transmitters for home, business, and telecommunication operators, including various types of access points, routers, and wireless gateway, etc. |
| 2. Computers and storage | ||
| (1) Computer motherboard | ||
| Motherboard for desktop and notebook computers and server motherboards | Core components that connect to CPU and internal access through main line and chipsets, forming the core of a computer. These components receive the energy provided by the power source of a computer and subsequently distribute the energy. They also have multiple ports that can connect to external hard drives, keyboards, and mouse. | Desktop and notebook computers and servers |
| (2) Commercial and network storage | ||
Network attached storage
(NAS)
| NAS is a data storage device with network connections. | Primarily used in data storage management for SMEs or network companies |
| Grid array system | A technology that synchronizes the reading/writing of multiple hard drives, reduces errors, and increases efficiency and reliability by controlling the connection of multiple hard drives with a single hard drive controller | Primarily used in corporate headquarters and financial institutions or areas where remotely backing up and storing information are required to store the massive volume of corporate data and manage the storage of cloud data |
| 3. Consumer electronics | ||
| Liquid crystal display control panel (VPD) | Circuit board for receiving signals and controlling liquid crystal display | LCD TVs and liquid crystal displays for desktop and notebook computers |
| Backlight module control panel | Circuit board that controls the backlight intensity of liquid crystal displays according to signals | |
| 4. Industrial products | ||
| Smart handheld device (SHD) | Industrial SHD that features a variety of functions, including reading, transmitting, | An extensive range of applications for warehouse logistics management system, including |
| 110 |
| Product name | Product function | Scope of application |
| processing, storing, and wirelessly communicating data | barcode data collectors, terminal equipment for mobile communication data, IC card handheld terminal equipment, terminal fingerprint collector, and recording meter | |
| Point of sale (POS) terminal equipment | A PC-based commercial cash register that is installed in contract business owners and forms a network with the computers of the place where a retail transaction is taking place. This setup realizes ETF payment function and supports purchasing, preauthorization, balance enquiry, and bank transfer functions | Extensively used in various applications such as payment collection and other management practices of restaurants and retail stores |
| 5. Other products | ||
| LED headlight module | LED headlight modules can control the brightness, color, beam distribution, and beam angle | For the automobile industry and other automotive electronics, products primarily comprise LED headlight modules, voltage regulator, and other printed circuit board assembly (PCBA) products |
| Voltage regulator | Voltage regulator maintains constant output voltage in an alternator under working condition | |
| Other PCBA products for automobiles | Meeting corresponding functions according to the requirement of electronic products in vehicles; for example: circuit board for windscreen wiper and air-conditioning control | |
(2) Production process
1 Packaging products
Ÿ Lead-frame products:
Wafer cutting→die bonding→Au wire bonding→seal mold→print→form outer lead→examine outer appearance→package
Ball grid products:
Wafer cutting→die bonding→Au wire bonding→seal mold→print→implant solder ball→cut and form→examine outer appearance→package
Ÿ Flip-chip products:
Wafer bump→wafer cutting→flip-chip die bond→underfill→print→implant solder ball→examine outer appearance→package
| 111 |
Ÿ TSV products:
TSV→through via insulation layer→through via Cu-plated filling→through via wafer thinning→double-sided Cu wire→implant solder ball→stack→examine outer appearance→package
Ÿ Wireless connectivity SiP module:
Solder paste printing→component placement→high-temperature reflow→molding process→laser printing→cut and form→anti-electromagnetic coating→examine outer appearance→package
2 Testing products
Ÿ Lead-frame/ball array products:
IC test→product aging test (if requested by customer)→oven bake→examine product outer appearance→roll packaging→final product packaging
Ÿ High-frequency module products/power management module products:
Test system selection→develop program→verify and troubleshooting→pilot production→mass production
3 Electronic assembly application
Ÿ DC/DC converter module
Prepare material→print solder paste/silver gel→chip attachment→substrate attachment (reflow)→wire bonding→part placement→hand soldering→cleaning→laser modification→prepare top cover material→examine outer appearance→solder sealing→high/low-temp cycling→centrifugal test→foreign substance test→function test→burn test→solder soaking→package and shipment
Ÿ Standard IGBT module
Prepare material→chip bonding→chip cutting→solder paste printing (reflow)→die bonding→part soldering→vacuum reflow→cleaning→wire bonding→intermediate testing→terminal preparation→outer cover assembly→oven bake→inject gel→oven bake→final test (detection PIND test)→thermal grease printing→oven bake→package and shipment
Ÿ Standard IPM module
Prepare material→chip bonding→chip cutting→die soldering→die placement (epoxy die)→oven bake→Cu-wire bonding→gel potting→oven bake→final test→oven bake→package and shipment
mElectronic assembly products
Electronic assembly products are primarily produced using the same method, which involves three major operations: surface mount technology (SMT), assembly, and testing. Whether products require plug-ins is dependent on the specific purpose of use and customer requirements. The Company's three major operations, surface mount technology (SMT), assembly, and testing, are illustrated below:SMT
| 112 |
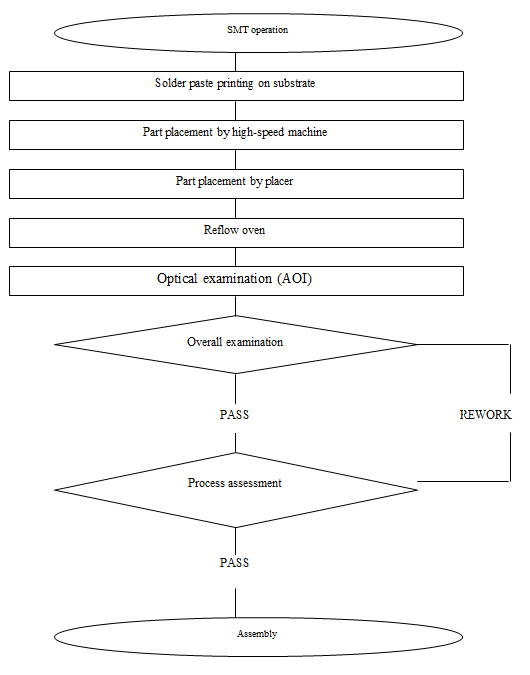
| 113 |
Assembly operation process

| 114 |
Test operation process

| 115 |
3. State of supply of key raw materials
(1) Packaging
The Company offers customers wafer packaging and testing services for semiconductors, purchases wafers primarily from internationally acclaimed semiconductor companies, and maintains a favorable long-term relation with these companies.
Main packaging material: Lead frame, substrate, Au wire, Cu wire, compound, etc. We employ excellent-performing suppliers who have passed our quality control evaluation. In particular, the Company obtains substrates from its subsidiary, ASE (Shanghai) Inc. and ASE Electronics Inc. so that the Company can monitor the entire process of material procurement.
| Name of main raw materials | Source | Market condition | Procurement strategy |
| Substrate | ASEMTLSH/ASEE/Company A/Company B/Company C | Supply–demand balance | Cooperating vendors |
| Lead frame | Company D/E/F | Supply–demand balance | Cooperating vendors |
| Gold wire | Company G/H/I | Supply–demand balance | Cooperating vendors |
| Copper wire | Company J/I | Supply–demand balance | Cooperating vendors |
| Compound | Company D/K/L | Supply–demand balance | Cooperating vendors |
(2) EMS activity
The Company and its subsidiaries primarily use IC, PCB, structural parts, and other electronic components as raw materials for production activities. The Company and its subsidiaries have built a comprehensive material procurement and management system to ensure that purchases are made instantly, quality is controlled, and procurement cost is minimized. Currently, the Company and its subsidiaries are fully equipped with an effective procurement mechanism inside and outside of China, and have established long-term, stable cooperative relationship with numerous component suppliers inside and outside of China.
4. Explanations on changes in type of core products or gross profit margin (by department) during the past 2 years
(1) Changes in gross profit margin during the past 2 years
Unit: NT$1,000; %
| Year | Operating revenue | Gross profit | Gross profit margin (%) | Changes in gross profit margin (%) |
| 2014 | 256,591,447 | 53,588,529 | 20.88 | - |
| 2015 | 283,302,536 | 50,135,228 | 17.70 | (15.23) |
(2) Price difference analysis
The changes in the gross profit margin of the Company and its subsidiaries did not exceed 20%, and therefore price difference analysis was not conducted.
5. List of main suppliers and buyers
(1) Names of suppliers who accounted for more than 10% of the purchases in the last two years, and purchase as a percentage of total purchase, with explanation on causes for such increase/decrease
| 116 |
Unit: NT$1,000; %
| 2014 | 2015 | As of Q3 of 2016 | ||||||||||
| Item | Name | Amount | Percentage of total net purchase | Relation with issuer | Name | Amount | Percentage of total net purchase | Relation with issuer | Name | Amount | Percentage of total net purchase as of the end of Q3 2016 | Relation with issuer |
| 1 | Company A | 16,360,849 | 11.95 | Company A | 22,842,407 | 14.46 | None | Company A | 12,028,049 | 11.95 | None | |
| Others | 120,563,319 | 88.05 | - | Others | 135,158,159 | 85.54 | - | Others | 88,590,459 | 88.05 | - | |
Procurements
Net value
| 136,924,168 | 100.00 | - | Procurements
Net value
| 158,000,566 | 100.00 | - | Procurements
Net value
| 100,618,508 | 100.00 | - | |
Reason for changes: Primarily due to the effect of customer demand.
(2) Names of customers who accounted for more than 10% of the sales in any of the last two years, and sales as a percentage of total sales, with explanations of the increase/decrease of such sales
Unit: NT$1,000; %
| 2014 | 2015 | As of the end of Q3 2016 | ||||||||||
| Item | Name | Amount | Percentage of net sales | Relation with issuer | Name | Amount | Percentage of net sales | Relation with issuer | Name | Amount | Percentage of net sales as of the end of Q3 2016 | Relation with issuer |
| 1 | Company B | 54,431,222 | 21.21 | None | Company B | 88,311,697 | 31.17 | None | Company B | 44,706,306 | 22.61 | None |
| Others | 202,160,225 | 78.79 | - | Others | 194,990,839 | 68.83 | - | Others | 153,049,168 | 77.39 | - | |
Sales
Net value
| 256,591,447 | 100.00 | - | Sales
Net value
| 283,302,536 | 100.00 | - | Sales
Net value
| 197,755,474 | 100.00 | - | |
Reason for changes: Primarily due to the influence of product sales of Company B.
6. Output volume and value during the most recent two years
Unit: 1,000; NT$ 1,000
Year Production value | 2014 | 2015 | ||||
Core Products | Production capacity | Production volume | Production output | Production capacity | Production volume | Production output |
| Packaging products | 32,937,997 | 28,656,057 | 88,296,216 | 36,603,997 | 27,604,076 | 86,258,77 |
| Test products (Note 1) | - | - | 16,242,669 | - | - | 16,166,199 |
| Electronic assembly products | 500,805 | 465,749 | 96,665,532 | 708,773 | 595,142 | 128,808,721 |
| Other (Note 2) | - | - | 1,798,501 | - | - | 1,933,618 |
| Total | 33,438,802 | 29,121,806 | 203,002,918 | 37,312,730 | 28,199,218 | 233,167,308 |
Note 1: Based on test duration; therefore, quantity was not disclosed
Note 2: Quantity was not disclosed due to inconsistent quantity
Reason for changes: The overall production capacity and output in 2015 increased from those in 2014 because of an increase in the order for electronic assembly products in 2015.
| 117 |
7. Sales volume and value during most recent two years
Unit: 1,000; NT$ 1,000
Year Sales value | 2014 | 2015 | ||||||
| Domestic | Export | Domestic | Export | |||||
Core Products | Qty | Value | Qty | Value | Qty | Value | Qty | Value |
| Packaging products | 5,370,470 | 25,024,909 | 23,285,587 | 96,311,544 | 4,494,130 | 22,795,108 | 23,109,946 | 93,812,206 |
| Test products (Note 1) | - | 1,691,568 | - | 24,183,126 | - | 1,661,491 | - | 23,530,425 |
| Electronic assembly products | 63,882 | 9,118,368 | 401,867 | 96,666,059 | 56,610 | 7,369,646 | 538,532 | 130,872,454 |
| Other (Note 2) | - | 912,854 | - | 2,683,019 | - | 804,904 | - | 2,456,302 |
| Total | 5,434,352 | 36,747,699 | 23,687,454 | 219,843,748 | 4,550,740 | 32,631,149 | 23,648,478 | 250,671,387 |
Note 1: Based on test duration; therefore, quantity was not disclosed
Note 2: Quantity was not disclosed due to inconsistent quantity
Reason for changes: Total sales in 2015 increased compared with that in 2014 primarily because of an increase in the export orders for electronic assembly products.
(3) Number of employees during the past 2 years
Unit: person; Year; %
| Year | 2014 | 2015 | As of November 30, 2016 | ||
Number of employees
| Technicians | 16,420 | 17,198 | 17,167 | |
| Managerial personnel | 3,496 | 3,698 | 3,853 | ||
| General affairs personnel | 6,008 | 6,201 | 6,110 | ||
| Operator | 42,176 | 38,692 | 40,018 | ||
| Total | 68,100 | 65,789 | 67,148 | ||
| Average age | 30.9 | 31.7 | |||
| Average years of service | 4.8 | 5.3 | |||
Education Distribution Percentage | Masters and Ph.D | 6.03% | 6.98% | 7.03% | |
| Bachelors | 47.01% | 47.23% | 48.62% | ||
| Senior High School and below | 46.96% | 45.79% | 44.35% | ||
(4) Spending on environmental protection
1. According to prevailing laws and regulations, a company is required to apply for permit for installation of waste treatment facilities or that for discharge of such waste or any waste prevention or treatment charges or institute units or personnel dedicated to environmental protection. In such a case its application, payment or institution shall be as follows
The Company and its subsidiaries have, as required by law, applied for operating permit for stationary pollution source and permit for water pollution prevention,
| 118 |
and have paid for pollution prevention fees and selected employees to participate in training and obtain environmental protection certificates.
(1) Status of application for permit for installation of waste treatment facilities or that for discharge of such waste or any waste prevention
| Types of Permit | Explanation |
| Operating Permit for Stationary Pollution Source | Zheng-Shu-Zi No. (ASE Kaohsiung): (1) MOEA Export Processing Si-Zing-Zi No.ABO03790, effective period: 2016/4/20 ~ 2021/4/19 (2) MOEA Export Processing Si-Zing-Zi No.AAN03791, effective period: 2015/8/21 ~ 2020/8/20 (3) MOEA Export Processing Si-Zing-Zi No.AEN20241, effective period: 2015/12/25 ~ 2020/12/24 (4) MOEA Export Processing Si-Zing-Zi No.AEN17291, effective period: 2015/12/25 ~ 2020/12/24 (5) MOEA Export Processing Si-Zing-Zi No.AENA7191, effective period: 2015/12/28 ~ 2020/12/27 (6) MOEA Export Processing Si-Zing-Zi No.AAOA5890, effective period: 7/7/2016 ~ 7/6/2021 (7) MOEA Export Processing Si-Zing-Zi No.AAOA5790, effective period: 7/7/2016 ~ 7/6/2021 (8) MOEA Export Processing Si-Zing-Zi No.AAOA5990, effective period: 7/8/2016 ~ 7/7/2021 (9) MOEA Export Processing Si-Zing-Zi No.AAN16075, effective period: 10/1/2015 ~ 9/30/2020 (10) MOEA Export Processing Si-Zing-Zi No.ACO16070, effective period: 1/12/2016 ~ 1/11/2021 (11) MOEA Export Processing Si-Zing-Zi No.ACO16071, effective period: 1/8/2016 ~ 1/7/2021 (12) MOEA Export Processing Si-Zing-Zi No.AEO16073, effective period: 11/9/2016 ~ 11/8/2021 (13) MOEA Export Processing Si-Zing-Zi No.AAOA6980, effective period: 6/17/2016 ~ 6/16/2021 (14) MOEA Export Processing Si-Zing-Zi No.AAO53650, effective period: 6/15/2016 ~ 6/14/2021 (15) MOEA Export Processing Si-Zing-Zi No.AEN53653, effective period: 11/20/2015 ~ 11/19/2020 (16) MOEA Export Processing Si-Zing-Zi No.AEN53652, effective period: 11/18/2015 ~ 11/17/2020 (17) MOEA Export Processing Si-Zing-Zi No.AAOA2660, effective period: 3/21/2016 ~ 3/20/2021 (18) MOEA Export Processing Si-Zing-Zi No.ACNA2660, effective period: 7/21/2015 ~ 7/20/2020 (19) MOEA Export Processing Si-Zing-Zi No.AANA5151, effective period: 9/10/2015 ~ 9/9/2020 (20) MOEA Export Processing Si-Zing-Zi No.ACOA5150, effective period: 8/4/2016 ~ 8/3/2021 (21) MOEA Export Processing Si-Zing-Zi No.AAKA5152, effective period: 10/22/2012 ~ 10/21/2017 (22) MOEA Export Processing Si-Zing-Zi No.AAOA8060, effective period: 7/4/2016 ~ 7/4/2021 (23) MOEA Export Processing Si-Zing-Zi No.AAO68350, effective period: 3/28/2016 ~ 3/27/2021 (24) MOEA Export Processing Si-Zing-Zi No.AAN68350, effective period: 4/8/2015 ~ 4/7/2020 (25) MOEA Export Processing Si-Zing-Zi No.AEN68351, effective period: 7/3/2015 ~7/2/2020 |
(26) MOEA Export Processing Si-Zing-Zi No.ABN68352, effective period: 11/3/2015 ~ 11/2/2020 (27) MOEA Export Processing Si-Zing-Zi No.AEOA6341, effective period: 9/22/2016 ~ 9/21/2021 (28) MOEA Export Processing Si-Zing-Zi No.AAMA6340, effective period: | |
| 119 |
5/20/2014 ~ 5/19/2019 (29) MOEA Export Processing Si-Zing-Zi No.AAOA0780, effective period: 5/17/2016 ~ 5/16/2021 (30) MOEA Export Processing Si-Zing-Zi No.AENA0780, effective period: 11/4/2015 ~ 11/3/2020 (31) MOEA Export Processing Si-Zing-Zi No.AAMA6920, effective period: 4/25/2014 ~ 4/20/2019 (32) MOEA Export Processing Si-Zing-Zi No.AENA6921, effective period: 12/1/2015 ~ 11/30/2020 (33) MOEA Export Processing Si-Zing-Zi No.AANA6301, effective period: 4/1/2015 ~ 3/31/2020 (34) MOEA Export Processing Si-Zing-Zi No.ACNA6922, effective period: 12/1/2015 ~ 11/30/2020 (35) MOEA Export Processing Si-Zing-Zi No.AAOA6920, effective period: 5/24/2016 ~ 5/23/2021 (36) MOEA Export Processing Si-Zing-Zi No.AAOA6921, effective period: 9/8/2016 ~ 9/7/2021 (37) MOEA Export Processing Si-Zing-Zi No.ABNA3852, effective period: 12/8/2015 ~ 3/4/2020 (38) MOEA Export Processing Si-Zing-Zi No.AAOA6307, effective period: 11/8/2016 ~ 11/7/2021 (39) MOEA Export Processing Si-Zing-Zi No.AEOA6304, effective period: 5/25/2016 ~ 4/19/2021 (40) MOEA Export Processing Si-Zing-Zi No.AANA6301, effective period: 4/1/2015 ~ 3/31/2020 (41) MOEA Export Processing Si-Zing-Zi No.AEOA6305, effective period: 5/25/2016 ~ 4/20/2021 (42) MOEA Export Processing Si-Zing-Zi No.AAOA6300, effective period: 1/28/2016 ~ 1/27/2021 (43) MOEA Export Processing Si-Zing-Zi No.AEOA6306, effective period: 5/27/2016 ~ 4/20/2021 Zheng-Shu-Zi No. (ASE Zhongli): (1) Packaging and testing plant 1 (H4032809): M01 Cao-Zheng-Zi No.H4517-05 M03 She-Zheng-Zi No.H3966-01 (2) Packaging and testing plant 4 (H43A2093): M01 Cao-Zheng-Zi No.H4901-04 | |
| Permit for Water Pollution Prevention | Zheng-Shu-Zi No. (ASE Kaohsiung): (1) Kaohsiung City Government Huan-Tu-Zhu-Xu-Zi No.00011-04 (effective period: 2/22/2016~12/27/2017) (2) Kaohsiung City Government Huan-Tu-Pai-Xu-Zi No.00734-03 (effective period: 10/17/2016~1/15/2018) (3) Kaohsiung City Government Huan-Tu-Pai-Xu-Zi No.00626-05 (effective period: 3/8/2016~10/1/2018) (4) Kaohsiung City Government Huan-Tu-Shui-Cuo-Zi No.00519-03 (effective period: 2/22/2016~8/2/2017) (5) Kaohsiung City Government Huan-Tu-Shui-Cuo-Zi No.00674-03 (effective period: 3/3/2016~3/2/2021) (6) Kaohsiung City Government Huan-Tu-Shui-Cuo-Zi No.00776-02 (effective period: 2/22/2016~6/19/2018) (7) Kaohsiung City Government Huan-Tu-Shui-Cuo-Zi No.00822-01 (effective period: 2/22/2016~2/21/2021 (8) Kaohsiung City Government Huan-Tu-Shui-Cuo-Zi No.00925-01 (effective period: 8/29/2016~8/28/2021) (9) Kaohsiung City Government Huan-Tu-Shui-Cuo-Zi No.00879-02 (effective period: 10/14/2016~7/8/2019) (10) Kaohsiung City Government Huan-Tu-Shui-Cuo-Zi No.00769-04 (effective period: 10/14/2016~5/21/2017) (11) Kaohsiung City Government Huan-Tu-Shui-Cuo-Zi No.00864-04 (effective period: 10/3/2916~4/22/2019) Zheng-Shu-Zi No. (ASE Zhongli): (1) Packaging and testing plant 1 (H4032809): Taoyuan City Huan-Pai-Xu-Zi No.H1980-07 |
| 120 |
(2) Packaging and testing plant 4 (H43A2093): Taoyuan City Huan-Pai-Xu-Zi No.H2107-05 (3) Packaging and testing plant 5 (H43A0700): Taoyuan City Huan-Pai-Xu-Zi No.H2108-09 (4) Packaging and testing plant 6 (H43B3840): Taoyuan City Huan-Pai-Xu-Zi No.H2976-05 (5) Packaging and testing plant 7 (H43C1277): Taoyuan City Huan-Pai-Xu-Zi No.H3435-02 (6) Packaging and testing plant 8 (H43C1811): Taoyuan City Huan-Pai-Xu-Zi No.H3525-01 (7) Underground sewage center (H4310703): Taoyuan City Huan-Pai-Xu-Zi No.H1382-06 | |
| Industrial Waste Disposal Plan | Zheng-Shu-Zi No. (ASE Kaohsiung): (1) 1050910 MOEA Export Processing Si-Zing-Zi No. 10501042450 (2) 1041202 MOEA Export Processing Si-Zing-Zi No. 10400126810 (3) 1041202 MOEA Export Processing Si-Zing-Zi No. 10400126800 (4) 1050826 MOEA Export Processing Si-Zing-Zi No. 10500086690 (5) 1041217 MOEA Export Processing Si-Zing-Zi No. 10400134180 (6) 1050902 MOEA Export Processing Si-Huan-Zi No. 10500089500 (7) 1050908 MOEA Export Processing Si-Zing-Zi No. 10501041990 (8) 1050907 MOEA Export Processing Si-Zing-Zi No. 10501041510 (9) 1050107 MOEA Export Processing Si-Zing-Zi No. 10400144040 (10) 1050926 MOEA Export Processing Si-Zing-Zi No. 10500097900 (11) 1050907 MOEA Export Processing Si-Zing-Zi No. 10501041700 (12) 1050617 MOEA Export Processing Si-Zing-Zi No. 10500058350 (13) 1050901 MOEA Export Processing Si-Zing-Zi No. 10501040870 (14) 1050910 MOEA Export Processing Si-Zing-Zi No. 10500091660 (15) 1050910 MOEA Export Processing Si-Zing-Zi No. 10500091670 (16) 1050927 MOEA Export Processing Si-Zing-Zi No. 10501044310 (17) 1040623 MOEA Export Processing Si-Zing-Zi No. 10400061140 (18) 1050203 MOEA Export Processing Si-Zing-Zi No. 10500013270 (19) 1051006 MOEA Export Processing Si-Zing-Zi No. 10500099650 (20) 1050707 MOEA Export Processing Si-Zing-Zi No. 10500066370 (21) 1050527 MOEA Export Processing Si-Zing-Zi No. 10500051630 approved Zheng-Shu-Zi No. (ASE Zhongli): (1) Packaging and testing plant 1 (H4032809): H09211160001 (2) Packaging and testing plant 4 (H43A2093): H09509070010 (3) Packaging and testing plant 5 (H43A0700): H09412120001 (4) Packaging and testing plant 6 (H43B3840): H10009070004 (5) Packaging and testing plant 7 (H43C1277): H10306250002 (6) Packaging and testing plant 8 (H43C1811): H10310290006 (7) Packaging and testing plant 9 (H43C8785): H10506200001 (8) Underground sewage center (H4310703): H095050011 |
(2) Payment of treatment charges
| Company/plant name | Category | 2014 | 2015 |
| ASE Kaohsiung/Chungli/Nantou | Industrial waste disposal | NT$ 99,436,000 | NT$ 158,137,000 |
| ASE Kaohsiung/Chungli/Nantou | Air pollution prevention | NT$ 23,405,000 | NT$ 39,206,000 |
| ASE Kaohsiung/Chungli/Nantou | Wastewater treatment | NT$ 64,136,000 | NT$ 44,975,000 |
(2) Units or personnel dedicated to environmental protection:
| Company/plant name | Name | Responsible technology | Certificate No. |
| K1 | Ming-Hao Liao | Category A wastewater treatment personnel | (2013) EPA-Xun-Zheng-Zi No.GA270128 |
| Han-Wei Lee | Category A wastewater treatment personnel | (2012) EPA-Xun-Zheng-Zi No.GA200350 | |
| Wen-Yao Chou | Category B wastewater treatment personnel | (2016) EPA-Xun-Zheng-Zi No.GB030217 |
| 121 |
| K3 | Shih-Hsien Chang | Category A wastewater treatment personnel | (2009) EPA-Xun-Zheng-Zi No.GA350079 |
| Chih-Hsien Wu | Category A wastewater treatment personnel | (2009) EPA-Xun-Zheng-Zi No.GA380094 | |
| De-Sheng Deng | Category B wastewater treatment personnel | (2013) EPA-Xun-Zheng-Zi No.GB080555 | |
| K5 | Chih-Yang Kuo | Category A wastewater treatment personnel | (2007) EPA-Xun-Zheng-Zi No.GA230008 |
| Chih-Hong Chang | Category A wastewater treatment personnel | (2009) EPA-Xun-Zheng-Zi No.GA480511 | |
| Ying-Hong Yeh | Category A wastewater treatment personnel | (2010) EPA-Xun-Zheng-Zi No.GA450643 | |
| K7 | Wen-Hui Chiu | Category A wastewater treatment personnel | (2005) EPA-Xun-Zheng-Zi No.GA110199 |
| Chung-Pu Tsai | Category A wastewater treatment personnel | (2013) EPA-Xun-Zheng-Zi No.GA301021 | |
| Pi-Yuan Wang | Category A wastewater treatment personnel | (2006) EPA-Xun-Zheng-Zi No.GA150036 | |
| K11 | Chung-Hsun Yu | Category A wastewater treatment personnel | (98) Huan-Shu-Shun-Zheng-Zi-GA070596 |
| Gu Li-Hua | Class 1 qualified wastewater treatment officer | (96) Huan-Shu-Shun-Zheng-Zi-GA020289 | |
| Zhou Jia-Cheng | Class 1 qualified wastewater treatment officer | (103) Huan-Shu-Shun-Zheng-Zi-GA320875 | |
K12
(Wafer Bumping 2B Plant)
| Zhang Jian Shi-Xian | Class 1 qualified wastewater treatment officer | (84) Huan-Shu-Shun-Zheng-Zi-GA430162 |
| Wang Wen-De | Class 1 qualified wastewater treatment officer | (93) Huan-Shu-Shun-Zheng-Zi-GA090102 | |
| Yan Jia-Fu | Class 2 qualified wastewater treatment officer | (103) Huan-Shu-Shun-Zheng-Zi-GB130131 | |
K12
(No. 12 Factory)
| Wang Guan-Lin | Class 1 qualified wastewater treatment officer | (103) Huan-Shu-Shun-Zheng-Zi-GA320954 |
| Hong Ming-Mao | Class 1 qualified wastewater treatment officer | (98) Huan-Shu-Shun-Zheng-Zi-GA190155 | |
| Yang Ming-Rui | Class 2 qualified wastewater treatment officer | (104) Huan-Shu-Shun-Zheng-Zi-GB240031 | |
| K21 | Lin Wei-Zong | Class 1 qualified wastewater treatment officer | (91) Huan-Shu-Shun-Zheng-Zi-GA060032 |
| Zheng Qing-Lun | Class 1 qualified wastewater treatment officer | (102) Huan-Shu-Shun-Zheng-Zi-GA160359 | |
| Zeng Peng-Cheng | Class 2 qualified wastewater treatment officer | (85) Huan-Shu-Shun-Zheng-Zi-GB351484 | |
| K14 | Wang Shi-Hao | Class 1 qualified wastewater treatment officer | (98) Huan-Shu-Shun-Zheng-Zi-GA250919 |
| Xiao Yi-Xiang | Class 1 qualified wastewater treatment officer | (92) Huan-Shu-Shun-Zheng-Zi-GA140293 | |
| Diao Qi-Yi | Class 2 qualified wastewater treatment officer | (97) Huan-Shu-Shun-Zheng-Zi-GB021005 | |
| K22 | Su Jing-Ming | Class 1 qualified wastewater treatment officer | (94) Huan-Shu-Shun-Zheng-Zi-GA150192 |
| Lin Kun-Zhi | Class 1 qualified wastewater treatment officer | (101) Huan-Shu-Shun-Zheng-Zi-GA300292 | |
| Wang Shi-Jie | Class 1 qualified wastewater treatment officer | (99) Huan-Shu-Shun-Zheng-Zi-GA070208 | |
| K8 | He Si-Ying | Class 1 qualified wastewater treatment officer | (97) Huan-Shu-Shun-Zheng-Zi-GA200599 |
| K9 | Wu Hui-Long | Class 1 qualified wastewater treatment officer | (98) Huan-Shu-Shun-Zheng-Zi-GA490009 |
| Su Zhen-Jia | Class 1 qualified wastewater treatment officer | (104) Huan-Shu-Shun-Zheng-Zi-GA410050 | |
| Xie Jia-Hong | Class 2 qualified wastewater treatment officer | (88) Huan-Shu-Shun-Zheng-Zi-GB250320 | |
| K15 | Xu Zhi-Wei | Class 1 qualified wastewater treatment officer | (95) Huan-Shu-Shun-Zheng-Zi-GA150342 |
| Lin Zhi-Hong | Class 1 qualified wastewater treatment officer | (92) Huan-Shu-Shun-Zheng-Zi-GA100357 | |
| Ye Li-Bin | Class 2 qualified wastewater treatment officer | (96) Huan-Shu-Shun-Zheng-Zi-GA050802 |
| 122 |
| K1 | Wang Min-Jie | Class 1 qualified air pollution control officer | (103) Huan-Shu-Shun-Zheng-Zi-FA220557 |
| K3 | Qian Jia-Yuan | Class 1 qualified air pollution control officer | (99) Huan-Shu-Shun-Zheng-Zi-FA040430 |
| K5 | Chen Kun-Cun | Class 1 qualified air pollution control officer | (104) Huan-Shu-Shun-Zheng-Zi-FA220089 |
| K7 | Liu Xuan-Xuan | Class 1 qualified air pollution control officer | (102) Huan-Shu-Shun-Zheng-Zi-FA320046 |
| K11 | Zhong Yu-Cheng | Class 1 qualified air pollution control officer | (103) Huan-Shu-Shun-Zheng-Zi-FA140443 |
| K21 | Wang Qiao-Zhi | Class 1 qualified air pollution control officer | (99) Huan-Shu-Shun-Zheng-Zi-FA010083 |
| K12 | Huang Yong-Cheng | Class 1 qualified air pollution control officer | (103) Huan-Shu-Shun-Zheng-Zi-FA140444 |
| K22 | Zhang Rui-Rui | Class 1 qualified air pollution control officer | (101) Huan-Shu-Shun-Zheng-Zi-FA170447 |
| K26 | He Shang-Feng | Class 1 qualified air pollution control officer | (90) Huan-Shu-Shun-Zheng-Zi-FA160457 |
| K9 | Chen Xin-Nan | Class 1 qualified air pollution control officer | (103) Huan-Shu-Shun-Zheng-Zi-FA140490 |
| K15 | Su Zhi-Cheng | Class 1 qualified air pollution control officer | (92) Huan-Shu-Shun-Zheng-Zi-FA030121 |
| K16 | Hong Mao-Zhe | Class 1 qualified air pollution control officer | (95) Huan-Shu-Shun-Zheng-Zi-FA010438 |
ASE Embedded Electronics Incorporated | Qiu Feng-Ze | Class 1 qualified air pollution control officer | (95) Huan-Shu-Shun-Zheng-Zi-FA010395 |
Advanced Semiconductor Engineering Co., Ltd. | Lin Yi-Hua | Class 1 qualified waste disposal officer | (96) Huan-Shu-Shun-Zheng-Zi-HA390493 |
| Tu Hong-Zhong | Class 1 qualified waste disposal officer | (102) Huan-Shu-Shun-Zheng-Zi-HA280488 | |
| Chen Jia-Ling | Class 1 qualified waste disposal officer | (104) Huan-Shu-Shun-Zheng-Zi-HA410288 | |
| Lin Feng-Qing | Class 2 qualified waste disposal officer | (103) Huan-Shu-Shun-Zheng-Zi-HB180203 | |
| Chen Yi-Jun | Class 1 qualified waste disposal officer | (100) Huan-Shu-Shun-Zheng-Zi-HA340323 | |
| Ou Su-Jie | Class 1 qualified waste disposal officer | (93) Huan-Shu-Shun-Zheng-Zi-HA290515 | |
| Yu Yan-Bin | Class 1 qualified waste disposal officer | (104) Huan-Shu-Shun-Zheng-Zi-HA410327 | |
| Chen Yan-Hong | Class 2 qualified waste disposal officer | (103) Huan-Shu-Shun-Zheng-Zi-HB210707 | |
ASE Test Incorporated | Lv Wen-Hong | Class 1 qualified waste disposal officer | (98) Huan-Shu-Shun-Zheng-Zi-HA050079 |
| Jian Yu-Zhi | Class 1 qualified waste disposal officer | (90) Huan-Shu-Shun-Zheng-Zi-HA440902 | |
ASE Electronics Incorporated | Chen Pin-Zhen | Class 1 qualified waste disposal officer | (98) Huan-Shu-Shun-Zheng-Zi-HA470311 |
| Cai Meng-Han | Class 1 qualified waste disposal officer | (97) Huan-Shu-Shun-Zheng-Zi-HA500691 | |
| Xu Shu-Yan | Class 1 qualified waste disposal officer | (103) Huan-Shu-Shun-Zheng-Zi-HA310153 | |
ASE Embedded Electronics Incorporated | Wang Si-Yu | Class 2 qualified waste disposal officer | (98) Huan-Shu-Shun-Zheng-Zi-HB370015 |
| No. 1 Packaging and Test Plant | Li Qi-Yu | Class 1 qualified air pollution control officer | (98) Huan-Shu-Shun-Zheng-Zi-FA210023 |
| No. 1 Packaging and Test Plant | Li Qi-Yu | Class 1 qualified wastewater treatment officer | (95) Huan-Shu-Shun-Zheng-Zi-GA070046 |
| No. 1 Packaging and Test Plant | Lin Jia-Wei | Class 1 qualified wastewater treatment officer | (101) Huan-Shu-Shun-Zheng-Zi-GA140254 |
| No. 1 Packaging and Test Plant | Wu Zhen-Jia | Class 1 qualified wastewater treatment officer | (101) Huan-Shu-Shun-Zheng-Zi-GA300968 |
| No. 1 Packaging and Test Plant | Li Qi-Yu | Class 1 waste disposal technician | (96) Huan-Shu-Shun-Zheng-Zi-HA500363 |
| No. 4 Packaging and Test Plant | Wang Zhi-Fa | Class 1 qualified air pollution control officer | (99) Huan-Shu-Shun-Zheng-Zi-FA260064 |
| 123 |
| No. 4 Packaging and Test Plant | Guo Wei-Yan | Class 1 qualified wastewater treatment officer | (99) Huan-Shu-Shun-Zheng-Zi-GA240896 |
| No. 4 Packaging and Test Plant | Guo Wei-Yan | Class 1 waste disposal technician | (99) Huan-Shu-Shun-Zheng-Zi-HB220950 |
| No. 5 Packaging and Test Plant | Zan Wu-Lie | Class 1 qualified wastewater treatment officer | (100) Huan-Shu-Shun-Zheng-Zi-GA050427 |
| No. 5 Packaging and Test Plant | Xu Chen-Zhi | Class 1 qualified wastewater treatment officer | (102) Huan-Shu-Shun-Zheng-Zi-GA270233 |
| No. 5 Packaging and Test Plant | Lv Yang-Ren | Class 2 qualified wastewater treatment officer | (97) Huan-Shu-Shun-Zheng-Zi-GB580008 |
| No. 5 Packaging and Test Plant | Zan Wu-Lie | Class 1 waste disposal technician | (93) Huan-Shu-Shun-Zheng-Zi-HA281344 |
| No. 6 Packaging and Test Plant | Lin Jian-Hong | Class 1 qualified wastewater treatment officer | (97) Huan-Shu-Shun-Zheng-Zi-GA450955 |
| No. 6 Packaging and Test Plant | Lin Jian-Hong | Class 1 waste disposal technician | (92) Huan-Shu-Shun-Zheng-Zi-HA110872 |
| No. 7 Packaging and Test Plant | Yang Ji-Zong | Class 1 qualified wastewater treatment officer | (99) Huan-Shu-Shun-Zheng-Zi-GA610175 |
| No. 7 Packaging and Test Plant | Xu Ji-Yin | Class 1 waste disposal technician | (105) Huan-Shu-Shun-Zheng-Zi-HA120785 |
| No. 8 Packaging and Test Plant | Yang Shun-Ming | Class 1 waste disposal technician | (93) Huan-Shu-Shun-Zheng-Zi-HA260860 |
| No. 9 Packaging and Test Plant | Zhu Xiu-Cheng | Class 2 waste disposal technician | (101) Huan-Shu-Shun-Zheng-Zi-HB211074 |
| Sewage Pipe Center | Zhong Xin-Zhao | Class 1 qualified wastewater treatment officer | (102) Huan-Shu-Shun-Zheng-Zi-GA340325 |
| Sewage Pipe Center | Hong Zheng-Guang | Class 1 qualified wastewater treatment officer | (88) Huan-Shu-Shun-Zheng-Zi-GA160087 |
| Sewage Pipe Center | Yang Qing-Fu | Class 2 qualified wastewater treatment officer | (103) Huan-Shu-Shun-Zheng-Zi-GB140381 |
| Sewage Pipe Center | Zhong Xin-Zhao | Class 1 waste disposal technician | (96) Huan-Shu-Shun-Zheng-Zi-HA180158 |
2. List of the Company's investments in key equipment on prevention and treatment of environmental pollution; their use and anticipated benefits
November 30, 2016 Unit: NT$ 1,000
| Name of Equipment | Quantity | Date Obtained | Investment Cost | Balance before Depreciation | Use and anticipated benefit |
| K7-8F indoor waste gas exhaust pipes and central dust pipe production and installation works | 1 | 2003/7/31 | 19,000 | 6,413 | Prevention and control of air pollution |
| BUMPING waste water and gas treatment system assmebly works | 1 | 2001/9/30 | 13,500 | - | Prevention and control of water pollution |
| K7-NUMPING II 300mm waste water and gas production and installation works | 1 | 2003/7/31 | 16,300 | 5,501 | Prevention and control of water pollution |
| K7-10F waste gas and central dust-collection equipment (one-off assembly) work | 1 | 2003/7/31 | 11,200 | 3,780 | Prevention and control of air pollution |
| K7-3F waste gas treatment and central dust-collection work for Phase 1 | 1 | 2003/10/31 | 33,900 | 11,865 | Prevention and control of air pollution |
| Wastewater land-borne discharge pipe work and planning design | 1 | 2001/9/30 | 19,848 | 4,879 | Prevention and control of water pollution |
| K7 wastewater treatment system | 1 | 2002/8/31 | 24,030 | 1,335 | Prevention and control of water pollution |
| K1/K2 organic/inorganic waste gas treatment work | 1 | 2001/11/30 | 12,244 | 68 | Prevention and control of air pollution |
| K7-11F indoor waste gas exhaust | 1 | 2004/7/31 | 11,200 | 4,340 | Prevention and |
| 124 |
| Name of Equipment | Quantity | Date Obtained | Investment Cost | Balance before Depreciation | Use and anticipated benefit |
| pipes and central dust pipe production and installation works | control of air pollution | ||||
| K7-5F BUMPING extension A.D Section waste gas/water discharge/central dust pipe work | 1 | 2004/7/31 | 24,500 | 9,494 | Prevention and control of air pollution |
| K11 Phase 1 waste treatment equipment and central dust-collection works | 1 | 2005/6/30 | 28,850 | 12,502 | Prevention and control of air pollution |
| K7-9F waste gas exhaust pipes and central dust pipe production and installation works | 1 | 2005/9/30 | 12,337 | 5,500 | Prevention and control of air pollution |
| K7 cutting and cleaning wastewater recovery system | 1 | 2006/2/28 | 25,572 | 7,388 | Prevention and control of water pollution |
| K11 air-conditioner main unit room and rooftop cooling water tower power distribution and piping works | 1 | 2006/5/31 | 38,171 | 18,290 | Prevention and control of water pollution |
| K11 wastewater treatment plant equipment and construction | 1 | 2006/8/31 | 32,629 | 16,043 | Prevention and control of water pollution |
| K7 new organic waste gas treatment equipment | 1 | 2006/9/30 | 14,821 | 7,349 | Prevention and control of air pollution |
| Sludge baking equipment work | 1 | 2007/11/30 | 14,775 | 5,992 | Waste Disposal/Treatment |
| K7 Phase 1 purified water system improvement (2B3T+MB) work | 1 | 2009/10/31 | 31,046 | 20,180 | Prevention and control of water pollution |
| K7 wastewater recovery system work | 1 | 2011/12/31 | 16,130 | 10,933 | Prevention and control of water pollution |
| K12-2F plant-construction DW, PCW water recovery pipe work | 1 | 2012/5/31 | 14,546 | 10,263 | Prevention and control of water pollution |
| K12 wastewater treatment plant new construction work | 1 | 2012/11/30 | 84,100 | 62,141 | Prevention and control of water pollution |
| K12-RF main waste gas treatment equipment work | 1 | 2013/3/31 | 70,425 | 53,601 | Prevention and control of air pollution |
| K7 column scrubber machine addition work (Phase 1) | 1 | 2014/5/31 | 16,686 | 13,997 | Prevention and control of air pollution |
| K5 wastewater recovery and treatment works | 1 | 2014/5/31 | 17,650 | 14,806 | Prevention and control of water pollution |
| K11-4F production process DS/SS wastewater recovery system work | 1 | 2014/7/31 | 28,092 | 23,878 | Prevention and control of water pollution |
| K21-B1F Block A main wastewater system work | 1 | 2014/11/30 | 78,065 | 68,090 | Prevention and control of water pollution |
| K12 wastewater recovery system work | 1 | 2014/12/31 | 13,112 | 11,509 | Prevention and control of water pollution |
| K21 production process SS/DS new recovered water and recovered organic water work | 1 | 2015/4/30 | 45,152 | 40,637 | Prevention and control of water pollution |
| K7RF air pollution control system | 1 | 2015/4/30 | 94,342 | 87,266 | Prevention and |
| 125 |
| Name of Equipment | Quantity | Date Obtained | Investment Cost | Balance before Depreciation | Use and anticipated benefit |
| work | control of air pollution | ||||
| K22-RF exhaust system main equipment work | 1 | 2015/7/31 | 21,975 | 20,602 | Prevention and control of air pollution |
| Environmental Protection Building central water recovery exhaust equipment | 1 | 2015/9/30 | 24,116 | 22,809 | Prevention and control of water pollution |
| Environmental Protection Building central work recovery equipment | 1 | 2015/9/30 | 226,898 | 214,496 | Prevention and control of water pollution |
| K14B Environmental Protection Building central water recovery buried-pipe work | 1 | 2015/11/30 | 62,943 | 59,936 | Prevention and control of water pollution |
| K11-RF (P011) air pollution system expansion work | 1 | 2016/3/31 | 52,767 | 50,715 | Prevention and control of air pollution |
| K22 new main exhaust system work | 1 | 2016/3/31 | 149,631 | 145,267 | Prevention and control of air pollution |
| K22 VOCS new waste gas treatment system work | 1 | 2016/4/30 | 123,755 | 120,661 | Prevention and control of air pollution |
| K16-RF plant section exhaust system Phase 1 | 1 | 2016/5/31 | 25,566 | 25,033 | Prevention and control of air pollution |
| K5 wastewater treatment work | 1 | 1998/10/31 | 10,500 | - | Prevention and control of water pollution |
| K5 damper purchasing and installation work | 1 | 2012/3/31 | 22,540 | 17,375 | Prevention and control of noise and vibration |
| K5 shock resistance enhancement work | 1 | 2012/4/30 | 27,449 | 21,273 | Prevention and control of noise and vibration |
| K14B Environmental Protection Building new renovation and landscaping works | 1 | 2014/11/30 | 62,261 | 54,305 | Prevention and control of water pollution |
| K14B Environmental Protection Building new M&E works | 1 | 2014/11/30 | 23,042 | 20,833 | Prevention and control of water pollution |
| K14B Environmental Protection Building new fire safety work | 1 | 2014/11/30 | 13,615 | 11,875 | Prevention and control of water pollution |
| No. 2 Park five major pipe inter-section connection and pre-cast work | 1 | 2015/7/31 | 71,267 | 66,813 | Prevention and control of water pollution |
| K14B-2F continuous-type heat pump environmentally-friendly sludge dryer | 1 | 2016/9/3 | 15,331 | 15,331 | Prevention and control of water pollution |
| K26-RF main exhaust system plant-construction work - 40% completed | 1 | 2016/9/3 | 10,020 | 10,020 | Prevention and control of air pollution |
| C Building waste gas treatment work | 1 | 2004/10/31 | 66,800 | - | Reduction of air pollution |
| Block C basement 1F wastewater treatment plant Phase 1 | 1 | 2004/12/31 | 36,490 | 26,248 | Prevention and control of water pollution |
| B8F waste gas treatment and central | 1 | 2005/6/30 | 44,175 | 10,798 | Reduction of air |
| 126 |
| Name of Equipment | Quantity | Date Obtained | Investment Cost | Balance before Depreciation | Use and anticipated benefit |
| dust-collection system works | pollution | ||||
| Block B Packaging and testing plant waste gas treatment work | 1 | 2005/9/12 | 22,400 | - | Reduction of air pollution |
| B Plant Administration Section 13F wastewater recovery system Phase 1 | 1 | 2005/9/12 | 38,912 | - | Prevention and control of water pollution |
| B Plant Administration Section 13F wastewater recovery system Phase 2 | 1 | 2006/5/4 | 21,500 | 1,792 | Prevention and control of water pollution |
| Block B wastewater treatment Phase 1 | 1 | 2006/7/1 | 82,000 | 7,243 | Prevention and control of water pollution |
| Black B materials plant Phase 1 main waste gas system work | 1 | 2006/8/31 | 79,800 | - | Reduction of air pollution |
| A10F clean room exhaust pipe work (new) | 1 | 2008/3/10 | 17,500 | 3,208 | Reduction of air pollution |
| Block A waste gas treatment system (new) | 1 | 2008/3/10 | 31,000 | 6,200 | Reduction of air pollution |
| A-RF recovered water system | 1 | 2010/9/20 | 23,780 | 14,400 | Prevention and control of water pollution |
| B-B1F purified water recovery system work | 1 | 2010/9/21 | 33,000 | 19,983 | Prevention and control of water pollution |
| A-8F primary exhaust system | 1 | 2010/9/23 | 15,275 | 6,237 | Reduction of air pollution |
| A-RF waste gas treatment system Phase 2 (includes main air pipe for utility distribution room) | 1 | 2010/9/23 | 22,300 | 13,504 | Reduction of air pollution |
| B-B1F recovered water system Phase 2 expansion work | 1 | 2011/7/22 | 33,000 | 22,367 | Prevention and control of water pollution |
| A-2F equipment section and utility distribution room waste gas work | 1 | 2011/12/8 | 10,800 | 5,490 | Reduction of air pollution |
| B-B2 wastewater circulation environmental indicator control and wastewater works | 1 | 2014/3/7 | 700 | 554 | Prevention and control of water pollution |
| B-B1F combined sludge tank and flotation system - Chemical mixing system | 1 | 2014/3/27 | 4,776 | 3,741 | Prevention and control of water pollution |
| Blocks A, B and C wastewater treatment plant release pool PH-monitoring Alarm Call system work (central control room) | 1 | 2014/4/16 | 138 | 71 | Prevention and control of water pollution |
| Block A wastewater treatment plant SS SENSOR connection work | 1 | 2014/4/16 | 122 | 63 | Prevention and control of water pollution |
| Block B wastewater treatment plant release pool environmental information continuous-monitoring Alarm Call system work (central control room) | 1 | 2014/4/16 | 104 | 53 | Prevention and control of water pollution |
| A-RF wastewater treatment plant and dust-collection exhaust vent's additional installation of ventilation pipe and fan coil unit work (201402) | 1 | 2014/4/22 | 6,134 | 3,885 | Prevention and control of water pollution |
| Blocks A and C wastewater monitoring equipment new connection and Block B wastewater | 1 | 2014/4/23 | 255 | 136 | Prevention and control of water pollution |
| 127 |
| Name of Equipment | Quantity | Date Obtained | Investment Cost | Balance before Depreciation | Use and anticipated benefit |
| treatment plan system work (1 unit of surveillance video camera for Blocks A and C) | |||||
| Block AB 1F wastewater temporary storage tank pipeline work | 1 | 2014/4/30 | 2,016 | 1,647 | Prevention and control of water pollution |
| B-13F recovery system UF membrane water-supply work | 1 | 2014/5/27 | 9,900 | 3,850 | Prevention and control of water pollution |
| B-B1F recovered water Phase 3 water-supply work | 1 | 2014/5/27 | 33,871 | 13,172 | Prevention and control of water pollution |
| Dehydrating equipment - Block B wastewater plan sludge dehydrating machine PAM-60 procurement | 2 | 2014/6/6 | 7,160 | 5,609 | Prevention and control of water pollution |
| C-B1F wastewater plant new CDA gas pipeline work (gas supply) | 1 | 2014/6/11 | 15 | 3 | Prevention and control of water pollution |
| Block LM 1200CMD cutting and grinding processes wastewater recovery system work | 1 | 2014/6/17 | 23,800 | 19,635 | Prevention and control of water pollution |
| L-RF purified water and waste gas scrubber infrastructural base addition work | 1 | 2014/6/26 | 6,194 | 5,506 | Prevention and control of water pollution |
| Blocks A, B and C wastewater plant fiber optics and communication monitoring work | 1 | 2014/7/10 | 370 | 210 | Prevention and control of water pollution |
| B-RF air pollution control equipment VOC (volatile organic compounds) concentration monitor work | 1 | 2014/7/23 | 2,385 | 1,550 | Reduction of air pollution |
| Nitrogen-hydrogen mixing section and Block A 8-11F plant administration section noise prevention work | 1 | 2014/7/23 | 2,200 | 1,833 | Prevention and control of noise |
| Gas exhaust work - Block B top floor Phases 1 and 2 AOP link-corridor work | 1 | 2014/8/14 | 270 | 231 | Reduction of air pollution |
| Block F wastewater treatment plant (civil construction) | 1 | 2014/8/15 | 370,834 | 350,747 | Prevention and control of water pollution |
| Blocks A, B and C released water recovery system purchasing and installation work | 1 | 2014/8/26 | 193,605 | 183,925 | Prevention and control of water pollution |
| L-10F (main pipeline) sewerage/wastewater works | 1 | 2014/9/29 | 1,150 | 910 | Prevention and control of water pollution |
| A-WWTP (Waste Water Treatment Plant) sludge-dehydrating machine work | 1 | 2014/10/14 | 4,800 | 4,000 | Prevention and control of water pollution |
| Blocks A, B and C wastewater plant man-machine interface integrated surveillance work | 1 | 2014/10/16 | 1,800 | 1,570 | Prevention and control of water pollution |
| Block A wastewater plant sand-filter pump additional installation of inching starter | 1 | 2014/10/30 | 140 | 113 | Prevention and control of water pollution |
| Blocks A, B and C B1F release water recovery system additional space construction work (201408) | 1 | 2014/11/11 | 3,080 | 2,926 | Prevention and control of water pollution |
| 128 |
| Name of Equipment | Quantity | Date Obtained | Investment Cost | Balance before Depreciation | Use and anticipated benefit |
| Block A B1F release water recovery system space - fire safety work | 1 | 2014/11/14 | 840 | 798 | Prevention and control of water pollution |
| A-b1F new production process recovery system - water supply work | 1 | 2014/11/26 | 35,000 | 32,278 | Prevention and control of water pollution |
| Retracting door work for Second Entrance at South Gate | 1 | 2014/11/26 | 300 | 263 | Prevention and control of water pollution |
| B-RF M02 column scrubber air volume air-flow meter exhaust work | 1 | 2014/12/12 | 315 | 277 | Reduction of air pollution |
| Blocks K, L, M B3F sewerage and normal water diversion work | 1 | 2014/12/18 | 479 | 391 | Prevention and control of water pollution |
| L-RF new pneumatic valve air-source pipeline work | 1 | 2014/12/25 | 640 | 562 | Reduction of air pollution |
| C-RF noise prevention and control work | 1 | 2015/1/13 | 9,223 | 8,454 | Prevention and control of noise |
| I-RF noise prevention and control work | 1 | 2015/1/13 | 2,235 | 2,030 | Prevention and control of noise |
| Block A wastewater plant temporary sludge storage section - addition of rolling shutter (201412) | 1 | 2015/2/25 | 320 | 286 | Prevention and control of water pollution |
| F-b3F sewerage and organic wastewater tank #9-13 FRP works | 1 | 2015/3/5 | 1,070 | 936 | Prevention and control of water pollution |
| F-b3F sewerage and organic wastewater tank #9-13 FRP works | 1 | 2015/3/5 | 1,070 | 936 | Prevention and control of water pollution |
| A-B1F release water recovery system tank body FRP/Epoxy materials | 1 | 2015/3/5 | 2,638 | 2,374 | Prevention and control of water pollution |
| Blocks A, B production process recovery system integrated water-supply work | 1 | 2015/3/27 | 10,700 | 10,403 | Prevention and control of water pollution |
| Block B release water filtration equipment installation work | 1 | 2015/3/27 | 6,100 | 5,490 | Prevention and control of water pollution |
| B-9F F/E waste liquid container testing structure secondary distribution work - POU Hantang | 1 | 2015/3/31 | 15 | 7 | Prevention and control of water pollution |
| Blocks A, B and C water recovery system - new exhaust pipe work (201501) | 1 | 2015/4/17 | 5,661 | 5,000 | Prevention and control of water pollution |
| Block A wastewater plant SS SENSOR water-discharge secondary distribution work (201401) | 1 | 2015/4/23 | 110 | 58 | Prevention and control of water pollution |
| A-WWTP TK-607 additional installation of diverging three-way valve to TK-1000 work | 1 | 2015/5/8 | 171 | 146 | Prevention and control of water pollution |
| L-b3F additional water-supply work for production process recovery Phase 2 system | 1 | 2015/5/27 | 27,970 | 26,922 | Prevention and control of water pollution |
| A-b1F additional tank body for production process recovery system | 1 | 2015/6/10 | 950 | 876 | Prevention and control of water pollution |
| B-b2F wastewater surveillance cabinet power-distribution work (201503) | 1 | 2015/6/16 | 150 | 137 | Prevention and control of water pollution |
| 129 |
| Name of Equipment | Quantity | Date Obtained | Investment Cost | Balance before Depreciation | Use and anticipated benefit |
| Purified/wastewater chemical tank over-flow barrier water-supply work | 1 | 2015/7/10 | 2,400 | 2,280 | Prevention and control of water pollution |
| CMP reclaimed water recycling system | 1 | 2015/7/16 | 2,707 | 2,223 | Factory floor grinding/scribing wastewater recycling |
| B-B1F ABC wastewater pool FRP laying work (201501) | 1 | 2015/8/7 | 5,986 | 5,786 | Prevention and control of water pollution |
| C-b1F wastewater system additional emergency power distribution work (201503) | 1 | 2015/8/10 | 1,480 | 1,365 | Prevention and control of water pollution |
| Release water quality and volume automatic monitoring (surveillance) and linked-transmission wastewater work (201407) | 1 | 2015/8/11 | 2,261 | 2,085 | Prevention and control of water pollution |
| Blocks A/B/C b-1F release water, production process recovery system power distribution work (201408) | 1 | 2015/8/14 | 1,424 | 1,313 | Prevention and control of water pollution |
| Exhaust work - No. 4 Packaging and Testing Plant - additional zoelite rotor system | 1 | 2015/9/9 | 26,500 | 26,500 | Reduction of air pollution |
| L-3F RUN CARE RUN 4 additional exhaust-cover work | 1 | 2015/10/1 | 960 | 864 | Reduction of air pollution |
| Block A wastewater plant chemical tank - addition of content gauge | 1 | 2015/10/5 | 570 | 513 | Prevention and control of water pollution |
| L-1F East corridor sound-reduction shuttle installation work | 1 | 2015/10/7 | 285 | 257 | Prevention and control of noise |
| Wastewater project - F-WWTP recovery system additional work | 1 | 2015/10/29 | 249,800 | 249,800 | Prevention and control of water pollution |
| Block A 3F-7F mounted opening noise insulation work | 1 | 2015/11/3 | 240 | 218 | Prevention and control of noise |
| Blocks A, B, C wastewater plant new PH meter system work | 1 | 2015/11/5 | 140 | 127 | Prevention and control of water pollution |
| Blocks A, B, C wastewater pool - addition of RC partitioning wall (201501) | 1 | 2015/11/23 | 969 | 909 | Prevention and control of water pollution |
| Release water quality and volume - Automatic monitoring (surveillance) and link-transmission equipment | 1 | 2015/12/7 | 590 | 556 | Prevention and control of water pollution |
| Block B B1F release water recovery system space - fire safety work | 1 | 2015/12/28 | 1,680 | 1,596 | Prevention and control of water pollution |
| Blocks A, B, C b1F release water recovery equipment section storeroom - Support pillar traffic and additional or protecting steel plate | 1 | 2016/1/13 | 680 | 629 | Prevention and control of water pollution |
| Block C B1F release water water recovery system space - fire safety work | 1 | 2016/1/18 | 280 | 266 | Prevention and control of water pollution |
| Blocks A, B, C wastewater pool - further addition of RC partitioning wall (PO#4500258069) | 1 | 2016/2/5 | 330 | 315 | Prevention and control of water pollution |
| WWTF release water abnormality emergency response meter control | 1 | 2016/2/15 | 2,826 | 2,826 | Prevention and control of water |
| 130 |
| Name of Equipment | Quantity | Date Obtained | Investment Cost | Balance before Depreciation | Use and anticipated benefit |
| and pipeline work | pollution | ||||
| B WWTP release pipe - addition of breaching chemical to wastewater | 1 | 2016/2/26 | 690 | 650 | Prevention and control of water pollution |
| L-1F Northeast side elevator lobby - Emergency exit sound insulation work | 1 | 2016/4/15 | 210 | 200 | Prevention and control of noise |
| Blocks A. B, C cooling water recovery work | 1 | 2016/4/22 | 1,890 | 1,843 | Prevention and control of water pollution |
| Block A Support, Blocks L/M industrial water pool - water-supply pipeline | 1 | 2016/4/22 | 2,700 | 2,685 | Prevention and control of water pollution |
| B-WWTP discharge - addition of automatic monitoring of cooper ions | 1 | 2016/4/25 | 790 | 751 | Prevention and control of water pollution |
| Block B sewerage screening machine installation - wastewater work | 1 | 2016/4/25 | 470 | 447 | Prevention and control of water pollution |
| Block L sewerage screening machine installation - wastewater work | 1 | 2016/4/25 | 430 | 409 | Prevention and control of water pollution |
| Wastewater work - Block A WWTP organic sediment pool installation work (201503) - 30% completed | 1 | 2016/7/21 | 5,290 | 5,290 | Prevention and control of water pollution |
| L-B3F organic and inorganic waste liquid storage tank - addition alarm work (201602) | 1 | 2016/7/26 | 168 | 164 | Prevention and control of water pollution |
| Waste recovery section surveillance camera and remote monitoring control work (201605) | 1 | 2016/8/17 | 197 | 194 | Prevention and control of water pollution |
3. The Company's history of reducing environmental pollution, any disputes involving such pollution and the Company's handling of such disputes during the past 2 years and as of the date of printing and publication of this Prospectus: None
4. Total amount of losses incurred by the Company (including compensation paid) and fines paid during the past 2 years and as of the date of printing and publication of this Prospectus; disclosure by the Company on its future response measures (including improvement measures) and likely expenses (including estimated amount of potential losses, fines and compensation as a result of failure of implementing such measures; where estimated amount for the above-mentioned cannot be given, explanation should be given about the facts that make such estimates incapable of being given):
Kaohsiung Head Office
(1) Kaohsiung K1 Plant
The Plant was duly fined NT$12,000 by Environmental Protection Bureau of Kaohsiung City Government on July 30, 2014 for violation of Trash Clearance Act on January 22, 2014. Response measures: ○ , 1 )1The Plant (i.e. K1 Plant) had on March 5, 2014 obtained approval for change of trash clearance permit; the means of disposing waste lubricant (D-1703) was approved as physical disposal. Insofar as subsequent disposal by the Plant differs from existing disposal means, the Plant would be required to apply for change of trash
| 131 |
clearance permit. (1) The Plant has set aside a temporary waste lubricant (i.e. D-1703) storage area. The layout plan for the said temporary storage area is attached to the trash clearance permit. The Plant has confirmed triplicate application for clearance, filing of waste production volume, and temporary storage and means of disposal etc.
(3) Kaohsiung K3 Plant
The Plant was duly fined NT$100,000 by Environmental Protection Bureau of Kaohsiung City Government on September 24, 2014 for violation of Article 24, Paragraph 2 of the Air Pollution Control Act on June 24, 2014. Response measures: (1) Application for variation (change) to raise the volume of raw materials used. (2) Control of draw down of raw materials to ensure that the volume used did not exceed the approved volume.
(3) Kaohsiung K5 Plant
The Plant was duly fined NT$12,000 by Environmental Protection Bureau of Kaohsiung City Government on July 30, 2014 for violation of Trash Clearance Act on January 22, 2014. Response measures: (1) According to the Trash Clearance Contract dated February 4, 2014 (vendor: Kingdom Resource Technology Co., Ltd.) the means of collection and disposal of waste lubricant would be heat treatment. Appropriate changes to the trash clearance permit was approved on March 5, 2014. Insofar as subsequent disposal by the Plant differs from existing disposal means, the Plant would be required to apply for change of trash clearance permit. (2) The respective Plants were expected to set aside temporary waste lubricant (i.e. D-1703) storage area. The layout plan for the said temporary storage area would be attached to the trash clearance permit. The said Plants were also expected to confirm matters such as triplicate application for clearance, filing of waste production volume, and temporary storage and means of disposal etc.
As a result of M11 production process (wafer packing process) and M13 production process (wafer packing process) on September 24, 2014, the Plant was on 24, 2014 fined NT$200,000 by Environmental Protection Bureau of Kaohsiung City Government for violation of Article 24, Paragraph 2 of the Air Pollution Control Act. Response measures: (1) Application for variation (change) to raise the volume of raw materials used. (2) Control of draw down of raw materials to ensure that the volume used did not exceed the approved volume.
(4) Kaohsiung K6 Plant:
As a result of M05 production process (wafer packing process) on September 24, 2014, the Plant was on June 24, 2014 fined NT$100,000 by Environmental Protection Bureau of Kaohsiung City Government for violation of Article 24, Paragraph 2 of the Air Pollution Control Act. Response measures: (1) Application for variation (change) to raise the volume of raw materials used. (2) Control of draw down of raw materials to ensure that the volume used did not exceed the approved volume.
(5) Kaohsiung K7 Plant:
As a result of violation of Article 24, Paragraph 2 of the Air Pollution Control Act on February 21, 2014, the Plant was on March 20, 2014 fined NT$100,000 by Environmental Protection Bureau of Kaohsiung City Government.
| 132 |
Response measures: Closed the secondary sodium chlorate tank's channel valve and the pipelines, and changed the contents of operating permit.
As a result of violation on December 17, 2013 of Articles 13 and 20 of the Employment Management Regulations of Environmental- Protection Dedicated Units or Personnel formulated pursuant to Article 21 of the Water Pollution Control Act, the Plant was on March 25, 2014 fined NT$30,000 by Environmental Protection Bureau of Kaohsiung City Government. The Kaohsiung District Prosecutors Office prosecuted the Company in January 2014 for violations of the Waste Disposal Act and other laws, and the Taiwan Kaohsiung District Court fined the Company NT$3 million for violating Article 47 of the Waste Disposal Act. Response measures: (1) This was mainly because the Environmental Protection Bureau had determined some disparity with respect to the persons-in-charge. The latter were carrying out other plant-related work, including wastewater. (2) As a result the relevant personnel was replaced. K7 wastewater plant's services were also determined.
The Plant was duly fined NT$12,000 by Environmental Protection Bureau of Kaohsiung City Government on July 30, 2014 for violation of Trash Clearance Act on January 22, 2014. Response measures: (1) Comprehensive planning for waste lubricant (D-1703) temporary storage area. (2) Matters such as triplicate application for clearance, filing of waste production volume, and temporary storage and means of disposal etc. were also implemented.
As a result of violation of Article 24, Paragraph 2 of the Air Pollution Control Act on June 24, 2014 for its M21 production process (IC production) and M22 production process (IC production), the Plant was on September 24, 2014 fined NT$200,000 by Environmental Protection Bureau of Kaohsiung City Government. Response measures: (1) Application for variation (change) to raise the volume of raw materials used. (2) Control of draw down of raw materials to ensure that the volume used did not exceed the approved volume.
(6) Kaohsiung K8 Plant
The Plant was duly fined NT$12,000 by Environmental Protection Bureau of Kaohsiung City Government on July 30, 2014 for violation of Trash Clearance Act on January 22, 2014. Response measures: (1) Change of trash clearance permit with addition of disposal means for D-1703: Interim treatment would be physical disposal. (2) When issuing triplicate notes upon clearance of waste, such triplicates would have to be issued in accordance with the type and volume of waste and disposal method in the trash clearance permit. (3) Formulation of Trash Clearance Contracts: Clearance tools, means and venues were all compliant with law.
As a result of violation on August 21, 2014 of Article 18 of the Water Pollution Control Act, the Plant was on November 11, 2014 fined NT$10,000 by Environmental Protection Bureau of Kaohsiung City Government. Response measures: Installation of released water flow-volume gauge in accordance with the Environmental Protection Bureau's requirements. The measure was also recorded in water-control documents.
As a result of violation on November 10, 2015 of Article 21, Paragraph 2 of the Water Pollution Control Act, the Plant was on December 14, 2015 fined NT$10,000 by Environmental Protection Bureau of Kaohsiung City Government. Response measures: Establishment of system for appointment of
| 133 |
officers to ensure that resignation of personnel or changes in employment could be promptly noted.
(7) Kaohsiung K9 Plant
As a result of violation on December 17, 2013 of Articles 13 and 20 of the Employment Management Regulations of Environmental- Protection Dedicated Units or Personnel formulated pursuant to Article 21 of the Water Pollution Control Act, the Plant was on March 25, 2014 fined NT$30,000 by Environmental Protection Bureau of Kaohsiung City Government. Response measures: Coagulation of wastewater failed because of erroneous pipeline layout for production line chemicals. The pipeline layout was upgraded, with raw liquid being separately collection. Operating personnel also underwent training.
The Plant was duly fined NT$12,000 by Environmental Protection Bureau of Kaohsiung City Government on July 30, 2014 for violation of Trash Clearance Act on January 22, 2014. Response measures: (1) Comprehensive planning for waste lubricant (D-1703) temporary storage area. (2) Matters such as triplicate application for clearance, filing of waste production volume, and temporary storage and means of disposal etc. were also implemented.
As a result of violation on August 15, 2014 of Article 18 of the Water Pollution Control Act, the Plant was on November 10, 2014 fined NT$20,000 by Environmental Protection Bureau of Kaohsiung City Government. Response measures: (1) Proposed changes to water-treatment documents, including separation of unused troughs from the treatment process; they were labeled unused at the site. (2) Removal of restricted pipelines or addition of new pipelines in conjunction with removal of production machinery. Changes were also made to water-treatment documents.
(8) Kaohsiung K11 Plant
As a result of violation on February 11, 2014 of Article 7, Paragraph 1 of the Water Pollution Control Act and Article 2 of the Released Water Standard, the Plant was on February 12, 2014 fined NT$140,000 by Environmental Protection Bureau of Kaohsiung City Government. Response measures: 1Addition of real-time monitoring system to enable continuous monitoring of water quality. The system was also linked to set internal control standard within the monitoring system and could promptly trigger alarm. 2In the event of abnormality discharge of abnormal water volume would be cut off. It would also trigger emergency response mechanism (with report to the production unit) which is linked to competent authority. Abnormality emergency processes would also be carried out.
The Plant was duly fined NT$12,000 by Environmental Protection Bureau of Kaohsiung City Government on April 28, 2014 for violation of Trash Clearance Act on January 22, 2014. Response measures: The Plant management was required to list information filed on-line with such information requiring confirmation by environmental safety supervisor and records of such information retained.
As a result of violation of Article 24, Paragraph 2 of the Air Pollution Control Act on June 24, 2014 for its M03 production process (IC production), the Plant was on September 24, 2014 fined NT$100,000 by Environmental Protection Bureau of Kaohsiung City Government. Response measures: (1) Application for
| 134 |
variation (change) to raise the volume of raw materials used. 2Control of draw down of raw materials to ensure that the volume used did not exceed the approved volume.
As a result of violation of Article 8, Paragraph 2 of the Regulations Governing Approval of Registration of Toxic Chemical Substances on December 18, 2015, the Plant was on February 26, 2016 fined NT$60,000 by Environmental Protection Bureau of Kaohsiung City Government. Response measures: Establishment of standard operating procedure for confirmation of basic information. Through controls in the system any changes in basic information would promptly captured and handled.
(9) Kaohsiung K12 Plant
As a result of violation on January 16, 2014 of Articles 4 and 29 of the Regulations Governing Water Pollution Control Measures and Filing of Inspection promulgated pursuant to Article 18 of the Water Pollution Control Act, the Plant was on March 25, 2014 fined NT$20,000 by Environmental Protection Bureau of Kaohsiung City Government. Response measures: 1. K12 Plant (Convex Crystal 2B) had already made fresh application to competent authority for changes to water-treatment measures. 2. It intended to increase the treatment volume from 1,500CMD originally to 4,750CMD.
The Plant was duly fined NT$12,000 by Environmental Protection Bureau of Kaohsiung City Government on July 30, 2014 for violation of Trash Clearance Act on January 22, 2014. Response measures: (1) K12 Plant had approved plan for waste lubricant (D-1703) temporary storage area. (2) Matters such as triplicate application for clearance, filing of waste production volume, and temporary storage and means of disposal etc. were also implemented.
As a result of violation of Article 24, Paragraph 2 of the Air Pollution Control Act on June 24, 2014 for its M01 production process (IC production) , the Plant was on September 24, 2014 fined NT$100,000 by Environmental Protection Bureau of Kaohsiung City Government. Response measures: 1Application for variation (change) to raise the volume of raw materials used. 2Control of draw down of raw materials to ensure that the volume used did not exceed the approved volume.
(10) Kaohsiung K22 Plant
As a result of violation of Article 24, Paragraph 2 of the Air Pollution Control Act on June 28, 2016, the Plant was on July 22, 2016 fined NT$100,000 by Environmental Protection Bureau of Kaohsiung City Government. Response measures: Strengthening of professional staff's concept of operating in accordance with permit.
As a result of violation of Article 5, Paragraph 2 of the Regulations Governing Approval of Registration of Toxic Chemical Substances on July 19, 2016, the Plant was on August 17, 2016 fined NT$60,000 by Environmental Protection Bureau of Kaohsiung City Government. Response measures: Establishment of standard operating procedure for confirmation of basic information. Through controls in the system any changes in basic information would promptly captured and handled.
Chungli Branch Company
The Environmental Protection Bureau of Taoyuan County Government had on January 16, 2014 ordered fine of NT$30,000 for breach on January 15, 2014
| 135 |
of Article 31, Paragraph 1, Sub-paragraph 2 of the Trash Clearance Act. Response measures: (1) Made supplemental filing based on actual circumstances on the site. (2) Set standard system for raw materials.
The Environmental Protection Bureau of Taoyuan County Government had on March 28, 2014 ordered fine of NT$10,000 for breach on March 26, 2014 of Article 18 of Water Pollution Control Act. Response measures: Carried out changes to permit.
The Environmental Protection Bureau of Taoyuan County Government had on January 17, 2014 ordered fine of NT$30,000 for breach on January 15, 2014 of Article 31, Paragraph 1, Sub-paragraph 2 of the Trash Clearance Act. Response measures: (1) Made supplemental filing based on actual circumstances on the site. (2) Set standard system for raw materials.
The Environmental Protection Bureau of Taoyuan County Government had on March 27, 2014 ordered fine of NT$60,000 for breach on March 26, 2014 of Article 36 of the Trash Clearance Act. Response measures: Set comprehensive labels and records in compliance with regulations.
The Environmental Protection Bureau of Taoyuan County Government had on March 28, 2014 ordered fine of NT$10,000 for breach on March 26, 2014 of Article 18 of Water Pollution Control Act. Response measures: Made changes to permit in accordance with law.
The Environmental Protection Bureau of Taoyuan County Government had on January 15, 2014 ordered fine of NT$10,000 for breach on January 15, 2014 of Article 18 of the Water Pollution Control Act. Response measures: Made changes to permit in accordance with law.
The Environmental Protection Bureau of Taoyuan County Government had on January 20, 2014 ordered fine of NT$30,000 for breach on January 16, 2014 of Article 31, Paragraph 1, Sub-paragraph 2 of the Trash Clearance Act. Response measures: (1) Made supplemental filing based on actual circumstances on the site. (2) Set standard system for raw materials.
The Environmental Protection Bureau of Taoyuan County Government had on March 28, 2014 ordered fine of NT$10,000 for breach on March 26, 2014 of Article 18 of Water Pollution Control Act. Response measures: Made changes to permit in accordance with law.
The Environmental Protection Bureau of Taoyuan County Government had on January 21, 2014 ordered fine of NT$30,000 for breach on January 16, 2014 of Article 31, Paragraph 1, Sub-paragraph 2 of the Trash Clearance Act. Response measures: (1) Made supplemental filing based on actual circumstances on the site. (2) Set standard system for raw materials.
The Environmental Protection Bureau of Taoyuan County Government had on March 28, 2014 ordered fine of NT$10,000 for breach on March 26, 2014 of Article 18 of Water Pollution Control Act. Response measures: Made changes to permit in accordance with law.
The Environmental Protection Bureau of Taoyuan County Government had on January 15, 2014 ordered fine of NT$60,000 for breach on January 13, 2014 of Article 18 of Water Pollution Control Act. Response measures: (1) Changed operations in permit. (2) Revamped site road signs.
| 136 |
The Environmental Protection Bureau of Taoyuan County Government had on February 14, 2014 ordered fine of NT$120,000 for breach on February 12, 2014 of Article 31, Paragraph 1, Sub-paragraph 2 of the Trash Clearance Act. Response measures: Made supplemental filing based on actual circumstances on the site.
The Environmental Protection Bureau of Taoyuan County Government had on February 20, 2014 ordered fine of NT$420,000 for breach on February 17, 2014 of Articles 18 and 31, Paragraph 1 of the Water Pollution Control Act. Response measures: (1) Change of permit, (2) strengthened monitoring and system improvement with daily review of changes in water quality and volume.
The Environmental Protection Bureau of Taoyuan County Government had on March 27, 2014 ordered fine of NT$60,000 for breach on March 26, 2014 of Article 36 of the Trash Clearance Act. Response measures: (1) Change of permit, (2) complete signs and records in compliance with regulations.
The Environmental Protection Bureau of Taoyuan County Government had on March 28, 2014 ordered fine of NT$60,000 for breach on March 26, 2014 of Articles 19 the Water Pollution Control Act (with Articles 14 and 18 of the said Act applying mutatis mutandis.) Response measures: 1Change of permit, 2increased rate of inspection.
The Environmental Protection Bureau of Taoyuan County Government had on September 4, 2015 ordered fine of NT$10,000 for breach on September 3, 2015 of Article 3, Paragraph 1, sub-paragraph 1 of the Trash Clearance Act by No. 5 Packaging and Testing Plant. Response measures: (1) Adjustment of water treatment volume. (2) Trash clearance plan changed in accordance with new water treatment volume.
The Environmental Protection Bureau of Taoyuan County Government had on September 4, 2015 ordered fine of NT$10,000 for breach on September 3, 2015 of Article 3, Paragraph 1, sub-paragraph 1 of the Trash Clearance Act by No. 6 Packaging and Testing Plant. Response measures: (1) Adjustment of water treatment volume. (2) Trash clearance plan changed in accordance with new water treatment volume.
The Environmental Protection Bureau of Taoyuan County Government had on November 24, 2015 ordered fine of NT$60,000 for breach on November 23, 2015 of Article 38, Paragraph 1 of the Trash Clearance Act. Response measures: (1) Communicated with customer on local trash clearance method. (2) All defective products that were to be returned to customer were shipped as "defective IC/wafer", with no action to be taken.
The Environmental Protection Bureau of Taoyuan County Government had on March 25, 2016 ordered fine of NT$147,000 for breach of Article 45, Paragraph 2 of the Water Pollution Control Act following an audit on November 17, 2015. Response measures: Strengthened monitoring of water quality, with simultaneous inspection and testing during audit.
Nantou Branch Company
The Environmental Protection Bureau of Nantou County Government had on January 22, 2014 ordered fine of NT$300,000 for breach on January 21, 2014 of Article 31, Paragraph 1, sub-paragraph 2 of the Trash Clearance Act.
| 137 |
Response measures: (1) The wastewater storage permit was submitted for review by the Environmental Protection Bureau on January 7, 2014. On January 28, 2014 the Bureau requested additional documents. These documents were submitted to the Bureau on February 17, 2014. At present the permit documents are under review by the Bureau. (2) Filing of full-time offer was completed on January 31, 2014.
Total losses (including compensation) and penalties incurred by the company and its subsidiaries during the past 2 years until the date of printing of the Prospectus: The total amount penalties incurred in fiscal year 2014 was NT$2.464 million. The total amount of penalties incurred in fiscal year 2015 was NT$297,000. The total amount of penalties incurred in fiscal year 2016 until date of printing of Prospectus is NT$172,000.
5. Existing pollution and improvement/treatment thereof which will have an impact on company's profit, competitive position and capital expenses and major environmental-protection capital expenses during the next 2 years:
Nantou Branch Company Equipment for pollution control used in the 4th and part of the first floor of the building of "USI Incorporated" are all owned by USI; Nantou Branch Company does not have its won pollution control equipment or facilities. Therefore there has been no major maintenance or repair expenses for environmental protection equipment.
The following are the improvement plans and projected major environmentally-related capital expenses for the next 2 years for Kaohsiung Plant and Chungli Branch Company, and description of their impact on the company's profit, competitiveness and capital expenses:
| Item | 2016 | 2017 |
| Proposed improvements: | ||
| (1) Improvement plan | (1) Renewal of ISO14001 environmental management system certification (2) Reduction of greenhouse gas emission in accordance with ISO14064 greenhouse gas management system operation (3) Promotion of eco-design of the company's products (4) Continued implementation of ISO50001 energy management system (5) Continued implementation of product carbon footprint and water footprint audit and verification (6) Continued promotion of the company's sustainable development in conjunction with Taiwan Sustainable Innovation Forum (7) Continued promotion of use of mass rapid transit system to reduce energy consumption and CO2 emission (8) Introduction of energy-saving product and improvement of | (1) Renewal of ISO14001 environmental management system certification (2) Reduction of greenhouse gas emission in accordance with ISO14064 greenhouse gas management system operation (3) Promotion of eco-design of the company's products (4) Continued implementation of ISO50001 energy management system (5) Continued implementation of product carbon footprint and water footprint audit and verification (6) Continued promotion of the company's sustainable development in conjunction with Taiwan Sustainable Innovation Forum (7) Continued promotion of use of mass rapid transit system to reduce energy consumption and CO2 emission (8) Introduction of energy-saving product and improvement of energy-saving projects |
| 138 |
energy-saving projects (9) Clearance and improvement of wastewater control equipment, with strengthened volume and benefit of wastewater recovery (10) Increased reclaimed water plant's recovery rate and recovery (11) Replacement of filter materials in wastewater treatment sand column and active carbon column (12) Construction of high-efficiency pollution control facilities (13) Replacement of filtration materials in dust-collection equipment (14) Replacement of filling materials and reduction of VOC volume for waste gas control equipment (15) Reduction of waste materials and volume and recycling (16) Reduction of weight and volume of sludge and recycling of metallic components (17) Optimization of volume of chemicals used (18) Prevention of odors in peripheral area (19) Emergency response training and rehearsals (20) Strengthened noise prevention and control (21) 2015 Industrial Safety and Environmental Protection Month event (22) Installation of new waste scrubbing column (23) Installation of new dust-collection machine (24) Maintenance of existing advance oxidation furnace (25) Consideration of best viable treatment equipment for air pollution control (26) Maintenance of existing zoelite rotor equipment (27) Installation of new production process wastewater recovery system (28) Maintenance of membrane in griding process wastewater recovery system (29) Recycling of packaging materials (30) Sludge collection system (31) Exhaust collection system (32) Introduction of sludge volume reduction plan | (9) Clearance and improvement of wastewater control equipment, with strengthened volume and benefit of wastewater recovery (10) Increased reclaimed water plant's recovery rate and recovery (11) Replacement of filter materials in wastewater treatment sand column and active carbon column (12) Construction of high-efficiency pollution control facilities (13) Replacement of filtration materials in dust-collection equipment (14) Replacement of filling materials and reduction of VOC volume for waste gas control equipment (15) Reduction of waste materials and volume and recycling (16) Reduction of weight and volume of sludge and recycling of metallic components (17) Optimization of volume of chemicals used (18) Prevention of odors in peripheral area (19) Emergency response training and rehearsals (20) Strengthened noise prevention and control (21) 2016 Industrial Safety and Environmental Protection Month event (22) Installation of new waste scrubbing column (23) Installation of new dust-collection machine (24) Maintenance of existing advance oxidation furnace (25) Consideration of best viable treatment equipment for air pollution control (26) Maintenance of existing zoelite rotor equipment (27) Installation of new production process wastewater recovery system (28) Maintenance of membrane in griding process wastewater recovery system (29) Recycling of packaging materials (30) Sludge collection system (31) Exhaust collection system (32) Introduction of sludge volume reduction plan | |
| (2) Proposed purchase of equipment or | (1) Implementation of improvement proposals by respective departments | (1) Implementation of improvement proposals by respective departments |
| 139 |
| expenses on equipment as part of projected environmental protection-related capital expenses in next 2 years | at their own initiative (2) Installation of new wastewater/waste gas control equipment and improvement of existing ones (3) Low-frequency noise control works (4) Replacement of environmental-protection equipment (5) Landscaping of surrounding environment (6) Implementation of recovery of waste and discarded items and installation of volume-reduction equipment (7) Use of energy-saving lighting and introduction of green energy source (8) Installation of energy management monitoring system (9) Improvement and expansion of reclaimed water recovery system (10) Waste gas column scrubber (11) High-efficiency oxidation equipment (12) Maintenance of existing zoelite rotor equipment (13) Best and most viable air pollution control equipment (14) Dust-collection machine (15) Wastewater recovery, filtration and distillation equipment (16) Sludge drying equipment (17) Purchase of sludge baking equipment | at their own initiative (2) Installation of new wastewater and waste gas control equipment and improvement of existing ones (3) Low-frequency noise control works (4) Replacement of environmental-protection equipment (5) Landscaping of surrounding environment (6) Implementation of recovery of waste and discarded items and installation of volume-reduction equipment (7) Use of energy-saving lighting and introduction of green energy source (8) Installation of energy management monitoring system (9) Improvement and expansion of reclaimed water recovery system (10) Waste gas column scrubber (11) High-efficiency oxidation equipment (12) Maintenance of existing zoelite rotor equipment (13) Best and most viable air pollution control equipment (14) Dust-collection machine (15) Wastewater recovery, filtration and distillation equipment (16) Sludge drying equipment (17) Purchase of sludge baking equipment
|
| Projected Improvements | (1) Reduction of energy consumption and CO2 emission (2) Control of odor at boundaries (3) Extension of equipment lifespan (4) Reduction of wastewater/waste/air pollutant volume and recovery of resources (5) Reduction of noise in surrounding areas (6) Reduction of energy consumption (7) Improvement of level of comfort of work environment (8) Recovery of water resources/reduction of volume of water used (9) Control and monitoring of pollution | (1) Reduction of energy consumption and CO2 emission (2) Control of odor at boundaries (3) Extension of equipment lifespan (4) Reduction of wastewater/waste/air pollutant volume and recovery of resources (5) Reduction of noise in surrounding areas (6) Reduction of energy consumption (7) Improvement of level of comfort of work environment (8) Recovery of water resources/reduction of volume of water used (9) Control and monitoring of pollution |
| Expenses | NT$581,315,000 | NT$1,242,715,000 |
| (3) Impact after Improvement | ||
| Impact on net profit | Increase of about NT$65,335,000 | Increase of about NT$101,855,000 |
| Impact on | Corporate social responsibility (CSR) | Corporate social responsibility (CSR) |
| 140 |
| competitiveness | and sustainable development An environmentally-friendly policy enhanced the company's corporate image, and was in conformity with the investors' objective for sustainable development of the company | and sustainable development An environmentally-friendly policy enhanced the company's corporate image, and was in conformity with the investors' objective for sustainable development of the company |
| Areas in which no response measures were taken | N/A | N/A |
(5) Employees-employer relations
1. List of the company's employee welfare measures, further learning, training, retirement regulations and the status of their implementation, and employer-employee collective agreements, and various measures protecting employee rights
(1) Employee welfare
The company accepts solidarity between shareholders and employees. In the meeting of its Board of Directors held on January 14, 2016 a resolution was passed on amendment (the resolution would be submitted to the company's Shareholders Meeting on June 28, 2016 for approval) which provides for 5.25~8.25% of profits be set aside each year for the following: employee remuneration and comprehensive improvement of employees' cultural and leisure facilities including library, society events, annual tours, cultural and sporting competition etc. The above would give employees an opportunity to achieve balanced lifestyle. Other measures to strengthen employee benefit and employer-employee relationship include:
| l | Free group medical insurance for employees and their family members |
| l | Full improvement of the plants' safety and sanitation in order to maintain a clean and comfortable environment |
| l | Regular or ad hoc employer-employee meetings |
| l | Establishment of plant environmental safety and health committee |
| l | Establishment of welfare committee to handle employee benefits |
| l | Self-service canteen and welfare society |
| l | Marriage gift, bereavement subsidy, hospitalization gift and study bursary |
| l | Comprehensive retirement system |
| l | Employee medical check |
| l | Share and cash bonus |
| l | Disbursement of benefits during major festivals |
| l | Employee tours and diverse items offered for purchase by employees |
| l | Employees on business trips entitled to travel insurance cover of NT$15 million |
| l | Free meals during public holidays |
| l | Establishment of employees' recreation and fitness center |
| l | Establishment of employee health clinic and physical fitness check center |
| l | Employee share-subscription warrants |
(2) Employee learning and implementation
| l | Employees who obtain educational qualification during their self-study could participate in education upgrading examinations. They would also be entitled to substantive salary increase. |
| 141 |
| l | Provision of school cooperative program for employees; undertook "on-the-job" training bureau flagship plan. |
(3) Employee training and implementation
| l | Provided new recruits with orientation guide, professional training and new staff appraisal. |
| l | Designed and implemented supervision management skills training and career development. |
| l | Designed and implemented engineer professional skills training. |
| l | Provided employees with professional skills and second-skill training (OJT). |
| l | Cultivated company's internal speakers and trainers. |
| l | Designed and implemented industrial safety and environment-related training. |
| l | Provided employees opportunity to participate in external training or seminars. |
| l | To more effectively integrate the company's resources, the company had formulated "Rules on External Training and Subsidy for Certificates". The Rules consisted of 2 major sections: External training (department staff sent to outside training) and subsidy for certificates (subsidy for personal advancement through self-study). To encourage employees to carry out self-studying and acquisition of professional skills for personal advancement, the company engaged external training to supplement its internal training. A standardized review and post-training feedback mechanism was established to facilitate the company's external training system. Control by supervision was made easier by electronic external training and attendance systems. |
| l | The company's subsidy for an employee's self-study, depending on the employee's appointment ranking, ranged from NT$20,000 to NT$100,000 over 2 years. Such subsidy would be given out upon approval after the employee had at his cost registered and underwent course. Application would be to the Training Department along with submission of training certificate. |
| l | In 2015 ASE joined the Electronic Industry Citizenship Coalition (EICC). In keeping with EICC Code of Conduct as well as the concept of sustainable operation, while also promoting a sustainable supply chain for ASE and its suppliers, the company had in 2015 begun implemented EICC Code of Conduct in its education and training for employees and suppliers. To-date more than 20,000 persons in ASE's Kaohsiung Plant have undergone EICC training. Refresher training held at least once annually provided the means of disseminating information on latest laws and regulations to employees. |
| l | In 2015 ASE established its first corporate university, combining experts and academics in various fields to provide first-class training for senior managers. The total number of management course was 78 hours and such courses included strategic development, operation management, and team management. Total training was 3,744 man/hours. |
| l | In fiscal year 2015 the company's total training expenses for its employees was NT$17,150,359. |
| l | Certification mandated by competent authority and obtained by the company and employees involved in financial information transparency is as follows: One of the company's internal audit staff obtained the International Internal Auditor certificate from the International Internal Auditor Association. |
| 142 |
| l | In fiscal year 2015 the company conducted more than 1,500 training classes (including on-line courses) involving 120,500 person/session for total training hours of 450,000 hours. |
| l | Type of training courses conducted by the company in fiscal year 2015: |
New recruits: Orientation, foundation training and job guidance.
General training; Training courses on government laws and regulations and company policies etc.
Special skills training: Professional skills training required by the company's respective departments.
(4) Retirement system and implementation
| l | Beginning in November 1986 the company had in place Labor Retirement Rules in compliance with Basic Labor Law. It also established a Labor Pensions Provision Supervisory Committee. Labor pension provisions were deposited on a monthly basis into the Bank of Taiwan for employees' withdrawal upon retirement. |
| l | Beginning in July 2005 the company had complied with the New Labor Pension Rules promulgated pursuant to the Labor Pensions Act, by setting aside on a monthly basis 6% into employees' special pensions account in the Bureau of Labor Insurance. Upon reaching the age of 60 employees can apply to withdraw their pensions from their personal pensions account. |
| l | Retirement conditions: An employee with a work tenure of more than 15 years, and the employee's age combined with his work tenure is 70 or above may apply for retirement. |
(5) Labor agreement
| l | The company has established communication channels (paper and electronic) for employees. The respective plants also regularly held employee forums to facilitate communication with employees. As such the company was not involved in labor disputes. |
(6) Measures upholding employees' rights
| l | The company protects employee's rights in accordance with Basic Labor Law. |
| l | The company provides a work environment with gender equality and that is free of sexual harassment in accordance with the Act of Gender Equality in Employment. |
| l | Measures by the company for raising employee welfare or rights compared with previous year: |
Salary increase in the beginning of 2015.
The monthly operating performance incentive based on the company's operating performance was higher than that in the previous year.
Increase in the coverage of employee group insurance policy and employee health check items.
Increase in the number of societies in which employees could join.
Hosted various activities and competitions such as tree planting, participation in social welfare events, employee day, sporting events and calligraphy etc. to foster care for society and employees' physical and mental health.
| l | Average salary adjustments by the company in fiscal year 2015: The company's policy is to directly or indirectly adjust employees' annual salary on a sustainable and steady basis. |
| 143 |
(7) Measures protecting work environment and employee's personal safety (measures taken by the company to prevent occupational injury)
| l | Continued certification under OHSAS 18001 and TOSHMS. |
| l | Sustained operation of plant safety and health performance review, with annual awards for plants that achieved excellent performance. |
| l | Continued to strengthen the operation of contractor organization meeting, with annual awards for contractors which achieved excellent performance in safety and health. |
| l | Established plant health risk assessment model and implementation of health management system. |
| l | Implemented system for verification of hazards and risk assessment by respective departments and strengthened their safety and health improvement proposals. |
| l | Continued implementation of protection and improvement to machines. |
| l | Introduction of regulations of the National Fire Protection Association (NFPA) for new plants to strengthen their fire safety facilities. |
| l | Counseled main contractors on the establishment of proprietary safety and health management systems. |
| l | Continued implementation of practice to establish own OHSAS 18001 system by contractors and verification mechanism. |
| l | Establishment of team overseeing contractor's safety management. |
| l | Participation in the selection competition for National Labor Safety Awards organized by Council of Labor Affairs, Executive Yuan. |
| l | Participated in selection competition for Outstanding Unit for National Labor Safety & Health Awards organized by Council of Labor Affairs, Executive Yuan. |
| l | Site commander response drills conducted in high-risk areas in plants. |
| l | Continued strengthening of plants' safety protection for their machine and chemical systems. |
| l | Continued implementation of risk assessment and improvements for plants' surrounding areas to strengthen their fire safety. |
| l | Continued implementation of EICC Code of Conduct to regularize management and completed verification of implementation. |
| l | Continued implementation of the plants' safety culture assessment system in order to improve their safety culture. |
| l | Organized monthly health and safety culture events. |
(8) Employee work regulations and code of ethics
| l | Employees who held differing opinions were reminded to communicate with their supervisors in a sincere manner and at appropriate time and place. They were reminded not to express their views in a strong manner in the presence of visitors or others. |
| l | Meetings were required to be held punctually. Individuals who could not attend were required to appoint others to attend on their behalf. They should also inform others about documents to be prepared. The meeting's chairperson had to be informed. |
| l | If meetings with vendors crossed over lunch or dinner hours, employees could order take-away meals for vendors and claim reimbursement. Employees were prohibited from privately entertaining vendors. |
| 144 |
| l | Employees were strictly forbidden from taking the company's products, spare parts or goods out of the processing sections. All goods that leave the plant area must be accompanied by bonded goods release form. Employees who failed to comply with the aforesaid would be dealt with in accordance with laws and regulations. |
| l | Employees were required to respect the company's reputation. They were forbidden from publishing their personal opinion on any matter involving the company without prior approval. |
| l | The company assiduously cultivated a culture of integrity and responsibility. In all operations employees should comply with the highest ethical standards. |
2. Any loss suffered by the company due to labor disputes in the most recent two fiscal years and up to the date of publication of the Prospectus, and disclose an estimate for the amount of losses that have been incurred to date and may be incurred in the future, as well as response measures. If a reasonable estimate cannot be made, explain why not. None
2. Property, plants and equipment and other real estate:
(1) Self-owned assets:
1. Property, plant and equipment if the acquisition cost is 20 percent or more of the paid-in capital or NT$300 million or more:
November 30, 2016 Unit: NT$1,000 %
Immovable Properties, Plant Buildings & Name of Equipment | Unit | Amount | Month and year of acquisition | Original cost | Revaluation gain | Non-depreciated balance | Utilization status | Insurance status | Encumbrances and any other restriction of rights | ||
| Department Using | Rented | Idle | |||||||||
| Plant | No. | 1 | 2004/02 | 636,462 | - | 230,717 | ASE Assembly & Test (Shanghai) | - | - | Insured | None |
| ASE Headquarters and R&D Center | Set | 1 | 2014/05 | 345,625 | - | 324,633 | ASE Assembly & Test (Shanghai) | - | - | Insured | None |
| LAND | EA | 1 | 1997/10 | 496,229 | - | 496,229 | ASE Korea | - | - | - | None |
| KS Plant phase 2 plant building (standard building) | No. | 1 | 2012/12 | 438,180 | - | 390,824 | ASE (Kunshan) | - | - | Insured | None |
| Civil construction of new plant buildings | No. | 1 | 2009/11 | 549,468 | - | 357,424 | ASEN Semiconductors (Suzhou) | - | - | Insured | None |
| LAND | EA | 1 | 1999/07 | 1,429,881 | - | 1,429,881 | Chungli Plant | - | - | - | None |
| 1# civil construction cost | Building | 1 | 2004/03 | 586,067 | - | 281,763 | ASE (Shanghai) | - | - | Insured | None |
| 2# civil construction cost | Building | 1 | 2004/03 | 618,156 | - | 297,105 | ASE (Shanghai) | - | - | Insured | None |
| Plant building for Shanghai No. 2 Plant/one main building consisting of several floors /including M&E, 1 each, CNY84,060,517.4 | No. | 1 | 2006/04 | 389,023 | - | 241,244 | USI (Shanghai) | - | - | Insured | None |
| New plant CNY87169818.09 | No. | 1 | 2004/04 | 367,162 | - | 197,232 | USI (Shanghai) | - | - | Insured | None |
| 145 |
Immovable Properties, Plant Buildings & Name of Equipment | Unit | Amount | Month and year of acquisition | Original cost | Revaluation gain | Non-depreciated balance | Utilization status | Insurance status | Encumbrances and any other restriction of rights | ||
| Department Using | Rented | Idle | |||||||||
| Nangang Plant land and factory buildings | Ping | Land: 5,575.68 Factory: 20,344.49 | 2000/03 | 970,146 | - | 453,165 | Universal Scientific Industrial Co., Ltd. | V | V | Insured | None |
| Warehousing building - K7 No. 109, North Inner Ring Road | SET | 1 | 2001/12 | 998,336 | - | 626,040 | Kaohsiung Plant | - | - | Insured | None |
| K11 - Block B, car park at No. 30 Zhongyang Road (Hong Lai) | SET | 1 | 2005/07 | 351,875 | - | 252,177 | Kaohsiung Plant | - | - | Insured | None |
| K15 Yawei Plant - purchase of plant-structure building | SET | 1 | 2010/09 | 398,144 | - | 336,763 | Kaohsiung Plant | - | - | Insured | None |
| K22 Wastewater and recycled water system construction | SET | 1 | 2016/02 | 308,854 | - | 297,272 | Kaohsiung Plant | - | - | Insured | None |
2. Idle real properties and the real properties which have been held for 5 fiscal years or more for investment purposes:
November 30, 2016 Unit: NT$ 1,000
Real Estate Name | Unit | Area: | Location | Acquisition Date: Year/Month | Acquisition Cost
| Revaluation Increase in Value | Before depreciation and impairment Balance | Current value, appraised value or fair market value published | Future disposal or development plan |
| Nangang Plant land and factory buildings | Ping | Land: 5,575.68 Factory: 20,344.48
| No. 330, Gongye Rd, Nantou City | 2000/03 | 970,146 | - | 3,165 | 1,216,086 | Regular evaluations on whether the book value has fallen, in preparation for disposal, expansion to the electronics assembly plant, or rental to other enterprises in the group, as needed. Currently the fifth floor has been rented to USI. |
(2) Rental properties:
1. Financing lease (of an amount that is 20% of paid-up capital or NT$300 million): None.
2. Operating lease assets the rent amount of which exceeds NT$5 million a year:
November 30, 2016 Unit: USD'000
| Asset Name | Unit | Amount | Lease Period | Rent | Lessor: | Calculation and Payment Method of Rent | Contractual Restrictions | |
| Takahata factory lease | SET | 1 | 2016/6/30~2020/5/31 | JPY | 8,650.81 | Renesas Semiconductor Manufacturing | Agree Rent/Remittance Payment | None |
| L1 factory lease | SET | 1 | 2016/1/1~2016/12/31 | JPY | 5,722.09 | Yamagata Electronic Corporation | Agree Rent/Remittance Payment | None |
| L2 factory lease | SET | 1 | 2016/1/1~2016/12/31 | JPY | 2,803.05 | Yamagata Electronic Corporation | Agree Rent/Remittance Payment | None |
| Plant | Square meters | 7,910.74 | 2014/7/16~2018/7/15 | NTD | 618.43 | Orient Semiconductor Electronics Ltd. | Agree Rent/Remittance Payment | None |
| Plant | Square meters | 4,355.8 | 2015/9/1~2018/8/31 | NTD | 523.00 | ASE Inc. | Agree Rent/Remittance Payment | None |
| 146 |
| Plant | Square meters | 4,509.66 | 2015/9/1~2018/8/31 | NTD | 541.00 | ASE Inc. | Agree Rent/Remittance Payment | None |
| Plant | Square meters | 4,558.5 | 2015/12/1~2018/11/30 | NTD | 546.00 | ASE Inc. | Agree Rent/Remittance Payment | None |
| Plant | Square meters | 6,900 | 2015/3/20~2018/12/31 | CNY | 394.29 | ASE Assembly & Test (Shanghai) Limited | Agree Rent/Remittance Payment | None |
| Plant | Square meters | 11,000 | 2014/11/24~2017/11/30 | CNY | 942.86 | ASE Assembly & Test (Shanghai) Limited | Agree Rent/Remittance Payment | None |
| Plant | Square meters | 2,420 | 2015/4/25~2018/4/30 | CNY | 209.50 | ASE Assembly & Test (Shanghai) Limited | Agree Rent/Remittance Payment | None |
| Office | Square meters | 2,300 | 2015/10/1~2018/9/30 | CNY | 138.00 | ASE Assembly & Test (Shanghai) Limited | Agree Rent/Remittance Payment | None |
| Plant | Square meters | 4,080 | 2016/5/1~2018/3/31 | CNY | 198.72 | ASE (Kunshan) | Agree Rent/Remittance Payment | None |
| Plant | Square meters | 41,827.93 | 2016/5/1~2018/3/31 | CNY | 597.61 | ASE (Kunshan) | Agree Rent/Remittance Payment | None |
| Employee dormitory | Rooms | Calculated based on actual use | 2015/12/1~2016/11/30 | CNY | Calculated based on actual use | ASE (Kunshan) | Agree Rent/Remittance Payment | None |
| Employee dormitory | Rooms | Calculated based on actual use | 2015/04/01~2017/04/30 | CNY | Calculated based on actual use | ASE (Shanghai) | Agree Rent/Remittance Payment | None |
| Employee dormitory | Rooms | Calculated based on actual use | 2015/5/1~2017/4/30 | CNY | Calculated based on actual use | ASE (Shanghai) | Agree Rent/Remittance Payment | None |
| Employee dormitory | Rooms | Calculated based on actual use | 2016/4/1~2016/3/31 | CNY | Calculated based on actual use | ASE (Shanghai) | Agree Rent/Remittance Payment | None |
| Plant | Square meters | 33,804 | 2013/12/01~2016/11/30 | CNY | 720.03 | ASE Integrated Circuits (China) | Agree Rent/Remittance Payment | None |
| Office | Level | 1 | 2013/11/1~2018/10/31 | NTD | 718.77 | Century Development Corporation | Agree Rent/Remittance Payment | None |
| Office | Level | 1 | 2013/11/1~2018/10/31 | NTD | 1,032.77 | Century Development Corporation | Agree Rent/Remittance Payment | None |
| Office | Square meters | 734.62 | 2014/3/1~2019/2/28 | CNY | 212.27 | Shanghai Ting Gu Real Estate Company | Agree Rent/Remittance Payment | None |
| Employee dormitory | Buildings | 1 | 2015/6/1~2017/5/31 | NTD | 450.00 | Hong Yu Limited | Agree Rent/Remittance Payment | None |
| Employee dormitory | Rooms | Calculated based on actual use | 2016/5/1~2017/4/30 | CNY | Calculated based on actual use | Shenzhen Tianxiang Labor Paiqian Service Limited Company | Agree Rent/Remittance Payment | None |
| Handler | SET | 1 | 2016/09/16~2017/03/15 | NTD | 1,400.00 | Hon Technologies | Agree Rent/Remittance Payment | None |
| Tester | SET | 1 | 2015/07/01~2018/06/30 | USD | 48.00 | Gat Asset Taiwan Limited | Agree Rent/Remittance Payment | None |
| Tester | SET | 1 | 2015/09/01~2018/08/31 | USD | 42.00 | Gat Asset Taiwan Limited | Agree Rent/Remittance Payment | None |
| Tester | SET | 1 | 2015/09/01~2018/08/31 | USD | 42.00 | Gat Asset Taiwan Limited | Agree Rent/Remittance Payment | None |
| Tester | SET | 1 | 2015/09/01~2018/08/31 | USD | 42.00 | Gat Asset Taiwan Limited | Agree Rent/Remittance Payment | None |
| Tester | SET | 1 | 2016/04/02~2019/04/01 | USD | 15.00 | Fan Tai Technology Company | Agree Rent/Remittance Payment | None |
| Tester | SET | 1 | 2016/04/02~2019/04/01 | USD | 15.00 | Fan Tai Technology Company | Agree Rent/Remittance Payment | None |
| Tester | SET | 1 | 2016/04/02~2019/04/01 | USD | 15.00 | Fan Tai Technology Company | Agree Rent/Remittance Payment | None |
| 147 |
| Tester | SET | 1 | 2016/06/01~2019/05/31 | USD | 15.00 | Fan Tai Technology Company | Agree Rent/Remittance Payment | None |
| Tester | SET | 1 | 2016/03/01~2017/07/31 | USD | 22.05 | ASE Inc. | Agree Rent/Remittance Payment | None |
| Tester | SET | 1 | 2016/03/01~2017/07/31 | USD | 22.05 | ASE Inc. | Agree Rent/Remittance Payment | None |
| Tester | SET | 1 | 2016/03/01~2017/07/31 | USD | 21.85 | ASE Inc. | Agree Rent/Remittance Payment | None |
| Tester | SET | 1 | 2016/03/01~2017/07/31 | USD | 21.85 | ASE Inc. | Agree Rent/Remittance Payment | None |
| Tester | SET | 1 | 2016/03/01~2017/07/31 | USD | 21.85 | ASE Inc. | Agree Rent/Remittance Payment | None |
| Tester | SET | 1 | 2016/07/01~2017/09/30 | USD | 20.98 | Fan Tai Technology Company | Agree Rent/Remittance Payment | None |
| Tester | SET | 1 | 2016/07/01~2017/09/30 | USD | 20.98 | Fan Tai Technology Company | Agree Rent/Remittance Payment | None |
| Tester | SET | 1 | 2016/07/01~2017/09/30 | USD | 20.98 | Fan Tai Technology Company | Agree Rent/Remittance Payment | None |
| Tester | SET | 1 | 2016/07/01~2017/09/30 | USD | 20.98 | Fan Tai Technology Company | Agree Rent/Remittance Payment | None |
| Tester | SET | 1 | 2016/07/01~2017/09/30 | USD | 20.98 | Fan Tai Technology Company | Agree Rent/Remittance Payment | None |
| option | SET | 1 | 2016/05/16~2017/05/15 | USD | 24.00 | Test Advantage Capital Pte. Ltd. | Agree Rent/Remittance Payment | None |
| Tester | SET | 1 | 2016/03/01~2017/04/30 | USD | 19.22 | ASE Inc. | Agree Rent/Remittance Payment | None |
| Tester | SET | 1 | 2016/03/01~2017/04/30 | USD | 19.22 | ASE Inc. | Agree Rent/Remittance Payment | None |
| Tester | SET | 1 | 2016/03/01~2017/04/30 | USD | 19.22 | ASE Inc. | Agree Rent/Remittance Payment | None |
| Tester | SET | 1 | 2016/03/01~2017/04/30 | USD | 19.22 | ASE Inc. | Agree Rent/Remittance Payment | None |
| Tester | SET | 1 | 2016/03/01~2017/04/30 | USD | 19.22 | ASE Inc. | Agree Rent/Remittance Payment | None |
| Tester | SET | 1 | 2016/03/01~2017/03/31 | USD | 18.59 | ASE Inc. | Agree Rent/Remittance Payment | None |
| Tester | SET | 1 | 2016/03/01~2017/03/31 | USD | 18.59 | ASE Inc. | Agree Rent/Remittance Payment | None |
| Tester | SET | 1 | 2016/03/01~2017/03/31 | USD | 18.59 | ASE Inc. | Agree Rent/Remittance Payment | None |
| Tester | SET | 1 | 2016/03/01~2017/03/31 | USD | 18.59 | ASE Inc. | Agree Rent/Remittance Payment | None |
| Tester | SET | 1 | 2016/03/01~2017/03/31 | USD | 18.59 | ASE Inc. | Agree Rent/Remittance Payment | None |
| UFLEX(SC3) | SET | 1 | 2014/08/01~2017/07/31 | USD | 22.05 | Teradyne (Asia) Pte Ltd | Agree Rent/Remittance Payment | None |
| UFLEX(SC3) | SET | 1 | 2014/08/01~2017/07/31 | USD | 22.05 | Teradyne (Asia) Pte Ltd | Agree Rent/Remittance Payment | None |
| UFLEX(SC3) | SET | 1 | 2014/08/01~2017/07/31 | USD | 21.85 | Teradyne (Asia) Pte Ltd | Agree Rent/Remittance Payment | None |
| 148 |
| UFLEX(SC3) | SET | 1 | 2014/08/01~2017/07/31 | USD | 21.85 | Teradyne (Asia) Pte Ltd | Agree Rent/Remittance Payment | None |
| UFLEX(SC3) | SET | 1 | 2014/08/01~2017/07/31 | USD | 21.85 | Teradyne (Asia) Pte Ltd | Agree Rent/Remittance Payment | None |
| Uflex Tester | SET | 1 | 2014/07/01~2017/04/30 | USD | 19.22 | Teradyne (Asia) Pte Ltd | Agree Rent/Remittance Payment | None |
| Uflex Tester | SET | 1 | 2014/07/01~2017/04/30 | USD | 19.22 | Teradyne (Asia) Pte Ltd | Agree Rent/Remittance Payment | None |
| Uflex Tester | SET | 1 | 2014/07/01~2017/04/30 | USD | 19.22 | Teradyne (Asia) Pte Ltd | Agree Rent/Remittance Payment | None |
| Uflex Tester | SET | 1 | 2014/07/01~2017/04/30 | USD | 19.22 | Teradyne (Asia) Pte Ltd | Agree Rent/Remittance Payment | None |
| Uflex Tester | SET | 1 | 2014/07/01~2017/04/30 | USD | 19.22 | Teradyne (Asia) Pte Ltd | Agree Rent/Remittance Payment | None |
| Uflex Tester | SET | 1 | 2014/07/01~2017/04/30 | USD | 19.22 | Teradyne (Asia) Pte Ltd | Agree Rent/Remittance Payment | None |
| Uflex Tester | SET | 1 | 2014/07/01~2017/04/30 | USD | 19.22 | Teradyne (Asia) Pte Ltd | Agree Rent/Remittance Payment | None |
| Uflex Tester | SET | 1 | 2014/07/01~2017/04/30 | USD | 19.22 | Teradyne (Asia) Pte Ltd | Agree Rent/Remittance Payment | None |
| Uflex Tester | SET | 1 | 2014/07/01~2017/04/30 | USD | 19.22 | Teradyne (Asia) Pte Ltd | Agree Rent/Remittance Payment | None |
| Uflex Tester | SET | 1 | 2014/07/01~2017/04/30 | USD | 19.22 | Teradyne (Asia) Pte Ltd | Agree Rent/Remittance Payment | None |
| Uflex Tester | SET | 1 | 2014/07/01~2017/03/31 | USD | 18.59 | Teradyne (Asia) Pte Ltd | Agree Rent/Remittance Payment | None |
| Uflex Tester | SET | 1 | 2014/07/01~2017/03/31 | USD | 18.59 | Teradyne (Asia) Pte Ltd | Agree Rent/Remittance Payment | None |
| Uflex Tester | SET | 1 | 2014/07/01~2017/03/31 | USD | 18.59 | Teradyne (Asia) Pte Ltd | Agree Rent/Remittance Payment | None |
| Uflex Tester | SET | 1 | 2014/07/01~2017/03/31 | USD | 18.59 | Teradyne (Asia) Pte Ltd | Agree Rent/Remittance Payment | None |
| Uflex Tester | SET | 1 | 2014/07/01~2017/03/31 | USD | 18.59 | Teradyne (Asia) Pte Ltd | Agree Rent/Remittance Payment | None |
| Sigma FXP | SET | 1 | 2016/02/01~2019/01/31 | USD | 19.43 | SPTS Technologies Ltd | Agree Rent/Remittance Payment | None |
| FT_Tester_iFlex RF | Sets | 1 | 2016/07~2016/12 | USD | 19.00 | Test Advantage Capital PTE,Ltd | Agree Rent/Remittance Payment | None |
| FT_Tester_iFlex RF | Sets | 1 | 2016/08~2017/01 | USD | 19.00 | Test Advantage Capital PTE,Ltd | Agree Rent/Remittance Payment | None |
| FT_Tester_iFlex RF | Sets | 1 | 2016/08~2017/01 | USD | 19.00 | Test Advantage Capital PTE,Ltd | Agree Rent/Remittance Payment | None |
| FT_Tester_iFlex BB | Sets | 1 | 2016/08~2017/01 | USD | 17.00 | KeenHammer Tech Co., Ltd | Agree Rent/Remittance Payment | None |
| FT_Tester_iFlex RF | Sets | 1 | 2016/07~2016/12 | USD | 19.00 | Test Advantage Capital PTE,Ltd | Agree Rent/Remittance Payment | None |
| FT_Tester_iFlex RF | Sets | 1 | 2016/08~2017/01 | USD | 19.00 | Test Advantage Capital PTE,Ltd | Agree Rent/Remittance Payment | None |
| FT_Tester_iFlex RF | Sets | 1 | 2016/08~2017/01 | USD | 19.00 | Test Advantage Capital PTE,Ltd | Agree Rent/Remittance Payment | None |
| 149 |
| Plant | Square meters | 7,290.18 | 2016/7/8~2017/7/7 | CNY | 149.45 | Wuxi City New Distric Economy Development Group | Agree Rent/Remittance Payment | None |
| option | SET | 1 | 2016/11/01~2017/04/30 | USD | 29 | Hon Technologies | Agree Rent/Remittance Payment | None |
| Plant | Ping | 8,446.07 | 2016/08/01~2019/07/31 | NTD | 1,047 | ASE Inc. | Agree Rent/Remittance Payment | None |
| Plant | Ping | 4,558.5 | 2016/05/01~2017/04/30 | NTD | 565 | ASE Inc. | Agree Rent/Remittance Payment | None |
| Plant | Ping | 4,558.5 | 2016/05/01~2017/04/30 | NTD | 547 | ASE Inc. | Agree Rent/Remittance Payment | None |
| Plant | Ping | 5,631.59 | 2016/11/01~2018/10/31 | NTD | 545 | ASE Inc. | Agree Rent/Remittance Payment | None |
| Plant | Ping | 5,631.59 | 2015/05/01~2017/04/30 | NTD | 545 | ASE Inc. | Agree Rent/Remittance Payment | None |
| Company car rental | Sets | Calculated based on actual use | 2016/6/1~2018/5/30 | CNY | Calculated based on actual use | Shanghai Jin Xiang Auto Rental Service Company | Agree Rent/Remittance Payment | None |
| Plant | Square meters | 7,594.01 | 2016/01/01~2018/12/31 | NTD | 911 | ISE Labs, Inc. | Agree Rent/Remittance Payment | None |
| Plant | Square meters | 5,240.68 | 2014/09/16~2017/08/31 | NTD | 628 | ISE Labs, Inc. | Agree Rent/Remittance Payment | None |
| Plant | Square meters | 5,241.99 | 2015/05/01~2017/04/30 | NTD | 629 | ISE Labs, Inc. | Agree Rent/Remittance Payment | None |
| Plant | Square meters | 5,208.68 | 2015/05/01~2017/04/30 | NTD | 625 | ISE Labs, Inc. | Agree Rent/Remittance Payment | None |
| Plant | Square meters | 8,991.06 | 2007/07/15~2017/07/14 | NTD | 820 | Export Processing Zone Administration | Agree Rent/Remittance Payment | None |
| Plant | Square meters | 1,3980.1 | 2014/10/16~2018/07/15 | NTD | 816 | Orient Semiconductor Electronics Ltd. | Agree Rent/Remittance Payment | None |
| Plant | Square meters | 5,943.64 | 2016/06/16~2018/06/15 | NTD | 1,228 | LCY Chemical Corp. | Agree Rent/Remittance Payment | None |
| Land | Square meters | 12,563.4 | 2015/07/01~2035/06/30 | NTD | 462 | Export Processing Zone Administration | Agree Rent/Remittance Payment | None |
| Office | Square feet | 40,200 | 10/1/10~09/30/20 | USD | 70 | ISE Labs, Inc. | Agree Rent/Remittance Payment | None |
| Office | Square feet | 4,070 | 01/01/14~12/31/16 | USD | 18 | HTSG | Agree Rent/Remittance Payment | None |
(3) Each plant's current condition and facility productivity ratio in the most recent 2 fiscal years:
1. Each plant's current condition:
November 30, 2016 Unit: ‘000 sq.ft./person
Item Plant | Building area | Number of employees | Types of production goods | Current use condition |
| Kaohsiung Plant | 7,484 | 24,393 | Packaging and testing products and BGA materials | Good |
| Chungli Plant | 4,107 | 9,477 | Packaging and testing products | Good |
| Nantou Plant | 400 | 1,816 | Packaging and electronic assembly products | Good |
| Shanghai Plant | 5,900 | 11,448 | Packaging/testing and electronic assembly products | Good |
| 150 |
Item Plant | Building area | Number of employees | Types of production goods | Current use condition |
| Kaohsiung Plant | 7,484 | 24,393 | Packaging and testing products and BGA materials | Good |
| Chungli Plant | 4,107 | 9,477 | Packaging and testing products | Good |
| Nantou Plant | 400 | 1,816 | Packaging and electronic assembly products | Good |
| Shanghai Plant | 5,900 | 11,448 | Packaging/testing and electronic assembly products | Good |
| Suzhou Plant | 433 | 1,648 | Packaging and testing products | Good |
| Kunshan Plant | 3,194 | 3,647 | Packaging/testing and electronic assembly products | Good |
| Weihai Plant | 759 | 1,589 | Packaging and testing products | Good |
| Shenzhen Plant | 683 | 3,860 | Electronic assembly products | Good |
| Malaysia Plant | 873 | 3,174 | Packaging and testing products | Good |
| Singapore Plant | 282 | 870 | Packaging and testing products | Good |
| Korea Plant | 1,079 | 2,909 | Packaging and testing products | Good |
| Japan Plant | 298 | 475 | Packaging and testing products | Good |
| Mexico Plant | 362 | 936 | Electronic assembly products | Good |
2. Facility productivity ratio in the most recent 2 fiscal years:
Unit: ‘000 pieces NT$1,000
Year Production Value | 2014 | 2015 | ||||||
| Production Capacity | Production Volume | Production Capacity Utilization Rate | Production Value | Production Capacity | Production volume | Production Capacity Utilization Rate | Production Value |
| Packaging Products | 32,937,997 | 28,656,057 | 87.00% | 88,296,216 | 36,603,997 | 27,604,076 | 75.41% | 86,258,770 |
| Testing products (Note 1) | - | - | - | 16,242,669 | - | - | - | 16,166,199 |
| Electronic assembly products | 500,805 | 465,749 | 93.00% | 96,665,532 | 708,773 | 595,142 | 83.97% | 128,808,721 |
| Others (Note 2) | - | - | - | 1,798,501 | - | - | - | 1,933,618 |
| Total | 33,438,802 | 29,121,806 | - | 203,002,918 | 37,312,730 | 28,199,218 | - | 233,167,308 |
Note 1: Pricing was based on testing hours, thus not able to disclose volume.
Note 2: Different unit of measurement, thus not able to disclose volume.
| 151 |
III. Reinvestment business
(1) Overview of reinvestment business:
September 30, 2016 Unit: NT$'000/Other currencies ('000), shares, %
| Name of investment company: | Reinvestment business | Main business | Investment cost | Book value | Investment shares | Net equity | Market price | Accounting methods: | Return on investment in most recent year | The amount of company shares | ||
| Number of shares | Equity ratio (%) | Investment gains and losses | Dividends | |||||||||
| Advanced Semiconductor Engineering Inc. | A.S.E. Holding Limited | Professional investment activities | USD283,966 | 14,699,286 | 243,966 | 100% | 14,963,730 | - | Equity method | 480,474 | - | - |
| J & R Holding Limited | Professional investment activities | USD479,693 | 48,364,435 | 435,128 | 100% | 50,716,458 | - | Equity method | 2,049,623 | - | 46,703,763 | |
| ASE Marketing & Service Japan Co., Ltd. | Marketing, sales and customer services in semiconductor assembly and testing industry | JPY60,000 | 34,002 | 1,200 | 100% | 34,002 | - | Equity method | 2,082 | - | - | |
| Omniquest Industrial Limited | Professional investment activities | USD250,504 | 11,106,064 | 250,504,067 | 71% | 11,404,656 | - | Equity method | 198,948 | - | - | |
| Innosource Limited | Professional investment activities | USD86,000 | 3,945,550 | 86,000,000 | 100% | 3,941,738 | - | Equity method | 77,641 | - | - | |
| Hung Ching Guang Company | Rental of remaining proprietary stalls and office building | 390,470 | 324,959 | 35,497,273 | 27% | 324,959 | - | Equity method | (9,694) | - | - | |
| Hung Ching Development & Construction Co., Ltd. | Engagement of contractors to build residential and commercial properties for rental; sale and purchase of all types of building materials and import and export trade thereof; property lease introduction; interior design and renovation works | 2,845,913 | 1,269,613 | 68,629,782 | 26% | 1,937,156 | 1,170,138 | Equity method | 64,151 | 75,493 | - | |
| ASE Test Inc. | Semiconductor testing services | 20,698,867 | 28,539,072 | 1,131,452,502 | 100% | 28,856,075 | - | Equity method | 2,883,511 | 2,624,970 | 10,978,776 | |
| Universal Scientific Industrial Inc. | Professional investment activities | 20,836,477 | 42,418,825 | 1,112,236,706 | 99% | 40,924,589 | - | Equity method | 1,239,134 | - | - | |
| LuZhu Development Inc. | Land and building development | 1,366,238 | 1,334,886 | 131,961,457 | 67% | 1,334,886 | - | Equity method | (1,527) | - | - | |
| ASE Embedded Electronics Incorporated | Production and sale of embedded substrate for ICB | 765,000 | 703,684 | 76,500,000 | 51% | 376,736 | - | Equity method | (4,274) | - | - | |
| 152 |
| Advanced Semiconductor Engineering Inc. | Siliconware Precision Industries Co., Ltd. | Manufacture, processing, sale & purchase and testing services for various ICB packages | 48,790,498 | 45,613,346 | 1,037,300,000 | 33% | 21,400,373 | 48,753,100 | Equity method | 410,937 | 3,941,740 | - |
| Deca Technologies Inc. | Holding company, with Group carrying our manufacture, assembly, processing, testing and sale of semiconductors | USD59,882 | 1,892,542 | 98,489,803 | 22% | 917,010 | - | Equity method | Note 3 | - | - | |
| Advanced Microelectronic Products, Inc. | OEM for wafer and ICB | 178,861 | 11,453 | 33,308,452 | 17% | 11,453 | 83,271 | Equity method | (58,390) | - | - | |
| ASE Test Inc. | Alto Enterprises Limited | Professional investment activities | USD188,000 | 4,240,162 | 188,000,000 | 100% | 4,240,162 | - | Equity method | Note 2 | - | - |
| Super Zone Holdings Limited | Professional investment activities | USD100,000 | 3,129,882 | 100,000,000 | 100% | 3,129,882 | - | Equity method | Note 2 | - | - | |
| LuZhu Development Inc. | Land and building development | 372,504 | 376,736 | 37,250,448 | 19% | 376,836 | - | Equity method | Note 2 | - | - | |
| TLJ Intertech Inc. | Information Software Services. | 89,998 | 89,624 | 2,119,080 | 60% | 10,158 | - | Equity method | Note 2 | - | - | |
| A.S.E. Holding Limited | ASE Test Limited | Professional investment activities | USD84,889 | USD107,774 | 11,148,000 | 10% | USD99,208 | - | Equity method | Note 2 | - | 88,200,472 |
| ASE Investment (Labuan) Inc. | Professional investment activities | USD168,643 | USD343,234 | 168,642,842 | 70% | USD343,234 | - | Equity method | Note 2 | - | - | |
| J & R Holding Limited | ASE Test Limited | Professional investment activities | USD964,524 | USD1,072,382 | 98,276,087 | 90% | USD874,378 | - | Equity method | Note 2 | - | 88,200,472 |
| Omniquest Industrial Limited | Professional investment activities | USD30,200 | USD43,817 | 30,200,000 | 8% | USD43,817 | - | Equity method | Note 2 | - | - | |
| ASE (Nanzih) Inc. | Lease of all types of ICB packaging and testing equipment and lead frame equipment | USD51,344 | USD31,885 | 170,000,006 | 100% | USD31,885 | - | Equity method | Note 2 | - | - | |
| ASE Japan Co., Ltd. | Packaging and manufacturing of ICB | USD25,606 | USD86,492 | 7,200 | 100% | USD85,771 | - | Equity method | Note 2 | - | - |
| 153 |
| J & R Holding Limited | ASE (U.S.) Inc. | Marketing support and customer service etc. | USD4,600 | USD12,693 | 1,000 | 100% | USD12,209 | - | Equity method | Note 2 | - | - |
| Global Advanced Packaging Technology Limited, Cayman Islands | Professional investment activities | USD190,000 | USD353,014 | 190,000,000 | 100% | USD340,338 | - | Equity method | Note 2 | - | - | |
| Anstock Limited | Professional investment activities | USD10 | USD345 | 10,000 | 100% | USD345 | - | Equity method | Note 2 | - | - | |
| Anstock II Limited | Professional investment activities | USD10 | USD189 | 10,000 | 100% | USD189 | - | Equity method | Note 2 | - | - | |
| Suzhou ASEN Semiconductor Co.,Ltd. | Assembly and testing of semiconductors and technical advisory services | USD21,600 | USD78,302 | -(Note 1) | 60% | USD78,302 | - | Equity method | Note 2 | - | - | |
| ASE Investment (Labuan) Inc. | ASE (Korea) Inc. | Manufacturing of electronic components and communication machinery | USD160,000 | USD490,377 | 20,741,363 | 100% | USD484,981 | - | Equity method | Note 2 | - | - |
| ASE Test Limited | ASE Holdings (Singapore) Pte Ltd | Professional investment activities | USD65,520 | USD146,168 | 71,428,902 | 100% | USD146,168 | - | Equity method | Note 2 | - | - |
| ASE Test Holdings, Ltd. | Professional investment activities | USD222,399 | USD100,347 | 5 | 100% | USD100,347 | - | Equity method | Note 2 | - | - | |
| ASE Investment (Labuan) Inc. | Professional investment activities | USD72,304 | USD147,100 | 72,304,040 | 30% | USD147,100 | - | Equity method | Note 2 | - | - | |
| ASE Singapore Pte. Ltd. | Semiconductor testing services | USD55,815 | USD157,950 | 30,100,000 | 100% | USD157,950 | - | Equity method | Note 2 | - | - | |
| ASE Test Holdings, Ltd. | ISE Labs, Inc. | Semiconductor testing services | USD221,145 | USD100,346 | 26,250,000 | 100% | USD100,346 | - | Equity method | Note 2 | - | - |
| ASE Holdings (Singapore) Pte Ltd | ASE Electronics (M) Sdn. Bhd. | Manufacture, assembly, reprocessing, testing and export of integrated circuits of various types. | USD60,000 | USD146,168 | 159,715,000 | 100% | USD146,168 | - | Equity method | Note 2 | - | - |
| Omniquest Industrial Limited | ASE Corporation | Professional investment activities | USD352,784 | USD515,094 | 352,784,067 | 100% | USD515,094 | - | Equity method | Note 2 | - | - |
| ASE Corporation | ASE Mauritius Inc. | Professional investment activities | USD217,800 | USD385,060 | 217,800,000 | 100% | USD385,060 | - | Equity method | Note 2 | - | - |
| ASE Labuan Inc. | Professional investment activities | USD126,184 | USD129,983 | 126,184,067 | 100% | USD129,983 | - | Equity method | Note 2 | - | - |
| 154 |
| ASE Labuan Inc. | ASE Electronics Inc. | Wholesale and retail of electronic materials and international trade | USD125,813 | USD129,416 | 398,981,900 | 100% | USD129,416 | - | Equity method | Note 2 | - | - |
| Innosource Limited | Omniquest Industrial Limited | Professional investment activities | USD74,000 | USD107,407 | 74,000,000 | 21% | USD107,407 | - | Equity method | Note 2 | - | - |
| ASE Electronic Components (Shanghai) Ltd. | Production and sale of new electronic components and provision of technical advisory services | USD12,000 | USD18,298 | -(Note 1) | 100% | USD18,298 | - | Equity method | Note 2 | - | - | |
| ASE (Shanghai) | ASE (Hong Kong) | Trade and related activities | USD1,000 | USD8,810 | -(Note 1) | 100% | USD9,761 | - | Equity method | Note 2 | - | - |
| USI Electronics Inc. | Design and manufacture of electronic products, manufacture and processing of new electronic components, high-performance motherboards for computers and wireless network communication components etc. | RMB12,900 | RMB60,187 | 18,098,476 | 1% | RMB60,187 | - | Equity method | Note 2 | - | - | |
| Shanghai Ding Hui Real Estate Development Ltd. | Real estate project development, construction and commercial property sale and property management | RMB1,441,000 | RMB1,619,453 | -(Note 1) | 40% | RMB1,619,453 | - | Equity method | Note 2 | - | - | |
| Universal Scientific Industrial Inc. | Huntington Holdings International Co., Ltd. | Holding company | 8,370,606 | 43,453,577 | 255,856,840 | 100% | 43,453,577 | - | Equity method | Note 2 | - | - |
| 155 |
| Huntington Holdings International Co., Ltd. | Unitech Holdings International Co., Ltd. | Holding company | USD3,000 | USD7,926 | 3,000,000 | 100% | USD7,926 | - | Equity method | Note 2 | - | - |
| Real Tech Holdings Limited | Holding company | USD149,151 | USD1,319,977 | 149,151,000 | 100% | USD1,319,977 | - | Equity method | Note 2 | - | - | |
| Universal ABIT Holding Co., Ltd. | Holding company | USD28,125 | USD13 | 90,000,000 | 100% | USD13 | - | Equity method | Note 2 | - | - | |
| Rising Capital Investment Limited | Holding company | USD6,000 | USD1,140 | 6,000,000 | 100% | USD1,140 | - | Equity method | Note 2 | - | - | |
| Rise Accord Limited | Holding company | USD2,000 | USD150 | 20,000 | 100% | USD150 | - | Equity method | Note 2 | - | - |
| Real Tech Holdings Limited | USI Enterprise Limited | Investment consulting services and warehousing management | USD210,900 | USD1,247,995 | 210,900,000 | 99.59% | USD1,247,995 | - | Equity method | Note 2 | - | - |
| Huan Quan Electronics (Kunshan) Ltd. | Manufacture of computer auxiliary system and high-performance motherboards, wireless network communication card etc. | USD12,000 | USD10,518 | -(Note 1) | 100% | USD10,518 | - | Equity method | Note 2 | - | - | |
| USI Enterprise Limited | USI Electronics Inc. | Design and manufacture of electronic products, manufacture and processing of new electronic components, high-performance motherboards for computers and wireless network communication components etc. | USD251,163 | USD840,269 | 1,683,749,126 | 77% | USD840,269 | - | Equity method | Note 2 | - | - |
| 156 |
| USI Electronics Inc. | Universal Global Technology Co., Limited | Holding company | CNY324,185 | CNY1,736,583 | 390,000,000 | 100% | CNY1,736,583 | - | Equity method | Note 2 | - | - |
| Huan Hong Electronics (Kunshan) Ltd. | Design and manufacturing services for electronic products | CNY250,000 | RMB562,692 | -(Note 1) | 100% | RMB562,692 | - | Equity method | Note 2 | - | - | |
| Universal Global Electronics (Shanghai) Co., Ltd. | Research, development and manufacture of electronic components, new electronic components, high-performance computer motherboards, wireless network communication components, mobile communication products and modules, processing and maintenance of spare parts, sale of electronic products, communication products and spare parts, third-party logistics services, and import and export of goods and technology | CNY1,330,000 | RMB628,297 | -(Note 1) | 100% | RMB628,297 | - | Equity method | Note 2 | - | - | |
| Universal Global Technology (Shanghai) Co., Ltd. | Sale of electronic components, computer hardware and software, communication equipment and accessories, third-party logistics services, goods and technology import and export, transshipment trade, inter-company trade in zone and trading agency | CNY50,000 | RMB53,598 | -(Note 1) | 100% | RMB53,598 | - | Equity method | Note 2 | - | - | |
| USI Electronics (Shenzhen) Co., Ltd. | Design, manufacture and sale of computer motherboards and related peripherals and communication industry control products. | RMB292,812 | RMB999,277 | -(Note 1) | 50% | RMB999,277 | - | Equity method | Note 2 | - | - |
| 157 |
| Universal Global Technology Co., Limited | USI Technology Ltd. | Trading and investment holding company | USD11,000 | USD19,916 | 85,800,000 | 100% | USD19,916 | - | Equity method | Note 2 | - | - |
| Universal Global Scientific Industrial Co., Ltd. | Manufacture, product design and research & development for cable communication equipment, wireless communication equipment, electronic components, computer and peripherals, automotive and spare parts | USD62,235 | USD130,444 | 198,000,000 | 100% | USD130,444 | - | Equity method | Note 2 | - | - | |
| USI Japan Co., Ltd. | Manufacture and sale and purchase of computer and IT peripherals, ICB and electronic parts | USD885 | USD893 | 6,400 | 100% | USD893 | - | Equity method | Note 2 | - | - | |
| Universal Scientific Industrial De Mexico S.A. De C.V. | Motherboard and computer system assembly | USD23,963 | USD46,823 | 281,085,325 | 100% | USD46,823 | - | Equity method | Note 2 | - | - | |
| USI America Inc. | Assembly and manufacture of new motherboards, manufacture of wireless communication products, maintenance and repair services | USD9,500 | USD5,518 | 250,000 | 100% | USD5,518 | - | Equity method | Note 2 | - | - | |
| USI Electronics (Shenzhen) Co., Ltd. | Design, manufacture and sale of computer motherboards and related peripherals and communication industry control products. | USD37,500 | USD150,028 | -(Note 1) | 50% | USD150,028 | - | Equity method | Note 2 | - | - |
| 158 |
| ASE Mauritius Inc. | ASE (Shanghai) | Manufacture of semiconductor materials | USD140,542 | USD326,017 | -(Note 1) | 100% | USD326,017 | - | Equity method | Note 2 | - | - |
| ASE (Kunshan) Inc. | Manufacture of semiconductor materials and packaging and testing of semiconductor products | USD80,000 | USD57,556 | -(Note 1) | 30% | USD57,556 | - | Equity method | Note 2 | - | - | |
| ASE Investment (Kunshan) Inc. | ASE (Kunshan) Inc. | Manufacture of semiconductor materials and packaging and testing of semiconductor products | USD122,000 | USD87,772 | -(Note 1) | 45% | USD87,772 | - | Equity method | Note 2 | - | - |
| Global Advanced Packaging Technology Limited, Cayman Islands | ASE Assembly and Test (Shanghai) Ltd. | Assembly and testing of semiconductor products | USD203,580 | USD356,538 | -(Note 1) | 100% | USD356,538 | - | Equity method | Note 2 | - | - |
| ASE (Korea) Inc | ASE (Weihai) | Assembly and testing of general discretes | USD126,500 | USD49,789 | -(Note 1) | 100% | USD49,789 | - | Equity method | Note 2 | - | - |
| ASE Assembly and Test (Shanghai) Ltd. | Wuxi Tongzhi Microelectronics Co., Ltd. | Assembly and testing of semiconductor products | RMB70,000 | CNY93,489 | -(Note 1) | 100% | RMB93,489 | - | Equity method | Note 2 | - | - |
| ASE Trading (Shanghai) Ltd. | Goods and technology import and export | CNY500 | CNY444 | -(Note 1) | 100% | CNY444 | - | Equity method | Note 2 | - | - | |
| Shanghai Ding Hui Real Estate Development Ltd. | Real estate project development, construction and commercial property sale and property management | RMB2,242,500 | RMB2,449,872 | -(Note 1) | 60% | RMB2,426,146 | - | Equity method | Note 2 | - | - |
| 159 |
| Shanghai Ding Hui Real Estate Development Ltd. | Shanghai Ding Qi Property Management Co., Ltd. | Property management, real estate agency | CNY1,000 | CNY (867) | -(Note 1) | 100% | CNY (867) | - | Equity method | Note 2 | - | - |
| Shanghai Ding Wei Real Estate Development Co., Ltd. | Real estate project development, construction and commercial property sale and property management | RMB1,548,000 | CNY1,528,067 | -(Note 1) | 100% | CNY1,528,067 | - | Equity method | Note 2 | - | - | |
| Shanghai Ding Yu Real Estate Development Co., Ltd. | Real estate project development, construction and commercial property sale and property management | CNY1,100,000 | CNY1,098,026 | -(Note 1) | 100% | CNY1,098,026 | - | Equity method | Note 2 | - | - | |
| Kun Shan Ding Hong Real Estate Development Co., Ltd. | Real estate project development, construction and commercial property sale and property management | CNY670,000 | CNY667,079 | -(Note 1) | 100% | CNY667,079 | - | Equity method | Note 2 | - | - | |
| Kun Shan Ding Yue Real Estate Development Co., Ltd. | Real estate project development, construction and commercial property sale and property management | CNY330,000 | CNY329,710 | -(Note 1) | 100% | CNY329,710 | - | Equity method | Note 2 | - | - |
| 160 |
| Super Zone Holdings Limited | ASE Circuit Manufacturing Co., Ltd. (China) | Semiconductor packaging and testing, after-sales service, consulting and factory building leasing | USD100,000 | USD99,801 | -(Note 1) | 100% | USD99,801 | - | Equity method | Note 2 | - | - |
| Alto Enterprises Limited | ASE Investment (Kunshan) Inc. | Investment and holding company | USD122,000 | USD87,718 | -(Note 1) | 100% | USD87,718 | - | Equity method | Note 2 | - | - |
| ASE (Kunshan) Inc. | Manufacture of semiconductor materials and packaging and testing of semiconductor products | USD66,000 | USD47,492 | -(Note 1) | 25% | USD47,492 | - | Equity method | Note 2 | - | - | |
| Shanghai Ding Wei Real Estate Development Co., Ltd. | Shanghai Ding Fan Department Stores Co., Ltd. | Departmental store and trading | CNY1,500 | CNY1,494 | -(Note 1) | 100% | CNY1,494 | - | Equity method | Note 2 | - | - |
| Universal Global Scientific Industrial Co., Ltd. | Universal Scientific Industrial Co., Ltd. | Manufacture, processing and sale and purchase of computer peripherals, Thick Film Hybrid Circuit, electronic components and accessories and personal computer and accessories | 792,064 | 1,130,788 | 39,603,222 | 99% | 886,154 | - | Equity method | Note 2 | - | - |
Note 1: No stocks issued as it is limited company.
Note 2: Profit and loss of the said invested company have been included in those of its parent company.
Note 3: In July 2016 the company invested NT$1,934,062,000 (USD59,882,000) in 98,490,000 special shares issued by Deca at USD0.608 per share. After the said investment the company's shareholding percentage was 22%, giving it substantial influence on Deca.
| 161 |
(B) Comprehensive shareholding ratio:
September 30, 2016 Unit: Share %
| Invested Company | Investment by the Company | Investments by directors, supervisors, managers and directly or indirectly controlled enterprises | Comprehensive investment | |||
| Number of shares | Shareholding ratio (%) | Number of shares | Shareholding ratio (%)(Note 2) | Number of shares | Shareholding ratio (%) | |
| A.S.E. Holding Limited | 243,966 | 100% | - | - | 243,966 | 100% |
| J & R Holding Limited | 435,128 | 100% | - | - | 435,128 | 100% |
| ASE Marketing & Service Japan Co., Ltd. | 1,200 | 100% | - | - | 1,200 | 100% |
| Omniquest Industrial Limited | 250,504,067 | 71% | 104,200,000 | 29% | 354,704,067 | 100% |
| Innosource Limited | 86,000,000 | 100% | - | - | 86,000,000 | 100% |
| Hung Ching Guang Company | 35,497,273 | 27% | 82,494,545 | 64% | 117,991,818 | 91% |
| Hung Ching Development & Construction Co. Ltd. | 68,629,782 | 26% | 63,580,900 | 25% | 132,210,682 | 51% |
| Universal Scientific Industrial Co., Ltd. | - | - | 39,603,222 | 77% | 39,603,222 | 77% |
| ASE Test Inc. | 1,131,452,502 | 100% | - | - | 1,131,452,502 | 100% |
| USI | 1,112,236,706 | 99% | - | - | 1,112,236,706 | 99% |
| Lu Zhu Development Co., Ltd. | 131,961,457 | 67% | 37,250,448 | 19% | 169,211,905 | 86% |
| Riyueyang Company | 76,500,000 | 51% | - | - | 76,500,000 | 51% |
| Siliconware Precision Industries Co., Ltd. | 1,037,300,000 | 33% | - | - | 1,037,300,000 | 33% |
| Deca Technologies Inc. | 98,489,803 | 22% | - | - | 98,489,803 | 22% |
| Advanced Microelectronic Products, Inc. | 33,308,452 | 17% | 10,000 | - | 33,318,452 | 17% |
| Alto Enterprises Limited | - | - | 188,000,000 | 100% | 188,000,000 | 100% |
| Super Zone Holdings Limited | - | - | 100,000,000 | 100% | 100,000,000 | 100% |
| TLJ Intertech Inc. | - | - | 2,119,080 | 60% | 2,119,080 | 60% |
| ASE Test Limited | - | - | 109,424,087 | 100% | 109,424,087 | 100% |
| ASE Investment (Labuan) Inc. | - | - | 240,946,882 | 100% | 240,946,882 | 100% |
| ASE Test Holdings, Ltd. | - | - | 170,000,006 | 100% | 170,000,006 | 100% |
| ASE Japan Co., Ltd. | - | - | 7,200 | 100% | 7,200 | 100% |
| ASE (U.S.) Inc. | - | - | 1,000 | 100% | 1,000 | 100% |
| Global Advanced Packaging Technology Limited, Cayman Islands | - | - | 190,000,000 | 100% | 190,000,000 | 100% |
| Anstock Limited | - | - | 10,000 | 100% | 10,000 | 100% |
| Anstock II Limited | - | - | 10,000 | 100% | 10,000 | 100% |
| ASE (Korea) Inc. | - | - | 20,741,363 | 100% | 20,741,363 | 100% |
| ASE Holdings (Singapore) Pte Ltd | - | - | 71,428,902 | 100% | 71,428,902 | 100% |
| ASE Test Holdings, Ltd. | - | - | 5 | 100% | 5 | 100% |
| ASE Singapore Pte. Ltd. | - | - | 30,100,000 | 100% | 30,100,000 | 100% |
| ISE Labs, Inc. | - | - | 26,250,000 | 100% | 26,250,000 | 100% |
| 162 |
| Invested Company | Investment by the Company | Investments by directors, supervisors, managers and directly or indirectly controlled enterprises | Comprehensive investment | |||
| Number of shares | Shareholding ratio (%) | Number of shares | Shareholding ratio (%)(Note 2) | Number of shares | Shareholding ratio (%) | |
| ASE Electronics (M) Sdn. Bhd. | - | - | 159,715,000 | 100% | 159,715,000 | 100% |
| ASE Corporation | - | - | 352,784,067 | 100% | 352,784,067 | 100% |
| ASE Mauritius Inc. | - | - | 217,800,000 | 100% | 217,800,000 | 100% |
| ASE Labuan Inc. | - | - | 126,184,067 | 100% | 126,184,067 | 100% |
| ASE Electronics Inc. | - | - | 398,981,900 | 100% | 398,981,900 | 100% |
| ASE (Hong Kong) | - | - | (Note) | 100% | (Note) | 100% |
| Huntington Holdings International Co., Ltd. | - | - | 255,856,840 | 99% | 255,856,840 | 99% |
| Unitech Holdings International Co., Ltd. | - | - | 3,000,000 | 99% | 3,000,000 | 99% |
| Real Tech Holdings Limited | - | - | 149,151,000 | 99% | 149,151,000 | 99% |
| Universal ABIT Holding Co., Ltd. | - | - | 90,000,000 | 99% | 90,000,000 | 99% |
| Rising Capital Investment Limited | - | - | 6,000,000 | 99% | 6,000,000 | 99% |
| Rise Accord Limited | - | - | 20,000 | 99% | 20,000 | 99% |
| USI Enterprise Limited | - | - | 210,978,000 | 99.% | 210,978,000 | 99.% |
| Universal Global Technology Co., Limited | - | - | 390,000,000 | 77% | 390,000,000 | 77% |
| USI (Shanghai) | - | - | 85,800,000 | 77% | 85,800,000 | 77% |
| USI | - | - | 198,000,000 | 77% | 198,000,000 | 77% |
| USI Japan Co., Ltd. | - | - | 6,400 | 77% | 6,400 | 77% |
| Universal Scientific Industrial De Mexico S.A. De C.V. | - | - | 281,085,325 | 77% | 281,085,325 | 77% |
| USI America Inc. | - | - | 250,000 | 77% | 250,000 | 77% |
| ASE (Shanghai) [ASE Global Semiconductor (Shanghai) Co.,Ltd] | - | - | (Note 1) | 100% | (Note 1) | 100% |
| ASE (Kunshan) | - | - | (Note 1) | 100% | (Note 1) | 100% |
| ASE Electronics Components (Shanghai) Co., Ltd. | - | - | (Note 1) | 100% | (Note 1) | 100% |
| ASE Assembly and Test (Shanghai) Ltd. | - | - | (Note 1) | 100% | (Note 1) | 100% |
| ASEN Semiconductors (Suzhou) | - | - | (Note 1) | 60% | (Note 1) | 60% |
| ASE (Weihai) | - | - | (Note 1) | 100% | (Note 1) | 100% |
| Shanghai Ding Hui Real Estate Development Co., Ltd. | - | - | (Note 1) | 100% | (Note 1) | 100% |
| Shanghai Ding Wei Real Estate Development Co., Ltd. | - | - | (Note 1) | 100% | (Note 1) | 100% |
| Shanghai Ding Yu Real Estate Development Co., Ltd. | - | - | (Note 1) | 100% | (Note 1) | 100% |
| Kunshan Ding Hong Real Estate Development Co., Ltd. | - | - | (Note 1) | 100% | (Note 1) | 100% |
| Kunshan Ding Yue Real Estate Development Co., Ltd. | - | - | (Note 1) | 100% | (Note 1) | 100% |
| ASE Integrated Circuit Manufacture (China) Co., Ltd. | - | - | (Note 1) | 100% | (Note 1) | 100% |
| 163 |
| Invested Company | Investment by the Company | Investments by directors, supervisors, managers and directly or indirectly controlled enterprises | Comprehensive investment | |||
| Number of shares | Shareholding ratio (%) | Number of shares | Shareholding ratio (%)(Note 2) | Number of shares | Shareholding ratio (%) | |
| ASE Investment (Kunshan) Co., Ltd. | - | - | (Note 1) | 100% | (Note 1) | 100% |
| Wuxi Tong Zhi Microelectronics Co., Ltd. | - | - | (Note 1) | 100% | (Note 1) | 100% |
| ASE Trading (Shanghai) Co., Ltd. | - | - | (Note 1) | 100% | (Note 1) | 100% |
| Shanghai Ding Qi Property Management Co., Ltd. | - | - | (Note 1) | 100% | (Note 1) | 100% |
| Shanghai Ding Fan Departmental Store Co., Ltd. | - | - | (Note 1) | 100% | (Note 1) | 100% |
| USI Electronics (Shenzhen) Co., Ltd. | - | - | (Note 1) | 77% | (Note 1) | 77% |
| USI (Shanghai) | - | - | 1,701,847,602 | 77% | 1,701,847,602 | 77% |
| Huan Quan Electronic Components (Kunshan) Co., Ltd. | - | - | (Note 1) | 99% | (Note 1) | 99% |
| USI (Kunshan) | - | - | (Note 1) | 77% | (Note 1) | 77% |
| Huan Wei Electronics (Shanghai) Co., Ltd. | - | - | (Note 1) | 77% | (Note 1) | 77% |
| Huan Hao Electronics (Shanghai) Co., Ltd. | - | - | (Note 1) | 77% | (Note 1) | 77% |
Note 1: No stocks issued as it is limited company.
Note 2: Consolidated shareholding percentage for the whole group
(3) The status of the subsidiaries who have held or disposed of shares of this company during the most recent 2 fiscal years and up to the prospectus' publishing date and the status of the shares pledged, and setting forth the origin of capital and other influences on the company's financial performance and financial condition. There was no major impact on the company's financial performance and financial status.
Unit: (NT$1,000) Share %
Subsidiaries Name | Paid-up Capital (NTD) | Capital Source
| Shareholding ratio of the company | Date of acquisition or disposal
| Shares acquired and amount | Shares disposed and amount | Investment Profit and loss | Number of shares held as at the end of the year or the date of printing of Prospectus and amount | Pledge | Amount endorsed by the company for its subsidiaries | Amount loaned by the company to its subsidiaries |
| ASE Test Inc. | 11,314,525 | Acquired as a result of merger of ASE with ASE Materials and ASE Chungli and distribution of profit | 100% | Obtained free placement for 2010 to 2012 in August 2004, partially disposed of in February 2010 | - | - | - | End 2014: 10,978,776 shares Book value 418,291 Amount transfered to treasury stock 196,677 | - | - | - |
| - | - | - | End 2015: 10,978,776 shares Book value 417,193 Amount transfered to treasury stock 196,677 | - | - | - | |||||
| - | - | - | End 2016 to date printing of Prospectus: 10,978,776 shares Book value 372,181 Amount transfered to treasury stock 196,677 | - | - | - |
| 164 |
Subsidiaries Name | Paid-up Capital (NTD) | Capital Source
| Shareholding ratio of the company | Date of acquisition or disposal | Shares acquired and amount | Shares disposed and amount | Investment Profit and loss | Number of shares held as at the end of the year or the date of printing of Prospectus and amount | Pledge | Amount endorsed by the company for its subsidiaries | Amount loaned by the company to its subsidiaries |
| ASE Test Ltd. | 659,075 | Acquired as a result of merger of ASE with ASE Materials and ASE Chungli and distribution of profit | 100% | Obtained free placement for 2010 to 2012 in August 2004, partially disposed of in February 2010 | - | - | - | End 2014: 88,200,472 shares (Note) Book value 3,360,438 Amount transfered to treasury stock 1,380,721 | - | - | - |
| - | - | - | End 2015: 88,200,472 shares (Note) Book value 3,351,618 Amount transfered to treasury stock 1,380,721 | - | - | - | |||||
| - | - | - | End 2016 to date printing of Prospectus: 88,200,472 shares (Note) Book value 2,989,996 Amount transfered to treasury stock 1,380,721 | - | - | - | |||||
J&R Holding Ltd. (Bermuda)
| 13,907,259 | Acquired as a result of merger of ASE with ASE Materials and ASE Chungli and distribution of profit | 100% | Obtained free placement for 2010 to 2012 in August 2004, partially disposed of in February 2010 | - | - | - | End 2014: 46,703,763 shares Book value 1,779,413 Amount transfered to treasury stock 381,709 | - | - | - |
| - | - | - | End 2015: 46,703,763 shares Book value 1,774,743 Amount transfered to treasury stock 381,709 | - | - | - | |||||
| - | - | - | End 2016 to date printing of Prospectus: 46,703,763 shares Book value 1,583,258 Amount transfered to treasury stock 381,709 | - | - | - |
Note: In compliance with local regulations ASE Test Ltd. placed 88,200,472 of the company's shares acquired by it to CTBC
(4) Any occurrences of the situations of Article 185 of the Company Act, or transferring part of the business operation or results of the research and development to a subsidiary during the most recent 2 fiscal years and up to the prospectus' publishing date, the status of waiving subscription rights to the cash capital increase in the subsidiary company, the name of the subscribing counter party, and the relationship with the company, the directors, supervisors and shareholders who hold more than 10 percent of the outstanding shares, and the number of the subscribed shares shall be disclosed. None
4. Important contracts
| Nature of contract | Contracting parties | Start and end dates of the contract | Content | Restrictive Terms |
| Syndicated contracts | 4 banks including Bank of Taiwan | 2013.07-2018.07 | Long-term USD loan contracts | Restrictions on financial ratio are as follows: 1. Current ratio not less than 100%. 2. Debt ratio no higher than 160%. 3. Interest cover ratio not less than 280%. 4. Net value of tangible assets not lower than NTD75 billion. |
| 165 |
| Patent contracts | FUJITSU LIMITED | 1998.04.13- 2017.04.12 | Patent Licensing | Not to disclose the terms and conditions in this contract to any third party within 5 years of its cessation or termination (confidentiality clause) |
| Patent contracts | FLIP CHIP INTERNATIONAL, LLC. (FOC/RDL) (ULCSP) | 2008.03.07- Expiration date of licensed patented technology | Patent Licensing | Not to disclose the terms and conditions in this contract to any third party before its expiration date (confidentiality clause) |
| Patent contracts | Mitsui High-tec, Inc. | 2007.06.25- 2017.06.24 | Patent Licensing | Not to disclose the terms and conditions in this contract to any third party before its expiration date (confidentiality clause) |
| Patent contracts | Infineon Technologies AG | 2007.11.06- 2017.11.05 | Patent Licensing | Not to disclose the terms and conditions in this contract to any third party before its expiration date (confidentiality clause) |
| Patent contracts | Infineon Technologies AG | 2013.04.11 - Expiration date of licensed patented technology | Patent Licensing | Not to disclose the terms and conditions in this contract to any third party (confidentiality clause) |
| Patent contracts | Siliconware Precision Industries Co., Ltd. and its related enterprises | 2009.05.10 - Expiration date of licensed patented technology | Patent Licensing | Not to disclose the terms and conditions in this contract to any third party (confidentiality clause) |
| Patent contracts | STATs Chippac Ltd. | 2012.01.01- 2016.12.31 | Patent Licensing | Not to disclose the terms and conditions in this contract to any third party (confidentiality clause) |
| Technology and patent contracts | TDK Corporation | 2015.12.3 - until the patent rights and proprietary knowledge of TDK SESUB technology have expired | Technology and patent contracts | Not to disclose the terms and conditions in this contract to any third party (confidentiality clause) |
| Technology and patent contracts | DECA TECHNOLOGIES INC. | 2016.01.13- 2026.01.13 | Technology and patent contracts | Not to disclose the terms and conditions in this contract to any third party (confidentiality clause) |
| Land leasing contract | Export Processing Zone Administration, MOEA | 2013.02.01- 2035.12.31 | Land lease | No conversion to activities not related to business operation during the term of the leasing contract; payment of rental continues pursuant to contract |
| Joint share conversion agreement | Siliconware Precision Industries Co., Ltd. | 2016.06.30- 2017.12.31. | The company entered into a joint share conversion agreement with Siliconware Precision Industries Co., Ltd. for the purpose of formation of industry holding company. | If the transaction in question cannot be completed or settled on the date of final transaction as a result of non-fulfillment of its conditions precedent, it shall be automatically terminated at zero hours of the date following the final transaction date, unless otherwise provided in the agreement. Not to disclose the terms and conditions in this contract to any third party (confidentiality clause) |
| 166 |
III. Issuance Plans and Implementation
A. The items that shall be included in the analysis regarding the allocation plan for capital raised through the previous cash capital increase, issuance of new shares to carry out a merger or acquisition, or to accept transfer of shares of another company; or issuance of corporate bonds:
As at to-date the company has not issued securities for private placement. Previous fundraising and issuance of securities by the company involved only the fourth tranche of unsecured convertible corporate bonds issued overseas in July 2015. The completion of the funds raised was slightly later than its projected time. Furthermore during the second half of 2015 the semiconductor industry was affected by liquidation of excess inventory. Thus the industry's capital expenses tended to be conservative. During the first half of 2016 the overall semiconductor industry suffered from a lack of demand due to shortage of terminal products. As a result the company adopted a prudent and conservative approach for its procurement and payment schedule in relation to capital expenses. Thus expenses lagged behind projected expenses. With machinery and equipment being pt in place, the company continued to make payment in the second half of 2016 in accordance with procurement terms. As at the end of November 2016, 90.39% of such payments have been made. Except for the outstanding items, all other procurement plans have been completed. Previous fundraising and issuance of securities with the actual completion date that is less than 3 years from the current filing include the third tranche of foreign unsecured convertible corporate bonds and share capital cash increase in 2013, the fourth tranche of unsecured convertible corporate bonds issued overseas in 2015 and the first tranche of unsecured ordinary corporate bonds issued in 2015. The said programs and their implementation are set out below:
Report on the Company's third issue of foreign unsecured convertible corporate bonds.
1. Content of the project:
(1) Date and document number of approval issued by the competent authority of the industry: Tai-Yang-Wai-Wu-Zi-1020030332 of the Central Bank dated July 26, and Jin-Guan-Zheng-Fa-Zi-10200309101 of the Financial Supervisory Commission dated August 15, 2013.
(2) The total amount of funds required under the Project: USD400,000,000, based on an exchange rate of NTD30: 1, the amount is about NTD12,000,000,000.
(3) Source of funds: Issuance of foreign unsecured convertible corporate bonds for a total amount of USD400,000,000 (about NTD12,000,000,000)
B. Project item, expected fund utilization and anticipated benefit
(1) Project item and expected fund utilization
Unit: NTD/USD '000
(Based on USD/ (NTD conversion rate of 1: 30)
| Project items | Expected Completion Date | Total funding needed | Anticipated fund utilization | ||
| 2013 | 2014 | ||||
| 4Q | 1Q | ||||
| Purchase of materials using foreign currency | 2014Q1 | USD | 400,000 | 260,626 | 139,374 |
| NTD | 12,000,000 | 7,818,780 | 4,181,220 | ||
| Total | USD | 400,000 | 260,626 | 139,374 | |
| NTD | 12,000,000 | 7,818,780 | 4,181,220 | ||
(2) Anticipated benefit:
(1) Injection of mid- to long-term operating capital in order to increase scale of operation. If calculated based on USD-denominated bank loan interest rate of
| 167 |
1.11%, there would be a saving of interest expense of USD4,440,000, or about NTD133,200,000 annually (tentatively based on exchange rate of USD to NTD of 1: 30.)
2. Reduction of exchange rate fluctuation risk, in particular for payment in foreign currency for purchase of materials.
A. Fund utilization and project implementation status
Unit: USD'000 %
| Project items | Implementation status: | Ahead or behind schedule Reasons and improvement plans | ||
| Purchase of materials using foreign currency | Expended amount | Expected | 400,000 | As the company had effectively controlled its inventory of raw materials, its actual expenses on materials to be paid in foreign currency were behind schedule. As as 2014Q2 all purchases had been implemented. Despite being behind schedule there was no major irregularity. |
| Actual | 400,000 | |||
| Implementation (%) | Expected | 100% | ||
| Actual | 100% | |||
As at 2014Q2 information on the company's fund utilization for the said fundraising project had been entered in the Market Observation Post System in accordance with regulations. In addition the project has been completed with no major irregularities.
4. Appraisal of benefit
Unit: (NT$1,000) %
Year Item | June 30, 2013 (Before fundraising) | September 30, 2013 (After fundraising) | June 30, 2014 (After fundraising) | |
| Basic financial information | Current liabilities | 51,341,442 | 51,325,274 | 55,666,748 |
| Total liabilities | 90,501,000 | 100,450,735 | 104,266,432 | |
| Operating revenue | 37,700,420 | 59,707,645 | 43,443,038 | |
| Gross operating profit | 9,111,204 | 15,153,575 | 12,303,876 | |
| Interest expense | 341,110 | 536,112 | 504,264 | |
| Earnings per share | 0.79 | 1.36 | 1.08 | |
| Financial structure | Debt-to-assets ratio (%) | 45.39% | 46.38% | 45.98% |
| Long-term fund to fixed assets ratio (%) | 247.84% | 263.27% | 251.38% | |
| Solvency | Current ratio (%) | 42.00% | 69.18% | 59.20% |
| Quick ratio (%) | 32.76% | 60.81% | 50.24% | |
The company had completed fundraising in 2013Q3. Although operating revenue from 2013Q3 and the first half of 2014 showed growth compared to before the fundraising, the company had actually controlled its inventory of raw materials. As such its actual expenditure on purchase of raw materials denominated in foreign currency was slightly behind the original schedule. As at 2014Q2 the funds raised under the project amounting to USD400,000,000 (about NTD12,000,000,000) had been fully utilized. With regard to the company's financial structure after completion of the
| 168 |
fundraising, the company's debt-asset ratio rose slightly from 45.39% at the end of June 2013 to 45.98% at the end of June 2014. The main reasons were that the project involved issuance of foreign unsecured convertible corporate bonds, and that demand was high during the first half of 2014. Thus in order to meet overwhelming demand during the second half of the year, the company had to increase its reserve of materials. This in turn led to increase in demand for operating capital, and loan amounts and accounts payable on the books increased, thereby increasing total debt amount. Furthermore long-term fund to fixed assets ratio rose from 247.84% at the end of June 2013 to 251.38% at the end of June 2014. In terms of debt-repayment ability, current ratio rose from 42.00% as at the end of June 2013 to 59.20% as at the end of June 2014, and quick ratio rose from 32.76% as at the end of June 2013 to 50.24% as at the end of June 2014. Operating income, operating margin and earnings per share all rose compared to before the fundraising. Upon completion of the fundraising project except for slight increase in its debt ratio, the company's financial structure and debt-repayment ability saw an improvement. Furthermore, the operating performance of the Company also showed improvement compared to before the fundraising. This is indication of the fundraising project's benefit of improving the company's financial structure and debt-repayment ability.
As indicated in the Table below, the company's interest expense during the first half of 2014 saw an increase of NTD168,247,000 compared to the same period in the previous year. This is because of increased operation during the first half of 2014, with the company's operating revenue increasing 15.23% over the same period last year, As a result of increased in operating demand during the second half of the year the company had to increase its reserve of materials. This had the effect of increased demand in operating capital, which in turn led to increase in overall loan. Therefore interest expense actually rose compared with the same period in 2013. Since the funds raised under the project were all used on purchase of raw materials denominated in foreign currency, the company actually benefited by saving interest rate expense.
Unit: NT$ 1,000
Year Item | 2013H1 (Before fundraising) | 2014H1 (After fundraising) |
| Interest expense | 270,084 | 438,331 |
(2) 2013 issue of new shares for cash
1. Content of the project:
(1) Date and document number of approval issued by the competent authority of the industry: In accordance with the Financial Supervisory Commission's letter, Jin-Guan-Zheng-Fa No. 1020030910 on August 15, 2013.
(2) The total amount of funds required under the Project: NTD4,000,000,000
(3) Source of funds:
A. Issuance of 130,000 new ordinary shares for cash. The denomination was NTD10 per share, and the issue price was NTD26.10 per share. A total of NTD3,393,000,000 had been raised.
B. Others: Cash in hand or bank loan of NTD607,000,000.
2. Project item, expected fund utilization and anticipated benefit
(1) Project item and expected fund utilization
| 169 |
Unit: NT$ 1,000
| Project items | Expected date of completion | Total funding needed | Anticipated fund use progress | |||
| 2013 | 2014 | |||||
| Quarter 4 (Q4) | Quarter 1 (Q1) | Quarter 2 (Q2) | ||||
| Purchase of machinery and equipment | 2014Q2 | 4,000,000 | 750,000 | 650,000 | 2,600,000 | |
| Total | 4,000,000 | 750,000 | 650,000 | 2,600,000 | ||
(2) Anticipated benefit:
Unit: '000 pieces NT$ 1,000
| Year | Item | Output Volume | Sales Volume | Operating revenue | Gross operating profit | Net operating profit |
| 2014 | Purchase of machinery and equipment | 896,756 | 896,756 | 3,040,000 | 663,024 | 328,624 |
| 2015 | 1,793,511 | 1,793,511 | 6,080,000 | 1,326,048 | 657,248 | |
| 2016 | 1,933,405 | 1,933,405 | 6,226,528 | 1,371,777 | 686,859 | |
| 2017 | 2,084,211 | 2,084,211 | 6,376,587 | 1,418,608 | 717,184 | |
| Total | 6,707,883 | 6,707,883 | 21,723,115 | 4,779,457 | 2,389,915 | |
3. Fund utilization and project implementation status
Unit: USD'000 %
| Project items | Implementation status: | Ahead or behind schedule Reasons and improvement plans | ||
| Purchase of machinery and equipment | Expended amount | Expected | 4,000,000 | The company had used utilized the entire amount of funds raised on purchase of machinery and equipment. The project was competed in 2014Q2 according to schedule. |
| Actual | 4,000,000 | |||
| Implementation (%) | Expected | 100% | ||
| Actual | 100% | |||
The fund utilization program was completed in 2104Q2 in accordance with schedule. All information was set out in the Quarterly Report entered into the Internet system.
4. Appraisal of benefit
Unit: '000 pieces NT$ 1,000
| Year | Item | Output Volume | Sales Volume | Operating revenue | Gross profit | Net operating profit | |
| 2014 | Purchase of machinery and equipment | Estimated number | 896,756 | 896,756 | 3,040,000 | 663,024 | 328,624 |
| Actual number | 787,500 | 787,500 | 2,520,000 | 826,236 | 549,036 | ||
| Achievement Rate | 87.82% | 87.82% | 82.89% | 124.62% | 167.07% | ||
| 2015 | Estimated number | 1,793,511 | 1,793,511 | 6,080,000 | 1,326,048 | 657,248 | |
| Actual number | 2,891,372 | 2,891,372 | 6,482,389 | 1,706,150 | 1,144,431 | ||
| Achievement Rate | 161.21% | 161.21% | 106.62% | 128.66% | 174.12% | ||
| 2016 | Estimated number | 1,933,405 | 1,933,405 | 6,226,528 | 1,371,777 | 686,859 | |
| Actual number (note) | 2,141,059 | 2,141,059 | 4,741,099 | 1,414,282 | 999,759 | ||
| Achievement Rate | 110.74% | 110.74% | 76.14% | 103.10% | 145.56% | ||
Note: Until end of November 2016.
| 170 |
Purchase of machinery and equipment by the company was in anticipation of future business growth. Thus the machinery and equipment purchased during this exercise were advance semiconductor assembly and testing equipment, with such equipment being added to production in stages. Official production was expected to begin in 2014Q3. The increase in production volume, sales volume, operating income, gross operating profit and net operating profit for the company's assembly and testing products in 2014Q3 after commencement of production were respectively: 787,500,000 units, 787,500,000 units, NTD2,520,000,000, NTD826,236,000 and NTD549,036,000, with achievement rate respectively of 87.82%, 87.82%, 82.89%, 124.62% and 167.07%. The achievement rate of over 80% for production volume, sales volume and operating revenue was considered excellent. In addition the achievement rate for gross operating profit and net operating profit was also good since the orders' gross profit was higher than that originally estimated, with the company also exercising effective control of expenses. The increase in production volume, sales volume, operating income, gross operating profit and net operating profit for the company's assembly and testing products in 2015 after commencement of production were respectively: 2,891,372,000 units, 2,891,372,000 units, NTD6,482,389,000, NTD1,706,150,000 and NTD1,144,431,000, with achievement rate respectively of 161.21%, 161.21%, 106.62%, 128.66% and 174.12%, which were considered excellent. Furthermore the increase in production volume, sales volume, operating income, gross operating profit and net operating profit for the company's assembly and testing products as at the end of November 2016 after commencement of production were respectively: 2,141,059,000 units, 2,141,059,000 units, NTD4,741,099,000, NTD1,414,282,000 and NTD999,759,000, with achievement rate respectively of 110.74%, 110.74%, 76.14%, 103.10% and 145.56%. As a result of adjustment in product combination the achievement rate for operating revenue was lower than that of gross operating profit. IN addition gross operating profit and net operating profit were excellent as gross profit from orders was higher than expected estimated gross profit margin as well as due to effective control of expenses. In conclusion the benefit from the company's 2013 issuance of new shares for cash injection for use in purchase of new machinery and equipment was apparent.
(3) Report on the Company's fourth issue of foreign non-guaranteed convertible corporate bonds in 2015
1. Content of the project:
(1) Date and document number of approval issued by the competent authority of the industry: Tai-Yang-Wai-Wu-Zi-1040019282 of the Central Bank dated May 15, 2015 and Jin-Guan-Zheng-Fa-Zi-1040020328 of the Financial Supervisory Commission dated June 3, 2015.
(2) The total amount of funds required under the Project: USD220,000,000 or about NTD6,886,000,000. (based on an exchange rate of NTD31.3: USD1.)
(3) Source of funds:
A. Issuance of foreign unsecured convertible corporate bonds for the amount of USD200,000,000, or about NTD6,260,000,000. (based on an exchange rate of NTD31.3: USD1.)
B. Others: Cash in hand or bank loan amounting to USD200,000,000, or about NTD626,000,000. (based on an exchange rate of NTD31.3: USD1.)
2. Project item, expected fund utilization and anticipated benefit
| 171 |
(1) Project item and expected fund utilization
Unit: NTD/USD '000
(Tentative exchange rate of USD- NTD at 1: 31.3.)
| Project items | Expected Completion Date | Total funding needed | Anticipated fund use progress | |||
| 2015 | 2016 | |||||
| Quarter 3 (Q3) | Quarter 4 (Q4) | Quarter 1 (Q1) | ||||
| Purchase of machinery and equipment | 2016 Quarter 1 (Q1) | USD | 220,000 | 78,081 | 113,835 | 28,084 |
| NTD | 6,886,000 | 2,443,935 | 3,563,036 | 879,029 | ||
| Total | USD | 220,000 | 78,081 | 113,835 | 28,084 | |
| NTD | 6,886,000 | 2,443,935 | 3,563,036 | 879,029 | ||
(2) Anticipated benefit:
In anticipation of future business growth, the company planned to purchase semiconductor assembly and testing machinery and equipment for its Kaohsiung Plant. The company projected increase in operating revenue, gross operating profit and net operating profit in 2016~2019 to be NTD17,610,794,000, NTD4,937,175,000 and NTD2,999,988,000 respectively.
3. Fund utilization and project implementation status
Unit: NT$ 1,000
| Project items | Status of implementation as at the end of November 2016 | The reason that the project is ahead of or behind schedule and improvement plan | ||
| Purchase of machinery and equipment | Expended amount | Expected | 6,886,000 | The company originally projected cumulative expenses as at 2016Q1 to be USD220,000,000 (about NTD6,886,000,000), and projected implementation progress to be 100.00%. However as at the end of November 2016 the company's actual cumulative expenses were USD198,850,000 (about NTD6,224,003,000), giving an actual cumulative implementation rate of 90.39%. The implementation was behind schedule mainly because the funds were in place on July 2, 2015 which was after the expected date. In addition the semiconductor industry was affected by moves to cut down inventory during the second half of 2015, thus causing the company to adopt a conservative approach for its expenditure. During the first half of 2016 the overall semiconductor |
| Actual | 6,224,003 | |||
Implementation (%) | Expected | 100.00% | ||
| Actual | 90.39% | |||
| Total | Expended amount | Expected | 6,886,000 | |
| Actual | 6,224,003 | |||
| 172 |
| Project items | Status of implementation as at the end of November 2016 | The reason that the project is ahead of or behind schedule and improvement plan | ||
Implementation (%) | Expected | 100.00% | industry suffered from a lack of demand due to shortage of terminal products. As a result the company adopted a prudent and conservative approach for its procurement and payment schedule in relation to capital expenses. Thus expenses lagged behind projected expenses. During the second half of 2016 the machinery and equipment were duly delivered and the company made payment in accordance with the payment terms. In summary, although the implementation of fund disbursement was slightly behind schedule the company came to the conclusion upon assessment that this was mainly due to changes in the semiconductor industry chain, albeit with no major irregularity. | |
| Actual | 90.39% | |||
As at the end of November 2016 the cumulative amount originally projected by the company for purchase of machinery and equipment was NTD6,886,000,00 with implementation level of 100.00%. However the actual cumulative expenses of NTD6,224,003,000, with implementation of 90.39%. This was mainly because the time for overseas underwriting was longer than originally expected, with funds raised behind schedule. Thus fund utilization was also behind schedule. Moreover weak demand for terminal devices during the second half of 2015 while upstream customers also adjusting their inventories. The above causes prompted the company to take a conservative approach with respect to its capital expenses. Owing to weak seasonal demand during the first half of 2016 and lack of terminal devices for the semiconductor industry, the company adopted a prudent approach for its capital expenses both with regard to actual purchases and payment schedule. Therefore actual expenses were slightly behind schedule. With traditional peak season during the second half of 2016 and sustained demand for smart phones, the machinery and equipment ordered by the company have been duly delivered with the company making payment in accordance with the payment terms. Overall, although the implementation of the company's fourth foreign unsecured convertible corporate bonds was slightly behind schedule, the company had upon assessment concluded that it was due to changes in the entire semiconductor industry with no major irregularity. Thus it did not have any major adverse impact on the company's finances and operation as well as shareholder's equity. In conclusion the causes were reasonably expected, with no major irregularity.
4. Unspent amount: As of November 2016, USD1,150,000 (approximately NTD35,995,000) from this fundraising remains unspent and is placed in a savings account. The remaining USD20,000,000 (approximately NTD626,000,000) will be supplemented through proprietary funds.
5. Appraisal of benefit
| 173 |
(1) Location of equipment installation: No. 2, Chuangyi Road S., Nantze Export Processing Zone (NEPZ), Kaohsiung and No. 26, Jingsan Road, NEPZ, Kaohsiung.
(2) Appraisal of benefit:
Unit: '000 pieces NT$ 1,000
| Year | Item | Output Volume | Sales Volume | Operating revenue | Gross profit | Net operating profit | |
2016 (Note)
| Purchase of machinery and equipment | Estimated number | 1,172,481 | 1,172481 | 4,338,180 | 1,201,790 | 724,591 |
| Actual number | 1,061,666 | 1,061,666 | 3,970,632 | 933,099 | 647,213 | ||
| Achievement Rate | 90.55% | 90.55% | 91.53% | 77.64% | 89.32% | ||
Note: Compiled up to the end of November 2016.
The current purchase of machinery and equipment by the company was mainly in anticipation of future business growth needs. As such the machinery consisting of semiconductor assembly and testing equipment was purchased, delivered and put in production in batches. The original plan was for mass production to begin in 2016Q1, but owing to weak demand for devices and adjustment of inventory by upstream customers, the company decided to adopt a conservative approach, thus causing the benefit to be slightly delayed. The increase in production volume, sales volume, operating income, gross operating profit and net operating profit for the company's assembly and testing products as at the end of November 2016 was respectively: 1,061,666,000 units, 1,061,666,000 units, NTD3,970,632,000, NTD 933,099,000 and NTD647,213, with achievement rate of 90.55%, 90.55%, 91.53%, 77.64% and 89.32%. The achievement rate of over 80% for production volume, sales volume, operating revenue and net operating profit was considered excellent. The achievement rate of gross operating profit was 77.64% since the orders' gross profit was lower than that originally estimated; however, net operating profit remained highly satisfactory due to the company’s effective control of expenses. The company expects that, with production capacity gradually stabilizing, shortening of semiconductor production process, returning demand for advance assembly and emerging smart phone application driving increasing market demand the effect of the company's purchase of new machinery and equipment will be demonstrated in due course.
6. Impact on shareholder's equity and future improvement plan
Utilization of funds from the fundraising project was behind schedule mainly because the time for overseas underwriting was longer than originally expected, with funds raised behind schedule. Moreover adjustments in the semiconductor industry of inventories and weak demand for terminal devices during the second half of 2015 prompted the company to take a conservative approach with respect to its capital expenses. The machinery and equipment purchased by the company had been put into production in stages. As at the end of November 2016, the achievement rate for additional production volume, sales volume, operating income, gross operating profit and net operating profit for the company's assembly and testing products as at the end of November 2016 was respectively: 90.55%, 90.55%, 91.53%, 77.64% and 89.32%. The achievement rate of over 80% for production volume, sales volume, operating revenue and net operating profit was considered excellent. In addition the achievement rate of 77.64% for gross operating profit was also good since the orders' gross profit was higher than that originally estimated, with the company also exercising effective control of expenses. Achievement of net operating profit was also excellent. The company expects
| 174 |
that, with production capacity gradually stabilizing, shortening of semiconductor production process, returning demand for advance assembly and emerging smart phone application driving increasing market demand the effect of the company's purchase of new machinery and equipment will be demonstrated in due course. In conclusion there was no major adverse impact on shareholder's equity.
(4) 2015 first unsecured ordinary corporate bonds
1. Content of the project:
(1) Date and document number of approval issued by the competent authority of the industry: Zheng-Gui-Zhai-Zi-1040037031 dated January 4, 2016.
(2) The total amount of funds required under the Project: NTD9,000,000,000.
(3) Source of funds: Issuance of 2015 first unsecured ordinary corporate bond for NTD9,000,000,000.
2. Project item, expected fund utilization and anticipated benefit
(1) Project item and expected fund utilization
Unit: NTD/USD '000
(Tentative exchange rate of USD- NTD at 1: 31.3.)
| Project items | Expected Completion Date | Total funding needed | Anticipated fund use progress |
| 2016 | |||
| Quarter 1 (Q1) | |||
| Repayment of debts | 2016 Quarter 1 | 9,000,000 | 9,000,000 |
| Total | 9,000,000 | 9,000,000 | |
(2) Anticipated benefit:
The interest rates for the company's long-term corporate bonds were at relatively modest level. The issuance of the current long-term corporate bonds would reduce the risk of rising interest rate. The issuance of long-term corporate bonds denominated in New Taiwan Dollars in order to increase its source of long-term funding meant that there was no exchange risk while also locking in the cost of long-term financing. This was in keeping with the principle of steady operation.
3. Fund utilization and project implementation status
Unit: USD'000 %
| Project items | Implementation status: | Ahead or behind schedule Reasons and improvement plans | ||
| Repayment of debts | Expended amount | Expected | 9,000,000 | The company had utilized all the funds raised towards repayment of debts. The project was fully implemented during 2016Q1. |
| Actual | 9,000,000 | |||
| Implementation (%) | Expected | 100% | ||
| Actual | 100% | |||
As at 2016Q1 information on the company's fund utilization for the said fundraising project had been entered in the Market Observation Post System in accordance with regulations. In addition the project has been completed with no major irregularities.
4. Appraisal of benefit
(1 Adjustments in financial structure
| 175 |
List of Bank Loans Repaid and Interest Rate Saved
Unit: NT$ 1,000
| Lending institution | Interest rate | Contractual Period
| Original loan Purpose
| Original loan Amount | Proposed repayment Amount | Reduced interest expense (Note) |
| NTD | NTD | 2016 | ||||
| NTD | ||||||
| DBS Bank | 1.00% | 2014/10/20-2017/10/19 | Repayment of loan and working capital | 1,100,000 | 1,100,000 | -- |
| Bank of Nova Scotia | 1.01% | 2015/2/4-2017/2/4 | Repayment of loan and working capital | 2,000,000 | 2,000,000 | -- |
| Standard Chartered Bank | 1.00% | 2014/12/31-2016/12/31 | Repayment of loan and working capital | 1,830,000 | 1,830,000 | -- |
| HSBC Bank (Taiwan) Limited | 1.02% | 2015/10/27-2017/10/26 | Repayment of loan and working capital | 3,530,000 | 3,470,000 | -- |
| KGI Bank | 0.96767% | 2015/5/19-2018/5/18 | Repayment of loan and working capital | 600,000 | 600,000 | -- |
| Total | 9,060,000 | 9,000,000 | -- | |||
Note: 1. The basis for calculation of reduction in interest was when the interest rate for the original loan was higher than that of the corporate bonds issued (Class A: fixed annual interest rate 1.30%; Class B: fixed annual interest rate 1.5%).
2. Part of the loans that were repaid carnied interest rates that were higher than that of the corporate bonds. However, considering that the current interest rate for mid- to long-term loans is still at a relatively low level, the current issuance of domestic corporate bonds was reasonable. Moreover it could reduce structural risk of the company's finances.
Unit: (NT$1,000) %
Year Item | End 2015 (Before fundraising) | 2016Q1 (After fundraising) | |
| Basic financial information | Total current assets | 32,132,019 | 26,744,680 |
| Total assets | 305,942,938 | 310,493,166 | |
| Total current liabilities | 91,305,117 | 94,091,727 | |
| Total liabilities | 149,026,934 | 153,039,266 | |
| Operating revenue | 94,206,807 | 21,527,239 | |
| Earnings per share (NTD) | 2.44 | 0.43 | |
| Financial structure (%) | Debt ratio | 48.71 | 49.29 |
| Long-term fund/fixed assets | 259.13 | 273.72 | |
| Solvency (%) | Current ratio | 35.19 | 28.42 |
| Quick ratio | 30.70 | 23.77 | |
The company's 2015 first unsecured corporate bonds were issued to raise a total sum of NTD9,000,000,000. All the funds raised would be utilized in repayment of bank loans, and implementation of the project was completed during 2016Q1. The purpose was to reduce risk of the company's financial structure. The company's debt ratio during 2016Q1 was 49.29%. This was slightly higher than that at the end of 2015 (48.71%). Its current ratio and quick ratio as at 2016Q1 were respectively 28.42% and 23.77%, compared with 35.19% and 30.70% at the end of 2015 (before fundraising). This is mainly because during 2016Q1 the company increased its shareholding in Siliconware Precision Industries. As a result the increase in current assets and quick
| 176 |
assets was significantly larger than the increase in current liabilities. However after the issuance of the ordinary corporate bonds the company's long-term capital increased to 273.73% of its fixed assets. This was indication of adjustment in the company's financial structure. In terms of operating income, due to adjustments in inventory in the semiconductor industry in the second half of 2014, weak demand in terminal devices, and the traditional low season, in the first quarter of 2016 the Company’s income was lower than the same period last year. However, rising demand for packaging in the communications, consumer electronics, industry, and vehicle industries has led to an end of the inventory clear-outs by downstream clients. Coupled with the traditional peak season, the Company’s performance in the first three quarters of 2016 showed a trend towards growth. This indicates the Company’s success in this issue of corporate bonds.
(2) Reduction of risk of rising interest rate
Furthermore judging by the yield trend of the 5th public debts in 2016 of the R.O.C., it has gradually risen from 0.6066% early in the year to 0.845% currently. This is an indication of the company locking in the cost of long-term financing by its issuance of 2015 first unsecured ordinary corporate bonds, thereby reducing the risk of rising interest rate.
In conclusion the effect of the company's 2015 first unsecured ordinary corporate bonds to repay bank loans is apparent.
| 177 |
2. Other matters that should be reported in the current plan for cash capital increase, issuance of corporate bonds, issuance of employee stock warrants or new restricted employee shares:
(3) Source of funds:
(1) The total amount of funds required by the Project: NTD10,290,000,000
(2) Source of funds:
For the current project the company proposes to issue 300,000,000 new shares each with a face value of NTD10, and an issuing price fixed at NTD34.3 per share. The company expects to raise NTD10,290,000,000.
3. Project item, expected fund utilization and anticipated benefit
Unit: NT$ 1,000
| Project items | Expected date of completion | Total funding needed | Anticipated fund use progress |
| 2017 | |||
| Quarter 2 (Q2) | |||
| Repayment of bank loan | 2017Q2 | 10,290,000 | 10,290,000 |
| Total | 10,290,000 | 10,290,000 | |
Anticipated Benefit
| The company expects to utilize NTD10,290,000,000 to repay bank loans. This means that for fiscal year 2017 it is expected to save about NTD70,739,000 in interest expense. Thereafter the company can save about NTD94,319,000 annually in interest expense. | ||
(2) Current issuance of the corporate bonds shall, pursuant to Article 248 of the Company Law, disclose relevant matters and fundraising plan for repayment and means of custody: Not applicable.
(3) Current of special shares shall require disclosure of the face value of each share, offer/issuing price, impact of issuing conditions on holders of special shares, potential dilution of shareholding rights, impact on shareholders' interest and matters specified in Article 157 of the Company Law: Not applicable.
(4) For issuance/offering of unlisted or non-OTC special shares of unlisted or non-OTC companies, there shall be disclosed the purpose of the issuance/offering, reason for not listing on stock exchange or OTC, impact on the rights of existing shareholders or future investors and whether or not there are plans to apply for listing on stock exchange or OTC: Not applicable.
(5) Where the shares to be issued are those of companies traded by securities brokerages approved pursuant to Article 5 of "Taipei Exchange Rules Governing the Review of Emerging Stocks for Trading on TPEx", future listing (OTC) plans should be disclosed: Not applicable.
(6) Where the current issuance/offering involves employee's subscription warrant, the rules governing issuance of employee's subscription warrant and subscription thereto should be disclosed. Not applicable.
| 178 |
(7) Where the current issuance/offering involves new shares with restricted employee's right, the rules governing issuance of such shares should be disclosed. Not applicable.
(8) The viability, necessity and reasonableness of the current project, with analysis of various sources of fund deployment and impact of dilution of earnings per share during the current and the next year.
1. Viability of the current funding plan involving offering and issuance of securities
(1) Viability of statutory procedure
The company's current issuance of new shares for cash has been approved by way of resolution at its Board of Directors meeting held on December 8, 2016. The company has determined that the issuance/offering is in compliance with the Company Law, Securities Exchange Act, Regulations Governing the Offering and Issuance of Securities by Issuers and other relevant laws and regulations. Furthermore the company's legal counsel has issued legal opinion with respect to the legal compliance of the share issuance/offering plan. As such the current issuance/offering is compliant with law,
(2) Viability of completion of fundraising
For the current project the company proposes to issue 300,000,000 new shares each with a face value of NTD10, and an issuing price tentatively fixed at NTD34.3 per share. The company expects to raise NTD10,290,000,000. Pursuant to the requirements under Article 267 of the Company Act, 10% of the new shares issued, i.e. 30,000,000 shares will be set aside for subscription by the company's employees. Furthermore pursuant to Article 28-1 of the Securities Exchange Act, 10% of new shares issued, i.e. 30,000,000 shares will be set aside for public offering through underwriter by way of open subscription. The remaining 80%, i.e. 240,000,000 shares will be subscribed by original shareholders with their respective shareholding ratios on the shareholders’ roster at subscription record date. For fractional part of a share subscribed by shareholders, such shareholders shall proceed to the company's registrar within 5 days of the cessation of transfer registration to process subscription through aggregation of fractional entitlement. For shares for which the original shareholders or employees have relinquished their subscription rights or fractional parts of shares, the Board of Directors authorizes the Chairman to negotiate with specific individuals to subscribe such shares or fractional parts at the issue price. In addition pursuant to Article 61 of the Taiwan Securities Association Rules Governing Underwriting and Resale of Securities by Securities Firms, for a firm commitment offering by public subscription, where subscriptions fall short of the number of units put up for sale, the underwriting syndicate may either place the remainder with a specific party or purchase the remainder on its own account. Therefor the current fundraising is considered viable.
(3) Viability of fund utilization plan
The company proposes to use all funds raised from the offering of new shares to repay bank loans in order to reduce its interest burden, improve its financial structure as well as flexibility of its financial channels. Upon perusal of the loan contracts for loans which the company proposes to repay and disbursement of monies, it has been ascertained that such loans actually exist and their contracts do not preclude early repayment or contain other special restrictions. Thus upon completion of the current fundraising the company can carry out repayment of bank loan in accordance with its fund utilization plan. This means that the proposal to use the funds raised to repay bank loans is reasonable and viable.
| 179 |
In conclusion the company's issuance/offering of new shares is compliant with law. The completion of fundraising and fund utilization plan are also viable.
2. Necessity of fundraising plan
(1) Reduces interest expense and financial burden, and additional room for flexible use of funds
Unit: NT$ 1,000
Year Item | 2014 | 2015 | 2016Q3 |
| Total loans (note) | 50,347,551 | 79,105,720 | 83,366,026 |
| Interest cost (A) (note) | 519,576 | 509,793 | 527,977 |
| Operating profit (B) | 18,278,988 | 13,892,786 | 8,365,544 |
| Interest cost/Operating profit (A)/(B)(%) | 2.84 | 3.67 | 6.31 |
Source: 2014–2015 financial reports inspected and certified by a CPA.
Note: “Loan” refers to bank loans (long- and short-term loans) short-term notes payable and short-term bonds payable
At present the company mainly carries out production, assembly, processing, testing and sale of all types of ICB. It leverages on its semiconductor assembly and testing technology and production process research and development to provide advance assembly and testing services for semiconductor manufacturers throughout the world. In the entire semiconductor supply chain the company's main operations involving assembly and testing in mid-stream and supply of assembly materials in the downstream. In 2015the assembly and testing industry was affected by weak demand for terminal devices. In addition upstream customers adjusted their inventories. Market competition also intensified, thus causing the company's operating revenue in 2015 to show marginal decline compared to that in 2014. Owing to weak seasonal demand during the first three quarters of 2016 and lack of terminal devices for the semiconductor industry, the company's operating revenue continued to show slight decline. With traditional peak season during the second half of 2016 and sustained demand for smart phones, the company's operating revenue during the third quarter rose slightly compared with the previous two quarter.s
It can be seen from the Table that at present the company's working capital consists entirely of loans. Thus, interest expense during 2014, 2015 and first three quarters of 2016 respectively made up 2.84%, 3.67%, and 6.31% of operating profit. This is indication that interest cost has significant impact on the company's profitability. In order to complement the company's financial structure and reduce interest expense, the company has fixed the amount required for this project to be NTD10,290,000,000. The company also proposes to utilize the entire amount to repay bank loans. Based on the interest rate of 0.90%~0.93% for loans for which the company proposes to repay, the company expects to save in 2017, interest expense of about NTD70,739,000, with saving of about NTD94,319,000 annually in subsequent years. The current fundraising plan will suitable reduce interest expense, thereby reducing the company's financial burden as well as its reliance on banks. This will enable it to respond better to changes in the industry. If the company continues to meet working capital needs through bank loans, the room for its working capital may well be significantly compressed in the event of downturn in economic outlook. Therefore the company's proposal to apply all the funds raised towards repayment of bank loans will not only reduce its reliance on financial institutions but will also convert short-term funds on loan to long-term funds, thereby reducing its financial and operational risks. The current fundraising plan is therefore of critical importance.
| 180 |
(2) Improvement in financial structure and debt-repayment ability, while ensuring operating opportunities and maintaining long-term competitiveness
Financial ratios of ASE before and after fundraising
Year Item | Before fundraising | After fundraising | |||
| 2014 | 2015 | 2016 Quarter 3 (Q3) | 2017 (note) | ||
| Financial structure | Debt ratio (%) | 42.60 | 48.71 | 51.66 | 41.13 |
| Solvency | Current ratio (%) | 60.50 | 35.19 | 33.36 | 43.56 |
| Quick ratio (%) | 53.66 | 30.70 | 27.43 | 34.40 | |
Source: 2014–2015 financial reports inspected and certified by a CPA.
Note: Projections based on financial statements for 2016Q3.
In terms of financial structure, the company's debt ratio as at the end of 2014~2015 and 2016Q3 is respectively 42.60%, 48.71% and 51.66%. The increase is mainly due to the company's issuance in 2015 of its fourth foreign unsecured convertible corporate bonds, issuance of unsecured ordinary corporate bonds in 2016Q1 and increase in bank loans to meet operating needs. With regard to the company's debt-repayment ability, as at the end of 2014~2015 and 2016Q3 the company's current ratio is respectively 60.50%, 35.19% and 33.36%, and its quick ratio 53.66%, 30.70% and 27.43% respectively. The decline year-by-year is mainly due to increase in demand for operating capital, causing the company's short-term liabilities to rise each year. Furthermore the corporate bonds issued at the end of 2015 have been transferred to corporate debts due within one year. The company is an advance semiconductor assembly and testing service provider. To meet its operating needs it depends on bank loans for its working capital. The current fundraising project is expected to be completed in 2017Q1 when all funds raised will be in place. The company is expected to then use the funds raised to repay its bank loans. It expects that following the fundraising the company's debt ratio will be reduced, and its current ratio and quick ratio will rise compared to those in 2015 and 2016Q3. If the company does not raise fresh capital to repay bank loans its financial structure may continue to weaken. Increase in interest expenses will also affect its debt-repayment ability and increase its liquidity and credit risks. All these will have adverse impact on the company's future business expansion. Following the fundraising the company's ratio and financial structure are expected to improve, thereby reducing its financial risk, improve its debt-repayment ability and maintenance of long-term competitiveness. As such the fundraising project is necessary.
(3) Finance and capital
The company's current fundraising involving issuance of new shares for cash is expected to raise NTD10,290,000,000. The entire amount of funds raised will be used to repay bank loans, thereby suitably reducing the company's debt ratio. Based on the company's cash income and expense projections for 2016 and 2017, the company's non-financing income between December 2016 and April 2017 is projected to total NTD43,453,831,000. Add to that its cash balance as at December 2016 of NTD1,319,683,000 and deduct from that non-financing expenses of NTD34,406,371,000, and considering that its monthly minimum cash balance is NTD1,500,000,000 and the net amount of total bank loan is NTD29,593,919,000, the
| 181 |
company will between December 2016 and April 2017 see a working capital shortfall of NTD20,726,776,000. If such shortfall is to be met by increase in bank loan the company's operating risk will correspondingly increase. Its profit will also be eroded. Thus to prevent interest rate from being a burden due to increased lending as well as reduce the company's reliance on banks and improve its competitiveness, it is necessary for the company's fundraising project to raise funds to repay bank loan. This also has the effect of using long-term funding to meet shortage in the company's working capital.
3. Reasonableness of projected progress and anticipated benefit of fund utilization plan
(1) Reasonableness of fund utilization plan and projected progress
Unit: NT$ 1,000
| Project items | Expected date of completion | Total funding needed | Anticipated fund use progress |
| 2017 | |||
| Quarter 2 (Q2) | |||
| Repayment of bank loan | 2017Q2 | 10,290,000 | 10,290,000 |
| Total | 10,290,000 | 10,290,000 | |
The company expects to file with the Securities and Futures Bureau of the Financial Supervisory Commission in December 2016 its new share issuance for cash. It is then expected to complete fundraising during 2017Q1 following the aforesaid filing, whereupon it will apply the entire amount of fund raised for repayment of bank loan. For those bank loans to be repaid by the company, their loan contracts do not contain restrictions with respect to early repayment. Therefore the fund utilization plan and expected progress are considered reasonable.
(2) Reasonableness of anticipated benefit:
The following contains details of bank loans expected to be repaid following the fundraising project:
Unit: NT$ 1,000
| Lending institution | Interest rate | Contract Period | Original loan purpose | Original loan amount | Proposed repayment amount in 2017Q2 | Reduced interest expense | |
2017 (Note) | 2018 | ||||||
| Standard Chartered Bank | 0.91% | 2016.08.01~2018.08.01 | Working capital | 3,290,000 | 3,290,000 | 22,454 | 29,939 |
| DBS Bank | 0.90% | 2016.08.12~2019.08.11 | Working capital | 4,330,000 | 2,400,000 | 16,200 | 21,600 |
| HSBC Bank | 0.93% | 2016.10.27~2018.10.26 | Working capital | 4,600,000 | 4,600,000 | 32,085 | 42,780 |
| Total | 12,220,000 | 10,290,000 | 70,739 | 94,319 | |||
Note: The company expects that following completion of fundraising in March 2017 it will utilize the funds to repay bank loans in April 2017, thus saving interest expense for April ~ December 2017.
The company expects to repay in 2017Q2 bank loans amounting to NTD10,290,000,000. The original bank loans were short-term loans for working capital.
| 182 |
Based on the lending rate for the loans to be repaid, the company will in 2017 and annually in subsequent years save the following: NTD70,739,000 and NTD94,319,000. The savings in interest expense and reduction in financial burden is therefore reasonable.
4. Analysis of impact of various sources of fund deployment on the company's earnings per share during the current year and subsequent one year
(1) Analysis of comparison between various funding sources:
The main sources of funding for listed (OTC) companies are generally divided into equity-based and debt-based fundraising tools. The former consists of issuance of new shares for cash and overseas depository receipts, while the latter consists of foreign or local convertible corporate bonds, ordinary corporate bonds and bank loans etc. The following sets out favorable and unfavorable factors for various funding sources, along with their analysis:
| Item | Favorable factors | Unfavorable factors | |
| Equity | Cash capital increase Issuance of new shares | 1. Improves financial structure, reduces financial risk, enhances market competitiveness. 2. A relatively common financial product in the capital market, with high level of acceptance by general investors. 3. Under the law employees will have priority in subscribing 10%~15% of the shares issued, thus raising employees' acceptance and sense of belonging. | 1. Earnings per share are diluted as a result of expansion in share capital. 2. For companies whose shareholding is not concentrated, their operating status can be easily threatened. 3. If there is no reasonable disparity between underwriting price and market price, the fundraising may not be successful. |
Overseas
Depository Receipts
| 1. Fundraising in overseas market gives an opportunity for the company to enhance its reputation. 2. Fundraising mainly targeted at foreign entities, thus preventing excessive accumulation of shareholding in local market and causing adverse impact of the share price. 3. Improves the ratio of proprietary funds as well as financial structure. | 1. The company's reputation in overseas market and growth of its industry will affect the fundraising program's success. 2. Relatively high fixed issuing cost. To achieve economy of scale the issuance/offering should not be for a low amount. | |
| Debt | Foreign and local convertible corporate bond | 1. As it is accompanied with 'conversion' right its coupon rate is lower than long-term loan interest rate. 2. The conversion price for conversion into ordinary shares is generally higher than the current price of such shares during issuance of such convertible bonds. This means that the issuer is issuing shares at a relative premium. 3. Lower pressure of dilution of earnings per share. 4. Convertible bonds is changed from liabilities to assets upon creditors requesting conversion. In addition to save interest expense the company can also avoid being under pressure for funding once the bonds mature. | 1. Lower liquidity than ordinary shares. 2. Insofar as the bonds are not converted the company will remain under pressure for capital in case of redemption.
|
| 183 |
Item | Favorable factors | Unfavorable factors | |
| Ordinary corporate debt | 1. No dilution of equity. 2. Creditors do not possess right of management of the company, thus no major impact. 3. Effective use of financial leverage, thus creating relatively high profit. | 1. Interest burden erodes the company's profitability. 2. Easily cause deterioration in the company's financial structure, thus reducing its competitiveness. 3. The company will face enormous pressure to raise fund to meet redemption upon maturity of corporate debt. | |
Bank loan or Issuance of acceptance bill
| 1. No dilution of equity. 2. Creditors do not possess right of management of the company, thus no major impact. 3. Effective use of financial leverage, thus creating relatively high profit.
| 1. Interest burden erodes the company's profitability. 2. Deterioration of financial structure and lowering of competitiveness. 3. Possible requirement for collaterals. 4. Pressure of repayment on maturity. | |
(2) Analysis of impact of various funding sources on the issuer's earnings per share in the current year
The common sources of funding for listed (OTC) companies are borrowings (including bank loans, issuance of ordinary corporate bonds and issuance of convertible corporate bonds), issuance of overseas depository receipts and issuance of new shares for cash. As the cost of issuing overseas depository receipts is relatively high and does not conform to economic benefit, it will not be considered. Furthermore since bank loans and issuance of ordinary corporate bonds have the same effect, this analysis will deal with three means of fundraising namely bank loan, issuance of convertible corporate bonds and issuance of new shares for cash. As since the current plan involves using the funds raised to repay bank loans, this means of fundraising will therefore not be considered. If the current fundraising is by way of issuance of ordinary corporate bonds, the company would be required to pay issuance interest together with guarantee cost and other processing expenses etc. Such interest expense will pose fixed annual interest burden. And they must be repaid at their due date. If at such time the industry's outlook deteriorates, they will have an impact on the company's financial deployment. Thus adoption of purely debt-based financing tools will, in addition to increasing the company's debt ratio and hence lead to increase in financial risk, also reduce the company's profitability as well as place a burden on the company's finance each year. All these run counter to the principle of steady operation, not to mention the likelihood of them affecting the company's credit worthiness, future financing cost, profitability and financial structure. Comparison of impact on 2017 earnings per share between issuance of convertible corporate bonds and issuance of new shares for cash:
Unit: (NT$1,000) Share
| Item | Cash capital increase | Convertible corporate bonds: (fully convertible) | Convertible corporate bonds: (partially convertible) |
| Amount of fund raised (NTD'000) (Note 1) | 10,290,000 | 10,290,000 | 10,290,000 |
| Fundraising tool interest (Note 2) | 0% | 0% | 0% |
| Financing cost (NTD'000) (Note 3) | — | — | — |
| Outstanding shares before fundraising (shares) (B) (Note 4) | 7,949,974,846 | 7,949,974,846 | 7,949,974,846 |
| Projected number of shares issued (Note 5) | 300,000,000 | 274,400,000 | — |
| 184 |
| Item | Cash capital increase | Convertible corporate bonds: (fully convertible) | Convertible corporate bonds: (partially convertible) |
| Outstanding shares after fundraising (shares)(C) | 8,249,974,846 | 8,224,374,846 | 7,949,974,846 |
| Maximum dilution of equity (Note 6)(D) | 3.64% | 3.34% | — |
| Maximum dilution of EPS (1-(1/1+D)) | 3.51% | 3.23% | — |
Note 1: The amount to be raised under the program is NTD10,290,000,000.
Note 2: Without considering issuing cost the financing cost of the respective financing tools is: Share issuance for cash 0%; convertible corporate bond 0%.
Note 3: If the full amount of NTD10,290,000,000 is raised by March 2017, the period for calculation of 2017 fundraising cost will be 9 months.
Note 4: The number of outstanding shares (i.e. shares in circulation) before the fundraising project is 7,949,974,846.
Note 5: The expected number of new shares to be issued is based on the assumption of issuance price of NTD34.30 per share. The conversion price for convertible corporate bonds during the conversion period is calculated based on NTD37.50 per share.
Note 6: Maximum dilution of equity= 1-(number of outstanding shares before fundraising/number of outstanding shares after fundraising) based on the assumption that original shareholders do not participate in the subscription of new ordinary shares issued for cash or convertible corporate bond.
A. Effect of dilution of EPS
Examination of the aforesaid fundraising tools based on their respective financing cost and effect of share capital expansion, the maximum dilution of EPS for issuance of new shares for cash is slightly higher than that for issuance of convertible corporate bonds, although the difference is marginal. However issuance of new shares for cash is a long-term funding source with the lowest financing cost. It can also immediately reduce debt ratio as well as raise the company's competitiveness such to reduce operating risk. Thus by considering the dilution of EPS of the respective tools, the current issuance of new shares for cash ought to be considered reasonable.
B. Impact on the issuer's financial burden
Except for issuance of new shares which is a equity-based financing tool and thus does not incur interest and is not encumbered with repayment principal upon maturity, all other aforesaid fundraising tools are debt-based fundraising tools. In the case of convertible corporate bonds, the company not only have to make payment of interest based on prescribed rate, but would also be subject to financing pressure brought about by re-purchase from the creditor or redemption by creditors at maturity. Thus fundraising through issuance of new shares for cash has the benefit of obtaining long-term, stable, low-cost financing. It can also reduce interest burden and strengthen financial structure. Although in the short term it will dilute earnings per share, in the long term it has the benefit of strengthening the company's finance. Therefore issuance of new shares for cash should be a relative better fundraising means since it reduces the company's financial risk.
C. Dilution of equity and impact on shareholder's equity
In terms of potential impact of dilution of equity, issuance of new shares for cash will cause equity to be diluted. There is no dilution of equity before holders of convertible corporate bonds exercise the conversion rights. During the exercise
| 185 |
period the holders can elect to exercise conversion at a relatively advantageous point in time. There is therefore a delay in the dilution of equity. With regard to the maximum dilution of equity for different fundraising tools (assuming that the original shareholders do not participate in subscription of new share issues or convertible corporate bonds), new share issue will have greater impact that convertible corporate bonds, although in such a case debt ratio will be lower than that if convertible corporate bonds are fully issued. Thus, new share issues can help improve financial structure, as well as avoid pressure on the company in relation to repayment of principal sum upon maturity of the corporate bonds. There are both reduced financial burden and financial risk. For the current issue, apart from being required by law to set aside 10% for employees' subscription as well as 10% for public subscription, the remaining shares are to be subscribed by shareholders on the shareholder's register on the benchmark date according to their shareholding percentage. As such dilution of equity is not as serious as in other cases. In the case of issuance of convertible corporate bonds, as they are usually sold to the public, any conversion by outside investors would result in greater dilution of equity. With regard to impact on shareholder equity, although the company's share capital will not increase immediately in the case of issuance of convertible corporate bonds, their financing cost is relatively high and can easily erode the company's profit. Moreover the fundraising exercise will only increase the company's liabilities and its net value will not immediately improved. There is therefore limited assistance to the company's sustainability. Conversely, share issue for cash will not only suitably improve the company's own capital and reduce its financial burden, but will even help it improve its competitiveness while reducing operating risk. Therefore in the long term existing shareholder equity has better protection.
5. For issuance of shares at below face value, explanation should be given with respect to the necessity and reasonableness of the company's issuance of new shares at discount, its reasons for not adopting other fundraising means and reasonableness thereof, and the amount of capital reserve or retained earnings that has been reduced: Not applicable.
(9) Describe the manner in which the issue price, conversion price, exchange price or subscription price is fixed: Please see Appendix 1: Calculation of Underwriting Price of Cash Subscription Shares
(10) Estimation of fund utilization and anticipated benefit
1. For acquisition of other companies, expansion or construction of immovable properties, plants and equipment, explanation should be given for projected increase in production and sale volume, value, cost structure (including total cost and unit cost), and changes in profitability, product quality improvement and other potential benefit after completion of share capital increase: Not applicable.
2. For re-investment in other companies, matters to be listed: Not applicable.
3. For complementing working capital, repayment of debts, matters to be listed:
(1) The amount due each year for the company's debts, repayment plan and projected reduction in financial burden, present status of working capital, amount of capital needed and projected utilization, with projected monthly cash income and expenses during the current and next one year:
A. The amount due each year for the company's debts, repayment plan and projected reduction in financial burden: Please refer to Sections 1 and 5 in the Prospectus, and Statement of Projected Cash Income and Expenses for 2016 and 2017.
| 186 |
B. Present status of working capital, amount of capital needed and projected utilization
Unit: NTD 1,000
| Item | January - November 2016 (Actual) | December 2016 ~ April 2017 (Estimated) | |
| Opening cash balance (A) | 8,533,346 | 1,319,683 | |
| Non-financing income (B) | 112,861,699 | 43,453,831 | |
| Non-financing expenses (C) | 128,799,788 | 34,406,371 | |
| Cash balance (minimum requirement) (D) | 1,500,000 | 1,500,000 | |
| Repayment of corporate debts (E) | 8,000,000 | - | |
| Repayment of bank loan (net amount) (F) | - | (29,593,919) | |
| Cash balance (shortfall) (A)+(B) - (C) - (D) +(E) +(F) | (16,904,743) | (20,726,776) | |
| Response. | Cash capital increase | -- | 10,290,000 |
| Issuance of ordinary corporate bonds | 9,000,000 | 8,000,000(Note) | |
| Bank loan (net amount) | 3,977,559 | - | |
Loan of borrowed funds to Related enterprise (net amount) | 3,746,866 | 3,367,000 | |
Note: The company issued the first unsecured ordinary corporate bonds of 2016 in accordance with the resolution of the Board of Directors on December 8, 2016. The total amount of the issue was no more than NTD8 billion. The funds are planned to be used for paying back bank loans. The company’s cash balance forecasts for 2016 and 2017 show that the company plans to issue the bonds in the 2017Q1. The predicted effect is based on the fact that long-term corporate bond yields are still quite low, so long-term corporate bonds will help mitigate the risk of rebounding yields in the future, thus locking in long-term capital for adjustments to the company’s financial structure.
It can be seen from the Table above that between December 2016 and April 2017, the company will have a working capital shortfall of NTD20,726,776,000. This figure is arrived at by taking the total of cash balance and non-financing income as at December 2016 amounting to NTD44,773,514,000 and deducting from it non-financing expenses and minimum cash balance required totaling NTD35,906,371,000 and projected repayment of bank loans totaling NTD29,593,919,000. If such capital shortfall were to be dealt with using bank loan, the company's operating risk will rise while its profit will be eroded. Thus to prevent interest expense burden, reduce its reliance on banks and improve its competitiveness, the company proposes to raise, through share issue for cash, the amount of NTD10,290,000,000, thereby using long-term fund to meet working capital shortfall. As such it is necessary. Following appraisal of the amount and time at which the company's fundraising program is fully implemented, and the cash requirements and time of cash shortfall as set out in the statement of projected cash income and expenses, no major irregularities have been discovered.
C. The Statement of Projected Cash Income and Expenses during the year of filing and the following year on a month-by-month basis:
| 187 |
Statement of Projected Cash Income and Expense in 2016
Unit: NT$ 1,000
| January | February | March | April | May | June | July | August | September | October | November | December | Total | |
| Opening cash balance | 8,533,346 | 11,825,732 | 14,277,654 | 4,701,645 | 2,504,141 | 1,476,831 | 3,520,040 | 1,218,698 | 1,202,531 | 2,656,750 | 2,410,613 | 1,319,683 | 8,533,346 |
| Add: Non-financing income | |||||||||||||
| Cash receipt for accounts receivable | 7,983,219 | 7,309,119 | 8,576,999 | 7,052,709 | 8,284,422 | 8,677,565 | 8,456,093 | 9,488,494 | 9,359,586 | 9,207,825 | 10,181,113 | 9,672,877 | 104,250,023 |
| Other income | 2,627,155 | 3,757,621 | 224,065 | 6,608,841 | |||||||||
| Others - sale of immovable property of Nantou Branch Company - Plant | 51,707 | 51,707 | |||||||||||
| Others - Handling of investment sum | 789,684 | 4,437,639 | 3,776,451 | 2,537,959 | 1,104,600 | 12,646,333 | |||||||
| Others - Disposal of equipment | 133,980 | 133,980 | |||||||||||
| Grand total 2 | 7,983,219 | 8,098,803 | 13,014,639 | 7,052,709 | 8,284,422 | 15,081,171 | 12,213,715 | 9,712,559 | 11,897,545 | 9,341,806 | 10,181,113 | 10,829,184 | 123,690,884 |
| Subtract: Non-financing expenses | |||||||||||||
| Accounts payable | 3,449,093 | 4,064,437 | 4,553,145 | 4,269,720 | 5,477,866 | 4,836,583 | 5,369,717 | 5,502,645 | 6,428,692 | 5,409,674 | 5,652,003 | 4,477,668 | 59,491,245 |
| Property, plant and equipment – Plant facilities | 262,603 | 211,890 | 101,435 | 140,042 | 120,586 | 102,156 | 150,448 | 191,290 | 146,588 | 182,308 | 147,217 | 105,303 | 1,861,865 |
| Property, plant and equipment – Machinery and equipment | 866,314 | 731,323 | 773,422 | 1,055,471 | 1,737,160 | 1,010,484 | 794,276 | 2,188,593 | 885,584 | 1,183,530 | 723,011 | 527,591 | 12,476,760 |
| Salary and remuneration in cash | 2,193,290 | 1,397,153 | 1,471,624 | 1,383,322 | 1,512,418 | 1,776,392 | 1,513,800 | 1,675,839 | 3,604,908 | 1,679,394 | 1,755,273 | 1,645,789 | 21,609,202 |
| Share dividend | 12,539,568 | 12,539,568 | |||||||||||
| Others - Investment | 4,505,252 | 13,240,877 | 4,169,036 | 4,410,830 | 146,903 | 1,104,600 | 27,577,499 | ||||||
| Grand total 3 | 11,276,553 | 6,404,804 | 20,140,503 | 11,017,591 | 8,848,030 | 7,725,615 | 12,239,070 | 9,558,367 | 23,752,244 | 9,559,506 | 8,277,504 | 6,756,351 | 135,556,139 |
| Required minimum cash balance 4 | 1,500,000 | 1,500,000 | 1,500,000 | 1,500,000 | 1,500,000 | 1,500,000 | 1,500,000 | 1,500,000 | 1,500,000 | 1,500,000 | 1,500,000 | 1,500,000 | 1,500,000 |
| Total funding needed 5 = 3+4 | 12,776,553 | 7,904,804 | 21,640,503 | 12,517,591 | 10,348,030 | 9,225,615 | 13,739,070 | 11,058,367 | 25,252,244 | 11,059,506 | 9,777,504 | 8,256,351 | 137,056,139 |
| Shortfall of available cash before fundraising 6 = 1+2 - 5 | 3,740,012 | 12,019,731 | 5,651,790 | (763,237) | 440,533 | 7,332,387 | 1,994,684 | (127,110) | (12,152,168) | 939,050 | 2,814,221 | 3,892,516 | (4,831,909) |
| Net amount raised | |||||||||||||
| Increase in loan | 9,000,000 | 9,000,000 | |||||||||||
| Repayment of loan | (8,000,000) | (8,000,000) | |||||||||||
| Issuance of corporate debt | 2,436,470 | 1,887,639 | 3,262,029 | 8,439,248 | 3,478,594 | 8,695,736 | 8,119,046 | 13,546,227 | 18,938,535 | 10,247,984 | 13,748,853 | 92,800,361 | |
| Repayment of corporate debt | (4,850,750) | (1,049,717) | (9,336,610) | (1,936,210) | (4,627,211) | (20,543,083) | (8,895,032) | (3,337,562) | (9,337,616) | (8,803,021) | (16,105,992) | (7,174,917) | (95,997,719) |
| Loan of borrowed money to related enterprises - Bank repayment | 7,033,687 | 4,839,000 | 5,935,930 | 10,355,000 | 8,565,750 | 6,655,840 | 23,584 | 3,467,000 | 46,875,790 | ||||
| Repayment of loans to related enterprises | (80,000) | (3,409,250) | (9,574,660) | (5,251,015) | (3,820,000) | (1,500,000) | (10,944,775) | (2,947,840) | (1,473,400) | (660,984) | (100,000) | (39,761,924) | |
| Grand total 7 | 6,585,720 | 757,922 | (2,450,145) | 1,767,378 | (463,701) | (5,312,347) | (2,275,986) | (170,359) | 13,308,919 | (28,437) | (2,994,539) | (3,807,917) | 4,916,508 |
| Closing cash balance 8 = 1 +2 - 3 + 7 | 11,825,732 | 14,277,654 | 4,701,645 | 2,504,141 | 1,476,831 | 3,520,040 | 1,218,698 | 1,202,531 | 2,656,750 | 2,410,613 | 1,319,683 | 1,584,599 | 1,584,599 |
| 188 |
Statement of Projected Cash Income and Expense in 2017
Unit: NT$ 1,000
| January | February | March | April | May | June | July | August | September | October | November | December | Total | |
| Opening cash balance | 1,584,599 | 1,549,213 | 1,591,374 | 10,772,828 | 2,430,224 | 2,345,839 | 2,346,088 | 2,380,238 | 2,428,291 | 2,372,298 | 2,355,915 | 2,387,038 | 1,584,599 |
| Add: Non-financing income | |||||||||||||
| Cash receipt for accounts receivable | 9,202,784 | 8,327,393 | 7,596,668 | 7,497,802 | 8,308,117 | 8,686,000 | 8,319,776 | 9,482,007 | 9,287,519 | 9,198,405 | 9,845,394 | 9,694,765 | 105,446,630 |
| Other income | 75,493 | 75,493 | |||||||||||
| Grand total 2 | 9,202,784 | 8,327,393 | 7,596,668 | 7,497,802 | 8,308,117 | 8,686,000 | 8,319,776 | 9,557,500 | 9,287,519 | 9,198,405 | 9,845,394 | 9,694,765 | 105,522,122 |
| Subtract: Non-financing expenses | |||||||||||||
| Accounts payable | 3,955,716 | 3,850,894 | 3,621,529 | 3,626,169 | 5,464,713 | 4,699,552 | 5,378,577 | 5,524,118 | 6,462,987 | 5,418,600 | 5,152,024 | 4,485,056 | 57,639,937 |
| Property, plant and equipment – Plant facilities | 221,071 | 53,028 | 178,110 | 37,470 | 5,095 | 20,814 | 7,507 | 5,252 | 4,470 | 4,762 | 5,829 | 5,066 | 548,475 |
| Property, plant and equipment – Machinery facilities | 3,122,204 | 441,038 | 972,304 | 337,329 | 127,540 | 111,244 | 151,986 | 98,534 | 113,595 | 139,993 | 91,722 | 99,454 | 5,806,943 |
| Salary and remuneration in cash | 2,295,789 | 1,645,789 | 1,645,789 | 1,645,789 | 1,794,156 | 1,527,542 | 1,528,938 | 1,692,597 | 3,640,957 | 1,696,188 | 1,662,247 | 1,662,247 | 22,438,030 |
| Share dividend | 12,539,568 | 12,539,568 | |||||||||||
| Grand total 3 | 9,594,781 | 5,990,749 | 6,417,732 | 5,646,758 | 7,391,504 | 6,359,152 | 7,067,008 | 7,320,501 | 22,761,577 | 7,259,544 | 6,911,822 | 6,251,824 | 98,972,953 |
| Required minimum cash balance 4 | 1,500,000 | 1,500,000 | 1,500,000 | 1,500,000 | 1,500,000 | 1,500,000 | 1,500,000 | 1,500,000 | 1,500,000 | 1,500,000 | 1,500,000 | 1,500,000 | 1,500,000 |
| Total funding needed 5 = 3+4 | 11,094,781 | 7,490,749 | 7,917,732 | 7,146,758 | 8,891,504 | 7,859,152 | 8,567,008 | 8,820,501 | 24,261,577 | 8,759,544 | 8,411,822 | 7,751,824 | 100,472,953 |
| Shortfall of available cash before fundraising 6 = 1+2 - 5 | (307,398) | 2,385,857 | 1,270,310 | 10,283,873 | 1,006,836 | 2,332,687 | 1,258,856 | 2,277,236 | (13,385,767) | 1,971,159 | 2,949,487 | 3,489,978 | 6,633,768 |
| Net amount raised | |||||||||||||
| Issuance of new shares for cash capital increase | 10,290,000 | 10,290,000 | |||||||||||
| Ordinary corporate bond issue | 8,000,000 | 8,000,000 | |||||||||||
| Bank loan increases | 3,230,000 | 13,418,065 | 16,648,065 | ||||||||||
| Bank repayments | (10,873,389) | (2,294,482) | (2,287,482) | (10,193,649) | (1,000,997) | (2,326,599) | (1,218,618) | (2,188,946) | (1,955,244) | (2,902,449) | (3,398,940) | (40,640,795) | |
| Loan of borrowed money to related enterprises - Bank repayment | 3,563,124 | 4,576,200 | 7,164,120 | 8,791,800 | 8,521,200 | 7,984,640 | 3,467,000 | 44,068,084 | |||||
| Repayment of loans to related enterprises | (3,563,124) | (4,576,200) | (7,164,120) | (8,791,800) | (8,521,200) | (7,984,640) | (3,467,000) | (44,068,084) | |||||
| Grand total 7 | 356,611 | (2,294,482) | 8,002,518 | (10,193,649) | (1,000,997) | (2,326,599) | (1,218,618) | (2,188,946) | 13,418,065 | (1,955,244) | (2,902,449) | (3,398,940) | (5,702,730) |
| Closing cash balance 8 = 1 +2 - 3 + 7 | 1,549,213 | 1,591,375 | 10,772,828 | 2,430,224 | 2,345,839 | 2,346,088 | 2,380,238 | 2,428,291 | 2,372,298 | 2,355,915 | 2,387,038 | 2,431,038 | 2,431,038 |
| 189 |
(2) With regard to the company's policy for collection of accounts receivable and payment of accounts payable, capital expenses plan, financial leverage and debt ratio (or ratio of own assets and risk assets) during the current year and the next one year, explanation should be give for reasons for repayment of debt or supplementing working capital.
A. Company's policy for collection of accounts receivable and payment of accounts payable
The company's main cash in-flow consists of cash receipts of accounts receivable. Its main expenses consist of purchase of raw materials and manufacturing cost. The company's policy for accounts receivable involves consideration of the customer's financial structure, credit status, operating scale, past dealings, economic situation of the respective sales regions and market competition, with appropriate credit limit and collection terms assigned to customers. For collection of money from sale of goods, in the company's financial reports for fiscal years 2014 and 2015 the term for accounts receivable is respectively 68 days and 73 days. There is no major deviation from credit term for the company's sale to general customers which is 30~90 days. Thus the number of days for cash receipts in the company's estimated accounts receivable for 2016 and 2017 should be reasonable, since they are compiled based on credit term for ordinary customers. With regard to purchases the company's policy for payment of accounts payable differs depending the vendor's scale, nature and raw materials market. According to the company's financial reports for fiscal years 2014 and 2015 the term for accounts payable is 42 days. There is no major deviation from credit term for the company's accounts payable which is 45 days. As such the estimate should be considered reasonable. Based on the aforesaid the company has, in keeping with its accounts receivable and payable policies and taking into consideration past and current trading terms, projected its cash receipts and payments for the respective months based on empirical principles for compilation of its cash receipt and payment table. The basis and assumption for its compilation are reasonable.
B. Capital expenses plan and long-term investment plan
In the Company's capital plan for 2016-2017, the expenses for the period January-November 2016 are based on its actual payments. The main items consist of purchase of operating machinery and equipment and related plant affairs. The capital expense plan from December 2016 to December 2017 consists mainly purchase of machinery and equipment, repair and maintenance of plants etc. Upon review it has been found that there have no major disparities in the Company's projected income and expenses for the respective months in 2016 and 2017. As such their compilation is considered reasonable.
Furthermore the Company's long-term investment in January to November 2016 consisted mainly of investment in currencies to obtain fixed return. The Company utilizes its own funds to obtain shareholding in Siliconware Precision Industries and that from its American depository receipts to increase its shareholding in Siliconware. In view of stable operation and performance of Siliconware, the Company expects to obtain long-term, steady investment return. The company also acquired special shares in Deca Technologies Inc. in order to strengthen its deployment in Fan-out WLP technology, thus strengthening the parternship relationship. There are no further plans for long-term investments between December 2016 and the end of December 2017.
C. Financial leverage and debt ratio
| 190 |
Year Item | 103.12.31 (Before fundraising) | 104.12.31 (Before fundraising) | 105.09.30 (Before fundraising) | 2016 (Estimation) (Note) | 2017 (Estimation) (Note) |
| Financial leverage (multiple) | 1.06 | 1.09 | 1.11 | 1.10 | 1.14 |
| Debt ratio (%) | 42.60 | 48.71 | 51.66 | 49.23 | 41.13 |
Source: 2014–2015 financial reports inspected and certified by a CPA.
Note: Projection based on individual 2016Q3 financial report
The higher a company's financial leverage, the greater the percentage of its interest expense in relation to its operating profit, and the greater its financial risk. Thus financial leverage operation requires one to consider the safety of one's financial structure as well as liquidity and convertibility of its assets. The company's issuance of new shares for cash to repay its bank loans means it can save on interest expense, thus preventing such expense from eroding its profit. The company’s degree of financial leverage for 2014-2015 and the first three quarters of 2016 are 1.06, 1.09, and 1.11 respectively. In 2015 due to the issuance of the fourth foreign unsecured convertible corporate bonds and additional bank loans to meet its need for working capital, financial leverage rose to 1.09; in the first three quarters of 2016 the financial leverage rose marginally to 1.11 due to the issuance of ordinary corporate bonds and increase in interest for long and short-term loans taken to fulfill the need for working capital. The company plans to issue the first unsecured ordinary corporate bonds for 2016 in January 2017, in consideration of the fact long-term corporate bond yields are still quite low, so long-term corporate bonds will help mitigate the risk of rebounding yields in the future, thus locking in long-term capital for adjustments to the company’s financial structure. Upon repayment of part of the company's bank loans following its fundraising plan, the company's financial leverage at year-end 2017 is at 1.14 times. It has been determined that if the company does not raise funds through issuance of new shares, and instead raises its working capital through loans from financial institutions, its interest burden will increase and its financial structure will deteriorate. The current issuance of new shares will enable the company to obtain long-term funds, reduce the impact of interest expense on its profit, as well as having a positive impact on the company's financial leverage.
Furthermore, the company's debt ratio for 2014~end 2015 and 2016Q3 is 42.60%, 48.71% and 51.66% respectively, demonstrating a rising trend. This is mainly because of the company's 2015 issuance of fourth foreign unsecured convertible corporate bonds and 2016Q1 issuance of unsecured ordinary corporate bonds as well as additional bank loans to meet its need for working capital. If the company then uses long and short-term loans to meet its needs, its financial structure consisting of high interest burden and relatively high debt ratio will directly affect its ability to flexibly use its working capital and its stability, thus increasing its financial risk. If the economic outlook turns worse or its operating environment deteriorates, the company will have even greater financial risk. For the above reasons the company has decided to undertake issue of new shares for cash in order to raise medium and long-term funding. It expects that after the fundraising its debt ratio as at the end of 2017 will drop to 41.10%, a significant improvement compared with 51.66% during the first three quarters of 2016. The company expects to improve its debt-repayment ability and reduce its financial risk.
(3) Explanation should be given to the use of the original loans and achievement of benefit if the fundraising plan is for repayment of debts
| 191 |
For the current fund utilization plan, the company expects to use NTD10,290,000,000 to repay bank loans. The following sets out details of bank loans to be repaid:
Unit: NT$ 1,000
| Lending institution | Interest rate | Contract Period | Original loan purpose | Original loan amount | Proposed repayment amount in 2017Q2 | Reduced interest expense | |
2017 (Note) | 2018 | ||||||
| Standard Chartered Bank | 0.91% | 2016.08.01~2018.08.01 | Working capital | 3,290,000 | 3,290,000 | 22,454 | 29,939 |
| DBS Bank | 0.90% | 2016.08.12~2019.08.11 | Working capital | 4,330,000 | 2,400,000 | 16,200 | 21,600 |
| HSBC Bank | 0.93% | 2016.10.27~2018.10.26 | Working capital | 4,600,000 | 4,600,000 | 32,085 | 42,780 |
| Total | 12,220,000 | 10,290,000 | 70,739 | 94,319 | |||
Note: The company expects that following completion of fundraising in March 2017 it will utilize the funds to repay bank loans in April 2017, thus saving interest expense for April ~ December 2017.
jNecessity and reasonableness of the endorsement or guarantee.
It can be seen from the above Table that the company's current fundraising plan is for proposed repayment of bank loans which have been used for its working capital. Owing to poor performance of the semiconductor assembly and testing industry in 2015 due to weak demand for terminal devices, as well as adjustment by upstream customers in their inventory and intensifying market competition the company's operating income in 2015 showed slight decline compared to that in 2014. Owing to weak seasonal demand during the first half of 2016 and lack of terminal devices for the semiconductor industry, the company’s operating income showed modest decline. With traditional peak season during the second half of 2016 and sustained demand for smart phones, the company’s income rose during the third quarter. To maintain its normal operation and continue expanding its business scale the company had to seek working capital from financial institutions. Therefore it was necessary and reasonable for the company to undertake the original loans.
kBenefit of original loans
The bank loans which the company proposes to repay following the current fundraising plan were necessary to meet its operating needs. Poor performance of the semicondutor assembly and testing industry in 2015 due to weak demand for terminal devices, as well as adjustment by upstream customers in their inventory and intensifying market competition meant that the company's operating income in 2015 suffered a slight decline compared to that in 2014. Owing to weak seasonal demand during the first half of 2016 and lack of terminal devices for the semiconductor industry, the company’s operating income showed modest decline. With traditional peak season during the second half of 2016 and sustained demand for smart phones, the company’s income rose on quarterly basis. To maintain its
| 192 |
normal operation and continue expanding its business it was necessary for the company to obtain working capital from financial institutions. Together with the company's prudent use of its funds, the company's net profit after tax during the first three quarters of 2016 has been steadily growing. Thus the company had benefited from such loans.
(4) If as shown in the Statement of Projected Cash Income and Expenses there are major capital expenses and long-term equity investment which together make up 60% of the fund raised, explanation should be given to their necessity, expected source of fund and benefit:
This fundraising program is projected at NTD10,290,000,000. The company's monthly statements of projected cash income and expenses from December 2016 to December 2017 show that there are no plans for long-term investments; future major capital expenses comprise primarily of general machinery equipment and the procurement, repair, and maintenance of relevant factory works which together make up 60% of the funds raised with NTD653.778 million in factory works, NTD6.334534 billion in machinery equipment for a total of NTD6.988312 billion. The fund sources, usages, and anticipated benefits of these expenses are described below.
From December 2016 to December 2017 in the Company’s cash balance forecast, capital outflow primarily comprises the procurement, repair, and maintenance of general machinery, factory operations, environmental equipment, and related ancillary facilities. This includes NTD653.778 million for factory operations and NTD6.334534 billion for machinery, for a total of NTD6.988312 billion. which are conducted in response to the demands of daily operations and optimization of existing production lines. These measures will in turn improve the product quality and production efficiency of the Company and furthermore reduce production costs and reinforce product competitiveness, and are deemed as indispensable. The necessary funds will be provided by the Company internally.
With regard to other anticipated benefits, general factory works primarily support the normal operations of respective plants and take form in factory facilities such as utilities piping and the procurement, replacement, and maintenance of engineering and ancillary equipment, which contribute toward the improvement of efficiency in daily operations but the benefits of which are intangible and therefore unable to exhibit benefits in the form of revenue or profit increase.
Additionally, in view of the Company’s continuous improvements in packaging and testing technical capacities and the ageing and expired durability of production machinery equipment on an annual basis, routine expenses in the form of repairs, replacements and equipment procurement are incurred annually to maintain the production efficiency and output yield of existing equipment. The benefits of these expenses are to sustain Company production capacity, thereby improving the Company’s technical capabilities and maintaining its industry competitiveness. Projected replacement and routine maintenance costs are approximately NTD1.353954 billion, do not contribute as newly increased production capacity, and as a result will not generate additional revenue or profit.
From December 2016 to December 2017 in the Company’s cash balance forecast includes regular maintenance, replacement, and procurement of environmental equipment and related ancillary facilities, for a total of NTD1.242715 billion. This is expected to continue to improve productivity and maintain existing policies towards environmental protection. It will also help reduce costs and improve the Company’s public image. The predicted reductions in
| 193 |
costs due to these environmental procurements will add NTD101.855 million annually to the Company’s net income.
In terms of newly added production equipment costing approximately NTD3.737865 billion, future anticipated benefits on an annual basis and basis of estimate are as described below.
jProduction volume and sales volume
The machinery equipment procured by the Company under this program will be installed and launched for operations on a progressive and ongoing basis and is scheduled to go into mass production in 2017 Q1. Production volume and sales volume are compositely projected by the Company according to past production process experiences, utilization rate, point in time machinery equipment go into mass production, and anticipated major client orders in the coming year in conjunction with future market demand forecasts provided by professional market research institutions. It is estimated that the Company will experience an increase of 192000000 units each in production and sales volumes from 2017 – 2020. In view of the above, the Company’s estimates in production and sales volumes are conducted by referencing the normal production capacities of similar type production equipment currently in use, mass production experiences, level of supplier cooperation and other relevant factors in conjunction with projected schedules for the procurement, installation, trial testing, inspection and acceptance of new machinery and their launch into mass production as well as factors such as future market supply and demand.
kOperation revenue
The estimated sales value of machinery equipment procured by the Company under this program are projected according to past production experiences, point in time in which equipment is scheduled to go into production, production utilization rate in conjunction with future market demand for the estimation of production and sales volumes. Unit price is estimated according to the average unit price of similar products currently manufactured by the Company in consideration of future product price fluctuations. It is estimated that from 2017 to 2020 the Company will experience an increase of NTD11.366078 billion in operating revenue.
ƒGross operating income and net operating income
In terms of gross operating income estimates, the Company adopts the average income ratio contributed by procured machinery equipment as the basis of calculation in conjunction with the impact of market price fluctuations. Based on these premises it is estimated that from 2017 to 2020 the Company will experience an increase of NTD3.973955 billion in gross operating income, which is deemed a reasonable projection. In terms of operating profit, the Company adopts the operating cost ratio of packaging and testing products of approximately 12% over the past year as the basis of calculation. Based on this premise from 2017 to 2020 the Company will experience an increase of NTD2.610026 billion in net operating income.
mFund recovery period
In the Company’s statements of projected cash income and expenses, with regard to the portion of newly added equipment in major capital expenses from December 2016 to December 2017, the projects amount is approximately
| 194 |
NTD3.737865 billion. If depreciation costs are added in accordance with operating profit, the estimated fund recovery period is 4 years.
4. With respect to purchase of land for construction, payment of construction cost or contractors' charges, details of such undertaking from the time of purchase to the completion of sale of construction project or contractors' work in terms of the total amount, source of funds covering any shortfall and funding of the respective stages and construction progress, with the time and amount involved for booking profit or loss and explanation on anticipated benefit: Not applicable.
5. In the case of purchase of incomplete works and assumption of contracts unfulfilled by the seller, details on the reasons for assignment by the seller, basis for determination of assignment price and impact of assignment on the contractual parties' rights and duties: Not applicable.
3. Assignment of new shares issued by other companies: Not applicable.
Matters that should be reported for the current issuance of new shares in connection with acquisition or merger: Not applicable.
| 195 |
IV. Financial Summary
| A. | Financial information for the most recent 5 fiscal years (note) |
(1) Condensed balance sheet and consolidated profit and loss statement
1. Condensed balance sheet - International Financial Reporting Standards (consolidated financial report)
Unit: NT$ 1,000
Year Item | Financial information for the most recent 5 fiscal years (note) | Financial information for current year until September 30, 2016 | |||||
| 2011 | 2012 | 2013 | 2014 | 2015 (after adjustment) | |||
| Current assets | N/A | 97,495,577 | 132,176,482 | 159,955,190 | 156,732,840 | 143,369,196 | |
| Financial assets available for use - non-current | 1,096,709 | 1,140,329 | 941,105 | 924,362 | 1,103,939 | ||
| Investment accounted for using equity method | 1,177,871 | 1,216,201 | 1,492,441 | 37,141,552 | 49,515,448 | ||
| Property, plant and equipment | 127,197,774 | 131,497,331 | 151,587,115 | 149,997,075 | 145,208,855 | ||
| Intangible assets | 12,361,269 | 11,953,644 | 11,913,286 | 11,888,612 | 12,217,117 | ||
| Other assets | 8,380,569 | 8,829,919 | 8,095,630 | 8,321,759 | 9,213,165 | ||
| Total assets | 247,709,769 | 286,813,906 | 333,984,767 | 365,006,200 | 360,627,720 | ||
| Current liabilities | Pre-distribution | 84,668,133 | 100,835,276 | 111,199,467 | 120,502,072 | 118,397,190 | |
| Post-distribution | 92,656,107 | 110,991,281 | 126,789,292 | 132,978,851 | N/A | ||
| Non-current liabilities | 52,089,877 | 58,813,671 | 64,347,296 | 76,365,603 | 81,013,087 | ||
| Total liabilities | Pre-distribution | 136,758,010 | 159,648,947 | 175,546,763 | 196,867,675 | 199,410,277 | |
| Post-distribution | 144,745,984 | 169,804,952 | 191,136,588 | 209,344,454 | N/A | ||
| Equity attributable to the parent company's owner | 107,430,340 | 123,020,621 | 150,218,907 | 156,634,647 | 150,158,984 | ||
| Share capital | 76,047,667 | 78,180,258 | 78,715,179 | 79,185,660 | 79,509,050 | ||
| Capital reserve | 5,262,129 | 7,908,870 | 16,013,058 | 23,757,099 | 22,461,952 | ||
| Retained earnings | Pre-distribution | 30,938,400 | 38,993,154 | 52,381,238 | 55,902,712 | 57,135,885 | |
| Post-distribution | 22,950,426 | 28,837,149 | 36,791,413 | 43,425,933 | N/A | ||
| Other interests | (2,858,749) | (102,554) | 5,068,539 | 5,081,689 | (1,655,390) | ||
| Treasury stock | (1,959,107) | (1,959,107) | (1,959,107) | (7,292,513) | (7,292,513) | ||
| Non-controlling interests | 3,521,419 | 4,144,338 | 8,219,097 | 11,503,878 | 11,058,459 | ||
| Total equity | Pre-distribution | 110,951,759 | 127,164,959 | 158,438,004 | 168,138,525 | 161,217,443 | |
| Post-distribution | 102,963,785 | 117,008,954 | 142,848,179 | 155,661,746 | N/A | ||
Source: Financial report inspected and certified by a CPA.
Note: Where the financial information prepared according to International Financial Reporting Standards is less than 5 years, financial statements prepared according to local financial standards should be separately provided.
| 196 |
2. Condensed balance sheet - International Financial Reporting Standards (individual financial report)
Unit: NT$ 1,000
Year Item | Financial information for the most recent 5 fiscal years (note) | |||||
| 2011 | 2012 | 2013 | 2014 | 2015 | ||
| Current assets | N/A | 17,849,645 | 37,009,050 | 41,483,018 | 32,132,019 | |
| Financial assets available for use (Note 2) - non-current | 521,999 | 592,557 | 542,147 | 473,107 | ||
Investment accounted for (Note 2)
using equity method
| 109,255,920 | 117,942,583 | 139,053,527 | 189,994,170 | ||
| Property, plant and equipment | 58,271,665 | 63,122,172 | 77,640,995 | 80,375,695 | ||
| Intangible assets | 1,338,972 | 1,352,379 | 1,444,812 | 1,614,309 | ||
| Other assets | 1,629,169 | 1,327,293 | 1,562,646 | 1,353,638 | ||
| Total assets (Note 2) | 188,867,370 | 221,346,034 | 261,727,145 | 305,942,938 | ||
| Current liabilities | Pre-distribution | 42,827,937 | 49,159,136 | 68,567,745 | 91,305,117 | |
| Post-distribution | 50,815,911 | 59,315,141 | 84,157,570 | 103,781,896 | ||
| Non-current liabilities | 38,609,093 | 49,242,041 | 42,940,493 | 57,721,817 | ||
| Total liabilities | Pre-distribution | 81,437,030 | 98,401,177 | 111,508,238 | 149,026,934 | |
| Post-distribution | 89,425,004 | 108,557,182 | 127,098,063 | 161,503,713 | ||
| Equity attributable to the company's owner | ─ | ─ | ─ | ─ | ||
| Share capital | 76,047,667 | 78,180,258 | 78,715,179 | 79,185,660 | ||
| Capital reserve | 5,262,129 | 7,920,220 | 16,013,058 | 23,757,099 | ||
| Retained earnings (Note 2) | Pre-distribution | 30,938,400 | 38,906,102 | 52,381,238 | 56,184,069 | |
| Post-distribution | 22,950,426 | 28,750,097 | 36,791,413 | 43,707,290 | ||
| Other interests | (2,858,749) | (102,616) | 5,068,539 | 5,081,689 | ||
| Treasury stock | (1,959,107) | (1,959,107) | (1,959,107) | (7,292,513) | ||
| Non-controlling interests | ─ | ─ | ─ | ─ | ||
| Total equity (Note 2) | Pre-distribution | 107,430,340 | 122,944,857 | 150,218,907 | 156,916,004 | |
| Post-distribution | 99,442,366 | 102,788,852 | 134,629,082 | 144,439,225 | ||
Source: Financial report inspected and certified by a CPA.
Note 1: Where the financial information prepared according to International Financial Reporting Standards is less than 5 years, financial statements prepared according to local financial standards should be separately provided.
Note 2: As at September 30, 2016 the company has completed identification of the difference between its investment cost and the net fair value of identifiable assets and liabilities of Siliconware Precision Industries Co., Ltd. following which it has made retrospective adjustments to its 2015 financial statement. After adjustments the company's investment accounted for using equity method is NTD189,712,813,000, total assets NTD305,661,581,000, retained earnings before distribution NTD55,902,712,000, retained earnings after distribution NTD43,425,933,000, total equity before distribution NTD156,634,647,000 and total equity after distribution NTD144,157,868,000.
| 197 |
3. Condensed balance sheet - Local Accounting Standards (consolidated)
Unit: NT$ 1,000
Year Item | Financial information for the most recent 5 fiscal years (note) | |||||
| 2011 | 2012 | 2013 | 2014 | 2015 | ||
| Current assets | 90,131,690 | 98,042,323 | N/A | |||
| Fund and investment | 2,220,728 | 2,365,931 | ||||
| Fixed assets | 111,779,036 | 126,150,296 | ||||
| Intangible assets | 15,772,415 | 15,801,845 | ||||
| Other assets | 3,974,226 | 4,143,720 | ||||
| Total assets | 223,878,095 | 246,504,115 | ||||
| Current liabilities | Pre-distribution | 66,761,885 | 84,703,409 | |||
| Post-distribution | 71,087,169 | 92,691,383 | ||||
| Long-term liabilities | 50,425,156 | 44,591,685 | ||||
| Other liabilities | 4,408,560 | 4,749,953 | ||||
| Total liabilities | Pre-distribution | 121,595,601 | 134,045,047 | |||
| Post-distribution | 125,920,885 | 142,033,021 | ||||
| Share capital | 67,571,325 | 76,047,667 | ||||
| Capital reserve | 7,397,481 | 8,767,134 | ||||
| Retained earnings | Pre-distribution | 27,809,126 | 26,969,183 | |||
| Post-distribution | 23,483,842 | 18,981,209 | ||||
| Unrealized profit and loss for financial products | 235,088 | 401,938 | ||||
| Cumulative conversion adjustments | 3,353,938 | 119,987 | ||||
Unrecognized pension fund Net loss for cost | (465,681) | (831,917) | ||||
Shareholder equity Total | Pre-distribution | 101,169,536 | 109,514,885 | |||
| Post-distribution | 96,844,252 | 101,526,911 | ||||
Source: Financial report inspected and certified by a CPA.
Note: For fiscal years 2013-2016 the company's financial reports are compiled in accordance with International Financial Reporting Standards (IFRS), therefore there are no financial reports that have been compiled in accordance with local accounting standards.
| 198 |
4. Condensed balance sheet - Local Accounting Standards (individual financial report)
Unit: NT$ 1,000
Year Item | Financial information for the most recent 5 fiscal years (note) | |||||
| 2011 | 2012 | 2013 | 2014 | 2015 | ||
| Current assets | 17,147,117 | 18,147,566 | N/A | |||
| Fund and investment | 106,619,178 | 110,891,285 | ||||
| Fixed assets | 44,897,565 | 57,233,865 | ||||
| Intangible assets | 1,023,803 | 1,222,757 | ||||
| Other assets | 1,390,944 | 1,505,088 | ||||
| Total assets | 171,078,607 | 189,000,561 | ||||
| Current liabilities | Pre-distribution | 31,159,171 | 42,712,691 | |||
| Post-distribution | 35,484,455 | 50,700,665 | ||||
| Long-term liabilities | 37,453,501 | 34,625,670 | ||||
| Other liabilities | 1,296,399 | 2,147,315 | ||||
| Total liabilities | Pre-distribution | 69,909,071 | 79,485,676 | |||
| Post-distribution | 74,234,355 | 87,473,650 | ||||
| Share capital | 67,571,325 | 76,047,667 | ||||
| Capital reserve | 7,397,481 | 8,767,134 | ||||
| Retained earnings | Pre-distribution | 27,809,126 | 26,969,183 | |||
| Post-distribution | 14,167,847 | 18,981,209 | ||||
| Unrealized profit and loss for financial products | 235,088 | 401,938 | ||||
| Cumulative conversion adjustments | 3,353,938 | 119,987 | ||||
Unrecognized pension fund Net loss for cost | (465,681) | (831,917) | ||||
Shareholder equity Total | Pre-distribution | 109,514,885 | 101,169,536 | |||
| Post-distribution | 101,526,911 | 96,844,252 | ||||
Source: Financial report inspected and certified by a CPA.
Note: For fiscal years 2013-2016 the company's financial reports are compiled in accordance with International Financial Reporting Standards (IFRS), therefore there are no financial reports that have been compiled in accordance with local accounting standards.
| 199 |
5. Condensed profit and loss statement - International Financial Reporting Standards (consolidated)
Unit: Except for earnings per share which are denominated in NTD, all other figures are expressed in NTD'000.
Year Item | Financial information for the most recent 5 fiscal years (note) | Financial information for current year until September 30, 2016 | ||||
| 2011 | 2012 | 2013 | 2014 | 2015 | ||
| Operating revenue | N/A | 193,972,392 | 219,862,446 | 256,591,447 | 283,302,536 | 197,755,474 |
| Gross profit | 36,619,812 | 42,813,744 | 53,588,529 | 50,135,228 | 37,817,099 | |
| Operating profits | 17,687,085 | 22,044,323 | 29,645,869 | 24,884,622 | 18,575,572 | |
| Non-operating revenue and gains (Note 2) | (1,102,770) | (2,687,631) | (1,097,658) | 403,631 | (203,571) | |
| Net profit before tax (Note 2) | 16,584,315 | 19,356,692 | 28,548,211 | 25,288,253 | 18,372,001 | |
Continuing operations Current period net profit (Note 2) | 13,523,583 | 16,155,040 | 24,281,585 | 20,449,007 | 14,555,214 | |
| Loss on units which cease operations | ─ | ─ | ─ | ─ | ─ | |
| Current period net profit (Note 2) | 13,523,583 | 16,155,040 | 24,281,585 | 20,449,007 | 14,555,214 | |
Other consolidated profit and loss during current period (Net after tax) | (3,823,690) | 3,238,026 | 5,503,510 | (147,547) | (7,331,544) | |
| Total consolidated profit and loss during current period (Note 2) | 9,699,893 | 19,393,066 | 29,785,095 | 20,301,460 | 7,223,670 | |
Net profit attributable to Owner of the Company (Note 2) | 13,066,075 | 15,689,074 | 23,636,522 | 19,478,873 | 13,715,836 | |
Net profit attributable to Non-controlling interests | 457,508 | 465,966 | 645,063 | 970,134 | 839,378 | |
Total consolidated profit and loss attributable to Owner of the Company | 9,301,863 | 18,798,923 | 28,802,296 | 19,405,806 | 6,978,757 | |
Total consolidated profit and loss attributable to Non-controlling interests | 398,030 | 594,143 | 982,799 | 895,654 | 244,913 | |
| Earnings per share (retroactive adjustment) (Note 2) | 1.75 | 2.09 | 3.07 | 2.55 | 1.79 | |
Source: Financial report inspected and certified by a CPA.
Note 1: Where the financial information prepared according to International Financial Reporting Standards is less than 5 years, financial statements prepared according to local financial standards should be separately provided.
Note 2: As at September 30, 2016 the company has completed identification of the difference between its investment cost and the net fair value of identifiable assets and liabilities of Siliconware Precision Industries Co., Ltd. following which it has made retrospective adjustments to its 2015 financial statement. Following adjustments non-operating income and expenses are NTD122,274,000, net profit before tax NTD25,006,896,000, net profit during current period for continuing operations NTD20,167,650,000, net profit during current period NTD20,167,650,000, total consolidated profit and loss during current period NTD20,020,103,000, net profit attributable to owner of the Company NTD19,197,516,000, total consolidated profit and loss attributable to the Company NTD19,124,449,000 and earning per share (with retroactive adjustment) are NTD2.51.6. Condensed consolidated profit and loss statement - International Financial Reporting Standards(individual financial report)
| 200 |
Unit: Except for earnings per share which are denominated in NTD, all other figures are expressed in NTD'000.
Year Item | Financial information for the most recent 5 fiscal years (note) | ||||
| 2011 | 2012 | 2013 | 2014 | 2015 | |
| Operating revenue | N/A | 72,926,652 | 82,329,117 | 96,678,100 | 94,206,807 |
| Gross profit | 18,324,545 | 22,264,748 | 29,376,669 | 25,147,806 | |
| Operating profits | 10,653,147 | 12,936,797 | 18,278,988 | 13,892,786 | |
| Non-operating revenue and gains (Note 2) | 3,906,755 | 4,458,346 | 7,882,138 | 8,540,566 | |
| Net profit before tax (Note 2) | 14,559,902 | 17,395,143 | 26,161,126 | 22,433,352 | |
Continuing operations Current period net profit (Note 2) | 13,066,075 | 15,689,074 | 23,636,522 | 19,478,873 | |
| Loss on units which cease operations | ─ | ─ | ─ | ─ | |
| Current period net profit (Note 2) | 13,066,075 | 15,689,074 | 23,636,522 | 19,478,873 | |
Other consolidated profit and loss during current period (Net after tax) | (3,764,212) | 3,109,849 | 5,165,774 | (73,067) | |
| Total consolidated profit and loss during current period (Note 2) | 9,301,863 | 18,798,923 | 28,802,296 | 19,405,806 | |
Net profit attributable to Owner of the Company | ─ | ─ | ─ | ─ | |
Net profit attributable to Non-controlling interests | ─ | ─ | ─ | ─ | |
Total consolidated profit and loss attributable toOwner of the Company | ─ | ─ | ─ | ─ | |
Total consolidated profit and loss attributable toNon-controlling interests | ─ | ─ | ─ | ─ | |
| Earnings per share (retroactive adjustment) (Note 2) | 1.75 | 2.09 | 3.07 | 2.554 | |
Source: Financial report inspected and certified by a CPA.
Note 1: Where the financial information prepared according to International Financial Reporting Standards is less than 5 years, financial statements prepared according to local financial standards should be separately provided.
Note 2: As at September 30, 2016 the company has completed identification of the difference between its investment cost and the net fair value of identifiable assets and liabilities of Siliconware Precision Industries Co., Ltd. following which it has made retrospective adjustments to its 2015 financial statement. Following adjustments non-operating income and expenses are NTD8,259,209,000, net profit before tax NTD22,151,995,000, net profit during current period for continuing operations NTD19,197,516,000, net profit during current period NTD19,197,516,000, total consolidated profit and loss during current period NTD19,124,449,000, and earning per share (with retroactive adjustment) are NTD2.51.
| 201 |
7. Condensed profit and loss statement - Local Accounting Standards (consolidated)
Unit: Except for earnings per share which are denominated in NTD, all other figures are expressed in NTD'000.
Year Item | Financial information for the most recent 5 fiscal years (note) | ||||
| 2011 | 2012 | 2013 | 2014 | 2015 | |
| Operating revenue | 185,347,206 | 193,972,392 | N/A | ||
| Gross profit | 35,008,803 | 36,623,770 | |||
| Operating profits | 16,821,251 | 17,761,382 | |||
| Non-operating revenue and profit | 3,058,708 | 2,435,229 | |||
| Non-operating expenses and losses | 2,882,798 | 3,606,075 | |||
| Profit and loss before tax for units as continuing operations | 16,997,161 | 16,590,536 | |||
| Profit and loss for units as continuing operations | 13,978,949 | 13,548,908 | |||
| Profit and loss for units which cease operations | ─ | ─ | |||
| Non-operating profit and loss | ─ | ─ | |||
Cumulative effect of changes in Accounting principles | ─ | ─ | |||
| Current period net profit | 13,978,949 | 13,548,908 | |||
Earnings per share (retroactive adjustment) (NTD) | 1.83 | 1.76 | |||
Source: Financial report inspected and certified by a CPA.
Note: For fiscal years 2013-2016 the company's financial reports are compiled in accordance with International Financial Reporting Standards (IFRS), therefore there are no financial reports that have been compiled in accordance with local accounting standards.
6. Condensed profit and loss statement - Local Accounting Standards(individual financial report)
Unit: Except for earnings per share which are denominated in NTD, all other figures are expressed in NTD'000.
Year Item | Financial information for the most recent 5 fiscal years (note) | ||||
| 2011 | 2012 | 2013 | 2014 | 2015 | |
| Operating revenue | 69,439,165 | 72,926,652 | N/A | ||
| Gross profit | 17,720,164 | 18,365,510 | |||
| Operating profits | 10,859,132 | 10,732,774 | |||
| Non-operating revenue and profit | 6,298,044 | 5,659,159 | |||
| Non-operating expenses and losses | 2,104,588 | 1,806,747 | |||
| Profit and loss before tax for units as continuing operations | 15,052,588 | 14,585,186 | |||
| Profit and loss for units as continuing operations | 13,725,958 | 13,091,359 | |||
| Profit and loss for units which cease operations | ─ | ─ | |||
| Non-operating profit and loss | ─ | ─ | |||
Cumulative effect of changes in Accounting principles | ─ | ─ | |||
| Current period net profit | 13,725,958 | 13,091,359 | |||
| Earnings per share (retroactive adjustment) | 1.83 | 1.76 | |||
Source: Financial report inspected and certified by a CPA.
Note: For fiscal years 2013-2016 the company's financial reports are compiled in accordance with International Financial Reporting Standards (IFRS), therefore there are no financial reports that have been compiled in accordance with local accounting standards.
| 202 |
(2)Changes which affect the above condensed financial statements' consistency such as accounting changes, merger of companies or cessation of business units and their impact on the current year's financial reports: None.
(3) Names of auditors and audit opinions of the most recent 5 fiscal years
1. List the name of certified public accountants who have audited the company's accounts during the past 5 years and their audit opinion. Except for unqualified opinions, set out in details the contents of their opinions
| Year | Audit firm name: | Accountant name: | Audit opinion |
| 2011 | KPMG Taiwan | Gong Jun-Ji, Qiu Hui-Yin | Unqualified opinion |
| 2012 | KPMG Taiwan | Chen Zhen-Li, Gong Jun-Ji | Unqualified opinion |
| 2013 | KPMG Taiwan | Chen Zhen-Li, Gong Jun-Ji | Unqualified opinion |
| 2014 | KPMG Taiwan | Chen Zhen-Li, Jiang Jia-Ling | Unqualified opinion |
| 2015 | KPMG Taiwan | Chen Zhen-Li, Jiang Jia-Ling | Revised unqualified opinion |
2. If there is any replacement of auditor in the last 5 fiscal years, the reasons for the replacement of company, the former and successor auditors should be explained: Change of auditors due to internal re-organization of the auditor firm.
(4) Financial analysis
1. Financial Anlaysis - International Financial Reporting Standards (consolidated financial report)
Year/Anlaysis Item | Financial analysis of the most recent 5 years | Financial information as at September 30, 2016 | |||||
| 2011 | 2012 | 2013 | 2014 | 2015 | |||
| Financial structure (%) | Debt-asset ratio (Note 3) | N/A | 55.21 | 55.66 | 52.56 | 53.89 | 55.30 |
| Long-term fund/property, plants and equipment (Note 3) | 128.18 | 141.43 | 146.97 | 163.19 | 166.82 | ||
Debt-Repayment Ability | Current ratio % | 115.15 | 131.08 | 143.85 | 130.07 | 121.09 | |
| Quick ratio % | 73.86 | 93.47 | 101.06 | 87.09 | 78.39 | ||
| Interest coverage ratio (Note 3) | 9.27 | 9.58 | 13.28 | 12.15 | 11.76 | ||
Operating Ability | Receivables turnover ratio (times) | 5.70 | 5.45 | 5.34 | 5.79 | 5.44 | |
| Average days of collection | 64 | 67 | 68 | 63 | 67 | ||
| Inventory turnover ratio (times) | 5.06 | 5.29 | 5.14 | 5.01 | 4.41 | ||
| Payables turnover ratio (times) | 6.93 | 6.65 | 6.30 | 6.71 | 5.92 | ||
| Average days of sales | 72 | 69 | 71 | 73 | 83 | ||
| Property, plant and equipment | 1.62 | 1.70 | 1.81 | 1.88 | 1.79 | ||
| Total assets turnover ratio (times) | 0.82 | 0.82 | 0.83 | 0.81 | 0.73 | ||
Profit Ability | Return on assets (%)(Note 3) | 6.42 | 6.75 | 8.44 | 6.39 | 5.87 | |
| Return on shareholder's equity (%)(Note 3) | 12.76 | 13.57 | 17.01 | 12.51 | 11.78 | ||
| 203 |
| Net profit before tax/Paid-up capital (%)(Note 3) | 21.81 | 24.76 | 36.27 | 31.94 | 30.81 | ||
| Net profit margin (%)(Note 3) | 6.97 | 7.35 | 9.46 | 7.22 | 7.36 | ||
| Earnings per share (NTD) (Note 3) | 1.75 | 2.09 | 3.07 | 2.55 | 1.79 | ||
Cash
Flow
| Cash flow ratio (%) | 39.02 | 40.95 | 41.25 | 47.76 | 41.34 | |
| Cash flow adequacy ratio (%) | 85.05 | 84.88 | 84.73 | 90.08 | 102.76 | ||
| Cash reinvestment ratio (%) | 9.27 | 9.56 | 8.80 | 9.39 | 10.70 | ||
| Leverage | Operating leverage | 2.38 | 2.21 | 1.94 | 2.24 | 2.24 | |
| Financial leverage | 1.13 | 1.11 | 1.09 | 1.10 | 1.10 | ||
Please explain reasons for changes in financial ratios in the last two years: (If the increase, decrease or change is less than 20%, the analysis can be exempted.) Decrease in return on assets, rate of return and net profit margin of the company and its subsidiaries: Gross operating margin and net operating profit in 2015 were affected by adjustments in product portfolio. As a result net profit after tax for 2015 declined resulting in the reduction of relevant financial ratios. | |||||||
Source: Financial report inspected and certified by a CPA.
Note 1: Where the financial information prepared according to International Financial Reporting Standards is less than 5 years, financial statements prepared according to local financial standards should be separately provided.
Note 2: See Note 3 of Table below for formula for financial analysis.
Note 3: As at September 30, 2016 the company has completed identification of the difference between its investment cost and the net fair value of identifiable assets and liabilities of Siliconware Precision Industries Co., Ltd. following which it has made retrospective adjustments to its 2015 financial statement. Folowing adjustments the financial analysis is as follows: Debt-asset ratio 53.94%, long-term fund to property, plant and equipment 163.01%, interest cover ratio 12.02, return on assets 6.31%, return on shareholders equity 12.35%, net profit before tax as a percentage of paid-up capital 31.58%, net profit margin 7.12% and earning per share (with retroactive adjustment) NTD2.51.
2. Financial anlaysis - International Financial Reporting Standards (individual financial report)
| Year/Anlaysis Item | Financial analysis of the most recent 5 years | |||||
| 2011 | 2012 | 2013 | 2014 | 2015 | ||
| Financial structure (%) | Debt-asset ratio (Note 2) | 43.12 | 44.44 | 42.60 | 48.71 | |
| Long-term fund to fixed assets ratio (Note 2) | 243.78 | 264.50 | 241.94 | 259.13 | ||
Debt-Repayment Ability | Current ratio % | 41.68 | 75.28 | 60.50 | 35.19 | |
| Quick ratio % | 32.89 | 67.45 | 53.66 | 30.70 | ||
| Interest coverage ratio (Note2) | 21.29 | 22.64 | 27.36 | 20.73 | ||
Operating Ability | Receivables turnover ratio (times) | 7.05 | 6.48 | 5.37 | 4.98 | |
| Average days of collection | 52 | 56 | 68 | 73 | ||
| Inventory turnover ratio (times) | 15.99 | 16.73 | 16.90 | 17.07 | ||
| Payables turnover ratio (times) | 7.43 | 8.06 | 8.68 | 8.69 | ||
| Average days of sales | 23 | 22 | 22 | 21 | ||
| Fixed assets turnover ratio (times) | 1.25 | 1.30 | 1.25 | 1.17 | ||
| Total assets turnover ratio (times) | 0.39 | 0.37 | 0.37 | 0.31 | ||
Profit Ability | Return on assets (%)(Note 2) | 7.60 | 7.97 | 10.13 | 7.20 | |
| 204 |
| Return on shareholder's equity (%)(Note 2) | 12.63 | 13.62 | 17.31 | 12.68 | ||
| Net profit before tax/Paid-up capital (%)(Note 2) | 19.15 | 22.25 | 33.24 | 28.33 | ||
| Net profit margin (%)(Note 2) | 17.92 | 19.06 | 24.45 | 20.68 | ||
| Earnings per share (NTD) (Note 2) | 1.75 | 2.09 | 3.07 | 2.55 | ||
Cash Flow | Cash flow ratio (%) | 49.20 | 40.73 | 36.53 | 32.26 | |
| Cash flow adequacy ratio (%) | 108.02 | 100.88 | 89.77 | 89.33 | ||
| Cash reinvestment ratio (%) | 8.20 | 5.06 | 5.54 | 5.80 | ||
| Leverage | Operating leverage | 1.85 | 1.86 | 1.73 | 2.11 | |
| Financial leverage | 1.07 | 1.07 | 1.06 | 1.09 | ||
Please explain reasons for changes in financial ratios in the last two years: (If the increase, decrease or change is less than 20%, the analysis can be exempted.) 1. Decrease in current ratio: Customer inventory closeout and the concurrence of major customer payment dates at the end of 2015 has caused accounts receivable to be lower than those at the end of 2014, thereby reducing current asset. Increase in current liabilitie is because of increase at the end of 2014 in others payable (related party) and corporate debt due within one year. Together with decrease in current asset, the increase in current liabilities has caused decrease in current ratio. 2. Decrease in quick ratio: Customer inventory closeout and the concurrence of major customer payment dates at the end of 2015 has caused accounts receivable to be lower than those at the end of 2014, thereby reducing quick asset. Increase in current liabilitie is because of increase at the end of 2014 in others payable (related party) and corporate debt due within one year. Together with decrease in current asset, the increase in current liabilities has caused decrease in quick ratio. 3. Decrease in interest coverage ratio: This is mainly because profit is affected by product portfolio adjustments in 2015. 4. Decrease in return on assets: This is because net profit after tax is affected by product portfolio adjustments in 2015. 5. Decrease in return on shareholder's equity This is because net profit after tax is affected by product portfolio adjustments in 2015. 6. Increase in operating leverage: This is because of higher operating income in 2015 than in 2014. | ||||||
Source: Financial report inspected and certified by a CPA.
Note 1: Where the financial information prepared according to International Financial Reporting Standards is less than 5 years, financial statements prepared according to local accounting standards should be separately provided.
Note 2: As at September 30, 2016 the company has completed identification of the difference between its investment cost and the net fair value of identifiable assets and liabilities of Siliconware Precision Industries Co., Ltd. following which it has made retrospective adjustments to its 2015 financial statement. Folowing adjustments the financial analysis is as follows: Debt-asset ratio 48.76%, long-term fund to property, plant and equipment 258.78%, interest cover ratio 20.49, return on assets 7.1%, return on shareholders equity 12.51%, net profit before tax as a percentage of paid-up capital 27.97%, net profit margin 20.38% and earning per share (with retroactive adjustment) NTD2.51.
Note 3: Calculation formula for financial analysis:
1. Financial structure
(1) Asset-debt ratio = Total assets/Total liabilities
(2) Long-term fund to property, plant and equipment = (Total equity + non-current liabilities)/Net property, plants and equipment
2. Solvency
(1) Current ratio = current assets / current liabilities.
(2) Quick ratio = (current assets – inventory – prepaid expense) / current liabilities.
(3) Times interest earned = net income before income tax and interest expense / current interest expense.
3. Operating ability
| 205 |
(1) Receivable (including accounts receivable and business-related notes receivable) turnover ratio = net operating revenue / average balance of receivable of the period (including accounts receivable and business-related notes receivable).
(2) Average days of collection = 365 / receivables turnover ratio.
(3) Inventory turnover ratio = cost of goods sold / average amount of inventory.
(4) Payable (including accounts payable and business-related notes payable) turnover ratio = cost of goods sold / average balance of payable of the period (including accounts payable and business-related notes payable).
(5) Average days of sales = 365 / inventory turnover ratio.
(6) Property, plants and equipment turnover ratio = Net sales/Net average property, plants and equipment
(7) Total assets turnover ratio = net sales / total assets.
4. Profitability
(1) Return on assets = [net income + interest expense (1– tax rate)] / average total assets.
(2) Return on shareholder’s equity= net profit and loss / net average shareholders’ equity.
(3) Net profit margin = net income / net sales.
(4) Earnings per share = (Profit and loss attributable to owner of parent company - dividend to special stock) / weighted average of shares issued.
5. Cash flows
(1) Cash flow ratio = new cash flows from operating activities / current liabilities.
(2) Cash flow adequacy ratio = net cash flows from operating activities in the past five years / (capital expenditure + increase in inventory + cash dividend) in the past five years.
(3) Cash reinvestment ratio = (Net cash flows from operating activities – cash dividend) / (gross property, plants and equipment + long-term investment + other non-current assets + working capital).
6. Leverage
(1) Operating leverage = (Net operating income – variable operating cost and expenses) / operating income
(2) Financial leverage = operating income / (operating income – interest expense).
| 206 |
3. Financial analysis - Local accounting standards (consolidated)
Year Item of analysis (Note2) | Financial analysis of the most recent 5 years | ||||||
| 2011 | 2012 | 2013 (Note 1) | 2014 (Note 1) | 2015 (Note 1) | |||
Financial Structure | Debt-to-assets ratio (%) | 54.31 | 54.38 | N/A | |||
| Long-term fund to fixed assets ratio (%) | 136.62 | 124.49 | |||||
Debt-Repayment Ability | Current ratio (%) | 135.00 | 115.75 | ||||
| Quick ratio (%) | 84.53 | 73.46 | |||||
| Interest coverage ratio | 11.20 | 9.28 | |||||
Operating Ability | Receivables turnover ratio (times) | 5.81 | 5.73 | ||||
| Average days of collection | 63 | 64 | |||||
| Inventory turnover ratio (times) | 5.63 | 5.06 | |||||
| Payables turnover ratio (times) | 6.60 | 6.93 | |||||
| Average days of sales | 65 | 72 | |||||
| Fixed assets turnover ratio (times) | 1.66 | 1.54 | |||||
| Total assets turnover ratio (times) | 0.83 | 0.79 | |||||
Profit Ability | Return on assets (%) | 7.11 | 6.47 | ||||
| Return on shareholder's equity (%) | 14.40 | 12.62 | |||||
| Percentage of paid-in capital (%) | Operating profits | 24.89 | 23.36 | ||||
| Net profit before tax | 25.15 | 21.82 | |||||
| Net profit margin | 7.54 | 6.98 | |||||
| Earnings per share (NTD) | Basic | 1.83 | 1.76 | ||||
| Diluted | 1.78 | 1.71 | |||||
Cash Flow (Note 3) | Cash flow ratio (%) | 47.84 | 34.26 | ||||
| Cash flow adequacy ratio (%) | 93.95 | 82.60 | |||||
| Cash reinvestment ratio (%) | 10.07 | 8.53 | |||||
| Leverage | Operating leverage | 2.42 | 2.37 | ||||
| Financial leverage | 1.11 | 1.13 | |||||
| Reasons for changes in the respective financial ratios during the past 2 years (If the increase, decrease is less than 20%, the analysis can be exempted.) Not applicable. | |||||||
Source: Financial report inspected and certified by a CPA.
Note 1: For fiscal years 2013-2016 the company's financial reports are compiled in accordance with International Financial Reporting Standards (IFRS), therefore there are no financial reports that have been compiled in accordance with local accounting standards.
Note 2: See Note 2 of Table below for formula for financial analysis.
| 207 |
4. Financial analysis - Local accounting standards (individual)
Year Item of analysis (Note2) | Financial analysis of the most recent 5 years | ||||||
| 2011 | 2012 | 2013 (Note 1) | 2014 (Note 1) | 2015 (Note 1) | |||
Financial Structure | Debt-to-assets ratio (%) | 40.86 | 42.06 | N/A | |||
| Long-term fund to fixed assets ratio (%) | 308.75 | 251.84 | |||||
Debt-Repayment Ability | Current ratio (%) | 55.03 | 42.49 | ||||
| Quick ratio (%) | 41.72 | 32.72 | |||||
| Interest coverage ratio | 17.85 | 21.33 | |||||
Operating Ability
| Receivables turnover ratio (times) | 7.13 | 7.10 | ||||
| Average days of collection | 51 | 51 | |||||
| Inventory turnover ratio (times) | 16.68 | 15.98 | |||||
| Payables turnover ratio (times) | 7.17 | 7.42 | |||||
| Average days of sales | 22 | 23 | |||||
| Fixed assets turnover ratio (times) | 1.55 | 1.27 | |||||
| Total assets turnover ratio (times) | 0.41 | 0.39 | |||||
Profit Ability
| Return on assets (%) | 8.70 | 7.60 | ||||
| Return on shareholder's equity (%) | 14.47 | 12.43 | |||||
| Percentage of paid-in capital (%) | Operating profits | 16.07 | 14.11 | ||||
| Net profit before tax | 22.28 | 19.18 | |||||
| Net profit margin | 19.77 | 17.95 | |||||
| Earnings per share (NTD) | Basic | 1.83 | 1.76 | ||||
| Diluted | 1.78 | 1.71 | |||||
Cash Flow (Note 2) | Cash flow ratio (%) | 75.82 | 49.27 | ||||
| Cash flow adequacy ratio (%) | 134.49 | 121.40 | |||||
| Cash reinvestment ratio (%) | 10.17 | 8.24 | |||||
| Leverage | Operating leverage | 3.10 | 3.34 | ||||
| Financial leverage | 1.09 | 1.07 | |||||
| Reasons for changes in the respective financial ratios during the past 2 years (If the increase, decrease is less than 20%, the analysis can be exempted.) Not applicable. | |||||||
Source: Financial report inspected and certified by a CPA.
Note 1: For fiscal years 2013-2016 the company's financial reports are compiled in accordance with International Financial Reporting Standards (IFRS), therefore there are no financial reports that have been compiled in accordance with local accounting standards.
Note 2: Calculation formula for financial analysis:
1. Financial structure
(1) Debt-to-asset ratio = total liabilities / total assets.
(2) Long-term fund to fixed assets ratio=(net shareholders’ equity + long-term debt) / net fixed assets.
2. Solvency
(1) Current ratio = current assets / current liabilities.
(2) Quick ratio = (current assets – inventory – prepaid expense) / current liabilities.
(3) Times interest earned = net income before income tax and interest expense / current interest expense.
3. Operating ability
(1) Receivable (including accounts receivable and business-related notes receivable) turnover ratio = net operating revenue / average balance of receivable of the period (including accounts receivable and business-related notes receivable).
| 208 |
(2) Average days of collection = 365 / receivables turnover ratio.
(3) Inventory turnover ratio = cost of goods sold / average amount of inventory.
(4) Accounts payable (including accounts payable and business-related notes payable) turnover ratio = Cost of goods sold / average balance of payable during the period (including accounts payable and business-related notes payable).
(5) Average days of sales = 365 / inventory turnover ratio.
(6) Fixed assets turnover ratio=net sales / net fixed assets.
(7) Total assets turnover ratio = net sales / total assets.
4. Profitability
(1) Return on assets = [net income + interest expense (1– tax rate)] / average total assets.
(2) Return on shareholder’s equity= net income / net average shareholders’ equity.
(3) Net profit margin = net income / net sales.
(4) Earnings per share = (net income - dividend to preferred stock) / weighted average of shares issued.
5. Cash flows
(1) Cash flow ratio = new cash flows from operating activities / current liabilities.
(2) Cash flow adequacy ratio = net cash flows from operating activities in the past five years / (capital expenditure + increase in inventory + cash dividend) in the past five years.
(3) Cash reinvestment ratio = (net cash flows from operating activities – cash dividend) / (gross fixed assets + long-term investment + other assets + working capital).
6. Leverage
(1) Operating leverage = (net operating income – variable operating cost and expenses) / operating income
(2) Financial leverage = operating income / (operating income – interest expense).
| 209 |
(6) Description of material changes in accounts Compare the accounts of the balance sheet and income statement of the most recent two fiscal years. If the change in the amount is 10% or more and the amount is 1% of the total assets of the current fiscal year, the reasons for the change should be analyzed in details.
1. International Financial Reporting Standards (consolidated financial report)
Unit: (NT$1,000) %
Year Accounting Item | 2014 | 2015 | Changes: | Explanation | |||
| Amount | % (Note 1) | Amount | % (Note 1) | Amount | % (Note 2) | ||
| Net accounts receivable | 52,920,810 | 15.85% | 44,931,487 | 12.30% | (7,989,323) | (15.10%) | Net accounts receivable for year-end 2015 was lower than that in 2014 due to customers liquidating excess inventory coincidentally encountering the payment dates of key customers |
| Investment accounted for using equity method | 1,492,441 | 0.45% | 37,141,552 | 10.17% | 35,649,111 | 2,388.64% | This is because of the company's additional adoption of equity method for its investment in 24.99% of the equity of Siliconware Precision Industries |
| Short-term borrowing | 41,176,033 | 12.33% | 32,635,321 | 8.93% | (8,540,712) | (20.74%) | This is caused by repayment of short-term bank loans in 2015 |
| Short-term bills payable | - | - | 4,348,054 | 1.19% | 4,348,054 | 100.00% | Addition of commercial bills payable for the company's operating needs in 2015 |
| Corporate debts due within one year | - | - | 14,685,866 | 4.02% | 14,685,866 | 100.00% | This is because imminent expiration of the company's 2015 Third foreign unsecured convertible corporate bonds' redemption right, as a result of which the compny transfered them from corporate debts payable to payable within one year |
| Corporate debt payable | 31,270,131 | 9.36% | 23,740,384 | 6.50% | (7,529,747) | (24.08%) | This is because of the company's issuance of 2015 Fourth foreign unsecured convertible corporate bonds and imminent expiration of the company's 2015 Third foreign unsecured convertible corporate bonds' redemption right, as a result of which the compny transfered them from corporate debts payable to payable within one year |
| Long-term borrowing | 24,104,424 | 7.22% | 42,493,668 | 11.64% | 18,389,244 | 76.29% | Additional long-term loans to meet the company's operating needs |
| Capital reserve | 16,013,059 | 4.79% | 23,757,099 | 6.50% | 7,744,040 | 48.36% | In 2015 the company disposed of part of its shareholding in Universal Scientific Industrial (Shanghai). Profit from the equity transaction is recognized under Capital Reserve |
| Treasury stock | (1,959,107) | (0.59%) | (7,292,513) | (2.00%) | (5,333,406) | 272.24% | In 2015 the company bought back treasury stocks for conversion under its Fourth foreign unsecured corporate bonds |
| Operating revenue | 256,591,447 | 100.00% | 283,302,536 | 100.00% | 26,711,089 | 10.41% | In 2015 the company continued to expand its production capacity. As a result operating income and cost were both higher than those in 2014 |
| Operating cost | 203,002,918 | 79.12% | 233,167,308 | 82.30% | 30,164,390 | 14.86% | |
| Net operating profit | 29,645,869 | 11.55% | 24,884,622 | 8.78% | (4,761,247) | (16.06%) | The company's adjustments to its product portfolio affect its gross operating margin, thus reducing its net operating profit for 2015 |
| Other profit | 776,290 | 0.30% | 1,437,036 | 0.51% | 660,746 | 85.12% | Due to increase in the profit of financial tools whose profit and loss are measured using fair market value, and decrease in loss from currency conversion in 2015 |
| Recognition of portion of profit and loss of related enterprises using equity method (Note 3) | (108,726) | (0.04%) | 402,730
| 0.14% | 511,456 | (470.41%) | Recognition of investment return for reinvestment company in 2015 based on shareholding ratio |
| Conversion difference in the financial statements of overseas operating units | 5,405,027 | 2.11% | (63,509) | (0.02%) | (5,468,536) | (101.17%) | Decline in the appreciation of USD caused reduction in conversion difference in the financial statement of overseas operating units |
| Other comprehensive income (net income after tax) | 5,503,510 | 2.14% | (147,547) | (0.05%) | (5,651,057) | (102.68%) | Due to changes in the conversion difference in the financial statement of overseas operating units |
| 210 |
Note 1: % refers to the same type of ratio of that item in the relevant statements.
Note 2: % refers to the calculated change of rate, assuming the previous year was 100%.
Note 3: As at September 30, 2016 the company has completed identification of the difference between its investment cost and the net fair value of identifiable assets and liabilities of Siliconware Precision Industries Co., Ltd. following which it has made retrospective adjustments to its 2015 financial statement. The portion after adjustment of profit and loss of related enterprises recognized using equity method is NTD121,373,000.
| 211 |
2. International Financial Reporting Standards (individual financial report)
Unit: NT$ 1,000
Year Accounting Item | 2014 | 2015 | Changes: | Explanation | |||
| Amount | % (Note 1) | Amount | % (Note 1) | Amount | % (Note 2) | ||
| Investment accounted for using equity method | 139,053,527 | 53.13% | 189,994,170 | 62.10% | 50,940,643 | 36.63% | This is because of the company's additional adoption of equity method for its investment in 24.99% of the equity of Siliconware Precision Industries |
| Short-term bills payable | 0 | 0.00% | 4,348,054 | 1.42% | 4,348,054 | 100% | Addition of commercial bills payable for the company's operating needs |
| Others payable - Related parties | 30,653,624 | 11.71% | 40,191,954 | 13.14% | 9,538,330 | 31.12% | Increase in loan of funds to related enterprises as a result of fund deployment within the Group |
| Corporate debts due within one year | 0 | 0.00% | 12,162,192 | 3.98% | 12,162,192 | 100% | This is because imminent expiration of the company's 2015 Third foreign unsecured convertible corporate bonds' redemption right, as a result of which the compny transfered them from corporate debts payable to payable within one year |
| Corporate debt payable | 19,270,613 | 7.36% | 13,938,894 | 4.56% | (5,331,719) | (27.67%) | This is because of the company's issuance of 2015 Fourth foreign unsecured convertible corporate bonds and imminent expiration of the company's 2015 Third foreign unsecured convertible corporate bonds' redemption right, as a result of which the compny transfered them from corporate debts payable to payable within one year |
| Long-term borrowing | 18,355,554 | 7.01% | 37,424,607 | 12.23% | 19,069,053 | 103.89% | Additional long-term loans taken in response to the company's operating needs |
| Capital reserve | 16,013,058 | 6.12% | 23,757,099 | 7.77% | 7,744,041 | 48.36% | In 2015 the company disposed of part of its shareholding in Universal Scientific Industrial (Shanghai). Profit from the equity transaction is recognized under Capital Reserve |
| Treasury stock | (1,959,107) | (0.75%) | (7,292,513) | (2.38%) | (5,333,406) | 272.24% | In 2015 the company bought back treasury stocks for conversion under its Fourth foreign unsecured corporate bonds |
| Gross profit | 29,376,669 | 30.39% | 25,147,806 | 26.69% | (4,228,863) | (14.40%) | Gross profit margin affected in 2015 mainly because of adjustment in product portfolio |
| Other income | 114,369 | 0.12% | 451,354 | 0.48% | 336,985 | 294.65% | Increase in share dividend of Ripley Cable Holdings I, L.P., a financial asset available or sale |
| Other profit | 8,043 | 0.01% | 722,437 | 0.77% | 714,394 | 8882.18% | Due to increase in the profit of financial tools whose profit and loss are measured using fair market value, and decrease in loss from currency conversion in 2015 |
| Share of other combined profit and loss of related enterprises and joint ventures recognized using equity method | 5,168,779 | 5.35% | 49,316 | 0.05% | (5,119,463) | (99.05%) | Decline in the appreciation of USD in 2015 caused reduction in conversion difference in the financial statement of overseas operating units |
Note 1: % refers to the same type of ratio of that item in the relevant statements.
Note 2: % refers to the calculated change of rate, assuming the previous year was 100%.
II. Items that should be included in the financial report
(1) The financial statements and CPA audit reports for the two preceding fiscal years as of the time when the issuer registered the offering and issuance of securities, and the financial report for the most recent quarter publicly announced and reported shall also be included:
1. Please refer to Appendix 2 for the company's 2014 Consolidated Financial Reports and Auditor Report.
2. Please refer to Appendix 3 for the company's 2015 Consolidated Financial Reports and Auditor Report.
3. Please refer to Appendix 4 for the company's 2016 Consolidated Financial Reports and Auditor Report.
| 212 |
(2) The issuer's parent company financial reports for the two most recent fiscal years, audited and certified by a CPA but excluding statement of major accounting items:
1. 2014 Individual Financial Reports and Auditor Report: Please see Appendix 5.
2. 2015 Individual Financial Reports and Auditor Report: Please see Appendix 6.
(3) If there are CPA audited and certified, or reviewed financial reports and parent company financial reports for the most recent period during the time after the issuer has registered the offering and issuance of securities and up to the date of publication of the prospectus, disclose these reports: None.
III. The information that should be included in the financial summary and other important matters
(1) If the company and its affiliated enterprises have experienced any financial difficulties in the most recent two fiscal years, or in the current year up to the date of publication of the prospectus, indicate the impact on the company's financial position. None.
(2) The information shall be disclosed, in case of occurrence of the events under Article 185 of the Company Act in the most recent two years and up to the date of publication of the prospectus: None.
(3) Subsequent events: None.
(4) Others: None.
IV. Review and analysis of the company's financial condition and operating performance
| (2) | Financial status |
Indicate the main reasons for, and impact of, any material changes to the company's assets, liabilities, or equity over the preceding two fiscal years. Where the impact is of material significance, describe plans for future response measures.
Unit: (NT$1,000) %
Year Item | 2015 (after adjustment) | 2014 | Difference | |
| Amount | % | |||
| Current assets | 156,732,840 | 159,955,190 | (3,222,350) | (2.01) |
| Property, plant and equipment | 149,997,075 | 151,587,115 | (1,590,040) | (1.05) |
| Intangible assets | 11,888,612 | 11,913,286 | (24,674) | (0.21) |
| Other assets | 46,387,673 | 10,529,176 | 35,858,497 | 340.56 |
| Total assets | 365,006,200 | 333,984,767 | 31,021,433 | 9.29 |
| Current liabilities | 120,502,072 | 111,199,467 | 9,302,605 | 8.37 |
| Non-current liabilities | 76,365,603 | 64,347,296 | 12,018,307 | 18.68 |
| Total liabilities | 196,867,675 | 175,546,763 | 21,320,912 | 12.15 |
| Share capital | 79,185,660 | 78,715,179 | 470,481 | 0.60 |
| Capital reserve | 23,757,099 | 16,013,058 | 7,744,041 | 48.36 |
| Retained earnings | 55,902,712 | 52,381,238 | 3,521,474 | 6.72 |
| Other interests | 5,081,689 | 5,068,539 | 13,150 | 0.26 |
| Treasury stock | (7,292,513) | (1,959,107) | (5,333,406) | 272.24 |
| Non-controlling interests | 11,503,878 | 8,219,097 | 3,284,781 | 39.97 |
| Total equity | 168,138,525 | 158,438,004 | 9,700,521 | 6.12 |
1. Reasons for changes and impact: (for changes of more than 20%, with the amount involved being NTD10 million) (1) Increase in other assets: This is because of the company's additional adoption of equity method for its investment. (2) Increase in Capital Reserve In 2015 the company disposed of part of its shareholding in Universal Scientific Industrial (Shanghai). Profit from the equity transaction is recognized under Capital Reserve. (3) Increase in treasury stock In 2015 the company bought back treasury stocks for conversion under its Fourth foreign unsecured corporate bonds. (4) Increase in non-controlling equity: Due to disposal of partial shareholding in subsidiary Universal Scientific Industrial (Shanghai). 2. Response plan: The above changes did not have major impact on the company. | ||||
| (3) | Financial Performance |
| 213 |
| 1. | Analysis of comparison of financial performance |
Unit: (NT$1,000) %
Year Item | 2015 | 2014 | Increased (reduced) amount | Change ratio (%) |
| Operating revenue | 283,302,536 | 256,591,447 | 26,711,089 | 10.41 |
| Operating cost | 233,167,308 | 203,002,918 | 30,164,390 | 14.86 |
| Gross profit | 50,135,228 | 53,588,529 | (3,453,301) | (6.44) |
| Operating expenses | 25,250,606 | 23,942,660 | 1,307,946 | 5.46 |
| Operating profits | 24,884,622 | 29,645,869 | (4,761,247) | (16.06) |
| Non-operating revenue and gains (Note) | 403,631 | (1,097,658) | 1,501,289 | 136.77 |
| Net profit before tax (Note) | 25,288,253 | 28,548,211 | (3,259,958) | (11.42) |
| Income tax expense | 4,839,246 | 4,266,626 | 572,620 | 13.42 |
| Current period net profit (Note) | 20,449,007 | 24,281,585 | (3,832,578) | (15.78) |
| Other comprehensive income (net income after tax) | (147,547) | 5,509,748 | (5,657,295) | (102.68) |
| Total comprehensive income (Note) | 20,301,460 | 29,785,095 | (9,483,635) | (31.84) |
Note: As at September 30, 2016 the company has completed identification of the difference between its investment cost and the fair value of identifiable assets and liabilities of Siliconware Precision Industries Co. Ltd. attributable to the company, with appropriate retroactive adjustments to the company's 2015 financial statement. After the aforesaid adjustments non-operating income and expenses were NT$122,274,000; net profit before tax was NT$25,006,896,000; net profit during current period for units operating as going concern during current period was NT$20,167,650,000; net profit during current period was NT$20,167,650,000; total consolidated profit & loss during current period was NT$20,020,103,000. Explanation for major changes: (for changes of more than 20%, with the amount involved being NTD10 million) (1) Increase in non-operating income and expense: This is mainly because of increased profit in 2015 for financial tools whose profit and loss was measured using fair market value compared to those in the previous year. (2) Decrease in other comprehensive income (net income after tax) This is mainly because of decrease in 2015 of conversion difference in financial statements of overseas operating units. (3) Decrease in total comprehensive income: This is mainly because gross operation profit margin was affected by adjustments of product portfolio in 2015. There was therefore decrease in net operating profit and conversion difference in financial statements of overseas operating units in 2015. | ||||
| 2. | The expected sales and its basis, and the possible impact on the company’s future financial operations and response plans: |
Sales volume is based on market demand. Consideration is also given to projected customer order volume and production capacity of the company and its subsidiaries. The company expects growth in sales volume during the next one year.
| (4) | Cash flow |
| 1. | Analysis and explanation on the change in cash flow in the most recent fiscal year. |
Unit: (NT$1,000) %
| Item | 2015 | 2014 | Increased (reduced) amount | Increased (reduced) percentage (%) |
| Operating activities | 57,548,305 | 45,864,749 | 11,683,556 | 25.47% |
| Investment activities | (63,351,429) | (38,817,889) | (24,533,540) | 63.20% |
| Fundraising activities | 8,636,339 | (2,797,003) | 11,433,342 | (408.77%) |
Explanation for major changes: (Where changes exceed 50%, with the amount being more than 5% of paid-up capital)
(1) Cash out-flow from investment activities increased to NTD24,533,540,000: This is because of the company's additional adoption of equity method for its investment in 24.99% of the equity of Siliconware Precision Industries.
(2) Cash in-flow from fundraising activities increased to NTD11,433,342,000: In 2015 the company issued its Fourth foreign unsecured corporate bonds to meet operating needs. It also increased long-term borrowings and short-term bills payable. | ||||
| 2. | Plan to improve inadequate liquidity in recent years: None |
| 214 |
| 3. | Analysis of cash flow in the next one year (2016) (individual) |
Unit: NT$ 1,000
Opening cash balance | Cash from operations during the year Net operating cash-flow | Cash during the year Cash out-flow | Cash balance (Shortfall) Amount | Remedial measures for cash shortfall | |
| Investment plan | Investment plan | ||||
| 8,533,346 | 110,858,863 | (135,556,139) | (16,163,930) | ─ | Issuance of corporate bonds, bank loan, or loans between parent company and subsidiaries |
1. Analysis of liquidity changes during next year:
(1) Net operating cash in-flow consists mainly of projected cash in-flow from the company's operations.
(2) Cash out-flow is mainly in response to operating needs, purchase of machinery, and purchase of ancillary facilities.
2. Expected remedial action for cash shortfall and liquidity analysis: The company's projected cash out-flow during the next one year (2016) is mainly to meet operating needs. In addition to using operating cash in-flow, the company will undertake issuance of ordinary corporate bonds, bank loans, or loans between the parent company and subsidiaries and other methods to meet operating needs. The company additionally plans to implement cash capital increase via issuance of new shares to be wholly contributed toward repayment of bank loans. | |||||
| (5) | Impact of major capital spending on financial position and business operation in the previous year |
| 1. | Utilization of major capital expenses and source of fund |
Unit: NT$ 1,000
| Project item | Actual or projected source of funds | Actual or projected completion date | Total funding needed | Actual or projected fund utilization |
| 2016 | ||||
| Expansion of plant by the Company or subsidiaries | Working capital and bank loan | December 2016 | 6,646,562 | 6,646,562 |
| Purchase of machinery and equipment by the Company or subsidiaries | Working capital and bank loan | December 2016 | 21,763,122 | 21,763,122 |
As at present the Company and its subsidiaries are unable to make reasonable estimate of its capital expenses during the next 2 to 5 years and anticipated benefits.
| 2. | Impact of major capital spending on financial position and business operation |
Unit: thousands; NT$ 1,000
| Year | Item | Output Volume | Sales Volume | Sales revenue | Gross profit |
| 2016 | Semiconductor assembly and packaging | 1,972,452 | 1,945,439 | 3,980,148 | 1,047,979 |
| 2016 | Semiconductor assembly and testing | -(Note 1) | -(Note 1) | 774,481 | 265,058 |
Note 1: Costs are based on test times, therefore the volumes are not disclosed.
Note 2: Estimates are solely for anticipated benefit in fiscal year 2016 for major capital expenses in 2016. Capital expenses on EMS comprise only small ratio. In addition it is difficult to project its industry characteristics. Thus it is not included.
| (5) | Reinvestment policy in the most recent year, the main reason for profit or loss, improvement plan, and investment plan for the coming year: |
| 1. | The company's reinvestment policy |
| 215 |
During the past year reinvestment policy of the company and its subsidiaries mainly involves investment in Mainland China, with key consideration given to their core competitiveness. As such each investment was made after careful study and evaluation.
| 2. | Main reason for profit or loss from reinvestment during the past year, improvement plan, and investment plan for the coming year: |
Unit: NT$ 1,000
| Reinvested company | Profit or loss in most recent year | Main reasons for profit or loss | Improvement plan | Other investment plan in the future |
| A.S.E. Holding Limited | 480,474 | Good operating status | - | Depends on its operating status |
| J & R Holding Limited | 2,049,623 | Good operating status | - | Depends on its operating status |
| ASE Marketing & Service Japan Co., Ltd. | 2,082 | Good operating status | - | Depends on its operating status |
| Omniquest Industrial Limited | 198,948 | Good operating status | - | Depends on its operating status |
| Innosource Limited | 77,641 | Good operating status | - | Depends on its operating status |
| Hung Ching Guang Company | (9,694) | Increase in competitors causing booth rental rate to decline | Continued solicitation of vendors and increase rental rate of exhibition booth | Depends on its operating status |
| Hung Ching Development & Construction Co. Ltd. | 64,151 | Good operating status | - | Depends on its operating status |
| Universal Scientific Industrial (USI) | 1,200,793 | Good operating status | - | Depends on its operating status |
| ASE Test Inc. | 2,883,511 | Good operating status | - | Depends on its operating status |
| USI | 1,239,134 | Good operating status | - | Depends on its operating status |
| Lu Zhu Development Co., Ltd. | (1,527) | Real estate development operation current remains in planning and development stage. | Already signed partnership contract with Hong Ching Construction to jointly develop land | Depends on its operating status |
| Riyueyang Company | (4,274) | A new company, its plant is still under construction | N/A | Depends on its operating status |
| Siliconware Precision Industries Co., Ltd. | 410,937 | Good operating status | - | Depends on its operating status |
| Advanced Microelectronic Products, Inc. | (58,390) | Insufficient production capacity, thus incurring loss as it does not have economy of scale | Continue to launch high value-added products and maintain technological leadership in order to expand market share in the power semiconductor industry. | Depends on its operating status |
3. Investment plan for the coming year: None
| (6) | Other material issues: None. |
| 216 |
V. Special Notes
| 1. | Implementation of internal control system |
(1) Recommendations of accountants during the past 3 years on internal control
| Year | Recommendation by accountants | Current improvements |
| 2013 | No major defect | None |
| 2014 | No major defect | None |
| 2015 | No major defect | None |
(2) The status of improvement of material defects discovered by internal auditors in the most recent three fiscal years: No major defect.
(3) Internal control statement: Please read Page 199 of this Prospectus.
(4) If accountants firm has been entrusted to conduct review of internal control system, the reasons for such appointment, the accountants firm review opinion, the company's improvement measures and status of improvement of defects shall be disclosed: Not applicable.
| 2. | Those who have retained an FSC-approved or -recognized credit rating institution to conduct a credit rating/evaluation shall disclose the credit rating/evaluation report issued by the credit rating institution: Not applicable. |
| 3. | Summary opinion from the securities underwriter's assessment: Please read Page 200 of this Prospectus. |
| 4. | Attorney's legal opinion: Please read Page 201 of this Prospectus. |
| 5. | Summary opinion stated in the case checklist schedule written by the issuer and reviewed by a CPA: Not applicable. |
| 6. | The improvement status of the items notified to be corrected, if at the time the company registered (or applied for approval of) the previous offering and issuance of securities the FSC had notified it to make self-correction on certain items: None. |
| 7. | The items notified to be further disclosed, if at the time the company registered the current offering and issuance of securities the FSC had notified it to make supplemental disclosure on certain items: Not applicable. |
| 8. | The statement or promised items disclosed in the prospectus from the company's registration (application) for offering and issuance of securities for the first time, the preceding time, and within the most recent three fiscal years, and the current state of fulfillment of such: None. |
| 9. | The major content of any dissenting opinion of any director or supervisor regarding any material resolution passed by the board of directors, where there is a record or written statement of such opinion, for the most recent fiscal year and up to the date of publication of the prospectus. None. |
| 10. | Any legal sanctions against the company or its internal personnel, or any disciplinary action taken by the company against its own personnel for violation of internal controls, during the most recent fiscal year or during the current fiscal year up to the date of publication of the prospectus; and a description of the main shortcomings in the company's internal control system as well as an indication of measures for improvement: None. |
| 11. | The statement issued by the securities underwriter, the issuer, and the issuer's directors, supervisors, General Manager, financial or accounting officer, and the managerial officers involved in the current registration for public offering and issuance of securities, specifying that no underwriting related fees will be refunded or collected: Please refer to Appendix 7. |
| 12. | For a case that involves the issuer conducting a cash capital increase or an offering of corporate bonds with equity characteristics and adopting book building and public |
| 217 |
underwriting, the statement issued by the securities underwriter and issuer, specifying that allocation to related parties and insiders is prohibited. Not applicable.
| 13. | Where depending on the nature of its operations, the issuer has engaged experts with professional knowledge and vast experience in technology, operations and finance etc. to conduct analysis and give opinions on the issuer's existing operating status and future development after current issuance of securities, the assessment opinions of such experts shall be disclosed: Not applicable. |
| 14. | Other necessary supplemental information: None. |
XIV. Matters relating to the state of its implementation of corporate governance that should be recorded by a company listed on the stock exchange or traded on an OTC market:
(1) Operation of the Board of Directors
Between January 1, 2015 and December 8, 2016 the Board of Directors met 32 (A) times (6 times for the previous Board an 26 times for the new Board), with the directors' attendance as follows:
| Title | Name | Attendance in person (or as observer)(B) | By proxy | Actual attendance rate (%)(B/A) (note) | Remarks |
| Director | Hong-Ben Chang (Vice Chairman) | 16 | 13 | 50% | Re-elected on June 23, 2015 |
| Director | Rutherford Chang | 1 | 2 | 3% | Re-elected on June 23, 2015 |
| Director | Representative, ASE Enterprises Ltd. Jason C.S. Chang (Chairman) | 16 | 13 | 50% | Re-elected on June 23, 2015 |
| Director | Tien Wu, Representative, ASE Enterprises Ltd. | 25 | 2 | 78% | Re-elected on June 23, 2015 |
| Director | Joseph Tung, Representative, ASE Enterprises Ltd. | 31 | 1 | 97% | Re-elected on June 23, 2015 |
| Director | Raymond Lo, Representative, ASE Enterprises Ltd. | 22 | 2 | 85% | Newly elected on June 24, 2015 |
| Director | Jeffery Chen, Representative, ASE Enterprises Ltd. | 22 | 3 | 85% | Newly elected on June 24, 2015 |
| Director | Chen Tien-chi, Representative, ASE Enterprises Ltd. | 24 | 0 | 92% | Newly elected on June 24, 2015 |
| Director | Representative, J&R Holding Ltd.: Raymond Lo | 6 | 0 | 100% | Resigned during by-election June 23, 2015 |
| Director | Representative, J&R Holding Ltd.: Jeffery Chen | 4 | 1 | 67% | Resigned during by-election June 23, 2015 |
| Independent Director | You Sheng-Fu | 32 | 0 | 100% | Re-elected on June 23, 2015 |
| Independent Director | Ta-lin Hsu | 17 | 15 | 53% | Re-elected on June 23, 2015 |
| Independent Director | Mei-yue Ho | 25 | 1 | 96% | Newly elected on June 24, 2015 |
Note: Actual attendance rate (%) is calculated based on the number of Board meetings and actual attendance of the director. Other matters that require reporting: 1. The items included in Article 14-3 of the Securities and Exchange Act and other comments objected or retained by other Independent Directors in record or the resolutions of the Board of directors in a written statement should indicate the | |||||
| 218 |
date, period, content of the motion, opinions of all Independent Directors and how the company handles the opinion of the Independent Directors: None.
2. The directors’ avoidance of interest motion should indicate the names of the directors, content of the motion and reasons of avoidance of interest as well as the involvement in voting:
Date of Board meeting: Session No. | Motions | Results and resolutions | Company's follow-up on opinion of independent directors |
September 8, 2015 12th Board meeting (2015) | To propose manager and employee bonus for the company's 2014 profit distribution plan. Abstention of directors on the ground of conflict of interest: Summary of speech by director Joseph Tung: Directors and ASE Enterprises Ltd. representatives Joseph Tung, Jason Chang, Hong-Ben Chang, Tien Wu, Raymond Lo and Chen Tien-chi are managers of the company and thus obviously are interested parties in the proposal on the company's 2014 profit-distribution proposal involving bonus for managers and employees. To avoid conflict of interest, directors Joseph Tung (including acting as proxy for chairman Jason Chang), Tien Wu, Raymond Lo (including acting as proxy for Hong-Ben Chang) and Chen Tien-chi will abstain from discussion and voting for the motion. The rest of the directors in attendance are requested to discuss the proposal. | The remaining 4 directors in attendance namely Jeffery Chen, You Sheng-Fu (including as proxy for Ta-Lin Hsu) and Mei-Yue Ho discussed and approved the motion. | Not applicable. |
September 8, 2015 12th Board meeting (2015) | To propose director's remuneration for the company's 2014 profit distribution plan. Abstention of directors on the ground of conflict of interest: Summary of speech by director Joseph Tung: Directors and ASE Enterprises Ltd. representative Joseph Tung, Jason Chang, Tien Wu, Raymond Lo, Chen Tien-chi, Jeffery Chen, and director Hong-Ben Chang, are directors of the company and subject of remuneration for directors and supervisors, and thus obviously are interested parties in the proposal. To avoid conflict of interest, directors Joseph Tung (including acting as proxy for chairman Jason Chang), Tien Wu, Raymond Lo (including acting as proxy for Hong-Ben Chang), Chen Tien-chi and Jeffery Chen will abstain from discussion and voting for the motion. The rest of the directors in attendance are requested to discuss the proposal. | The remaining 3 directors in attendance namely You Sheng-Fu (including as proxy for Ta-Lin Hsu) and Mei-Yue Ho discussed and approved the motion. | Not applicable. |
April 1, 2016 4th Board meeting (2016) | To discuss and revise remuneration of independent directors Abstention of directors on the ground of conflict of interest: Summary of speech by independent director You Sheng-Fu: Directors Yu Sheng-Fu, Ta-Lin Hsu and Mei-Yue Ho are all independent directors of the company. As such they have a patent conflict of interest in relation to the motion and will abstain from discussion and voting on the motion. The rest of the directors in attendance are requested to discuss the proposal. | Upon inquiry by the chairman all the directors in attendance except for independent directors Yu Sheng-Fu, Ta-Lin Hsu and Mei-Yue Ho approved the motion and passed the resolution. | Not applicable. |
September 2, 2016 11th Board meeting
| To propose distribution of remuneration for managers in 2015. Abstention of directors on the ground of conflict of interest: | The remaining directors in attendance namely You Sheng-Fu, | Not applicable. |
| 219 |
(2) The operation of the audit committee or the involvement of supervisors in the operation of the Board of Directors:
The company's Audit Committee has between June 24, 2015 and December 08, 2016 met 20 times (A), with attendance of independent directors as follows:
| Title | Name | Actual attendance (B) | By proxy | Actual attendance rate (%)(B/A) | Remarks |
| Independent Directors | You Sheng-Fu | 19 | 1 | 95% | |
| Independent Directors | Ta-lin Hsu | 13 | 7 | 65% | |
| Independent Directors | Mei-yue Ho | 19 | 1 | 95% |
Other matters that require reporting:
| I. | Items listed in Article 14-5 of the Securities and Exchange Act and other items that have not passed the Audit Committee but approved by more than two-thirds of the entire Board of Directors (the Board of Directors meeting, session number, motion, resolutions of the Audit Committee and the company's follow-up action on the Audit Committee's opinion): |
Date of Board meeting: Session No. | Motions | Resolution of Audit Committee | The company's follow-up action on the Audit Committee's opinion |
| July 2, 2015 | To appoint members of | All the independent directors | As more than half of the members of |
| 220 |
| 8th Board meeting (2015) | the company's 3rd Compensation Committee | expressed upon inquiry by the chairman, no objections to the approval of the motion for approval by the Board by way of resolution in accordance with Article 9 of the "Constitution of the Audit Committee". | the Audit Committee are interested parties in the motion and have to abstain the Audit Committee is unable to pass a resolution. Thus, in accordance with Article 9 of the "Constitution of the Audit Committee" the Audit Committee agreed to report to the Board for its approval by way of resolution. |
| II. | The directors’ avoidance of interest motion should indicate the names of the directors, content of the motion and reasons of avoidance of interest as well as the involvement in voting: |
| Session number | Motions | Name of Independent Director | Reasons for avoidance of interest | Participation in voting |
| 1st meeting of the 1st Audit Committee | To appoint members of the company's 3rd Compensation Committee | You Sheng-Fu Ta-lin Hsu | Independent directors You Sheng-Fu and Ta-Lin Hsu are nominated for election to the Compensation Committee and are therefore interested parties. | Independent director You Sheng-Fu (including as proxy for Ta-Lin Hsu) abstain from discussion and voting. |
| III. | Communication between independent directors and internal audit supervisor and auditors (e.g. about the company's financial status and operations, means and results etc.) |
(1) Before the end of each month the company's Internal Audit Department will submit consolidated report by way of e-mail to each independent director, such report containing results of its internal audit and defect responses. At the same time the supervisor of the Department will regular communicate on a quarterly basis with the independent directors. The supervisor also submits internal audit report during quarterly Board meetings. In addition the supervisor will promptly report to the independent directors on any special incidents. In 2015 and 2016 there are no such special incidents. As at to-date the company's independent directors and the supervisor of the Internal Audit Department have excellent communication.
(2) The company's CPAs (external auditors) also report quarterly to independent directors, results of their audit or review of the current quarter's financial statements, as well as other matters requiring communication under the law. In addition the CPAs (external auditors) will promptly report to the independent directors on any special incidents. In 2015 and 2016 there are no such special incidents. As at to-date the company's independent directors and the CPAs (external auditors) have excellent communication.
2. Attendance of supervisors in board meetings
Between January 1, 2015 and June 21, 2015 the Board of Directors has 6 meeting (A). The attendance of the supervisors are as follows:
| Title | Name | Attendance in person | Actual attendance rate (%) | Remarks |
| Supervisors | Jerry Chang | 1 | 17% | Resigned during by-election June 23, 2015 |
| Supervisor | Representative, Hung Ching Development & Construction Co. Ltd.: Tseng Yuan-Yi | 2 | 33% | Resigned during by-election June 23, 2015 |
| Supervisor | Representative, Hung Ching Development & Construction Co. Ltd.: Pan Shih-hua | 0 | 0% | Resigned during by-election June 23, 2015 |
| Supervisor | Representative, Hung Ching Development & Construction Co. Ltd.: Chen Tien-chi | 1 | 17% | Resigned during by-election June 23, 2015 |
| Supervisor | Representative, Hung Ching Development & Construction Co. Ltd.: Chun-che Lee | 2 | 33% | Resigned during by-election June 23, 2015 |
Other matters that require reporting: I. Composition and responsibility of supervisors: | ||||
| 221 |
(1) Communication between supervisors and company employees and shareholders (e.g. communication channels, means etc.): The company's portal is equipped with spokesperson mail box. Employees and shareholders who wish to consult supervisors can make contact through this channel; In addition supervisors attend Shareholder's Meetings and can therefore be available for direct communication.
(2) Communication between supervisors and the Company's internal audit chief and CPA:
1. Before the end of each month the company's Internal Audit Department will submit consolidated internal audit report and defect response by way of e-mail to supervisors. After the end of each quarter the Department will consolidate all audit items and defects for discussion at the Board meeting, with the Internal Audit Department's supervisor or his proxy present the report in such meetings. After the Board meetings the company will send all relevant materials together with Board minutes by way of e-mail for review by all supervisors.
2. According to Article 219 of the Company Law the supervisor should verify all the forms and statements compiled by the Board of Directors for Shareholders Meeting. If a supervisor has any doubts on financial statements he should directly contact and communicate with the external auditors.
II. If a supervisor voices opinion in the Board of Directors meeting, describe the date of board meeting, term of the board, agenda items, resolutions adopted by the board, and actions taken by the company in response to the opinion of the supervisor: None. |
(3) Corporate governance implementation status and deviations from Corporate Governance Best-Practice Principles for TWSE/TPEx Listed Companies and reasons
| 222 |
| Assessed areas: | Operation | Deviations from Corporate Governance Best-Practice Principles for TWSE/TPEx Listed Companies and reasons | ||
| Yes | No | Summary | ||
| I. Does the company establish and disclose its corporate governance principles in accordance with the Corporate Governance Best-Practice Principles for TWSE/TPEx Listed Companies? | V | In 2015 the company formulated in accordance with "Corporate Governance Best Practice Principles for TWSE/GTSM Listed Companies" its Code of Corporate Governance. The said Code was approved by the Board of Directors and disclosed on the company's portal. For details please see http://www.aseglobal.com。 | Deviations from Corporate Governance Best-Practice Principles for TWSE/TPEx Listed Companies and reasons | |
II. Shareholding structure & shareholders' rights
(1) Does the company establish internal operating procedures for handling shareholder suggestions, questions, disputes or litigation and handled related matters accordingly?
(2) Does the company have a list of major shareholders that have actual control over the Company and a list of ultimate owners of those major shareholders?
(3) Has the company established and implemented risk management and firewall systems within its affiliated enterprises?
(4) Has the company established internal rules against insiders trading with undisclosed information? |
V
V
V
V
| The company has set up departments to handle corporate relationship, public relations and legal affairs with full-time staff responsible for handle its stock affairs.
The company maintains on a monthly basis, report on filing of changes in shareholder, with such report being held by its directors and major shareholders owning more than 10% of the company's equity, in order to have thorough knowledge of the company's main shareholders. Through close contact with major shareholders the company has understanding of a list of individuals/entities with ultimate control.
The company implements control through its internal control system and promulgation of relevant rules and regulations. At the same time its audit unit is tasked with periodic supervision of the company's implementation.
The company has formulated "Management Procedure Governing Prevention of Insider Trading" to prevent the company's insiders from carrying out insider trading due to negligence, inadvertence or intentional acts. This ensures fairness in the securities trading market, while also protecting the interest of investors.
| Deviations from Corporate Governance Best-Practice Principles for TWSE/TPEx Listed Companies and reasons
| |
III. Composition and responsibilities of the Board of Directors
(1) Has the Board of Directors developed and implemented a diversified policy for the composition of its members?
(2) Does the company voluntarily establish other functional committees in addition to compensation committee and audit committee?
(3) Has the company established standards and method for evaluating the | V
V
V
V | The company in its Code of Corporate Governance has set out a policy of diversity with respect to the composition of its Board of Directors.
In this regard the Board of Directors comprises 11 directors including 3 independent directors, one of whom is a female director. Professional skills and knowledge of directors include: Industrial engineering, electronic engineering, mechanical engineering, computer science, physics, finance, economics, accounting, corporate management and psychology. It fully exemplifies the ideal of diversity of the members of the Board.
The company has also duly established an Audit Committee, comprising members appointed by the Board. Its members are all independent directors who conform to the requirements of Sarbanes-Oxley Act as required under Rule 10A-3 of the U.S. Securities Exchange Act of 1934 and the Listing Rules of TWSE for possession of accounting or relevant financial management expertise.
The company has also established a Compensation & Benefit Committee in compliance with the R.O.C. Securities and Exchange Act. According to the aforesaid law, there should be at least one member of the Compensation & Benefit Committee who meets the definition in the R.O.C. Securities and Exchange Act for independent directors. At present the Committee consists of three members, including 2 independent directors. | Deviations from Corporate Governance Best-Practice Principles for TWSE/TPEx Listed Companies and reasons
| |
| 223 |
| Assessed areas: | Operation | Deviations from Corporate Governance Best-Practice Principles for TWSE/TPEx Listed Companies and reasons | ||
| Yes | No | Summary | ||
performance of the board of directors, and implemented the performance evaluation annually?
(4) Has the company regularly evaluated the independence of CPAs?
| V
V
V
V
| During annual disbursement of director's remuneration in connection of distribution of profit, the Compensation & Benefit Committee will conduct evaluation based on the directors' performance and propose disbursement accordingly. The company had in its Board of Directors meeting in 2015 passed its rules on directors' performance appraisal and method of appraisal pursuant to its Code of Corporate Governance. It expects to conduct regular performance appraisal beginning in 2016. The company's Audit Committee obtains yearly, statement of independence of the auditors and assess their independence, following which it presents its findings to the Board of Directors. (I) Assessment is as follows: (1) The company's auditors are not related parties of the company and its directors. (2) In accordance with the Sarbanes-Oxley Act, the company requires that the auditor firm obtain prior approval of its Audit Committee before being appointed as external auditors. (3) In accordance with the Sarbanes-Oxley Act, the company's auditors are required to report to its Audit Committee on a quarterly basis, its implementation of verification/audit and compliance with independence. (4) The company conforms to its Code of corporate Governance by rotating its certified accountants/auditors. (II) Appraisal results are as follows: (1) The independence of the company's certified accountants is in conformity with the requirements under the U.S. SEC, PCAOB, R.O.C. Accountants Act, and Code of Conduct for Accountants etc. (2) The company does not appoint the same certified accountant for more than 5 consecutive years. | Deviations from Corporate Governance Best-Practice Principles for TWSE/TPEx Listed Companies and reasons
| |
| 4. Does the company establish a communication channel and build a designated section on its website for stakeholders, and properly respond to corporate social responsibility issues of concern to the stakeholders? | V | The company empowers the persons-in-charge of relevant departments to handle communication with stakeholders such as creditors, customers and vendors. It also sets up labor union and general manager's mail-box to ensure a channel for communication with employees. The company's portal contains a special section for stakeholders. It provides them with a channel for expressing their opinions. It therefore facilitates the company's understanding of stakeholders' concerns and enables it to make appropriate response. The company also publicly discloses information on its communication with stakeholders through its annual corporate social responsibility report and official portal. | Deviations from Corporate Governance Best-Practice Principles for TWSE/TPEx Listed Companies and reasons | |
| 5. Does the company designate a professional shareholder service agency to deal with shareholder affairs? | V | The Department of Stock Affairs at President Securities Corp. has been appointed the Company's stock affairs agent. | Deviations from Corporate Governance Best-Practice Principles for TWSE/TPEx Listed Companies and reasons | |
VI. Information disclosure
(1) Has the company established a corporate website to disclose information regarding the company's financial, business and corporate governance status?
(2) Does the company have other | V
V
| The company has in place a web portal and empowers its relevant departments to undertake disclosure and updating of its financial operations and corporate governance. For details please see: http://www.aseglobal.com. The company has also developed its web portal in Chinese and English. It employs full-time staff to be in charge of collation and disclosure of information. It also has in place a spokesperson and acting spokesperson system in accordance with regulations, as well as a special liaison to give reply to shareholders on their views. For more information see: http://www.aseglobal.com. | Deviations from Corporate Governance Best-Practice Principles for TWSE/TPEx Listed Companies and reasons | |
| 224 |
| Assessed areas: | Operation | Deviations from Corporate Governance Best-Practice Principles for TWSE/TPEx Listed Companies and reasons | ||
| Yes | No | Summary | ||
| information disclosure channels (e.g., maintaining an English-language website, appointing responsible people to handle information collection and disclosure, creating a spokesperson system, webcasting investor conference on company website)? | V
V
| The company appoints full-time staff to be in charge of filing periodically and ad hoc, various financial and operating information on the Market Observation Post System, with publication of major information as required by regulations. | ||
| 7. Is there any other important information to facilitate a better understanding of the company’s corporate governance practices (including but not limited to employee rights, employee wellness, investor relations, supplier relations, rights of stakeholders, continuing education of directors and supervisors, the implementation of risk management policies and risk evaluation standards, the implementation of customer relations policies, and purchasing insurance for directors and supervisors)? | V | A. Rights and interests of the employees and employee care: Please refer to the Annual Report's section on "Labor Relationship" and the company's Corporate Social Responsibility Report at http://www.aseglobal.com.
B. Investor relationship, supplier relationships and the rights and interest of stakeholders: Please refer to the company's web portal on investor relationship and its section for stakeholders: http://www.aseglobal.com.
C. Further studies by directors, supervisors and managers; Further studies undertaken by the company's directors, supervisors and managers in 2015 are set out in Attached Tables 1 and 2.
D. Implementation of risk management policy and risk measurement standards: Please refer to the Annual Report under the section "Analysis and Assessment of Risk Items" and the company's Corporate Social Responsibility Report at: http://www.aseglobal.com。
E. (6) The implementation of client policies: Please refer to the Annual Report under the section "Summary of Market, Production and Sale".
F. The Company has purchased liability insurance for directors and supervisors. The company has procured liability insurance for its directors and supervisors (in 2015 the sum insured was NTD820 million.)
G. The company will sign with its suppliers, confidentiality agreements/supplier and contractor social responsibility undertaking. All procurement contracts have clear and legally-valid provisions for rights and duties. The company also has in place a supplier-selection system to ensure that suppliers conform to its quality and environmental policies. The said system is supplemented by supplier audit system to ensure its implementation. In this regard the company accepts the necessity of maintaining long-term dialog with its stakeholders. This will enable the company to have a better understanding of the society, thus allowing it to make the best decisions while preventing it from being in conflict with the public. | Deviations from Corporate Governance Best-Practice Principles for TWSE/TPEx Listed Companies and reasons | |
| 8. Does the company have corporate governance self-assessment report or have engaged any other professional organization to conduct such assessment? (If so, please describe the opinion of the board, the results of self or outside evaluation, major deficiencies found, suggestions, or improvement actions taken) (Note 2) | V | At present the company participates in corporate governance evaluation by TWSE, pursuant to which it has established "Corporate Governance Evaluation System" to conduct self-evaluation. The company has completed its second Corporate Governance Self-Evaluation Report. The report will be posted on TWSE portal for the public's perusal. | Deviations from Corporate Governance Best-Practice Principles for TWSE/TPEx Listed Companies and reasons | |
Attached Table 1: Continuing education for directors and supervisors during the past year
| 225 |
| Title | Name | Date of further study | Organizer | Course | Study hours | Whether the study complies with requirements | |
| Start | End | ||||||
| Director (and manager) | Hong-Ben Chang | 104/12/17 | 104/12/17 | Taiwan Corporate Governance Association | Corporate governance, enterprise risk management | 6.0 | Yes |
| 105/07/13 | 105/07/13 | Taiwan Corporate Governance Association | 2016 Global Trends and Opportunities in the Green Economy and Corporate Low-Carbon Innovation | 3.0 | Yes | ||
| 105/10/13 | 105/10/13 | Securities and Futures Institute | 2017 Economic and Industrial Trends | 3.0 | Yes | ||
| Director | Rutherford Chang | 104/12/17 | 104/12/17 | Taiwan Corporate Governance Association | Corporate governance, enterprise risk management | 6.0 | Yes |
| 105/07/13 | 105/07/13 | Taiwan Corporate Governance Association | 2016 Global Trends and Opportunities in the Green Economy and Corporate Low-Carbon Innovation | 3.0 | Yes | ||
| Representative of legal entity director (and manager) | Jason C.S. Chang | 104/12/17 | 104/12/17 | Taiwan Corporate Governance Association | Corporate governance, enterprise risk management | 6.0 | Yes |
| 105/07/13 | 105/07/13 | Taiwan Corporate Governance Association | 2016 Global Trends and Opportunities in the Green Economy and Corporate Low-Carbon Innovation | 3.0 | Yes | ||
| 105/10/13 | 105/10/13 | Securities and Futures Institute | 2017 Economic and Industrial Trends | 3.0 | Yes | ||
| Representative of legal entity director (and manager) | Tien Wu | 104/12/17 | 104/12/17 | Taiwan Corporate Governance Association | Corporate governance, enterprise risk management | 6.0 | Yes |
| 105/07/13 | 105/07/13 | Taiwan Corporate Governance Association | 2016 Global Trends and Opportunities in the Green Economy and Corporate Low-Carbon Innovation | 3.0 | Yes | ||
| 105/10/13 | 105/10/13 | Securities and Futures Institute | 2017 Economic and Industrial Trends | 3.0 | Yes | ||
| Representative of legal entity director (and manager) | Joseph Tung | 104/07/23 | 104/07/23 | Taiwan Academy of Banking and Finance | Legal responsibility of directors and supervisor under corporate governance | 3.0 | Yes |
| 104/12/17 | 104/12/17 | Taiwan Corporate Governance Association | Corporate governance, enterprise risk management | 6.0 | Yes | ||
| 105/07/13 | 105/07/13 | Taiwan Corporate Governance Association | 2016 Global Trends and Opportunities in the Green Economy and Corporate Low-Carbon Innovation | 3.0 | Yes | ||
| 105/09/22 | 105/09/22 | Taiwan Institute of Directors | Corporate risk management and the challenges for family enterprises in Taiwan | 3.0 | Yes | ||
| Representative of legal entity director (and manager) | Raymond Lo | 104/12/17 | 104/12/17 | Taiwan Corporate Governance Association | Corporate governance, enterprise risk management | 6.0 | Yes |
| 105/07/13 | 105/07/13 | Taiwan Corporate Governance Association | 2016 Global Trends and Opportunities in the Green Economy and Corporate Low-Carbon Innovation | 3.0 | Yes | ||
| 105/10/13 | 105/10/13 | Securities and Futures Institute | 2017 Economic and Industrial Trends | 3.0 | Yes | ||
| Representative of | Jeffery Chen | 104/12/17 | 104/12/17 | Taiwan Corporate Governance Association | Corporate governance, enterprise risk management | 6.0 | Yes |
| 226 |
| Title | Name | Date of further study | Organizer | Course | Study hours | Whether the study complies with requirements | |
| Start | End | ||||||
| legal entity director (and manager) | |||||||
| 105/07/13 | 105/07/13 | Taiwan Corporate Governance Association | 2016 Global Trends and Opportunities in the Green Economy and Corporate Low-Carbon Innovation | 3.0 | Yes | ||
| Representative of legal entity director (and manager) | Chen Tien-chi | 104/12/17 | 104/12/17 | Taiwan Corporate Governance Association | Corporate governance, enterprise risk management | 6.0 | Yes |
| 105/07/13 | 105/07/13 | Taiwan Corporate Governance Association | 2016 Global Trends and Opportunities in the Green Economy and Corporate Low-Carbon Innovation | 3.0 | Yes | ||
| 105/10/13 | 105/10/13 | Securities and Futures Institute | 2017 Economic and Industrial Trends | 3.0 | Yes | ||
| Independent Directors | You Sheng-Fu | 104/01/22 | 104/01/22 | Securities and Futures Institute | Corporate social responsibility report - Seminar on showcasing the value of sustainable operation | 3.0 | Yes |
| 104/07/15 | 104/07/15 | Taiwan Corporate Governance Association | Corporate governance and evergreen enterprise; corporate decision-making and functions of board of directors | 6.0 | Yes | ||
| 105/07/13 | 105/07/13 | Taiwan Corporate Governance Association | 2016 Global Trends and Opportunities in the Green Economy and Corporate Low-Carbon Innovation | 3.0 | Yes | ||
| 105/08/10 | 105/08/10 | Securities and Futures Institute | Preventing fraud, protecting corporate secrets, and strengthening corporate management | 3.0 | Yes | ||
| 105/10/13 | 105/10/13 | Securities and Futures Institute | 2017 Economic and Industrial Trends | 3.0 | Yes | ||
| Independent Directors | Ta-lin Hsu | 104/12/15 | 104/12/15 | Taiwan Academy of Banking and Finance | Corporate governance forum - tax governance blueprint | 3.0 | Yes |
| 104/12/23 | 104/12/23 | Securities and Futures Institute | Skills for directors and supervisors in understanding financial information | 3.0 | Yes | ||
| 105/07/13 | 105/07/13 | Taiwan Corporate Governance Association | 2016 Global Trends and Opportunities in the Green Economy and Corporate Low-Carbon Innovation | 3.0 | Yes | ||
| 105/10/19 | 105/10/19 | Securities and Futures Institute | Corporate management and securities law | 3.0 | Yes | ||
| Independent Directors | Mei-yue Ho | 104/08/10 | 104/08/10 | Taiwan Corporate Governance Association | Enterprise risk management and prevention and detection of fraud risk | 3.0 | Yes |
| 104/08/18 | 104/08/18 | Taiwan Corporate Governance Association | American anti-trust law and Taiwan enterprises - why you should care about and what you should know | 3.0 | Yes | ||
| 227 |
| Title | Name | Date of further study | Organizer | Course | Study hours | Whether the study complies with requirements | |
| Start | End | ||||||
| 104/11/13 | 104/11/13 | Taiwan Corporate Governance Association | Global CEO Outlook 2015; Key auditing standards and legal updates | 3.0 | Yes | ||
| 105/07/20 | 105/07/20 | Securities and Futures Institute | Legal responsibilities of directors and supervisors in mergers and acquisitions | 3.0 | Yes | ||
| 105/08/02 | 105/08/02 | Securities and Futures Institute | Understanding and strategically using corporate financial data | 3.0 | Yes | ||
Attached Table 2: Studies by managers during the past year
| Title | Name | Date of further study | Organizer | Course | Study hours | Whether study is compliance with requirements | |
| Starting | Ending | ||||||
| Vice President and Chief of Accounting | Hong-Ming Kuo | 2015/08/07 | 2015/08/11 | Accounting Research and Development Foundation | Continuing education for accounting supervisors of issues, securities houses and Stock Exchange | 12 | Yes |
| 228 |
(4) State of operations of the compensation committee:
1. Information on members of the Compensation Committee.
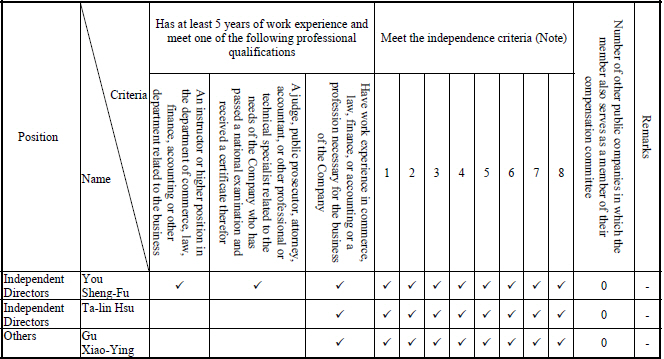
Note: If the committee member meets any of the following criteria in the two years before being appointed or during the term of office, please check "ü" the corresponding boxes:
(1) Not an employee of the Company or any of its affiliates.
(2) Not a director or supervisor of the Company or any of its affiliates. The same does not apply, however, in cases where the committee member is an independent director of the Company, its parent company, or any subsidiary in which the Company holds, directly or indirectly, more than 50 percent of the voting shares.
Not a natural-person shareholder whose shareholding, together with those of his/her spouse, minor children, and shares held under others' names, exceed 1% of the total number of outstanding shares of the Company, or ranks the person in the top ten shareholders of the Company.
(4) Not a spouse, relative within second degree of kinship, or lineal relative within third degree of kinship of any of the persons in the preceding three paragraphs.
Not a director, supervisor or employee of a juristic-person shareholder that holds directly 5% or more of the total number of outstanding shares of the Company or ranks in the top five shareholders.
Not a director, supervisor, manager or shareholder holding 5% or more of the shares of a specified company or institution that has a financial or business relationship with the Company.
Not a professional or an owner, partner, director, supervisor, manager or a spouse of the abovementioned who provides commercial, legal, financial, accounting services or consultation to the Company or an affiliate of the Company.
(8) Not having any of the situations set forth in Article 30 of the Company Act.
2. Current term of office: Between June 24, 2015 and June 23, 2108, and between January 1, 2015 and December 8, 2016 the Compensation Committee met5 times, with the Committee members' attendance as follows:
| Title | Name | Actual attendance (Note) | By proxy | Actual attendance rate (%) | Remarks |
| Convener | You Sheng-Fu | 5 | 0 | 100% | - |
| 229 |
| Title | Name | Actual attendance (Note) | By proxy | Actual attendance rate (%) | Remarks |
| Committee member | Ta-lin Hsu | 1 | 4 | 20% | - |
| Committee member | Gu Xiao-Ying | 5 | 0 | 100% | - |
Note: Actual attendance rate (%) is calculated based on the number of Board meetings and actual attendance of the Committee member.
Other matters that require reporting:
I. If the Board of Directors do not adopt or revise the recommendations of the Compensation Committee, explanation should be provided with respect to the date and session of the Board meeting, details on the motion, resolution of the Board and the company's follow-up action on the views of the Compensation Committee: None.
II. If with respect to any resolution of the compensation committee, any member has a dissenting or qualified opinion that is on record or stated in a written statement, describe the date of committee meeting, term of the committee, agenda item, opinions of all members, and actions taken by the company in response to the opinion of members: None. | |||||
| 230 |
(5) Implementation of corporate social responsibility:
| Assessed areas: | Operation | Departure from Corporate Social Responsibility Best Practice Principles for TWSE/GTSM listed companies and reasons | ||
| Yes | No | Summary | ||
I. Corporate governance implementation
(1) Does the company establish corporate social responsibility policy or system and examine its implementation results?
(2) Does the company provide educational training on corporate social responsibility on a regular basis?
(3) Has the company established a dedicated or concurrent unit in charge of promoting CSR with senior management authorized by the board to take charge of proposing CSR policies and
| V
V
V
V
| The company has adopted "ASE Group Policy for Sustainable Development and Corporate Citizen" and "Code of Corporate Social Responsibility". They are listed in the company's portal under corporate social responsibility and its corporate social responsibility (CSR) report. Pursuant to the said policies the company embarks on its CSR implementation plan. Details are set out in "2. Developing Sustainable Environment", "3. Maintaining Public Welfare", and "6. Other Important Information towards Understanding of CSR Operations" in this Table. The Board regularly conducts review of the company's CSR practice and achievements.
Details on the company's CSR policy, regulations or management rules and results of specific implementation are all disclosed in ASE Group's CSR Report. Please refer to: http://www.aseglobal.com.
The company formalizes annually CSR training program and provides in accordance with the program, training for new recruits and existing employees on their CSR. The program is designed to help employees understand the spirit of the company's CSR and means of achieving it.
The company has established a "Group Sustainable Development Committee" consisting of senior management. The Committee is responsible for guiding and supervising ASE's growth with respect to its global economic, environmental and social policies. It regularly submits report to the Board, and puts in place a "Group Enterprise Sustainability Center", responsible for promoting the company's CSR. The Center is also responsible for assessing the Group's sustainability issues and performance, coordinating and promoting the formulation of the Group's targets and promoting the implementation of sustainable development plans. It reports directly to the Committee. The sustainable development program is divided into 6 major | There is no departure from Corporate Social Responsibility Best Practice Principles for TWSE/GTSM listed companies. | |
| 231 |
| Assessed areas: | Operation | Departure from Corporate Social Responsibility Best Practice Principles for TWSE/GTSM listed companies and reasons | ||
| Yes | No | Summary | ||
reporting to the board?
(4) Has the company established a reasonable salary remuneration policy, and integrated the employee performance evaluation system with its CSR policy, and established an effective reward and disciplinary system?
| themes, namely corporate governance, environmental sustainability, human resources, supply chain development, corporate citizen and social participation, consultation with stakeholders and information disclosure. Their implementation and results are as set out in "2. Developing Sustainable Environment", "3. Maintaining Public Welfare", and "6. Other Important Information towards Understanding of CSR Operations" in this Table.
The company's CSR Report discloses the performance of its CSR unit. It also explains the unit's governance structure and implementation status. For information on the CSR unit's operation and implementation, please see: http://www.aseglobal.com.
The company regularly adjusts its salary structure and welfare in accordance with local regulations and market status. In no way are salaries differentiated based on gender, race, nationality or age.
The company complies with Gender Equality Act and will not consider gender as a criterion for appointment, performance appraisal or promotion of employees.
To maintain the highest standards for employee's work discipline, the company has promulgated Guidelines on employee management, specifying unequivocal incentive and penalty rules. The Guidelines are the highest ethical standard and commitment to be complied with by employees. | |||
II. Fostering a sustainable environment
(1) Has the company endeavored to improve the efficiency of resource utilization and used recycled materials which | V
| The company has in place a management plan for use of electric power, water resources and consumable materials. It upgrades the efficiency of their supply facilities or makes optimal improvements on a sustained basis. The aim is to comply with "ASE Group Policy for Sustainable Development and Corporate Citizen" and "Code of Corporate Social Responsibility" and achieve their targets of reducing consumption of resources. They include: Energy-saving for air-conditioning, | There is no departure from Corporate Social Responsibility Best Practice Principles for TWSE/GTSM | |
| 232 |
| Assessed areas: | Operation | Departure from Corporate Social Responsibility Best Practice Principles for TWSE/GTSM listed companies and reasons | ||
| Yes | No | Summary | ||
have a low impact on the environment?
(2) Has the company established a proper environmental management system based on the characteristics of the industry?
(3) Has the company monitored the impact of climate change on business operations, conducted greenhouse gas inventory and formulated strategies for energy conservation and carbon and greenhouse gas reduction?
| V
V
| lighting and manufacturing processes etc.
All the company's packaging materials are recyclable and compliant with EU regulations. Through internal management processes the company classifies waste materials and recycles resources, thereby reduces waste of natural resources and lowers impact on the environment.
Pursuant to its "ASE Group Policy for Sustainable Development and Corporate Citizen" and "Code of Corporate Social Responsibility" the company has established a management system to implement in an orderly manner management of various types of resources. In this manner it is able to make best use and improve on a sustained basis, energy and water resources.
With respect to environmental protection the company has in addition to compliance with laws and regulations, established ISO14001 environmental management system. In addition to regular checks on legal compliance the company formulates annually, pollution control and equipment improvement plans in order to effectively reduce pollution emission and discharge and make timely review of its environmental management system.
The company monitors the impact of climate changes on its operating activities. As such it implements a ISO14064 greenhouse gas management system, based on which it checks its greenhouse gas discharge. It formulates emission-reduction targets in order to reduce its discharge of greenhouse gases. The company has passed ISO50001 certification. In response to expectations or customers and consumers around the world for low-carbon products the company introduces carbon footprint checks and has as its target, reduction of product carbon footprint. | listed companies. | |
III. Upholding public interests
(1) Has the company | V
| The company has introduced SA8000 social responsibility management system and | There is no departure from | |
| 233 |
| Assessed areas: | Operation | Departure from Corporate Social Responsibility Best Practice Principles for TWSE/GTSM listed companies and reasons | ||
| Yes | No | Summary | ||
formulated appropriate management policies and procedures according to relevant regulations and the International Bill of Human Rights?
(2) Has the company set up an employee hotline or grievance mechanism to handle complaints properly?
(3) Has the company provided a safe and healthy working environment and provided employees with regular safety and health training?
(4) Has the company set up a channel for communicating with employees on a regular basis, and reasonably inform employees of any significant changes in | V
V
V
V
V
| EICC certification, and has promulgated "ASE Group Policy for Sustainable Development and Corporate Citizen" and "Code of Corporate Social Responsibility". It also respects basic human rights, complies with government labor laws and protects workers' rights with respect to their work environment, health and safety.
The company devotes its attention to a harmonious employer-employee relationship. For this it has in pace a communication and complaint management policy. It provides employees with diversified communication channels including employer-employee meetings, general manager mailbox, employees' opinion box, seminars, correspondence, public notice board, internal communication, training, electronic notice board, employee-consultation staff and e-mail etc., all of which serve to enable the company to understand employees' views and suggestions, with reply and follow-up action whenever necessary.
The company has implemented safety and health operations through the introduction of OHSAS 18001 and TOSHMS occupational safety and health management systems. Its objective is to provide employees with a work environment that is compliant with safety and health regulations. In this regard it regularly conducts risk identification and assessment, as well as adopt appropriate improvement measures to reduce work environment risk. The company also conducts employee work safety and health training and health-promotion activities. The company is equipped with employee clinic and regularly arranges employees to undergo health checks required by their respective units.
The company regularly holds seminars or related meetings according to the category of employees including recruits, employees and labor representatives. Through periodic communication and exchanges the company is able to provide employees with an uncluttered communication channel. Whenever there are major work | Corporate Social Responsibility Best Practice Principles for TWSE/GTSM listed companies. | |
| 234 |
| Assessed areas: | Operation | Departure from Corporate Social Responsibility Best Practice Principles for TWSE/GTSM listed companies and reasons | ||
| Yes | No | Summary | ||
operations that may have an impact on them?
(5) Does the company set up effective career development and training programs for its employees?
(6) Has the company established any consumer protection mechanisms and complaint procedures regarding R&D, purchasing, production, operation and service?
(7) Has the company advertised and labeled its goods and services according to relevant regulations and international standards?
(8) Has the company evaluated the records of suppliers’ impact on the environment and society before doing business with the supplier?
(9) Do the contracts between the company and its major | V
V
V
V
V
| changes (such as change in operating points) the company will communicate with employees in advance by giving them at least 2 weeks' notice. To-date the company has not been involved in any incidents involving coercion of its employees.
The company undertakes annual training planning based on occupational training needs and career development requirements. Course programs include; Recruit training, general knowledge training, professional training, grass-root management, mid-level management and talent development etc.
To ensure that customer's views can be effectively relayed and dealt with, as well as to promote timely interaction with customers, the company has in place management procedures for customer communication involving the establishment of professional customer service team, regular inspection of customer satisfaction, provision of relevant customer view response and communication services, and using the Internet as the basis, establishment of customer on-line service platform with integrated service network, thus providing customers with highly efficient services.
The company complies with Taiwan trade laws including those on export and import of strategic hi-tech products. Its marketing, sale and labeling of services are all in accordance with customer needs and regulatory requirements.
Before admitting new suppliers the company will examine and review their records in environmental and social impact in accordance with its vendor selection mechanism. Thereafter the suppliers are subject to the company's annual "sustainable development questionnaire". The company also conducts site check or documentary audit to ensure that suppliers are in conformity with its requirements.
The company also stipulates in its contracts with key suppliers, the requirement for their compliance with local laws and the company's Code of Social Responsibility. Once a supplier is discovered to have conducted itself in contravention of such | There is no departure from Corporate Social Responsibility Best Practice Principles for TWSE/GTSM listed companies. | |
| 235 |
| Assessed areas: | Operation | Departure from Corporate Social Responsibility Best Practice Principles for TWSE/GTSM listed companies and reasons | ||
| Yes | No | Summary | ||
| suppliers include termination clauses which come into force once the suppliers breach the corporate social responsibility policy and cause significant impact on the environment and society? | requirements the company will conduct investigation. In serious cases it can even terminate its cooperation with such supplier. | |||
IV. Enhancing information disclosure
(1) Has the company disclosed relevant and reliable information regarding its corporate social responsibility on its website and the M.O.P.S.? | V
| To enable the public to understand the company's ideas and commitments with respect to its responses to sustainable development trends, as well as its efforts and adherence on related topics, the company makes public annually its Corporate Social Responsibility Report (in Chinese and English). It also provides PDF versions in its web portal (http://www.aseglobal.com). Key information on the company's corporate social responsibility is also disclosed in the Market Observation Post System. | There is no departure from Corporate Social Responsibility Best Practice Principles for TWSE/GTSM listed companies. | |
V. If the Company has established the corporate social responsibility principles based on "Corporate Social Responsibility Best Practice Principles for TWSE/TPEx Listed Companies", please describe any discrepancy between the principles and their implementation: The company has in conformity with "Corporate Social Responsibility Best Practice Principles for TWSE/TPEx Listed Companies" formulated in 2015 its Code of Corporate Social Responsibility. The said Code was approved by its Board of Directors and posted on its web portal (http://www.aseglobal.com). Furthermore its practice does not deviate significantly from the said Code. VI. Other important information to facilitate a better understanding of the company’s corporate social responsibility practices: (1) For other information on the company's CSR operation please refer to the company's CSR Report (http://www.aseglobal.com). (2) The company has made long-standing effort to repay the society. It does so through the "Warmer Charity Foundation" and "ASE Cultural | ||||
| 236 |
| Assessed areas: | Operation | Departure from Corporate Social Responsibility Best Practice Principles for TWSE/GTSM listed companies and reasons | ||
| Yes | No | Summary | ||
Educational Foundation" and participation in social welfare activities. The company's employees generously contribute their time, funds and professional skills to help resolve urgent needs and children's educational needs. They provide the greatest support for our fulfillment of our social responsibility and our commitments. The company hopes that through long-term cooperation and communication with neighboring residents and members of the public, it will establish a trusting and harmonious relationship with them. Indeed the company spares no effort in creating a positive and socially-beneficial business environment. (3) Active participation in environmental-protection public welfare activities: In December 20, 2013 the company made a commitment to invest at least NTD100 million annually for 30 years in environmental-protection work in Taiwan. This will be done through long-term planning and diverse angles. At present the company has planned and executed numerous environmental-protection public welfare activities through its "ASE Cultural and Educational Foundation". Important projects include: 1. Promotion of environmental education (construction of green classroom and plan for propagation of environmental-protection concepts/environmental education audio and video programs/South Region environmental education proposal/academic research and studies program for environmental technology/thesis subsidy for post-graduate and doctoral studies on environmental protection.) 2. Improvement of environmental quality (tree-planting program/Nantze Processing Zone landscaping fence.) 3. Reduction of environmental impact (campus LED proposal/Nantze Processing Zone's resource recycling model plant operation/proposal for promotion of green supply chain/dengue fever control.) 4. Promotion of environmental protection art and culture (Yayoi Kusama environmental art and cultural promotion/environmental theme opera - Adventures Under the Sea). (4) Participation in charitable and care activities: In 2015 the company was able to rally employees in the Group and raised over NTD10 million. The fund was used through "ASE Cultural and Educational Foundation" towards under-privileged children and needy communities. The Foundation also provides emergency aid. Regional public welfare activities participated by the Foundation include: 1. Child care center for under-privileged families (after-school care for children/course tutoring/character education/family visits and counseling/parenthood talks etc.) 2. Subsidies for students from needy families (provision of lunch/study subsidies for primary, secondary and pre-university students in public schools near Kaohsiung and Chungli Plants.) 3. Emergency aid fund (provision of aid funds to families in need near Kaohsiung and Chungli Plants due to special emergencies or accidents.) | ||||
| 237 |
| Assessed areas: | Operation | Departure from Corporate Social Responsibility Best Practice Principles for TWSE/GTSM listed companies and reasons | ||
| Yes | No | Summary | ||
4. Sponsorship of aid funds of public welfare units (sponsorship was extended to 20 public welfare organizations in 2015, including donations to medical fund for the under-privileged and assistance in organization of public welfare activities.) (5) Promotion of collaboration between industry and academia: Collaboration with numerous universities (NTHU, Tungnan University, Chung Yuan, Yuan Ze, National Sun Yat Sen, National Cheng Kung, Kaohsiung Normal, Kaohsiung First Tech, Kaohsiung University of Applied Sciences, Kaohsiung Marine, Pingtung University of Science and Technology and Kao Yuan University, etc.) This does not only increase the channels for the company's recruitment but also foster job opportunities for local students as well as improve the company's partnership with universities, thereby enhancing academic research and industrial technology. The achievements were impressive. In 2015 the company will continue to expand its program such as to achieve benefit for all parties involved. (6) A childcare center for employees was set up in the company's Chungli Plant. Qualified teachers were engaged to look after employees' children, relieving employees of the stress of looking after children while working. VII. If the corporate social responsibility reports have received assurance from external institutions, they should state so below: None
From 2010 to 2014 the company has been publishing annually its corporate social responsibility report, the contents of which are compiled in accordance with the Guidelines of Global Reporting Initiative (GRI) and accountability principle standard (APS) under AA1000. The company also voluntarily obtained verification statement from third party (BSI) with respect to its compliance of G3.1 A+ application level. The company's 2015 Corporate Social Responsibility report was compiled using the core options in the Guidelines of Global Reporting Initiative (GRI). The company also obtained confirmation from Deloitte. The said confirmation was an independent 'limited assurance' under ISAE 3000. | ||||
| 238 |
(6) Ethical corporate management and measures adopted:
| Assessed areas: | Operation | Departure from "Ethical Corporate Management Best Practice Principles for TWSE/GTSM Listed Companies" and reasons | ||
| Yes | No | Summary | ||
I. Establishment of ethical corporate management policy and approaches
(1) Has the company declared its ethical corporate management policies and procedures in its rules and external documents, as well as the commitment of its Board of Directors and management to implementing the management policies? (2) Has the company established policies to prevent unethical conduct with relevant procedures, guidelines of conduct, punishment for violation, rules of appeal clearly stated in the policies, and implemented the policies? (3) Has the company | V
V
V
| The company's Board of Directors has passed relevant operating rules, i.e. "ASE Group Code of Business Conduct and Ethics" and "Guidelines on Ethical Operation". They are disclosed in the company's web portal. Please see: http://www.aseglobal.com.
The company intends to formulate operating procedure, code of behavior and complaint regulations in 2016 in accordance with the aforesaid Code. For work ethics the company has already in place its regulations on ethical behavior and penalties for infringement. All employees have been advised to comply with such regulations.
The company expressly prohibits in its Code of Ethics, the following behavior by its directors, managers and employees. This prohibition is being supervised and monitored through its internal audit. The company's aim is to establish an honest business environment: 1. Giving and accepting bribes; 2. Giving illegal political contributions; 3. Improper charity donation or sponsorship; 4. Giving or accepting unreasonable gifts, entertainment or other benefits; | There was no departure from "Ethical Corporate Management Best Practice Principles for TWSE/GTSM Listed Companies". | |
| 239 |
| Assessed areas: | Operation | Departure from "Ethical Corporate Management Best Practice Principles for TWSE/GTSM Listed Companies" and reasons | ||
| Yes | No | Summary | ||
| established appropriate precautionary measures for operating activities with higher risk of unethical conducts provided in Paragraph 2, Article 7 of the Ethical Corporate Management Best-Practice Principles for TWSE/TPEx Listed Companies or within its scope of business? | 5. Infringe business secrets, trademark, patent, copyright and other intellectual property rights; 6. Carrying out unfair competition. | |||
II. Implementation of ethical corporate management (1) Has the company evaluated the ethical records of parties it does business with and stipulated ethical conduct clauses in business contracts? (2) Has the company established a dedicated (concurrent) unit under the board of directors to promote ethical corporate | V
V
V
V
| Before commencing business dealings the company will first conduct credit checks on potential business partners. It eliminates subjects with poor record of integrity. It also specify integrity as a requisite behavior in its business contracts.
The company has also incorporated integrity and moral values in its operating policies. It conducts propagation of integrity for newly-recruited and existing employees. The company proposes to establish in 2016 a dedicated (concurrent) unit to promote ethical corporate management. It will be required to regularly report the status of implementation to the Board of Directors.
The company exercises a high degree of discipline. For Board deliberations
| There was no departure from "Ethical Corporate Management Best Practice Principles for TWSE/GTSM Listed Companies".
| |
| 240 |
| Assessed areas: | Operation | Departure from "Ethical Corporate Management Best Practice Principles for TWSE/GTSM Listed Companies" and reasons | ||
| Yes | No | Summary | ||
management, and reported the status of implementation to the Board of Directors? (3) Has the company established policies to prevent conflict of interests, provided appropriate channels for filing related complaints and implemented the policies accordingly? (4) Has the company had effective accounting system and internal control systems set up to facilitate ethical corporate management, and have those systems been audited by either internal auditors or CPAs on a regular basis? (5) Has the company held internal and external educational trainings on | V
| involving conflict of interest members of the Board who are affected are required to abstain in such deliberations and voting. Board members are not disallowed to support each other's motions.
The company regularly conducts audit to prevent insider trading.
The company has in place a comprehensive accounting system and internal control regime. It does not allow outside or retain secret accounts. To ensure sustained effect of the systems' design and implementation the company's internal audit staff conduct ad hoc checks on their compliance.
The company also conducts from time to time during each year training on integrity for its senior management. It also carries out propagation of ethical behavior by its suppliers.
| ||
| 241 |
| Assessed areas: | Operation | Departure from "Ethical Corporate Management Best Practice Principles for TWSE/GTSM Listed Companies" and reasons | ||
| Yes | No | Summary | ||
| operational integrity regularly? | ||||
III. Operation of whistleblowing system
(1) Has the company established concrete whistleblowing and reward system and had a convenient reporting channel in place, and assign an appropriate person to communicate with the accused? (2) Has the company established standard operating procedures for investigating reported cases and related confidentiality mechanism? (3) Has the company provided proper whistle blower protection? | V
| V
V
| The company has in place a whistle blower channel (including general manager's mailbox and anti-fraud complaint mailbox). Its whistleblowing rules are set out in its Code of Ethics.
The company proposes to establish in 2016, after its whistle blower regulations, standard operating procedure for lodgment of complaints and confidentiality rules.
The company also intends to formulate and adopt in 2016 protection measures for whistle blowers. | There was no departure from "Ethical Corporate Management Best Practice Principles for TWSE/GTSM Listed Companies".
The company is in the process of undertaking improvement.
The company is in the process of undertaking improvement. |
| 242 |
| Assessed areas: | Operation | Departure from “Ethical Corporate Management Best Practice Principles for TWSE/GTSM Listed Companies” and reasons | ||
| Yes | No | Summary | ||
IV. Enhancing information disclosure (1) Has the company disclosed information regarding the company’s ethical corporate management principles and implementation status on its website and the M.O.P.S.? | V
| The company has posted on its web portal relevant rules on ethical operations including “ASE Group Code of Business Conduct and Ethics” and “Guidelines on Ethical Operation”. It also discloses its ethical operations in its annual report. The company plans to set up in its web portal information on results of its implementation of the said rules.
| There is no departure from “Ethical Corporate Management Best Practice Principles for TWSE/GTSM Listed Companies” | |
V. If the company has established Ethical Corporate Management Principles in accordance with the "Ethical Corporate Management Best Practice Principles for TWSE/TPEx Listed Companies", describe any discrepancy between the principles and their implementation: In keeping with the "Ethical Corporate Management Best-Practice Principles for TWSE/TPEx Listed Companies" the company had in 2015 formulated its ethical guidelines. The guidelines were passed by its Board of Directors and duly disclosed in its web portal (http://www.aseglobal.com). The company's actual operations have not deviated from the guidelines. | ||||
| 6. Other important information that is helpful in understanding the company's ethical operations (such as review and revision by the company of its ethical operation guidelines, etc.) None. | ||||
(7) If the company has established corporate governance principles and related guidelines, disclose the means of accessing this information: “Corporate Governance Best-Practice Principles”, “Corporate Social Responsibility Best Practice Principles” and “Ethical Corporate Management Best Practice Principles” of the company are disclosed in its web portal (http://www.aseglobal.com).
(8) Resignation and dismissal of managerial officers related to the financial report (including Chairperson of the Board, General Manager, chief accounting officer, chief financial officer, chief R&D officer and chief internal auditor) in the past year and up to the date of report: None.
(9) Other significant information which may improve the understanding of corporate governance and operation: None.
| 243 |
VI. Important Resolutions, Articles of Incorporation and Relevant Laws and Regulations
1. Key resolution records and text of resolution on the current issue:
Please refer to pages 202 to 203.
| 244 |
Advanced Semiconductor Engineering, Inc.
Statement of Internal Control Regulations
Date:March 16, 2016
The Company hereby makes the following statement about its internal control system for the year 2015 based on its self-examination:
| I. | The Company acknowledges and understands that the establishment, enforcement and maintenance of the internal control system are the responsibility of the Board of Directors and management, and that the company has already established such a system.The purpose is to provide reasonable assurance to the effectiveness and efficiency of business operations (including profitability, performance and security of assets), reliability of reports and compliance with relevant regulatory requirements in reaching compliance targets. |
| II. | There are inherent limitations to even the most well designed internal control system. As such, an effective internal control system can only reasonably ensure the achievement of the aforementioned goals. Moreover, the operating environment and situation may change and impact the effectiveness of the internal control system.The internal control system of the Company features a self-monitoring mechanism. Once identified, any deficiency will be rectified immediately. |
| III. | The Company determines whether the design and implementation of its internal control system is effective by referring to the criteria stated in the "Regulations Governing Establishment of Internal Control Systems by Public Companies" (hereinafter, the "Regulations"). The Regulations provides measures for judging the effectiveness of the internal control system.There are five components of an internal control system as specified in the Regulations which are broken down based on the management control process, namely:1. Control environment, 2. Risk assessment, 3. Procedural control, 4. Information and communication, and 5. Supervision.Each of the components in turn contains certain audit items.Please refer to the Regulations for details. |
| IV. | The Company has adopted the aforementioned measures for an evaluation of the effectiveness of the design and implementation of the internal control system. |
| V. | Based on the findings of the aforementioned examination, the Company believes it can reasonably assure that the design and implementation of its internal control system as of December 31, 2015 (including supervision and management of subsidiaries), including the effectiveness and efficiency in operation, reliability, promptness and transparency of reports and compliance with relevant regulatory requirements, have achieved the aforementioned objectives. |
| VI. | This statement shall be an integral part of the annual report and prospectus of the company and will be made public.If any fraudulent information, concealment or unlawful practices are discovered in the content of the aforementioned information, the Company shall be held liable under Article 20, Article 32, Article 171 and Article 174 of the Securities and Exchange Act. |
| VII. | This statement was approved by the Board on March 16, 2016 in the presence of 10 Directors, who concurred unanimously. |
| Advanced Semiconductor Engineering, Inc. |
| Chairman:Jason C.S. Chang |
| General Manager:Richard H.P. Chang |
| 245 |
Summary Opinion of Underwriter
Advanced Semiconductor Engineering, Inc. (hereinafter referred to as ASE or the Company) issues 300,000,000 shares in common stocks at a face value of NT$10 per share, amounting to NT$3,000,000,000 in total issuance value for the cash capital increase. It files an application with the Financial Supervisory Commission in accordance with regulations. Upon undertaking necessary counseling and evaluation by the Underwriter including understanding the company's operating status, interviews or meetings with the company's directors, managers and other relevant staff, collation, compilation, verification and comparison and analysis, the Underwriter has given the proposed issue and offering by the company careful evaluation.Pursuant to the Financial Supervisory Commission's "Regulations Governing the Offering and Issuance of Securities by Issuers", "Taiwan Securities Association Rules for Information to be Published in Securities Underwriter Evaluation Reports on Offering and Issuance of Securities by Securities Issuers" and "Taiwan Securities Association Rules for Information to be Published in Securities Underwriter Evaluation Reports on Offering and Issuance of Securities by Securities Issuers", the Underwriter hereby issues its Summary Opinion.
According to the opinion of the Underwriter, the offering and issuance of securities by Advanced Semiconductor Engineering, Inc. are consistent with the regulations in the "Regulations Governing the Offering and Issuance of Securities by Securities Issuers" and related regulations. The feasibility and necessity of the plan, the use and progress of funds, and the expected results are also considered to be reasonable.
| KGI Securities Co., Ltd. |
| Legal Representative: Hsu Daw-yi |
| Supervisor of Underwriting Department:Lin Neng-Xian |
| Date: |
| 246 |
Attorney's legal opinion
Advanced Semiconductor Engineering, Inc. accepts subscriptions and issues 30,000,000 registered shares in common stocks at a face value of NT$10 per share, amounting to NT$3,000,000,000 in total issuance value in the cash capital increase. It files an application with the Financial Supervisory Commission. The Attorney has undertaken necessary review procedures including company visits, interviews or meetings with the company's directors, managers and other relevant staff, collation, compilation, and verification of the company's meeting minutes, important contracts, and other related documents and material, as well as opinions of related experts.The Attorney's legal opinion is provided in accordance with regulations in the "Regulations Governing the Offering and Issuance of Securities by Securities Issuers."
According to the opinion of the Attorney, no violations of regulations have been discovered in the items in the legal item check list submitted by Advanced Semiconductor Engineering, Inc. to the Financial Supervisory Commission which would affect the offering and issuance of the securities.
To
Advanced Semiconductor Engineering, Inc.
| Handsome Attorneys-at-Law |
| Qiu Ya-Wen |
| Date: (month) (date), 2016 |
| 247 |
Summary Opinion of Underwriter
| 248 |
Attorney's legal opinion
| 249 |
Advanced Semiconductor Engineering, Inc.
2016 14th Board of Directors Meeting Minutes (Excerpt)
I. Date and time: 4:00PM, December 8, 2016
II. Location: Conference room of the Company
III. Attending Directors: Jason C.S. Chang (Joseph Tung as proxy), Tien Wu (attending via video conference), Joseph Tung, Raymond Lo (Tien Wu as proxy), Tien-Szu Chen (attending via video conference), Jeffrey Chen (Tien-Szu Chen as proxy), Shen-Fu Yu, Ta-Lin Hsu, Mei-Yueh Ho, for a total of 9 in attendance. Richard H.P. Chang and Rutherford Chang are on leave and unable to attend
IV. In attendance:Li-Bin Guo (Auditing Chief Kun-Huang Wu is on a business trip, therefore in accordance with the relevant job authority and deputy regulations of the Company, deputy Li-Bin Guo is listed in attendance and is participating via video conference)
V. Presided by: Joseph Tung corded by: Mei-Hui Li
VI. Announcements: The Chairman of the Company Jason C.S. Chang is unable to attend and preside over this board director's meeting, and Vice Chairman Richard H.P. Chang is unable to attend for due reason, therefore Chairman Jason C.S. Chang has delegated I, Joseph Tung to act as proxy for the attendance of this board directors' meeting and to preside as chairman.
VII. Discussions:
Proposal 1:
Cause of action: The company plans to conduct issuance of ordinary shares for increasing domestic cash capital by means of public subscription and placement, and hereby submits the proposal for review and approval.
Explanation: 1. To accommodate future production capacity expansion plans, substantiate operating funds, repay bank loans or other capital needs that facilitate the long term developments of the Company, the Company has by resolution of the shareholders' meeting on June 28, 2016 authorized the Board of Directors to conduct one or more of the following financing methods individually or concurrently as deemed appropriate: cash capital increase via issuance of ordinary shares for participation in issuance of global depository receipts, domestic cash capital increase via issuance of ordinary shares, overseas discretionary convertible corporate bonds. New shares issued for domestic cash capital increases shall amount to no more than 500,000,000 ordinary shares and shall be conducted in either one of the following two manners: public subscription and placement, or book building subscription.
2. To repay bank loans and reduce interest expenditures, the company proposes to, in accordance with authorization granted to the Board of Directors by the shareholders' meeting on June 28, 2016, conduct domestic cash capital increase via issuance of 300,000,000 ordinary shares for public subscription and placement.
3. This issuance of ordinary shares for increasing domestic cash capital shall be conducted in the following manner:
| (1) | The issue price of this cash capital increase is established in accordance with the regulations of the "Taiwan Securities Association Self-Disciplinary Regulations on Underwriter Members for Subscription and Issuance of Securities by Issuing Company," and shall be no lower than 70 percent of the simple arithmetic mean of the closing ordinary share price five business days prior to registering with the FSC for a public offering and ex-rights date after factoring out ex-rights trading in connection with issuance of stock dividends and ex-dividend trading.The Company has tentatively fixed the share issue price at NT$31.50 per share at the time of registering with the FSC, actual issue price as authorized by the Chairman shall become effective with the competent authority's approval and jointly determined by the underwriter according to actual market conditions within the above stated range in compliance with laws and regulations.(2) If the funds raised are insufficient due to adjustment in the offer price of the new ordinary shares as a result of market changes and in compliance with laws and regulations, the difference will be supplemented by proprietary funds; in the event of an excess in funds raised, excess funds shall contribute toward the repayment of bank loans. |
| (2) | Pursuant to the requirements under Article 267 of the Company Act, 10% of new shares issued will be set aside for subscription by the company's employees. Furthermore |
| 250 |
pursuant to Article 28-1 of the Securities Exchange Act, 10% of new shares issued will be set aside for public offering through underwriter by way of open subscription. The remaining 80% will be subscribed by original shareholders with their respective shareholding ratios on the shareholders’ roster at subscription record date. For fractional part of a share subscribed by shareholders, such shareholders shall proceed to the company's registrar within 5 days of the cessation of transfer registration to process subscription through aggregation of fractional entitlement. For shares for which the original shareholders or employees have relinquished their subscription rights or fractional parts of shares, the Chairman is authorized to negotiate with specific individuals to subscribe such shares or fractional parts at the issue price.
| (3) | The issuance of new shares for cash capital increase shall be conducted in book-entry form, are entitled to the same rights and obligations as those of the ordinary shares originally issued, and shall be listed with the Taiwan Stock Exchange. |
4. The sources of capital, project items, expected fund utilization and anticipated benefits of this program are as specified in Appendix 1.
5. Due to potential rapid fund raising changes in the capital market, in order to obtain full control of the formulation of issuance conditions and achieve timeliness in actual issuance operations, in the event the competent authority conducts modifications or modifications and adjustments are necessary due to subjective and objective concerns, it is hereby proposed that the Chairman of the Company or his delegate be granted full authority to modify or adjust all matters with regard to the preceding cash capital increase financing program, including issue amount, number of issued shares, issuance conditions, project items, issuance schedule, anticipated potential benefits, and other relevant matters.
6. Matters not addressed in the preceding paragraphs shall be subject to the discretion of the Chairman in accordance with the law.
7. The proposal has been approved by resolution of the Auditing Committee, and is hereby submitted for review and approval.
Resolution: The proposal is approved unanimously by attending Directors following proposition by the presiding Chairman.
VIII. Extempore motion: None.
IX. Meeting dismissed
Presided by: Joseph Tung
Recorded by: Mei-Hui Li |
| 251 |
Appendix 1
Advanced Semiconductor Engineering, Inc.
Calculation of Underwriting Price of Cash Subscription Shares
Advanced Semiconductor Engineering, Inc.
Calculation of Underwriting Price of Cash Subscription Shares
| I | Description |
| (I) | Th paid-up capital of Advanced Semiconductor Engineering, Inc. ("ASE") at present isNT$79,499,748,460 with 7,949,974,846 ordinary shares issued, each with a face value of NT$10.The current issuance of new shares for cash to increase the company's capital has been approved by resolution of the Board of Directors' meeting held on December 8, 2016, under which 300,000,000 new ordinary shares each with a face value of NT$10 will be issued. After the share capital increase the company's paid-up capital will be NT$82,499,748,460. |
| (II) | Pursuant to the requirements under Article 267 of the Company Act, 10% of the new shares issued, i.e. 30,000,000 shares will be set aside for subscription by the company's employees. Furthermore pursuant to Article 28-1 of the Securities Exchange Act, 10% of new shares issued, i.e. 30,000,000 shares will be set aside for public offering through underwriter by way of open subscription. The remaining 80%, i.e. 240,000,000 shares will be subscribed by original shareholders with their respective shareholding ratios on the shareholders’ roster at subscription record date. For fractional part of a share subscribed by shareholders, such shareholders shall proceed to the company's registrar within 5 days of the cessation of transfer registration to process subscription through aggregation of fractional entitlement. For shares for which the original shareholders or employees have relinquished their subscription rights or fractional parts of shares, the Board of Directors authorizes the Chairman to negotiate with specific individuals to subscribe such shares or fractional parts at the issue price. |
| (III) | The new shares issued by this cash capital increase shall have the same rights and obligations as those of the ordinary shares originally issued. |
| (IV) | For this share issue the shares to be subscribed by original shareholders, employees and underwriter and those offered for public subscription shall have the same subscription price. |
| II | The company's financial status during the past 3 years |
| (I) | Net earnings per share and share dividend per share during the most recent period and the last 3 years are as set out in the Table below: |
| 1 |
| Unit:NT$/share |
| Net earnings per share (Note 1) | Dividend distribution | |||
| Cash dividend | Stock dividend | Total | |||
| Earnings | Capital reserve | ||||
| 2013 | 2.09 | 1.30 | ─ | ─ | 1.30 |
| 2014 | 3.07 | 2.00 | ─ | ─ | 2.00 |
| 2015 | 2.55 (Note 2) | 1.60 | ─ | ─ | 1.60 |
| 2016Q3 | 1.79 | ─ | ─ | ─ | ─ |

Source: The company's audited financial reports during the respective periods
Note 1: Earnings per share are calculated based on weighted average shares in circulation during the current year
Note 2: As of September 30, 2016, said company completed all identification of invested capital and the difference in net fair value between identifiable assets and liabilities of Silicon Precision Industries Co., Ltd. to which the company is entitled. Retroactive adjustments were made to the 2015 financial report, and earnings per share was retroactively adjusted to NT$2.51
| (II) | Shareholder's Equity per share as at September 30, 2016 calculated based on shares in circulation. |
| Description | Amount |
| Shareholder's Equity attributable to the parent company | NT$150,158,984,000 |
| Total shares issued as at September 30, 2016 (note) | 7,816,690,000 |
| Net book value per share as at September 30, 2016 | 19.21 (NT$/share) |
Source: The company's audited financial reports for 2016Q3
Note: Includes advance receipts for capital stock after deducting treasury shares
| 2 |
| (III) | Audited financial reports for the last 3 years |
1. Summary Balance Sheet
Unit:NT$ 1,000
| Financial information for the most recent 5 fiscal years (note) | Financial Information as at September 30, 2016 | |||
| 2013 | 2014 | 2015 | |||
| Current assets | 132,176,482 | 159,955,190 | 156,732,840 | 143,369,196 | |
| Financial assets for sale - Non-current | 1,140,329 | 941,105 | 924,362 | 1,103,939 | |
| Investment accounted for using equity method | 1,216,201 | 1,492,441 | 37,141,552 | 49,515,448 | |
| Property, plant and equipment | 131,497,331 | 151,587,115 | 149,997,075 | 145,208,855 | |
| Intangible assets | 11,953,644 | 11,913,286 | 11,888,612 | 12,217,117 | |
| Other assets | 8,829,919 | 8,095,630 | 8,321,759 | 9,213,165 | |
| Total assets | 286,813,906 | 333,984,767 | 365,006,200 | 360,627,720 | |
| Current liabilities | Pre-distribution | 100,835,276 | 111,199,467 | 120,502,072 | 118,397,190 |
| Post-distribution | 110,991,281 | 126,789,292 | 132,978,851 | N/A | |
| Non-current liabilities | 58,813,671 | 64,347,296 | 76,365,603 | 81,013,087 | |
| Total liabilities | Pre-distribution | 159,648,947 | 175,546,763 | 196,867,675 | 199,410,277 |
| Post-distribution | 169,804,952 | 191,136,588 | 209,344,454 | N/A | |
| Shareholder's Equity attributable to the parent company | 123,020,621 | 150,218,907 | 156,634,647 | 150,158,984 | |
| Share capital | 78,180,258 | 78,715,179 | 79,185,660 | 79,509,050 | |
| Capital reserve | 7,908,870 | 16,013,058 | 23,757,099 | 22,461,952 | |
| Retained earnings | Pre-distribution | 38,993,154 | 52,381,238 | 55,902,712 | 57,135,885 |
| Post-distribution | 28,837,149 | 36,791,413 | 43,425,933 | N/A | |
| Other interests | (102,554) | 5,068,539 | 5,081,689 | (1,655,390) | |
| Treasury stock | (1,959,107) | (1,959,107) | (7,292,513) | (7,292,513) | |
| Non-controlling interests | 4,144,338 | 8,219,097 | 11,503,878 | 11,058,459 | |
| Total equity | Pre-distribution | 127,164,959 | 158,438,004 | 168,138,525 | 161,217,443 |
| Post-distribution | 117,008,954 | 142,848,179 | 155,661,746 | N/A | |
Source:The company's audited financial reports during the respective periods
| 3 |
2. Summary Consolidated Profit & Loss Statement
Unit:Except for earnings per share which are expressed in NT$, all other figures are NT$1,000.
| Financial information for the last 5 fiscal years | Financial Information as at September 30, 2016 | ||
| 2013 | 2014 | 2015 | ||
| Operating revenue | 219,862,446 | 256,591,447 | 283,302,536 | 197,755,474 |
| Gross profit | 42,813,744 | 53,588,529 | 50,135,228 | 37,817,099 |
| Net operating profit | 22,044,323 | 29,645,869 | 24,884,622 | 18,575,572 |
| Non-operating revenue and gains (Note 2) | (2,687,631) | (1,097,658) | 403,631 | (203,571) |
| Net income (loss) before tax (Note 2) | 19,356,692 | 28,548,211 | 25,288,253 | 18,372,001 |
| Net profit during current period for units operating as going concern (Note 2) | 16,155,040 | 24,281,585 | 20,449,007 | 14,555,214 |
| Loss for units which have ceased operations | - | - | - | - |
| Current period net profit (Note 2) | 16,155,040 | 24,281,585 | 20,449,007 | 14,555,214 |
Other consolidated profit & loss
(Net income after tax)
| 3,238,026 | 5,503,510 | (147,547) | (7,331,544) |
| Total consolidated profit & loss (Note 2) | 19,393,066 | 29,785,095 | 20,301,460 | 7,223,670 |
| Net profit attributable to shareholders of the parent company (Note 2) | 15,689,074 | 23,636,522 | 19,478,873 | 13,715,836 |
| Net profit attributable to non-controlling interest | 465,966 | 645,063 | 970,134 | 839,378 |
| Consolidated profit & loss attributable toowners of the parent company (Note 2) | 18,798,923 | 28,802,296 | 19,405,806 | 6,978,757 |
| 4 |
| Consolidated profit & loss attributable tonon-controlling interest | 594,143 | 982,799 | 895,654 | 244,913 |
| Earnings per share (retroactive adjustment) (Note 2) | 2.09 | 3.07 | 2.55 | 1.79 |
Source:The company's audited financial reports during the respective periods
Note:As at September 30, 2016 said company has completed identification of the difference between its investment cost and the fair value of identifiable assets and liabilities of Siliconware Precision Industries Co. Ltd. attributable to the company, with appropriate retroactive adjustments to the company's 2015 financial statements. After the aforesaid adjustments non-operating income and expenses were NT$122,274,000; net profit before tax was NT$25,006,896,000; net profit during current period for units operating as going concern during current period was NT$20,167,650,000; net profit during current period was NT$20,167,650,000; total consolidated profit & loss during current period was NT$20,020,103,000; net profit attributable to shareholders of the parent company was NT$19,197,516,000; consolidated profit & loss attributable to owners of the parent company was NT$19,124,449,000 and earnings per share were retroactively adjusted to NT$2.51.
| 5 |
| III | Calculation of Underwriting Price and Explanation |
| (I) | Reference factors for calculation of underwriting prices |
| 1. | The company's capital increase through share issuance proposal has been approved by way of resolution of its Board of Directors meeting held on December 8, 2016. The resolution also stipulates that the issue price of the new shares shall be in accordance with market changes and can be adjusted in accordance with Article 6 Paragraph 1 of the "Taiwan Securities Association Self-Disciplinary Regulations on Underwriter Members for Subscription and Issuance of Securities by Issuing Company". Furthermore the Chairman is authorized to make necessary adjustments to the relevant conditions based on objective conditions at the time of share issuance. |
| 2. | For the current issue the company plans to issue 300,000,000 new ordinary shares with a face value of NT$10 each. The issue price has been tentatively fixed at NT$34.30, and the total capital raised is fixed at NT$10,290,000,000.Pursuant to the requirements under Article 267 of the Company Act, 10% of the new shares issued, i.e. 30,000,000 shares will be set aside for subscription by the company's employees. Furthermore pursuant to Article 28-1 of the Securities Exchange Act, 10% of new shares issued, i.e. 30,000,000 shares will be set aside for public offering through underwriter by way of open subscription.The remaining 80%, i.e. 240,000,000 shares will be subscribed by original shareholders with their respective shareholding ratios on the shareholders’ roster at subscription record date. For fractional part of a share subscribed by shareholders, such shareholders shall proceed to said company's registrar within 5 days of the cessation of transfer registration to process subscription through aggregation of fractional entitlement.For shares for which the original shareholders or employees have relinquished their subscription rights or fractional parts of shares, the Board of Directors authorizes the Chairman to negotiate with specific individuals to subscribe such shares or fractional parts at the issue price. |
| 3. | The new shares issued by this cash capital increase shall have the same rights and obligations as those of the ordinary shares originally issued. |
| (II) | Explanation on price calculation |
| 1. | Based on the benchmark date of February 2, 2017 the average closing prices for the company's shares on the preceding trading day, preceding 3 trading days and preceding 5 trading days are NT$34.30, NT$33.78 and NT$34.00. The average closing price of NT$34.30 for the preceding 1 trading day shall be the reference price for the purpose of calculation. |
| 2. | With respect to the issuance of new shares for additional share capital, the underwriter KGI Securities Co., Ltd. has considered the market's overall situation, the company's |
| 6 |
| share price trend, ASE's operating performance and future prospects. KGI has, following joint consultation with ASE, fixed the share issue price at NT$34.30 per share. As such the underwriting price is in conformity with Article 6 of the "Taiwan Securities Association Self-Disciplinary Regulations on Underwriter Members for Subscription and Issuance of Securities by Issuing Company". |
| 7 |
Issuing company: Advanced Semiconductor Engineering, Inc.
Legal Representative: Chian-Sheng Chang
(This seal endorsement page is solely for Calculation of Underwriting Price of Cash Subscription Shares for 2017 Capital Increase Share Issuance by Advanced Semiconductor Engineering, Inc.)
Date:
| 8 |
Main Underwriter: KGI Securities Co., Ltd.
Legal Representative: Hsu Daw-yi
(This seal endorsement page is solely for Calculation of Underwriting Price of Cash Subscription Shares for 2017 Capital Increase Share Issuance by Advanced Semiconductor Engineering, Inc.)
Date:
| 9 |
Appendix 2
Advanced Semiconductor Engineering, Inc.
2014 Consolidated Financial statements and Auditor Report
Advanced Semiconductor Engineering, Inc. and Subsidiaries
Consolidated Financial Statements for the
Years Ended December 31, 2014 and 2013 and
Independent Auditors’ Report
REPRESENTATION LETTER
The entities that are required to be included in the combined financial statements of Advanced Semiconductor Engineering, Inc. as of and for the year ended December 31, 2014, under the Criteria Governing the Preparation of Affiliation Reports, Consolidated Business Reports and Consolidated Financial Statements of Affiliated Enterprises are the same as those included in the consolidated financial statements prepared in conformity with the International Accounting Standards No. 27, “Consolidated and Separate Financial Statements.” In addition, the information required to be disclosed in the combined financial statements is included in the consolidated financial statements. Consequently, Advanced Semiconductor Engineering, Inc. and Subsidiaries do not prepare a separate set of combined financial statements.
Very truly yours,
Advanced Semiconductor Engineering, Inc.
By
________________________
JASON C.S. CHANG
Chairman
February 26, 2015
INDEPENDENT AUDITORS’ REPORT
The Board of Directors and Shareholders
Advanced Semiconductor Engineering, Inc.
We have audited the accompanying consolidated balance sheets of Advanced Semiconductor Engineering, Inc. and its subsidiaries (collectively, the “Group”) as of December 31, 2014 and 2013, and the related consolidated statements of comprehensive income, changes in equity and cash flows for the years ended December 31, 2014 and 2013. These consolidated financial statements are the responsibility of the Group’s management. Our responsibility is to express an opinion on these consolidated financial statements based on our audits.
We conducted our audits in accordance with the Rules Governing the Audit of Financial Statements by Certified Public Accountants and auditing standards generally accepted in the Republic of China. Those rules and standards require that we plan and perform the audit to obtain reasonable assurance about whether the consolidated financial statements are free of material misstatement. An audit includes examining, on a test basis, evidence supporting the amounts and disclosures in the consolidated financial statements. An audit also includes assessing the accounting principles used and significant estimates made by management, as well as evaluating the overall consolidated financial statement presentation. We believe that our audits provide a reasonable basis for our opinion.
In our opinion, the consolidated financial statements referred to above present fairly, in all material respects, the consolidated financial position of the Group as of December 31, 2014 and 2013, and the consolidated results of operations and the consolidated cash flows for the years ended December 31, 2014 and 2013, in conformity with the Guidelines Governing the Preparation of Financial Reports by Securities Issuers and International Financial Reporting Standards, International Accounting Standards, IFRIC Interpretations and SIC Interpretations endorsed by the Financial Supervisory Commission of the Republic of China.
We have also audited the parent company only financial statements of Advanced Semiconductor Engineering, Inc. as of and for the years ended December 31, 2014 and 2013 on which we have issued an unqualified opinion.
February 26, 2015
Notice to Readers
The accompanying consolidated financial statements are intended only to present the consolidated financial position, results of operations and cash flows in accordance with accounting principles and practices generally accepted in the Republic of China and not those of any other jurisdictions. The standards, procedures and practices to audit such consolidated financial statements are those generally accepted and applied in the Republic of China.
For the convenience of readers, the independent auditors’ report and the accompanying consolidated financial statements have been translated into English from the original Chinese version prepared and used in the Republic of China. If there is any conflict between the English version and the original Chinese version or any difference in the interpretation of the two versions, the Chinese-language independent auditors’ report and consolidated financial statements shall prevail.
-3-
ADVANCED SEMICONDUCTOR ENGINEERING, INC. AND SUBSIDIARIES
CONSOLIDATED BALANCE SHEETS
(In Thousands of New Taiwan Dollars)
| December 31, 2014 | December 31, 2013 | |||||||||||||||
| ASSETS | NT$ | % | NT$ | % | ||||||||||||
| CURRENT ASSETS | ||||||||||||||||
| Cash and cash equivalents (Notes 4 and 6) | $ | 51,694,410 | 16 | $ | 45,026,371 | 16 | ||||||||||
| Financial assets at fair value through profit or loss - current (Notes 4, 5 and 7) | 4,988,843 | 2 | 2,764,269 | 1 | ||||||||||||
| Available-for-sale financial assets - current (Notes 4 and 8) | 1,533,265 | - | 2,376,970 | 1 | ||||||||||||
| Trade receivables, net (Notes 4 and 10) | 52,920,810 | 16 | 43,235,573 | 15 | ||||||||||||
| Other receivables (Note 4) | 537,122 | - | 422,345 | - | ||||||||||||
| Current tax assets (Note 4 and 24) | 65,312 | - | 150,596 | - | ||||||||||||
| Inventories (Notes 4, 5 and 11) | 20,163,093 | 6 | 16,281,236 | 6 | ||||||||||||
| Inventories related to real estate business | ||||||||||||||||
| (Notes 4, 5, 12, 23 and 34) | 23,986,478 | 7 | 18,589,255 | 6 | ||||||||||||
| Other financial assets - current (Notes 4 and 34) | 638,592 | - | 278,375 | - | ||||||||||||
| Other current assets | 3,427,265 | 1 | 3,051,492 | 1 | ||||||||||||
| Total current assets | 159,955,190 | 48 | 132,176,482 | 46 | ||||||||||||
| NON-CURRENT ASSETS | ||||||||||||||||
| Available-for-sale financial assets – | ||||||||||||||||
| non-current (Notes 4 and 8) | 941,105 | - | 1,140,329 | - | ||||||||||||
| Investments accounted for using the | ||||||||||||||||
| equity method (Notes 4 and 13) | 1,492,441 | 1 | 1,216,201 | 1 | ||||||||||||
| Property, plant and equipment | ||||||||||||||||
| (Notes 4, 5, 14, 23, 34 and 35) | 151,587,115 | 45 | 131,497,331 | 46 | ||||||||||||
| Goodwill (Notes 4, 5 and 15) | 10,445,415 | 3 | 10,347,820 | 4 | ||||||||||||
| Other intangible assets (Notes 4, 5, 16 and 23) | 1,467,871 | 1 | 1,605,824 | 1 | ||||||||||||
| Deferred tax assets (Notes 4 , 5 and 24) | 4,493,664 | 1 | 3,765,482 | 1 | ||||||||||||
| Other financial assets - non-current (Notes 4 and 34) | 367,345 | - | 354,993 | - | ||||||||||||
| Long-term prepayments for lease (Note 17) | 2,585,964 | 1 | 4,072,281 | 1 | ||||||||||||
| Other non-current assets | 635,350 | - | 637,163 | - | ||||||||||||
| Total non-current assets | 174,016,270 | 52 | 154,637,424 | 54 | ||||||||||||
| TOTAL | $ | 333,971,460 | 100 | $ | 286,813,906 | 100 | ||||||||||
| (Continued) |
-4-
ADVANCED SEMICONDUCTOR ENGINEERING, INC. AND SUBSIDIARIES
CONSOLIDATED BALANCE SHEETS
(In Thousands of New Taiwan Dollars)
| December 31, 2014 | December 31, 2013 | |||||||||||||||
| LIABILITIES AND EQUITY | NT$ | % | NT$ | % | ||||||||||||
| CURRENT LIABILITIES | ||||||||||||||||
| Short-term borrowings (Note 18) | $ | 41,176,033 | 12 | $ | 44,618,195 | 16 | ||||||||||
| Financial liabilities at fair value through | ||||||||||||||||
| profit or loss - current (Notes 4, 5 and 7) | 2,651,352 | 1 | 1,853,304 | 1 | ||||||||||||
| Derivative financial liabilities for hedging | ||||||||||||||||
| - current (Notes 4, 5 and 9) | - | - | 3,310 | - | ||||||||||||
| Trade payables | 35,411,281 | 11 | 28,988,976 | 10 | ||||||||||||
| Other payables (Note 20) | 22,364,516 | 7 | 14,758,553 | 5 | ||||||||||||
| Current tax liabilities (Note 4 and 24) | 4,150,036 | 1 | 3,000,869 | 1 | ||||||||||||
| Advance real estate receipts (Note 4) | 480,325 | - | 19,248 | - | ||||||||||||
| Current portion of bonds payable | ||||||||||||||||
| (Notes 4 and 19) | - | - | 731,438 | - | ||||||||||||
| Current portion of long-term borrowings | ||||||||||||||||
| (Notes 18 and 34) | 2,831,007 | 1 | 5,276,206 | 2 | ||||||||||||
| Other current liabilities | 2,134,917 | 1 | 1,585,177 | - | ||||||||||||
| Total current liabilities | 111,199,467 | 34 | 100,835,276 | 35 | ||||||||||||
| NON-CURRENT LIABILITIES | ||||||||||||||||
| Bonds payable (Notes 4 and 19) | 31,270,131 | 10 | 20,582,567 | 7 | ||||||||||||
| Long-term borrowings (Notes 18 and 34) | 24,104,424 | 7 | 29,580,659 | 11 | ||||||||||||
| Deferred tax liabilities (Notes 4, 5 and 24) | 3,932,819 | 1 | 2,663,767 | 1 | ||||||||||||
| Long-term payables (Note 20) | - | - | 894,150 | - | ||||||||||||
| Accrued pension cost (Notes 4, 5 and 21) | 4,371,136 | 1 | 4,441,357 | 2 | ||||||||||||
| Other non-current liabilities | 657,392 | - | 651,171 | - | ||||||||||||
| Total non-current liabilities | 64,335,902 | 19 | 58,813,671 | 21 | ||||||||||||
| Total liabilities | 175,535,369 | 53 | 159,648,947 | 56 | ||||||||||||
| EQUITY ATTRIBUTABLE TO OWNERS OF | ||||||||||||||||
| THE COMPANY (Notes 4 and 22) | ||||||||||||||||
| Share capital | ||||||||||||||||
| Ordinary shares | 78,525,378 | 24 | 77,560,040 | 27 | ||||||||||||
| Shares subscribed in advance | 189,801 | - | 620,218 | - | ||||||||||||
| Total share capital | 78,715,179 | 24 | 78,180,258 | 27 | ||||||||||||
| Capital surplus | 15,995,671 | 5 | 7,908,870 | 3 | ||||||||||||
| Retained earnings | ||||||||||||||||
| Legal reserve | 10,289,878 | 3 | 8,720,971 | 3 | ||||||||||||
| Special reserve | 3,353,938 | 1 | 3,663,930 | 2 | ||||||||||||
| Unappropriated earnings | 38,753,462 | 12 | 26,608,253 | 9 | ||||||||||||
| Total retained earnings | 52,397,278 | 16 | 38,993,154 | 14 | ||||||||||||
| Other Equity | 5,067,931 | 1 | (102,554 | ) | - | |||||||||||
| Treasury shares | (1,959,107 | ) | (1 | ) | (1,959,107 | ) | (1 | ) | ||||||||
| Equity attributable to owners of | ||||||||||||||||
| the Company | 150,216,952 | 45 | 123,020,621 | 43 | ||||||||||||
| NON-CONTROLLING INTERESTS | ||||||||||||||||
| (Notes 4 and 22) | 8,219,139 | 2 | 4,144,338 | 1 | ||||||||||||
| Total equity | 158,436,091 | 47 | 127,164,959 | 44 | ||||||||||||
| TOTAL | $ | 333,971,460 | 100 | $ | 286,813,906 | 100 | ||||||||||
The accompanying notes are an integral part of the consolidated financial statements. | (Concluded) |
-5-
ADVANCED SEMICONDUCTOR ENGINEERING, INC. AND SUBSIDIARIES
CONSOLIDATED STATEMENTS OF COMPREHENSIVE INCOME
(In Thousands of New Taiwan Dollars Except Earnings Per Share)
| For the Years Ended December 31 | ||||||||||||||||
| 2014 | 2013 | |||||||||||||||
| NT$ | % | NT$ | % | |||||||||||||
| OPERATING REVENUES (Note 4) | $ | 256,591,447 | 100 | $ | 219,862,446 | 100 | ||||||||||
| OPERATING COSTS (Notes 11, 21 and 23) | 203,051,691 | 79 | 177,048,702 | 81 | ||||||||||||
| GROSS PROFIT | 53,539,756 | 21 | 42,813,744 | 19 | ||||||||||||
| OPERATING EXPENSES (Notes 21 and 23) | ||||||||||||||||
| Selling and marketing expenses | 3,439,258 | 2 | 2,983,874 | 1 | ||||||||||||
| General and administrative expenses | 10,233,878 | 4 | 8,716,529 | 4 | ||||||||||||
| Research and development expenses | 10,295,363 | 4 | 9,069,018 | 4 | ||||||||||||
| Total operating expenses | 23,968,499 | 10 | 20,769,421 | 9 | ||||||||||||
| PROFIT FROM OPERATIONS | 29,571,257 | 11 | 22,044,323 | 10 | ||||||||||||
| NON-OPERATING INCOME AND | ||||||||||||||||
| EXPENSES | ||||||||||||||||
| Other income (Note 23) | 588,875 | - | 557,014 | - | ||||||||||||
| Other gains (losses), net (Note 23) | 776,290 | 1 | (963,490 | ) | - | |||||||||||
| Finance costs (Note 23) | (2,354,097 | ) | (1 | ) | (2,307,455 | ) | (1 | ) | ||||||||
| Share of the profit (loss) of associates | ||||||||||||||||
| and joint ventures (Note 4) | (108,726 | ) | - | 26,300 | - | |||||||||||
| Total non-operating income and | ||||||||||||||||
| expenses | (1,097,658 | ) | - | (2,687,631 | ) | (1 | ) | |||||||||
| PROFIT BEFORE INCOME TAX EXPENSE | 28,473,599 | 11 | 19,356,692 | 9 | ||||||||||||
| INCOME TAX EXPENSE (Notes 4, 5 | ||||||||||||||||
| and 24) | 4,251,513 | 1 | 3,201,652 | 2 | ||||||||||||
| NET PROFIT FOR THE YEAR | 24,222,086 | 10 | 16,155,040 | 7 | ||||||||||||
(Continued)
-6-
ADVANCED SEMICONDUCTOR ENGINEERING, INC. AND SUBSIDIARIES
CONSOLIDATED STATEMENTS OF COMPREHENSIVE INCOME
(In Thousands of New Taiwan Dollars Except Earnings Per Share)
| For the Years Ended December 31 | ||||||||||||||||
| 2014 | 2013 | |||||||||||||||
| NT$ | % | NT$ | % | |||||||||||||
| OTHER COMPREHENSIVE INCOME | ||||||||||||||||
| (LOSS) | ||||||||||||||||
| Exchange differences on translating | ||||||||||||||||
| foreign operations | $ | 5,404,358 | 2 | $ | 2,817,268 | 2 | ||||||||||
| Unrealized gain (loss) on available-for-sale | ||||||||||||||||
| financial assets | (133,714 | ) | - | 14,839 | - | |||||||||||
| Cash flow hedges | 3,279 | - | 1,245 | - | ||||||||||||
| Remeasurement of defined benefit | ||||||||||||||||
| obligation | (45,884 | ) | - | 418,843 | - | |||||||||||
| Share of other comprehensive income | ||||||||||||||||
| of associates and joint ventures | 234,125 | - | 55,183 | - | ||||||||||||
| Income tax relating to items that will not | ||||||||||||||||
| be reclassified subsequently | 13,039 | - | (69,352 | ) | - | |||||||||||
| Other comprehensive income for | ||||||||||||||||
| the year, net of income tax | 5,475,203 | 2 | 3,238,026 | 2 | ||||||||||||
| TOTAL COMPREHENSIVE INCOME | ||||||||||||||||
| FOR THE YEAR | $ | 29,697,289 | 12 | $ | 19,393,066 | 9 | ||||||||||
| NET PROFIT ATTRIBUTABLE TO: | ||||||||||||||||
| Owners of the Company | $ | 23,592,667 | 10 | $ | 15,689,074 | 7 | ||||||||||
| Non-controlling interests | 629,419 | - | 465,966 | - | ||||||||||||
| $ | 24,222,086 | 10 | $ | 16,155,040 | 7 | |||||||||||
| TOTAL COMPREHENSIVE INCOME | ||||||||||||||||
| ATTRIBUTABLE TO: | ||||||||||||||||
| Owners of the Company | $ | 28,730,614 | 11 | $ | 18,798,923 | 9 | ||||||||||
| Non-controlling interests | 966,675 | 1 | 594,143 | - | ||||||||||||
| $ | 29,697,289 | 12 | $ | 19,393,066 | 9 | |||||||||||
| EARNINGS PER SHARE (Note 25) | ||||||||||||||||
| Basic | $ | 3.07 | $ | 2.09 | ||||||||||||
| Diluted | $ | 2.95 | $ | 2.03 | ||||||||||||
The accompanying notes are an integral part of the consolidated financial statements. | (Concluded) |
-7-
ADVANCED SEMICONDUCTOR ENGINEERING, INC. AND SUBSIDIARIES
CONSOLIDATED STATEMENTS OF CHANGES IN EQUITY
(In Thousands of New Taiwan Dollars)
| Equity Attributable to Owners of the Company | |||||||||||||||||||||||||||||||||||||||||||||
| Other Equity | |||||||||||||||||||||||||||||||||||||||||||||
| Share Capital | Retained Earnings | ||||||||||||||||||||||||||||||||||||||||||||
| Shares (In Thousands) | Amounts | Capital Surplus | Legal Reserve | Special Reserve | Unappropriated Earnings | Total | Exchange Differences on Translating Foreign Operations | Unrealized Gain on Available for-sale Financial Assets | Cash Flow Hedges | Total | Treasury Shares | Total | Non-controlling Interests | Total Equity | |||||||||||||||||||||||||||||||
| BALANCE AT JANUARY 1, 2013 | 7,602,292 | $ | 76,047,667 | $ | 5,262,129 | 7,411,835 | — | $ | 23,526,565 | $ | 30,938,400 | (3,210,248 | ) | $ | 355,254 | $ | (3,755 | ) | $ | (2,858,749 | ) | $ | (1,959,107 | ) | $ | 107,430,340 | $ | 3,521,419 | $ | 110,951,759 | |||||||||||||||
| Special reserve under Rule No. 1010012865 issued by the Financial Supervisory Commission (Note 22) | — | — | — | — | 3,353,938 | (3,353,938 | ) | — | — | — | — | — | — | — | — | — | |||||||||||||||||||||||||||||
| Profit for the year ended December 31, 2013 | — | — | — | — | — | 15,689,074 | 15,689,074 | — | — | — | — | — | 15,689,074 | 465,966 | 16,155,040 | ||||||||||||||||||||||||||||||
| Other comprehensive income for the year ended December 31, 2013, net of income tax | — | — | — | — | — | 353,654 | 353,654 | 2,684,727 | 70,992 | 476 | 2,756,195 | 3,109,849 | 128,177 | 3,238,026 | |||||||||||||||||||||||||||||||
| Total comprehensive income for the year ended December 31, 2013 | — | — | — | — | — | 16,042,728 | 16,042,728 | 2,684,727 | 70,992 | 476 | 2,756,195 | 18,798,923 | 594,143 | 19,393,066 | |||||||||||||||||||||||||||||||
| Issue of ordinary shares for cash (Note 22) | 130,000 | 1,300,000 | 2,093,000 | — | — | — | — | — | — | — | 3,393,000 | — | 3,393,000 | ||||||||||||||||||||||||||||||||
| Appropriation of 2012 earnings | |||||||||||||||||||||||||||||||||||||||||||||
| Legal reserve | — | — | — | 1,309,136 | — | (1,309,136 | ) | — | — | — | — | — | — | — | |||||||||||||||||||||||||||||||
| Special reserve | — | — | — | — | 309,992 | (309,992 | ) | — | — | — | — | — | — | — | |||||||||||||||||||||||||||||||
| Cash dividends distributed by the Company | — | — | — | — | (7,987,974 | ) | (7,987,974 | ) | — | — | — | (7,987,974 | ) | — | (7,987,974 | ) | |||||||||||||||||||||||||||||
| — | — | 1,309,136 | 309,992 | (9,607,102 | ) | (7,987,974 | ) | — | — | — | (7,987,974 | ) | — | (7,987,974 | ) | ||||||||||||||||||||||||||||||
| Issue of dividends received by subsidiaries from the Company | — | — | 153,097 | — | — | — | — | — | — | — | 153,097 | — | 153,097 | ||||||||||||||||||||||||||||||||
| Partial disposal of interest in subsidiaries and additional acquisition of partially-owned subsidiaries (Notes 22 and 28) | — | — | (330 | ) | — | — | — | — | — | — | — | (330 | ) | 27,826 | 27,496 | ||||||||||||||||||||||||||||||
| Changes in capital surplus from investments in associates accounted for using the equity method | — | — | 1,457 | — | — | — | — | — | — | — | 1,457 | — | 1,457 | ||||||||||||||||||||||||||||||||
| Issue of ordinary shares under employee share options | 55,535 | 832,591 | 399,517 | — | — | — | — | — | — | — | 1,232,108 | 1,232,108 | |||||||||||||||||||||||||||||||||
| Cash dividends distributed by subsidiaries | — | — | — | — | — | — | — | — | — | — | — | (99,597 | ) | (99,597 | ) | ||||||||||||||||||||||||||||||
| Additional non-controlling interest arising on issue of employee share options by subsidiaries | — | — | — | — | — | — | — | — | — | — | — | 100,547 | 100,547 | ||||||||||||||||||||||||||||||||
| BALANCE AT DECEMBER 31, 2013 | 7,787,827 | 78,180,258 | 7,908,870 | 8,720,971 | 3,663,930 | 26,608,253 | 38,993,154 | (525,521 | ) | 426,246 | (3,279 | ) | (102,554 | ) | (1,959,107 | ) | 123,020,621 | 4,144,338 | 127,164,959 | ||||||||||||||||||||||||||
| Profit for the year ended December 31,2014 | — | — | — | — | — | 23,592,667 | 23,592,667 | — | — | — | — | — | 23,592,667 | 629,419 | 24,222,086 | ||||||||||||||||||||||||||||||
| Other comprehensive income (loss) for the year ended December 31, 2014, net of income tax | — | — | — | — | — | (32,538 | ) | (32,538 | ) | 5,066,674 | 100,532 | 3,279 | 5,170,485 | — | 5,137,947 | 337,256 | 5,475,203 | ||||||||||||||||||||||||||||
| Total comprehensive income for the year ended December 31, 2014 | — | — | — | — | — | 23,560,129 | 23,560,129 | 5,066,674 | 100,532 | 3,279 | 5,170,485 | — | 28,730,614 | 966,675 | 29,697,289 | ||||||||||||||||||||||||||||||
| Appropriation of 2013 earnings | |||||||||||||||||||||||||||||||||||||||||||||
| Legal reserve | — | — | — | 1,568,907 | — | (1,568,907 | ) | — | — | — | — | — | — | — | — | — | |||||||||||||||||||||||||||||
| Special reserve | — | — | — | — | (309,992 | ) | 309,992 | — | — | — | — | — | — | — | — | — | |||||||||||||||||||||||||||||
| Cash dividends distributed by the Company | — | — | — | — | — | (10,156,005 | ) | (10,156,005 | ) | — | — | — | — | — | — | — | (10,156,005 | ) | |||||||||||||||||||||||||||
| — | — | — | 1,568,907 | (309,992 | ) | (11,414,920 | ) | (10,156,005 | ) | — | — | — | — | — | (10,156,005 | ) | — | (10,156,005 | ) | ||||||||||||||||||||||||||
| Issue of dividends received by subsidiaries from the Company | — | — | 188,790 | — | — | — | — | — | — | — | — | — | 188,790 | — | 188,790 | ||||||||||||||||||||||||||||||
| Partial disposal of interest in subsidiaries and additional acquisition of partially-owned subsidiaries (Notes 22 and 28) | — | — | 6,871,062 | — | — | — | — | — | — | — | — | — | 6,871,062 | 3,073,516 | 9,944,578 | ||||||||||||||||||||||||||||||
| Change in capital surplus from investments in associates accounted for using the equity method | — | — | 26,884 | — | — | — | — | — | — | — | — | — | 26,884 | — | 26,884 | ||||||||||||||||||||||||||||||
(Continued)
-8-
ADVANCED SEMICONDUCTOR ENGINEERING, INC. AND SUBSIDIARIES
CONSOLIDATED STATEMENTS OF CHANGES IN EQUITY
(In Thousands of New Taiwan Dollars)
| Equity Attributable to Owners of the Company | ||||||||||||||||||||||||||||||||||||||||||||||||||||||||||||||
| Other Equity | ||||||||||||||||||||||||||||||||||||||||||||||||||||||||||||||
| Exchange | ||||||||||||||||||||||||||||||||||||||||||||||||||||||||||||||
| Differences on | Unrealized Gain | |||||||||||||||||||||||||||||||||||||||||||||||||||||||||||||
| Share Capital | Retained Earnings | Translating | on Available- | |||||||||||||||||||||||||||||||||||||||||||||||||||||||||||
| Shares | Unappropriated | Foreign | for-sale | Cash Flow | Non-controlling | |||||||||||||||||||||||||||||||||||||||||||||||||||||||||
| (In Thousands) | Amounts | Capital Surplus | Legal Reserve | Special Reserve | Earnings | Total | Operations | Financial Assets | Hedges | Total | Treasury Shares | Total | Interests | Total Equity | ||||||||||||||||||||||||||||||||||||||||||||||||
| Issue of ordinary shares under employee share options | 73,898 | $ | 534,921 | $ | 1,000,065 | $ | — | $ | — | $ | — | $ | — | $ | — | $ | — | $ | — | $ | — | $ | — | $ | 1,534,986 | $ | $1,534,986 | |||||||||||||||||||||||||||||||||||
| Cash dividends distributed by subsidiaries | — | — | — | — | — | — | — | — | — | — | — | — | — | (85,766 | ) | (85,766 | ||||||||||||||||||||||||||||||||||||||||||||||
| Additional non-controlling interest arising on issue of | ||||||||||||||||||||||||||||||||||||||||||||||||||||||||||||||
| employee share options by subsidiaries | — | — | — | — | — | — | — | — | — | — | — | — | — | 120,376 | 120,376 | |||||||||||||||||||||||||||||||||||||||||||||||
| BALANCE AT DECEMBER 31, 2014 | 7,861,725 | $ | 78,715,179 | $ | 15,995,671 | $ | 10,289,878 | $ | 3,353,938 | $ | 38,753,462 | $ | 52,397,278 | $ | 4,541,153 | $ | 526,778 | $ | — | $ | 5,067,931 | $ | (1,959,107 | ) | $ | 150,216,952 | $ | 8,219,139 | $158,436,091 | |||||||||||||||||||||||||||||||||
The accompanying notes are an integral part of the consolidated financial statements. | (Concluded) |
-9-
ADVANCED SEMICONDUCTOR ENGINEERING, INC. AND SUBSIDIARIES
CONSOLIDATED STATEMENTS OF CASH FLOWS
(In Thousands of New Taiwan Dollars)
| For the Years Ended December 31 | ||||||||
| 2014 | 2013 | |||||||
| NT$ | NT$ | |||||||
| CASH FLOWS FROM OPERATING ACTIVITIES | ||||||||
| Profit before income tax | $ | 28,473,599 | $ | 19,356,692 | ||||
| Adjustments for: | ||||||||
| Depreciation expense | 25,805,042 | 24,696,607 | ||||||
| Amortization expense | 545,734 | 774,304 | ||||||
| Net gain on fair value change of financial assets | ||||||||
| and liabilities at fair value through profit or loss | (1,838,840 | ) | (795,359 | ) | ||||
| Interest expense | 2,324,426 | 2,257,144 | ||||||
| Interest income | (243,474 | ) | (212,801 | ) | ||||
| Dividend income | (101,252 | ) | (131,449 | ) | ||||
| Compensation cost of employee share options | 110,157 | 260,801 | ||||||
| Share of the loss (profit) of associates and joint | ||||||||
| ventures | 108,726 | (26,300 | ) | |||||
| Impairment loss recognized on financial assets | 28,421 | 196,325 | ||||||
| Impairment loss recognized on non-financial assets | 899,480 | 949,015 | ||||||
| Others | 1,717,372 | 1,345,390 | ||||||
| Changes in operating assets and liabilities | ||||||||
| Financial assets held for trading | 823,313 | 1,122,280 | ||||||
| Trade receivables | (9,703,070 | ) | (5,767,254 | ) | ||||
| Other receivables | (8,625 | ) | (6,540 | ) | ||||
| Inventories | (8,208,824 | ) | (3,241,115 | ) | ||||
| Other current assets | 102,353 | (108,425 | ) | |||||
| Financial liabilities held for trading | (835,779 | ) | (1,011,975 | ) | ||||
| Trade payables | 6,422,305 | 4,722,462 | ||||||
| Other payables | 3,045,452 | 1,068,223 | ||||||
| Other current liabilities | 703,764 | 2,796 | ||||||
| Other operating activities items | (111,843 | ) | (174,306 | ) | ||||
| 50,058,437 | 45,276,515 | |||||||
| Interest received | 233,457 | 182,164 | ||||||
| Dividend received | 101,252 | 176,058 | ||||||
| Interest paid | (2,065,244 | ) | (2,200,143 | ) | ||||
| Income tax paid | (2,463,153 | ) | (2,138,639 | ) | ||||
| Net cash generated from operating activities | 45,864,749 | 41,295,955 | ||||||
| CASH FLOWS FROM INVESTING ACTIVITIES | ||||||||
| Purchase of financial assets designated as at fair | ||||||||
| value through profit or loss | (108,958,658 | ) | (53,135,894 | ) | ||||
| Proceeds on sale of financial assets designated as at | ||||||||
| fair value through profit or loss | 109,825,159 | 55,032,536 | ||||||
| Purchase of available-for-sale financial assets | (3,565,428 | ) | (3,474,152 | ) | ||||
| Proceeds on sale of available-for-sale financial assets | 4,388,130 | 1,093,408 | ||||||
(Continued)
-10-
ADVANCED SEMICONDUCTOR ENGINEERING, INC. AND SUBSIDIARIES
CONDENSED CONSOLIDATED STATEMENTS OF CASH FLOWS
(In Thousands of New Taiwan Dollars)
| For the Years Ended December 31 | ||||||||
| 2014 | 2013 | |||||||
| NT$ | NT$ | |||||||
| Cash received from return of capital by | ||||||||
| available-for-sale financial assets | $ | 20,411 | $ | 27,368 | ||||
| Purchase of held-to-maturity financial assets | - | (88,169 | ) | |||||
| Proceeds on sale of held-to-maturity financial assets | - | 73,716 | ||||||
| Acquisition of associates and joint ventures | (100,000 | ) | - | |||||
| Net cash outflow on acquisition of subsidiaries | - | (250,387 | ) | |||||
| Payments for property, plant and equipment | (39,598,964 | ) | (29,142,719 | ) | ||||
| Proceeds from disposal of property, plant and | ||||||||
| equipment | 421,207 | 351,546 | ||||||
| Payments for intangible assets | (396,466 | ) | (313,110 | ) | ||||
| Decrease (increase) in other financial assets | (372,569 | ) | 4,513 | |||||
| Increase in other non-current assets | (480,711 | ) | (104,499 | ) | ||||
| Net cash used in investing activities | (38,817,889 | ) | (29,925,843 | ) | ||||
| CASH FLOWS FROM FINANCING ACTIVITIES | ||||||||
| Net proceeding from (repayment of) short-term | ||||||||
| borrowings | (3,442,162 | ) | 7,051,874 | |||||
| Proceeds from issue of bonds | 8,888,562 | 11,900,051 | ||||||
| Repayment of bonds payable | (729,790 | ) | - | |||||
| Proceeds from long-term borrowings | 32,030,868 | 28,715,694 | ||||||
| Repayment of long-term borrowings | (40,978,403 | ) | (31,382,333 | ) | ||||
| Dividends paid | (9,967,215 | ) | (7,834,877 | ) | ||||
| Proceeds from issue of ordinary shares | - | 3,393,000 | ||||||
| Proceeds from exercise of employee share options | 1,498,343 | 1,071,854 | ||||||
| Decrease (Increase) in non-controlling interests | 9,905,673 | (72,101 | ) | |||||
| Other financing activities items | (2,879 | ) | (48,291 | ) | ||||
| Net cash generated from (used in) financing | ||||||||
| activities | (2,797,003 | ) | 12,794,871 | |||||
| EFFECTS OF EXCHANGE RATE CHANGES ON | ||||||||
| THE BALANCE OF CASH AND CASH | ||||||||
| EQUIVALENTS | 2,418,182 | 867,872 | ||||||
| NET INCREASE IN CASH AND CASH | ||||||||
| EQUIVALENTS | 6,668,039 | 25,032,855 | ||||||
| CASH AND CASH EQUIVALENTS AT THE | ||||||||
| BEGINNING OF THE YEAR | 45,026,371 | 19,993,516 | ||||||
| CASH AND CASH EQUIVALENTS AT THE END | ||||||||
| OF THE YEAR | $ | 51,694,410 | $ | 45,026,371 | ||||
The accompanying notes are an integral part of the consolidated financial statements. | (Concluded) |
-11-
ADVANCED SEMICONDUCTOR ENGINEERING, INC. AND SUBSIDIARIES
NOTES TO CONSOLIDATED FINANCIAL STATEMENTS
(Amounts in Thousands, Unless Stated Otherwise)
| 1. | GENERAL INFORMATION |
Advanced Semiconductor Engineering, Inc. (the “Company”), a corporation incorporated in Nantze Export Processing Zone under the laws of Republic of China (the “ROC”). In August 2004, the Company merged its subsidiaries, ASE (Chung Li) Inc. and ASE Material Inc., and established Chung-Li Branch. In August 2006, the Company spun-off and assigned its substrate production business to ASE Electronics Inc. In January 2011, the Company established Nan-Tou Branch. In May 2012, the Company merged its subsidiary, PowerASE Technology, Inc. In August 2013, the Company merged its subsidiary, Yang Ting Tech Co., Ltd. The Company and its subsidiaries (collectively referred to as the “Group”) offer a comprehensive range of semiconductors packaging, testing, and electronic manufacturing services (“EMS”).
Since July 1989, the Company’s ordinary shares have been listed on the Taiwan Stock Exchange (the “TSE”) under the symbol “2311”. Since September 2000, the Company’s ordinary shares of the Company have been traded on the New York Stock Exchange (the “NYSE”) under the symbol “ASX” in the form of American Depositary Shares (“ADS”). The ordinary shares of its subsidiary, Universal Scientific Industrial (Shanghai) Co., Ltd. (the “USISH”), have been listed on the Shanghai Stock Exchange (the “SSE”) under the symbol “601231” since February 2012.
The consolidated financial statements are presented in the Company’s functional currency, New Taiwan dollar (NT$).
| 2. | APPROVAL OF FINANCIAL STATEMENTS |
The consolidated financial statements were approved for issue by board of directors on February 26, 2015.
| 3. | APPLICATION OF NEW AND REVISED STANDARDS, AMENDMENTS AND INTERPRETATIONS |
| a. | The amendment to the Regulations Governing the Preparation of Financial Reports by Securities Issuers and the 2013 version of the International Financial Reporting Standards (IFRS), International Accounting Standards (IAS), Interpretations of IFRS (IFRIC), and Interpretations of IAS (SIC) endorsed by the Financial Supervisory Commission of the ROC (“FSC”) not yet effective |
Rule No. 1030029342 and Rule No. 1030010325 issued by the FSC on April 3, 2014, stipulated that the Group should apply the 2013 version of IFRS, IAS, IFRIC and SIC (collectively, the “IFRSs”) endorsed by the FSC and the related amendments to the Regulations Governing the Preparation of Financial Reports by Securities Issuers starting January 1, 2015.
New, Amended and Revised Standards and Interpretations (the “New IFRSs”) | Effective Date Announced by International Accounting Standard Board (“IASB”) (Note) | |
| Improvements to IFRSs (2009) - amendment to IAS 39 | January 1, 2009 or January 1, 2010 | |
| Amendment to IAS 39 “Embedded Derivatives” | Effective in fiscal year ended on or after June 30, 2009 |
(Continued)
-12-
New, Amended and Revised Standards and Interpretations (the “New IFRSs”) | Effective Date Announced byInternational Accounting Standard Board (“IASB”)(Note) | |
| Improvements to IFRSs (2010) | July 1, 2010 or January 1,2011 | |
| Annual Improvements to IFRSs 2009 - 2011 Cycle | January 1, 2013 | |
| Amendments to IFRS 1 “Limited Exemption from Comparative IFRS 7 Disclosures for First- time Adopters” | July 1, 2010 | |
| Amendment to IFRS 1 “Severe Hyperinflation and Removal of Fixed Dates for First-time Adopters” | July 1, 2011 | |
| Amendment to IFRS 1 “Government Loans” | January 1, 2013 | |
| Amendment to IFRS 7 “Disclosures - Offsetting Financial Assets and Financial Liabilities” | January 1, 2013 | |
| Amendment to IFRS 7 “Disclosures - Transfers of Financial Assets” | July 1, 2011 | |
| IFRS 10 “Consolidated Financial Statements” | January 1, 2013 | |
| IFRS 11 “Joint Arrangements” | January 1, 2013 | |
| IFRS 12 “Disclosure of Interests in Other Entities” | January 1, 2013 | |
| Amendments to IFRS 10, IFRS 11 and IFRS 12 “Consolidated financial Statements, Joint Arrangements, and Disclosure of Interests in Other Entities: Transition Guidance” | January 1, 2013 | |
| Amendments to IFRS 10, IFRS 12 and IAS 27 “Investment Entities” | January 1, 2014 | |
| IFRS 13 “Fair Value Measurement” | January 1, 2013 | |
| Amendment to IAS 1 “Presentation of Items of Other Comprehensive Income” | July 1, 2012 | |
| Amendment to IAS 12 “Deferred Tax: Recovery of Underlying Assets” | January 1, 2012 | |
| IAS 19 (Revised 2011) “Employee Benefits” | January 1, 2013 | |
| IAS 27 (Revised 2011) “Separate Financial Statements” | January 1, 2013 | |
| IAS 28 (Revised 2011) “Investments in Associates and Joint Ventures” | January 1, 2013 | |
| Amendment to IAS 32 “Offsetting of Financial Assets and Financial Liabilities” | January 1, 2014 | |
| IFRIC 20 “Stripping Costs in the Production Phase of a Surface Mine” | January 1, 2013 |
(Concluded)
| Note : | Unless stated otherwise, the above New IFRSs are effective for annual periods beginning on or after the respective effective dates. |
Except for the following, whenever applied, the initial application of the above 2013 IFRSs version and the related amendments to the Regulations Governing the Preparation of Financial Reports by Securities Issuers would not have any material impact on the Group’s accounting policies:
| 1) | IFRS 12 “Disclosure of Interests in Other Entities” |
IFRS 12 is a new disclosure standard and is applicable to entities that have interests in subsidiaries, joint arrangements, associates and/or unconsolidated structured entities. In general, the disclosure requirements in IFRS 12 are more extensive than in the current standards.
| 2) | IFRS 13 “Fair Value Measurement” |
IFRS 13 establishes a single source of guidance for fair value measurements. It defines fair value,
-13-
establishes a framework for measuring fair value, and requires disclosures about fair value measurements. The disclosure requirements in IFRS 13 are more extensive than those required in the current standards, for example, quantitative and qualitative disclosures based on the three-level fair value hierarchy currently required for financial instruments only will be extended by IFRS 13 to cover all assets and liabilities within its scope.
The fair value measurements under IFRS 13 will be applied prospectively from January 1, 2015.
| 3) | Amendment to IAS 1 “Presentation of Items of Other Comprehensive Income” |
The amendments to IAS 1 requires items of other comprehensive income to be grouped into those items that (1) will not be reclassified subsequently to profit or loss; and (2) may be reclassified subsequently to profit or loss. Income taxes on related items of other comprehensive income are grouped on the same basis. Under current IAS 1, there were no such requirements.
The Group retrospectively will apply the above amendments starting in 2015. Items that will not be reclassified subsequently to profit or loss are remeasurements of the defined benefit plans and share of remeasurements of the defined benefit plans of associates accounted for using the equity method. Items that may be reclassified to profit or loss are the exchange differences on translating foreign operations, unrealized gain (loss) on available-for-sale financial assets, cash flow hedges, and share of other comprehensive income (except the share of the remeasurements of the defined benefit plans) of associates accounted for using the equity method. However, the application of the above amendments will not have any impact on the net profit, other comprehensive income (net of income tax), and total comprehensive income for the period.
| 4) | Revision to IAS 19 “Employee Benefits” |
Revised IAS 19 requires the recognition of changes in defined benefit obligations and in the fair value of plan assets when they occur, and hence eliminates the “corridor approach” permitted under current IAS 19 and accelerate the recognition of past service costs. The revision requires all remeasurements of the defined benefit plans to be recognized immediately through other comprehensive income in order for the net pension asset or liability to reflect the full value of the plan deficit or surplus. Remeasurement of the defined benefit plans is presented separately as other equity. The Group has not determinated the presentation of the changes in defined benefit obligations.
Furthermore, the interest cost and expected return on plan assets used in current IAS 19 are replaced with a “net interest” amount, which is calculated by applying the discount rate to the net defined benefit liability or asset. In addition, the revised IAS 19 introduces certain changes in the presentation of the defined benefit cost, and also includes more extensive disclosures.
On initial application of the revised IAS 19 in 2015, the changes in cumulative employee benefit costs as of January 1, 2013 resulting from the retrospective application are adjusted to accrued pension cost, deferred tax assets, capital surplus, retained earnings and non-controlling interests; however, the carrying amount of inventory is not adjusted. In addition, in preparing the consolidated financial statements for the year ended December 31, 2015, the Group would elect not to present 2014 comparative information about the sensitivity analysis of the defined benefit obligation. The anticipated impact of the initial application is set out below:
-14-
| Carrying Amount | Adjustments Arising from Retrospective Application | Adjusted | ||||||||||
| NT$ | NT$ | NT$ | ||||||||||
| Impact on Assets, Liabilities and Equity | ||||||||||||
| December 31, 2014 | ||||||||||||
| Deferred tax assets | $ | 4,493,664 | $ | 13,307 | $ | 4,506,971 | ||||||
| Accrued pension cost | 4,371,136 | 11,393 | 4,382,529 | |||||||||
| Capital surplus | 15,995,671 | 17,387 | 16,013,058 | |||||||||
| Retained earnings | 52,397,278 | (16,040 | ) | 52,381,238 | ||||||||
| Exchange differences on translating foreign operations | 4,541,153 | 608 | 4,541,761 | |||||||||
| Non-controlling interests | 8,219,139 | (41 | ) | 8,219,098 | ||||||||
| January 1, 2014 | ||||||||||||
| Deferred tax assets | 3,765,482 | 17,783 | 3,783,265 | |||||||||
| Accrued pension cost | 4,441,357 | 104,603 | 4,545,960 | |||||||||
| Capital surplus | 7,908,870 | 11,576 | 7,920,446 | |||||||||
| Retained earnings | 38,993,154 | (87,050 | ) | 38,906,104 | ||||||||
| Non-controlling interests | 4,144,338 | (11,346 | ) | 4,132,992 | ||||||||
| Impact on Total Comprehensive Income For the Year Ended December 31, 2014 | ||||||||||||
| Operating cost | 203,051,691 | (48,773 | ) | 203,002,918 | ||||||||
| Operating expense | 23,968,499 | (25,839 | ) | 23,942,660 | ||||||||
| Income tax expense | 4,251,513 | 15,113 | 4,266,626 | |||||||||
| Net profit for the year | 24,222,086 | 59,499 | 24,281,585 | |||||||||
| Items that will not be reclassified subsequently to profit or loss: | ||||||||||||
| Remeasurement of defined benefit obligation | (45,884 | ) | 17,739 | (28,145 | ) | |||||||
| Income tax relating to items that will not be reclassified subsequently | 13,039 | 9,897 | 22,936 | |||||||||
| Impact on comprehensive income for the year, net of income tax | 5,475,203 | 28,244 | 5,503,447 | |||||||||
| Total comprehensive income for the year | 29,697,289 | 87,743 | 29,785,032 | |||||||||
| Net profit attributable to: | ||||||||||||
| Owners of the Company | $ | 23,592,667 | $ | 43,855 | $ | 23,636,522 | ||||||
| Non-controlling interests | 629,419 | 15,644 | 645,063 | |||||||||
| $ | 24,222,086 | $ | 59,499 | $ | 24,281,585 | |||||||
| Total comprehensive income attributable to: | ||||||||||||
| Owners of the Company | $ | 28,730,614 | $ | 71,618 | $ | 28,802,232 | ||||||
| Non-controlling interests | 966,675 | 16,125 | 982,800 | |||||||||
| $ | 29,697,289 | $ | 87,743 | $ | 29,785,032 | |||||||
-15-
| 5) | Amendment to IFRS 7 “Disclosures - Offsetting Financial Assets and Financial Liabilities” |
The amendments to IFRS 7 require disclosure of information about rights of offset and related arrangements (such as collateral posting requirements) for financial instruments under enforceable master netting arrangements and similar arrangements.
| 6) | Amendment to IAS 32 “Offsetting Financial Assets and Financial Liabilities” |
The amendments to IAS 32 clarify the requirements relating to the offset of financial assets and financial liabilities. Specifically, the amendments clarify the meaning of “currently has a legally enforceable right of set-off” and “simultaneous realization and settlement”.
| 7) | Annual Improvements to IFRSs: 2009-2011 Cycle |
Several standards including IFRS 1 “First-time Adoption of International Financial Reporting Standards”, IAS 1 “Presentation of Financial Statements”, IAS 16 “Property, Plant and Equipment”, IAS 32 “Financial Instruments: Presentation” and IAS 34 “Interim Financial Reporting” were amended in this annual improvement.
The amendments to IAS 1 clarify that an entity is required to present a balance sheet as at the beginning of the preceding period when a) it applies an accounting policy retrospectively, or makes a retrospective restatement or reclassifies items in its financial statements, and b) the retrospective application, restatement or reclassification has a material effect on the information in the balance sheet at the beginning of the preceding period. The amendments also clarify that related notes are not required to accompany the balance sheet at the beginning of the preceding period.
The initial application of the amendments to the Regulations Governing the Preparation of Financial Reports by Securities Issuers and the 2013 IFRSs version in 2015 is expected to have material effect on the consolidated balance sheet as of January 1, 2014. In preparing the consolidated financial statements for the year ended December 31, 2015, the Group would present the consolidated balance sheet as of January 1, 2014 in accordance of the above amendments to IAS 1 and disclose related information in accordance with IAS 8 “Accounting Policies, Changes in Accounting Estimates and Errors”, but not required to make disclosures about the line items of the balance sheet as of January 1, 2014.
| b. | New IFRSs in issue but not yet endorsed by the FSC |
The Group has not applied the following New IFRSs issued by the IASB but not yet endorsed by the FSC. As of the date the consolidated financial statements were approved for issue, the FSC has not announced their effective dates.
| New IFRSs | Effective Date Announced by IASB (Note 1) | |
| Annual Improvements to IFRSs 2010-2012 Cycle | July 1, 2014 or transactions on or after July 1, 2014 | |
| Annual Improvements to IFRSs 2011-2013 Cycle | July 1, 2014 | |
| Annual Improvements to IFRSs 2012-2014 Cycle | January 1, 2016 (Note 2) | |
| IFRS 9 “Financial Instruments” | January 1, 2018 | |
| Amendments to IFRS 9 and IFRS 7 “Mandatory Effective Date of IFRS 9 and Transition Disclosures” | January 1, 2018 | |
(Continued)
-16-
| New IFRSs | Effective Date Announced by IASB (Note 1) | |
| Amendments to IFRS 10 and IAS 28 “Sale or Contribution of Assets between an Investor and its Associate or Joint Venture” | January 1, 2016 (Note 3) | |
| Amendments to IFRS 10, IFRS 12 and IAS 28 “Investment Entities: Applying the Consolidation Exception” | January 1, 2016 | |
| Amendment to IFRS 11 “Accounting for Acquisitions of Interests in Joint Operations” | January 1, 2016 | |
| IFRS 14 “Regulatory Deferral Accounts” | January 1, 2016 | |
| IFRS 15 “Revenue from Contracts with Customers” | January 1, 2017 | |
| Amendment to IAS 1 “Disclosure Initiative” | January 1, 2016 | |
| Amendments to IAS 16 and IAS 38 “Clarification of Acceptable Methods of Depreciation and Amortization” | January 1, 2016 | |
| Amendments to IAS 16 and IAS 41 “Agriculture: Bearer Plants” | January 1, 2016 | |
| Amendment to IAS 19 “Defined Benefit Plans: Employee Contributions” | July 1, 2014 | |
| Amendment to IAS 27 Equity Method in Separate Financial Statements | January 1, 2016 | |
| Amendment to IAS 36 “Impairment of Assets: Recoverable Amount Disclosures for Non-financial Assets” | January 1, 2014 | |
| Amendment to IAS 39 “Novation of Derivatives and Continuation of Hedge Accounting” | January 1, 2014 | |
| IFRIC 21 “Levies” | January 1, 2014 |
(Concluded)
| Note 1: | Unless stated otherwise, the above New IFRSs are effective for annual periods beginning on or after their respective effective dates. |
| Note 2: | The amendment to IFRS 5 is applied prospectively to changes in a method of disposal that occur in annual periods beginning on or after January 1, 2016; the remaining amendments are effective for annual periods beginning on or after January 1, 2016. |
| Note 3: | Prospectively applicable to transactions occurring in annual periods beginning on or after January 1, 2016. |
The initial application of the above New IFRSs, whenever applied, would not have any material impact on the Group’s accounting policies, except for the following:
| 1) | IFRS 9 “Financial Instruments” |
Recognition and measurement of financial assets
With regards to financial assets, all recognized financial assets that are within the scope of IAS 39 “Financial Instruments: Recognition and Measurement” are subsequently measured at amortized cost or fair value. Under IFRS 9, the requirement for the classification of financial assets is stated below:
For the Group’s debt instruments that have contractual cash flows that are solely payments of principal and interest on the principal amount outstanding, their classification and measurement are as follows:
-17-
| a) | For debt instruments, if they are held within a business model whose objective is to collect the contractual cash flows, the financial assets are measured at amortized cost and are assessed for impairment continuously with impairment loss recognized in profit or loss, if any. Interest revenue is recognized in profit or loss by using the effective interest method; |
| b) | For debt instruments, if they are held within a business model whose objective is achieved by both the collecting of contractual cash flows and the selling of financial assets, the financial assets are measured at fair value through other comprehensive income (FVTOCI) and are assessed for impairment. Interest revenue is recognized in profit or loss by using the effective interest method, and other gain or loss shall be recognized in other comprehensive income, except for impairment gains or losses and foreign exchange gains and losses. When the debt instruments are derecognized or reclassified, the cumulative gain or loss previously recognized in other comprehensive income is reclassified from equity to profit or loss. |
Except for above, all other financial assets are measured at fair value through profit or loss. However, the Group may make an irrevocable election to present subsequent changes in the fair value of an equity investment (that is not held for trading) in other comprehensive income, with only dividend income generally recognized in profit or loss. No subsequent impairment assessment is required, and the cumulative gain or loss previously recognized in other comprehensive income cannot be reclassified from equity to profit or loss.
The impairment of financial assets
IFRS 9 requires that impairment loss on financial assets is recognized by using the “Expected Credit Losses Model”. The credit loss allowance is required for financial assets measured at amortized cost, financial assets mandatorily measured at FVTOCI, lease receivables, contract assets arising from IFRS 15 “Revenue from Contracts with Customers”, certain written loan commitments and financial guarantee contracts. A loss allowance for the 12-month expected credit losses is required for a financial asset if its credit risk has not increased significantly since initial recognition. A loss allowance for full lifetime expected credit losses is required for a financial asset if its credit risk has increased significantly since initial recognition and is not low. However, a loss allowance for full lifetime expected credit losses is required for trade receivables that do not constitute a financing transaction.
For purchased or originated credit-impaired financial assets, the Group takes into account the expected credit losses on initial recognition in calculating the credit-adjusted effective interest rate. Subsequently, any changes in expected losses are recognized as a loss allowance with a corresponding gain or loss recognized in profit or loss.
Hedge accounting
The main changes in hedge accounting amended the application requirements for hedge accounting to better reflect the entity’s risk management activities. Compared with IAS 39, the main changes include: (1) enhancing types of transactions eligible for hedge accounting, specifically broadening the risk eligible for hedge accounting of non-financial items; (2) changing the way hedging derivative instruments are accounted for to reduce profit or loss volatility; and (3) replacing retrospective effectiveness assessment with the principle of economic relationship between the hedging instrument and the hedged item.
| 2) | Amendment to IAS 36 “Recoverable Amount Disclosures for Non-financial Assets” |
In issuing IFRS 13 “Fair Value Measurement”, the IASB made consequential amendment to the disclosure requirements in IAS 36 “Impairment of Assets”, introducing a requirement to disclose in every reporting period the recoverable amount of an asset or each cash-generating unit. The amendment clarifies that such disclosure of recoverable amounts is required only when an
-18-
impairment loss has been recognized or reversed during the period. Furthermore, the Group is required to disclose the discount rate used in measurements of the recoverable amount based on fair value less costs of disposal measured using a present value technique.
| 3) | IFRS 15 “Revenue from Contracts with Customers” |
IFRS 15 establishes principles for recognizing revenue that apply to all contracts with customers, and will supersedes IAS 18 “Revenue”, IAS 11 “Construction Contracts” and a number of revenue-related interpretations from January 1, 2017.
When applying IFRS 15, an entity shall recognize revenue by applying the following steps:
| — | Identify the contract with the customer; |
| — | Identify the performance obligations in the contract; |
| — | Determine the transaction price; |
| — | Allocate the transaction price to the performance obligations in the contracts; and |
| — | Recognize revenue when the entity satisfies a performance obligation. |
When IFRS 15 is effective, the Group may elect to apply this Standard either retrospectively to each prior reporting period presented or retrospectively with the cumulative effect of initially applying this Standard recognized at the date of initial application.
| 4) | Amendments to IFRS 10 and IAS 28 “Sale or Contribution of Assets between an Investor and its Associate or Joint Venture” |
The amendments stipulated that, when the Group sells or contributes assets that constitute a business (as defined in IFRS 3) to an associate or joint venture, the gain or loss resulting from the transaction is recognized in full. Also, when the Group loses control of a subsidiary that contains a business but retains significant influence or joint control, the gain or loss resulting from the transaction is recognized in full.
Conversely, when the Group sells or contributes assets that do not constitute a business to an associate or joint venture, the gain or loss resulting from the transaction is recognized only to the extent of the unrelated investors’ interest in the associate or joint venture, i.e. the entity’s share of the gain or loss is eliminated. Also, when the Group loses control of a subsidiary that does not contain a business but retains significant influence or joint control in an associate or a joint venture, the gain or loss resulting from the transaction is recognized only to the extent of the unrelated investors’ interest in the associate or joint venture, i.e. the entity’s share of the gain or loss is eliminated.
| 5) | Amendment to IAS 1 Disclosure Initiative |
The amendment clarifies that the consolidated financial statements should be prepared for the purpose of disclosing material information. To improve the understandability of its consolidated financial statements, the Group should disaggregate the disclosure of material items into their different natures or functions, and disaggregate material information from immaterial information.
The amendment further clarifies that the Group should consider the understandability and comparability of its consolidated financial statements to determine a systematic order in presenting its footnotes.
-19-
Except for the above impact, as of the date the consolidated financial statements were approved for issue, the Group is continuously assessing the possible impact that the application of other standards and interpretations will have on the Group’s financial position and results of operations, and will disclose the relevant impact when the assessment is completed.
| 4. | SUMMARY OF SIGNIFICANT ACCOUNTING POLICIES |
| a. | Statement of Compliance |
The consolidated financial statements have been prepared in accordance with the Regulations Governing the Preparation of Financial Reports by Securities Issuers and IFRSs as endorsed by the FSC.
| b. | Basis of Preparation |
The consolidated financial statements have been prepared on the historical cost basis except for certain financial instruments that are measured at fair value. Historical cost is generally based on the fair value of the consideration given in exchange for the assets.
| c. | Classification of Current and Non-current Assets and Liabilities |
Current assets include cash and cash equivalents and those assets held primarily for trading purposes or to be realized within twelve months after the balance sheet date, unless the asset is to be used for an exchange or to settle a liability, or otherwise remains restricted, at more than twelve months after the balance sheet date. Current liabilities are obligations incurred for trading purposes or to be settled within twelve months after the balance sheet date and liabilities that do not have an unconditional right to defer settlement for at least twelve months after the balance sheet date. Assets and liabilities that are not classified as current are classified as non-current.
The Group engages in the construction business which has an operating cycle of over one year. The normal operating cycle applies when considering the classification of the Group’s construction-related assets and liabilities.
| d. | Basis of Consolidation |
| 1) | Principles for preparing consolidated financial statements |
The consolidated financial statements incorporate the financial statements of the Company and the entities controlled by the Company (i.e. its subsidiaries).
Income and expenses of subsidiaries acquired or disposed of during the period are included in the consolidated statement of comprehensive income from the effective date of acquisition or up to the effective date of disposal, as appropriate.
When necessary, adjustments are made to the financial statements of subsidiaries to bring their accounting policies into line with those used by the Company.
All intra-group transactions, balances, income and expenses are eliminated in full upon consolidation.
Attribution of total comprehensive income to non-controlling interests
Total comprehensive income of subsidiaries is attributed to the owners of the Company and to the non-controlling interests even if this results in the non-controlling interests having a deficit balance.
-20-
Changes in the Group’s ownership interests in existing subsidiaries
Changes in the Group’s ownership interests in subsidiaries that do not result in the Group losing control over the subsidiaries are accounted for as equity transactions. The carrying amounts of the Group’s interests and the non-controlling interests are adjusted to reflect the changes in their relative interests in the subsidiaries. Any difference between the amount by which the non-controlling interests are adjusted and the fair value of the consideration paid or received is recognized directly in equity and attributed to the owners of the Company.
| 2) | Subsidiaries included in consolidated financial statements were as follows: |
| Establishment and | Percentage of Ownership (%) | |||||||
| Name of Investee | Main Businesses | Operating Location | 2014 | 2013 | ||||
| A.S.E. Holding Limited | Holding company | Bermuda | 100.0 | 100.0 | ||||
| J & R Holding Limited (“J&R Holding”) | Holding company | Bermuda | 100.0 | 100.0 | ||||
| Innosource Limited | Holding company | British Virgin Islands | 100.0 | 100.0 | ||||
| Omniquest Industrial Limited | Holding company | British Virgin Islands | 100.0 | 100.0 | ||||
| ASE Marketing & Service Japan Co., Ltd. | Engaged in marketing and sales services | Japan | 100.0 | 100.0 | ||||
| ASE Test, Inc. | Engaged in the testing of semiconductors | Kaohsiung, ROC | 100.0 | 100.0 | ||||
| Universal Scientific Industrial Co., Ltd. (“USI”) | Engaged in the manufacturing, processing and sale of computers, computer peripherals and related accessories | Nantou, ROC | 99.2 | 99.2 | ||||
| Luchu Development Corporation (“Luchu”) | Engaged in the development of real estate properties | Taipei, ROC | 86.1 | 86.1 | ||||
| Alto Enterprises Limited | Holding company | British Virgin Islands | 100.0 | 100.0 | ||||
| Super Zone Holdings Limited | Holding company | Hong Kong | 100.0 | 100.0 | ||||
| ASE (Kun Shan) Inc. | Engaged in the packaging and testing of semiconductors | Kun Shan, China | 100.0 | 100.0 | ||||
| ASE Investment (Kun Shan) Limited | Holding company | Kun Shan, China | 100.0 | 100.0 | ||||
| Advanced Semiconductor Engineering (China) Ltd. | Will engage in the packaging and testing of semiconductors | Shanghai, China | 100.0 | 100.0 | ||||
| ASE Investment (Labuan) Inc. | Holding company | Malaysia | 100.0 | 100.0 | ||||
| ASE Test Limited (“ASE Test”) | Holding company | Singapore | 100.0 | 100.0 | ||||
| ASE (Korea) Inc. | Engaged in the packaging and testing of semiconductors | Korea | 100.0 | 100.0 | ||||
| J&R Industrial Inc. | Engaged in leasing equipment and investing activity | Kaohsiung, ROC | 100.0 | 100.0 | ||||
(Continued)
-21-
| Establishment and | Percentage of Ownership (%) | |||||||
| Name of Investee | Main Businesses | Operating Location | 2014 | 2013 | ||||
| ASE Japan Co., Ltd. | Engaged in the packaging and testing of semiconductors | Japan | 100.0 | 100.0 | ||||
| ASE (U.S.) Inc. (“ASE US”) | After-sales service and sales support | U.S.A. | 100.0 | 100.0 | ||||
| Global Advanced Packaging Technology Limited, Cayman Islands | Holding company | British Cayman Islands | 100.0 | 100.0 | ||||
| ASE WeiHai Inc. | Engaged in the packaging and testing of semiconductors | Shandong, China | 100.0 | 100.0 | ||||
| Suzhou ASEN Semiconductors Co., Ltd. | Engaged in the packaging and testing of semiconductors | Suzhou, China | 60.0 | 60.0 | ||||
| Anstock Limited | Engaged in financing activity | British Cayman Islands | 100.0 | 100.0 | ||||
| Anstock II Limited | Engaged in financing activity | British Cayman Islands | 100.0 | - | ||||
| ASE Module (Shanghai) Inc. | Will engage in the production and sale of electronic components and printed circuit boards | Shanghai, China | 100.0 | 100.0 | ||||
| ASE (Shanghai) Inc. | Engaged in the production of substrates | Shanghai, China | 100.0 | 100.0 | ||||
| ASE Corporation | Holding company | British Cayman Islands | 100.0 | 100.0 | ||||
| ASE Mauritius Inc. | Holding company | Mauritius | 100.0 | 100.0 | ||||
| ASE Labuan Inc. | Holding company | Malaysia | 100.0 | 100.0 | ||||
| ASE Module (Kun Shan) Inc. | Merged into ASE (Kun Shan) Inc. in September 2014 | Kun Shan, China | - | 100.0 | ||||
| Shanghai Ding Hui Real Estate Development Co., Ltd. | Engaged in the development, construction and sale of real estate properties | Shanghai, China | 100.0 | 100.0 | ||||
| Advanced Semiconductor Engineering (HK) Limited | Engaged in the trading of substrates | Hong Kong | 100.0 | 100.0 | ||||
| Shanghai Ding Wei Real Estate Development Co., Ltd. | Engaged in the development, construction and leasing of real estate properties | Shanghai, China | 100.0 | 100.0 | ||||
| Shanghai Ding Yu Real Estate Development Co., Ltd. | Engaged in the development, construction and leasing of real estate properties | Shanghai, China | 100.0 | 100.0 | ||||
| Kun Shan Ding Yue Real Estate Development Co., Ltd. | Engaged in the development, construction and leasing of real estate properties | Kun Shan, China | 100.0 | 100.0 | ||||
(Continued)
-22-
| Establishment and | Percentage of | |||||||
| Name of Investee | Main Businesses | Operating Location | 2014 | 2013 | ||||
| Kun Shan Ding Hong Real Estate Development Co., Ltd. | Engaged in the development, construction and leasing of real estate properties | Kun Shan, China | 100.0 | 100.0 | ||||
| ASE Electronics Inc. | Engaged in the production of substrates | Kaohsiung, ROC | 100.0 | 100.0 | ||||
| ASE Test Holdings, Ltd. | Holding company | British Cayman Islands | 100.0 | 100.0 | ||||
| ASE Holdings (Singapore) Pte. Ltd. | Holding company | Singapore | 100.0 | 100.0 | ||||
| ASE Test Finance Limited | Engaged in financing activity | Mauritius | 100.0 | 100.0 | ||||
| ASE Singapore Pte. Ltd. | Engaged in the packaging and testing of semiconductors | Singapore | 100.0 | 100.0 | ||||
| ISE Labs, Inc. | Engaged in the testing of semiconductors | U.S.A. | 100.0 | 100.0 | ||||
| ASE Electronics (M) Sdn. Bhd. | Engaged in the packaging and testing of semiconductors | Malaysia | 100.0 | 100.0 | ||||
| ASE Assembly & Test (Shanghai) Limited | Engaged in the packaging and testing of semiconductors | Shanghai, China | 100.0 | 100.0 | ||||
| Wuxi Tongzhi Microelectronics Co., Ltd. | Engaged in the packaging and testing of semiconductors | Wuxi, China | 100.0 | 100.0 | ||||
| Huntington Holdings International Co., Ltd. | Holding company | British Virgin Islands | 99.2 | 99.2 | ||||
| Senetex Investment Co., Ltd. | In the process of liquidation | Nantou, ROC | 99.2 | 99.2 | ||||
| Unitech Holdings International Co., Ltd. | Holding company | British Virgin Islands | 99.2 | 99.2 | ||||
| Real Tech Holdings Limited | Holding company | British Virgin Islands | 99.2 | 99.2 | ||||
| Universal ABIT Holding Co., Ltd. | Holding company | British Cayman Islands | 99.2 | 99.2 | ||||
| Rising Capital Investment Limited | Holding company | British Virgin Islands | 99.2 | 99.2 | ||||
| Rise Accord Limited | Holding company | British Virgin Islands | 99.2 | 99.2 | ||||
| Cubuy Corporation | Will engaged in the trading of computer systems | Shanghai, China | 99.2 | 99.2 | ||||
| Universal Scientific Industrial (Kunshan) Co., Ltd. | Engaged in the manufacturing and sale of computer assistance system and related peripherals | Kun Shan, China | 99.2 | 99.2 | ||||
| USI Enterprise Limited (“USIE”) | Engaged in the services of investment advisory and warehousing management | Hong Kong | 98.7 | 99.1 | ||||
| Universal Scientific Industrial (Shanghai) Co., Ltd. (“USISH”) | Engaged in the designing, manufacturing and sale of electronic components | Shanghai, China | 82.1 | 88.6 | ||||
(Continued)
-23-
| Establishment and | Percentage of Ownership (%) | |||||||
| Name of Investee | Main Businesses | Operating Location | 2014 | 2013 | ||||
| Universal Global Technology Co., Limited | Holding company | Hong Kong | 82.1 | 88.6 | ||||
| Universal Global Technology (Kun Shan) Co., Ltd. | Engaged in the designing and manufacturing of electronic components | Kun Shan, China | 82.1 | 88.6 | ||||
| Universal Global Technology (Shanghai) Co., Ltd. | Engaged in the processing and sales of computer and communication peripherals as well as business in import and export of goods and technology | Shanghai, China | 82.1 | 88.6 | ||||
| Universal Global Electronics (Shanghai) Co., Ltd. | Engaged in the sale of electronic components and telecommunications equipment and established in May 2014 | Shanghai, China | 82.1 | - | ||||
| Universal Global Electronics (Shenzhen) Co., Ltd. | Liquidated in March 2014 | Shenzhen, China | - | 88.6 | ||||
| Universal Global Industrial Co., Limited | Engaged in manufacturing, trading and investing activity | Hong Kong | 82.1 | 88.6 | ||||
| Universal Global Scientific Industrial Co., Ltd. | Engaged in the manufacturing of components of telecomm and cars and provision of related R&D services | Nantou, ROC | 82.1 | 88.6 | ||||
| USI Manufacturing Service Inc. | Engaged in the manufacturing and processing of motherboards and wireless network communication and provision of related technical service. | U.S.A. | 82.1 | 88.6 | ||||
| Universal Scientific Industrial De Mexico S.A. De C.V. | Engaged in the assembling of motherboards and computer components | Mexico | 82.1 | 88.6 | ||||
| USI Japan Co., Ltd. | Engaged in the manufacturing and sale of computer peripherals, integrated chip and other related accessories | Japan | 82.1 | 88.6 | ||||
| USI@Work, Inc. | After-sale service | U.S.A. | 82.1 | 88.6 | ||||
| USI Electronics (Shenzhen) Co., Ltd. | Engaged in the design, manufacturing and sale of motherboards and computer peripherals | Shenzhen, China | 82.1 | 88.6 | ||||
(Concluded)
-24-
| e. | Business Combinations |
Acquisitions of businesses are accounted for using the acquisition method. The consideration transferred in a business combination is measured at fair value, which is calculated as the sum of the acquisition-date fair values of the assets transferred by the Group, liabilities incurred by the Group to the former owners of the acquiree and the equity interests issued by the Group in exchange for control of the acquiree. Acquisition-related costs are recognized in profit or loss as incurred.
Goodwill is measured as the excess of the sum of the consideration transferred, the amount of any non-controlling interests in the acquiree, and the fair value of the acquirer's previously held equity interest in the acquiree (if any) over the net of the acquisition-date amounts of the identifiable assets acquired and the liabilities assumed. If, after re-assessment, the net of the acquisition-date amounts of the identifiable assets acquired and liabilities assumed exceeds the sum of the consideration transferred, the amount of any non-controlling interests in the acquiree and the fair value of the acquirer's previously held interest in the acquiree (if any), the excess is recognized immediately in profit or loss as a bargain purchase gain.
When a business combination is achieved in stages, the Group’s previously held equity interest in the acquiree is remeasured to its acquisition-date fair value and the resulting gain or loss, if any, is recognized in profit or loss. Amounts arising from interests in the acquiree prior to the acquisition date that have previously been recognized in other comprehensive income are recognized on the same basis as would be required if that interest were directly disposed of by the Group.
If the initial accounting for a business combination is incomplete by the end of the reporting period in which the combination occurs, the Group reports provisional amounts for the items for which the accounting is incomplete. Those provisional amounts are adjusted during the measurement period, or additional assets or liabilities are recognized, to reflect new information obtained about facts and circumstances that existed at the acquisition date that, if known, would have affected the amounts recognized at that date.
The Group does not apply the acquisition method to account for business combinations involving entities under common control.
| f. | Foreign Currencies |
In preparing the financial statements of each individual group entity, transactions in currencies other than the entity’s functional currency (foreign currencies) are recognized at the rates of exchange prevailing at the dates of the transactions. At each balance sheet date, monetary items denominated in foreign currencies are retranslated at the rates prevailing at that date. Non-monetary items carried at fair value that are denominated in foreign currencies are retranslated at the rates prevailing at the date when the fair value was determined. Non-monetary items that are measured in terms of historical cost in a foreign currency are not retranslated.
Exchange differences on monetary items arising from settlement or translation are recognized in profit or loss in the period in which they arise.
Exchange differences arising on the retranslation of non-monetary assets (such as equity instruments) or liabilities measured at fair value are included in profit or loss for the period at the rates prevailing at the balance sheet date except for exchange differences arising on the retranslation of non-monetary items in respect of which gains and losses are recognized directly in other comprehensive income, in which case, the exchange differences are also recognized directly in other comprehensive income.
For the purposes of presenting the consolidated financial statements, the assets and liabilities of the Group’s foreign operations are translated into New Taiwan dollars using exchange rates prevailing at each balance sheet date. Income and expense items are translated at the average exchange rates for the
-25-
period. Exchange differences arising are recognized in other comprehensive income and accumulated in equity attributed to the owners of the Company and non-controlling interests as appropriate.
On the disposal of the Group’s foreign operation that result in the Group losing control , joint control or significant influence over the foreign operation, all of the equity in respect of that operation attributable to the owners of the Company are reclassified to profit or loss.
| g. | Cash Equivalents |
Cash equivalents are short-term, highly liquid investments that are readily convertible to known amounts of cash and which are subject to an insignificant risk of change in value.
| h. | Inventories and Inventories Related to Real Estate Business |
Inventories, including raw materials (materials received from customers for processing, mainly semiconductor wafers, are excluded from inventories as title and risk of loss remain with the customers), supplies, work in process, finished goods, and materials and supplies in transit are stated at the lower of cost or net realizable value. Inventory write-downs are made by item, except for those that may be appropriate to group items of similar or related inventories. Net realizable value is the estimated selling prices of inventories less all estimated costs of completion and estimated costs necessary to make the sale. Raw materials and supplies are recorded at moving average cost while work in process and finished goods are recorded at standard cost.
Inventories related to real estate business include land and buildings held for sale, land held for construction, construction in progress and prepayment for land use rights. Land held for development is recorded as land held for construction upon obtaining the title of ownership. The prepayment is recorded as prepayments for land use right before obtaining the title of ownership. Prior to the completion, the borrowing costs directly attributable to construction in progress are capitalized as part of the cost of the asset. Construction in progress is transferred to land and buildings held for sale upon completion. Land and buildings held for sale, construction in progress and land held for construction are stated at the lower of cost or net realizable value and related write-downs are made by item. The amounts received in advance for real estate properties are first recorded as advance receipts and then recognized as revenue when the construction is completed and the title and significant risk of the real estate properties are transferred to customers. Cost of sales of land and buildings held for sale are recognized based on the ratio of property sold to the total property developed.
| i. | Investments Accounted for Using the Equity Method |
Investments accounted for using the equity method include investments in associates. An associate is an entity over which the Group has significant influence and that is not a subsidiary. Significant influence is the power to participate in the financial and operating policy decisions of the investee without having control over those policies.
The operating results as well as assets and liabilities of associates are incorporated in these consolidated financial statements using the equity method of accounting. Under the equity method, an investment in an associate is initially recognized at cost and adjusted thereafter to recognize the Group’s share of the profit or loss and other comprehensive income of the associate. The Group also recognizes the changes in the Group’s share of equity of associates.
Any excess of the cost of acquisition over the Group's share of the net fair value of the identifiable assets and liabilities of an associate at the date of acquisition is recognized as goodwill, which is included within the carrying amount of the investment and is not amortized.
When a group entity transacts with its associate, unrealized profits and losses resulting from the transactions with the associate are eliminated.
-26-
| j. | Property, Plant and Equipment |
Except for land which is stated at cost, property, plant and equipment are stated at cost less accumulated depreciation and accumulated impairment.
Properties in the course of construction for production, supply or administrative purposes are carried at cost, less any recognized impairment loss. Cost includes professional fees and borrowing costs eligible for capitalization. Such properties are classified to the appropriate categories of property, plant and equipment when completed and ready for intended use. Depreciation of these assets, on the same basis as other property assets, commences when the assets are ready for their intended use.
Freehold land is not depreciated.
Depreciation is recognized using the straight-line method. Each significant part is depreciated separately. The estimated useful lives, residual values and depreciation method are reviewed at each balance sheet date. The effect of any changes in estimate accounted for on a prospective basis.
Assets held under finance leases are depreciated over their expected useful lives on the same basis as owned assets. If the lease term is shorter than the useful lives, assets are depreciated over the lease term.
Any gain or loss arising on the disposal or retirement of an item of property, plant and equipment is determined as the difference between the sales proceeds and the carrying amount of the asset and is recognized in profit or loss.
| k. | Goodwill |
Goodwill arising from an acquisition of a business is carried at cost as established at the date of acquisition of the business less accumulated impairment loss.
For the purposes of impairment testing, goodwill is allocated to each of the Group’s cash-generating units or groups of cash-generating units that is expected to benefit from the synergies of the combination.
A cash-generating unit to which goodwill has been allocated is tested for impairment annually, or more frequently when there is an indication that the unit may be impaired, by comparing its carrying amount, including the attributed goodwill, with its recoverable amount. However, if the goodwill allocated to a cash-generating unit was acquired in a business combination during the current annual period, that unit shall be tested for impairment before the end of the current annual period. If the recoverable amount of the cash-generating unit is less than its carrying amount, the impairment loss is allocated first to reduce the carrying amount of any goodwill allocated to the unit and then to the other assets of the unit pro rata based on the carrying amount of each asset in the unit. Any impairment loss is recognized directly in profit or loss. An impairment loss recognized for goodwill is not reversed in subsequent periods.
| l. | Other Intangible Assets |
Other intangible assets with finite useful lives acquired separately are initially measured at cost and subsequently measured at cost less accumulated amortization and accumulated impairment. Other intangible assets are amortized based on the pattern in which the economic benefits are consumed or using the straight-line method over their estimated useful lives. The estimated useful lives, residual value and amortization methods are reviewed at each balance sheet date. The residual value of an intangible asset with a finite useful life shall be assumed to be zero unless the Group expects to dispose of the intangible asset before the end of its economic life. The effect of any changes in estimate being accounted for on a prospective basis.
-27-
Other intangible assets acquired in a business combination and recognized separately from goodwill are initially recognized at their fair value at the acquisition date which is regarded as their cost. Subsequent to initial recognition, they are measured on the same basis as intangible assets that are acquired separately.
On derecognition of an intangible asset, the difference between the net disposal proceeds and the carrying amount of the asset are recognized in profit or loss.
| m. | Impairment of Tangible and Intangible Assets Other than Goodwill |
At each balance sheet date, the Group reviews the carrying amounts of its tangible and intangible assets, excluding goodwill (see above), to determine whether there is any indication that those assets have suffered an impairment loss. If any such indication exists, the recoverable amount of the asset is estimated in order to determine the extent of the impairment loss. Recoverable amount is the higher of fair value less costs to sell and value in use. If the recoverable amount of an asset or cash-generating unit is estimated to be less than its carrying amount, the carrying amount of the asset or cash-generating unit is reduced to its recoverable amount.
When an impairment loss is subsequently reversed, the carrying amount of the asset or cash-generating unit is increased to the revised estimate of its recoverable amount, but only to the extent of the carrying amount that would have been determined had no impairment loss been recognized for the asset or cash-generating unit in prior years. A reversal of an impairment loss is recognized immediately in profit or loss.
| n. | Financial Instruments |
Financial assets and financial liabilities are recognized when a group entity becomes a party to the contractual provisions of the instruments. Financial assets and financial liabilities are initially measured at fair value. Transaction costs that are directly attributable to the acquisition or issue of financial assets and financial liabilities (other than financial assets and financial liabilities at fair value through profit or loss) are added to or deducted from the fair value of the financial assets or financial liabilities, as appropriate, on initial recognition. Transaction costs directly attributable to the acquisition of financial assets or financial liabilities at fair value through profit or loss are recognized immediately in profit or loss.
| 1) | Financial assets |
All regular way purchases or sales of financial assets are recognized or derecognized on a settlement date basis.
| a) | Measurement category |
The classification of financial assets held by the Group depends on the nature and purpose of the financial assets and is determined at the time of initial recognition.
| i | Financial assets at fair value through profit or loss (“FVTPL”) |
Financial assets are classified as at FVTPL when the financial assets are either held for trading or they are designated as at FVTPL.
A financial asset other than a financial asset held for trading may be designated as at FVTPL upon initial recognition if:
| • | Such designation eliminates or significantly reduces a measurement or recognition inconsistency that would otherwise arise; or |
-28-
| • | The financial asset forms part of a group of financial assets or financial liabilities or both, which is managed and its performance is evaluated on a fair value basis, in accordance with the Group’s documented risk management or investment strategy, and information about the grouping is provided internally on that basis; or |
| • | It forms part of a contract containing one or more embedded derivatives, and IAS 39 permits the entire combined contract to be designated as at FVTPL. |
Financial assets at FVTPL are stated at fair value with any gains or losses arising on remeasurement recognized in profit or loss. The net gain or loss recognized in profit or loss incorporates any dividend or interest earned on the financial asset.
| ii | Available-for-sale financial assets |
Available-for-sale financial assets are non-derivatives that are either designated as available-for-sale or are not classified as (a) loans and receivables, (b) held-to-maturity investments or (c) financial assets at fair value through profit or loss.
Available-for-sale financial assets are stated at fair value at each balance sheet date. Changes in the carrying amount of available-for-sale monetary financial assets relating to changes in foreign currency rates, interest income calculated using the effective interest method and dividends on available-for-sale equity investments are recognized in profit or loss. Other changes in the carrying amount of available-for-sale financial assets are recognized in other comprehensive income and accumulated under the heading of unrealized gain (loss) on available-for-sale financial assets. When the investment is disposed of or is determined to be impaired, the cumulative gain or loss previously accumulated in the unrealized gain (loss) on available-for-sale financial assets is reclassified to profit or loss.
Dividends on available-for-sale equity instruments are recognized in profit or loss when the Group’s right to receive the dividends is established.
| iii | Loans and receivables |
Loans and receivables including cash and cash equivalents, trade receivables, other receivables, other financial assets and debt investments with no active market are measured at amortized cost using the effective interest method, less any impairment. Interest income is recognized by applying the effective interest rate, except for short-term receivables when the effect of discounting is immaterial.
| b) | Impairment of financial assets |
Financial assets, other than those at FVTPL, are assessed for indicators of impairment at each balance sheet date. Financial assets are considered to be impaired when there is objective evidence that, as a result of one or more events that occurred after the initial recognition of the financial assets, the estimated future cash flows of the investments have been affected.
For financial assets carried at amortized cost, such as trade receivables and other receivables, assets that are assessed not to be impaired individually are, further, assessed for impairment on a collective basis. The Group assesses the collectability of receivables based on the Group’s past experience of collecting payments and observable changes that correlate with default on receivables.
For financial assets carried at amortized cost, the amount of the impairment loss recognized is the difference between the assets’ carrying amounts and the present value of estimated future cash flows, discounted at the financial assets’ original effective interest rates. If, in a
-29-
subsequent period, the amount of the impairment loss decreases and the decreases can be objectively related to an event occurring after the impairment loss recognized, the previously recognized impairment loss is reversed either directly or by adjusting an allowance account through profit or loss. The reversal shall not result in carrying amounts of financial assets that exceed what the amortized cost would have been at the date the impairment is reversed.
When an available-for-sale financial asset is considered to be impaired, cumulative gains or losses previously recognized in other comprehensive income are reclassified to profit or loss in the period. In respect of available-for-sale equity securities, impairment loss previously recognized in profit or loss are not reversed through profit or loss. Any increase in fair value subsequent to an impairment loss is recognized in other comprehensive income and accumulated under the heading of unrealized gain (loss) on available-for-sale financial assets.
| c) | Derecognition of financial assets |
The Group derecognizes a financial asset only when the contractual rights to the cash flows from the asset expire, or when it transfers the financial asset and substantially all the risks and rewards of ownership of the asset to another entity. On derecognition of a financial asset in its entirety, the difference between the asset’s carrying amount and the sum of the consideration received and receivable and the cumulative gain or loss that had been recognized in other comprehensive income and accumulated in equity is recognized in profit or loss.
| 2) | Equity instruments |
Debt and equity instruments issued by the Group are classified as either financial liabilities or as equity in accordance with the substance of the contractual arrangements and the definitions of a financial liability and an equity instrument. Equity instruments issued by a group entity are recognized at the proceeds received, net of direct issue costs.
Repurchase of the Company’s own equity instruments is recognized in and deducted directly from equity. No gain or loss is recognized in profit or loss on the purchase, sale, issue or cancellation of the Company’s own equity instruments.
| 3) | Financial liabilities |
Financial liabilities are measured either at amortized cost using the effective interest method or at FVTPL. Financial liabilities measured at FVTPL are held for trading.
Financial liabilities at FVTPL are stated at fair value, with any gain or loss arising on remeasurement recognized in profit or loss. The net gain or loss recognized in profit or loss incorporates any interest or dividend paid on the financial liability.
The Group derecognizes financial liabilities when, and only when, the Group’s obligations are discharged, cancelled or they expire. The difference between the carrying amount of the financial liability derecognized and the consideration paid and payable, including any non-cash assets transferred or liabilities assumed, is recognized in profit or loss.
| 4) | Derivative financial instruments |
Derivatives are initially recognized at fair value at the date the derivative contracts are entered into and are subsequently remeasured to their fair value at each balance sheet date. When the fair value of derivative financial instruments is positive, the derivative is recognized as a financial asset; when the fair value of derivative financial instruments is negative, the derivative is recognized as financial liabilities.
-30-
Derivatives embedded in non-derivative host contracts are treated as separate derivatives when they meet the definition of a derivative, their risks and characteristics are not closely related to those of the host contracts and the contracts are not measured at FVTPL.
| 5) | Convertible bonds |
Convertible bonds issued by the Company that contain liability, conversion option, redemption option and put option (collectively the “Bonds Options”) components are classified separately into respective items on initial recognition. The conversion option that will be settled other than by the exchange of a fixed amount of cash or other financial asset for a fixed number of the Company’s own equity instruments is classified as a conversion option derivative. At the date of offering, both the liability and the Bonds Options components are recognized at fair value.
In subsequent periods, the liability component of the convertible bonds is measured at amortized cost using the effective interest method. The Bonds Options are measured at fair value and the changes in fair value are recognized in profit or loss.
Transaction costs that relate to the offering of the convertible bonds are allocated to the liability and the Bonds Options components in proportion to their relative fair values. Transaction costs relating to the Bonds Options are recognized immediately in profit or loss. Transaction costs relating to the liability component are included in the carrying amount of the liability component and amortized using the effective interest method.
| o. | Hedge Accounting |
The Group designates certain hedging instruments as cash flow hedges. At the inception of the hedge relationship, the Group documents the relationship between the hedging instrument and the hedged item, along with its risk management objectives and its strategy for undertaking various hedge transactions. Furthermore, at the inception of the hedge and on an ongoing basis, the Group documents whether the hedging instrument is highly effective in offsetting changes in fair values or cash flows of the hedged item attributable to the hedged risk.
The effective portion of changes in the fair value of derivatives that are designated and qualify as cash flow hedges is recognized in other comprehensive income and accumulated under the heading of cash flow hedges. The gain or loss relating to the ineffective portion is recognized immediately in profit or loss.
Hedge accounting is discontinued prospectively when the Group revokes the designated hedging relationship, or when the hedging instrument expires or is sold, terminated, or exercised, or when it no longer meets the criteria for hedge accounting. The cumulative gain or loss on the hedging instruments that has been previously recognized in other comprehensive income from the period when the hedge was effective remains separately in equity until the forecast transaction occurs. When a forecast transaction is no longer expected to occur, the gain or loss accumulated in equity is recognized immediately in profit or loss.
| p. | Revenue Recognition |
Revenue is measured at the fair value of the consideration received or receivable take into account of estimated customer returns, rebates and other similar allowances.
| 1) | Sale of goods and real estate properties |
Revenue from the sale of goods and real estate properties is recognized when the goods and real estate properties are delivered and titles have passed, at the time all the following conditions are satisfied:
-31-
| — | The Group has transferred to the buyer the significant risks and rewards of ownership of the goods and real estate properties; |
| — | The Group retains neither continuing managerial involvement to the degree usually associated with ownership nor effective control over the goods and real estate properties sold; |
| — | The amount of revenue can be reliably measured; |
| — | It is probable that the economic benefits associated with the transaction will flow to the Group; and |
| — | The costs incurred or to be incurred in respect of the transaction can be reliably measured. |
| 2) | Rendering of services |
Service income is recognized when services are rendered.
| 3) | Dividend and interest income |
Dividend income from investments and interest income from financial assets are recognized when they are probable that the economic benefits will flow to the Group and the amount of income can be reliably measured. Interest income is accrued on a time basis, by reference to the principal outstanding and at the effective interest rate applicable.
| q. | Leasing |
The Group as lessor
Rental income from operating leases is recognized on a straight-line basis over the term of the relevant lease.
The Group as lessee
Assets held under finance leases are initially recognized as assets of the Group at their fair value at the inception of the lease or, if lower, at the present value of the minimum lease payments. The corresponding liability to the lessor is included in the consolidated balance sheets as a finance lease obligation.
Operating lease payments are recognized as expenses on a straight-line basis over the lease term.
| r. | Borrowing Costs |
Borrowing costs directly attributable to the acquisition, construction or production of qualifying assets are added to the cost of those assets, until such time as the assets are substantially ready for their intended use or sale. All other borrowing costs are recognized in profit or loss in the period in which they are incurred.
| s. | Government grants |
Government grants are not recognized until there is reasonable assurance that the Group will comply with the conditions attaching to them and that the grants will be received.
Government grants are recognized in profit or loss on a systematic basis over the periods in which the Group recognizes as expenses the related costs for which the grants are intended to compensate. Specifically, government grants whose primary condition is that the Group should purchase, construct
-32-
or otherwise acquire non-current assets are recognized as deferred revenue in the consolidated financial statements and transferred to profit or loss on a systematic and rational basis over the useful lives of the related assets.
Government grants that are receivable as compensation for expenses or losses already incurred or for the purpose of giving immediate financial support to the Group with no future related costs are recognized in profit or loss in the period in which they become receivable.
| t. | Retirement Benefit Costs |
Payments to defined contribution retirement benefit plans are recognized as expenses when employees have rendered services entitling them to the contributions.
For defined benefit retirement benefit plans, the cost of providing benefits is determined using the Projected Unit Credit Method. All actuarial gains and losses on the defined benefit obligation are recognized immediately in other comprehensive income.
| u. | Share-based Payment Arrangements |
Equity-settled share-based payments to employees are measured at the fair value of the equity instruments at the grant date. The fair value determined at the grant date of the equity-settled share-based payments is expensed on a straight-line basis over the vesting period, based on the Group's best estimate of equity instruments that will eventually vest, with a corresponding increase in capital surplus - employee share options.
At each balance sheet date, the Group reviews its estimate of the number of employee share options expected to vest. The impact of the revision of the original estimates is recognized in profit or loss such that the cumulative expense reflects the revised estimate, with a corresponding adjustment to the capital surplus - employee share options.
| v. | Taxation |
Income tax expense represents the sum of the tax currently payable and deferred tax.
| 1) | Current tax |
Income tax on unappropriated earnings (excluding earnings from foreign consolidated subsidiaries) at a rate of 10% is expensed in the year the earnings arise and adjusted to the extent that distributions are approved by the shareholders in the following year.
Adjustments of prior years’ tax liabilities are added to or deducted from the current year’s tax provision.
| 2) | Deferred tax |
Deferred tax is recognized on temporary differences between the carrying amounts of assets and liabilities in the consolidated financial statements and the corresponding tax bases used in the computation of taxable profit. Deferred tax liabilities are generally recognized for all taxable temporary differences. Deferred tax assets are generally recognized for all deductible temporary differences, unused loss carry-forward and unused tax credits for purchases of machinery and equipment to the extent that it is probable that taxable profits will be available against which those deductible temporary differences can be utilized.
Deferred tax liabilities are recognized for taxable temporary differences associated with investments in subsidiaries except where the Group is able to control the reversal of the temporary differences and it is probable that the temporary differences will not reverse in the foreseeable future.
-33-
The carrying amounts of deferred tax assets is reviewed at each balance sheet date and reduced to the extent that it is no longer probable that sufficient taxable profits will be available to allow all or part of deferred tax assets to be utilized. A previously unrecognized deferred tax asset is also reviewed at each balance sheet date and recognized to the extent that it has become probable that future taxable profit will allow the deferred tax asset to be recovered.
Deferred tax assets and liabilities are measured at the tax rates that are expected to apply in the period in which assets are realized or the liabilities are settled. The measurement of deferred tax assets and liabilities reflects the tax consequences that would follow from the manner in which the Group expects, at the balance sheet date, to recover or settle the carrying amounts of its assets and liabilities.
| 3) | Current and deferred tax for the year |
Current and deferred tax are recognized in profit or loss, except when they relate to items that are recognized in other comprehensive income or directly in equity, in which case, the current and deferred tax are also recognized in other comprehensive income or directly in equity, respectively.
Where current tax or deferred tax arises from the initial accounting for a business combination, the tax effect is included in the accounting for the business combination.
| 5. | CRITICAL ACCOUNTING JUDGMENTS AND KEY SOURCES OF ESTIMATION UNCERTAINTY |
In the application of the Group’s accounting policies, which are described in Note 4, management is required to make judgments, estimates and assumptions about the carrying amounts of assets and liabilities that are not readily apparent from other sources. The estimates and underlying assumptions are based on historical experience and other factors that are considered to be relevant. Actual results may differ from these estimates.
The estimates and underlying assumptions are reviewed on an ongoing basis. Revisions to accounting estimates are recognized in the period in which the estimate is revised if the revision affects only that period, or in the period of the revision and future periods if the revision affects both current and future periods.
Impairment of Goodwill
Determining whether goodwill is impaired requires an estimation of the value in use of the cash-generating units to which goodwill has been allocated. The value in use calculation requires management to estimate the future cash flows expected to arise from cash-generating units and suitable discount rates in order to calculate its present value. When the actual future cash flows are less than expected, a material impairment loss may arise.
Impairment of Tangible and Intangible Assets Other than Goodwill
In evaluating the impairment of tangible and intangible assets other than goodwill, the Group is required to make subjective judgments in determining the independent cash flows, useful lives, expected future revenue and expenses related to the specific asset groups with the consideration of its usage patterns and the nature of semiconductor industry. Any changes in these estimates based on changed economic conditions or business strategies could result in significant impairment charges in future periods.
-34-
Valuation of Inventory
Inventories are stated at the lower of cost or net realizable value and the net realizable value of inventory at balance sheet date is determined based on Group’s judgments and estimates.
Due to the rapid technology changes, the Group estimates the net realizable value of inventory for obsolescent and unmarketable items at balance sheet date and then writes down the cost of inventories to net realizable value. There may be significant changes in the net realizable value of inventories due to assumptions of future demand within a specific time period.
Income Taxes
The reliability of deferred tax assets mainly depends on whether sufficient future profits or taxable temporary differences will be available. In cases where the actual future profits generated are less than expected, a material reversal of deferred tax assets may arise, which would be recognized in profit or loss for the period in which such a reversal takes place.
Recognition and Measurement of Defined Benefit Plans
Accrued pension liabilities and the resulting pension expenses under defined benefit pension plans are calculated using the Projected Unit Credit Method. Actuarial assumptions comprise discount rates and expected rates of salary increase. Changes in economic circumstances and market conditions will affect these assumptions and may have a material impact on the amount of the expense and the liability.
Fair value measurements and valuation processes of Derivatives and Other Financial Instruments
As disclosed in Note 32, the Group’s management uses its judgments applying appropriate valuation techniques commonly applied by market practitioners. The assumptions applied are based on observable quoted market prices, foreign exchange rates and interest rates to the extent it is available. The fair value of unquoted equity instruments is estimated based on the assumptions supported by unobservable market prices and interest rates which are disclosed in Note 32. The Group’s management believes that the valuation techniques and the assumptions applied are appropriate in determining the fair value of financial instruments.
| 6. | CASH AND CASH EQUIVALENTS |
| December 31 | ||||||||
| 2014 | 2013 | |||||||
| NT$ | NT$ | |||||||
| Cash on hand | $ | 9,953 | $ | 40,392 | ||||
| Checking accounts and demand deposits | 43,059,911 | 38,090,014 | ||||||
| Cash equivalents | 8,624,546 | 6,895,965 | ||||||
| $ | 51,694,410 | $ | 45,026,371 | |||||
-35-
| 7. | FINANCIAL INSTRUMENTS AT FAIR VALUE THROUGH PROFIT OR LOSS |
| December 31 | ||||||||
| 2014 | 2013 | |||||||
| NT$ | NT$ | |||||||
| Financial assets designated as at FVTPL | ||||||||
| Structured time deposits | $ | 2,376,050 | $ | 2,228,643 | ||||
| Private-placement convertible bonds | 100,500 | 100,500 | ||||||
| 2,476,550 | 2,329,143 | |||||||
| Financial assets held for trading | ||||||||
| Swap contracts | 1,907,705 | 219,324 | ||||||
| Open-end mutual funds | 533,425 | 172,000 | ||||||
| Quoted shares | 43,352 | 33,624 | ||||||
| Forward exchange contracts | 27,811 | 10,178 | ||||||
| 2,512,293 | 435,126 | |||||||
| $ | 4,988,843 | $ | 2,764,269 | |||||
| Financial liabilities held for trading | ||||||||
| Conversion option, redemption option and put option of convertible bonds (Note 19) | $ | 2,520,606 | $ | 1,742,996 | ||||
| Swap contracts | 99,165 | 74,170 | ||||||
| Forward exchange contracts | 31,581 | 31,315 | ||||||
| Cross currency swap contracts | - | 4,180 | ||||||
| Foreign currency option contracts | - | 643 | ||||||
| $ | 2,651,352 | $ | 1,853,304 | |||||
The Group invested in structured time deposits and in private-placement convertible bonds, and all included embedded derivative instruments which are not closely related to the host contracts. The Group designated the entire contracts as financial assets at FVTPL on initial recognition.
At each balance sheet date, the outstanding swap contracts not accounted for hedge accounting were as follows:
| Notional Amount | ||||
| Currency | Maturity Period | (In Thousands) | ||
| December 31, 2014 | ||||
| Sell NT$/Buy US$ | 2015.01-2015.12 | NT$36,199,735/US$1,209,000 | ||
| Sell US$/Buy NT$ | 2015.01-2015.02 | US$132,100/NT$4,149,958 | ||
| Sell US$/Buy JPY | 2015.01 | US$72,248/JPY8,450,000 | ||
| Sell US$/Buy CNY | 2015.01-2015.06 | US$80,000/CNY503,452 | ||
| Sell CNY/Buy US$ | 2015.03 | CNY217,288/US$35,000 | ||
(Continued)
-36-
| Notional Amount | ||||
| Currency | Maturity Period | (In Thousands) | ||
| December 31, 2013 | ||||
| Sell NT$/Buy US$ | 2014.01-2014.12 | NT$31,707,176/US$1,075,000 | ||
| Sell US$/Buy NT$ | 2014.01-2014.02 | US$46,500/NT$1,377,874 | ||
| Sell US$/Buy JPY | 2014.02 | US$53,965/JPY5,550,000 | ||
| Sell US$/Buy CNY | 2014.01-2014.06 | US$60,000/CNY368,148 |
(Concluded)
At each balance sheet date, the outstanding forward exchange contracts not accounted for hedge accounting were as follow:
| Notional Amount | ||||
| Currency | Maturity Period | (In Thousands) | ||
| December 31, 2014 | ||||
| Sell US$/Buy NT$ | 2015.01 | US$14,000/NT$438,434 | ||
| Sell US$/Buy CNY | 2015.01-2015.03 | US$127,000/CNY785,683 | ||
| Sell US$/Buy MYR | 2015.01-2015.02 | US$6,000/MYR20,860 | ||
| Sell US$/Buy SGD | 2015.01-2015.02 | US$11,700/SGD15,211 | ||
| Sell US$/Buy JPY | 2015.01-2015.04 | US$18,385/JPY2,177,800 | ||
| December 31, 2013 | ||||
| Sell US$/Buy NT$ | 2014.01-2014.02 | US$51,000/NT$1,521,484 | ||
| Sell US$/Buy CNY | 2014.01-2014.04 | US$88,220/CNY537,100 | ||
| Sell US$/Buy MYR | 2014.01-2014.02 | US$8,500/MYR27,508 | ||
| Sell US$/Buy KRW | 2014.01 | US$4,000/KRW4,253,000 | ||
| Sell US$/Buy SGD | 2014.01-2014.02 | US$9,500/SGD11,870 | ||
| Sell US$/Buy JPY | 2014.01-2014.03 | US$28,950/JPY3,003,944 | ||
| Sell NT$/Buy US$ | 2014.03 | NT$294,370/US$10,000 |
At each balance sheet date, the outstanding cross currency swap contracts not accounted for hedge accounting were as follows:
Notional Amount (In Thousands) | Maturity Period | Range of Interest Rates Paid | Range of Interest Rates Received | |||
| December 31, 2013 | ||||||
| NT$598,600/US$20,000 | 2014.07 | (0.19) | 0.16 |
At each balance sheet date, the outstanding foreign currency option contracts not accounted for hedge accounting were as follows:
| Notional Amount | ||||
| Currency | Maturity Period | (In Thousands) | ||
| December 31, 2013 | ||||
| Sell US$ Put/NT$ Call | 2016.03 (Note) | US$4,000/NT$113,400 | ||
| Buy US$ Call/NT$ Put | 2016.03 (Note) | US$2,000/NT$56,700 |
-37-
| Note: | The contracts will be settled once a month and the counterparty has the right to early terminate the contracts. All of the aforementioned outstanding contracts as of December 31, 2013 were early terminated. |
| 8. | AVAILABLE-FOR-SALE FINANCIAL ASSETS |
| December 31 | ||||||||
| 2014 | 2013 | |||||||
| NT$ | NT$ | |||||||
| Open-end mutual funds | $ | 1,500,434 | $ | 2,321,826 | ||||
| Limited partnership | 555,361 | 583,441 | ||||||
| Unquoted ordinary shares | 211,726 | 199,051 | ||||||
| Quoted ordinary shares | 195,070 | 328,656 | ||||||
| Unquoted preferred shares | 11,779 | 14,670 | ||||||
| Private-placement ordinary shares | - | 69,655 | ||||||
| 2,474,370 | 3,517,299 | |||||||
| Current | 1,533,265 | 2,376,970 | ||||||
| Non-current | $ | 941,105 | $ | 1,140,329 | ||||
In 2014 and 2013, the Group assessed its investees’ financial conditions as well as future operating performance and charged an impairment loss of NT$10,390 thousand and NT$106,916 thousand, respectively, to the carrying amounts of a portion of the aforementioned investments and debt investments with no active market.
| 9. | DERIVATIVE FINANCIAL INSTRUMENTS FOR HEDGING |
The Group entered into interest rate swap contracts as cash flow hedge to mitigate exposures to future cash flow fluctuations resulting from interest rate changes from the Group’s borrowings.
At each balance sheet date, the outstanding interest rate swap contracts of the Group were as follows:
| Maturity Period | Notional Amount (In Thousands) | Interest Rates Paid (%) | Interest Rates Received (%) | Expected Period for Future Cash Flow | Expected Period for the Recognition of Gains or Losses from Hedging | |||||
| December 31, 2013 | ||||||||||
| 2014.04 | CNY 240,000 | 2.00 | 1.05-2.80 | 2014 | 2014 |
ll interest rate swap contracts exchanging floating interest rates for fixed interest rates were designated as cash flow hedges in order to reduce the Group's cash flow exposure to loating interest rates on borrowings. The interest rate swaps and the interest payments on the borrowings occur simultaneously and the amounts accumulated in equity are reclassified to profit or loss over the period that the floating rate interest payments on the borrowings affect profit or loss. (Note 22e)
-38-
| 10. | TRADE RECEIVABLES, NET |
| December 31 | ||||||||
| 2014 | 2013 | |||||||
| NT$ | NT$ | |||||||
| Trade receivables | $ | 53,004,955 | $ | 43,303,693 | ||||
| Less: Allowance for doubtful debts | 84,145 | 68,120 | ||||||
| Trade receivables, net | $ | 52,920,810 | $ | 43,235,573 | ||||
| a. | Trade receivables |
The Group’s average credit terms were 30 to 90 days. Allowance for doubtful debts is assessed by reference to the collectability of receivables by evaluating the account aging, historical experience and current financial condition of customers.
As of December 31, 2014 and 2013, except that the Group’s five largest customers accounted for 30% and 21% of accounts receivable, respectively, the concentration of credit risk is insignificant for the remaining accounts receivable.
Age of receivables that are past due but not impaired
| December 31 | ||||||||
| 2014 | 2013 | |||||||
| NT$ | NT$ | |||||||
| Less than 30 days | $ | 5,191,521 | $ | 4,090,787 | ||||
| 31 to 90 days | 131,247 | 195,741 | ||||||
| More than 91 days | 1,407 | 1,585 | ||||||
| Total | $ | 5,324,175 | $ | 4,288,113 | ||||
The above aging schedule was based on the past due date.
Except for those impaired, the Group had not provided an allowance for doubtful debts on trade receivables at each balance sheet date since there has not been a significant change in credit quality and the amounts were still considered collectible. The Group did not hold any collateral or other credit enhancements over these balances nor did it have a legal right to offset against any amounts owed by the Group to counterparties.
Movement of the allowance for doubtful trade receivables
Impaired Individually | Impaired Collectively | Total | ||||||||||
| NT$ | NT$ | NT$ | ||||||||||
| Balance at January 1, 2014 | $ | 26,885 | $ | 41,235 | $ | 68,120 | ||||||
| Impairment losses recognized | 2,875 | 15,156 | 18,031 | |||||||||
| Amount written off during the period as uncollectible | (891 | ) | (917 | ) | (1,808 | ) | ||||||
| Effect of foreign currency exchange | (564 | ) | 366 | (198 | ) | |||||||
| Balance at December 31, 2014 | $ | 28,305 | $ | 55,840 | $ | 84,145 | ||||||
(Continued)
-39-
Impaired Individually | Impaired Collectively | Total | ||||||||||
| NT$ | NT$ | NT$ | ||||||||||
| Balance at January 1, 2013 | $ | 34,225 | $ | 45,912 | $ | 80,137 | ||||||
| Impairment losses reversed | (5,860 | ) | (4,033 | ) | (9,893 | ) | ||||||
| Amount written off during the period as uncollectible | - | (757 | ) | (757 | ) | |||||||
| Effect of foreign currency exchange | (1,480 | ) | 113 | (1,367 | ) | |||||||
| Balance at December 31, 2013 | $ | 26,885 | $ | 41,235 | $ | 68,120 | ||||||
(Concluded)
Age of impaired trade receivables
| December 31 | ||||||||
| 2014 | 2013 | |||||||
| NT$ | NT$ | |||||||
| Not past due | $ | 2,701 | $ | - | ||||
| Less than 30 days | 31,422 | 11,501 | ||||||
| 31 to 90 days | 174,805 | 109,376 | ||||||
| More than 91 days | 86,665 | 115,203 | ||||||
| Total | $ | 295,593 | $ | 236,080 | ||||
The above aging schedule was based on the past due date.
| b. | Transfers of financial assets |
Factored trade receivables of the Company were as follows:
| Counterparties | Receivables Sold (In Thousands) | Amounts Collected (In Thousands) | Advances Received At Year-end (In Thousands) | Interest Rates on Advances Received (%) | Credit Line (In Thousands) | |||||||||
| Year ended December 31, 2014 | ||||||||||||||
| Citi bank | US$ 103,744 | US$ 103,744 | - | - | US$ 92,000 | |||||||||
| Year ended December 31, 2013 | ||||||||||||||
| Citi bank | US$ 258,660 | US$ 202,532 | US$ 56,128 | 1.06 | US$ 92,000 | |||||||||
Pursuant to the factoring agreement, losses from commercial disputes (such as sales returns and discounts) should be borne by the Company, while losses from credit risk should be borne by the banks. The Company also issued promissory notes to the banks for commercial disputes which remained undrawn since. The promissory notes amounted to US$5,000 thousand and US$27,000 thousand as of December 31, 2014 and 2013, respectively. As of December 31, 2014, there was no significant losses from commercial disputes in the past and the Company does not expect any significant commercial dispute losses in the foreseeable future.
-40-
| 11. | INVENTORIES |
| December 31 | ||||||||
| 2014 | 2013 | |||||||
| NT$ | NT$ | |||||||
| Finished goods | $ | 6,568,459 | $ | 4,863,676 | ||||
| Work in process | 2,064,377 | 1,701,257 | ||||||
| Raw materials | 10,155,006 | 8,766,638 | ||||||
| Supplies | 797,353 | 573,588 | ||||||
| Raw materials and supplies in transit | 577,898 | 376,077 | ||||||
| $ | 20,163,093 | $ | 16,281,236 | |||||
The cost of inventories recognized as operating costs for the years ended December 31, 2014 and 2013 were NT$203,009,201 thousand and NT$176,637,295 thousand, respectively, which included write-downs of inventories at NT$601,726 thousand and NT$453,468 thousand, respectively.
| 12. | INVENTORIES RELATED TO REAL ESTATE BUSINESS |
| December 31 | ||||||||
| 2014 | 2013 | |||||||
| NT$ | NT$ | |||||||
| Land and buildings held for sale | $ | 5,558 | $ | 16,764 | ||||
| Construction in progress | 22,242,065 | 13,676,668 | ||||||
| Land held for construction | 1,738,855 | 1,682,735 | ||||||
| Prepayments for land use rights | - | 3,213,088 | ||||||
| $ | 23,986,478 | $ | 18,589,255 | |||||
Land and buildings held for sale located in Shanghai Zhangjiang was completed and subsequently sold. Construction in progress is mainly located on Caobao Road and Hutai Road in Shanghai, China and Lidu Road and Xinhong Road in Kun Shan, China. The capitalized borrowing costs for the years ended December 31, 2014 and 2013 is disclosed in Note 23.
As of December 31, 2014 and 2013, inventories related to real estate business of NT$23,697,339 thousand and NT$18,572,491 thousand, respectively, are expected to be recovered longer than twelve months.
Refer to Note 34 for the carrying amount of inventories related to real estate business that had been pledged by the Group to secure bank borrowings.
| 13. | INVESTMENTS ACCOUNTED FOR USING THE EQUITY METHOD |
Investments in associates accounted for using the equity method consisted of the following:
-41-
Carrying Amount as of December 31 | ||||||||||||
| Name of Associate | Main Business | Operating Location | 2014 | 2013 | ||||||||
| NT$ | NT$ | |||||||||||
| Listed company | ||||||||||||
| Hung Ching Development & Construction Co. (“HC”) | Engaged in the development, construction and leasing of real estate properties | ROC | $ | 1,351,400 | $ | 1,163,196 | ||||||
| Advanced Microelectronic Products Inc. (“AMPI”) | Engaged in integrated circuit | ROC | 99,052 | - | ||||||||
| Unlisted companies | ||||||||||||
| Hung Ching Kwan Co. (“HCK”) | Engaged in the leasing of real estate properties | ROC | 342,138 | 353,154 | ||||||||
| StarChips Technology Inc. (“SCT”) | Engaged in design, manufacturing and sale of LED driver IC | ROC | - | 47,856 | ||||||||
| 1,792,590 | 1,564,206 | |||||||||||
| Less: Deferred gain on transfer of land | 300,149 | 300,149 | ||||||||||
| Accumulated impairment - SCT | - | 47,856 | ||||||||||
| $ | 1,492,441 | $ | 1,216,201 | |||||||||
| a. | At each balance sheet date, the percentages of ownership held by the Group were as follows: |
| December 31 | ||||
| Name of Associate | 2014 | 2013 | ||
| HC | 26.2% | 26.2% | ||
| AMPI | 18.2% | - | ||
| HCK | 27.3% | 27.3% | ||
| SCT | - | 33.3% | ||
| b. | In January 2014, the Company subscribed for 20,000 thousand private-placement ordinary shares of AMPI in NT$100,000 thousand. The Company obtained significant influence over AMPI since the percentage of ownership was increased to 27.4% after taking into account the shares previously held which were recognized as available-for-sale financial assets. The private-placement ordinary shares were restricted for disposal during a 3-year lock-up period. In addition, the Company did not join AMPI’s cash capital increase in February and April 2014 and, as the result, the percentage of ownership decreased from 27.4% to 18.2%. After the consideration of potential voting rights that are currently convertible, the Company still has significant influence over AMPI. |
| c. | The Company did not subscribe for SCT’s cash capital increase in May 2014 and, therefore, the percentage of ownership decreased from 33.3% to 5.6%. As the result, the Company had no significant influence over SCT and the investment in SCT was reclassified to available-for-sale financial assets. |
| d. | Fair values of investments in associates with available published price quotation as of the balance sheet date are summarized as follows |
-42-
| December 31 | ||||||||
| Name of Associate | 2014 | 2013 | ||||||
| NT$ | NT$ | |||||||
| HC | $ | 1,427,499 | $ | 1,242,199 | ||||
| AMPI | $ | 184,862 | $ | - | ||||
| e. | Aggregate information of associates that are not individually material |
| December 31 | ||||||||
| 2014 | 2013 | |||||||
| NT$ | NT$ | |||||||
| Total assets | $ | 16,992,101 | $ | 16,020,314 | ||||
| Total liabilities | $ | 8,679,614 | $ | 9,802,624 | ||||
For the Year Ended December 31 | ||||||||
| 2014 | 2013 | |||||||
| NT$ | NT$ | |||||||
| Operating revenue for the year | $ | 5,718,922 | $ | 2,403,386 | ||||
| Net profit for the year | $ | 508,376 | $ | 311,835 | ||||
| Other comprehensive income for the year | $ | 9,087 | $ | 215,427 | ||||
The investment accounted for using the equity method and the share of net profit and other comprehensive income were recorded based on the audited financial statements for the years ended December 31, 2014 and 2013.
| 14. | PROPERTY, PLANT AND EQUIPMENT |
The carrying amounts of each class of property, plant and equipment were as follows:
| December 31 | ||||||||
| 2014 | 2013 | |||||||
| NT$ | NT$ | |||||||
| Land | $ | 3,348,018 | $ | 3,295,758 | ||||
| Buildings and improvements | 56,395,710 | 44,766,601 | ||||||
| Machinery and equipment | 84,171,647 | 75,085,182 | ||||||
| Transportation equipment | 88,119 | 82,228 | ||||||
| Furniture and fixtures | 1,310,703 | 1,243,556 | ||||||
| Leased assets and leasehold improvement | 417,865 | 14,304 | ||||||
| Construction in progress and machinery in transit | 5,855,053 | 7,009,702 | ||||||
| $ | 151,587,115 | $ | 131,497,331 | |||||
-43-
For the year ended December 31, 2014
| Land | Buildings and improvements | Machinery and equipment | Transportation equipment | Furniture and fixtures | Leased assets and leasehold improvement | Construction in progress and machinery in transit | Total | |||||||||||||||||||||||||
| NT$ | NT$ | NT$ | NT$ | NT$ | NT$ | NT$ | NT$ | |||||||||||||||||||||||||
| Cost | ||||||||||||||||||||||||||||||||
| Balance at January 1,2014 | $ | 3,295,758 | $ | 70,593,537 | $ | 208,351,905 | $ | 288,571 | $ | 5,973,301 | $ | 122,717 | $ | 7,009,702 | $ | 295,635,491 | ||||||||||||||||
| Additions | - | 1,246,123 | 1,140,822 | 8,603 | 87,903 | 476,260 | 40,488,876 | 43,448,587 | ||||||||||||||||||||||||
| Disposals | - | (299,515 | ) | (8,188,532 | ) | (26,982 | ) | (312,774 | ) | (107,291 | ) | (56,209 | ) | (8,991,303 | ) | |||||||||||||||||
| Reclassification | - | 12,683,476 | 27,935,525 | 26,832 | 378,928 | (10,645 | ) | (41,044,364 | ) | (30,248 | ) | |||||||||||||||||||||
| Effect of foreign currency exchange differences | 52,260 | 2,501,633 | 4,429,907 | 11,103 | 263,949 | 2,099 | (535,788 | ) | 6,725,163 | |||||||||||||||||||||||
| Balance at December 31,2014 | $ | 3,348,018 | $ | 86,725,254 | $ | 233,669,627 | $ | 308,127 | $ | 6,391,307 | $ | 483,140 | $ | 5,862,217 | $ | 336,787,690 | ||||||||||||||||
| Accumulated depreciation and impairment | ||||||||||||||||||||||||||||||||
| Balance at January 1,2014 | $ | - | $ | 25,826,936 | $ | 133,266,723 | $ | 206,343 | $ | 4,729,745 | $ | 108,413 | $ | - | $ | 164,138,160 | ||||||||||||||||
| Depreciation expense | - | 3,980,337 | 21,180,214 | 30,152 | 550,126 | 64,213 | - | 25,805,042 | ||||||||||||||||||||||||
| Impairment losses recognized | - | 79,124 | 211,466 | - | - | - | 7,164 | 297,754 | ||||||||||||||||||||||||
| Disposals | - | (248,477 | ) | (7,786,216 | ) | (24,199 | ) | (302,373 | ) | (107,291 | ) | - | (8,468,556 | ) | ||||||||||||||||||
| Reclassification | - | 7,459 | (7,122 | ) | - | (6,133 | ) | (1,774 | ) | - | (7,570 | ) | ||||||||||||||||||||
| Effect of foreign currency exchange differences | - | 684,165 | 2,632,915 | 7,712 | 109,239 | 1,714 | - | 3,435,745 | ||||||||||||||||||||||||
| Balance at December 31,2014 | $ | - | $ | 30,329,544 | $ | 149,497,980 | $ | 220,008 | $ | 5,080,604 | $ | 65,275 | $ | 7,164 | $ | 185,200,575 | ||||||||||||||||
For the year ended December 31, 2013
| Land | Buildings and improvements | Machinery and equipment | Transportation equipment | Furniture and fixtures | Leased assets and leasehold improvement | Construction in progress and machinery in transit | Total | |||||||||||||||||||||||||
| NT$ | NT$ | NT$ | NT$ | NT$ | NT$ | NT$ | NT$ | |||||||||||||||||||||||||
| Cost | ||||||||||||||||||||||||||||||||
| Balance at January 1,2013 | $ | 3,274,086 | $ | 63,482,739 | $ | 193,973,968 | $ | 294,377 | $ | 5,435,713 | $ | 211,477 | $ | 8,178,827 | $ | 274,851,187 | ||||||||||||||||
| Additions | - | 5,447,913 | 14,484,611 | 22,920 | 285,276 | 10,645 | 6,792,707 | 27,044,072 | ||||||||||||||||||||||||
| Disposals | - | (412,648 | ) | (9,479,630 | ) | (42,581 | ) | (154,622 | ) | - | (38,565 | ) | (10,128,046 | ) | ||||||||||||||||||
| Reclassification | - | 758,850 | 7,661,570 | 4,935 | 241,193 | (103,337 | ) | (8,638,840 | ) | (75,629 | ) | |||||||||||||||||||||
| Acquisitions through business combinations | - | 5,106 | 278,862 | 114 | 121,994 | - | - | 406,076 | ||||||||||||||||||||||||
| Effect of foreign currency exchange differences | 21,672 | 1,311,577 | 1,432,524 | 8,806 | 43,747 | 3,932 | 715,573 | 3,537,831 | ||||||||||||||||||||||||
| Balance at December 31,2013 | $ | 3,295,758 | $ | 70,593,537 | $ | 208,351,905 | $ | 288,571 | $ | 5,973,301 | $ | 122,717 | $ | 7,009,702 | $ | 295,635,491 | ||||||||||||||||
| Accumulated depreciation and impairment | ||||||||||||||||||||||||||||||||
| Balance at January 1,2013 | $ | - | $ | 22,307,146 | $ | 120,775,451 | $ | 207,017 | $ | 4,235,613 | $ | 128,186 | $ | - | $ | 147,653,413 | ||||||||||||||||
| Depreciation expense | - | 3,555,865 | 20,486,896 | 26,766 | 566,575 | 60,505 | - | 24,696,607 | ||||||||||||||||||||||||
| Impairment losses recognized (reversed) | - | (15,754 | ) | 508,894 | - | 2,407 | - | - | 495,547 | |||||||||||||||||||||||
| Disposals | - | (368,707 | ) | (9,285,927 | ) | (34,810 | ) | (131,561 | ) | - | - | (9,821,005 | ) | |||||||||||||||||||
| Reclassification | - | (24,797 | ) | 58,448 | 2,016 | 35,491 | (83,242 | ) | - | (12,084 | ) | |||||||||||||||||||||
| Acquisitions through business combinations | - | 2,473 | 108,365 | 4 | 36,814 | - | - | 147,656 | ||||||||||||||||||||||||
| Effect of foreign currency exchange differences | - | 370,710 | 614,596 | 5,350 | (15,594 | ) | 2,964 | - | 978,026 | |||||||||||||||||||||||
| Balance at December 31,2013 | $ | - | $ | 25,826,936 | $ | 133,266,723 | $ | 206,343 | $ | 4,729,745 | $ | 108,413 | $ | - | $ | 164,138,160 | ||||||||||||||||
A portion of property, plant and equipment used in packaging segment, testing segment, EMS segment and other segment was unable to be used for the Group’s production due to operation plans and production demands. After carrying out individual assessment or cash flow analysis, the Group recognized an impairment loss of NT$297,754 thousand and NT$495,547 thousand under the line item of other income and expenses in the consolidated statements of comprehensive income for the years ended December 31, 2014 and 2013, respectively.
Each class of property, plant and equipment was depreciated on a straight-line basis over the following useful lives:
| Buildings and improvements | ||
| Main plant buildings | 10-40 years | |
| Cleanrooms | 10-20 years | |
| Others | 3-20 years | |
| Machinery and equipment | 2-10 years | |
| Transportation equipment | 2-7 years | |
| Furniture and fixtures | 2-20 years | |
| Leased assets and leasehold improvements | 2-10 years |
-44-
The capitalized borrowing costs for the years ended December 31, 2014 and 2013 are disclosed in Note 23.
Refer to Note 34 for the carrying amount of property, plant and equipment that had been pledged by the Group to secure bank borrowings.
| 15. | GOODWILL |
| December 31 | ||||||||
| 2014 | 2013 | |||||||
| NT$ | NT$ | |||||||
| Cost | ||||||||
| Balance at January 1 | $ | 12,336,816 | $ | 12,295,819 | ||||
| Effect of foreign currency exchange differences | 97,595 | 40,997 | ||||||
| Balance at December 31 | $ | 12,434,411 | $ | 12,336,816 | ||||
| Accumulated impairment | ||||||||
| Balance at January 1 and December 31 | $ | (1,988,996 | ) | $ | (1,988,996 | ) | ||
| a. | Allocating goodwill to cash-generating units |
Goodwill had been allocated to the following cash-generating units for impairment testing purposes: packaging segment, testing segment, EMS segment and other segment. The carrying amount of goodwill allocated to cash-generating units was as follows:
| December 31 | ||||||||
| 2014 | 2013 | |||||||
| Cash-generating units | NT$ | NT$ | ||||||
| Testing segment | $ | 7,846,460 | $ | 7,777,268 | ||||
| Others | 2,598,955 | 2,570,552 | ||||||
| $ | 10,445,415 | $ | 10,347,820 | |||||
| b. | Impairment assessment |
At the end of each year, the Group performs impairment assessment by reviewing the recoverable amounts based on value in use. In assessing value in use, the estimated 5-year future cash flows are discounted to their present value using annual discount rates of 9.70%-11.50% and 9.56%-11.80% as of December 31, 2014 and 2013, respectively, that reflect the risks specific to each cash-generating unit.
Cash flow projection is based on the expected operating revenue, gross profit, capital expenditure and the growth of other operating costs. The Group’s capital expenditure is based on the forecast of market demands, capacity strategy and improvement of manufacturing process.
For the years ended December 31, 2014 and 2013, the Group did not recognize impairment loss on goodwill.
-45-
| 16. | OTHER INTANGIBLE ASSETS |
The carrying amounts of each class of other intangible assets were as follows:
| December 31 | ||||||||
| 2014 | 2013 | |||||||
| NT$ | NT$ | |||||||
| Patents | $ | 15,768 | $ | 35,751 | ||||
| Acquired specific technology | 5,116 | 88,674 | ||||||
| Customer relationships | 501,501 | 654,821 | ||||||
| Computer software and others | 945,486 | 826,578 | ||||||
| $ | 1,467,871 | $ | 1,605,824 | |||||
For the year ended December 31, 2014
| Patents | Acquired Specific Technology | Customer Relationships | Computer Software and Others | Total | ||||||||||||||||
| NT$ | NT$ | NT$ | NT$ | NT$ | ||||||||||||||||
| Cost | ||||||||||||||||||||
| Balance at January 1, 2014 | $ | 1,021,750 | $ | 1,113,947 | $ | 1,579,015 | $ | 3,848,793 | $ | 7,563,505 | ||||||||||
| Additions | - | - | - | 396,466 | 396,466 | |||||||||||||||
| Disposals or derecognization | - | - | - | (1,239,163 | ) | (1,239,163 | ) | |||||||||||||
| Reclassification | - | - | - | 6,228 | 6,228 | |||||||||||||||
| Effect of foreign currency exchange differences | 3,441 | - | - | 55,017 | 58,458 | |||||||||||||||
| Balance at December 31, 2014 | $ | 1,025,191 | $ | 1,113,947 | $ | 1,579,015 | $ | 3,067,341 | $ | 6,785,494 | ||||||||||
| Accumulated amortization | ||||||||||||||||||||
| Balance at January 1, 2014 | $ | 985,999 | $ | 1,025,273 | $ | 924,194 | $ | 3,022,215 | $ | 5,957,681 | ||||||||||
| Amortization expense | 21,958 | 83,558 | 153,320 | 286,898 | 545,734 | |||||||||||||||
| Disposals or derecognization | - | - | - | (1,227,346 | ) | (1,227,346 | ) | |||||||||||||
| Reclassification | - | - | - | 2,516 | 2,516 | |||||||||||||||
| Effect of foreign currency exchange differences | 1,466 | - | - | 37,572 | 39,038 | |||||||||||||||
| Balance at December 31, 2014 | $ | 1,009,423 | $ | 1,108,831 | $ | 1,077,514 | $ | 2,121,855 | $ | 5,317,623 | ||||||||||
-46-
For the year ended December 31, 2013
| Patents | Acquired Specific Technology | Customer Relationships | Computer Software and Others | Total | ||||||||||||||||
| NT$ | NT$ | NT$ | NT$ | NT$ | ||||||||||||||||
| Cost | ||||||||||||||||||||
| Balance at January 1, 2013 | $ | 1,018,533 | $ | 1,113,947 | $ | 1,579,015 | $ | 3,522,312 | $ | 7,233,807 | ||||||||||
| Additions | - | - | - | 313,110 | 313,110 | |||||||||||||||
| Disposals | - | - | - | (11,294 | ) | (11,294 | ) | |||||||||||||
| Reclassification | - | - | - | (8,684 | ) | (8,684 | ) | |||||||||||||
| Acquisitions through business combinations | - | - | - | 3,508 | 3,508 | |||||||||||||||
| Effect of foreign currency exchange differences | 3,217 | - | - | 29,841 | 33,058 | |||||||||||||||
| Balance at December 31, 2013 | $ | 1,021,750 | $ | 1,113,947 | $ | 1,579,015 | $ | 3,848,793 | $ | 7,563,505 | ||||||||||
| Accumulated amortization | ||||||||||||||||||||
| Balance at January 1, 2013 | $ | 774,159 | $ | 882,625 | $ | 776,600 | $ | 2,745,977 | $ | 5,179,361 | ||||||||||
| Amortization expense | 210,900 | 142,648 | 147,594 | 273,162 | 774,304 | |||||||||||||||
| Disposals | - | - | - | (11,294 | ) | (11,294 | ) | |||||||||||||
| Reclassification | - | - | - | 25 | 25 | |||||||||||||||
| Acquisitions through business combinations | - | - | - | 688 | 688 | |||||||||||||||
| Effect of foreign currency exchange differences | 940 | - | - | 13,657 | 14,597 | |||||||||||||||
| Balance at December 31, 2013 | $ | 985,999 | $ | 1,025,273 | $ | 924,194 | $ | 3,022,215 | $ | 5,957,681 | ||||||||||
Each class of other intangible assets, except a portion of customer relationships amortized based on the pattern in which the economic benefits are consumed, were amortized on the straight-line basis over the following useful lives:
| Patents | 5-15 years | |
| Acquired specific technology | 5 years | |
| Customer relationships | 11 years | |
| Computer software and others | 2-32 years |
| 17. | LONG-TERM PREPAYMENTS FOR LEASE |
Long-term prepayments for lease mainly represent land use right located in China with periods for use from 50 to 60 years. As of December 31, 2014 and 2013, the carrying amount of the land use right which the Group was in the process of obtaining the certificates was NT$17,594 thousand and NT$1,541,453 thousand, respectively. During 2014, the land use right located in China which the Group obtained the certificates was reclassified from long-term prepayments for lease to construction in progress under inventories related to real estate business.
-47-
| 18. | BORROWINGS |
| a. | Short-term borrowings |
Short-term borrowings mainly represented unsecured revolving bank loans with annual interest rates at 0.81%-6.00% and 0.80%-6.30% as of December 31, 2014 and 2013, respectively.
| b. | Long-term borrowings |
As of December 31, 2014 and 2013, the long-term bank loans with fixed interest rates were NT$1,192,975 thousand and NT$706,562 thousand, respectively, with annual interest rates at 1.10%-6.15%, respectively, and all repayable through May 2015 to November 2016. As of December 31, 2014 and 2013, the current portion of long-term bank loans with fixed interest rates were NT$116,876 thousand and nil, respectively. The others were floating interest rate borrowings and consisted of the followings:
| December 31 | ||||||||
| 2014 | 2013 | |||||||
| NT$ | NT$ | |||||||
| Specified purpose loans | ||||||||
| Repaid in March 2014, annual interest rate was 6.15% as of December 31, 2013 | $ | - | $ | 16,080 | ||||
| Working capital bank loans | ||||||||
| Syndicated bank loans - repayable through April 2015 to July 2018, annual interest rates were 0.90%-1.83% and 0.90%-2.28% as of December 31, 2014 and 2013, respectively | 10,760,548 | 11,537,135 | ||||||
| Others - repayable through January 2016 to August 2019, annual interest rates were 1.03%-3.74% and 1.04%-4.43% as of December 31, 2014 and 2013, respectively | 12,479,650 | 22,260,633 | ||||||
| Mortgage loans | ||||||||
| Repayable through December 2015 to June 2023, annual interest rates were 6.77% and 1.40%-7.20% as of December 31, 2014 and 2013, respectively | 2,534,483 | 395,177 | ||||||
| 25,774,681 | 34,209,025 | |||||||
| Less: unamortized arrangement fee | 32,225 | 58,722 | ||||||
| 25,742,456 | 34,150,303 | |||||||
| Less: current portion | 2,714,131 | 5,276,206 | ||||||
| $ | 23,028,325 | $ | 28,874,097 | |||||
Pursuant to the above syndicated bank loans agreements, the Company and some of its subsidiaries should maintain certain financial covenants including current ratio, leverage ratio, tangible net assets and interest coverage ratio. Such financial ratios are calculated based on the Group’s annual audited consolidated financial statements or semi-annual reviewed consolidated financial statements or subsidiaries’ annual audited financial statements. The Company and its subsidiaries were in compliance with all of the loan covenants as of December 31, 2014 and 2013.
The Group had sufficient long term credit facility obtained before December 31, 2013 to refinance some portion of the loans on a long-term basis. Therefore, NT$5,962,343 thousand were not classified as current portion of long-term borrowings as of December 31, 2013.
-48-
| 19. | BONDS PAYABLE |
| December 31 | ||||||||
| 2014 | 2013 | |||||||
| NT$ | NT$ | |||||||
| Secured domestic bonds - secured by banks | ||||||||
| Repayable at maturity in August 2016 and interest due annually with annual interest rate 1.45% | $ | 8,000,000 | $ | 8,000,000 | ||||
| Unsecured convertible overseas bonds | 12,660,000 | 11,922,000 | ||||||
| Secured overseas bonds - secured by the Company | ||||||||
| US$300,000 thousand, repayable at maturity in July 2017; interest due semi-annually with annual interest rate 2.125% | 9,495,000 | - | ||||||
| CNY500,000 thousand, repayable at maturity in September 2016 and interest due semi-annually with annual interest rate 4.25% | 2,586,207 | 2,444,275 | ||||||
| CNY150,000 thousand with annual interest rate 3.13% and repaid in September 2014 | - | 733,282 | ||||||
| 32,741,207 | 23,099,557 | |||||||
| Less: discounts on bonds payable | 1,471,076 | 1,785,552 | ||||||
| 31,270,131 | 21,314,005 | |||||||
| Less: current portion | - | 731,438 | ||||||
| $ | 31,270,131 | $ | 20,582,567 | |||||
In September 2013, the Company offered the third unsecured convertible overseas bonds (the “Bonds”) in US$400,000 thousand. The Bonds is zero coupon bonds with the maturity of 5 years, in denominations of US$200 thousand or in any integral multiples thereof. Each holder of the Bonds has the right at any time on or after October 16, 2013 and up to (and including) August 26, 2018, except during legal lock-up period, to convert the Bonds into newly issued listed common shares at the conversion price NT$33.085, determined on the basis of a fixed exchange rate of US$1 to NT$29.956. The conversion price will be adjusted in accordance with the conversion provisions due to anti-dilution clause. As of December 31, 2014, the conversion price was NT$31.93.
The Bonds may be redeemed at the option of the Company, in whole or in part, at any time on or after the third anniversary of the offering date provided that (1) the closing price, translated into U.S. dollars, of the common shares for a period of 20 consecutive trading days is at least 130% of the conversion price, (2) at least 90% in aggregate principal amount of the Bonds originally outstanding has been redeemed, repurchased and canceled or converted, or (3) the Company is required to pay additional taxes on the Bonds as a result of certain changes in tax laws in the ROC.
Each holder shall have the right to request the Company repurchase all or any portion of the principal amount thereof of a holder’s Bonds (1) on the third anniversary of the offering date, (2) in the event of a change of control, or (3) in the event of delisting.
The Bonds contained a debt host contract, recognized as bonds payable, and the conversion option, redemption option and put option (collectively the “Bonds Options”) aggregately recognized as financial liabilities at FVTPL. The effective interest rate of the debt host contract was 3.16% and the aggregate fair value of the Bonds Options was NT$1,667,950 thousand on initial recognition. As a result of changes in fair value, we recognized a loss of NT$777,610 thousand and NT$75,046 thousand for the years ended December 31, 2014 and 2013, respectively, in other gains and losses.
To focus on corporate sustainability and to carry out the commitment to environmental protection and energy conservation, Anstock II Limited, a subsidiary the Company 100% owned, offered overseas bonds in US$300,000 thousand with the maturity of 3 years and annual interest rate of 2.125% (the “Green Bonds”) in July 2014. The Green Bonds are unconditionally and irrevocably guaranteed by the Company and the proceeds will be used to fund certain eligible projects to promote the Group’s transition to
-49-
low-carbon and climate resilient growth.
| 20. | OTHER PAYABLES |
| December 31 | ||||||||
| 2014 | 2013 | |||||||
| NT$ | NT$ | |||||||
| Payables for property, plant and equipment | $ | 7,097,129 | $ | 3,408,603 | ||||
| Accrued salary and bonus | 5,550,040 | 4,414,581 | ||||||
| Accrued bonus to employees and remuneration to directors and supervisors | 2,602,796 | 1,778,422 | ||||||
| Accrued legal settlement fee | 814,185 | - | ||||||
| Accrued employee insurance | 572,259 | 473,575 | ||||||
| Accrued utilities | 495,404 | 450,506 | ||||||
| Others | 5,232,703 | 4,232,866 | ||||||
| $ | 22,364,516 | $ | 14,758,553 | |||||
The Company and its subsidiary, ASE US, reached the final settlement agreement with Tessera Inc. (“Tessera”) in October 2014 to resolve the patent infringement lawsuit, and Tessera has dismissed all claims against the Company and ASE US. The Company recognized the originally agreed settlement amount of NT$894,150 thousand (US$30,000 thousand as resolved in the term sheet agreement in February 2014) in the fourth quarter of 2013 under the line item of long-term payables. The final settlement amount was reduced to NT$814,185 (US$27,000 thousand as resolved in the final settlement agreement in October 2014) and reclassified from long-term payables to other payables which was paid in January 2015.
| 21. | RETIREMENT BENEFIT PLANS |
| a. | Defined contribution plans |
| 1) | The pension plan under the ROC Labor Pension Act (“LPA”) for the Group’s ROC resident employees is a government-managed defined contribution plan. Based on the LPA, the Company and its subsidiaries in Taiwan makes monthly contributions to employees’ individual pension accounts at 6% of their monthly salaries. |
| 2) | The subsidiaries located in China, U.S.A., Malaysia, Singapore and Mexico also make contributions at various ranges according to relevant local regulations. |
| b. | Defined benefit plans |
| 1) | The Company and its subsidiaries in Taiwan joined the defined benefit pension plan under the ROC Labor Standards Law (“LS Law”). Pension benefits are calculated on the basis of the length of service and average monthly salaries of the last six months before retirement. The Company and its subsidiaries in Taiwan make contributions based on a certain percentage of their domestic employees’s monthly salaries to a pension fund administered by the pension fund monitoring committee and deposited in the names of the Committees in the Bank of Taiwan.. Under the Labor Standards Law, the rate of return on assets shall not be less than the average interest rate on a two-year time deposit published by the local banks and the government is responsible for any shortfall in the event that the rate of return is less than the required rate of return. The plan assets are held in a commingled fund which is operated and managed by the government’s designated authorities; as such, the Company does not have any right to intervene in the investments of the funds. |
-50-
| 2) | ASE Japan has a pension plan under which eligible employees with more than ten years of service are entitled to receive pension benefits based on their length of service and salaries at the time of termination of employment. ASE Japan makes contributions based on a certain amount of pension cost to employees. |
ASE Korea also has a pension plan under which eligible employees and directors with more than one year of service are entitled to receive a lump-sum payment upon termination of their service with ASE Korea, based on their length of service and salaries at the time of termination. ASE Korea makes contributions based on a certain percentage of pension cost to an external financial institution administered by the management and in the names of employees.
| 3) | ASE Inc., ASE Test, Inc. and ASE Electronics Inc. maintain pension plans for executive managers. Pension costs under the plans were NT$16,645 thousand and NT$4,950 thousand for the years ended December 31, 2014 and 2013, respectively. Pension payments were NT$25,315 thousand and NT$2,666 thousand for the years ended December 31, 2014 and 2013, respectively. As of December 31, 2014 and 2013, accrued pension liabilities for executive managers were NT$199,842 thousand and NT$208,512 thousand, respectively. |
| 4) | The present value of the defined benefit obligation and the related current service cost and past service cost were measured using the Projected Unit Credit Method. |
Except the pension plans for executive managers, the key assumptions used for the actuarial valuations were as follow:
| December 31 | ||||
| 2014 | 2013 | |||
| Discount rates | 0.12%-4.03% | 0.20%-4.94% | ||
| Expected return on plan assets | 1.25%-2.66% | 1.25%-3.45% | ||
| Expected rates of salary increase | 2.00%-4.70% | 0.00%-5.05% | ||
The expected rate of return was based on historical return trends and analysts’ predictions of the market where the plan assets located over the life of the related obligation, by reference to the aforementioned use of the plan assets and the impact of the related minimum return.
| 5) | An analysis of the amounts recognized in profit or loss in respect of the defined benefit plans excluding those for executive managers was as follows: |
| For the Years Ended December 31 | ||||||||
| 2014 | 2013 | |||||||
| NT$ | NT$ | |||||||
| Current service cost | $ | 327,707 | $ | 347,629 | ||||
| Interest cost | 189,043 | 156,157 | ||||||
| Expected return on plan assets | (61,352 | ) | (71,740 | ) | ||||
| Past service cost | 48,364 | 10,707 | ||||||
| $ | 503,762 | $ | 442,753 | |||||
-51-
An analysis by function was as follows:
| For the Years Ended December 31 | ||||||||
| 2014 | 2013 | |||||||
| NT$ | NT$ | |||||||
| Operating cost | $ | 394,082 | $ | 345,336 | ||||
| Selling and marketing expenses | 12,540 | 11,266 | ||||||
| General and administrative expenses | 55,594 | 47,048 | ||||||
| Research and development expenses | 41,546 | 39,103 | ||||||
| $ | 503,762 | $ | 442,753 | |||||
| 6) | For the years ended December 31, 2014 and 2013, the Group recognized actuarial loss of NT$32,845 thousand and actuarial gain of NT$350,260 thousand in other comprehensive loss, respectively. As of December 31, 2014 and 2013, the accumulated actuarial loss of NT$349,260 thousand and NT$316,722 thousand were recognized in other comprehensive loss, and NT$4,981 thousand and NT$3,643 thousand were recognized in non-controlling interests, respectively. |
| 7) | The amounts included in the consolidated balance sheets arising from the Group’s obligation in respect of its defined benefit plans excluding those for executive managers were as follows: |
| December 31 | ||||||||
| 2014 | 2013 | |||||||
| NT$ | NT$ | |||||||
| Present value of funded defined benefit obligation | $ | 7,741,174 | $ | 7,472,145 | ||||
| Fair value of plan assets | (3,502,487 | ) | (3,118,804 | ) | ||||
| Present value of unfunded defined benefit obligation | 4,238,687 | 4,353,341 | ||||||
| Unrecognized past service cost | (78,275 | ) | (104,603 | ) | ||||
| Recorded under others payables | (1,028 | ) | (15,893 | ) | ||||
| Recorded under prepaid pension cost | 11,910 | - | ||||||
| Net defined benefit liability | $ | 4,171,294 | $ | 4,232,845 | ||||
Movements in net defined benefit liability were as follows:
| December 31 | ||||||||
| 2014 | 2013 | |||||||
| NT$ | NT$ | |||||||
| Balance, beginning of the year | $ | 7,472,145 | $ | 7,751,862 | ||||
| Current service cost | 327,707 | 347,629 | ||||||
| Interest cost | 189,043 | 156,157 | ||||||
| Actuarial losses (gains) | 64,830 | (429,208 | ) | |||||
| Past service cost | 22,036 | - | ||||||
| Exchange differences on foreign plans | (25,354 | ) | (100,662 | ) | ||||
| Benefits paid | ||||||||
| Plan assets | (292,996 | ) | (154,608 | ) | ||||
| The Group | (16,237 | ) | (99,025 | ) | ||||
| Balance, end of the year | $ | 7,741,174 | $ | 7,472,145 | ||||
-52-
Movements in the fair value of the plan assets were as follows:
| December 31 | ||||||||
| 2014 | 2013 | |||||||
| NT$ | NT$ | |||||||
| Balance, beginning of the year | $ | 3,118,804 | $ | 2,682,803 | ||||
| Expected return on plan assets | 61,352 | 71,740 | ||||||
| Actuarial gains (losses) | 18,946 | (10,365 | ) | |||||
| Contributions from employer | 556,555 | 470,592 | ||||||
| Benefits paid from plan assets | (292,996 | ) | (154,608 | ) | ||||
| Exchange differences on foreign plans | 39,826 | 58,642 | ||||||
| Balance, end of the year | $ | 3,502,487 | $ | 3,118,804 | ||||
For the years ended December 31, 2014 and 2013, the actual return on plan assets were NT$80,298 thousand and NT$61,375 thousand, respectively.
| 8) | The major categories of plan assets at the end of the reporting period for each category were disclosed based on the information announced by Bureau of Labor Funds, Ministry of Labor and foreign actuarial report: |
| Fair Value of Plan Assets (%) | ||||||||
| December 31 | ||||||||
| 2014 | 2013 | |||||||
| Cash and cash equivalents | 53 | 37 | ||||||
| Equity instruments | 25 | 26 | ||||||
| Debt instruments | 20 | 33 | ||||||
| Others | 2 | 4 | ||||||
| Total | 100 | 100 | ||||||
| 9) | The Group elected to disclose the historical information of experience adjustments as the amounts determined for each accounting period prospectively from the date of transition to Taiwan-IFRSs (January 1, 2012). |
| December 31 | ||||||||
| 2014 | 2013 | |||||||
| NT$ | NT$ | |||||||
| Present value of defined benefit obligation | $ | 7,741,174 | $ | 7,472,145 | ||||
| Fair value of plan assets | (3,502,487 | ) | (3,118,804 | ) | ||||
| Deficit | $ | 4,238,687 | $ | 4,353,341 | ||||
| Experience adjustments on plan liabilities | $ | 38,516 | $ | (35,839 | ) | |||
| Experience adjustments on plan assets | $ | 18,946 | $ | (10,365 | ) | |||
| 10) | The Group expects to make contributions of NT$510,434 thousand to the defined benefit plans in the next year starting from January 1, 2015. |
-53-
| 22. | EQUITY |
| a. | Share capital |
Ordinary shares
| December 31, | ||||||||
| 2014 | 2013 | |||||||
| Numbers of shares authorized (in thousands) | 10,000,000 | 9,600,000 | ||||||
| Numbers of shares reserved (in thousands) | ||||||||
| Employee share options | 800,000 | 800,000 | ||||||
| Shares authorized | $ | 100,000,000 | $ | 960,000,000 | ||||
| Shares reserved | ||||||||
| Employee share options | $ | 8,000,000 | $ | 8,000,000 | ||||
| Numbers of shares registered (in thousands) | 7,852,538 | 7,756,004 | ||||||
| Numbers of shares subscribed in advance (in thousands) | 9,187 | 31,823 | ||||||
| Number of shares issued and fully paid (in thousands) | 7,861,725 | 7,787,827 | ||||||
The holders of issued ordinary shares with a par value at $10 per share are entitled the right to vote and receive dividends, except the shares held by the Group’s subsidiaries which are not entitled the right to vote. As of December 31, 2014 and 2013, there were 500,000 thousand and 100,000 thousand ordinary shares, respectively, included in the authorized shares that were not yet required to complete the share registration process.
American Depositary Receipts
The Company issued ADSs and each ADS represents five ordinary shares. As of December 31, 2014 and 2013, 125,731 thousand and 96,649 thousand ADSs were outstanding and represented approximately 628,657 thousand and 483,243 thousand ordinary shares of the Company, respectively.
| b. | Capital surplus |
| December 31, | ||||||||
| 2014 | 2013 | |||||||
| NT$ | NT$ | |||||||
| Arising from the excess of the consideration received over the carrying amounts of the subsidiaries’ net assets (Note 28) | $ | 9,036,941 | $ | 2,165,879 | ||||
| Arising from issuance of ordinary shares | 5,325,382 | 4,134,295 | ||||||
| Arising from employee share options | 1,178,210 | 1,369,232 | ||||||
| Arising from treasury share transactions | 425,004 | 236,214 | ||||||
| Arising from share of changes in capital surplus of associates | 30,134 | 3,250 | ||||||
| $ | 15,995,671 | $ | 7,908,870 | |||||
As of December 31, 2014 and 2013, capital surplus arising from issuance of ordinary shares of NT$3,626 thousand represented the unexercised portion for employees’ subscription on cash capital increase of the Company in 2013 (Note 26c).
-54-
The premium from ordinary shares issued in excess of par, including the premium from issuance of ordinary shares, treasury share transactions and carrying amount of expired options, may be used to offset deficits; in addition, when the Company has no deficit, such capital surplus may be distributed as cash dividends or transferred to capital up to a certain percentage of the Company’s capital surplus each year.
The capital surplus arising from investments accounted for using the equity method and employee share options may not be used for any purpose.
| c. | Retained earnings and dividend policy |
The Articles of Incorporation of ASE Inc. (the “Articles”) provides that annual net income shall be distributed in the following order:
| 1) | Replenishment of deficits; |
| 2) | 10.0% as legal reserve; |
| 3) | Special reserve appropriated or reversed in accordance with laws or regulations set forth by the authorities concerned; |
| 4) | An amount equal to the excess of the income from investments accounted for using the equity method over cash dividends as special reserve; |
| 5) | Addition or deduction of realized gains or losses on equity instruments at fair value through other comprehensive income; |
| 6) | Not more than 1.0% of the remainder, from 1) to 5), as remuneration to directors and supervisors; |
| 7) | Between 7.0% to 11.0% of the remainder, from 1) to 5), as bonus to employees, of which 7.0% shall be distributed in accordance with the employee bonus plan and the excess shall be distributed to specified employees at the board of directors’ discretion; and |
| 8) | Any remainder from above as dividends to shareholders. |
Employees to whom referred in 7) above include employees of subsidiaries that meet certain conditions, which are to be determined by the board of directors.
The Company is currently in the mature growth stage. To meet the capital needs for business development now and in the future and satisfy the shareholders’ demand for cash inflows, the Company shall use residual dividend policy to distribute dividends, of which the cash dividend is not lower than 30% of the total dividend distribution, with the remainder to be distributed in stock. A distribution plan is also to be made by the board of directors and passed for resolution in the shareholders’ meeting.
As of December 31, 2014 and 2013, the accrued bonus to employees of the Company was NT$2,335,786 thousand and NT$1,586,672 thousand, respectively, and the accrued remuneration to directors and supervisors of the Company was NT$212,344 thousand and NT$144,243 thousand, respectively. The accrued bonus to employees and remuneration to directors and supervisors represented 11% and 1%, respectively, of net income (net of the bonus and remuneration) for the years ended December 31, 2014 and 2013. Material differences between such estimated amounts and the amounts proposed by the board of directors on or before the consolidated financial statements are authorized for issue are adjusted in the year the bonus and remuneration were recognized. If there is a change in the proposed amounts after the consolidated financial statements are authorized for issue, the differences are recorded as a change in accounting estimate. If a share bonus is resolved to be distributed to employees, the number of shares is determined by dividing the amount of the share bonus
-55-
by the closing price (after considering the effect of cash and stock dividends) of the shares of the day immediately preceding the shareholders’ meeting.
Under Rule No. 1010012865 and Rule No. 1010047490 issued by the FSC and the directive titled “Questions and Answers for Special Reserves Appropriated Following Adoption of IFRSs”, the Company should appropriate or reverse to a special reserve. Any special reserve appropriated may be reversed to the extent that the net debit balance reverses and thereafter distributed.
Appropriation of earnings to legal reserve shall be made until the legal reserve equals the Company’s capital surplus. Legal reserve may be used to offset deficits. If the Company has no deficit and the legal reserve has exceeded 25% of the Company’s capital surplus, the excess may be transferred to capital or distributed in cash.
The appropriations of earnings for 2013 and 2012 resolved at the Company’s annual shareholders’ meetings in June 2014 and June 2013, respectively, were as follows:
| Appropriation of Earnings | Dividends Per Share | |||||||||||||||
| For Year 2013 | For Year 2012 | For Year 2013 | For Year 2012 | |||||||||||||
| NT$ | NT$ | NT$ | NT$ | |||||||||||||
| (in dollars) | (in dollars) | |||||||||||||||
| Legal reserve | $ | 1,568,907 | $ | 1,309,136 | ||||||||||||
| Special reserve | (309,992 | ) | 309,992 | |||||||||||||
| Cash dividends | 10,156,005 | 7,987,974 | $ | 1.30 | $ | 1.05 | ||||||||||
| $ | 11,414,920 | $ | 9,607,102 | |||||||||||||
The bonus to employees and the remuneration to directors and supervisors for 2013 and 2012 distributed in cash were also approved in the aforementioned shareholders’ meetings. The information was as follows:
| For Year 2013 | For Year 2012 | |||||||
| NT$ | NT$ | |||||||
| Bonus to employees | $ | 1,587,300 | $ | 1,147,223 | ||||
| Remuneration to directors and supervisors | 144,000 | 228,000 | ||||||
The appropriations of earnings for 2012 were proposed according to the Corporation’s financial statements for the year ended December 31, 2012, which were prepared in accordance with the former Regulations Governing the Preparation of Financial Reports by Securities Issuers and ROC GAAP.
The differences between the resolved amounts of the bonus to employees and remuneration to directors and supervisors and the accrued amounts reflected in the consolidated financial statements for the years ended December 31, 2013 and 2012 were deemed changes in estimates. The difference was NT$385 thousand and NT$38,644 thousand and had been adjusted in earnings for the years ended December 31, 2014 and 2013, respectively.
Information regarding the bonus to employees and the remuneration to directors and supervisors resolved by the shareholders’ meeting is available on the Market Observation Post System website of the TSE.
| d. | Special reserve appropriated in accordance with the local regulations |
On January 1, 2013, the Company appropriated to the special reserve of NT$3,353,938 thousand relating to the exchange differences on translating foreign operations transferred to retained earnings in accordance with the local regulations.
-56-
| e. | Accumulated other comprehensive income |
| 1) | Exchange differences on translating foreign operations |
| For the Years Ended December 31 | ||||||||
| 2014 | 2013 | |||||||
| NT$ | NT$ | |||||||
| Balance at January 1 | $ | (525,521 | ) | $ | (3,210,248 | ) | ||
| Exchange differences arising on translating foreign operations | 5,064,907 | 2,685,647 | ||||||
| Share of exchange difference of associates accounted for using the equity method | 1,767 | (920 | ) | |||||
| Balance at December 31 | $ | 4,541,153 | $ | (525,521 | ) | |||
| 2) | Unrealized gain on available-for-sale financial assets |
| For the Years Ended December 31 | ||||||||
| 2014 | 2013 | |||||||
| NT$ | NT$ | |||||||
| Balance at January 1 | $ | 426,246 | $ | 355,254 | ||||
| Unrealized loss arising on revaluation of available-for-sale financial assets | (142,418 | ) | 14,985 | |||||
| Cumulative loss reclassified to profit or loss on disposal of available-for-sale financial assets | 9,561 | (96 | ) | |||||
| Share of unrealized gain on available-for-sale financial assets of associates accounted for using the equity method | 233,389 | 56,103 | ||||||
| Balance at December 31 | $ | 526,778 | $ | 426,246 | ||||
| 3) | Cash flow hedges |
| For the Years Ended December 31 | ||||||||
| 2014 | 2013 | |||||||
| NT$ | NT$ | |||||||
| Balance at January 1 | $ | (3,279 | ) | $ | (3,755 | ) | ||
| Gain arising on changes in the fair value of hedging instruments - Interest rate swap contracts | 795 | (2,597 | ) | |||||
| Cumulative loss arising on changes in fair value of hedging instruments reclassified to profit or loss - Interest rate swap contracts | 2,484 | 3,842 | ||||||
| Income tax related to cash flow hedges | - | (769 | ) | |||||
| Balance at December 31 | $ | - | $ | (3,279 | ) | |||
| f. | Treasury shares (in thousand shares) |
There was no change in the Company’s shares held by subsidiaries in 2014 and 2013. The Company’s shares held by its subsidiaries at each balance sheet date were as follows:
-57-
The Company’s shares held by its subsidiaries at each balance sheet date were as follows:
Shares Held By Subsidiaries (in thousand shares) | Carrying amount | Fair Value | ||||||||||
| NT$ | NT$ | |||||||||||
| December 31, 2014 | ||||||||||||
| ASE Test | 88,200 | $ | 1,380,721 | $ | 3,360,438 | |||||||
| J&R Holding | 46,704 | 381,709 | 1,779,413 | |||||||||
| ASE Test, Inc. | 10,979 | 196,677 | 418,291 | |||||||||
| 145,883 | $ | 1,959,107 | $ | 5,558,142 | ||||||||
| December 31, 2013 | ||||||||||||
| ASE Test | 88,200 | $ | 1,380,721 | $ | 2,443,153 | |||||||
| J&R Holding | 46,704 | 381,709 | 1,293,694 | |||||||||
| ASE Test, Inc. | 10,979 | 196,677 | 304,112 | |||||||||
| 145,883 | $ | 1,959,107 | $ | 4,040,959 | ||||||||
The Company issued ordinary shares in connection with its merger with its subsidiaries. The shares held by its subsidiaries were reclassified from investments accounted for using the equity method to treasury shares on the proportion owned by the Company.
Under the Securities and Exchange Act in the ROC, the Company shall neither pledge treasury shares nor exercise shareholders’ rights on these shares, such as rights to dividends and voting. The subsidiaries holding treasury shares, however, retain shareholders’ rights except the rights to participate in any share issuance for cash and voting.
In February 2015, the board of directors approved to repurchase up to 120,000 thousand of the Company’s ordinary shares which will be used for equity conversion of convertible overseas bonds to be issued in the future. The shares to be repurchased account for 1.53% of our total issued shares, at prices between NT$32.0 to NT$55.0 per share during the period from March 2, 2015 to April 30, 2015. The Company will keep buying back if the prices is under the lower limit.
| g. | Non-controlling interests |
| For the Years Ended December 31 | ||||||||
| 2014 | 2013 | |||||||
| NT$ | NT$ | |||||||
| Balance at January 1 | $ | 4,144,338 | $ | 3,521,419 | ||||
| Attributable to non-controlling interests: | ||||||||
| Share of profit for the year | 629,419 | 465,966 | ||||||
| Exchange difference on translating foreign operations | 339,451 | 131,621 | ||||||
| Unrealized loss on available-for-sale financial assets | (857 | ) | (50 | ) | ||||
| Cash capital increase of subsidiary (Note 28) | 3,073,516 | 27,826 | ||||||
| Non-controlling interest relating to outstanding vested share options held by the employees of subsidiaries | 120,376 | 100,547 | ||||||
| Defined benefit plan actuarial losses | (1,338 | ) | (3,394 | ) | ||||
| Cash dividends to non-controlling interests | (85,766 | ) | (99,597 | ) | ||||
| Balance at December 31 | $ | 8,219,139 | $ | 4,144,338 | ||||
-58-
| 23. | PROFIT BEFORE INCOME TAX |
| a. | Other income |
| For the Years Ended December 31 | ||||||||
| 2014 | 2013 | |||||||
| NT$ | NT$ | |||||||
| Interest income | $ | 243,474 | $ | 212,801 | ||||
| Government subsidy | 184,525 | 149,634 | ||||||
| Dividends income | 101,252 | 131,449 | ||||||
| Rental income | 59,624 | 63,130 | ||||||
| $ | 588,875 | $ | 557,014 | |||||
| b. | Other gains, net |
| For the Years Ended December 31 | ||||||||
| 2014 | 2013 | |||||||
| NT$ | NT$ | |||||||
| Net gain arising on financial instruments held for trading | $ | 1,266,653 | $ | 615,207 | ||||
| Net gain on financial assets designated as at FVTPL | 572,187 | 180,152 | ||||||
| Gains (losses) on disposal of property, plant and equipment and other assets | (44,681 | ) | 127,375 | |||||
| Foreign exchange loss, net | (1,221,979 | ) | (276,201 | ) | ||||
| Loss on damages and claims | (102,101 | ) | (1,058,810 | ) | ||||
| Impairment loss | (308,144 | ) | (691,872 | ) | ||||
| Bargain purchase gain | - | 28,860 | ||||||
| Others | 614,355 | 111,799 | ||||||
| $ | 776,290 | $ | (963,490 | ) | ||||
| c. | Finance costs |
| For the Years Ended December 31 | ||||||||
| 2014 | 2013 | |||||||
| NT$ | NT$ | |||||||
| Total interest expense for financial liabilities measured at amortized cost | $ | 2,548,850 | $ | 2,433,868 | ||||
| Less: Amounts included in the cost of qualifying assets | ||||||||
| Inventories related to real estate business | (100,705 | ) | (42,999 | ) | ||||
| Property, plant and equipment | (126,203 | ) | (137,567 | ) | ||||
| 2,321,942 | 2,253,302 | |||||||
| Loss arising on derivatives as designated hedging instruments in cash flow hedge accounting relationship reclassified from equity to profit or loss | 2,484 | 3,842 | ||||||
| Other finance costs | 29,671 | 50,311 | ||||||
| $ | 2,354,097 | $ | 2,307,455 | |||||
-59-
Information relating to the capitalized borrowing costs was as follows:
| For the Years Ended December 31 | ||||
| 2014 | 2013 | |||
| Annual interest capitalization rates | ||||
| Inventories related to real estate business | 6.00%-7.21% | 5.90%-7.21% | ||
| Property, plant and equipment | 0.88%-6.15% | 1.54%-6.15% | ||
| d. | Depreciation and amortization |
| For the Years Ended December 31 | ||||||||
| 2014 | 2013 | |||||||
| NT$ | NT$ | |||||||
| Property, plant and equipment | $ | 25,805,042 | $ | 24,696,607 | ||||
| Intangible assets | 545,734 | 774,304 | ||||||
| Total | $ | 26,350,776 | $ | 25,470,911 | ||||
| Summary of depreciation by function | ||||||||
| Operating costs | $ | 24,050,546 | $ | 23,025,115 | ||||
| Operating expenses | 1,754,496 | 1,671,492 | ||||||
| $ | 25,805,042 | $ | 24,696,607 | |||||
| Summary of amortization by function | ||||||||
| Operating costs | $ | 180,719 | $ | 397,976 | ||||
| Operating expenses | 365,015 | 376,328 | ||||||
| $ | 545,734 | $ | 774,304 | |||||
| e. | Employee benefits expense |
| For the Years Ended December 31 | ||||||||
| 2014 | 2013 | |||||||
| NT$ | NT$ | |||||||
| Post-employment benefits (Note 21) | ||||||||
| Defined contribution plans | $ | 1,589,505 | $ | 1,324,178 | ||||
| Defined benefit plans | 520,407 | 447,703 | ||||||
| 2,109,912 | 1,771,881 | |||||||
| Equity-settled share-based payments | 110,157 | 260,801 | ||||||
| Salary, incentives and bonus | 40,475,594 | 34,032,023 | ||||||
| Other employee benefits | 5,984,074 | 5,211,948 | ||||||
| $ | 48,679,737 | $ | 41,276,653 | |||||
| Summary of employee benefits expense by function | ||||||||
| Operating costs | $ | 33,291,997 | $ | 28,061,759 | ||||
| Operating expenses | 15,387,740 | 13,214,894 | ||||||
| $ | 48,679,737 | $ | 41,276,653 | |||||
-60-
| 24. | INCOME TAX |
| a. | Income tax recognized in profit or loss |
The major components of income tax expense were as follows:
| For the Years Ended December 31 | ||||||||
| 2014 | 2013 | |||||||
| NT$ | NT$ | |||||||
| Current income tax | ||||||||
| In respect of the current year | $ | 3,524,456 | $ | 2,594,114 | ||||
| Income tax on unappropriated earnings | 25,737 | 13,933 | ||||||
| Adjustments for prior years | 72,380 | (91,633 | ) | |||||
| 3,622,573 | 2,516,414 | |||||||
| Deferred income tax | ||||||||
| In respect of the current year | 556,549 | 719,332 | ||||||
| Effect of foreign currency exchange differences | 75,305 | (62,285 | ) | |||||
| Others | (2,914 | ) | 28,191 | |||||
| 628,940 | 685,238 | |||||||
| Income tax expense recognized in profit or loss | $ | 4,251,513 | $ | 3,201,652 | ||||
A reconciliation of income tax expense calculated at the statutory rate and income tax expense recognized in profit or loss was as follows:
| For the Years Ended December 31 | ||||||||
| 2014 | 2013 | |||||||
| NT$ | NT$ | |||||||
| Profit before income tax | $ | 28,473,599 | $ | 19,356,692 | ||||
| Income tax expense calculated at the statutory rate | $ | 5,089,846 | $ | 3,681,888 | ||||
| Nontaxable expense in determining taxable income | 126,407 | (172,322 | ) | |||||
| Tax-exempt income | (623,652 | ) | (373,113 | ) | ||||
| Additional income tax on unappropriated earnings | 488,517 | 362,359 | ||||||
| Loss carry-forward and income tax credits currently used | (1,186,565 | ) | (684,309 | ) | ||||
| Remeasurement of deferred income tax assets, net | 291,217 | 241,824 | ||||||
| Adjustments for prior years’ tax | 72,380 | (91,633 | ) | |||||
| Land value increment tax | (6,637 | ) | 236,958 | |||||
| Income tax expense recognized in profit or loss | $ | 4,251,513 | $ | 3,201,652 | ||||
For the years ended December 31, 2014 and 2013, the Group applied a tax rate of 17% for resident entities subject to the Income Tax Law of the ROC; for the subsidiaries located in China, the applied tax rate was 25%; and for other jurisdictions, the Group measures taxes by using the applicable tax rate for each individual jurisdiction.
As the status of 2014 appropriations of earnings is uncertain, the potential income tax consequences of 2014 unappropriated earnings are not reliably determinable.
-61-
| b. | Income tax recognized directly in equity |
| For the Years Ended December 31 | ||||||||
| 2014 | 2013 | |||||||
| NT$ | NT$ | |||||||
| Deferred income tax | ||||||||
| Employee share options | $ | 4,481 | $ | - | ||||
| c. | Income tax recognized in other comprehensive income |
| For the Years Ended December 31 | ||||||||
| 2014 | 2013 | |||||||
| NT$ | NT$ | |||||||
| Deferred income tax | ||||||||
| Actuarial loss on defined benefit plan | $ | 13,039 | $ | (68,583 | ) | |||
| Fair value changes of hedging instruments for cash flow hedges | - | (769 | ) | |||||
| $ | 13,039 | $ | (69,352 | ) | ||||
| d. | Current tax assets and liabilities |
| December 31 | ||||||||
| 2014 | 2013 | |||||||
| NT$ | NT$ | |||||||
| Current tax assets | ||||||||
| Tax refund receivable | $ | 23,616 | $ | 92,430 | ||||
| Prepaid income tax | 41,696 | 58,166 | ||||||
| $ | 65,312 | $ | 150,596 | |||||
| Current tax liabilities | ||||||||
| Income tax payable | $ | 4,150,036 | $ | 3,000,869 | ||||
| e. | Deferred tax assets and liabilities |
The Group offset certain deferred tax assets and deferred tax liabilities which met the offset criteria.
The movements of deferred tax assets and deferred tax liabilities were as follows:
| Balance at January 1 | Recognized in Profit or Loss | Recognized in Other Comprehensive Income | Recognized in Equity | Exchange Differences | Balance at December 31 | |||||||||||||||||||
| NT$ | NT$ | NT$ | NT$ | NT$ | NT$ | |||||||||||||||||||
| Year ended December 31, 2014 | ||||||||||||||||||||||||
| Temporary differences | ||||||||||||||||||||||||
| Property, plant and equipment | $ | (1,684,616 | ) | $ | (804,082 | ) | $ | - | $ | - | $ | 56,843 | $ | (2,431,855 | ) | |||||||||
| Defined benefit obligation | 836,757 | (44,694 | ) | 13,039 | - | (21,767 | ) | 783,335 | ||||||||||||||||
| FVTPL financial instruments | (12,329 | ) | (170,722 | ) | - | - | 12,992 | (170,059 | ) | |||||||||||||||
| Others | 767,744 | 372,563 | - | 4,481 | 21,509 | 1,166,297 | ||||||||||||||||||
| (92,444 | ) | (646,935 | ) | 13,039 | 4,481 | 69,577 | (652,282 | ) | ||||||||||||||||
| Loss carry-forward | 270,031 | 246,334 | - | - | 3,533 | 519,898 | ||||||||||||||||||
| Investment credits | 924,128 | (227,486 | ) | - | - | (2,560 | ) | 694,082 | ||||||||||||||||
| Others | - | (853 | ) | - | - | - | (853 | ) | ||||||||||||||||
| $ | 1,101,715 | $ | (628,940 | ) | $ | 13,039 | $ | 4,481 | $ | 70,550 | $ | 560,845 | ||||||||||||
-62-
| Balance at January 1 | Recognized in Profit or Loss | Recognized in Other Comprehensive Income | Exchange Differences | Balance at December 31 | ||||||||||||||||
| NT$ | NT$ | NT$ | NT$ | NT$ | ||||||||||||||||
| Year ended December 31, 2013 | ||||||||||||||||||||
| Temporary differences | ||||||||||||||||||||
| Property, plant and equipment | $ | (977,288 | ) | $ | (730,743 | ) | $ | - | $ | 23,415 | $ | (1,684,616 | ) | |||||||
| Defined benefit obligation | 977,915 | (12,829 | ) | (68,583 | ) | (59,746 | ) | 836,757 | ||||||||||||
| Cash flow hedges | 769 | - | (769 | ) | - | - | ||||||||||||||
| FVTPL financial instruments | 61,499 | (73,832 | ) | - | 4 | (12,329 | ) | |||||||||||||
| Others | 445,904 | 336,473 | - | (14,633 | ) | 767,744 | ||||||||||||||
| 508,799 | (480,931 | ) | (69,352 | ) | (50,960 | ) | (92,444 | ) | ||||||||||||
| Loss carry-forward | 380,694 | (117,007 | ) | - | 6,344 | 270,031 | ||||||||||||||
| Investment credits | 1,029,097 | (87,300 | ) | - | (17,669 | ) | 924,128 | |||||||||||||
| $ | 1,918,590 | $ | (685,238 | ) | $ | (69,352 | ) | $ | (62,285 | ) | $ | 1,101,715 | ||||||||
| f. | Items for which no deferred tax assets have been recognized |
Unrecognized deferred tax assets related to loss carry-forward, investment credits and deductible temporary differences were summarized as follows:
| December 31 | ||||||||
| 2014 | 2013 | |||||||
| NT$ | NT$ | |||||||
| Loss carry-forward | $ | 694,960 | $ | 669,410 | ||||
| Investment credits | 629,231 | 714,481 | ||||||
| Deductible temporary differences | 957,183 | 901,580 | ||||||
| $ | 2,281,374 | $ | 2,285,471 | |||||
The unrecognized loss carry-forward will expire through 2023 and the unrecognized investment credits will expire through 2017.
| g. | Information about unused loss carry-forward, unused investment credits, tax-exemption and other tax relief |
As of December 31, 2014, the unused loss carry-forward comprised of:
| Year of Expiry | NT$ | |||
| 2015 | $ | 70,223 | ||
| 2016 | 167,001 | |||
| 2017 | 352,030 | |||
| 2018 | 277,680 | |||
| 2019 and thereafter | 347,924 | |||
| $ | 1,214,858 | |||
As of December 31, 2014, unused investment credits comprised of:
| Remaining Creditable Amount | ||||||||
| Laws and Statutes | Tax Credit Source | NT$ | Expiry Year | |||||
| Statute for Upgrading Industries | Purchase of machinery and equipment | $ | 1,267,646 | 2015 and thereafter | ||||
| Others | 55,667 | 2017 | ||||||
| $ | 1,323,313 | |||||||
-63-
As of December 31, 2014, profits attributable to the following expansion projects were exempted from income tax for a 3-year or 5-year period:
| Tax-exemption Period | ||
| Construction and expansion of 2004 by the Company | 2012.01-2016.12 | |
| Construction and expansion of 2005 by the Company | 2012.01-2016.12 | |
| Construction and expansion of 2007 by the Company | 2013.01-2015.12 | |
| Construction and expansion of 2008 by the Company. | 2014.01-2018.12 | |
| Construction and expansion of 2005 by ASE Test Inc. | 2011.01-2015.12 | |
| Construction and expansion of 2008 by ASE Test Inc. | 2014.01-2018.12 | |
| Construction and expansion of 2005 by ASE Electronics Inc. | 2012.01-2016.12 |
In addition, the Group had additional 3 unused construction and expansion projects.
Some China subsidiaries qualify as high technology enterprises which entitle them to a reduced income tax rate of 15% and also make them eligible to deduct certain times of research and development expenses from their taxable income.
| h. | Unrecognized deferred tax liabilities associated with investments |
As of December 31, 2014 and 2013, the taxable temporary differences associated with investments in subsidiaries for which no deferred tax liabilities have been recognized were NT$11,400,826 thousand and NT$9,326,560 thousand, respectively.
| i. | Integrated income tax |
As of December 31, 2014 and 2013, unappropriated earnings were all generated on and after January 1, 1998. As of December 31, 2014 and 2013, the balance of the Imputation Credit Account (“ICA”) was NT$934,038 thousand and NT$733,341 thousand, respectively.
The creditable ratio for the distribution of earnings of 2014 and 2013 was 6.19% (estimated) and 6.10% (actual), respectively.
Under the Integrated Income Tax System, ROC resident shareholders are allowed a tax credit for their proportionate share of the income tax paid in the ROC by the Company on earnings generated after January 1, 1998. Non-resident shareholders are allowed only a tax credit from the 10% income tax on undistributed earnings, which can be used to reduce the withholding income tax on dividends. Starting from 2015, the allowed tax credit is adjusted to 50% of the income tax paid in the ROC by the Company for ROC resident shareholders or 50% of the 10% income tax on undistributed earnings for non-resident shareholders. An ICA is maintained by the Company for such income tax and the tax credit allocated to each shareholder. The maximum credit available for allocation to each shareholder cannot exceed the balance shown in the ICA on the date of dividend distribution. The expected creditable ratio for the 2014 earnings may be adjusted, depending on the ICA balance on the date of dividend distribution.
| j. | Income tax assessments |
Income tax returns of ASE Inc. and its subsidiaries in Taiwan have been examined by authorities through 2012 and through 2010 to 2012, respectively. ASE Inc. and some of its subsidiaries in Taiwan disagreed with the result of examinations relating to its income tax returns for 2004 through 2008 and 2010 through 2012 and applied for appeal procedures. The related income tax expenses in the years resulting from the examinations have been accrued in respective tax years.
-64-
| 25. | EARNINGS PER SHARE |
The earnings and weighted average number of ordinary shares outstanding in the computation of earnings per share were as follows:
Net profit for the year
| For the Years Ended December 31 | ||||||||
| 2014 | 2013 | |||||||
| NT$ | NT$ | |||||||
| Profit for the year attributable to owners of the Company | $ | 23,592,667 | $ | 15,689,074 | ||||
| Effect of potentially dilutive ordinary shares: | ||||||||
| Employee share options issued by subsidiaries | (260,925 | ) | (131,756 | ) | ||||
| Convertible bonds | 931,344 | 156,193 | ||||||
| Earnings used in the computation of diluted earnings per share | $ | 24,263,086 | $ | 15,713,511 | ||||
eighted average number of ordinary shares outstanding (in thousand shares):
| For the Years Ended December 31 | ||||||||
| 2014 | 2013 | |||||||
| Weighted average number of ordinary shares in computation of basic earnings per share | 7,687,930 | 7,508,539 | ||||||
| Effect of potentially dilutive ordinary shares: | ||||||||
| Convertible bonds | 375,271 | 117,085 | ||||||
| Employee share options | 101,850 | 67,081 | ||||||
| Bonus to employees | 55,643 | 54,926 | ||||||
| Weighted average number of ordinary shares in computation of diluted earnings per share | 8,220,694 | 7,747,631 | ||||||
The Group is able to settle the bonuses paid to employees in cash or shares. The Group assumed that the entire amount of the bonus would be settled in shares and the resulting potential shares were included in the weighted average number of ordinary shares outstanding used in the computation of diluted earnings per share if the effect is dilutive. Such dilutive effect of the potential shares was included in the computation of diluted earnings per share until the shareholders approve the number of shares to be distributed to employees at their meeting in the following year.
| 26. | SHARE-BASED PAYMENT ARRANGEMENTS |
| a. | Employee share option plans of the Company and its subsidiaries |
In order to attract, retain and reward employees, ASE Inc. has four employee share option plans for full-time employees of the Group. Each share option represents the right to purchase one ordinary share of ASE Inc. when exercised. Under the terms of the plans, share options are granted at an exercise price equal to or not less than the closing price of the ordinary shares listed on the TSE at the grant date. The option rights of these plans are valid for 10 years, non-transferable and exercisable at certain percentages subsequent to the second anniversary of the grant date. For any subsequent changes in the Company’s capital structure, the exercise price is accordingly adjusted.
In December 2014, the board of directors approved the 5th employee share option plan.
-65-
ASE Inc. Option Plans
Information about share options was as follows:
| For the Years Ended December 31 | ||||||||||||||||
| 2014 | 2013 | |||||||||||||||
| Weighted | Weighted | |||||||||||||||
| Average | Average | |||||||||||||||
| Number of | Exercise | Number of | Exercise | |||||||||||||
| Options | Price Per Share | Options | Price Per Share | |||||||||||||
| (In Thousands) | (NT$) | (In Thousands) | (NT$) | |||||||||||||
| Balance at January 1 | 285,480 | $ | 20.5 | 344,332 | $ | 20.3 | ||||||||||
| Options forfeited | (1,515 | ) | 20.5 | (3,307 | ) | 20.7 | ||||||||||
| Options expired | (322 | ) | 13.5 | (10 | ) | 7.4 | ||||||||||
| Options exercised | (73,898 | ) | 19.7 | (55,535 | ) | 19.3 | ||||||||||
| Balance at December 31 | 209,745 | 20.7 | 285,480 | 20.5 | ||||||||||||
| Options exercisable, end of year | 189,240 | 20.7 | 228,685 | 20.4 | ||||||||||||
The weighted average share price at exercise dates of share options for the years ended December 31, 2014 and 2013 was NT$35.1 and NT$26.2, respectively.
Information about the Company’s outstanding share options at each balance sheet date was as follows:
| Range of Exercise Price Per Share (NT$) | Weighted Average Remaining Contractual Life (Years) | |||||||
| December 31, 2014 | $11.1-13.5 | 0.4 | ||||||
| 20.4-22.6 | 4.4 | |||||||
| December 31, 2013 | 11.1-13.5 | 0.6 | ||||||
| 20.4-22.6 | 5.4 | |||||||
ASE Mauritius Inc. Option Plan
ASE Mauritius Inc. has an employee share option plan for full-time employees of the Group which granted 30,000 thousand units in December 2007. Under the terms of the plan, each unit represents the right to purchase one ordinary share of ASE Mauritius Inc. when exercised. The option rights of the plan are valid for 10 years, non-transferable and exercisable at certain percentages subsequent to the second anniversary of the grant date.
-66-
Information about share options was as follows:
| For the Years Ended December 31 | ||||||||||||||||
| 2014 | 2013 | |||||||||||||||
| Number of | Exercise | Number of | Exercise | |||||||||||||
| Options | Price Per Share | Options | Price Per Share | |||||||||||||
| (In Thousands) | (US$) | (In Thousands) | (US$) | |||||||||||||
| Balance at January 1 | 28,545 | $ | 1.7 | 28,595 | $ | 1.7 | ||||||||||
| Options forfeited | - | - | (50 | ) | 1.7 | |||||||||||
| Balance at December 31 | 28,545 | 1.7 | 28,545 | 1.7 | ||||||||||||
| Options exercisable, end of year | 28,545 | 1.7 | 28,545 | 1.7 | ||||||||||||
As of December 31, 2014 and 2013, the share options were all vested and the remaining contractual life was 3 years and 4 years, respectively.
USIE Option Plans
The terms of the plans issued by USIE were the same with those of the Company’s option plans.
Information about share options was as follows:
| For the Years Ended December 31 | ||||||||||||||||
| 2014 | 2013 | |||||||||||||||
| Weighted | Weighted | |||||||||||||||
| Average | Average | |||||||||||||||
| Number of | Exercise | Number of | Exercise | |||||||||||||
| Options | Price Per Share | Options | Price Per Share | |||||||||||||
| (In Thousands) | (US$) | (In Thousands) | (US$) | |||||||||||||
| Balance at January 1 | 34,939 | $ | 2.1 | 34,966 | $ | 2.1 | ||||||||||
| Options forfeited | - | - | (27 | ) | 2.9 | |||||||||||
| Options exercised | (780 | ) | 1.5 | - | - | |||||||||||
| Balance at December 31 | 34,159 | 2.1 | 34,939 | 2.1 | ||||||||||||
| Options exercisable, end of year | 30,874 | 2.0 | 28,281 | 2.0 | ||||||||||||
Information about USIE’s outstanding share options at each balance sheet date was as follows:
Range of Exercise Price Per Share (US$) | Weighted Average Remaining Contractual Life (Years) | ||||||||
| December 31, 2014 | $ | 1.5 | 5.0 | ||||||
| 2.4-2.9 | 5.8 | ||||||||
| December 31, 2013 | 1.5 | 4.0 | |||||||
| 2.4-2.9 | 6.8 | ||||||||
-67-
| b. | Fair value of share options |
Share options granted by the Group were measured using the Black-Scholes Option Pricing Model or the Hull & White Model (2004) incorporated with Ritchken’s Trinomial Tree Model (1995), and the inputs to the models were as follows:
| ASE Inc. | ASE Mauritius Inc. | USIE | ||||
| Share price/market price at the grant date | NT$28.60-30.65 | US$1.7 | US$1.53-2.62 | |||
| Exercise prices | NT$28.60-30.65 | US$1.7 | US$1.53-2.94 | |||
| Expected volatility | 28.59%-40.82% | 47.21% | 32.48%-42.58% | |||
| Expected lives | 10 years | 10 years | 10-12 years | |||
| Expected dividend yield | 3.00%-4.00% | - | - | |||
| Risk free interest rates | 1.56%-2.51% | 3.87%-3.90% | 1.63%-4.02% |
Expected volatility was based on the historical share price volatility over the past 10 years of ASE Inc. and the comparable companies of ASE Mauritius Inc. and USIE, respectively. Under the Hull & White Model (2004) incorporated with Ritchken’s Trinomial Tree Model (1995) to allow for the effects of early exercise, the Group assumed that employees would exercise the options after vesting date when the share price was 1.58-1.69 times the exercise price.
In December 2014 and 2013, USIE had modified the terms of its option plan granted in 2007 to extend the valid period from 11 years to 12 years and from 10 years to 11 years, respectively. The incremental fair value of NT$10,378 thousand and NT$15,497 thousand were all recognized as employee benefits expense in 2014 and 2013, respectively, since the options were all vested.
Employee benefits expense recognized on employee share options was NT$110,157 thousand and NT$234,093 thousand for the years ended December 31, 2014 and 2013, respectively.
| c. | New shares issued under cash capital increase reserved for subscription by employees |
In July 2013, the board of directors approved the cash capital increase and, as required under the Company Act of the ROC, simultaneously granted options to employees to purchase 15% of such newly issued shares with such options exercisable within 3 days and vested when granted. The grant of the options was treated as employee options, accordingly a share-based compensation, and measured at fair value in accordance with IFRS 2. The Group recognized employee benefits expense and capital surplus of NT$26,708 thousand in full at the grant date (also the vested date), of which 1,960 thousand shares had not been vested, therefore, NT$3,626 thousand was reclassified from capital surplus-employee share options to capital surplus-issuance of ordinary shares.
Information about the Company’s employee share options related to the aforementioned newly issued shares was as follows:
Number of Options (In Thousand) | Fair Value (NT$) | |||||||
| Balance at January 1, 2013 | - | $ | - | |||||
| Options granted | 14,437 | 1.85 | ||||||
| Options exercised | (12,477 | ) | 1.85 | |||||
| Options forfeited | (1,960 | ) | - | |||||
| Balance at December 31, 2013 | - | - | ||||||
-68-
Fair value was measured using the Black-Scholes Option Pricing Model and the inputs to the model were as follows:
| Share price at the grant date | NT$27.95 per share | |
| Exercise price | NT$26.10 per share | |
| Expected volatility | 17.98% | |
| Expected lives | 3 days | |
| Expected dividend yield | - | |
| Risk free interest rate | 0.57% |
Expected volatility was based on the Company’s historical share prices volatility.
| 27. | BUSINESS COMBINATIONS |
| a. | Subsidiaries acquired |
| Principal Activity | Date of Acquisition | Proportion of Voting Equity Interests Acquired | Cash Consideration | |||||
| NT$ | ||||||||
| Wuxi Tongzhi | Packaging and testing of semiconductors | May 27, 2013 | 100% | $ 338,021 |
| b. | Consideration transferred, fair value of assets acquired and liabilities assumed as well as net cash outflow on acquisition of subsidiaries at the acquisition date were as follows: |
| NT$ | ||||
| Current assets | $ | 158,100 | ||
| Non-current assets | ||||
| Property, plant and equipment | 258,420 | |||
| Other non-current assets | 35,656 | |||
| Current liabilities | (85,295 | ) | ||
| 366,881 | ||||
| Bargain purchase gain - recognized in other gains and losses | (28,860 | ) | ||
| Total consideration | 338,021 | |||
| Less: Cash and cash equivalent acquired | (87,634 | ) | ||
| Net cash outflow on acquisition of Wuxi Tongzhi | $ | 250,387 | ||
| c. | Impact of acquisitions on the operating results of the Group |
The operating results of Wuxi Tongzhi, since the acquisition date to December 31, 2013, included in the consolidated statements of comprehensive income were operating revenue NT$316,380 thousand and profit for the period NT$15,762 thousand.
| d. | Pro-forma information |
Had these business combinations been in effect at the beginning of each year, the Group’s operating revenues and profit for the years ended December 31, 2013 would have been NT$220,093,736 thousand and NT$16,158,494 thousand, respectively. This pro-forma information is for illustrative purposes only and is not necessarily an indication of operating revenue and results of operations of the Group that actually would have been achieved had the acquisition been completed at the beginning of each year, nor is it intended to be a projection of future results.
-69-
| 28. | EQUITY TRANSACTION WITH NON-CONTROLLING INTERESTS |
In November 2014, USISH completed its cash capital increase of CNY2,017,690 thousand and the Group’s shareholdings of USISH decreased from 88.6% to 82.1% since the Group did not subscribe for additional new shares.
In August 2013, the Group’s subsidiary, Luchu, issued new ordinary shares for cash capital increase of NT$400,000 thousand and the Group’s shareholdings of Luchu increased from 84.3% to 86.1%.
The above transactions were accounted for as equity transactions since the Group did not cease to have control over these subsidiaries and, as a result, capital surplus was charged an addition of NT$6,871,062 thousand and a deduction of NT$330 thousand due to USISH capital increase and Luchu capital increase, respectively.
| 29. | NON-CASH TRANSACTIONS |
For the years ended December 31, 2014 and 2013, the Group entered into the following non-cash investing activities which were not reflected in the consolidated statements of cash flows:
| For the Years Ended December 31 | ||||||||
| 2014 | 2013 | |||||||
| NT$ | NT$ | |||||||
| Payments for property, plant and equipment | ||||||||
| Purchase of property, plant and equipment | $ | 43,448,587 | $ | 27,044,072 | ||||
| Increase (decrease) in prepayments for property, plant and equipment | (34,894 | ) | 327,810 | |||||
| Decrease (increase) in payables for property, plant and equipment | (3,688,526 | ) | 1,908,404 | |||||
| Capitalized borrowing costs | (126,203 | ) | (137,567 | ) | ||||
| $ | 39,598,964 | $ | 29,142,719 | |||||
| Proceeds from disposal of property, plant and equipment | ||||||||
| Consideration from disposal of property, plant and equipment | $ | 462,438 | $ | 350,873 | ||||
| Decrease (increase) in other receivables | (41,231 | ) | 673 | |||||
| $ | 421,207 | $ | 351,546 | |||||
| 30. | OPERATING LEASE ARRANGEMENTS |
Except those discussed in Note 17, the Company and its subsidiary, ASE Test, Inc., lease the land on which their buildings are located under various operating lease agreements with the ROC government expiring through January 2023. The agreements grant these entities the option to renew the leases and reserve the right for the lessor to adjust the lease payments upon an increase in the assessed value of the land and to terminate the leases under certain conditions. In addition, the Group leases buildings, machinery and equipment under operating leases.
The subsidiaries’ offices located in U.S.A. and Japan, etc. are leased from other parties and the lease term will expire through 2015 to 2017 with the option to renew the leases upon expiration.
The Group recognized rental expense of NT$1,459,835 thousand and NT$1,301,550 thousand for the years ended December 31, 2014 and 2013, respectively.
-70-
| 31. | CAPITAL MANAGEMENT |
The capital structure of the Group consists of debt and equity. The Group manages its capital to ensure that entities in the Group will be able to continue as going concerns while maximizing the return to shareholders through the optimization of the debt and equity balance. Key management personnel of the Group periodically reviews the cost of capital and the risks associated with each class of capital. In order to balance the overall capital structure, the Group may adjust the amount of dividends paid to shareholders, the number of new shares issued or repurchased, and the amount of new debt issued or existing debt redeemed.
The Group is not subject to any externally imposed capital requirements except those discussed in Note 18.
32. FINANCIAL INSTRUMENTS
| a. | Fair value of financial instruments |
| 1) | Fair value of financial instruments that are not measured at fair value |
Except bonds payable measured at amortized cost, the management considers that the carrying amounts of financial assets and financial liabilities not measured at fair value approximate their fair values.
The carrying amounts and fair value of bonds payable as of December 31, 2014 and 2013, respectively, were as follows:
| Carrying Amount | Fair Value | |||||||
| NT$ | NT$ | |||||||
| December 31, 2014 | $ | 31,270,131 | $ | 31,702,988 | ||||
| December 31, 2013 | 21,314,005 | 21,913,590 | ||||||
| 2) | Fair value measurements recognized in the consolidated balance sheets |
The following table provides an analysis of financial instruments that are measured at fair value subsequent to initial recognition, grouped into Levels 1 to 3 based on the degree to which the fair value is observable:
| a) | Level 1 fair value measurements are those derived from quoted prices (unadjusted) in active markets for identical assets or liabilities; |
| b) | Level 2 fair value measurements are those derived from inputs other than quoted prices included within Level 1 that are observable for the asset or liability, either directly (i.e. prices) or indirectly (i.e. derived from prices); and |
| c) | Level 3 fair value measurements are those derived from valuation techniques that include inputs for those assets or liabilities that are not based on observable market data (unobservable inputs). |
-71-
| Level 1 | Level 2 | Level 3 | Total | |||||||||||||
| NT$ | NT$ | NT$ | NT$ | |||||||||||||
| December 31, 2014 | ||||||||||||||||
| Financial assets at FVTPL | ||||||||||||||||
| Financial assets designated as at FVTPL | ||||||||||||||||
| Structured time deposits | $ | - | $ | 2,376,050 | $ | - | $ | 2,376,050 | ||||||||
| Private-placement convertible bonds | - | 100,500 | - | 100,500 | ||||||||||||
| Derivative financial assets | ||||||||||||||||
| Swap contracts | - | 1,907,705 | - | 1,907,705 | ||||||||||||
| Forward exchange contracts | - | 27,811 | - | 27,811 | ||||||||||||
| Non-derivative financial assets held for trading | ||||||||||||||||
| Open-end mutual funds | 533,425 | - | - | 533,425 | ||||||||||||
| Quoted shares | 43,352 | - | - | 43,352 | ||||||||||||
| $ | 576,777 | $ | 4,412,066 | $ | - | $ | 4,988,843 | |||||||||
| Available-for-sale financial assets | ||||||||||||||||
| Open-end mutual funds | $ | 1,500,434 | $ | - | $ | - | $ | 1,500,434 | ||||||||
| Limited Partnership | - | - | 555,361 | 555,361 | ||||||||||||
| Unquoted shares | - | - | 223,505 | 223,505 | ||||||||||||
| Quoted shares | 195,070 | - | - | 195,070 | ||||||||||||
| $ | 1,695,504 | $ | - | $ | 778,866 | $ | 2,474,370 | |||||||||
| Financial liabilities at FVTPL | ||||||||||||||||
| Derivative financial liabilities | ||||||||||||||||
| Conversion option, redemption option and put option of convertible bonds | $ | - | $ | 2,520,606 | $ | - | $ | 2,520,606 | ||||||||
| Swap contracts | - | 99,165 | - | 99,165 | ||||||||||||
| Forward exchange contracts | - | 31,581 | - | 31,581 | ||||||||||||
| $ | - | $ | 2,651,352 | $ | - | $ | 2,651,352 | |||||||||
| December 31, 2013 | ||||||||||||||||
| Financial assets at FVTPL | ||||||||||||||||
| Financial assets designated as at FVTPL | ||||||||||||||||
| Structured time deposits | $ | - | $ | 2,228,643 | $ | - | $ | 2,228,643 | ||||||||
| Private-placement convertible bonds | - | 100,500 | - | 100,500 | ||||||||||||
| Derivative financial assets | ||||||||||||||||
| Swap contracts | - | 219,324 | - | 219,324 | ||||||||||||
| Forward exchange contracts | - | 10,178 | - | 10,178 | ||||||||||||
(Continued)
-72-
| Level 1 | Level 2 | Level 3 | Total | |||||||||||||
| NT$ | NT$ | NT$ | NT$ | |||||||||||||
| Non-derivative financial assets held for trading | ||||||||||||||||
| Open-end mutual funds | $ | 172,000 | $ | - | $ | - | $ | 172,000 | ||||||||
| Quoted shares | 33,624 | - | - | 33,624 | ||||||||||||
| $ | 205,624 | $ | 2,558,645 | $ | - | $ | 2,764,269 | |||||||||
| Available-for-sale financial assets | ||||||||||||||||
| Open-end mutual funds | $ | 2,321,826 | $ | - | $ | - | $ | 2,321,826 | ||||||||
| Limited partnership | - | - | 583,441 | 583,441 | ||||||||||||
| Quoted shares | 328,656 | - | - | 328,656 | ||||||||||||
| Unquoted shares | - | - | 213,721 | 213,721 | ||||||||||||
| Private-placement shares | - | 69,655 | - | 69,655 | ||||||||||||
| $ | 2,650,482 | $ | 69,655 | $ | 797,162 | $ | 3,517,299 | |||||||||
| Financial liabilities at FVTPL | ||||||||||||||||
| Derivative financial liabilities | ||||||||||||||||
| Conversion option, redemption option and put option of convertible bonds | $ | - | $ | 1,742,996 | $ | - | $ | 1,742,996 | ||||||||
| Swap contracts | - | 74,170 | - | 74,170 | ||||||||||||
| Forward exchange contracts | - | 31,315 | - | 31,315 | ||||||||||||
| Cross currency swap contracts | - | 4,180 | - | 4,180 | ||||||||||||
| Foreign currency option contracts | - | 643 | - | 643 | ||||||||||||
| $ | - | $ | 1,853,304 | $ | - | $ | 1,853,304 | |||||||||
| Derivative financial liabilities for hedging | ||||||||||||||||
| Interest rate swap contracts | $ | - | $ | 3,310 | $ | - | $ | 3,310 | ||||||||
(Concluded)
For assets and liabilities held as of December 31, 2014 and 2013 that were measured at fair value on a recurring basis, there were no transfers between Level 1 and Level 2 of the fair value hierarchy.
| 3) | Reconciliation of Level 3 fair value measurements of financial assets |
The financial assets measured at Level 3 fair value were equity investments with no quoted prices classified as available-for-sale financial assets - non-current. Reconciliations for the years ended December 31, 2014 and 2013 were as follows:
| For the Years Ended December 31 | ||||||||
| 2014 | 2013 | |||||||
| NT$ | NT$ | |||||||
| Balance at January 1 | $ | 797,162 | $ | 776,683 | ||||
| Purchases | 38,793 | 73,358 | ||||||
| Disposals | (21,012 | ) | (27,368 | ) | ||||
(Continued)
-73-
| For the Years Ended December 31 | ||||||||
| 2014 | 2013 | |||||||
| NT$ | NT$ | |||||||
| Total gains or losses | ||||||||
| In profit or loss | $ | (10,390 | ) | $ | (106,916 | ) | ||
| In other comprehensive income | (25,687 | ) | 81,405 | |||||
| Balance at December 31 | $ | 778,866 | $ | 797,162 | ||||
(Concluded)
As of December 31, 2014 and 2013, unrealized loss of NT$21,519 thousand and unrealized gain of NT$20,175 thousand, recorded in other comprehensive income under the heading of unrealized gain (loss) on available-for-sale financial assets, were included in the carrying amount of the financial assets at fair value on Level 3 fair value measurement.
| 4) | Valuation techniques and assumptions applied for the purpose of measuring fair value |
The fair values of financial assets and financial liabilities were determined as follows:
| a) | The fair values of financial assets and financial liabilities with standard terms and conditions and traded in active markets were determined with reference to quoted market prices (includes quoted shares and open-end mutual funds). The fair value of private-placement shares was derived using quoted market prices and adjusted for the liquidity discount due to the selling restrictions relating to the lock-up period. The liquidity discount was the option value using the Black-Scholes Model with all observable inputs. |
| b) | The fair values of derivative instruments were calculated using quoted prices. Where such prices were not available, a discounted cash flow analysis was performed using the applicable yield curve for the duration of the instruments for non-optional derivatives, and option pricing models for optional derivatives. These models use market-based observable inputs including interest rate curves, foreign exchange rates, and forward and spot prices for currencies to project fair value. The estimates and assumptions used by the Group were consistent with those that market participants would use in pricing financial instruments. |
| c) | The fair value of the Group’s investments in unquoted shares on Level 3 fair value measurement were measured using market approach based on investees’ recent financing activities, technical development, valuation of investees comparable companies, market conditions and other economic indicators. |
| d) | Except the aforementioned, the fair values of other financial assets and financial liabilities were measured using the generally accepted pricing models based on a discounted cash flow analysis. |
| b. | Categories of financial instruments |
| December 31 | ||||||||
| 2014 | 2013 | |||||||
| NT$ | NT$ | |||||||
| Financial assets | ||||||||
| FVTPL | ||||||||
| Designated as at FVTPL | $ | 2,476,550 | $ | 2,329,143 | ||||
| Held for trading | 2,512,293 | 435,126 | ||||||
| Available-for-sale financial assets | 2,474,370 | 3,517,299 | ||||||
| Loans and receivables (Note 1) | 106,158,279 | 89,317,657 | ||||||
(Continued)
-74-
| December 31 | ||||||||
| 2014 | 2013 | |||||||
| NT$ | NT$ | |||||||
| Financial liabilities | ||||||||
| FVTPL | ||||||||
| Held for trading | $ | 2,651,352 | $ | 1,853,304 | ||||
| Derivative instruments in designated hedge accounting relationships | - | 3,310 | ||||||
| Measured at amortized cost (Note 2) | 157,157,392 | 145,430,744 | ||||||
(Concluded)
| Note 1: | The balances included loans and receivables measured at amortized cost which comprised cash and cash equivalents, trade and other receivables and other financial assets. |
| Note 2: | The balances included financial liabilities measured at amortized cost which comprised short-term borrowings, trade and other payables, bonds payable, long-term borrowings and long-term payables. |
| c. | Financial risk management objectives and policies |
The derivative instruments used by the Group are to mitigate risks arising from ordinary business operations. All derivative transactions entered into by the Group are designated as either hedging or trading. Derivative transactions entered into for hedging purposes must hedge risk against fluctuations in foreign exchange rates and interest rates arising from operating activities. The currencies and the amount of derivative instruments held by the Group must match its hedged assets and liabilities denominated in foreign currencies.
The Group’s risk management department monitors risks to mitigate risk exposures, reports unsettled position, transaction balances and related gains or losses to the Group’s chief financial officer on monthly basis.
| 1) | Market risk |
The Group’s activities exposed it primarily to the financial risks of changes in foreign currency exchange rates and interest rates. Gains or losses arising from fluctuations in foreign currency exchange rates of a variety of derivative financial instruments were approximately offset by those of hedged items. Interest rate risk was not significant due to the cost of capital was expected to be fixed.
There had been no change to the Group’s exposure to market risks or the manner in which these risks were managed and measured.
| a) | Foreign currency exchange rate risk |
The Group had sales and purchases as well as financing activities denominated in foreign currency which exposed the Group to foreign currency exchange rate risk. The Group entered into a variety of derivative financial instruments to hedge foreign currency exchange rate risk to minimize the fluctuations of assets and liabilities denominated in foreign currencies.
The carrying amounts of the Group’s foreign currency denominated monetary assets and liabilities (including those eliminated upon consolidation) as well as derivative instruments which exposed the Group to foreign currency exchange rate risk at each balance sheet date are presented in Note 37.
-75-
The Group was principally subject to the impact to exchange rate fluctuation in U.S. dollars and Japanese yen against NT$ or Chinese Yuan Renminbi (“CNY”). 1% is the sensitivity rate used when reporting foreign currency exchange rate risk internally to key management personnel and represents management’s assessment of the reasonably possible change in foreign currency exchange rates. The sensitivity analysis included financial assets and liabilities and inter-company receivables and payables within the Group. The changes in profit before income tax due to a 1% change in U.S. dollars and Japanese yen both against NT$ and CNY would be NT$41,000 thousand and NT$15,000 thousand for the years ended December 31, 2014 and 2013, respectively. Hedging contracts and hedged items have been taken into account while measuring the changes in profit before income tax. The abovementioned sensitivity analysis mainly focused on the foreign currency monetary items at the end of the year. As the year-end exposure did not reflect the exposure for the years ended December 31, 2014 and 2013, the abovementioned sensitivity analysis was unrepresentative of those years.
| b) | Interest rate risk |
Except a portion of long-term bonds payable at fixed interest rates, the Group was exposed to interest rate risk because group entities borrowed funds at floating interest rates. Changes in market interest rates will lead to variances in effective interest rates of borrowings from which the future cash flow fluctuations arise.
The carrying amounts of the Group’s financial assets and financial liabilities with exposure to interest rates at each balance sheet date were as follows:
| December 31 | ||||||||
| 2014 | 2013 | |||||||
| NT$ | NT$ | |||||||
| Fair value interest rate risk | ||||||||
| Financial liabilities | $ | 34,003,038 | $ | 22,186,535 | ||||
| Cash flow interest rate risk | ||||||||
| Financial assets | 51,603,455 | 46,206,830 | ||||||
| Financial liabilities | 65,149,698 | 78,502,073 | ||||||
For assets and liabilities with floating interest rates, a 100 basis point increase or decrease was used when reporting interest rate risk internally to key management personnel. If interest rates had been 100 basis points (1%) higher or lower and all other variables held constant, the Group’s profit before income tax for the years ended December 31, 2014 and 2013 would have decreased or increased approximately by NT$135,000 thousand and NT$323,000 thousand, respectively.
| c) | Other price risk |
The Group was exposed to equity or debt price risk through its investments in financial assets at FVTPL, including private-placement convertible bonds, quoted shares, and open-end mutual funds, and available-for-sale financial assets. If equity or debt prices were 1% higher or lower, profit before income tax for the years ended December 31, 2014 and 2013 would have increased or decreased approximately by NT$6,800 thousand and NT$3,100 thousand, respectively, and other comprehensive income before income tax for the years ended December 31, 2014 and 2013 would have increased or decreased approximately by NT$25,000 thousand and NT$35,000 thousand, respectively.
In addition, the Group was also exposed to the Company’s ordinary share price risk through Bonds Options recognized as financial liabilities held for trading. 7% is the sensitivity rate used when reporting price risk internally to key management personnel. If the Company’s
-76-
ordinary share price increased or decreased by 7%, profit before income tax for the years ended December 31, 2014 would have decreased approximately by NT$651,000 thousand and increased approximately by NT$608,000 thousand, respectively.
| 2) | Credit risk |
Credit risk refers to the risk that counterparty will default on its contractual obligations resulting in financial loss to the Group. The Group’s credit risk arises from cash and cash equivalents, receivables and other financial assets. The Group’s maximum exposure to credit risk was the carrying amounts of financial assets in the consolidated balance sheets.
The Group dealt with counterparties creditworthy and has a credit policy and trade receivable management procedures to ensure recovery and evaluation of trade receivables. The Group’s counterparties consisted of a large number of customers and banks and there was no significant concentration of credit risk exposure.
| 3) | Liquidity risk |
The Group manages liquidity risk by maintaining adequate working capital and banking facilities to fulfill the demand for cash flow used in the Group’s operation and capital expenditure. The Group also monitors its compliance with all the loan covenants. Liquidity risk is not considered to be significant.
In the table below, financial liabilities with a repayment on demand clause were included in the earliest time band regardless of the probability of counter-parties choosing to exercise their rights. The maturity dates for other non-derivative financial liabilities were based on the agreed repayment dates.
To the extent that interest flows are floating rate, the undiscounted amounts were derived from the interest rates at each balance sheet date.
On Demand or Less than 1 Month | 1 to 3 Months | 3 Months to 1 Year | 1 to 5 Years | More than 5 Years | ||||||||||||||||
| NT$ | NT$ | NT$ | NT$ | NT$ | ||||||||||||||||
| December 31, 2014 | ||||||||||||||||||||
| Non-derivative financial liabilities | ||||||||||||||||||||
| Non-interest bearing | $ | 23,660,711 | $ | 21,370,876 | $ | 4,606,064 | $ | 155,599 | $ | 29,139 | ||||||||||
| Floating interest rate liabilities | 21,534,220 | 9,003,403 | 12,364,453 | 23,870,629 | 175,302 | |||||||||||||||
| Fixed interest rate liabilities | 684,039 | 838,234 | 846,899 | 34,458,859 | - | |||||||||||||||
| $ | 45,878,970 | $ | 31,212,513 | $ | 17,817,416 | $ | 58,485,087 | $ | 204,441 | |||||||||||
| December 31, 2013 | ||||||||||||||||||||
| Non-derivative financial liabilities | ||||||||||||||||||||
| Non-interest bearing | $ | 16,755,995 | $ | 18,506,103 | $ | 2,193,722 | $ | 979,923 | $ | - | ||||||||||
| Floating interest rate liabilities | 22,940,649 | 11,905,684 | 21,552,430 | 23,383,218 | - | |||||||||||||||
| Fixed interest rate liabilities | 4,051 | 169,271 | 1,105,439 | 23,523,781 | - | |||||||||||||||
| $ | 39,700,695 | $ | 30,581,058 | $ | 24,851,591 | $ | 47,886,922 | $ | - | |||||||||||
The amounts included above for floating interest rate instruments for non-derivative financial liabilities was subject to change if changes in floating interest rates differ from those estimates of interest rates determined at each balance sheet date.
The following table detailed the Group’s liquidity analysis for its derivative financial instruments. The table was based on the undiscounted contractual net cash inflows and outflows on derivative instruments that settle on a net basis, and the undiscounted gross cash inflows and outflows on those derivatives that require gross settlement. When the amounts payable or receivable are not fixed,
-77-
the amounts disclosed have been determined by reference to the projected interest rates as illustrated by the yield curves at each balance sheet date.
On Demand or Less than 1 Month | 1 to 3 Months | 3 Months to 1 Year | ||||||||||
| NT$ | NT$ | NT$ | ||||||||||
| December 31, 2014 | ||||||||||||
| Gross settled | ||||||||||||
| Forward exchange contracts | ||||||||||||
| Inflows | $ | 3,662,813 | $ | 1,959,573 | $ | 9,241 | ||||||
| Outflows | (3,655,279 | ) | (1,940,145 | ) | (9,331 | ) | ||||||
| 7,534 | 19,428 | (90 | ) | |||||||||
| Swap contracts | ||||||||||||
| Inflows | 10,342,259 | 4,621,200 | 33,399,031 | |||||||||
| Outflows | (10,215,834 | ) | (4,461,118 | ) | (31,646,310 | ) | ||||||
| 126,425 | 160,082 | 1,752,721 | ||||||||||
| $ | 133,959 | $ | 179,510 | $ | 1,752,631 | |||||||
| December 31, 2013 | ||||||||||||
| Net settled | ||||||||||||
| Forward exchange contracts | $ | 3,520 | $ | (2,670 | ) | $ | - | |||||
| Foreign currency option contracts | - | 2,910 | - | |||||||||
| $ | 3,520 | $ | 240 | $ | - | |||||||
| Gross settled | ||||||||||||
| Forward exchange contracts | ||||||||||||
| Inflows | $ | 2,703,738 | $ | 1,540,707 | $ | 208,348 | ||||||
| Outflows | (2,725,667 | ) | (1,541,515 | ) | (208,635 | ) | ||||||
| (21,929 | ) | (808 | ) | (287 | ) | |||||||
| Swap contracts | ||||||||||||
| Inflows | 6,565,374 | 6,384,442 | 23,843,432 | |||||||||
| Outflows | (6,524,921 | ) | (6,368,366 | ) | (23,596,540 | ) | ||||||
| 40,453 | 16,076 | 246,892 | ||||||||||
| Cross currency swap contracts | ||||||||||||
| Inflows | 175 | 356 | 596,801 | |||||||||
| Outflows | - | - | (598,600 | ) | ||||||||
| 175 | 356 | (1,799 | ) | |||||||||
| Interest rate swap contracts | ||||||||||||
| Inflows | 3,744 | - | 3,089 | |||||||||
| Outflows | (5,995 | ) | - | (5,865 | ) | |||||||
| (2,251 | ) | - | (2,776 | ) | ||||||||
| $ | 16,448 | $ | 15,624 | $ | 242,030 | |||||||
-78-
33. RELATED PARTY TRANSACTIONS
Balances and transactions within the Group had been eliminated upon consolidation. Details of transactions between the Group and other related parties were disclosed as follows:
| a. | The Company acquired real estate from HC in 2014 and 2013 at NT$4,540,086 thousand and NT$1,473,905 thousand, respectively, which were all primarily based on independent professional appraisal reports and fully paid before December 31, 2014 and 2013, respectively. In addition, the construction of buildings with green design concept and other projects on current leased property for which the Company contracted with Fu Hwa Construction Co., Ltd. has been completed with a total consideration of NT$349,646 thousand in 2014, which was primarily based on independent professional appraisal reports as well as request for quotation and price negotiation, and the payment schedule was based on the agreed acceptance progress. |
| b. | In addition to the donation of NT$15,000 thousand to Social Affairs Bureau of Kaohsiung City Government through ASE Cultural and Educational Foundation (the “ASE Foundation”) in August 2014, the Company contributed NT$100,000 thousand to ASE Foundation in September 2014 for environmental charity in promoting the related domestic environmental protection and public service activities (Note 35). |
| c. | Compensation to key management personnel |
| For the Years Ended December 31 | ||||||||
| 2014 | 2013 | |||||||
| NT$ | NT$ | |||||||
| Short-term employee benefits | $ | 989,720 | $ | 741,232 | ||||
| Post-employment benefits | 4,049 | 4,766 | ||||||
| Share-based payments | 50,327 | 78,701 | ||||||
| $ | 1,044,096 | $ | 824,699 | |||||
The compensation to the Company’s key management personnel is determined according to personal performance and market trends.
Except for the aforementioned, the Group had no material transactions with related parties for the years ended December 31, 2014 and 2013.
34. ASSETS PLEDGED AS COLLATERAL OR FOR SECURITY
In addition to Note 10, the following assets were provided as collateral for bank borrowings and the tariff guarantees of imported raw materials:
| December 31 | ||||||||
| 2014 | 2013 | |||||||
| NT$ | NT$ | |||||||
| Inventories related to real estate business | $ | 15,164,858 | $ | 12,239,500 | ||||
| Property, plant and equipment | ||||||||
| Land | - | 299,059 | ||||||
| Buildings and improvements | - | 337,222 | ||||||
| Other financial assets (including current and non-current) | 268,562 | 250,656 | ||||||
| $ | 15,433,420 | $ | 13,126,437 | |||||
-79-
35. SIGNIFICANT CONTINGENT LIABILITIES AND UNRECOGNIZED COMMITMENTS
In addition to those disclosed in other notes, significant commitments and contingencies of the Group as of each balance sheet date were as follows:
| a. | Significant commitments |
| 1) | As of December 31, 2014 and 2013, unused letters of credit of the Group were approximately NT$137,000 thousand and NT$271,000 thousand, respectively. |
| 2) | As of December 31, 2014 and 2013, the amounts that the Group has committed to purchase property, plant and equipment were approximately NT$17,498,000 thousand and NT$8,249,000 thousand, respectively, of which NT$1,516,396 thousand and NT$1,291,306 thousand had been prepaid, respectively. |
| 3) | In consideration of corporate social responsibility for environmental protection, the Company’s board of directors, in December 2013, approved contributions to be made in the next 30 years, at a total amount of NT$3,000,000 thousand, at the minimum, to environmental protection efforts in Taiwan. In January 2015, the Company’s board of directors approved to contribute NT$100,000 thousand to ASE Foundation for continuously implementing environmental effort in promoting the related domestic environmental protection and public service activities. |
| b. | Non-cancellable operating lease commitments |
| December 31, 2014 | ||||
| NT$ | ||||
| Less than 1 year | $ | 224,600 | ||
| 1-5 years | 275,463 | |||
| More than 5 years | 421,949 | |||
| $ | 922,012 | |||
36. SIGNIFICANT SUBSEQUENT EVENTS
To enhance operational flexibility via structural adjustments, the board of directors of the Company’s subsidiary, USI, resolved in January 2015 the spin-off of its investment business as well as capital reduction of NT$16,012,966 thousand by reducing 1,601,297 thousand shares (a reduction ratio of 97.56%), and will assign its investment business to USI, Inc. (“New USI”), a newly established business entity. As the consideration of the business value to be spun-off by USI, New USI will issue 1,000,000 thousand new ordinary shares to the shareholders of USI. Based on the shareholdings on the record date of the spin-off, the shareholders of USI will receive 609.27 shares of New USI’s ordinary share in exchange of each 1,000 shares of USI’s ordinary share. The tentative record date of the spin-off is March 6, 2015. After the spin-off, the Group will have control over both USI and New USI, and the spin-off will not have material impact on the financial position and business operation of the Group.
37. SIGNIFICANT ASSETS AND LIABILITIES DENOMINATED IN FOREIGN CURRENCIES
The significant assets and liabilities denominated in foreign currencies were as follows:
-80-
Foreign Currencies (In Thousand) | Exchange Rate | Carrying Amount (In Thousand) | ||||||||
| December 31, 2014 | ||||||||||
| Monetary financial assets | ||||||||||
| US$ | $ | 3,761,345 | US$1=NT$31.65 | $ | 119,046,569 | |||||
| JPY | 12,543,157 | JPY1=NT$0.2646 | 3,318,919 | |||||||
| Monetary financial liabilities | ||||||||||
| US$ | 3,888,563 | US$1=NT$31.65 | 123,073,019 | |||||||
| JPY | 12,728,820 | JPY1=NT$0.2646 | 3,368,046 | |||||||
| December 31, 2013 | ||||||||||
| Monetary financial assets | ||||||||||
| US$ | 3,381,706 | US$1=NT$29.805 | 100,791,747 | |||||||
| JPY | 12,302,816 | JPY1=NT$0.2839 | 3,492,769 | |||||||
| Monetary financial liabilities | ||||||||||
| US$ | 3,438,847 | US$1=NT$29.805 | 102,494,835 | |||||||
| JPY | 11,659,321 | JPY1=NT$0.2839 | 3,310,081 | |||||||
38. OTHERS
On December 20, 2013, the Kaohsiung Environmental Protection Bureau (“KEPB”) issued an official letter No. Kao-Shih-Huan-Chu-Tu-Tzu 10243758100 and an administrative sanction letter No. Kao-Shih-Huan-Chu-Shui-Chu-Tzu 30-102-120022 (“the Administrative Decision”). The Administrative Decision was to suspend the operation at ASE K7 Plant's wafer-level process where nickel is used and impose a fine of NT$110,065 thousand, which has been recorded under the line item of other income and expenses for the year ended December 31, 2013. On April 7, 2014, the amount of the fine was amended to NT$109,359 thousand by the KEPB. On January 17, 2014, the Company retained lawyers to file an administrative appeal to nullify the Administrative Decision with the Kaohsiung City Government, but the administrative appeal was dismissed. The Company next retained lawyers to file an administrative complaint to revoke the part of the Administrative Decision pertaining to the fine, and the case is being heard by the Kaohsiung High Administrative Court. As to the suspended operation at ASE K7 Plant's wafer-level process where nickel is used, the KEPB issued official letter No. Kao-Shih-Huan-Chu-Tu-Tzu 10343171000, on December 15, 2014, to grant the resumption.
Meanwhile, owing to the event above, on January 3, 2014, the Kaohsiung District Prosecutors Office charged the Company with violation of the Waste Disposal Act and the judgment was handed down on October 20, 2014, in which the Company was fined NT$3,000 thousand, recorded under the line item of other income and expenses for the year ended December 31, 2014, for violation of Article 47 of the Waste Disposal Act. The Company filed an appeal against the judgment, and the case is being heard by the Taiwan High Court's Kaohsiung Branch Court.
39. ADDITIONAL DISCLOSURES
Following are the additional disclosures required by the Securities and Futures Bureau for ASE Inc.:
| a. | Financial provided: Please see Table 1 attached; |
| b. | Endorsement/guarantee provided: Please see Table 2 attached; |
-81-
| c. | Marketable securities held (excluding investments in subsidiaries, associates and joint venture): Please see Table 3 attached; |
| d. | Marketable securities acquired and disposed of at costs or prices of at least NT$300 million or 20% of the paid-in capital: Please see Table 4 attached; |
| e. | Acquisition of individual real estate properties at costs of at least NT$300 million or 20% of the paid-in capital: Please see Table 5 attached; |
| f. | Disposal of individual real estate properties at prices of at least NT$300 million or 20% of the paid-in capital: None; |
| g. | Total purchase from or sales to related parties of at least NT$100 million or 20% of the paid-in capital: Please see Table 6 attached; |
| h. | Receivables from related parties amounting to at least NT$100 million or 20% of the paid-in capital: Please see Table 7 attached; |
| i. | Information about the derivative financial instruments transaction: Please see Note 7 and 9; |
| j. | Others: The business relationship between the parent and the subsidiaries and significant transactions between them: Please see Table 10 attached; |
| k. | Names, locations, and related information of investees over which ASE Inc. exercises significant influence (excluding information on investment in Mainland China): Please see Table 8 attached; |
| l. | Information on investment in Mainland China |
| 1) | The name of the investee in Mainland China, the main businesses and products, its issued capital, method of investment, information on inflow or outflow of capital, percentage of ownership, income (losses) of the investee, share of profits/losses of investee, ending balance, amount received as dividends from the investee, and the limitation on investee: Please see Table 9 attached; |
| 2) | Any of the following significant transactions with investee companies in mainland China, either directly or indirectly through a third party, and their prices, payment terms, and unrealized gains or losses: |
| a) | The amount and percentage of purchases and the balance and percentage of the related payables at the end of the period: Please see Table 6 attached; |
| b) | The amount and percentage of sales and the balance and percentage of the related receivables at the end of the period: None; |
| c) | The amount of property transactions and the amount of the resultant gains or losses: No significant transactions; |
| d) | The balance of negotiable instrument endorsements or guarantees or pledges of collateral at the end of the period and the purposes: None; |
| e) | The highest balance, the end of period balance, the interest rate range, and total current period interest with respect to financing of funds: None; |
| f) | Other transactions that have a material effect on the profit or loss for the period or on the financial position, such as the rendering or receiving of services: None. |
-82-
40. OPERATING SEGMENTS INFORMATION
The Group has the following reportable segments: Packaging, Testing and EMS. The Group packages bare semiconductors into finished semiconductors with enhanced electrical and thermal characteristics; provides testing services, including front-end engineering testing, wafer probing and final testing services; provides electronics manufacturing services. Information about other business activities and operating segments that are not reportable are combined and disclosed in “Others.” The Group engages in other activities such as substrate production and real estate business.
The accounting policies for segments are the same as those described in Note 4. The measurement basis for resources allocation and performance evaluation is based on profit before income tax.
Segment information for the years ended December 31, 2014 and 2013 was as follows:
| a. | Segment revenues and results |
| Packaging | Testing | EMS | Others | Total | ||||||||||||||||
| NT$ | NT$ | NT$ | NT$ | NT$ | ||||||||||||||||
| For the year ended December 31, 2014 | ||||||||||||||||||||
| Revenue from external customers | 121,336,453 | 25,874,694 | 105,784,427 | 3,595,873 | 256,591,447 | |||||||||||||||
| Inter-segment revenues (Note) | 9,418,359 | 177,793 | 48,596,814 | 8,437,439 | 66,630,405 | |||||||||||||||
| Segment revenues | 130,754,812 | 26,052,487 | 154,381,241 | 12,033,312 | 323,221,852 | |||||||||||||||
| Interest income | 96,737 | 10,245 | 116,451 | 20,041 | 243,474 | |||||||||||||||
| Interest expense | (1,566,595 | ) | (15,663 | ) | (155,702 | ) | (586,466 | ) | (2,324,426 | ) | ||||||||||
| Depreciation and amortization | (17,533,267 | ) | (6,160,378 | ) | (1,435,509 | ) | (1,221,622 | ) | (26,350,776 | ) | ||||||||||
| Share of the profit of associates | (108,726 | ) | - | - | - | (108,726 | ) | |||||||||||||
| Impairment loss | (231,936 | ) | (4,701 | ) | (10,390 | ) | (61,117 | ) | (308,144 | ) | ||||||||||
| Segment profit before income tax | 17,241,307 | 6,790,309 | 3,807,944 | 634,039 | 28,473,599 | |||||||||||||||
| Investments accounted for using the equity method | 1,492,441 | - | - | - | 1,492,441 | |||||||||||||||
| Segment assets | 166,626,502 | 44,148,283 | 78,851,169 | 44,345,506 | 333,971,460 | |||||||||||||||
| Expenditures for segment assets | 29,863,337 | 6,157,154 | 6,562,513 | 865,583 | 43,448,587 | |||||||||||||||
| For the year ended December 31, 2013 | ||||||||||||||||||||
| Revenue from external customers | 112,603,927 | 24,732,197 | 78,530,594 | 3,995,728 | 219,862,446 | |||||||||||||||
| Inter-segment revenues (Note) | 3,337,074 | 246,223 | 42,960,432 | 8,048,827 | 54,592,556 | |||||||||||||||
| Segment revenues | 115,941,001 | 24,978,420 | 121,491,026 | 12,044,555 | 274,455,002 | |||||||||||||||
| Interest income | 74,171 | 11,958 | 85,491 | 41,181 | 212,801 | |||||||||||||||
| Interest expense | (1,542,047 | ) | (44,167 | ) | (96,620 | ) | (574,310 | ) | (2,257,144 | ) | ||||||||||
| Depreciation and amortization | (16,412,763 | ) | (6,293,170 | ) | (1,658,743 | ) | (1,106,235 | ) | (25,470,911 | ) | ||||||||||
| Share of the profit of associates | 26,300 | - | - | - | 26,300 | |||||||||||||||
| Impairment loss | (344,150 | ) | (115,966 | ) | (99,843 | ) | (131,913 | ) | (691,872 | ) | ||||||||||
| Segment profit before income tax | 9,973,216 | 6,320,384 | 2,918,365 | 144,727 | 19,356,692 | |||||||||||||||
| Investments accounted for using the equity method | 1,216,201 | - | - | - | 1,216,201 | |||||||||||||||
| Segment assets | 146,268,732 | 44,100,564 | 55,096,207 | 41,348,403 | 286,813,906 | |||||||||||||||
| Expenditures for segment assets | 18,648,304 | 6,068,085 | 1,224,698 | 1,102,985 | 27,044,072 | |||||||||||||||
| Note: | Inter-segment revenues were eliminated upon consolidation. |
| b. | Revenue from major products and services |
| For the Years Ended December 31 | ||||||||
| 2014 | 2013 | |||||||
| NT$ | NT$ | |||||||
| Advanced packaging and IC wirebonding service | $ | 108,384,405 | $ | 100,457,184 | ||||
| Wafer probing and final testing service | 25,116,026 | 24,120,370 | ||||||
| Electronic components manufacturing service | 104,904,455 | 77,731,347 | ||||||
| Others | 18,186,561 | 17,553,545 | ||||||
| $ | 256,591,447 | $ | 219,862,446 | |||||
-83-
| c. | Geographical information |
Geographical information about revenue from external customers and noncurrent assets are reported based on the country where the external customers are headquartered and noncurrent assets are located.
| 1) | Net revenues from external customers |
| For the Years Ended December 31 | ||||||||
| 2014 | 2013 | |||||||
| NT$ | NT$ | |||||||
| United States | $ | 173,912,974 | $ | 143,753,891 | ||||
| Taiwan | 36,747,699 | 31,277,147 | ||||||
| Asia | 24,042,586 | 23,779,212 | ||||||
| Europe | 20,826,125 | 20,392,268 | ||||||
| Others | 1,062,063 | 659,928 | ||||||
| $ | 256,591,447 | $ | 219,862,446 | |||||
| 2) | Noncurrent assets |
| December 31 | ||||||||
| 2014 | 2013 | |||||||
| NT$ | NT$ | |||||||
| Taiwan | $ | 97,159,564 | $ | 82,174,469 | ||||
| China | 43,384,186 | 40,121,292 | ||||||
| Others | 26,177,965 | 25,864,658 | ||||||
| $ | 166,721,715 | $ | 148,160,419 | |||||
Noncurrent assets excluded financial instruments, post-employment benefit assets and deferred tax assets
| d. | Major customers |
Except one customer from which the operating revenues generated from packaging and EMS segments was NT$54,431,222 thousand and NT$32,588,464 thousand in 2014 and 2013, respectively, the Group did not have other single customer to which the operating revenues exceeded 10% of operating revenues for the years ended December 31, 2014 and 2013.
-84-
TABLE 1
ADVANCED SEMICONDUCTOR ENGINEERING, INC. AND SUBSIDIARIES
FINANCINGS PROVIDED
FOR THE YEAR ENDED DECEMBER 31, 2014
(Amounts In Thousands of New Taiwan Dollars)
| Financial Statement | Related | Maximum Balance | Nature for | Transaction | Reason for | Allowance for | Collateral | Each Borrowing Company | Total Financing | |||||||||||||||||||||||||||||||
| No. | Financing Company | Counter-party | Account | Party | for the year | Ending Balance | Amount Actual Drawn | Interest Rate | Financing | Amounts | Financing | Bad Debt | Item | Value | (Note 1) | Amount Limits (Note 2) | ||||||||||||||||||||||||
| 1 | A.S.E. Holding Limited | The Company | Other receivables | Yes | $ | 2,404,365 | $ | 2,088,900 | $ | 2,088,900 | 0.55~0.57 | The need for short-term | $ | - | Operating capital | $ | - | - | $ | - | $ | 2,927,288 | $ | 5,854,576 | ||||||||||||||||
| form related parties | financing | |||||||||||||||||||||||||||||||||||||||
| J & R Holding Limited | Long-term receivables | Yes | 883,630 | 189,900 | 189,900 | 0.55~0.57 | The need for short-term | - | Operating capital | - | - | - | 15,021,695 | 22,532,543 | ||||||||||||||||||||||||||
| form related parties | financing | |||||||||||||||||||||||||||||||||||||||
| 2 | J & R Holding Limited | The Company | Other receivables | Yes | 8,935,529 | 7,849,200 | 7,849,200 | 0.55~1.00 | The need for short-term | - | Operating capital | - | - | - | 9,522,922 | 19,045,844 | ||||||||||||||||||||||||
| form related parties | financing | |||||||||||||||||||||||||||||||||||||||
| Global Advanced | Long-term receivables | Yes | 506,400 | 506,400 | 506,400 | 0.55~0.57 | The need for short-term | - | Operating capital | - | - | - | 15,021,695 | 22,532,543 | ||||||||||||||||||||||||||
| Packaging | form related parties | financing | ||||||||||||||||||||||||||||||||||||||
| Technology Limited, | ||||||||||||||||||||||||||||||||||||||||
| Cayman Islands | ||||||||||||||||||||||||||||||||||||||||
| ASE WeiHai Inc. | Other receivables | Yes | 4,243,590 | 3,782,175 | 3,782,175 | 0.62~0.64 | The need for short-term | - | Operating capital | - | - | - | 15,021,695 | 22,532,543 | ||||||||||||||||||||||||||
| form related parties | financing | |||||||||||||||||||||||||||||||||||||||
| Omniquest Industrial | Long-term receivables | Yes | 2,551,298 | 1,427,415 | 1,427,415 | 0.55~0.57 | The need for short-term | - | Operating capital | - | - | - | 15,021,695 | 22,532,543 | ||||||||||||||||||||||||||
| Limited | form related parties | financing | ||||||||||||||||||||||||||||||||||||||
| ASE Assembly & Test | Other receivables | Yes | 2,130,450 | 1,582,500 | 1,582,500 | 0.62~0.65 | The need for short-term | - | Operating capital | - | - | - | 15,021,695 | 22,532,543 | ||||||||||||||||||||||||||
| (Shanghai) Limited | form related parties | financing | ||||||||||||||||||||||||||||||||||||||
| ASE (Kun Shan) Inc. | Other receivables | Yes | 1,592,423 | 1,344,828 | 1,344,828 | 0.63~5.77 | The need for short-term | - | Operating capital | - | - | - | 15,021,695 | 22,532,543 | ||||||||||||||||||||||||||
| form related parties | financing | |||||||||||||||||||||||||||||||||||||||
| Anstock Limited | Long-term receivables | Yes | 775,860 | 775,860 | 775,860 | 3.99~4.05 | The need for short-term | - | Operating capital | - | - | - | 15,021,695 | 22,532,543 | ||||||||||||||||||||||||||
| form related parties | financing | |||||||||||||||||||||||||||||||||||||||
| 3 | ASE Test Limited | The Company | Other receivables | Yes | 5,113,080 | 4,525,950 | 4,525,950 | 0.55~0.57 | The need for short-term | - | Operating capital | - | - | - | 5,682,061 | 11,364,122 | ||||||||||||||||||||||||
| form related parties | financing | |||||||||||||||||||||||||||||||||||||||
| J & R Holding Limited | Long-term receivables | Yes | 1,987,270 | 1,392,600 | 1,392,600 | 0.55~0.57 | The need for short-term | - | Operating capital | - | - | - | 15,021,695 | 22,532,543 | ||||||||||||||||||||||||||
| form related parties | financing | |||||||||||||||||||||||||||||||||||||||
| ASE Singapore Pte. Ltd. | Long-term receivables | Yes | 1,127,390 | 443,100 | 443,100 | 0.55~0.57 | The need for short-term | - | Operating capital | - | - | - | 15,021,695 | 22,532,543 | ||||||||||||||||||||||||||
| form related parties | financing | |||||||||||||||||||||||||||||||||||||||
| A.S.E. Holding Limited | Long-term receivables | Yes | 1,582,500 | 1,582,500 | 1,582,500 | 0.55~0.57 | The need for short-term | - | Operating capital | - | - | - | 15,021,695 | 22,532,543 | ||||||||||||||||||||||||||
| form related parties | financing | |||||||||||||||||||||||||||||||||||||||
| 4 | ASE Test, Inc. | The Company | Other receivables | Yes | 4,800,000 | 4,499,200 | 4,499,200 | 0.98~1.03 | The need for short-term | - | Operating capital | - | - | - | 5,452,799 | 10,905,598 | ||||||||||||||||||||||||
| form related parties | financing | |||||||||||||||||||||||||||||||||||||||
| J & R Holding Limited | Other receivables | Yes | 1,523,500 | - | - | 0.99~1.00 | The need for short-term | - | Operating capital | - | - | - | 5,452,799 | 10,905,598 | ||||||||||||||||||||||||||
| form related parties | financing | |||||||||||||||||||||||||||||||||||||||
| Luchu Development | Other receivables | Yes | 110,000 | - | - | - | The need for short-term | - | Operating capital | - | - | - | 5,452,799 | 10,905,598 | ||||||||||||||||||||||||||
| Corporation | form related parties | financing | ||||||||||||||||||||||||||||||||||||||
| 5 | ASE Module (Shanghai) | ASE (Shanghai) Inc. | Other receivables | Yes | 517,240 | 517,240 | 517,240 | 5.40 | The need for short-term | - | Operating capital | - | - | - | 15,021,695 | 22,532,543 | ||||||||||||||||||||||||
| Inc. | form related parties | financing | ||||||||||||||||||||||||||||||||||||||
| 6 | J&R Industrial Inc. | The Company | Other receivables | Yes | 190,000 | 190,000 | 190,000 | 0.98~1.03 | The need for short-term | - | Operating capital | - | - | - | 198,616 | 397,232 | ||||||||||||||||||||||||
| form related parties | financing | |||||||||||||||||||||||||||||||||||||||
| J & R Holding Limited | Other receivables | Yes | 182,820 | - | - | 0.98~1.00 | The need for short-term | - | Operating capital | - | - | - | 198,616 | 397,232 | ||||||||||||||||||||||||||
| form related parties | financing | |||||||||||||||||||||||||||||||||||||||
| ASE Electronics Inc. | Other receivables | Yes | 190,000 | 190,000 | 190,000 | 0.99~1.03 | The need for short-term | - | Operating capital | - | - | - | 198,616 | 397,232 | ||||||||||||||||||||||||||
| form related parties | financing | |||||||||||||||||||||||||||||||||||||||
| 7 | ISE Labs, Inc. | J & R Holding Limited | Long-term receivables | Yes | 1,202,700 | 1,202,700 | 1,202,700 | 0.63~0.66 | The need for short-term | - | Operating capital | - | - | - | 15,021,695 | 22,532,543 | ||||||||||||||||||||||||
| form related parties | financing | |||||||||||||||||||||||||||||||||||||||
| Other receivables | ||||||||||||||||||||||||||||||||||||||||
| form related parties | ||||||||||||||||||||||||||||||||||||||||
| 8 | ASE (Korea) Inc. | The Company | Other receivables | Yes | 1,582,500 | 1,582,500 | 1,582,500 | 3.15~3.17 | The need for short-term | - | Operating capital | - | - | - | 3,017,323 | 6,034,646 | ||||||||||||||||||||||||
| form related parties | financing | |||||||||||||||||||||||||||||||||||||||
(Continued)
-85-
TABLE 1
ADVANCED SEMICONDUCTOR ENGINEERING, INC. AND SUBSIDIARIES
FINANCINGS PROVIDED
FOR THE YEAR ENDED DECEMBER 31, 2014
(Amounts In Thousands of New Taiwan Dollars)
| Financing Limits for | Financing Company's | |||||||||||||||||||||||||||||||||||||||
| Financial Statement | Related | Maximum Balance | Nature for | Transaction | Reason for | Allowance for | Collateral | Each Borrowing Company | Total Financing | |||||||||||||||||||||||||||||||
| No. | Financing Company | Counter-party | Account | Party | for the year | Ending Balance | Amount Actual Drawn | Interest Rate | Financing | Amounts | Financing | Bad Debt | Item | Value | (Note 1) | Amount Limits (Note 2) | ||||||||||||||||||||||||
| 9 | ASE Japan Co., Ltd. | J & R Holding Limited | Other receivables | Yes | $ | 2,668,800 | $ | 2,407,860 | $ | 2,249,100 | 0.53~0.55 | The need for short-term | $ | - | Operating capital | $ | - | - | $ | - | $ | 15,021,695 | $ | 22,532,543 | ||||||||||||||||
| form related parties | financing | |||||||||||||||||||||||||||||||||||||||
| 10 | USI Enterprise Limited | The Company | Other receivables | Yes | 4,431,000 | 4,431,000 | 4,431,000 | 0.55~0.57 | The need for short-term | - | Operating capital | - | - | - | 6,424,787 | 12,849,573 | ||||||||||||||||||||||||
| form related parties | financing | |||||||||||||||||||||||||||||||||||||||
| Universal Scientific | Other receivables | Yes | 335,170 | 284,850 | 284,850 | 0.55~0.57 | The need for short-term | - | Operating capital | - | - | - | 6,424,787 | 12,849,573 | ||||||||||||||||||||||||||
| Industrial Co., Ltd. | form related parties | financing | ||||||||||||||||||||||||||||||||||||||
| 11 | Huntington Holdings | The Company | Other receivables | Yes | 1,740,750 | 1,740,750 | 1,740,750 | 0.55~0.56 | The need for short-term | - | Operating capital | - | - | - | 7,343,287 | 14,686,574 | ||||||||||||||||||||||||
| International Co.Ltd. | form related parties | financing | ||||||||||||||||||||||||||||||||||||||
| J & R Holding Limited | Other receivables | Yes | 1,675,850 | - | - | 0.55~0.57 | The need for short-term | - | Operating capital | - | - | - | 7,343,287 | 14,686,574 | ||||||||||||||||||||||||||
| form related parties | financing | |||||||||||||||||||||||||||||||||||||||
| 12 | Anstock Limited | ASE Assembly & Test | Long-term receivables | Yes | 3,325,853 | 3,325,853 | 3,325,853 | 4.45 | The need for short-term | - | Operating capital | - | - | - | 15,021,695 | 22,532,543 | ||||||||||||||||||||||||
| (Shanghai) Limited | form related parties | financing | ||||||||||||||||||||||||||||||||||||||
| 13 | Shanghai Ding Yu Real | Shanghai Ding Wei Real | Other receivables | Yes | 504,520 | - | - | 6.00 | The need for short-term | - | Operating capital | - | - | - | 15,021,695 | 22,532,543 | ||||||||||||||||||||||||
| Estate Development | Estate Development Co., | form related parties | financing | |||||||||||||||||||||||||||||||||||||
| Co., Ltd. | Ltd. | |||||||||||||||||||||||||||||||||||||||
| 14 | ASE (Kun Shan) Inc. | ASE Investment | Other receivables | Yes | 2,069 | 2,069 | 2,069 | 6.00 | The need for short-term | - | Operating capital | - | - | - | 15,021,695 | 22,532,543 | ||||||||||||||||||||||||
| (Kun Shan) Limited | form related parties | financing | ||||||||||||||||||||||||||||||||||||||
| 15 | Real Tech Holdings | The Company | Other receivables | Yes | 1,675,850 | 474,750 | 474,750 | 0.55~0.57 | The need for short-term | - | Operating capital | - | - | - | 6,882,164 | 13,764,328 | ||||||||||||||||||||||||
| Limited | form related parties | financing | ||||||||||||||||||||||||||||||||||||||
| J & R Holding Limited | Other receivables | Yes | 1,266,000 | 1,266,000 | 1,266,000 | 0.55~0.56 | The need for short-term | - | Operating capital | - | - | - | 6,882,164 | 13,764,328 | ||||||||||||||||||||||||||
| form related parties | financing | |||||||||||||||||||||||||||||||||||||||
| 16 | Shanghai Ding Hui Real | Shanghai Ding Wei Real | Other receivables | Yes | 684,390 | 206,896 | 206,896 | 6.00 | The need for short-term | - | Operating capital | - | - | - | 15,021,695 | 22,532,543 | ||||||||||||||||||||||||
| Estate Development | Estate Development Co., | form related parties | financing | |||||||||||||||||||||||||||||||||||||
| Co., Ltd. | Ltd. | |||||||||||||||||||||||||||||||||||||||
| Kun Shan Ding Hong Real | Other receivables | Yes | 181,034 | 181,034 | 181,034 | 6.00 | The need for short-term | - | Operating capital | - | - | - | 15,021,695 | 22,532,543 | ||||||||||||||||||||||||||
| Estate Development Co., | form related parties | financing | ||||||||||||||||||||||||||||||||||||||
| Ltd. | ||||||||||||||||||||||||||||||||||||||||
| 17 | ASE Assembly & Test | ASE (Shanghai) Inc. | Other receivables | Yes | 1,466,550 | - | - | 5.60 | The need for short-term | - | Operating capital | - | - | - | 15,021,695 | 22,532,543 | ||||||||||||||||||||||||
| (Shanghai) Limited | form related parties | financing | ||||||||||||||||||||||||||||||||||||||
| ASE (Kun Shan) Inc. | Other receivables | Yes | 121,740 | - | - | 1.83 | The need for short-term | - | Operating capital | - | - | - | 15,021,695 | 22,532,543 | ||||||||||||||||||||||||||
| form related parties | financing | |||||||||||||||||||||||||||||||||||||||
| 18 | Universal Scientific | Universal Global | Other receivables | Yes | 517,240 | 517,240 | - | - | The need for short-term | - | Operating capital | - | - | - | 6,568,672 | 13,137,345 | ||||||||||||||||||||||||
| Industrial (Shanghai) | Technology (Kunshan) | form related parties | financing | |||||||||||||||||||||||||||||||||||||
| Co., Ltd. | Co., Ltd. | |||||||||||||||||||||||||||||||||||||||
| Universal Global | Other receivables | Yes | 3,879,300 | 3,879,300 | - | - | The need for short-term | - | Operating capital | - | - | - | 6,568,672 | 13,137,345 | ||||||||||||||||||||||||||
| Technology (Shanghai) | form related parties | financing | ||||||||||||||||||||||||||||||||||||||
| Co., Ltd. | ||||||||||||||||||||||||||||||||||||||||
| Universal Global | Other receivables | Yes | 1,551,720 | 1,551,720 | - | - | The need for short-term | - | Operating capital | - | - | - | 6,568,672 | 13,137,345 | ||||||||||||||||||||||||||
| Technology Co., Limited | form related parties | financing | ||||||||||||||||||||||||||||||||||||||
| Universal Global | Other receivables | Yes | 517,240 | 517,240 | - | - | The need for short-term | - | Operating capital | - | - | - | 6,568,672 | 13,137,345 | ||||||||||||||||||||||||||
| Electronics (Shanghai) | form related parties | financing | ||||||||||||||||||||||||||||||||||||||
| Co., Ltd.(Note3) | ||||||||||||||||||||||||||||||||||||||||
| Universal Global Scientific | Other receivables | Yes | 1,293,100 | 1,293,100 | - | - | The need for short-term | - | Operating capital | - | - | - | 6,568,672 | 13,137,345 | ||||||||||||||||||||||||||
| Industrial Co., Ltd. | form related parties | financing | ||||||||||||||||||||||||||||||||||||||
| 19 | ASE Module (Kunshan) Inc. | ASE (Kun Shan) Inc. | Other receivables | Yes | 119,960 | - | - | 1.83 | The need for short-term | - | Operating capital | - | - | - | 15,021,695 | 22,532,543 | ||||||||||||||||||||||||
| form related parties | financing | |||||||||||||||||||||||||||||||||||||||
| 20 | Omniquest Industrial | The Company | Other receivables | Yes | 2,548,300 | 1,424,250 | 1,424,250 | 0.55~0.56 | The need for short-term | - | Operating capital | - | - | - | 3,218,935 | 6,437,871 | ||||||||||||||||||||||||
| Limited | form related parties | financing | ||||||||||||||||||||||||||||||||||||||
(Continued)
-86-
TABLE 1
ADVANCED SEMICONDUCTOR ENGINEERING, INC. AND SUBSIDIARIES
FINANCINGS PROVIDED
FOR THE YEAR ENDED DECEMBER 31, 2014
(Amounts In Thousands of New Taiwan Dollars)
| Financial Statement | Related | Maximum Balance | Nature for | Transaction | Reason for | Allowance for | Collateral | Each Borrowing Company | Total Financing | |||||||||||||||||||||||||||||||
| No. | Financing Company | Counter-party | Account | Party | for the year | Ending Balance | Amount Actual Drawn | Interest Rate | Financing | Amounts | Financing | Bad Debt | Item | Value | (Note 1) | Amount Limits (Note 2) | ||||||||||||||||||||||||
| 21 | Anstock II Limited(Note4) | J & R Holding Limited | Long-term receivables | Yes | $ | 9,400,050 | $ | 9,400,050 | $ | 9,400,050 | 2.45 | The need for short-term | $ | - | Operating capital | $ | - | - | $ | - | $ | 15,021,695 | $ | 22,532,543 | ||||||||||||||||
| form related parties | financing | |||||||||||||||||||||||||||||||||||||||
| 22 | USI Electronics | Universal Scientific | Other receivables | Yes | 1,293,100 | 1,293,100 | - | - | The need for short-term | - | Operating capital | - | - | - | 1,771,341 | 3,542,683 | ||||||||||||||||||||||||
| (Shenzhen) Co., Ltd. | Industrial (Shanghai) | form related parties | financing | |||||||||||||||||||||||||||||||||||||
| Co., Ltd. | ||||||||||||||||||||||||||||||||||||||||
| Universal Global | Other receivables | Yes | 1,293,100 | 1,293,100 | 982,756 | 3.00~5.04 | The need for short-term | - | Operating capital | - | - | - | 1,771,341 | 3,542,683 | ||||||||||||||||||||||||||
| Technology (Shanghai) | form related parties | financing | ||||||||||||||||||||||||||||||||||||||
| Co., Ltd. | ||||||||||||||||||||||||||||||||||||||||
Note 1: Limit amount of lending to a company shall not exceed 20% of the net worth of the company. However, when the foreign subsidiaries whose voting shares are 100% owned directly or indirectly, by ASE as a lender, the amount lending to a company shall not exceed 10% of the net worth of ASE.
Note 2: Where an inter-company or inter-firm short-term financing facility is necessary provided that the total amount of such financing facility shall not exceed 40% of the amount of the net worth of the lending company. However, the foreign subsidiaries whose voting shares are 100% owned directly or indirectly, by ASE as a lender, the total amount lending to a company shall not exceed 15% of the net worth of ASE.
Note 3: Universal Global Electronics (Shanghai) Co., Ltd. was established on April 9, 2014 and 100% owned by Universal Scientific Industrial (Shanghai) Co., Ltd.
Note 4: Anstock II Limited was established on July 8, 2014 and 100% owned by J&R Holding Limited.
Note 5: Amount was eliminated based on the audited financial statements.
-87-
TABLE 2
ADVANCED SEMICONDUCTOR ENGINEERING, INC. AND SUBSIDIARIES
ENDORSEMENTS/GUARANTEES PROVIDED
FOR THE YEAR ENDED DECEMBER 31, 2014
(Amounts In Thousands of New Taiwan Dollars)
| Limits on Endorsement | Ratio of Accumulated | Maximum | Guarantee | ||||||||||||||||||||||||||||
| Endorsement/ | /Guarantee Amount | Amount of Endorsement/ | Endorsement/Guarantee to | Endorsement | Guarantee | Guarantee | Provided to | ||||||||||||||||||||||||
| Guarantee Provider | Guaranteed Party | Provided to Each | Maximum Balance | Amount Actually | Guarantee Collateralized | Net Equity per Latest | /Guarantee Amount | Provided by | Provided by | Subsidiaries | |||||||||||||||||||||
| No. | Name | Name | Nature of Relationship | Guaranteed Party (Note 1) | for the Year | Ending Balance | Drawn | by Properties | Financial Statement | Allowable (Note 2) | Parent Company | A Subsidiary | in Mainland CHINA | ||||||||||||||||||
| 0 | The Company | Anstock Limited | 100% voting shares | $ | 45,065,086 | $ | 3,568,862 | $ | 2,804,922 | $ | 2,616,614 | $ | - | 1.87 | $ | 60,086,781 | Yes | No | No | ||||||||||||
| indirectly owned by | (Note3) | (Note3) | (Note3) | ||||||||||||||||||||||||||||
| the Company | |||||||||||||||||||||||||||||||
| USI Enterprise Limited | 99% voting shares | 45,065,086 | 16,758,500 | - | - | - | - | 60,086,781 | Yes | No | No | ||||||||||||||||||||
| indirectly owned by | (Note3) | ||||||||||||||||||||||||||||||
| the Company | |||||||||||||||||||||||||||||||
| Anstock II Limited | 100% voting shares | 45,065,086 | 10,100,306 | 10,100,306 | 9,585,235 | - | 6.72 | 60,086,781 | Yes | No | No | ||||||||||||||||||||
| indirectly owned by | (Note3) | (Note3) | (Note3) | ||||||||||||||||||||||||||||
| the Company | |||||||||||||||||||||||||||||||
Note 1: The ceilings on the amounts for any single entity is permitted to make in endorsements/guarantees shall not exceed 30% of total equity of shareholders, respectively, according to “The Process of make in endorsements/guarantees” of ASE.
Note 2: The ceilings on the aggregate amounts are permitted to make in endorsements/guarantees shall not exceed 40% of total equity of shareholders, respectively, according to “The Process of make in endorsements/guarantees” of ASE.c
Note 3: Amount was included principal and interest.
-88-
TABLE 3
ADVANCED SEMICONDUCTOR ENGINEERING, INC. AND SUBSIDIARIES
MARKETABLE SECURITIES HELD
DECEMBER 31, 2014
(Amounts In Thousands of New Taiwan Dollars, Unless Specified Otherwise)
| December 31, 2014 | |||||||||||||||
| Relationship with | Percentage of | ||||||||||||||
| Held Company Name | Marketable Securities Type and Name | the Company | Financial Statement Account | Shares/ Units | Carrying Value | Ownership (%) | Fair Value | Note | |||||||
| The Company | Stock | ||||||||||||||
| H&HH Venture Investment Corporation | - | Available-for-sale financial assets - non-current | 4,435,245 | $ | 21,927 | 15 | $ | 21,927 | |||||||
| H&D Venture Capital Investment Corporation | - | Available-for-sale financial assets - non-current | 3,879,310 | 22,718 | 13 | 22,718 | |||||||||
| Claridy Solutions, Inc. | - | Available-for-sale financial assets - non-current | 12,611 | 58 | - | 58 | |||||||||
| Asia Pacifical Emerging Industry Venture Capital Co, Ltd. | - | Available-for-sale financial assets - non-current | 6,000,000 | 58,491 | 7 | 58,491 | |||||||||
| StarChips Technology Inc. | - | Available-for-sale financial assets - non-current | 333,334 | - | 6 | - | |||||||||
| Bond | |||||||||||||||
| AMPI Second Private of Domestic Unsecured | - | Financial assets at fair value through profit | 1,000 | 100,500 | - | 100,500 | |||||||||
| Convertible Bonds | or loss - current | ||||||||||||||
| Limited Liability Partnership | |||||||||||||||
| Ripley Cable Holdings I, L.P. | - | Available-for-sale financial assets - non-current | - | 438,953 | 4 | 438,953 | |||||||||
| Fund | |||||||||||||||
| Mega Diamond Money Market Fund | - | Available-for-sale financial assets - current | 32,504,205 | 400,007 | - | 400,007 | |||||||||
| ASE Test, Inc. | Stock | ||||||||||||||
| The Company | Parent Company | Available-for-sale financial assets - non-current | 10,978,776 | (Note) | 418,291 | - | 418,291 | ||||||||
| Claridy Solutions, Inc. | - | Available-for-sale financial assets - non-current | 3,400,090 | 15,878 | 17 | 15,878 | |||||||||
| Fund | |||||||||||||||
| UPAMC JAMES BOND MONEY MARKET FUND | - | Available-for-sale financial assets - current | 18,289,114 | 300,338 | - | 300,338 | |||||||||
| Allianz Global Investors Taiwan Money Market Fund | - | Available-for-sale financial assets - current | 8,130,610 | 110,010 | - | 110,010 | |||||||||
| CTBC Hua-win Money Market Fund | - | Available-for-sale financial assets - current | 27,717,723 | 300,033 | - | 300,033 | |||||||||
| Union Money Market Fund | - | Available-for-sale financial assets - current | 7,705,644 | 100,010 | - | 100,010 | |||||||||
| Prudential Financial Money Market Fund | - | Available-for-sale financial assets - current | 6,444,088 | 100,012 | - | 100,012 | |||||||||
| Franklin Templeton SinoAm Money Market Fund | - | Available-for-sale financial assets - current | 19,729,119 | 200,024 | - | 200,024 | |||||||||
| J&R Industrial Inc. | Fund | ||||||||||||||
| Taishin 1699 Money Market | - | Financial assets at fair value through profit | 34,302,310 | 455,720 | - | 455,720 | |||||||||
| or loss - current | |||||||||||||||
| Hua Nan Kirin Money Market Fund | - | Financial assets at fair value through profit | 2,616,592 | 30,829 | - | 30,829 | |||||||||
| or loss - current | |||||||||||||||
| Hua Nan Phoenix Money Market Fund | - | Financial assets at fair value through profit | 2,833,825 | 45,346 | - | 45,346 | |||||||||
| or loss - current | |||||||||||||||
| Luchu Development Corporation | Stock | ||||||||||||||
| Powerchip Technology Corporation | - | Available-for-sale financial assets - current | 1,677,166 | - | - | - | |||||||||
| A.S.E. Holding Limited | Stock | ||||||||||||||
| Global Strategic Investment Inc. | - | Available-for-sale financial assets - non-current | 490,000 | US$ | 282 thousand | 3 | US$ | 282 thousand | |||||||
| SiPhoton, Inc. | - | Available-for-sale financial assets - non-current | 544,800 | - | 4 | - | |||||||||
| Claridy Solutions, Inc. | - | Available-for-sale financial assets - non-current | 169,859 | US$ | 26 thousand | 1 | US$ | 26 thousand | |||||||
| Global Strategic Investment, Inc. (Samoa) | - | Available-for-sale financial assets - non-current | 869,891 | US$ | 212 thousand | 2 | US$ | 212 thousand | |||||||
| J & R Holding Limited | Stock | ||||||||||||||
| The Company | Parent Company | Available-for-sale financial assets - non-current | 46,703,763 | US$ | 56,222 thousand | 1 | US$ | 56,222 thousand | |||||||
(Continued)
-89-
TABLE 3
ADVANCED SEMICONDUCTOR ENGINEERING, INC. AND SUBSIDIARIES
MARKETABLE SECURITIES HELD
DECEMBER 31, 2014
(Amounts In Thousands of New Taiwan Dollars, Unless Specified Otherwise)
| Relationship with | Percentage of | ||||||||||||||
| Held Company Name | Marketable Securities Type and Name | the Company | Financial Statement Account | Shares/ Units | Carrying Value | Ownership (%) | Fair Value | Note | |||||||
| Limited Liability Partnership | |||||||||||||||
| Crimson Velocity Fund, L.P. | - | Available-for-sale financial assets - non-current | - | US$ | 1,630 thousand | - | US$ | 1,630 thousand | |||||||
| H&QAP Greater China Growth Fund, L.P. | - | Available-for-sale financial assets - non-current | - | US$ | 2,048 thousand | 8 | US$ | 2,048 thousand | |||||||
| ASE Test Limited | Stock | ||||||||||||||
| The Company | Parent Company | Available-for-sale financial assets - non-current | 88,200,472 | (Note) | US$ | 106,175 thousand | 1 | US$ | 106,175 thousand | ||||||
| Shanghai Ding Hui Real | Fund | ||||||||||||||
| Estate Development | 180ETF | - | Financial assets at fair value through profit | 47,825 | CNY | 154 thousand | - | CNY | 154 thousand | ||||||
| Co., Ltd. | or loss - current | ||||||||||||||
| 300ETF | - | Financial assets at fair value through profit | 39,700 | CNY | 142 thousand | - | CNY | 142 thousand | |||||||
| or loss - current | |||||||||||||||
| Stock | |||||||||||||||
| Gree Electric Appliances, Inc. Of Zhuhai | - | Financial assets at fair value through profit | 6,300 | CNY | 234 thousand | - | CNY | 234 thousand | |||||||
| or loss - current | |||||||||||||||
| Saic Motor Corporation Limited | - | Financial assets at fair value through profit | 7,250 | CNY | 156 thousand | - | CNY | 156 thousand | |||||||
| or loss - current | |||||||||||||||
| SINOMINE RESOURCE EXPLORATION CO., LTD. | - | Financial assets at fair value through profit | 500 | CNY | 6 thousand | - | CNY | 6 thousand | |||||||
| or loss - current | |||||||||||||||
| Universal Scientific | Stock | ||||||||||||||
| Industrial Co,Ltd | Allied Circuit Co., Ltd | - | Available-for-sale financial assets - current | 827,009 | 32,832 | 2 | 32,832 | ||||||||
| Universal Venture Capital Investment Corporation | - | Available-for-sale financial assets - non-current | 6,200,000 | 39,873 | 5 | 39,873 | |||||||||
| Plasmag Technology Inc. | - | Available-for-sale financial assets - non-current | 733,000 | - | 2 | - | |||||||||
| Senetex Investment Co., Ltd. | Stock | ||||||||||||||
| Universal Scientific Industrial Co,Ltd | - | Financial assets carried at cost- non-current | 2,753,578 | 37,608 | - | 37,608 | |||||||||
| Huntington Holdings | Stock | ||||||||||||||
| International Co., Ltd. | United Pacific Industrial Ltd. | - | Financial assets at fair value through profit | 5,548,800 | US$ | 558 thousand | - | US$ | 558 thousand | ||||||
| or loss - current | |||||||||||||||
| Cadence Design SYS Inc. | - | Financial assets at fair value through profit | 9,633 | US$ | 183 thousand | - | US$ | 183 thousand | |||||||
| or loss - current | |||||||||||||||
| Solid Gain Invenstments Ltd. | - | Available-for-sale financial assets - non-current | 1,544,500 | US$ | 577 thousand | 20 | US$ | 577 thousand | |||||||
| Preferred stock | |||||||||||||||
| Techgains I Corporation | - | Available-for-sale financial assets - non-current | 675,247 | US$ | 218 thousand | 10 | US$ | 218 thousand | |||||||
| Techgains II Corporation | - | Available-for-sale financial assets - non-current | 784,411 | US$ | 154 thousand | 4 | US$ | 154 thousand | |||||||
| Unitech Holdings | Stock | ||||||||||||||
| International Co., Ltd. | United Pacific Industrial Ltd. | - | Financial assets at fair value through profit | 5,613,600 | US$ | 564 thousand | - | US$ | 564 thousand | ||||||
| or loss - current | |||||||||||||||
| WacomCo., Ltd. | - | Available-for-sale financial assets - non-current | 1,200,000 | US$ | 4,685 thousand | 1 | US$ | 4,685 thousand | |||||||
| Sequans Communications SA | - | Available-for-sale financial assets - non-current | 370,554 | US$ | 441 thousand | 1 | US$ | 441 thousand | |||||||
| Asia Global Venture Co., Ltd. | - | Available-for-sale financial assets - non-current | 1,000,000 | US$ | 571 thousand | 10 | US$ | 571 thousand | |||||||
(Continued)
Note: The Company’s stocks held by ASE Test, Inc., of which 9,600,219 shares are trusted without power to decide the allocation of the trust assets, remaining 1,378,557 shares are under custody by Taiwan Depository &Clearing Corporation; ASE, Inc.'s stocks held by ASE Test Limited, 88,200,472 shares, are all trusted without power to decide the allocation of the trust assets.
-90-
TABLE 4
ADVANCED SEMICONDUCTOR ENGINEERING, INC. AND SUBSIDIARIES
MARKETABLE SECURITIES ACQUIRED AND DISPOSED OF AT COSTS OR PRICES OF AT LEAST NT$300 MILLION OR 20% OF THE PAID-IN CAPITAL
FOR THE YEAR ENDED DECEMBER 31, 2014
(Amounts In Thousands of New Taiwan Dollars, Unless Specified Otherwise)
| Nature of | Beginning Balance | Acquisition | Disposal | Ending Balance | ||||||||||||||||||||||||||||||||
| Company Name | Marketable Securities Type and Name | Financial Statement Account | Counter-party | Relationship | Shares/Units | Amount (Note 1) | Shares/Units | Amount | Shares/Units | Amount | Carrying Value | Gain/Loss on Disposal | Shares/Units | Amount (Note 1) | ||||||||||||||||||||||
| The Company | Fund | |||||||||||||||||||||||||||||||||||
| Yuanta De- Bao Money Market Fund | Available-for-sale financial assets - current | - | - | 24,719,982 | $ | 290,381 | 25,536,262 | $ | 300,000 | 50,256,244 | $ | 591,347 | $ | 590,000 | $ | 1,347 | - | $ | - | |||||||||||||||||
| Jih Sun Money Market | Available-for-sale financial assets - current | - | - | 20,087,832 | 290,402 | 20,749,327 | 300,000 | 40,837,159 | 591,356 | 590,000 | 1,356 | - | - | |||||||||||||||||||||||
| UPAMC James Bond Money | Available-for-sale financial assets - current | - | - | 17,779,195 | 290,384 | 18,365,923 | 300,000 | 36,145,118 | 591,318 | 590,000 | 1,318 | - | - | |||||||||||||||||||||||
| Market Fund | ||||||||||||||||||||||||||||||||||||
| Franklin Templeton SinoAm | Available-for-sale financial assets - current | - | - | - | - | 29,759,838 | 300,000 | 29,759,838 | 300,818 | 300,000 | 818 | - | - | |||||||||||||||||||||||
| Money Market Fund | ||||||||||||||||||||||||||||||||||||
| Mega Diamond Money Market Fund | Available-for-sale financial assets - current | - | - | - | - | 32,504,205 | 400,000 | - | - | - | - | 32,504,205 | 400,007 | |||||||||||||||||||||||
| ASE Test, Inc. | Fund | |||||||||||||||||||||||||||||||||||
| UPAMC James Bond Money | Available-for-sale financial assets - current | - | - | - | - | 36,032,303 | 590,000 | 17,743,189 | 290,972 | 290,000 | 972 | 18,289,114 | 300,338 | |||||||||||||||||||||||
| Market Fund | ||||||||||||||||||||||||||||||||||||
| CTBC Hua-win Money Market Fund | Available-for-sale financial assets - current | - | - | - | - | 29,574,164 | 320,000 | 1,856,441 | 20,051 | 20,000 | 51 | 27,717,723 | 300,033 | |||||||||||||||||||||||
| J&R Industrial Inc. | Fund | |||||||||||||||||||||||||||||||||||
| Taishin 1699 Money Market Fund | Financial assets at fair value through profit | - | - | - | - | 34,302,310 | 454,000 | - | - | - | - | 34,302,310 | 455,720 | |||||||||||||||||||||||
| or loss - current | ||||||||||||||||||||||||||||||||||||
| A.S.E Holding Limited | Stock | |||||||||||||||||||||||||||||||||||
| ASE Investment (Labuan) | Investments accounted for using the equity | (Note 2) | Subsidary | 147,642,842 | US$ | 302,403 thousand | 21,000,000 | US$ | 21,000 thousand | - | - | - | - | 168,642,842 | US$ | 337,150 thousand | ||||||||||||||||||||
| Inc. | method | |||||||||||||||||||||||||||||||||||
| ASE Investment | Stock | |||||||||||||||||||||||||||||||||||
| (Labuan) Inc. | ASE (Korea) Inc. | Investments accounted for using the equity | (Note 2) | Subsidary | 14,051,363 | US$ | 431,987 thousand | 6,690,000 | US$ | 30,000 thousand | - | - | - | - | 20,741,363 | US$ | 481,629 thousand | |||||||||||||||||||
| method | ||||||||||||||||||||||||||||||||||||
| ASE (Korea) Inc. | Capital | |||||||||||||||||||||||||||||||||||
| ASE WeiHai Inc. | Investments accounted for using the equity | (Note 2) | Subsidary | - | US$ | 42,902 thousand | - | US$ | 20,000 thousand | - | - | - | - | - | US$ | 63,680 thousand | ||||||||||||||||||||
| method | ||||||||||||||||||||||||||||||||||||
| USISH | Capital | |||||||||||||||||||||||||||||||||||
| UG-JQ | Investments accounted for using the equity | (Note 2) | Subsidary | - | CNY | 29,581 thousand | - | CNY | 500,000 thousand | - | - | - | - | - | CNY | 341,706 thousand | ||||||||||||||||||||
| method | ||||||||||||||||||||||||||||||||||||
Note 1: The ending balance of Long-Term Stock Investment-Equity Method includes share of profits/losses of investees and other related adjustment to equity. The ending balance of other financial assets includes the adjustment to fair value.
Note 2: Capital Increase by Cash
-91-
TABLE 5
ADVANCED SEMICONDUCTOR ENGINEERING, INC. AND SUBSIDIARIES
ACQUISITION OF INDIVIDUAL REAL ESTATE PROPERTIES AT COSTS OF AT LEAST NT$300 MILLION OR 20% OF THE PAID-IN CAPITAL
FOR THE YEAR ENDED DECEMBER 31, 2014
(Amounts In Thousands of New Taiwan Dollars)
| Prior Transaction of Related Counter-party | |||||||||||||||||||
| Transaction Date | Nature of | Purpose of | Other | ||||||||||||||||
| Company Name | Types of Property | Transaction Date | (Tax excluded) | Payment Term | Counter-party | Relationships | Owner | Relationships | Transfer Date | Amount | Price Reference | Acquisition | Terms | ||||||
| The Company | The Buildings, Located at No. 566、 | July 10, 2014 | $ | 4,540,086 | Paid | HC | Associate | - | - | - | $ | - | Based on independent | To facilitate the future | None | ||||
| 568、570 B1 and 572, Sec. 1, | (Tax excluded) | professional appraisal | production expansion | ||||||||||||||||
| Chung-Hwa Rd., Chungli | reports | plan | |||||||||||||||||
| City, Taoyuan County | |||||||||||||||||||
| Facilities and equipment of ASE's | January 03, 2014~ | 426,677 | There is 104,995 thousand will | Aircare Engineering | None | - | - | - | - | Request for quotation, | Facilities and equipment | None | |||||||
| Kaohsiung factory | December 11, 2014 | (Tax excluded) | be paid after acceptance check. | Corp. | price comparison | expansion | |||||||||||||
| and price negotiation | |||||||||||||||||||
| The plant and facility construction | January 07, 2014~ | 349,646 | There is 4,620 thousand will | Hu Hwa Construction | Associate | - | - | - | - | Based on independent | The wastewater treatment | None | |||||||
| of a new ”green building” project | November 09, 2014 | (Tax excluded) | be paid after acceptance check. | Co., Ltd. | professional appraisal | for further construction | |||||||||||||
| in Nantze Export Processing Zone, | reports, request for | and plant expansion | |||||||||||||||||
| Kaohsiung City | quotation, price | ||||||||||||||||||
| comparison and | |||||||||||||||||||
| price negotiation | |||||||||||||||||||
| Pumping and drainage works, etc. | January 09, 2014~ | 399,154 | There is 114,189 thousand will | Kun Lin Engineering | None | - | - | - | - | Request for quotation, | Facilities and equipment | None | |||||||
| December 23, 2014 | (Tax excluded) | be paid after acceptance check. | Co., Ltd. | price comparison | expansion | ||||||||||||||
| and price negotiation | |||||||||||||||||||
| Facilities and equipment of ASE's | January 10, 2014~ | 307,025 | There is 95,142 thousand will | Chia Wang Technology | None | - | - | - | - | Request for quotation, | Facilities and equipment | None | |||||||
| Kaohsiung factory | December 24, 2014 | (Tax excluded) | be paid after acceptance check. | Engineering Co., Ltd. | price comparison | expansion | |||||||||||||
| and price negotiation | |||||||||||||||||||
-92-
TABLE 6
ADVANCED SEMICONDUCTOR ENGINEERING, INC. AND SUBSIDIARIES
TOTAL PURCHASES FROM OR SALES TO RELATED PARTIES OF AT LEAST NT$100 MILLION OR 20% OF THE PAID-IN CAPITAL
FOR THE YEAR ENDED DECEMBER 31, 2014
(Amounts In Thousands of New Taiwan Dollars)
| Transaction Details | Abnormal Transaction | |||||||||||||||||||||||||||
| Buyer | Related Party | Relationships | Purchases/ | Ending Balance | % to Total | Note | ||||||||||||||||||||||
| Sales | Amount | % to Total | Payment Terms | Unit Price | Payment Terms | |||||||||||||||||||||||
| The Company | ASE (Shanghai) Inc. | Subsidiary | Purchases | $ | 2,033,164 | 8 | Net 60 days from the end | $ | - | - | $ | (615,718 | ) | (8 | ) | Note | ||||||||||||
| of the month of when | ||||||||||||||||||||||||||||
| invoice is issued | ||||||||||||||||||||||||||||
| ASE Electronics Inc. | Subsidiary | Purchases | 2,657,642 | 10 | Net 60 days from the end | - | - | (605,628 | ) | (7 | ) | Note | ||||||||||||||||
| of the month of when | ||||||||||||||||||||||||||||
| invoice is issued | ||||||||||||||||||||||||||||
| ISE Labs, Inc. | Subsidiary | Sales | (130,681 | ) | - | Net 45 days from | - | - | 13,192 | - | Note | |||||||||||||||||
| invoice date | ||||||||||||||||||||||||||||
| Universal Scientific | Subsidiary | Sales | (8,907,167 | ) | (9 | ) | Net 60 days from the end | - | - | 4,994,846 | 23 | Note | ||||||||||||||||
| Industrial Co., Ltd. | of the month of when | |||||||||||||||||||||||||||
| invoice is issued | ||||||||||||||||||||||||||||
| ASE Japan Co.,Ltd | Subsidiary | Sales | (172,358 | ) | - | Net 60 days from the end | - | - | 31,286 | - | Note | |||||||||||||||||
| of the month of when | ||||||||||||||||||||||||||||
| invoice is issued | ||||||||||||||||||||||||||||
| ASE Assembly & Test | ASE (Shanghai) Inc. | Associate | Purchases | 672,369 | 20 | Net 60 days from the end | - | - | (161,823 | ) | (22 | ) | Note | |||||||||||||||
| (Shanghai) Limited | of the month of when | |||||||||||||||||||||||||||
| invoice is issued | ||||||||||||||||||||||||||||
| ASE Electronics Inc. | Associate | Purchases | 151,797 | 4 | Net 60 days from the end | - | - | (19,562 | ) | (3 | ) | Note | ||||||||||||||||
| of the month of when | ||||||||||||||||||||||||||||
| invoice is issued | ||||||||||||||||||||||||||||
| Advanced Semiconductor | ASE (Shanghai) Inc. | Parent company | Purchases | 1,024,417 | 100 | Net 90 days from the end | - | - | (330,610 | ) | (100 | ) | Note | |||||||||||||||
| Engineering (HK) Limited | of the month of when | |||||||||||||||||||||||||||
| invoice is issued | ||||||||||||||||||||||||||||
| ASE Electronics (M) Sdn. Bhd. | ASE Electronics Inc. | Associate | Purchases | 327,954 | 21 | Net 60 days from | - | - | (53,717 | ) | (25 | ) | Note | |||||||||||||||
| invoice date | - | |||||||||||||||||||||||||||
| ISE Labs, Inc. | The Company | The Ultimate Parent of the Company | Purchases | 130,681 | 47 | Net 45 days from | - | - | (13,224 | ) | (21 | ) | Note | |||||||||||||||
| invoice date | ||||||||||||||||||||||||||||
| Universal Scientific | The Company | The Ultimate Parent of the Company | Purchases | 8,907,167 | 31 | Net 60 days from the end | - | - | (4,989,042 | ) | (17 | ) | Note | |||||||||||||||
| Industrial Co., Ltd. | of the month of when | |||||||||||||||||||||||||||
| invoice is issued | ||||||||||||||||||||||||||||
| ASE Japan Co.,Ltd | The Company | The Ultimate Parent of the Company | Purchases | 172,358 | 31 | Net 60 days from the end | - | - | (31,526 | ) | (20 | ) | Note | |||||||||||||||
| of the month of when | ||||||||||||||||||||||||||||
| invoice is issued | ||||||||||||||||||||||||||||
| ASE (Shanghai) Inc. | The Company | The Ultimate Parent of the Company | Sales | (2,033,164 | ) | (39 | ) | Net 60 days from the end | - | - | 619,787 | 50 | Note | |||||||||||||||
| of the month of when | ||||||||||||||||||||||||||||
| invoice is issued | ||||||||||||||||||||||||||||
| ASE Assembly & Test | Associate | Sales | (672,369 | ) | (13 | ) | Net 60 days from | - | - | 161,853 | 13 | Note | ||||||||||||||||
| (Shanghai) Limited | invoice date | |||||||||||||||||||||||||||
| Advanced Semiconductor | Subsidiary | Sales | (1,024,417 | ) | (20 | ) | Net 90 days from the end | - | - | 330,610 | 27 | Note | ||||||||||||||||
| Engineering (HK) Limited | of the month of when | |||||||||||||||||||||||||||
| invoice is issued | ||||||||||||||||||||||||||||
| ASE Electronics Inc. | The Company | The Ultimate Parent of the Company | Sales | (2,657,642 | ) | (63 | ) | Net 60 days from the end | - | - | 623,445 | 64 | Note | |||||||||||||||
| of the month of when | ||||||||||||||||||||||||||||
| invoice is issued | ||||||||||||||||||||||||||||
| ASE Electronics (M) Sdn. Bhd. | Associate | Sales | (327,954 | ) | (8 | ) | Net 60 days from | - | - | 53,922 | 6 | Note | ||||||||||||||||
| invoice date | ||||||||||||||||||||||||||||
| ASE Assembly & Test | Associate | Sales | (151,797 | ) | (4 | ) | Net 60 days from the end | - | - | 19,562 | 2 | Note | ||||||||||||||||
| (Shanghai) Limited | of the month of when | |||||||||||||||||||||||||||
| invoice is issued | ||||||||||||||||||||||||||||
(Continued)
-93-
TABLE 6
ADVANCED SEMICONDUCTOR ENGINEERING, INC. AND SUBSIDIARIES
TOTAL PURCHASES FROM OR SALES TO RELATED PARTIES OF AT LEAST NT$100 MILLION OR 20% OF THE PAID-IN CAPITAL
FOR THE YEAR ENDED DECEMBER 31, 2014
(Amounts In Thousands of New Taiwan Dollars)
| Transaction Details | Abnormal Transaction | |||||||||||||||||||||||||||
| Buyer | Related Party | Relationships | Purchases/ | Ending Balance | % to Total | Note | ||||||||||||||||||||||
| Sales | Amount | % to Total | Payment Terms | Unit Price | Payment Terms | |||||||||||||||||||||||
| Suzhou ASEN Semiconductors | NXP Semiconductors | Subsidiary of the company has | Sales | $ | (2,360,029 | ) | (50 | ) | Net 90 days from the end | $ | - | - | $ | 808,316 | 63 | Note | ||||||||||||
| Co., Ltd. | Taiwan Ltd. | significant influence over | of the month of when | |||||||||||||||||||||||||
| Suzhou ASEN Semiconductors | invoice is issued | |||||||||||||||||||||||||||
| Co., Ltd.-Subsidiary of | ||||||||||||||||||||||||||||
| NXP B.V | ||||||||||||||||||||||||||||
| USI Electronics | Universal Global Industrial | Associate | Purchases | CNY | 752,761 thousand | 18 | T/T 75 days | - | - | ( | CNY | 176,197 thousand | ) | (15 | ) | Note | ||||||||||||
| (Shenzhen) Co., Ltd. | Co., Limited | Sales | ( | CNY | 2,383,898 thousand | ) | (47 | ) | T/T 75 days | - | - | CNY | 543,737 thousand | 50 | Note | |||||||||||||
| Universal Scientific Industrial | Universal Global Technology | Subsidiary | Purchases | CNY | 919,092 thousand | 16 | T/T 75 days | - | - | ( | CNY | 142,047 thousand | ) | (16 | ) | Note | ||||||||||||
| (Shanghai) Co., Ltd. | Co., Limited | |||||||||||||||||||||||||||
| Universal Global Industrial | Subsidiary | Sales | ( | CNY | 29,026 thousand | ) | - | T/T 75 days | - | - | CNY | 5,555thousand | - | Note | ||||||||||||||
| Co., Limited | ||||||||||||||||||||||||||||
| USI Electronics | Subsidiary | Sales | ( | CNY | 43,312 thousand | ) | ( | (1 | T/T 75 days | - | - | CNY | 238 thousand | - | Note | |||||||||||||
| (Shenzhen) Co., Ltd. | ||||||||||||||||||||||||||||
| Universal Global Technology | Universal Scientific Industrial | Parent company | Sales | ( | US$ | 147,603 thousand | ) | (50 | ) | T/T 75 days | - | - | US$ | 23,239 thousand | 33 | Note | ||||||||||||
| Co., Limited | (Shanghai) Co., Ltd. | |||||||||||||||||||||||||||
| Universal Global Technology | Associate | Sales | ( | US$ | 144,110 thousand | ) | (49 | ) | T/T 75 days | - | - | US$ | 47,639 thousand | 67 | Note | |||||||||||||
| (Kunshan) Co., Ltd. | ||||||||||||||||||||||||||||
| Universal Global Industrial | USI Electronics | Associate | Purchases | US$ | 387,747 thousand | 52 | T/T 75 days | - | - | ( | US$ | 88,860 thousand | ) | (49 | ) | Note | ||||||||||||
| Co., Limited | (Shenzhen) Co., Ltd. | Sales | ( | US$ | 108,669 thousand | ) | (15 | ) | T/T 75 days | - | - | US$ | 24,152 thousand | 13 | Note | |||||||||||||
| Universal Scientific Industrial | Parent company | Purchases | US$ | 4,728 thousand | 1 | T/T 75 days | - | - | ( | US$ | 908 thousand | ) | - | Note | ||||||||||||||
| (Shanghai) Co., Ltd. | ||||||||||||||||||||||||||||
| Universal Global Scientific | Associate | Purchases | US$ | 20,212 thousand | 3 | T/T 75 days | - | - | ( | US$ | 2,747 thousand | ) | (2 | ) | Note | |||||||||||||
| Industrial Co., Ltd. | Sales | ( | US$ | 499,126 thousand | ) | (67 | ) | T/T 75 days | - | - | US$ | 118,943 thousand | 66 | Note | ||||||||||||||
| Universal Global Technology | Associate | Purchases | US$ | 227,435 thousand | 31 | T/T 75 days | - | - | ( | US$ | 48,620 thousand | ) | (27 | ) | Note | |||||||||||||
| (Kunshan) Co., Ltd. | Sales | ( | US$ | 15,855 thousand | ) | (2 | ) | T/T 75 days | - | - | US$ | 3,090 thousand | 2 | Note | ||||||||||||||
| Universal Global Scientific | Universal Global Industrial | Associate | Purchases | 15,070,938 | 84 | T/T 75 days | - | - | (3,763,342 | ) | (78 | ) | Note | |||||||||||||||
| Industrial Co., Ltd. | Co., Limited | Sales | (543,727 | ) | (3 | ) | T/T 75 days | - | - | 225,875 | 4 | Note | ||||||||||||||||
| Universal Scientific Industrial | Parent company | Sales | (210,566 | ) | (1 | ) | T/T 75 days | - | - | - | - | Note | ||||||||||||||||
| (Shanghai) Co., Ltd. | ||||||||||||||||||||||||||||
| USI Electronics | Associate | Sales | (149,256 | ) | (1 | ) | T/T 75 days | - | - | - | - | Note | ||||||||||||||||
| (Shenzhen) Co., Ltd. | ||||||||||||||||||||||||||||
| Universal Scientific | Parent company | Sales | (679,727 | ) | (3 | ) | T/T 75 days | - | - | 501,212 | 8 | Note | ||||||||||||||||
| Industrial Co., Ltd. | ||||||||||||||||||||||||||||
| Universal Global Technology | Universal Global Technology | Associate | Purchases | CNY | 888,380 thousand | 49 | T/T 75 days | - | - | ( | CNY | 291,498 thousand | ) | (51 | ) | Note | ||||||||||||
| (Kunshan) Co., Ltd. | Co., Limited | |||||||||||||||||||||||||||
| Universal Global Industrial | Associate | Purchases | CNY | 97,851 thousand | 5 | T/T 75 days | - | - | ( | CNY | 18,906 thousand | ) | (3 | ) | Note | |||||||||||||
| Co., Limited | Sales | ( | CNY | 1,398,544 thousand | ) | (66 | ) | T/T 75 days | - | - | CNY | 298,645 thousand | 53 | Note | ||||||||||||||
| Note: Amount was included principal and interest. | (Concluded) |
-94-
TABLE 7
ADVANCED SEMICONDUCTOR ENGINEERING, INC. AND SUBSIDIARIES
RECEIVABLES FROM RELATED PARTIES AMOUNTING TO AT LEAST NT$100 MILLION OR 20% OF THE PAID-IN CAPITAL
DECEMBER 31, 2014
(Amounts In Thousands of New Taiwan Dollars, Unless Specified Otherwise)
| Turnover Rate | Overdue (Note 1) | Amounts Received | Allowance for | ||||||||||||||||||
| Company Name | Related Party | Relationships | Ending Balance (Note 1) | (Note 2) | Amount | Actions Taken | in Subsequent Period | Bad Debts | |||||||||||||
| The Company | Universal Scientific Industrial Co., Ltd. | Subsidiary | $ | 4,994,846 | (Note5) | 2 | $ | 203,068 | Continued collection | $ | 3,485,786 | $ | - | ||||||||
| ASE Electronics Inc. | The Company | The Ultimate Parent of | 625,509 | (Note5) | 4 | - | - | 418,183 | - | ||||||||||||
| the Company | |||||||||||||||||||||
| Omniquest Industrial Limited | The Company | The Ultimate Parent of | 1,424,250 | (Notes 3,5) | - | - | - | - | - | ||||||||||||
| the Company | |||||||||||||||||||||
| ISE Labs, Inc. | J & R Holding Limited | Parent company | 1,202,862 | (Notes 3,5) | - | - | - | - | - | ||||||||||||
| Anstock Limited | ASE Assembly & Test (Shanghai) Limited | Associate | 3,370,262 | (Notes 3,5) | - | - | - | - | - | ||||||||||||
| A.S.E. Holding Limited | J & R Holding Limited | Associate | 194,320 | (Notes 3,5) | - | - | - | - | - | ||||||||||||
| The Company | Parent company | 2,088,900 | (Notes 3,5) | - | - | - | - | - | |||||||||||||
| ASE Test, Inc. | The Company | Parent company | 6,211,977 | (Notes 3,4,5) | - | - | - | 2,130,251 | - | ||||||||||||
| ASE Test Limited | The Company | The Ultimate Parent of | 4,525,950 | (Notes 3,5) | - | - | - | 56 | - | ||||||||||||
| the Company | |||||||||||||||||||||
| J & R Holding Limited | Parent company | 1,404,553 | (Notes 3,5) | - | - | ||||||||||||||||
| ASE Singapore Pte. Ltd. | Subsidiary | 443,305 | (Notes 3,5) | 3,006 | |||||||||||||||||
| A.S.E. Holding Limited | Parent company | 1,594,551 | (Notes 3,5) | - | - | - | - | - | |||||||||||||
| ASE (Korea) Inc. | The Company | The Ultimate Parent of | 1,582,734 | (Notes 3,5) | - | - | - | 1,582,734 | - | ||||||||||||
| the Company | |||||||||||||||||||||
| J & R Holding Limited | ASE WeiHai Inc. | Associate | 3,791,196 | (Notes 3,5) | - | - | - | 318,494 | - | ||||||||||||
| Global Advanced Packaging Technology | Subsidiary | 509,811 | (Notes 3,5) | - | - | - | - | - | |||||||||||||
| Limited, Cayman Islands. | |||||||||||||||||||||
| The Company | Parent company | 7,849,200 | (Notes 3,5) | - | - | - | - | - | |||||||||||||
| ASE (Kun Shan) Inc. | Associate | 1,361,858 | (Notes 3,5) | - | - | ||||||||||||||||
| ASE Assembly & Test (Shanghai) Limited | Associate | 1,611,205 | (Notes 3,5) | - | - | - | - | - | |||||||||||||
| Omniquest Industrial Limited | Associate | 1,433,053 | (Notes 3,5) | - | - | - | - | - | |||||||||||||
| Anstock Limited | Subsidiary | 784,955 | (Notes 3,5) | - | - | - | - | - | |||||||||||||
| J&R Industrial Inc. | The Company | The Ultimate Parent of | 190,000 | (Notes 3,5) | - | - | - | - | - | ||||||||||||
| the Company | |||||||||||||||||||||
| ASE Electronics Inc. | Associate | 190,000 | (Notes 3,5) | - | - | - | - | - | |||||||||||||
| ASE Japan Co., Ltd. | J & R Holding Limited | Parent company | 2,250,132 | (Notes 3,5) | - | - | - | - | - | ||||||||||||
| ASE (Shanghai) Inc. | The Company | The Ultimate Parent of | 619,787 | (Note 5) | 4 | - | - | 67,130 | - | ||||||||||||
| the Company | |||||||||||||||||||||
| ASE Assembly & Test (Shanghai) Limited | Associate | 168,555 | (Note 5) | 5 | 451 | Continued collection | 19119 | - | |||||||||||||
| Advanced Semiconductor | Subsidiary | 330,610 | (Note 5) | 3 | - | - | - | - | |||||||||||||
| Engineering (HK) Limited | |||||||||||||||||||||
(Continued)
-95-
TABLE 7
ADVANCED SEMICONDUCTOR ENGINEERING, INC. AND SUBSIDIARIES
RECEIVABLES FROM RELATED PARTIES AMOUNTING TO AT LEAST NT$100 MILLION OR 20% OF THE PAID-IN CAPITAL
DECEMBER 31, 2014
(Amounts In Thousands of New Taiwan Dollars, Unless Specified Otherwise)
| Company Name | Related Party | Relationships | Ending Balance(Note 1) | (Note 2) | Amount | Actions Taken | in Subsequent Period | Bad Debts | |||||||||||||
| ASE Module (Shanghai) Inc. | ASE (Shanghai) Inc. | Associate | $ | 535,275 | (Notes 3,5) | - | $ | - | - | $ | - | - | |||||||||
| Shanghai Ding Hui Real | Shanghai Ding Wei Real Estate | Subsidiary | 216,660 | (Notes 3,5) | - | - | - | - | - | ||||||||||||
| Estate Development Co., Ltd. | Development Co., Ltd. | ||||||||||||||||||||
| Kun Shan Ding Hong Real | Subsidiary | 184,037 | (Notes 3,5) | - | - | - | 266 | - | |||||||||||||
| Estate Development Co., Ltd. | |||||||||||||||||||||
| Anstock II Limited | J & R Holding Limited | Parent company | 9,458,905 | (Notes 3,5) | - | - | - | 58,855 | - | ||||||||||||
| USI Enterprise Limited | The Company | The Ultimate Parent of | 4,431,000 | (Notes 3,5) | - | - | - | - | - | ||||||||||||
| the Company | |||||||||||||||||||||
| Universal Scientific | Parent company | US$ | 9,000 thousand | (Note 5) | - | - | - | - | - | ||||||||||||
| Industrial Co., Ltd. | |||||||||||||||||||||
| Huntington Holdings International Co. Ltd. | The Company | The Ultimate Parent of | 1,740,750 | (Notes 3,5) | - | - | - | - | - | ||||||||||||
| the Company | |||||||||||||||||||||
| Real Tech Holdings Limited | The Company | The Ultimate Parent of | 474,750 | (Notes 3,5) | - | - | - | - | - | ||||||||||||
| the Company | |||||||||||||||||||||
| J & R Holding Limited | Associate | 1,267,192 | (Notes 3,5) | - | - | - | 1,813 | - | |||||||||||||
| Suzhou ASEN Semiconductors Co., Ltd. | NXP Semiconductors Taiwan Ltd. | Subsidiary of the company has | 808,316 | 3 | - | - | 6,472 | - | |||||||||||||
| significant influence over | |||||||||||||||||||||
| Suzhou ASEN Semiconductors | |||||||||||||||||||||
| Co., Ltd. | |||||||||||||||||||||
| USI Electronics (Shenzhen) Co., Ltd. | Universal Global Industrial | Associate | CNY | 543,737 thousand | (Note 5) | 5 | - | - | CNY | 183,714 thousand | - | ||||||||||
| Co., Limited | |||||||||||||||||||||
| Universal Global Technology | Associate | CNY | 190,000 thousand | (Note 5) | - | - | - | CNY | 130,000 thousand | - | |||||||||||
| (Shanghai) Co., Ltd. | |||||||||||||||||||||
| Universal Global Technology Co., Limited | Universal Scientific Industrial | Parent company | US$ | 23,262 thousand | (Note 5) | 8 | - | - | US$ | 7,853 thousand | - | ||||||||||
| (Shanghai) Co., Ltd. | |||||||||||||||||||||
| Universal Global Technology | Associate | US$ | 47,639 thousand | (Note 5) | 3 | - | - | US$ | 13,758 thousand | - | |||||||||||
| (Kunshan) Co., Ltd. | |||||||||||||||||||||
| Universal Global Industrial Co., Limited | USI Electronics (Shenzhen) Co., Ltd. | Associate | US$ | 28,823 thousand | (Note 5) | 6 | - | - | US$ | 11,726 thousand | - | ||||||||||
| Universal Global Scientific | Associate | US$ | 119,066 thousand | (Note 5) | 5 | - | - | US$ | 45,543 thousand | - | |||||||||||
| Industrial Co., Ltd. | |||||||||||||||||||||
| Universal Global Scientific Industrial Co., Ltd. | Universal Global Industrial | Associate | 236,300 | (Note 5) | 2 | - | - | 71,068 | - | ||||||||||||
| Co., Limited | |||||||||||||||||||||
| Universal Scientific Industrial Co., Ltd. | Parent company | 501,220 | (Note 5) | 2 | 135 | Continued collection | 8,630 | - | |||||||||||||
| Universal Global Technology | Universal Global Industrial Co., Limited | Associate | CNY | 298,645 thousand | (Note 5) | 5 | - | - | CNY | 153,171 thousand | - | ||||||||||
| (Kunshan) Co., Ltd. | |||||||||||||||||||||
(Continued)
-96-
Note 1: Include accounts receivables and other receivables
Note 2: Exclude other receivables
Note 3: Intercompany Loan, please refer to Table 1.
Note 4: Receivable of selling PPE.
Note 5: All the transactions had been eliminated when preparing consolidated financial statements.
-97-
TABLE 8
ADVANCED SEMICONDUCTOR ENGINEERING, INC. AND SUBSIDIARIES
NAMES, LOCATIONS, AND RELATED INFORMATION OF INVESTEES OVER WHICH THE COMPANY EXERCISES SIGNIFICANT INFLUENCE
FOR THE YEAR ENDED DECEMBER 31, 2014
(Amounts In Thousands of New Taiwan Dollars, Unless Specified Otherwise)
| Original Investment Amount | Balance as of December 31, 2014 | Net Income | Share of Profits/Losses | |||||||||||||||||||||||||
| Investor Company | Investee Company | Location | Main Businesses and Products | December 31, 2014 | December 31, 2013 | Shares | Percentage of Ownership | Carrying Value | (Losses) of the Investee | of Investee | Note | |||||||||||||||||
| The Company | A.S.E. Holding Limited | Bermuda | Investment activities | US$ | 283,966 thousand | US$ | 283,966 thousand | 243,966 | 100 | $ | 14,367,500 | $ | 633,375 | $ | 621,744 | Subsidiary | ||||||||||||
| J & R Holding Limited | Bermuda | Investment activities | US$ | 479,693 thousand | US$ | 479,693 thousand | 435,128 | 100 | 45,150,552 | 2,304,535 | 2,129,949 | Subsidiary | ||||||||||||||||
| ASE Marketing & Service Japan Co., Ltd. | Japan | Engaged in marketing and sales services | JPY | 60,000 thousand | JPY | 60,000 thousand | 1,200 | 100 | 24,972 | 1,316 | 1,316 | Subsidiary | ||||||||||||||||
| Omniquest Industrial Limited | British Virgin Islands | Investment activities | US$ | 250,504 thousand | US$ | 250,504 thousand | 250,504,067 | 71 | 11,044,272 | 736,363 | 509,186 | Subsidiary | ||||||||||||||||
| Innosource Limited | British Virgin Islands | Investment activities | US$ | 86,000 thousand | US$ | 86,000 thousand | 86,000,000 | 100 | 3,965,686 | 163,878 | 160,657 | Subsidiary | ||||||||||||||||
| HCK | Taiwan | Engaged in the leasing of real estate properties | $ | 390,470 | $ | 390,470 | 35,497,273 | 27 | 342,138 | (40,338 | ) | (11,016 | ) | Associate | ||||||||||||||
| HC | Taiwan | Engaged in the development, construction and | 2,845,913 | 2,845,913 | 68,629,782 | 26 | 1,351,400 | 884,976 | 6,159 | Associate | ||||||||||||||||||
| leasing of real estate properties | ||||||||||||||||||||||||||||
| USI | Taiwan | Engaged in the manufacturing, processing and | 21,356,967 | 21,356,967 | 1,625,015,916 | 99 | 36,711,064 | 3,005,865 | 2,363,353 | Subsidiary | ||||||||||||||||||
| sale of computers, computer peripherals | ||||||||||||||||||||||||||||
| and related accessories | ||||||||||||||||||||||||||||
| ASE Test, Inc. | Taiwan | Engaged in the testing of semiconductors | 20,698,867 | 20,698,867 | 851,997,366 | 100 | 26,941,503 | 3,074,899 | 3,060,691 | Subsidiary | ||||||||||||||||||
| Luchu Development Corporation | Taiwan | Engaged in the development of real estate properties | 1,366,238 | 1,366,238 | 131,961,457 | 67 | 1,315,326 | (1,929 | ) | (1,294 | ) | Subsidiary | ||||||||||||||||
| AMPI | Taiwan | Engaged in integrated circuit | 178,861 | - | 33,308,452 | 18 | 99,052 | (361,860 | ) | (103,869 | ) | Associate | ||||||||||||||||
| StarChips Technology Inc. | Taiwan | Engaged in manufacturing, product desing, intellectual property | - | 84,000 | - | - | - | - | - | Transfer to | ||||||||||||||||||
| and global transaction | Available-for | |||||||||||||||||||||||||||
| -Sale | ||||||||||||||||||||||||||||
| ASE Test, Inc. | Alto Enterprises Limited | British Virgin Islands | Investment activities | US$ | 140,000 thousand | US$ | 140,000 thousand | 140,000,000 | 100 | 3,351,112 | 44,145 | Subsidiary | ||||||||||||||||
| Super Zone Holdings Limited | Hong Kong | Investment activities | US$ | 100,000 thousand | US$ | 100,000 thousand | 100,000,000 | 100 | 3,323,497 | 5,700 | Subsidiary | |||||||||||||||||
| Luchu Development Corporation | Taiwan | Engaged in the development of real estate properties | 372,504 | 372,504 | 37,250,448 | 19 | 371,299 | (1,929 | ) | Subsidiary | ||||||||||||||||||
| A.S.E. Holding Limited | ASE Test Limited | Singapore | Investment activities | US$ | 84,889 thousand | US$ | 84,889 thousand | 11,148,000 | 10 | US$ | 100,035 thousand | US$ | 56,602 thousand | Subsidiary | ||||||||||||||
| ASE Investment (Labuan) Inc. | Malaysia | Investment activities | US$ | 168,643 thousand | US$ | 168,643 thousand | 168,642,842 | 70 | US$ | 337,150 thousand | US$ | 23,306 thousand | Subsidiary | |||||||||||||||
| J & R Holding Limited | ASE Test Limited | Singapore | Investment activities | US$ | 964,524 thousand | US$ | 964,524 thousand | 98,276,087 | 90 | US$ | 1,008,799 thousand | US$ | 56,602 thousand | Subsidiary | ||||||||||||||
| Omniquest Industrial Limited | British Virgin Islands | Investment activities | US$ | 30,200 thousand | US$ | 30,200 thousand | 30,200,000 | 8 | US$ | 43,275 thousand | US$ | 24,394 thousand | Subsidiary | |||||||||||||||
| J&R Industrial Inc. | Taiwan | Engaged in leasing equipment and investing activity | US$ | 51,344 thousand | US$ | 51,344 thousand | 170,000,006 | 100 | US$ | 31,377 thousand | US$ | 576 thousand | Subsidiary | |||||||||||||||
| ASE Japan Co., Ltd. | Japan | Engaged in the packaging and testing of semiconductors | US$ | 25,606 thousand | US$ | 25,606 thousand | 7,200 | 100 | US$ | 69,858 thousand | US$ | 5,691 thousand | Subsidiary | |||||||||||||||
| ASE (U.S.) Inc. | U.S.A | After-sales service and sales support | US$ | 4,600 thousand | US$ | 4,600 thousand | 1,000 | 100 | US$ | 10,875 thousand | US$ | 1,901 thousand | Subsidiary | |||||||||||||||
| Global Advanced Packaging Technology | British Cayman Islands | Investment activities | US$ | 190,000 thousand | US$ | 190,000 thousand | 190,000,000 | 100 | US$ | 335,602 thousand | US$ | 13,784 thousand | Subsidiary | |||||||||||||||
| Limited, Cayman Islands | ||||||||||||||||||||||||||||
| Anstock Limited | British Cayman Islands | Investment activities | US$ | 10 thousand | US$ | 10 thousand | 10,000 | 100 | US$ | 658 thousand | US$ | 730 thousand | Subsidiary | |||||||||||||||
| Anstock II Limited | British Cayman Islands | Investment activities | US$ | 10 thousand | - | 10,000 | 100 | ( | US$ | 56 thousand | ) | ( | US$ | 66 thousand | ) | Subsidiary | ||||||||||||
| ASE Investment (Labuan) Inc. | ASE (Korea) Inc. | Korea | Engaged in the packaging and testing of semiconductors | US$ | 160,000 thousand | US$ | 160,000 thousand | 20,741,363 | 100 | US$ | 481,629 thousand | US$ | 20,059 thousand | Subsidiary | ||||||||||||||
| ASE Test Limited | ASE Holdings (Singapore) Pte Ltd | Singapore | Investment activities | US$ | 65,520 thousand | US$ | 65,520 thousand | 71,428,902 | 100 | US$ | 134,133 thousand | US$ | 13,176 thousand | Subsidiary | ||||||||||||||
| ASE Test Holdings, Ltd. | British Cayman Islands | Investment activities | US$ | 222,399 thousand | US$ | 222,399 thousand | 5 | 100 | US$ | 98,926 thousand | US$ | 2,683 thousand | Subsidiary | |||||||||||||||
| ASE Test Finance Limited | Mauritius | Investment activities | US$ | 0.002 thousand | US$ | 0.002 thousand | 2 | 100 | US$ | 53 thousand | ( | US$ | 4 thousand | ) | Subsidiary | |||||||||||||
| ASE Investment (Labuan) Inc. | Malaysia | Investment activities | US$ | 72,304 thousand | US$ | 63,304 thousand | 72,304,040 | 30 | US$ | 144,493 thousand | US$ | 20,306 thousand | Subsidiary | |||||||||||||||
| ASE Singapore Pte. Ltd. | Singapore | Engaged in the packaging and testing of semiconductors | US$ | 55,815 thousand | US$ | 55,815 thousand | 30,100,000 | 100 | US$ | 146,252 thousand | US$ | 30,616 thousand | Subsidiary | |||||||||||||||
| ASE Test Holdings, Ltd. | ISE Labs, Inc. | U.S.A | Engaged in the testing of semiconductors | US$ | 221,145 thousand | US$ | 221,145 thousand | 26,250,000 | 100 | US$ | 98,925 thousand | US$ | 2,638 thousand | Subsidiary | ||||||||||||||
| ASE Holdings (Singapore) Pte Ltd | ASE Electronics (M) Sdn. Bhd. | Malaysia | Engaged in the packaging and testing of semiconductors | US$ | 60,000 thousand | US$ | 60,000 thousand | 159,715,000 | 100 | US$ | 134,133 thousand | US$ | 13,176 thousand | Subsidiary | ||||||||||||||
| Omniquest Industrial Limited | ASE Corporation | British Cayman Islands | Investment activities | US$ | 352,784 thousand | US$ | 352,784 thousand | 352,784,067 | 100 | US$ | 508,568 thousand | US$ | 24,430 thousand | Subsidiary | ||||||||||||||
(Continued)
-98-
TABLE 8
ADVANCED SEMICONDUCTOR ENGINEERING, INC. AND SUBSIDIARIES
NAMES, LOCATIONS, AND RELATED INFORMATION OF INVESTEES OVER WHICH THE COMPANY EXERCISES SIGNIFICANT INFLUENCE
FOR THE YEAR ENDED DECEMBER 31, 2014
(Amounts In Thousands of New Taiwan Dollars, Unless Specified Otherwise)
| Investor Company | Investee Company | Location | Main Businesses and Products | December 31, 2014 | December 31, 2013 | Shares | Percentage of Ownership | Carrying Value | (Losses) of the Investee | of Investee | Note | |||||||||||||||||
| ASE Corporation | ASE Mauritius Inc. | Mauritius | Investment activities | US$ | 217,800 thousand | US$ | 217,800 thousand | 217,800,000 | 100 | US$ | 390,199 thousand | US$ | 16,116 thousand | Subsidiary | ||||||||||||||
| ASE Labuan Inc. | Malaysia | Investment activities | US$ | 126,184 thousand | US$ | 126,184 thousand | 126,184,067 | 100 | US$ | 118,231 thousand | US$ | 8,323 thousand | Subsidiary | |||||||||||||||
| ASE Labuan Inc. | ASE Electronics Inc. | Taiwan | Engaged in the production of substrates | US$ | 125,813 thousand | US$ | 125,813 thousand | 398,981,900 | 100 | US$ | 117,650 thousand | US$ | 8,326 thousand | Subsidiary | ||||||||||||||
| Innosource Limited | Omniquest Industrial Limited | British Virgin Islands | Investment activities | US$ | 74,000 thousand | US$ | 74,000 thousand | 74,000,000 | 21 | US$ | 106,077 thousand | US$ | 24,394 thousand | Subsidiary | ||||||||||||||
| ASE (Shanghai) Inc. | Advanced Semiconductor Engineering | Hong Kong | Engaged in the trading of substrates | US$ | 1,000 thousand | US$ | 1,000 thousand | - | 100 | US$ | 8,808 thousand | US$ | 1,087 thousand | Subsidiary | ||||||||||||||
| (HK) Limited | ||||||||||||||||||||||||||||
| Universal Scientific | Huntington Holdings International Co. Ltd. | British Virgin Islands | Holding company | $ | 8,370,606 | $ | 8,370,606 | 255,856,840 | 100 | $ | 36,715,105 | $ | 3,030,791 | Subsidiary | ||||||||||||||
| Industrial Co,Ltd | Senetex Investment Co., Ltd. | Taiwan | Engaged in investment activities | 298 | 298 | 29,700 | 100 | (3,516 | ) | 15 | Subsidiary | |||||||||||||||||
| Huntington Holdings International | Unitech Holdings International Co. Ltd. | British Virgin Islands | Holding company | US$ | 3,000 thousand | US$ | 3,000 thousand | 3,000,000 | 100 | US$ | 8,839 thousand | US$ | 124 thousand | Subsidiary | ||||||||||||||
| Co. Ltd. | Real Tech Holdings Limited | British Virgin Islands | Holding company | US$ | 149,151 thousand | US$ | 149,151 thousand | 149,151,000 | 100 | US$ | 1,087,230 thousand | US$ | 10,113 thousand | Subsidiary | ||||||||||||||
| Universal ABIT Holding Co., Ltd. | British Cayman Islands | Holding company | US$ | 28,125 thousand | US$ | 28,125 thousand | 90,000,000 | 100 | US$ | 14 thousand | ( | US$ | 7 thousand | ) | Subsidiary | |||||||||||||
| Rising Capital Investment Limited | British Virgin Islands | Holding company | US$ | 6,000 thousand | US$ | 6,000 thousand | 6,000,000 | 100 | US$ | 1,132 thousand | US$ | 2 thousand | Subsidiary | |||||||||||||||
| Rise Accord Limited | British Virgin Islands | Holding company | US$ | 2,000 thousand | US$ | 2,000 thousand | 20,000 | 100 | US$ | 153 thousand | ( | US$ | 119 thousand | ) | Subsidiary | |||||||||||||
| Real Tech Holdings Limited | USI Enterprise Limited | Hong Kong | Engaged in the services of investment advisory and | US$ | 210,900 thousand | US$ | 210,900 thousand | 210,900,000 | 99.53 | US$ | 1,010,204 thousand | US$ | 100,035 thousand | Subsidiary | ||||||||||||||
| warehousing management | ||||||||||||||||||||||||||||
| USISH | Universal Global Technology Co., Limited | Hong Kong | Holding company | CNY | 324,185 thousand | CNY | 324,185 thousand | 390,000,000 | 100 | CNY | 1,042,586 thousand | CNY | 307,786 thousand | Subsidiary | ||||||||||||||
| Universal Global Technology Co., | Universal Global Industrial Co., Limited | Hong Kong | Engaged in manufacturing, trading and investing activity | US$ | 11,000 thousand | US$ | 11,000 thousand | 85,800,000 | 100 | US$ | 17,597 thousand | US$ | 271 thousand | Subsidiary | ||||||||||||||
| Limited | Universal Global Scientific Industrial | Taiwan | Engaged in the manufacturing of components of | US$ | 30,400 thousand | US$ | 30,400 thousand | 98,000,000 | 100 | US$ | 64,353 thousand | US$ | 18,028 thousand | Subsidiary | ||||||||||||||
| Co., Ltd. | telecomm and cars and provision of related | |||||||||||||||||||||||||||
| R&D services | ||||||||||||||||||||||||||||
| USI Japan Co., Ltd | Japan | Engaged in the manufacturing and sale of computer | US$ | 885 thousand | US$ | 885 thousand | 6,400 | 100 | US$ | 734 thousand | US$ | 59 thousand | Subsidiary | |||||||||||||||
| peripherals, integrated chip and other | ||||||||||||||||||||||||||||
| related accessories | ||||||||||||||||||||||||||||
| USI @ Work, Inc. | U.S.A | Merged into USI America Inc. in August 2015 | US$ | 250 thousand | US$ | 250 thousand | 250,000 | 100 | US$ | 737 thousand | ( | US$ | 11 thousand | ) | Subsidiary | |||||||||||||
| Universal Scientific Industrial De Mexico | Mexico | Engaged in the assembling of motherboards and | US$ | 23,963 thousand | US$ | 23,963 thousand | 281,085,325 | 100 | US$ | 37,317 thousand | US$ | 3,984 thousand | Subsidiary | |||||||||||||||
| S.A. De C.V. | computer components | |||||||||||||||||||||||||||
| USI America Inc. | U.S.A | Engaged in the manufacturing and processing of | US$ | 9,500 thousand | US$ | 9,500 thousand | 250,000 | 100 | US$ | 4,443 thousand | US$ | 82 thousand | Subsidiary | |||||||||||||||
| motherboards and wireless network communication | ||||||||||||||||||||||||||||
| and provision of related technical service | ||||||||||||||||||||||||||||
| Universal Global Industrial | Universal Scientific Industrial De Mexico | Mexico | Engaged in the assembling of motherboards and | - | - | 1 | - | - | US$ | 3,984 thousand | Subsidiary | |||||||||||||||||
| Co., Limited | S.A. De C.V. | computer components | ||||||||||||||||||||||||||
(Continued)
-99-
TABLE 9
ADVANCED SEMICONDUCTOR ENGINEERING, INC. AND SUBSIDIARIES
INFORMATION ON INVESTMENT IN MAINLAND CHINA
FOR THE YEAR ENDED DECEMBER 31, 2014
(Amounts In Thousands of New Taiwan Dollars, Unless Specified Otherwise)
| Accumulated amount of | Amount remitted from Taiwan to | Accumulated amount of | Investment income (loss) | Accumulated amount of | |||||||||||||||||||||||||||||||||||
| remittance from Taiwan | Mainland China/Amount remitted back to | remittance from Taiwan | Ownership held | recognised by the Company | Book value of investments in | investment income | |||||||||||||||||||||||||||||||||
| Investment | to Mainland China | Taiwan for the year ended December 31,2014 | to Mainland China | Net income of investee | by the Company | for the yaer ended | Mainland China as of | remitted back to Taiwan | |||||||||||||||||||||||||||||||
| Investee Company | Main Business Activities | Paid-in Capital | Method | as of January 1, 2014 | Remitted to Mainland China | Remitted back to Taiwan | as of December 31, 2014 | as of December 31, 2014 | (direct or indirect) | December 31, 2014 | December 31, 2014 | as of December 31, 2014 | |||||||||||||||||||||||||||
| ASE (Shanghai) Inc. | Engaged in the production of | $ | 4,236,563 | Note 1 (1) | $ | 4,398,576 | $ | - | $ | - | $ | 4,398,576 | $ | 455,058 | 100 | $ | 455,058 | $ | 10,391,730 | None | |||||||||||||||||||
| substrates | ( | US$ | 133,812 thousand | ) | ( | US$ | 137,800 thousand | ) | ( | US$ | 137,800 thousand | ) | ( | US$ | 15,083 thousand | ) | ( | US$ | 15,083 thousand | ) | ( | US$ | 328,333 thousand | ) | |||||||||||||||
| (Note 5 | ) | (Note 5 | ) | ||||||||||||||||||||||||||||||||||||
| ASE (Kun Shan) Inc. | Engaged in the packaging and | ( | 6,843,004 | Note 1 (2) | 6,641,405 | - | - | 6,641,405 | 69,670 | 100 | 69,670 | 5,266,958 | None | ||||||||||||||||||||||||||
| testing of semiconductors | ( | US$ | 220,000 thousand | ) | ( | US$ | 214,000 thousand | ) | ( | US$ | 214,000 thousand | ) | ( | US$ | 2,272 thousand | ) | ( | US$ | 2,272 thousand | ) | ( | US$ | 166,413 thousand | ) | |||||||||||||||
| (Note 10) | (Note 4 | ) | (Note 4 | ) | |||||||||||||||||||||||||||||||||||
| ASE Module (Shanghai) Inc. | Engage in the production and | 383,640 | Note 1 (3) | 383,640 | - | - | 383,640 | 10,272 | 100 | 10,272 | 611,197 | None | |||||||||||||||||||||||||||
| sale of electronic components | ( | US$ | 12,000 thousand | ) | ( | US$ | 12,000 thousand | ) | ( | US$ | 12,000 thousand | ) | ( | US$ | 341 thousand | ) | ( | US$ | 341 thousand | ) | ( | US$ | 19,311 thousand | ) | |||||||||||||||
| and printed circuit boards | (Note 5 | ) | (Note 5 | ) | |||||||||||||||||||||||||||||||||||
| ASE Module (Kunshan) Inc. | Engage in the production and | - | - | 201,599 | - | - | 201,599 | 34,472 | 100 | 34,472 | - | ||||||||||||||||||||||||||||
| sale of electronic components | (Note 10 | ) | ( | US$ | 6,000 thousand | ) | ( | US$ | 6,000 thousand | ) | ( | US$ | 1,143 thousand | ) | ( | US$ | 1,143 thousand | ) | (Note 10 | ) | |||||||||||||||||||
| and printed circuit boards | (Note 4 | ) | (Note 4 | ) | |||||||||||||||||||||||||||||||||||
| ASE Assembly & Test (Shanghai) | Engaged in the packaging and | 6,501,336 | Note 1 (4) | 5,792,530 | - | - | 5,792,530 | 418,932 | 100 | 418,932 | 10,721,752 | None | |||||||||||||||||||||||||||
| Limited | testing of semiconductors | ( | US$ | 203,580 thousand | ) | ( | US$ | 180,000 thousand | ) | ( | US$ | 180,000 thousand | ) | ( | US$ | 13,879 thousand | ) | ( | US$ | 13,879 thousand | ) | ( | US$ | 338,760 thousand | ) | ||||||||||||||
| (Note 4 | ) | (Note 4 | ) | ||||||||||||||||||||||||||||||||||||
| Suzhou ASEN Semiconductors | Engaged in the packaging and | 1,568,467 | Note 1 (5) | 711,180 | - | - | 711,180 | 473,080 | 60 | 283,848 | 1,889,451 | None | |||||||||||||||||||||||||||
| Co., Ltd. | testing of semiconductors | ( | US$ | 48,672 thousand | ) | ( | US$ | 21,600 thousand | ) | ( | US$ | 21,600 thousand | ) | ( | US$ | 15,648 thousand | ) | ( | US$ | 9,389 thousand | ) | ( | US$ | 59,698 thousand | ) | ||||||||||||||
| (Note 5 | ) | (Note 5 | ) | ||||||||||||||||||||||||||||||||||||
| ASE WeiHai Inc. | Engaged in the packaging and | 4,507,081 | Note 1 (6) | 1,295,307 | - | - | 1,295,307 | 25,602 | 100 | 25,602 | 2,015,472 | None | |||||||||||||||||||||||||||
| testing of semiconductors | ( | US$ | 152,200 thousand | ) | ( | US$ | 40,000 thousand | ) | ( | US$ | 40,000 thousand | ) | ( | US$ | 800 thousand | ) | ( | US$ | 800 thousand | ) | ( | US$ | 63,680 thousand | ) | |||||||||||||||
| (Note 5 | ) | (Note 5 | ) | ||||||||||||||||||||||||||||||||||||
| Shanghai Ding Hui Real Estate | Engaged in the development, | 16,345,070 | Note 2 | - | - | - | - | (101,922 | ) | 100 | (102,212 | ) | 20,478,531 | None | |||||||||||||||||||||||||
| Development Co., Ltd. | construction and sale of real | ( | CNY | 3,600,000 thousand | ) | (Note 2 | ) | (註2) | ( | CNY | -20,670 thousand | ) | ( | CNY | -20,729 thousand | ) | ( | CNY | 3,959,183 thousand | ) | |||||||||||||||||||
| estate properties | (Note 5 | ) | (Note 5 | ) | |||||||||||||||||||||||||||||||||||
| Shanghai Ding Wei Real Estate | Engaged in the development, | 6,908,089 | Note 2 | - | - | - | - | (18,522 | ) | 100 | (18,522 | ) | 7,958,791 | None | |||||||||||||||||||||||||
| Development Co., Ltd. | construction and sale of real | ( | CNY | 1,548,000 thousand | ) | (Note 2 | ) | (註2) | ( | CNY | -3,757 thousand | ) | ( | CNY | -3,757 thousand | ) | ( | CNY | 1538,700 thousand | ) | |||||||||||||||||||
| estate properties | (Note 5 | ) | (Note 5 | ) | |||||||||||||||||||||||||||||||||||
| Shanghai Ding Yu Real Estate | Engaged in the development, | 4,936,538 | Note 2 | - | - | - | - | 10,866 | 100 | 10,866 | 5,703,680 | None | |||||||||||||||||||||||||||
| Development Co., Ltd. | construction and sale of real | ( | CNY | 1,100,000 thousand | ) | (Note 2 | ) | (註2) | ( | CNY | 2,235 thousand | ) | ( | CNY | 2,235 thousand | ) | ( | CNY | 1,102,711 thousand | ) | |||||||||||||||||||
| estate properties | (Note 5 | ) | (Note 5 | ) | |||||||||||||||||||||||||||||||||||
| Kun Shan Ding Hong Real Estate | Engaged in the development, | 3,139,662 | Note 2 | - | - | - | - | (1,149 | ) | 100 | (1,149 | ) | 3,460,885 | None | |||||||||||||||||||||||||
| Development Co., Ltd. | construction and sale of real | ( | CNY | 670,000 thousand | ) | (Note 2 | ) | (註2) | ( | CNY | -233 thousand | ) | ( | CNY | -233 thousand | ) | ( | CNY | 669,105 thousand | ) | |||||||||||||||||||
| estate properties | (Note 5 | ) | (Note 5 | ) | |||||||||||||||||||||||||||||||||||
| Kun Shan Ding Yue Real Estate | Engaged in the development, | 1,546,415 | Note 2 | - | - | - | - | (79 | ) | 100 | (79 | ) | 1,705,018 | None | |||||||||||||||||||||||||
| Development Co., Ltd. | construction and sale of real | ( | CNY | 330,000 thousand | ) | (Note 2 | ) | (註2) | ( | CNY | -15 thousand | ) | ( | CNY | -15 thousand | ) | ( | CNY | 329,637 thousand | ) | |||||||||||||||||||
| estate properties | (Note 5 | ) | (Note 5 | ) | |||||||||||||||||||||||||||||||||||
| Advanced Semiconductor | Engage in the packaging and | 3,149,000 | Note 1 (7) | 3,149,000 | - | - | 3,149,000 | 5,700 | 100 | 5,700 | 3,323,377 | None | |||||||||||||||||||||||||||
| Engineering (China) Ltd. | testing of semiconductors | ( | US$ | 100,000 thousand | ) | ( | US$ | 100,000 thousand | ) | ( | US$ | 100,000 thousand | ) | ( | US$ | 196 thousand | ) | ( | US$ | 196 thousand | ) | ( | US$ | 105,004 thousand | ) | ||||||||||||||
| (Note 4 | ) | (Note 4 | ) | ||||||||||||||||||||||||||||||||||||
(Continued)
-100-
TABLE 9
ADVANCED SEMICONDUCTOR ENGINEERING, INC. AND SUBSIDIARIES
INFORMATION ON INVESTMENT IN MAINLAND CHINA
FOR THE YEAR ENDED DECEMBER 31, 2014
(Amounts In Thousands of New Taiwan Dollars, Unless Specified Otherwise)
| Accumulated amount of | Amount remitted from Taiwan to | Accumulated amount of | Investment income (loss) | Accumulated amount of | |||||||||||||||||||||||||||||||||||
| remittance from Taiwan | Mainland China/Amount remitted back to | remittance from Taiwan | Ownership held | recognised by the Company | Book value of investments in | investment income | |||||||||||||||||||||||||||||||||
| Investment | to Mainland China | Taiwan for the year ended December 31,2014 | to Mainland China | Net income of investee | by the Company | for the yaer ended | Mainland China as of | remitted back to Taiwan | |||||||||||||||||||||||||||||||
| Investee Company | Main Business Activities | Paid-in Capital | Method | as of January 1, 2014 | Remitted to Mainland China | Remitted back to Taiwan | as of December 31, 2014 | as of December 31, 2014 | (direct or indirect) | December 31, 2014 | December 31, 2014 | as of December 31, 2014 | |||||||||||||||||||||||||||
| ASE Investment (Kun Shan) | Holding company | 2,210,118 | Note 1 (8) | $ | 2,210,118 | $ | - | $ | - | $ | 2,210,118 | $ | 23,191 | 100 | $ | 23,191 | $ | 1,771,025 | None | ||||||||||||||||||||
| Limited | ( | US$ | 74,000 thousand | ) | ( | US$ | 74,000 thousand | ) | ( | US$ | 74,000 thousand | ) | ( | US$ | 756 thousand | ) | ( | US$ | 756 thousand | ) | ( | US$ | 55,957 thousand | ) | |||||||||||||||
| (Note 4 | ) | (Note 4 | ) | ||||||||||||||||||||||||||||||||||||
| . | |||||||||||||||||||||||||||||||||||||||
| Wuxi Tongzhi Microelectronics | Engage in the packaging and | $ | 356,682 | (Note 2) | - | - | - | - | 24,391 | 100 | 24,391 | 439,093 | None | ||||||||||||||||||||||||||
| Co., Ltd. | testing of semiconductors | ( | CNY | 73,461 thousand | ) | (Note 2 | ) | (Note 2 | ) | ( | CNY | 4,938 thousand | ) | ( | CNY | 4,938 thousand | ) | ( | CNY | 84,891 thousand | ) | ||||||||||||||||||
| (Note 4 | ) | (Note 4 | ) | ||||||||||||||||||||||||||||||||||||
| USI Electronics (Shenzhen) | Engaged in the processing | 2,270,625 | Note 1 (9) | 1,180,746 | - | - | 1,180,746 | 1,946,187 | 82 | 1,738,082 | 7,259,533 | $ | 1,196,256 | ||||||||||||||||||||||||||
| Co., Ltd | and sales of computer and | ( | US$ | 75,000 thousand | ) | ( | CNY | 395,800 thousand | ) | ( | US$ | 57,549 thousand | ) | ( | US$ | 229,369 thousand | ) | ( | US$ | 41,243 thousand | ) | ||||||||||||||||||
| communication peripherals as | (Note 6 | ) | (Note 6 | ) | |||||||||||||||||||||||||||||||||||
| well as business in import and | |||||||||||||||||||||||||||||||||||||||
| export of goods and technology | |||||||||||||||||||||||||||||||||||||||
| Universal Scientific Industrial | Engaged in the designing, | 5,228,884 | Note 1 (9) | 1,668,233 | - | - | 1,668,233 | 3,434,878 | 82 | 2,994,518 | 26,968,081 | None | |||||||||||||||||||||||||||
| (Shanghai) Co., Ltd. | manufacturing and sale of | ( | CNY | 1,087,962 thousand | ) | ( | US$ | 113,730 thousand | ) | ( | US$ | 99,150 thousand | ) | ( | US$ | 852,072 thousand | ) | ||||||||||||||||||||||
| electronic components | (Note 6 | ) | (Note 6 | ) | |||||||||||||||||||||||||||||||||||
| Universal Scientific Industrial | Engaged in the manufacturing | 383,201 | Note 1 (9) | 383,201 | - | - | 383,201 | 4,748 | 99 | 4,709 | 444,586 | None | |||||||||||||||||||||||||||
| (Kunshan) Co., Ltd. | and sale of computer assistance | ( | US$ | 12,000 thousand | ) | ( | US$ | 157 thousand | ) | ( | US$ | 156 thousand | ) | ( | US$ | 14,047 thousand | ) | ||||||||||||||||||||||
| system and related peripherals | (Note 6 | ) | (Note 6 | ) | |||||||||||||||||||||||||||||||||||
| e-Cloud Corporation | Engaged in the sale of electronic | 147,450 | Note 1 (11) | 147,450 | - | - | 147,450 | - | - | - | - | None | |||||||||||||||||||||||||||
| components and | ( | US$ | 5,000 thousand | ) | (Note 12 | ) | |||||||||||||||||||||||||||||||||
| telecommunications equipment | |||||||||||||||||||||||||||||||||||||||
| Siargo(SH), Ltd. | Engaged in manufacturing and sale | 227,063 | (Note 3) | 3,035 | - | - | 3,035 | - | - | - | - | None | |||||||||||||||||||||||||||
| of MEMS mass flow sensors | ( | US$ | 7,500 thousand | ) | |||||||||||||||||||||||||||||||||||
| Universal Global Technology | Engaged in the designing and | 1,202,223 | (Note 2) | - | - | - | - | 500,431 | 82 | 432,190 | 1,398,231 | None | |||||||||||||||||||||||||||
| (Kunshan) Co., Ltd. | manufacturing of electronic | ( | CNY | 250,000 thousand | ) | (Note 2 | ) | (Note 2 | ) | ( | CNY | 101,774 thousand | ) | ( | CNY | 87,897 thousand | ) | ( | CNY | 270,325 thousand | ) | ||||||||||||||||||
| components | (Note 6 | ) | (Note 6 | ) | |||||||||||||||||||||||||||||||||||
| Universal Global Technology | Engaged in the processing and sales | 2,603,640 | (Note 2) | - | - | - | - | (923,798 | ) | 82 | (807,732 | ) | 1,451,263 | None | |||||||||||||||||||||||||
| (Shanghai) Co., Ltd. | of computer and communication | ( | CNY | 530,000 thousand | ) | (Note 2 | ) | (Note 2 | ) | ( | CNY | -187,874 thousand | ) | ( | CNY | -164,274 thousand | ) | ( | CNY | 280,578 thousand | ) | ||||||||||||||||||
| peripherals as well as business in | (Note 6 | ) | (Note 6 | ) | |||||||||||||||||||||||||||||||||||
| import and export of goods and | |||||||||||||||||||||||||||||||||||||||
| technology | |||||||||||||||||||||||||||||||||||||||
| Universal Global Electronics | Engaged in the sale of electronic | 240,850 | (Note 2) | - | - | - | - | 4,840 | 82 | 4,232 | 216,536 | None | |||||||||||||||||||||||||||
| (Shanghai) Co., Ltd. | components and | ( | CNY | 50,000 thousand | ) | (Note 2 | ) | (Note 2 | ) | ( | CNY | 984 thousand | ) | ( | CNY | 861 thousand | ) | ( | CNY | 41,864 thousand | ) | ||||||||||||||||||
| telecommunications equipment | (Note 6 | ) | (Note 6 | ) | |||||||||||||||||||||||||||||||||||
| Cubuy Corporation | Engaged in the sale of electronic | 60,868 | Note 1 (10) | - | - | - | - | (3,589 | ) | 99 | (3,560 | ) | 4,796 | None | |||||||||||||||||||||||||
| components and | - | ( | US$ | -119 thousand | ) | ( | US$ | -118 thousand | ) | ( | US$ | 152 thousand | ) | ||||||||||||||||||||||||||
| telecommunications equipment | ( | US$ | 2,000 thousand | ) | (Note 6 | ) | (Note 6 | ) | |||||||||||||||||||||||||||||||
(Continued)
-101-
Investee Company | Accumulated Investment in Mainland China as of December 31, 2014 | Investment Amounts Authorized by Investment Commission, MOEA | Upper Limit on Investment |
The company
| $ 15,203,097 (US$ 471,400 thousand) | $ 16,790,306 (US$ 576,400 thousand ) (Note 9) | $ - (Note 7) |
| ASE Test, Inc. | 7,371,638 (US$ 240,000 thousand) | 7,371,638 (US$ 240,000 thousand) | 16,358,397 (Note 8) |
| USI Inc. | 3,382,665 | 5,017,806 (US$ 167,932 thousand) | 24,906,385 (Note 11) |
Note 1: Investments through a holding company registered in a third region. The holding companies are as follow:
| (1) | ASE Mauritius Inc., ASE Corporation, Omniquest Industrial Limited, Innosource Limited and J&R Holding Limited. |
| (2) | ASE Mauritius Inc., Alto Enterprises Limited, Innosource Limited, ASE Corporation, Omniquest Industrial Limited and J&R Holding Limited. |
| (3) | Innosource Limited. |
| (4) | Global Advanced Packaging Technology Ltd. and J&R Holding Limited. |
| (5) | J&R Holding Limited. |
| (6) | ASE (Korea) Inc., ASE Test Limited, ASE Investment (Labuan) Inc., ASE Holding Ltd. and J&R Holding Limited. |
| (7) | Super Zone Holdings Limited. |
| (8) | Alto Enterprises Limited. |
| (9) | Real Tech Holdings Limited and Huntington Holdings International Co. Ltd. |
| (10) | Rise Accord Limited and Huntington Holdings International Co. Ltd. |
| (11) | Rise Capital Investment Limited and Huntington Holdings International Co. Ltd. |
Note 2: Invested by companies in Mainland China.
Note 3: The company was invested by Asia Global Venture Co. Ltd which is invested by UHI as available-for-sale. Asia Global Venture Co. Ltd disposed all of the company's shares in October, 2013, therefore as of December 31,2014 UHI does not invest to any company in Mainland China.
Note 4: The basis for investment income (loss) recognition is from the financial statements audited and attested by R.O.C. parent company’s CPA
Note 5: The basis for investment income (loss) recognition is from the financial statements audited and attested by international accounting firm which has cooperative relationship with accounting firm in R.O.C.
Note 6: The basis for investment income (loss) recognition is from the financial statements audited and attested by other CPA in the same accounting firm with R.O.C. parent company’s CPA.
Note 7: Pursuant to the Jing-Shen-Zi Letter No. 09704604680 of the Ministry of Economic Affairs, R.O.C amended 'Guidelines Governing the Review of Investment or Technical Cooperation in the Mainland Area' dated on August 29, 2008, as the Company has obtained the certificate of being qualified for operating headquarters, issued by the Industrial Development Bureau, MOEA, the ceiling amount of the investment in Mainland China is not applicable to the Company.
Note 8: The upper limit on investment of ASET, Inc. is calculated as follow: $27,263,995× 60% = 16,358,397
Note 9: USD $80,000 thousand was directly remitted by the subsidiary, ASE (Korea), and USD $25,000 thousand was by means of Debt for Equity Swap. Therefore, there is USD$105,000 thousand difference between MOEA approved investment amount and accumulated outflow of investment from Taiwan.
Note 10: ASE Module (Kun Shan) Inc. was merged into ASE (Kun Shan) Inc. in September 2014.
Note 11: The upper limit on investment of Universal Scientific Industrial Co., Ltd. is calculated as follow: $41,510,641× 60% = 24,906,385
Note 12: e-Cloud Corporation was liquidated in December 2013.
-102-
TABLE 10
ADVANCED SEMICONDUCTOR ENGINEERING, INC. AND SUBSIDIARIES
INTERCOMPANY RELATIONSHIPS AND SIGNIFICANT INTERCOMPANY TRANSACTIONS
FOR THE YEAR ENDED DECEMBER 31, 2014
(Amounts In Thousands of New Taiwan Dollars, Unless Specified Otherwise)
| Percentage of | |||||||||||
| Consolidated Net Revenue | |||||||||||
| No. | Company Name | Related Party | Nature of Relationships | Financial Statement Account | Amount (Note) | Terms | or Total Assets | ||||
| 0 | The Company | ASE Test, Inc. | Parent company to subsidiary | Other payables | $ | 6,211,123 | 2 | ||||
| USI | Parent company to subsidiary | Trade receivables | 4,994,846 | 1 | |||||||
| Parent company to subsidiary | Operating revenues | 8,907,167 | The transacation has the same terms with other companies | 3 | |||||||
| ASE (Shanghai) Inc. | Parent company to subsidiary | Trade payables | 615,718 | - | |||||||
| Parent company to subsidiary | Operating costs | 2,033,164 | The transacation has the same terms with other companies | 1 | |||||||
| ASE (U.S.) Inc. | Parent company to subsidiary | Operating expenses | 817,169 | It is calculated by fixed ratio based on actual expenses. | - | ||||||
| There is an upper limit to the expenses. | |||||||||||
| ASE Electronics Inc. | Parent company to subsidiary | Trade payables | 605,628 | - | |||||||
| Parent company to subsidiary | Operating costs | 2,657,642 | The transacation has the same terms with other companies | 1 | |||||||
| ISE Labs, Inc. | Parent company to subsidiary | Operating revenues | 130,681 | The transacation has the same terms with other companies | - | ||||||
| J & R Holding Limited | Parent company to subsidiary | Other payables | 7,849,200 | 2 | |||||||
| Omniquest Industrial Limited | Parent company to subsidiary | Other payables | 1,424,250 | - | |||||||
| ASE Japan Co., Ltd | Parent company to subsidiary | Operating revenues | 172,358 | The transacation has the same terms with other companies | - | ||||||
| ASE Test Limited | Parent company to subsidiary | Other payables | 4,525,950 | 1 | |||||||
| J&R Industrial Inc. | Parent company to subsidiary | Other payables | 190,000 | - | |||||||
| ASE (Korea)Inc. | Parent company to subsidiary | Other payables | 1,582,734 | - | |||||||
| Huntington Holdings International | Parent company to subsidiary | Other payables | 1,740,750 | 1 | |||||||
| Co., Ltd. | |||||||||||
| USI Enterprise Limited | Parent company to subsidiary | Other payables | 4,431,000 | 1 | |||||||
| Real Tech Holdings Limited | Parent company to subsidiary | Other payables | 474,750 | - | |||||||
| A.S.E. Holding Limited | Parent company to subsidiary | Other payables | 2,088,900 | 1 | |||||||
| ASE Test, Inc. | Parent company to subsidiary | Purchase of property, plant | 365,888 | - | |||||||
| and equipment | |||||||||||
| 1 | ASE (Shanghai) Inc. | ASE Assembly & Test (Shanghai) Limited | Subsidiary to subsidiary | Trade receivables | 161,853 | - | |||||
| Subsidiary to subsidiary | Operating revenues | 672,369 | The transacation has the same terms with other companies | - | |||||||
| Advanced Semiconductor Engineering | Subsidiary to subsidiary | Trade receivables | 330,610 | - | |||||||
| (HK) Limited | Subsidiary to subsidiary | Operating revenues | 1,024,417 | The transacation has the same terms with other companies | - | ||||||
| ASE Module (Shanghai) Inc. | Subsidiary to subsidiary | Other payables | 535,275 | - | |||||||
| 2 | Shanghai Ding Hui Real Estate | Shanghai Ding Wei Real Estate | Subsidiary to subsidiary | Other receivables | 216,660 | - | |||||
| Development Co., Ltd. | Development Co., Ltd. | ||||||||||
| Kun Shan Ding Hong Real Estate | Subsidiary to subsidiary | Other receivables | 184,037 | - | |||||||
| Development Co., Ltd. | |||||||||||
| 3 | ASE Test Limited | ASE Singapore Pte. Ltd. | Subsidiary to subsidiary | Other assets | 443,100 | - | |||||
(Continued)
-103-
TABLE 10
ADVANCED SEMICONDUCTOR ENGINEERING, INC. AND SUBSIDIARIES
INTERCOMPANY RELATIONSHIPS AND SIGNIFICANT INTERCOMPANY TRANSACTIONS
FOR THE YEAR ENDED DECEMBER 31, 2014
(Amounts In Thousands of New Taiwan Dollars, Unless Specified Otherwise)
| Intercompany Transactions (Note) | |||||||||||
| Percentage of | |||||||||||
| Consolidated Net Revenue | |||||||||||
| No. | Company Name | Related Party | Nature of Relationships | Financial Statement Account | Amount (Note) | Terms | or Total Assets | ||||
| 4 | A.S.E. Holding Limited | J & R Holding Limited | Subsidiary to subsidiary | Other assets | $ | 194,320 | - | ||||
| ASE Test Limited | Subsidiary to subsidiary | Other liabilities | 1,594,551 | - | |||||||
| 5 | J & R Holding Limited | Global Advanced Packaging | Subsidiary to subsidiary | Other assets | 509,811 | - | |||||
| Technology Limited, Cayman | |||||||||||
| Islands | |||||||||||
| Omniquest Industrial Limited | Subsidiary to subsidiary | Other assets | 1,433,053 | - | |||||||
| Anstock Limited | Subsidiary to subsidiary | Other assets | 784,955 | - | |||||||
| ASE Test Limited | Subsidiary to subsidiary | Other liabilities | 1,404,553 | - | |||||||
| ISE Labs, Inc. | Subsidiary to subsidiary | Other liabilities | 949,621 | - | |||||||
| Subsidiary to subsidiary | Other payables | 253,241 | - | ||||||||
| Anstock II Limited | Subsidiary to subsidiary | Other liabilities | 9,400,050 | 3 | |||||||
| ASE Japan Co., Ltd. | Subsidiary to subsidiary | Other payables | 2,250,132 | 1 | |||||||
| ASE Assembly & Test (Shanghai) Limited | Subsidiary to subsidiary | Other receivables | 1,611,205 | - | |||||||
| ASE WeiHai Inc. | Subsidiary to subsidiary | Other receivables | 3,791,196 | 1 | |||||||
| Real Tech Holdings Limited | Subsidiary to subsidiary | Other payables | 1,267,192 | - | |||||||
| ASE (KunShan) Inc. | Subsidiary to subsidiary | Other receivables | 1,361,858 | - | |||||||
| 6 | ASE Electronics Inc. | J&R Industrial Inc. | Subsidiary to subsidiary | Other payables | 190,000 | - | |||||
| ASE Electronics (M) Sdn. Bhd. | Subsidiary to subsidiary | Operating revenues | 327,954 | The transacation has the same terms with other companies | - | ||||||
| ASE Assembly & Test (Shanghai) Limited | Subsidiary to subsidiary | Operating revenues | 151,797 | - | |||||||
| 7 | ASE Test, Inc. | ASE (Korea) Inc. | Subsidiary to subsidiary | Purchase of property, plant | 137,577 | - | |||||
| and equipment | |||||||||||
| ASE (U.S.) Inc. | Subsidiary to subsidiary | Operating expenses | 112,616 | It is calculated by fixed ratio based on actual expenses. | - | ||||||
| There is an upper limit to the expenses. | |||||||||||
| 8 | ASE (U.S.) Inc. | ASE (Korea) Inc. | Subsidiary to subsidiary | Operating revenues | 152,287 | The transacation has the same terms with other companies | - | ||||
| 9 | ASE Assembly & Test | Anstock Limited | Subsidiary to subsidiary | Other liabilities | 3,325,862 | 1 | |||||
| (Shanghai) Limited | |||||||||||
| 10 | USI | Universal Global Scientific Industrial | Subsidiary to subsidiary | Trade payables | 501,212 | - | |||||
| Co., Ltd. | |||||||||||
(Continued)
-104-
TABLE 10
ADVANCED SEMICONDUCTOR ENGINEERING, INC. AND SUBSIDIARIES
INTERCOMPANY RELATIONSHIPS AND SIGNIFICANT INTERCOMPANY TRANSACTIONS
FOR THE YEAR ENDED DECEMBER 31, 2014
(Amounts In Thousands of New Taiwan Dollars, Unless Specified Otherwise)
| Percentage of | |||||||||||
| Consolidated Net Revenue | |||||||||||
| No. | Company Name | Related Party | Nature of Relationships | Financial Statement Account | Amount (Note) | Terms | or Total Assets | ||||
| Subsidiary to subsidiary | Operating costs | 679,727 | - | ||||||||
| USI Enterprise Limited | Subsidiary to subsidiary | Other payables | 284,850 | - | |||||||
| 11 | Universal Scientific Industrial | Universal Global Technology Co., | Subsidiary to subsidiary | Operating costs | 4,455,899 | 2 | |||||
| (Shanghai) Co., Ltd. | Limited | Subsidiary to subsidiary | Trade payables | 734728 | - | ||||||
| Universal Global Industrial Co.,Ltd. | Subsidiary to subsidiary | Operating revenues | 142,899 | - | |||||||
| USI Electronics (Shenzhen) Co., Ltd. | Subsidiary to subsidiary | Operating revenues | 212,933 | - | |||||||
| 12 | Universal Global Industrial | USI Electronics (Shenzhen) Co., Ltd | Subsidiary to subsidiary | Operating revenues | 3,282,163 | 1 | |||||
| Co., Limited | Subsidiary to subsidiary | Operating costs | 11,723,368 | 5 | |||||||
| Subsidiary to subsidiary | Trade receivables | 764,406 | - | ||||||||
| Subsidiary to subsidiary | Other receivables | 147,856 | - | ||||||||
| Subsidiary to subsidiary | Trade payables | 2,812,432 | 1 | ||||||||
| Universal Global Scientific Industrial | Subsidiary to subsidiary | Operating revenues | 15,079,544 | 6 | |||||||
| Co., Ltd. | Subsidiary to subsidiary | Operating costs | 543,727 | - | |||||||
| Subsidiary to subsidiary | Trade receivables | 3,764,550 | 1 | ||||||||
| Universal Global Technology | Subsidiary to subsidiary | Operating revenues | 478,674 | - | |||||||
| (Kunshan) Co., Ltd. | Subsidiary to subsidiary | Operating costs | 6,874,346 | 3 | |||||||
| Subsidiary to subsidiary | Trade payables | 1,538,819 | - | ||||||||
| 13 | Universal Global Technology Co., | Universal Global Technology | Subsidiary to subsidiary | Operating revenues | 4,352,696 | 2 | |||||
| Limited | (Kunshan) Co., Ltd. | Subsidiary to subsidiary | Trade receivables | 1,507,785 | - | ||||||
| 14 | Universal Global Scientific Industrial | USI Electronics (Shenzhen) Co., Ltd | Subsidiary to subsidiary | Operating revenues | 149,256 | - | |||||
| Co., Ltd. | Universal Scientific Industrial | Subsidiary to subsidiary | Operating revenues | 210,566 | - | ||||||
| (Shanghai) Co., Ltd. | |||||||||||
| Universal Global Industrial Co., Limited | Subsidiary to subsidiary | Trade receivables | 225,875 | - | |||||||
| 15 | USI Electronics (Shenzhen) Co., Ltd | Universal Global Technology | Subsidiary to subsidiary | Other receivables | 984,079 | - | |||||
| (Shanghai) Co., Ltd. | |||||||||||
Note: Amount was eliminated based on the audited financial statements. (Concluded)
-105-
Appendix 3
Advanced Semiconductor Engineering, Inc.
2015 Consolidated Financial statements and Auditor Report
Advanced Semiconductor Engineering, Inc. and Subsidiaries
Consolidated Financial Statements for the
Years Ended December 31, 2015 and 2014 and
Independent Auditors’ Report
REPRESENTATION LETTER
The entities that are required to be included in the combined financial statements of Advanced Semiconductor Engineering, Inc. as of and for the year ended December 31, 2015, under the Criteria Governing the Preparation of Affiliation Reports, Consolidated Business Reports and Consolidated Financial Statements of Affiliated Enterprises are the same as those included in the consolidated financial statements prepared in conformity with the International Financial Reporting Standards No. 10, “Consolidated Financial Statements.” In addition, the information required to be disclosed in the combined financial statements is included in the consolidated financial statements. Consequently, Advanced Semiconductor Engineering, Inc. and Subsidiaries do not prepare a separate set of combined financial statements.
Very truly yours,
Advanced Semiconductor Engineering, Inc.
By
| JASON C.S. CHANG |
| Chairman |
| March 16, 2016 |
ADVANCED SEMICONDUCTOR ENGINEERING, INC. AND SUBSIDIARIES
CONSOLIDATED BALANCE SHEETS
(In Thousands of New Taiwan Dollars)
| ASSETS CURRENT ASSETS | December 31, 2015 | December 31, 2014 (Adjusted) | January 1, 2014 (Adjusted) | |||||||||||||||||||||
| NT$ | % | NT$ | % | NT$ | % | |||||||||||||||||||
| Cash and cash equivalents (Notes 4 and 6) | $ | 55,251,181 | 15 | $ | 51,694,410 | 16 | $ | 45,026,371 | 16 | |||||||||||||||
| Financial assets at fair value through profit or loss - current (Notes 4, 5 and 7) | 3,833,701 | 1 | 4,988,843 | 2 | 2,764,269 | 1 | ||||||||||||||||||
| Available-for-sale financial assets - current (Notes 4 and 8) | 30,344 | — | 1,533,265 | — | 2,376,970 | 1 | ||||||||||||||||||
| Trade receivables, net (Notes 4 and 9) | 44,931,487 | 13 | 52,920,810 | 16 | 43,235,573 | 15 | ||||||||||||||||||
| Other receivables (Note 4) | 429,541 | — | 537,122 | — | 422,345 | — | ||||||||||||||||||
| Current tax assets (Note 4) | 168,717 | — | 65,312 | — | 150,596 | — | ||||||||||||||||||
| Inventories (Notes 4, 5 and 10) | 23,258,279 | 6 | 20,163,093 | 6 | 16,281,236 | 6 | ||||||||||||||||||
| Inventories related to real estate business (Notes 4, 5, 11, 22 and 32) | 25,713,538 | 7 | 23,986,478 | 7 | 18,589,255 | 6 | ||||||||||||||||||
| Other financial assets - current (Notes 4 and 32) | 301,999 | — | 638,592 | — | 278,375 | — | ||||||||||||||||||
| Other current assets | 2,814,053 | 1 | 3,427,265 | 1 | 3,051,492 | 1 | ||||||||||||||||||
| Total current assets | 156,732,840 | 43 | 159,955,190 | 48 | 132,176,482 | 46 | ||||||||||||||||||
| NON-CURRENT ASSETS | ||||||||||||||||||||||||
| Available-for-sale financial assets - non-current (Notes 4 and 8) | 924,362 | — | 941,105 | — | 1,140,329 | — | ||||||||||||||||||
| Investments accounted for using the equity method (Notes 4 and 12) | 37,422,909 | 10 | 1,492,441 | 1 | 1,216,201 | 1 | ||||||||||||||||||
| Property, plant and equipment (Notes 4, 5, 13, 22, 31 and 33) | 149,997,075 | 41 | 151,587,115 | 45 | 131,497,331 | 46 | ||||||||||||||||||
| Goodwill (Notes 4, 5 and 14) | 10,506,519 | 3 | 10,445,415 | 3 | 10,347,820 | 4 | ||||||||||||||||||
| Other intangible assets (Notes 4, 5, 15 and 22) | 1,382,093 | — | 1,467,871 | 1 | 1,605,824 | 1 | ||||||||||||||||||
| Deferred tax assets (Notes 4 , 5 and 23) | 5,156,515 | 2 | 4,506,971 | 1 | 3,783,265 | 1 | ||||||||||||||||||
| Other financial assets - non-current (Notes 4 and 32) | 345,672 | — | 367,345 | — | 354,993 | — | ||||||||||||||||||
| Long-term prepayments for lease (Note 16) | 2,556,156 | 1 | 2,585,964 | 1 | 4,072,281 | 1 | ||||||||||||||||||
| Other non-current assets | 263,416 | — | 635,350 | — | 637,163 | — | ||||||||||||||||||
| Total non-current assets | 208,554,717 | 57 | 174,029,577 | 52 | 154,655,207 | 54 | ||||||||||||||||||
| TOTAL | $ | 365,287,557 | 100 | $ | 333,984,767 | 100 | $ | 286,831,689 | 100 | |||||||||||||||
(Continued)
| - 3 - |
ADVANCED SEMICONDUCTOR ENGINEERING, INC. AND SUBSIDIARIES
CONSOLIDATED BALANCE SHEETS
(In Thousands of New Taiwan Dollars)
| December 31, 2015 | December 31, 2014 (Adjusted) | January 1, 2014 (Adjusted) | ||||||||||||||||||||||
| LIABILITIES AND EQUITY | NT$ | % | NT$ | % | NT$ | % | ||||||||||||||||||
| CURRENT LIABILITIES | ||||||||||||||||||||||||
| Short-term borrowings (Note 17) | $ | 32,635,321 | 9 | $ | 41,176,033 | 12 | $ | 44,618,195 | 16 | |||||||||||||||
| Commercial papers and bank acceptances payable (Note 17) | 4,348,054 | 1 | — | — | — | — | ||||||||||||||||||
| Financial liabilities at fair value through profit or loss - current (Notes 4, 5 and 7) | 3,005,726 | 1 | 2,651,352 | 1 | 1,853,304 | 1 | ||||||||||||||||||
| Derivative financial liabilities for hedging - current (Notes 4 and 5) | — | — | — | — | 3,310 | — | ||||||||||||||||||
| Trade payables | 34,138,564 | 9 | 35,411,281 | 11 | 28,988,976 | 10 | ||||||||||||||||||
| Other payables (Note 19) | 19,194,818 | 5 | 22,364,516 | 7 | 14,758,553 | 5 | ||||||||||||||||||
| Current tax liabilities (Note 4) | 4,551,785 | 1 | 4,150,036 | 1 | 3,000,869 | 1 | ||||||||||||||||||
| Advance real estate receipts (Note 4) | 2,703,706 | 1 | 480,325 | — | 19,248 | — | ||||||||||||||||||
| Current portion of bonds payable (Notes 4 and 18) | 14,685,866 | 4 | — | — | 731,438 | — | ||||||||||||||||||
| Current portion of long-term borrowings (Notes 17 and 32) | 2,057,465 | 1 | 2,831,007 | 1 | 5,276,206 | 2 | ||||||||||||||||||
| Other current liabilities | 3,180,767 | 1 | 2,134,917 | 1 | 1,585,177 | — | ||||||||||||||||||
| Total current liabilities | 120,502,072 | 33 | 111,199,467 | 34 | 100,835,276 | 35 | ||||||||||||||||||
| NON-CURRENT LIABILITIES | ||||||||||||||||||||||||
| Bonds payable (Notes 4 and 18) | 23,740,384 | 7 | 31,270,131 | 10 | 20,582,567 | 7 | ||||||||||||||||||
| Long-term borrowings (Notes 17 and 32) | 42,493,668 | 12 | 24,104,424 | 7 | 29,580,659 | 11 | ||||||||||||||||||
| Deferred tax liabilities (Notes 4, 5 and 23) | 4,987,549 | 1 | 3,932,819 | 1 | 2,663,767 | 1 | ||||||||||||||||||
| Long-term payables | — | — | — | — | 894,150 | — | ||||||||||||||||||
| Net defined benefit liabilities (Notes 3, 4, 5 and 20) | 4,072,493 | 1 | 4,382,530 | 1 | 4,545,960 | 2 | ||||||||||||||||||
| Other non-current liabilities | 1,071,509 | — | 657,392 | — | 651,171 | — | ||||||||||||||||||
| Total non-current liabilities | 76,365,603 | 21 | 64,347,296 | 19 | 58,918,274 | 21 | ||||||||||||||||||
| Total liabilities | 196,867,675 | 54 | 175,546,763 | 53 | 159,753,550 | 56 | ||||||||||||||||||
| EQUITY ATTRIBUTABLE TO OWNERS OF THE COMPANY (Notes 4 and 21) | ||||||||||||||||||||||||
| Share capital | ||||||||||||||||||||||||
| Ordinary shares | 79,029,290 | 22 | 78,525,378 | 24 | 77,560,040 | 27 | ||||||||||||||||||
| Shares subscribed in advance | 156,370 | — | 189,801 | — | 620,218 | — | ||||||||||||||||||
| Total share capital | 79,185,660 | 22 | 78,715,179 | 24 | 78,180,258 | 27 | ||||||||||||||||||
| Capital surplus | 23,757,099 | 7 | 16,013,058 | 5 | 7,920,220 | 3 | ||||||||||||||||||
| Retained earnings | ||||||||||||||||||||||||
| Legal reserve | 12,649,145 | 3 | 10,289,878 | 3 | 8,720,971 | 3 | ||||||||||||||||||
| Special reserve | 3,353,938 | 1 | 3,353,938 | 1 | 3,663,930 | 2 | ||||||||||||||||||
| Unappropriated earnings | 40,180,986 | 11 | 38,737,422 | 12 | 26,521,201 | 9 | ||||||||||||||||||
| Total retained earnings | 56,184,069 | 15 | 52,381,238 | 16 | 38,906,102 | 14 | ||||||||||||||||||
| Other Equity | 5,081,689 | 1 | 5,068,539 | 1 | (102,616 | ) | — | |||||||||||||||||
| Treasury shares | (7,292,513 | ) | (2 | ) | (1,959,107 | ) | (1 | (1,959,107 | ) | (1 | ) | |||||||||||||
| Equity attributable to owners of the Company | 156,916,004 | 43 | 150,218,907 | 45 | 122,944,857 | 43 | ||||||||||||||||||
| NON-CONTROLLING INTERESTS (Notes 4 and 21) | 11,503,878 | 3 | 8,219,097 | 2 | 4,133,282 | 1 | ||||||||||||||||||
| Total equity | 168,419,882 | 46 | 158,438,004 | 47 | 127,078,139 | 44 | ||||||||||||||||||
| TOTAL | $ | 365,287,557 | 100 | $ | 333,984,767 | 100 | $ | 286,831,689 | 100 | |||||||||||||||
The accompanying notes are an integral part of the consolidated financial statements. (With Deloitte & Touche audit report dated March 16, 2016) | (Concluded) |
| - 4 - |
ADVANCED SEMICONDUCTOR ENGINEERING, INC. AND SUBSIDIARIES
CONSOLIDATED STATEMENTS OF COMPREHENSIVE INCOME
(In Thousands of New Taiwan Dollars Except Earnings Per Share)
| For the Years Ended December 31 | ||||||||||||||||
| 2015 | 2014 (Adjusted) | |||||||||||||||
| NT$ | % | NT$ | % | |||||||||||||
| OPERATING REVENUES (Note 4) | $ | 283,302,536 | 100 | $ | 256,591,447 | 100 | ||||||||||
| OPERATING COSTS (Notes 10, 20 and 22) | 233,167,308 | 82 | 203,002,918 | 79 | ||||||||||||
| GROSS PROFIT | 50,135,228 | 18 | 53,588,529 | 21 | ||||||||||||
| OPERATING EXPENSES (Notes 20 and 22) | ||||||||||||||||
| Selling and marketing expenses | 3,588,472 | 1 | 3,438,166 | 2 | ||||||||||||
| General and administrative expenses | 10,724,568 | 4 | 10,214,810 | 4 | ||||||||||||
| Research and development expenses | 10,937,566 | 4 | 10,289,684 | 4 | ||||||||||||
| Total operating expenses | 25,250,606 | 9 | 23,942,660 | 10 | ||||||||||||
| PROFIT FROM OPERATIONS | 24,884,622 | 9 | 29,645,869 | 11 | ||||||||||||
| NON-OPERATING INCOME AND EXPENSES | ||||||||||||||||
| Other income (Note 22) | 876,008 | — | 588,875 | — | ||||||||||||
| Other gains, net (Note 22) | 1,437,036 | 1 | 776,290 | 1 | ||||||||||||
| Finance costs (Note 22) | (2,312,143 | ) | (1 | ) | (2,354,097 | ) | (1 | ) | ||||||||
| Share of the profit or loss of associates and joint ventures (Note 4) | 402,730 | — | (108,726 | ) | — | |||||||||||
| Total non-operating income and expenses | 403,631 | — | (1,097,658 | ) | — | |||||||||||
| PROFIT BEFORE INCOME TAX EXPENSE | 25,288,253 | 9 | 28,548,211 | 11 | ||||||||||||
| INCOME TAX EXPENSE (Notes 4, 5 and 23) | 4,839,246 | 2 | 4,266,626 | 2 | ||||||||||||
| NET PROFIT FOR THE YEAR | 20,449,007 | 7 | 24,281,585 | 9 | ||||||||||||
| OTHER COMPREHENSIVE INCOME (LOSS) | ||||||||||||||||
| Items that will not be reclassified subsequently to profit or loss: | ||||||||||||||||
| Remeasurement of defined benefit obligation | (62,911 | ) | — | (28,145 | ) | — | ||||||||||
| Share of other comprehensive loss of associates and joint ventures | (37,748 | ) | — | (1,031 | ) | — | ||||||||||
| Income tax relating to items that will not be reclassified subsequently | 11,002 | 22,938 | — | |||||||||||||
| (89,657 | ) | — | (6,238 | ) | — | |||||||||||
(Continued)
| - 5 - |
ADVANCED SEMICONDUCTOR ENGINEERING, INC. AND SUBSIDIARIES
CONSOLIDATED STATEMENTS OF COMPREHENSIVE INCOME
(In Thousands of New Taiwan Dollars Except Earnings Per Share)
| For the Years Ended December 31 | ||||||||||||||||
| 2015 | 2014 (Adjusted) | |||||||||||||||
| NT$ | % | NT$ | % | |||||||||||||
| Items that may be reclassified subsequently to profit or loss: | ||||||||||||||||
| Exchange differences on translating foreign operations | $ | (63,509 | ) | — | $ | 5,405,027 | 2 | |||||||||
| Unrealized gain (loss) on available-for-sale financial assets | 10,451 | — | (133,714 | ) | — | |||||||||||
| Cash flow hedges | — | — | 3,279 | — | ||||||||||||
| Share of other comprehensive income (loss) of associates and joint ventures | (4,832 | ) | — | 235,156 | — | |||||||||||
| (57,890 | ) | — | 5,509,748 | 2 | ||||||||||||
| Other comprehensive income (loss) for the year, net of income tax | (147,547 | ) | — | 5,503,510 | 2 | |||||||||||
| TOTAL COMPREHENSIVE INCOME FOR THE YEAR | $ | 20,301,460 | 7 | $ | 29,785,095 | 11 | ||||||||||
| NET PROFIT ATTRIBUTABLE TO: | ||||||||||||||||
| Owners of the Company | $ | 19,478,873 | 7 | $ | 23,636,522 | 9 | ||||||||||
| Non-controlling interests | 970,134 | — | 645,063 | — | ||||||||||||
| $ | 20,449,007 | 7 | $ | 24,281,585 | 9 | |||||||||||
| TOTAL COMPREHENSIVE INCOME ATTRIBUTABLE TO: | ||||||||||||||||
| Owners of the Company | $ | 19,405,806 | 7 | $ | 28,802,296 | 11 | ||||||||||
| Non-controlling interests | 895,654 | — | 982,799 | — | ||||||||||||
| $ | 20,301,460 | 7 | $ | 29,785,095 | 11 | |||||||||||
| EARNINGS PER SHARE (Note 24) | ||||||||||||||||
| Basic | $ | 2.55 | $ | 3.07 | ||||||||||||
| Diluted | $ | 2.44 | $ | 2.96 | ||||||||||||
The accompanying notes are an integral part of the consolidated financial statements. (With Deloitte & Touche audit report dated March 16, 2016)
| (Concluded) |
| - 6 - |
ADVANCED SEMICONDUCTOR ENGINEERING, INC. AND SUBSIDIARIES
CONSOLIDATED STATEMENTS OF CHANGES IN EQUITY
(In Thousands of New Taiwan Dollars)
| Equity Attributable to Owners of the Company | ||||||||||||||||||||||||||||||||||||||||||||||||||||||||||||
| Accumulated Other Comprehensive Income | ||||||||||||||||||||||||||||||||||||||||||||||||||||||||||||
| Share Capital | Retained Earnings | Exchange | Unrealized | |||||||||||||||||||||||||||||||||||||||||||||||||||||||||
| Shares (In Thousands) | Amounts | Capital Surplus | Legal Reserve | Special Reserve | Unappropriated Earnings | Total | Differences on Translating Foreign Operations | Gain on Available- for-sale Financial Assets | Cash Flow Hedges | Total | Treasury Shares | Total | Non-controlling Interests | Total Equity | ||||||||||||||||||||||||||||||||||||||||||||||
| BALANCE AT JANUARY 1, 2014 | 7,787,827 | $ | 78,180,258 | $ | 7,908,870 | $ | 8,720,971 | $ | 3,663,930 | $ | 26,608,253 | $ | 38,993,154 | $ | (525,521 | ) | $ | 426,246 | $ | (3,279 | ) | $ | (102,554 | ) | $ | (1,959,107 | ) | $ | 123,020,621 | $ | 4,144,338 | $ | 27,164,959 | |||||||||||||||||||||||||||
| Effect of retrospective application | — | — | 11,350 | — | — | (87,052 | ) | (87,052 | ) | (62 | ) | — | — | (62 | ) | — | (75,764 | ) | (11,056 | ) | (86,820 | ) | ||||||||||||||||||||||||||||||||||||||
| ADJUSTED BALANCE AT JANUARY 1, 2014 | 7,787,827 | 78,180,258 | 7,920,220 | 8,720,971 | 3,663,930 | 26,521,201 | 38,906,102 | (525,583 | ) | 426,246 | (3,279 | ) | (102,616 | ) | (1,959,107 | ) | 122,944,857 | 4,133,282 | 127,078,139 | |||||||||||||||||||||||||||||||||||||||||
| Change in capital surplus from investments in associates accounted for using the equity method | — | — | 26,884 | — | — | — | — | — | — | — | — | — | 26,884 | — | 26,884 | |||||||||||||||||||||||||||||||||||||||||||||
| Profit for the year ended December 31, 2014 (After Adjusted) | — | — | — | — | — | 23,636,522 | 23,636,522 | — | — | — | — | — | 23,636,522 | 645,063 | 24,281,585 | |||||||||||||||||||||||||||||||||||||||||||||
| Other comprehensive income (loss) for the year ended | ||||||||||||||||||||||||||||||||||||||||||||||||||||||||||||
| December 31, 2014, net of income tax (After Adjusted) | — | — | — | — | — | (5,381 | ) | (5,381 | ) | 5,067,344 | 100,532 | 3,279 | 5,171,155 | — | 5,165,774 | 337,736 | 5,503,510 | |||||||||||||||||||||||||||||||||||||||||||
| Total comprehensive income for the year ended December 31, 2014 (After Adjusted) | — | — | — | — | — | 23,631,141 | 23,631,141 | 5,067,344 | 100,532 | 3,279 | 5,171,155 | — | 28,802,296 | 982,799 | 29,785,095 | |||||||||||||||||||||||||||||||||||||||||||||
| Appropriation of 2013 earnings | ||||||||||||||||||||||||||||||||||||||||||||||||||||||||||||
| Legal reserve | — | — | — | 1,568,907 | — | (1,568,907 | ) | — | — | — | — | — | — | — | — | — | ||||||||||||||||||||||||||||||||||||||||||||
| Special reserve | — | — | — | — | (309,992 | ) | 309,992 | — | — | — | — | — | — | — | — | — | ||||||||||||||||||||||||||||||||||||||||||||
| Cash dividends distributed by the Company | — | — | — | — | — | (10,156,005 | ) | (10,156,005 | ) | — | — | — | — | — | (10,156,005 | ) | — | (10,156,005 | ) | |||||||||||||||||||||||||||||||||||||||||
| — | — | — | 1,568,907 | (309,992 | ) | (11,414,920 | ) | (10,156,005 | ) | — | — | — | — | — | (10,156,005 | ) | — | (10,156,005 | ) | |||||||||||||||||||||||||||||||||||||||||
| Issue of dividends received by subsidiaries from the Company | — | — | 188,790 | — | — | — | — | — | — | — | — | — | 188,790 | — | 188,790 | |||||||||||||||||||||||||||||||||||||||||||||
| Partial disposal of interests in subsidiaries and additional acquisition of majority-owned subsidiaries (Notes 26) | — | — | 6,877,099 | — | — | — | — | — | — | — | — | — | 6,877,099 | 3,068,406 | 9,945,505 | |||||||||||||||||||||||||||||||||||||||||||||
| Issue of ordinary shares under employee share options | 73,898 | 534,921 | 1,000,065 | — | — | — | — | — | — | — | — | — | 1,534,986 | — | 1,534,986 | |||||||||||||||||||||||||||||||||||||||||||||
| Cash dividends distributed by subsidiaries | — | — | — | — | — | — | — | — | — | — | — | — | — | (85,766 | ) | (85,766 | ) | |||||||||||||||||||||||||||||||||||||||||||
| Additional non-controlling interest arising on issue of employee share options by subsidiaries | — | — | — | — | — | — | — | — | — | — | — | — | — | 120,376 | 120,376 | |||||||||||||||||||||||||||||||||||||||||||||
| ADJUSTED BALANCE AT DECEMBER 31, 2014 | $ | 7,861,725 | $ | 78,715,179 | $ | 16,013,058 | $ | 10,289,878 | $ | 3,353,938 | $ | 38,737,422 | $ | 52,381,238 | $ | 4,541,761 | $ | 526,778 | $ | — | $ | 5,068,539 | $ | (1,959,107 | ) | $ | 150,218,907 | $ | 8,219,097 | $ | 158,438,004 | |||||||||||||||||||||||||||||
| Equity component of convertible bonds issued by the Company (Note 18) | — | — | 214,022 | — | — | — | — | — | — | — | — | — | 214,022 | — | 214,022 | |||||||||||||||||||||||||||||||||||||||||||||
| Change in capital surplus from investments in associates and joint ventures accounted for using the equity method | — | — | 150 | — | — | — | — | — | — | — | — | — | 150 | — | 150 | |||||||||||||||||||||||||||||||||||||||||||||
| Profit for the year ended December 31, 2015 | — | — | — | — | — | 19,478,873 | 19,478,873 | — | — | — | — | — | 19,478,873 | 970,134 | 20,449,007 | |||||||||||||||||||||||||||||||||||||||||||||
| Other comprehensive income (loss) for the year ended December 31, 2015, net of income tax | — | — | — | — | — | (86,217 | ) | (86,217 | ) | (48,191 | ) | 61,341 | — | 13,150 | — | (73,067 | ) | (74,480 | ) | (147,547 | ) | |||||||||||||||||||||||||||||||||||||||
| Total comprehensive income (loss) for the year ended December 31, 2015 | — | — | — | — | — | 19,392,656 | 19,392,656 | (48,191 | ) | 61,341 | — | 13,150 | — | 19,405,806 | 895,654 | 20,301,460 | ||||||||||||||||||||||||||||||||||||||||||||
| Appropriation of 2014 earnings | ||||||||||||||||||||||||||||||||||||||||||||||||||||||||||||
| Legal reserve | — | — | — | 2,359,267 | — | (2,359,267 | ) | — | — | — | — | — | — | — | — | — | ||||||||||||||||||||||||||||||||||||||||||||
| Cash dividends distributed by the Company | — | — | — | — | — | (15,589,825 | ) | (15,589,825 | ) | — | — | — | — | — | (15,589,825 | ) | — | (15,589,825 | ) | |||||||||||||||||||||||||||||||||||||||||
| — | — | — | 2,359,267 | — | (17,949,092 | ) | (15,589,825 | ) | — | — | — | — | — | (15,589,825 | ) | — | (15,589,825 | ) | ||||||||||||||||||||||||||||||||||||||||||
| Acquisition of treasury shares | — | — | — | — | — | — | — | — | — | — | — | (5,333,406 | ) | (5,333,406 | ) | — | (5,333,406 | ) | ||||||||||||||||||||||||||||||||||||||||||
(Continued)
| - 7 - |
ADVANCED SEMICONDUCTOR ENGINEERING, INC. AND SUBSIDIARIES
CONSOLIDATED STATEMENTS OF CHANGES IN EQUITY
(In Thousands of New Taiwan Dollars)
| Equity Attributable to Owners of the Company | ||||||||||||||||||||||||||||||||||||||||||||||||||||||||||||
| Share Capital | Capital Surplus | Retained Earnings | Accumulated Other Comprehensive Income | Treasury Shares | Total | Non-controlling Interests | Total Equity | |||||||||||||||||||||||||||||||||||||||||||||||||||||
| Exchange Differences on Translating Foreign Operations | Unrealized Gain on Available-for-sale Financial Assets | Cash Flow Hedges | Total | |||||||||||||||||||||||||||||||||||||||||||||||||||||||||
| Shares (In Thousands) | Amounts | Legal Reserve | Special Reserve | Unappropriated Earnings | Total | |||||||||||||||||||||||||||||||||||||||||||||||||||||||
| Issue of dividends received by subsidiaries from the Company | - | $ | - | $ | 292,351 | $ | - | $ | - | $ | - | $ | - | $ | - | $ | - | $ | - | $ | - | $ | - | $ | 292,351 | $ | - | $ | 292,351 | |||||||||||||||||||||||||||||||
| Partial disposal of interests in subsidiaries and additional acquisition of majority-owned subsidiaries (Notes 26) | - | - | 7,197,510 | - | - | - | - | - | - | - | - | - | 7,197,510 | 1,712,836 | 8,910,346 | |||||||||||||||||||||||||||||||||||||||||||||
| Changes in percentage of ownership interest in subsidiaries | - | - | (564,344 | ) | - | - | - | - | - | - | - | - | - | (564,344 | ) | 564,344 | - | |||||||||||||||||||||||||||||||||||||||||||
| Issue of ordinary shares under employee share options | 48,703 | 470,481 | 604,352 | - | - | - | - | - | - | - | - | - | 1,074,833 | - | 1,074,833 | |||||||||||||||||||||||||||||||||||||||||||||
| Cash dividends distributed by subsidiaries | - | - | - | - | - | - | - | - | - | - | - | - | - | (232,148 | ) | (232,148 | ) | |||||||||||||||||||||||||||||||||||||||||||
| Additional non-controlling interest arising on issue of employee share options by subsidiaries | - | - | - | - | - | - | - | - | - | - | - | - | - | 344,095 | 344,095 | |||||||||||||||||||||||||||||||||||||||||||||
| ADJUSTED BALANCE AT DECEMBER 31, 2015 | $ | 7,910,428 | $ | 79,185,660 | $ | 23,757,093 | $ | 12,649,145 | $ | 3,353,938 | $ | 40,180,986 | $ | 56,184,069 | $ | 4,493,570 | $ | 588,119 | $ | - | $ | 5,081,689 | $ | (7,292,513 | ) | $ | 156,916,004 | $ | 11,503,878 | $ | 168,419,88 | |||||||||||||||||||||||||||||
The accompanying notes are an integral part of the consolidated financial statements. (With Deloitte & Touche audit report dated March 16, 2016) | (Concluded) |
| - 8 - |
ADVANCED SEMICONDUCTOR ENGINEERING, INC. AND SUBSIDIARIES
CONSOLIDATED STATEMENTS OF CASH FLOWS
(In Thousands of New Taiwan Dollars)
For the Years Ended December 31 | ||||||||
2015 | 2014 | |||||||
| NT$ | NT$ | |||||||
| CASH FLOWS FROM OPERATING ACTIVITIES | ||||||||
| Profit before income tax | $ | 25,288,253 | $ | 28,548,211 | ||||
| Adjustments for: | ||||||||
| Depreciation expense | 28,938,770 | 25,805,042 | ||||||
| Amortization expense | 579,894 | 545,734 | ||||||
| Net gain on fair value change of financial assets and liabilities at fair value through profit or loss | (2,472,835 | ) | (1,838,840 | ) | ||||
| Interest expense | 2,268,786 | 2,324,426 | ||||||
| Interest income | (242,084 | ) | (243,474 | ) | ||||
| Dividend income | (396,973 | ) | (101,252 | ) | ||||
| Compensation cost of employee share options | 133,496 | 110,157 | ||||||
| Share of the profit or loss of associates and joint ventures | (402,730 | 108,726 | ||||||
| Impairment loss recognized on financial assets | 8,232 | 28,421 | ||||||
| Impairment loss recognized on non-financial assets | 610,140 | 899,480 | ||||||
| Net loss on foreign currency exchange | 1,358,777 | 1,404,234 | ||||||
| Others | 1,411,599 | 313,138 | ||||||
| Changes in operating assets and liabilities | ||||||||
| Financial assets held for trading | 4,162,522 | 823,313 | ||||||
| Trade receivables | 7,982,736 | (9,703,070 | ) | |||||
| Other receivables | 55,112 | (8,625 | ) | |||||
| Inventories | (5,128,726 | ) | (8,208,824 | ) | ||||
| Other current assets | 407,017 | 102,353 | ||||||
| Financial liabilities held for trading | (1,725,606 | ) | (835,779 | ) | ||||
| Trade payables | (1,272,717 | ) | 6,422,305 | |||||
| Other payables | (814,809 | ) | 3,045,452 | |||||
| Other current liabilities | 2,545,312 | 703,764 | ||||||
| Other operating activities items | (247,024 | ) | (186,455 | ) | ||||
| 63,047,142 | 50,058,437 | |||||||
| Interest received | 253,289 | 233,457 | ||||||
| Dividend received | 499,918 | 101,252 | ||||||
| Interest paid | (2,067,955 | ) | (2,065,244 | ) | ||||
| Income tax paid | (4,184,089 | ) | (2,463,153 | ) | ||||
| Net cash generated from operating activities | 57,548,305 | 45,864,749 | ||||||
| CASH FLOWS FROM INVESTING ACTIVITIES | ||||||||
| Purchase of financial assets designated as at fair value through profit or loss | (100,842,813 | ) | (108,958,658 | ) | ||||
| Proceeds on sale of financial assets designated as at fair value through profit or loss | 102,139,161 | 109,825,159 | ||||||
| Purchase of available-for-sale financial assets | (1,273,510 | ) | (3,565,428 | ) | ||||
| Proceeds on sale of available-for-sale financial assets | 2,761,145 | 4,388,130 | ||||||
(Continued)
| - 9 - |
ADVANCED SEMICONDUCTOR ENGINEERING, INC. AND SUBSIDIARIES
CONDENSED CONSOLIDATED STATEMENTS OF CASH FLOWS
(In Thousands of New Taiwan Dollars)
For the Years Ended December 31 | ||||||||
2015 | 2014 | |||||||
NTS | NTS | |||||||
| Cash received from return of capital by available-for-sale financial assets | $ | 44,511 | $ | 20,411 | ||||
| Acquisition of associates and joint ventures | (35,673,097 | ) | (100,000 | ) | ||||
| Payments for property, plant and equipment | (30,280,124 | ) | (39,598,964 | ) | ||||
| Proceeds from disposal of property, plant and equipment | 243,031 | 421,207 | ||||||
| Payments for intangible assets | (491,135 | ) | (396,466 | ) | ||||
| Decrease (increase) in other financial assets | 358,266 | (372,569 | ) | |||||
| Increase in other non-current assets | (336,864 | ) | (480,711 | ) | ||||
| Net cash used in investing activities | (63,351,429 | ) | (38,817,889 | ) | ||||
| CASH FLOWS FROM FINANCING ACTIVITIES | ||||||||
| Net repayment of short-term borrowings | (8,532,792 | ) | (3,442,162 | ) | ||||
| Proceeds from commercial papers and bank acceptances payable | 4,348,054 | — | ||||||
| Proceeds from issue of bonds | 6,136,425 | 8,888,562 | ||||||
| Repayment of bonds payable | — | (729,790 | ) | |||||
| Proceeds from long-term borrowings | 39,887,570 | 32,030,868 | ||||||
| Repayment of long-term borrowings | (22,926,660 | ) | (40,978,403 | ) | ||||
| Dividends paid | (15,297,474 | ) | (9,967,215 | ) | ||||
| Proceeds from exercise of employee share options | 1,285,102 | 1,498,343 | ||||||
| Payments for acquisition of treasury shares | (5,333,406 | ) | — | |||||
| Proceeds from partial disposal of interests in subsidiaries | 8,910,346 | 9,991,439 | ||||||
| Dividends paid to non-controlling interest | (232,148 | ) | (85,766 | ) | ||||
| Other financing activities items | 391,322 | (2,879 | ) | |||||
| Net cash generated from (used in) financing activities | 8,636,339 | (2,797,003 | ) | |||||
| EFFECTS OF EXCHANGE RATE CHANGES ON THE BALANCE OF CASH AND CASH EQUIVALENTS | 723,556 | 2,418,182 | ||||||
| NET INCREASE IN CASH AND CASH EQUIVALENTS | 3,556,771 | 6,668,039 | ||||||
| CASH AND CASH EQUIVALENTS AT THE BEGINNING OF THE YEAR | 51,694,410 | 45,026,371 | ||||||
| CASH AND CASH EQUIVALENTS AT THE END OF THE YEAR | $ | 55,251,181 | $ | 51,694,410 | ||||
The accompanying notes are an integral part of the consolidated financial statements. (With Deloitte & Touche audit report dated March 16, 2016) | (Concluded) |
| - 10 - |
ADVANCED SEMICONDUCTOR ENGINEERING, INC. AND SUBSIDIARIES
NOTES TO CONSOLIDATED FINANCIAL STATEMENTS
(Amounts in Thousands, Unless Stated Otherwise)
| 1. | GENERAL INFORMATION |
Advanced Semiconductor Engineering, Inc. (the “Company”), a corporation incorporated in Nantze Export Processing Zone under the laws of Republic of China (the “ROC”). In August 2004, the Company merged its subsidiaries, ASE (Chung Li) Inc. and ASE Material Inc., and established Chung-Li Branch. In August 2006, the Company spun-off and assigned its substrate production business to ASE Electronics Inc. In January 2011, the Company established Nan-Tou Branch. In May 2012, the Company merged its subsidiary, PowerASE Technology, Inc. In August 2013, the Company merged its subsidiary, Yang Ting Tech Co., Ltd. The Company and its subsidiaries (collectively referred to as the “Group”) offer a comprehensive range of semiconductors packaging, testing, and electronic manufacturing services (“EMS”).
Since July 1989, the Company’s ordinary shares have been listed on the Taiwan Stock Exchange (the “TSE”) under the symbol “2311”. Since September 2000, the Company’s ordinary shares of the Company have been traded on the New York Stock Exchange (the “NYSE”) under the symbol “ASX” in the form of American Depositary Shares (“ADS”). The ordinary shares of its subsidiary, Universal Scientific Industrial (Shanghai) Co., Ltd. (the “USISH”), have been listed on the Shanghai Stock Exchange (the “SSE”) under the symbol “601231” since February 2012.
The consolidated financial statements are presented in the Company’s functional currency, New Taiwan dollar (NT$).
| 2. | APPROVAL OF FINANCIAL STATEMENTS |
The consolidated financial statements were approved for issue by board of directors on March 16, 2016.
| 3. | APPLICATION OF NEW AND REVISED STANDARDS, AMENDMENTS AND INTERPRETATIONS |
| a. | Initial application of the amendments to the Regulations Governing the Preparation of Financial Reports by Securities Issuers and the 2013 version of the International Financial Reporting Standards (IFRS), International Accounting Standards (IAS), Interpretations of IFRS (IFRIC), and Interpretations of IAS (SIC) endorsed by the FSC |
Rule No. 1030029342 and Rule No. 1030010325 issued by the FSC on April 3, 2014, stipulated that the Group should apply the 2013 version of IFRS, IAS, IFRIC and SIC (collectively, the “IFRSs”) endorsed by the FSC and the related amendments to the Regulations Governing the Preparation of Financial Reports by Securities Issuers starting January 1, 2015.
Except for the following, whenever applied, the initial application of the amendments to the Regulations Governing the Preparation of Financial Reports by Securities Issuers and the 2013 version of IFRSs would not have any material impact on the Group’s accounting policies:
| - 11 - |
| 1) | IFRS 12 “Disclosure of Interests in Other Entities” |
IFRS 12 is a new disclosure standard and is applicable to entities that have interests in subsidiaries, joint arrangements, associates and/or unconsolidated structured entities. In general, the disclosure requirements in IFRS 12 are more extensive than in the current standards.
| 2) | IFRS 13 “Fair Value Measurement” |
IFRS 13 establishes a single source of guidance for fair value measurements. It defines fair value, establishes a framework for measuring fair value, and requires disclosures about fair value measurements. The disclosure requirements in IFRS 13 are more extensive, for example, quantitative and qualitative disclosures based on the three-level fair value hierarchy currently required for financial instruments only will be extended by IFRS 13 to cover all assets and liabilities within its scope.
The fair value measurements under IFRS 13 will be applied prospectively from January 1, 2015. Refer to Note 30 for related disclosures.
| 3) | Amendments to IAS 1 “Presentation of Items of Other Comprehensive Income” |
The amendments to IAS 1 requires items of other comprehensive income to be grouped into those items that (1) will not be reclassified subsequently to profit or loss; and (2) may be reclassified subsequently to profit or loss. Income taxes on related items of other comprehensive income are grouped on the same basis. Under current IAS 1, there were no such requirements.
The Group retrospectively applied the above amendments starting in 2015. Items that will not be reclassified subsequently to profit or loss are remeasurements of the defined benefit plans and share of remeasurements of the defined benefit plans of associates accounted for using the equity method. Items that may be reclassified to profit or loss are the exchange differences on translating foreign operations, unrealized gain (loss) on available-for-sale financial assets, cash flow hedges, and share of the other comprehensive income (except the share of the remeasurements of the defined benefit plans) of associates accounted for using the equity method. However, the application of the above amendments will not have any impact on the net profit, other comprehensive income (net of income tax), and total comprehensive income for the period.
| 4) | Revision to IAS 19 “Employee Benefits” |
Revised IAS 19 requires the recognition of changes in defined benefit obligations and in the fair value of plan assets when they occur, and hence eliminates the “corridor approach” permitted under current IAS 19 and accelerate the recognition of past service costs. The revision requires all remeasurements of the defined benefit plans to be recognized immediately through other comprehensive income in order for the net pension asset or liability to reflect the full value of the plan deficit or surplus. Remeasurement of the defined benefit plans is presented separately as other equity.
Furthermore, the interest cost and expected return on plan assets used in current IAS 19 are replaced with a “net interest” amount, which is calculated by applying the discount rate to the net defined benefit liability or asset. In addition, the revised IAS 19 introduces certain changes in the presentation of the defined benefit cost, and also includes more extensive disclosures.
On initial application of the revised IAS 19, the changes in cumulative employee benefit costs as of January 1, 2014 resulting from the retrospective application are adjusted to net defined benefit liabilities, deferred tax assets, capital surplus, retained earnings, other equity and non-controlling interests; however, the carrying amount of inventory is not adjusted. In addition, in preparing the consolidated financial statements for the year ended December 31, 2015, the Group elects not to present 2014 comparative information about the sensitivity analysis of the defined benefit
| - 12 - |
obligation.
The initial application of the revised IAS 19 has no material impact on the current period. The impact on the prior reporting periods is set out below:
| As Originally Stated | Adjustments Arising from Retrospective Application | Adjusted | ||||||||||
| Impact on Assets, Liabilities and Equity | ||||||||||||
| December 31, 2014 | ||||||||||||
| Deferred tax assets | $ | 4,493,664 | $ | 13,307 | $ | 4,506,971 | ||||||
| Net defined benefit liabilities | 4,371,136 | 11,394 | 4,382,530 | |||||||||
| Capital surplus | 15,995,671 | 17,387 | 16,013,058 | |||||||||
| Retained earnings | 52,397,278 | (16,040 | ) | 52,381,238 | ||||||||
| Other equity | 5,067,931 | 608 | 5,068,539 | |||||||||
| Non-controlling interests | 8,219,139 | (42 | ) | 8,219,097 | ||||||||
| January 1, 2014 | ||||||||||||
| Deferred tax assets | 3,765,482 | 17,783 | 3,783,265 | |||||||||
| Net defined benefit liabilities | 4,441,357 | 104,603 | 4,545,960 | |||||||||
| Capital surplus | 7,908,870 | 11,350 | 7,920,220 | |||||||||
| Retained earnings | 38,993,154 | (87,052 | ) | 38,906,102 | ||||||||
| Other equity | (102,554 | ) | (62 | ) | (102,616 | ) | ||||||
| Non-controlling interests | 4,144,338 | (11,056 | ) | 4,133,282 | ||||||||
| Impact on Total Comprehensive Income | ||||||||||||
| Year ended December 31, 2014 | ||||||||||||
| Operating cost | $ | 203,051,691 | $ | (48,773 | ) | $ | 203,002,918 | |||||
| Operating expense | 23,968,499 | (25,839 | ) | 23,942,660 | ||||||||
| Income tax expense | 4,251,513 | 15,113 | 4,266,626 | |||||||||
| Net profit for the year | 24,222,086 | 59,499 | 24,281,585 | |||||||||
| Items that will not be reclassified subsequently to profit or loss: | ||||||||||||
| Remeasurement of defined benefit obligation | (45,884 | ) | 17,739 | (28,145 | ) | |||||||
| Income tax relating to items that will not be reclassified subsequently | 13,039 | 9,899 | 22,938 | |||||||||
| Impact on comprehensive income for the year, net of income tax | 5,475,203 | 28,307 | 5,503,510 | |||||||||
| Total comprehensive income for the year | 29,697,289 | 87,806 | 29,785,095 | |||||||||
(Continued)
| - 13 - |
| As Originally Stated | Adjustments Arising from Retrospective Application | Adjusted | ||||||||||
| Net profit attributable to: | ||||||||||||
| Owners of the Company | $ | 23,592,667 | $ | 43,855 | $ | 23,636,522 | ||||||
| Non-controlling interests | 629,419 | 15,644 | 645,063 | |||||||||
| $ | 24,222,086 | $ | 59,499 | $ | 24,281,585 | |||||||
| Total comprehensive income attributable to: | ||||||||||||
| Owners of the Company | $ | 28,730,614 | $ | 71,682 | $ | 28,802,296 | ||||||
| Non-controlling interests | 966,675 | 16,124 | 982,799 | |||||||||
| $ | 29,697,289 | $ | 87,806 | $ | 29,785,095 | |||||||
(Concluded)
| 5) | Annual Improvements to IFRSs: 2009-2011 Cycle |
Several standards including IFRS 1 “First-time Adoption of International Financial Reporting Standards”, IAS 1 “Presentation of Financial Statements”, IAS 16 “Property, Plant and Equipment”, IAS 32 “Financial Instruments: Presentation” and IAS 34 “Interim Financial Reporting” were amended in this annual improvement.
The amendments to IAS 1 clarify that an entity is required to present a balance sheet as at the beginning of the preceding period when a) it applies an accounting policy retrospectively, or makes a retrospective restatement or reclassifies items in its financial statements, and b) the retrospective application, restatement or reclassification has a material effect on the information in the balance sheet at the beginning of the preceding period. The amendments also clarify that related notes are not required to accompany the balance sheet at the beginning of the preceding period.
The initial application of the amendments to the Regulations Governing the Preparation of Financial Reports by Securities Issuers and the 2013 version of IFRSs in 2015 has material effect on the consolidated balance sheet as of January 1, 2014. In preparing the consolidated financial statements for the year ended December 31, 2015, the Group would present the consolidated balance sheet as of January 1, 2014 in accordance of the above amendments to IAS 1 and disclose related information in accordance with IAS 8 “Accounting Policies, Changes in Accounting Estimates and Errors”, but the Group is not required to make disclosures about the line items of the balance sheet as of January 1, 2014.
| b. | New IFRSs in issue but not yet endorsed by the FSC |
On March 10, 2016, the FSC announced the scope of the 2016 version of IFRSs to be endorsed and will take effect from January 1, 2017. The scope includes all IFRSs that were issued by the IASB before January 1, 2016 and have effective dates on or before January 1, 2017, which means the scope excludes those that are not yet effective as of January 1, 2017 such as IFRS 9 “Financial Instruments” and IFRS 15 “Revenue from Contracts with Customers” and those with undetermined effective date. In addition, the FSC announced that the Group should apply IFRS 15 starting January 1, 2018. As of the date the consolidated financial statements were approved for issue, the FSC has not announced the effective dates of other new, amended and revised standards and interpretations.
The Group has not applied the following New IFRSs issued by the IASB but not yet endorsed by the FSC.
| - 14 - |
| New IFRSs | Effective Date Announced by IASB (Note 1) | |
| Annual Improvements to IFRSs 2010-2012 Cycle | July 1, 2014 or transactions on or after July 1, 2014 | |
| Annual Improvements to IFRSs 2011-2013 Cycle | July 1, 2014 | |
| Annual Improvements to IFRSs 2012-2014 Cycle | January 1, 2016 (Note 2) | |
| IFRS 9 “Financial Instruments” | January 1, 2018 | |
| Amendments to IFRS 9 and IFRS 7 “Mandatory Effective Date of IFRS 9 and Transition Disclosures” | January 1, 2018 | |
| Amendments to IFRS 10 and IAS 28 “Sale or Contribution of Assets between an Investor and its Associate or Joint Venture” | To be determined by IASB | |
| Amendments to IFRS 10, IFRS 12 and IAS 28 “Investment Entities: Applying the Consolidation Exception” | January 1, 2016 | |
| Amendment to IFRS 11 “Accounting for Acquisitions of Interests in Joint Operations” | January 1, 2016 | |
| IFRS 14 “Regulatory Deferral Accounts” | January 1, 2016 | |
| IFRS 15 “Revenue from Contracts with Customers” | January 1, 2018 | |
| IFRS 16 “Leases” | January 1, 2019 | |
| Amendment to IAS 1 “Disclosure Initiative” | January 1, 2016 | |
| Amendment to IAS 7 “Disclosure Initiative” | January 1, 2017 | |
| Amendments to IAS 12 “Recognition of Deferred Tax Assets for Unrealized Losses” | January 1, 2017 | |
| Amendments to IAS 16 and IAS 38 “Clarification of Acceptable Methods of Depreciation and Amortization” | January 1, 2016 | |
| Amendments to IAS 16 and IAS 41 “Agriculture: Bearer Plants” | January 1, 2016 | |
| Amendment to IAS 19 “Defined Benefit Plans: Employee Contributions” | July 1, 2014 | |
| Amendment to IAS 36 “Impairment of Assets: Recoverable Amount Disclosures for Non-financial Assets” | January 1, 2014 | |
| Amendment to IAS 39 “Novation of Derivatives and Continuation of Hedge Accounting” | January 1, 2014 | |
| IFRIC 21 “Levies” | January 1, 2014 |
| Note 1: | Unless stated otherwise, the above New IFRSs are effective for annual periods beginning on or after their respective effective dates. |
| Note 2: | The amendment to IFRS 5 is applied prospectively to changes in a method of disposal that occur in annual periods beginning on or after January 1, 2016; the remaining amendments are effective for annual periods beginning on or after January 1, 2016. |
The initial application of the above New IFRSs, whenever applied, would not have any material impact on the Group’s accounting policies, except for the following:
| 1) | IFRS 9 “Financial Instruments” |
Recognition and measurement of financial assets
With regards to financial assets, all recognized financial assets that are within the scope of IAS 39 “Financial Instruments: Recognition and Measurement” are subsequently measured at amortized cost or fair value. Under IFRS 9, the requirement for the classification of financial assets is stated below:
For the Group’s debt instruments that have contractual cash flows that are solely payments of principal and interest on the principal amount outstanding, their classification and measurement are
| - 15 - |
as follows:
| a) | For debt instruments, if they are held within a business model whose objective is to collect the contractual cash flows, the financial assets are measured at amortized cost and are assessed for impairment continuously with impairment loss recognized in profit or loss, if any. Interest revenue is recognized in profit or loss by using the effective interest method; |
| b) | For debt instruments, if they are held within a business model whose objective is achieved by both the collecting of contractual cash flows and the selling of financial assets, the financial assets are measured at fair value through other comprehensive income (FVTOCI) and are assessed for impairment. Interest revenue is recognized in profit or loss by using the effective interest method, and other gain or loss shall be recognized in other comprehensive income, except for impairment gains or losses and foreign exchange gains and losses. When the debt instruments are derecognized or reclassified, the cumulative gain or loss previously recognized in other comprehensive income is reclassified from equity to profit or loss. |
Except for above, all other financial assets are measured at fair value through profit or loss. However, the Group may make an irrevocable election to present subsequent changes in the fair value of an equity investment (that is not held for trading) in other comprehensive income, with only dividend income generally recognized in profit or loss. No subsequent impairment assessment is required, and the cumulative gain or loss previously recognized in other comprehensive income cannot be reclassified from equity to profit or loss.
The impairment of financial assets
IFRS 9 requires that impairment loss on financial assets is recognized by using the “Expected Credit Losses Model”. The credit loss allowance is required for financial assets measured at amortized cost, financial assets mandatorily measured at FVTOCI, lease receivables, contract assets arising from IFRS 15 “Revenue from Contracts with Customers”, certain written loan commitments and financial guarantee contracts. A loss allowance for the 12-month expected credit losses is required for a financial asset if its credit risk has not increased significantly since initial recognition. A loss allowance for full lifetime expected credit losses is required for a financial asset if its credit risk has increased significantly since initial recognition and is not low. However, a loss allowance for full lifetime expected credit losses is required for trade receivables that do not constitute a financing transaction.
For purchased or originated credit-impaired financial assets, the Group takes into account the expected credit losses on initial recognition in calculating the credit-adjusted effective interest rate. Subsequently, any changes in expected losses are recognized as a loss allowance with a corresponding gain or loss recognized in profit or loss.
Hedge accounting
The main changes in hedge accounting amended the application requirements for hedge accounting to better reflect the entity’s risk management activities. Compared with IAS 39, the main changes include: (1) enhancing types of transactions eligible for hedge accounting, specifically broadening the risk eligible for hedge accounting of non-financial items; (2) changing the way hedging derivative instruments are accounted for to reduce profit or loss volatility; and (3) replacing retrospective effectiveness assessment with the principle of economic relationship between the hedging instrument and the hedged item.
| 2) | Amendment to IAS 36 “Recoverable Amount Disclosures for Non-financial Assets” |
In issuing IFRS 13 “Fair Value Measurement”, the IASB made consequential amendment to the disclosure requirements in IAS 36 “Impairment of Assets”, introducing a requirement to disclose in every reporting period the recoverable amount of an asset or each cash-generating unit. The
| - 16 - |
amendment clarifies that such disclosure of recoverable amounts is required only when an impairment loss has been recognized or reversed during the period. Furthermore, the Group is required to disclose the discount rate used in measurements of the recoverable amount based on fair value less costs of disposal measured using a present value technique.
| 3) | IFRS 15 “Revenue from Contracts with Customers” |
IFRS 15 establishes principles for recognizing revenue that apply to all contracts with customers, and will supersedes IAS 18 “Revenue”, IAS 11 “Construction Contracts” and a number of revenue-related interpretations from January 1, 2017.
When applying IFRS 15, an entity shall recognize revenue by applying the following steps:
| Ÿ | Identify the contract with the customer; |
| Ÿ | Identify the performance obligations in the contract; |
| Ÿ | Determine the transaction price; |
| Ÿ | Allocate the transaction price to the performance obligations in the contracts; and |
| Ÿ | Recognize revenue when the entity satisfies a performance obligation. |
When IFRS 15 is effective, the Group may elect to apply this Standard either retrospectively to each prior reporting period presented or retrospectively with the cumulative effect of initially applying this Standard recognized at the date of initial application.
| 4) | Amendments to IFRS 10 and IAS 28 “Sale or Contribution of Assets between an Investor and its Associate or Joint Venture” |
The amendments stipulated that, when the Group sells or contributes assets that constitute a business (as defined in IFRS 3) to an associate or joint venture, the gain or loss resulting from the transaction is recognized in full. Also, when the Group loses control of a subsidiary that contains a business but retains significant influence or joint control, the gain or loss resulting from the transaction is recognized in full.
Conversely, when the Group sells or contributes assets that do not constitute a business to an associate or joint venture, the gain or loss resulting from the transaction is recognized only to the extent of the unrelated investors’ interest in the associate or joint venture, i.e. the entity’s share of the gain or loss is eliminated. Also, when the Group loses control of a subsidiary that does not contain a business but retains significant influence or joint control in an associate or a joint venture, the gain or loss resulting from the transaction is recognized only to the extent of the unrelated investors’ interest in the associate or joint venture, i.e. the entity’s share of the gain or loss is eliminated.
| 5) | IFRS 16 “Leases” |
IFRS 16 sets out the accounting standards for leases that will supersede IAS 17 and a number of related interpretations.
Under IFRS 16, if the Group is a lessee, it shall recognize right-of-use assets and lease liabilities for all leases on the consolidated balance sheets except for low-value and short-term leases. The Group may elect to apply the accounting method similar to the accounting for operating lease under IAS 17 to the low-value and short-term leases. On the consolidated statements of comprehensive income, the Group should present the depreciation expense charged on the right-of-use asset separately from interest expense accrued on the lease liability; interest is computed by using
| - 17 - |
effective interest method. On the consolidated statements of cash flows, cash payments for the principal portion of the lease liability are classified within financing activities; cash payments for interest portion are classified within operating activities.
The application of IFRS 16 is not expected to have a material impact on the accounting of the Group as lessor.
When IFRS 16 becomes effective, the Group may elect to apply this Standard either retrospectively to each prior reporting period presented or retrospectively with the cumulative effect of the initial application of this Standard recognized at the date of initial application.
| 6) | Amendments to IAS 12 “Recognition of Deferred Tax Assets for Unrealized Losses” |
The amendment clarifies that the difference between the carrying amount of the debt instrument measured at fair value and its tax base gives rise to a temporary difference, even though there are unrealized losses on that asset, irrespective of whether the Group expects to recover the carrying amount of the debt instrument by sale or by holding it and collecting contractual cash flows.
In addition, in determining whether to recognize a deferred tax asset, the Group should assess a deductible temporary difference in combination with all of its other deductible temporary differences, unless the tax law restricts the utilization of losses to deduction against income of a specific type, in which case, a deductible temporary difference is assessed in combination only with other deductible temporary differences of the appropriate type. The amendment also stipulates that, when determining whether to recognize a deferred tax asset, the estimate of probable future taxable profit may include some of the Group’s assets for more than their carrying amount if there is sufficient evidence that it is probable that the Group will achieve this, and that the estimate for future taxable profit should exclude tax deductions resulting from the reversal of deductible temporary differences.
Except for the above impact, as of the date the consolidated financial statements were approved for issue, the Group is continuously assessing the possible impact that the application of other standards and interpretations will have on the Group’s financial position and results of operations, and will disclose the relevant impact when the assessment is completed.
| 4. | SUMMARY OF SIGNIFICANT ACCOUNTING POLICIES |
| a. | Statement of Compliance |
The consolidated financial statements have been prepared in accordance with the Regulations Governing the Preparation of Financial Reports by Securities Issuers and IFRSs as endorsed by the FSC.
| b. | Basis of Preparation |
The consolidated financial statements have been prepared on the historical cost basis except for certain financial instruments that are measured at fair value.
The fair value measurements are grouped into Levels 1 to 3 based on the degree to which the fair value measurement inputs are observable and the significance of the inputs to the fair value measurement in its entirety, which are described as follows:
| 1) | Level 1 inputs are quoted prices (unadjusted) in active markets for identical assets or liabilities; |
| 2) | Level 2 inputs are inputs other than quoted prices included within Level 1 that are observable for the asset or liability, either directly (i.e. as prices) or indirectly (i.e. derived from prices); and |
| - 18 - |
| 3) | Level 3 inputs are unobservable inputs for the asset or liability. |
| c. | Classification of Current and Non-current Assets and Liabilities |
Current assets include cash and cash equivalents and those assets held primarily for trading purposes or to be realized within twelve months after the balance sheet date, unless the asset is to be used for an exchange or to settle a liability, or otherwise remains restricted, at more than twelve months after the balance sheet date. Current liabilities are obligations incurred for trading purposes or to be settled within twelve months after the balance sheet date and liabilities that do not have an unconditional right to defer settlement for at least twelve months after the balance sheet date. Assets and liabilities that are not classified as current are classified as non-current.
The Group engages in the construction business which has an operating cycle of over one year. The normal operating cycle applies when considering the classification of the Group’s construction-related assets and liabilities.
| d. | Basis of Consolidation |
| 1) | Principles for preparing consolidated financial statements |
The consolidated financial statements incorporate the financial statements of the Company and the entities controlled by the Company (i.e. its subsidiaries). Control is achieved when the Group:
| Ÿ | has power over the investee; |
| Ÿ | is exposed, or has rights, to variable returns from its involvement with the investee; and |
| Ÿ | has the ability to use its power to affect its returns. |
The Group reassesses whether or not it controls an investee if facts and circumstances indicate that there are changes to one or more of the three elements of control listed above.
When the Group has less than a majority of the voting rights of an investee, it has power over the investee when the voting rights are sufficient to give it the practical ability to direct the relevant activities of the investee unilaterally. The Group considers all relevant facts and circumstances in assessing whether or not the Group’s voting rights in an investee are sufficient to give it power, including:
| Ÿ | the size of the Group’s holding of voting rights relative to the size and dispersion of holdings of the other vote holders; |
| Ÿ | potential voting rights held by the Group, other vote holders or other parties; |
| Ÿ | rights arising from other contractual arrangements; and |
| Ÿ | any additional facts and circumstances that indicate that the Group has, or does not have, the current ability to direct the relevant activities at the time that decisions need to be made, including voting patterns at previous shareholders' meetings. |
Consolidation of a subsidiary begins when the Group obtains control over the subsidiary and ceases when the Group loses control over the subsidiary. Specifically, income and expenses of subsidiaries acquired or disposed of during the period are included in the consolidated statement of comprehensive income from the effective date of acquisition or up to the effective date of disposal, as appropriate.
| - 19 - |
When necessary, adjustments are made to the financial statements of subsidiaries to bring their accounting policies in line with those used by the Company.
All intra-group transactions, balances, income and expenses are eliminated in full upon consolidation.
Attribution of total comprehensive income to non-controlling interests
Total comprehensive income of subsidiaries is attributed to the owners of the Company and to the non-controlling interests even if this results in the non-controlling interests having a deficit balance.
Changes in the Group’s ownership interests in existing subsidiaries
Changes in the Group’s ownership interests in subsidiaries that do not result in the Group losing control over the subsidiaries are accounted for as equity transactions. The carrying amounts of the Group’s interests and the non-controlling interests are adjusted to reflect the changes in their relative interests in the subsidiaries. Any difference between the amount by which the non-controlling interests are adjusted and the fair value of the consideration paid or received is recognized directly in equity and attributed to the owners of the Company.
When the Group loses control over a subsidiary, a gain or loss is recognized in profit or loss and is calculated as the difference between (i) the aggregate of the fair value of the consideration received and any investment retained in the former subsidiary at its fair value at the date when control is lost and (ii) the assets (including any goodwill) and liabilities and any non-controlling interests of the former subsidiary at their carrying amounts at the date when control is lost. The Group accounts for all amounts recognized in other comprehensive income in relation to that subsidiary on the same basis as would be required if the Group had directly disposed of the related assets or liabilities.
| 2) | Subsidiaries included in consolidated financial statements were as follows: |
| Establishment and | Percentage of Ownership (%) December 31 | |||||||
| Name of Investee | Main Businesses | Operating Location | 2015 | 2014 | ||||
| A.S.E. Holding Limited | Holding company | Bermuda | 100.0 | 100.0 | ||||
| J & R Holding Limited (“J&R Holding”) | Holding company | Bermuda | 100.0 | 100.0 | ||||
| Innosource Limited | Holding company | British Virgin Islands | 100.0 | 100.0 | ||||
| Omniquest Industrial Limited | Holding company | British Virgin Islands | 100.0 | 100.0 | ||||
| ASE Marketing & Service Japan Co., Ltd. | Engaged in marketing and sales services | Japan | 100.0 | 100.0 | ||||
| ASE Test, Inc. | Engaged in the testing of semiconductors | Kaohsiung, ROC | 100.0 | 100.0 | ||||
| Universal Scientific Industrial Co., Ltd. (“USI”) | Engaged in the manufacturing, processing and sale of computers, computer peripherals and related accessories | Nantou, ROC | 99.0 | 99.2 | ||||
| USI Inc. (“USIINC”) | Engaged in investing activity and established in April 2015 | Nantou, ROC | 99.2 | - | ||||
| Luchu Development Corporation (“Luchu”) | Engaged in the development of real estate properties | Taipei, ROC | 86.1 | 86.1 | ||||
| Alto Enterprises Limited | Holding company | British Virgin Islands | 100.0 | 100.0 | ||||
(Continued)
| - 20 - |
Percentage of Ownership (%) | ||||||||
| Establishment and | December 31 | |||||||
Name of Investee | Main Businesses | Operating Location | 2015 | 2014 | ||||
| Super Zone Holdings Limited | Holding company | Hong Kong | 100.0 | 100.0 | ||||
| ASE (Kun Shan) Inc. | Engaged in the packaging and testing of semiconductors | Kun Shan, China | 100.0 | 100.0 | ||||
| ASE Investment (Kun Shan) Limited | Holding company | Kun Shan, China | 100.0 | 100.0 | ||||
| Advanced Semiconductor Engineering (China) Ltd. | Will engage in the packaging and testing of semiconductors | Shanghai, China | 100.0 | 100.0 | ||||
| ASE Investment (Labuan) Inc. | Holding company | Malaysia | 100.0 | 100.0 | ||||
| ASE Test Limited (“ASE Test”) | Holding company | Singapore | 100.0 | 100.0 | ||||
| ASE (Korea) Inc. | Engaged in the packaging and testing of semiconductors | Korea | 100.0 | 100.0 | ||||
| J&R Industrial Inc. | Engaged in leasing equipment and investing activity | Kaohsiung, ROC | 100.0 | 100.0 | ||||
| ASE Japan Co., Ltd. | Engaged in the packaging and testing of semiconductors | Japan | 100.0 | 100.0 | ||||
| ASE (U.S.) Inc. | After-sales service and sales support | U.S.A. | 100.0 | 100.0 | ||||
| Global Advanced Packaging Technology Limited, Cayman Islands | Holding company | British Cayman Islands | 100.0 | 100.0 | ||||
| ASE WeiHai Inc. | Engaged in the packaging and testing of semiconductors | Shandong, China | 100.0 | 100.0 | ||||
| Suzhou ASEN Semiconductors Co., Ltd. | Engaged in the packaging and testing of semiconductors | Suzhou, China | 60.0 | 60.0 | ||||
| Anstock Limited | Engaged in financing activity | British Cayman Islands | 100.0 | 100.0 | ||||
| Anstock II Limited | Engaged in financing activity | British Cayman Islands | 100.0 | 100.0 | ||||
| ASE Module (Shanghai) Inc. | Will engage in the production and sale of electronic components and printed circuit boards | Shanghai, China | 100.0 | 100.0 | ||||
| ASE (Shanghai) Inc. | Engaged in the production of substrates | Shanghai, China | 100.0 | 100.0 | ||||
| ASE Corporation | Holding company | British Cayman Islands | 100.0 | 100.0 | ||||
| ASE Mauritius Inc. | Holding company | Mauritius | 100.0 | 100.0 | ||||
| ASE Labuan Inc. | Holding company | Malaysia | 100.0 | 100.0 | ||||
| Shanghai Ding Hui Real Estate Development Co., Ltd. | Engaged in the development, construction and sale of real estate properties | Shanghai, China | 100.0 | 100.0 | ||||
| Shanghai Ding Qi Property Management Co., Ltd. | Engaged in the management of real estate properties and established in January 2015 | Shanghai, China | 100.0 | - | ||||
(Continued)
| - 21 - |
Percentage of Ownership (%) | ||||||||
| Establishment and | December 31 | |||||||
Name of Investee
| Main Businesses
| Operating Location
| 2015
| 2014
| ||||
| Advanced Semiconductor Engineering (HK) Limited | Engaged in the trading of substrates | Hong Kong | 100.0 | 100.0 | ||||
| Shanghai Ding Wei Real Estate Development Co., Ltd. | Engaged in the development, construction and leasing of real estate properties | Shanghai, China | 100.0 | 100.0 | ||||
| Shanghai Ding Yu Real Estate Development Co., Ltd. | Engaged in the development, construction and leasing of real estate properties | Shanghai, China | 100.0 | 100.0 | ||||
| Kun Shan Ding Yue Real Estate Development Co., Ltd. | Engaged in the development, construction and leasing of real estate properties | Kun Shan, China | 100.0 | 100.0 | ||||
| Kun Shan Ding Hong Real Estate Development Co., Ltd. | Engaged in the development, construction and leasing of real estate properties | Kun Shan, China | 100.0 | 100.0 | ||||
| ASE Electronics Inc. | Engaged in the production of substrates | Kaohsiung, ROC | 100.0 | 100.0 | ||||
| ASE Test Holdings, Ltd. | Holding company | British Cayman Islands | 100.0 | 100.0 | ||||
| ASE Holdings (Singapore) Pte. Ltd. | Holding company | Singapore | 100.0 | 100.0 | ||||
| ASE Test Finance Limited | Liquidated in July 2015 | Mauritius | - | 100.0 | ||||
| ASE Singapore Pte. Ltd. | Engaged in the packaging and testing of semiconductors | Singapore | 100.0 | 100.0 | ||||
| ISE Labs, Inc. | Engaged in the testing of semiconductors | U.S.A. | 100.0 | 100.0 | ||||
| ASE Electronics (M) Sdn. Bhd. | Engaged in the packaging and testing of semiconductors | Malaysia | 100.0 | 100.0 | ||||
| ASE Assembly & Test (Shanghai) Limited | Engaged in the packaging and testing of semiconductors | Shanghai, China | 100.0 | 100.0 | ||||
| ASE Trading (Shanghai) Ltd. | Engaged in trading activity and was invested by ASE Assembly & Test (Shanghai) Limited in January 2015 | Shanghai, China | 100.0 | - | ||||
| Wuxi Tongzhi Microelectronics Co., Ltd. | Engaged in the packaging and testing of semiconductors | Wuxi, China | 100.0 | 100.0 | ||||
| Huntington Holdings International Co., Ltd. | Holding company | British Virgin Islands | 99.2 | 99.2 | ||||
| Senetex Investment Co., Ltd. | Liquidated in December 2015 | Nantou, ROC | - | 99.2 | ||||
| Unitech Holdings International Co., Ltd. | Holding company | British Virgin Islands | 99.2 | 99.2 | ||||
| Real Tech Holdings Limited | Holding company | British Virgin Islands | 99.2 | 99.2 | ||||
| Universal ABIT Holding Co., Ltd. | In the process of liquidation | British Cayman Islands | 99.2 | 99.2 | ||||
| Rising Capital Investment Limited | Holding company | British Virgin Islands | 99.2 | 99.2 | ||||
(Continued)
| - 22 - |
Percentage of Ownership (%) | ||||||||
| Establishment and | December 31 | |||||||
Name of Investee
| Main Businesses
| Operating Location
| 2015
| 2014
| ||||
| Rise Accord Limited | Holding company | British Virgin Islands | 99.2 | 99.2 | ||||
| Cubuy Corporation | Liquidated in July 2015 | Shanghai, China | - | 99.2 | ||||
| Universal Scientific Industrial (Kunshan) Co., Ltd. | Engaged in the manufacturing and sale of computer assistance system and related peripherals | Kun Shan, China | 99.2 | 99.2 | ||||
| USI Enterprise Limited (“USIE”) | Engaged in the services of investment advisory and warehousing management | Hong Kong | 96.7 | 98.7 | ||||
| Universal Scientific Industrial (Shanghai) Co., Ltd. (“USISH”) | Engaged in the designing, manufacturing and sale of electronic components | Shanghai, China | 75.7 | 82.1 | ||||
| Universal Global Technology Co., Limited | Holding company | Hong Kong | 75.7 | 82.1 | ||||
| Universal Global Technology (Kunshan) Co., Ltd. | Engaged in the designing and manufacturing of electronic components | Kun Shan, China | 75.7 | 82.1 | ||||
| Universal Global Technology (Shanghai) Co., Ltd. | Engaged in the processing and sales of computer and communication peripherals as well as business in import and export of goods and technology | Shanghai, China | 75.7 | 82.1 | ||||
| Universal Global Electronics (Shanghai) Co., Ltd. | Engaged in the sale of electronic components and telecommunications equipment | Shanghai, China | 75.7 | 82.1 | ||||
| Universal Global Industrial Co., Limited | Engaged in manufacturing, trading and investing activity | Hong Kong | 75.7 | 82.1 | ||||
| Universal Global Scientific Industrial Co., Ltd. (“UGTW”) | Engaged in the manufacturing of components of telecomm and cars and provision of related R&D services | Nantou, ROC | 75.7 | 82.1 | ||||
| USI America Inc. | Engaged in the manufacturing and processing of motherboards and wireless network communication and provision of related technical service. The name was changed from USI Manufacturing Service Inc. to USI America Inc. in May 2015 | U.S.A. | 75.7 | 82.1 | ||||
(Continued)
| - 23 - |
Percentage of Ownership (%) | ||||||||
| Establishment and | December 31 | |||||||
Name of Investee
| Main Businesses
| Operating Location
| 2015
| 2014
| ||||
| Universal Scientific Industrial De Mexico S.A. De C.V. | Engaged in the assembling of motherboards and computer components | Mexico | 75.7 | 82.1 | ||||
| USI Japan Co., Ltd. | Engaged in the manufacturing and sale of computer peripherals, integrated chip and other related accessories | Japan | 75.7 | 82.1 | ||||
| USI@Work, Inc. | Merged into USI America Inc. in August 2015 | U.S.A. | - | 82.1 | ||||
| USI Electronics (Shenzhen) Co., Ltd. | Engaged in the design, manufacturing and sale of motherboards and computer peripherals | Shenzhen, China | 75.7 | 82.1 | ||||
(Concluded)
| a) | To enhance operational flexibility via structural adjustments, the board of directors of the Company’s subsidiary, USI, approved to spin-off its investment business as well as capital reduction of NT$16,012,966 thousand by reducing 1,601,297 thousand shares (a reduction ratio of 97.56%), and would transfer its investment business to USIINC, a newly established business entity. The record date of the spin-off was April 1, 2015. USI completed the registration process of capital reduction on April 17, 2015, and USIINC also completed the registration of the incorporation on the same date. Based on the consideration of the business value to be spun-off by USI, USIINC issued 1,000,000 thousand new ordinary shares to the shareholders of USI. Based on the shareholdings on the record date of the spin-off, the shareholders of USI received 609.27 shares of USIINC’s ordinary share in exchange of each 1,000 shares of USI’s ordinary share. After the spin-off, the Group has control over both USI and USIINC, and the spin-off did not have material impact on the financial position and business operation of the Group. |
| b) | To integrate the Group’s EMS upstream and downstream business resources, the board of directors approved in September 2015 the disposal of the Company’s 39,603 thousand shares in USI to the Company’s subsidiary, UGTW, at NT$20 per share. Total consideration is NT$792,064 thousand and the transaction price is based on the net value per share of USI’s audited financial statements as of June 30, 2015. The proposed transaction has been approved by the Investment Commission of the ROC in February 2016. |
| e. | Business Combinations |
Acquisitions of businesses are accounted for using the acquisition method. The consideration transferred in a business combination is measured at fair value, which is calculated as the sum of the acquisition-date fair values of the assets transferred by the Group, liabilities incurred by the Group to the former owners of the acquiree and the equity interests issued by the Group in exchange for control of the acquiree. Acquisition-related costs are recognized in profit or loss as incurred.
Goodwill is measured as the excess of the sum of the consideration transferred, the amount of any non-controlling interests in the acquiree, and the fair value of the acquirer's previously held equity interest in the acquiree (if any) over the net of the acquisition-date amounts of the identifiable assets acquired and the liabilities assumed. If, after re-assessment, the net of the acquisition-date amounts of the identifiable assets acquired and liabilities assumed exceeds the sum of the consideration transferred, the amount of any non-controlling interests in the acquiree and the fair value of the acquirer's previously held interest in the acquiree (if any), the excess is recognized immediately in profit or loss as a bargain purchase gain.
| - 24 - |
When a business combination is achieved in stages, the Group’s previously held equity interest in the acquiree is remeasured to its acquisition-date fair value and the resulting gain or loss, if any, is recognized in profit or loss. Amounts arising from interests in the acquiree prior to the acquisition date that have previously been recognized in other comprehensive income are recognized on the same basis as would be required if that interest were directly disposed of by the Group.
If the initial accounting for a business combination is incomplete by the end of the reporting period in which the combination occurs, the Group reports provisional amounts for the items for which the accounting is incomplete. Those provisional amounts are adjusted during the measurement period, or additional assets or liabilities are recognized, to reflect new information obtained about facts and circumstances that existed at the acquisition date that, if known, would have affected the amounts recognized at that date.
Business combination involving entities under common control is not accounted for by acquisition method but accounted for at the carrying amounts of the entities. Prior period comparative information in the financial statements is restated as if a business combination involving entities under common control had already occurred in that period.
| f. | Foreign Currencies |
In preparing the financial statements of each individual group entity, transactions in currencies other than the entity’s functional currency (foreign currencies) are recognized at the rates of exchange prevailing at the dates of the transactions. At each balance sheet date, monetary items denominated in foreign currencies are retranslated at the rates prevailing at that date. Non-monetary items carried at fair value that are denominated in foreign currencies are retranslated at the rates prevailing at the date when the fair value was determined. Non-monetary items that are measured in terms of historical cost in a foreign currency are not retranslated.
Exchange differences on monetary items arising from settlement or translation are recognized in profit or loss in the period in which they arise.
Exchange differences arising on the retranslation of non-monetary assets (such as equity instruments) or liabilities measured at fair value are included in profit or loss for the period at the rates prevailing at the balance sheet date except for exchange differences arising on the retranslation of non-monetary items in respect of which gains and losses are recognized directly in other comprehensive income, in which case, the exchange differences are also recognized directly in other comprehensive income.
For the purposes of presenting the consolidated financial statements, the assets and liabilities of the Group’s foreign operations are translated into New Taiwan dollars using exchange rates prevailing at each balance sheet date. Income and expense items are translated at the average exchange rates for the period. Exchange differences arising are recognized in other comprehensive income and accumulated in equity attributed to the owners of the Company and non-controlling interests as appropriate.
On the disposal of the Group’s entire interest in a foreign operation, or a disposal involving loss of control over a subsidiary that includes a foreign operation, all of the exchange differences accumulated in equity in respect of that operation attributable to the owners of the Company are reclassified to profit or loss.
In relation to a partial disposal of a subsidiary that does not result in the Group losing control over the subsidiary, the proportionate share of accumulated exchange differences is re-attributed to non-controlling interests of the subsidiary and is not recognized in profit or loss. For all other partial disposals, the proportionate share of the accumulated exchange differences recognized in other comprehensive income is reclassified to profit or loss.
| - 25 - |
| g. | Inventories and Inventories Related to Real Estate Business |
Inventories, including raw materials (materials received from customers for processing, mainly semiconductor wafers, are excluded from inventories as title and risk of loss remain with the customers), supplies, work in process, finished goods, and materials and supplies in transit are stated at the lower of cost or net realizable value. Inventory write-downs are made by item, except for those that may be appropriate to group items of similar or related inventories. Net realizable value is the estimated selling prices of inventories less all estimated costs of completion and estimated costs necessary to make the sale. Raw materials and supplies are recorded at moving average cost while work in process and finished goods are recorded at standard cost.
Inventories related to real estate business include land and buildings held for sale, land held for construction and construction in progress. Land held for development is recorded as land held for construction upon obtaining the title of ownership. Prior to the completion, the borrowing costs directly attributable to construction in progress are capitalized as part of the cost of the asset. Construction in progress is transferred to land and buildings held for sale upon completion. Land and buildings held for sale, construction in progress and land held for construction are stated at the lower of cost or net realizable value and related write-downs are made by item. The amounts received in advance for real estate properties are first recorded as advance receipts and then recognized as revenue when the construction is completed and the title and significant risk of the real estate properties are transferred to customers. Cost of sales of land and buildings held for sale are recognized based on the ratio of property sold to the total property developed.
| h. | Investments in associates and joint ventures |
An associate is an entity over which the Group has significant influence and that is neither a subsidiary nor an interest in a joint venture. Joint venture is a joint arrangement whereby the Group and other parties that have joint control of the arrangement have rights to the net assets of the arrangement.
The Group uses the equity method to account for its investments in associates and joint ventures.
Under the equity method, investments in an associate and a joint venture are initially recognized at cost and adjusted thereafter to recognize the Group’s share of the profit or loss and other comprehensive income of the associate and joint venture. The Group also recognizes the changes in the Group’s share of equity of associates and joint venture.
Any excess of the cost of acquisition over the Group’s share of the net fair value of the identifiable assets and liabilities of an associate or a joint venture at the date of acquisition is recognized as goodwill, which is included within the carrying amount of the investment and is not amortized.
Gains and losses resulting from upstream, downstream and sidestream transactions between the Group (including its subsidiaries) and its associates or joint ventures are recognized in the Group’s consolidated financial statements only to the extent of interests in the associates or joint ventures that are not related to the Group.
| i. | Property, Plant and Equipment |
Except for land which is stated at cost, property, plant and equipment are stated at cost less accumulated depreciation and accumulated impairment.
Properties in the course of construction for production, supply or administrative purposes are carried at cost, less any recognized impairment loss. Cost includes professional fees and borrowing costs eligible for capitalization. Such properties are classified to the appropriate categories of property, plant and equipment when completed and ready for intended use. Depreciation of these assets, on the same basis as other property assets, commences when the assets are ready for their intended use.
| - 26 - |
Freehold land is not depreciated.
Depreciation on property, plant and equipment is recognized using the straight-line method. Each significant part is depreciated separately. If the lease term is shorter than the useful lives, assets are depreciated over the lease term. The estimated useful lives, residual values and depreciation method are reviewed at each balance sheet date, with the effect of any changes in estimate accounted for on a prospective basis.
On derecognition of an item of property, plant and equipment, the difference between the sales proceeds and the carrying amount of the asset is recognized in profit or loss.
| j. | Goodwill |
Goodwill arising from an acquisition of a business is carried at cost as established at the date of acquisition of the business less accumulated impairment loss.
For the purposes of impairment testing, goodwill is allocated to each of the Group’s cash-generating units or groups of cash-generating units (referred to as cash-generating units) that is expected to benefit from the synergies of the combination.
A cash-generating unit to which goodwill has been allocated is tested for impairment annually, or more frequently when there is an indication that the unit may be impaired, by comparing its carrying amount, including the attributed goodwill, with its recoverable amount. However, if the goodwill allocated to a cash-generating unit was acquired in a business combination during the current annual period, that unit shall be tested for impairment before the end of the current annual period. If the recoverable amount of the cash-generating unit is less than its carrying amount, the impairment loss is allocated first to reduce the carrying amount of any goodwill allocated to the unit and then to the other assets of the unit pro rata based on the carrying amount of each asset in the unit. Any impairment loss is recognized directly in profit or loss. An impairment loss recognized for goodwill is not reversed in subsequent periods.
| k. | Other Intangible Assets |
Other intangible assets with finite useful lives acquired separately are initially measured at cost and subsequently measured at cost less accumulated amortization and accumulated impairment. Other intangible assets are amortized based on the pattern in which the economic benefits are consumed or using the straight-line method over their estimated useful lives. The estimated useful lives, residual value and amortization methods are reviewed at each balance sheet date, with the effect of any changes in estimate being accounted for on a prospective basis. Intangible assets with indefinite useful lives that are acquired separately are measured at cost less accumulated impairment loss.
Other intangible assets acquired in a business combination and recognized separately from goodwill are initially recognized at their fair value at the acquisition date which is regarded as their cost. Subsequent to initial recognition, they are measured on the same basis as intangible assets that are acquired separately.
On derecognition of an intangible asset, the difference between the net disposal proceeds and the carrying amount of the asset are recognized in profit or loss.
| l. | Impairment of Tangible and Intangible Assets Other than Goodwill |
At each balance sheet date, the Group reviews the carrying amounts of its tangible and intangible assets, excluding goodwill (see above), to determine whether there is any indication that those assets have suffered an impairment loss. If any such indication exists, the recoverable amount of the asset is estimated in order to determine the extent of the impairment loss. When it is not possible to estimate the recoverable amount of an individual asset, the Group estimates the recoverable amount of the
| - 27 - |
cash-generating unit to which the asset belongs. Corporate assets are allocated to the individual cash-generating units on a reasonable and consistent basis of allocation. Recoverable amount is the higher of fair value less costs to sell and value in use. If the recoverable amount of an asset or cash-generating unit is estimated to be less than its carrying amount, the carrying amount of the asset or cash-generating unit is reduced to its recoverable amount, with the resulting impairment loss recognized in profit or loss.
When an impairment loss is subsequently reversed, the carrying amount of the asset or cash-generating unit is increased to the revised estimate of its recoverable amount, but only to the extent of the carrying amount that would have been determined had no impairment loss been recognized for the asset or cash-generating unit in prior years. A reversal of an impairment loss is recognized immediately in profit or loss.
| m. | Financial Instruments |
Financial assets and financial liabilities are recognized when a group entity becomes a party to the contractual provisions of the instruments. Financial assets and financial liabilities are initially measured at fair value. Transaction costs that are directly attributable to the acquisition or issue of financial assets and financial liabilities (other than financial assets and financial liabilities at fair value through profit or loss) are added to or deducted from the fair value of the financial assets or financial liabilities, as appropriate, on initial recognition. Transaction costs directly attributable to the acquisition of financial assets or financial liabilities at fair value through profit or loss are recognized immediately in profit or loss.
| 1) | Financial assets |
All regular way purchases or sales of financial assets are recognized or derecognized on a settlement date basis.
| a) | Measurement category |
The classification of financial assets held by the Group depends on the nature and purpose of the financial assets and is determined at the time of initial recognition.
| i. | Financial assets at fair value through profit or loss (“FVTPL”) |
Financial assets are classified as at FVTPL when the financial assets are either held for trading or they are designated as at FVTPL.
A financial asset other than a financial asset held for trading may be designated as at FVTPL upon initial recognition if:
| Ÿ | Such designation eliminates or significantly reduces a measurement or recognition inconsistency that would otherwise arise; or |
| Ÿ | The financial asset forms part of a group of financial assets or financial liabilities or both, which is managed and its performance is evaluated on a fair value basis, in accordance with the Group’s documented risk management or investment strategy, and information about the grouping is provided internally on that basis; or |
| Ÿ | It forms part of a contract containing one or more embedded derivatives, and IAS 39 permits the entire combined contract to be designated as at FVTPL. |
Financial assets at FVTPL are stated at fair value with any gains or losses arising on remeasurement recognized in profit or loss. The net gain or loss recognized in profit or loss incorporates any dividend or interest earned on the financial asset.
| - 28 - |
Fair value is determined in the manner described in Note 30.
| ii. | Available-for-sale financial assets |
Available-for-sale financial assets are non-derivatives that are either designated as available-for-sale or are not classified as (a) loans and receivables, (b) held-to-maturity investments or (c) financial assets at fair value through profit or loss.
Available-for-sale financial assets are stated at fair value at each balance sheet date. Changes in the carrying amount of available-for-sale monetary financial assets relating to changes in foreign currency rates, interest income calculated using the effective interest method and dividends on available-for-sale equity investments are recognized in profit or loss. Other changes in the carrying amount of available-for-sale financial assets are recognized in other comprehensive income and accumulated under the heading of unrealized gain (loss) on available-for-sale financial assets. When the investment is disposed of or is determined to be impaired, the cumulative gain or loss previously accumulated in the unrealized gain (loss) on available-for-sale financial assets is reclassified to profit or loss.
Dividends on available-for-sale equity instruments are recognized in profit or loss when the Group’s right to receive the dividends is established.
| iii. | Loans and receivables |
Loans and receivables including cash and cash equivalents, trade receivables, other receivables, other financial assets and debt investments with no active market are measured at amortized cost using the effective interest method, less any impairment. Interest income is recognized by applying the effective interest rate, except for short-term receivables when the effect of discounting is immaterial.
Cash equivalents are short-term, highly liquid investments that are readily convertible to known amounts of cash and which are subject to an insignificant risk of change in value.
| b) | Impairment of financial assets |
Financial assets, other than those at FVTPL, are assessed for indicators of impairment at each balance sheet date. Financial assets are considered to be impaired when there is objective evidence that, as a result of one or more events that occurred after the initial recognition of the financial assets, the estimated future cash flows of the investments have been affected.
For financial assets carried at amortized cost, such as trade receivables and other receivables, assets that are assessed not to be impaired individually are, further, assessed for impairment on a collective basis. The Group assesses the collectability of receivables based on the Group’s past experience of collecting payments and observable changes that correlate with default on receivables.
For financial assets carried at amortized cost, the amount of the impairment loss recognized is the difference between the assets’ carrying amounts and the present value of estimated future cash flows, discounted at the financial assets’ original effective interest rates. If, in a subsequent period, the amount of the impairment loss decreases and the decreases can be objectively related to an event occurring after the impairment loss recognized, the previously recognized impairment loss is reversed either directly or by adjusting an allowance account through profit or loss. The reversal shall not result in carrying amounts of financial assets that exceed what the amortized cost would have been at the date the impairment is reversed.
| - 29 - |
When an available-for-sale financial asset is considered to be impaired, cumulative gains or losses previously recognized in other comprehensive income are reclassified to profit or loss in the period. In respect of available-for-sale equity securities, impairment loss previously recognized in profit or loss are not reversed through profit or loss. Any increase in fair value subsequent to an impairment loss is recognized in other comprehensive income and accumulated under the heading of unrealized gain (loss) on available-for-sale financial assets.
The carrying amount of the financial asset is reduced by the impairment loss directly for all financial assets with the exception of trade receivables where the carrying amount is reduced through the use of an allowance account. When a trade receivable is considered uncollectible, it is written off against the allowance account. Subsequent recoveries of amounts previously written off are credited against the allowance account. Changes in the carrying amount of the allowance account are recognized in profit or loss except for uncollectible trade receivables that are written off against the allowance account.
| c) | Derecognition of financial assets |
The Group derecognizes a financial asset only when the contractual rights to the cash flows from the asset expire, or when it transfers the financial asset and substantially all the risks and rewards of ownership of the asset to another entity. On derecognition of a financial asset in its entirety, the difference between the asset’s carrying amount and the sum of the consideration received and receivable and the cumulative gain or loss that had been recognized in other comprehensive income and accumulated in equity is recognized in profit or loss.
| 2) | Equity instruments |
Debt and equity instruments issued by a group entity are classified as either financial liabilities or as equity in accordance with the substance of the contractual arrangements and the definitions of a financial liability and an equity instrument.
Equity instruments issued by a group entity are recognized at the proceeds received, net of direct issue costs.
Repurchase of the Company’s own equity instruments is recognized in and deducted directly from equity. No gain or loss is recognized in profit or loss on the purchase, sale, issue or cancellation of the Company’s own equity instruments.
| 3) | Financial liabilities |
Financial liabilities are measured either at amortized cost using the effective interest method or at FVTPL. Financial liabilities measured at FVTPL are held for trading.
Financial liabilities at FVTPL are stated at fair value, with any gain or loss arising on remeasurement recognized in profit or loss. The net gain or loss recognized in profit or loss incorporates any interest or dividend paid on the financial liability. Fair value is determined in the manner described in Note 30.
The Group derecognizes financial liabilities when, and only when, the Group’s obligations are discharged, cancelled or they expire. The difference between the carrying amount of the financial liability derecognized and the consideration paid and payable, including any non-cash assets transferred or liabilities assumed, is recognized in profit or loss.
| - 30 - |
| 4) | Derivative financial instruments |
Derivatives are initially recognized at fair value at the date the derivative contracts are entered into and are subsequently remeasured to their fair value at each balance sheet date. The resulting gain or loss is recognized in profit or loss immediately unless the derivative is designated and effective as a hedging instrument , in which event the timing of the recognition in profit or loss depends on the nature of the hedge relationship. When the fair value of derivative financial instruments is positive, the derivative is recognized as a financial asset; when the fair value of derivative financial instruments is negative, the derivative is recognized as financial liabilities.
Derivatives embedded in non-derivative host contracts are treated as separate derivatives when they meet the definition of a derivative, their risks and characteristics are not closely related to those of the host contracts and the contracts are not measured at FVTPL.
| 5) | Convertible bonds |
| a) | Convertible bonds contain conversion option classified as an equity |
The component parts of compound instruments (convertible bonds) issued by the Group are classified separately as financial liabilities and equity in accordance with the substance of the contractual arrangements and the definitions of a financial liability and an equity instrument.
On initial recognition, the fair value of the liability component is estimated using the prevailing market interest rate for similar non-convertible instruments. This amount is recorded as a liability on an amortized cost basis using the effective interest method until extinguished upon conversion or the instrument’s maturity date. Any embedded derivative liability is measured at fair value.
The conversion option classified as equity is determined by deducting the amount of the liability component from the fair value of the compound instrument as a whole. This is recognized and included in equity, net of income tax effects, and is not subsequently remeasured. In addition, the conversion option classified as equity will remain in equity until the conversion option is exercised, in which case, the balance recognized in equity will be transferred to capital surplus - share premium. When the conversion option remains unexercised at maturity, the balance recognized in equity will be transferred to capital surplus - share premium.
Transaction costs that relate to the issue of the convertible bonds are allocated to the liability and equity components in proportion to the allocation of the gross proceeds. Transaction costs relating to the equity component are recognized directly in equity. Transaction costs relating to the liability component are included in the carrying amount of the liability component.
| b) | Convertible bonds contain conversion option classified as a liability |
The conversion options component of the convertible bonds issued by the Group that will be settled other than by the exchange of a fixed amount of cash or other financial asset for a fixed number of the Group’s own equity instruments is classified as derivative financial liabilities.
On initial recognition, the derivative financial liabilities component of the convertible bonds is recognized at fair value, and the initial carrying amount of the component of non-derivative financial liabilities is determined by deducting the amount of derivative financial liabilities from the fair value of the hybrid instrument as a whole. In subsequent periods, the non-derivative financial liabilities component of the convertible bonds is measured at amortized cost using the effective interest method. The derivative financial liabilities component is measured at fair value and the changes in fair value are recognized in profit or loss.
Transaction costs that relate to the issue of the convertible bonds are allocated to the derivative
| - 31 - |
financial liabilities component and the non-derivative financial liabilities component in proportion to their relative fair values. Transaction costs relating to the derivative financial liabilities component are recognized immediately in profit or loss. Transaction costs relating to the non-derivative financial liabilities component are included in the carrying amount of the liability component.
| n. | Hedge Accounting |
The Group designates certain hedging instruments as cash flow hedges. At the inception of the hedge relationship, the Group documents the relationship between the hedging instrument and the hedged item, along with its risk management objectives and its strategy for undertaking various hedge transactions. Furthermore, at the inception of the hedge and on an ongoing basis, the Group documents whether the hedging instrument is highly effective in offsetting changes in fair values or cash flows of the hedged item attributable to the hedged risk.
The effective portion of changes in the fair value of derivatives that are designated and qualify as cash flow hedges is recognized in other comprehensive income and accumulated under the heading of cash flow hedges. The gain or loss relating to the ineffective portion is recognized immediately in profit or loss.
Amounts previously recognized in other comprehensive income and accumulated in equity are reclassified to profit or loss in the periods when the hedged item affects profit or loss, in the same line as the recognized hedged item. If a hedge of a forecast transaction subsequently results in the recognition of a non-financial asset or a non-financial liability, the associated gains and losses that were recognized in other comprehensive income are removed from equity and are included in the initial cost of the non-financial asset or non-financial liability.
Hedge accounting is discontinued prospectively when the Group revokes the designated hedging relationship, or when the hedging instrument expires or is sold, terminated, or exercised, or when it no longer meets the criteria for hedge accounting. The cumulative gain or loss on the hedging instruments that has been previously recognized in other comprehensive income from the period when the hedge was effective remains separately in equity until the forecast transaction occurs. When a forecast transaction is no longer expected to occur, the gain or loss accumulated in equity is recognized immediately in profit or loss.
| o. | Revenue Recognition |
Revenue is measured at the fair value of the consideration received or receivable take into account of estimated customer returns, rebates and other similar allowances.
| 1) | Sale of goods and real estate properties |
Revenue from the sale of goods and real estate properties is recognized when the goods and real estate properties are delivered and titles have passed, at the time all the following conditions are satisfied:
| Ÿ | The Group has transferred to the buyer the significant risks and rewards of ownership of the goods and real estate properties; |
| Ÿ | The Group retains neither continuing managerial involvement to the degree usually associated with ownership nor effective control over the goods and real estate properties sold; |
| Ÿ | The amount of revenue can be reliably measured; |
| Ÿ | It is probable that the economic benefits associated with the transaction will flow to the Group; and |
| - 32 - |
| Ÿ | The costs incurred or to be incurred in respect of the transaction can be reliably measured. |
| 2) | Rendering of services |
Service income is recognized when services are rendered.
| 3) | Dividend and interest income |
Dividend income from investments and interest income from financial assets are recognized when they are probable that the economic benefits will flow to the Group and the amount of income can be reliably measured. Interest income is accrued on a time basis, by reference to the principal outstanding and at the effective interest rate applicable.
| p. | Leasing |
Leases are classified as finance leases whenever the terms of the lease transfer substantially all the risks and rewards of ownership to the lessee. All other leases are classified as operating leases.
The Group as lessor
Rental income from operating leases is recognized on a straight-line basis over the term of the relevant lease.
The Group as lessee
Assets held under finance leases are initially recognized as assets of the Group at their fair value at the inception of the lease or, if lower, at the present value of the minimum lease payments. The corresponding liability to the lessor is included in the consolidated balance sheets as a finance lease obligation.
Operating lease payments are recognized as expenses on a straight-line basis over the lease term.
| q. | Borrowing Costs |
Borrowing costs directly attributable to the acquisition, construction or production of qualifying assets are added to the cost of those assets, until such time as the assets are substantially ready for their intended use or sale.
Investment income earned on the temporary investment of specific borrowings pending their expenditure on qualifying assets is deducted from the borrowing costs eligible for capitalization.
Other than stated above, all other borrowing costs are recognized in profit or loss in the period in which they are incurred.
| r. | Government grants |
Government grants are not recognized until there is reasonable assurance that the Group will comply with the conditions attaching to them and that the grants will be received.
Government grants are recognized in profit or loss on a systematic basis over the periods in which the Group recognizes as expenses the related costs for which the grants are intended to compensate. Specifically, government grants whose primary condition is that the Group should purchase, construct or otherwise acquire non-current assets are recognized as deferred revenue in the consolidated financial statements and transferred to profit or loss on a systematic and rational basis over the useful lives of the related assets.
| - 33 - |
Government grants that are receivable as compensation for expenses or losses already incurred or for the purpose of giving immediate financial support to the Group with no future related costs are recognized in profit or loss in the period in which they become receivable.
| s. | Retirement Benefit Costs |
Payments to defined contribution retirement benefit plans are recognized as expenses when employees have rendered services entitling them to the contributions.
Defined benefit costs (including service cost, net interest and remeasurement) under the defined benefit retirement benefit plans are determined using the projected unit credit method. Service cost (including current service cost and past service cost) and net interest on the net defined benefit liability (asset) are recognized as employee benefits expense in the period they occur. Remeasurement, comprising actuarial gains and losses and the return on plan assets (excluding interest), is recognized in other comprehensive income in the period in which they occur. Remeasurement recognized in other comprehensive income is reflected immediately in retained earnings and will not be reclassified to profit or loss.
Net defined benefit liability (asset) represents the actual deficit (surplus) in the Group’s defined benefit plan. Any surplus resulting from this calculation is limited to the present value of any refunds from the plans or reductions in future contributions to the plans.
| t. | Employee share options |
Employee share options granted to employees are measured at the fair value at the grant date. The fair value determined at the grant date is expensed on a straight-line basis over the vesting period, based on the Group’s best estimate of the number of options that are expected to ultimately vest, with a corresponding increase in capital surplus - employee share options and non-controlling interests. It is recognized as an expense in full at the grant date if vesting immediately.
At each balance sheet date, the Group reviews its estimate of the number of employee share options expected to vest. The impact of the revision of the original estimates is recognized in profit or loss such that the cumulative expense reflects the revised estimate, with a corresponding adjustment to the capital surplus - employee share options and non-controlling interests.
| u. | Taxation |
Income tax expense represents the sum of the tax currently payable and deferred tax.
| 1) | Current tax |
Income tax on unappropriated earnings (excluding earnings from foreign consolidated subsidiaries) at a rate of 10% is expensed in the year the earnings arise and adjusted to the extent that distributions are approved by the shareholders in the following year.
Adjustments of prior years’ tax liabilities are added to or deducted from the current year’s tax provision.
| 2) | Deferred tax |
Deferred tax is recognized on temporary differences between the carrying amounts of assets and liabilities in the consolidated financial statements and the corresponding tax bases used in the computation of taxable profit. Deferred tax liabilities are generally recognized for all taxable temporary differences. Deferred tax assets are generally recognized for all deductible temporary differences, unused loss carry-forward and unused tax credits for purchases of machinery and
| - 34 - |
equipment to the extent that it is probable that taxable profits will be available against which those deductible temporary differences can be utilized.
Deferred tax liabilities are recognized for taxable temporary differences associated with investments in subsidiaries except where the Group is able to control the reversal of the temporary differences and it is probable that the temporary differences will not reverse in the foreseeable future.
The carrying amounts of deferred tax assets is reviewed at each balance sheet date and reduced to the extent that it is no longer probable that sufficient taxable profits will be available to allow all or part of deferred tax assets to be utilized. A previously unrecognized deferred tax asset is also reviewed at each balance sheet date and recognized to the extent that it has become probable that future taxable profit will allow the deferred tax asset to be recovered.
Deferred tax assets and liabilities are measured at the tax rates that are expected to apply in the period in which assets are realized or the liabilities are settled. The measurement of deferred tax assets and liabilities reflects the tax consequences that would follow from the manner in which the Group expects, at the balance sheet date, to recover or settle the carrying amounts of its assets and liabilities.
| 3) | Current and deferred tax for the year |
Current and deferred tax are recognized in profit or loss, except when they relate to items that are recognized in other comprehensive income or directly in equity, in which case, the current and deferred tax are also recognized in other comprehensive income or directly in equity, respectively.
Where current tax or deferred tax arises from the initial accounting for a business combination, the tax effect is included in the accounting for the business combination.
| 5. | CRITICAL ACCOUNTING JUDGMENTS AND KEY SOURCES OF ESTIMATION UNCERTAINTY |
In the application of the Group’s accounting policies, which are described in Note 4, management is required to make judgments, estimates and assumptions about the carrying amounts of assets and liabilities that are not readily apparent from other sources. The estimates and underlying assumptions are based on historical experience and other factors that are considered to be relevant. Actual results may differ from these estimates.
The estimates and underlying assumptions are reviewed on an ongoing basis. Revisions to accounting estimates are recognized in the period in which the estimate is revised if the revision affects only that period, or in the period of the revision and future periods if the revision affects both current and future periods.
Impairment of Goodwill
Determining whether goodwill is impaired requires an estimation of the value in use of the cash-generating units to which goodwill has been allocated. The value in use calculation requires management to estimate the future cash flows expected to arise from cash-generating units and suitable discount rates in order to calculate its present value. When the actual future cash flows are less than expected, a material impairment loss may arise.
Impairment of Tangible and Intangible Assets Other than Goodwill
In evaluating the impairment of tangible and intangible assets other than goodwill, the Group is required to make subjective judgments in determining the independent cash flows, useful lives, expected future revenue and expenses related to the specific asset groups with the consideration of its usage patterns and the nature
| - 35 - |
of semiconductor industry. Any changes in these estimates based on changed economic conditions or business strategies could result in significant impairment charges in future periods.
Valuation of Inventory
Inventories are stated at the lower of cost or net realizable value and the net realizable value of inventory at balance sheet date is determined based on Group’s judgments and estimates.
Due to the rapid technology changes, the Group estimates the net realizable value of inventory for obsolescent and unmarketable items at balance sheet date and then writes down the cost of inventories to net realizable value. There may be significant changes in the net realizable value of inventories due to assumptions of future demand within a specific time period.
Income Taxes
The reliability of deferred tax assets mainly depends on whether sufficient future profits or taxable temporary differences will be available. In cases where the actual future profits generated are less than expected, a material reversal of deferred tax assets may arise, which would be recognized in profit or loss for the period in which such a reversal takes place.
Recognition and Measurement of Defined Benefit Plans
Accrued pension liabilities and the resulting pension expenses under defined benefit pension plans are calculated using the Projected Unit Credit Method. Actuarial assumptions comprise discount rates and expected rates of salary increase. Changes in economic circumstances and market conditions will affect these assumptions and may have a material impact on the amount of the expense and the liability.
Fair value measurements and valuation processes of Derivatives and Other Financial Instruments
As disclosed in Note 30, the Group’s management uses its judgments applying appropriate valuation techniques commonly applied by market practitioners. The assumptions applied are based on observable quoted market prices, foreign exchange rates and interest rates to the extent it is available. The fair value of unquoted equity instruments is estimated based on the assumptions supported by unobservable market prices and interest rates which are disclosed in Note 30. The Group’s management believes that the valuation techniques and the assumptions applied are appropriate in determining the fair value of financial instruments.
| 6. | CASH AND CASH EQUIVALENTS |
| December 31 | ||||||||
| 2015 | 2014 | |||||||
| NT$ | NT$ | |||||||
| Cash on hand | $ | 8,806 | $ | 9,953 | ||||
| Checking accounts and demand deposits | 50,291,823 | 43,059,911 | ||||||
| Cash equivalent | 4,950,552 | 8,624,546 | ||||||
| $ | 55,251,181 | $ | 51,694,410 | |||||
Cash equivalents include time deposits that are of a short maturity of three months or less from the date of acquisitions, and are highly liquid, readily convertible to known amounts in cash and the risk of changes in values is insignificant. Cash equivalents are held for the purpose of meeting short-term cash commitments rather than for investments or other purposes.
| - 36 - |
| 7. | FINANCIAL INSTRUMENTS AT FAIR VALUE THROUGH PROFIT OR LOSS |
| December 31 | ||||||||
| 2015 | 2014 | |||||||
| NT$ | NT$ | |||||||
| Financial assets designated as at FVTPL | ||||||||
| Structured time deposits | $ | 1,646,357 | $ | 2,376,050 | ||||
| Private-placement convertible bonds | 100,500 | 100,500 | ||||||
| 1,746,857 | 2,476,550 | |||||||
| Financial assets held for trading | ||||||||
| Swap contracts | 1,452,611 | 1,907,705 | ||||||
| Open-end mutual funds | 573,242 | 533,425 | ||||||
| Quoted shares | 37,058 | 43,352 | ||||||
| Forward exchange contracts | 18,913 | 27,811 | ||||||
| Foreign currency option contracts | 5,020 | - | ||||||
| 2,086,844 | 2,512,293 | |||||||
| $ | 3,833,701 | $ | 4,988,843 | |||||
| Financial liabilities held for trading | ||||||||
| Conversion option, redemption option and put option of convertible bonds (Note 18) | $ | 2,632,565 | $ | 2,520,606 | ||||
| Swap contracts | 290,176 | 99,165 | ||||||
| Forward exchange contracts | 69,207 | 31,581 | ||||||
| Foreign currency option contracts | 13,659 | - | ||||||
| Interest rate swap contracts | 119 | - | ||||||
| $ | 3,005,726 | $ | 2,651,352 | |||||
The Group invested in structured time deposits and in private-placement convertible bonds, and all included embedded derivative instruments which are not closely related to the host contracts. The Group designated the entire contracts as financial assets at FVTPL on initial recognition.
At each balance sheet date, the outstanding swap contracts not accounted for hedge accounting were as follows:
| Notional Amount | ||||
| Currency | Maturity Period | (In Thousands) | ||
| December 31, 2015 | ||||
| Sell NT$/Buy US$ | 2016.01~2016.12 | NT$57,554,138/US$1,802,834 | ||
| Sell US$/Buy CNY | 2016.01~2016.03 | US$353,881/CNY 2,255,872 | ||
| Sell US$/Buy JPY | 2016.03 | US$67,125/JPY 8,240,000 | ||
| Sell US$/Buy NT$ | 2016.01 | US$91,750/NT$ 3,005,494 |
(Continued)
| - 37 - |
| Notional Amount | ||||
| Currency | Maturity Period | (In Thousands) | ||
| December 31, 2014 | ||||
| Sell NT$/Buy US$ | 2015.01-2015.12 | NT$36,199,735/US$1,209,000 | ||
| Sell US$/Buy NT$ | 2015.01-2015.02 | US$132,100/NT$4,149,958 | ||
| Sell US$/Buy JPY | 2015.01 | US$72,248/JPY8,450,000 | ||
| Sell US$/Buy CNY | 2015.01-2015.06 | US$80,000/CNY503,452 | ||
| Sell CNY/Buy US$ | 2015.03 | CNY217,288/US$35,000 |
(Concluded)
At each balance sheet date, the outstanding forward exchange contracts not accounted for hedge accounting were as follow:
| Notional Amount | ||||
| Currency | Maturity Period | (In Thousands) | ||
| December 31, 2015 | ||||
| Sell NT$/Buy US$ | 2016.02 | NT$325,400/US$10,000 | ||
| Sell US$/Buy CNY | 2016.01~2016.03 | US$121,000/CNY780,252 | ||
| Sell US$/Buy JPY | 2016.01 | US$14,000/JPY1,713,388 | ||
| Sell US$/Buy KRW | 2016.01 | US$8,000/KRW9,420,350 | ||
| Sell US$/Buy MYR | 2016.01~2016.02 | US$6,000/MYR25,525 | ||
| Sell US$/Buy NT$ | 2016.01~2016.03 | US$155,000/NT$5,088,230 | ||
| Sell US$/Buy SGD | 2016.01~2016.02 | US$11,400/SGD16,079 | ||
| December 31, 2014 | ||||
| Sell US$/Buy NT$ | 2015.01 | US$14,000/NT$438,434 | ||
| Sell US$/Buy CNY | 2015.01-2015.03 | US$127,000/CNY785,683 | ||
| Sell US$/Buy MYR | 2015.01-2015.02 | US$6,000/MYR20,860 | ||
| Sell US$/Buy SGD | 2015.01-2015.02 | US$11,700/SGD15,211 | ||
| Sell US$/Buy JPY | 2015.01-2015.04 | US$18,385/JPY2,177,800 |
At each balance sheet date, the outstanding foreign currency option contracts not accounted for hedge accounting were as follows:
| Notional Amount | ||||
| Currency | Maturity Period | (In Thousands) | ||
| December 31, 2015 | ||||
| Buy US$ Call/CNY Put | 2016.01~2017.08 (Note) | US$2,000/CNY13,800 | ||
| Buy US$ Put/CNY Call | 2016.03 (Note) | US$20,000/CNY131,600 | ||
| Sell US$ Put/CNY Call | 2016.01~2017.08 (Note) | US$1,000/CNY6,900 |
| Note: | The contracts will be settled once a month and the counterparty has the right to early terminate the contracts, or the contracts will be early terminated or both parties will have no obligation to settle the contracts when the specific criteria is met. |
At each balance sheet date, the outstanding interest rate swap contracts not accounted for hedge accounting were as follows:
| - 38 - |
| Maturity Period | Notional Amounts (In Thousands) | Range of Interest Rates Paid | Range of Interest Rates Received | |||
| December 31, 2015 | ||||||
| 2016.10 | NT$1,000,000 | 4.6% (Fixed) | 0.0%~5.0% (Floating) |
8. AVAILABLE-FOR-SALE FINANCIAL ASSETS
| December 31 | ||||||||
| 2015 | 2014 | |||||||
| NT$ | NT$ | |||||||
| Limited partnership | $ | 476,612 | $ | 555,361 | ||||
| Unquoted ordinary shares | 249,217 | 211,726 | ||||||
| Quoted ordinary shares | 197,580 | 195,070 | ||||||
| Open-end mutual funds | 16,037 | 1,500,434 | ||||||
| Unquoted preferred shares | 15,260 | 11,779 | ||||||
| 954,706 | 2,474,370 | |||||||
| Current | 30,344 | 1,533,265 | ||||||
| Non-current | $ | 924,362 | $ | 941,105 | ||||
| 9. | TRADE RECEIVABLES, NET |
| December 31 | ||||||||
| 2015 | 2014 | |||||||
| NT$ | NT$ | |||||||
| Trade receivables | $ | 45,014,393 | $ | 53,004,955 | ||||
| Less: Allowance for doubtful debts | 82,906 | 84,145 | ||||||
| Trade receivables, net | $ | 44,931,487 | $ | 52,920,810 | ||||
| a. | Trade receivables |
The Group’s average credit terms were 30 to 90 days. Allowance for doubtful debts is assessed by reference to the collectability of receivables by evaluating the account aging, historical experience and current financial condition of customers.
As of December 31, 2015 and 2014, except that the Group’s five largest customers accounted for 26% and 30% of accounts receivable, respectively, the concentration of credit risk is insignificant for the remaining accounts receivable.
| - 39 - |
Aging of receivables
| December 31 | ||||||||
| 2015 | 2014 | |||||||
| NT$ | NT$ | |||||||
| Not past due | $ | 40,409,227 | $ | 47,387,888 | ||||
| 1 to 30 days | 3,901,300 | 5,222,943 | ||||||
| 31 to 90 days | 495,664 | 306,052 | ||||||
| More than 91 days | 208,202 | 88,072 | ||||||
| Total | $ | 45,014,393 | $ | 53,004,955 | ||||
The above aging schedule was based on he past due date.
Age of receivables that are past due but not impaired
| December 31 | ||||||||
| 2015 | 2014 | |||||||
| NT$ | NT$ | |||||||
| Less than 30 days | $ | 3,086,796 | $ | 5,191,521 | ||||
| 31 to 90 days | 344,265 | 131,247 | ||||||
| More than 91 days | - | 1,407 | ||||||
| Total | $ | 3,431,061 | $ | 5,324,175 | ||||
The above aging schedule was based on the past due date.
Except for those impaired, the Group had not provided an allowance for doubtful debts on trade receivables at each balance sheet date since there has not been a significant change in credit quality and the amounts were still considered collectible. The Group did not hold any collateral or other credit enhancements over these balances nor did it have a legal right to offset against any amounts owed by the Group to counterparties.
Movement of the allowance for doubtful trade receivables
Impaired Individually | Impaired Collectively | Total | ||||||||||
| NT$ | NT$ | NT$ | ||||||||||
| Balance at January 1, 2015 | $ | 28,305 | $ | 55,840 | $ | 84,145 | ||||||
| Impairment losses recognized (reversed) | 18,816 | (10,584 | ) | 8,232 | ||||||||
| Amount written off during the period as uncollectible | (7,617 | ) | (209 | ) | (7,826 | ) | ||||||
| Effect of foreign currency exchange | (458 | ) | (1,187 | ) | (1,645 | ) | ||||||
| Balance at December 31, 2015 | $ | 39,046 | $ | 43,860 | $ | 82,906 | ||||||
(Continued)
| - 40 - |
Impaired Individually | Impaired Collectively | Total | ||||||||||
| NT$ | NT$ | NT$ | ||||||||||
| Balance at January 1, 2014 | $ | 26,885 | $ | 41,235 | $ | 68,120 | ||||||
| Impairment losses recognized | 2,875 | 15,156 | 18,031 | |||||||||
| Amount written off during the period as uncollectible | (891 | ) | (917 | ) | (1,808 | ) | ||||||
| Effect of foreign currency exchange | (564 | ) | 366 | (198 | ) | |||||||
| Balance at December 31, 2014 | $ | 28,305 | $ | 55,840 | $ | 84,145 | ||||||
(Concluded)
| b. | Transfers of financial assets |
Factored trade receivables of the Company were as follows:
| Counterparties | Receivables Sold (In Thousands) | Amounts Collected (In Thousands) | Advances Received At Year-end (In Thousands) | Interest Rates on Advances Received (%) | Credit Line (In Thousands) | |||||
| Year ended December 31, 2015 | ||||||||||
| Citi bank | US$ 78,804 | US$ 36,955 | US$ 41,849 | 1.30% | US$ 92,000 | |||||
| Year ended December 31, 2014 | ||||||||||
| Citi bank | US$ 103,744 | US$ 103,744 | - | - | US$ 92,000 |
Pursuant to the factoring agreement, losses from commercial disputes (such as sales returns and discounts) should be borne by the Company, while losses from credit risk should be borne by the banks. The Company also issued promissory notes to the banks for commercial disputes which remained undrawn since. The promissory notes both amounted to US$5,000 thousand as of December 31, 2015 and 2014, respectively. As of December 31, 2015, there was no significant losses from commercial disputes in the past and the Company does not expect any significant commercial dispute losses in the foreseeable future.
| 10. | INVENTORIES |
| December 31 | ||||||||
| 2015 | 2014 | |||||||
| NT$ | NT$ | |||||||
| Finished goods | $ | 10,012,182 | $ | 6,568,459 | ||||
| Work in process | 1,692,346 | 2,064,377 | ||||||
| Raw materials | 9,672,894 | 10,155,006 | ||||||
| Supplies | 852,251 | 797,353 | ||||||
| Raw materials and supplies in transit | 1,028,606 | 577,898 | ||||||
| $ | 23,258,279 | $ | 20,163,093 | |||||
The cost of inventories recognized as operating costs for the years ended December 31, 2015 and 2014 were NT$233,165,722 thousand and NT$202,960,428 thousand, respectively, which included write-downs of inventories at NT$352,011 thousand and NT$601,726 thousand, respectively.
| - 41 - |
| 11. | INVENTORIES RELATED TO REAL ESTATE BUSINESS |
| December 31 | ||||||||
| 2015 | 2014 | |||||||
| NT$ | NT$ | |||||||
| Land and buildings held for sale | $ | 5,431 | $ | 5,558 | ||||
| Construction in progress (Note 16) | 23,956,678 | 22,242,065 | ||||||
| Land held for construction | 1,751,429 | 1,738,855 | ||||||
| $ | 25,713,538 | $ | 23,986,478 | |||||
Land and buildings held for sale located in Shanghai Zhangjiang was completed and subsequently sold. Construction in progress is mainly located on Caobao Road and Hutai Road in Shanghai, China and Lidu Road and Xinhong Road in Kun Shan, China. The capitalized borrowing costs for the years ended December 31, 2015 and 2014 is disclosed in Note 22.
As of December 31, 2015 and 2014, inventories related to real estate business of NT$24,837,046 thousand and NT$23,697,339 thousand, respectively, are expected to be recovered longer than twelve months.
Refer to Note 32 for the carrying amount of inventories related to real estate business that had been pledged by the Group to secure bank borrowings.
| 12. | INVESTMENTS ACCOUNTED FOR USING THE EQUITY METHOD |
| December 31 | ||||||||
| 2015 | 2014 | |||||||
| NT$ | NT$ | |||||||
| Investments in associates | $ | 36,809,068 | $ | 1,492,441 | ||||
| Investments in joint ventures | 613,841 | - | ||||||
| $ | 37,422,909 | $ | 1,492,441 | |||||
| a. | Investments in associates |
| 1) | Investments in associates accounted for using the equity method consisted of the following: |
| Carrying Amount as of December 31 | ||||||||||||
| Name of Associate | Main Business | Operating Location | 2015 | 2014 | ||||||||
| NT$ | NT$ | |||||||||||
| Material associate | ||||||||||||
| Siliconware Precision Industries Co., Ltd. (“SPIL”) | Engaged in assembly, testing and turnkey services of integrated circuits | ROC | $ | 35,423,058 | $ | - | ||||||
| Associates that are not individually material | ||||||||||||
| Hung Ching Development & Construction Co. (“HC”) | Engaged in the development, construction and leasing of real estate properties | ROC | 1,313,499 | 1,351,400 | ||||||||
| Hung Ching Kwan Co. (“HCK”) | Engaged in the leasing of real estate properties | ROC | 332,444 | 342,138 | ||||||||
| Advanced Microelectronic Products Inc. (“AMPI”) | Engaged in integrated circuit | ROC | 40,216 | 99,052 | ||||||||
| 37,109,217 | 1,792,590 | |||||||||||
| Less: Deferred gain on transfer of land | 300,149 | 300,149 | ||||||||||
| $ | 36,809,068 | $ | 1,492,441 | |||||||||
| - 42 - |
| 2) | At each balance sheet date, the percentages of ownership held by the Group were as follows: |
| December 31 | ||||||||
| 2015 | 2014 | |||||||
| SPIL | 24.99 | % | - | |||||
| HC | 26.22 | % | 26.22 | % | ||||
| AMPI | 18.24 | % | 18.24 | % | ||||
| HCK | 27.31 | % | 27.31 | % | ||||
| 3) | In September 2015, the Company acquired 725,749 thousand ordinary shares and 10,650 thousand units of ADS (one ADS represents five ordinary shares) of SPIL at NT$45 per ordinary share. The percentage of ownership was 24.99% and, as a result, the Company obtained significant influence over SPIL. As of December 31, 2015, the Company has not completed the calculation of the difference between the cost of the investment and the Company’s share of the net fair value of SPIL’s identifiable assets and liabilities. |
In December 2015, the Company’s board of directors resolved to purchase additional ordinary shares (including ordinary shares represented by ADS) of SPIL up to 770,000 thousand shares, accounting for approximately 24.71% of the outstanding ordinary shares of SPIL, through a tender offer for a consideration of NT$55 per ordinary share and NT$275 per ADS from December 29, 2015 to February 16, 2016. Since the Fair Trade Commission of the ROC is still reviewing the application for the combination between the Company and SPIL, the Company has extended the period of the tender offer from February 16, 2016 to March 17, 2016.
| 4) | In January 2014, the Company acquired additional ordinary shares of AMPI in a private placement and, as a result, obtained significant influence over AMPI. The private-placement ordinary shares were restricted for disposal during a 3-year lock-up period. |
| 5) | Fair values (Level 1 inputs in terms of IFRS 13) of investments in associates with available published price quotation are summarized as follows: |
| December 31 | ||||||||
| 2015 | 2014 | |||||||
| NT$ | NT$ | |||||||
| SPIL | $ | 40,741,700 | $ | - | ||||
| HC | $ | 1,149,549 | $ | 1,427,499 | ||||
| AMPI | $ | 104,255 | $ | 184,862 | ||||
| 6) | Summarized financial information in respect of the Group’s material associate is set out below. The summarized financial information below represents amounts shown in SPIL’s consolidated financial statements prepared in accordance with the Regulations Governing the Preparation of Financial Reports by Securities Issuers and IFRSs as endorsed by the FSC, and adjusted by the Group for equity accounting purposes. |
| - 43 - |
| December 31, 2015 | ||||
| NT$ | ||||
| Current assets | $ | 48,785,212 | ||
| Non-current assets | 74,460,018 | |||
| Current liabilities | (30,677,239 | ) | ||
| Non-current liabilities | (21,967,349 | ) | ||
| Equity | $ | 70,600,642 | ||
| Proportion of the Group’s ownership interest in SPIL | 24.99 | % | ||
| Equity attributable to the Group | $ | 17,643,100 | ||
| The difference between investment cost and net equity | 17,779,958 | |||
| Carrying amount of the Group’s ownership interest in SPIL | $ | 35,423,058 | ||
For the Year Ended December 31, 2015 | ||||
| NT$ | ||||
| Operating revenue | $ | 82,839,922 | ||
| Net profit for the year | $ | 8,762,257 | ||
| Other comprehensive loss for the year | (906,053 | ) | ||
| Total comprehensive income for the year | $ | 7,856,204 | ||
The investments accounted for using the equity method and the share of profit or loss and other comprehensive income of the investments in associates for the years ended December 31, 2015 and 2014 was based on the associates’ financial statements audited by the auditors for the same years.
| 7) | Aggregate information of associates that are not individually material |
For the Year Ended December 31 | ||||||||
| 2015 | 2014 | |||||||
| NT$ | NT$ | |||||||
| The Group’s share of: | ||||||||
| Net profit for the year | $ | 115,857 | $ | 147,085 | ||||
| Other comprehensive income (loss) for the year | (2,916 | ) | 234,125 | |||||
| Total comprehensive income for the year | $ | 112,941 | $ | 381,210 | ||||
| - 44 - |
| b. | Investments in joint ventures |
| 1) | Investment in joint ventures that are not individually material accounted for using the equity method consisted of the following: |
December 31, 2015 | ||||||||||||
| Name of Joint Venture | Main Business | Operating Location | Percentages of Ownership | Carrying Amount | ||||||||
| NT$ | ||||||||||||
| ASE Embedded Electronics Inc. (“ASEEE”) | Engaged in the production of embedded substrate | ROC | 51.00 | % | $ | 613,841 | ||||||
In May 2015, the Group and TDK Corporation (“TDK”) entered into an agreement to establish a joint venture to invest in ASEEE. In August 2015, the Croup invested NT$618,097 thousand for 51.00% shareholding in ASEEE. According to the joint arrangement, the Group and TDK must act together to direct the relevant operating activities and, as a result, the Group does not control ASEEE. The investment in ASEEE is accounted for using the equity method.
| 2) | Aggregate information of joint venture that is not individually material |
For the Year Ended December 31, 2015 | ||||
| NT$ | ||||
| The Group’s share of: | ||||
| Net loss for the year | $ | (4,274 | ) | |
| Other comprehensive income for the year | - | |||
| Total comprehensive loss for the year | $ | (4,274 | ) | |
The investments accounted for using the equity method and the share of profit or loss and other comprehensive income for the investments in joint ventures for the year ended December 31, 2015 was based on ASEEE’s financial statements audited by the auditors for the same year.
| 13. | PROPERTY, PLANT AND EQUIPMENT |
The carrying amounts of each class of property, plant and equipment were as follows:
| December 31 | ||||||||
| 2015 | 2014 | |||||||
| NT$ | NT$ | |||||||
| Land | $ | 3,381,300 | $ | 3,348,018 | ||||
| Buildings and improvements | 59,801,054 | 56,395,710 | ||||||
| Machinery and equipment | 78,715,309 | 84,171,647 | ||||||
| Other equipment | 1,814,994 | 1,816,687 | ||||||
| Construction in progress and machinery in transit | 6,284,418 | 5,855,053 | ||||||
| $ | 149,997,075 | $ | 151,587,115 | |||||
| - 45 - |
For the year ended December 31, 2015
| Land | Buildings and improvements | Machinery and equipment | Other equipment | Construction in progress and machinery in transit | Total | |||||||||||||||||||
| NT$ | NT$ | NT$ | NT$ | NT$ | NT$ | |||||||||||||||||||
| Cost | ||||||||||||||||||||||||
| Balance at January 1, 2015 | $ | 3,348,018 | $ | 86,725,254 | $ | 233,669,627 | $ | 7,182,574 | $ | 5,862,217 | $ | 336,787,690 | ||||||||||||
| Additions | - | 132,584 | 553,496 | 401,417 | 27,193,324 | 28,280,821 | ||||||||||||||||||
| Disposals | - | (405,040 | ) | (8,041,933 | ) | (232,555 | ) | (20,711 | ) | (8,700,239 | ) | |||||||||||||
| Reclassification | - | 8,579,472 | 18,054,712 | 389,783 | (26,893,158 | ) | 130,809 | |||||||||||||||||
| Effect of foreign currency exchange differences | 33,282 | (584,338 | ) | (952,295 | ) | (18,811 | ) | 256,088 | (1,266,074 | ) | ||||||||||||||
| Balance at December 31, 2015 | $ | 3,381,300 | $ | 94,447,932 | $ | 243,283,607 | $ | 7,722,408 | $ | 6,397,760 | $ | 355,233,007 | ||||||||||||
| Accumulated depreciation and impairment | ||||||||||||||||||||||||
| Balance at January 1, 2015 | $ | - | $ | 30,329,544 | $ | 149,497,980 | $ | 5,365,887 | $ | 7,164 | $ | 185,200,575 | ||||||||||||
| Depreciation expense | - | 4,790,646 | 23,372,408 | 775,716 | - | 28,938,770 | ||||||||||||||||||
| Impairment losses recognized | - | 120,424 | 31,116 | - | 106,589 | 258,129 | ||||||||||||||||||
| Disposals | - | (308,895 | ) | (7,838,937 | ) | (224,509 | ) | - | (8,372,341 | ) | ||||||||||||||
| Reclassification | - | 5,704 | (11,920 | ) | 3,008 | - | (3,208 | ) | ||||||||||||||||
| Effect of foreign currency exchange differences | - | (290,545 | ) | (482,349 | ) | (12,688 | ) | (411 | ) | (785,993 | ) | |||||||||||||
| Balance at December 31, 2015 | $ | - | $ | 34,646,878 | $ | 164,568,298 | $ | 5,907,414 | $ | 113,342 | $ | 205,235,932 | ||||||||||||
For the year ended December 31, 2014
| Land | Buildings and improvements | Machinery and equipment | Other equipment | Construction in progress and machinery in transit | Total | |||||||||||||||||||
| NT$ | NT$ | NT$ | NT$ | NT$ | NT$ | |||||||||||||||||||
| Cost | ||||||||||||||||||||||||
| Balance at January 1, 2014 | $ | 3,295,758 | $ | 70,593,537 | $ | 208,351,905 | $ | 6,384,589 | $ | 7,009,702 | $ | 295,635,491 | ||||||||||||
| Additions | - | 1,246,123 | 1,140,822 | 572,766 | 40,488,876 | 43,448,587 | ||||||||||||||||||
| Disposals | - | (299,515 | ) | (8,188,532 | ) | (447,047 | ) | (56,209 | ) | (8,991,303 | ) | |||||||||||||
| Reclassification | - | 12,683,476 | 27,935,525 | 395,115 | (41,044,364 | ) | (30,248 | ) | ||||||||||||||||
| Effect of foreign currency exchange differences | 52,260 | 2,501,633 | 4,429,907 | 277,151 | (535,788 | ) | 6,725,163 | |||||||||||||||||
| Balance at December 31, 2014 | $ | 3,348,018 | $ | 86,725,254 | $ | 233,669,627 | $ | 7,182,574 | $ | 5,862,217 | $ | 336,787,690 | ||||||||||||
| Accumulated depreciation and impairment | ||||||||||||||||||||||||
| Balance at January 1, 2014 | $ | - | $ | 25,826,936 | $ | 133,266,723 | $ | 5,044,501 | $ | - | $ | 164,138,160 | ||||||||||||
| Depreciation expense | - | 3,980,337 | 21,180,214 | 644,491 | - | 25,805,042 | ||||||||||||||||||
| Impairment losses recognized | - | 79,124 | 211,466 | - | 7,164 | 297,754 | ||||||||||||||||||
| Disposals | - | (248,477 | ) | (7,786,216 | ) | (433,863 | ) | - | (8,468,556 | ) | ||||||||||||||
| Reclassification | - | 7,459 | (7,122 | ) | (7,907 | ) | - | (7,570 | ) | |||||||||||||||
| Effect of foreign currency exchange differences | - | 684,165 | 2,632,915 | 118,665 | - | 3,435,745 | ||||||||||||||||||
| Balance at December 31, 2014 | $ | - | $ | 30,329,544 | $ | 149,497,980 | $ | 5,365,887 | $ | 7,164 | $ | 185,200,575 | ||||||||||||
Due to the Group’s operation plans and production demands, the Group believed that a portion of property, plant and equipment used in packaging segment, testing segment, EMS segment and other segment was not used and recognized an impairment loss of NT$258,129 thousand and NT$297,754 thousand under the line item of other gains, net in the consolidated statements of comprehensive income for the years ended December 31, 2015 and 2014, respectively. The recoverable amount of a portion of the impaired property, plant and equipment is determined by its fair value less costs of disposal, of which the fair value is based on the recent quoted prices of assets with similar age and obsolescence that provided by the vendors in secondary market. The recent quoted prices of assets are a Level 3 input in terms of IFRS 13 because the secondary market is not very active. The recoverable amount of the other portion of the impaired property, plant and equipment is determined on the basis of its value in use which was zero due to the Group’s expectation to derive no cash flows from these assets.
| - 46 - |
Each class of property, plant and equipment was depreciated on a straight-line basis over the following useful lives:
| Buildings and improvements | ||
| Main plant buildings | 10-40 years | |
| Cleanrooms | 10-20 years | |
| Others | 3-20 years | |
| Machinery and equipment | 2-10 years | |
| Other equipment | 2-20 years |
The capitalized borrowing costs for the years ended December 31, 2015 and 2014 are disclosed in Note 22.
| 14. | GOODWILL |
| Cost | Accumulated impairment | Carrying value | ||||||||||
| NT$ | NT$ | NT$ | ||||||||||
| Balance at January 1, 2015 | $ | 12,434,411 | $ | 1,988,996 | $ | 10,445,415 | ||||||
| Effect of foreign currency exchange differences | 61,104 | - | 61,104 | |||||||||
| Balance at December 31, 2015 | $ | 12,495,515 | $ | 1,988,996 | $ | 10,506,519 | ||||||
| Balance at January 1, 2014 | $ | 12,336,816 | $ | 1,988,996 | $ | 10,347,820 | ||||||
| Effect of foreign currency exchange differences | 97,595 | - | 97,595 | |||||||||
| Balance at December 31, 2014 | $ | 12,434,411 | $ | 1,988,996 | $ | 10,445,415 | ||||||
| a. | Allocating goodwill to cash-generating units |
Goodwill had been allocated to the following cash-generating units for impairment testing purposes: packaging segment, testing segment, EMS segment and other segment. The carrying amount of goodwill allocated to cash-generating units was as follows:
| December 31 | ||||||||
| 2015 | 2014 | |||||||
| Cash-generating units | NT$ | NT$ | ||||||
| Testing segment | $ | 7,890,525 | $ | 7,846,460 | ||||
| Others | 2,615,994 | 2,598,955 | ||||||
| $ | 10,506,519 | $ | 10,445,415 | |||||
| b. | Impairment assessment |
At the end of each year, the Group performs impairment assessment by reviewing the recoverable amounts based on value in use calculation which incorporates cash flow projections covering a five-year period. The cash flows beyond that five-year period have been extrapolated using a steady 2% per annum growth rate. In assessing value in use, the estimated future cash flows are discounted to their present value using annual discount rates. For the years ended December 31, 2015 and 2014, the Group did not recognize impairment loss on goodwill.
The key assumptions used in the value in use calculations are growth rates for operating revenue and
| - 47 - |
discount rates. Growth rates for operating revenue are based on the revenue forecast for the Group and the market as well as our historical experience. The discount rates were 8.67%- 10.71% and 9.70%-11.50% as of December 31, 2015 and 2014, respectively
Management believed that any reasonably possible change in the key assumptions on which recoverable amount was based would not cause the aggregate carrying amount of the cash-generating unit to exceed its aggregate recoverable amount significantly.
| 15. | OTHER INTANGIBLE ASSETS |
The carrying amounts of each class of other intangible assets were as follows:
| December 31 | ||||||||
| 2015 | 2014 | |||||||
| NT$ | NT$ | |||||||
| Customer relationships | $ | 274,402 | $ | 501,501 | ||||
| Computer software | 953,322 | 798,127 | ||||||
| Others | 154,369 | 168,243 | ||||||
| $ | 1,382,093 | $ | 1,467,871 | |||||
For the year ended December 31, 2015
| Customer relationships | Computer software | Others | Total | |||||||||||||
| NT$ | NT$ | NT$ | NT$ | |||||||||||||
| Cost | ||||||||||||||||
| Balance at January 1, 2015 | $ | 1,579,015 | $ | 2,882,932 | $ | 2,323,547 | $ | 6,785,494 | ||||||||
| Additions | - | 481,412 | 9,723 | 491,135 | ||||||||||||
| Disposals or derecognization | (663,379 | ) | (8,426 | ) | (1,984,118 | ) | (2,655,923 | ) | ||||||||
| Reclassification | - | 12,360 | - | 12,360 | ||||||||||||
| Effect of foreign currency exchange differences | - | (29,918 | ) | (1,732 | ) | (31,650 | ) | |||||||||
| Balance at December 31, 2015 | $ | 915,636 | $ | 3,338,360 | $ | 347,420 | $ | 4,601,416 | ||||||||
| Accumulated amortization | ||||||||||||||||
| Balance at January 1, 2015 | $ | 1,077,514 | $ | 2,084,804 | $ | 2,155,305 | $ | 5,317,623 | ||||||||
| Amortization expense | 227,099 | 325,856 | 26,939 | 579,894 | ||||||||||||
| Disposals or derecognization | (663,379 | ) | (7,402 | ) | (1,983,914 | ) | (2,654,695 | ) | ||||||||
| Reclassification | - | 3,190 | - | 3,190 | ||||||||||||
| Effect of foreign currency exchange differences | - | (21,410 | ) | (5,279 | ) | (26,689 | ) | |||||||||
| Balance at December 31, 2015 | $ | 641,234 | $ | 2,385,038 | $ | 193,051 | $ | 3,219,323 | ||||||||
| - 48 - |
For the year ended December 31, 2014
| Customer relationships | Computer software | Others | Total | |||||||||||||
| NT$ | NT$ | NT$ | NT$ | |||||||||||||
| Cost | ||||||||||||||||
| Balance at January 1, 2014 | $ | 1,579,015 | $ | 3,679,835 | $ | 2,304,655 | $ | 7,563,505 | ||||||||
| Additions | - | 375,623 | 20,843 | 396,466 | ||||||||||||
| Disposals or derecognization | - | (1,232,757 | ) | (6,406 | ) | (1,239,163 | ) | |||||||||
| Reclassification | - | 6,228 | - | 6,228 | ||||||||||||
| Effect of foreign currency exchange differences | - | 54,002 | 4,456 | 58,458 | ||||||||||||
| Balance at December 31, 2014 | $ | 1,579,015 | $ | 2,882,931 | $ | 2,323,548 | $ | 6,785,494 | ||||||||
| Accumulated amortization | ||||||||||||||||
| Balance at January 1, 2014 | $ | 924,194 | $ | 3,002,828 | $ | 2,030,659 | $ | 5,957,681 | ||||||||
| Amortization expense | 153,320 | 269,375 | 123,039 | 545,734 | ||||||||||||
| Disposals or derecognization | - | (1,227,346 | ) | - | (1,227,346 | ) | ||||||||||
| Reclassification | - | 2,516 | - | 2,516 | ||||||||||||
| Effect of foreign currency exchange differences | - | 37,431 | 1,607 | 39,038 | ||||||||||||
| Balance at December 31, 2014 | $ | 1,077,514 | $ | 2,084,804 | $ | 2,155,305 | $ | 5,317,623 | ||||||||
Each class of other intangible assets, except a portion of customer relationships amortized based on the pattern in which the economic benefits are consumed, were amortized on the straight-line basis over the following useful lives:
| Customer relationships | 11 years | |||
| Computer software | 2-5 years | |||
| Others | 5-32 years |
| 16. | LONG-TERM PREPAYMENTS FOR LEASE |
Long-term prepayments for lease mainly represent land use right located in China with periods for use from 50 to 70 years. As of December 31, 2015 and 2014, the carrying amount of the land use right which the Group was in the process of obtaining the certificates was nil and NT$17,594 thousand, respectively. During 2014, the land use right located in China which the Group obtained the certificates was reclassified from long-term prepayments for lease to construction in progress under inventories related to real estate business.
| 17. | BORROWINGS |
| a. | Short-term borrowings |
Short-term borrowings mainly represented unsecured revolving bank loans with annual interest rates at 0.57%-5.78% and 0.81%-6.00% as of December 31, 2015 and 2014, respectively.
| b. | Short-term bills payable |
Short-term bills payable outstanding as of December 31, 2015 represented commercial papers NT$4,350,000 thousand less unamortized discounts of NT$1,946 thousand with annual interest rate at
| - 49 - |
0.78%. The commercial papers were secured by China Bills Finance Corporation and Mega Bills Finance Corporation.
| c. | Long-term borrowings |
| 1) | Bank loans |
As of December 31, 2015 and 2014, the long-term bank loans with fixed interest rates were NT$1,500,000 thousand and NT$1,192,975 thousand, respectively, with annual interest rates at 1.17% and 1.10%-6.15%, respectively. The long-term bank loans with fixed interest rate will be repayable in December 2018. As of December 31, 2015 and 2014, the current portion of long-term bank loans with fixed interest rates were nil and NT$116,876 thousand, respectively. The others were long-term bank loans with floating interest rate and consisted of the followings:
| December 31 | ||||||||
| 2015 | 2014 | |||||||
| NT$ | NT$ | |||||||
| Working capital bank loans | ||||||||
| Syndicated bank loans - repayable through April 2016 to July 2018, annual interest rates were 1.56%-1.92% and 0.90%-1.83% as of December 31, 2015 and 2014, respectively | $ | 12,159,037 | $ | 10,760,548 | ||||
| Others - repayable through June 2016 to August 2019, annual interest rates were 0.90%-3.98% and 1.03%-3.74% as of December 31, 2015 and 2014, respectively | 25,660,638 | 12,479,650 | ||||||
| Mortgage loans | ||||||||
| Repayable through July 2016 to June 2023, annual interest rates were 4.95%-5.39% and 6.77% as of December 31, 2015 and 2014, respectively | 3,251,139 | 2,534,483 | ||||||
| 41,070,814 | 25,774,681 | |||||||
| Less: unamortized arrangement fee | 18,670 | 32,225 | ||||||
| 41,052,144 | 25,742,456 | |||||||
| Less: current portion | 2,057,465 | 2,714,131 | ||||||
| $ | 38,994,679 | $ | 23,028,325 | |||||
Pursuant to the above syndicated bank loans agreements, the Company and some of its subsidiaries should maintain certain financial covenants including current ratio, leverage ratio, tangible net assets and interest coverage ratio. Such financial ratios are calculated based on the Group’s annual audited consolidated financial statements or semi-annual reviewed consolidated financial statements or subsidiaries’ annual audited financial statements. The Company and its subsidiaries were in compliance with all of the loan covenants as of December 31, 2015 and 2014.
The Group had sufficient long term credit facility obtained before December 31, 2015 to refinance a portion of loans on a long-term basis. Therefore, NT$2,105,883 thousand was not classified as current portion of long-term borrowings as of December 31, 2015.
| 2) | Bills payable |
Long-term bills payable represented unsecured commercial paper NT$2,000,000 thousand less unamortized discounts of NT$1,011 thousand with annual interest rate at 1.03% as of December 31, 2015. The commercial paper contract was entered into with Ta Ching Bills Finance Corporation and the duration is 3 years.
| - 50 - |
| 18. | BONDS PAYABLE |
| December 31 | ||||||||
| 2015 | 2014 | |||||||
| NT$ | NT$ | |||||||
| Secured domestic bonds - secured by banks | ||||||||
| Repayable at maturity in August 2016 and interest due annually with annual interest rate 1.45% | $ | 8,000,000 | $ | 8,000,000 | ||||
| Unsecured convertible overseas bonds | ||||||||
| US$400,000 thousand | 13,130,000 | 12,660,000 | ||||||
| US$200,000 thousand (linked to New Taiwan dollar) | 6,185,600 | - | ||||||
| Secured overseas bonds - secured by the Company | ||||||||
| US$300,000 thousand, repayable at maturity in July 2017; interest due semi-annually with annual interest rate 2.125% | 9,847,500 | 9,495,000 | ||||||
| CNY500,000 thousand, repayable at maturity in September 2016 and interest due semi-annually with annual interest rate 4.25% | 2,527,489 | 2,586,207 | ||||||
| 39,690,589 | 32,741,207 | |||||||
| Less: discounts on bonds payable | 1,264,339 | 1,471,076 | ||||||
| 38,426,250 | 31,270,131 | |||||||
| Less: current portion | 14,685,866 | - | ||||||
| $ | 23,740,384 | $ | 31,270,131 | |||||
The Group had sufficient long term credit facility obtained before December 31, 2015 to refinance a portion of the bonds payable on a long-term basis. Therefore, NT$8,000,000 thousand was not classified as current portion of bonds payable as of December 31, 2015.
| a. | In September 2013, the Company offered the third unsecured convertible overseas bonds (the “Bonds”) in US$400,000 thousand. The Bonds is zero coupon bonds with the maturity of 5 years, in denominations of US$200 thousand or in any integral multiples thereof. Each holder of the Bonds has the right at any time on or after October 16, 2013 and up to (and including) August 26, 2018, except during legal lock-up period, to convert the Bonds into newly issued listed common shares at the conversion price NT$33.085, determined on the basis of a fixed exchange rate of US$1 to NT$29.956. The conversion price will be adjusted in accordance with the conversion provisions due to anti-dilution clause. As of December 31, 2015 and 2014, the conversion price was NT$30.28 and NT$31.93, respectively. |
The Bonds may be redeemed at the option of the Company, in whole or in part, at any time on or after the third anniversary of the offering date provided that (1) the closing price, translated into U.S. dollars, of the common shares for a period of 20 consecutive trading days is at least 130% of the conversion price, (2) at least 90% in aggregate principal amount of the Bonds originally outstanding has been redeemed, repurchased and canceled or converted, or (3) the Company is required to pay additional taxes on the Bonds as a result of certain changes in tax laws in the ROC.
Each holder shall have the right to request the Company repurchase all or any portion of the principal amount thereof of a holder’s Bonds (1) on the third anniversary of the offering date, (2) in the event of a change of control, or (3) in the event of delisting.
The Bonds contained a debt host contract, recognized as bonds payable, and the conversion option, redemption option and put option (collectively the “Bonds Options”) aggregately recognized as financial liabilities at FVTPL. The effective interest rate of the debt host contract was 3.16% and the aggregate fair value of the Bonds Options was NT$1,667,950 thousand on initial recognition.
| - 51 - |
| b. | In July 2015, the Company offered the forth unsecured convertible overseas bonds (the “Currency Linked Bonds”) in US$200,000 thousand. The Currency Linked Bonds is zero coupon bonds with the maturity of 2.75 years, in denominations of US$200 thousand or in any integral multiples thereof. Repayment, redemption and put amount denominated in U.S. dollar will be converted into New Taiwan dollar amount using a fixed exchange rate of US$1 to NT$30.928 (the “Fixed Exchange Rate”) and then converted back to U.S. dollar amount using the applicable prevailing rate at the time of repayment, redemption or put. Each holder of the Currency Linked Bonds has the right at any time on or after August 11, 2015 and up to (and including) March 17, 2018, except during legal lock-up period, to convert the Currency Linked Bonds into common shares at the conversion price NT$54.55, determined on the basis of the Fixed Exchange Rate. The Company’s treasury shares will be available for delivery upon conversion of the Currency Linked Bonds. The conversion price will be adjusted in accordance with the conversion provisions due to anti-dilution clause. As of December 31, 2015, the conversion price was NT$51.73. |
The Currency Linked Bonds may be redeemed at the option of the Company, in whole or in part, at any time on or after March 19, 2018 provided that (1) the closing price, translated into U.S. dollars, of the common shares for a period of 20 out of 30 consecutive trading days is at least 130% of the conversion price, (2) at least 90% in aggregate principal amount of the Currency Linked Bonds originally outstanding has been redeemed, repurchased and canceled or converted, or (3) the Company is required to pay additional taxes on the Currency Linked Bonds as a result of certain changes in tax laws in the ROC.
Each holder shall have the right to request the Company repurchase all or any portion of the principal amount thereof of a holder’s Currency Linked Bonds (1) in the event of a change of control, or (2) in the event of delisting.
The Currency Linked Bonds contained a debt host contract, recognized as bonds payable, and the conversion option, recognized as capital surplus. The effective interest rate of the debt host contract was 1.58% and the fair value of the conversion option was NT$214,022 thousand on initial recognition.
| c. | To focus on corporate sustainability and to carry out the commitment to environmental protection and energy conservation, Anstock II Limited, a subsidiary the Company 100% owned, offered overseas bonds in US$300,000 thousand with the maturity of 3 years and annual interest rate of 2.125% (the “Green Bonds”) in July 2014. The Green Bonds are unconditionally and irrevocably guaranteed by the Company and the proceeds will be used to fund certain eligible projects to promote the Group’s transition to low-carbon and climate resilient growth. |
| 19. | OTHER PAYABLES |
| December 31 | ||||||||
| 2015 | 2014 | |||||||
| NT$ | NT$ | |||||||
| Payables for property, plant and equipment | $ | 4,782,357 | $ | 7,097,129 | ||||
| Accrued salary and bonus | 5,826,982 | 5,550,040 | ||||||
| Accrued bonus to employees or employees’ compensation and remuneration to directors and supervisors | 2,270,608 | 2,602,796 | ||||||
| Accrued employee insurance | 599,218 | 572,259 | ||||||
| Accrued utilities | 466,956 | 495,404 | ||||||
| Accrued legal settlement fee | - | 814,185 | ||||||
| Others | 5,248,697 | 5,232,703 | ||||||
| $ | 19,194,818 | $ | 22,364,516 | |||||
| - 52 - |
The Company and its subsidiary, ASE US, reached the final settlement agreement with Tessera Inc. (“Tessera”) in October 2014 to resolve the patent infringement lawsuit, and Tessera has dismissed all claims against the Company and ASE US. The final settlement amount was NT$814,185 thousand (US$27,000 thousand as resolved in the final settlement agreement in October 2014) and paid in January 2015.
| 20. | RETIREMENT BENEFIT PLANS |
| a. | Defined contribution plans |
| 1) | The pension plan under the ROC Labor Pension Act (“LPA”) for the Group’s ROC resident employees is a government-managed defined contribution plan. Based on the LPA, the Company and its subsidiaries in Taiwan makes monthly contributions to employees’ individual pension accounts at 6% of their monthly salaries. |
| 2) | The subsidiaries located in China, U.S.A., Malaysia, Singapore and Mexico also make contributions at various ranges according to relevant local regulations. |
| b. | Defined benefit plans |
| 1) | The Company and its subsidiaries in Taiwan joined the defined benefit pension plan under the ROC Labor Standards Law (“LS Law”) operated by the government. Pension benefits are calculated on the basis of the length of service and average monthly salaries of the last six months before retirement. The Company and its subsidiaries in Taiwan make contributions based on a certain percentage of their domestic employees monthly salaries to a pension fund administered by the pension fund monitoring committee. Pension contributions are deposited in the Bank of Taiwan in the committee’s name and are managed by the Bureau of Labor Funds, Ministry of Labor (“the Bureau”); the Group has no right to influence the investment policy and strategy. Before the end of each year, the Group assesses the balance in the pension fund. If the amount of the balance in the pension fund is inadequate to pay retirement benefits for employees who conform to retirement requirements in the next year, the Group is required to fund the difference in one appropriation that should be made before the end of March of the next year. |
| 2) | ASE Japan has a pension plan under which eligible employees with more than ten years of service are entitled to receive pension benefits based on their length of service and salaries at the time of termination of employment. ASE Japan makes contributions based on a certain amount of pension cost to employees. |
ASE Korea also has a pension plan under which eligible employees and directors with more than one year of service are entitled to receive a lump-sum payment upon termination of their service with ASE Korea, based on their length of service and salaries at the time of termination. ASE Korea makes contributions based on a certain percentage of pension cost to an external financial institution administered by the management and in the names of employees.
| 3) | ASE Inc., ASE Test, Inc. and ASE Electronics Inc. maintain pension plans for executive managers. Pension costs under the plans were NT$2,302 thousand and NT$16,645 thousand for the years ended December 31, 2015 and 2014, respectively. Pension payments were NT$2,549 thousand and NT$25,315 thousand for the years ended December 31, 2015 and 2014, respectively. As of December 31, 2015 and 2014, accrued pension liabilities for executive managers were NT$199,595 thousand and NT$199,842 thousand, respectively. |
| 4) | The present value of the defined benefit obligation and the related current service cost and past service cost were measured using the Projected Unit Credit Method. |
Except the pension plans for executive managers, the key assumptions used for the actuarial
| - 53 - |
valuations were as follow:
December 31 | ||||
| 2015 | 2014 | |||
| Discount rates | 0.15%-3.48% | 0.12%-4.03% | ||
| Expected rates of salary increase | 2.00%-4.57% | 2.00%-4.70% | ||
| 5) | An analysis by function of the amounts recognized in profit or loss in respect of the defined benefit plans excluding those for executive managers was as follows: |
| For the Years Ended December 31 | ||||||||
| 2015 | 2014 (Adjusted) | |||||||
| NT$ | NT$ | |||||||
| Operating cost | $ | 319,151 | $ | 345,309 | ||||
| Selling and marketing expenses | 10,160 | 11,448 | ||||||
| General and administrative expenses | 43,753 | 35,867 | ||||||
| Research and development expenses | 38,124 | 36,526 | ||||||
| $ | 411,188 | $ | 429,150 | |||||
| 6) | For the years ended December 31, 2015 and 2014, the Group recognized actuarial loss of NT$51,909 thousand and NT$5,207 thousand (adjusted) in other comprehensive loss, respectively. As of December 31, 2015 and 2014, the accumulated actuarial loss of NT$420,111 thousand and NT$333,894 thousand (adjusted) were recognized in other comprehensive loss, and NT$7,931 thousand and NT$4,491 thousand (adjusted) were recognized in non-controlling interests, respectively. |
| 7) | The amounts included in the consolidated balance sheets arising from the Group’s obligation in respect of its defined benefit plans excluding those for executive managers were as follows: |
| December 31 | ||||||||
| 2015 | 2014 (Adjusted) | |||||||
| NT$ | NT$ | |||||||
| Present value of funded defined benefit obligation | $ | 7,973,676 | $ | 7,674,293 | ||||
| Fair value of plan assets | (3,973,729 | ) | (3,502,487 | ) | ||||
| Present value of unfunded defined benefit obligation | 3,999,947 | 4,171,806 | ||||||
| Recorded under others payables | (138,959 | ) | (1,028 | ) | ||||
| Recorded under prepaid pension cost | 11,910 | 11,910 | ||||||
| Net defined benefit liability | $ | 3,872,898 | $ | 4,182,688 | ||||
| - 54 - |
Movements in net defined benefit liability (asset) were as follows:
| Present value of the defined benefit obligation | Fair value of the plan assets | Net defined benefit liability (asset) | ||||||||||
| NT$ | NT$ | NT$ | ||||||||||
| Balance at January 1, 2015 | $ | 7,674,293 | $ | (3,502,487 | ) | $ | 4,171,806 | |||||
| Service cost | ||||||||||||
| Current service cost | 335,655 | - | 335,655 | |||||||||
| Net interest expense (income) | 183,889 | (108,356 | ) | 75,533 | ||||||||
| Recognized in profit or loss | 519,544 | (108,356 | ) | 411,188 | ||||||||
| Remeasurement | ||||||||||||
| Return on plan assets (excluding amounts included in net interest) | - | 12,426 | 12,426 | |||||||||
| Actuarial loss arising from changes in financial assumptions | 309,695 | - | 309,695 | |||||||||
| Actuarial gain arising from experience adjustments | (243,363 | ) | - | (243,363 | ) | |||||||
| Actuarial gain arising from changes in demographic assumptions | (15,847 | ) | - | (15,847 | ) | |||||||
| Recognized in other comprehensive income | 50,485 | 12,426 | 62,911 | |||||||||
| Contributions from the employer | - | (611,581 | ) | (611,581 | ) | |||||||
| Benefits paid from the pension fund | (192,928 | ) | 192,928 | - | ||||||||
| Benefits paid from the Group | (43,088 | ) | - | (43,088 | ) | |||||||
| Exchange differences on foreign plans | (34,630 | ) | 43,341 | 8,711 | ||||||||
| Balance at December 31, 2015 | $ | 7,973,676 | $ | (3,973,729 | ) | $ | 3,999,947 | |||||
| Balance at January 1, 2014 | $ | 7,472,145 | $ | (3,118,804 | ) | $ | 4,353,341 | |||||
| Service cost | ||||||||||||
| Current service cost | 327,707 | - | 327,707 | |||||||||
| Past service cost | 22,036 | - | 22,036 | |||||||||
| Net interest expense (income) | 189,043 | (109,636 | ) | 79,407 | ||||||||
| Recognized in profit or loss | 538,786 | (109,636 | ) | 429,150 | ||||||||
| Remeasurement | ||||||||||||
| Return on plan assets (excluding amounts included in net interest) | - | 29,338 | 29,338 | |||||||||
| Actuarial gain arising from changes in financial assumptions | (46,913 | ) | - | (46,913 | ) | |||||||
| Actuarial loss arising from experience adjustments | 38,516 | - | 38,516 | |||||||||
(Continued)
| - 55 - |
| Present value of the defined benefit obligation | Fair value of the plan assets | Net defined benefit liability (asset) | ||||||||||
| NT$ | NT$ | NT$ | ||||||||||
| Actuarial loss arising from changes in demographic assumptions | 7,204 | - | 7,204 | |||||||||
| Recognized in other comprehensive income | (1,193 | ) | 29,338 | 28,145 | ||||||||
| Contributions from the employer | - | (556,555 | ) | (556,555 | ) | |||||||
| Benefits paid from the pension fund | (292,996 | ) | 292,996 | - | ||||||||
| Benefits paid from the Group | (16,237 | ) | - | (16,237 | ) | |||||||
| Exchange differences on foreign plans | (26,212 | ) | (39,826 | ) | (66,038 | ) | ||||||
| Balance at December 31, 2014 | $ | 7,674,293 | $ | (3,502,487 | ) | $ | 4,171,806 | |||||
(Concluded)
| 8) | The fair value of the plan assets by major categories at each balance sheet date was as follows: |
| December 31 | ||||||||
| 2015 | 2014 | |||||||
| NT$ | NT$ | |||||||
| Cash and cash equivalents | $ | 2,090,399 | $ | 1,854,926 | ||||
| Debt instruments | 1,020,532 | 691,720 | ||||||
| Equity instruments | 823,496 | 869,752 | ||||||
| Others | 39,302 | 86,089 | ||||||
| Total | $ | 3,973,729 | $ | 3,502,487 | ||||
| 9) | Through the defined benefit plans under the Labor Standards Law, the Company and its subsidiaries are exposed to the following risks: |
| a) | Investment risk |
The plan assets are invested in equity and debt securities, bank deposits, etc. The investment is conducted at the discretion of the Bureau or under the mandated management. However, in accordance with relevant regulations, the return generated by plan assets should not be below the interest rate for a 2-year time deposit with local banks.
| b) | Interest risk |
A decrease in the government bond interest rate will increase the present value of the defined benefit obligation; however, this will be partially offset by an increase in the return on the plan’s debt investments.
| c) | Salary risk |
The present value of the defined benefit obligation is calculated by reference to the future salaries of plan participants. As such, an increase in the salary of the plan participants will increase the present value of the defined benefit obligation.
| - 56 - |
| 10) | The management of ASE Korea is responsible for the administration of the fund and determination of the investment strategies according to related local regulations. ASE Korea is responsible for the shortfall between the fund and the defined benefit obligation. All of the plan assets are invested in the certificates of deposits. |
| 11) | Significant actuarial assumptions for the determination of the defined obligation are discount rates and expected rates of salary increase. The sensitivity analysis below has been determined based on reasonably possible changes of the respective assumptions occurring at each balance sheet date, while holding all other assumptions constant. |
| December 31, 2015 | ||||
| NT$ | ||||
| Discount Rate | ||||
| 0.5% higher | $ | (444,132 | ) | |
| 0.5% lower | $ | 497,046 | ||
| Expected rates of salary increase | ||||
| 0.5% higher | $ | 476,378 | ||
| 0.5% lower | $ | (426,130 | ) | |
The sensitivity analysis presented above may not be representative of the actual change in the defined benefit obligation as it is unlikely that the change in assumptions would occur in isolation of one another as some of the assumptions may be correlated.
| 12) | Maturity analysis of undiscounted pension benefit |
| December 31 | ||||||||
| 2015 | 2014 | |||||||
| NT$ | NT$ | |||||||
| No later than 1 year | $ | 247,030 | $ | 249,000 | ||||
| Later than 1 year and not later than 5 years | 1,616,804 | 1,462,070 | ||||||
| Later than 5 years | 17,674,518 | 14,468,022 | ||||||
| $ | 19,538,352 | $ | 16,179,092 | |||||
The Group expects to make contributions of NT$705,384 thousand to the defined benefit plans in the next year starting from January 1, 2016.
As of December 31, 2015 and 2014, the average duration of the defined benefit obligation excluding those for executive managers of the Group was 8 to 16 years and 9 to 18 years, respectively.
| 21. | EQUITY |
| a. | Share capital |
Ordinary shares
December 31, 2015 | December 31, 2014 | |||||||
| Numbers of shares authorized (in thousands) | 10,000,000 | 10,000,000 | ||||||
(Continued)
| - 57 - |
December 31, 2015 | December 31, 2014 | |||||||
| Numbers of shares reserved (in thousands) | ||||||||
| Employee share options | 800,000 | 800,000 | ||||||
| Shares authorized | $ | 100,000,000 | $ | 100,000,000 | ||||
| Shares reserved | ||||||||
| Employee share options | $ | 8,000,000 | $ | 8,000,000 | ||||
| Numbers of shares registered (in thousands) | 7,902,929 | 7,852,538 | ||||||
| Numbers of shares subscribed in advance (in thousands) | 7,499 | 9,187 | ||||||
| Number of shares issued and fully paid (in thousands) | 7,910,428 | 7,861,725 | ||||||
(Concluded)
The holders of issued ordinary shares with a par value at $10 per share are entitled the right to vote and receive dividends, except the shares held by the Group’s subsidiaries which are not entitled the right to vote. As of December 31, 2015 and 2014, there were 500,000 thousand ordinary shares included in the authorized shares that were not yet required to complete the share registration process.
American Depositary Receipts
The Company issued ADSs and each ADS represents five ordinary shares. As of December 31, 2015 and 2014, 115,240 thousand and 125,731 thousand ADSs were outstanding and represented approximately 576,198 thousand and 628,657 thousand ordinary shares of the Company, respectively.
| b. | Capital surplus |
| December 31 | ||||||||
| 2015 | 2014
(Adjusted)
| |||||||
| NT$ | NT$ | |||||||
| May be used to offset a deficit, distributed as cash dividends, or transferred to share capital (1) | ||||||||
| Arising from issuance of ordinary shares | $ | 5,479,616 | $ | 4,946,308 | ||||
| Arising from the difference between consideration received and the carrying amount of the subsidiaries’ net assets during actual disposal or acquisition | 7,197,510 | - | ||||||
| May be used to offset a deficit only | ||||||||
| Arising from changes in percentage of ownership interest in subsidiaries (2) | 8,489,984 | 9,054,328 | ||||||
| Arising from treasury share transactions | 717,355 | 425,004 | ||||||
| Arising from exercised employee share options | 544,112 | 375,448 | ||||||
| Arising from expired employee share options | 3,626 | 3,626 | ||||||
(Continued)
| - 58 - |
| December 31 | ||||||||
| 2015 | 2014 (Adjusted) | |||||||
| NT$ | NT$ | |||||||
| May not be used for any purpose | ||||||||
| Arising from employee share options | $ | 1,080,590 | $ | 1,178,210 | ||||
| Arising from equity component of convertible bonds | 214,022 | - | ||||||
| Arising from share of changes in capital surplus of associates | 30,284 | 30,134 | ||||||
| $ | 23,757,099 | $ | 16,013,058 | |||||
(Concluded)
| 1) | Such capital surplus may be used to offset a deficit; in addition, when the Company has no deficit, such capital surplus may be distributed as cash dividends or transferred to share capital (limited to a certain percentage of the Company’s capital surplus and once a year). |
| 2) | Such capital surplus arises from the effect of changes in ownership interest in a subsidiary resulted from equity transactions other than actual disposal or acquisition, or from changes in capital surplus of subsidiaries accounted for by using equity method. |
| c. | Retained earnings and dividend policy |
The Articles of Incorporation of ASE Inc. (the “Articles”) provides that annual net income shall be distributed in the following order:
| 1) | Replenishment of deficits; |
| 2) | 10.0% as legal reserve; |
| 3) | Special reserve appropriated or reversed in accordance with laws or regulations set forth by the authorities concerned; |
| 4) | An amount equal to the excess of the income from investments accounted for using the equity method over cash dividends as special reserve; |
| 5) | Addition or deduction of realized gains or losses on equity instruments at fair value through other comprehensive income; |
| 6) | Not more than 1.0% of the remainder, from 1) to 5), as remuneration to directors; |
| 7) | Between 7.0% to 11.0% of the remainder, from 1) to 5), as bonus to employees, of which 7.0% shall be distributed in accordance with the employee bonus plan and the excess shall be distributed to specified employees at the board of directors’ discretion; and |
| 8) | Any remainder from above as dividends to shareholders. |
Employees to whom referred in 7) above include employees of subsidiaries that meet certain conditions, which are to be determined by the board of directors.
The Company is currently in the mature growth stage. To meet the capital needs for business development now and in the future and satisfy the shareholders’ demand for cash inflows, the Company shall use residual dividend policy to distribute dividends, of which the cash dividend is not lower than 30% of the total dividend distribution, with the remainder to be distributed in stock. A distribution plan is also to be made by the board of directors and passed for resolution in the shareholders’ meeting.
| - 59 - |
In accordance with the amendments to the Company Act in May 2015, the recipients of dividends and bonuses are limited to shareholders and do not include employees. Accordingly, the Company expects to make amendments to the Company’s Articles of Incorporation to be approved during the 2016 annual shareholders’ meeting. For information about the accrual basis of the employee compensation and remuneration to directors and supervisors and the actual appropriations, please refer to employee benefits expense under profit before income tax in Note 22 (e).
Under Rule No. 1010012865 and Rule No. 1010047490 issued by the FSC and the directive titled “Questions and Answers for Special Reserves Appropriated Following Adoption of IFRSs”, the Company should appropriate or reverse to a special reserve. Any special reserve appropriated may be reversed to the extent that the net debit balance reverses and thereafter distributed.
Appropriation of earnings to legal reserve shall be made until the legal reserve equals the Company’s capital surplus. Legal reserve may be used to offset deficits. If the Company has no deficit and the legal reserve has exceeded 25% of the Company’s capital surplus, the excess may be transferred to capital or distributed in cash.
The appropriations of earnings for 2014 and 2013 resolved at the Company’s annual shareholders’ meetings in June 2015 and June 2014, respectively, were as follows:
| Appropriation of Earnings | Dividends Per Share | |||||||||||||||
| For Year 2014 | For Year 2013 | For Year 2014 | For Year 2013 | |||||||||||||
| NT$ | NT$ | NT$ | NT$ | |||||||||||||
| (in dollars) | (in dollars) | |||||||||||||||
| Legal reserve | $ | 2,359,267 | $ | 1,568,907 | ||||||||||||
| Special reserve | - | (309,992 | ) | |||||||||||||
| Cash dividends | 15,589,825 | 10,156,005 | $ | 2.00 | $ | 1.30 | ||||||||||
| $ | 17,949,092 | $ | 11,414,920 | |||||||||||||
| d. | Special reserve appropriated in accordance with the local regulations |
On January 1, 2013, the Company appropriated to the special reserve of NT$3,353,938 thousand relating to the exchange differences on translating foreign operations transferred to retained earnings in accordance with the local regulations.
| e. | Accumulated other comprehensive income |
| 1) | Exchange differences on translating foreign operations |
| For the Years Ended December 31 | ||||||||
| 2015 | 2014 (Adjusted) | |||||||
| NT$ | NT$ | |||||||
| Balance at January 1 | $ | 4,541,761 | $ | (525,583 | ) | |||
| Exchange differences arising on translating foreign operations | 11,459 | 5,065,577 | ||||||
| Share of exchange difference of associates accounted for using the equity method | (59,650 | ) | 1,767 | |||||
| Balance at December 31 | $ | 4,493,570 | $ | 4,541,761 | ||||
| - 60 - |
| 2) | Unrealized gain on available-for-sale financial assets |
| For the Years Ended December 31 | ||||||||
| 2015 | 2014 | |||||||
| NT$ | NT$ | |||||||
| Balance at January 1 | $ | 526,778 | $ | 426,246 | ||||
| Unrealized loss arising on revaluation of available-for-sale financial assets | (4,304 | ) | (142,418 | ) | ||||
| Cumulative loss reclassified to profit or loss on disposal of available-for-sale financial assets | 10,827 | 9,561 | ||||||
| Share of unrealized gain on available-for-sale financial assets of associates accounted for using the equity method | 54,818 | 233,389 | ||||||
| Balance at December 31 | $ | 588,119 | $ | 526,778 | ||||
| 3) | Cash flow hedges – for the year ended December 31, 2014 |
| For the Years Ended December 31, 2014 | ||||
| NT$ | ||||
| Balance at January 1 | $ | (3,279 | ) | |
| Gain arising on changes in the fair value of hedging instruments - Interest rate swap contracts | 795 | |||
| Cumulative loss arising on changes in fair value of hedging instruments reclassified to profit or loss - Interest rate swap contracts | 2,484 | |||
| Balance at December 31 | $ | - | ||
| f. | Treasury shares (in thousand shares) |
| Balance at | Balance at | |||||||||||||||
| January 1 | Addition | Decrease | December 31 | |||||||||||||
| 2015 | ||||||||||||||||
| Shares held by subsidiaries | 145,883 | - | - | 145,883 | ||||||||||||
| Shares reserved for bonds conversion | - | 120,000 | - | 120,000 | ||||||||||||
| 145,883 | 120,000 | - | 265,883 | |||||||||||||
| 2014 | ||||||||||||||||
| Shares held by subsidiaries | 145,883 | - | - | 145,883 | ||||||||||||
In February 2015, the board of directors approved to repurchase up to 120,000 thousand of the Company’s ordinary shares which will be used for equity conversion of convertible overseas bonds to be issued in the future. The Company has completed the repurchase during March 2015 and the shares repurchased accounted for 1.53% of the Company’s total issued shares. The average repurchase price was NT$44.45 per share.
The Company’s shares held by its subsidiaries at each balance sheet date were as follows:
| - 61 - |
Shares Held By Subsidiaries | Carrying amount | Fair Value | ||||||||||
| (in thousand shares) | NT$ | NT$ | ||||||||||
| December 31, 2015 | ||||||||||||
| ASE Test | 88,200 | $ | 1,380,721 | $ | 3,351,618 | |||||||
| J&R Holding | 46,704 | 381,709 | 1,774,743 | |||||||||
| ASE Test, Inc. | 10,979 | 196,677 | 417,193 | |||||||||
| 145,883 | $ | 1,959,107 | $ | 5,543,554 | ||||||||
| December 31, 2014 | ||||||||||||
| ASE Test | 88,200 | $ | 1,380,721 | $ | 3,360,438 | |||||||
| J&R Holding | 46,704 | 381,709 | 1,779,413 | |||||||||
| ASE Test, Inc. | 10,979 | 196,677 | 418,291 | |||||||||
| 145,883 | $ | 1,959,107 | $ | 5,558,142 | ||||||||
Fair values of the Company’s shares held by subsidiaries are based on the closing price from an available published price quotation, which is a Level 1 input in terms of IFRS 13, at the balance sheet dates.
The Company issued ordinary shares in connection with its merger with its subsidiaries. The shares held by its subsidiaries were reclassified from investments accounted for using the equity method to treasury shares on the proportion owned by the Company.
Under the Securities and Exchange Act in the ROC, the Company shall neither pledge treasury shares nor exercise shareholders’ rights on these shares, such as rights to dividends and voting. The subsidiaries holding treasury shares, however, retain shareholders’ rights except the rights to participate in any share issuance for cash and voting.
| f. | Non-controlling interests |
| For the Years Ended December 31 | ||||||||
| 2015 | 2014 (Adjusted) | |||||||
| NT$ | NT$ | |||||||
| Balance at January 1 | $ | 8,219,097 | $ | 4,133,282 | ||||
| Attributable to non-controlling interests: | ||||||||
| Share of profit for the year | 970,134 | 645,063 | ||||||
| Exchange difference on translating foreign operations | (74,968 | ) | 339,450 | |||||
| Unrealized gain (loss) on available-for-sale financial assets | 3,928 | (857 | ) | |||||
| Defined benefit plan actuarial losses | (3,440 | ) | (857 | ) | ||||
| Cash capital increase of subsidiary (Note 26) | - | 3,068,406 | ||||||
| Additional non-controlling interests arising from partial disposal of subsidiaries (Note 26) | 1,712,836 | - | ||||||
| Spin-off of subsidiaries | 3,535 | - | ||||||
(Continued)
| - 62 - |
| For the Years Ended December 31 | ||||||||
| 2015 | 2014
(Adjusted)
| |||||||
| NT$ | NT$ | |||||||
| Non-controlling interest relating to outstanding vested share options held by the employees of subsidiaries | $ | 904,904 | $ | 120,376 | ||||
| Cash dividends to non-controlling interests | (232,148 | ) | (85,766 | ) | ||||
| Balance at December 31 | $ | 11,503,878 | $ | 8,219,097 | ||||
(Concluded)
| 22. | PROFIT BEFORE INCOME TAX |
| a. | Other income |
| For the Years Ended December 31 | ||||||||
| 2015 | 2014 | |||||||
| NT$ | NT$ | |||||||
| Dividends income | $ | 396,973 | $ | 101,252 | ||||
| Interest income | 242,084 | 243,474 | ||||||
| Government subsidy | 176,721 | 184,525 | ||||||
| Rental income | 60,230 | 59,624 | ||||||
| $ | 876,008 | $ | 588,875 | |||||
| b. | Other gains, net |
| For the Years Ended December 31 | ||||||||
| 2015 | 2014 | |||||||
| NT$ | NT$ | |||||||
| Net gain arising on financial instruments held for trading | $ | 1,657,093 | $ | 1,266,653 | ||||
| Net gain on financial assets designated as at FVTPL | 815,742 | 572,187 | ||||||
| Foreign exchange loss, net | (713,213 | ) | (1,221,979 | ) | ||||
| Impairment loss | (258,129 | ) | (308,144 | ) | ||||
| Others | (64,457 | ) | 467,573 | |||||
| $ | 1,437,036 | $ | 776,290 | |||||
| c. | Finance costs |
| For the Years Ended December 31 | ||||||||
| 2015 | 2014 | |||||||
| NT$ | NT$ | |||||||
| Total interest expense for financial liabilities measured at amortized cost | $ | 2,514,208 | $ | 2,548,850 | ||||
| Less: Amounts included in the cost of qualifying assets | ||||||||
| Inventories related to real estate business | (197,287 | ) | (100,705 | ) | ||||
| Property, plant and equipment | (48,135 | ) | (126,203 | ) | ||||
| 2,268,786 | 2,321,942 | |||||||
(Continued)
| - 63 - |
| For the Years Ended December 31 | ||||||||
| 2015 | 2014 | |||||||
| NT$ | NT$ | |||||||
| Loss arising on derivatives as designated hedging instruments in cash flow hedge accounting relationship reclassified from equity to profit or loss | $ | - | $ | 2,484 | ||||
| Other finance costs | 43,357 | 29,671 | ||||||
| $ | 2,312,143 | $ | 2,354,097 | |||||
(Concluded)
Information relating to the capitalized borrowing costs was as follows:
| For the Years Ended December 31 | ||||
| 2015 | 2014 | |||
| Annual interest capitalization rates | ||||
| Inventories related to real estate business | 4.35%-6.77% | 6.00%-7.21% | ||
| Property, plant and equipment | 0.75%-6.15% | 0.88%-6.15% | ||
| d. | Depreciation and amortization |
| For the Years Ended December 31 | ||||||||
| 2015 | 2014 | |||||||
| NT$ | NT$ | |||||||
| Property, plant and equipment | $ | 28,938,770 | $ | 25,805,042 | ||||
| Intangible assets | 579,894 | 545,734 | ||||||
| Total | $ | 29,518,664 | $ | 26,350,776 | ||||
| Summary of depreciation by function | ||||||||
| Operating costs | $ | 27,023,957 | $ | 24,050,546 | ||||
| Operating expenses | 1,914,813 | 1,754,496 | ||||||
| $ | 28,938,770 | $ | 25,805,042 | |||||
| Summary of amortization by function | ||||||||
| Operating costs | $ | 124,235 | $ | 180,719 | ||||
| Operating expenses | 455,659 | 365,015 | ||||||
| $ | 579,894 | $ | 545,734 | |||||
| - 64 - |
| e. | Employee benefits expense |
| For the Years Ended December 31 | ||||||||
| 2015 | 2014 (Adjusted) | |||||||
| NT$ | NT$ | |||||||
| Post-employment benefits (Note 20) | ||||||||
| Defined contribution plans | $ | 1,693,060 | $ | 1,589,505 | ||||
| Defined benefit plans | 413,490 | 445,795 | ||||||
| 2,106,550 | 2,035,300 | |||||||
| Equity-settled share-based payments | 133,496 | 110,157 | ||||||
| Salary, incentives and bonus | 41,985,329 | 40,475,594 | ||||||
| Other employee benefits | 6,529,812 | 5,984,074 | ||||||
| $ | 50,755,187 | $ | 48,605,125 | |||||
| Summary of employee benefits expense by function | ||||||||
| Operating costs | $ | 34,720,359 | $ | 33,243,224 | ||||
| Operating expenses | 16,034,828 | 15,361,901 | ||||||
| $ | 50,755,187 | $ | 48,605,125 | |||||
The existing Articles of Incorporation of the Company stipulate to distribute bonus to employees and remuneration to directors and supervisors at the rates in 7%-11% and no higher than 1% from net income (net of the bonus and remuneration) , respectively (retained earnings and dividend policy in Note 21c). For the year ended December 31, 2014, the bonus to employees and the remuneration to directors and supervisors were NT$2,335,786 thousand and NT$212,344 thousand, respectively, representing 11% and 1%, respectively, of the net income (net of the bonus and remuneration).
To be in compliance with the Company Act as amended in May 2015, the amended Articles of Incorporation of the Company, as proposed by the board of directors in January 2016, stipulate to distribute employees’ compensation and remuneration to directors at the rates in 5.25%-8.25% and no higher than 0.75%, respectively, of net profit before income tax, employees’ compensation and remuneration to directors. For the year ended December 31, 2015, the employees’ compensation and the remuneration to directors were NT$2,033,500 thousand and NT$184,500 thousand, respectively, which were accrued based on 8.25% and 0.75% of net profit before income tax, employees’ compensation and remuneration to directors, respectively. The employees’ compensation and remuneration to directors for the year ended December 31, 2015 are subject to the resolution of the Company’s board of directors and the resolution of the amendments to the Company’s Articles of Incorporation for adoption by the shareholders in their meeting to be held in June 2016, and in addition thereto a report of such distribution shall be submitted to the shareholders’ meeting.
Material differences between such estimated amounts and the amounts proposed by the board of directors on or before the annual consolidated financial statements approved for issue are adjusted in the year the compensation and remuneration were recognized. If there is a change in the proposed amounts after the consolidated financial statements authorized for issue, the differences are recorded as a change in accounting estimate.
| - 65 - |
The bonus to employees and the remuneration to directors and supervisors for 2014 and 2013 distributed in cash resolved at the Company’s annual shareholders’ meetings in June 2015 and June 2014, respectively, were as follows:
| For Year 2014 | For Year 2013 | |||||||
| NT$ | NT$ | |||||||
| Bonus to employees | $ | 2,335,600 | $ | 1,587,300 | ||||
| Remuneration to directors and supervisors | 211,200 | 144,000 | ||||||
The differences between the resolved amounts of the bonus to employees and remuneration to directors and supervisors and the accrued amounts reflected in the consolidated financial statements for the years ended December 31, 2014 and 2013 was deemed changes in estimates. The difference was NT$1,330 thousand and NT$385 thousand and had been adjusted in earnings for the years ended December 31, 2015 and 2014, respectively.
Information regarding the bonus to employees and the remuneration to directors and supervisors resolved by the Company’s board of directors and the shareholders’ meeting is available on the Market Observation Post System website of the TSE.
| 23. | INCOME TAX |
| a. | Income tax recognized in profit or loss |
The major components of income tax expense were as follows:
| For the Years Ended December 31 | ||||||||
| 2015 | 2014 (Adjusted) | |||||||
| NT$ | NT$ | |||||||
| Current income tax | ||||||||
| In respect of the current year | $ | 4,029,076 | $ | 3,524,456 | ||||
| Income tax on unappropriated earnings | 474,076 | 25,737 | ||||||
| Adjustments for prior years | (20,719 | ) | 72,380 | |||||
| 4,482,433 | 3,622,573 | |||||||
| Deferred income tax | ||||||||
| In respect of the current year | 436,374 | 571,662 | ||||||
| Effect of foreign currency exchange differences | (58,671 | ) | 75,305 | |||||
| Others | (20,890 | ) | (2,914 | ) | ||||
| 356,813 | 644,053 | |||||||
| Income tax expense recognized in profit or loss | $ | 4,839,246 | $ | 4,266,626 | ||||
| - 66 - |
A reconciliation of income tax expense calculated at the statutory rate and income tax expense recognized in profit or loss was as follows:
| For the Years Ended December 31 | ||||||||
| 2015 | 2014 (Adjusted) | |||||||
| NT$ | NT$ | |||||||
| Profit before income tax | $ | 25,288,253 | $ | 28,548,211 | ||||
| Income tax expense calculated at the statutory rate | $ | 6,306,316 | $ | 5,104,220 | ||||
| Nontaxable expense in determining taxable income | 161,362 | 126,407 | ||||||
| Tax-exempt income | (537,987 | ) | (623,652 | ) | ||||
| Additional income tax on unappropriated earnings | 624,564 | 488,517 | ||||||
| Loss carry-forward and income tax credits currently used | (1,044,954 | ) | (1,186,565 | ) | ||||
| Remeasurement of deferred income tax assets, net | (649,336 | ) | 291,956 | |||||
| Adjustments for prior years’ tax | (20,719 | ) | 72,380 | |||||
| Land value increment tax | - | (6,637 | ) | |||||
| Income tax expense recognized in profit or loss | $ | 4, 839,246 | $ | 4,266,626 | ||||
For the years ended December 31, 2015 and 2014, the Group applied a tax rate of 17% for resident entities subject to the Income Tax Law of the ROC; for the subsidiaries located in China, the applied tax rate was 25%; and for other jurisdictions, the Group measures taxes by using the applicable tax rate for each individual jurisdiction.
As the status of 2016 appropriations of earnings is uncertain, the potential income tax consequences of 2015 unappropriated earnings are not reliably determinable.
| b. | Income tax recognized directly in equity |
| For the Years Ended December 31 | ||||||||
| 2015 | 2014 | |||||||
| NT$ | NT$ | |||||||
| Deferred income tax | ||||||||
| Employee share options | $ | (33 | ) | $ | 4,481 | |||
| c. | Income tax recognized in other comprehensive income |
| For the Years Ended December 31 | ||||||||
| 2015 | 2014 (Adjusted) | |||||||
| NT$ | NT$ | |||||||
| Deferred income tax | ||||||||
| Actuarial loss on defined benefit plan | $ | 11,002 | $ | 22,938 | ||||
| - 67 - |
| d. | Current tax assets and liabilities |
| December 31 | ||||||||
| 2015 | 2014 | |||||||
| NT$ | NT$ | |||||||
| Current tax assets | ||||||||
| Tax refund receivable | $ | 10,984 | $ | 23,616 | ||||
| Prepaid income tax | 157,733 | 41,696 | ||||||
| $ | 168,717 | $ | 65,312 | |||||
| Current tax liabilities | ||||||||
| Income tax payable | $ | 4,551,785 | $ | 4,150,036 | ||||
| e. | Deferred tax assets and liabilities |
The Group offset certain deferred tax assets and deferred tax liabilities which met the offset criteria.
The movements of deferred tax assets and deferred tax liabilities were as follows:
Balance at January 1 (Adjusted) | Recognized in Profit or Loss | Recognized in Other Comprehensive Income | Recognized in Equity | Exchange Differences | Balance at December 31 | |||||||||||||||||||
| NT$ | NT$ | NT$ | NT$ | NT$ | NT$ | |||||||||||||||||||
| Year ended December 31, 2015 | ||||||||||||||||||||||||
| Temporary differences | ||||||||||||||||||||||||
| Property, plant and equipment | $ | (2,431,855 | ) | $ | (1,083,273 | ) | $ | - | $ | - | $ | 10,670 | $ | (3,504,458 | ) | |||||||||
| Defined benefit obligation | 796,642 | 20,398 | 11,002 | - | 17,897 | 845,939 | ||||||||||||||||||
| FVTPL financial instruments | (170,059 | ) | (62,152 | ) | - | - | 13 | (232,198 | ) | |||||||||||||||
| Others | 1,166,297 | 229,799 | - | (33 | ) | (11,076 | ) | 1,384,987 | ||||||||||||||||
| (638,975 | ) | (895,228 | ) | 11,002 | (33 | ) | 17,504 | (1,505,730 | ) | |||||||||||||||
| Loss carry-forward | 519,898 | 812,217 | - | - | (8,538 | ) | 1,323,577 | |||||||||||||||||
| Investment credits | 694,082 | (274,655 | ) | - | - | (68,308 | ) | 351,119 | ||||||||||||||||
| Others | (853 | ) | 853 | - | - | - | - | |||||||||||||||||
| $ | 574,152 | $ | (356,813 | ) | $ | 11,002 | $ | (33 | ) | $ | (59,342 | ) | $ | 168,966 | ||||||||||
Balance at January 1 (Adjusted) | Recognized in Profit or Loss (Adjusted) | Recognized in Other Comprehensive Income (Adjusted) | Recognized in Equity (Adjusted) | Exchange Differences (Adjusted) | Balance at December 31 (Adjusted) | |||||||||||||||||||
| NT$ | NT$ | NT$ | NT$ | NT$ | NT$ | |||||||||||||||||||
| Year ended December 31, 2014 | ||||||||||||||||||||||||
| Temporary differences | ||||||||||||||||||||||||
| Property, plant and equipment | $ | (1,684,616 | ) | $ | (804,082 | ) | $ | - | $ | - | $ | 56,843 | $ | (2,431,855 | ) | |||||||||
| Defined benefit obligation | 854,540 | (59,807 | ) | 22,938 | - | (21,029 | ) | 796,642 | ||||||||||||||||
| FVTPL financial instruments | (12,329 | ) | (170,722 | ) | - | - | 12,992 | (170,059 | ) | |||||||||||||||
| Others | 767,744 | 372,563 | - | 4,481 | 21,509 | 1,166,297 | ||||||||||||||||||
| (74,661 | ) | (662,048 | ) | 22,938 | 4,481 | 70,315 | (638,975 | ) | ||||||||||||||||
| Loss carry-forward | 270,031 | 246,334 | - | - | 3,533 | 519,898 | ||||||||||||||||||
| Investment credits | 924,128 | (227,486 | ) | - | - | (2,560 | ) | 694,082 | ||||||||||||||||
| Others | - | (853 | ) | - | - | - | (853 | ) | ||||||||||||||||
| $ | 1,119,498 | $ | (644,053 | ) | $ | 22,938 | $ | 4,481 | $ | 71,288 | $ | 574,152 | ||||||||||||
| - 68 - |
| f. | Items for which no deferred tax assets have been recognized |
Unrecognized deferred tax assets related to loss carry-forward, investment credits and deductible temporary differences were summarized as follows:
| December 31 | ||||||||
| 2015 | 2014 | |||||||
| NT$ | NT$ | |||||||
| Loss carry-forward | $ | 666,373 | $ | 694,960 | ||||
| Investment credits | 387,480 | 629,231 | ||||||
| Deductible temporary differences | 1,007,105 | 957,183 | ||||||
| $ | 2,060,958 | $ | 2,281,374 | |||||
The unrecognized loss carry-forward will expire through 2030 and the unrecognized investment credits will expire through 2018.
| g. | Information about unused loss carry-forward, unused investment credits, tax-exemption and other tax relief |
As of December 31, 2015, the unused loss carry-forward comprised of:
| Year of Expiry | NT$ | |||
| 2016 | $ | 124,478 | ||
| 2017 | 318,985 | |||
| 2018 | 268,332 | |||
| 2019 | 333,284 | |||
| 2020 and thereafter | 944,871 | |||
| $ | 1,989,950 | |||
As of December 31, 2015, unused investment credits comprised of:
| Remaining Creditable Amount | ||||||||
| Laws and Statutes | Tax Credit Source | NT$ | Expiry Year | |||||
| Statute for Upgrading Industries | Purchase of machinery and equipment | $ | 710,863 | 2018 | ||||
| Others | 27,736 | 2017 | ||||||
| $ | 738,599 | |||||||
As of December 31, 2015, profits attributable to the following expansion projects were exempted from income tax for a 3-year or 5-year period:
| Tax-exemption Period | |
| Construction and expansion of 2004 by the Company | 2012.01-2016.12 |
| Construction and expansion of 2005 by the Company | 2012.01-2016.12 |
(Continued)
| - 69 - |
| Tax-exemption Period | |
| Construction and expansion of 2007 by the Company | 2013.01-2015.12 |
| Construction and expansion of 2008 by the Company | 2014.01-2018.12 |
| Construction and expansion of 2007 by the Company | 2016.01-2020.12 |
| Construction and expansion of 2005 by ASE Test Inc. | 2011.01-2015.12 |
| Construction and expansion of 2008 by ASE Test Inc. | 2014.01-2018.12 |
| Construction and expansion of 2009 by ASE Test Inc. | 2018.01-2022.12 |
| Construction of 2005 by ASE Electronics Inc. | 2012.01-2016.12 |
| Expansion of 2008 by ASE Electronics Inc. | 2016.01-2020.12 |
(Concluded)
Some China subsidiaries qualify as high technology enterprises which entitle them to a reduced income tax rate of 15% and also make them eligible to deduct certain times of research and development expenses from their taxable income.
| h. | Unrecognized deferred tax liabilities associated with investments |
As of December 31, 2015 and 2014, the taxable temporary differences associated with investments in subsidiaries for which no deferred tax liabilities have been recognized were NT$12,676,347 thousand and NT$11,400,826 thousand, respectively.
| i. | Integrated income tax |
As of December 31, 2015 and 2014, unappropriated earnings were all generated on and after January 1, 1998. As of December 31, 2015 and 2014, the balance of the Imputation Credit Account (“ICA”) was NT$1,913,243 thousand and NT$934,038 thousand, respectively.
The creditable ratio for the distribution of earnings of 2015 and 2014 was 8.66% (estimated) and 6.88% (actual), respectively.
| j. | Income tax assessments |
Income tax returns of ASE Inc. and its ROC subsidiaries have been examined by authorities through 2012 and through 2010, 2011, 2012 or 2013, respectively. ASE Inc. and some of its ROC subsidiaries disagreed with the result of examinations relating to its income tax returns for 2004 through 2008 and 2010 through 2012 and appealed to the tax authorities. A settlement was reached in June 2015. The related income tax expenses in the years resulting from the examinations have been accrued in respective tax years or in the year of the settlement.
| 24. | EARNINGS PER SHARE |
The earnings and weighted average number of ordinary shares outstanding in the computation of earnings per share were as follows:
Net profit for the year
| For the Years Ended December 31 | ||||||||
| 2015 | 2014 (Adjusted) | |||||||
| NT$ | NT$ | |||||||
| Profit for the year attributable to owners of the Company | $ | 19,478,873 | $ | 23,636,522 | ||||
(Continued)
| - 70 - |
| For the Years Ended December 31 | ||||||||
| 2015 | 2014 (Adjusted) | |||||||
| NT$ | NT$ | |||||||
| Effect of potentially dilutive ordinary shares: | ||||||||
| Employee share options issued by subsidiaries | $ | (210,126 | ) | $ | (260,925 | ) | ||
| Convertible bonds | 901,187 | 931,344 | ||||||
| Earnings used in the computation of diluted earnings per share | $ | 20,169,934 | $ | 24,306,941 | ||||
(Concluded)
Weighted average number of ordinary shares outstanding (in thousand shares):
| For the Years Ended December 31 | ||||||||
| 2015 | 2014 | |||||||
| Weighted average number of ordinary shares in computation of basic earnings per share | 7,652,773 | 7,687,930 | ||||||
| Effect of potentially dilutive ordinary shares: | ||||||||
| Convertible bonds | 455,671 | 375,271 | ||||||
| Employee share options | 86,994 | 101,850 | ||||||
| Bonus to employees or employees’ compensation | 54,626 | 55,643 | ||||||
| Weighted average number of ordinary shares in computation of diluted earnings per share | 8,250,064 | 8,220,694 | ||||||
The Group is able to settle the compensation or bonuses paid to employees in cash or shares. The Group assumed that the entire amount of the compensation or bonus would be settled in shares and the resulting potential shares were included in the weighted average number of ordinary shares outstanding used in the computation of diluted earnings per share if the effect is dilutive. Such dilutive effect of the potential shares was included in the computation of diluted earnings per share until the shareholders approve the number of shares to be distributed to employees at their meeting in the following year.
| 25. | SHARE-BASED PAYMENT ARRANGEMENTS |
Employee share option plans of the Company and its subsidiaries
In order to attract, retain and reward employees, ASE Inc. has five employee share option plans for full-time employees of the Group, including 100,000 thousand share options approved to be granted in April 2015. Each share option represents the right to purchase one ordinary share of ASE Inc. when exercised. Under the terms of the plans, share options are granted at an exercise price equal to or not less than the closing price of the ordinary shares listed on the TSE at the grant date. The option rights of these plans are valid for 10 years, non-transferable and exercisable at certain percentages subsequent to the second anniversary of the grant date. For any subsequent changes in the Company’s capital structure, the exercise price is accordingly adjusted.
| - 71 - |
| a. | ASE Inc. Option Plans |
Information about share options was as follows:
| For the Years Ended December 31 | ||||||||||||||||
| 2015 | 2014 | |||||||||||||||
| Weighted | Weighted | |||||||||||||||
| Average | Average | |||||||||||||||
| Number of | Exercise | Number of | Exercise | |||||||||||||
| Options | Price | Options | Price | |||||||||||||
| (In | Per Share | (In | Per Share | |||||||||||||
| Thousands) | (NT$) | Thousands) | (NT$) | |||||||||||||
| Balance at January 1 | 209,745 | $ | 20.7 | 285,480 | $ | 20.5 | ||||||||||
| Options granted | 94,270 | 36.5 | - | - | ||||||||||||
| Options forfeited | (1,975 | ) | 30.3 | (1,515 | ) | 20.5 | ||||||||||
| Options expired | (730 | ) | 11.1 | (322 | ) | 13.5 | ||||||||||
| Options exercised | (48,703 | ) | 20.6 | (73,898 | ) | 19.7 | ||||||||||
| Balance at December 31 | 252,607 | 26.6 | 209,745 | 20.7 | ||||||||||||
| Options exercisable, end of year | 158,103 | 20.8 | 189,240 | 20.7 | ||||||||||||
| Weighted-average fair value of options granted (NT$) | $ 7.18~7.39 | $ | - | |||||||||||||
The weighted average share price at exercise dates of share options for the years ended December 31, 2015 and 2014 was NT$38.8 and NT$35.1, respectively.
Information about the Company’s outstanding share options at each balance sheet date was as follows:
| Range of Exercise Price Per Share (NT$) | Weighted Average Remaining Contractual Life (Years) | |||||
| December 31, 2015 | $ 20.4-22.6 | 3.5 | ||||
| 36.5 | 9.7 | |||||
| December 31, 2014 | 11.1-13.5 | 0.4 | ||||
| 20.4-22.6 | 4.4 | |||||
| b. | ASE Mauritius Inc. Option Plan |
ASE Mauritius Inc. has an employee share option plan for full-time employees of the Group which granted 30,000 thousand units in December 2007. Under the terms of the plan, each unit represents the right to purchase one ordinary share of ASE Mauritius Inc. when exercised. The option rights of the plan are valid for 10 years, non-transferable and exercisable at certain percentages subsequent to the second anniversary of the grant date.
| - 72 - |
Information about share options was as follows:
| For the Years Ended December 31 | ||||||||||||||||
| 2015 | 2014 | |||||||||||||||
| Number of | Exercise | Number of | Exercise | |||||||||||||
| Options | Price | Options | Price | |||||||||||||
| (In | Per Share | (In | Per Share | |||||||||||||
| Thousands) | (US$) | Thousands) | (US$) | |||||||||||||
| Balance at January 1 | 28,545 | $ | 1.7 | 28,545 | $ | 1.7 | ||||||||||
| Options forfeited | (75 | ) | 1.7 | - | - | |||||||||||
| Balance at December 31 | 28,470 | 1.7 | 28,545 | 1.7 | ||||||||||||
| Options exercisable, end of year | 28,470 | 1.7 | 28,545 | 1.7 | ||||||||||||
As of December 31, 2015 and 2014, the share options were all vested and the remaining contractual life was 2 years and 3 years, respectively.
| c. | USIE Option Plans |
The terms of the plans issued by USIE were the same with those of the Company’s option plans.
Information about share options was as follows:
| For the Years Ended December 31 | ||||||||||||||||
| 2015 | 2014 | |||||||||||||||
| Weighted | Weighted | |||||||||||||||
| Average | Average | |||||||||||||||
| Number of | Exercise | Number of | Exercise | |||||||||||||
| Options | Price | Options | Price | |||||||||||||
| (In | Per Share | (In | Per Share | |||||||||||||
| Thousands) | (US$) | Thousands) | (US$) | |||||||||||||
| Balance at January 1 | 34,159 | $ | 2.1 | 34,939 | $ | 2.1 | ||||||||||
| Options forfeited | (84 | ) | 2.8 | - | - | |||||||||||
| Options exercised | (4,380 | ) | 1.9 | (780 | ) | 1.5 | ||||||||||
| Balance at December 31 | 29,695 | 2.1 | 34,159 | 2.1 | ||||||||||||
| Options exercisable, end of year | 28,106 | 2.1 | 30,874 | 2.0 | ||||||||||||
Information about USIE’s outstanding share options at each balance sheet date was as follows:
Range of Exercise Price Per Share (US$) | Weighted Average Remaining Contractual Life (Years) | |||||
| December 31, 2015 | $ | 1.5 | 5.0 | |||
| 2.4-2.9 | 4.9 | |||||
| December 31, 2014 | 1.5 | 5.0 | ||||
| 2.4-2.9 | 5.8 | |||||
| - 73 - |
| d. | USISH Option Plans |
In November 2015, the shareholders of USISH approved a share option plan for the employees of USISH. Each unit represents the right to purchase one ordinary share of USISH when exercised. The options are valid for 10 years, non-transferable and exercisable at certain percentages subsequent to the second anniversary of the grant date incorporated with certain performance conditions. For any subsequent changes in USISH’s capital structure, the exercise price is accordingly adjusted.
Information about share options was as follows:
| For the Year Ended December 31, 2015 | ||||||||
| Number of | Exercise | |||||||
| Options | Price | |||||||
| (In | Per Share | |||||||
| Thousands) | (CNY) | |||||||
| Balance at January 1 | - | $ | - | |||||
| Options granted | 26,640 | 15.5 | ||||||
| Options forfeited | (13 | ) | 15.5 | |||||
| Balance at December 31 | 26,627 | 15.5 | ||||||
| Options exercisable, end of year | - | - | ||||||
| Weighted-average fair value of options granted (CNY) | $5.95~7.14 | |||||||
As of December 31, 2015, the remaining contractual life of the share options was 9.9 years.
Fair value of share options
Share options granted by the Company and USISH in 2015 were measured using the Hull & White Model (2004) incorporated with Ritchken’s Trinomial Tree Model (1995) and the Black-Scholes Option Pricing Model, respectively, and the inputs to the models were as follows:
| ASE Inc. | USISH | |||
| Share price at the grant date | NT$36.5 | CNY15.2 | ||
| Exercise prices | NT$36.5 | CNY15.5 | ||
| Expected volatility | 27.02% | 40.33%-45.00% | ||
| Expected lives | 10 years | 10 years | ||
| Expected dividend yield | 4.00% | 0.87% | ||
| Risk free interest rates | 1.34% | 3.06%-3.13% |
Expected volatility was based on the historical share price volatility over the past 10 years of ASE Inc. and the comparable companies of USISH, respectively. Under the Hull & White Model (2004) incorporated with Ritchken’s Trinomial Tree Model (1995), the Company assumed that employees would exercise the options after vesting date when the share price was 1.88 times the exercise price to allow for the effects of early exercise.
In December 2015 and 2014, USIE had modified the terms of its option plan granted in 2007 to extend the valid period from 12 years to 13 years and from 11 years to 12 years, respectively. The incremental fair value of NT$13,721 thousand and NT$10,378 thousand were all recognized as employee benefits expense in 2015 and 2014, respectively, since the options were all vested.
Employee benefits expense recognized on employee share options was NT$133,496 thousand and NT$110,157 thousand for the years ended December 31, 2015 and 2014, respectively.
| - 74 - |
| 26. | EQUITY TRANSACTION WITH NON-CONTROLLING INTERESTS |
In November 2014, USISH completed its cash capital increase of CNY2,017,690 thousand and the Group’s shareholdings of USISH decreased from 88.6% to 82.1% since the Group did not subscribe for additional new shares. The transaction was accounted for as an equity transaction since the Group did not cease to have control over USISH and, as a result, in the fourth quarter of 2014, capital surplus was increased by NT$6,877,099 thousand (after adjusted).
In April 2015, USIE sold its shareholdings of 54,000 thousand ordinary shares of USISH amounting to CNY1,992,060 thousand and, as a result, the Group’s shareholdings of USISH decreased from 82.1% to 77.2%. The transaction was accounted for as an equity transaction since the Group did not cease to have control over USISH. and, as a result, capital surplus was increased by NT$7,197,510 thousand in the second quarter of 2015.
Furthermore, the shareholders of USIE approved in December 2015 to repurchase 4,500,820 shares of USIE’s outstanding ordinary shares at US$18.82 per share. The board of directors of USIE resolved in February 2016 to cancel the repurchased shares on February 17, 2016, the record date for the capital reduction.
| 27. | NON-CASH TRANSACTIONS |
For the years ended December 31, 2015 and 2014, the Group entered into the following non-cash investing activities which were not reflected in the consolidated statements of cash flows:
| For the Years Ended December 31 | ||||||||
| 2015 | 2014 | |||||||
| NT$ | NT$ | |||||||
| Payments for property, plant and equipment | ||||||||
| Purchase of property, plant and equipment | $ | 28,280,821 | $ | 43,448,587 | ||||
| Decrease in prepayments for property, plant and equipment (recorded under the line item of other non-current assets) | (267,334 | ) | (34,894 | ) | ||||
| Decrease (increase) in payables for property, plant and equipment | 2,314,772 | (3,688,526 | ) | |||||
| Capitalized borrowing costs | (48,135 | ) | (126,203 | ) | ||||
| $ | 30,280,124 | $ | 39,598,964 | |||||
| Proceeds from disposal of property, plant and equipment | ||||||||
| Consideration from disposal of property, plant and equipment | $ | 201,766 | $ | 462,438 | ||||
| Decrease (increase) in other receivables | 41,265 | (41,231 | ) | |||||
| $ | 243,031 | $ | 421,207 | |||||
| 28. | OPERATING LEASE ARRANGEMENTS |
Except those discussed in Note 16, the Company and its subsidiary, ASE Test, Inc., lease the land on which their buildings are located under various operating lease agreements with the ROC government expiring through June 2035. The agreements grant these entities the option to renew the leases and reserve the right for the lessor to adjust the lease payments upon an increase in the assessed value of the land and to terminate the leases under certain conditions. In addition, the Group leases buildings, machinery and equipment under operating leases.
| - 75 - |
The subsidiaries’ offices located in U.S.A. and Japan, etc. are leased from other parties and the lease term will expire through 2016 to 2023 with the option to renew the leases upon expiration.
The Group recognized rental expense of NT$1,390,821 thousand and NT$1,459,835 thousand for the years ended December 31, 2015 and 2014, respectively.
| 29. | CAPITAL MANAGEMENT |
The capital structure of the Group consists of debt and equity. The Group manages its capital to ensure that entities in the Group will be able to continue as going concerns while maximizing the return to shareholders through the optimization of the debt and equity balance. Key management personnel of the Group periodically reviews the cost of capital and the risks associated with each class of capital. In order to balance the overall capital structure, the Group may adjust the amount of dividends paid to shareholders, the number of new shares issued or repurchased, and the amount of new debt issued or existing debt redeemed.
The Group is not subject to any externally imposed capital requirements except those discussed in Note 17.
30. FINANCIAL INSTRUMENTS
| a. | Fair value of financial instruments that are not measured at fair value |
| 1) | Fair value of financial instruments not measured at fair value but for which fair value is disclosed |
Except bonds payable measured at amortized cost, the management considers that the carrying amounts of financial assets and financial liabilities not measured at fair value approximate their fair values.
The carrying amounts and fair value of bonds payable as of December 31, 2015 and 2014, respectively, were as follows:
| Carrying Amount | Fair Value | |||||||
| NT$ | NT$ | |||||||
| December 31, 2015 | $ | 38,426,250 | $ | 38,465,355 | ||||
| December 31, 2014 | 31,270,131 | 31,702,988 | ||||||
| 2) | Fair value hierarchy |
The aforementioned fair value hierarchy of bonds payable was Level 3 which was determined based on discounted cash flow analysis with the applicable yield curve for the duration or the last trading prices.
| - 76 - |
| b. | Fair value of financial instruments that are measured at fair value on a recurring basis |
| 1) | Fair value hierarchy |
| Level 1 | Level 2 | Level 3 | Total | |||||||||||||
| NT$ | NT$ | NT$ | NT$ | |||||||||||||
| December 31, 2015 | ||||||||||||||||
| Financial assets at FVTPL | ||||||||||||||||
| Financial assets designated as at FVTPL | ||||||||||||||||
| Structured time deposits | $ | - | $ | 1,646,357 | $ | - | $ | 1,646,357 | ||||||||
| Private-placement convertible bonds | - | 100,500 | - | 100,500 | ||||||||||||
| Derivative financial assets | ||||||||||||||||
| Swap contracts | - | 1,452,611 | - | 1,452,611 | ||||||||||||
| Forward exchange contracts | - | 18,913 | - | 18,913 | ||||||||||||
| Forward currency options | - | 5,020 | - | 5,020 | ||||||||||||
| Non-derivative financial assets held for trading | ||||||||||||||||
| Open-end mutual funds | 573,242 | - | - | 573,242 | ||||||||||||
| Quoted shares | 37,058 | - | - | 37,058 | ||||||||||||
| $ | 610,300 | $ | 3,223,401 | $ | - | $ | 3,833,701 | |||||||||
| Available-for-sale financial assets | ||||||||||||||||
| Limited Partnership | $ | - | $ | - | $ | 476,612 | $ | 476,612 | ||||||||
| Unquoted shares | - | - | 264,477 | 264,477 | ||||||||||||
| Quoted shares | 197,580 | - | - | 197,580 | ||||||||||||
| Open-end mutual funds | 16,037 | - | - | 16,037 | ||||||||||||
| $ | 213,617 | $ | - | $ | 741,089 | $ | 954,706 | |||||||||
| Financial liabilities at FVTPL | ||||||||||||||||
| Derivative financial liabilities | ||||||||||||||||
| Conversion option, redemption option and put option of convertible bonds | $ | - | $ | 2,632,565 | $ | - | $ | 2,632,565 | ||||||||
| Swap contracts | - | 290,176 | - | 290,176 | ||||||||||||
| Forward exchange contracts | - | 69,207 | - | 69,207 | ||||||||||||
| Foreign currency option contracts | - | 13,659 | - | 13,659 | ||||||||||||
| Interest rate swap contracts | - | 119 | - | 119 | ||||||||||||
| $ | - | $ | 3,005,726 | $ | - | $ | 3,005,726 | |||||||||
| - 77 - |
| Level 1 | Level 2 | Level 3 | Total | |||||||||||||
| NT$ | NT$ | NT$ | NT$ | |||||||||||||
| December 31, 2014 | ||||||||||||||||
| Financial assets at FVTPL | ||||||||||||||||
| Financial assets designated as at FVTPL | ||||||||||||||||
| Structured time deposits | $ | - | $ | 2,376,050 | $ | - | $ | 2,376,050 | ||||||||
| Private-placement convertible bonds | - | 100,500 | - | 100,500 | ||||||||||||
| Derivative financial assets | ||||||||||||||||
| Swap contracts | - | 1,907,705 | - | 1,907,705 | ||||||||||||
| Forward exchange contracts | - | 27,811 | - | 27,811 | ||||||||||||
| Non-derivative financial assets held for trading | ||||||||||||||||
| Open-end mutual funds | 533,425 | - | - | 533,425 | ||||||||||||
| Quoted shares | 43,352 | - | - | 43,352 | ||||||||||||
| $ | 576,777 | $ | 4,412,066 | $ | - | $ | 4,988,843 | |||||||||
| Available-for-sale financial assets | ||||||||||||||||
| Open-end mutual funds | $ | 1,500,434 | $ | - | $ | - | $ | 1,500,434 | ||||||||
| Limited Partnership | - | - | 555,361 | 555,361 | ||||||||||||
| Unquoted shares | - | - | 223,505 | 223,505 | ||||||||||||
| Quoted shares | 195,070 | - | - | 195,070 | ||||||||||||
| $ | 1,695,504 | $ | - | $ | 778,866 | $ | 2,474,370 | |||||||||
| Financial liabilities at FVTPL | ||||||||||||||||
| Derivative financial liabilities | ||||||||||||||||
| Conversion option, redemption option and put option of convertible bonds | $ | - | $ | 2,520,606 | $ | - | $ | 2,520,606 | ||||||||
| Swap contracts | - | 99,165 | - | 99,165 | ||||||||||||
| Forward exchange contracts | - | 31,581 | - | 31,581 | ||||||||||||
| $ | - | $ | 2,651,352 | $ | - | $ | 2,651,352 | |||||||||
For assets and liabilities held as of December 31, 2015 and 2014 that were measured at fair value on a recurring basis, there were no transfers between Level 1 and Level 2 of the fair value hierarchy.
| 2) | Reconciliation of Level 3 fair value measurements of financial assets |
The financial assets measured at Level 3 fair value were equity investments with no quoted prices classified as available-for-sale financial assets - non-current. Reconciliations for the years ended December 31, 2015 and 2014 were as follows:
| - 78 - |
| For the Years Ended December 31 | ||||||||
| 2015 | 2014 | |||||||
| NT$ | NT$ | |||||||
| Balance at January 1 | $ | 778,866 | $ | 797,162 | ||||
| Purchases | 2,010 | 38,793 | ||||||
| Disposals | (45,091 | ) | (21,012 | ) | ||||
| Total gains or losses recognized | ||||||||
| In profit or loss | (15,891 | ) | (10,390 | ) | ||||
| In other comprehensive income | 21,195 | (25,687 | ) | |||||
| Balance at December 31 | $ | 741,089 | $ | 778,866 | ||||
As of December 31, 2015 and 2014, unrealized loss of NT$8,611 thousand and NT$21,519 thousand, recorded in other comprehensive income under the heading of unrealized gain (loss) on available-for-sale financial assets, were included in the carrying amount of the financial assets at fair value on Level 3 fair value measurement.
| 3) | Valuation techniques and assumptions applied for the purpose of measuring fair value |
| a) | Valuation techniques and inputs applied for the purpose of measuring Level 2 fair value measurement |
| Financial Instruments | Valuation Techniques and Inputs | |
| Derivatives - swap contracts, forward exchange contracts, foreign currency option contracts and interest rate swap contracts | Discounted cash flows - Future cash flows are estimated based on observable forward exchange rates or interest rates at balance sheet dates and contract forward exchange rates and interest rates or interest rates, discounted at rates that reflected the credit risk of various counterparties. | |
| Derivatives - conversion option, redemption option and put option of convertible bonds | Option pricing model - Incorporation of present value techniques and reflect both the time value and the intrinsic value of options | |
| Structured time deposits and private-placement convertible bonds | Discounted cash flows - Future cash flows are estimated based on observable forward exchange rates or stock prices at balance sheet dates and contract interest rate ranges or conversion prices, discounted at rates that reflected the credit risk of various counterparties. |
| b) | Valuation techniques and inputs applied for the purpose of measuring Level 3 fair value measurement |
The fair value of the Group’s investments in unquoted shares on Level 3 fair value measurement were measured using market approach based on investees’ recent financing activities, technical development, valuation of investees comparable companies, market conditions and other economic indicators.
The fair values of investments in limited partnership are measured using discounted cash flow technique and a comparable multiple technique. The significant unobservable inputs used in the discounted cash flow technique were discount rates of 12.34% and the terminal growth rates of 2.50%. Any significant increase in discount rates or any significant decrease in terminal growth rates would result in a decrease in the fair value of the investments in limited partnership. The significant unobservable input used in the comparable multiple technique was EBITDA multiples of 9.73. Any significant decrease in multiples would result in a
| - 79 - |
decrease in the fair value of the investments in limited partnership.
| c. | Categories of financial instruments |
| December 31 | ||||||||
| 2015 | 2014 | |||||||
| NT$ | NT$ | |||||||
| Financial assets | ||||||||
| FVTPL | ||||||||
| Designated as at FVTPL | $ | 1,746,857 | $ | 2,476,550 | ||||
| Held for trading | 2,086,844 | 2,512,293 | ||||||
| Available-for-sale financial assets | 954,706 | 2,474,370 | ||||||
| Loans and receivables (Note 1) | 101,259,880 | 106,158,279 | ||||||
| Financial liabilities | ||||||||
| FVTPL | ||||||||
| Held for trading | 3,005,726 | 2,651,352 | ||||||
| Measured at amortized cost (Note 2) | 173,294,140 | 157,157,392 | ||||||
| Note 1: | The balances included loans and receivables measured at amortized cost which comprise cash and cash equivalents, trade and other receivables and other financial assets. |
| Note 2: | The balances included financial liabilities measured at amortized cost which comprise short-term borrowings, short-term bills payable, trade and other payables, bonds payable and long-term borrowings. |
| d. | Financial risk management objectives and policies |
The derivative instruments used by the Group are to mitigate risks arising from ordinary business operations. All derivative transactions entered into by the Group are designated as either hedging or trading. Derivative transactions entered into for hedging purposes must hedge risk against fluctuations in foreign exchange rates and interest rates arising from operating activities. The currencies and the amount of derivative instruments held by the Group must match its hedged assets and liabilities denominated in foreign currencies.
The Group’s risk management department monitors risks to mitigate risk exposures, reports unsettled position, transaction balances and related gains or losses to the Group’s chief financial officer on monthly basis.
| 1) | Market risk |
The Group’s activities exposed it primarily to the financial risks of changes in foreign currency exchange rates and interest rates. Gains or losses arising from fluctuations in foreign currency exchange rates of a variety of derivative financial instruments were approximately offset by those of hedged items. Interest rate risk was not significant due to the cost of capital was expected to be fixed.
There had been no change to the Group’s exposure to market risks or the manner in which these risks were managed and measured.
| - 80 - |
| a) | Foreign currency exchange rate risk |
The Group had sales and purchases as well as financing activities denominated in foreign currency which exposed the Group to foreign currency exchange rate risk. The Group entered into a variety of derivative financial instruments to hedge foreign currency exchange rate risk to minimize the fluctuations of assets and liabilities denominated in foreign currencies.
The carrying amounts of the Group’s foreign currency denominated monetary assets and liabilities (including those eliminated upon consolidation) as well as derivative instruments which exposed the Group to foreign currency exchange rate risk at each balance sheet date are presented in Note 35.
The Group was principally subject to the impact to exchange rate fluctuation in U.S. dollars and Japanese yen against NT$ or Chinese Yuan Renminbi (“CNY”). 1% is the sensitivity rate used when reporting foreign currency exchange rate risk internally to key management personnel and represents management’s assessment of the reasonably possible change in foreign currency exchange rates. The sensitivity analysis included financial assets and liabilities and inter-company receivables and payables within the Group. The changes in profit before income tax due to a 1% change in U.S. dollars and Japanese yen both against NT$ and CNY would be NT$18,000 thousand and NT$41,000 thousand for the years ended December 31, 2015 and 2014, respectively. Hedging contracts and hedged items have been taken into account while measuring the changes in profit before income tax. The abovementioned sensitivity analysis mainly focused on the foreign currency monetary items at the end of the year. As the year-end exposure did not reflect the exposure for the years ended December 31, 2015 and 2014, the abovementioned sensitivity analysis was unrepresentative of those years.
| b) | Interest rate risk |
Except a portion of long-term borrowings and bonds payable at fixed interest rates, the Group was exposed to interest rate risk because group entities borrowed funds at floating interest rates. Changes in market interest rates will lead to variances in effective interest rates of borrowings from which the future cash flow fluctuations arise.
The carrying amounts of the Group’s financial assets and financial liabilities with exposure to interest rates at each balance sheet date were as follows:
| December 31 | ||||||||
| 2015 | 2014 | |||||||
| NT$ | NT$ | |||||||
| Fair value interest rate risk | ||||||||
| Financial liabilities | $ | 18,030,482 | $ | 34,003,038 | ||||
| Cash flow interest rate risk | ||||||||
| Financial assets | 53,475,994 | 51,603,455 | ||||||
| Financial liabilities | 65,213,083 | 65,149,698 | ||||||
For assets and liabilities with floating interest rates, a 100 basis point increase or decrease was used when reporting interest rate risk internally to key management personnel. If interest rates had been 100 basis points (1%) higher or lower and all other variables held constant, the Group’s profit before income tax for the years ended December 31, 2015 and 2014 would have decreased or increased approximately by NT$117,000 thousand and NT$135,000 thousand, respectively.
| c) | Other price risk |
The Group was exposed to equity or debt price risk through its investments in financial assets at
| - 81 - |
FVTPL, including private-placement convertible bonds, quoted shares, and open-end mutual funds, and available-for-sale financial assets. If equity or debt prices were 1% higher or lower, profit before income tax for the years ended December 31, 2015 and 2014 would have increased or decreased approximately by NT$7,100 thousand and NT$6,800 thousand, respectively, and other comprehensive income before income tax for the years ended December 31, 2015 and 2014 would have increased or decreased approximately by NT$10,000 thousand and NT$25,000 thousand, respectively.
In addition, the Group was also exposed to the Company’s ordinary share price risk through Bonds Options recognized as financial liabilities held for trading. 7% is the sensitivity rate used when reporting price risk internally to key management personnel. If the Company’s ordinary share price increased or decreased by 7%, profit before income tax for the years ended December 31, 2015 and 2014 would have decreased approximately by NT$605,000 thousand and NT$651,000 thousand, respectively, or increased approximately by NT$638,000 thousand and NT$608,000 thousand, respectively.
| 2) | Credit risk |
Credit risk refers to the risk that counterparty will default on its contractual obligations resulting in financial loss to the Group. The Group’s credit risk arises from cash and cash equivalents, receivables and other financial assets. The Group’s maximum exposure to credit risk was the carrying amounts of financial assets in the consolidated balance sheets.
The Group dealt with counterparties creditworthy and has a credit policy and trade receivable management procedures to ensure recovery and evaluation of trade receivables. The Group’s counterparties consisted of a large number of customers and banks and there was no significant concentration of credit risk exposure.
| 3) | Liquidity risk |
The Group manages liquidity risk by maintaining adequate working capital and banking facilities to fulfill the demand for cash flow used in the Group’s operation and capital expenditure. The Group also monitors its compliance with all the loan covenants. Liquidity risk is not considered to be significant.
In the table below, financial liabilities with a repayment on demand clause were included in the earliest time band regardless of the probability of counter-parties choosing to exercise their rights. The maturity dates for other non-derivative financial liabilities were based on the agreed repayment dates.
To the extent that interest flows are floating rate, the undiscounted amounts were derived from the interest rates at each balance sheet date.
On Demand or Less than 1 Month | 1 to 3 Months | 3 Months to 1 Year | 1 to 5 Years | More than 5 Years | ||||||||||||||||
| NT$ | NT$ | NT$ | NT$ | NT$ | ||||||||||||||||
| December 31, 2015 | ||||||||||||||||||||
| Non-derivative financial liabilities | ||||||||||||||||||||
| Non-interest bearing | $ | 19,393,406 | $ | 19,626,026 | $ | 6,493,504 | $ | 1,926 | $ | 194,346 | ||||||||||
| Floating interest rate liabilities | 6,617,050 | 5,677,129 | 10,582,324 | 39,202,454 | 775,273 | |||||||||||||||
| Fixed interest rate liabilities | 16,168,484 | 2,463,617 | 24,787,238 | 18,078,920 | - | |||||||||||||||
| $ | 42,178,940 | $ | 27,766,772 | $ | 41,863,066 | $ | 57,283,300 | $ | 969,619 | |||||||||||
(Continued)
| - 82 - |
On Demand or Less than 1 Month | 1 to 3 Months | 3 Months to 1 Year | 1 to 5 Years | More than 5 Years | ||||||||||||||||
| NT$ | NT$ | NT$ | NT$ | NT$ | ||||||||||||||||
| December 31, 2014 | ||||||||||||||||||||
| Non-derivative financial liabilities | ||||||||||||||||||||
| Non-interest bearing | $ | 23,660,711 | $ | 21,370,876 | $ | 4,606,064 | $ | 155,599 | $ | 29,139 | ||||||||||
| Floating interest rate liabilities | 21,534,220 | 9,003,403 | 12,364,453 | 23,870,629 | 175,302 | |||||||||||||||
| Fixed interest rate liabilities | 684,039 | 838,234 | 846,899 | 34,458,859 | - | |||||||||||||||
| $ | 45,878,970 | $ | 31,212,513 | $ | 17,817,416 | $ | 58,485,087 | $ | 204,441 | |||||||||||
(Concluded)
The amounts included above for floating interest rate instruments for non-derivative financial liabilities was subject to change if changes in floating interest rates differ from those estimates of interest rates determined at each balance sheet date.
The following table detailed the Group’s liquidity analysis for its derivative financial instruments. The table was based on the undiscounted contractual net cash inflows and outflows on derivative instruments that settle on a net basis, and the undiscounted gross cash inflows and outflows on those derivatives that require gross settlement. When the amounts payable or receivable are not fixed, the amounts disclosed have been determined by reference to the projected interest rates as illustrated by the yield curves at each balance sheet date.
On Demand or Less than 1 Month | 1 to 3 Months | 3 Months to 1 Year | ||||||||||
| NT$ | NT$ | NT$ | ||||||||||
| December 31, 2015 | ||||||||||||
| Net settled | ||||||||||||
| Forward exchange contracts | $ | (230 | ) | $ | 3,435 | $ | - | |||||
| Foreign currency options | $ | 2,054 | $ | 8,735 | $ | - | ||||||
| Gross settled | ||||||||||||
| Forward exchange contracts | ||||||||||||
| Inflows | $ | 2,822,265 | $ | 2,421,602 | $ | - | ||||||
| Outflows | (2,836,080 | ) | (2,429,050 | ) | - | |||||||
| (13,815 | ) | (7,448 | ) | - | ||||||||
| Swap contracts | ||||||||||||
| Inflows | 16,561,521 | 22,476,799 | 36,796,825 | |||||||||
| Outflows | (16,564,549 | ) | (22,007,274 | ) | (35,813,527 | ) | ||||||
| (3,028 | ) | 469,525 | 983,298 | |||||||||
| Interest rate swap | ||||||||||||
| Inflows | 12,603 | 12,466 | 25,069 | |||||||||
| Outflows | (11,595 | ) | (11,469 | ) | (23,063 | ) | ||||||
| 1,008 | 997 | 2,006 | ||||||||||
| $ | (15,835 | ) | $ | 463,074 | $ | 985,304 | ||||||
(Continued)
| - 83 - |
On Demand or Less than 1 Month | 1 to 3 Months | 3 Months to 1 Year | ||||||||||
| NT$ | NT$ | NT$ | ||||||||||
| December 31, 2014 | ||||||||||||
| Gross settled | ||||||||||||
| Forward exchange contracts | ||||||||||||
| Inflows | $ | 3,662,813 | $ | 1,959,573 | $ | 9,241 | ||||||
| Outflows | (3,655,279 | ) | (1,940,145 | ) | (9,331 | ) | ||||||
| 7,534 | 19,428 | (90 | ) | |||||||||
| Swap contracts | ||||||||||||
| Inflows | 10,342,259 | 4,621,200 | 33,399,031 | |||||||||
| Outflows | (10,215,834 | ) | (4,461,118 | ) | (31,646,310 | ) | ||||||
| 126,425 | 160,082 | 1,752,721 | ||||||||||
| $ | 133,959 | $ | 179,510 | $ | 1,752,631 | |||||||
(Concluded)
| 31. | RELATED PARTY TRANSACTIONS |
Balances and transactions within the Group had been eliminated upon consolidation. Details of transactions between the Group and other related parties were disclosed as follows:
| a. | The Company contributed each NT$100,000 thousand to ASE Cultural and Educational Foundation (the “ASE Foundation”) in 2015 and in 2014, respectively, for environmental charity in promoting the related domestic environmental protection and public service activities (Note 33). |
| b. | In 2015 and 2014, the Company acquired real estate from an associate at NT$2,466,000 thousand and NT$4,540,086 thousand, respectively, which were primarily based on independent professional appraisal reports and fully paid. |
| c. | The Company contracted with an associate to construct a foreign labor dormitory on current lease property and NT$504,600 thousand had been paid in 2015. In addition, for the years ended December 31, 2014, the construction of buildings with green design concept and other projects on current leased property for which the Company contracted with an associate has been completed with a total consideration of NT$349,646 thousand, which was primarily based on independent professional appraisal reports as well as request for quotation and price negotiation, and the payment schedule was based on the agreed acceptance progress. |
| d. | In 2014, the Company donated NT$15,000 thousand to Social Affairs Bureau of the Kaohsiung City Government through ASE Foundation to help the Kaohsiung City Government rebuild the damaged area and settle the residents who suffered or needed to be evacuated from home due to the gas explosion accident in the Qianzhen District of the Kaohsiung City. |
| e. | Compensation to key management personnel |
| For the Years Ended December 31 | ||||||||
| 2015 | 2014 | |||||||
| NT$ | NT$ | |||||||
| Short-term employee benefits | $ | 812,002 | $ | 989,720 | ||||
| Post-employment benefits | 3,944 | 4,049 | ||||||
(Continued)
| - 84 - |
| For the Years Ended December 31 | ||||||||
| 2015 | 2014 | |||||||
| NT$ | NT$ | |||||||
| Share-based payments | $ | 17,937 | $ | 50,327 | ||||
| $ | 833,883 | $ | 1,044,096 | |||||
(Concluded)
The compensation to the Company’s key management personnel is according to personal performance and market trends.
32. ASSETS PLEDGED AS COLLATERAL OR FOR SECURITY
In addition to Note 9, the following assets were provided as collateral for bank borrowings and the tariff guarantees of imported raw materials:
| December 31 | ||||||||
| 2015 | 2014 | |||||||
| NT$ | NT$ | |||||||
| Inventories related to real estate business | $ | 16,312,519 | $ | 15,164,858 | ||||
| Other financial assets (including current and non-current) | 229,613 | 268,562 | ||||||
| $ | 16,542,132 | $ | 15,433,420 | |||||
| 33. | SIGNIFICANT CONTINGENT LIABILITIES AND UNRECOGNIZED COMMITMENTS |
In addition to those disclosed in other notes, significant commitments and contingencies of the Group as of each balance sheet date were as follows:
| a. | Significant commitments |
| 1) | As of December 31, 2015 and 2014, unused letters of credit of the Group were approximately NT$93,000 thousand and NT$137,000 thousand, respectively. |
| 2) | As of December 31, 2015 and 2014, the amounts that the Group has committed to purchase property, plant and equipment were approximately NT$8,089,200 thousand and NT$17,498,000 thousand, respectively, of which NT$1,756,990 thousand and NT$1,516,396 thousand had been prepaid, respectively. |
| 3) | As of December 31, 2015 and 2014, the unpaid amounts that the Group has contracted for the construction related to our real estate business were approximately NT$2,745,400 thousand and NT$3,156,100 thousand, respectively. |
| 4) | In consideration of corporate social responsibility for environmental protection, the Company’s board of directors, in December 2013, approved contributions to be made in the next 30 years, at a total amount of NT$3,000,000 thousand, at the minimum, to environmental protection efforts in Taiwan. In January 2016, the Company’s board of directors approved to contribute NT$100,000 thousand to ASE Foundation for continuously implementing environmental effort in promoting the related domestic environmental protection and public service activities. |
| - 85 - |
| b. | Non-cancellable operating lease commitments |
| December 31, 2015 | ||||
| NT$ | ||||
| Less than 1 year | $ | 211,225 | ||
| 1-5 years | 353,470 | |||
| More than 5 years | 462,733 | |||
| $ | 1,027,428 | |||
| 34. | SIGNIFICANT SUBSEQUENT EVENTS |
In January 2016, the Company issued unsecured domestic bonds in NT$7,000,000 thousand with a maturity of 5 years and due annually with annual interest rate 1.30%, and in NT$2,000,000 thousand with a maturity of 7 years and interest due annually with annual interest rate 1.50%.
| 35. | SIGNIFICANT ASSETS AND LIABILITIES DENOMINATED IN FOREIGN CURRENCIES |
The following information was aggregated by the foreign currencies other than functional currencies of the group entities and the exchange rates between foreign currencies and respective functional currencies were disclosed. The significant assets and liabilities denominated in foreign currencies were as follows:
Foreign Currencies (In Thousand) | Exchange Rate | Carrying Amount (In Thousand) | ||||||||
| December 31, 2015 | ||||||||||
| Monetary financial assets | ||||||||||
| US$ | $ | 2,926,597 | US$1=NT$32.825 | $ | 96,065,552 | |||||
| US$ | 1,008,097 | US$1=CNY6.4936 | 33,090,795 | |||||||
| JPY | 3,380,683 | JPY1=NT$0.2727 | 921,912 | |||||||
| JPY | 8,467,689 | JPY1=US$0.0083 | 2,309,139 | |||||||
| Monetary financial liabilities | ||||||||||
| US$ | 2,988,953 | US$1=NT$32.825 | 98,112,393 | |||||||
| US$ | 995,195 | US$1=CNY6.4936 | 32,667,265 | |||||||
| JPY | 3,747,333 | JPY1=NT$0.2727 | 1,021,898 | |||||||
| JPY | 8,775,382 | JPY1=US$0.0083 | 2,393,047 | |||||||
| December 31, 2014 | ||||||||||
| Monetary financial assets | ||||||||||
| US$ | 3,086,749 | US$1=NT$31.65 | 97,695,606 | |||||||
| US$ | 649,271 | US$1=CNY6.119 | 20,549,427 | |||||||
| JPY | 3,354,008 | JPY1=NT$0.2646 | 887,471 | |||||||
| JPY | 8,787,236 | JPY1=US$0.0084 | 2,325,103 | |||||||
| Monetary financial liabilities | ||||||||||
| US$ | 2,896,001 | US$1=NT$31.65 | 91,658,432 | |||||||
| US$ | 976,913 | US$1=CNY6.119 | 30,919,296 | |||||||
| JPY | 3,159,712 | JPY1=NT$0.2646 | 836,060 | |||||||
| JPY | 8,903,753 | JPY1=US$0.0084 | 2,355,933 |
| - 86 - |
The significant realized and unrealized foreign exchange gain (loss) were as follows:
| For the Years Ended December 31 | ||||||||||||
| 2015 | 2014 | |||||||||||
| Net Foreign Exchange Gain (Loss) | Net Foreign Exchange Gain (Loss) | |||||||||||
| Functional Currencies | Exchange Rate | NT$ | Exchange Rate | NT$ | ||||||||
| US$ | US$1=NT$32.825 | $ | 136,795 | US$1=NT$31.65 | $ | 298,225 | ||||||
| NT$ | (695,510 | ) | (1,591,124 | ) | ||||||||
| CNY | CNY1=NT$5.0550 | (271,358 | ) | CNY1=NT$5.1724 | 42,049 | |||||||
| $ | (830,073 | ) | $ | (1,250,850 | ) | |||||||
| 36. | OTHERS |
| a. | In November 2015, the Company received a legal brief made by SPIL in connection with a lawsuit brought by SPIL against the Company which was filed with Kaohsiung District Court. SPIL filed a civil lawsuit against the Company seeking to confirm that Company does not have the right to request SPIL to register it as a shareholder in SPIL's shareholder register. The Company has engaged attorney to defend this case and will submit defense brief to the court to protect the Company's interest. The Kaohsiung District Court has not scheduled a hearing on this case. The Company does not expect the lawsuit to have material impact on the financial position and business operation of the Company. |
| b. | On December 20, 2013, the Kaohsiung Environmental Protection Bureau (“KEPB”) issued an official letter No. Kao-Shih-Huan-Chu-Tu-Tzu 10243758100 and an administrative sanction letter No. Kao-Shih-Huan-Chu-Shui-Chu-Tzu 30-102-120022 (“the Administrative Decision”). The Administrative Decision was to impose a fine of NT$110,065 thousand which has been recorded under the line item of other losses for the year ended December 31, 2013. On April 7, 2014, the amount of the fine was amended to NT$109,359 thousand by the KEPB. On September 4, 2015, the amount of the fine was further amended to NT$102,014 thousand (US$3,093 thousand) by the KEPB. On January 17, 2014, the Company retained lawyers to file an administrative appeal to nullify the Administrative Decision with the Kaohsiung City Government, but the administrative appeal was dismissed. The Company next retained lawyers to file an administrative complaint to revoke the part of the Administrative Decision pertaining to the fine, and the case is being heard by the Kaohsiung High Administrative Court. Meanwhile, owing to the event above, on January 3, 2014, the Kaohsiung District Prosecutors Office charged the Company with violation of the Waste Disposal Act. The Kaohsiung District Court handed down the judgment on October 20, 2014 and the Company was fined NT$3,000 thousand for violation of Article 47 of the Waste Disposal Act and has been recorded under the line item of other gains and losses for the year ended December 31, 2014. Then the Company appealed against the judgment to the Kaohsiung Branch of Taiwan High Court. On September 29, 2015, the Kaohsiung Branch of Taiwan High Court rendered a final judgment of finding the Company not guilty of the criminal charge. |
37. ADDITIONAL DISCLOSURES
Following are the additional disclosures required by the Securities and Futures Bureau for ASE Inc.:
| a. | Financial provided: Please see Table 1 attached; |
| b. | Endorsement/guarantee provided: Please see Table 2 attached; |
| c. | Marketable securities held (excluding investments in subsidiaries, associates and joint venture): |
Please see Table 3 attached;
| d. | Marketable securities acquired and disposed of at costs or prices of at least NT$300 million or 20% of |
| - 87 - |
the paid-in capital: Please see Table 4 attached;
| e. | Acquisition of individual real estate properties at costs of at least NT$300 million or 20% of the paid-in capital: Please see Table 5 attached; |
| f. | Disposal of individual real estate properties at prices of at least NT$300 million or 20% of the paid-in capital: None; |
| g. | Total purchase from or sales to related parties of at least NT$100 million or 20% of the paid-in capital: |
Please see Table 6 attached;
| h. | Receivables from related parties amounting to at least NT$100 million or 20% of the paid-in capital: |
Please see Table 7 attached;
| i. | Information about the derivative financial instruments transaction: Please see Note 7; |
| j. | Others: The business relationship between the parent and the subsidiaries and significant transactions between them: Please see Table 10 attached; |
| k. | Names, locations, and related information of investees over which ASE Inc. exercises sinificant influence (excludung information on investment in Mainland China): Please see Table 8 attached; |
| l. | Information on investment in Mainland China |
| 1) | The name of the investee in Mainland China, the main businesses and products, its issued capital, method of investment, information on inflow or outflow of capital, percentage of ownership, income (losses) of the investee, share of profits/losses of investee, ending balance, amount received as dividends from the investee, and the limitation on investee: Please see Table 9 attached; |
| 2) | Any of the following significant transactions with investee companies in mainland China, either directly or indirectly through a third party, and their prices, payment terms, and unrealized gains or losses: |
| a) | The amount and percentage of purchases and the balance and percentage of the related payables at the end of the period: Please see Table 6 attached; |
| b) | The amount and percentage of sales and the balance and percentage of the related receivables at the end of the period: None; |
| c) | The amount of property transactions and the amount of the resultant gains or losses: No sinificant transactions; |
| d) | The balance of negotiable instrument endorsements or guarantees or pledges of collateral at the end of the period and the purposes: Please see Table 2 attached; |
| e) | The highest balance, the end of period balance, the interest rate range, and total current period interest with respect to financing of funds: None; |
| f) | Other transactions that have a material effect on the profit or loss for the period or on the financial position, such as the rendering or receiving of services: None. |
| 38. | OPERATING SEGMENTS INFORMATION |
The Group has the following reportable segments: Packaging, Testing and EMS. The Group packages bare semiconductors into finished semiconductors with enhanced electrical and thermal characteristics; provides testing services, including front-end engineering testing, wafer probing and final testing services;
| - 88 - |
provides electronics manufacturing services. Information about other business activities and operating segments that are not reportable are combined and disclosed in “Others.” The Group engages in other activities such as substrate production and real estate business.
The accounting policies for segments are the same as those described in Note 4. The measurement basis for resources allocation and performance evaluation is based on profit before income tax.
Segment information for the years ended December 31, 2015 and 2014 was as follows:
| a. | Segment revenues and results |
| Packaging | Testing | EMS | Others | Total | ||||||||||||||||
| NT$ | NT$ | NT$ | NT$ | NT$ | ||||||||||||||||
| For the year ended December 31, 2015 | ||||||||||||||||||||
| Revenue from external customers | 116,607,314 | 25,191,916 | 138,242,100 | 3,261,206 | 283,302,536 | |||||||||||||||
| Inter-segment revenues (Note) | 9,454,671 | 191,608 | 58,451,996 | 7,659,282 | 75,757,557 | |||||||||||||||
| Segment revenues | 126,061,985 | 25,383,524 | 196,694,096 | 10,920,488 | 359,060,093 | |||||||||||||||
| Interest income | 53,235 | 12,536 | 149,385 | 26,928 | 242,084 | |||||||||||||||
| Interest expense | (1,520,118 | ) | (5,821 | ) | (147,792 | ) | (595,055 | ) | (2,268,786 | ) | ||||||||||
| Depreciation and amortization | (18,946,460 | ) | (6,516,912 | ) | (2,738,722 | ) | (1,316,570 | ) | (29,518,664 | ) | ||||||||||
| Share of the profit of associates and joint ventures | 402,730 | - | - | - | 402,730 | |||||||||||||||
| Impairment loss | (139,397 | ) | - | (102,389 | ) | (16,343 | ) | (258,129 | ) | |||||||||||
| Segment profit before income tax | 15,756,333 | 6,354,140 | 2,874,944 | 302,836 | 25,288,253 | |||||||||||||||
| Expenditures for segment assets | 19,691,068 | 4,754,481 | 2,917,939 | 917,333 | 28,280,821 | |||||||||||||||
| December 31, 2015 | ||||||||||||||||||||
| Investments accounted for using the equity method | 37,422,909 | - | - | - | 37,422,909 | |||||||||||||||
| Segment assets | 193,623,969 | 42,652,569 | 79,997,341 | 49,013,678 | 365,287,557 | |||||||||||||||
| For the year ended December 31, 2014 | ||||||||||||||||||||
| Revenue from external customers | 121,336,453 | 25,874,694 | 105,784,427 | 3,595,873 | 256,591,447 | |||||||||||||||
| Inter-segment revenues (Note) | 9,418,359 | 177,793 | 48,596,814 | 8,437,439 | 66,630,405 | |||||||||||||||
| Segment revenues | 130,754,812 | 26,052,487 | 154,381,241 | 12,033,312 | 323,221,852 | |||||||||||||||
| Interest income | 96,737 | 10,245 | 116,451 | 20,041 | 243,474 | |||||||||||||||
| Interest expense | (1,566,595 | ) | (15,663 | ) | (155,702 | ) | (586,466 | ) | (2,324,426 | ) | ||||||||||
| Depreciation and amortization | (17,533,267 | ) | (6,160,378 | ) | (1,435,509 | ) | (1,221,622 | ) | (26,350,776 | ) | ||||||||||
| Share of the profit of associates | (108,726 | ) | - | - | - | (108,726 | ) | |||||||||||||
| Impairment loss | (231,936 | ) | (4,701 | ) | (10,390 | ) | (61,117 | ) | (308,144 | ) | ||||||||||
| Segment profit before income tax | 17,292,396 | 6,800,893 | 3,818,393 | 636,529 | 28,548,211 | |||||||||||||||
| Expenditures for segment assets | 29,863,337 | 6,157,154 | 6,562,513 | 865,583 | 43,448,587 | |||||||||||||||
| December 31, 2014 | ||||||||||||||||||||
| Investments accounted for using the equity method | 1,492,441 | - | - | - | 1,492,441 | |||||||||||||||
| Segment assets | 166,625,901 | 44,147,813 | 78,865,897 | 44,345,157 | 333,984,768 | |||||||||||||||
| Note: | Inter-segment revenues were eliminated upon consolidation. |
| b. | Revenue from major products and services |
| For the Years Ended December 31 | ||||||||
| 2015 | 2014 | |||||||
| NT$ | NT$ | |||||||
| Advanced packaging and IC wirebonding service | $ | 103,735,586 | $ | 108,384,405 | ||||
| Wafer probing and final testing service | 24,136,399 | 25,116,026 | ||||||
| Electronic components manufacturing service | 137,347,359 | 104,904,455 | ||||||
| Others | 18,083,192 | 18,186,561 | ||||||
| $ | 283,302,536 | $ | 256,591,447 | |||||
| - 89 - |
| c. | Geographical information |
Geographical information about revenue from external customers and noncurrent assets are reported based on the country where the external customers are headquartered and noncurrent assets are located.
| 1) | Net revenues from external customers |
| For the Years Ended December 31 | ||||||||
| 2015 | 2014 | |||||||
| NT$ | NT$ | |||||||
| United States | $ | 205,730,670 | $ | 173,912,974 | ||||
| Taiwan | 32,631,149 | 36,747,699 | ||||||
| Asia | 22,885,128 | 24,042,586 | ||||||
| Europe | 20,577,069 | 20,826,125 | ||||||
| Others | 1,478,520 | 1,062,063 | ||||||
| $ | 283,302,536 | $ | 256,591,447 | |||||
| 2) | Noncurrent assets, excluding financial instruments, post-employment benefit assets and deferred tax assets |
| December 31 | ||||||||
| 2015 | 2014 | |||||||
| NT$ | NT$ | |||||||
| Taiwan | $ | 98,849,362 | $ | 97,159,564 | ||||
| China | 40,385,484 | 43,384,186 | ||||||
| Others | 25,458,503 | 26,177,965 | ||||||
| $ | 164,693,349 | $ | 166,721,715 | |||||
| d. | Major customers |
Except one customer from which the operating revenues generated from packaging and EMS segments was NT$88,311,697 thousand and NT$54,431,222 thousand in 2015 and 2014, respectively, the Group did not have other single customer to which the operating revenues exceeded 10% of operating revenues for the years ended December 31, 2015 and 2014.
| - 90 - |
TABLE 1
ADVANCED SEMICONDUCTOR ENGINEERING, INC. AND SUBSIDIARIES
FINANCINGS PROVIDED
FOR THE YEAR ENDED DECEMBER 31, 2015
(Amounts In Thousands of New Taiwan Dollars)
Collateral | ||||||||||||||||||||||||
No. | Financing Company | Counter-party | Financial Statement Account | Related | Maximum Balance for the year | Ending Balance | Amount Actual Drawn | Interest Rate | Nature for Financing | Transaction Amounts | Reason for Financing | Allowance for Bad Debt | Item | Value | Financing Limits for Each Borrowing Company | Financing Company’s Total Financing Amount Limits | ||||||||
| 1 | ASE Holding Limited | The Company | Other receivables form related parties | Yes | $ | 2,859,690 | $ | 2,757,300 | $ | 2,757,300 | 0.57~0.64 | The need for short-term financing | $ | – | Operating capital | $ | – | – | $ | – | $ | 3,103,833 | $ | 6,207,666 |
| J & R Holding Limited | Long-term receivables form related parties | Yes | 189,000 | – | – | 0.57 | The need for short-term financing | – | Operating capital | – | – | – | 15,691,600 | 23,537,401 | ||||||||||
| ASE Trading (Shanghai) | Long-term receivables form related parties | Yes | 821,700 | 820,625 | – | – | The need for short-term financing | – | Operating capital | – | – | – | 15,691,600 | 23,537,401 | ||||||||||
| 2 | J & R Holding Limited | The Company | Other receivables form related paraties | Yes | 9,367,950 | 9,256,650 | 9,256,650 | 0.57~0.64 | The need for short-term financing | – | Operating capital | – | – | – | 9,992,655 | 19,985,309 | ||||||||
Global Advanced
Packaging
Technology Limited, Cayman Islands
| Other receivables form related parties | Yes | 2,465,250 | 2,461,875 | 2,461,875 | 0.57~0.64 | The need for short-term financing | – | Operating capital | – | – | – | 15,691,600 | 23,537,401 | ||||||||||
| ASE Wei-Hai Inc. | Other receivables form related parties | Yes | 3,782,175 | 1,378,650 | 1,378,650 | 0.63~0.84 | The need for short-term financing | – | Operating capital | – | – | – | 15,691,600 | 23,537,401 | ||||||||||
| Omniquest Industrial Limited | Long-term receivables form related parties | Yes | 1,482,437 | 1,480,408 | 3,283 | 0.57~0.64 | The need for short-term financing | – | Operating capital | – | – | – | 15,691,600 | 23,537,401 | ||||||||||
| ASE Assembly & Test (Shanghai) Limited | Long-term receivables form related parties | Yes | 1,579,000 | 558,025 | 558,025 | 0.63~0.84 | The need for short-term financing | – | Operating capital | – | – | – | 15,691,600 | 23,537,401 | ||||||||||
| ASE (Kun Shan) Inc. | Other receivables form related parties | Yes | 1,334,528 | – | – | 3.81~5.77 | The need for short-term financing | – | Operating capital | – | – | – | 15,691,600 | 23,537,401 | ||||||||||
| Anstock Limited | Long-term receivables form related parties | Yes | 775,080 | 758,250 | 758,250 | 3.64~5.13 | The need for short-term financing | – | Operating capital | – | – | – | 15,691,600 | 23,537,401 | ||||||||||
| ASE Trading (Shanghai) Ltd. | Long-term receivables form related parties | Yes | 6,947,600 | 4,923,750 | – | – | The need for short-term financing | – | Operating capital | – | – | – | 15,691,600 | 23,537,401 | ||||||||||
| Innosource Limited | Long-term receivables form related parties | Yes | 723,140 | 722,150 | 722,150 | 0.59~0.64 | The need for short-term financing | – | Operating capital | – | – | – | 15,691,600 | 23,537,401 | ||||||||||
| ASE Labuan Inc. | Long-term receivables form related parties | Yes | 723,140 | – | – | 0.59~61 | The need for short-term financing | – | Operating capital | – | – | – | 15,691,600 | 23,537,401 | ||||||||||
| ASE Investment (Labuan) Inc. | Other receivables form related parties | Yes | 2,662,470 | – | – | 0.59~61 | The need for short-term financing | – | Operating capital | – | – | – | 15,691,600 | 23,537,401 | ||||||||||
| Real Tech Holdings Limited | Other receivables form related parties | Yes | 2,136,550 | 2,133,625 | 2,133,625 | 0.59~0.64 | The need for short-term financing | – | Operating capital | – | – | – | 9,992,655 | 19,985,309 | ||||||||||
| 3 | ASE Test Limited | The Company | Other receivables form related parties | Yes | 5,842,850 | 5,842,850 | 4,037,475 | 0.57~0.64 | The need for short-term financing | – | Operating capital | – | – | – | 6,059,525 | 12,119,051 | ||||||||
| J & R Holding Limited | Long-term receivables form related parties | Yes | 1,386,000 | – | – | 0.57~0.60 | The need for short-term financing | – | Operating capital | – | – | – | 15,691,600 | 23,537,401 | ||||||||||
| ASE Singapore Pte. Ltd. | Long-term receivables form related parties | Yes | 443,100 | – | – | 0.57~0.58 | The need for short-term financing | – | Operating capital | – | – | – | 15,691,600 | 23,537,401 | ||||||||||
| A S E Holding Limited | Other receivables form related parties | Yes | 1,643,500 | 1,641,250 | 1,641,250 | 0.57~0.64 | The need for short-term financing | – | Operating capital | – | – | – | 15,691,600 | 23,537,401 | ||||||||||
| Omniquest Industrial Limited | Long-term receivables form related parties | Yes | 1,643,500 | 1,641,250 | 1,641,250 | 0.59~0.64 | The need for short-term financing | – | Operating capital | – | – | – | 15,691,600 | 23,537,401 | ||||||||||
| 4 | ASE Test, Inc. | The Company | Other receivables form related parties | Yes | 5,600,000 | 5,600,000 | 5,600,000 | 0.87~1.03 | The need for short-term financing | – | Operating capital | – | – | – | 5,981,659 | 11,963,319 | ||||||||
| ASE Trading (Shanghai) Ltd. | Other receivables form related parties | Yes | 2,629,600 | 656,500 | – | – | The need for short-term financing | – | Operating capital | – | – | – | 5,981,659 | 11,963,319 | ||||||||||
| ASE Corporation | Other receivables form related parties | Yes | 2,793,950 | 1,879,444 | 900,000 | 0.87~0.93 | The need for short-term financing | – | Operating capital | – | – | – | 5,981,659 | 11,963,319 | ||||||||||
| ASE Investment (Labuan) Inc. | Other receivables form related parties | Yes | 2,626,000 | 2,626,000 | – | – | The need for short-term financing | – | Operating capital | – | – | – | 5,981,659 | 11,963,319 | ||||||||||
| 5 | ASE Module (Shanghai) Inc. | ASE (Shanghai) Inc. | Other receivables form related parties | Yes | 516,720 | – | – | 4.59~5.40 | The need for short-term financing | – | Operating capital | – | – | – | 15,691,600 | 23,537,401 | ||||||||
(Continued)
| - 91 - |
TABLE 1
ADVANCED SEMICONDUCTOR ENGINEERING, INC. AND SUBSIDIARIES
FINANCINGS PROVIDED
FOR THE YEAR ENDED DECEMBER 31, 2015
(Amounts In Thousands of New Taiwan Dollars)
Collateral | ||||||||||||||||||||||
No.
| Financing Company | Counter-party | Financial Statement Account | Related Party | Maximum Balance for the year | Ending Balance | Amount Actual Drawn | Interest Rate | Nature for Financing | Transaction Amounts | Reason for Financing | Allowance for Bad Debt | Item | Value | Financing Limits for each Borrowing Company | Financing Company’s Total Financing Amount Limits | ||||||
| 6 | J&R Industrial Inc. | The Company | Other receivables form related parties | Yes | $ | 109,000 | $ | 190,000 | $ | 190,000 | 0.87~1.03 | The need for short-term financing | – | Operating capital | $ | – | $ | – | $ | 199,539 | $ | 399,079 |
| ASE Electronics Inc. | Other receivables form related parties | Yes | 190,000 | 190,000 | 190,000 | 0.87~1.03 | The need for short-term financing | – | Operating capital | – | – | – | 199,539 | 399,079 | ||||||||
| 7 | ISE Labs, Inc. | J & R Holding Limited | Other receivables form related parties | Yes | 1,512,020 | 1,509,950 | 1,509,950 | 0.65~0.99 | The need for short-term financing | – | Operating capital | – | – | – | 15,691,600 | 23,537,401 | ||||||
| Long-term receivables form related parties | ||||||||||||||||||||||
| 8 | ASE (Korea) Inc. | The Company | Other receivables form related parties | Yes | 2,958,300 | 2,954,250 | 2,626,000 | 3.17-3.42 | The need for short-term financing | – | Operating capital | – | – | – | 3,187,595 | 6,375,190 | ||||||
| ASE WeiHai Inc. | Other receivables form related parties | Yes | 1,641,250 | 1,641,250 | 1,641,250 | 3.21~3.24 | The need for short-term financing | – | Operating capital | – | – | – | 15,691,600 | 23,537,401 | ||||||||
| 9 | ASE Japan Co., Ltd. | J & R Holding Limited | Other receivables form related parties | Yes | 2,431,520 | 2,263,410 | 2,263,410 | 0.53 | The need for short-term financing | – | Operating capital | – | – | – | 15,691,600 | 23,537,401 | ||||||
| 10 | USI Enterprise Limited | The Company | Other receivables form related parties | Yes | 5,916,600 | 2,626,000 | 2,626,000 | 0.57-0.64 | The need for short-term financing | – | Operating capital | – | – | – | 8,435,979 | 16,871,957 | ||||||
| Universal Scientific Industrial Co., Ltd. | Other receivables form related parties | Yes | 283,500 | – | – | 0.57~0.58 | The need for short-term financing | – | Operating capital | – | – | – | 8,435,979 | 16,871,957 | ||||||||
| USI Inc. | Other receivables form related parties | Yes | 2,235,160 | 2,235,160 | 2,322,100 | 0.59~0.64 | The need for short-term financing | – | Operating capital | – | – | – | 8,435,979 | 16,871,957 | ||||||||
| J&R Holding Limited | Other receivables form related parties | Yes | 4,443,317 | 6,390,340 | 6,390,340 | 0.59~3.29 | The need for short-term financing | – | Operating capital | – | – | – | 8,435,979 | 16,871,957 | ||||||||
| 11 | Huntington Holdings International Co. Ltd. | The Company | Other receivables form related parties | Yes | 1,807,850 | 1,805,375 | 1,805,375 | 0.57-0.64 | The need for short-term financing | – | Operating capital | – | – | – | 9,161,282 | 18,322,564 | ||||||
| 12 | Anlock Limited | ASE Assembly & Test (Shanghai) Limited | Other receivables form related parties | Yes | 3,322,510 | 3,250,365 | 3,250,365 | 4.45 | The need for short-term financing | – | Operating capital | – | – | – | 15,691,600 | 23,537,401 | ||||||
| 13 | ASE (Kun Shan) Inc. | ASE Investment (Kun Shan) Limited | Other receivables form related parties | Yes | 4,130 | 2,022 | 2,022 | 4.85~6.00 | The need for short-term financing | – | Operating capital | – | – | – | 15,691,600 | 23,537,401 | ||||||
| 14 | Real Tech Holdings Limited | The Company | Other receivables form related parties | Yes | 3,944,400 | 3,939,000 | 3,939,000 | 0.57~0.64 | The need for short-term financing | – | Operating capital | – | – | – | 8,704,030 | 17,408,100 | ||||||
| J & R Holding Limited | Other receivables form related parties | Yes | 1,260,000 | – | – | 0.57~0.58 | The need for short-term financing | – | Operating capital | – | – | – | 8,704,030 | 17,408,100 | ||||||||
| 15 | Shanghai Ding Hui Real Estate Development Co., Ltd. | Shanghai Ding Wei Real Estate Development Co., Ltd. | Other receivables form related parties | Yes | 205,312 | – | – | 6.00 | The need for short-term financing | – | Operating capital | – | – | – | 15,691,600 | 23,537,401 | ||||||
| Kun Shan Ding Hong Real Estate Development Co., Ltd. | Other receivables form related parties | Yes | 682,425 | 682,425 | 556,050 | 4.35~6.00 | The need for short-term financing | – | Operating capital | – | – | – | 15,691,600 | 23,537,401 | ||||||||
| 16 | Universal Scientific Industrial (Shanghai) Co., Ltd. | Universal Global Technology (Kunshan) Co., Ltd. | Other receivables form related parties | Yes | 1,550,160 | 1,516,500 | – | – | The need for short-term financing | – | Operating capital | – | – | – | 6,906,269 | 13,812,538 | ||||||
| Universal Global Technology (Shanghai) Co., Ltd. | Other receivables form related parties | Yes | 3,875,400 | 3,791,250 | 1,982,623 | 0.80~2.25 | The need for short-term financing | – | Operating capital | – | – | – | 6,906,269 | 13,812,538 | ||||||||
| Universal Global Technology Co., Limited | Other receivables form related parties | Yes | 6,200,640 | 6,066,000 | – | 2.25 | The need for short-term financing | – | Operating capital | – | – | – | 6,906,269 | 13,812,538 | ||||||||
| Universal Global Electronics (Shanghai) Co., Ltd. | Other receivables form related parties | Yes | 516,720 | 305,500 | – | – | The need for short-term financing | – | Operating capital | – | – | – | 6,906,269 | 13,812,538 | ||||||||
| Universal Global Scientific Industires Co., Ltd. | Other receivables form related parties | Yes | 1,283,200 | – | – | – | The need for short-term financing | – | Operating capital | – | – | – | 6,906,269 | 13,812,538 | ||||||||
| (Continued) |
| - 92 - |
TABLE 1
ADVANCED SEMICONDUCTOR ENGINEERING, INC. AND SUBSIDIARIES
FINANCINGS PROVIDED
FOR THE YEAR ENDED DECEMBER 31, 2015
(Amounts In Thousands of New Taiwan Dollars)
Collateral | |||||||||||||||||||||
No.
| Financing Company | Counter-party | Financial Statement Account | Related Party | Maximum Balance for the year | Ending Balance | Amount Actual Drawn | Interest Rate | Nature for Financing | Transaction Amounts | Reason for Financing | Allowance for Bad Debt | Item | Value | Financing Limits for each Borrowing Company | Financing Company’s Total Financing Amount Limits | |||||
| 17 | Omniquest Industrial Limited | The Company | Other receivables from related parties | Yes | $ | 3,122,650 | $ | 3,118,375 | $ | 1,641,250 | 0.37~0.64 | The need for short-term financing | – | Operating capital | $ | – | – | $ | 3,236,524 | $ | 6,473,048 |
| 18 | Anstock II Limited | J & R Holding Limited | Long-term receivables from related parties | Yes | 9,762,390 | 9,749,025 | 9,749,025 | 2.45 | The need for short-term financing | – | Operating capital | – | – | – | 15,691,600 | 23,537,401 | |||||
| 19 | USI Electronics (Shenshen) Co., Ltd. | Universal Scientific Industrial (Shanghai) Co., Ltd. | Other receivables from related parties | Yes | 1,283,200 | – | – | – | The need for short-term financing | – | Operating capital | – | – | – | 1,667,679 | 3,335,357 | |||||
| Universal Global Technology (Shanghai) Co., Ltd. | Other receivables from related parties | Yes | 1,756,848 | 1,313,006 | 1,313,006 | 0.8~5.04 | The need for short-term financing | – | Operating capital | – | – | – | 1,667,679 | 3,335,357 | |||||||
| Universal Global Technology Co., Limited | Other receivables form related parties | Yes | 1,756,848 | 1,465,950 | – | – | The need for short-term financing | – | Operating capital | – | – | – | 1,667,679 | 3,335,357 | |||||||
| 20 | ASE Assembly & Test (Shanghai) Limited | Shanghai Ding Wei Real Estate Development Co., Ltd. | Other receivables form related parties | Yes | 774,375 | - | - | 5.35 | The need for short-term financing | – | Operating capital | – | – | – | 15,691,600 | 23,537,401 | |||||
| ASE Trading (Shanghai) Ltd. | Long-term receivables from related parties | Yes | 986,100 | 984,750 | - | 0.94 | The need for short-term financing | – | Operating capital | – | – | – | 15,691,600 | 23,537,401 | |||||||
| 21 | ASE Trading (Shanghai) Ltd. | J & R Holding Limtied | Long-term receivables from related parties | Yes | 6,574,000 | 6,565,000 | – | 0.94 | The need for short-term financing | – | Operating capital | – | – | – | 15,691,600 | 23,537,401 | |||||
| A.S.E. Holding Limited | Long-term receivables from related parties | Yes | 3,287,000 | 3,282,500 | – | – | The need for short-term financing | – | Operating capital | �� | – | – | 15,691,600 | 23,537,401 | |||||||
| 22 | ASE (Shanghai) Inc. | ASE WeiHai Inc. | Other receivables form related parties | Yes | 427,310 | 164,125 | 164,125 | 0.73~1.12 | The need for short-term financing | – | Operating capital | – | – | – | 15,691,600 | 23,537,401 | |||||
| 23 | Innosource Limited | The Company | Other receivables form related parties | Yes | 723,140 | 722,150 | 722,150 | 0.59~0.64 | The need for short-term financing | – | Operating capital | – | – | – | 798,494 | 1,596,988 | |||||
| 24 | ASE Investment (Labuan) Inc. | The Company | Other receivables form related parties | Yes | 3,118,375 | 3,118,375 | – | 0.59~0.61 | The need for short-term financing | – | Operating capital | – | – | – | 3,221,829 | 6,443,638 | |||||
| 25 | ASE Labuan Inc. | The Company | Other receivables from related parties | Yes | 723,140 | – | – | 0.35~0.61 | The need for short-term financing | – | Operating capital | – | – | – | 769,395 | 1,538,770 | |||||
| 26 | Global Advanced Packaging Technology Limited, Cayman Islands | The Company | Other receivables from related parties | Yes | 1,939,330 | 1,936,673 | 1,936,673 | 0.59~0.64 | The need for short-term financing | – | Operating capital | – | – | – | 2,073,390 | 4,146,780 | |||||
(Continued)
| - 93 - |
TABLE 1
ADVANCED SEMICONDUCTOR ENGINEERING, INC. AND SUBSIDIARIES
FINANCINGS PROVIDED
FOR THE YEAR ENDED DECEMBER 31, 2015
(Amounts In Thousands of New Taiwan Dollars)
Collateral | |||||||||||||||||||||
No.
| Financing Company | Counter-party | Financial Statement Account | Related Party | Maximum Balance for the year | Ending Balance | Amount Actual Drawn | Interest Rate | Nature fo Financing | Transaction Amounts | Reason for Financing | Allowance for Bad Debt | Item | Value | Financing Limits for each Borrowing Company | Financing Company’s Total Financing Amount Limits | |||||
| 27 | ASE Corporation | The Company | Other receivables form related parties | Yes | $ | 2,793,990 | $ | 1,879,444 | $ | 900,000 | 0.87~0.93 | The need for short-term financing | – | Operating capital | – | – | – | $ | 3,237,259 | $ | 6,474,518 |
| 28 | ASE Electronics Inc. | The Company | Other receivables form related parties | Yes | 350,000 | 200,000 | 200,000 | 0.87~0.93 | The need for short-term financing | – | Operating capital | – | – | – | 765,609 | 1,531,218 | |||||
| 29 | ASE Electronics (M) SDN, BHD | A.S.E. Holding Limited | Other receivables form related parties | Yes | 131,480 | – | – | 0.60 | The need for short-term financing | – | Operating capital | – | – | – | 15,691,600 | 23,537,401 | |||||
| 30 | ASE Singapore Pte. Ltd. | A.S.E. Holding Limited | Other receivables from related parties | Yes | 394,440 | 393,900 | 393,900 | 0.59~0.64 | The need for short-term financing | – | Operating capital | – | – | – | 15,691,600 | 23,537,401 | |||||
| 31 | Advanced Semiconductor Engineering (HK) Limited | A.S.E. Holding Limited | Other receivables from related parties | Yes | 230,090 | – | – | 0.61 | The need for short-term financing | – | Operating capital | – | – | – | 15,691,600 | 23,537,401 | |||||
(Concluded)
| Note 1: | Limit amount of lending to a company shall not exceed 20% of the net worth of the company. However, when the foreign subsidiaries whose voting shares are 100% owned directly or indirectly, by ASE as a lender, the amount lending to a company shall not exceed 10% of the net worth of ASE. |
| Note 2: | Where an inter-company or inter-firm short-term financing facility is necessary provided that the total amount of such financing facility shall not exceed 40% of the amount of the net worth of the lending company. However, the foreign subsidiaries whose voting shares are 100% owned directly or indirectly, by ASE as a lender, the total amount lending to a company shall not exceed 15% of the net worth of ASE. |
| Note 3: | Amount was eliminated based on the audited financial statements. |
| - 94 - |
TABLE 2
ADVANCED SEMICONDUCTOR ENGINEERING, INC. AND SUBSIDIARIES
ENDORSEMENTS/GUARANTEES PROVIDED
FOR THE YEAR ENDED DECEMBER 31, 2015
(Amounts In Thousands of New Taiwan Dollars)
Endorsement | Guaranteed Party | ||||||||||||||||||
No. | Name | Name | Nature of Relationship | Limits on Endorsement Guarantee Amount Provided to Each Guaranteed Party | Maximum Balance for the Year | Ending Balance | Amount Actually Drawn | Amount of Endorsement Guarantee Collateralized by Properties | Ratio of Accumulated Endorsement Guarantee to Net Equity per Latest Financial Statement | Maximum Endorsement Guarantee Amount Allowable (Note 2) | Guarantee Provided by Parent Company | Guarantee Provided by A Subsidiary | Guarantee Provided to Subsidiaries in Manchuria CHINA | ||||||
| 0 | The Company | Anstock Limited | 100% voting shares indirectly owned by the Company | $ | 47,074,801 | $ | 2,783,448 (Note 3) | $ | 2,634,135 (Note 3) | $ | 2,557,224 (Note 3) | $ | – | 1.7 | $ | 62,766,402 | Yes | No | No |
| Anstock II Limited | 100% voting shares indirectly owned by the Company | 47,074,801 | 10,266,019 (Note 3) | 10,226,019 (Note 3) | 9,941,667 (Note 3) | – | 6.5 | 62,766,402 | Yes | No | No | ||||||||
| 1 | Shanghai Ding Hui Real Estate Development Co., Ltd. | Shanghai Ding Wei Real Estate Development Co., Ltd. | 100% voting shares indirectly owned by the Company | 13,765,242 | 5,693,228 (Note 3) | – | – | – | – | 19,664,631 | Yes | No | Yes | ||||||
| Note 1: | The ceilings on the amounts for any single entity is permitted to make in endorsements/guarantees shall not exceed 30% and 70% of total equity of shareholders, respectively, according to “The Process of make in endorsements/guarantees” of ASE and DH. |
| Note 2: | The ceilings on the aggregate amounts are permitted to make in endorsements/guarantees shall not exceed 40% and 100% of total equity of shareholders, respectively, according to “The Process of make in endorsements/guarantees” of ASE and DH. |
| Note 3: | Amount was included principal and interest. |
| - 95 - |
TABLE 3
ADVANCED SEMICONDUCTOR ENGINEERING, INC. AND SUBSIDIARIES
MARKETABLE SECURITIES HELD
DECEMBER 31, 2015
(Amounts In Thousands of New Taiwan Dollars, Unless Specified Otherwise)
December 31, 2015 | ||||||||||
Held Company Name | Marketable Securities Type and Name | Relationship with the Company | Financial Statement Account` | Shares/Units | Carrying Value | Percentage of Ownership (%) | Fair Value | Note | ||
| The Company | Stock | |||||||||
| H&HH Venture Investment Corporation | – | Available-for-sale financial assets – non-current | 2,528,090 | $ | 10,771 | 15 | $ | 10,771 | ||
| H&D Venture Capital Investment Corporation | - | Available-for-sale financial assets – non-current | 2,482,758 | 33,798 | 13 | 33,798 | ||||
| MiTAC Information Technology Corp. | Available-for-sale financial assets – non-current | 4,203 | 27 | – | 27 | |||||
| Asia Pacific Emerging Industry Venture Capital Co., Ltd. | Available-for-sale financial assets – non-current | 6,000,000 | 37,524 | 7 | 37,524 | |||||
| StarChips Technology Inc. | Available-for-sale financial assets – non-current | 333,334 | – | 6 | – | |||||
| Bond | ||||||||||
| AMPI Second Private of Domestic Unsecured | Financial assets at fair value through profit | 1,000 | 100,500 | – | 100,500 | |||||
| Convertible Bonds | – | or loss - current | ||||||||
| Limited Liability Partnership | ||||||||||
| Ripley Cable Holdings I, L.P. | – | Available-for-sale financial assets – non-current | - | 390,987 | 4 | 390,987 | ||||
| ASE Test, Inc. | Stock | |||||||||
| The Company | Parent Company | Available-for-sale financial assets – non-current | 10,978,776 | 417,193 | – | 417,193 | ||||
| MiTAC Information Technology Corp | – | Available-for-sale financial assets – non-current | 1,133,363 | 7,314 | 1 | 7,314 | ||||
| Fund | ||||||||||
| CTBC ASIA PACIFIC MULTIPLE INCOME | – | Available-for-sale financial assets – current | 1,600,192 | 16,036 | – | 16,036 | ||||
| FUND-A | ||||||||||
| J&R Industrial Inc. | Fund | |||||||||
| Taishin Ta Chong Money Market Fund | - | Financial assets at fair value through profit | 33,664,705 | 472,164 | – | 472,164 | ||||
| or loss - current | ||||||||||
| Jih Sun Money Market Fund | Financial assets at fair value through profit | 1,575,019 | 23,029 | - | 23,029 | |||||
| or loss - current | ||||||||||
| Hua Nan Kirim Money Market Fund | – | Financial assets at fair value through profit | 2,616,592 | 30,962 | – | 30,962 | ||||
| or loss - current | ||||||||||
| Hua Nan Phoenix Money Market Fund | – | Financial assets at fair value through profit | 2,833,825 | 45,555 | – | 45,555 | ||||
| or loss - current | ||||||||||
| Luchu Development Corporation | Stock | |||||||||
| Powerchip Technology Corporation | – | Available-for-sale financial assets – non-current | 1,677,166 | 27,530 | – | 27,530 | ||||
| A.S.E. Holding Limited | Stock | |||||||||
| Global Strategic Investment Inc. | – | Available-for-sale financial assets – non-current | 490,000 | US$ 414 thousand | 3 | US$ 414 thousand | ||||
| SiPhoton, Inc. | – | Available-for-sale financial assets – non-current | 544,800 | * | 4 | |||||
| Global Strategic Investment, Inc. (Samoa) | - | Available-for-sale financial assets – non-current | 869,891 | US$ 1,253 thousand | 2 | US$ 1,253 thousand | ||||
| J & R Holding Limited | Stock | |||||||||
| The Company | Parent Company | Available-for-sale financial assets – non-current | 46,703,763 | US$ 54,067 thousand | 1 | US$ 54,067 thousand | ||||
(Continued)
| - 96 - |
TABLE 3
ADVANCED SEMICONDUCTOR ENGINEERING, INC. AND SUBSIDIARIES
MARKETABLE SECURITIES HELD
DECEMBER 31, 2015
(Amounts In Thousands of New Taiwan Dollars, Unless Specified Otherwise)
December 31, 2015 | ||||||||
Held Company Name | Marketable Securities Type and Name | Relationship with the Company | Financial Statement Account` | Shares/Units | Carrying Value | Percentage of Ownership (%) | Fair Value | Note |
| Limited Liability Partnership | ||||||||
| Crimson Velocity Fund, L.P. | – | Available-for-sale financial assets – non-current | – | US$ 1,597 thousand | – | US$ 1,597 thousand | ||
| H&QAP Greater China Growth Fund, L.P. | - | Available-for-sale financial assets – non-current | – | US$ 1,011 thousand | 8 | US$ 1,011 thousand | ||
| ASE Test Limited | Stock | 7 | ||||||
| The Company | Parent Company | Available-for-sale financial assets – non-current | 88,200,472 (Note) | US$ 102,106 thousand | 1 | US$ 102,106 thousand | ||
| Shanghai Ding Hui Real | Fund | |||||||
| Estate Development | 180 ETF | – | Financial assets at fair value through profit | 47,825 | CNY 153 thousand | – | CNY 153 thousand | |
| Co., Ltd. | or loss - current | |||||||
| 300 ETF | – | Financial assets at fair value through profit | 39,700 | CNY 150 thousand | – | CNY 150 thousand | ||
| or loss - current | ||||||||
| Stock | ||||||||
| Gree Electric Applicances, Inc. Of Zhuhai | – | Financial assets at fair value through profit | 28,000 | CNY 626 thousand | – | CNY 626 thousand | ||
| or loss - current | ||||||||
| Saic Motor Corporation Limtied | – | Financial assets at fair value through profit | 19,250 | CNY 408 thousand | CNY 408 thousand | |||
| or loss - current | ||||||||
| Shenyang Toly Bread Co., Ltd. | – | Financial assets at fair value through profit | 1,000 | CNY 39 thousand | – | CNY 39 thousand | ||
| or loss - current | ||||||||
| USINC | Stock | |||||||
| Allied Circuit Co., Ltd. | – | Available-for-sale financial assets – current | 827,009 | 14,307 | 2 | 14,307 | ||
| Universal Venture Capital Investment Corporation | – | Available-for-sale financial assets – non-current | 6,200,00 | 35,789 | 5 | 35,780 | ||
| Plasmag Technology Inc. | – | Available-for-sale financial assets – non-current | 733,000 | 2 | ||||
| Huntington Holdings | Stock | - | Financial assets at fair value through profit | 5,548,800 | US$ 379 thousand | – | US$ 379 thousand | |
| International Co., Ltd. | United Pacific Industrial Ltd. | or loss - current | ||||||
| Financial assets at fair value through profit | 9,633 | US$ 200 thousand | - | US$ 200 thousand | ||||
| Cadence Design SYS Inc. | – | or loss - current | ||||||
| Financial assets at fair value through profit | 1,439,500 | US$ 818 thousand | 20 | US$ 818 thousand | ||||
| Solid Gain Investments Ltd. | - | or loss - current | ||||||
| Preferred stock | ||||||||
| Techgains I Corporation | – | Available-for-sale financial assets – non-current | 526,732 | US$ 268 thousand | 10 | US$ 268 thousand | ||
| Techgains II Corporation | – | Available-for-sale financial assets – non-current | 669,705 | US$ 197 thousand | 4 | US$ 197 thousand | ||
| Unitech Holdings | Stock | |||||||
| International Co., Ltd. | United Pacific Industrial Ltd. | – | Financial assets at fair value through profit | 5,613,600 | US$ 384 thousand | – | US$ 384 thousand | |
| or loss - current | ||||||||
| WacomCo., Ltd. | – | Available-for-sale financial assets – non-current | 1,200,000 | US$ 4,805 thousand | 1 | US$ 4,805 thousand | ||
| Sequans Communications S.A. | – | Available-for-sale financial assets – non-current | 370,554 | US$ 778 thousand | 1 | US$ 778 thousand | ||
| Asia Global Venture Co., Ltd. | – | Available-for-sale financial assets – non-current | 1,000,000 | US$ 454 thousand | 10 | US$ 454 thousand | ||
(Concluded)
| Note: | ASE, Inc.'s stocks held by ASE Test Limited, 88,200,472 shares, are all trusted without power to decide the allocation of the trust assets. |
| - 97 - |
TABLE 4
ADVANCED SEMICONDUCTOR ENGINEERING, INC. AND SUBSIDIARIES
MARKETABLE SECURITIES ACQUIRED AND DISPOSED OF AT COSTS OR PRICES OF AT LEAST NT$300 MILLION OR 20% OF THE PAID-IN CAPITAL
FOR THE YEAR ENDED DECEMBER 31, 2015
(Amounts In Thousands of New Taiwan Dollars, Unless Specified Otherwise)
| Beginning Balance | Acquisitions | Disposal | Ending Balance | |||||||||||
Company Name | Marketable Securities; | Financial Statement Account | Counter-party | Nature of | Share | Amount | Shares/ | Amount | Shares/ | Amount | Carrying | Gain/Loss on Disposal | Shares/ | Amount |
| The Company | Fund | |||||||||||||
| Mega Diamond Money Market Fund | Available-for-sale financial assets – current | – | – | 32,504,205 | $ 400,007 | – | $ – | 32,504,205 | $ 400,085 | $ 400,000 | $ 85 | – | $ – | |
| Stock | ||||||||||||||
| USI | Investments accounted for using the equity method | (Note 2) | Subsidiary | 1,625,015,916 | 36,706,080 | – | – | 1,585,412,694 | 36,214,968 | 36,218,502 | (3,534) | 39,603,222 | 1,187,548 | |
| USINC | Investments accounted for using the equity method | (Note 2) | Subsidiary | – | – | 990,080,566 | 36,214,968 | – | – | – | – | 990,080,566 | 44,733,359 | |
| ASEEE | Investments accounted for using the equity method | (Note 3) | Joint Venture | – | – | 61,809,660 | 618,097 | – | – | – | – | 61,809,660 | 613,841 | |
| SPIL | Investments accounted for using the equity method | (Note 4) | Associate | – | – | 779,000,000 | 25,055,000 | – | – | – | – | 779,000,000 | 35,423,058 | |
| ASE Test, Inc. | Fund | |||||||||||||
| UPAMC James Bond Money Market Fund | Available-for-sale financial assets – current | – | – | 18,289,114 | 300,338 | 18,187,991 | 300,000 | 36,477,105 | 601,787 | 600,000 | 1,787 | – | – | |
| CTBC Hua-win Money Market Fund | Available-for-sale financial assets – current | – | – | 27,717,723 | 300,033 | – | – | 27,717,723 | 301,242 | 300,000 | 1,242 | – | – | |
| FUBON CHI-HSIANG Money Market Fund | Available-for-sale financial assets – current | – | – | – | – | 25,850,193 | 400,000 | 25,850,193 | 400,257 | 400,000 | 257 | – | – | |
| Stock | ||||||||||||||
| Auto Enterprises Limited | Investments accounted for using the equity method | (Note 5) | Subsidiary | 140,000,000 | 3,351,112 | 48,000,000 | 1,507,200 | – | – | – | – | 188,000,000 | 4,490,553 | |
| J&R Industrial Inc. | Fund | |||||||||||||
| Taishin 1699 Money Market Fund | Financial assets at fair value through profit or loss – current | – | – | 34,302,310 | 455,720 | 14,256,665 | 190,000 | 48,558,973 | 646,223 | 644,000 | 2,223 | – | - | |
| Taishin Ta Chong Money Market Fund | Financial assets at fair value through profit or loss – current | – | – | – | – | 33,664,705 | 470,066 | – | – | – | – | 33,664,705 | 472,164 | |
| Alto Enterprises Limited | Capital | |||||||||||||
| ASE Investment (Kun Shan) Limited | Investments accounted for using the equity method | (Note 5) | Subsidiary | – | US 55,957 thousand | – | US$ 48,000 thousand | – | – | – | – | – | US$ 88,752 thousand | |
| ASE Investment | Capital | |||||||||||||
| (Kun Shen) Limited | ASE (Kun Shan) Inc. | Investments accounted for using the equity method | (Note 5) | Subsidiary | – | US$ 55,981 thousand | – | US$ 48,000 thousand | – | – | – | – | – | US$ 88,805 |
| USISH | Capital | |||||||||||||
| Universal Global Technology (Shanghai) Co., Ltd. | Investments accounted for using the equity method | (Note 5) | Subsidiary | – | CNY 341,705 thousand | - | CNY 800,000 thousand | – | – | – | – | – | CNY 727,596 thousand | |
| USIE | Stock | |||||||||||||
| USISH | Investments accounted for using the equity method | – | Subsidiary | 895,874,563 | US$ 834,449 thousand | – | – | – | US$ 319,785 thousand | US$ 52,456 thousand | US$ 232,972 thousand | 1,683,749,126 | US$ 814,021 thousand |
| Note 1: | The ending balance of Long-Term Stock Investment-Equity Method includes share of profits/losses of investees and other related adjustment to equity. The ending balance of other financial assets includes the adjustment to fair value. |
| Note 2: | USI, Inc divided from Universal Scientific Industrial Co., Ltd. |
| Note 3: | Joint venture with TDK Corporation |
| Note 4: | Public Tender Offer |
| Note 5: | Capital Increase by Cash |
| - 98 - |
TABLE 5
ADVANCED SEMICONDUCTOR ENGINEERING, INC. AND SUBSIDIARIES
ACQUISITION OF INDIVIDUAL REAL ESTATE PROPERTIES AT COSTS OF AT LEAST NT$300 MILLION OR 20% OF THE PAID-IN CAPITAL
FOR THE YEAR ENDED DECEMBER 31, 2015
(Amounts In Thousands of New Taiwan Dollars)
Prior Transaction of Related Counter-party | |||||||||||||
Company Name | Type of Property | Transaction Date | Transaction | Payment Term | Counter-party | Nature of Relationships | Owner | Relationships | Transfer Date | Amount | Price Reference | Purpose of Acquisition | Other Terms |
| The Company | No. 1, Chuangyi N. Rd. in Nantze 2nd Export Processing Zone, Kaohsiung City | June 04, 2015 | $ 1,718,000 | Paid | HC | Associate | – | – | – | $ – | Based on independent professional appraisal reports | To facilitate the future production expansion plan | None |
| No. 66, Yenfa Rd. in Nantze 2nd Export Processing Zone, Kaohsiung City | June 04, 2015 | 748,000 | Paid | HC | Associate | – | – | – | – | Based on independent professional appraisal reports | To facilitate the future production expansion plan | None | |
| The building construction of foreign worker dormitory of ASE’s Kaohsiung factory | January 01, 2015~December 31, 2015 | 504,600 | There is 37,800 thousand will be paid after acceptance check. | HU Hwa Construction Co., Ltd. | Associate | – | – | – | – | Based on independent professional appraisal reports | To manage the demand for accommodation resulted from the recruitment accommodation safety and quality for foreign workers | None | |
| Facilities and equipment of ASE’s Kaohsiung factory | January 01, 2015~December 31, 2015 | 355,282 | There is 121,521 thousand will be paid after acceptance check. | Kun Lin Engineering Co., Ltd. | – | – | – | – | – | Request for quotation price comparison and price negotiation | Facilities and equipment expansion | None | |
| Facilities and equipment of ASE’s Kaohsiung factory | January 01, 2015~December 31, 2015 | 337,374 | There is 55,130 thousand will be paid after acceptance check. | Hyun Chang Enterprise Co., Ltd. | – | – | – | – | – | Request for quotation price comparison and price negotiation | Facilities and equipment expansion | None | |
| Facilities and equipment of ASE’s Kaohsiung factory | January 01, 2015~December 31, 2015 | 310,414 | There is 62,600 thousand will be paid after acceptance check. | Aircare Engineering Corp. | – | – | – | – | – | Request for quotation price comparison and price negotiation | Facilities and equipment expansion | None | |
| Facilities and equipment of ASE’s Kaohsiung factory | January 01, 2015~December 31, 2015 | 307,000 | There is 184,200 thousand will be paid after acceptance check. | Aqualab Inc. | – | – | – | – | – | Request for quotation price comparison and price negotiation | Facilities and equipment expansion | None | |
| ASE Assembly & Test (Shanghai) Limited | New plants of ASE Group Zhangjiang 2nd phase project | May 05, 2015~December 24, 2015 | 548,465 | There is 90,747 thousand will be paid after acceptance check. | China MCC20 Group Corp. Ltd. | – | – | – | – | – | Bidding, price comparison and price negotiation | To facilitate the future production expansion plan | None |
| - 99 - |
TABLE 6
ADVANCED SEMICONDUCTOR ENGINEERING, INC. AND SUBSIDIARIES
TOTAL PURCHASES FROM OR SALES TO RELATED PARTIES OF AT LEAST NT$100 MILLION OR 20% OF THE PAID-IN CAPITAL
FOR THE YEAR ENDED DECEMBER 31, 2015
(Amounts In Thousands of New Taiwan Dollars)
Transition Detials | Abnormal Transaction | Notes/Accounts Payable or Receivable | |||||||||
Buyer | Related Party | Relationships | Purchases/ | Amount | % to Total | Payment Terms | Unit Price | Payment Terms | Ending Balance | % to Total | Note |
| The Company | ASE (Shanghai) Inc. | Subsidiary | Purchases | $ 1,713,266 | 6 | Net 60 days from the end of the month of when invoice is issued | $ – | – | $ (433,581) | (6) | Note |
| ASE Electronics Inc. | Subsidiary | Purchases | 1,990,597 | 6 | Net 60 days from the end of the month of when invoice is issued | – | – | (475,673) | (6) | Note | |
| ISE Labs, Inc. | Subsidiary | Sales | (121,374) | – | Net 45 days from invoice date | – | – | 30,216 | – | Note | |
| Universal Scientific Industrial Co., Ltd. | Subsidiary | Sales | (9,083,160) | (10) | Net 60 days from the end of the month of when invoice is issued | – | – | 2,220,182 | 14 | Note | |
| ASE Japan Co., Ltd. | Subsidiary | Sales | (116,993) | – | Net 60 days from the end of the month of when invoice is issued | – | – | 18,075 | – | Note | |
| ASE Assembly & Test (Shanghai) Limited | ASE (Shanghai) Inc. | Associate | Purchases | 399,553 | 13 | Net 60 days from the end of the month of when invoice is issued | – | – | (68,869) | (11) | Note |
| ASE Electronics Inc. | Associate | Purchases | 212,770 | 7 | Net 60 days from the end of the month of when invoice is issued | – | – | (47,235) | (8) | Note | |
| Advanced Semiconductor Engineering (HK) Limited | ASE (Shanghai) Inc. | Parent company | Purchases | 1,059,036 | 100 | Net 60 days from invoice date | – | – | (306,358) | (100) | Note |
| ASE Electronics (M) Sdn. Bhd. | ASE Electronics Inc. | Associate | Purchases | 380,496 | 26 | Net 60 days from invoice date | – | – | (61,229) | (24) | Note |
| ISE Labs, Inc. | The Company | The Ultimate Parent of the Company | Purchases | 121,374 | 47 | Net 45 days from invoice date | – | – | (30,295) | (38) | Note |
| Universal Scientific Industrial Co., Ltd. | The Company | The Ultimate Parent of the Company | Purchases | 9,083,160 | 30 | Net 60 days from the end of the month of when invoice is issued | – | – | (2,214,594) | (62) | Note |
| ASE Japan Co., Ltd. | The Company | The Ultimate Parent of the Company | Sales | 116,993 | 50 | Net 60 days from the end of the month of when invoice is issued | – | – | (18,101) | (22) | Note |
| ASE (Shanghai) Inc. | The Company | The Ultimate Parent of the Company | Sales | (1,713,266) | (39) | Net 60 days from the end of the month of when invoice is issued | – | – | 435,484 | 48 | Note |
| ASE Assembly & Test (Shanghai) Limited | Associate | Sales | (399,553) | (9) | Net 60 days from invoice date | – | – | 68,869 | 8 | Note | |
| Advanced Semiconductor Engineering (HK) Limited | Subsidiary | Sales | (1,059,036) | (24) | Net 90 days from the end of the month of when invoice is issued | – | – | 306,358 | 34 | Note | |
| ASE Electronics Inc. | The Company | The Ultimate Parent of the Company | Sales | (1,990,597) | (50) | Net 60 days from the end of the month of when invoice is issued | – | – | 494,337 | 51 | Note |
| ASE Electronics (M) Sdn. Bhd. | Associate | Sales | (380,496) | (10) | Net 60 days from the end of the month of when invoice is issued | – | – | 61,337 | 6 | Note | |
| ASE Assembly & Test (Shanghai) Limited | Associate | Sales | (212,770) | (5) | Net 60 days from the end of the month of when invoice is issued | – | – | 47,876 | 5 | Note | |
| Universal Global Technology Co., Limited | Associate | Sales | (305,682) | (8) | Net 60 days from the end of the month of when invoice is issued | – | – | 115,072 | 12 | Note | |
(Continued)
| - 100 - |
TABLE 6
ADVANCED SEMICONDUCTOR ENGINEERING, INC. AND SUBSIDIARIES
TOTAL PURCHASES FROM OR SALES TO RELATED PARTIES OF AT LEAST NT$100 MILLION OR 20% OF THE PAID-IN CAPITAL
FOR THE YEAR ENDED DECEMBER 31, 2015
(Amounts In Thousands of New Taiwan Dollars)
Transition Detials | Abnormal Transaction | Notes/Accounts Payable or Receivable | |||||||||
Buyer | Related Party | Relationships | Purchases/ | Amount | % to Total | Payment Terms | Unit Price | Payment Terms | Ending Balance | % to Total | Note |
| Suzhon ASEN Semiconductors Co., Ltd. | NXP Semiconductors Taiwan Ltd. | Subsidiary of the company has significant influence over Suzhou ASEM Semiconductors Co., Ltd. – Subsidiary of NXP B.V. | Sales | $ (1,924,007) | (39) | Net 90 days from the end of the month of when invoice is issued | $ – | – | $ 668,998 | 51 | Note |
| USI Electronics | Universal Global Industrial | Associate | Purchase | CNY 738,134 thousand | 20 | T/T 75 days | – | – | (CNY 149,480 thousand) | (13) | Note |
| (Shenzhen) Co., Ltd. | Co., Limited | Sales | (CNY 2,596,129 thousand) | (54) | T/T 75 days | – | – | CNY 649,947 thousand | 54 | Note | |
| – | – | (CNY 903,017 thousand) | (48) | Note | |||||||
| Universal Scientific Industrial (Shanghai) Co., Ltd. | Universal Global Technology Co., Limited | Subsidiary | Purchases | CNY 1,809,909 thousand | 22 | T/T 75 days | – | – | Note | ||
| Universal Global Industrial Co., Limited | Subsidiary | Sales | (CNY 35,722 thousand) | – | T/T 75 days | – | – | CNY 12,184 thousand | 1 | Note | |
| USI Electronics (Shenshen) Co., Ltd. | Subsidiary | Sales | (CNY 34,959 thousand) | – | T/T 75 days | – | – | CNY 329 thousand | – | Note | |
| Universal Global Technology Co., Limited | Universal Scientific Industrial (Shanghai) Co., Ltd. | Parent company | Sales | (US$ 288,558 thousand) | (68) | T/T 75 days | – | – | US$ 139,083 thousand | 93 | Note |
| Universal Global Technology (Kunshen) Co., Ltd | Associate | Sales | (US$ 137,121 thousand) | (32) | T/T 75 days | – | – | US$ 10,721 thousand | 7 | Note | |
| ASE Electronics Inc. | Associate | Purchases | 305,682 | 2 | Net 60 days from the end of the month of when invoice is issued | - | - | (115,072) | (1) | Note | |
| Universal Global | USI Electronics | Associate | Purchases | US$ 417,234 thousand | 54 | T/T 75 days | – | – | (US$ 100,090 thousand) | (58) | Note |
| Industrial Co. Limited | (Shenshen) Co., Ltd. | Sales | (US$107,966 thousand) | (14) | T/T 75 days | – | – | US$ 21,927 thousand | 12 | Note | |
| Universal Scientific Industrial (Shanghai) Co., Ltd. | Parent companies | Purchases | US$ 5,707 thousand | 1 | T/T 75 days | – | – | (US$ 1,876 thousand) | (1) | Note | |
| Universal Global Scientific | Associate | Purchases | US$ 9,520 thousand | 1 | T/T 75 days | – | – | (US$ 1,143 thousand) | (1) | Note | |
| Industrial Co. Ltd | Sales | (US$544,423 thousand) | (70) | T/T 75 days | – | – | US $121,600 | 68 | Note | ||
| Universal Global Technology | Associate | Purchases | US$ 241,229 thousand | 31 | T/T 75 days | – | – | (US$ 31,576 thousand) | (18) | Note | |
| (Kunshen) Co., Ltd | Sales | (US$ 11,791 thousand) | (2) | T/T 75 days | – | – | US$ 2,144 thousand | 1 | Note | ||
| Universal Global | Universal Global Industrial | Associate | Purchases | 17,349,315 | 89 | T/T 75 days | – | – | (3,989,043) | (88) | Note |
| Scientific Industrial Co., Ltd. | Co., Limited | Sales | (273,913) | (1) | T/T 75 days | – | – | 76,102 | (1) | Note | |
| Universal Scientific Industrial (Shanghai) Co., Ltd. | Parent companies | Sales | (226,300) | (1) | T/T 75 days | – | – | – | – | Note | |
| USI Electronics (Shenshen) Co., Ltd. | Associate | Sales | (149,600) | (1) | T/T 75 days | – | – | – | – | Note | |
| Universal Scientific Industrial Co., Ltd. | Associate | Sales | (1,496,637) | (7) | T/T 75 days | – | – | 329,214 | 6 | Note | |
| Universal Global Technology (Kunshen) Co., Ltd | Universal Global Technology Co., Limited | Associate | Purchases | CNY 853,882 thousand | 46 | T/T 75 days | – | – | (CNY 69,615 thousand) | (22) | Note |
| Universal Global Industrial | Associate | Purchases | CNY 73,828 thousand | 4 | T/T 75 days | – | – | (CNY 13,922 thousand) | (4) | Note | |
| Co., Limited | Sales | (CNY 1,497,895 thousand) | (66) | T/T 75 days | – | – | CNY 206,744 thousand | 45 | Note | ||
| Note 3: Amount was included principal and interest. | (Concluded) |
| - 101 - |
TABLE 7
ADVANCED SEMICONDUCTOR ENGINEERING, INC. AND SUBSIDIARIES
RECEIVABLES FROM RELATED PARTIES AMOUNTING TO AT LEAST NT$100 MILLION OR 20% OF THE PAID-IN CAPITAL
DECEMBER 31, 2015
(Amounts In Thousands of New Taiwan Dollars, Unless Specified Otherwise)
| Turnover Rate | Overdue (Note 1) | Amounts Received | Allowance for | ||||||
Company Name | Related Party | Relationships | Ending Balance (Note 1) | (Note 2) | Amount | Actions Taken | in Subsequent Period | Bad Debts | |
| The Company | Universal Scientific Industrial Co., Ltd. | Subsidiary | $2,220,182 | (Note 5) | 3 | $6.173 | Continued collection | $1,766,202 | $ – |
| ASE Electronics Inc. | The Company | The Ultimate Parent of the Company | 700,456 | (Note 5) | 4 | – | – | 406,076 | – |
| Universal Global Technology Co., Ltd. | Associate | 115,072 | (Note 5) | 5 | – | – | 94,561 | – | |
| Omniquest Industrial Limited | The Company | Parent Company | 1,641,250 | (Notes 3, 5) | – | – | – | – | – |
| ISE Labs, Inc. | J & R Holding Limited | Parent company | 1,510,312 | (Notes 3, 5) | – | – | – | – | – |
| Anstock II Limited | J & R Holding Limited | Parent company | 9,810,065 | (Notes 3, 5) | – | – | – | 61,040 | – |
| Anstock Limited | ASE Assembly & Test (Shanghai) Limited | Associate | 3,293,743 | (Notes 3, 5) | – | – | – | – | – |
| A.S.E. Holding Limited | The Company | Parent company | 2,757,300 | (Notes 3, 5) | – | – | – | – | – |
| ASE Test, Inc. | The Company | Parent company | 7,320,710 | (Notes 3,4,5) | – | – | – | 590,421 | – |
| ASE Corporation | Associate | 900,000 | (Notes 3, 5) | – | – | – | – | – | |
| ASE Test Limited | The Company | The Ultimate Parent of the Company | 4,037,475 | (Notes 3, 5) | – | – | – | – | – |
| A.S.E. Holding Limited | Associate | 1,663,540 | (Notes 3, 5) | – | – | – | – | – | |
| Omniquest Industrial Limited | Associate | 1,644,277 | (Notes 3, 5) | – | – | – | – | – | |
| ASE Singapore Pte. Ltd. | A.S.E. Holding Limited | Associate | 394,118 | (Notes 3, 5) | – | – | – | – | – |
| ASE (Korea) Inc. | The Company | The Ultimate Parent of the Company | 2,627,294 | (Notes 3, 5) | – | – | – | 241 | – |
| ASE WeiHai Inc. | Subsidiary | 1,643,994 | (Notes 3, 5) | – | – | – | – | – | |
| J & R Holding Limited | The Company | Parent company | 9,256,650 | (Notes 3, 5) | – | – | – | – | – |
| Global Advanced Packaging Technology Limited, Cayman Islands. | Subsidiary | 2,471,186 | (Notes 3, 5) | – | – | – | – | – | |
| Anstock Limited | Subsidiary | 801,897 | (Notes 3, 5) | – | – | – | – | – | |
| ASE WeiHai Inc. | Associate | 1,380,065 | (Notes 3, 5) | – | – | – | – | – | |
| ASE Assembly & Test (Shanghai) Limited | Associate | 560,401 | (Notes 3, 5) | – | – | – | – | – | |
| Imnosource Limited | Associate | 723,447 | (Notes 3, 5) | – | – | – | – | – | |
| Real Tech Holdings Limited | Associate | 2,134,808 | (Notes 3, 5) | – | – | – | – | – | |
| Imnosource Limited | The Company | Parent company | 722,150 | (Notes 3, 5) | – | – | – | – | – |
| J&R Industrial Inc. | The Company | The Ultimate Parent of the Company | 190,000 | (Notes 3, 5) | – | – | – | – | – |
| ASE Electronics Inc. | Associate | 190,000 | (Notes 3, 5) | – | – | – | – | – | |
(Continued)
| - 102 - |
TABLE 7
ADVANCED SEMICONDUCTOR ENGINEERING, INC. AND SUBSIDIARIES
RECEIVABLES FROM RELATED PARTIES AMOUNTING TO AT LEAST NT$100 MILLION OR 20% OF THE PAID-IN CAPITAL
DECEMBER 31, 2015
(Amounts In Thousands of New Taiwan Dollars, Unless Specified Otherwise)
Appendix 3.table7b
| Turnover Rate | Overdue (Note 1) | Amounts Received | Allowance for | ||||||
| Company Name | Related Party | Relationships | Ending Balance (Note 1) | (Note 2) | Amount | Actions Taken | in Subsequent Period | Bad Debts | |
| Global Advanced Packaging Technology, Limited Cayman Islands | The Company | The Ultimate Parent of the Company | $1,956,675 | (Notes 3,5) | – | $ – | – | $ – | $ – |
| ASE Japan Co., Ltd. | J & R Holding Limited | Parent company | 2,264,165 | (Notes 3,5) | – | – | – | – | – |
| ASE Corporation | The Company | The Ultimate Parent of the Company | 900,000 | (Notes 3,5) | – | – | – | – | – |
| ASE (Shanghai) Inc. | The Company | The Ultimate Parent of the Company | 435,484 | (Note 5) | 3 | 40,311 | Continued collection | 105,042 | – |
| Advanced Semiconductor Engineering (HK) Limited | Subsidiary | 306,358 | (Note 5) | 3 | 1,772 | Continued collection | 100,053 | – | |
| ASE WeiHai Inc. | Associate | 164,556 | (Notes 3,5) | – | – | – | – | – | |
| Shanghai Ding Hui Real Estate Development Co., Ltd. | Kun Shan Ding Hong Real Estate Development Co., Ltd. | Subsidiary | 570,852 | (Notes 3,5) | – | – | – | 750 | – |
| USI Enterprise Limited | The Company | The Ultimate Parent of the Company | 2,626,000 | (Notes 3,5) | – | – | – | – | – |
| J & R Holding Limited | Associate | 6,402,296 | (Notes 3,5) | – | – | – | 6.663 | – | |
| USI Inc. | Parent company | 2,233,090 | (Notes 3,5) | – | – | – | – | – | |
| Huntington Holdings International Co. Ltd. | The Company | The Ultimate Parent of the Company | 1,805,375 | (Notes 3,5) | – | – | – | – | – |
| Real Tech Holdings Limited | The Company | The Ultimate Parent of the Company | 3,939,000 | (Notes 3,5) | – | – | – | – | – |
| Suzhou ASEN Semiconductors Co., Ltd. | NXP Semiconductors Taiwan Ltd. | Subsidiary of the company has significant influence over Suzhou ASEN Semiconductors Co., Ltd. | 683,680 | 3 | – | – | – | ||
| USI Electronics (Shenzhen) Co., Ltd. | Universal Scientific Industrial (Shanghai) Co., Ltd. | Associate | CNY 650,086 thousand | (Note 5) | 4 | – | – | CNY 249,196 thousand | – |
| Universal Global Technology (Shanghai) Co., Ltd. | Associate | CNY 261,002 thousand | (Note 5) | – | – | – | – | – | |
| Universal Scientific Industrial (Shanghai) Co., Ltd. | Universal Global Technology (Shanghai) Co., Ltd. | Subsidiary | CNY 393,196 thousand | (Note 5) | – | – | – | – | – |
| USI Electronics (Shenzhen) Co., Ltd. | Subsidiary | CNYI 289,096 thousand | (Note 5) | – | – | – | – | – | |
| Universal Global Technology Co., Limited | Universal Scientific Industrial (Shanghai) Co., Ltd. | Parent company | US$ 139,153 thousand | (Note 5) | 4 | – | – | US$ 49,939 thousand | – |
| Universal Global Technology (Kunshan) Co., Ltd. | Associate | US$ 10,721 thousand | (Note 5) | 5 | – | – | – | – | |
| USI Electronics (Shenzhen) Co., Ltd. | Subsidiary | US$ 43,119 thousand | (Note 5) | – | – | – | US$ 43,119 thousand | – | |
| Universal Global Industrial Co., Limited | USI Electronics (Shenzhen) Co., Ltd. | Associate | US$ 23,084 thousand | (Note 5) | 4 | – | – | US$ 6,589 thousand | – |
| Universal Global Scientific Industrial Co., Ltd. | Associate | US$ 121,863 thousand | (Note 5) | 5 | – | – | US$46,803 thousand | – | |
| Universal Global Scientific Industrial Co., Ltd. | Universal Scientific Industrial Co., Ltd. | Associate | 345,070 | (Note 5) | 4 | 2,563 | Continued collection | 273,537 | – |
| Universal Global Technology (Kunshan) Co., Ltd. | Universal Global Industrial Co., Limited | Associate | CNY 206,744 thousand | (Note 5) | 6 | – | – | CNY 63,666 thousand | – |
(Continued)
| - 103 - |
Note 1: Include Accounts receivables and Other receivables
Note 2: Exclude other receivables
Note 3: Intercompany Loan, please refer to Table 1.
Note 4: Turnkey transaction.
Note 5: All the transactions had been eliminated when preparing consolidated financial statements.
| - 104 - |
TABLE 8
ADVANCED SEMICONDUCTOR ENGINEERING, INC. AND SUBSIDIARIES
NAMES, LOCATIONS, AND RELATED INFORMATION OF INVESTEES OVER WHICH THE COMPANY EXERCISES SIGNIFICANT INFLUENCE
FOR THE YEAR ENDED DECEMBER 31, 2015
(Amounts In Thousands of New Taiwan Dollars, Unless Specified Otherwise)
| Original Investment Amount | Balance as of December 31, 2015 | Net Income | Share of Profits/ Losses | ||||||||
| Investor Company | Investee Company | Location | Main Businesses and Products | December 31, 2015 | December 31, 2014 | Shares | Percentage of Ownership | Carrying Value | (Losses) of the Investee | of Investee (Note 1) | Note |
| The Company | A.S.E. Holding Limited | Bermuda | Investment activities | US $ 283,966 thousand | US$ 283,966 thousand | 243,966 | 100 | $ 15,251,124 | $ 498,485 | $ 480,474 | Subsidiary |
| J & R Holding Limited | Bermuda | Investment activities | US$ 479,693 thousand | US$ 479,693 thousand | 435,128 | 100 | 47,271,666 | 2,304,578 | 2,049,623 | Subsidiary | |
| ASE Marketing & Service Japan Co., Ltd. | Japan | Engaged in marketing and sales services | JPY 60,000 thousand | JPY 60,000 thousand | 1,200 | 100 | 27,986 | 2,082 | 2,082 | Subsidiary | |
| Omniquest Industrial Limited | British Virgin Islands | Investment activities | US$ 250,504 thousand | US$ 250,504 thousand | 250,504,067 | 71 | 11,140,252 | 233,728 | 198,948 | Subsidiary | |
| Innosource Limited | British Virgin Islands | Investment activities | US$ 86,000 thousand | US$ 86,000 thousand | 86,000,000 | 100 | 3,998.959 | 67,639 | 77,641 | Subsidiary | |
| HCK | Taiwan | Engaged in the leasing of real estate properties | $ 390,470 | $ 390,470 | 35,497,273 | 27 | 332,444 | (35,497) | (9,794) | Associate | |
| HC | Taiwan | Engaged in the development, construction and leasing of real estate properties | 2,845,911 | 2,845,913 | 68,629,782 | 26 | 1,313,499 | 701,551 | 64,151 | Associate | |
| USI | Taiwan | Engaged in the manufacturing, processing and sale of computers, computer peripherals and related accessories | 520,490 | 21,356,967 | 39,603,222 | 99 | 1,187,548 | 776,524 | 1,200,793 | Subsidiary | |
| ASE Test, Inc. | Taiwan | Engaged in the testing of semiconductors | 20,698,867 | 20,698,867 | 851,997,366 | 100 | 29,586,903 | 2,905,510 | 2,883,511 | Subsidiary | |
| USINC | Taiwan | Investment activities | 20,816,477 | – | 990,00,566 | 99 | 44,753,359 | 1,427,299 | 1,239,134 | Subsidiary | |
| Luchu Development Corporation | Taiwan | Engaged in the development of real estate properties | 1,366,238 | 1,366,238 | 131,961,457 | 67 | 1,332,571 | (2,276) | (1,527) | Subsidiary | |
| ASEFF | Taiwan | Engaged in the production of embedded substrate | 618,097 | – | 61,809,660 | 51 | 613,841 | (8,375) | (4,274) | Associate | |
| SPIL | Taiwan | Engaged in the assembly, testing and turnkey services of integrated circuits | 35,055,000 | – | 779,000,000 | 24 | 35,423,048 | 8,762,257 | 410,37 | Associate | |
| AMPI | Taiwan | Engaged in integrated circuit | 178,861 | 178,861 | 33,308,452 | 18 | 40,216 | (217,534) | (58,390) | Associate | |
| ASE Test, Inc. | Alto Enterprises Limited | British Virgin Islands | Investment activities | US$ 188,000 thousand | US$ 140,000 thousand | 188,000,000 | 100 | 4,490,553 | (163,043) | (Note 2) | Subsidiary |
| Super Zone Holdings Limited | Hong Kong | Investment activities | US$ 100,000 thousand | US$ 100,000 thousand | 100,000,000 | 100 | 3,332,370 | 83,754 | (Note 2) | Subsidiary | |
| Luchu Development Corporation | Taiwan | Engaged in the development of real estate properties | 372,504 | 372,504 | 37,250,448 | 19 | 376,082 | (2,276) | (Note 2) | Subsidiary | |
| A.S.E. Holding Limited | ASE Test Limited | Singapore | Investment activities | US$ 84,889 thousand | US$ 84,889 thousand | 11,148,000 | 10 | US$ 102,629 | US$ 57,830 thousand | (Note 2) | Subsidiary |
| ASE Investment (Labuan) Inc. | Malaysia | Investment activities | US$ 168,643 thousand | US$ 168,643 thousand | 168,642,842 | 70 | US$ 343,531 thousand | US$ 14,196 thousand | (Note 2) | Subsidiary | |
| J & R Holding Limited | ASE Test Limited | Singapore | Investment activities | US$ 964,524 thousand | US$ 964,524 thousand | 98,276,087 | 90 | US$ 1,028,767 thousand | US$ 57,830 thousand | (Note 2) | Subsidiary |
| Omniquest Industrial Limited | British Virgin Islands | Investment activities | US$ 30,200 thousand | US$ 30,200 thousand | 30,200,000 | 8 | US$ 41,954 thousand | US$ 7,478 thousand | (Note 2) | Subsidiary | |
| J&R Industrial Inc. | Taiwan | Engaged in leasing equipment and investing activity | US$ 51,344 thousand | US$ 51,344 thousand | 170,000,006 | 100 | US$ 30,394 thousand | US$ 146 thousand | (Note 2) | Subsidiary | |
| ASE Japan Co., Ltd. | Japan | Engaged in the packaging and testing of semiconductors | US$ 25,606 thousand | US$ 25,606 thousand | 7,200 | 100 | US$ 70,861 thousand | US$ 788 thousand | (Note 2) | Subsidiary | |
| ASE (U.S.) Inc. | U.S.A. | After–sales service and sales support | US$ 4,600 thousand | US$ 4,600 thousand | 1,000 | 100 | US$ 12,014 thousand | US$ 1,068 thousand | (Note 2) | Subsidiary | |
| Global Advanced Packaging Technology Limited, Cayman Islands | British Cayman Islands | Investment activities | US$ 190,000 thousand | US$ 190,000 thousand | 190,000,000 | 100 | US$ 328,528 thousand | US$ 13,060 thousand | (Note 2) | Subsidiary | |
| Anstock Limited | British Cayman Islands | Investment activities | US$ 10 thousand | US$ 10 thousand | 10,000 | 100 | US$ 602 thousand | (US$ 18 thousand) | (Note 2) | Subsidiary | |
| Anstock II Limited | British Cayman Islands | Investment activities | US$ 10 thousand | 10 thousand | 10,000 | 100 | US$ 34 thousand | US$ 90 thousand | (Note 2) | Subsidiary | |
| ASE Investment (Labuan) Inc. | ASE (Korea) Inc. | Korea | Engaged in the packaging and testing of semiconductors | US$ 160,000 thousand | US$ 160,000 thousand | 20,741,363 | 100 | US$ 490,753 thousand | US$ 13,955 thousand | (Note 2) | Subsidiary |
| ASE Test Limited | ASE Holdings (Singapore) Pte Ltd | Singapore | Investment activities | US$ 65,520 thousand | US$ 65,520 thousand | 71,428,902 | 100 | US$ 129,372 thousand | US$ 22,127 thousand | (Note 2) | Subsidiary |
| ASE Test Holdings, Ltd. | British Cayman Islands | Investment activities | US$ 222,399 thousand | US$ 222,399 thousand | 5 | 100 | US$ 99,491 thousand | US$ 558 thousand | (Note 2) | Subsidiary | |
| ASE Test Finance Limited | Mauritius | Investment activities | US$ - | US$ 0.002 thousand | - | 100 | – | (US$ 1 thousand) | (Note 2) | Subsidiary | |
| ASE Investment (Labuan) Inc. | Malaysia | Investment activities | US$ 72,304 thousand | US$ 72,304 thousand | 72,304,040 | 30 | US$ 147,228 thousand | US$ 14,196 thousand | (Note 2) | Subsidiary | |
| ASE Singapore Pte. Ltd. | Singapore | Engaged in the packaging and testing of semiconductors | US$ 55,815 thousand | US$ 55,815 thousand | 30,100,000 | 100 | US$ 171,580 thousand | US$ 25,319 thousand | (Note 2) | Subsidiary | |
| ASE Test Holdings, Ltd. | ISE Labs, Inc. | U.S.A | Engaged in the testing of semiconductors | US$ 221,145 thousand | US$ 221,145 thousand | 26,250,000 | 100 | US$ 99,490 thousand | US$ 558 thousand | (Note 2) | Subsidiary |
| ASE Holdings (Singapore) Pte Ltd | ASE Electronics (M) Sdn. Bhd. | Malaysia | Engaged in the packaging and testing of semiconductors | US$ 60,000 thousand | US$ 60,000 thousand | 159,715,000 | 100 | US$ 129,372 thousand | US$ 22,127 thousand | (Note 2) | Subsidiary |
| Omniquest Industrial Limited | ASE Corporation | British Cayman Islands | Investment activities | US$ 352,784 thousand | US$ 352,784 thousand | 352,784,067 | 100 | US$ 493,109 thousand | US$ 7,542 thousand | (Note 2) | Subsidiary |
(Continued)
| - 105 - |
TABLE 8
ADVANCED SEMICONDUCTOR ENGINEERING, INC. AND SUBSIDIARIES
NAMES, LOCATIONS, AND RELATED INFORMATION OF INVESTEES OVER WHICH THE COMPANY EXERCISES SIGNIFICANT INFLUENCE
FOR THE YEAR ENDED DECEMBER 31, 2015
(Amounts In Thousands of New Taiwan Dollars, Unless Specified Otherwise)
| Investor Company | Investee Company | Location | Main Businesses and Products | Original Investment Amount | Balance as of December 31, 2015 | Net Income (Losses) of the Investee | Share of Profits/ Losses of Investee (Note 1) | Note | |||
| December 31, 2015 | December 31, 2014 | Shares | Percentage of Ownership | Carrying Value | |||||||
| ASE Corporation | ASE Mauritius Inc. | Mauritius | Investment activities | US $ 217,800 thousand | US$ 217,800 thousand | 217,800,000 | 100 | US$ 375,804 thousand | US$ 4,246 thousand | (Note 2) | Subsidiary |
| ASE Labuan Inc. | Malaysia | Investment activities | US$ 126,184 thousand | US$ 126,184 thousand | 126,184,067 | 100 | US$ 117,195 thousand | US$ 3,324 thousand | (Note 2) | Subsidiary | |
| ASE Labuan Inc. | ASE Electronics Inc | Taiwan | Engaged in the production of substrates | US$ 125,813 thousand | US$ 125,813 thousand | 398,981,900 | 100 | US$ 116,620 thousand | US$ 3,329 thousand | (Note 2) | Subsidiary |
| Innosource Limited | Omniquest Industrial Limited | British Virgin Islands | Investment activities | US$ 74,000 thousand | US$ 74,000 thousand | 74,000,000 | 21 | US$ 102,839 thousand | US$ 7,478 thousand | (Note 2) | Subsidiary |
| ASE (Shanghai) Inc. | Advanced Semiconductor Engineering (HK) Limited | Hong Kong | Engaged in the trading of substrates | US$ 1,000 thousand | US$ 1,000 thousand | – | 100 | US$ 9,191 thousand | US$ 82 thousand | (Note 2) | Subsidiary |
| USI | Huntington Holdings International Co. Ltd. | British Virgin Islands | Holding company | $ – | $ 8,370,606 | – | – | $ – | $ 586,787 | (Note 2) | Subsidiary |
| Senetex Investment Co., Ltd. | Taiwan | Engaged in investment activities | – | 298 | – | – | – | (2) | (Note 2) | Subsidiary | |
| USIINC | Huntington Holdings International Co. Ltd. | British Virgin Islands | Holding company | 8,370,605 | – | 255,856,840 | 100 | 45,805,518 | 1,552,527 | (Note 2) | Subsidiary |
| Senetex Investment Co., Ltd. | Taiwan | Engaged in investment activities | – | – | – | – | – | 1,046 | (Note 2) | Subsidiary | |
| Huntington Holdings International Co. Ltd. | Unitech Holdings International Co. Ltd. | British Virgin Islands | Holding company | US$ 3,000 thousand | US$ 3,000 thousand | 3,000,000 | 100 | US$ 9,133 thousand | (US$ 46 thousand) | (Note 2) | Subsidiary |
| Real Tech Holdings Limited | British Virgin Islands | Holding company | US$ 149,151 thousand | US$ 149,151 thousand | 149,151,000 | 100 | US$ 1,325,826 thousand | US$ 71,385 thousand | (Note 2) | Subsidiary | |
| Universal ABIT Holding Co., Ltd | British Cayman Islands | Holding company | US$ 28,125 thousand | US$ 28,125 thousand | 90,000,000 | 100 | US$ 13 thousand | (US$ 1 thousand) | (Note 2) | Subsidiary | |
| Rising Capital Investment Limited | British Virgin Islands | Holding company | US$ 6,000 thousand | US$ 6,000 thousand | 6,000,000 | 100 | US$ 1,136 thousand | US$ 4 thousand | (Note 2) | Subsidiary | |
| Rise Accord Limited | British Virgin Islands | Holding company | US$ 2,000 thousand | US$ 2,000 thousand | 20,000 | 100 | US$ 151 thousand | US$ 22 thousand | (Note 2) | Subsidiary | |
| Real Tech Holdings Limited | USI Enterprise Limited | Hong Kong | Engaged in the services of investment advisory and warehousing management | US$ 210,900 thousand | US$ 210,900 thousand | 210,900,000 | 98 | US$ 1,253,125 thousand | US$ 75,710 thousand | (Note 2) | Subsidiary |
| USISH | Universal Global Technology Co., Limited | Hong Kong | Holding company | CNY 324,185 thousand | CNY 324,185 thousand | 390,000,000 | 100 | CNY 1,421,145 thousand | CNY 375,551 thousand | (Note 2) | Subsidiary |
| Universal Global Technology Co., Limited | Universal Global Industrial Co., Limited | Hong Kong | Engaged in manufacturing, trading and investing activity | US$ 11,000 thousand | US$ 11,000 thousand | 85,800,000 | 100 | US$ 18,632 thousand | US$ 1,036 thousand | (Note 2) | Subsidiary |
| Universal Global Scientific Industrial Co., Ltd. | Taiwan | Engaged in the manufacturing of components of telecomm and cars and provision of related R&D services | US$ 30,400 thousand | US$ 30,400 thousand | 98,000,000 | 100 | US$ 83,745 thousand | US$ 22,578 thousand | (Note 2) | Subsidiary | |
| USI Japan Co., Ltd. | Japan | Engaged in the manufacturing and sale of computer peripherals, integrated chip and other related accessories | US$ 885 thousand | US$ 885 thousand | 6,400 | 100 | US$ 751 thousand | US$ 25 thousand | (Note 2) | Subsidiary | |
| USI @ Work, Inc. | U.S.A. | Merged into USI America Inc. in August 2015 | – | US$ 250 thousand | – | – | – | US$ 32 thousand | (Note 2) | Subsidiary | |
| Universal Scientific Industrial De Mexico S.A. De C.V. | Mexico | Engaged in the assembling of motherboards and computer components | US$ 23,963 thousand | US$ 23,963 thousand | 281,085,325 | 100 | US$ 41,731 thousand | US$ 4,414 thousand | (Note 2) | Subsidiary | |
| USI America Inc. | U.S.A. | Engaged in the assembling of motherboards and wireless network communication and provision of related technical service | US$ 9,500 thousand | US$ 9,500 thousand | 250,000 | 100 | US$ 5,365 thousand | US$ 153 thousand | (Note 2) | Subsidiary | |
| Universal Global Industrial Co., Limited | Universal Scientific Industrial De Mexico S.A. De C.V. | Mexico | Engaged in the assembling of motherboards and computer components | – | – | 1 | – | – | US$ 4,414 thousand | (Note 2) | Subsidiary |
(Concluded)
| Note 1: | The share of profits/losses of investee includes the effect of unrealized gross profit on intercompany transaction. |
| Note 2: | The share of profits/losses of investee company is not reflected herein as such amount is already included in the share of profits/losses of the investor company. |
| - 106 - |
TABLE 9
ADVANCED SEMICONDUCTOR ENGINEERING, INC. AND SUBSIDIARIES
INFORMATION ON INVESTMENT IN MAINLAND CHINA
FOR THE YEAR ENDED DECEMBER 31, 2015
(Amounts In Thousands of New Taiwan Dollars, Unless Specified Otherwise)
| Investee Company | Main Business Activities | Paid-in Capital | Investment Method | Accumulated amount of remittance from Taiwan to Mainland China as of January 1, 2015 | Amount remitted from Taiwan to Mainland China/Amount remitted back to Taiwan for the three months ended December 31, 2015 | Accumulated amount of remittance from Taiwan to Mainland China as of December 31, 2015 | Net income of investee as of December 31, 2015 | Ownership held by the Company (direct or indirect) | Investment income (loss) recognized by the Company for the[Illegible] December 31, 2015 | Book value of investments in Mainland China as of December 31, 2015 | Accumulated amount of investment income remitted back to Taiwan as of December 31, 2015 | |
| Remitted to Mainland China | Remitted back to Taiwan | |||||||||||
| ASE (Shanghai) Inc. | Engaged in the production of substrates | $ 4,236,563 (US$ 137,800 thousand) | Note 1 (1) | $ 4,398,576 (US$ 137,800 thousand) | $ – | $ – | $ 4,398,576 (US$ 137,800 thousand) | $ 201,665 (CNY 6,425 thousand) (Note 5) | 100 | $ 201,665 (US$ 6,425 thousand) (Note 5) | $ 10,375,148 (US$ 316,075 thousand) | None |
| ASE (Kun Shan) Inc. | Engaged in the packaging and texting of semiconductors | 8,350,204 (US$ 268,000 thousand) | Note 1 (2) | 6,843,004 (US$ 220,000 thousand) | 1,507,200 (US$ 220,000 thousand) (Note 10) | 8,350,204 (US$ 268,000 thousand) | (230,901) (US$ -7,194 thousand) (Note 4) | 100 | (230,901) (US$ -7,194 thousand) (Note 4) | 6,403,859 (US$ 195,091 thousand) | None | |
| ASE Module (Shanghai) Inc. | Engage in the production and sale of electronic components and printed circuit boards | 383,640 (US$ 12,000 thousand) | Note 1 (3) | 383,640 (US$ 12,000 thousand) | – | – | 383,640 (US$ 12,000 thousand) | 19,139 (US$ 605 thousand) (Note 5) | 100 | 19,139) (US$ 605 thousand) (Note 5) | 616,357 (US$ 18,777 thousand) | None |
| ASE Assembly & Text (Shanghai) Limited | Engaged in the packaging and texting of semiconductors | 6,501,336 (US$ 203,580 thousand) | Note 1 (4) | 5,792,530 (US$ 180,000 thousand) | – | – | 5,792,530 (US$ 180,000 thousand) | 417,581 (US$ 13,177 thousand) (Note 4) | 100 | 417,581 (US$ 13,177 thousand ) (Note 4) | 10,892,636 (US$ 331,840 thousand) | None |
| Suzhou ASEN Semiconductors Co., Ltd. | Engaged in the packaging and testing of semiconductors | 1,568,467 (US$ 48,672 thousand) | Note 1 (5) | 711,180 (US$ 21,600 thousand) | – | – | 711,180 (US$ 21,600 thousand) | 479,965 (US$ 15,144 thousand) (Note 5) | 60 | 287,979 (US$ 9,086 thousand) (Note 5) | 2,257,860 (US$ 68,785 thousand) | None |
| ASE WeiHai Inc. | Engaged in the packaging and testing of semiconductors | 4,507,081 (US$ 152,000 thousand) | Note 1 (6) | 1,295,307 (US$ 40,0000 thousand) | – | – | 1,295,307 (US$ 40,000 thousand) | (245,190) (US$ -7,645 thousand) (Note 5) | 100 | (245,190) (US$ -7,645 thousand) (Note 5) | 1,714,663 (US$ 52,541 thousand) | None |
| Shanghai Ding Hui Real Estate Development Co., Ltd. | Engaged in the development, construction and sale of real estate properties | 16,345,070 (CNY 3,600,000 thousand) | (Note 2) | – (Note 2) | – | – | – (#2) | (145,116) (CNY -28,561 thousand) (Note 5) | 100 | (145,116) (CNY -28,561 thousand ) (Note 5 ) | 19,869,203 (CNY 3,930,622 thousand) | None |
| Shanghai Ding Wei Real Estate Development Co., Ltd. | Engaged in the development, construction and sale of real estate properties | 6,908,089 CNY 1,548,000 thousand) | (Note 2) | – (Note 2) | – | – | – (#2) | (28,429) (CNY -5,599 thousand) (Note 5) | 100 | (28,429) (CNY -5,599 thousand) (Note 5) | 7,749,787 (CNY 1,533,100 thousand) | None |
| Shanghai Ding Yu Real Estate Development Co., Ltd. | Engaged in the development, construction and sale of real estate properties | 4,936,538 (CNY 1,100,000 thousand) | (Note 2) | – (Note 2) | – | – | – (#2) | (5,468) (CNY -1,074 thousand) (Note 5) | 100 | (5,468) (CNY -1,074 thousand) (Note 5) | 5,568,751 (CNY 1,101,637 thousand) | None |
| Kun Shan Ding Hong Real Estate Development Co., Ltd. | Engaged in the development, construction and sale of real estate properties | 3,139,662 (CNY 670,000 thousand) | (Note 2) | – (Note 2) | – | – | – (#2) | (1,432) (CNY -282 thousand) (Note 5) | 100 | (1,432) (CNY -282 thousand) (Note 5) | 3,380,883 (CNY 668,823 thousand) | None |
| Kun Shan Ding Yue Real Estate Development Co., Ltd. | Engaged in the development, construction and sale of real estate properties | 1,346,415 (CNY 330,000 thousand) | (Note 2) | – (Note 2) | – | – | – (#2) | 487 (CNY 96 thousand) (Note 5) | 100 | 487 (CNY 96 thousand) (Note 5) | 1,666,793 (CNY 329,733 thousand) | None |
| Advanced Semiconductor Engineering (China) Ltd. | Engage in the packaging and testing of semiconductors | 1,349,000 (US$ 100,000 thousand) | Note 1 (7) | 3,149,000 (US$ 100,000 thousand) | – | – | 3,149,000 (US$ 100,000 thousand) | 83,753 (US$ 2,616 thousand) (Note 4) | 100 | 83,753 (US$ 2,6161 thousand) (Note 4) | 3,332,245 (US$ 101,515 thousand) | None |
| ASE Investment (Kun Shan) Limited | Holding company | 3,717,318 US$ 122,000 thousand) | Note 1 (8) | 2,210,118 (US$ 74,000 thousand) | 1,507,200 (US$ 48,000 thousand) (Note 10) | – | 3,717,318 (US$ 122,000 thousand) | (106,242) (US$ -3,312 thousand) (Note 4) | 100 | (106,242) (US$ -3,312 thousand) (Note 4) | 2,913,283 (US$ 88,752 thousand) | None |
(Continued)
| - 107 - |
TABLE 9
ADVANCED SEMICONDUCTOR ENGINEERING, INC. AND SUBSIDIARIES
INFORMATION ON INVESTMENT IN MAINLAND CHINA
FOR THE YEAR ENDED DECEMBER 31, 2015
(Amounts In Thousands of New Taiwan Dollars, Unless Specified Otherwise)
| Investee Company | Main Business Activities | Paid-in Capital | Investment Method | Accumulated amount of remittance from Taiwan to Mainland China as of January 1, 2015 | Amount remitted from Taiwan to Mainland China/Amount remitted back to Taiwan for the year ended December 31, 2015 | Accumulated amount of remittance from Taiwan to Mainland China as of December 31, 2015 | Net income of investee as of December 31, 2015 | Ownership held by the Company (direct or indirect) | Investment income (loss) recognized by the Company for the year ended December 31, 2015 | Book value of investments in Mainland China as of December 31, 2015 | Accumulated amount of investment income remitted back to Taiwan as of December 31, 2015 | |
| Remitted to Mainland China | Remitted back to Taiwan | |||||||||||
| Wuxi Tongzhi Microelectronics Co Ltd | Engaged in the packing and testing of semiconductors | $ 356,682 (CNY 73,461 thousand) | (Note 2) | $ – (Note 2) | $ – | $ – | $ – (Note 2) | $ 25,990 (CNY 5,113 thousand) (Note 4) | 100 | $ 25,990 (CNY 5,113 thousand) (Note 4) | $ 454,969 (CNY 90,004 thousand) | None |
| ASE Trading (Shanghai) Ltd. | Engaged in trading activity | 2,566 (CNY 500 thousand) | (Note 2) | – (Note 2) | – | – | – (Note 2) | (255) (CNY -49 thousand) (Note 4) | 100 | (255) (CNY -49 thousand) (Note 4) | 2,279 (CNY 451 thousand) | None |
| Shanghai Ding Qi Property Management Co, Ltd. | Engaged in the management of real estate properties | 5,078 (CNY 1,000 thousand) | (Note 2) | – (Note 2) | – | – | – (Note 2) | (3,438) (CNY -679 thousand) (Note 5) | 100 | (3,438) (CNY -679 thousand) (Note 5) | 1,623 (CNY 321 thousand) | None |
| USI Electronics (Shenzhen) Co., Ltd. | Engaged in the processing and sales of computer and communication peripherals as well as business in import and export of goods and technology | 2,270,625 (US$ 75,000 thousand) | Note 1 (9) | 1,180,746 | – | – | 1,180,746 | 2,523,541 (CNY 496,516 thousand) (Note 6) | 76 | 1,965,027 (US$ 62,086 thousand) (Note 6) | 6,299,091 (US$ 191,899 thousand) | $ 1,196,256 (US$ 41,343 thousand) |
| Universal Scientific Industrial (Shanghai) Co., Ltd. | Engaged in the designing, manufacturing and sale of electronic components | 10,649,310 (CNY 2,175,924 thousand) | Note 1 (9) | 1,668,233 | – | – | 1,668,233 | 3,468,871 (US$ 109,602 thousand) (Note 6) | 76 | 2,658,906 (US$ 84,010 thousand) (Note 6) | 26,127,903 (US$ 795,936 thousand) | None |
| Universal Scientific Industrial (Kunshan) Co., Ltd. | Engaged in the manufacturing and sale of computer assistance system and related peripherals | 383,201 (US$ 12,000 thousand) | Note 1 (9) | 383,201 | – | – | 383,201 | (86,993) (US$ -2,749 thousand) (Note 6) | 99 | (86,271) (US$ -2,726 thousand) (Note 6) | 346,005 (US$ 10,541 thousand) | None |
| e-Cloud Corporation | Engaged in the sale of electronic components and telecommunications equipment | 147,450 (US$ 5,000 thousand) | Note 1 (11) | 147,450 | – | – | 147,450 | – | – | – | – (Note 11) | None |
| Siargo (SH), Ltd. | Engaged in manufacturing and sale of MEMS mass flow sensors | 227,063 (US$ 7,500 thousand) | (Note 3) | 3,035 | – | – | 3,035 | – | – | – | – | None |
| Universal Global Technology (Kunshan) Co., Ltd. | Engaged in the designing and manufacturing of electronic components | 1,202,223 (CNY 250,000 thousand) | (Note 2) | – (Note 2) | – | – | – (Note 2) | 645,853 (CNY 127,074 thousand) (Note 6) | 76 | 507,448 (CNY 99,842 thousand) (Note 6) | 1,749,854 (CNY 346,164 thousand) | None |
| Universal Global Technology (Shanghai) Co., Ltd. | Engaged in the processing and sales of computer and communication peripherals as well as business in import and export of goods and technology | 6,652,140 (CNY 1,330,000 thousand) | (Note 2) | – (Note 2) | – | – | – (Note 2) | (2,106,690) (CNY -414,499 thousand) (Note 6) | 76 | (1,644,175) (CNY -323,497 thousand) (Note 6) | 2,782,943 (CNY 350,535 thousand) | None |
| Universal Global Electronics (Shanghai) Co., Ltd. | Engaged in the sale of electronic components and telecommunications equipment | 240,850 (CNY 50000 thousand) | (Note 2) | – (Note 2) | – | – | – (Note 2) | 8,447 (CNY 1,662 thousand) (Note 6) | 76 | 6,592 (CNY 1,297 thousand) (Note 6) | 201,364 (CNY 39,835 thousand) | None |
| Cubuy Corporation | Engaged in the sale of electronic components and telecommunications equipment | – – | Note 1 (10) | – | – | – | – | 17 (US$ 1 thousand) (Note 6) | – | 17 (US$ 1 thousand) (Note 6) | – – (Note 12) | None |
(Continued)
| - 108 - |
Investee Company | Accumulated Investment in Mainland China as of December 31, 2015 | Investment Amounts | Upper Limit on Investment |
| The company | $ 15,203,097 (US$ 471,400 thousand) | $ 16,790,306 (US$ 576,400 thousand) (Note 9) | $- (Note 7) |
| ASE Test, Inc. | 8,878,838 (US$ 288,000 thousand) | 8,878,838 (US$ 288,000 thousand) | 17,944,978 (Note 8) |
| USI Inc. | 3,382,665 | 32,402,340 (US$1,027,236 thousand) | - (Note 7) |
| Note 1: | Investments through a holding company registered in a third region. The holding companies are as follow: |
| (1) | ASE Mauritius Inc., ASE Corporation,Omniquest Industrial Limited,Innosource Limited and J&R Holding Limited. | |
| (2) | ASE Mauritius Inc., Alto Enterprises Limited, Innosource Limited, ASE Corporation, Omniquest Industrial Limited and J&R Holding Limited. | |
| (3) | Innosource Limited. | |
| (4) | Global Advanced Packaging Technology Ltd. and J&R Holding Limited. | |
| (5) | J&R Holding Limited. | |
| (6) | ASE (Korea) Inc., ASE Test Limited, ASE Investment (Labuan) Inc., ASE Holding Ltd. and J&R Holding Limited. | |
| (7) | Super Zone Holdings Limited. | |
| (8) | Alto Enterprises Limited. | |
| (9) | Real Tech Holdings Limited and Huntington Holdings International Co. Ltd.. | |
| (10) | Rise Accord Limited and Huntington Holdings International Co. Ltd.. | |
| (11) | Rise Capital Investment Limited and Huntington Holdings International Co. Ltd.. |
| Note 2: | Invested by companies in Mainland China. |
| Note 3: | The company was invested by Aisa Global Venture Co. Ltd which is invested by UHI as available-for-sale. Asis Global Venture Co. Ltd disposed all of the company's shares in October, 2013, therefore as of December 31, 2015UHI does not invest to any company in Mainland China. |
| Note 4: | The basis for investment income (loss) recognition is from the financial statements audited and attested by R.O.C. parent company’s CPA |
| Note 5: | The basis for investment income (loss) recognition is from the financial statements audited and attested by international accounting firm which has cooperative relationship with accounting firm in R.O.C. |
| Note 6: | The basis for investment income (loss) recognition is from the financial statements audited and attested by other CPA in the same accounting firm wirh R.O.C. parent company’s CPA. |
| Note 7: | Pursuant to the Jing-Shen-Zi Letter No. 09704604680 of the Ministry of Economic Affairs, R.O.C amended 'Guidelines Governing the Review of Investment or Technical Cooperation in the Mainland Area' dated on August 29, 2008, as the Company has obtained the certificate of being qualified for operating headquarters, issued by the Industrial Development Bureau, MOEA, the ceiling amount of the investment in Mainland China is not applicable to the Company. (Approved on Augest 13th, 2015.) |
| Note 8: | The upper limit on investment of ASET, Inc is calculated as follow: $29,908,297× 60% = 17,944,978 |
| Note 9: | USD $60,000 thousand was directly remitted by the subsidiary, ASE (Korea), and USD $25,000 thousand was by means of Debt for Equity Swap. Therefore, there is USD$85,000 thousand difference between MOEA approved investment amount and accumulated outflow of investment from Taiwan. |
| Note 10: | It was the same fund that ASET, inc indirectly invested to ASE Investment (KS) through another comapny in 3rd area and than invested to ASEKS. |
| Note 11: | e-Cloud Corporation was liquidated in December 2013. |
| Note 12: | Cubuy Corporationwas liquidated in July 2014. |
| - 109 - |
TABLE 10
ADVANCED SEMICONDUCTOR ENGINEERING, INC. AND SUBSIDIARIES
INTERCOMPANY RELATIONSHIPS AND SIGNIFICANT INTERCOMPANY TRANSACTIONS
FOR THE YEAR ENDED DECEMBER 31, 2015
(Amounts In Thousands of New Taiwan Dollars, Unless Specified Otherwise)
Intercompany Transactions | |||||||
No. | Company Name | Related Party | Nature of Relationships | Financial State | Amount (Note) | Terms | Percentage of Consolidated Net Revenue of Total Assets |
| 0 | The Company | ASE Test Inc. | Parent company of subsidiary | Other payables | $ 7,320,608 | 2 | |
| USI | Parent company of subsidiary | Trade receivables | 2,220,182 | 1 | |||
| Parent company of subsidiary | Operating revenues | 9,083,160 | The transaction has the same terms with other companies | 3 | |||
| Parent company of subsidiary | Non-operating expenses | 604,226 | The transaction has the same terms with other companies | - | |||
| ASE (Shanghai) Inc. | Parent company of subsidiary | Trade payables | 433,581 | - | |||
| Parent company of subsidiary | Operating costs | 1,713,266 | The transaction has the same terms with other companies | 1 | |||
| ASE (U.S.) Inc. | Parent company of subsidiary | Operating expenses | 834,398 | It is calculated by fixed ratio based on actual expenses. There is an upper limit to the expenses. | 2 | ||
| 1 | |||||||
| ASE Electronics Inc. | Parent Company of subsidiary | Trade payables | 475,673 | - | |||
| Parent Company of subsidiary | Other payables | 224,763 | - | ||||
| Parent Company of subsidiary | Operating costs | 1,990,567 | The transaction has the same terms with other companies | 1- | |||
| J & R Holding Limited | Parent Company of subsidiary | Other payables | 9,256,650 | - | |||
| Omniqest Industrial Limited | Parent Company of subsidiary | Other payables | 1,641,250 | 1 | |||
| Innosource Limited | Parent Company of subsidiary | Other payables | 722,150 | - | |||
| ASE Test Limited | Parent Company of subsidiary | Other payables | 4,037,475 | - | |||
| Global Advanced Packaging | Parent Company of subsidiary | Other payables | 1,936,675 | 1 | |||
| Technology Limited. Cayman Islands | 1 | ||||||
| J&R Industrial Inc. | Parent Company of subsidiary | Other payables | 190,000 | 1 | |||
| ASE (Korea) Inc. | Parent Company of subsidiary | Other payables | 2,627,294 | - | |||
| Hunnington Holdings International Co., Ltd. | Parent company of subsidiary | Other payables | 1,805,375 | 1 | |||
| USI Enterprise Limited | Parent company of subsidiary | Other payables | 2,626,000 | 1 | |||
| Real Tech Holding Limited | Parent company of subsidiary | Other payables | 3,939,000 | - | |||
| ASE Corporation | Parent company of subsidiary | Other payables | 900,000 | 1 | |||
| A.S.E. Holding Limited | Parent company of subsidiary | Operating revenues | 2,757,300 | 1 | |||
| ASE Japan Co., Ltd | Parent company of subsidiary | Operating revenues | 116,993 | The transaction has the same terms with other companies | - | ||
| ISE Labs, Inc. | Parent company to subsidiary | Operating revenues | 121,374 | The transaction has the same terms with other companies | - | ||
| 1 | ASE (Sanghai) Inc. | ASE Assembly & Test (Shanghai) Limited | Subsidiary to subsidiary | Operating revenues | 399,553 | The transaction has the same terms with other companies | - |
| Advanced Semiconductor Engineering | Subsidiary to subsidiary | Trade receivables | 306,358 | - | |||
| (HK) Limited | Operating revenues | 1,059,036 | The transaction has the same terms with other companies | - | |||
| 2 | Shanghi Ding Hui Real Estate Development Co. Ltd | Kun Shan Ding Hong Real Estate Development Co., Ltd | Subsidiary to subsidiary | Other receivables | 570,852 | - | |
| 3 | A.S.E. Holdings Limited | ASE Test Limited | Subsidiary to subsidiary | Other liabilities | 431,754 | - | |
| Subsidiary to subsidiary | Other payables | 1,231,786 | - | ||||
| ASE Singapore Pte. Ltd | Subsidiary to subsidiary | Other payables | 394,118 | - | |||
(Continued)
| - 110 - |
TABLE 10
ADVANCED SEMICONDUCTOR ENGINEERING, INC. AND SUBSIDIARIES
INTERCOMPANY RELATIONSHIPS AND SIGNIFICANT INTERCOMPANY TRANSACTIONS
FOR THE YEAR ENDED DECEMBER 31, 2015
(Amounts In Thousands of New Taiwan Dollars, Unless Specified Otherwise)
Intercompany Transctions | |||||||
No. | Company Name | Related Party | Nature of Relationships | Financial Statement Account | Amount (Note) | Terms | Percentage of Consolidated Net Revenue or Total Assets |
| 4 | Omniquest Industrial Limited | ASE Test Limited. | Subsidiary to subsidiary | Other liabilities | $ 1,644,277 | - | |
| 5 | J & R Holding Limited | Global Advanced Packaging Technology Limited, Cayman Islands | Subsidiary to subsidiary | Other receivables | 2,471,186 | 1 | |
| Innosource Limited | Subsidiary to subsidiary | Other assets | 723,447 | - | |||
| Anstock Limited | Subsidiary to subsidiary | Other assets | 801,897 | - | |||
| Real Tech Holdings Limited | Subsidiary to subsidiary | Other receivables | 2,134,808 | 1 | |||
| ISE Labs, Inc. | Subsidiary to subsidiary | Other payables | 984,941 | - | |||
| Subsidiary to subsidiary | Other liabilities | 525,371 | - | ||||
| Anstock II Limited | Subsidiary to subsidiary | Other liabilities | 9,749,025 | 3 | |||
| ASE Japan Co., Ltd. | Subsidiary to subsidiary | Other payables | 2,264,163 | 1 | |||
| ASE Assembly & Test (Shanghai) Limited | Subsidiary to subsidiary | Other assets | 560,401 | - | |||
| ASE WeiHai Inc. | Subsidiary to subsidiary | Other receivables | 1,380,065 | - | |||
| USI Enterprise Limited | Subsidiary to subsidiary | Other payables | 6,402,296 | 2 | |||
| 6 | Anstock II Limited | J & R Holding Limited | Subsidiary to subsidiary | Interest income | 233,511 | - | |
| 7 | ASE Electronics Inc. | J&R Industrial Inc. | Subsidiary to subsidiary | Other payables | 190,000 | - | |
| ASE Electronic (M) Sdn. Bhd. | Subsidiary to subsidiary | Operating revenues | 380,496 | - | |||
| Universal Global Technology Co., | Subsidiary to subsidiary | Trade receivables | 115,072 | - | |||
| Limited | Subsidiary to subsidiary | Operating revenues | 305,682 | The transaction has the same terms with other companies | - | ||
| 8 | ASE Test. Inc. | ASE (Korea) Inc. | Subsidiary to subsidiary | Disposal of property, plant and equipment | 104,913 | - | |
| ASE Corporation | Subsidiary to subsidiary | Other receivables | 900,000 | - | |||
| ASE (U.S.) Inc. | Subsidiary to subsidiary | Operating expenses | 109,470 | It is calculated by fixed ratio based on actual expenses. There is an upper limit on the expenses. | - | ||
| 9 | ASE Assembly & Test | ASE Electronics Inc. | Subsidiary to subsidiary | Operating costs | 212,770 | - | |
| (Shanghai) Limited | Anstock Limited | Subsidiary to subsidiary | Other payables | 3,293,743 | 1 | ||
| Interest expenses | 147,441 | - | |||||
| Universal Scientific Industrial | Subsidiary to subsidiary | Salay expenses | 161,083 | - | |||
| (Shanghai) Co., Ltd. | |||||||
(Continued)
| - 111 - |
TABLE 10
ADVANCED SEMICONDUCTOR ENGINEERING, INC. AND SUBSIDIARIES
INTERCOMPANY RELATIONSHIPS AND SIGNIFICANT INTERCOMPANY TRANSACTIONS
FOR THE YEAR ENDED DECEMBER 31, 2015
(Amounts In Thousands of New Taiwan Dollars, Unless Specified Otherwise)
| Intercompany Transactions | |||||||
| Company Name | Related Party | Nature of Relationships | Financial State | Amount (Note) | Terms | Percentage of Consolidated Net Revenue of Total Assets | |
| 10 | ASE (U.S.) Inc. | ASE (Korea) Inc. | Subsidiary to subsidiary | Operating revenues | $ 134,504 | It is calculated by fixed ratio based on actual expenses. There is an upper limit to the expenses. | - |
| 11 | ASE WeiHei Inc. | ASE (Korea) Inc. | Subsidiary to subsidiary | Other payables | 1,643,994 | - | |
| ASE (Shanghai) Inc. | Subsidiary to subsidiary | Other payables | 164,556 | - | |||
| 12 | USI | Universal Global Scientific Industrial Co., Ltd. | Subsidiary to subsidiary | Operating costs | 1,496,637 | 1 | |
| Subsidiary to subsidiary | Trade payables | 329,214 | - | ||||
| 13 | USIINC | USI Enterprise Limited | Subsidiary to subsidiary | Other payables | 2,232,100 | 1 | |
| 14 | Universal Scientific Industrial | Universal Global Technology Co., | Subsidiary to subsidiary | Operating costs | 9,253,024 | 3 | |
| (Shanghai) Co., Ltd. | Limited | Subsidiary to subsidiary | Trade payables | 4,564,733 | 1 | ||
| Universal Global Industrial Co., Limited | Subsidiary to subsidiary | Operating revenues | 181,875 | - | |||
| USI Electronics (Shenzhen) Co., Ltd. | Subsidiary to subsidiary | Operating revenues | 177,762 | - | |||
| Subsidiary to subsidiary | Other receivables | 1,459,713 | - | ||||
| Universal Global Technology | Subsidiary to subsidiary | Other receivables | 1,987,520 | - | |||
| (Shanghai) Co., Ltd. | |||||||
| 15 | Universal Global Industrial Co., Limited | USI Electronics (Shenzhen) Co., Ltd. Universal Global Scientific Industrial Co., Ltd. Universal Global Technology | Subsidiary to subsidiary Subsidiary to subsidiary Subsidiary to subsidiary Subsidiary to subsidiary Subsidiary to subsidiary Subsidiary to subsidiary Subsidiary to subsidiary Subsidiary to subsidiary Subsidiary to subsidiary | Operating revenues Operating costs Trade receivables Trade payables Operating revenues Trade receivables Operating revenues Operating costs Trade payables | 3,419,070 13,193,279 719,766 3,285,468 17,214,934 3,991,508 373,280 7,610,976 1,036,495 | 1 5 - 1 6 1 - 3 - | |
| 16 | Universal Global Technology Co., Limited | Universal Global Technology (Kunshan) Co., Ltd. | Subsidiary to subsidiary Subsidiary to subsidiary | Operating revenues Trade receivables | 4,330,764 351,903 | 2 - | |
| USI Electronics (Shenzhen) Co., Ltd | Subsidiary to subsidiary | Dividend receivable | 1,415,390 | - | |||
| 17 | Universal Global Scientific Industrial Co., Ltd. | Universal Scientific Industrial (Shanghai) Co., Ltd. | Subsidiary to subsidiary | Operating revenues | 220,300 | - | |
| Universal Global Industrial Co., Ltd. | Subsidiary to subsidiary | Operating revenues | 273,913 | - | |||
| USI Electronics (Shenzhen) Co., Ltd | Subsidiary to subsidiary | Operating revenues | 149,600 | - | |||
| 18 | USI Electronics (Shenzhen) Co., Ltd | Universal Global Scientific Industrial Co., Ltd. | Subsidiary to subsidiary | Other receivables | 1,319,361 | - | |
| Note: Amount was eliminated based on the audited financial statements. | (Concluded) |
| - 112 - |
Appendix 4
Advanced Semiconductor Engineering, Inc.
2016Q3 Consolidated Financial Statements and Auditor Report
| Advanced Semiconductor Engineering, Inc. and Subsidiaries | |
| Consolidated Financial Statements for the | |
| Nine Months Ended September 30, 2016 and 2015 and | |
| Independent Accountants’ Review Report |
INDEPENDENT ACCOUNTANTS’ REVIEW REPORT
- 1 -
ADVANCED SEMICONDUCTOR ENGINEERING, INC. AND SUBSIDIARIES
CONSOLIDATED BALANCE SHEETS
(In Thousands of New Taiwan Dollars)
| September 30, 2016 | December 31, 2015 | Sptember 30, 2015 | ||||||||||||||||||||||
| (Reviewed) | (Adjusted and audited) | (Reviewed) | ||||||||||||||||||||||
| ASSETS | NT$ | % | NT$ | % | NT$ | % | ||||||||||||||||||
| CURRENT ASSETS | ||||||||||||||||||||||||
| Cash and cash equivalents (Notes 4 and 6) | $ | 37,661,420 | 10 | $ | 55,251,181 | 15 | $ | 42,409,714 | 12 | |||||||||||||||
| Financial assets at fair value through profit or loss - current (Notes 4, 5 and 7) | 813,831 | - | 3,833,701 | 1 | 3,142,231 | 1 | ||||||||||||||||||
| Available-for-sale financial assets - current (Notes 4 and 8) | 70,092 | - | 30,344 | - | 15,506 | - | ||||||||||||||||||
| Trade receivables, net (Notes 4 and 9) | 52,009,578 | 14 | 44,931,487 | 13 | 53,156,487 | 14 | ||||||||||||||||||
| Other receivables (Notes 4) | 936,417 | - | 429,541 | - | 551,249 | - | ||||||||||||||||||
| Current tax assets (Note 4) | 275,770 | - | 168,717 | - | 166,615 | - | ||||||||||||||||||
| Inventories (Notes 4, 5 and 10) | 23,635,153 | 7 | 23,258,279 | 6 | 27,591,187 | 7 | ||||||||||||||||||
| Inventories related to real estate business (Notes 4, 5, 11, 23 and 34) | 24,141,398 | 7 | 25,713,538 | 7 | 25,114,779 | 7 | ||||||||||||||||||
| Other financial assets - current (Notes 4, 12 and 34) | 1,047,303 | - | 301,999 | - | 1,928,146 | 1 | ||||||||||||||||||
| Other current assets | 2,778,234 | 1 | 2,814,053 | 1 | 3,095,559 | 1 | ||||||||||||||||||
| Total current assets | 143,369,196 | 39 | 156,732,840 | 43 | 157,171,473 | 43 | ||||||||||||||||||
| NON-CURRENT ASSETS | ||||||||||||||||||||||||
| Available-for-sale financial assets - non-current (Notes 4 and 8) | 1,103,939 | - | 924,362 | - | 904,795 | - | ||||||||||||||||||
| Investments accounted for using the equity method (Notes 4 and 13) | 49,515,448 | 14 | 37,141,552 | 10 | 36,981,863 | 10 | ||||||||||||||||||
| Property, plant and equipment (Notes 4, 5, 14, 23 and 35) | 145,208,855 | 40 | 149,997,075 | 41 | 152,981,113 | 42 | ||||||||||||||||||
| Goodwill (Notes 4, 5 and 15) | 10,512,448 | 3 | 10,506,519 | 3 | 10,509,270 | 3 | ||||||||||||||||||
| Other intangible assets (Notes 4, 5, 16 and 23) | 1,704,669 | 1 | 1,382,093 | - | 1,449,287 | - | ||||||||||||||||||
| Deferred tax assets (Notes 4 , 5 and 24) | 5,236,508 | 1 | 5,156,515 | 2 | 5,128,646 | 1 | ||||||||||||||||||
| Other financial assets - non-current (Notes 4, 12 and 34) | 1,355,254 | 1 | 345,672 | - | 343,516 | - | ||||||||||||||||||
| Long-term prepayments for lease (Note 17) | 2,382,424 | 1 | 2,556,156 | 1 | 2,610,187 | 1 | ||||||||||||||||||
| Other non-current assets | 238,979 | - | 263,416 | - | 371,586 | - | ||||||||||||||||||
| Total non-current assets | 217,258,524 | 61 | 208,273,360 | 57 | 211,280,263 | 57 | ||||||||||||||||||
| TOTAL | $ | 360,627,720 | 100 | $ | 365,006,200 | 100 | $ | 368,451,736 | 100 | |||||||||||||||
(Continued)
- 2 -
ADVANCED SEMICONDUCTOR ENGINEERING, INC. AND SUBSIDIARIES
CONSOLIDATED BALANCE SHEETS
(In Thousands of New Taiwan Dollars)
| Sptember 30, 2016 | December 31, 2015 | Sptember 30, 2015 | ||||||||||||||||||||||
| (Reviewed) | (Adjusted and audited) | (Reviewed) | ||||||||||||||||||||||
| LIABILITIES AND EQUITY | NT$ | % | NT$ | % | NT$ | % | ||||||||||||||||||
| CURRENT LIABILITIES | ||||||||||||||||||||||||
| Short-term borrowings (Note 18) | $ | 31,008,127 | 9 | $ | 32,635,321 | 9 | $ | 45,746,588 | 12 | |||||||||||||||
| Short-term bills payable (Note 18) | 1,999,342 | 1 | 4,348,054 | 1 | - | - | ||||||||||||||||||
| Financial liabilities at fair value through profit or loss - current (Notes 4, 5 and 7) | 3,953,520 | 1 | 3,005,726 | 1 | 2,605,077 | 1 | ||||||||||||||||||
| Trade payables | 37,856,245 | 10 | 34,138,564 | 9 | 39,699,655 | 11 | ||||||||||||||||||
| Dividends payable (Note 22) | ||||||||||||||||||||||||
| Other payables (Note 20) | 19,875,189 | 6 | 19,194,818 | 5 | 18,396,751 | 5 | ||||||||||||||||||
| Current tax liabilities (Note 4) | 4,015,514 | 1 | 4,551,785 | 1 | 3,828,439 | 1 | ||||||||||||||||||
| Advance real estate receipts (Note 4) | 530,873 | - | 2,703,706 | 1 | 2,234,716 | 1 | ||||||||||||||||||
| Current portion of bonds payable (Notes 4 and 19) | 9,384,865 | 3 | 14,685,866 | 4 | 2,578,343 | 1 | ||||||||||||||||||
| Current portion of long-term borrowings (Notes 18 and 34) | 6,272,817 | 2 | 2,057,465 | 1 | 2,025,374 | - | ||||||||||||||||||
| Other current liabilities | 3,500,698 | 1 | 3,180,767 | 1 | 2,799,082 | 1 | ||||||||||||||||||
| Total current liabilities | 118,397,190 | 34 | 120,502,072 | 33 | 119,914,025 | 33 | ||||||||||||||||||
| NON-CURRENT LIABILITIES | ||||||||||||||||||||||||
| Bonds payable (Notes 4 and 19) | 26,871,735 | 7 | 23,740,384 | 7 | 35,804,305 | 10 | ||||||||||||||||||
| Long-term borrowings (Notes 18 and 34) | 43,941,187 | 12 | 42,493,668 | 12 | 38,386,055 | 10 | ||||||||||||||||||
| Deferred tax liabilities (Notes 4, 5 and 24) | 4,815,903 | 1 | 4,987,549 | 1 | 4,833,071 | 1 | ||||||||||||||||||
| Net defined benefit liabilities (Notes 4, 5 and 21) | 4,181,619 | 1 | 4,072,493 | 1 | 4,429,291 | 1 | ||||||||||||||||||
| Other non-current liabilities | 1,202,643 | - | 1,071,509 | - | 801,769 | - | ||||||||||||||||||
| Total non-current liabilities | 81,013,087 | 21 | 76,365,603 | 21 | 84,254,491 | 22 | ||||||||||||||||||
| Total liabilities | 199,410,277 | 55 | 196,867,675 | 54 | 204,168,516 | 55 | ||||||||||||||||||
| EQUITY ATTRIBUTABLE TO OWNERS OF THE COMPANY (Notes 4 and 22) | ||||||||||||||||||||||||
| Share capital | ||||||||||||||||||||||||
| Ordinary shares | 79,236,226 | 22 | 79,029,290 | 22 | 78,931,576 | 21 | ||||||||||||||||||
| Shares subscribed in advance | 272,824 | - | 156,370 | - | 209,602 | - | ||||||||||||||||||
| Total share capital | 79,509,050 | 22 | 79,185,660 | 22 | 79,141,178 | 21 | ||||||||||||||||||
| Capital surplus | 22,461,952 | 6 | 23,757,099 | 7 | 24,157,701 | 7 | ||||||||||||||||||
| Retained earnings (Note 13) | ||||||||||||||||||||||||
| Legal reserve | 14,597,032 | 4 | 12,649,145 | 3 | 12,649,145 | 3 | ||||||||||||||||||
| Special reserve | 3,353,938 | 1 | 3,353,938 | 1 | 3,353,938 | 1 | ||||||||||||||||||
| Unappropriated earnings | 39,184,915 | 11 | 39,899,629 | 11 | 35,277,587 | 10 | ||||||||||||||||||
| Total retained earnings | 57,135,885 | 16 | 55,902,712 | 15 | 51,280,670 | 14 | ||||||||||||||||||
| Accumulated other comprehensive income | (1,655,390 | ) | - | 5,081,689 | 1 | 6,242,036 | 2 | |||||||||||||||||
| Treasury shares | (7,292,513 | ) | (2 | ) | (7,292,513 | ) | (2 | ) | (7,292,513 | ) | (2 | |||||||||||||
| Equity attributable to owners of the Company | 150,158,984 | 42 | 156,634,647 | 43 | 153,529,072 | 42 | ||||||||||||||||||
| NON-CONTROLLING INTERESTS (Notes 4 and 22) | 11,058,459 | 3 | 11,503,878 | 3 | 10,754,148 | 3 | ||||||||||||||||||
| Total equity | 161,217,443 | 45 | 168,138,525 | 46 | 164,283,220 | 45 | ||||||||||||||||||
| TOTAL | $ | 360,627,720 | 100 | $ | 365,006,200 | 100 | $ | 368,451,736 | 100 | |||||||||||||||
The accompanying notes are an integral part of the consolidated financial statements.
| (With Deloitte & Touche review report dated November 7, 2016) | (Concluded) |
- 3 -
ADVANCED SEMICONDUCTOR ENGINEERING, INC. AND SUBSIDIARIES
CONSOLIDATED STATEMENTS OF COMPREHENSIVE INCOME
(In Thousands of New Taiwan Dollars Except Earnings Per Share)
Reviewed, Not Audited)
| For the Three Months Ended September 30 | For the Nine Months Ended September 30 | |||||||||||||||||||||||||||||||
| 2016 | 2015 | 2016 | 2015 | |||||||||||||||||||||||||||||
| NT$ | % | NT$ | % | NT$ | % | NT$ | % | |||||||||||||||||||||||||
| OPERATING REVENUES (Note 4) | $ | 72,783,689 | 100 | $ | 72,870,404 | 100 | $ | 197,755,474 | 100 | $ | 207,754,374 | 100 | ||||||||||||||||||||
| OPERATING COSTS (Notes 10, 21 and 23) | 58,670,777 | 81 | 59,882,751 | 82 | 159,938,375 | 81 | 170,888,018 | 82 | ||||||||||||||||||||||||
| GROSS PROFIT | 14,112,912 | 19 | 12,987,653 | 18 | 37,817,099 | 19 | 36,866,356 | 18 | ||||||||||||||||||||||||
| OPERATING EXPENSES (Notes 21 and 23) | ||||||||||||||||||||||||||||||||
| Selling and marketing expenses | 837,656 | 1 | 923,927 | 1 | 2,569,312 | 2 | 2,675,081 | 1 | ||||||||||||||||||||||||
| General and administrative expenses | 2,889,746 | 4 | 2,837,288 | 4 | 8,371,727 | 4 | 7,983,571 | 4 | ||||||||||||||||||||||||
| Research and development expenses | 2,947,251 | 4 | 2,844,445 | 4 | 8,300,488 | 4 | 8,124,096 | 4 | ||||||||||||||||||||||||
| Total operating expenses | 6,674,653 | 9 | 6,605,660 | 9 | 19,241,527 | 10 | 18,782,748 | 9 | ||||||||||||||||||||||||
| PROFIT FROM OPERATIONS | 7,438,259 | 10 | 6,381,993 | 9 | 18,575,572 | 9 | 18,083,608 | 9 | ||||||||||||||||||||||||
| NON-OPERATING INCOME AND EXPENSES | ||||||||||||||||||||||||||||||||
| Other income (Note 23) | 167,694 | - | 127,357 | - | 450,061 | - | 425,648 | - | ||||||||||||||||||||||||
| Other gains (losses), net (Note 23) | (640,234 | ) | (1 | ) | 1,845,931 | 3 | (8,281 | ) | - | 1,926,825 | 1 | |||||||||||||||||||||
| Finance costs (Note 23) | (547,458 | ) | (1 | ) | (574,414 | ) | (1 | ) | (1,746,585 | ) | (1 | ) | (1,698,197 | ) | (1 | |||||||||||||||||
| Share of profit (loss) of associates and joint ventures (Note 4) | 456,612 | 1 | 29,322 | - | 1,101,234 | 1 | (21,268 | ) | - | |||||||||||||||||||||||
| Total non-operating income and expenses | (563,386 | ) | (1 | ) | 1,428,196 | 2 | (203,571 | ) | - | 633,008 | - | |||||||||||||||||||||
| PROFIT BEFORE INCOME TAX EXPENSE | 6,874,873 | 9 | 7,810,189 | 11 | 18,372,001 | 9 | 18,716,616 | 9 | ||||||||||||||||||||||||
| INCOME TAX EXPENSE (Notes 4, 5 and 24) | 975,530 | 1 | 1,127,308 | 2 | 3,816,787 | 2 | 3,579,664 | 2 | ||||||||||||||||||||||||
| NET PROFIT FOR THE PERIOD | 5,899,343 | 8 | 6,682,881 | 9 | 14,555,214 | 7 | 15,136,952 | 7 | ||||||||||||||||||||||||
| OTHER COMPREHENSIVE INCOME (LOSS) | ||||||||||||||||||||||||||||||||
| Items that may be reclassified subsequently to profit or loss | ||||||||||||||||||||||||||||||||
| Exchange differences on translating foreign operations | (4,032,107 | ) | (5 | ) | 4,553,560 | 6 | (6,743,531 | ) | (3 | ) | 1,369,632 | 1 | ||||||||||||||||||||
| Unrealized gain (loss) on available-for-sale financial assets | (34,111 | ) | - | 18,411 | - | (52,969 | ) | - | (22,413 | ) | - | |||||||||||||||||||||
| Share of other comprehensive income of associates and joint ventures accounted for using the equity method | (362,462 | ) | - | (145,624 | ) | - | (535,044 | ) | - | (62,823 | ) | - | ||||||||||||||||||||
(Continued)
- 4 -
ADVANCED SEMICONDUCTOR ENGINEERING, INC. AND SUBSIDIARIES
CONSOLIDATED STATEMENTS OF COMPREHENSIVE INCOME
(In Thousands of New Taiwan Dollars Except Earnings Per Share)
(Reviewed, Not Audited)
| For the Three Months Ended September 30 | For the Nine Months Ended September 30 | |||||||||||||||||||||||||||||||
| 2016 | 2015 | 2016 | 2015 | |||||||||||||||||||||||||||||
| NT$ | % | NT$ | % | NT$ | % | NT$ | % | |||||||||||||||||||||||||
| Other comprehensive income for the period, net of income tax | $ | (4,428,680 | ) | (5 | ) | $ | 4,426,347 | 6 | $ | (7,331,544 | ) | (3 | ) | $ | 1,284,396 | 1 | ||||||||||||||||
| TOTAL COMPREHENSIVE INCOME FOR THE PERIOD | $ | 1,470,663 | 3 | $ | 11,109,228 | 15 | $ | 7,223,670 | 4 | $ | 16,421,348 | 8 | ||||||||||||||||||||
| NET PROFIT ATTRIBUTABLE TO: | ||||||||||||||||||||||||||||||||
| Owners of the Company | $ | 5,505,994 | 7 | $ | 6,368,622 | 9 | $ | 13,715,836 | 7 | $ | 14,489,257 | 7 | ||||||||||||||||||||
| Non-controlling interests | 393,349 | 1 | 314,259 | - | 839,378 | - | 647,695 | - | ||||||||||||||||||||||||
| $ | 5,899,343 | 8 | $ | 6,682,881 | 9 | $ | 14,555,214 | 7 | $ | 15,136,952 | 7 | |||||||||||||||||||||
| TOTAL COMPREHENSIVE INCOME ATTRIBUTABLE TO: | ||||||||||||||||||||||||||||||||
| Owners of the Company | $ | 1,385,198 | 3 | $ | 10,528,507 | 14 | $ | 6,978,757 | 4 | $ | 15,662,754 | 8 | ||||||||||||||||||||
| Non-controlling interests | 85,465 | - | 580,721 | 1 | 244,913 | - | 758,594 | - | ||||||||||||||||||||||||
| $ | 1,470,663 | 3 | $ | 11,109,228 | 15 | $ | 7,223,670 | 4 | $ | 16,421,348 | 8 | |||||||||||||||||||||
| EARNINGS PER SHARE (Note 25) | ||||||||||||||||||||||||||||||||
| Basic | $ | 0.72 | $ | 0.83 | $ | 1.79 | $ | 1.89 | ||||||||||||||||||||||||
| Diluted | $ | 0.64 | $ | 0.69 | $ | 1.50 | $ | 1.76 | ||||||||||||||||||||||||
The accompanying notes are an integral part of the consolidated financial statements.
(With Deloitte & Touche review report dated November 7, 2016)
(Concluded)
- 5 -
ADVANCED SEMICONDUCTOR ENGINEERING, INC. AND SUBSIDIARIES
CONSOLIDATED STATEMENTS OF CHANGES IN EQUITY
(In Thousands of New Taiwan Dollars)
(Reviewed, Not Audited)
| Equity Attributable to Owners of the Company | ||||||||||||||||||||||||||||||||||||||||||||||||||||||||
| Other Equity | ||||||||||||||||||||||||||||||||||||||||||||||||||||||||
| Share Capital | Retained Earnings | Exchange Differences on | Unrealized Gain on Available- | |||||||||||||||||||||||||||||||||||||||||||||||||||||
| Shares | Unappropriated | Translating Foreign | for-sale | Non-controlling | ||||||||||||||||||||||||||||||||||||||||||||||||||||
| (In Thousands) | Amounts | Capital Surplus | Legal Reserve | Special Reserve | Earnings | Total | Operations | Financial Assets | Total | Treasury Shares | Total | Interests | Total Equity | |||||||||||||||||||||||||||||||||||||||||||
| BALANCE AT JANUARY 1, 2015 | 7,861,725 | $ | 78,715,179 | $ | 16,013,058 | $ | 10,289,878 | $ | 3,353,938 | $ | 38,737,422 | $ | 52,381,238 | $ | 4,541,761 | $ | 526,778 | $ | 5,068,539 | $ | (1,959,107 | ) | $ | 150,218,907 | $ | 8,219,098 | $ | 158,438,005 | ||||||||||||||||||||||||||||
| Equity component of convertible bonds issued by | ||||||||||||||||||||||||||||||||||||||||||||||||||||||||
| the Company (Note 18) | - | - | 214,022 | - | - | - | - | - | - | - | - | 214,022 | - | 214,022 | ||||||||||||||||||||||||||||||||||||||||||
| Change in capital surplus from investments in | ||||||||||||||||||||||||||||||||||||||||||||||||||||||||
| associates and joint ventures accounted for using the | ||||||||||||||||||||||||||||||||||||||||||||||||||||||||
| equity method | - | - | 3,362 | - | - | - | - | - | - | - | - | 3,362 | - | 3,362 | ||||||||||||||||||||||||||||||||||||||||||
| Profit for the nine months ended September 30, 2015 | - | - | - | - | - | 14,489,257 | 14,489,257 | - | - | - | - | 14,489,257 | 647,695 | 15,136,952 | ||||||||||||||||||||||||||||||||||||||||||
| Other comprehensive income (loss) for the nine | ||||||||||||||||||||||||||||||||||||||||||||||||||||||||
| months ended September 30, 2015, net of income tax | - | - | - | - | - | - | - | 1,262,027 | (88,530 | ) | 1,173,497 | - | 1,173,497 | 110,899 | 1,284,396 | |||||||||||||||||||||||||||||||||||||||||
| Total comprehensive income for the nine months | ||||||||||||||||||||||||||||||||||||||||||||||||||||||||
| ended September 30, 2015 | - | - | - | - | - | 14,489,257 | 14,489,257 | 1,262,027 | (88,530 | ) | 1,173,497 | - | 15,662,754 | 758,594 | 16,421,348 | |||||||||||||||||||||||||||||||||||||||||
| Appropriation of 2014 earnings | ||||||||||||||||||||||||||||||||||||||||||||||||||||||||
| Legal reserve | - | - | - | 2,359,267 | - | (2,359,267 | ) | - | - | - | - | - | - | - | - | |||||||||||||||||||||||||||||||||||||||||
| Cash dividends declared by the Company | - | - | - | - | - | (15,589,825 | ) | (15,589,825 | ) | - | - | - | - | (15,589,825 | ) | - | (15,589,825 | ) | ||||||||||||||||||||||||||||||||||||||
| - | - | - | 2,359,267 | - | (17,949,092 | ) | (15,589,825 | ) | - | - | - | - | (15,589,825 | ) | - | (15,589,825 | ) | |||||||||||||||||||||||||||||||||||||||
| Acquisition of treasury shares | - | - | - | - | - | - | - | - | - | - | (5,333,406 | ) | (5,333,406 | ) | - | (5,333,406 | ) | |||||||||||||||||||||||||||||||||||||||
| Issue of dividends received by subsidiaries from the | ||||||||||||||||||||||||||||||||||||||||||||||||||||||||
| Company | - | - | 292,351 | - | - | - | - | - | - | - | - | 292,351 | - | 292,351 | ||||||||||||||||||||||||||||||||||||||||||
| Partial disposal of interests in subsidiaries and | ||||||||||||||||||||||||||||||||||||||||||||||||||||||||
| additional acquisition of majority-owned | ||||||||||||||||||||||||||||||||||||||||||||||||||||||||
| subsidiaries (Note 28) | - | - | 7,197,510 | - | - | - | - | - | - | - | - | 7,197,510 | 1,712,836 | 8,910,346 | ||||||||||||||||||||||||||||||||||||||||||
| Spin-off of subsidiaries | - | - | (3,535 | ) | - | - | - | - | - | - | - | - | (3,535 | ) | 3,535 | - | ||||||||||||||||||||||||||||||||||||||||
| Issue of ordinary shares under employee share options | 41,518 | 425,999 | 440,933 | - | - | - | - | - | - | - | - | 866,932 | - | 866,932 | ||||||||||||||||||||||||||||||||||||||||||
| Cash dividends distributed by subsidiaries | - | - | - | - | - | - | - | - | - | - | - | - | (232,148 | ) | (232,148 | ) | ||||||||||||||||||||||||||||||||||||||||
| Additional non-controlling interest arising on issue of | ||||||||||||||||||||||||||||||||||||||||||||||||||||||||
| employee share options by subsidiaries | - | - | - | - | - | - | - | - | - | - | - | - | 292,233 | 292,233 | ||||||||||||||||||||||||||||||||||||||||||
| BALANCE AT SEPTEMBER 30, 2015 | 7,903,243 | $ | 79,141,178 | $ | 24,157,701 | $ | 12,649,145 | $ | 3,353,938 | $ | 35,277,587 | $ | 51,280,670 | $ | 5,803,788 | $ | 438,248 | $ | 6,242,036 | $ | (7,292,513 | ) | $ | 153,529,072 | $ | 10,754,148 | $ | 164,283,220 | ||||||||||||||||||||||||||||
| ADJUSTED BALANCE AT JANUARY 1, 2016 (Note | 7,910,428 | $ | 79,185,660 | $ | 23,757,099 | $ | 12,649,145 | $ | 3,353,938 | $ | 39,899,629 | $ | 55,902,712 | $ | 4,493,570 | $ | 588,119 | $ | 5,081,689 | $ | (7,292,513 | ) | $ | 156,634,647 | $ | 11,503,878 | $ | 168,138,525 | ||||||||||||||||||||||||||||
| Change in capital surplus from investments in | ||||||||||||||||||||||||||||||||||||||||||||||||||||||||
| associates and joint ventures accounted for using the | ||||||||||||||||||||||||||||||||||||||||||||||||||||||||
| equity method | - | - | 8,283 | - | - | - | - | - | - | - | - | 8,283 | - | 8,283 | ||||||||||||||||||||||||||||||||||||||||||
| Profit for the nine months ended September 30, 2016 | - | - | - | - | - | 13,715,836 | 13,715,836 | - | - | - | - | 13,715,836 | 839,378 | 14,555,214 | ||||||||||||||||||||||||||||||||||||||||||
| Other comprehensive income (loss) for the nine | ||||||||||||||||||||||||||||||||||||||||||||||||||||||||
| months ended September 30, 2016, net of income tax | - | - | - | - | - | - | - | (6,448,846 | ) | (288,233 | ) | (6,737,079 | ) | - | (6,737,079 | ) | (594,465 | ) | (7,331,544 | ) | ||||||||||||||||||||||||||||||||||||
| Total comprehensive income (loss) for the nine | ||||||||||||||||||||||||||||||||||||||||||||||||||||||||
| months ended September 30, 2016 | - | - | - | - | - | 13,715,836 | 13,715,836 | (6,448,846 | ) | (288,233 | ) | (6,737,079 | ) | - | 6,978,757 | 244,913 | 7,223,670 | |||||||||||||||||||||||||||||||||||||||
(Continued)
- 6 -
ADVANCED SEMICONDUCTOR ENGINEERING, INC. AND SUBSIDIARIES
CONSOLIDATED STATEMENTS OF CHANGES IN EQUITY
(In Thousands of New Taiwan Dollars)
(Reviewed, Not Audited)
| Equity Attributable to Owners of the Company | ||||||||||||||||||||||||||||||||||||||||||||||||||||||||
| Other Equity | ||||||||||||||||||||||||||||||||||||||||||||||||||||||||
| Share Capital | Retained Earnings | Exchange Differences on Translating | Unrealized Gain on Available- | |||||||||||||||||||||||||||||||||||||||||||||||||||||
| Shares (In Thousands) | Amounts | Capital Surplus | Legal Reserve | Special Reserve | Unappropriated Earnings | Total | Foreign Operations | for-sale Financial Assets | Total | Treasury Shares | Total | Non-controlling Interests | Total Equity | |||||||||||||||||||||||||||||||||||||||||||
| Appropriation of 2015 earnings | ||||||||||||||||||||||||||||||||||||||||||||||||||||||||
| Legal reserve | - | $ | - | $ | - | $ | 1,947,887 | $ | - | $ | (1,947,887 | ) | $ | - | $ | - | $ | - | $ | - | $ | - | $ | - | $ | - | $ | - | ||||||||||||||||||||||||||||
| Cash dividends declared by the Company | - | - | - | - | - | (12,476,779 | ) | (12,476,779 | ) | - | - | - | - | (12,476,779 | ) | - | (12,476,779 | ) | ||||||||||||||||||||||||||||||||||||||
| - | - | - | 1,947,887 | - | (14,424,666 | ) | (12,476,779 | ) | - | - | - | - | (12,476,779 | ) | - | (12,476,779 | ) | |||||||||||||||||||||||||||||||||||||||
| Issue of dividends received by subsidiaries from the Company | - | - | 233,013 | - | - | - | - | - | - | - | - | 233,013 | - | 233,013 | ||||||||||||||||||||||||||||||||||||||||||
| Actual disposal or acquisition of interest in subsidiaries (Note 28) | - | - | (20,552 | ) | - | - | (5,884 | ) | (5,884 | ) | - | - | - | - | (26,436 | ) | 26,436 | - | ||||||||||||||||||||||||||||||||||||||
| Changes in percentage of ownership interest in subsidiaries (Note 28) | - | - | (1,912,887 | ) | - | - | - | - | - | - | - | - | (1,912,887 | ) | (912,886 | ) | (2,825,773 | ) | ||||||||||||||||||||||||||||||||||||||
| Issue of ordinary shares under employee share options | 26,262 | 323,390 | 396,996 | - | - | - | - | - | - | - | - | 720,386 | - | 720,386 | ||||||||||||||||||||||||||||||||||||||||||
| Non-controlling interest arising from acquisition of subsidiaries (Note 27) | - | - | - | - | - | - | - | - | - | - | - | - | 7,021 | 7,021 | ||||||||||||||||||||||||||||||||||||||||||
| Cash dividends distributed by subsidiaries | - | - | - | - | - | - | - | - | - | - | - | - | (236,426 | ) | (236,426 | ) | ||||||||||||||||||||||||||||||||||||||||
| Additional non-controlling interest arising on issue of employee share options by subsidiaries | - | - | - | - | - | - | - | - | - | - | - | - | 425,523 | 425,523 | ||||||||||||||||||||||||||||||||||||||||||
| BALANCE AT SEPTEMBER 30, 2016 | 7,936,690 | $ | 79,509,050 | $ | 22,461,952 | $ | 14,597,032 | $ | 3,353,938 | $ | 39,184,915 | $ | 57,135,885 | $ | (1,955,276 | ) | $ | 299,886 | $ | (1,655,390 | ) | $ | (7,292,513 | ) | $ | 150,158,984 | $ | 11,058,459 | $ | 161,217,443 | ||||||||||||||||||||||||||
The accompanying notes are an integral part of the consolidated financial statements.
(With Deloitte & Touche review report dated November 7, 2016)
(Concluded)
- 7 -
ADVANCED SEMICONDUCTOR ENGINEERING, INC. AND SUBSIDIARIES
CONSOLIDATED STATEMENTS OF CASH FLOWS
(In Thousands of New Taiwan Dollars)
(Reviewed, Not Audited)
| For the Nine Months Ended September 30 | ||||||||
| 2016 | 2015 | |||||||
| NT$ | NT$ | |||||||
| CASH FLOWS FROM OPERATING ACTIVITIES | ||||||||
| Profit before income tax | $ | 18,372,001 | $ | 18,716,616 | ||||
| Adjustments for: | ||||||||
| Depreciation expense | 21,694,771 | 21,750,748 | ||||||
| Amortization expense | 343,868 | 421,472 | ||||||
| Net (gain) loss on fair value change of financial assets and liabilities at fair value through profit or loss | 1,492,157 | (3,196,273 | ) | |||||
| Finance costs | 1,746,585 | 1,698,197 | ||||||
| Interest income | (171,615 | ) | (192,162 | ) | ||||
| Dividend income | (20,625 | ) | (74,374 | ) | ||||
| Compensation cost of employee share options | 353,676 | 35,919 | ||||||
| Share of loss (profit) of associates and joint ventures | (1,101,234 | ) | 21,268 | |||||
| Impairment loss recognized on financial assets | 1,886 | 23,299 | ||||||
| Reversal of impairment loss on financial assets | (27,664 | ) | - | |||||
| Impairment loss recognized on non-financial assets | 1,199,970 | 154,815 | ||||||
| Net gain on foreign currency exchange | (1,333,438 | ) | 1,383,924 | |||||
| Others | 493,491 | 905,470 | ||||||
| Changes in operating assets and liabilities | ||||||||
| Financial assets held for trading | 2,708,652 | 3,025,524 | ||||||
| Trade receivables | (7,049,447 | ) | (257,928 | ) | ||||
| Other receivables | (189,591 | ) | 60,383 | |||||
| Inventories | 1,077,286 | (8,570,434 | ) | |||||
| Other current assets | (179,052 | ) | 150,732 | |||||
| Financial liabilities held for trading | (2,044,739 | ) | (1,148,709 | ) | ||||
| Trade payables | 3,717,681 | 4,288,374 | ||||||
| Other payables | (172,266 | ) | (1,959,645 | ) | ||||
| Advance real estate receipts | (2,172,833 | ) | 1,754,391 | |||||
| Other current liabilities | 239,510 | 314,503 | ||||||
| Other operating activities items | 38,013 | 190,377 | ||||||
| 39,017,043 | 39,496,487 | |||||||
| Interest received | 164,867 | 182,419 | ||||||
| Dividend received | 4,037,857 | 74,374 | ||||||
| Interest paid | (1,668,975 | ) | (1,713,548 | ) | ||||
| Income tax paid | (4,838,659 | ) | (3,735,975 | ) | ||||
| Net cash generated from operating activities | 36,712,133 | 34,303,757 | ||||||
| CASH FLOWS FROM INVESTING ACTIVITIES | ||||||||
| Purchase of financial assets designated as at fair value through profit or loss | (52,981,180 | ) | (81,789,096 | ) | ||||
| Proceeds on sale of financial assets designated as at fair value through profit or loss | 54,592,483 | 84,672,199 | ||||||
(Continued)
- 8 -
ADVANCED SEMICONDUCTOR ENGINEERING, INC. AND SUBSIDIARIES
CONSOLIDATED STATEMENTS OF CASH FLOWS
(In Thousands of New Taiwan Dollars)
(Reviewed, Not Audited)
| For the Nine Months Ended September 30 | ||||||||
| 2016 | 2015 | |||||||
| NT$ | NT$ | |||||||
| Purchase of available-for-sale financial assets | $ | (1,192,678 | ) | $ | (469,291 | ) | ||
| Proceeds on sale of available-for-sale financial assets | 867,336 | 1,972,254 | ||||||
| Cash received from return of capital by available-for-sale financial assets | 28,927 | 30,545 | ||||||
| Acquisition of associates and joint ventures | (15,816,463 | ) | (35,673,097 | ) | ||||
| Net cash outflow on acquisition of subsidiaries | (73,437 | ) | - | |||||
| Payments for property, plant and equipment | (20,391,111 | ) | (24,695,271 | ) | ||||
| Proceeds from disposal of property, plant and equipment | 129,261 | 213,284 | ||||||
| Payments for intangible assets | (373,928 | ) | (393,507 | ) | ||||
| Proceeds from disposal of intangible assets | 5,482 | - | ||||||
| Increase in other financial assets | (1,754,676 | ) | (1,265,725 | ) | ||||
| Increase in other non-current assets | (177,245 | ) | (294,186 | ) | ||||
| Net cash used in investing activities | (37,137,229 | ) | (57,691,891 | ) | ||||
| CASH FLOWS FROM FINANCING ACTIVITIES | ||||||||
| Net proceed from (repayment of) short-term borrowings | (384,911 | ) | 4,148,082 | |||||
| Repayment of short-term bills payable | (2,348,712 | ) | - | |||||
| Proceeds from issue of bonds | 9,000,000 | 6,136,425 | ||||||
| Repayment of bonds payable | (10,365,135 | ) | - | |||||
| Proceeds from long-term borrowings | 48,963,098 | 29,382,813 | ||||||
| Repayment of long-term borrowings | (42,202,720 | ) | (16,649,534 | ) | ||||
| Dividends paid | (12,243,766 | ) | (15,297,474 | ) | ||||
| Proceeds from exercise of employee share options | 792,233 | 854,609 | ||||||
| Payments for acquisition of treasury shares | - | (5,333,406 | ) | |||||
| Proceeds from partial disposal of interests in subsidiaries | - | 8,910,346 | ||||||
| Increase (decrease) in non-controlling interests | (3,062,199 | ) | 36,517 | |||||
| Other financing activities items | 12,342 | (1,035 | ) | |||||
| Net cash generated from (used in) financing activities | (11,839,770 | ) | 12,187,343 | |||||
| EFFECTS OF EXCHANGE RATE CHANGES ON | ||||||||
| THE BALANCE OF CASH AND CASH EQUIVALENTS | (5,324,895 | ) | 1,916,095 | |||||
| NET DECREASE IN CASH AND CASH EQUIVALENTS | (17,589,761 | ) | (9,284,696 | ) | ||||
| CASH AND CASH EQUIVALENTS AT THE BEGINNING OF THE PERIOD | 55,251,181 | 51,694,410 | ||||||
| CASH AND CASH EQUIVALENTS AT THE END OF THE PERIOD | $ | 37,661,420 | $ | 42,409,714 | ||||
The accompanying notes are an integral part of the consolidated financial statements.
| With Deloitte & Touche review report dated November 7, 2016) | (Concluded) |
- 9 -
ADVANCED SEMICONDUCTOR ENGINEERING, INC. AND SUBSIDIARIES
NOTES TO CONSOLIDATED FINANCIAL STATEMENTS
FOR THE NINE MONTHS ENDED SEPTEMBER 30, 2016 AND 2015
(Amounts in Thousands, Unless Stated Otherwise)
(Reviewed, Not Audited)
| 1. | GENERAL INFORMATION |
Advanced Semiconductor Engineering, Inc. (the “Company”), a corporation incorporated in Nantze Export Processing Zone under the laws of Republic of China (the “ROC”). In August 2004, the Company merged its subsidiaries, ASE (Chung Li) Inc. and ASE Material Inc., and established Chung-Li Branch. In August 2006, the Company spun-off and assigned its substrate production business to ASE Electronics Inc. In January 2011, the Company established Nan-Tou Branch. In May 2012, the Company merged its subsidiary, PowerASE Technology, Inc. In August 2013, the Company merged its subsidiary, Yang Ting Tech Co., Ltd. The Company and its subsidiaries (collectively referred to as the “Group”) offer a comprehensive range of semiconductors packaging, testing, and electronic manufacturing services (“EMS”).
Since July 1989, the Company’s ordinary shares have been listed on the Taiwan Stock Exchange (the “TSE”) under the symbol “2311”. Since September 2000, the Company’s ordinary shares of the Company have been traded on the New York Stock Exchange (the “NYSE”) under the symbol “ASX” in the form of American Depositary Shares (“ADS”). The ordinary shares of its subsidiary, Universal Scientific Industrial (Shanghai) Co., Ltd. (the “USISH”), have been listed on the Shanghai Stock Exchange (the “SSE”) under the symbol “601231” since February 2012.
The consolidated financial statements are presented in the Company’s functional currency, New Taiwan dollar (NT$).
| 2. | APPROVAL OF FINANCIAL STATEMENTS |
The consolidated financial statements were authorized for issue by the board of directors on November 7, 2016.
| 3. | APPLICATION OF NEW AND REVISED STANDARDS, AMENDMENTS AND INTERPRETATIONS |
| a. | International Financial Reporting Standards (IFRS), International Accounting Standards (IAS), Interpretations of IFRS (IFRIC), and Interpretations of IAS (SIC) (collectively, the “IFRSs”) endorsed by the Financial Supervisory Commission of the Republic of China (“FSC”) for application from 2017. |
Rule No.1050026834 issued by the FSC endorsed the following IFRSs for application starting January 1, 2017.
- 10 -
New, Amended or Revised Standards and Interpretations (the “New IFRSs”) | Effective Date Announced by International Accounting Standard Board (“IASB”) (Note 1) | |
| Annual Improvements to IFRSs 2010-2012 Cycle | July 1, 2014 or transactions on or after July 1, 2014 | |
| Annual Improvements to IFRSs 2011-2013 Cycle | July 1, 2014 | |
| Annual Improvements to IFRSs 2012-2014 Cycle | January 1, 2016 (Note 2) | |
| Amendments to IFRS 10, IFRS 12 and IAS 28 “Investment Entities: Applying the Consolidation Exception” | January 1, 2016 | |
| Amendment to IFRS 11 “Accounting for Acquisitions of Interests in Joint Operations” | January 1, 2016 | |
| IFRS 14 “Regulatory Deferral Accounts” | January 1, 2016 | |
| Amendment to IAS 1 “Disclosure Initiative” | January 1, 2016 | |
| Amendments to IAS 16 and IAS 38 “Clarification of Acceptable Methods of Depreciation and Amortization” | January 1, 2016 | |
| Amendments to IAS 16 and IAS 41 “Agriculture: Bearer Plants” | January 1, 2016 | |
| Amendment to IAS 19 “Defined Benefit Plans: Employee Contributions” | July 1, 2014 | |
| Amendment to IAS 36 “Impairment of Assets: Recoverable Amount Disclosures for Non-financial Assets” | January 1, 2014 | |
| Amendment to IAS 39 “Novation of Derivatives and Continuation of Hedge Accounting” | January 1, 2014 | |
| IFRIC 21 “Levies” | January 1, 2014 |
| Note 1: | Unless stated otherwise, the above New IFRSs are effective for annual periods beginning on or after their respective effective dates. |
| Note 2: | The amendment to IFRS 5 is applied prospectively to changes in a method of disposal that occur in annual periods beginning on or after January 1, 2016, the remaining amendments are effective for annual periods beginning on or after January 1, 2016. |
Except for the following, the initial application of the above New IFRSs in 2017 would not have any material impact on the Group’s accounting policies:
Amendment to IAS 36 “Impairment of Assets: Recoverable Amount Disclosures for Non-financial Assets”
The amendment to IAS 36 clarifies that the recoverable amount of an asset or a cash-generating unit is disclosed only when an impairment loss on the asset has been recognized or reversed during the period. If the recoverable amount of an item of property, plant and equipment for which impairment loss has been recognized or reversed is fair value less costs of disposal, the Group is required to disclose the fair value hierarchy. If the fair value measurements are categorized within Level 2 or Level 3, the valuation technique and key assumptions used to measure the fair value are disclosed. The discount rate used is disclosed if such fair value less costs of disposal is measured by using present value technique. The amendment will be applied retrospectively. The Group expect that recoverable amount disclosure for non-financial assets is required under the amendment.
| b. | New IFRSs in issue but not yet endorsed by the FSC |
The Group has not applied the following IFRSs issued by the IASB but not yet endorsed by the FSC. As of the date the consolidated financial statements were authorized for issue, except that the Group should apply IFRS 15 starting January 1, 2018, the FSC has not announced the effective dates of other New IFRSs.
- 11 -
| New IFRSs | Effective Date
Announced by IASB (Note)
| |
| Amendments to IFRS 2 “Classification and Measurement of Share-based Payment Transactions” | January 1, 2018 | |
| Amendments to IFRS 4“Applying IFRS 9 Financial Instruments with IFRS 4 Insurance Contracts” | January 1, 2018 | |
| IFRS 9 “Financial Instruments” | January 1, 2018 | |
| Amendments to IFRS 9 and IFRS 7 “Mandatory Effective Date of IFRS 9 and Transition Disclosures” | January 1, 2018 | |
| Amendments to IFRS 10 and IAS 28 “Sale or Contribution of Assets between an Investor and its Associate or Joint Venture” | To be determined by IASB | |
| IFRS 15 “Revenue from Contracts with Customers” | January 1, 2018 | |
| Amendments to IFRS 15 “Clarifications to IFRS 15” | January 1, 2018 | |
| IFRS 16 “Leases” | January 1, 2019 | |
| Amendment to IAS 7 “Disclosure Initiative” | January 1, 2017 | |
| Amendments to IAS 12 “Recognition of Deferred Tax Assets for Unrealized Losses” | January 1, 2017 |
| Note: | Unless stated otherwise, the above New IFRSs are effective for annual periods beginning on or after their respective effective dates. |
| 1) | IFRS 9 “Financial Instruments” |
Recognition and measurement of financial assets
With regards to financial assets, all recognized financial assets that are within the scope of IAS 39 “Financial Instruments: Recognition and Measurement” are subsequently measured at amortized cost or fair value. Under IFRS 9, the requirement for the classification of financial assets is stated below:
For the Group’s debt instruments that have contractual cash flows that are solely payments of principal and interest on the principal amount outstanding, their classification and measurement are as follows:
| a) | For debt instruments, if they are held within a business model whose objective is to collect the contractual cash flows, the financial assets are measured at amortized cost and are assessed for impairment continuously with impairment loss recognized in profit or loss, if any. Interest revenue is recognized in profit or loss by using the effective interest method; |
| b) | For debt instruments, if they are held within a business model whose objective is achieved by both the collecting of contractual cash flows and the selling of financial assets, the financial assets are measured at fair value through other comprehensive income (FVTOCI) and are assessed for impairment. Interest revenue is recognized in profit or loss by using the effective interest method, and other gain or loss shall be recognized in other comprehensive income, except for impairment gains or losses and foreign exchange gains and losses. When the debt instruments are derecognized or reclassified, the cumulative gain or loss previously recognized in other comprehensive income is reclassified from equity to profit or loss. |
Except for above, all other financial assets are measured at fair value through profit or loss. However, the Group may make an irrevocable election to present subsequent changes in the fair value of an equity investment (that is not held for trading) in other comprehensive income, with only dividend income generally recognized in profit or loss. No subsequent impairment assessment is required, and the cumulative gain or loss previously recognized in other comprehensive income cannot be reclassified from equity to profit or loss.
- 12 -
The impairment of financial assets
IFRS 9 requires that impairment loss on financial assets is recognized by using the “Expected Credit Losses Model”. The credit loss allowance is required for financial assets measured at amortized cost, financial assets mandatorily measured at FVTOCI, lease receivables, contract assets arising from IFRS 15 “Revenue from Contracts with Customers”, certain written loan commitments and financial guarantee contracts. A loss allowance for the 12-month expected credit losses is required for a financial asset if its credit risk has not increased significantly since initial recognition. A loss allowance for full lifetime expected credit losses is required for a financial asset if its credit risk has increased significantly since initial recognition and is not low. However, a loss allowance for full lifetime expected credit losses is required for trade receivables that do not constitute a financing transaction.
For purchased or originated credit-impaired financial assets, the Group takes into account the expected credit losses on initial recognition in calculating the credit-adjusted effective interest rate. Subsequently, any changes in expected losses are recognized as a loss allowance with a corresponding gain or loss recognized in profit or loss.
Hedge accounting
The main changes in hedge accounting amended the application requirements for hedge accounting to better reflect the entity’s risk management activities. Compared with IAS 39, the main changes include: (1) enhancing types of transactions eligible for hedge accounting, specifically broadening the risk eligible for hedge accounting of non-financial items; (2) changing the way hedging derivative instruments are accounted for to reduce profit or loss volatility; and (3) replacing retrospective effectiveness assessment with the principle of economic relationship between the hedging instrument and the hedged item.
| 2) | Amendments to IFRS 10 and IAS 28 “Sale or Contribution of Assets between an Investor and its Associate or Joint Venture” |
The amendments stipulated that, when the Group sells or contributes assets that constitute a business (as defined in IFRS 3) to an associate or joint venture, the gain or loss resulting from the transaction is recognized in full. Also, when the Group loses control over a subsidiary that contains a business but retains significant influence or joint control, the gain or loss resulting from the transaction is recognized in full.
Conversely, when the Group sells or contributes assets that do not constitute a business to an associate or joint venture, the gain or loss resulting from the transaction is recognized only to the extent of the unrelated investors’ interest in the associate or joint venture, i.e. the entity’s share of the gain or loss is eliminated. Also, when the Group loses control over a subsidiary that does not contain a business but retains significant influence or joint control in an associate or a joint venture, the gain or loss resulting from the transaction is recognized only to the extent of the unrelated investors’ interest in the associate or joint venture, i.e. the entity’s share of the gain or loss is eliminated.
| 3) | IFRS 15 “Revenue from Contracts with Customers” and related amendment |
IFRS 15 establishes principles for recognizing revenue that apply to all contracts with customers, and will supersede IAS 18 “Revenue”, IAS 11 “Construction Contracts” and a number of revenue-related interpretations from January 1, 2018.
- 13 -
When applying IFRS 15, an entity shall recognize revenue by applying the following steps:
| — | Identify the contract with the customer; |
| — | Identify the performance obligations in the contract; |
| — | Determine the transaction price; |
| — | Allocate the transaction price to the performance obligations in the contracts; and |
| — | Recognize revenue when the entity satisfies a performance obligation. |
In identifying performance obligations, IFRS 15 and related amendment require that a good or service is distinct if it is capable of being distinct (for example, the Group regularly sells it separately) and the promise to transfer it is distinct within the context of the contract (i.e. the nature of the promise in the contract is to transfer each of those goods or services individually rather than to transfer combined items).
When IFRS 15 and related amendment are effective, the Group may elect to apply this Standard either retrospectively to each prior reporting period presented or retrospectively with the cumulative effect of initially applying this Standard recognized at the date of initial application.
| 4) | IFRS 16 “Leases” |
IFRS 16 sets out the accounting standards for leases that will supersede IAS 17 and a number of related interpretations.
Under IFRS 16, if the Group is a lessee, it shall recognize right-of-use assets and lease liabilities for all leases on the consolidated balance sheets except for low-value and short-term leases. The Group may elect to apply the accounting method similar to the accounting for operating lease under IAS 17 to the low-value and short-term leases. On the consolidated statements of comprehensive income, the Group should present the depreciation expense charged on the right-of-use asset separately from interest expense accrued on the lease liability; interest is computed by using effective interest method. On the consolidated statements of cash flows, cash payments for the principal portion of the lease liability are classified within financing activities; cash payments for interest portion are classified within operating activities.
The application of IFRS 16 is not expected to have a material impact on the accounting of the Group as lessor.
When IFRS 16 becomes effective, the Group may elect to apply this Standard either retrospectively to each prior reporting period presented or retrospectively with the cumulative effect of the initial application of this Standard recognized at the date of initial application.
| 5) | Amendments to IAS 12 “Recognition of Deferred Tax Assets for Unrealized Losses” |
The amendment clarifies that the difference between the carrying amount of the debt instrument measured at fair value and its tax base gives rise to a temporary difference, even though there are unrealized losses on that asset, irrespective of whether the Group expects to recover the carrying amount of the debt instrument by sale or by holding it and collecting contractual cash flows.
In addition, in determining whether to recognize a deferred tax asset, the Group should assess a deductible temporary difference in combination with all of its other deductible temporary differences, unless the tax law restricts the utilization of losses to deduction against income of a specific type, in which case, a deductible temporary difference is assessed in combination only with other deductible temporary differences of the appropriate type. The amendment also stipulates
- 14 -
that, when determining whether to recognize a deferred tax asset, the estimate of probable future taxable profit may include some of the Group’s assets for more than their carrying amount if there is sufficient evidence that it is probable that the Group will achieve this, and that the estimate for future taxable profit should exclude tax deductions resulting from the reversal of deductible temporary differences.
Except for the above impact, as of the date the consolidated financial statements were authorized for issue, the Group is continuously assessing the possible impact that the application of other standards and interpretations will have on the Group’s financial position and results of operations, and will disclose the relevant impact when the assessment is completed.
| 4. | SUMMARY OF SIGNIFICANT ACCOUNTING POLICIES |
| a. | Statement of Compliance |
These interim consolidated financial statements have been prepared in accordance with the Regulations Governing the Preparation of Financial Reports by Securities Issuers and IAS 34 “Interim Financial Reporting” as endorsed by the FSC. Disclosure information included in these interim consolidated financial statements is less than the disclosure information required in a complete set of annual financial statements.
| b. | Basis of Consolidation |
Subsidiaries included in these interim consolidated financial statements were as follows:
| Percentage of Ownership (%) | ||||||||||
| Name of Investee | Main Businesses | Establishment and Operating Location | September 30, 2016 | December 31, 2015 | September 30, 2015 | |||||
| A.S.E. Holding Limited | Holding company | Bermuda | 100.0 | 100.0 | 100.0 | |||||
| J & R Holding Limited (“J&R Holding”) | Holding company | Bermuda | 100.0 | 100.0 | 100.0 | |||||
| Innosource Limited | Holding company | British Virgin Islands | 100.0 | 100.0 | 100.0 | |||||
| Omniquest Industrial Limited | Holding company | British Virgin Islands | 100.0 | 100.0 | 100.0 | |||||
| ASE Marketing & Service Japan Co., Ltd. | Engaged in marketing and sales services | Japan | 100.0 | 100.0 | 100.0 | |||||
| ASE Test, Inc. | Engaged in the testing of semiconductors | Kaohsiung, ROC | 100.0 | 100.0 | 100.0 | |||||
| USI Inc. (“USIINC”) | Engaged in investment | Nantou, ROC | 99.2 | 99.2 | 99.2 | |||||
| Luchu Development Corporation | Engaged in the development of real estate properties | Taipei, ROC | 86.1 | 86.1 | 86.1 | |||||
| TLJ Intertech Inc. (“TLJ”) | Engaged in information software services and 60% shareholdings were acquired by ASE Test, Inc. in May 2016 | Taipei, ROC | 60.0 | - | - | |||||
| Alto Enterprises Limited | Holding company | British Virgin Islands | 100.0 | 100.0 | 100.0 | |||||
| Super Zone Holdings Limited | Holding company | Hong Kong | 100.0 | 100.0 | 100.0 | |||||
| ASE (Kun Shan) Inc. | Engaged in the packaging and testing of semiconductors | Kun Shan, China | 100.0 | 100.0 | 100.0 | |||||
| ASE Investment (Kun Shan) Limited | Holding company | Kun Shan, China | 100.0 | 100.0 | 100.0 | |||||
| Advanced Semiconductor Engineering (China) Ltd. | Will engage in the packaging and testing of semiconductors | Shanghai, China | 100.0 | 100.0 | 100.0 | |||||
| ASE Investment (Labuan) Inc. | Holding company | Malaysia | 100.0 | 100.0 | 100.0 | |||||
| ASE Test Limited (“ASE Test”) | Holding company | Singapore | 100.0 | 100.0 | 100.0 | |||||
| ASE (Korea) Inc. | Engaged in the packaging and testing of semiconductors | Korea | 100.0 | 100.0 | 100.0 | |||||
| J&R Industrial Inc. | Engaged in leasing equipment and investing activity | Kaohsiung, ROC | 100.0 | 100.0 | 100.0 | |||||
| ASE Japan Co., Ltd. | Engaged in the packaging and testing of semiconductors | Japan | 100.0 | 100.0 | 100.0 | |||||
| ASE (U.S.) Inc. | After-sales service and sales support | U.S.A. | 100.0 | 100.0 | 100.0 | |||||
| Global Advanced Packaging Technology Limited, Cayman Islands | Holding company | British Cayman Islands | 100.0 | 100.0 | 100.0 | |||||
| ASE WeiHai Inc. | Engaged in the packaging and testing of semiconductors | Shandong, China | 100.0 | 100.0 | 100.0 | |||||
| Suzhou ASEN Semiconductors Co., Ltd. | Engaged in the packaging and testing of semiconductors | Suzhou, China | 60.0 | 60.0 | 60.0 | |||||
(Continued)
- 15 -
| Percentage of Ownership (%) | ||||||||||
| Name of Investee | Main Businesses | Establishment and Operating Location | September 30, 2016 | December 31, 2015 | September 30, 2015 | |||||
| Anstock Limited | Engaged in financing activity | British Cayman Islands | 100.0 | 100.0 | 100.0 | |||||
| Anstock II Limited | Engaged in financing activity | British Cayman Islands | 100.0 | 100.0 | 100.0 | |||||
| ASE Module (Shanghai) Inc. | Will engage in the production and sale of electronic components and printed circuit boards | Shanghai, China | 100.0 | 100.0 | 100.0 | |||||
| ASE (Shanghai) Inc. | Engaged in the production of substrates | Shanghai, China | 100.0 | 100.0 | 100.0 | |||||
| ASE Corporation | Holding company | British Cayman Islands | 100.0 | 100.0 | 100.0 | |||||
| ASE Mauritius Inc. | Holding company | Mauritius | 100.0 | 100.0 | 100.0 | |||||
| ASE Labuan Inc. | Holding company | Malaysia | 100.0 | 100.0 | 100.0 | |||||
| Shanghai Ding Hui Real Estate Development Co., Ltd. | Engaged in the development, construction and sale of real estate properties | Shanghai, China | 100.0 | 100.0 | 100.0 | |||||
| Shanghai Ding Qi Property Management Co., Ltd. | Engaged in the management of real estate properties | Shanghai, China | 100.0 | 100.0 | 100.0 | |||||
| Advanced Semiconductor Engineering (HK) Limited | Engaged in the trading of substrates | Hong Kong | 100.0 | 100.0 | 100.0 | |||||
| Shanghai Ding Wei Real Estate Development Co., Ltd. | Engaged in the development, construction and leasing of real estate properties | Shanghai, China | 100.0 | 100.0 | 100.0 | |||||
| Shanghai Ding Yu Real Estate Development Co., Ltd. | Engaged in the development, construction and leasing of real estate properties | Shanghai, China | 100.0 | 100.0 | 100.0 | |||||
| Shanghai Ding Fan Department Store Co., Ltd. | Will engage in department store business, and was established in July 2016 | Shanghai, China | 100.0 | - | - | |||||
| Kun Shan Ding Yue Real Estate Development Co., Ltd. | Engaged in the development, construction and leasing of real estate properties | Kun Shan, China | 100.0 | 100.0 | 100.0 | |||||
| Kun Shan Ding Hong Real Estate Development Co., Ltd | Engaged in the development, construction and leasing of real estate properties | Kun Shan, China | 100.0 | 100.0 | 100.0 | |||||
| ASE Electronics Inc. | Engaged in the production of substrates | Kaohsiung, ROC | 100.0 | 100.0 | 100.0 | |||||
| ASE Test Holdings, Ltd. | Holding company | British Cayman Islands | 100.0 | 100.0 | 100.0 | |||||
| ASE Holdings (Singapore) Pte Ltd | Holding company | Singapore | 100.0 | 100.0 | 100.0 | |||||
| ASE Singapore Pte. Ltd. | Engaged in the packaging and testing of semiconductors | Singapore | 100.0 | 100.0 | 100.0 | |||||
| ISE Labs, Inc. | Engaged in the testing of semiconductors | U.S.A. | 100.0 | 100.0 | 100.0 | |||||
| ASE Electronics (M) Sdn. Bhd. | Engaged in the packaging and testing of semiconductors | Malaysia | 100.0 | 100.0 | 100.0 | |||||
| ASE Assembly & Test (Shanghai) Limited | Engaged in the packaging and testing of semiconductors | Shanghai, China | 100.0 | 100.0 | 100.0 | |||||
| ASE Trading (Shanghai) Ltd. | Engaged in trading activity | Shanghai, China | 100.0 | 100.0 | 100.0 | |||||
| Wuxi Tongzhi Microelectronics Co., Ltd. | Engaged in the packaging and testing of semiconductors | Wuxi, China | 100.0 | 100.0 | 100.0 | |||||
| Huntington Holdings International Co., Ltd. | Holding company | British Virgin Islands | 99.2 | 99.2 | 99.2 | |||||
| Senetex Investment Co., Ltd. | Liquidated in December 2015 | Nantou, ROC | - | - | 99.2 | |||||
| Unitech Holdings International Co., Ltd. | Holding company | British Virgin Islands | 99.2 | 99.2 | 99.2 | |||||
| Real Tech Holdings Limited | Holding company | British Virgin Islands | 99.2 | 99.2 | 99.2 | |||||
| Universal ABIT Holding Co., Ltd. | In the process of liquidation | British Cayman Islands | 99.2 | 99.2 | 99.2 | |||||
| Rising Capital Investment Limited | Holding company | British Virgin Islands | 99.2 | 99.2 | 99.2 | |||||
| Rise Accord Limited | Holding company | British Virgin Islands | 99.2 | 99.2 | 99.2 | |||||
| Universal Scientific Industrial (Kunshan) Co., Ltd. | Engaged in the manufacturing and sale of computer assistance system and related peripherals | Kun Shan, China | 99.2 | 99.2 | 99.2 | |||||
| USI Enterprise Limited (“USIE”) | Engaged in the service of investment advisory and warehousing management | Hong Kong | 98.8 | 96.7 | 98.7 | |||||
| Universal Scientific Industrial (Shanghai) Co., Ltd. (“USISH”) | Engaged in the designing, manufacturing and sale of electronic components | Shanghai, China | 77.3 | 75.7 | 77.2 | |||||
| Universal Global Technology Co., Limited | Holding company | Hong Kong | 77.3 | 75.7 | 77.2 | |||||
| Universal Global Technology (Kunshan) Co., Ltd. | Engaged in the designing and manufacturing of electronic components | Kun Shan, China | 77.3 | 75.7 | 77.2 | |||||
| Universal Global Technology (Shanghai) Co., Ltd. | Engaged in the processing and sales of computer and communication peripherals as well as business in import and export of goods and technology | Shanghai, China | 77.3 | 75.7 | 77.2 | |||||
| Universal Global Electronics (Shanghai) Co., Ltd. | Engaged in the sale of electronic components and telecommunications equipment | Shanghai, China | 77.3 | 75.7 | 77.2 | |||||
(Continued)
- 16 -
| Percentage of Ownership (%) | ||||||||||
| Name of Investee | Main Businesses | Establishment and Operating Location | September 30, 2016 | December 31, 2015 | September 30, 2015 | |||||
| Universal Global Industrial Co., Limited | Engaged in manufacturing, trading and investing activity | Hong Kong | 77.3 | 75.7 | 77.2 | |||||
| Universal Global Scientific Industrial Co., Ltd. (“UGTW”) | Engaged in the manufacturing of components of telecomm and cars and provision of related R&D services | Nantou, ROC | 77.3 | 75.7 | 77.2 | |||||
| USI America Inc. | Engaged in the manufacturing and processing of motherboards and wireless network communication and provision of related technical service. | U.S.A. | 77.3 | 75.7 | 77.2 | |||||
| Universal Scientific Industrial De Mexico S.A. De C.V. | Engaged in the assembling of motherboards and computer components | Mexico | 77.3 | 75.7 | 77.2 | |||||
| USI Japan Co., Ltd. | Engaged in the manufacturing and sale of computer peripherals, integrated chip and other related accessories | Japan | 77.3 | 75.7 | 77.2 | |||||
| USI Electronics (Shenzhen) Co., Ltd. | Engaged in the design, manufacturing and sale of motherboards and computer peripherals | Shenzhen, China | 77.3 | 75.7 | 77.2 | |||||
| Universal Scientific Industrial Co., Ltd. (“USI”) | Engaged in the manufacturing, processing and sale of computers, computer peripherals and related accessories | Nantou, ROC | 76.5 | 99.0 | 99.0 | |||||
(Concluded)
| c. | Other significant accounting policies |
Except for the following, the accounting policies applied in these condensed consolidated financial statements are consistent with those applied in the Group’s consolidated financial statements for the year ended December 31, 2015.
| 1) | Retirement benefits |
Pension cost for an interim period is calculated on a year-to-date basis by using the actuarially determined pension cost rate at the end of the prior financial year, adjusted for significant market fluctuations since that time and for significant plan amendments, settlements, or other significant one-off events.
| 2) | Taxation |
Income tax expense represents the sum of the tax currently payable and deferred tax. Interim period income taxes are assessed on an annual basis and calculated by applying to an interim period’s pre-tax income the tax rate that would be applicable to expected total annual earnings.
| 5. | CRITICAL ACCOUNTING JUDGMENTS AND KEY SOURCES OF ESTIMATION UNCERTAINTY |
Except those discussed below, the same critical accounting judgments and key sources of estimation uncertainty of consolidated financial statements have been followed in these consolidated financial statements as were applied in the preparation of the Group’s consolidated financial statements for the year ended December 31, 2015.
For the associate accounted for using the equity method, the Group recognized goodwill which is included within the carrying amount of the investment as of each investment date as the excess of cost of investments over the Group’s share of the net fair value of the associate’s identifiable assets acquired and the liabilities assumed at the respective investment dates; as a result, it involves critical accounting judgment and estimates when determining aforementioned fair values. The management engaged external appraiser to identify and evaluate the associate’s identifiable tangible assets, intangible assets and liabilities.
- 17 -
The scope of such evaluation includes assumptions as current replacement cost of tangible assets, the categories of intangible assets and their expected economic benefits, growth rates and discount rates used in cash flow analysis. The amounts of differences between fair value of identified tangible and intangible assets and the carrying amount at each respective investment dates are depreciated or amortized over their remaining useful lives or expected future economic benefit lives. The management considered that the related evaluation and assumption has appropriately reflected the fair value of identifiable assets acquired and liabilities assumed.
| 6. | CASH AND CASH EQUIVALENTS |
September 30, 2016 | December 31, 2015 | September 30, 2015 | ||||||||||
| NT$ | NT$ | NT$ | ||||||||||
| Cash on hand | $ | 8,146 | $ | 8,806 | $ | 8,828 | ||||||
| Checking accounts and demand deposits | 29,027,930 | 50,291,823 | 33,144,463 | |||||||||
| Cash equivalents | 8,625,344 | 4,950,552 | 9,256,423 | |||||||||
| $ | 37,661,420 | $ | 55,251,181 | $ | 42,409,714 | |||||||
Cash equivalents include time deposits that are of a short maturity of three months or less from the date of acquisitions, and are highly liquid, readily convertible to known amounts in cash and the risk of changes in values is insignificant. Cash equivalents are held for the purpose of meeting short-term cash commitments rather than for investments or other purposes.
| 7. | FINANCIAL INSTRUMENTS AT FAIR VALUE THROUGH PROFIT OR LOSS (“FVTPL”) |
September 30, 2016 | December 31, 2015 | September 30, 2015 | ||||||||||
| NT$ | NT$ | NT$ | ||||||||||
| Financial assets designated as at FVTPL | ||||||||||||
| Private-placement convertible bonds | $ | 100,583 | $ | 100,500 | $ | 100,500 | ||||||
| Structured time deposits | - | 1,646,357 | - | |||||||||
| 100,583 | 1,746,857 | 100,500 | ||||||||||
| Financial assets held for trading | ||||||||||||
| Open-end mutual funds | 584,424 | 573,242 | 558,437 | |||||||||
| Forward exchange contracts | 55,645 | 18,913 | 41,189 | |||||||||
| Swap contracts | 38,451 | 1,452,611 | 2,398,880 | |||||||||
| Quoted shares | 34,728 | 37,058 | 43,225 | |||||||||
| Foreign currency option contracts | - | 5,020 | - | |||||||||
| 713,248 | 2,086,844 | 3,041,731 | ||||||||||
| $ | 813,831 | $ | 3,833,701 | $ | 3,142,231 |
| Financial liabilities held for trading | ||||||||||||
| Conversion option, redemption option and put option of convertible bonds (Note 19) | $ | 2,224,051 | $ | 2,632,565 | $ | 2,049,773 |
(Continued)
- 18 -
September 30, 2016 | December 31, 2015 | September 30, 2015 | ||||||||||
| NT$ | NT$ | NT$ | ||||||||||
| Swap contracts | $ | 1,708,293 | $ | 290,176 | $ | 244,204 | ||||||
| Forward exchange contracts | 10,825 | 69,207 | 298,988 | |||||||||
| Interest rate swap contracts | 8,791 | 119 | - | |||||||||
| Foreign currency option contracts | 1,560 | 13,659 | 12,112 | |||||||||
| $ | 3,953,520 | $ | 3,005,726 | $ | 2,605,077 | |||||||
(Concluded)
The Group invested in structured time deposits and private-placement convertible bonds, and all included embedded derivative instruments which are not closely related to the host contracts. The Group designated the entire contracts as financial assets at FVTPL on initial recognition.
At each balance sheet date, the outstanding swap contracts not accounted for hedge accounting were as follows:
| Notional Amount | ||||
| Currency | Maturity Period | (In Thousands) | ||
| September 30, 2016 | ||||
| Sell EUR/Buy US$ | 2016.10 | EUR4,960/US$5,573 | ||
| Sell JPY/Buy US$ | 2016.10 | JPY38,308/US$380 | ||
| Sell NT$/Buy US$ | 2016.10-2017.09 | NT$62,646,431/US$1,951,500 | ||
| Sell US$/Buy CNY | 2016.10 | US$52,535/CNY349,800 | ||
| Sell US$/Buy JPY | 2016.11-2016.12 | US$83,036/JPY8,420,000 | ||
| Sell US$/Buy KRW | 2016.10-2016.11 | US$20,000/KRW22,232,000 | ||
| Sell US$/Buy NT$ | 2016.10-2016.11 | US$51,600/NT$1,621,665 | ||
| December 31, 2015 | ||||
| Sell NT$/Buy US$ | 2016.01-2016.12 | NT$57,554,138/US$1,802,834 | ||
| Sell US$/Buy CNY | 2016.01-2016.03 | US$353,881/CNY2,255,872 | ||
| Sell US$/Buy JPY | 2016.03 | US$67,125/JPY8,240,000 | ||
| Sell US$/Buy NT$ | 2016.01 | US$91,750/NT$3,005,494 | ||
| September 30, 2015 | ||||
| Sell JPY$/Buy US$ | 2015.10 | JPY66,604/US$550 | ||
| Sell NT$/Buy US$ | 2015.10-2016.09 | NT$75,508,555/US$2,367,628 | ||
| Sell US$/Buy CNY | 2015.10-2016.01 | US$460,287/CNY2,927,341 | ||
| Sell US$/Buy JPY | 2015.10-2015.11 | US$69,190/JPY8,350,000 | ||
| Sell US$/Buy KRW | 2015.10 | US$17,000/KRW19,903,600 | ||
| Sell US$/Buy NT$ | 2015.10-2015.11 | US$76,800/NT$2,503,231 |
At each balance sheet date, the outstanding forward exchange contracts not accounted for hedge accounting were as follow:
- 19 -
| Notional Amount | ||||
| Currency | Maturity Period | (In Thousands) | ||
| September 30, 2016 | ||||
| Sell NT$ /Buy US$ | 2016.10-2016.11 | NT$10,147,295/US$325,000 | ||
| Sell US$/Buy CNY | 2016.10-2016.11 | US$65,000/CNY433,976 | ||
| Sell US$/Buy JPY | 2016.10-2016.11 | US$21,864/JPY2,227,835 | ||
| Sell US$/Buy KRW | 2016.10-2016.11 | US$26,400/KRW29,134,690 | ||
| Sell US$/Buy MYR | 2016.10-2016.11 | US$9,000/MYR36,944 | ||
| Sell US$/Buy SGD | 2016.10-2016.12 | US$11,100/SGD14,988 | ||
| December 31, 2015 | ||||
| Sell NT$/Buy US$ | 2016.02 | NT$325,400/US$10,000 | ||
| Sell US$/Buy CNY | 2016.01-2016.03 | US$121,000/CNY780,252 | ||
| Sell US$/Buy JPY | 2016.01 | US$14,000/JPY1,713,388 | ||
| Sell US$/Buy KRW | 2016.01 | US$8,000/KRW9,420,350 | ||
| Sell US$/Buy MYR | 2016.01-2016.02 | US$6,000/MYR25,525 | ||
| Sell US$/Buy NT$ | 2016.01-2016.03 | US$155,000/NT$5,088,230 | ||
| Sell US$/Buy SGD | 2016.01-2016.02 | US$11,400/SGD16,079 | ||
| September 30, 2015 | ||||
| Sell US$/Buy CNY | 2015.10-2015.12 | US$105,408/CNY673,695 | ||
| Sell US$/Buy JPY | 2015.10 | US$74/JPY8,840 | ||
| Sell US$/Buy KRW | 2015.10 | US$11,000/KRW13,064,100 | ||
| Sell US$/Buy MYR | 2015.10-2015.11 | US$13,000/MYR55,759 | ||
| Sell US$/Buy NT$ | 2015.10-2015.12 | US$615,000/NT$20,127,565 | ||
| Sell US$/Buy SGD | 2015.10-2015.12 | US$12,400/SGD17,302 |
At each balance sheet date, the outstanding foreign currency option contracts not accounted for hedge accounting were as follows:
| Notional Amount | ||||
| Currency | Maturity Period | (In Thousands) | ||
| September 30, 2016 | ||||
| Buy US$ Call/CNY Put | 2017.08 (Note) | US$2,000/CNY13,800 | ||
| Sell US$ Put/CNY Call | 2017.08 (Note) | US$1,000/CNY 6,900 | ||
| December 31, 2015 | ||||
| Buy US$ Call/CNY Put | 2017.08 (Note) | US$2,000/CNY13,800 | ||
| Buy US$ Put/CNY Call | 2016.03 | US$20,000/CNY131,600 | ||
| Sell US$ Put/CNY Call | 2017.08 (Note) | US$1,000/CNY 6,900 | ||
| September 30, 2015 | ||||
| Buy US$ Call/NT$ Put | 2016.08 (Note) | US$2,000/NT$68,200 | ||
| Buy US$ Call/CNY Put | 2017.08 (Note) | US$2,000/CNY13,800 | ||
| Sell US$ Put/ NT$ Call | 2016.08 (Note) | US$1,000/NT$34,100 | ||
| Sell US$ Put/CNY Call | 2017.08 (Note) | US$1,000/CNY6,900 |
- 20 -
| Note: | The contracts will be settled once a month and the counterparty has the right to early terminate the contracts, or the contracts will be early terminated or both parties will have no obligation to settle the contracts when the specific criteria is met. Partial of the aforementioned outstanding contracts as of September 30, 2015 were early terminated. |
At each balance sheet date, the outstanding interest rate swap contracts not accounted for hedge accounting were as follows:
| Maturity Period | Notional Amounts (In Thousands) | Range of Interest Rates Paid | Range of Interest Rates Received | |||
| September 30, 2016 | ||||||
| 2016.10 | NT$1,000,000 | 4.60% (Fixed) | 0.00%-5.00% (Floating) | |||
| December 31, 2015 | ||||||
| 2016.10 | NT$1,000,000 | 4.60% (Fixed) | 0.00%-5.00% (Floating) |
| 8. | AVAILABLE-FOR-SALE FINANCIAL ASSETS |
September 30, 2016 | December 31, 2015 | September 30, 2015 | ||||||||||
| NT$ | NT$ | NT$ | ||||||||||
| Unquoted ordinary shares | $ | 506,502 | $ | 249,217 | $ | 230,792 | ||||||
| Limited partnership | 448,913 | 476,612 | 501,168 | |||||||||
| Quoted ordinary shares | 160,243 | 197,580 | 172,915 | |||||||||
| Open-end mutual funds | 44,207 | 16,037 | - | |||||||||
| Unquoted preferred shares | 14,166 | 15,260 | 15,426 | |||||||||
| 1,174,031 | 954,706 | 920,301 | ||||||||||
| Current | 70,092 | �� | 30,344 | 15,506 | ||||||||
| Non-current | $ | 1,103,939 | $ | 924,362 | $ | 904,795 | ||||||
| 9. | TRADE RECEIVABLES, NET |
September 30, 2016 | December 31, 2015 | September 30, 2015 | ||||||||||
| NT$ | NT$ | NT$ | ||||||||||
| Trade receivables | $ | 52,063,840 | $ | 45,014,393 | $ | 53,262,675 | ||||||
| Less: Allowance for doubtful debts | 54,262 | 82,906 | 106,188 | |||||||||
| Trade receivables, net | $ | 52,009,578 | $ | 44,931,487 | $ | 53,156,487 | ||||||
- 21 -
| a. | Trade receivables |
The Group’s average credit terms were 30 to 90 days. Allowance for doubtful debts is assessed by reference to the collectability of receivables by evaluating the account aging, historical experience and current financial condition of customers.
As of September 30, 2016, December 31, 2015 and September 30, 2015, except that the Group’s five largest customers accounted for 33%, 26% and 28% of accounts receivable, respectively, the concentration of credit risk is insignificant for the remaining accounts receivable.
Aging of receivables based on the past due date
September30, 2016 | December 31, 2015 | September 30, 2015 | ||||||||||
| NT$ | NT$ | NT$ | ||||||||||
| Not past due | $ | 47,741,458 | $ | 40,409,227 | $ | 48,266,342 | ||||||
| 1 to 30 days | 3,695,299 | 3,901,300 | 3,935,421 | |||||||||
| 31 to 90 days | 532,980 | 495,664 | 842,340 | |||||||||
| More than 91 days | 94,103 | 208,202 | 218,572 | |||||||||
| Total | $ | 52,063,840 | $ | 45,014,393 | $ | 53,262,675 | ||||||
Aging of receivables that were past due but not impaired
September 30, 2016 | December 31, 2015 | September 30, 2015 | ||||||||||
| NT$ | NT$ | NT$ | ||||||||||
| 1 to 30 days | $ | 3,669,497 | $ | 3,086,796 | $ | 2,788,127 | ||||||
| 31 to 90 days | 333,527 | 344,265 | 283,394 | |||||||||
| More than 91 days | - | - | 3,357 | |||||||||
| Total | $ | 4,003,024 | $ | 3,431,061 | $ | 3,074,878 | ||||||
Except for those impaired, the Group had not provided an allowance for doubtful debts on trade receivables at each balance sheet date since there has not been a significant change in credit quality and the amounts were still considered collectible. The Group did not hold any collateral or other credit enhancements over these balances nor did it have a legal right to offset against any amounts owed by the Group to counterparties.
Movement of the allowance for doubtful trade receivables
Impaired Individually | Impaired Collectively | Total | ||||||||||
| NT$ | NT$ | NT$ | ||||||||||
| Balance at January 1, 2016 | $ | 39,046 | $ | 43,860 | $ | 82,906 | ||||||
| Impairment losses recognized (reversed) | (29,013 | ) | 1,349 | (27,664 | ) | |||||||
| Effect of foreign currency exchange differences | (691 | ) | (289 | ) | (980 | ) | ||||||
| Balance at September 30, 2016 | $ | 9,342 | $ | 44,920 | $ | 54,262 | ||||||
(Continued)
- 22 -
Impaired Individually | Impaired Collectively | Total | ||||||||||
| NT$ | NT$ | NT$ | ||||||||||
| Balance at January 1, 2015 | $ | 28,305 | $ | 55,840 | $ | 84,145 | ||||||
| Impairment losses recognized | 20,411 | 2,888 | 23,299 | |||||||||
| Amount written off as uncollectible | - | (208 | ) | (208 | ) | |||||||
| Effect of foreign currency exchange differences | (177 | ) | (871 | ) | (1,048 | ) | ||||||
| Balance at September 30, 2015 | $ | 48,539 | $ | 57,649 | $ | 106,188 | ||||||
(Concluded)
| b. | Transfers of financial assets |
Factored trade receivables of the Company were as follows:
| Counterparties | Receivables Sold (In Thousands) | Amounts Collected (In Thousands) | Advances Received At Period-end (In Thousands) | Interest Rates on Advances Received (%) | Credit Line (In Thousands) | |||||
| For the nine months ended September 30, 2016 | ||||||||||
| Citi bank | US$ - | US$ 41,849 | US$ - | - | US$ 66,000 | |||||
| For the nine months ended September 30, 2015 | ||||||||||
| Citi bank | US$ 47,555 | US$ - | US$ 47,555 | 1.03 | US$ 92,000 |
Pursuant to the factoring agreement, losses from commercial disputes (such as sales returns and discounts) should be borne by the Company, while losses from credit risk should be borne by the banks. The Company also issued promissory notes to the banks for commercial disputes which remained undrawn since. The promissory notes amounted to US$2,000 thousand, US$5,000 thousand and US$5,000 thousand as of September 30, 2016, December 31, 2015 and September 30, 2015, respectively. As of September 30, 2016, there was no significant losses from commercial disputes in the past and the Company does not expect any significant commercial dispute losses in the foreseeable future.
| 10. | INVENTORIES |
September 30, 2016 | December 31, 2015 | September 30, 2015 | ||||||||||
| NT$ | NT$ | NT$ | ||||||||||
| Finished goods | $ | 6,639,252 | $ | 10,012,182 | $ | 9,369,678 | ||||||
| Work in process | 4,664,874 | 1,692,346 | 5,445,993 | |||||||||
| Raw materials | 11,071,692 | 9,672,894 | 11,013,635 | |||||||||
| Supplies | 788,774 | 852,251 | 873,379 | |||||||||
| Raw materials and supplies in transit | 470,561 | 1,028,606 | 888,502 | |||||||||
| $ | 23,635,153 | $ | 23,258,279 | $ | 27,591,187 | |||||||
- 23 -
The cost of inventories recognized as operating costs for the three months and nine months ended September 30, 2016 and 2015 were NT$58,579,554 thousand, NT$59,881,971 thousand, NT$158,489,852 thousand and NT$170,887,198 thousand, respectively, which included write-down of inventories at NT$160,104 thousand, NT$139,193 thousand, NT$313,124 thousand and NT$3,724 thousand, respectively.
| 11. | INVENTORIES RELATED TO REAL ESTATE BUSINESS |
September 30, 2016 | December 31, 2015 | September 30, 2015 | ||||||||||
| NT$ | NT$ | NT$ | ||||||||||
| Land and buildings held for sale | $ | 667 | $ | 5,431 | $ | 5,552 | ||||||
| Construction in progress | 22,453,205 | 23,956,678 | 23,357,798 | |||||||||
| Land held for construction | 1,687,526 | 1,751,429 | 1,751,429 | |||||||||
| $ | 24,141,398 | $ | 25,713,538 | $ | 25,114,779 | |||||||
Land and buildings held for sale located in Shanghai Zhangjiang was completed and successively sold. Construction in progress is mainly located on Caobao Road and Hutai Road in Shanghai, China and Lidu Road and Xinhong Road in Kun Shan, China. The capitalized borrowing costs for the three months and nine months ended September 30, 2016 and 2015 is disclosed in Note 23.
As of September 30, 2016, December 31, 2015 and September 30, 2015, inventories related to real estate business of NT$11,978,732 thousand, NT$24,837,046 thousand and NT$24,762,819 thousand, respectively, are expected to be recovered longer than twelve months.
Refer to Note 34 for the carrying amount of inventories related to real estate business that had been pledged by the Group to secure bank borrowings.
| 12. | OTHER FINANCIAL ASSETS |
September 30, 2016 | December 31, 2015 | September 30, 2015 | ||||||||||
| NT$ | NT$ | NT$ | ||||||||||
| Unsecured subordinate corporate bonds | $ | 1,000,000 | $ | - | $ | - | ||||||
| Time deposits with original maturity over three months | 948,086 | 220,545 | 1,840,131 | |||||||||
| Pledged time deposits (Note 34) | 235,913 | 207,359 | 207,325 | |||||||||
| Guarantee deposits | 210,966 | 197,513 | 183,892 | |||||||||
| Others (Note 34) | 7,592 | 22,254 | 40,314 | |||||||||
| 2,402,557 | 647,671 | 2,271,662 | ||||||||||
| Current | 1,047,303 | 301,999 | 1,928,146 | |||||||||
| Non-current | $ | 1,355,254 | $ | 345,672 | $ | 343,516 | ||||||
In June 2016, the Group acquired 1,000 units of perpetual unsecured subordinate corporate bonds in the amount of NT$1,000,000 thousand. The corporate bonds are in denomination of NT$1,000 thousand with annual interest rate at 3.5% as of September 30, 2016.
- 24 -
| 13. | INVESTMENTS ACCOUNTED FOR USING THE EQUITY METHOD |
September 30, 2016 | December 31, 2015 | September 30, 2015 | ||||||||||
| NT$ | NT$ | NT$ | ||||||||||
| Investments in associates | $ | 48,811,764 | $ | 36,527,711 | $ | 36,363,961 | ||||||
| Investments in joint ventures | 703,684 | 613,841 | 617,902 | |||||||||
| $ | 49,515,448 | $ | 37,141,552 | $ | 36,981,863 | |||||||
| a. | Investments in associates |
| 1) | Investments in associates accounted for using the equity method consisted of the following: |
| Carrying Amount | ||||||||||
| Operating | September 30, 2016 | December 31, 2015 | September 30, 2015 | |||||||
| Name of Associate | Main Business | Location | NT$ | NT$ | NT$ | |||||
| Material associate | ||||||||||
| Siliconware Precision Industries Co., Ltd.( “SPIL”) | Engaged in assembly, testing and turnkey services of integrated circuits | ROC | $ 45,613,346 | $ 35,141,701 | $ 35,055,000 | |||||
| Associates that are not individually material | ||||||||||
| Deca Technologies Inc.(“DECA”) | Holding company and the group engaged in manufacturing, development and marketing of wafer level packaging and interconnect technology | British Cayman Islands | 1,892,542 | - | - | |||||
| Hung Ching Development & Construction Co. (“HC”) | Engaged in the development, construction and leasing of real estate properties | ROC | 1,269,613 | 1,313,499 | 1,214,463 | |||||
| Hung Ching Kwan Co. (“HCK”) | Engaged in the leasing of real estate properties | ROC | 324,959 | 332,444 | 335,273 | |||||
| Advanced Microelectronic Products Inc. (“AMPI”) | Engaged in manufacturing of integrated circuit | ROC | 11,453
| 40,216
| 59,374
| |||||
| 49,111,913 | 36,827,860 | 36,664,110 | ||||||||
| Less: Deferred gain on transfer of land | 300,149
| 300,149
| 300,149
| |||||||
| $ 48,811,764 | $ 36,527,711 | $ 36,363,961 | ||||||||
| 2) | At each balance sheet date, the percentages of ownership held by the Group were as follows: |
September 30, 2016 | December 31, 2015 | September 30, 2015 | ||||
| SPIL | 33.29% | 24.99% | 24.99% | |||
| DECA | 22.07% | - | - | |||
| HC | 26.22% | 26.22% | 26.22% | |||
| HCK | 27.31% | 27.31% | 27.31% | |||
| AMPI | 17.38% | 18.24% | 18.24% |
| 3) | In September 2015, the Company acquired 725,749 thousand ordinary shares and 10,650 thousand units of ADS (one ADS represents five ordinary shares) of SPIL at NT$45 per ordinary share. The percentage of ownership was 24.99% and, as a result, the Company obtained significant influence over SPIL. |
In March and April 2016, the Company acquired additional 258,300 thousand ordinary shares and ADS (one ADS represents five ordinary shares) of SPIL from open market with a total consideration of NT$13,735,498 thousand which was paid in cash. As the result, the percentage of ownership increased from 24.99% to 33.29%.
- 25 -
As of September 30, 2016, the Company has completed the identification of the difference between the cost of the investment and the Company’s share of the net fair value of SPIL’s identifiable assets and liabilities. Therefore, the Company has retrospectively adjusted the comparative financial statements for prior periods. As of December 31, 2015, the retrospective adjustments are summarized as follows:
| Before adjusted | After adjusted | |||
| NT$ | NT$ | |||
| Investments accounted for using the equity method - SPIL | $ 35,423,058 | $ 35,141,701 | ||
| Retained earnings | $ 56,184,069 | $ 55,902,712 |
In June 2016, the Company’s board of directors approved to enter into and execute a joint share exchange agreement with SPIL. Please refer to Note 37.
| 4) | In July 2016, the Company acquired 98,490 thousand preferred shares issued by DECA at US$0.608 per share with a total consideration of NT$1,934,062 thousand (US$59,882 thousand). The percentage of ownership was 22.07% and the Company obtained significant influence over DECA. As of September 30, 2016, the Company has not completed the identification of the difference between the cost of the investment and the Company’s share of the net fair value of DECA’s identifiable assets and liabilities. |
| 5) | The convertible bond holders of AMPI exercised the conversion option in September 2016 and, as a result, the percentage of ownership held by the Company decreased from 18.24% to 17.38%. |
| 6) | Fair values (Level 1 inputs in terms of IFRS 13) of investments in associates with available published price quotation are summarized as follows: |
| September 30, 2016 | December 31, 2015 | September 30, 2015 | ||||||||||
| NT$ | NT$ | NT$ | ||||||||||
| SPIL | $ | 48,753,100 | $ | 40,741,700 | $ | 31,822,150 | ||||||
| HC | $ | 1,170,138 | $ | 1,149,549 | $ | 1,146,117 | ||||||
| AMPI | $ | 83,271 | $ | 104,255 | $ | 96,595 | ||||||
| 7) | Summarized financial information in respect of the Group’s material associate |
The summarized financial information below represents amounts shown in SPIL’s consolidated financial statements prepared in accordance with the Regulations Governing the Preparation of Financial Reports by Securities Issuers and IAS 34 “Interim Financial Reporting” as endorsed by the FSC, and adjusted by the Group for equity accounting purposes.
September 30, 2016 | December 31, 2015 | September 30, 2015 | ||||||||||
| NT$ | NT$ | NT$ | ||||||||||
| Current assets | $ | 44,914,756 | $ | 48,785,212 | $ | 45,627,115 | ||||||
| Non-current assets | 75,329,761 | 74,460,018 | 74,074,787 | |||||||||
| Current liabilities | (30,432,003 | ) | (30,677,239 | ) | (27,698,354 | ) | ||||||
| Non-current liabilities | (25,527,825 | ) | (21,967,349 | ) | (22,764,800 | ) | ||||||
| Equity | $ | 64,284,689 | $ | 70,600,642 | $ | 69,238,748 | ||||||
(Continued)
- 26 -
September 30, 2016 | December 31, 2015 | September 30, 2015 | ||||||||||
| NT$ | NT$ | NT$ | ||||||||||
| Proportion of the Group's ownership | 33.29 | % | 24.99 | % | 24.99 | % | ||||||
| Net assets attributable to the Group | $ | 21,400,373 | $ | 17,643,100 | $ | 17,302,763 | ||||||
| Adjustments for fair value of identifiable assets acquired | ||||||||||||
| Goodwill | 12,433,417 | 7,980,547 | 7,980,547 | |||||||||
| Tangible assets | 3,819,232 | 3,249,580 | 3,346,401 | |||||||||
| Intangible assets | 7,960,324 | 6,268,474 | 6,425,289 | |||||||||
| Carrying amount | $ | 45,613,346 | $ | 35,141,701 | $ | 35,055,000 | ||||||
(Concluded)
The above tangible assets and intangible assets are mainly depreciated or amortized over 10 years.
| For the Three Months Ended September 30, 2016 | For the Nine Months Ended September 30, 2016 | |||||||
| NT$ | NT$ | |||||||
| Operating revenue | $ | 21,955,188 | $ | 62,934,405 | ||||
| Gross profit | $ | 5,053,421 | $ | 14,121,937 | ||||
| Profit before income tax expense | $ | 3,159,859 | $ | 8,292,368 | ||||
| Net profit for the period | $ | 2,691,530 | $ | 7,104,261 | ||||
| Other comprehensive loss for the period | (1,286,112 | ) | (1,578,042 | ) | ||||
| Total comprehensive income for the period | $ | 1,405,418 | $ | 5,526,219 | ||||
| Cash dividends received from SPIL | $ | 3,941,740 | $ | 3,941,740 | ||||
| 8) | Aggregate information of associates that are not individually material |
For the Three Months Ended September 30 | For the Nine Months Ended September 30 | |||||||||||||||
| 2016 | 2015 | 2016 | 2015 | |||||||||||||
| NT$ | NT$ | NT$ | NT$ | |||||||||||||
| The Group's share of: | ||||||||||||||||
| Net profit (loss) for the period | $ | 10,508 | $ | 27,918 | $ | (29,002 | ) | $ | 110,449 | |||||||
| Other comprehensive income (loss) for the period | (6,815 | ) | (145,624 | ) | (37,574 | ) | (62,823 | ) | ||||||||
| Total comprehensive income (loss) for the period | $ | 3,693 | $ | (117,706 | ) | $ | (66,576 | ) | $ | 47,626 | ||||||
| 9) | Except for DECA, the investments accounted for using the equity method and the share of loss and other comprehensive loss for the investments in associates for the three months and nine months ended September 30, 2016 and 2015, respectively, was based on the associate’s financial statements reviewed by the auditors for the same period. Management believes there is no material impact on the equity method accounting or the calculation of the share of profit or loss and other comprehensive income, from the financial statements of DECA that have not been reviewed. |
- 27 -
| b. | Investments in joint ventures |
| 1) | The Group’s investment in joint ventures that are not individually material and were accounted for using the equity method consisted of ASE Embedded Electronics Inc. (“ASEEE”). In May 2015, the Group and TDK Corporation (“TDK”) entered into an agreement to establish a joint venture to invest in ASEEE. The Croup invested NT$618,097 thousand in August 2015 and participated ASEEE’s capital increase in cash with NT$146,903 thousand in September 2016. As of September 30, 2016, December 31, 2015 and September 30, 2015, the percentage of ownership are both 51%. ASEEE are located in ROC and engaged in the production of embedded substrate. According to the joint arrangement, the Group and TDK must act together to direct the relevant operating activities and, as a result, the Group does not control ASEEE. The investment in ASEEE is accounted for using the equity method. |
| 2) | Aggregate information of joint venture that is not individually material |
| For the Three Months Ended September 30 | For the Nine Months Ended September 30 | |||||||||||||||
| 2016 | 2015 | 2016 | 2015 | |||||||||||||
| NT$ | NT$ | NT$ | NT$ | |||||||||||||
| The Group's share of net loss and other comprehensive loss for the period | $ | (31,204 | ) | $ | (195 | ) | $ | (57,252 | ) | $ | (195 | ) | ||||
| 3) | The investments accounted for using the equity method and the share of loss and other comprehensive loss for the investments in the joint venture for the three months and nine months ended September 30, 2016 and 2015, respectively, was based on the joint venture’s financial statements reviewed by the auditors for the same period. |
| 14. | PROPERTY, PLANT AND EQUIPMENT |
The carrying amounts of each class of property, plant and equipment were as follows:
September 30, 2016 | December 31, 2015 | September 30, 2015 | ||||||||||
| NT$ | NT$ | NT$ | ||||||||||
| Land | $ | 3,339,803 | $ | 3,381,300 | $ | 3,382,574 | ||||||
| Buildings and improvements | 57,676,078 | 59,801,054 | 59,514,294 | |||||||||
| Machinery and equipment | 73,399,437 | 78,715,309 | 80,491,015 | |||||||||
| Other equipment | 1,841,436 | 1,814,994 | 1,737,466 | |||||||||
| Construction in progress and machinery in transit | 8,952,101 | 6,284,418 | 7,855,764 | |||||||||
| $ | 145,208,855 | $ | 149,997,075 | $ | 152,981,113 | |||||||
For the nine months ended September 30, 2016
| Land | Buildings and improvements | Machinery and equipment | Other equipment | Construction in progress and machinery in transit | Total | |||||||
| NT$ | NT$ | NT$ | NT$ | NT$ | NT$ | |||||||
| Cost | ||||||||||||
| Balance at January 1, 2016 | $ 3,381,300 | $ 94,447,932 | $ 243,283,607 | $ 7,722,408 | $ 6,397,760 | $355,233,007 | ||||||
| Additions | - | (19,825 ) | 100,380 | 76,145 | 21,128,121 | 21,284,821 |
(Continued)
- 28 -
| Land | Buildings and improvements | Machinery and equipment | Other equipment | Construction in progress and machinery �� in transit | Total | |||||||||||||||||||
| NT$ | NT$ | NT$ | NT$ | NT$ | NT$ | |||||||||||||||||||
| Disposals | $ | - | $ | (387,024 | ) | $ | (8,033,648 | ) | $ | (84,143 | ) | $ | (215,773 | ) | $ | (8,720,588 | ) | |||||||
| Reclassification | - | 3,316,244 | 14,388,566 | 594,599 | (18,299,584 | ) | (175 | ) | ||||||||||||||||
| Acquisitions through business combinations | - | - | - | 1,159 | - | 1,159 | ||||||||||||||||||
| Effect of foreign currency exchange differences | (41,497 | ) | (2,534,611 | ) | (4,762,613 | ) | (194,188 | ) | (42,550 | ) | (7,575,459 | ) | ||||||||||||
| Balance at September 30, 2016 | $ | 3,339,803 | $ | 94,822,716 | $ | 244,976,292 | $ | 8,115,980 | $ | 8,967,974 | $ | 360,222,765 | ||||||||||||
| Accumulated depreciation and impairment | ||||||||||||||||||||||||
| Balance at January 1, 2016 | $ | - | $ | 34,646,878 | $ | 164,568,298 | $ | 5,907,414 | $ | 113,342 | $ | 205,235,932 | ||||||||||||
| Depreciation expense | - | 3,845,108 | 17,236,723 | 612,940 | - | 21,694,771 | ||||||||||||||||||
| Impairment losses recognized | - | 620 | 876,153 | 5,564 | 4,509 | 886,846 | ||||||||||||||||||
| Disposals | - | (332,480 | ) | (7,790,959 | ) | (76,588 | ) | (100,049 | ) | (8,300,076 | ) | |||||||||||||
| Reclassification | - | (5,200 | ) | 2,979 | 2,221 | - | - | |||||||||||||||||
| Acquisitions through business combinations | - | - | - | 824 | - | 824 | ||||||||||||||||||
| Effect of foreign currency exchange differences | - | (1,008,288 | ) | (3,316,339 | ) | (177,831 | ) | (1,929 | ) | (4,504,387 | ) | |||||||||||||
| Balance at September 30, 2016 | $ | - | $ | 37,146,638 | $ | 171,576,855 | $ | 6,274,544 | $ | 15,873 | $ | 215,013,910 | ||||||||||||
(Concluded)
For the nine months ended September 30, 2015
| Land | Buildings and improvements | Machinery and equipment | Other equipment | Construction in progress and machinery in transit | Total | |||||||||||||||||||
| NT$ | NT$ | NT$ | NT$ | NT$ | NT$ | |||||||||||||||||||
| Cost | ||||||||||||||||||||||||
| Balance at January 1,2015 | $ | 3,348,018 | $ | 86,725,254 | $ | 233,669,627 | $ | 7,182,574 | $ | 5,862,217 | $ | 336,787,690 | ||||||||||||
| Additions | - | 53,050 | 173,239 | 204,926 | 22,698,232 | 23,129,447 | ||||||||||||||||||
| Disposals | - | (202,257 | ) | (5,877,465 | ) | (203,255 | ) | (8,992 | ) | (6,291,969 | ) | |||||||||||||
| Reclassification | - | 6,638,011 | 14,094,445 | 289,476 | (20,893,867 | ) | 128,065 | |||||||||||||||||
| Effect of foreign currency exchange differences | 34,556 | 34,066 | 31,141 | 40,687 | 207,628 | 348,078 | ||||||||||||||||||
| Balance at September 30,2015 | $ | 3,382,574 | $ | 93,248,124 | $ | 242,090,987 | $ | 7,514,408 | $ | 7,865,218 | $ | 354,101,311 | ||||||||||||
| Accumulated depreciation and impairment | ||||||||||||||||||||||||
| Balance at January 1, 2015 | $ | - | $ | 30,329,544 | $ | 149,497,980 | $ | 5,365,887 | $ | 7,164 | $ | 185,200,575 | ||||||||||||
| Depreciation expense | - | 3,537,606 | 17,636,686 | 576,456 | - | 21,750,748 | ||||||||||||||||||
| Impairment losses recognized | - | 117,646 | 31,155 | - | 2,290 | 151,091 | ||||||||||||||||||
| Disposals | - | (185,390 | ) | (5,693,081 | ) | (196,852 | ) | - | (6,075,323 | ) | ||||||||||||||
| Reclassification | - | 322 | 601 | (4,102 | ) | - | (3,179 | ) | ||||||||||||||||
| Effect of foreign currency exchange differences | - | (65,898 | ) | 126,631 | 35,553 | - | 96,286 | |||||||||||||||||
| Balance at September 30, 2015 | $ | - | $ | 33,733,830 | $ | 161,599,972 | $ | 5,776,942 | $ | 9,454 | $ | 201,120,198 | ||||||||||||
Due to the Group’s future operation plans and capacity evaluation or production demands in segment of packaging and testing, the Group believed that a portion of property, plant and equipment was not used and recognized an impairment loss of NT$ 372,299 thousand, NT$134,890 thousand, NT$886,846 thousand and NT$151,091 thousand under the line item of other gains (losses) in the consolidated statements of comprehensive income for the three months and nine months ended September 30, 2016 and 2015, respectively. The recoverable amount of a portion of the impaired property, plant and equipment is determined by its fair value less costs of disposal, of which the fair value is based on the quoted prices of assets with similar obsolescence that provided by the vendors in market. The recent quoted prices of assets are a Level 3 input in terms of IFRS 13 because the market is not very active. The recoverable amount of the other portion of the impaired property, plant and equipment is determined on the basis of its value in use. The Group expects to derive zero future cash flows from these assets.
Each class of property, plant and equipment was depreciated on a straight-line basis over the following useful lives:
- 29 -
| Buildings and improvements | ||||
| Main plant buildings | 10-40 years | |||
| Cleanrooms | 10-20 years | |||
| Others | 3-20 years | |||
| Machinery and equipment | 2-10 years | |||
| Other equipment | 2-20 years |
The capitalized borrowing costs for the three months and nine months ended September 30, 2016 and 2015, respectively, are disclosed in Note 23.
| 15. | GOODWILL |
| Cost | Accumulated impairment | Carrying amount | ||||||||||
| NT$ | NT$ | NT$ | ||||||||||
| Balance at January 1, 2016 | $ | 12,495,515 | $ | 1,988,996 | $ | 10,506,519 | ||||||
| Acquisitions through business combinations | 83,892 | - | 83,892 | |||||||||
| Effect of foreign currency exchange differences | (77,963 | ) | - | (77,963 | ) | |||||||
| Balance at September 30, 2016 | $ | 12,501,444 | $ | 1,988,996 | $ | 10,512,488 | ||||||
| Balance at January 1, 2015 | $ | 12,434,411 | $ | 1,988,996 | $ | 10,445,415 | ||||||
| Effect of foreign currency exchange differences | 63,855 | - | 63,855 | |||||||||
| Balance at September 30, 2015 | $ | 12,498,266 | $ | 1,988,996 | $ | 10,509,270 | ||||||
| 16. | OTHER INTANGIBLE ASSETS |
The carrying amounts of each class of other intangible assets were as follows:
September 30, 2016 | December 31, 2015 | September 30, 2015 | ||||||||||
| NT$ | NT$ | NT$ | ||||||||||
| Customer relationships | $ | 214,167 | $ | 274,402 | $ | 343,625 | ||||||
| Computer software | 954,310 | 953,322 | 954,350 | |||||||||
| Patents and acquired specific technology | 411,530 | 15,696 | 16,249 | |||||||||
| Others | 124,662 | 138,673 | 135,063 | |||||||||
| $ | 1,704,669 | $ | 1,382,093 | $ | 1,449,287 | |||||||
For the nine months ended September 30, 2016
| Customer relationships | Computer software | Patents and acquired specific technology | Others | Total | ||||||||||||||||
| NT$ | NT$ | NT$ | NT$ | NT$ | ||||||||||||||||
| Cost | ||||||||||||||||||||
| Balance at January 1, 2016 | $ | 915,636 | $ | 3,338,360 | $ | 154,082 | $ | 193,338 | $ | 4,601,416 | ||||||||||
| Additions (Note 33) | - | 282,739 | 403,543 | 1,246 | 687,528 | |||||||||||||||
(Continued)
- 30 -
| Customer relationships | Computer software | Patents and acquired specific technology | Others | Total | ||||||||||||||||
| NT$ | NT$ | NT$ | NT$ | NT$ | ||||||||||||||||
| Disposals | $ | - | $ | (36,452 | ) | $ | (30 | ) | $ | - | $ | (36,572 | ) | |||||||
| Acquisitions through business combinations | - | - | 1,074 | 30 | 1,104 | |||||||||||||||
| Effect of foreign currency exchange differences | - | (65,196 | ) | (4,318 | ) | (2,327 | ) | (71,841 | ) | |||||||||||
| Balance at September 30, 2016 | $ | 915,636 | $ | 3,519,361 | $ | 554,351 | $ | 192,287 | $ | 5,181,635 | ||||||||||
| Accumulated amortization | ||||||||||||||||||||
| Balance at January 1, 2016 | $ | 641,234 | $ | 2,385,038 | $ | 138,386 | $ | 54,665 | $ | 3,219,323 | ||||||||||
| Amortization expense | 60,235 | 260,597 | 9,938 | 13,098 | 343,868 | |||||||||||||||
| Disposals | - | (28,772 | ) | (30 | ) | - | (28,802 | ) | ||||||||||||
| Acquisitions through business combinations | - | - | 483 | 23 | 506 | |||||||||||||||
| Effect of foreign currency exchange differences | - | (51,812 | ) | (5,956 | ) | (161 | ) | (57,929 | ) | |||||||||||
| Balance at September 30, 2016 | $ | 701,469 | $ | 2,565,051 | $ | 142,821 | $ | 67,625 | $ | 3,476,966 | ||||||||||
(Concluded)
For the nine months ended September 30, 2015
| Customer relationships | Computer software | Patents and acquired specific technology | Others | Total | ||||||||||||||||
| NT$ | NT$ | NT$ | NT$ | NT$ | ||||||||||||||||
| Cost | ||||||||||||||||||||
| Balance at January 1, 2015 | $ | 1,579,015 | $ | 2,882,932 | $ | 2,139,138 | $ | 184,409 | $ | 6,785,494 | ||||||||||
| Additions | - | 392,235 | 209 | 1,063 | 393,507 | |||||||||||||||
| Disposals or derecognization | - | (2,941 | ) | (1,983,914 | ) | (205 | ) | (1,987,060 | ) | |||||||||||
| Reclassification | - | 15,034 | - | - | 15,034 | |||||||||||||||
| Effect of foreign currency exchange differences | - | (15,596 | ) | (17 | ) | 121 | (15,492 | ) | ||||||||||||
| Balance at September 30, 2015 | $ | 1,579,015 | $ | 3,271,664 | $ | 155,416 | $ | 185,388 | $ | 5,191,483 | ||||||||||
| Accumulated amortization | ||||||||||||||||||||
| Balance at January 1, 2015 | $ | 1,077,514 | $ | 2,084,805 | $ | 2,118,254 | $ | 37,050 | $ | 5,317,623 | ||||||||||
| Amortization expense | 157,876 | 242,100 | 8,382 | 13,114 | 421,472 | |||||||||||||||
(Continued)
- 31 -
| Customer relationships | Computer software | Patents and acquired specific technology | Others | Total | ||||||||||||||||
| NT$ | NT$ | NT$ | NT$ | NT$ | ||||||||||||||||
| Disposals or derecognization | $ | - | $ | (2,245 | ) | $ | (1,983,914 | ) | $ | - | $ | (1,986,159 | ) | |||||||
| Reclassification | - | 3,160 | - | - | 3,160 | |||||||||||||||
| Effect of foreign currency exchange differences | - | (10,506 | ) | (3,555 | ) | 161 | (13,900 | ) | ||||||||||||
| Balance at September 30, 2015 | $ | 1,235,390 | $ | 2,317,314 | $ | 139,167 | $ | 50,325 | $ | 3,742,196 | ||||||||||
(Concluded)
Each class of other intangible assets, except a portion of customer relationships amortized based on the pattern in which the economic benefits are consumed, were amortized on the straight-line basis over the following useful lives:
| Customer relationships | 11 years | |||
| Computer software | 2-5 years | |||
| Patents and acquired specific technology | 5-15 years | |||
| Others | 5-32 years |
| 17. | LONG-TERM PREPAYMENTS FOR LEASE |
Long-term prepayments for lease mainly represent land use right located in China with periods for use from 50 to 70 years.
| 18. | BORROWINGS |
| a. | Short-term borrowings |
Short-term borrowings mainly represented unsecured revolving bank loans with annual interest rates at 0.21%-7.98%, 0.57%-5.78% and 0.60%-5.78% as of September 30, 2016, December 31, 2015 and September 30, 2015, respectively.
| b. | Short-term bills payable – only as of September 30, 2016 and December 31, 2015 |
September 30, 2016 | December 31, 2015 | |||||||
| NT$ | NT$ | |||||||
| Commercial papers | $ | 2,000,000 | $ | 4,350,000 | ||||
| Less: unamortized discounts | 658 | 1,946 | ||||||
| $ | 1,999,342 | $ | 4,348,054 | |||||
| Annual interest rate | 0.67 | % | 0.78 | % | ||||
- 32 -
| c. | Long-term borrowings |
| 1) | Bank loans |
As of September 30, 2016, December 31, 2015 and September 30, 2015, the long-term bank loans with fixed interest rates were NT$1,500,000 thousand, NT$1,500,000 thousand and NT$378,005 thousand, respectively, with annual interest rates at 1.17%, 1.17% and 0.90%, respectively. The long-term bank loans with fixed interest rate will be repayable through December 2018. The others with floating interest rates consisted of the followings:
September 30, 2016 | December 31, 2015 | September 30, 2015 | ||||||||||
| NT$ | NT$ | NT$ | ||||||||||
| Working capital bank loans | ||||||||||||
| Syndicated bank loans - repayable through January 2017 to July 2018, annual interest rates were 1.94%, 1.56%-1.92% and 1.38%-1.88% as of September 30, 2016, December 31, 2015 and September 30, 2015, respectively | $ | 8,968,960 | $ | 12,159,037 | $ | 12,509,007 | ||||||
| Others - repayable through October 2016 to August 2019, annual interest rates were 0.74%-4.33%, 0.90%-3.98% and 0.90%-3.83% as of September 30, 2016, December 31, 2015 and September 30, 2015, respectively | 33,147,893 | 25,660,638 | 24,590,640 | |||||||||
| Mortgage loans | ||||||||||||
| Repayable through December 2016 to June 2023, annual interest rates were 4.95%-5.39%, 4.95%-5.39% and 5.66%-5.71% as of September 30, 2016, December 31, 2015 and September 30, 2015, respectively | 4,607,809 | 3,251,139 | 2,955,629 | |||||||||
| 46,724,662 | 41,070,814 | 40,055,276 | ||||||||||
| Less: unamortized arrangement fee | 9,596 | 18,670 | 21,852 | |||||||||
| 46,715,066 | 41,052,144 | 40,033,424 | ||||||||||
| Less: current portion | 6,272,817 | 2,057,465 | 2,025,374 | |||||||||
| $ | 40,442,249 | $ | 38,994,679 | $ | 38,008,050 | |||||||
Pursuant to the above syndicated bank loans agreements, the Company and some of its subsidiaries should maintain certain financial covenants including current ratio, leverage ratio, tangible net assets and interest coverage ratio. Such financial ratios are calculated based on the Group’s annual audited consolidated financial statements or semi-annual reviewed consolidated financial statements or subsidiaries’ annual audited financial statements. The Group was in compliance with all of the loan covenants as of June 30, 2016 and December 31, 2015. The Company’s subsidiaries were in compliance with all of the loan covenants as of December 31, 2015.
The Group had sufficient long term credit facility obtained before December 31, 2015 to refinance a portion of loans on a long-term basis. Therefore, NT$2,105,883 thousand were not classified as current portion of long-term borrowings as of December 31, 2015.
- 33 -
| 2) | Bills payable-only as of September 30, 2016 and December 31, 2015 |
September 30, 2016 | December 31, 2015 | |||||||
| NT$ | NT$ | |||||||
| Commercial papers | $ | 2,000,000 | $ | 2,000,000 | ||||
| Less: unamortized discounts | 1,062 | 1,011 | ||||||
| $ | 1,998,938 | $ | 1,998,989 | |||||
| Annual interest rate | 0.97 | % | 1.03 | % | ||||
The commercial paper contract was entered into with Ta Ching Bills Finance Corporation in December 2015 and the duration is three years.
| 19. | BONDS PAYABLE |
September 30, 2016 | December 31, 2015 | September 30, 2015 | ||||||||||
| NT$ | NT$ | NT$ | ||||||||||
| Unsecured domestic bonds | ||||||||||||
| Repayable at maturity in January 2021 and interest due annually with annual interest rate at 1.30% | $ | 7,000,000 | $ | - | $ | - | ||||||
| Repayable at maturity in January 2023 and interest due annually with annual interest rate at 1.50% | 2,000,000 | - | - | |||||||||
| Unsecured convertible overseas bonds | ||||||||||||
| US$400,000 thousand | 12,544,000 | 13,130,000 | 13,148,000 | |||||||||
| US$200,000 thousand (linked to New Taiwan dollar) | 6,185,600 | 6,185,600 | 6,185,600 | |||||||||
| Secured overseas bonds - secured by the Company | ||||||||||||
| US$300,000 thousand, repayable at maturity in July 2017; interest due semi-annually with annual interest rate at 2.125% | 9,408,000 | 9,847,500 | 9,861,000 | |||||||||
| CNY500,000 thousand, with annual interest rate at 4.25% and repaid in September 2016 | - | 2,527,489 | 2,583,591 | |||||||||
| Secured domestic bonds - secured by banks | ||||||||||||
| With annual interest rate at 1.45% and repaid in August 2016 | - | 8,000,000 | 8,000,000 | |||||||||
| 37,137,600 | 39,690,589 | 39,778,191 | ||||||||||
| Less: discounts on bonds payable | 881,000 | 1,264,339 | 1,395,543 | |||||||||
| 36,256,600 | 38,426,250 | 38,382,648 | ||||||||||
| Less: current portion | 9,384,865 | 14,685,866 | 2,578,343 | |||||||||
| $ | 26,871,735 | $ | 23,740,384 | $ | 35,804,305 | |||||||
The Group had sufficient long term credit facility obtained before December 31, 2015 to refinance a portion of the bonds payable on a long-term basis. Therefore, NT$8,000,000 thousand was not classified as current portion of bonds payable as of December 31, 2015.
- 34 -
| a. | In September 2013, the Company offered the third unsecured convertible overseas bonds (the “Bonds”) in US$400,000 thousand. The Bonds is zero coupon bonds with the maturity of 5 years, in denominations of US$200 thousand or in any integral multiples thereof. Each holder of the Bonds has the right at any time on or after October 16, 2013 and up to (and including) August 26, 2018, except during legal lock-up period, to convert the Bonds into newly issued listed common shares at the conversion price NT$33.085, determined on the basis of a fixed exchange rate of US$1 to NT$29.956. The conversion price will be adjusted in accordance with the conversion provisions due to anti-dilution clause. As of September 30, 2106, December 31, 2015 and September 30, 2015, the conversion price was NT$28.99, NT$30.28 and NT$30.28, respectively. |
The Bonds may be redeemed at the option of the Company, in whole or in part, at any time on or after the third anniversary of the offering date provided that (1) the closing price, translated into U.S. dollars, of the common shares for a period of 20 consecutive trading days is at least 130% of the conversion price, (2) at least 90% in aggregate principal amount of the Bonds originally outstanding has been redeemed, repurchased and canceled or converted, or (3) the Company is required to pay additional taxes on the Bonds as a result of certain changes in tax laws in the ROC.
Each holder shall have the right to request the Company repurchase all or any portion of the principal amount thereof of a holder’s Bonds (1) on the third anniversary of the offering date, (2) in the event of a change of control, or (3) in the event of delisting.
The Bonds contained a debt host contract, recognized as bonds payable, and the conversion option, redemption option and put option (collectively the “Bonds Options”) aggregately recognized as financial liabilities at FVTPL. The effective interest rate of the debt host contract was 3.16% and the aggregate fair value of the Bonds Options was NT$1,667,950 thousand on initial recognition.
| b. | In July 2015, the Company offered the forth unsecured convertible overseas bonds (the “Currency Linked Bonds”) in US$200,000 thousand. The Currency Linked Bonds is zero coupon bonds with the maturity of 2.75 years, in denominations of US$200 thousand or in any integral multiples thereof. Repayment, redemption and put amount denominated in U.S. dollar will be converted into New Taiwan dollar amount using a fixed exchange rate of US$1 to NT$30.928 (the “Fixed Exchange Rate”) and then converted back to U.S. dollar amount using the applicable prevailing rate at the time of repayment, redemption or put. Each holder of the Currency Linked Bonds has the right at any time on or after August 11, 2015 and up to (and including) March 17, 2018, except during legal lock-up period, to convert the Currency Linked Bonds into common shares at the conversion price NT$54.55, determined on the basis of the Fixed Exchange Rate. The Company’s treasury shares will be available for delivery upon conversion of the Currency Linked Bonds. The conversion price will be adjusted in accordance with the conversion provisions due to anti-dilution clause. As of September 30, 2016, December 31, 2015 and September 30, 2015 the conversion price was NT$49.52, NT$51.73 and NT$51.73, respectively. |
The Currency Linked Bonds may be redeemed at the option of the Company, in whole or in part, at any time on or after March 19, 2018 provided that (1) the closing price, translated into U.S. dollars, of the common shares for a period of 20 out of 30 consecutive trading days is at least 130% of the conversion price, (2) at least 90% in aggregate principal amount of the Currency Linked Bonds originally outstanding has been redeemed, repurchased and canceled or converted, or (3) the Company is required to pay additional taxes on the Currency Linked Bonds as a result of certain changes in tax laws in the ROC.
Each holder shall have the right to request the Company repurchase all or any portion of the principal amount thereof of a holder’s Currency Linked Bonds (1) in the event of a change of control, or (2) in the event of delisting.
The Currency Linked Bonds contained a debt host contract, recognized as bonds payable, and the conversion option, recognized as capital surplus. The effective interest rate of the debt host contract was 1.58% and the fair value of the conversion option was NT$214,022 thousand on initial recognition.
- 35 -
| c. | To focus on corporate sustainability and to carry out the commitment to environmental protection and energy conservation, Anstock II Limited, a subsidiary the Company 100% owned, offered overseas bonds in US$300,000 thousand with the maturity of three years and annual interest rate of 2.125% (the “Green Bonds”) in July 2014. The Green Bonds were unconditionally and irrevocably guaranteed by the Company and the proceeds were used to fund certain eligible projects to promote the Group’s transition to low-carbon and climate resilient growth. |
| 20. | OTHER PAYABLES |
September 30, 2016 | December 31, 2015 | September 30, 2015 | ||||||||||
| NT$ | NT$ | NT$ | ||||||||||
| Accrued salary and bonus | $ | 5,900,872 | $ | 5,826,982 | $ | 5,295,141 | ||||||
| Payables for property, plant and equipment | 5,607,586 | 4,782,357 | 5,272,576 | |||||||||
| Accrued employees’ compensation and remuneration to directors and supervisors | 1,577,483 | 2,270,608 | 1,703,539 | |||||||||
| Accrued employee insurance | 623,069 | 599,218 | 633,550 | |||||||||
| Accrued utilities | 446,717 | 466,956 | 480,628 | |||||||||
| Accrued patents and acquired specific technology | 117,600 | - | - | |||||||||
| Others | 5,601,862 | 5,248,697 | 5,011,317 | |||||||||
| $ | 19,875,189 | $ | 19,194,818 | $ | 18,396,751 | |||||||
| 21. | RETIREMENT BENEFIT PLANS |
The Group’s retirement benefit plans consisted of defined contribution retirement plan and defined benefit retirement plan. Employee benefit expenses in respect of the Group’s defined benefit retirement plans were calculated using the projected pension cost stated in 2015 and 2014 actuarial reports and recognized in the following line items in respective periods:
For the Three Months Ended September 30 | For the Nine Months Ended September 30 | |||||||||||||||
| 2016 | 2015 | 2016 | 2015 | |||||||||||||
| NT$ | NT$ | NT$ | NT$ | |||||||||||||
| Operating costs | $ | 77,226 | $ | 78,107 | $ | 229,241 | $ | 238,824 | ||||||||
| Selling and marketing expenses | 2,512 | 2,485 | 7,469 | 7,598 | ||||||||||||
| General and administrative expenses | 11,839 | 11,409 | 34,842 | 34,505 | ||||||||||||
| Research and development expenses | 8,691 | 9,476 | 25,873 | 28,663 | ||||||||||||
| $ | 100,268 | $ | 101,477 | $ | 297,425 | $ | 309,590 | |||||||||
- 36 -
| 22. | EQUITY |
| a. | Share capital |
Ordinary shares
September 30, 2016 | December 31, 2015 | September 30, 2015 | ||||||||||
| Numbers of shares authorized (in thousands) | 10,000,000 | 10,000,000 | 10,000,000 | |||||||||
| Numbers of shares reserved (in thousands) | ||||||||||||
| Employee share options | 800,000 | 800,000 | 800,000 | |||||||||
| Shares capital authorized | $ | 100,000,000 | $ | 100,000,000 | $ | 100,000,000 | ||||||
| Shares capital reserved | ||||||||||||
| Employee share options | $ | 8,000,000 | $ | 8,000,000 | $ | 8,000,000 | ||||||
| Numbers of shares registered (in thousands) | 7,923,623 | 7,902,929 | 7,893,158 | |||||||||
| Numbers of shares subscribed in advance (in thousands) | 13,067 | 7,499 | 10,085 | |||||||||
| Number of shares issued and fully paid (in thousands) | 7,936,690 | 7,910,428 | 7,903,243 | |||||||||
The holders of issued ordinary shares with a par value at $10 per share are entitled the right to vote and receive dividends, except the shares held by the Group’s subsidiaries which are not entitled the right to vote. As of September 30, 2016, December 31, 2015 and September 30, 2015, there were 500,000 thousand ordinary shares included in the authorized shares that were not yet required to complete the share registration process.
American Depositary Receipts
The Company issued ADSs and each ADS represents five ordinary shares. As of September 30, 2016, December 31, 2015 and September 30, 2015, 125,518 thousand, 115,240 thousand and 115,854 thousand ADSs were outstanding and represented approximately 627,590 thousand, 576,198 thousand and 579,271 thousand ordinary shares of the Company, respectively.
| b. | Capital surplus |
September 30, 2016 | December 31, 2015 | September 30, 2015 | ||||||||||
| NT$ | NT$ | NT$ | ||||||||||
| May be used to offset a deficit, distributed as cash dividends, or transferred to share capital (1) | ||||||||||||
| Arising from issuance of ordinary shares | $ | 5,704,731 | $ | 5,479,616 | $ | 5,374,259 | ||||||
| Arising from the difference between consideration received and the carrying amount of the subsidiaries’ net assets during actual disposal or acquisition | 7,176,958 | 7,197,510 | 7,197,510 | |||||||||
(Continued)
- 37 -
September 30, 2016 | December 31, 2015
| September 30, 2015 | ||||||||||
| NT$ | NT$ | NT$ | ||||||||||
| May be used to offset a deficit only | ||||||||||||
| Arising from changes in percentage of ownership interest in subsidiaries (2) | $ | 6,577,097 | $ | 8,489,984 | $ | 9,050,793 | ||||||
| Arising from treasury share transactions | 950,368 | 717,355 | 717,355 | |||||||||
| Arising from exercised employee share options | 597,869 | 544,112 | 510,556 | |||||||||
| Arising from expired employee share options | 3,626 | 3,626 | 3,626 | |||||||||
| Arising from share of changes in capital surplus of associates | 38,567 | 30,284 | 33,496 | |||||||||
| May not be used for any purpose | ||||||||||||
| Arising from employee share options | 1,198,714 | 1,080,590 | 1,056,084 | |||||||||
| Arising from equity component of convertible bonds | 214,022 | 214,022 | 214,022 | |||||||||
| $ | 22,461,952 | $ | 23,757,099 | $ | 24,157,701 | |||||||
(Concluded)
| 1) | Such capital surplus may be used to offset a deficit; in addition, when the Company has no deficit, such capital surplus may be distributed as cash dividends or transferred to share capital (limited to a certain percentage of the Company’s capital surplus and once a year). |
| 2) | Such capital surplus arises from the effect of changes in ownership interest in a subsidiary resulted from equity transactions other than actual disposal or acquisition, or from changes in capital surplus of subsidiaries accounted for by using equity method. |
| c. | Retained earnings and dividend policy |
In accordance with the amendments to the Company Act in May 2015, the recipients of dividends and bonuses are limited to shareholders and do not include employees. The consequential amendments to the Company’s Articles of Incorporation had been proposed for 2015 resolved at the Company’s annual shareholders’ meetings. For information about the accrual basis of the employees’ compensation and remuneration to directors and the actual appropriations, please refer to employee benefits expense under profit before income tax in Note 23(e).
The amended Articles of Incorporation of ASE Inc. (the “Articles”) in June, 2016 provides that annual net income shall be distributed in the following order:
| 1) | Replenishment of deficits; |
| 2) | 10.0% as legal reserve; |
| 3) | Special reserve appropriated or reversed in accordance with laws or regulations set forth by the authorities concerned; |
| 4) | Addition or deduction of realized gains or losses on equity instruments at fair value through other comprehensive income. |
- 38 -
The Company is currently in the mature growth stage. To meet the capital needs for business development now and in the future and satisfy the shareholders’ demand for cash inflows, the Company shall use residual dividend policy to distribute dividends, of which the cash dividend is not lower than 30% of the total dividend distribution, with the remainder to be distributed in stock. A distribution plan is also to be made by the board of directors and passed for resolution in the shareholders’ meeting.
Appropriation of earnings to legal reserve shall be made until the legal reserve equals the Company’s capital surplus. Legal reserve may be used to offset deficits. If the Company has no deficit and the legal reserve has exceeded 25% of the Company’s capital surplus, the excess may be transferred to capital or distributed in cash.
Under Rule No. 1010012865 and Rule No. 1010047490 issued by the FSC and the directive titled “Questions and Answers for Special Reserves Appropriated Following Adoption of IFRSs”, the Company should appropriate or reverse to a special reserve.
Expect for non-ROC resident shareholders, all shareholders receiving the dividends are allowed a tax credit equal to their proportionate share of the income tax paid by the Company.
The appropriations of earnings for 2015 and 2014 resolved at the Company’s annual shareholders’ meetings in June 2016 and June 2015, respectively, were as follows:
| Appropriation of Earnings | Dividends Per Share | |||||||||||
| For Year 2015 | For Year 2014 | For Year 2015 | For Year 2014 | |||||||||
| NT$ | NT$ | NT$ | NT$ | |||||||||
| (in dollars) | (in dollars) | |||||||||||
| Legal reserve | $ | 1,947,887 | $ | 2,359,267 | ||||||||
| Cash dividends | 12,476,779 | 15,589,825 | $1.60 | $2.00 | ||||||||
| $ | 14,424,666 | $ | 17,949,092 | |||||||||
| d. | Others equity |
| 1) | Exchange differences on translating foreign operations |
| 2016 | 2015 | |||||||
| NT$ | NT$ | |||||||
| Balance at January 1 | $ | 4,493,570 | $ | 4,541,761 | ||||
| Exchange differences arising on translating foreign operations | (6,147,51 9) | 1,262,015 | ||||||
| Share of exchange difference of associates accounted for using the equity method | (301,327 | ) | 12 | |||||
| Balance at September 30 | $ | (1,955,276 | ) | $ | 5,803,788 | |||
| 2) | Unrealized gain on available-for-sale financial assets |
| 2016 | 2015 | |||||||
| NT$ | NT$ | |||||||
| Balance at January 1 | $ | 588,119 | $ | 526,778 | ||||
| Unrealized loss arising on revaluation of available-for-sale financial assets | (62,028 | ) | (37,190 | ) | ||||
(Continued)
- 39 -
| 2016 | 2015 | |||||||
| NT$ | NT$ | |||||||
| Cumulative loss reclassified to profit or loss on disposal of available-for-sale financial assets | $ | 7,512 | $ | 11,495 | ||||
| Unrealized loss on available-for-sale financial assets of associates accounted for using the equity method | (233,717 | ) | (62,835 | ) | ||||
| Balance at September 30 | $ | 299,886 | $ | 438,248 | ||||
(Concluded)
| e. | Treasury shares (in thousand shares) |
| Beginning | Ending | |||||||||||||||
| Balance | Addition | Decrease | Balance | |||||||||||||
| For the nine months ended September 30, 2016 | ||||||||||||||||
| Shares held by subsidiaries | 145,883 | - | - | 145,883 | ||||||||||||
| Shares reserved for bonds conversion | 120,000 | - | - | 120,000 | ||||||||||||
| 265,883 | - | - | 265,883 | |||||||||||||
| For the nine months ended September 30, 2015 | ||||||||||||||||
| Shares held by subsidiaries | 145,883 | - | - | 145,883 | ||||||||||||
| Shares reserved for bonds conversion | - | 120,000 | - | 120,000 | ||||||||||||
| 145,883 | 120,000 | - | 265,883 | |||||||||||||
In February 2015, the board of directors approved to repurchase up to 120,000 thousand of the Company’s ordinary shares which will be used for equity conversion of convertible overseas bonds in the future. The Company has completed the repurchase during March 2015 and the shares repurchased accounted for 1.53% of the Company’s total issued shares. The average repurchase price was NT$44.45 per share.
The Company’s shares held by its subsidiaries at each balance sheet date were as follows:
Shares Held By Subsidiaries | Carrying amount | Fair Value | ||||||||||
| (in thousand shares) | NT$ | NT$ | ||||||||||
| September 30, 2016 | ||||||||||||
| ASE Test | 88,200 | $ | 1,380,721 | $ | 3,316,338 | |||||||
| J&R Holding | 46,704 | 381,709 | 1,756,061 | |||||||||
| ASE Test, Inc. | 10,979 | 196,677 | 412,802 | |||||||||
| 145,883 | $ | 1,959,107 | $ | 5,485,201 | ||||||||
(Continued)
- 40 -
Shares Held By Subsidiaries | Carrying amount | Fair Value | ||||||||||
| (in thousand shares) | NT$ | NT$ | ||||||||||
| December 31, 2015 | ||||||||||||
| ASE Test | 88,200 | $ | 1,380,721 | $ | 3,351,618 | |||||||
| J&R Holding | 46,704 | 381,709 | 1,774,743 | |||||||||
| ASE Test, Inc. | 10,979 | 196,677 | 417,193 | |||||||||
| 145,883 | $ | 1,959,107 | $ | 5,543,554 | ||||||||
| September 30, 2015 | ||||||||||||
| ASE Test | 88,200 | $ | 1,380,721 | $ | 3,113,476 | |||||||
| J&R Holding | 46,704 | 381,709 | 1,648,643 | |||||||||
| ASE Test, Inc. | 10,979 | 196,677 | 387,551 | |||||||||
| 145,883 | $ | 1,959,107 | $ | 5,149,670 | ||||||||
(Concluded)
Fair values of the Company’s shares held by subsidiaries are based on the closing price from an available published price quotation, which is a Level 1 input in terms of IFRS 13, at the balance sheet dates.
The Company issued ordinary shares in connection with its merger with its subsidiaries. The shares held by its subsidiaries were reclassified from investments accounted for using the equity method to treasury shares on the proportion owned by the Company.
Under the Securities and Exchange Act in the ROC, the Company shall neither pledge treasury shares nor exercise shareholders’ rights on these shares, such as rights to dividends and voting. The subsidiaries holding treasury shares, however, retain shareholders’ rights except the rights to participate in any share issuance for cash and voting.
| f. | Non-controlling interests |
| 2016 | 2015 | |||||||
| NT$ | NT$ | |||||||
| Balance at January 1 | $ | 11,503,878 | $ | 8,219,098 | ||||
| Attributable to non-controlling interests: | ||||||||
| Share of profit for the period | 839,378 | 647,695 | ||||||
| Exchange difference on translating foreign operations | (596,012 | ) | 107,617 | |||||
| Unrealized gain on available-for-sale financial assets | 1,547 | 3,282 | ||||||
| Non-controlling interest arising from acquisition of subsidiaries (Note 27) | 7,021 | - | ||||||
| Partial disposal of interests in subsidiaries (Note 28) | 26,436 | 1,712,836 | ||||||
| Repurchase of outstanding ordinary shares of subsidiaries (Note 28) | (912,886 | ) | - | |||||
| Spin-off of subsidiaries | - | 3,535 | ||||||
(Continued)
- 41 -
| 2016 | 2015 | |||||||
| NT$ | NT$ | |||||||
| Non-controlling interest relating to issue of ordinary shares under employee share options | $ | 425,523 | $ | 292,233 | ||||
| Cash dividends to non-controlling interests | (236,426 | ) | (232,148 | ) | ||||
| Balance at September 30 | $ | 11,058,459 | $ | 10,754,148 | ||||
(Concluded)
| 23. | PROFIT BEFORE INCOME TAX |
| a. | Other income |
For the Three Months Ended September 30 | For the Nine Months Ended September 30 | |||||||||||||||
| 2016 | 2015 | 2016 | 2015 | |||||||||||||
| NT$ | NT$ | NT$ | NT$ | |||||||||||||
| Government subsidy | $ | 94,227 | $ | 34,814 | $ | 219,725 | $ | 114,333 | ||||||||
| Interest income | 57,429 | 75,885 | 171,615 | 192,162 | ||||||||||||
| Rental income | 13,144 | 15,004 | 38,096 | 44,779 | ||||||||||||
| Dividends income | 2,894 | 1,654 | 20,625 | 74,374 | ||||||||||||
| $ | 167,694 | $ | 127,357 | $ | 450,061 | $ | 425,648 | |||||||||
| b. | Other gains (losses) |
For the Three Months Ended September 30 | For the Nine Months Ended September 30 | |||||||||||||||
| 2016 | 2015 | 2016 | 2015 | |||||||||||||
| NT$ | NT$ | NT$ | NT$ | |||||||||||||
| Net gains (losses) arising on financial instruments held for trading | $ | (2,056,755 | ) | $ | 4,006,972 | $ | (1,657,476 | ) | $ | 2,452,527 | ||||||
| Net gains on financial assets designated as at FVTPL | 58,947 | 491,548 | 165,319 | 743,746 | ||||||||||||
| Foreign exchange gains (losses), net | 1,592,864 | (2,520,549 | ) | 2,235,621 | (1,141,608 | ) | ||||||||||
| Impairment losses | (374,185 | ) | (134,890 | ) | (888,732 | ) | (151,091 | ) | ||||||||
| Others | 138,895 | 2,850 | 136,987 | 23,251 | ||||||||||||
| $ | (640,234 | ) | $ | 1,845,931 | $ | (8,281 | ) | $ | 1,926,825 | |||||||
| c. | Finance costs |
For the Three Months Ended September 30 | For the Nine Months Ended September 30 | |||||||||||||||
| 2016 | 2015 | 2016 | 2015 | |||||||||||||
| NT$ | NT$ | NT$ | NT$ | |||||||||||||
| Total interest expense for financial liabilities measured at amortized cost | $ | 610,084 | $ | 630,581 | $ | 1,923,733 | $ | 1,865,132 | ||||||||
(Continued)
- 42 -
For the Three Months Ended September 30 | For the Nine Months Ended September 30 | |||||||||||||||
| 2016 | 2015 | 2016 | 2015 | |||||||||||||
| NT$ | NT$ | NT$ | NT$ | |||||||||||||
| Less: Amounts included in the cost of qualifying assets | ||||||||||||||||
| Inventories related to real estate business | $ | (60,625 | ) | $ | (49,148 | ) | $ | (176,710 | ) | $ | (146,084 | ) | ||||
| Property, plant and equipment | (13,913 | ) | (13,646 | ) | (38,828 | ) | (37,811 | ) | ||||||||
| 535,546 | 567,787 | 1,708,195 | 1,681,237 | |||||||||||||
| Other finance costs | 11,912 | 6,627 | 38,390 | 16,960 | ||||||||||||
| $ | 547,458 | $ | 574,414 | $ | 1,746,585 | $ | 1,698,197 | |||||||||
(Concluded)
Information relating to the annual interest capitalization rates was as follows:
For the Three Months Ended September 30 | For the Nine Months Ended September 30 | |||||||||||||||
| 2016 | 2015 | 2016 | 2015 | |||||||||||||
| Inventories related to real estate business | 4.35%-6.00% | 4.85%-6.49% | 4.35%-6.00% | 4.85%-6.77% | ||||||||||||
| Property, plant and equipment | 1.21%-4.05% | 0.76%-4.13% | 1.15%-4.05% | 0.76%-6.15% | ||||||||||||
| d. | Depreciation and amortization |
For the Three Months Ended September 30 | For the Nine Months Ended September 30 | |||||||||||||||
| 2016 | 2015 | 2016 | 2015 | |||||||||||||
| NT$ | NT$ | NT$ | NT$ | |||||||||||||
| Property, plant and equipment | $ | 7,252,369 | $ | 7,270,814 | $ | 21,694,771 | $ | 21,750,748 | ||||||||
| Intangible assets | 120,172 | 149,096 | 343,868 | 421,472 | ||||||||||||
| Total | $ | 7,372,541 | $ | 7,419,910 | $ | 22,038,639 | $ | 22,172,220 | ||||||||
| Summary of depreciation by function | ||||||||||||||||
| Operating costs | $ | 6,764,505 | $ | 6,792,220 | $ | 20,206,684 | $ | 20,334,199 | ||||||||
| Operating expenses | 487,864 | 478,594 | 1,488,087 | 1,416,549 | ||||||||||||
| $ | 7,252,369 | $ | 7,270,814 | $ | 21,694,771 | $ | 21,750,748 | |||||||||
| Summary of amortization by function | ||||||||||||||||
| Operating costs | $ | 37,506 | $ | 31,751 | $ | 110,427 | $ | 90,135 | ||||||||
| Operating expenses | 82,666 | 117,345 | 233,441 | 331,337 | ||||||||||||
| $ | 120,172 | $ | 149,096 | $ | 343,868 | $ | 421,472 | |||||||||
- 43 -
| e. | Employee benefits expense |
For the Three Months Ended September 30 | For the Nine Months Ended September 30 | |||||||||||||||
| 2016 | 2015 | 2016 | 2015 | |||||||||||||
| NT$ | NT$ | NT$ | NT$ | |||||||||||||
| Post-employment benefits | ||||||||||||||||
| Defined contribution plans | $ | 435,617 | $ | 425,121 | $ | 1,298,851 | $ | 1,258,304 | ||||||||
| Defined benefit plans | 100,268 | 101,477 | 297,425 | 309,590 | ||||||||||||
| 535,885 | 526,598 | 1,596,276 | 1,567,894 | |||||||||||||
| Equity-settled share-based payments | 112,979 | 16,564 | 353,676 | 35,919 | ||||||||||||
| Salary, incentives and bonus | 11,335,717 | 10,689,401 | 31,845,563 | 31,491,527 | ||||||||||||
| Other employee benefits | 1,745,373 | 1,671,839 | 4,915,816 | 4,928,015 | ||||||||||||
| $ | 13,729,954 | $ | 12,904,402 | $ | 38,711,331 | $ | 38,023,355 | |||||||||
| Summary of employee benefits expense by function | ||||||||||||||||
| Operating costs | $ | 9,302,919 | $ | 8,741,553 | $ | 26,264,502 | $ | 26,092,702 | ||||||||
| Operating expenses | 4,427,035 | 4,162,849 | 12,446,829 | 11,930,653 | ||||||||||||
| $ | 13,729,954 | $ | 12,904,402 | $ | 38,711,331 | $ | 38,023,355 | |||||||||
To be in compliance with the Company Act as amended in May 2015, the amended Articles of Incorporation of the Company, has been approved in the shareholders’ meeting in June 2016, stipulate to distribute employees’ compensation and remuneration to directors at the rates in 5.25%-8.25% and no higher than 0.75%, respectively, of net profit before income tax, employees’ compensation and remuneration to directors. For the three months and nine months ended September 30, 2016 and 2015, the employees’ compensation and the remuneration to directors were accrued based on 8.25% and 0.75% of net profit before income tax, employees’ compensation and remuneration to directors, respectively.
For the Three Months Ended September 30 | For the Nine Months
Ended September 30
| |||||||||||||||
| 2016 | 2015 | 2016 | 2015 | |||||||||||||
| NT$ | NT$ | NT$ | NT$ | |||||||||||||
| Employees’ compensation | $ | 506,210 | $ | 686,655 | $ | 1,409,574 | $ | 1,533,299 | ||||||||
| Remuneration to directors | 46,019 | 52,346 | 128,143 | 129,314 | ||||||||||||
If there is a change in the proposed amounts after the consolidated financial statements authorized for issue, the differences are recorded as a change in accounting estimate.
The appropriations of employees’ compensation and remuneration to directors for 2015 were resolved by the board of directors in April 2016, and the appropriations of bonus to employees and remuneration to directors and supervisors for 2014 were approved in the shareholders’ meeting in June 2015. The amounts of the employees’ compensation/bonus and remuneration to directors and supervisors are disclosed in the table below. After the amendments to the Articles had been resolved in the shareholders’ meeting held in June 2016, the appropriations of the employees’ compensation and remuneration to directors for 2015 were reported in the shareholders’ meeting.
- 44 -
| For Year 2015 | For Year 2014 | |||||||
| NT$ | NT$ | |||||||
| Bonus to employees / employees’ compensation | $ | 2,033,800 | $ | 2,335,600 | ||||
| Remuneration to directors and supervisors / directors | 140,000 | 211,200 | ||||||
The differences between the resolved amounts of the employees’ compensation and the remuneration to directors and the accrued amounts reflected in the consolidated financial statements for the years ended December 31, 2015 and the bonus to employees and remuneration to directors and supervisors and the accrued amounts reflected in the consolidated financial statements for the years ended December 31, 2014 were deemed changes in estimates. The difference was NT$44,200 thousand and NT$1,330 thousand and had been adjusted in earnings for the years ended December 31, 2016 and 2015, respectively.
Information on the employees’ compensation and the remuneration to directors for 2015 resolved by the Company’s board of directors in 2016 and the bonus to employees and the remuneration to directors and supervisors resolved by the shareholders’ meeting in 2015 are available on the Market Observation Post System website of the TSE.
| 24. | INCOME TAX |
| a. | Income tax recognized in profit or loss |
The major components of income tax expense were as follows:
For the Three Months Ended September 30 | For the Nine Months Ended September 30 | |||||||||||||||
| 2016 | 2015 | 2016 | 2015 | |||||||||||||
| NT$ | NT$ | NT$ | NT$ | |||||||||||||
| Current income tax | ||||||||||||||||
| In respect of the current period | $ | 1,135,051 | $ | 1,320,237 | $ | 3,609,224 | $ | 2,740,629 | ||||||||
| Income tax on unappropriated earnings | - | - | 559,606 | 610,556 | ||||||||||||
| Changes in estimate for prior periods | (4,265 | ) | 7,797 | 26,514 | (38,109 | ) | ||||||||||
| 1,130,786 | 1,328,034 | 4,195,344 | 3,313,076 | |||||||||||||
| Deferred income tax | ||||||||||||||||
| In respect of the current period | (34,365 | ) | (268,848 | ) | (238,983 | ) | 273,630 | |||||||||
| Adjustments to attributable to changes in tax rates | - | - | 14,184 | 25,937 | ||||||||||||
| Changes in estimate for prior periods | 379 | (10,517 | ) | (26,840 | ) | (20,989 | ) | |||||||||
| Effect of foreign currency exchange differences | (121,170 | ) | 78,639 | (126,918 | ) | (11,990 | ) | |||||||||
| (155,256 | ) | (200,726 | ) | (378,557 | ) | 266,588 | ||||||||||
| Income tax expense recognized in profit or loss | $ | 975,530 | $ | 1,127,308 | $ | 3,816,787 | $ | 3,579,664 | ||||||||
- 45 -
| b. | Integrated income tax |
As of September 30, 2016, December 31, 2015 and September 30, 2015, unappropriated earnings were all generated on and after January 1, 1998. As of September 30, 2016, December 31, 2015 and September 30, 2015, the balance of the Imputation Credit Account (“ICA”) was NT$2,484,934 thousand, NT$1,913,243 thousand and NT$1,430,460 thousand, respectively.
The creditable ratio for the distribution of earnings of 2015 and 2014 was 9.65% (estimated) and 6.88% (actual), respectively.
| c. | Income tax assessments |
Income tax returns of ASE Inc. and its ROC subsidiaries have been examined by authorities through 2012 and through 2013 to 2014, respectively. ASE Inc. and some of its ROC subsidiaries disagreed with the result of examinations relating to its income tax returns for 2004 through 2008 and 2010 through 2012 and appealed to the tax authorities. A settlement was reached in June 2015. The related income tax expenses in the years resulting from the examinations have been accrued in respective tax years or in the year of the settlement.
| 25. | EARNINGS PER SHARE |
The earnings and weighted average number of ordinary shares outstanding in the computation of earnings per share were as follows:
Net profit for the period
For the Three Months Ended September 30 | For the Nine Months Ended September 30 | |||||||||||||||
| 2016 | 2015 | 2016 | 2015 | |||||||||||||
| NT$ | NT$ | NT$ | NT$ | |||||||||||||
| Net profit for the period attributable to owners of the Company | $ | 5,505,994 | $ | 6,368,622 | $ | 13,715,836 | $ | 14,489,257 | ||||||||
| Effect of potentially dilutive ordinary shares: | ||||||||||||||||
| Employee share options issued by subsidiaries | (102,880 | ) | (49,096 | ) | (291,290 | ) | (154,682 | ) | ||||||||
| Investments in associates | (232,138 | ) | - | (455,098 | ) | - | ||||||||||
| Convertible bonds | 146,220 | (619,223 | ) | (551,720 | ) | 174,970 | ||||||||||
| Earnings used in the computation of diluted earnings per share | $ | 5,317,196 | $ | 5,700,303 | $ | 12,417,728 | $ | 14,509,545 | ||||||||
Weighted average number of ordinary shares outstanding (in thousand shares)
For the Three Months Ended September 30 | For the Nine Months Ended September 30 | |||||||||||||||
| 2016 | 2015 | 2016 | 2015 | |||||||||||||
| Weighted average number of ordinary shares in computation of basic earnings per share | 7,668,008 | 7,635,675 | 7,658,467 | 7,656,395 | ||||||||||||
(Continued)
- 46 -
For the Three Months Ended September 30 | For the Nine Months Ended September 30 | |||||||||||||||
| 2016 | 2015 | 2016 | 2015 | |||||||||||||
| Effect of potentially dilutive ordinary shares: | ||||||||||||||||
| Convertible bonds | 515,295 | 513,995 | 515,295 | 435,578 | ||||||||||||
| Employee share options | 62,335 | 71,028 | 61,385 | 90,537 | ||||||||||||
| Employees’ compensation | 6,732 | 10,225 | 37,793 | 58,454 | ||||||||||||
| Weighted average number of ordinary shares in computation of diluted earnings per share | 8,252,370 | 8,230,923 | 8,272,940 | 8,240,964 | ||||||||||||
(Concluded)
The Group is able to settle the employees’ compensation by cash or shares. The Group presumed that the entire amount of the compensation would be settled in shares and the resulting potential shares were included in the weighted average number of ordinary shares outstanding used in the computation of diluted earnings per share if the effect is dilutive. Such dilutive effect of the potential shares was included in the computation of diluted earnings per share until the board of directors approve the number of shares to be distributed to employees at their meeting in the following year.
| 26. | SHARE-BASED PAYMENT ARRANGEMENTS |
Employee share option plans of the Company and its subsidiaries
In order to attract, retain and reward employees, ASE Inc. has five employee share option plans for full-time employees of the Group, including 100,000 thousand share options approved to be granted in April 2015. There are 5,730 thousand share options of the fifth employee stock option plan that will no longer be issued due to the expiration of grant period. Each share option represents the right to purchase one ordinary share of ASE Inc. when exercised. Under the terms of the plans, share options are granted at an exercise price equal to or not less than the closing price of the ordinary shares listed on the TSE at the grant date. The option rights of these plans are valid for 10 years, non-transferable and exercisable at certain percentages subsequent to the second anniversary of the grant date. For any subsequent changes in the Company’s capital structure, the exercise price is accordingly adjusted.
| a. | ASE Inc. Option Plans |
Information about share options was as follows:
| For the Nine Months Ended September 30 | ||||||||||||||||
| 2016 | 2015 | |||||||||||||||
| Weighted | Weighted | |||||||||||||||
| Average | Average | |||||||||||||||
| Number of | Exercise | Number of | Exercise | |||||||||||||
| Options (In | Price Per | Options (In | Price Per | |||||||||||||
| Thousands) | Share (NT$) | Thousands) | Share (NT$) | |||||||||||||
| Balance at January 1 | 252,607 | $ | 26.6 | 209,745 | $ | 20.7 | ||||||||||
| Options granted | - | - | 94,270 | 36.5 | ||||||||||||
| Options forfeited | (4,556 | ) | 34.5 | (859 | ) | 24.4 | ||||||||||
| Options expired | - | - | (730 | ) | 11.1 | |||||||||||
(Continued)
- 47 -
| For the Nine Months Ended September 30 | ||||||||||||||||
| 2016 | 2015 | |||||||||||||||
| Weighted | Weighted | |||||||||||||||
| Average | Average | |||||||||||||||
| Number of | Exercise | Number of | Exercise | |||||||||||||
| Options (In | Price Per | Options (In | Price Per | |||||||||||||
| Thousands) | Share (NT$) | Thousands) | Share (NT$) | |||||||||||||
| Options exercised | (26,262 | ) | $ | 20.9 | (41,518 | ) | $ | 20.6 | ||||||||
| Balance at September 30 | 221,789 | 27.1 | 260,908 | 26.5 | ||||||||||||
| Options exercisable, end of period | 132,619 | 20.8 | 164,046 | 20.8 | ||||||||||||
(Concluded)
The weighted average share prices at exercise dates of share options for the nine months ended September 30, 2016 and 2015 was NT$36.5 and NT$39.6, respectively.
Information about the Company’s outstanding share options at each balance sheet date was as follows:
| Range of Exercise Price Per Share (NT$) | Weighted Average Remaining Contractual Life (Years) | |||
| September 30, 2016 | $ 20.4-22.6 | 2.7 | ||
| 36.5 | 8.9 | |||
| December 31, 2015 | 20.4-22.6 | 3.5 | ||
| 36.5 | 9.7 | |||
| September 30, 2015 | 20.4-22.6 | 3.7 | ||
| 36.5 | 9.9 |
| b. | ASE Mauritius Inc. Option Plan |
ASE Mauritius Inc. has an employee share option plan for full-time employees of the Group which granted 30,000 thousand units in December 2007. Under the terms of the plan, each unit represents the right to purchase one ordinary share of ASE Mauritius Inc. when exercised. The option rights of the plan are valid for 10 years, non-transferable and exercisable at certain percentages subsequent to the second anniversary of the grant date.
Information about share options was as follows:
| For the Nine Months Ended September 30 | ||||||||||||||||
| 2016 | 2015 | |||||||||||||||
| Number of | Exercise | Number of | Exercise | |||||||||||||
| Options (In | Price Per | Options (In | Price Per | |||||||||||||
| Thousands) | Share (US$) | Thousands) | Share (US$) | |||||||||||||
| Balance at January 1 | 28,470 | $ | 1.7 | 28,545 | $ | 1.7 | ||||||||||
| Options forfeited | - | - | (75 | ) | 1.7 | |||||||||||
| Balance at September 30 | 28,470 | 1.7 | 28,470 | 1.7 | ||||||||||||
| Options exercisable, end of period | 28,470 | 1.7 | 28,470 | 1.7 | ||||||||||||
- 48 -
As of September 30, 2016, December 31, 2015 and September 30, 2015, the remaining contractual life was 1.3 years, 2 years and 2.3 years, respectively.
| c. | USIE Option Plans |
The terms of the plans issued by USIE were the same with those of the Company’s option plans. USIE modified its option plan granted in 2007 by extending the contractual life to 13 years. The incremental fair value was all recognized as employee benefits expense in the years of modifications since the options were all vested.
Information about share options was as follows:
| For the Nine Months Ended September 30 | ||||||||||||||||
| 2016 | 2015 | |||||||||||||||
| Weighted | Weighted | |||||||||||||||
| Average | Average | |||||||||||||||
| Number of | Exercise | Number of | Exercise | |||||||||||||
| Options (In | Price Per | Options (In | Price Per | |||||||||||||
| Thousands) | Share (US$) | Thousands) | Share (US$) | |||||||||||||
| Balance at January 1 | 29,695 | $ | 2.1 | 34,159 | $ | 2.1 | ||||||||||
| Options forfeited | - | - | (84 | ) | 2.8 | |||||||||||
| Options exercised | (3,762 | ) | 2.0 | (4,380 | ) | 1.9 | ||||||||||
| Balance at September 30 | 25,933 | 2.2 | 29,695 | 2.1 | ||||||||||||
| Options exercisable, end of period | 25,933 | 2.2 | 28,106 | 2.1 | ||||||||||||
Information about USIE’s outstanding share options at each balance sheet date was as follows:
Range of Exercise Price Per Share (US$) | Weighted Average Remaining Contractual Life (Years) | |||
| September 30, 2016 | $ 1.5 | 4.2 | ||
| 2.4-2.9 | 4.1 | |||
| December 31, 2015 | 1.5 | 5.0 | ||
| 2.4-2.9 | 4.9 | |||
| September 30, 2015 | 1.5 | 4.2 | ||
| 2.4-2.9 | 5.1 |
| d. | USISH Option Plan |
In November 2015, the shareholders of USISH approved a share option plan for the employees of USISH. Each unit represents the right to purchase one ordinary share of USISH when exercised. The options are valid for 10 years, non-transferable and exercisable at certain percentages subsequent to the second anniversary of the grant date incorporated with certain performance conditions. For any subsequent changes in USISH’s capital structure, the exercise price is accordingly adjusted.
- 49 -
Information about share options was as follows:
For the Nine Months Ended September 30, 2016 | ||||||||
| Number of | Exercise | |||||||
| Options | Price Per | |||||||
| (In Thousands) | Share (CNY) | |||||||
| Balance at January 1 | 26,627 | $ | 15.5 | |||||
| Options forfeited | (1,211 | ) | 15.5 | |||||
| Balance at September 30 | 25,416 | �� | 15.5 | |||||
| Options exercisable, end of period | - | - | ||||||
As of September 30, 2016 and December 31, 2015, the remaining contractual life of the share options was 9.2 years and 9.9 years, respectively.
Fair value of share options
Share options granted by the Company and USISH in 2015 were measured using the Hull & White Model (2004) incorporated with Ritchken’s Trinomial Tree Model (1995) and the Black-Scholes Option Pricing Model, respectively, and the inputs to the models were as follows:
| ASE Inc. | USISH | |||
| Share price at the grant date | NT$36.5 | CNY15.2 | ||
| Exercise prices | NT$36.5 | CNY15.5 | ||
| Expected volatility | 27.02% | 40.33%-45.00% | ||
| Expected lives | 10 years | 10 years | ||
| Expected dividend yield | 4.00% | 0.87% | ||
| Risk free interest rates | 1.34% | 3.06%-3.13% |
Expected volatility was based on the historical share price volatility over the past 10 years of ASE Inc. and the comparable companies of USISH, respectively. Under the Hull & White Model (2004) incorporated with Ritchken’s Trinomial Tree Model (1995), the Company assumed that employees would exercise the options after vesting date when the share price was 1.88 times the exercise price to allow for the effects of early exercise.
| 27. | BUSINESS COMBINATIONS |
| a. | Subsidiaries acquired |
| Principal Activity | Date of Acquisition | Proportion of Voting Equity Interests Acquired | Cash Consideration | |||||||||||||
| NT$ | ||||||||||||||||
| TLJ | Engaged in information software services | May 3, 2016 | 60 | % | $ | 89,998 | ||||||||||
| b. | Consideration transferred, preliminary fair value of assets acquired and liabilities assumed as well as net cash outflow on acquisition of subsidiaries at the acquisition dates were as follows: |
- 50 -
| NT$ | ||||
| Current assets | $ | 16,645 | ||
| Non-current assets | 4,081 | |||
| Current liabilities | (7,599 | ) | ||
| 13,127 | ||||
| Non-controlling interests | (7,021 | ) | ||
| Goodwill | 83,892 | |||
| Total consideration | 89,998 | |||
| Less: Cash and cash equivalent acquired | (16,561 | ) | ||
| $ | 73,437 | |||
In May 2016, the Company’s subsidiary, ASE Test, Inc., acquired 60% shareholdings of TLJ with a total consideration determined primarily based on independent professional appraisal reports. NT$41,739 thousand out of the total consideration was paid to key management personnel and related parties. As of September 30, 2016, the Group has not completed the identification of the difference between the cost of the investment and the Group’s share of the net fair value of TLJ’s identifiable assets and liabilities and, as a result, the difference was recognized as goodwill provisionally.
| 28. | EQUITY TRANSACTION WITH NON-CONTROLLING INTERESTS |
In April 2015, USIE sold its shareholdings of 54,000 thousand ordinary shares of USISH amounting to CNY1,992,060 thousand and, as a result, the Group’s shareholdings of USISH decreased from 82.1% to 77.2%. The transaction was accounted for as an equity transaction since the Group did not cease to have control over USISH and, as a result, capital surplus was increased by NT$7,197,510 thousand in the second quarter of 2015.
In February 2016, USIE repurchased 4,501 thousand shares of USIE’s outstanding ordinary shares and, as a result, the Group’s shareholdings of USIE increased from 96.7% to 98.8%. The transaction was accounted for as an equity transaction since the Group did not cease to have control over USIE and capital surplus was decreased by NT$1,912,887 thousand.
In February 2016, the Company, with a total consideration of NT$ 792,064 thousand, completed the disposal of 39,603 thousand shares in USI to the Company’s subsidiary, UGTW, at NT$20 per share and, as a result, the Group’s shareholdings of USI decreased from 99.0% to 76.5%. The transaction was accounted for as an equity transaction since the Group did not cease to have control over USI and capital surplus was decreased by NT$20,552 thousand.
| 29. | NON-CASH TRANSACTIONS |
For the nine months ended September 30, 2016 and 2015, the Group entered into the following non-cash investing activities which were not reflected in the consolidated statements of cash flows:
For the Nine Months Ended September 30 | ||||||||
| 2016 | 2015 | |||||||
| NT$ | NT$ | |||||||
| Payments for property, plant and equipment | ||||||||
| Purchase of property, plant and equipment | $ | 21,284,821 | $ | 23,129,447 | ||||
| Decrease in prepayments for property, plant and equipment (recorded under the line item of other non-current assets) | (29,653 | ) | (220,918 | ) | ||||
(Continued)
- 51 -
For the Nine Months Ended September 30 | ||||||||
| 2016 | 2015 | |||||||
| NT$ | NT$ | |||||||
| (Increase) decrease in payables for property, plant and equipment | $ | (825,229 | ) | $ | 1,824,553 | |||
| Capitalized borrowing costs | (38,828 | ) | (37,811 | ) | ||||
| $ | 20,391,111 | $ | 24,695,271 | |||||
| Proceeds from disposal of property, plant and equipment | ||||||||
| Consideration from disposal of property, plant and equipment | $ | 439,798 | $ | 175,106 | ||||
| (Increase) decrease in other receivables | (310,537 | ) | 38,178 | |||||
| $ | 129,261 | $ | 213,284 | |||||
(Concluded)
| 30. | OPERATING LEASE ARRANGEMENTS |
Except those discussed in Note 17, the Company and its subsidiary, ASE Test, Inc., lease the land on which their buildings are located under various operating lease agreements with the ROC government expiring through June 2035. The agreements grant these entities the option to renew the leases and reserve the right for the lessor to adjust the lease payments upon an increase in the assessed value of the land and to terminate the leases under certain conditions. In addition, the Group leases buildings, machinery and equipment under operating leases.
The subsidiaries’ offices located in U.S.A. and Japan, etc. are leased from other parties and the lease term will expire through 2016 to 2023 with the option to renew the leases upon expiration.
The Group recognized rental expense of NT$396,530 thousand, NT$343,584 thousand, NT$1,073,013 thousand and NT$1,057,269 thousand for the three months and nine months ended September 30, 2016 and 2015, respectively.
| 31. | CAPITAL MANAGEMENT |
The capital structure of the Group consists of debt and equity. The Group manages its capital to ensure that entities in the Group will be able to continue as going concerns while maximizing the return to shareholders through the optimization of the debt and equity balance. Key management personnel of the Group periodically reviews the cost of capital and the risks associated with each class of capital. In order to balance the overall capital structure, the Group may adjust the amount of dividends paid to shareholders, the number of new shares issued or repurchased, and the amount of new debt issued or existing debt redeemed.
The Group is not subject to any externally imposed capital requirements except those discussed in Note 18.
| 32. | FINANCIAL INSTRUMENTS |
| a. | Fair value of financial instruments that are not measured at fair value |
| 1) | Fair value of financial instruments not measured at fair value but for which fair value is disclosed |
Except bonds payable measured at amortized cost, the management considers that the carrying amounts of financial assets and financial liabilities not measured at fair value approximate their fair
- 52 -
values. The carrying amounts and fair value of bonds payable as of September 30, 2016, December 31, 2015 and September 30, 2015, respectively, were as follows:
| Carrying Amount | Fair Value | |||
| NT$ | NT$ | |||
| September 30, 2016 | $ 36,256,600 | $ 36,680,738 | ||
| December 31, 2015 | 38,426,250 | 38,465,355 | ||
| September 30, 2015 | 38,382,648 | 38,292,845 |
| 2) | Fair value hierarchy |
The aforementioned fair value hierarchy of bonds payable was level 3 which was determined based on discounted cash flows analysis with the applicable yield curve for the duration or the last trading prices.
| b. | Fair value of financial instruments that are measured at fair value on a recurring basis |
| 1) | Fair value hierarchy |
| Level 1 | Level 2 | Level 3 | Total | |||||||||||||
| NT$ | NT$ | NT$ | NT$ | |||||||||||||
| September 30, 2016 | ||||||||||||||||
| Financial assets at FVTPL | ||||||||||||||||
| Financial assets designated as at FVTPL | ||||||||||||||||
| Private-placement convertible bonds | $ | - | $ | 100,583 | $ | - | $ | 100,583 | ||||||||
| Derivative financial assets | ||||||||||||||||
| Forward exchange contracts | - | 55,645 | - | 55,645 | ||||||||||||
| Swap contracts | - | 38,451 | - | 38,451 | ||||||||||||
| Non-derivative financial assets held for trading | ||||||||||||||||
| Open-end mutual funds | 584,424 | - | - | 584,424 | ||||||||||||
| Quoted shares | 34,728 | - | - | 34,728 | ||||||||||||
| $ | 619,152 | $ | 194,679 | $ | - | $ | 813,831 | |||||||||
| Available-for-sale financial assets | ||||||||||||||||
| Limited partnership | $ | - | $ | - | $ | 448,913 | $ | 448,913 | ||||||||
| Unquoted shares | - | - | 520,668 | 520,668 | ||||||||||||
| Quoted shares | 160,243 | - | - | 160,243 | ||||||||||||
| Open-end mutual funds | 44,207 | - | - | 44,207 | ||||||||||||
| $ | 204,450 | $ | - | $ | 969,581 | $ | 1,174,031 | |||||||||
(Continued)
- 53 -
| Level 1 | Level 2 | Level 3 | Total | |||||||||||||
| NT$ | NT$ | NT$ | NT$ | |||||||||||||
| Financial liabilities at FVTPL | ||||||||||||||||
| Derivative financial liabilities | ||||||||||||||||
| Conversion option, redemption option and put option of convertible bonds | $ | - | $ | 2,224,051 | $ | - | $ | 2,224,051 | ||||||||
| Swap contracts | - | 1,708,293 | - | 1,708,293 | ||||||||||||
| Forward exchange contracts | - | 10,825 | - | 10,825 | ||||||||||||
| Interest rate swap contracts | - | 8,791 | - | 8,791 | ||||||||||||
| Foreign currency option contracts | - | 1,560 | - | 1,560 | ||||||||||||
| $ | - | $ | 3,953,520 | $ | - | $ | 3,953,520 | |||||||||
| December 31, 2015 | ||||||||||||||||
| Financial assets at FVTPL | ||||||||||||||||
| Financial assets designated as at FVTPL | ||||||||||||||||
| Structured time deposits | $ | - | $ | 1,646,357 | $ | - | $ | 1,646,357 | ||||||||
| Private-placement convertible bonds | - | 100,500 | - | 100,500 | ||||||||||||
| Derivative financial assets | ||||||||||||||||
| Swap contracts | - | 1,452,611 | - | 1,452,611 | ||||||||||||
| Forward exchange contracts | - | 18,913 | - | 18,913 | ||||||||||||
| Forward currency option contracts | - | 5,020 | - | 5,020 | ||||||||||||
| Non-derivative financial assets held for trading | ||||||||||||||||
| Open-end mutual funds | 573,242 | - | - | 573,242 | ||||||||||||
| Quoted shares | 37,058 | - | - | 37,058 | ||||||||||||
| $ | 610,300 | $ | 3,223,401 | $ | - | $ | 3,833,701 | |||||||||
| Available-for-sale financial assets | ||||||||||||||||
| Limited Partnership | $ | - | $ | - | $ | 476,612 | $ | 476,612 | ||||||||
| Unquoted shares | - | - | 264,477 | 264,477 | ||||||||||||
(Continued)
- 54 -
| Level 1 | Level 2 | Level 3 | Total | |||||||||||||
| NT$ | NT$ | NT$ | NT$ | |||||||||||||
| Quoted shares | $ | 197,580 | $ | - | $ | - | $ | 197,580 | ||||||||
| Open-end mutual funds | 16,037 | - | - | 16,037 | ||||||||||||
| $ | 213,617 | $ | - | $ | 741,089 | $ | 954,706 | |||||||||
| Financial liabilities at FVTPL | ||||||||||||||||
| Derivative financial liabilities | ||||||||||||||||
| Conversion option, redemption option and put option of convertible bonds | $ | - | $ | 2,632,565 | $ | - | $ | 2,632,565 | ||||||||
| Swap contracts | - | 290,176 | - | 290,176 | ||||||||||||
| Forward exchange contracts | - | 69,207 | - | 69,207 | ||||||||||||
| Foreign currency option contracts | - | 13,659 | - | 13,659 | ||||||||||||
| Interest rate swap contracts | - | 119 | - | 119 | ||||||||||||
| $ | - | $ | 3,005,726 | $ | - | $ | 3,005,726 | |||||||||
| September 30, 2015 | ||||||||||||||||
| Financial assets at FVTPL | ||||||||||||||||
| Financial assets designated as at FVTPL | ||||||||||||||||
| Private-placement convertible bonds | $ | - | $ | 100,500 | $ | - | $ | 100,500 | ||||||||
| Derivative financial assets | ||||||||||||||||
| Swap contracts | - | 2,398,880 | - | 2,398,880 | ||||||||||||
| Forward exchange contracts | - | 41,189 | - | 41,189 | ||||||||||||
| Non-derivative financial assets held for trading | ||||||||||||||||
| Open-end mutual funds | 558,437 | - | - | 558,437 | ||||||||||||
| Quoted shares | 43,225 | - | - | 43,225 | ||||||||||||
| $ | 601,662 | $ | 2,540,569 | $ | - | $ | 3,142,231 | |||||||||
(Continued)
- 55 -
| Level 1 | Level 2 | Level 3 | Total | |||||||||||||
| NT$ | NT$ | NT$ | NT$ | |||||||||||||
| Available-for-sale financial assets | ||||||||||||||||
| Limited Partnership | $ | - | $ | - | $ | 501,168 | $ | 501,168 | ||||||||
| Quoted shares | 172,915 | - | - | 172,915 | ||||||||||||
| Unquoted shares | - | - | 246,218 | 246,218 | ||||||||||||
| $ | 172,915 | $ | - | $ | 747,386 | $ | 920,301 | |||||||||
| Financial liabilities at FVTPL | ||||||||||||||||
| Derivative financial liabilities | ||||||||||||||||
| Conversion option, redemption option and put option of convertible bonds | $ | - | $ | 2,049,773 | $ | - | $ | 2,049,773 | ||||||||
| Foreign exchange contracts | - | 298,988 | - | 298,988 | ||||||||||||
| Swap contracts | - | 244,204 | - | 244,204 | ||||||||||||
| Foreign currency option contracts | - | 12,112 | - | 12,112 | ||||||||||||
| $ | - | $ | 2,605,077 | $ | - | $ | 2,605,077 | |||||||||
(Concluded)
For the financial assets and liabilities that were measured at fair value on a recurring basis held for the nine months ended September 30, 2016 and 2015, there were no transfers between Level 1 and Level 2 of the fair value hierarchy.
| 2) | Reconciliation of Level 3 fair value measurements of financial assets |
The financial assets measured at Level 3 fair value were equity investments with no quoted prices and classified as available-for-sale financial assets - non-current. Reconciliations for the nine months ended September 30, 2016 and 2015 were as follows:
| 2016 | 2015 | |||||||
| NT$ | NT$ | |||||||
| Balance at January 1 | $ | 741,089 | $ | 778,866 | ||||
| Purchases | 297,678 | 13,791 | ||||||
| Total losses recognized | ||||||||
| In profit or loss | (10,734 | ) | (15,891 | ) | ||||
| In other comprehensive income | (29,525 | ) | 13,522 | |||||
| Disposals | (28,927 | ) | (42,902 | ) | ||||
| Balance at September 30 | $ | 969,581 | $ | 747,386 | ||||
As of September 30, 2016 and 2015, unrealized loss of NT$26,765 thousand and NT$16,633 thousand, recorded in other comprehensive income under the heading of unrealized gain on available-for-sale financial assets, were included in the carrying amount of the financial assets at fair value on Level 3 fair value measurement.
- 56 -
| 3) | Valuation techniques and assumptions applied for the purpose of measuring fair value |
| a) | Valuation techniques and inputs applied for the purpose of measuring Level 2 fair value measurement |
| Financial Instruments | Valuation Techniques and Inputs | |
| Derivatives - swap contracts, forward exchange contracts, foreign currency option contracts and interest rate swap contracts | Discounted cash flows - Future cash flows are estimated based on observable forward exchange rates or interest rates at balance sheet dates and contract forward exchange rates or interest rates, discounted at rates that reflected the credit risk of various counterparties. | |
| Derivatives - conversion option, redemption option and put option of convertible bonds | Option pricing model - Incorporation of present value techniques and reflect both the time value and the intrinsic value of options | |
| Structured time deposits and private-placement convertible bonds | Discounted cash flows - Future cash flows are estimated based on observable forward exchange rates or stock prices at balance sheet dates and contract interest rate ranges or conversion prices, discounted at rates that reflected the credit risk of various counterparties. |
| b) | Valuation techniques and inputs applied for the purpose of measuring Level 3 fair value measurement |
The fair value of the Group’s investments in unquoted shares on Level 3 fair value measurement were measured using market approach based on investees’ recent financing activities, technical development, valuation of investees comparable companies, market conditions and other economic indicators.
The fair values of investments in limited partnership are measured using discounted cash flow technique and a comparable multiple technique. The significant unobservable inputs used in the discounted cash flow technique were discount rates of 12.34% and the terminal growth rates of 2.50%. Any significant increase in discount rates or any significant decrease in terminal growth rates would result in a decrease in the fair value of the investments in limited partnership. The significant unobservable input used in the comparable multiple technique was EBITDA multiples of 9.73. Any significant decrease in multiples would result in a decrease in the fair value of the investments in limited partnership.
| c. | Categories of financial instruments |
September 30, 2016 | December 31, 2015 | September 30, 2015 | ||||||||||
| NT$ | NT$ | NT$ | ||||||||||
| Financial assets | ||||||||||||
| FVTPL | ||||||||||||
| Designated as at FVTPL | $ | 100,583 | $ | 1,746,857 | $ | 100,500 | ||||||
| Held for trading | 713,248 | 2,086,844 | 3,041,731 | |||||||||
| Available-for-sale financial assets | 1,174,031 | 954,706 | 920,301 | |||||||||
| Loans and receivables (Note 1) | 93,009,972 | 101,259,880 | 98,389,112 | |||||||||
(Continued)
- 57 -
September 30, 2016 | December 31, 2015 | September 30, 2015 | ||||
| NT$ | NT$ | NT$ | ||||
| Financial liabilities | ||||||
| FVTPL | ||||||
| Held for trading | $ 3,953,520 | $ 3,005,726 | $ 2,605,077 | |||
| Measured at amortized cost (Note 2) | 177,209,507 | 173,294,140 | 182,637,071 |
(Concluded)
| Note 1: | The balances included loans and receivables measured at amortized cost which comprise cash and cash equivalents, trade and other receivables and other financial assets. |
| Note 2: | The balances included financial liabilities measured at amortized cost which comprise short-term borrowings, short-term bills payable, trade and other payables, bonds payable and long-term borrowings. |
| d. | Financial risk management objectives and policies |
The derivative instruments used by the Group are to mitigate risks arising from ordinary business operations. All derivative transactions entered into by the Group are designated as either hedging or trading. Derivative transactions entered into for hedging purposes must hedge risk against fluctuations in foreign exchange rates and interest rates arising from operating activities. The currencies and the amount of derivative instruments held by the Group must match its hedged assets and liabilities denominated in foreign currencies.
The Group's risk management department monitors risks to mitigate risk exposures, reports unsettled position, transaction balances and related gains or losses to the Group’s chief financial officer on monthly basis.
| 1) | Market risk |
The Group’s activities exposed it primarily to the financial risks of changes in foreign currency exchange rates and interest rates. Gains or losses arising from fluctuations in foreign currency exchange rates of a variety of derivative financial instruments were approximately offset by those of hedged items. Interest rate risk was not significant due to the cost of capital was expected to be fixed.
There had been no change to the Group's exposure to market risks or the manner in which these risks were managed and measured.
| a) | Foreign currency exchange rate risk |
The Group had sales and purchases as well as financing activities denominated in foreign currency which exposed the Group to foreign currency exchange rate risk. The Group entered into a variety of derivative financial instruments to hedge foreign currency exchange rate risk to minimize the fluctuations of assets and liabilities denominated in foreign currencies.
The carrying amounts of the Group's foreign currency denominated monetary assets and liabilities (including those eliminated upon consolidation) as well as derivative instruments which exposed the Group to foreign currency exchange rate risk at each balance sheet date are presented in Note 36.
- 58 -
The Group was principally subject to the impact to exchange rate fluctuation in U.S. dollars and Japanese yen against NT$ or Chinese Yuan Renminbi (“CNY”). 1% is the sensitivity rate used when reporting foreign currency exchange rate risk internally to key management personnel and represents management’s assessment of the reasonably possible change in foreign currency exchange rates. The sensitivity analysis included financial assets and liabilities and inter-company receivables and payables within the Group. The changes in profit before income tax due to a 1% change in U.S. dollars and Japanese yen both against NT$ and CNY would be NT$218,000 thousand and NT$56,000 thousand for the nine months ended September 30, 2016 and 2015, respectively. Hedging contracts and hedged items have been taken into account while measuring the changes in profit before income tax. The abovementioned sensitivity analysis mainly focused on the foreign currency monetary items at the end of the reporting period. As the period-end exposure did not reflect the exposure for the nine months ended September 30, 2016 and 2015, the abovementioned sensitivity analysis was unrepresentative of those periods.
| b) | Interest rate risk |
Except a portion of long-term borrowings and bonds payable at fixed interest rates, the Group was exposed to interest rate risk because group entities borrowed funds at floating interest rates. Changes in market interest rates will lead to variances in effective interest rates of borrowings from which the future cash flow fluctuations arise. The Group entered into a variety of derivative financial instruments to hedge interest rate risk to minimize the fluctuations of assets and liabilities denominated in interest rate.
The carrying amounts of the Group’s financial assets and financial liabilities with exposure to interest rates at each balance sheet date were as follows:
September 30, 2016 | December 31, 2015 | September 30, 2015 | ||||||||||
| NT$ | NT$ | NT$ | ||||||||||
| Fair value interest rate risk | ||||||||||||
| Financial liabilities | $ | 29,731,458 | $ | 18,030,482 | $ | 29,772,311 | ||||||
| Cash flow interest rate risk | ||||||||||||
| Financial assets | 30,340,234 | 53,475,994 | 39,098,465 | |||||||||
| Financial liabilities | 72,903,042 | 65,213,083 | 60,468,199 | |||||||||
For assets and liabilities with floating interest rates, a 100 basis point increase or decrease was used when reporting interest rate risk internally to key management personnel. If interest rates had been 100 basis points (1%) higher or lower and all other variables held constant, the Group’s profit before income tax for the nine months ended September 30, 2016 and 2015 would have decreased or increased approximately by NT$320,000 thousand and NT$161,000 thousand , respectively. Hedging contracts and hedged items have been taken into account while measuring the changes in profit before income tax. The abovementioned sensitivity analysis mainly focused on the interest rate items at the end of the reporting period. As the period-end exposure did not reflect the exposure for the nine months ended September 30, 2016 and 2015, the abovementioned sensitivity analysis was unrepresentative of those periods.
| c) | Other price risk |
The Group was exposed to equity or debt price risk through its investments in financial assets at FVTPL, including private-placement convertible bonds, quoted shares, open-end mutual funds, and available-for-sale financial assets. If equity or debt prices were 1% higher or lower, profit before income tax for the nine months ended September 30, 2016 and 2015 would have increased or decreased approximately by NT$7,200 thousand and NT$7,000 thousand,
- 59 -
respectively, and other comprehensive income before income tax for the nine months ended September 30, 2016 and 2015 would have increased or decreased approximately by NT$12,000 thousand and NT$9,000 thousand, respectively.
In addition, the Group was also exposed to the Company’s ordinary share price risk through Bonds Options recognized as financial liabilities held for trading. 7% is the sensitivity rate used when reporting price risk internally to key management personnel. If the Company’s ordinary share price increased or decreased by 7%, profit before income tax for the nine months ended September 30, 2016 and 2015 would have decreased approximately by NT$644,000 thousand and NT$586,000 thousand, respectively, or increased approximately by NT$528,000 thousand and NT$488,000 thousand, respectively.
| 2) | Credit risk |
Credit risk refers to the risk that counterparty will default on its contractual obligations resulting in financial loss to the Group. The Group’s credit risk arises from cash and cash equivalents, receivables and other financial assets. The Group’s maximum exposure to credit risk was the carrying amounts of financial assets in the consolidated balance sheets.
The Group dealt with counterparties creditworthy and has a credit policy and trade receivable management procedures to ensure recovery and evaluation of trade receivables. Except for those discussed in Note 9, the Group’s counterparties consisted of a large number of customers and banks and there was no significant concentration of credit risk exposure.
| 3) | Liquidity risk |
The Group manages liquidity risk by maintaining adequate working capital and banking facilities to fulfill the demand for cash flow used in the Group’s operation and capital expenditure. The Group also monitors its compliance with all the loan covenants. Liquidity risk is not considered to be significant.
In the table below, financial liabilities with a repayment on demand clause were included in the earliest time band regardless of the probability of counter-parties choosing to exercise their rights. The maturity dates for other non-derivative financial liabilities were based on the agreed repayment dates.
To the extent that interest flows are floating rate, the undiscounted amounts were derived from the interest rates at each balance sheet date.
On Demand or Less than 1 Month | 1 to 3 Months | 3 Months to 1 Year | 1 to 5 Years | More than 5 Years | ||||||||||||||||
| NT$ | NT$ | NT$ | NT$ | NT$ | ||||||||||||||||
| September 30, 2016 | ||||||||||||||||||||
| Non-derivative financial liabilities | ||||||||||||||||||||
| Non-interest bearing | $ | 25,814,299 | $ | 20,449,262 | $ | 4,484,715 | $ | 1,882 | $ | 185,672 | ||||||||||
| Floating interest rate liabilities | 17,893,862 | 7,033,066 | 6,508,471 | 41,578,145 | 2,123,033 | |||||||||||||||
| Fixed interest rate liabilities | 4,718,810 | 3,804,691 | 10,026,691 | 28,049,987 | 2,062,500 | |||||||||||||||
| $ | 48,426,971 | $ | 31,287,019 | $ | 21,019,877 | $ | 69,630,014 | $ | 4,371,205 | |||||||||||
| December 31, 2015 | ||||||||||||||||||||
| Non-derivative financial liabilities | ||||||||||||||||||||
| Non-interest bearing | $ | 19,393,406 | $ | 19,626,026 | $ | 6,493,504 | $ | 1,926 | $ | 194,346 | ||||||||||
| Floating interest rate liabilities | 6,617,050 | 5,677,129 | 10,582,324 | 39,202,454 | 775,273 | |||||||||||||||
| Fixed interest rate liabilities | 16,168,484 | 2,463,617 | 24,787,238 | 18,078,920 | - | |||||||||||||||
| $ | 42,178,940 | $ | 27,766,772 | $ | 41,863,066 | $ | 57,283,300 | $ | 969,619 | |||||||||||
(Continued)
- 60 -
On Demand or Less than 1 Month | 1 to 3 Months | 3 Months to 1 Year | 1 to 5 Years | More than 5 Years | ||||||||||||||||
| NT$ | NT$ | NT$ | NT$ | NT$ | ||||||||||||||||
| September 30, 2015 | ||||||||||||||||||||
| Non-derivative financial liabilities | ||||||||||||||||||||
| Non-interest bearing | $ | 21,938,820 | $ | 20,993,569 | $ | 8,516,979 | $ | 1,938 | $ | 194,612 | ||||||||||
| Floating interest rate liabilities | 7,883,885 | 4,458,392 | 13,030,379 | 36,033,593 | 1,091,712 | |||||||||||||||
| Fixed interest rate liabilities | 17,939,675 | 6,174,920 | 12,277,466 | 29,786,331 | - | |||||||||||||||
| $ | 47,762,380 | $ | 31,626,881 | $ | 33,824,824 | $ | 65,821,862 | $ | 1,286,324 | |||||||||||
(Concluded)
The amounts included above for floating interest rate instruments for non-derivative financial liabilities was subject to change if changes in floating interest rates differ from those estimates of interest rates determined at each balance sheet date.
The following table detailed the Group's liquidity analysis for its derivative financial instruments. The table was based on the undiscounted contractual net cash inflows and outflows on derivative instruments that settle on a net basis, and the undiscounted gross cash inflows and outflows on those derivatives that require gross settlement. When the amounts payable or receivable are not fixed, the amounts disclosed have been determined by reference to the projected interest rates as illustrated by the yield curves at each balance sheet date.
On Demand or Less than 1 Month | 1 to 3 Months | 3 Months to 1 Year | ||||||||||
| September 30, 2016 | ||||||||||||
| Net settled | ||||||||||||
| Forward exchange contracts | $ | 43,105 | $ | 1,600 | $ | - | ||||||
| Foreign currency option contracts | $ | 1,043 | $ | - | $ | - | ||||||
| Gross settled | ||||||||||||
| Forward exchange contracts | ||||||||||||
| Inflows | $ | 3,504,294 | $ | 672,875 | $ | - | ||||||
| Outflows | (3,507,738 | ) | (674,546 | ) | - | |||||||
| (3,444 | ) | (1,671 | ) | - | ||||||||
| Swap contracts | ||||||||||||
| Inflows | 14,149,871 | 16,423,419 | 37,318,400 | |||||||||
| Outflows | (14,255,579 | ) | (16,759,396 | ) | (38,314,216 | ) | ||||||
| (105,708 | ) | (335,977 | ) | (995,816 | ) | |||||||
| Interest rate swap contracts | ||||||||||||
| Outflows | (11,595 | ) | - | - | ||||||||
| $ | (120,747 | ) | $ | (337,648 | ) | $ | (995,816 | ) | ||||
| December 31, 2015 | ||||||||||||
| Net settled | ||||||||||||
| Forward exchange contracts | $ | (230 | ) | $ | 3,435 | $ | - | |||||
| Foreign currency option contracts | $ | 2,054 | $ | 8,735 | $ | - | ||||||
(Continued)
- 61 -
On Demand or Less than 1 Month | 1 to 3 Months | 3 Months to 1 Year | ||||||||||
| Gross settled | ||||||||||||
| Forward exchange contracts | ||||||||||||
| Inflows | $ | 2,822,265 | $ | 2,421,602 | $ | - | ||||||
| Outflows | (2,836,080 | ) | (2,429,050 | ) | - | |||||||
| (13,815 | ) | (7,448 | ) | - | ||||||||
| Swap contracts | ||||||||||||
| Inflows | 16,561,521 | 22,476,799 | 36,796,825 | |||||||||
| Outflows | (16,564,549 | ) | (22,007,274 | ) | (35,813,527 | ) | ||||||
| (3,028 | ) | 469,525 | 983,298 | |||||||||
| Interest rate swap contracts | ||||||||||||
| Inflows | 12,603 | 12,466 | 25,069 | |||||||||
| Outflows | (11,595 | ) | (11,469 | ) | (23,063 | ) | ||||||
| 1,008 | 997 | 2,006 | ||||||||||
| $ | (15,835 | ) | $ | 463,074 | $ | 985,304 | ||||||
| September 30, 2015 | ||||||||||||
| Net settled | ||||||||||||
| Forward exchange contracts | $ | (21,905 | ) | $ | (65,580 | ) | $ | - | ||||
| Gross settled | ||||||||||||
| Forward exchange contracts | ||||||||||||
| Inflows | $ | 3,405,810 | $ | 1,257,026 | $ | - | ||||||
| Outflows | (3,414,596 | ) | (1,249,060 | ) | - | |||||||
| (8,786 | ) | 7,966 | - | |||||||||
| Swap contracts | ||||||||||||
| Inflows | 19,580,602 | 40,269,898 | 38,880,941 | |||||||||
| Outflows | (19,146,168 | ) | (38,601,435 | ) | (37,542,335 | ) | ||||||
| 434,434 | 1,668,463 | 1,338,606 | ||||||||||
| Foreign currency option contracts | ||||||||||||
| Inflows | 69,759 | - | - | |||||||||
| Outflows | (65,745 | ) | - | - | ||||||||
| 4,014 | - | - | ||||||||||
| $ | 429,662 | $ | 1,676,429 | $ | 1,338,606 | |||||||
(Concluded)
| 33. | RELATED PARTY TRANSACTIONS |
Balances and transactions within the Group had been eliminated upon consolidation. Details of transactions between the Group and other related parties were disclosed as follows:
| a. | The Company contributed each NT$100,000 thousand to ASE Cultural and Educational Foundation in January 2016 and 2015, respectively, for environmental charity in promoting the related domestic environmental protection and public service activities (Note 35). |
- 62 -
| b. | During the third quarter in 2016, the Company acquired patents and acquired specific technology from associate at NT$403,543 thousand, which was primarily based on independent professional appraisal reports. As of September 30, 2016, NT$313,600 thousand has not been paid and the Company accrued payables under the line item of other payables and other non-current liabilities. |
| c. | During the second quarter in 2015, the Company acquired real estate from associate at NT$2,466,000 thousand, which was primarily based on independent professional appraisal reports and fully paid in the second quarter of 2015. |
| d. | The Company contracted with associate to construct a foreign labor dormitory on current lease property and NT$ 646,500 thousand and NT$172,400 thousand has been paid as of September 30, 2016 and 2015, respectively. |
| e. | In February 2016, USIE repurchased 1,801 thousand USIE’s outstanding ordinary shares from the Group’s key management personnel, with approximately NT$1,130,650 thousand. |
| f. | Compensation to key management personnel |
For the Three Months Ended September 30 | For the Nine Months Ended September 30 | |||||||||||||||
| 2016 | 2015 | 2016 | 2015 | |||||||||||||
| NT$ | NT$ | NT$ | NT$ | |||||||||||||
| Short-term employee benefits | $ | 209,947 | $ | 273,263 | $ | 610,714 | $ | 775,997 | ||||||||
| Post-employment benefits | 959 | 780 | 2,836 | 2,368 | ||||||||||||
| Share-based payments | 15,180 | 7,568 | 47,520 | 16,412 | ||||||||||||
| $ | 226,086 | $ | 281,611 | $ | 661,070 | $ | 794,777 | |||||||||
The compensation to the Company’s key management personnel is determined according to personal performance and market trends.
| 34. | ASSETS PLEDGED AS COLLATERAL OR FOR SECURITY |
In addition to Note 9, the following assets were provided as collateral for bank borrowings and the tariff guarantees of imported raw materials:
September 30, 2016 | December 31, 2015 | September 30, 2015 | ||||||||||
| NT$ | NT$ | NT$ | ||||||||||
| Inventories related to real estate business | $ | 19,272,915 | $ | 16,312,519 | $ | 11,599,303 | ||||||
| Other financial assets (including current and non-current) | 243,505 | 229,613 | 247,639 | |||||||||
| $ | 19,516,420 | $ | 16,542,132 | $ | 11,846,942 | |||||||
| 35. | SIGNIFICANT CONTINGENT LIABILITIES AND UNRECOGNIZED COMMITMENTS |
In addition to those disclosed in other notes, significant commitments and contingencies of the Group as of each balance sheet date were as follows:
- 63 -
| a. | Significant commitments |
| 1) | As of September 30, 2016, December 31, 2015 and September 30, 2015, unused letters of credit of the Group were approximately NT$88,000 thousand, NT$93,000 thousand and NT$38,000 thousand, respectively. |
| 2) | As of September 30, 2016, December 31, 2015 and September 30, 2015, outstanding commitments to purchase property, plant and equipment of the Group were approximately NT$6,983,924 thousand, NT$8,089,200 thousand and NT$8,395,000 thousand, respectively, of which NT$1,353,773 thousand, NT$1,756,990 thousand and NT$1,887,845 thousand had been prepaid, respectively. As of September 30, 2016, December 31, 2015 and September 30, 2015, the commitment that the Group has contracted for the construction related to the real estate business were approximately NT$2,106,576 thousand, NT$2,745,400 thousand and NT$2,774,135 thousand, respectively. |
| 3) | In consideration of corporate social responsibility for environmental protection, the Company’s board of directors, in December 2013, approved contributions to be made in the next 30 years, at a total amount of NT$3,000,000 thousand, at the minimum, to environmental protection efforts in Taiwan. |
| b. | Non-cancellable operating lease commitments |
| September 30, 2016 | ||||
| NT$ | ||||
| Less than 1 year | $ | 321,660 | ||
| 1 to 5 years | 501,574 | |||
| More than 5 years | 529,867 | |||
| $ | 1,353,101 | |||
| 36. | SIGNIFICANT ASSETS AND LIABILITIES DENOMINATED IN FOREIGN CURRENCIES |
The following information was aggregated by the foreign currencies other than functional currencies of the group entities and the exchange rates between foreign currencies and respective functional currencies were disclosed. The significant assets and liabilities denominated in foreign currencies were as follows:
Foreign Currencies (In Thousand) | Exchange Rate | Carrying Amount (In Thousand) | ||||||||
| September 30, 2016 | ||||||||||
| Monetary financial assets | ||||||||||
| US$ | $ | 3,455,665 | US$1=NT$31.36 | $ | 108,369,656 | |||||
| US$ | 1,028,436 | US$1=CNY6.6778 | 32,251,751 | |||||||
| JPY | 3,040,963 | JPY1=NT$0.3109 | 945,435 | |||||||
| JPY | 8,992,855 | JPY1=US$0.0099 | 2,795,879 | |||||||
| Monetary financial liabilities | ||||||||||
| US$ | 2,778,373 | US$1=NT$31.36 | 87,129,763 | |||||||
| US$ | 969,433 | US$1=CNY6.6778 | 30,401,433 | |||||||
| JPY | 6,985,135 | JPY1=NT$0.3109 | 2,171,678 | |||||||
| JPY | 9,313,192 | JPY1=US$0.0099 | 2,895,471 | |||||||
(Continued)
- 64 -
Foreign Currencies (In Thousand) | Exchange Rate | Carrying Amount (In Thousand) | ||||||||
| December 31, 2015 | ||||||||||
| Monetary financial assets | ||||||||||
| US$ | $ | 2,926,597 | US$1=NT$32.825 | $ | 96,065,552 | |||||
| US$ | 1,008,097 | US$1=CNY6.4936 | 33,090,795 | |||||||
| JPY | 3,380,683 | JPY1=NT$0.2727 | 921,912 | |||||||
| JPY | 8,467,689 | JPY1=US$0.0083 | 2,309,139 | |||||||
| Monetary financial liabilities | ||||||||||
| US$ | 2,988,953 | US$1=NT$32.825 | 98,112,393 | |||||||
| US$ | 995,195 | US$1=CNY6.4936 | 32,667,265 | |||||||
| JPY | 3,747,333 | JPY1=NT$0.2727 | 1,021,898 | |||||||
| JPY | 8,775,382 | JPY1=US$0.0083 | 2,393,047 | |||||||
| September 30, 2015 | ||||||||||
| Monetary financial assets | ||||||||||
| US$ | 3,630,216 | US$1=NT$32.87 | 119,325,202 | |||||||
| US$ | 1,099,391 | US$1=CNY6.3613 | 36,136,970 | |||||||
| JPY | 314,430 | JPY1=NT$0.2739 | 86,122 | |||||||
| JPY | 9,025,321 | JPY1=US$0.0083 | 2,472,035 | |||||||
| Monetary financial liabilities | ||||||||||
| US$ | 3,708,393 | US$1=NT$32.87 | 121,894,878 | |||||||
| US$ | 1,156,520 | US$1=CNY6.3613 | 38,014,804 | |||||||
| JPY | 4,493,549 | JPY1=NT$0.2739 | 1,230,783 | |||||||
| JPY | 9,277,840 | JPY1=US$0.0083 | 2,541,200 | |||||||
(Concluded)
The significant realized and unrealized foreign exchange gains (losses) were as follows:
For the Three Months Ended September 30, 2016 | For the Three Months Ended September 30, 2015 | |||||||||||
| Foreign Currencies | Exchange Rate | Net Foreign Exchange Gain (Loss) | Exchange Rate | Net Foreign Exchange Loss | ||||||||
| US$ | US$1=NT$31.36 | $ | (83,330 | ) | US$1=NT$32.87 | $ | (113,471 | ) | ||||
| NT$ | 1,635,486 | (2,223,718 | ) | |||||||||
| CNY | CNY1=NT$4.6962 | 27,079 | CNY1=NT$5.1672 | (269,976 | ) | |||||||
| $ | 1,579,235 | $ | (2,607,165 | ) | ||||||||
For the Nine Months Ended September 30, 2016 | For the Nine Months Ended September 30, 2015 | |||||||||||
| Foreign Currencies | Exchange Rate | Net Foreign Exchange Gain (Loss) | Exchange Rate | Net Foreign Exchange Gain (Loss) | ||||||||
| US$ | US$1=NT$31.36 | $ | (335,549 | ) | US$1=NT$32.87 | $ | 124,356 | |||||
| NT$ | 2,553,110 | (1,095,340 | ) | |||||||||
| CNY | CNY1=NT$4.6962 | 56,388 | CNY1=NT$5.1672 | (298,002 | ) | |||||||
| $ | 2,273,949 | $ | (1,268,986 | ) | ||||||||
- 65 -
| 37. | OTHERS |
| a. | In November 2015, the Company received a legal brief filed by SPIL in connection with a lawsuit brought by SPIL against the Company which was filed with Kaohsiung District Court. On June 27, 2016, as SPIL failed to pay the court expenses upon the deadline, the Kaohsiung District Court dismissed the lawsuit pursuant to the relevant law. As a result, the lawsuit does not have material impact on the financial position and the result of operations of the Group. |
| b. | On December 20, 2013, the Kaohsiung Environmental Protection Bureau (“KEPB”) imposed a fine of NT$102,014 thousand (“the Administrative Fine”) upon the Company for the violation of the Water Pollution Control Act . The Company filed an administrative appeal to nullify the Administrative Fine, which, however, was dismissed by the Kaohsiung City Government. The Company then filed a lawsuit with the Kaohsiung High Administrative Court seeking to revoke the dismissal decision made by the Kaohsiung City Government (the “Administrative Appeal Decision”) and the Administrative Fine, and to demand a refund of the fine paid by the Company. The judgment of the Kaohsiung High Administrative Court was rendered on March 22, 2016, ruling to revoke the Administrative Appeal Decision and the Administrative Fine, and to dismiss the other complaint filed by the Company (i.e., to demand a refund of the fine paid by the Company). The Company appealed against the unfavorable ruling on April 14, 2016 and the case is now being heard by the Supreme Administrative Court. Meanwhile, owing to the event above, in January 2014, the Kaohsiung District Prosecutors Office charged the Company with violation of the Waste Disposal Act. The Kaohsiung District Court handed down the judgment and the Company was fined NT$3,000 thousand. Then the Company appealed against the judgment to the Kaohsiung Branch of Taiwan High Court, and the Kaohsiung Branch of Taiwan High Court rendered on September 29, 2015 a final judgment of finding the Company not guilty of the criminal charge. |
| c. | For the future development and sustainable development of semiconductor industry , the Company’s board of directors approved in June 2016 to enter into and execute a joint share exchange agreement with SPIL to establish ASE Industrial Holding Co., Ltd. (”HoldCo”) and HoldCo will acquire all issued and outstanding shares of both ASE and SPIL in the way of share exchange. The share exchange will be conducted at an exchange ratio of 1 ordinary share of the Company for 0.5 ordinary share of HoldCo, and at NT$55 in cash per SPIL's ordinary share, which has been adjusted to NT$51.2 after SPIL’s appropriation of earnings in 2016 (Note 13). |
As of the date the consolidated financial statements were authorized for issue, the share exchange transaction which is based on the share exchange agreement is subject to the satisfaction of various conditions precedent (including but not limited to the unconditional approvals at the Company and SPIL's shareholders meeting, the approval or consent to consummate the transaction from all relevant competent authorities). Unless the Company and SPIL entering into an another agreement, this share exchange agreement shall be terminated automatically if the aforementioned conditions precedent are not satisfied or to be waived on or before December 31, 2017.
Due to the aforementioned share exchange agreement, treasury shares of the Company and the convertible bonds embedded with conversion option recognized as equity issued by the Company were affected as follows:
| 1) | For the outstanding balance of the Bonds, except where the Bonds have been redeemed or repurchased and cancelled or converted by the holders by exercising their conversion rights before the share exchange record date, the holders of the Bonds may, after the Company obtains approval from all relevant competent authorities and after the share exchange record date, convert such outstanding balance into newly issued HoldCo common shares. The conversion shall be subject to applicable laws, the indenture of the Bonds and the share exchange ratio. |
| 2) | Treasury shares purchased before the share exchange record date for the conversion of the Currency Linked Bonds will be exchanged to HoldCo's ordinary shares, which will still be hold by the |
- 66 -
Company, based on the agreed share exchange ratio. The conversion price of the Currency Linked Bonds shall also be adjusted in accordance with the agreed share exchange ratio in the joint share exchange agreement.
| 3) | For the employee share options issued by the Company upon the approval from relevant competent authorities before the execution of the joint share exchange agreement, HoldCo will assume the Company’s obligations under the employee share options as of the share exchange record date. Except that the exercise price and amount shall be adjusted in accordance with the agreed share exchange ratio and that the shares subject to exercise shall be converted into HoldCo’s newly issued ordinary shares, all other terms and conditions for issuance will remain the same. The final execution arrangements shall be made by HoldCo in compliance with relevant laws and regulations and subject to the approval of relevant competent authorities. |
| 38. | ADDITIONAL DISCLOSURES |
Following are the additional disclosures required by the Securities and Futures Bureau for ASE Inc.:
| a. | Financial provided: Please see Table 1 attached; |
| b. | Endorsement/guarantee provided: Please see Table 2 attached; |
| c. | Marketable securities held (excluding investments in subsidiaries, associates and joint venture): Please see Table 3 attached; |
| d. | Marketable securities acquired and disposed of at costs or prices of at least NT$300 million or 20% of the paid-in capital: Please see Table 4 attached; |
| e. | Acquisition of individual real estate properties at costs of at least NT$300 million or 20% of the paid-in capital: Please see Table 5 attached; |
| f. | Disposal of individual real estate properties at prices of at least NT$300 million or 20% of the paid-in capital: None; |
| g. | Total purchase from or sales to related parties of at least NT$100 million or 20% of the paid-in capital: |
Please see Table 6 attached;
| h. | Receivables from related parties amounting to at least NT$100 million or 20% of the paid-in capital: |
Please see Table 7 attached;
| i. | Information about the derivative financial instruments transaction: Please see Note 7; |
| j. | Others: The business relationship between the parent and the subsidiaries and significant transactions between them: Please see Table 10 attached; |
| k. | Names, locations, and related information of investees over which ASE Inc. exercises significant influence (excluding information on investment in Mainland China): Please see Table 8 attached; |
| l. | Information on investment in Mainland China |
| 1) | The name of the investee in Mainland China, the main businesses and products, its issued capital, method of investment, information on inflow or outflow of capital, percentage of ownership, income (losses) of the investee, share of profits/losses of investee, ending balance, amount received as dividends from the investee, and the limitation on investee: Please see Table 9 attached; |
- 67 -
| 2) | Any of the following significant transactions with investee companies in mainland China, either directly or indirectly through a third party, and their prices, payment terms, and unrealized gains or losses: |
| a) | The amount and percentage of purchases and the balance and percentage of the related payables at the end of the period: Please see Table 6 attached; |
| b) | The amount and percentage of sales and the balance and percentage of the related receivables at the end of the period: None; |
| c) | The amount of property transactions and the amount of the resultant gains or losses: No significant transactions; |
| d) | The balance of negotiable instrument endorsements or guarantees or pledges of collateral at the end of the period and the purposes: None; |
| e) | The highest balance, the end of period balance, the interest rate range, and total current period interest with respect to financing of funds: Please see Table 1 attached; |
| f) | Other transactions that have a material effect on the profit or loss for the period or on the financial position, such as the rendering or receiving of services: None. |
| 39. | OPERATING SEGMENTS INFORMATION |
The Group has the following reportable segments: Packaging, Testing and EMS. The Group packages bare semiconductors into finished semiconductors with enhanced electrical and thermal characteristics; provides testing services, including front-end engineering testing, wafer probing and final testing services; engages in the designing, assembling, manufacturing and sale of electronic components and telecommunications equipment motherboards. Information about other business activities and operating segments that are not reportable are combined and disclosed in “Others.” The Group engages in other activities such as substrate production and real estate business.
The accounting policies for segments are the same as those described in Note 4. The measurement basis for resources allocation and performance evaluation is based on profit before income tax.
Segment information for the nine months ended September 30, 2016 and 2015 was as follows:
| Packaging | Testing | EMS | Others | Adjustment and Elimination | Total | |||||||||||||||||||
| NT$ | NT$ | NT$ | NT$ | NT$ | NT$ | |||||||||||||||||||
For the nine months ended September 30, 2016 | ||||||||||||||||||||||||
| Revenue from external customers | $ | 91,662,376 | $ | 19,728,887 | $ | 80,768,466 | $ | 5,595,745 | $ | - | $ | 197,755,474 | ||||||||||||
| Inter-segment revenues (Note) | $ | 3,225,876 | $ | 183,035 | $ | 35,123,433 | $ | 7,057,756 | $ | (45,590,100 | ) | $ | - | |||||||||||
| Segment profit before income tax | $ | 8,468,036 | $ | 5,058,493 | $ | 2,868,374 | $ | 1,977,098 | $ | - | $ | 18,372,001 | ||||||||||||
| As of September 30, 2016 | ||||||||||||||||||||||||
| Segment assets | $ | 200,635,600 | $ | 42,705,683 | $ | 76,091,008 | $ | 41,195,429 | $ | - | $ | 360,627,720 | ||||||||||||
For the nine months ended September 30, 2015 | ||||||||||||||||||||||||
| Revenue from external customers | $ | 87,513,840 | $ | 18,836,024 | $ | 98,941,313 | $ | 2,463,197 | $ | - | $ | 207,754,374 | ||||||||||||
| Inter-segment revenues (Note) | $ | 7,338,347 | $ | 139,156 | $ | 41,930,125 | $ | 5,784,586 | $ | (55,192,214 | ) | $ | - | |||||||||||
| Segment profit before income tax | $ | 11,934,222 | $ | 4,634,291 | $ | 1,922,964 | $ | 225,139 | $ | - | $ | 18,716,616 | ||||||||||||
(Continued)
- 68 -
| Packaging | Testing | EMS | Others | Adjustment and Elimination | Total | |||||||||||||||||||
| NT$ | NT$ | NT$ | NT$ | NT$ | NT$ | |||||||||||||||||||
| As of September 30, 2015 | ||||||||||||||||||||||||
| Segment assets | $ | 194,463,369 | $ | 40,780,791 | $ | 88,452,992 | $ | 44,754,584 | $ | - | $ | 368,451,736 | ||||||||||||
(Concluded)
| Note: | Inter-segment revenues were eliminated upon consolidation. |
- 69 -
TABLE 1
ADVANCED SEMICONDUCTOR ENGINEERING, INC. AND SUBSIDIARIES
FINANCINGS PROVIDED
FOR THE NINE MONTHS ENDED SEPTEMBER 30, 2016
(Amounts In Thousands of New Taiwan Dollars)
| Collateral | Financing | |||||||||||||||||||||||
| No. | Financing Company | Counter-party | Financial Statement Account | Related Party | Maximum Balance for the period | Ending Balance | Amount Actual Drawn | Interest Rate | Nature for Financing | Transaction Amounts | Reason for Financing | Allowance for Bad Debt | Item | Value | Financing Limits for | Company's Total Financing Amount Limits (Note 2) | ||||||||
| 1 | A.S.E. Holding Limited | The Company | Other receivables form related parties | Yes | $ | 2,885,120 | $ | 2,885,120 | $ | 2,885,120 | 0.83~1.16 | The need for short-term financing | $ | - | Operating capital | $ | - | - | $ | - | $ | 2,992,746 | $ | 5,985,492 |
| ASE Trading (Shanghai) Ltd. | Long-term receivables form related parties | Yes | 834,000 | 784,000 | - | - | The need for short-term financing | - | Operating capital Payments for equipment | - | - | - | 15,015,898 | 22,523,848 | ||||||||||
| 2 | J & R Holding Limited | The Company | Other receivables form related parties | Yes | 9,408,000 | 9,408,000 | 7,024,640 | 0.83~1.16 | The need for short-term financing | - | Operating capital | - | - | - | 10,143,292 | 20,286,583 | ||||||||
| Global Advanced Packaging Technology Limited, Cayman Islands | Other receivables form related parties | Yes | 2,502,000 | 533,120 | 533,120 | 0.83~0.92 | The need for short-term financing | - | Operating capital | - | - | - | 15,015,898 | 22,523,848 | ||||||||||
| ASE WeiHai Inc. | Other receivables form related parties | Yes | 3,000,580 | 533,120 | 533,120 | 0.76~1.21 | The need for short-term financing | - | Operating capital | - | - | - | 15,015,898 | 22,523,848 | ||||||||||
| Omniquest Industrial Limited | Other receivables form related parties | Yes | 1,504,536 | 1,414,336 | 3,136 | 0.83~0.92 | The need for short-term financing | - | Operating capital | - | - | - | 15,015,898 | 22,523,848 | ||||||||||
| Long-term receivables form related parties | ||||||||||||||||||||||||
| ASE Assembly & Test(Shanghai) Limited | Long-term receivables form related parties | Yes | 567,120 | 533,120 | 533,120 | 0.84~1.24 | The need for short-term financing | - | Operating capital | - | - | - | 15,015,898 | 22,523,848 | ||||||||||
| Anstock Limited | Other receivables form related parties | Yes | 2,113,290 | 2,113,290 | 1,972,404 | 5.24~7.17 | The need for short-term financing | - | Operating capital | - | - | - | 15,015,898 | 22,523,848 | ||||||||||
| Long-term receivables form related parties | ||||||||||||||||||||||||
| ASE Trading (Shanghai) Ltd. | Long-term receivables form related parties | Yes | 5,004,000 | 4,704,000 | - | - | The need for short-term financing | - | Operating capital Payments for equipment | - | - | - | 15,015,898 | 22,523,848 | ||||||||||
| Innosource Limited | Long-term receivables form related parties | Yes | 733,920 | 3,136 | 3,136 | 0.83~0.93 | The need for short-term financing | - | Operating capital | - | - | - | 15,015,898 | 22,523,848 | ||||||||||
| ASE Corporation | Long-term receivables form related parties | Yes | 3,013,875 | 2,979,200 | 2,979,200 | 0.85~0.92 | The need for short-term financing | - | Operating capital | - | - | - | 15,015,898 | 22,523,848 | ||||||||||
| ASE Labuan Inc. | Long-term receivables form related parties | Yes | 645,500 | 627,200 | 627,200 | 0.85~0.92 | The need for short-term financing | - | Operating capital | - | - | - | 15,015,898 | 22,523,848 | ||||||||||
| ASE Investment (Labuan) Inc. | Long-term receivables form related parties | Yes | 1,269,000 | 1,254,400 | 1,254,400 | 0.91~0.92 | The need for short-term financing | - | Operating capital | - | - | - | 15,015,898 | 22,523,848 | ||||||||||
| Real Tech Holdings Limited | Other receivables form related parties | Yes | 2,168,400 | - | - | 0.83~0.89 | The need for short-term financing | - | Operating capital | - | - | - | 10,143,292 | 20,286,583 | ||||||||||
| 3 | ASE Test Limited | The Company | Other receivables form related parties | Yes | 5,805,675 | 5,738,880 | 5,738,880 | 0.83~1.15 | The need for short-term financing | - | Operating capital | - | - | - | 6,106,332 | 12,212,664 | ||||||||
| A.S.E. Holding Limited | Long-term receivables form related parties | Yes | 2,195,200 | 2,195,200 | 2,195,200 | 0.83~0.92 | The need for short-term financing | - | Operating capital | - | - | - | 15,015,898 | 22,523,848 | ||||||||||
| Omniquest Industrial Limited | Long-term receivables form related parties | Yes | 3,098,425 | 1,411,200 | 1,411,200 | 0.83~0.92 | The need for short-term financing | - | Operating capital | - | - | - | 15,015,898 | 22,523,848 | ||||||||||
| ASE Investment (Labuan) Inc. | Long-term receivables form related parties | Yes | 489,225 | 470,400 | 470,400 | 0.83~0.92 | The need for short-term financing | - | Operating capital | - | - | - | 15,015,898 | 22,523,848 | ||||||||||
| 4 | ASE Test, Inc. | The Company | Other receivables form related parties | Yes | 5,600,000 | 5,600,000 | 5,600,000 | 0.73~0.81 | The need for short-term financing | - | Operating capital | - | - | - | 5,771,215 | 11,542,430 | ||||||||
| ASE Trading (Shanghai) Ltd. | Other receivables form related parties | Yes | 667,200 | - | - | - | The need for short-term financing | - | Operating capital | - | - | - | 5,771,215 | 11,542,430 | ||||||||||
| ASE Corporation | Other receivables form related parties | Yes | 1,910,076 | - | - | 0.76~0.81 | The need for short-term financing | - | Operating capital | - | - | - | 5,771,215 | 11,542,430 | ||||||||||
| ASE Investment (Labuan) Inc. | Other receivables form related parties | Yes | 2,668,800 | 1,133,361 | 1,100,000 | 0.73~0.80 | The need for short-term financing | - | Operating capital | - | - | - | 5,771,215 | 11,542,430 | ||||||||||
| Advanced Microelectronic Products Inc. | Other receivables form related parties | Yes | 75,000 | 75,000 | 75,000 | 3.33 | The need for short-term financing | - | Operating capital | - | - | - | 5,771,215 | 11,542,430 | ||||||||||
| Omniquest Industrial Limited | Other receivables form related parties | Yes | 1,586,250 | 1,568,000 | 250,000 | 0.73 | The need for short-term financing | - | Operating capital | - | - | - | 5,771,215 | 11,542,430 | ||||||||||
(Continued)
- 70 -
ADVANCED SEMICONDUCTOR ENGINEERING, INC. AND SUBSIDIARIES
FINANCINGS PROVIDED
FOR THE NINE MONTHS ENDED SEPTEMBER 30, 2016
(Amounts In Thousands of New Taiwan Dollars)
| Collateral | Financing | |||||||||||||||||||||||
| No. | Financing Company | Counter-party | Financial Statement Account | Related Party | Maximum Balance for the period | Ending Balance | Amount Actual Drawn | Interest Rate | Nature for Financing | Transaction Amounts | Reason for Financing | Allowance for Bad Debt | Item | Value | Financing Limits for | Company's Total Financing Amount Limits (Note 2) | ||||||||
| 5 | J&R Industrial Inc. | The Company | Other receivables form related parties | Yes | $ | 190,000 | $ | 190,000 | $ | 190,000 | 0.73~0.81 | The need for short-term financing | $ | - | Operating capital | $ | - | - | $ | - | $ | 199,982 | $ | 399,965 |
| ASE Electronics Inc. | Other receivables form related parties | Yes | 190,000 | 190,000 | 190,000 | 0.73~0.81 | The need for short-term financing | - | Operating capital | - | - | - | 199,982 | 399,965 | ||||||||||
| 6 | ISE Labs, Inc. | J & R Holding Limited | Long-term receivables form related parties | Yes | 1,534,560 | 1,442,560 | 1,442,560 | 0.92~1.26 | The need for short-term financing | - | Operating capital | - | - | - | 15,015,898 | 22,523,848 | ||||||||
| 7 | ASE (Korea) Inc. | The Company | Other receivables form related parties | Yes | 3,002,400 | 2,508,800 | 2,195,200 | 3.43~3.52 | The need for short-term financing | - | Operating capital | - | - | - | 3,041,798 | 6,083,596 | ||||||||
| ASE WeiHai Inc. | Other receivables form related parties | Yes | 2,420,625 | 2,352,000 | 2,352,000 | 2.46~3.44 | The need for short-term financing | - | Operating capital | - | - | - | 15,015,898 | 22,523,848 | ||||||||||
| 8 | ASE Japan Co., Ltd. | J & R Holding Limited | Other receivables form related parties | Yes | 2,642,650 | 2,642,650 | 2,642,650 | 0.43~0.53 | The need for short-term financing | - | Operating capital | - | - | - | 15,015,898 | 22,523,848 | ||||||||
| 9 | USI Enterprise Limited | The Company | Other receivables form related parties | Yes | 7,584,625 | 7,369,600 | 7,369,600 | 0.83~0.92 | The need for short-term financing | - | Operating capital | - | - | - | 7,907,159 | 15,814,318 | ||||||||
| USIINC | Other receivables form related parties | Yes | 2,268,480 | 2,132,480 | 2,132,480 | 0.83~0.92 | The need for short-term financing | - | Operating capital | - | - | - | 7,907,159 | 15,814,318 | ||||||||||
| J&R Holding Limited | Other receivables form related parties | Yes | 6,475,392 | 3,136,000 | 3,136,000 | 0.83~3.37 | The need for short-term financing | - | Operating capital | - | - | - | 7,907,159 | 15,814,318 | ||||||||||
| 10 | Huntington Holdings International Co.Ltd. | The Company | Other receivables form related parties | Yes | 1,834,800 | 1,724,800 | 1,724,800 | 0.83~0.93 | The need for short-term financing | - | Operating capital | - | - | - | 8,690,863 | 17,381,726 | ||||||||
| 11 | Anstock Limited | ASE Assembly & Test (Shanghai) Limited | Other receivables form related parties | Yes | 3,274,092 | 2,028,758 | 2,028,758 | 4.45~5.07 | The need for short-term financing | - | Operating capital | - | - | - | 15,015,898 | 22,523,848 | ||||||||
| Long-term receivables form related parties | ||||||||||||||||||||||||
| 12 | ASE (Kun Shan) Inc. | ASE Investment
(Kun Shan) Limited
| Other receivables form related parties | Yes | 2,039 | 2,019 | 2,019 | 4.35~4.85 | The need for short-term financing | - | Operating capital | - | - | - | 15,015,898 | 22,523,848 | ||||||||
| 13 | Real Tech Holdings Limited | The Company | Other receivables form related parties | Yes | 4,003,200 | 1,724,800 | 1,724,800 | 0.83~0.93 | The need for short-term financing | - | Operating capital | - | - | - | 8,278,899 | 16,557,798 | ||||||||
| 14 | Shanghai Ding Hui Real Estate Development Co., Ltd. | Kun Shan Ding Hong Real Estate Development Co., Ltd. | Other receivables form related parties | Yes | 687,407 | 117,405 | 117,405 | 4.35~6.00 | The need for short-term financing | - | Operating capital | - | - | - | 15,015,898 | 22,523,848 | ||||||||
| Shanghai Ding Qi Property Management Co., Ltd. | Other receivables form related parties | Yes | 14,984 | 14,089 | 14,089 | 4.35 | The need for short-term financing | - | Operating capital | - | - | - | 15,015,898 | 22,523,848 | ||||||||||
| 15 | Universal Scientific Industrial (Shanghai) Co., Ltd. | Universal Global Technology (Kunshan) Co., Ltd. | Other receivables form related parties | Yes | 1,527,570 | - | - | - | The need for short-term financing | - | Operating capital | - | - | - | 6,810,764 | 13,621,527 | ||||||||
| Universal Global Technology (Shanghai) Co., Ltd. | Other receivables form related parties | Yes | 6,493,110 | 6,105,060 | 2,742,824 | 0.80~1.75 | The need for short-term financing | - | Operating capital | - | - | - | 6,810,764 | 13,621,527 | ||||||||||
| Universal Global Technology Co., Limited | Other receivables form related parties | Yes | 6,110,280 | 2,817,720 | - | - | The need for short-term financing | - | Operating capital | - | - | - | 6,810,764 | 13,621,527 | ||||||||||
| Universal Global Electronics (Shanghai) Co., Ltd. | Other receivables form related parties | Yes | 509,190 | - | - | - | The need for short-term financing | - | Operating capital | - | - | - | 6,810,764 | 13,621,527 | ||||||||||
| 16 | Omniquest Industrial Limited | The Company | Other receivables form related parties | Yes | 3,169,200 | 2,979,200 | 1,661,200 | 0.83~1.15 | The need for short-term financing | - | Operating capital | - | - | - | 3,229,408 | 6,458,817 | ||||||||
| 17 | Anstock II Limited | J & R Holding Limited | Other receivables form related parties | Yes | 9,907,920 | 9,313,920 | 9,313,920 | 2.45 | The need for short-term financing | - | Operating capital | - | - | - | 15,015,898 | 22,523,848 | ||||||||
| 18 | USI Electronics (Shenzhen) Co., Ltd. | Universal Global Technology (Shanghai) Co., Ltd. | Other receivables form related parties | Yes | 1,559,740 | 1,526,265 | 516,582 | 0.80~1.75 | The need for short-term financing | - | Operating capital | - | - | - | 1,881,950 | 3,763,899 | ||||||||
| Universal Global Technology Co., Limited | Other receivables form related parties | Yes | 1,526,265 | 1,526,265 | - | - | The need for short-term financing | - | Operating capital | - | - | - | 1,881,950 | 3,763,899 | ||||||||||
(Continued)
- 71 -
| Collateral | Financing | |||||||||||||||
| No. | Financing Company | Counter-party | Financial Statement Account | Related Party | Maximum Balance for the period | Ending Balance | Amount Actual Drawn | Interest Rate | Nature for Financing | Transaction Amounts | Reason for Financing | Allowance for Bad Debt | Item | Value | Financing Limits for | Company's Total Financing Amount Limits (Note 2) |
| 19 | ASE Assembly & Test (Shanghai) Limited | ASE Trading (Shanghai) Ltd. | Long-term receivables form related parties | Yes | $ 1,000,800 | $ 940,800 | $ - | - | The need for short-term financing | $ - | Operating capital | $ - | - | $ - | $ 15,015,898 | $ 22,523,848 |
| 20 | ASE Trading (Shanghai) Ltd. | J & R Holding Limited | Long-term receivables form related parties | Yes | 6,672,000 | 6,272,000 | - | - | The need for short-term financing | - | Operating capital | - | - | - | 15,015,898 | 22,523,848 |
| A.S.E. Holding Limited | Long-term receivables form related parties | Yes | 3,336,000 | 3,136,000 | - | - | The need for short-term financing | - | Operating capital | - | - | - | 15,015,898 | 22,523,848 | ||
| 21 | ASE (Shanghai) Inc. | ASE WeiHai Inc. | Other receivables form related parties | Yes | 166,800 | - | - | 1.12~1.19 | The need for short-term financing | - | Operating capital | - | - | - | 15,015,898 | 22,523,848 |
| 22 | Innosource Limited | The Company | Other receivables form related parties | Yes | 733,920 | - | - | 0.83~0.89 | The need for short-term financing | - | Operating capital | - | - | - | 788,348 | 1,576,695 |
| 23 | ASE Investment (Labuan) Inc. | The Company | Other receivables form related parties | Yes | 3,169,200 | 2,858,161 | 2,821,664 | 0.76~1.15 | The need for short-term financing | - | Operating capital | - | - | - | 3,075,374 | 6,150,749 |
| 24 | Global Advanced Packaging Technology Limited, Cayman Islands | The Company | Other receivables form related parties | Yes | 1,968,240 | - | - | 0.83~0.92 | The need for short-term financing | - | Operating capital | - | - | - | 2,134,600 | 4,269,200 |
| 25 | ASE Corporation | The Company | Other receivables form related parties | Yes | 3,061,011 | 2,979,200 | 2,979,200 | 0.76~1.15 | The need for short-term financing | - | Operating capital | - | - | - | 3,230,671 | 6,461,342 |
| 26 | ASE Electronics Inc. | The Company | Other receivables form related parties | Yes | 200,000 | - | - | 0.76~0.81 | The need for short-term financing | - | Operating capital | - | - | - | 811,695 | 1,623,390 |
| 27 | ASE Singapore Pte. Ltd. | A.S.E. Holding Limited | Other receivables form related parties | Yes | 400,320 | - | - | 0.83~0.89 | The need for short-term financing | - | Operating capital | - | - | - | 15,015,898 | 22,523,848 |
| 28 | Universal Scientific (Kunshan) Co., Ltd. | Universal Global Technology (Shanghai) Co., Ltd. | Other receivables form related parties | Yes | 399,576 | 375,696 | 234,810 | 1.75 | The need for short-term financing | - | Operating capital | - | - | - | 531,063 | 1,062,125 |
| 29 | ASE Labuan Inc. | The Company | Other receivables form related parties | Yes | 645,500 | 627,200 | 627,200 | 0.85~1.15 | The need for short-term financing | - | Operating capital | - | - | - | 815,251 | 1,630,502 |
(Concluded)
| Note 1: | Limit amount of lending to a company shall not exceed 20% of the net worth of the company. However, when the foreign subsidiaries whose voting shares are 100% owned directly or indirectly, by ASE as a lender, the amount lending to a company shall not exceed 10% of the net worth of ASE. |
| Note 2: | Where an inter-company or inter-firm short-term financing facility is necessary provided that the total amount of such financing facility shall not exceed 40% of the amount of the net worth of the lending company. However, the foreign subsidiaries whose voting shares are 100% owned directly or indirectly, by ASE as a lender, the total amount lending to a company shall not exceed 15% of the net worth of ASE. |
| Note 3: | Amount was eliminated based on the reviewed financial statements. |
- 72 -
TABLE 2
ADVANCED SEMICONDUCTOR ENGINEERING, INC. AND SUBSIDIARIES
ENDORSEMENTS/GUARANTEES PROVIDED
FOR THE NINE MONTHS ENDED SEPTEMBER 30, 2016
(Amounts In Thousands of New Taiwan Dollars)
Endorsement | Guaranteed Party | ||||||||||||
No. | Name | Name | Nature of Relationship | Limits on Endorsement Guarantee Amount Provided to Each Guaranteed Party | Maximum Balance for the Year | Ending Balance | Amount Actually Drawn | Amount of Endorsement Guarantee Collateralized by Properties | Ratio of Accumulated Endorsement Guarantee to Net Equity per Latest Financial Statement | Maximum Endorsement Guarantee Amount Allowable (Note 2) | Guarantee Provided by Parent Company | Guarantee Provided by A Subsidiary | Guarantee Provided to Subsidiaries in Manchuria CHINA |
| 0 | The Company | Anstock Limited | 100% voting shares indirectly owned by the Company | $ 45,047,695 | $ 2,653,363
(Note 3)
| $ -
(Note 3)
| $ -
(Note 3)
| $ - | - | $ 60,063,594 | Yes | No | No |
| Anstock II Limited | 100% voting shares indirectly owned by the Company | 45,047,695 | 10,327,005 (Note 3) | 9,607,920 (Note 3) | 9,445,763 (Note 3) | - | 6.4 | 60,063,594 | Yes | No | No | ||
| 1 | Shanghai Ding Hui Real Estate Development Co., Ltd. | Kun Shan Ding Hong Real Estate Development Co., Ltd. | 100% voting shares directly owned by the Company | 13,299,138 | 633,647
(Note 3)
| 585,762 (Note 3) | 470,271 (Note 3) | - | 3.1 | 18,998,769 | Yes | No | Yes |
| Note 1: | The ceilings on the amounts for any single entity is permitted to make in endorsements/guarantees shall not exceed 30% and 70% of total equity of shareholders, respectively, according to “The Process of make in endorsements/guarantees” of ASE and DH. |
| Note 2: | The ceilings on the aggregate amounts are permitted to make in endorsements/guarantees shall not exceed 40% and 100% of total equity of shareholders, respectively, according to “The Process of make in endorsements/guarantees” of ASE and DH. |
| Note 3: | Amount was included principal and interest. |
- 73 -
TABLE 3
ADVANCED SEMICONDUCTOR ENGINEERING, INC. AND SUBSIDIARIES
MARKETABLE SECURITIES HELD
SEPTEMBER 30, 2016
(Amounts In Thousands of New Taiwan Dollars, Unless Specified Otherwise)
September 30, 2016 | ||||||||
Held Company Name | Marketable Securities Type and Name | Relationship with the Company | Financial Statement Account` | Shares/Units | Carrying Value | Percentage of Ownership (%) | Fair Value | Note |
| The Company | Stock
H&HH Venture Investment Corporation
| - | Available-for-sale financial assets - non-current | 884,832 | $ - | 15 | $ - | |
| H&D Venture Capital Investment Corporation | - | Available-for-sale financial assets - non-current | 1,613,793 | 23,125 | 13 | 23,125 | ||
| MiTAC Information Technology Corp | - | Available-for-sale financial assets - non-current | 4,203 | 20 | - | 20 | ||
| Asia Pacifical Emerging Industry Venture Capital Co, Ltd. | - | Available-for-sale financial assets - non-current | 6,000,000 | 37,473 | 7 | 37,473 | ||
| StarChips Technology Inc. | - | Available-for-sale financial assets - non-current | 333,334 | - | 6 | - | ||
Bond
AMPI Second Private of Domestic Unsecured
Convertible Bonds
| - | Financial assets at fair value through profit or loss - current | 1,000 | 100,583 | - | 100,583 | ||
| Limited Liability Partnership Ripley Cable Holdings I, L.P. | - | Available-for-sale financial assets - non-current | - | 390,987 | 4 | 390,987 | ||
| ASE Test, Inc. | Stock
The Company
| Parent Company | Available-for-sale financial assets - non-current | 10,978,776 | 412,802 | - | 412,802 | |
| Powertec Energy Corporation | - | Available-for-sale financial assets - non-current | 97,000,000 | 291,000 | 4 | 291,000 | ||
| MiTAC Information Technology Corp | - | Available-for-sale financial assets - non-current | 1,133,363 | 5,273 | 1 | 5,273 | ||
Fund
CTBC Global Real Estate Income Fund-A
| - | Available-for-sale financial assets - current | 2,500,000 | 24,200 | - | 24,200 | ||
Corporate bond
Nan Shan Life Insurance Co., Ltd. 1st Perpetual Unsecured
Subordinate Corporate Bond Issue in 2016
| - | Other financial assets - non-current | 1,000 | 1,000,000 | - | 1,000,000 | ||
| J&R Industrial Inc. | Fund
Taishin Ta Chong Money Market Fund
| - | Financial assets at fair value through profit or loss - current | 33,664,705 | 473,376 | - | 473,376 | |
| Jih Sun Money Market Fund | - | Financial assets at fair value through profit or loss - current | 1,575,019 | 23,090 | - | 23,090 | ||
| Hua Nan Kirin Money Market Fund | - | Financial assets at fair value through profit or loss - current | 2,616,592 | 31,026 | - | 31,026 | ||
| Hua Nan Phoenix Money Market Fund | - | Financial assets at fair value through profit or loss - current | 2,833,825 | 45,639 | - | 45,639 | ||
| Luchu Development Corporation | Stock
Powerchip Technology Corporation
| - | Available-for-sale financial assets - non-current | 1,677,166 | 40,520 | - | 40,520 | |
| A.S.E. Holding Limited | Stock
Global Strategic Investment Inc.
| - | Available-for-sale financial assets - non-current | 490,000 | US$ 512 thousand | 3 | US$ 512 thousand | |
| SiPhoton, Inc. | - | Available-for-sale financial assets - non-current | 544,800 | US$ - thousand | 4 | US$ - thousand | ||
| Global Strategic Investment, Inc. (Samoa) | - | Available-for-sale financial assets - non-current | 869,891 | US$ 564 thousand | 2 | US$ 564 thousand | ||
| J & R Holding Limited | Stock
The Company
| Parent Company | Available-for-sale financial assets - non-current | 46,703,763 | US$ 55,997 thousand | 1 | US$ 55,997 thousand | |
(Continued)
- 74 -
September 30, 2016 | ||||||||
Held Company Name | Marketable Securities Type and Name | Relationship with the Company | Financial Statement Account` | Shares/Units | Carrying Value | Percentage of Ownership (%) | Fair Value | Note |
| Limited Liability Partnership Crimson Velocity Fund, L.P. | - | Available-for-sale financial assets - non-current | - | US$ 812 thousand | - | US$ 812 thousand | ||
| H&QAP Greater China Growth Fund, L.P. | - | Available-for-sale financial assets - non-current | - | US$ 1,036 thousand | 8 | US$ 1,036 thousand | ||
| ASE Test Limited | Stock
The Company
| Parent Company | Available-for-sale financial assets - non-current | 88,200,472 (Note) | US$ 105,751 thousand | 1 | US$ 105,751 thousand | |
| Shanghai Ding Hui Real Estate Development Co., Ltd. | Fund
180ETF
| - | Financial assets at fair value through profit or loss - current | 447,825 | CNY 1,276 thousand | - | CNY 1,276 thousand | |
| 300ETF | - | Financial assets at fair value through profit or loss - current | 339,700 | CNY 1,128 thousand | - | CNY 1,128 thousand | ||
Stock
Gree Electric Appliances, Inc. Of Zhuhai
| - | Financial assets at fair value through profit or loss - current | 28,000 | CNY 622 thousand | - | CNY 622 thousand | ||
| Saic Motor Corporation Limited | - | Financial assets at fair value through profit or loss - current | 19,250 | CNY 421 thousand | - | CNY 421 thousand | ||
| USIINC | Stock
Allied Circuit Co., Ltd
| - | Available-for-sale financial assets - current | 827,009 | $ 25,885 | 2 | $ 25,885 | |
| Universal Venture Capital Investment Corporation | - | Available-for-sale financial assets - non-current | 6,200,000 | 34,746 | 5 | 34,746 | ||
| Gapertise Inc. | - | Available-for-sale financial assets - non-current | 247,500 | 3,064 | 4 | 3,064 | ||
| WellySun Inc. | - | Available-for-sale financial assets - non-current | 108,000 | 1,728 | 1 | 1,728 | ||
| Plasmag Technology Inc. | - | Available-for-sale financial assets - non-current | 733,000 | - | 2 | - | ||
| Huntington Holdings International Co., Ltd. | Stock
United Pacific Industrial Ltd.
| - | Financial assets at fair value through profit or loss - current | 5,548,800 | US$ 351 thousand | - | US$ 351 thousand | |
| Cadence Design SYS Inc. | - | Financial assets at fair value through profit or loss - current | 9,633 | US$ 246 thousand | - | US$ 246 thousand | ||
| Solid Gain Invenstments Ltd. | - | Available-for-sale financial assets - non-current | 1,322,833 | US$ 710 thousand | 20 | US$ 710 thousand | ||
Preferred Stock
Techgains I Corporation
| - | Available-for-sale financial assets - non-current | 526,732 | US$ 267 thousand | 10 | US$ 267 thousand | ||
| Techgains II Corporation | - | Available-for-sale financial assets - non-current | 669,705 | US$ 185 thousand | 4 | US$ 185 thousand | ||
| Unitech Holdings International Co., Ltd. | Stock
United Pacific Industrial Ltd.
| - | Financial assets at fair value through profit or loss - current | 5,613,600 | US$ 355 thousand | - | US$ 355 thousand | |
| WacomCo., Ltd. | - | Available-for-sale financial assets - non-current | 1,200,000 | US$ 3,628 thousand | 1 | US$ 3,628 thousand | ||
| Sequans Communications SA | - | Available-for-sale financial assets - non-current | 370,554 | US$ 656 thousand | 1 | US$ 656 thousand | ||
| Asia Global Venture Co., Ltd. | - | Available-for-sale financial assets - non-current | 1,000,000 | US$ 431 thousand | 10 | US$ 431 thousand | ||
| UG-TW | Fund
Franklin U.S. Government Money Fund
| - | Available-for-sale financial assets - current | 1,956,583 | $ 20,007 | - | $ 20,007 | |
(Concluded)
| Note: | ASE, Inc.'s stocks held by ASE Test Limited, 88,200,472 shares, are all trusted without power to decide the allocation of the trust assets. |
- 75 -
TABLE 4
ADVANCED SEMICONDUCTOR ENGINEERING, INC. AND SUBSIDIARIES
MARKETABLE SECURITIES ACQUIRED AND DISPOSED OF AT COSTS OR PRICES OF AT LEAST NT$300 MILLION OR 20% OF THE PAID-IN CAPITAL
FOR THE NINE MONTHS ENDED SEPTEMBER 30, 2016
(Amounts In Thousands of New Taiwan Dollars, Unless Specified Otherwise)
| Beginning Balance | Acquisition | Disposal | Ending Balance | ||||||||||||
| Company Name | Marketable Securities Type and Name | Financial Statement Account | Counter-party | Nature of Relationship | Shares/Units | Amount (Note 1) | Shares/Units | Amount | Shares/ Units | Amount | Carrying Value | Gain/Loss on Disposal | Shares/Units | Amount (Note 1) | |
| The Company | Stock
USI
| Investments accounted for using the equity method | (Note 2) | Subsidary | 39,603,222 | $ 1,187,548 | - | $ - | 39,603,222 | $ 792,064 | $ 1,242,836 | $ - | - | $ - | |
| SPIL | Investments accounted for using the equity method | (Note 3) | Associate | 779,000,000 | 35,141,701 | 258,300,000 | 13,735,498 | - | - | - | - | 1,037,300,000 | 45,613,346 | ||
| Deca Technologies Inc., | Investments accounted for using the equity method | (Note 3) | Associate | - | - | 98,489,803 | 1,934,062 | - | - | - | - | 98,489,803 | 1,892,542 | ||
| ASE Test, Inc. | Fund UPAMC JAMES BOND MONEY MARKET FUND
| Available-for-sale financial assets - current | - | - | - | - | 18,170,696 | 300,000 | 18,170,696 | 300,454 | 300,000 | 454 | - | - | |
Corporate bond Nan Shan Life Insurance Co., Ltd. 1st Perpetual Unsecured Subordinate Corporate Bond Issue in 2016
| Other financial assets - non-current | - | - | - | - | 1,000 | 1,000,000 | - | - | - | - | 1,000 | 1,000,000 | ||
| UGTW | Stock
USI
| Investments accounted for using the equity method | (Note 2) | Subsidary | - | - | 39,603,222 | 894,612 | - | - | - | - | 39,603,222 | 1,130,788 | |
| UGHK | Stock
UGTW
| Investments accounted for using the equity method | (Note 4) | Subsidary | 98,000,000 | US$ | 83,745 | 100,000,000 | US$ 31,835 | - | - | - | - | 198,000,000 | US$ 130,444 |
| Note 1: | The ending balance of Long-Term Stock Investment-Equity Method includes share of profits/losses of investees and other related adjustment to equity. The ending balance of other financial assets includes the adjustment to fair value. |
| Note 2: | Organizational restructuring due to the acquiring of USI by UG-TW. |
| Note 3: | Acquired by Public Market. |
| Note 4: | Capital Increase by Cash. |
- 76 -
TABLE 5
ADVANCED SEMICONDUCTOR ENGINEERING, INC. AND SUBSIDIARIES
ACQUISITION OF INDIVIDUAL REAL ESTATE PROPERTIES AT COSTS OF AT LEAST NT$300 MILLION OR 20% OF THE PAID-IN CAPITAL
FOR THE NINE MONTHS ENDED SEPTEMBER 30, 2016
(Amounts In Thousands of New Taiwan Dollars, Unless Specified Otherwise)
| Prior Transaction of Related Counter-party | |||||||||||||
| Company Name | Types of Property | Transaction Date | Transaction Date (Tax excluded) | Payment Term | Counter-party | Nature of Relationships | Owner | Relationships | Transfer Date | Amount | Price Reference | Purpose of Acquisition | Other Terms |
| The Company | Facilities and equipment of ASE's Kaohsiung factory Processing Zone, Kaohsiung City
| January 01, 2016~ September 30, 2016 | $ 350,427 | There is 21,303 thousand will be paid after acceptance check. | United Integrated Services Co., Ltd. | - | - | - | - | $ - | Request for quotation, price comparison and price negotiation | Facilities and equipment expansion | None |
- 77 -
TABLE 6
ADVANCED SEMICONDUCTOR ENGINEERING, INC. AND SUBSIDIARIES
TOTAL PURCHASES FROM OR SALES TO RELATED PARTIES OF AT LEAST NT$100 MILLION OR 20% OF THE PAID-IN CAPITAL
FOR THE NINE MONTHS ENDED SEPTEMBER 30, 2016
(Amounts In Thousands of New Taiwan Dollars)
| Transaction Details | Abnormal Transaction | Notes/Accounts Payable or Receivable | |||||||||
| Buyer | Related Party | Relationships | Purchases/ Sales | Amount | % to Total | Payment Terms | Unit Price | Payment Terms | Ending Balance | % to Total | Note |
| The Company | ASE (Shanghai) Inc. | Subsidiary | Purchases | $ 1,653,730 | 6 | Net 60 days from the end of the month of when invoice is issued | $ - | - | $ (510,614 ) | (5 ) | Note |
| ASE Electronics Inc. | Subsidiary | Purchases | 1,935,410 | 7 | Net 60 days from the end of the month of when invoice is issued | - | - | (692,217 ) | (7 ) | Note | |
| Universal Scientific Industrial Co., Ltd. | Subsidiary | Sales | (2,891,916 ) | (4 ) | Net 60 days from the end of the month of when invoice is issued | - | - | 1,428,076 | 7 | Note | |
| ISE Labs, Inc. | Subsidiary | Sales | (125,021 ) | - | Net 45 days from invoice date | - | - | 42,203 | - | Note | |
| ASE Assembly & Test (Shanghai) Limited | ASE (Shanghai) Inc. | Associate | Purchases | 182,463 | 8 | Net 60 days from the end of the month of when invoice is issued | - | - | (186 ) | - | Note |
| ASE Electronics Inc. | Associate | Purchases | 163,303 | 7 | Net 60 days from the end of the month of when invoice is issued | - | - | (52,079 ) | (9 ) | Note | |
| Advanced Semiconductor Engineering (HK) Limited | ASE (Shanghai) Inc. | Parent company | Purchases | 1,201,962 | 100 | Net 90 days from the end of the month of when invoice is issued | - | - | (481,202 ) | (100 ) | Note |
| ASE Electronics (M) Sdn. Bhd. | ASE Electronics Inc. | Associate | Purchases | 338,177 | 28 | Net 60 days from invoice date | - | - | (87,926 ) | (33 ) | Note |
| ISE Labs, Inc. | The Company | The Ultimate Parent of the Company | Purchases | 125,021 | 52 | Net 45 days from invoice date | - | - | (40,203 ) | (40 ) | Note |
| Universal Scientific Industrial Co., Ltd. | The Company | The Ultimate Parent of the Company | Purchases | 2,891,916 | 18 | Net 60 days from the end of the month of when invoice is issued | - | - | (1,427,212 ) | (28 ) | Note |
| ASE (Shanghai) Inc. | The Company | The Ultimate Parent of the Company | Sales | (1,653,730 ) | (45 ) | Net 60 days from the end of the month of when invoice is issued | - | - | 512,966 | 46 | Note |
| ASE Assembly & Test (Shanghai) Limited | Associate | Sales | (182,463 ) | (5 ) | Net 60 days from invoice date | - | - | 186 | - | Note | |
| Advanced Semiconductor Engineering (HK) Limited | Subsidiary | Sales | (1,201,962 ) | (33 ) | Net 90 days from the end of the month of when invoice is issued | - | - | 481,202 | 43 | Note | |
| ASE Electronics Inc. | The Company | The Ultimate Parent of the Company | Sales | (1,935,410 ) | (55 ) | Net 60 days from the end of the month of when invoice is issued | - | - | 703,336 | 59 | Note |
| ASE Electronics (M) Sdn. Bhd. | Associate | Sales | (338,177 ) | (10 ) | Net 60 days from invoice date | - | - | 88,124 | 7 | Note | |
| ASE Assembly & Test (Shanghai) Limited | Associate | Sales | (163,303 ) | (5 ) | Net 60 days from the end of the month of when invoice is issued | - | - | 52,079 | 4 | Note | |
| Universal Scientific Industrial (Shanghai) Co., Ltd. | Associate | Sales | (140,611 ) | (4 ) | Net 60 days from the end of the month of when invoice is issued | - | - | 86,038 | 7 | Note | |
(Continued)
- 78 -
| Transaction Details | Abnormal Transaction | Notes/Accounts Payable or Receivable | |||||||||
| Buyer | Related Party | Relationships | Purchases/ Sales | Amount | % to Total | Payment Terms | Unit Price | Payment Terms | Ending Balance | % to Total | Note |
| Suzhou ASEN Semiconductors Co., Ltd. | NXP Semiconductors Taiwan Ltd. | Subsidiary of the company has significant influence over Suzhou ASEN Semiconductors Co., Ltd.-Subsidiary of NXP B.V | Sales | $ (1,504,582) | (34 ) | Net 90 days from the end of the month of when invoice is issued | $ -- | - | $ 689,585 | 45 | Note |
| USI Electronics (Shenzhen) Co., Ltd. | Universal Global Scientific Industrial Co., Ltd. | Associate | Purchases Sales | CNY 459,898 thousand
( CNY 1,923,195 thousand )
| 17
(56 )
| T/T 75 days T/T 75 days | -
-
| -
-
| ( CNY 130,512 thousand )
CNY 597,193 thousand
| (11 )
54
| Note Note |
| Universal Scientific Industrial (Shanghai) Co., Ltd. | Universal Global Technology Co., Limited | Subsidiary | Purchases | CNY 643,050 thousand | 13 | T/T 75 days | - | - | ( CNY 151,892 thousand ) | (10 ) | Note |
| Universal Global Scientific Industrial Co., Ltd. | Subsidiary | Sales | ( CNY 44,113 thousand ) | (1 ) | T/T 75 days | - | - | CNY 17,818 thousand | 1 | Note | |
| Universal Global Technology (Kunshan) Co., Ltd. | Subsidiary | Sales | ( CNY 23,047 thousand ) | - | T/T 75 days | - | - | CNY 6,323 thousand | - | Note | |
| USI Electronics (Shenzhen) Co., Ltd. | Subsidiary | Sales | ( CNY 27,049 thousand ) | - | T/T 75 days | - | - | CNY 119 thousand | - | Note | |
| ASE Electronics Inc. | Associate | Purchases | CNY 31,812 thousand | 1 | Net 60 days from the end of the month of when invoice is issued | - | - | CNY 17,533 thousand | 1 | Note | |
| Universal Global Technology Co., Limited | Universal Scientific Industrial (Shanghai) Co., Ltd. | Parent company | Sales | ( US$ 96,073 thousand ) | (55 ) | T/T 75 days | - | - | US$ 22,749 thousand | 40 | Note |
| Universal Global Technology (Kunshan) Co., Ltd. | Associate | Sales | ( US$ 77,310 thousand ) | (44 ) | T/T 75 days | - | - | US$ 30,738 thousand | 54 | Note | |
| Universal Global Industrial Co., Limited | USI Electronics (Shenzhen) Co., Ltd. | Associate | Purchases Sales | US$ 292,675 thousand
( US$ 68,275 thousand )
| 51
(14 )
| T/T 75 days T/T 75 days | -
-
| -
-
| ( US$ 89,430 thousand )
US$ 19,384 thousand
| (52 )
12
| Note Note |
| Universal Scientific Industrial (Shanghai) Co., Ltd. | Parent company | Purchases | US$ 6,696 thousand | 1 | T/T 75 days | - | - | ( US$ 2,668 thousand ) | (2 ) | Note | |
| Universal Global Scientific Industrial Co., Ltd. | Associate | Sales | ( US$ 354,711 thousand ) | (70 ) | T/T 75 days | - | - | US$ 113,669 thousand | 68 | Note | |
| Universal Global Technology (Kunshan) Co., Ltd. | Associate | Purchases Sales | US$ 134,750 thousand
( US$ 5,859 thousand )
| 24
(1 )
| T/T 75 days T/T 75 days | -
-
| -
-
| ( US$ 44,302 thousand )
US$ 2,126 thousand
| (26 )
1
| Note Note | |
| Universal Global Scientific Industrial Co., Ltd. | Universal Global Industrial Co., Limited | Associate | Purchases | $ 11,527,285 | 90 | T/T 75 days | - | - | $ (3,564,648 ) | (84 ) | Note |
| Universal Scientific Industrial (Shanghai) Co., Ltd. | Parent company | Sales | (201,454 ) | (1 ) | T/T 75 days | - | - | 72,440 | 1 | Note | |
| USI Electronics (Shenzhen) Co., Ltd. | Associate | Sales | (155,660 ) | (1 ) | T/T 75 days | - | - | 41,324 | 1 | Note | |
| Universal Scientific Industrial Co., Ltd. | Subsidiary | Sales | (497,145 ) | (3 ) | T/T 75 days | - | - | 217,476 | 4 | Note | |
| Universal Global Technology (Kunshan) Co., Ltd. | Universal Global Technology Co., Limited | Associate | Purchases | CNY 519,410 thousand | 39 | T/T 75 days | - | - | ( CNY 205,212 thousand ) | (34 ) | Note |
| Universal Global Industrial Co., Limited | Associate | Purchases | CNY 38,520 thousand | 3 | T/T 75 days | - | - | ( CNY 14,196 thousand ) | (2 ) | Note | |
| Sales | ( CNY 889,815 thousand) | (55 ) | T/T 75 days | - | - | CNY 296,718 thousand | 50 | Note | |||
Universal Global Technology
(Shanghai) Co., Ltd.
| Universal Global Technology
Co., Limited
| Associate | Purchases | CNY 21,486 thousand | 2 | T/T 75 days | - | - | ( CNY 19,539 thousand ) | (3 ) | Note |
| Note: Amount was eliminated based on the reviewed financial statements. | (Concluded) |
- 79 -
TABLE 7
ADVANCED SEMICONDUCTOR ENGINEERING, INC. AND SUBSIDIARIES
RECEIVABLES FROM RELATED PARTIES AMOUNTING TO AT LEAST NT$100 MILLION OR 20% OF THE PAID-IN CAPITAL
SEPTEMBER 30, 2016
(Amounts In Thousands of New Taiwan Dollars, Unless Specified Otherwise)
| Overdue (Note 1) | |||||||||||||
| Company Name | Related Party | Relationships | Ending Balance (Note 1) | Turnover Rate (Note 2) | Amount | Actions Taken | Amounts Received in Subsequent Period | Allowance for Bad Debts | |||||
| The Company | Universal Scientific Industrial Co., Ltd. | Subsidiary | $ | 1,428,076 | (Note 5) | 2 | $ | 39,491 | Continued collection | $ | 198,732 | $ | - |
| ASE Test, Inc. | Subsidiary | 291,696 | (Note 5) | 4 | 32,879 | Continued collection | 200,316 | - | |||||
| ASE Electronics Inc. | Subsidiary | 140,321 | (Note 5) | 3 | - | - | 6,781 | - | |||||
| ASE Electronics Inc. | The Company | The Ultimate Parent of the Company | 705,668 | (Note 5) | 4 | - | - | 266,569 | - | ||||
| Omniquest Industrial Limited | The Company | Parent company | 1,661,200 | (Notes 3,5) | - | - | - | - | - | ||||
| ISE Labs, Inc. | J & R Holding Limited | Parent company | 1,442,959 | (Notes 3,5) | - | - | - | - | - | ||||
| Anstock Limited | ASE Assembly & Test (Shanghai) Limited | Associate | 2,032,960 | (Notes 3,5) | - | - | - | - | - | ||||
| Anstock II Limited | J & R Holding Limited | Parent company | 9,372,235 | (Notes 3,5) | - | - | - | - | - | ||||
| A.S.E. Holding Limited | The Company | Parent company | 2,885,120 | (Notes 3,5) | - | - | - | - | - | ||||
| ASE Test, Inc. | The Company | Parent company | 7,384,609 | (Notes 3,4,5) | - | - | - | 548,477 | - | ||||
| ASE Investment (Labuan) Inc. | Associate | 1,100,000 | (Notes 3,5) | - | - | - | - | - | |||||
| Omniquest Industrial Limited | Associate | 250,000 | (Notes 3,5) | - | - | - | - | - | |||||
| ASE Test Limited | The Company | The Ultimate Parent of the Company | 5,738,880 | (Notes 3,5) | - | - | - | - | |||||
| A.S.E. Holding Limited | Associate | 2,196,952 | (Notes 3,5) | - | - | - | - | - | |||||
| Omniquest Industrial Limited | Associate | 1,417,809 | (Notes 3,5) | - | - | - | - | - | |||||
| ASE Investment (Labuan) Inc. | Associate | 472,515 | (Notes 3,5) | - | - | - | - | - | |||||
| ASE (Korea) Inc. | The Company | The Ultimate Parent of the Company | 2,195,354 | (Notes 3,5) | - | - | - | 911 | - | ||||
| ASE WeiHai Inc. | Subsidiary | 2,354,360 | (Notes 3,5) | - | - | - | - | - | |||||
| J & R Holding Limited | The Company | Parent company | 7,024,640 | (Notes 3,5) | - | - | - | - | - | ||||
| Global Advanced Packaging Technology Limited, Cayman Islands. | Subsidiary | 547,142 | (Notes 3,5) | - | - | - | - | - | |||||
| Anstock Limited | Subsidiary | 2,045,406 | (Notes 3,5) | - | - | - | - | - | |||||
| ASE WeiHai Inc. | Associate | 535,270 | (Notes 3,5) | - | - | - | - | - | |||||
| ASE Assembly & Test (Shanghai) Limited | Associate | 539,545 | (Notes 3,5) | - | - | - | - | - | |||||
| ASE Investment (Labuan) Inc. | Subsidiary | 1,255,839 | (Notes 3,5) | - | - | - | - | - | |||||
| ASE Corporation | Associate | 2,984,121 | (Notes 3,5) | - | - | - | - | - | |||||
| ASE Labuan Inc. | Associate | 628,693 | (Notes 3,5) | - | - | - | - | - | |||||
(Continued)
- 80 -
| Overdue (Note 1) | |||||||||||||
| Company Name | Related Party | Relationships | Ending Balance (Note 1) | Turnover Rate (Note 2) | Amount | Actions Taken | Amounts Received in Subsequent Period | Allowance for Bad Debts | |||||
| J&R Industrial Inc. | The Company | The Ultimate Parent of the Company | $ | 190,000 | (Notes 3,5) | - | $ | - | - | $ | - | $ | - |
| ASE Electronics Inc. | Associate | 190,000 | (Notes 3,5) | - | - | - | - | - | |||||
| ASE Japan Co., Ltd. | J & R Holding Limited | Parent company | 2,643,536 | (Notes 3,5) | - | - | - | - | - | ||||
| ASE Investment(Labuan)Inc. | The Company | The Ultimate Parent of the Company | 2,821,664 | (Notes 3,5) | - | - | - | 1,000,000 | - | ||||
| ASE Corporation | The Company | The Ultimate Parent of the Company | 2,979,200 | (Notes 3,5) | - | - | - | - | - | ||||
| ASE Labuan Inc. | The Company | The Ultimate Parent of the Company | 627,200 | (Notes 3,5) | - | - | - | - | - | ||||
| ASE (Shanghai) Inc. | The Company | The Ultimate Parent of the Company | 512,966 | (Note 5) | 5 | - | - | 37,942 | - | ||||
| Advanced Semiconductor Engineering (HK) Limited | Subsidiary | 481,202 | (Note 5) | 4 | - | - | 539 | - | |||||
| Shanghai Ding Hui Real Estate Development Co., Ltd. | Kun Shan Ding Hong Real Estate Development Co., Ltd. | Subsidiary | 121,391 | (Notes 3,5) | - | - | - | - | - | ||||
| USI Enterprise Limited | The Company | The Ultimate Parent of the Company | 7,369,600 | (Notes 3,5) | - | - | - | - | - | ||||
| J & R Holding Limited | Associate | 3,140,827 | (Notes 3,5) | - | - | - | - | - | |||||
| USI Inc. | Parent company | 2,139,481 | (Notes 3,5) | - | - | - | 6,993 | - | |||||
| Huntington Holdings International Co. Ltd. | The Company | The Ultimate Parent of the Company | 1,724,800 | (Notes 3,5) | - | - | - | 156,800 | - | ||||
| Real Tech Holdings Limited | The Company | The Ultimate Parent of the Company | 1,724,800 | (Notes 3,5) | - | - | - | - | - | ||||
| Suzhou ASEN Semiconductors Co., Ltd. | NXP Semiconductors Taiwan Ltd. | Subsidiary of the company has significant influence over Suzhou ASEN Semiconductors Co., Ltd. | 690,210 | 3 | - | - | 169,335 | - | |||||
| USI Electronics (Shenzhen) Co., Ltd. | Universal Global Industrial Co., Limited | Associate | CNY | 597,216 thousand | (Note 5) | 4 | - | - | CNY | 161,560 thousand | - | ||
| Universal Global Technology (Shanghai) Co., Ltd. | Associate | CNY | 110,053 thousand | (Notes 3,5) | - | - | - | - | - | ||||
| Universal Scientific Industrial (Shanghai) Co., Ltd. | Universal Global Technology (Kunshan) Co., Ltd. | Subsidiary | CNY | 22,625 thousand | (Note 5) | 2 | - | - | CNY | 314 thousand | - | ||
| Universal Global Technology (Shanghai) Co., Ltd. | Subsidiary | CNY | 587,494 thousand | (Notes 3,5) | - | - | - | - | - | ||||
(Continued)
- 81 -
| Overdue (Note 1) | |||||||||||||
| Company Name | Related Party | Relationships | Ending Balance (Note 1) | Turnover Rate (Note 2) | Amount | Actions Taken | Amounts Received in Subsequent Period | Allowance for Bad Debts | |||||
| Universal Global Technology Co., Limited | Universal Scientific Industrial (Shanghai) Co., Ltd. | Parent company | US$ | 22,749 thousand | (Note 5) | 2 | $ | - | - | $ | - | $ | - |
| Universal Global Technology (Kunshan) Co., Ltd. | Associate | US$ | 30,738 thousand | (Note 5) | 5 | - | - | US$ | 10,070 thousand | - | |||
| Universal Global Industrial Co., Limited | USI Electronics (Shenzhen) Co., Ltd. | Associate | US$ | 19,545 thousand | (Note 5) | 4 | - | - | US$ | 9 thousand | - | ||
| Universal Global Scientific Industrial Co., Ltd. | Associate | US$ | 113,719 thousand | (Note 5) | 4 | - | - | US$ | 45 thousand | - | |||
| Universal Global Scientific Industrial Co., Ltd. | Universal Scientific Industrial Co., Ltd. | Subsidiary | $ | 217,606 | (Note 5) | 2 | - | - | - | - | |||
| Universal Global Technology (Kunshan) Co., Ltd. | Universal Global Industrial Co., Limited | Associate | CNY | 296,718 thousand | (Note 5) | 5 | - | - | CNY | 99,944 thousand | - | ||
| Universal Global Technology (Shanghai) Co., Ltd. | Associate | CNY | 50,024 thousand | (Notes 3,5) | - | - | - | - | - | ||||
(Concluded)
Note 1: Include Accounts receivables and other receivables.
Note 2: Exclude other receivables
Note 3: Intercompany Loan, please refer to Table 1.
Note 4: Turnkey transaction.
Note 5: Amount was eliminated based on the reviewed financial statements.
- 82 -
TABLE 8
ADVANCED SEMICONDUCTOR ENGINEERING, INC. AND SUBSIDIARIES
NAMES, LOCATION, AND RELATED INFORMATION OF INVESTEES OVER WHICH THE COMPANY EXERCISES SIGNIFICANT INFLUENCE
FOR THE NINE MONTHS ENDED SEPTEMBER 30, 2016
(Amounts In Thousands of New Taiwan Dollars, Unless Specified Otherwise)
| Original Investment Amount | Balance as of September 30, 2016 | |||||||||||||||
| Investor Company | Investee Company | Location | Main Businesses and Products | September 30, 2016 | December 31, 2015 | Shares | Percentage of Ownership | Carrying Value | Net Income (Losses) of the Investee | Share of Profits/Losses of Investee (Note 1) | Note | |||||
| The Company | A.S.E. Holding Limited | Bermuda | Investment activities | US$ | 283,966 thousand | US$ | 283,966 thousand | 243,966 | 100 | $ | 14,699,286 | $ | 161,771 | $ | 147,416 | Subsidiary |
| J & R Holding Limited | Bermuda | Investment activities | US$ | 479,693 thousand | US$ | 479,693 thousand | 435,128 | 100 | 48,364,435 | 2,649,260 | 2,443,483 | Subsidiary | ||||
| ASE Marketing & Service Japan Co., Ltd. | Japan | Engaged in marketing and sales services | JPY | 60,000 thousand | JPY | 60,000 thousand | 1,200 | 100 | 34,002 | 2,003 | 2,003 | Subsidiary | ||||
| Omniquest Industrial Limited | British Virgin Islands | Investment activities | US$ | 250,504 thousand | US$ | 250,504 thousand | 250,504,067 | 71 | 11,106,064 | 862,856 | 600,376 | Subsidiary | ||||
| Innosource Limited | British Virgin Islands | Investment activities | US$ | 86,000 thousand | US$ | 86,000 thousand | 86,000,000 | 100 | 3,945,550 | 180,482 | 177,807 | Subsidiary | ||||
| HCK | Taiwan | Engaged in the leasing of real estate properties | $ | 390,470 | $ | 390,470 | 35,497,273 | 27 | 324,959 | (27,409 ) | (7,485 ) | Associate | ||||
| HC | Taiwan | Engaged in the development, construction and leasing of real estate properties | 2,845,913 | 2,845,913 | 68,629,782 | 26 | 1,269,613 | 102,119 | 38,907 | Associate | ||||||
| Universal Scientific Industrial Co., Ltd. | Taiwan | Engaged in the manufacturing, processing and sale of computers, computer peripherals and related accessories | - | 520,490 | - | - | - | (34,564 ) | 55,288 | Subsidiary | ||||||
| ASE Test, Inc. | Taiwan | Engaged in the testing of semiconductors | 20,698,867 | 20,698,867 | 1,131,452,502 | 100 | 28,539,072 | 2,123,994 | 2,106,459 | Subsidiary | ||||||
| USI Inc. | Taiwan | Investment activities | 20,836,477 | 20,836,477 | 1,112,236,706 | 99 | 42,418,825 | 1,819,882 | 1,706,918 | Subsidiary | ||||||
| Luchu Development Corporation | Taiwan | Engaged in the development of real estate properties | 1,366,238 | 1,366,238 | 131,961,457 | 67 | 1,334,886 | (9,540 ) | (6,402 ) | Subsidiary | ||||||
| ASEEE | Taiwan | Engaged in the production of embedded substrate | 765,000 | 618,097 | 76,500,000 | 51 | 703,684 | (112,264 ) | (57,252 ) | Associate | ||||||
| SPIL | Taiwan | Engaged in assembly, testing and turnkey services of integrated circuits | 48,790,498 | 35,055,000 | 1,037,300,000 | 33 | 45,613,346 | 7,104,261 | 1,175,356 | Associate | ||||||
| Deca Technologies Inc. | Cayman | Holding company and the group engaged in manufacturing, development and marketing of wafer level packaging and interconnect technology | US$ | 59,882 | - | 98,489,803 | 22.07 | 1,892,542 | (267,219 ) | (13,711 ) | Associate | |||||
| AMPI | Taiwan | Engaged in integrated circuit | 178,861 | 178,861 | 33,308,452 | 17 | 11,453 | (189,588 ) | (34,581 ) | Associate | ||||||
| ASE Test, Inc. | Alto Enterprises Limited | British Virgin Islands | Investment activities | US$ | 188,000 thousand | US$ | 188,000 thousand | 188,000,000 | 100 | 4,240,162 | 70,401 | (Note 2) | Subsidiary | |||
| Super Zone Holdings Limited | Hong Kong | Investment activities | US$ | 100,000 thousand | US$ | 100,000 thousand | 100,000,000 | 100 | 3,129,882 | 35,196 | (Note 2) | Subsidiary | ||||
| Luchu Development Corporation | Taiwan | Engaged in the development of real estate properties | $ | 372,504 | $ | 372,504 | 37,250,448 | 19 | 376,736 | (9,540 ) | (Note 2) | Subsidiary | ||||
| TLJ Intertech Inc. | Taiwan | Engaged in information software services | 89,998 | - | 2,119,080 | 60 | 89,624 | (3,771 ) | (Note 2) | Subsidiary | ||||||
| A.S.E. Holding Limited | ASE Test Limited | Singapore | Investment activities | US$ | 84,889 thousand | US$ | 84,889 thousand | 11,148,000 | 10 | US$ | 107,774 thousand | US$ | 42,602 thousand | (Note 2) | Subsidiary | |
| ASE Investment (Labuan) Inc. | Malaysia | Investment activities | US$ | 168,643 thousand | US$ | 168,643 thousand | 168,642,842 | 70 | US$ | 343,234 thousand | US$ | 970 thousand | (Note 2) | Subsidiary | ||
| J & R Holding Limited | ASE Test Limited | Singapore | Investment activities | US$ | 964,524 thousand | US$ | 964,524 thousand | 98,276,087 | 90 | US$ | 1,072,382 thousand | US$ | 42,602 thousand | (Note 2) | Subsidiary | |
| Omniquest Industrial Limited | British Virgin Islands | Investment activities | US$ | 30,200 thousand | US$ | 30,200 thousand | 30,200,000 | 8 | US$ | 43,817 thousand | US$ | 26,427 thousand | (Note 2) | Subsidiary | ||
| J&R Industrial Inc. | Taiwan | Engaged in leasing equipment and investing activity | US$ | 51,344 thousand | US$ | 51,344 thousand | 170,000,006 | 100 | US$ | 31,885 thousand | US$ | 68 thousand | (Note 2) | Subsidiary | ||
| ASE Japan Co., Ltd. | Japan | Engaged in the packaging and testing of semiconductors | US$ | 25,606 thousand | US$ | 25,606 thousand | 7,200 | 100 | US$ | 86,492 thousand | US$ | 1,972 thousand | (Note 2) | Subsidiary | ||
| ASE (U.S.) Inc. | U.S.A | After-sales service and sales support | US$ | 4,600 thousand | US$ | 4,600 thousand | 1,000 | 100 | US$ | 12,693 thousand | US$ | 673 thousand | (Note 2) | Subsidiary | ||
| Global Advanced Packaging Technology Limited, Cayman Islands | British Cayman Islands | Investment activities | US$ | 190,000 thousand | US$ | 190,000 thousand | 190,000,000 | 100 | US$ | 353,014 thousand | US$ | 34,313 thousand | (Note 2) | Subsidiary | ||
| Anstock Limited | British Cayman Islands | Investment activities | US$ | 10 thousand | US$ | 10 thousand | 10,000 | 100 | US$ | 345 thousand | ( US$ | 243 thousand ) | (Note 2) | Subsidiary | ||
| Anstock II Limited | British Cayman Islands | Investment activities | US$ | 10 thousand | US$ | 10 thousand | 10,000 | 100 | US$ | 189 thousand | US$ | 155 thousand | (Note 2) | Subsidiary | ||
| ASE Investment (Labuan) Inc. | ASE (Korea) Inc. | Korea | Engaged in the packaging and testing of semiconductors | US$ | 160,000 thousand | US$ | 160,000 thousand | 20,741,363 | 100 | US$ | 490,377 thousand | US$ | 831 thousand | (Note 2) | Subsidiary | |
| ASE Test Limited | ASE Holdings (Singapore) Pte Ltd | Singapore | Investment activities | US$ | 65,520 thousand | US$ | 65,520 thousand | 71,428,902 | 100 | US$ | 146,168 thousand | US$ | 12,047 thousand | (Note 2) | Subsidiary | |
| ASE Test Holdings, Ltd. | British Cayman Islands | Investment activities | US$ | 222,399 thousand | US$ | 222,399 thousand | 5 | 100 | US$ | 100,347 thousand | US$ | 853 thousand | (Note 2) | Subsidiary | ||
| ASE Investment (Labuan) Inc. | Malaysia | Investment activities | US$ | 72,304 thousand | US$ | 72,304 thousand | 72,304,040 | 30 | US$ | 147,100 thousand | US$ | 970 thousand | (Note 2) | Subsidiary | ||
| ASE Singapore Pte. Ltd. | Singapore | Engaged in the packaging and testing of semiconductors | US$ | 55,815 thousand | US$ | 55,815 thousand | 30,100,000 | 100 | US$ | 157,950 thousand | US$ | 24,368 thousand | (Note 2) | Subsidiary | ||
| ASE Test Holdings, Ltd. | ISE Labs, Inc. | U.S.A | Engaged in the testing of semiconductors | US$ | 221,145 thousand | US$ | 221,145 thousand | 26,250,000 | 100 | US$ | 100,346 thousand | US$ | 853 thousand | (Note 2) | Subsidiary | |
(Continued)
- 83 -
| Original Investment Amount | Balance as of September 30, 2016 | |||||||||||||||
| Investor Company | Investee Company | Location | Main Businesses and Products | September 30, 2016 | December 31, 2015 | Shares | Percentage of Ownership | Carrying Value | Net Income (Losses) of the Investee | Share of Profits/Losses of Investee (Note 1) | Note | |||||
| ASE Holdings (Singapore) Pte Ltd | ASE Electronics (M) Sdn. Bhd. | Malaysia | Engaged in the packaging and testing of semiconductors | US$ | 60,000 thousand | US$ | 60,000 thousand | 159,715,000 | 100 | US$ | 146,168 thousand | US$ | 12,047 thousand | (Note 2) | Subsidiary | |
| Omniquest Industrial Limited | ASE Corporation | British Cayman Islands | Investment activities | US$ | 352,784 thousand | US$ | 352,784 thousand | 352,784,067 | 100 | US$ | 515,094 thousand | US$ | 26,517 thousand | (Note 2) | Subsidiary | |
| ASE Corporation | ASE Mauritius Inc. | Mauritius | Investment activities | US$ | 217,800 thousand | US$ | 217,800 thousand | 217,800,000 | 100 | US$ | 385,060 thousand | US$ | 19,623 thousand | (Note 2) | Subsidiary | |
| ASE Labuan Inc. | Malaysia | Investment activities | US$ | 126,184 thousand | US$ | 126,184 thousand | 126,184,067 | 100 | US$ | 129,983 thousand | US$ | 6,952 thousand | (Note 2) | Subsidiary | ||
| ASE Labuan Inc. | ASE Electronics Inc. | Taiwan | Engaged in the production of substrates | US$ | 125,813 thousand | US$ | 125,813 thousand | 398,981,900 | 100 | US$ | 129,416 thousand | US$ | 6,960 thousand | (Note 2) | Subsidiary | |
| Innosource Limited | Omniquest Industrial Limited | British Virgin Islands | Investment activities | US$ | 74,000 thousand | US$ | 74,000 thousand | 74,000,000 | 21 | US$ | 107,407 thousand | US$ | 26,427 thousand | (Note 2) | Subsidiary | |
| ASE (Shanghai) Inc. | Advanced Semiconductor Engineering (HK) Limited | Hong Kong | Engaged in the trading of substrates | US$ | 1,000 thousand | US$ | 1,000 thousand | - | 100 | US$ | 8,810 thousand | ( US$ | 134 thousand) | (Note 2) | Subsidiary | |
| USI Inc. | Huntington Holdings International Co. Ltd. | British Virgin Islands | Holding company | $ | 8,370,606 | $ | 8,370,606 | 255,856,840 | 100 | $ | 43,453,577 | $ | 1,920,067 | (Note 2) | Subsidiary | |
| Huntington Holdings International Co. Ltd. | Unitech Holdings International Co. Ltd. | British Virgin Islands | Holding company | US$ | 3,000 thousand | US$ | 3,000 thousand | 3,000,000 | 100 | US$ | 7,926 thousand | US$ | 115 thousand | (Note 2) | Subsidiary | |
| Real Tech Holdings Limited | British Virgin Islands | Holding company | US$ | 149,151 thousand | US$ | 149,151 thousand | 149,151,000 | 100 | US$ | 1,319,977 thousand | US$ | 62,362 thousand | (Note 2) | Subsidiary | ||
| Universal ABIT Holding Co., Ltd. | British Cayman Islands | Holding company | US$ | 28,125 thousand | US$ | 28,125 thousand | 90,000,000 | 100 | US$ | 13 thousand | US$ | - thousand | (Note 2) | Subsidiary | ||
| Rising Capital Investment Limited | British Virgin Islands | Holding company | US$ | 6,000 thousand | US$ | 6,000 thousand | 6,000,000 | 100 | US$ | 1,140 thousand | US$ | 4 thousand | (Note 2) | Subsidiary | ||
| Rise Accord Limited | British Virgin Islands | Holding company | US$ | 2,000 thousand | US$ | 2,000 thousand | 20,000 | 100 | US$ | 150 thousand | US$ | - thousand | (Note 2) | Subsidiary | ||
| Real Tech Holdings Limited | USI Enterprise Limited | Hong Kong | Engaged in the services of investment advisory and warehousing management | US$ | 210,900 thousand | US$ | 210,900 thousand | 210,900,000 | 99.59 | US$ | 1,247,995 thousand | US$ | 63,130 thousand | (Note 2) | Subsidiary | |
| Universal Scientific Industrial(Shanghai) Co., Ltd. | Universal Global Technology Co., Limited | Hong Kong | Holding company | CNY | 324,185 thousand | CNY | 324,185 thousand | 390,000,000 | 100 | CNY | 1,736,583 thousand | CNY | 225,761 thousand | (Note 2) | Subsidiary | |
| Universal Global Technology Co., Limited | Universal Global Industrial Co., Limited | Hong Kong | Engaged in manufacturing, trading and investing activity | US$ | 11,000 thousand | US$ | 11,000 thousand | 85,800,000 | 100 | US$ | 19,916 thousand | US$ | 1,283 thousand | (Note 2) | Subsidiary | |
| Universal Global Scientific Industrial Co., Ltd. | Taiwan | Engaged in the manufacturing of components of telecomm and cars and provision of related R&D services | US$ | 62,235 thousand | US$ | 30,400 thousand | 198,000,000 | 100 | US$ | 130,444 thousand | US$ | 4,616 thousand | (Note 2) | Subsidiary | ||
| USI Japan Co., Ltd | Japan | Engaged in the manufacturing and sale of computer peripherals, integrated chip and other related accessories | US$ | 885 thousand | US$ | 885 thousand | 6,400 | 100 | US$ | 893 thousand | ( US$ | 2 thousand) | (Note 2) | Subsidiary | ||
| Universal Scientific Industrial De Mexico S.A. De C.V. | Mexico | Engaged in the assembling of motherboards and computer components | US$ | 23,963 thousand | US$ | 23,963 thousand | 281,085,325 | 100 | US$ | 46,823 thousand | US$ | 5,093 thousand | (Note 2) | Subsidiary | ||
| USI America Inc. | U.S.A | Engaged in the manufacturing and processing of motherboards and wireless network communication and provision of related technical service | US$ | 9,500 thousand | US$ | 9,500 thousand | 250,000 | 100 | US$ | 5,518 thousand | US$ | 153 thousand | (Note 2) | Subsidiary | ||
| Universal Global Industrial Co., Limited | Universal Scientific Industrial De Mexico S.A. De C.V. | Mexico | Engaged in the assembling of motherboards and computer components | US$ | - thousand | US$ | - thousand | 1 | - | US$ | - thousand | US$ | 5,093 thousand | (Note 2) | Subsidiary | |
| Universal Global Scientific Industrial Co., Ltd. | Universal Scientific Industrial Co., Ltd. | Taiwan | Engaged in the manufacturing, processing and sale of computers, computer peripherals and related accessories | $ | 792,064 | $ | - | 39,603,222 | 99 | $ | 1,130,788 | $ | 209,046 | (Note 2) | Subsidiary | |
(Concluded)
| Note 1: | The share of profits/losses of investee includes the effect of unrealized gross profit on intercompany transaction. |
| Note 2: | The share of profits/losses of investee company is not reflected herein as such amount is already included in the share of profits/losses of the investor company. |
- 84 -
TABLE 9
ADVANCED SEMICONDUCTOR ENGINEERING, INC. AND SUBSIDIARIES
INFORMATION ON INVESTMENT IN MAINLAND CHINA
FOR THE NINE MONTHS ENDED SEPTEMBER 30, 2016
(Amounts In Thousands of New Taiwan Dollars, Unless Specified Otherwise)
| Investee Company | Main Business Activities | Paid-in Capital | Investment Method | Accumulated amount of remittance from Taiwan to Mainland China as of January 1, 2016 | Amount remitted from Taiwan to
Mainland China/Amount remitted back to
| Accumulated amount of remittance from Taiwan to Mainland China as of September 30, 2016 | Net income of investee for the nine months ended September 30, 2016 | Ownership held by the Company (direct or indirect) | Investment income (loss) recognised by the Company for the nine months ended September 30, 2016 | Book value of investments in Mainland China as of September 30, 2016 | Accumulated amount of investment income remitted back to Taiwan as of September 30, 2016 | |
| Remitted to Mainland China | Remitted back to Taiwan | |||||||||||
| ASE (Shanghai) Inc. | Engaged in the production of substrates | $ 4,236,563
( US$ 133,812 thousand )
| Note 1 (1) | $ 4,398,576
( US$ 137,800 thousand )
| $ - | $ - | $ 4,398,576
( US$ 137,800 thousand)
| $ 612,094
( US$ 18,697 thousand )
(Note 5 )
| 100 | $ 612,094
( US$ 18,697 thousand)
(Note 5 )
| $ 10,223,905
( US$ 326,017 thousand )
| None |
| ASE (Kun Shan) Inc. | Engaged in the packaging and testing of semiconductors | 8,350,204
( US$ 268,000 thousand )
| Note 1 (2) | 8,350,204
( US$ 268,000 thousand )
(Note 10 )
| - | - | 8,350,204
( US$ 268,000 thousand)
| 100,451
( US$ 3,131 thousand )
(Note 4 )
| 100 | 100,451
( US$ 3,131 thousand )
(Note 4 )
| 6,046,827
( US$ 192,820 thousand )
| None |
| ASE Module (Shanghai) Inc. | Engage in the production and sale of electronic components and printed circuit boards | 383,640
( US$ 12,000 thousand )
| Note 1 (3) | 383,640
( US$ 12,000 thousand )
| - | - | 383,640
( US$ 12,000 thousand)
| 1,277
( US$ 39 thousand )
(Note 5 )
| 100 | 1,277
( US$ 39 thousand)
(Note 5 )
| 573,822
( US$ 18,298 thousand )
| None |
| ASE Assembly & Test (Shanghai) Limited | Engaged in the packaging and testing of semiconductors | 6,501,336
( US$ 203,580 thousand )
| Note 1 (4) | 5,792,530
( US$ 180,000 thousand )
| - | - | 5,792,530
( US$ 180,000 thousand)
| 1,123,630
( US$ 34,498 thousand )
(Note 4 )
| 100 | 1,123,630
( US$ 34,498 thousand )
(Note 4 )
| 11,181,017
( US$ 356,538 thousand )
| None |
| Suzhou ASEN Semiconductors Co., Ltd. | Engaged in the packaging and testing of semiconductors | 1,568,467
( US$ 48,672 thousand )
| Note 1 (5) | 711,180
( US$ 21,600 thousand )
| - | - | 711,180
( US$ 21,600 thousand)
| 511,703
( US$ 15,862 thousand )
(Note 5 )
| 60 | 307,022
( US$ 9,517 thousand )
(Note 5 )
| 2,455,555
( US$ 78,302 thousand )
| None |
| ASE WeiHai Inc. | Engaged in the packaging and testing of semiconductors | 4,507,081
( US$ 152,200 thousand )
| Note 1 (6) | 1,295,307
( US$ 40,000 thousand )
| - | - | 1,295,307
( US$ 40,000 thousand)
| (45,817 )
( US$ -1,355 thousand )
(Note 5 )
| 100 | (45,817 )
( US$ -1,355 thousand )
(Note 5 )
| 1,561,395
( US$ 49,789 thousand )
| None |
| Shanghai Ding Hui Real Estate Development Co., Ltd. | Engaged in the development, construction and sale of real estate properties | 16,345,070
( CNY 3,600,000 thousand )
| Note 2 | -
(Note 2 )
| - | - | -
(註2)
| 787,860
( CNY 155,446 thousand )
(Note 5 )
| 100 | 703,378
( CNY 138,703 thousand )
(Note 5 )
| 19,110,189
( CNY 4,069,325 thousand )
| None |
| Shanghai Ding Wei Real Estate Development Co., Ltd. | Engaged in the development, construction and sale of real estate properties | 6,908,089
( CNY 1,548,000 thousand )
| Note 2 | -
(Note 2 )
| - | - | -
(註2)
| (24,794 )
( CNY -5,034 thousand )
(Note 5 )
| 100 | (24,794 )
( CNY -5,034 thousand )
(Note 5 )
| 7,176,041
( CNY 1,528,067 thousand )
| None |
| Shanghai Ding Yu Real Estate Development Co., Ltd. | Engaged in the development, construction and sale of real estate properties | 4,936,538
( CNY 1,100,000 thousand )
| Note 2 | -
(Note 2 )
| - | - | -
(註2)
| (17,761 )
( CNY -3,611 thousand )
(Note 5 )
| 100 | (17,761 )
( CNY -3,611 thousand )
(Note 5 )
| 5,156,505
( CNY 1,098,026 thousand )
| None |
| Kun Shan Ding Hong Real Estate Development Co., Ltd. | Engaged in the development, construction and sale of real estate properties | 3,139,662
( CNY 670,000 thousand )
| Note 2 | -
(Note 2 )
| - | - | -
(註2)
| (8,520 )
( CNY -1,744 thousand )
(Note 5 )
| 100 | (8,520 )
( CNY -1,744 thousand )
(Note 5 )
| 3,132,706
( CNY 667,079 thousand )
| None |
| Kun Shan Ding Yue Real Estate Development Co., Ltd. | Engaged in the development, construction and sale of real estate properties | 1,546,415
( CNY 330,000 thousand )
| Note 2 | -
(Note 2 )
| - | - | -
(註2)
| ( 115 )
( CNY -23 thousand )
(Note 5 )
| 100 | ( 115 )
( CNY -23 thousand )
(Note 5 )
| 1,548,369
( CNY 329,710 thousand )
| None |
| Advanced Semiconductor Engineering (China) Ltd. | Engage in the packaging and testing of semiconductors | 3,149,000
( US$ 100,000 thousand )
| Note 1 (7) | 3,149,000
( US$ 100,000 thousand )
| - | - | 3,149,000
( US$ 100,000 thousand)
| 35,196
( US$ 1,097 thousand )
(Note 4 )
| 100 | 35,196
( US$ 1,097 thousand )
(Note 4 )
| 3,129,762
( US$ 99,801 thousand )
| None |
| ASE Investment (Kun Shan) Limited | Holding company | 3,717,318
( US$ 122,000 thousand )
| Note 1 (8) | 3,717,318
( US$ 122,000 thousand )
(Note 10 )
| - | - | 3,717,318
( US$ 122,000 thousand)
| 45,660
( US$ 1,423 thousand )
(Note 4 )
| 100 | 45,660
( US$ 1,423 thousand )
(Note 4 )
| 2,750,829
( US$ 87,718 thousand )
| None |
(Continued)
- 85 -
| Investee Company | Main Business Activities | Paid-in Capital | Investment Method | Accumulated amount of remittance from Taiwan to Mainland China as of January 1, 2016 | Amount remitted from Taiwan to Mainland China/Amount remitted back to Taiwan for the three months ended September 30, 2016 | Accumulated amount of remittance from Taiwan to Mainland China as of September 30, 2016 | Net income of investee for the nine months ended September 30, 2016 | Ownership held by the Company (direct or indirect) | Investment income (loss) recognized by the Company for the nine months ended September 30, 2016 | Book value of investments in Mainland China as of September 30, 2016 | Accumulated amount of investment income remitted back to Taiwan as of September 30, 2016 | |
| Remitted to Mainland China | Remitted back to Taiwan | |||||||||||
| Wuxi Tongzhi Microelectronics Co., Ltd. | Engage in the packaging and testing of semiconductors | $ 356,682 ( CNY 73,461 thousand) | (Note 2) | $ - (Note 2) | $ - | $ - | $ - (Note 2) | $ 17,214 ( CNY 3,485 thousand ) (Note 4 ) | 100 | $ 17,214 ( CNY 3,485 thousand ) (Note 4 ) | $ 439,040 ( CNY 93,489 thousand) | None |
| ASE Trading (Shanghai) Ltd. | Engaged in trading activity | 2,566 ( CNY 500 thousand) | (Note 2) | - (Note 2) | - | - | - (Note 2) | (32 ) ( CNY -6 thousand) (Note 4 ) | 100 | (32 ) ( CNY -6 thousand ) (Note 4 ) | 2,087 ( CNY 444 thousand ) | None |
| Shanghai Ding Qi Property Management Co., Ltd. | Engaged in the management of real estate properties | 5,078 ( CNY 1,000 thousand) | (Note 2) | - (Note 2) | - | - | - (Note 2) | (5,832 ) ( CNY -1,188 thousand) (Note 5 ) | 100 | (5,832 ) ( CNY -1,188 thousand ) (Note 5 ) | (4,070) ( CNY -867 thousand ) | None |
| Shanghai Ding Fan Department Store Co., Ltd. | Engaged in selling General merchandise | 7,199 ( CNY 1,500 thousand) | (Note 2) | - (Note 2) | - | - | - (Note 2) | (27 ) ( CNY -6 thousand) (Note 5 ) | 100 | (27 ) ( CNY -6 thousand ) (Note 5 ) | 7,018 ( CNY -1,494 thousand ) | None |
| USI Electronics (Shenzhen) Co., Ltd. | Engaged in the processing and sales of computer and communication peripherals as well as business in import and export of goods and technology | 2,270,625 ( US$ 75,000 thousand) | (Note 1) (9) | 1,180,746 | - | - | 1,180,746 | 1,719,713 ( CNY 348,748 thousand ) (Note 6 ) | 77 | 1,324,978 ( US$ 40,872 thousand ) (Note 6 ) | 7,259,997 ( US$ 231,505 thousand ) | $ 1,196,256 ( US$ 41,243 thousand) |
| Universal Scientific Industrial (Shanghai) Co., Ltd. | Engaged in the designing, manufacturing and sale of electronic components | 10,649,110 ( CNY 2,175,924 thousand) | (Note 1) (9) | 1,668,233 | - | - | 1,668,233 | 2,620,336 ( US$ 80,831 thousand ) (Note 6 ) | 77 | 2,024,342 ( US$ 62,445 thousand ) (Note 6 ) | 26,307,638 ( US$ 838,892 thousand ) | None |
| Universal Scientific Industrial (Kunshan) Co., Ltd. | Engaged in the manufacturing and sale of computer assistance system and related peripherals | 383,201 ( US$ 12,000 thousand) | (Note 1) (9) | 383,201 | - | - | 383,201 | 5,958 ( US$ 184 thousand) (Note 6 ) | 99 | 5,908 ( US$ 182 thousand ) (Note 6 ) | 327,092 ( US$ 10,430 thousand ) | None |
| e-Cloud Corporation | Engaged in the sale of electronic components and telecommunications equipment | 147,450 ( US$ 5,000 thousand) | (Note 1) (10) | 147,450 | - | - | 147,450 | - | - | - | - (Note 11) | None |
| Siargo(SH), Ltd. | Engaged in manufacturing and sale of MEMS mass flow sensors | 227,063 ( US$ 7,500 thousand) | (Note 3) | 3,035 | - | - | 3,035 | - | - | - | - | None |
| Universal Global Technology (Kunshan) Co., Ltd. | Engaged in the designing and manufacturing of electronic components | 1,202,223 ( CNY 250,000 thousand) | (Note 2) | - (Note 2) | - | - | - (Note 2) | 512,436 ( CNY 103,919 thousand ) (Note 6 ) | 77 | 389,771 ( CNY 79,062 thousand ) (Note 6 ) | 2,041,426 ( CNY 434,701 thousand ) | None |
| Universal Global Technology (Shanghai) Co., Ltd. | Engaged in the processing and sales of computer and communication peripherals as well as business in import and export of goods and technology | 6,652,140 ( CNY 1,330,000 thousand) | (Note 2) | - (Note 2) | - | - | - (Note 2) | (503,580 ) ( CNY -102,123 thousand ) (Note 6 ) | 77 | (388,143 ) ( CNY -78,731 thousand ) (Note 6 ) | 2,279,437 ( CNY 485,384 thousand ) | None |
| Universal Global Electronics (Shanghai) Co., Ltd. | Engaged in the sale of electronic components and telecommunications equipment | 240,850 ( CNY 50,000 thousand) | (Note 2) | - (Note 2) | - | - | - (Note 2) | 4,691 ( CNY 951 thousand ) (Note 6 ) | 77 | 3,616 ( CNY 733 thousand ) (Note 6 ) | 194,450 ( CNY 41,406 thousand ) | None |
(Continued)
- 86 -
Investee Company | Accumulated Investment in Mainland China as of December 31, 2015 | Investment Amounts | Upper Limit on Investment |
| The company | $ 15,203,097 (US$ 471,400 thousand) | $ 16,790,306 (US$ 576,400 thousand) (Note 9) | $- (Note 7) |
| ASE Test, Inc. | 8,878,838 (US$ 288,000 thousand) | 8,878,838 (US$ 288,000 thousand) | 17,944,978 (Note 8) |
| USI Inc. | 3,382,665 | 32,402,340 (US$1,027,236 thousand) | - (Note 7) |
| Note 1: | Investments through a holding company registered in a third region. The holding companies are as follow: |
| (1) | ASE Mauritius Inc., ASE Corporation,Omniquest Industrial Limited, Innosource Limited and J&R Holding Limited. |
| (2) | ASE Mauritius Inc., Alto Enterprises Limited, Innosource Limited, ASE Corporation, Omniquest Industrial Limited and J&R Holding Limited. |
| (3) | Innosource Limited. |
| (4) | Global Advanced Packaging Technology Limited, Cayman Islands and J&R Holding Limited. |
| (5) | J&R Holding Limited. |
| (6) | ASE (Korea) Inc., ASE Test Limited, ASE Investment (Labuan) Inc., ASE Holding Ltd. and J&R Holding Limited. |
| (7) | Super Zone Holdings Limited. |
| (8) | Alto Enterprises Limited. |
| (9) | Real Tech Holdings Limited and Huntington Holdings International Co. Ltd.. |
| (10) | Rise Capital Investment Limited and Huntington Holdings International Co. Ltd.. |
| Note 2: | Invested by companies in Mainland China. |
| Note 3: | The company was invested by Asia Global Venture Co. Ltd which is invested by UHI as available-for-sale. Asia Global Venture Co. Ltd disposed all of the company's shares in October, 2013, therefore as of September 30, 2016 UHI does not invest to any company in Mainland China. |
| Note 4: | The basis for investment income (loss) recognition is from the financial statements reviewed and attested by R.O.C. parent company’s CPA |
| Note 5: | The basis for investment income (loss) recognition is from the financial statements reviewed and attested by international accounting firm which has cooperative relationship with accounting firm in R.O.C. |
| Note 6: | The basis for investment income (loss) recognition is from the financial statements reviewed and attested by other CPA in the same accounting firm with R.O.C. parent company’s CPA. |
| Note 7: | Pursuant to the Jing-Shen-Zi Letter No. 09704604680 of the Ministry of Economic Affairs, R.O.C amended 'Guidelines Governing the Review of Investment or Technical Cooperation in the Mainland Area' dated on August 29, 2008, as the Company has obtained the certificate of being qualified for operating headquarters, issued by the Industrial Development Bureau, MOEA, the ceiling amount of the investment in Mainland China is not applicable to the Company. |
| Note 8: | The upper limit on investment of ASE Test, Inc. is calculated as follow: $28,856,075× 60% = 17,313,645 |
| Note 9: | US$80,000 thousand was directly remitted by the subsidiary, ASE (Korea), and US$25,000 thousand was by means of Debt for Equity Swap. Therefore, there is US$105,000 thousand difference between MOEA approved investment amount and accumulated outflow of investment from Taiwan. |
| Note 10: | It was the same fund that ASE Test, Inc. indirectly invested to ASE Investment (KS) through another company in 3rd area and then invested to ASEKS. |
| Note 11: | e-Cloud Corporation was liquidated in December 2013. |
(Concluded)
- 87 -
TABLE 10
ADVANCED SEMICONDUCTOR ENGINEERING, INC. AND SUBSIDIARIES
INTERCOMPANY RELATIONSHIPS AND SIGNIFICANT INTERCOMPANY TRANSACTIONS
FOR THE NINE MONTHS ENDED SEPTEMBER 30, 2016
(Amounts In Thousands of New Taiwan Dollars, Unless Specified Otherwise)
| Intercompany Transactions (Note) | |||||||
| No. | Company Name | Related Party | Nature of Relationships | Financial Statement Account | Amount (Note) | Terms | Percentage of Consolidated Net Revenue or Total Assets |
| 0 | The Company | ASE Test, Inc. | Parent company to subsidiary | Other payables | $ 7,384,449 | 2 | |
| Parent company to subsidiary | Disposal of property, plant and equipment | 269,349 | - | ||||
| Parent company to subsidiary | Purchase of property, plant and equipment | 1,238,210 | 1 | ||||
| Parent company to subsidiary | Other receivables | 281,285 | - | ||||
| Universal Scientific Industrial Co., Ltd. | Parent company to subsidiary | Trade Receivables | 1,428,076 | - | |||
| Parent company to subsidiary | Operating revenues | 2,891,916 | The transacation has the same terms with other companies | 1 | |||
| ASE (Shanghai) Inc. | Parent company to subsidiary | Trade payables | 510,614 | - | |||
| Parent company to subsidiary | Operating costs | 1,653,730 | The transacation has the same terms with other companies | 1 | |||
| ASE (U.S.) Inc. | Parent company to subsidiary | Operating expenses | 683,776 | It is calculated by fixed ratio based on actual expenses. There is an upper limit to the expenses. | - | ||
| ASE Electronics Inc. | Parent company to subsidiary | Trade payables | 692,217 | - | |||
| Parent company to subsidiary | Other receivables | 139,967 | - | ||||
| Parent company to subsidiary | Operating costs | 1,935,410 | The transacation has the same terms with other companies | 1 | |||
| ISE Labs, Inc. | Parent company to subsidiary | Operating revenues | 125,021 | - | |||
| J & R Holding Limited | Parent company to subsidiary | Other payables | 7,024,640 | 2 | |||
| Omniquest Industrial Limited | Parent company to subsidiary | Other payables | 1,661,200 | - | |||
| ASE Labuan Inc. | Parent company to subsidiary | Other payables | 627,200 | - | |||
| ASE Test Limited | Parent company to subsidiary | Other payables | 5,738,880 | 2 | |||
| ASE Investment (Labuan) Inc. | Parent company to subsidiary | Other payables | 2,821,664 | 1 | |||
| J&R Industrial Inc. | Parent company to subsidiary | Other payables | 190,000 | - | |||
| ASE (Korea)Inc. | Parent company to subsidiary | Other payables | 2,195,354 | 1 | |||
| Huntington Holdings International Co., Ltd. | Parent company to subsidiary | Other payables | 1,724,800 | - | |||
| USI Enterprise Limited | Parent company to subsidiary | Other payables | 7,369,600 | 2 | |||
| Real Tech Holdings Limited | Parent company to subsidiary | Other payables | 1,724,800 | - | |||
| ASE Corporation | Parent company to subsidiary | Other payables | 2,979,200 | 1 | |||
| A.S.E. Holding Limited | Parent company to subsidiary | Other payables | 2,885,120 | 1 | |||
| 1 | ASE (U.S.) Inc. | ASE (Korea) Inc. | Subsidiary to subsidiary | Operating revenues | 113,658 | - | |
| 2 | ASE (Shanghai) Inc. | ASE Assembly & Test (Shanghai) Limited | Subsidiary to subsidiary | Operating revenues | 182,463 | The transacation has the same terms with other companies | - |
| Advanced Semiconductor Engineering | Subsidiary to subsidiary | Trade receivables | 481,202 | - | |||
| (HK) Limited | Subsidiary to subsidiary | Operating revenues | 1,201,962 | The transacation has the same terms with other companies | 1 | ||
| 3 | Shanghai Ding Hui Real Estate Development Co., Ltd. | Kun Shan Ding Hong Real Estate Development Co., Ltd. | Subsidiary to subsidiary | Other receivables | 121,391 | - | |
| 4 | ASE Investment (Labuan) Inc. | ASE Test Limited | Subsidiary to subsidiary | Other liabilities | 472,515 | - | |
| 5 | A.S.E. Holding Limited | ASE Test Limited | Subsidiary to subsidiary | Other payables | 2,196,952 | 1 | |
| 6 | Omniquest Industrial Limited | ASE Test Limited | Subsidiary to subsidiary | Other liabilities | 1,417,809 | - | |
(Continued)
- 88 -
| No | Company Name | Related Party | Name of Relationships | Intercompany Transactions | |||
| Financial Statement Account | Amount (Note) | Terms | Percentage of Consolidated Net Revenue or Total Asset | ||||
| 7 | J & R Holding Limited | Global Advanced Packaging
Technology Limited, Cayman
Islands
ASE Labuan Inc.
Anstock Limited
ISE Labs, Inc.
Anstock II Limited
ASE Japan Co., Ltd.
ASE Assembly & Test (Shanghai) Limited
ASE WeisHai Inc.
USI Enterprise Limited
ASE Investment (Labuan) Inc.
ASE Corporation
| Subsidiary to subsidiary
Subsidiary to subsidiary
Subsidiary to subsidiary
Subsidiary to subsidiary
Subsidiary to subsidiary
Subsidiary to subsidiary
Subsidiary to subsidiary
Subsidiary to subsidiary
Subsidiary to subsidiary
Subsidiary to subsidiary
Subsidiary to subsidiary
| Other receivables
Other receivables
Other receivables
Other liabilities
Other payables
Other payables
Other receivables
Other receivables
Other payables
Other receivables
Other receivables
| $ 547,142
628,693
2,045,406
1,442,959
9,372,235
2,643,536
539,545
535,270
3,140,827
1,255,839
2,984,121
| -
-
1
-
3
1
-
-
1
-
1
| |
| 8 | Anstock II Limited | J&R Holding Limited | Subsidiary to subsidiary | Interest income | 179,524 | - | |
| 9 | ASE WeiHai Inc. | ASE (Korea) Inc. | Subsidiary to subsidiary | Other payables | 2,354,360 | 1 | |
| 10 | ASE Electronics Inc. | J&R Industrial Inc.
Universal Scientific Industrial
(Shanghai) Co., Ltd.
ASE Electronics (M) Sdn. Bhd.
| Subsidiary to subsidiary
Subsidiary to subsidiary
Subsidiary to subsidiary
| Other payables
Operating revenues
Operating revenues
| 190,000
140,611
338,177
| -
-
-
| |
| 11 | ASE Test, Inc. | ASE Investment (Labuan) Inc.
Omniquest Industrial Limited
| Subsidiary to subsidiary
Subsidiary to subsidiary
| Other receivables
Other receivables
| 1,100,000
250,000
| -
-
| |
| 12 | ASE Assembly & Test
(Shanghai) Limited
| Anstock Limited
ASE Electronics Inc.
| Subsidiary to subsidiary
Subsidiary to subsidiary
Subsidiary to subsidiary
Subsidiary to subsidiary
| Other payables
Other liabilities
Interest expense
Operating costs
| 680,467
1,352,493
105,612
163,303
| -
-
-
-
| |
| 13 | USI Inc. | USI Enterprise Limited | Subsidiary to subsidiary | Other payables | 2,132,480 | 1 | |
| 14 | Universal Scientific Industrial
(Shanghai) Co., Ltd.
| Universal Global Technology Co.,
Limited
Universal Global Technology
(Shanghai) Co., Ltd.
Universal Global Industrial Co., Limited
Universal Global Technology
(Kunshan) Co., Ltd.
USI Electronics (Shenzhen) Co., Ltd
| Subsidiary to subsidiary
Subsidiary to subsidiary
Subsidiary to subsidiary
Subsidiary to subsidiary
Subsidiary to subsidiary
Subsidiary to subsidiary
| Operating costs
Trade payables
Other receivables
Operating revenues
Operating revenues
Operating revenues
| 3,120,702
713,309
2,757,365
216,181
112,830
133,485
| 2
-
1
-
-
-
| |
| 15 | Universal Global Industrial
Co., Limited
| USI Electronics (Shenzhen) Co., Ltd.
Universal Global Scientific Industrial
Co., Ltd.
Universal Global Technology
(Kushan) Co., Ltd.
| Subsidiary to subsidiary
Subsidiary to subsidiary
Subsidiary to subsidiary
Subsidiary to subsidiary
Subsidiary to subsidiary
Subsidiary to subsidiary
Subsidiary to subsidiary
Subsidiary to subsidiary
Subsidiary to subsidiary
| Operating revenues
Operating costs
Trade receivables
Trade payables
Operating revenues
Trade receivables
Operating revenues
Operating costs
Trade payables
| 2,212,281
9,472,631
607,885
2,804,511
11,482,615
3,564,648
189,813
4,367,045
1,389,297
| 1
5
-
1
6
1
-
2
-
| |
| 16 | Universal Global Technology Co.,
Limited
| Universal Global Technology (Kunshan) Co., Ltd. | Subsidiary to subsidiary
Subsidiary to subsidiary
| Operating revenues
Trade receivables
| 2,506,039
963,952
| 1
-
| |
(Continued)
- 89 -
| No | Company Name | Related Party | Name of Relationships | Intercompany Transactions | |||
| Financial Statement Account | Amount (Note) | Terms | Percentage of Consolidated Net Revenue or Total Asset | ||||
| 17 | Universal Global Scientific Industrial
Co., Ltd.
| USI Electronics (Shenzhen) Co., Ltd
Universal Scientific Industrial
(Shanghai) Co., Ltd.
Universal Scientific Industrial Co., Ltd.
| Subsidiary to subsidiary
Subsidiary to subsidiary
Subsidiary to subsidiary
Subsidiary to subsidiary
| Operating revenues
Operating evenues
Operating revenues
Trade receivables
| $ 155,660
201,454
497,145
217,476
| -
-
-
-
| |
| 18 | USI Electronics (Shenzhen) Co., Ltd | Universal Global Technology (Shanghai) Co., Ltd. | Subsidiary to subsidiary | Trade receivables | 516,577 | - | |
| 19 | Universal Global Technology (Kunshan) Co., Ltd. | Universal Global Technology (Shanghai) Co., Ltd. | Subsidiary to subsidiary | Other receivables | 234,922 | - | |
Note: Amount was eliminated based on the reviewed financial statements. (Concluded)
- 90 -
Appendix 5
Advanced Semiconductor Engineering, Inc.
2014 Individual Financial Statements and Auditor Report
Advanced Semiconductor Engineering, Inc.
Parent Company Only Financial Statements for the
Years Ended December 31, 2014 and 2013 and
Independent Auditors’ Report
INDEPENDENT AUDITORS’ REPORT
The Board of Directors and Shareholders
Advanced Semiconductor Engineering, Inc.
We have audited the accompanying balance sheets of Advanced Semiconductor Engineering, Inc. (the “Company”) as of December 31, 2014 and 2013, and the related statements of comprehensive income, changes in equity and cash flows for the years ended December 31, 2014 and 2013. These financial statements are the responsibility of the Company’s management. Our responsibility is to express an opinion on these financial statements based on our audits.
We conducted our audits in accordance with the Rules Governing the Audit of Financial Statements by Certified Public Accountants and auditing standards generally accepted in the Republic of China. Those rules and standards require that we plan and perform the audit to obtain reasonable assurance about whether the financial statements are free of material misstatement. An audit includes examining, on a test basis, evidence supporting the amounts and disclosures in the financial statements. An audit also includes assessing the accounting principles used and significant estimates made by management, as well as evaluating the overall financial statement presentation. We believe that our audits provide a reasonable basis for our opinion.
In our opinion, such financial statements referred to above present fairly, in all material respects, the financial position of the Company as of December 31, 2014 and 2013, and the results of operations and cash flows for the years ended December 31, 2014 and 2013, in conformity with the Guidelines Governing the Preparation of Financial Reports by Securities Issuers.
The statements of major accounting items listed in the parent company only financial statements of the Company as of and for the year ended December 31, 2014 are presented for the purpose of additional analysis. Such statements have been subjected to the auditing procedures applied in our audits of the financial statements mentioned above. In our opinion, such statements are consistent in all material respects in relation to the financial statements as a whole.
February 26, 2015
Notice to Readers
The accompanying financial statements are intended only to present the financial position, results of operations and cash flows in accordance with accounting principles and practices generally accepted in the Republic of China and not those of any other jurisdictions. The standards, procedures and practices to audit such financial statements are those generally accepted and applied in the Republic of China.
For the convenience of readers, the independent auditors’ report and the accompanying financial statements have been translated into English from the original Chinese version prepared and used in the Republic of China. If there is any conflict between the English version and the original Chinese version or any difference in the interpretation of the two versions, the Chinese-language independent auditors’ report and financial statements shall prevail.
-1-
ADVANCED SEMICONDUCTOR ENGINEERING, INC.
PARENT COMPANY ONLY BALANCE SHEETS
DECEMBER 31, 2014 AND 2013
(In Thousands of New Taiwan Dollars)
| December 31, 2014 | December 31, 2013 | December 31, 2014 | December 31, 2013 | |||||||||||||||||||||||||||||||
| ASSETS | NT$ | % | NT$ | % | LIABILITIES AND STOCKHOLDERS’ EQUITY | NT$ | % | NT$ | % | |||||||||||||||||||||||||
| CURRENT ASSETS | CURRENT LIABILITIES | |||||||||||||||||||||||||||||||||
| Cash (Note 6) | $ | 11,254,517 | 4 | $ | 14,959,268 | 7 | Short-term borrowings (Note 14) | $ | 11,636,241 | 4 | $ | 11,721,924 | 5 | |||||||||||||||||||||
| Financial assets at fair value through profit or loss - | Financial liabilities at fair value through profit or | |||||||||||||||||||||||||||||||||
| current (Notes 4, 5 and 7) | 1,990,183 | 1 | 302,273 | — | loss - current (Notes 4, 5 and 7) | 2,540,418 | 1 | 1,793,652 | 1 | |||||||||||||||||||||||||
| Available-for-sale financial assets - current (Notes 4, 5 and 8) | 400,007 | — | 2,312,147 | 1 | Trade payables | 6,965,763 | 3 | 6,239,588 | 3 | |||||||||||||||||||||||||
| Trade receivables, net (Notes 4 and 9) | 16,473,504 | 6 | 12,061,441 | 6 | Trade payables to related parties (Note 27) | 1,223,750 | — | 1,074,901 | 1 | |||||||||||||||||||||||||
| Trade receivables from related parties (Note 27) | 5,082,423 | 2 | 2,418,651 | 1 | Other payables (Notes 16 and 17) | 12,352,075 | 5 | 7,941,207 | 4 | |||||||||||||||||||||||||
| Other receivables (Note 4) | 1,414,007 | 1 | 962,907 | — | Other payables to related parties (Note 27) | 30,653,624 | 12 | 18,107,805 | 8 | |||||||||||||||||||||||||
| Other receivables from related parties (Note 27) | 36,699 | — | 46,202 | — | Current tax liabilities (Note 4) | 1,617,605 | 1 | 803,419 | — | |||||||||||||||||||||||||
| Inventories (Notes 4, 5 and 10) | 4,323,668 | 2 | 3,642,616 | 2 | Current portion of long-term borrowings (Notes 14 and 28) | 1,085,143 | — | 1,028,571 | — | |||||||||||||||||||||||||
| Other current assets | 508,010 | — | 303,545 | — | Other current liabilities | 493,126 | — | 448,069 | — | |||||||||||||||||||||||||
| Total current assets | 41,483,018 | 16 | 37,009,050 | 17 | Total current liabilities | 68,567,745 | 26 | 49,159,136 | 22 | |||||||||||||||||||||||||
| NON - CURRENT ASSETS | NON-CURRENT LIABILITIES | |||||||||||||||||||||||||||||||||
| Available-for-sale financial assets - non-current (Notes 4, 5 and | Bonds payable (Notes 4 and 15) | 19,270,613 | 8 | 18,152,195 | 8 | |||||||||||||||||||||||||||||
| 8) | 542,147 | — | 592,557 | — | Long-term borrowings (Notes 14 and 28) | 18,355,554 | 7 | 25,787,145 | 12 | |||||||||||||||||||||||||
| Investments accounted for using the equity method (Notes 4 | Deferred tax liabilities (Notes 4 and 20) | 2,897,155 | 1 | 1,892,418 | 1 | |||||||||||||||||||||||||||||
| and 11) | 139,054,506 | 53 | 118,011,718 | 53 | Long-term payables (Note 16) | — | — | 894,150 | — | |||||||||||||||||||||||||
| Property, plant and equipment (Notes 4, 5, 12, 19, 23, 27 and | Accrued pension liabilities (Notes 4, 5 and 17) | 2,419,189 | 1 | 2,488,363 | 1 | |||||||||||||||||||||||||||||
| 29) | 77,640,995 | 30 | 63,122,172 | 29 | Other non-current liabilities | 1,517 | — | 19,783 | — | |||||||||||||||||||||||||
| Goodwill (Notes 4 and 5) | 958,620 | — | 958,620 | — | ||||||||||||||||||||||||||||||
| Other intangible assets (Notes 4, 5, 13 and 19) | 486,192 | — | 393,759 | — | Total non-current liabilities | 42,944,028 | 17 | 49,234,054 | 22 | |||||||||||||||||||||||||
| Deferred tax assets (Notes 4, 5 and 20) | 1,020,403 | 1 | 1,019,230 | 1 | ||||||||||||||||||||||||||||||
| Other financial assets - non-current (Note 26) | 215,784 | — | 214,803 | — | Total liabilities | 111,511,773 | 43 | 98,393,190 | 44 | |||||||||||||||||||||||||
| Long-term prepayments for lease | 195,879 | — | 19,141 | — | ||||||||||||||||||||||||||||||
| Other non-current assets | 131,181 | — | 72,761 | — | EQUITY (Notes 4 and 18) | |||||||||||||||||||||||||||||
| Share capital | ||||||||||||||||||||||||||||||||||
| Total non-current assets | 220,245,707 | 84 | 184,404,761 | 83 | Ordinary shares | 78,525,378 | 30 | 77,560,040 | 35 | |||||||||||||||||||||||||
| Capital received in advance | 189,801 | — | 620,218 | — | ||||||||||||||||||||||||||||||
| Total share capital | 78,715,179 | 30 | 78,180,258 | 35 | ||||||||||||||||||||||||||||||
| Capital surplus | 15,995,671 | 6 | 7,908,870 | 4 | ||||||||||||||||||||||||||||||
| Retained earnings | ||||||||||||||||||||||||||||||||||
| Legal reserve | 10,289,878 | 4 | 8,720,971 | 4 | ||||||||||||||||||||||||||||||
| Special reserve | 3,353,938 | 1 | 3,663,930 | 2 | ||||||||||||||||||||||||||||||
| Unappropriated earnings | 38,753,462 | 15 | 26,608,253 | 12 | ||||||||||||||||||||||||||||||
| Total retained earnings | 52,397,278 | 20 | 38,993,154 | 18 | ||||||||||||||||||||||||||||||
| Other equity | 5,067,931 | 2 | (102,554 | ) | — | |||||||||||||||||||||||||||||
| Treasury shares | (1,959,107 | ) | (1 | ) | (1,959,107 | ) | (1 | ) | ||||||||||||||||||||||||||
| Total equity | 150,216,952 | 57 | 123,020,621 | 56 | ||||||||||||||||||||||||||||||
| TOTAL | $ | 261,728,725 | 100 | $ | 221,413,811 | 100 | TOTAL | $ | 261,728,725 | 100 | $ | 221,413,811 | 100 | |||||||||||||||||||||
The accompanying notes are an integral part of the financial statements.
-2-
ADVANCED SEMICONDUCTOR ENGINEERING, INC.
PARENT COMPANY ONLY STATEMENTS OF COMPREHENSIVE INCOME
YEARS ENDED DECEMBER 31, 2014 AND 2013
(In Thousands of New Taiwan Dollars, Except Earnings Per Share)
| For the Years Ended December 31 | ||||||||||||||||
| 2014 | 2013 | |||||||||||||||
| NT$ | % | NT$ | % | |||||||||||||
| OPERATING REVENUE (Note 4) | $ | 96,678,100 | 100 | $ | 82,329,117 | 100 | ||||||||||
| OPERATING COSTS (Notes 10, 17 and 19) | 67,316,934 | 70 | 60,064,369 | 73 | ||||||||||||
| GROSS PROFIT | 29,361,166 | 30 | 22,264,748 | 27 | ||||||||||||
| OPERATING EXPENSES (Notes 17 and 19) | ||||||||||||||||
| Selling and marketing expenses | 1,110,116 | 1 | 903,186 | 1 | ||||||||||||
| General and administrative expenses | 4,522,027 | 5 | 3,561,931 | 4 | ||||||||||||
| Research and development expenses | 5,472,965 | 5 | 4,862,834 | 6 | ||||||||||||
| Total operating expenses | 11,105,108 | 11 | 9,327,951 | 11 | ||||||||||||
| PROFIT FROM OPERATIONS | 18,256,058 | 19 | 12,936,797 | 16 | ||||||||||||
| NON-OPERATING INCOME AND EXPENSES | ||||||||||||||||
| Other income (Note 19) | 114,369 | — | 116,525 | — | ||||||||||||
| Other gains and losses (Note 19) | 8,043 | — | (403,734 | ) | (1 | ) | ||||||||||
| Finance costs (Note 19) | (1,001,974 | ) | (1 | ) | (817,169 | ) | (1 | ) | ||||||||
| Share of the profit of subsidiaries and associates (Note 4) | 8,736,876 | 9 | 5,562,724 | 7 | ||||||||||||
| Total non-operating income and expenses | 7,857,314 | 8 | 4,458,346 | 5 | ||||||||||||
| PROFIT BEFORE INCOME TAX | 26,113,372 | 27 | 17,395,143 | 21 | ||||||||||||
| INCOME TAX EXPENSE (Notes 4 and 20) | 2,520,705 | 2 | 1,706,069 | 2 | ||||||||||||
| PROFIT FOR THE YEAR | 23,592,667 | 25 | 15,689,074 | 19 | ||||||||||||
| OTHER COMPREHENSIVE INCOME (LOSS) | ||||||||||||||||
| Unrealized gain on available-for-sale financial assets | 2,376 | — | 42,254 | — | ||||||||||||
| Cash flow hedges | — | — | 4,524 | — | ||||||||||||
| Share of other comprehensive income of subsidiaries and associates | 5,149,012 | 5 | 2,855,480 | 4 | ||||||||||||
| Remeasurement of defined benefit obligation (Note 17) | (16,194 | ) | — | 251,036 | — | |||||||||||
| Income tax relating to the components of other comprehensive income or loss | 2,753 | — | (43,445 | ) | — | |||||||||||
| Other comprehensive income for the year, net of income tax | 5,137,947 | 5 | 3,109,849 | 4 | ||||||||||||
| TOTAL COMPREHENSIVE INCOME FOR THE YEAR | $ | 28,730,614 | 30 | $ | 18,798,923 | 23 | ||||||||||
(Continued)
-3-
ADVANCED SEMICONDUCTOR ENGINEERING, INC.
PARENT COMPANY ONLY STATEMENTS OF COMPREHENSIVE INCOME
YEARS ENDED DECEMBER 31, 2014 AND 2013
(In Thousands of New Taiwan Dollars, Except Earnings Per Share)
| For the Years Ended December 31 | ||||||||||||||||
| 2014 | 2013 | |||||||||||||||
| NT$ | % | NT$ | % | |||||||||||||
| EARNINGS PER SHARE (Note 21) | ||||||||||||||||
| Basic | $ | 3.07 | $ | 2.09 | ||||||||||||
| Diluted | $ | 2.95 | $ | 2.03 | ||||||||||||
(Concluded)
The accompanying notes are an integral part of the financial statements.
-4-
ADVANCED SEMICONDUCTOR ENGINEERING, INC.
PARENT COMPANY ONLY STATEMENTS OF CHANGES IN EQUITY
YEARS ENDED DECEMBER 31, 2014 AND 2013
(In Thousands of New Taiwan Dollars)
| Other Equity | ||||||||||||||||||||||||||||||||||||||||||||||||||||
| Exchange | Unrealized | |||||||||||||||||||||||||||||||||||||||||||||||||||
| Differences on | Gain on | |||||||||||||||||||||||||||||||||||||||||||||||||||
| Share Capital | Retained Earnings | Translating | Available-for- | |||||||||||||||||||||||||||||||||||||||||||||||||
| Shares | Capital | Special | Unappropriated | Foreign | sale Financial | Cash Flow | Total | |||||||||||||||||||||||||||||||||||||||||||||
| (In thousands) | Amount | Surplus | Legal Reserve | Reserve | Earnings | Total | Operations | Assets | Hedges | Total | Treasury Shares | Equity | ||||||||||||||||||||||||||||||||||||||||
| BALANCE AT JANUARY 1, 2013 | 7,602,292 | $ | 76,047,667 | $ | 5,262,129 | $ | 7,411,835 | $ | — | $ | 23,526,565 | $ | 30,938,400 | $ | (3,210,248 | ) | $ | 355,254 | $ | (3,755 | ) | $ | (2,858,749 | ) | $ | (1,959,107 | ) | $ | 107,430,340 | |||||||||||||||||||||||
| Special reserve under Rule No.1010012865 issued by the Financial Supervisory Commission (Note 22) | — | — | — | — | 3,353,938 | (3,353,938 | ) | — | — | — | — | — | — | — | ||||||||||||||||||||||||||||||||||||||
| Profit for the year ended December 31, 2013 | — | — | — | — | — | 15,689,074 | 15,689,074 | — | — | — | — | — | 15,689,074 | |||||||||||||||||||||||||||||||||||||||
| Other comprehensive income for the year ended December 31, 2013, net of income tax | — | — | — | — | — | 353,654 | 353,654 | 2,684,727 | 70,992 | 476 | 2,756,195 | — | 3,109,849 | |||||||||||||||||||||||||||||||||||||||
| Total comprehensive income for the year ended December 31, 2013 | — | — | — | — | — | 16,042,728 | 16,042,728 | 2,684,727 | 70,992 | 476 | 2,756,195 | — | 18,798,923 | |||||||||||||||||||||||||||||||||||||||
| Issue of ordinary shares for cash (Note 22) | 130,000 | 1,300,000 | 2,093,000 | — | — | — | — | — | — | — | — | — | 3,393,000 | |||||||||||||||||||||||||||||||||||||||
| Appropriation of 2012 earnings | ||||||||||||||||||||||||||||||||||||||||||||||||||||
| Legal reserve | — | — | — | 1,309,136 | — | (1,309,136 | ) | — | — | — | — | — | — | — | ||||||||||||||||||||||||||||||||||||||
| Special reserve | — | — | — | — | 309,992 | (309,992 | ) | — | — | — | — | — | — | — | ||||||||||||||||||||||||||||||||||||||
| Cash dividends | — | — | — | — | — | (7,987,974 | ) | (7,987,974 | ) | — | — | — | — | — | (7,987,974 | ) | ||||||||||||||||||||||||||||||||||||
| — | — | — | 1,309,136 | 309,992 | (9,607,102 | ) | (7,987,974 | ) | — | — | — | — | — | (7,987,974 | ) | |||||||||||||||||||||||||||||||||||||
| Issue of dividends received by subsidiaries | — | — | 153,097 | — | — | — | — | — | — | — | — | — | 153,097 | |||||||||||||||||||||||||||||||||||||||
| Changes in capital surplus from investments in subsidiaries and associates accounted for using the equity method | — | — | 1,457 | — | — | — | — | — | — | — | — | — | 1,457 | |||||||||||||||||||||||||||||||||||||||
| Partial disposal of interests in subsidiaries and additional acquisition of partially-owned subsidiaries (Note 11) | — | — | (330 | ) | — | — | — | — | — | — | — | — | — | (330 | ) | |||||||||||||||||||||||||||||||||||||
| Issue of ordinary shares under employee share options | 55,535 | 832,591 | 399,517 | — | — | — | — | — | — | — | — | — | 1,232,108 | |||||||||||||||||||||||||||||||||||||||
| BALANCE AT DECEMBER 31, 2013 | 7,787,827 | 78,180,258 | 7,908,870 | 8,720,971 | 3,663,930 | 26,608,253 | 38,993,154 | (525,521 | ) | 426,246 | (3,279 | ) | (102,554 | ) | (1,959,107 | ) | 123,020,621 | |||||||||||||||||||||||||||||||||||
| Profit for the year ended December 31, 2014 | — | — | — | — | — | 23,592,667 | 23,592,667 | — | — | — | — | — | 23,592,667 | |||||||||||||||||||||||||||||||||||||||
| Other comprehensive income (loss) for the year ended December 31, 2014, net of income tax | — | — | — | — | — | (32,538 | ) | (32,538 | ) | 5,066,674 | 100,532 | 3,279 | 5,170,485 | — | 5,137,947 | |||||||||||||||||||||||||||||||||||||
| Total comprehensive income for the year ended December 31, 2014 | — | — | — | — | — | 23,560,129 | 23,560,129 | 5,066,674 | 100,532 | 3,279 | 5,170,485 | — | 28,730,614 | |||||||||||||||||||||||||||||||||||||||
| Appropriation of 2013 earnings | ||||||||||||||||||||||||||||||||||||||||||||||||||||
| Legal reserve | — | — | — | 1,568,907 | — | (1,568,907 | ) | — | — | — | — | — | — | — | ||||||||||||||||||||||||||||||||||||||
| Cash dividends | — | — | — | — | — | (10,156,005 | ) | (10,156,005 | ) | — | — | — | — | — | (10,156,005 | ) | ||||||||||||||||||||||||||||||||||||
| Special reserve | — | — | — | — | (309,992 | ) | 309,992 | — | — | — | — | — | — | — | ||||||||||||||||||||||||||||||||||||||
| — | — | — | 1,568,907 | (309,992 | ) | (11,414,920 | ) | (10,156,005 | ) | — | — | — | — | — | (10,156,005 | ) | ||||||||||||||||||||||||||||||||||||
| Issue of dividends received by subsidiaries | — | — | 188,790 | — | — | — | — | — | — | — | — | — | 188,790 | |||||||||||||||||||||||||||||||||||||||
| Changes in capital surplus from investments in subsidiaries and associates accounted for using the equity method | — | — | 26,884 | — | — | — | — | — | — | — | — | — | 26,884 | |||||||||||||||||||||||||||||||||||||||
| Partial disposal of interests in subsidiaries and additional acquisition of partially-owned subsidiaries (Note 11) | — | — | 6,871,062 | — | — | — | — | — | — | — | — | — | 6,871,062 | |||||||||||||||||||||||||||||||||||||||
| Issue of ordinary shares under employee share options | 73,898 | 534,921 | 1,000,065 | — | — | — | — | — | — | — | — | — | 1,534,986 | |||||||||||||||||||||||||||||||||||||||
| BALANCE AT DECEMBER 31, 2014 | 7,861,725 | $ | 78,715,179 | $ | 15,995,671 | $ | 10,289,878 | $ | 3,353,938 | $ | 38,753,462 | $ | 52,397,278 | $ | 4,541,153 | $ | 526,778 | $ | — | $ | 5,067,931 | $ | (1,959,107 | ) | $ | 150,216,952 | ||||||||||||||||||||||||||
The accompanying notes are an integral part of the financial statements.
-5-
ADVANCED SEMICONDUCTOR ENGINEERING, INC.
PARENT COMAPNY ONLY STATEMENTS OF CASH FLOWS
YEARS ENDED DECEMBER 31, 2014 AND 2013
(In Thousands of New Taiwan Dollars)
For the Years Ended December 31 | ||||||||
| 2014 | 2013 | |||||||
| NT$ | NT$ | |||||||
| CASH FLOWS FROM OPERATING ACTIVITIES | ||||||||
| Profit before income tax | $ | 26,113,372 | $ | 17,395,143 | ||||
| Adjustments for: | ||||||||
| Depreciation expenses | 12,667,954 | 10,778,678 | ||||||
| Amortization expenses | 109,809 | 114,366 | ||||||
| Net gain on fair value change of financial assets and liabilities at fair value through profit or loss | (1,735,649 | ) | (767,225 | ) | ||||
| Interest expenses | 992,542 | 803,669 | ||||||
| Compensation cost of employee share options | 82,408 | 194,601 | ||||||
| Share of profit of subsidiaries and associates | (8,736,876 | ) | (5,562,724 | ) | ||||
| Impairment loss recognized on non-financial assets | 335,797 | 223,186 | ||||||
| Others | 1,414,695 | 904,836 | ||||||
| Changes in operating assets and liabilities | ||||||||
| Financial assets held for trading | 889,176 | 723,403 | ||||||
| Trade receivables | (4,412,063 | ) | (1,232,436 | ) | ||||
| Trade receivables from related parties | (2,663,772 | ) | (2,366,534 | ) | ||||
| Other receivables | (419,790 | ) | 146,660 | |||||
| Other receivables from related parties | (2,856 | ) | 98,571 | |||||
| Inventories | (851,607 | ) | (340,678 | ) | ||||
| Other current assets | (230,071 | ) | 131,286 | |||||
| Financial liabilities held for trading | (258,775 | ) | (367,281 | ) | ||||
| Trade payables | 726,175 | (237,473 | ) | |||||
| Trade payables to related parties | 148,849 | (44,481 | ) | |||||
| Other payables | 1,865,052 | 785,387 | ||||||
| Other payables to related parties | 312,412 | (75,040 | ) | |||||
| Other current liabilities | 52,772 | 26,840 | ||||||
| Accrued pension liabilities | (85,368 | ) | (97,329 | ) | ||||
| 26,314,186 | 21,235,425 | |||||||
| Dividend received | 87,030 | 67,044 | ||||||
| Interest paid | (644,433 | ) | (664,985 | ) | ||||
| Income tax paid | (706,640 | ) | (616,206 | ) | ||||
| Net cash generated from operating activities | 25,050,143 | 20,021,278 | ||||||
| CASH FLOWS FROM INVESTING ACTIVITIES | ||||||||
| Purchase of financial assets designated as at fair value through profit or loss | (25,266,850 | ) | (3,072,500 | ) | ||||
| Proceeds from disposal of financial assets designated as at fair value through profit or loss | 25,430,954 | 2,965,447 | ||||||
| Purchase of available-for-sale financial assets | (1,941,283 | ) | (3,120,451 | ) | ||||
| Proceeds on sale of available-for-sale financial assets | 3,809,325 | 780,650 | ||||||
| Acquisition of equity method investments | (100,000 | ) | — | |||||
| Payments for property, plant and equipment | (25,859,051 | ) | (16,048,751 | ) | ||||
| Proceeds from disposal of property, plant and equipment | 187,058 | 685,884 | ||||||
| Payments for intangible assets | (202,242 | ) | (130,025 | ) | ||||
(Continued)
-6-
ADVANCED SEMICONDUCTOR ENGINEERING, INC.
STATEMENTS OF CASH FLOWS
YEARS ENDED DECEMBER 31, 2014 AND 2013
(In Thousands of New Taiwan Dollars)
For the Years Ended December 31 | ||||||||
| 2014 | 2013 | |||||||
| NT$ | NT$ | |||||||
| Net cash inflows from business combination | $ | — | $ | 13,191 | ||||
| Other investing activities | (282,825 | ) | 144,279 | |||||
| Net cash used in investing activities | (24,224,914 | ) | (17,782,276 | ) | ||||
| CASH FLOWS FROM FINANCING ACTIVITIES | ||||||||
| Proceeds from short-term borrowings | (85,683 | ) | 5,541,883 | |||||
| Proceeds from issue of convertible bonds | — | 11,900,051 | ||||||
| Proceeds from long-term borrowings | 28,718,192 | 26,022,788 | ||||||
| Repayments of long-term borrowings | (36,739,806 | ) | (28,057,003 | ) | ||||
| Increase (decrease) in other payables to related parties | 12,273,225 | (855,962 | ) | |||||
| Dividends paid | (10,156,005 | ) | (7,987,974 | ) | ||||
| Proceeds from issue of ordinary shares | — | 3,393,000 | ||||||
| Proceeds from exercise of employee share options | 1,458,088 | 1,071,919 | ||||||
| Other financing activities | 2,009 | (2,866 | ) | |||||
| Net cash generated from (used in) financing activities | (4,529,980 | ) | 11,025,836 | |||||
| NET INCREASE ( DECREASE) IN CASH | (3,704,751 | ) | 13,264,838 | |||||
| CASH, AT THE BEGINNING OF THE YEAR | 14,959,268 | 1,694,430 | ||||||
| CASH, AT THE END OF THE YEAR | $ | 11,254,517 | $ | 14,959,268 | ||||
(Concluded)
The accompanying notes are an integral part of the financial statements.
-7-
ADVANCED SEMICONDUCTOR ENGINEERING, INC.
NOTES TO PARENT COMPANY ONLY FINANCIAL STATEMENTS
(Amounts in Thousands, Unless Stated Otherwise)
| 1. | GENERAL INFORMATION |
Advanced Semiconductor Engineering, Inc. (the “Company”), a corporation incorporated in Nantze Export Processing Zone under the laws of Republic of China (the “ROC”). In August 2004, the Company merged its subsidiaries, ASE (Chung Li) Inc. and ASE Material Inc., and established Chung-Li Branch. In August 2006, the Company spun-off and assigned its substrate production business to ASE Electronics Inc. In January 2011, the Company established Nan-Tou Branch. In May 2012, the Company merged its subsidiary, PowerASE Technology, Inc. In August 2013, the Company merged its subsidiary, Yang Ting Tech Co., Ltd. The Company offers a comprehensive range of semiconductors packaging and testing services.
Since July 1989, the Company’s ordinary shares have been listed on the Taiwan Stock Exchange (the “TSE”) under the symbol “2311”. Since September 2000, the Company’s ordinary shares have been traded on the New York Stock Exchange (the “NYSE”) under the symbol “ASX” in the form of American Depositary Shares (“ADS”).
The parent company only financial statements are presented in the Company’s functional currency, New Taiwan dollar (NT$).
| 2. | APPROVAL OF FINANCIAL STATEMENTS |
The parent company only financial statements were approved for issue by board of directors on February 26, 2015.
| 3. | APPLICATION OF NEW AND REVISED STANDARDS, AMENDMENTS AND INTERPRETATIONS |
| a. | The amendment to the Regulations Governing the Preparation of Financial Reports by Securities Issuers and the 2013 version of the International Financial Reporting Standards (IFRS), International Accounting Standards (IAS), Interpretations of IFRS (IFRIC), and Interpretations of IAS (SIC) endorsed by the Financial Supervisory Commission of the ROC (“FSC”) not yet effective |
Rule No. 1030029342 and Rule No. 1030010325 issued by the FSC on April 3, 2014, stipulated that the Group should apply the 2013 version of IFRS, IAS, IFRIC and SIC (collectively, the “IFRSs”) endorsed by the FSC and the related amendments to the Regulations Governing the Preparation of Financial Reports by Securities Issuers starting January 1, 2015.
New, Amended and Revised Standards and Interpretations (the “New IFRSs”) | Effective Date Announced by International Accounting Standard Board (“IASB”) (Note) | |
| Improvements to IFRSs (2009) - amendment to IAS 39 | January 1, 2009 or January 1, 2010 | |
| Amendment to IAS 39 “Embedded Derivatives” | Effective in fiscal year ended on or after June 30, 2009 |
(Continued)
-8-
New, Amended and Revised Standards and Interpretations (the “New IFRSs”) | Effective Date Announced by International Accounting Standard Board (“IASB”) (Note) | |
| Improvements to IFRSs (2010) | July 1, 2010 or January 1,2011 | |
| Annual Improvements to IFRSs 2009 - 2011 Cycle | January 1, 2013 | |
| Amendments to IFRS 1 “Limited Exemption from Comparative IFRS 7 Disclosures for First-time Adopters” | July 1, 2010 | |
| Amendment to IFRS 1 “Severe Hyperinflation and Removal of Fixed Dates for First-time Adopters” | July 1, 2011 | |
| Amendment to IFRS 1 “Government Loans” | January 1, 2013 | |
| Amendment to IFRS 7 “Disclosures - Offsetting Financial Assets and Financial Liabilities” | January 1, 2013 | |
| Amendment to IFRS 7 “Disclosures - Transfers of Financial Assets” | July 1, 2011 | |
| IFRS 11 “Joint Arrangements” | January 1, 2013 | |
| IFRS 12 “Disclosure of Interests in Other Entities” | January 1, 2013 | |
| Amendments to IFRS 10, IFRS 11 and IFRS 12 “Consolidated financial Statements Joint Arrangements, and Disclosure of Interests in Other Entities: Transition Guidance” | January 1, 2013 | |
| Amendments to IFRS 10, IFRS 12 and IAS 27 “Investment Entities” | January 1, 2014 | |
| IFRS 13 “Fair Value Measurement” | January 1, 2013 | |
| Amendment to IAS 1 “Presentation of Items of Other Comprehensive Income” | July 1, 2012 | |
| Amendment to IAS 12 “Deferred Tax: Recovery of Underlying Assets” | January 1, 2012 | |
| IAS 19 (Revised 2011) “Employee Benefits” | January 1, 2013 | |
| IAS 27 (Revised 2011) “Separate Financial Statements” | January 1, 2013 | |
| IAS 28 (Revised 2011) “Investments in Associates and Joint Ventures” | January 1, 2013 | |
| Amendment to IAS 32 “Offsetting of Financial Assets and Financial Liabilities” | January 1, 2014 | |
| IFRIC 20 “Stripping Costs in the Production Phase of a Surface Mine” | January 1, 2013 |
(Concluded)
| Note : | Unless stated otherwise, the above New IFRSs are effective for annual periods beginning on or after the respective effective dates. |
Except for the following, whenever applied, the initial application of the above 2013 IFRSs version and the related amendments to the Regulations Governing the Preparation of Financial Reports by Securities Issuers would not have any material impact on the Company’s accounting policies:
| 1) | IFRS 13 “Fair Value Measurement” |
IFRS 13 establishes a single source of guidance for fair value measurements. It defines fair value, establishes a framework for measuring fair value, and requires disclosures about fair value measurements. The disclosure requirements in IFRS 13 are more extensive than those required in the current standards, for example, quantitative and qualitative disclosures based on the three-level fair value hierarchy currently required for financial instruments only will be extended by IFRS 13 to cover all assets and liabilities within its scope.
The fair value measurements under IFRS 13 will be applied prospectively from January 1, 2015.
-9-
| 2) | Amendment to IAS 1 “Presentation of Items of Other Comprehensive Income” |
The amendments to IAS 1 requires items of other comprehensive income to be grouped into those items that (1) will not be reclassified subsequently to profit or loss; and (2) may be reclassified subsequently to profit or loss. Income taxes on related items of other comprehensive income are grouped on the same basis. Under current IAS 1, there were no such requirements.
The Company retrospectively will apply the above amendments starting in 2015. Items that will not be reclassified subsequently to profit or loss are remeasurements of the defined benefit plans and share of remeasurements of the defined benefit plans of subsidiaries and associates accounted for using the equity method. Items that may be reclassified to profit or loss are unrealized gain (loss) on available-for-sale financial assets, cash flow hedges and share of other comprehensive income (except the share of the remeasurements of the defined benefit plans) of subsidiaries and associates accounted for using the equity method. However, the application of the above amendments will not have any impact on the net profit, other comprehensive income (net of income tax) and total comprehensive income for the period.
| 3) | Revision to IAS 19 “Employee Benefits” |
Revised IAS 19 requires the recognition of changes in defined benefit obligations and in the fair value of plan assets when they occur, and hence eliminates the “corridor approach” permitted under current IAS 19 and accelerate the recognition of past service costs. The revision requires all remeasurements of the defined benefit plans to be recognized immediately through other comprehensive income in order for the net pension asset or liability to reflect the full value of the plan deficit or surplus. Remeasurement of the defined benefit plans is presented separately as other equity. The Company has not determined the presentation of the changes in defined benefit obligations.
Furthermore, the interest cost and expected return on plan assets used in current IAS 19 are replaced with a “net interest” amount, which is calculated by applying the discount rate to the net defined benefit liability or asset. In addition, the revised IAS 19 introduces certain changes in the presentation of the defined benefit cost, and also includes more extensive disclosures.
On initial application of the revised IAS 19 in 2015, the changes in cumulative employee benefit costs as of January 1, 2013 resulting from the retrospective application are adjusted to accrued pension cost, deferred tax assets and retained earnings; however, the carrying amount of inventory is not adjusted. In addition, in preparing the parent company only financial statements for the year ended December 31, 2015, the Company would elect not to present 2014 comparative information about the sensitivity analysis of the defined benefit obligation. The anticipated impact of the initial application is set out below:
| Carrying Amount | Adjustments Arising from Retrospective Application | Adjusted | ||||||||||
| NT$ | NT$ | NT$ | ||||||||||
| Impact on Assets, Liabilities and Equity | ||||||||||||
| December 31, 2014 | ||||||||||||
| Deferred tax assets | $ | 1,020,403 | $ | (601 | ) | $ | 1,019,802 | |||||
| Investments accounted for using the equity method | 139,054,506 | (979 | ) | 139,053,527 | ||||||||
(Continued)
-10-
| Carrying Amount | Adjustments Arising from Retrospective Application | Adjusted | ||||||||||
| NT$ | NT$ | NT$ | ||||||||||
| Accrued pension cost | $ | 2,419,189 | $ | (3,535 | ) | $ | 2,415,654 | |||||
| Retained earnings | 52,397,278 | (16,040 | ) | 52,381,238 | ||||||||
| Capital surplus | 15,995,671 | 17,387 | 16,013,058 | |||||||||
| Exchange differences on translating foreign operations | 4,541,153 | 608 | 4,541,761 | |||||||||
| January 1, 2014 | ||||||||||||
| Deferred tax assets | 1,019,230 | 1,358 | 1,020,588 | |||||||||
| Investments accounted for using the equity method | 118,011,718 | 68,845 | 118,080,563 | |||||||||
| Accrued pension cost | 2,488,363 | 7,987 | 2,496,350 | |||||||||
| Retained earnings | 38,993,154 | (87,050 | ) | 38,906,104 | ||||||||
| Capital surplus | 7,908,870 | 11,576 | 7,920,446 | |||||||||
| Impact on Total Comprehensive Income For the Year Ended December 31, 2014 | ||||||||||||
| Operating cost | 67,316,934 | (15,503 | ) | 67,301,431 | ||||||||
| Operating expense | 11,105,108 | (7,427 | ) | 11,097,681 | ||||||||
| Share of profits of subsidiaries and associates | 8,736,876 | 24,824 | 8,761,700 | |||||||||
| Income tax expense | 2,520,705 | 3,899 | 2,524,604 | |||||||||
| Net profit for the year | 23,592,667 | 43,855 | 23,636,522 | |||||||||
| Items that will not be reclassified subsequently to profit or loss: | ||||||||||||
| Remeasurement of defined benefit obligation | (16,194 | ) | (11,408 | ) | (27,602 | ) | ||||||
| Share of other comprehensive income (loss) of subsidiaries and associates | (19,097 | ) | 36,623 | 17,526 | ||||||||
| Income tax relating to items that will not be reclassified subsequently | 2,753 | 1,940 | 4,693 | |||||||||
| Impact on comprehensive income for the year, net of income tax | 5,137,947 | 27,763 | 5,165,710 | |||||||||
| Total comprehensive income for the year | 28,730,614 | 71,618 | 28,802,232 | |||||||||
(Concluded)
| 4) | Amendment to IFRS 7 “Disclosures - Offsetting Financial Assets and Financial Liabilities” |
The amendments to IFRS 7 require disclosure of information about rights of offset and related arrangements (such as collateral posting requirements) for financial instruments under enforceable master netting arrangements and similar arrangements.
| 5) | Annual Improvements to IFRSs: 2009-2011 Cycle |
Several standards including IFRS 1 “First-time Adoption of International Financial Reporting Standards”, IAS 1 “Presentation of Financial Statements”, IAS 16 “Property, Plant and Equipment”,
-11-
IAS 32 “Financial Instruments: Presentation” and IAS 34 “Interim Financial Reporting” were amended in this annual improvement.
The amendments to IAS 1 clarify that an entity is required to present a balance sheet as at the beginning of the preceding period when a) it applies an accounting policy retrospectively, or makes a retrospective restatement or reclassifies items in its financial statements, and b) the retrospective application, restatement or reclassification has a material effect on the information in the balance sheet at the beginning of the preceding period. The amendments also clarify that related notes are not required to accompany the balance sheet at the beginning of the preceding period.
The amendments to IAS 16 clarify that spare parts, stand-by equipment and servicing equipment should be recognized in accordance with IAS16 when they meet the definition of property, plant and equipment and otherwise as inventory.
The amendments to IAS 32 clarify that income tax relating to distributions to holders of an equity instrument and to transaction costs of an equity transaction should be accounted for in accordance with IAS 12 “Income Taxes”.
The initial application of the amendments to the Regulations Governing the Preparation of Financial Reports by Securities Issuers and the 2013 IFRSs version in 2015 is expected to have material effect on the parent company only balance sheet as of January 1, 2014. In preparing the parent company only financial statements for the year ended December 31, 2015, the Company would present the parent company only balance sheet as of January 1, 2014 in accordance of the above amendments to IAS 1 and disclose related information in accordance with IAS 8 “Accounting Policies, Changes in Accounting Estimates and Errors”, but not required to make disclosures about the line items of the balance sheet as of January 1, 2014.
| 6) | Recognition and measurement of financial liabilities designated as at fair value through profit or loss |
In accordance with the amendments to the Regulations Governing the Preparation of Financial Reports by Securities Issuers, for financial liabilities designated as at fair value through profit or loss, the amount of change in the fair value attributable to changes in the credit risk of that liability is presented in other comprehensive income and the remaining amount of change in the fair value of that liability is presented in profit or loss. Changes in fair value attributable to a financial liability's credit risk are not subsequently reclassified to profit or loss. If the above accounting treatment would create or enlarge an accounting mismatch, all gains or losses on that liability are presented in profit or loss.
| b. | New IFRSs in issue but not yet endorsed by the FSC |
The Company has not applied the following New IFRSs issued by the IASB but not yet endorsed by the FSC. As of the date the parent company only financial statements were approved for issue, the FSC has not announced their effective dates.
| New IFRSs | Effective Date Announced by IASB (Note 1) | |
| Annual Improvements to IFRSs 2010-2012 Cycle | July 1, 2014 or transactions on or after July 1, 2014 | |
| Annual Improvements to IFRSs 2011-2013 Cycle | July 1, 2014 | |
| Annual Improvements to IFRSs 2012-2014 Cycle | January 1, 2016 (Note 2) | |
| IFRS 9 “Financial Instruments” | January 1, 2018 |
(Continued)
-12-
| New IFRSs | Effective Date Announced by IASB (Note 1) | |
| Amendments to IFRS 9 and IFRS 7 “Mandatory Effective Date of IFRS 9 and Transition Disclosures” | January 1, 2018 | |
| Amendment to IAS 10 and IAS 28 “Sale or Contribution of Assets between an Investor and its Associate or Joint Venture” | January 1, 2016 (Note 3) | |
| Amendment to IFRS 11 “Accounting for Acquisitions of Interests in Joint Operations” | January 1, 2016 | |
| IFRS 14 “Regulatory Deferral Accounts” | January 1, 2016 | |
| IFRS 15 “Revenue from Contracts with Customers” | January 1, 2017 | |
| Amendment to IAS 1 “Disclosure Initiative” | January 1, 2016 | |
| Amendments to IAS 16 and IAS 41 “Agriculture: Bearer Plants” | January 1, 2016 | |
| Amendment to IAS 19 “Defined Benefit Plans: Employee Contributions” | July 1, 2014 | |
| Amendment to IAS 27 Equity Method in Separate Financial Statements | January 1, 2016 | |
| Amendment to IAS 36 “Impairment of Assets: Recoverable Amount Disclosures for Non-financial Assets” | January 1, 2014 | |
| Amendment to IAS 39 “Novation of Derivatives and Continuation of Hedge Accounting” | January 1, 2014 | |
| IFRIC 21 “Levies” | January 1, 2014 |
(Concluded)
Note 1: Unless stated otherwise, the above New IFRSs are effective for annual periods beginning on or after their respective effective dates.
Note 2: The amendment to IFRS 5 is applied prospectively to changes in a method of disposal that occur in annual periods beginning on or after January 1, 2016; the remaining amendments are effective for annual periods beginning on or after January 1, 2016.
Note 3: Prospectively applicable to transactions occurring in annual periods beginning on or after January 1, 2016.
The initial application of the above New IFRSs, whenever applied, would not have any material impact on the Company’s accounting policies, except for the following:
| 1) | IFRS 9 “Financial Instruments” |
Recognition and measurement of financial assets
With regards to financial assets, all recognized financial assets that are within the scope of IAS 39 “Financial Instruments: Recognition and Measurement” are subsequently measured at amortized cost or fair value. Under IFRS 9, the requirement for the classification of financial assets is stated below:
For the Company’s debt instruments that have contractual cash flows that are solely payments of principal and interest on the principal amount outstanding, their classification and measurement are as follows:
| a) | For debt instruments, if they are held within a business model whose objective is to collect the contractual cash flows, the financial assets are measured at amortized cost and are assessed for impairment continuously with impairment loss recognized in profit or loss, if any. Interest revenue is recognized in profit or loss by using the effective interest method; |
-13-
| b) | For debt instruments, if they are held within a business model whose objective is achieved by both the collecting of contractual cash flows and the selling of financial assets, the financial assets are measured at fair value through other comprehensive income (FVTOCI) and are assessed for impairment. Interest revenue is recognized in profit or loss by using the effective interest method, and other gain or loss shall be recognized in other comprehensive income, except for impairment gains or losses and foreign exchange gains and losses. When the debt instruments are derecognized or reclassified, the cumulative gain or loss previously recognized in other comprehensive income is reclassified from equity to profit or loss. |
Except for above, all other financial assets are measured at fair value through profit or loss. However, the Company may make an irrevocable election to present subsequent changes in the fair value of an equity investment (that is not held for trading) in other comprehensive income, with only dividend income generally recognized in profit or loss. No subsequent impairment assessment is required, and the cumulative gain or loss previously recognized in other comprehensive income cannot be reclassified from equity to profit or loss.
The impairment of financial assets
IFRS 9 requires that impairment loss on financial assets is recognized by using the “Expected Credit Losses Model”. The credit loss allowance is required for financial assets measured at amortized cost, financial assets mandatorily measured at FVTOCI, lease receivables, contract assets arising from IFRS 15 “Revenue from Contracts with Customers”, certain written loan commitments and financial guarantee contracts. A loss allowance for the 12-month expected credit losses is required for a financial asset if its credit risk has not increased significantly since initial recognition. A loss allowance for full lifetime expected credit losses is required for a financial asset if its credit risk has increased significantly since initial recognition and is not low. However, a loss allowance for full lifetime expected credit losses is required for trade receivables that do not constitute a financing transaction.
For purchased or originated credit-impaired financial assets, the Company takes into account the expected credit losses on initial recognition in calculating the credit-adjusted effective interest rate. Subsequently, any changes in expected losses are recognized as a loss allowance with a corresponding gain or loss recognized in profit or loss.
Hedge accounting
The main changes in hedge accounting amended the application requirements for hedge accounting to better reflect the entity’s risk management activities. Compared with IAS 39, the main changes include: (1) enhancing types of transactions eligible for hedge accounting, specifically broadening the risk eligible for hedge accounting of non-financial items; (2) changing the way hedging derivative instruments are accounted for to reduce profit or loss volatility; and (3) replacing retrospective effectiveness assessment with the principle of economic relationship between the hedging instrument and the hedged item.
| 2) | Amendment to IAS 36 “Recoverable Amount Disclosures for Non-financial Assets” |
In issuing IFRS 13 “Fair Value Measurement”, the IASB made consequential amendment to the disclosure requirements in IAS 36 “Impairment of Assets”, introducing a requirement to disclose in every reporting period the recoverable amount of an asset or each cash-generating unit. The amendment clarifies that such disclosure of recoverable amounts is required only when an impairment loss has been recognized or reversed during the period. Furthermore, the Company is required to disclose the discount rate used in measurements of the recoverable amount based on fair value less costs of disposal measured using a present value technique.
-14-
| 3) | IFRS 15 “Revenue from Contracts with Customers” |
IFRS 15 establishes principles for recognizing revenue that apply to all contracts with customers, and will supersedes IAS 18 “Revenue”, IAS 11 “Construction Contracts” and a number of revenue-related interpretations from January 1, 2017.
When applying IFRS 15, an entity shall recognize revenue by applying the following steps:
| — | Identify the contract with the customer; |
| — | Identify the performance obligations in the contract; |
| — | Determine the transaction price; |
| — | Allocate the transaction price to the performance obligations in the contracts; and |
| — | Recognize revenue when the entity satisfies a performance obligation. |
When IFRS 15 is effective, the Company may elect to apply this Standard either retrospectively to each prior reporting period presented or retrospectively with the cumulative effect of initially applying this Standard recognized at the date of initial application.
| 4) | Amendments to IFRS 10 and IAS 28 “Sale or Contribution of Assets between an Investor and its Associate or Joint Venture” |
The amendments stipulated that, when the Company sells or contributes assets that constitute a business (as defined in IFRS 3) to an associate or joint venture, the gain or loss resulting from the transaction is recognized in full. Also, when the Company loses control of a subsidiary that contains a business but retains significant influence or joint control, the gain or loss resulting from the transaction is recognized in full.
Conversely, when the Company sells or contributes assets that do not constitute a business to an associate or joint venture, the gain or loss resulting from the transaction is recognized only to the extent of the unrelated investors’ interest in the associate or joint venture, i.e. the entity’s share of the gain or loss is eliminated. Also, when the Company loses control of a subsidiary that does not contain a business but retains significant influence or joint control in an associate or a joint venture, the gain or loss resulting from the transaction is recognized only to the extent of the unrelated investors’ interest in the associate or joint venture, i.e. the entity’s share of the gain or loss is eliminated.
| 5) | Amendment to IAS 1 Disclosure Initiative |
The amendment clarifies that the parent company only financial statements should be prepared for the purpose of disclosing material information. To improve the understandability of its consolidated financial statements, the Company should disaggregate the disclosure of material items into their different natures or functions, and disaggregate material information from immaterial information.
The amendment further clarifies that the Company should consider the understandability and comparability of its parent company only financial statements to determine a systematic order in presenting its footnotes.
Except for the above impact, as of the date the parent company only financial statements were approved for issue, the Company is continuously assessing the possible impact that the application of other standards and interpretations will have on the Company’s financial position and results of operations, and will disclose the relevant impact when the assessment is completed.
-15-
| 4. | SUMMARY OF SIGNIFICANT ACCOUNTING POLICIES |
| a. | Statement of Compliance |
The accompanying parent company only financial statements have been prepared in accordance with the Regulations Governing the Preparation of Financial Reports by Securities Issuers.
| b. | Basis of Preparation |
The accompanying parent company only financial statements have been prepared on the historical cost basis except for certain financial instruments that are measured at fair value. Historical cost is generally based on the fair value of the consideration given in exchange for the assets.
When preparing the parent company only financial statements, the Company used equity method to account for its investments in subsidiaries and associates. In order for the amount of the net profit for the year, other comprehensive income for the year and total equity in the parent company only financial statements to be the same with the amounts attributable to owners of the Company in its consolidated financial statements, adjustments arising from the differences in accounting treatment between parent company only basis and consolidated basis were made to investments accounted for using the equity method, share of profit or loss of subsidiaries and associates and share of other comprehensive income of subsidiaries and associates in the parent company only financial statements.
| c. | Classification of Current and Non-current Assets and Liabilities |
Current assets include cash and those assets held primarily for trading purposes or to be realized within twelve months after the balance sheet date, unless the asset is to be used for an exchange or to settle a liability, or otherwise remains restricted, at more than twelve months after the balance sheet date. Current liabilities are obligations incurred for trading purposes or to be settled within twelve months after the balance sheet date and liabilities that do not have an unconditional right to defer settlement for at least twelve months after the balance sheet date. Assets and liabilities that are not classified as current are classified as non-current.
| d. | Foreign Currencies |
In preparing the parent company only financial statements, transactions in currencies other than the entity’s functional currency (foreign currencies) are recognized at the rates of exchange prevailing at the dates of the transactions. At each balance sheet date, monetary items denominated in foreign currencies are retranslated at the rates prevailing at that date. Non-monetary items carried at fair value that are denominated in foreign currencies are retranslated at the rates prevailing at the date when the fair value was determined. Non-monetary items that are measured in terms of historical cost in a foreign currency are not retranslated.
Exchange differences on monetary items arising from settlement or translation are recognized in profit or loss in the period in which they arise.
Exchange differences arising on the retranslation of non-monetary assets (such as equity instruments) or liabilities measured at fair value are included in profit or loss for the period at the rates prevailing at the balance sheet date except for exchange differences arising on the retranslation of non-monetary items in respect of which gains and losses are recognized directly in other comprehensive income, in which case, the exchange differences are also recognized directly in other comprehensive income.
For the purposes of presenting the parent company only financial statements, the assets and liabilities of the Company’s foreign operations (including subsidiaries and associates operating in other countries or using currencies that are different from the Company’s) are translated into New Taiwan dollars using exchange rates prevailing at each balance sheet date. Income and expense items are translated at the
-16-
average exchange rates for the period. Exchange differences arising are recognized in other comprehensive income.
| e. | Inventories |
Inventories, including raw materials (materials received from customers for processing, mainly semiconductor wafers, are excluded from inventories as title and risk of loss remain with the customers), supplies, work in process, finished goods, and materials and supplies in transit are stated at the lower of cost or net realizable value. Inventory write-downs are made by item, except for those that may be appropriate to group items of similar or related inventories. Net realizable value is the estimated selling prices of inventories less all estimated costs of completion and estimated costs necessary to make the sale. Raw materials and supplies are recorded at moving average cost while work in process and finished goods are recorded at standard cost.
| f. | Investments Accounted for Using the Equity Method |
The Company used equity method to account for its investment in subsidiaries and associates.
| 1) | Investment in subsidiaries |
A subsidiary is an entity that is controlled by the company.
Under the equity method, an investment in a subsidiary is initially recognized at cost and adjusted thereafter to recognize the Company’s share of profit or loss and other comprehensive income of the subsidiary as well as the distribution received. The Company also recognized its share of the changes in other equity of the subsidiaries.
Changes in the Company’s ownership interests in subsidiaries that do not result in the Company’s losing control over the subsidiaries are accounted for as equity transactions. Any difference between the carrying amount of the investment and the fair value of the consideration paid or received is recognized directly in equity.
Any excess of the cost of acquisition over the Company’s share of the net fair value of the identifiable assets and liabilities of subsidiaries at the date of acquisition is recognized as goodwill, which is included within the carrying amount of the investment and is not amortized.
Unrealized profits and losses from downstream, upstream and sidestream transactions with subsidiaries are eliminated in full.
| 2) | Investments in associates |
An associate is an entity over which the Company has significant influence and that is neither a subsidiary nor a joint venture.
The Company uses the equity method to account for its investments in associates. Under the equity method, investments in an associate are initially recognized at cost and adjusted thereafter to recognize the Company’s share of the profit or loss and other comprehensive income of the associate. The Company also recognizes the changes in the Company’s share of equity of associates.
When the Company subscribes to additional shares in an associate at a percentage different from its existing ownership percentage, the resulting carrying amount of the investment differs from the amount of the Company’s proportionate interest in the net assets of the associate. The Company records such a difference as an adjustment to investments with the corresponding amount charged or credited to capital surplus. If the Company’s ownership interest is reduced due to the additional subscription to the shares of associate, the proportionate amount of the gains or losses previously
-17-
recognized in other comprehensive income in relation to that associate shall be reclassified to profit or loss on the same basis as would be required if the associate had directly disposed of the related assets or liabilities.
The unrealized profits and losses from downstream, upstream and sidestream transactions with associates are eliminated in full.
| g. | Property, Plant and Equipment |
Property, plant and equipment are stated at cost less accumulated depreciation and accumulated impairment.
Properties in the course of construction for production, supply or administrative purposes are carried at cost, less any recognized impairment loss. Such properties are classified to the appropriate categories of property, plant and equipment when completed and ready for intended use. Depreciation of these assets, on the same basis as other property assets, commences when the assets are ready for their intended use.
Depreciation is recognized using the straight-line method. The estimated useful lives, residual values and depreciation method are reviewed at each balance sheet date, with the effect of any changes in estimate accounted for on a prospective basis. Freehold land is not depreciated.
Property, plant and equipment is derecognized upon disposal or no expected future economic benefits. Any gain or loss arising on the derecognization of an item of property, plant and equipment is recognized in profit or loss.
| h. | Goodwill |
Goodwill arising from an acquisition of a business is carried at cost as established at the date of acquisition of the business less accumulated impairment loss.
Goodwill is not amortized and instead is tested for impairment annually. For the purpose of impairment testing, goodwill is allocated to each of the Company’s cash-generating units or groups of cash-generating units that are expected to benefit from the synergies of the combination.
If the recoverable amount of the cash-generating unit is less than its carrying amount, the impairment loss is allocated first to reduce the carrying amount of any goodwill allocated to the unit and then to the other assets of the unit pro rata based on the carrying amount of each asset in the unit. Any impairment loss is recognized directly in profit or loss. An impairment loss recognized for goodwill is not reversed in subsequent periods.
| i. | Other Intangible Assets |
Other intangible assets with finite useful lives acquired separately are initially measured at cost and subsequently measured at cost less accumulated amortization and accumulated impairment. Other intangible assets are amortized based on the straight-line method over their estimated useful lives. The estimated useful lives, residual value and amortization methods are reviewed at each balance sheet date. The residual value of an intangible asset with a finite useful life shall be assumed to be zero. The effect of any changes in estimate is accounted for on a prospective basis.
| j. | Impairment of Tangible and Intangible Assets Other than Goodwill |
At each balance sheet date, the Company reviews the carrying amounts of its tangible and intangible assets, excluding goodwill (see above), to determine whether there is any indication that those assets have suffered an impairment loss. If any such indication exists, the recoverable amount of the asset is estimated in order to determine the extent of the impairment loss. Recoverable amount is the higher of
-18-
fair value less costs to sell and value in use. If the recoverable amount of an asset or cash-generating unit is estimated to be less than its carrying amount, the carrying amount of the asset or cash-generating unit is reduced to its recoverable amount.
When an impairment loss is subsequently reversed, the carrying amount of the asset or cash-generating unit is increased to the revised estimate of its recoverable amount, but only to the extent of the carrying amount that would have been determined had no impairment loss been recognized for the asset or cash-generating unit in prior years. A reversal of an impairment loss is recognized immediately in profit or loss.
| k. | Financial Instruments |
Financial assets and financial liabilities are recognized when the Company becomes a party to the contractual provisions of the instruments. Financial assets and financial liabilities are initially measured at fair value. Transaction costs that are directly attributable to the acquisition or issue of financial assets and financial liabilities (other than financial assets and financial liabilities at fair value through profit or loss) are added to or deducted from the fair value of the financial assets or financial liabilities, as appropriate, on initial recognition. Transaction costs directly attributable to the acquisition of financial assets or financial liabilities at fair value through profit or loss are recognized immediately in profit or loss.
| 1) | Financial assets |
All regular way purchases or sales of financial assets are recognized or derecognized on a settlement date basis.
| a) | Measurement category |
The classification of financial assets held by the Company depends on the nature and purpose of the financial assets and is determined at the time of initial recognition.
| i | Financial assets at fair value through profit or loss (“FVTPL”) |
Financial assets are classified as at FVTPL when the financial assets are either held for trading or they are designated as at FVTPL. Financial assets at FVTPL are stated at fair value with any gains or losses arising on remeasurement recognized in profit or loss. The net gain or loss recognized in profit or loss incorporates any dividend or interest earned on the financial asset.
A financial asset other than a financial asset held for trading may be designated as at FVTPL upon initial recognition if:
| • | Such designation eliminates or significantly reduces a measurement or recognition inconsistency that would otherwise arise; or |
| • | The financial asset forms part of a group of financial assets or financial liabilities or both, which is managed and its performance is evaluated on a fair value basis, in accordance with the Company’s documented risk management or investment strategy, and information about the grouping is provided internally on that basis; or |
| • | It forms part of a contract containing one or more embedded derivatives, and IAS 39 permits the entire combined contract to be designated as at FVTPL. |
-19-
| ii | Available-for-sale financial assets |
Shares, of which the fair value can be measured reliably, held by the Company are classified as available-for-sale financial assets and are measured at fair value at each balance sheet date. Changes in the carrying amount of available-for-sale financial assets are recognized in other comprehensive income and accumulated under the heading of unrealized gain (loss) on available-for-sale financial assets. When the investment is disposed of or is determined to be impaired, the cumulative gain or loss previously accumulated in the unrealized gain (loss) on available-for-sale financial assets is reclassified to profit or loss.
Dividends on available-for-sale equity instruments are recognized in profit or loss when the Company’ s right to receive the dividends is established.
| iii | Loans and receivables |
Loans and receivables including cash, trade receivables, other receivables and other financial assets are measured at amortized cost using the effective interest method, less any impairment. Interest income is recognized by applying the effective interest rate, except for short-term receivables when the effect of discounting is immaterial.
| b) | Impairment of financial assets |
Financial assets, other than those at FVTPL, are assessed for indicators of impairment at each balance sheet date. Financial assets are considered to be impaired when there is objective evidence that, as a result of one or more events that occurred after the initial recognition of the financial assets, the estimated future cash flows of the investments have been affected.
For financial assets carried at amortized cost, such as trade receivables and other receivables, assets that are assessed not to be impaired individually are, further, assessed for impairment on a collective basis. The Group assesses the collectability of receivables based on the Group’s past experience of collecting payments and observable changes that correlate with default on receivables.
For financial assets carried at amortized cost, the amount of the impairment loss recognized is the difference between the assets’ carrying amounts and the present value of estimated future cash flows, discounted at the financial assets’ original effective interest rates. If, in a subsequent period, the amount of the impairment loss decreases and the decreases can be objectively related to an event occurring after the impairment loss recognized, the previously recognized impairment loss is reversed either directly or by adjusting an allowance account through profit or loss. The reversal shall not result in carrying amounts of financial assets that exceed what the amortized cost would have been at the date the impairment is reversed.
When an available-for-sale financial asset is considered to be impaired, cumulative gains or losses previously recognized in other comprehensive income are reclassified to profit or loss in the period. In respect of available-for-sale equity securities, impairment loss previously recognized in profit or loss are not reversed through profit or loss. Any increase in fair value subsequent to an impairment loss is recognized in other comprehensive income and accumulated under the heading of unrealized gain (loss) on available-for-sale financial assets.
| c) | Derecognition of financial assets |
The Company derecognizes a financial asset only when the contractual rights to the cash flows from the asset expire, or when it transfers the financial asset and substantially all the risks and rewards of ownership of the asset to another entity. On derecognition of a financial asset in its entirety, the difference between the asset’s carrying amount and the sum of the consideration received and receivable and the cumulative gain or loss that had been recognized in other comprehensive income and accumulated in equity is recognized in profit or loss.
-20-
| 2) | Equity instruments |
Debt and equity instruments issued by the Company are classified as either financial liabilities or as equity in accordance with the substance of the contractual arrangements and the definitions of a financial liability and an equity instrument. Equity instruments issued by a group entity are recognized at the proceeds received, net of direct issue costs.
Repurchase of the Company’s own equity instruments is recognized in and deducted directly from equity. No gain or loss is recognized in profit or loss on the purchase, sale, issue or cancellation of the Company’s own equity instruments.
| 3) | Financial liabilities |
Financial liabilities are measured either at amortized cost using the effective interest method or at FVTPL. Financial liabilities measured at FVTPL are held for trading.
Financial liabilities at FVTPL are stated at fair value, with any gain or loss arising on remeasurement recognized in profit or loss. The net gain or loss recognized in profit or loss incorporates any interest or dividend paid on the financial liability. Fair value is determined in the manner described in Note 26.
The Company derecognizes financial liabilities when, and only when, the Company’s obligations are discharged, cancelled or they expire. The difference between the carrying amount of the financial liability derecognized and the consideration paid and payable, including any non-cash assets transferred or liabilities assumed, is recognized in profit or loss.
| 4) | Derivative financial instruments |
Derivatives are initially recognized at fair value at the date the derivative contracts are entered into and are subsequently remeasured to their fair value at each balance sheet date. When the fair value of derivative financial instruments is positive, the derivative is recognized as a financial asset; when the fair value of derivative financial instruments is negative, the derivative is recognized as financial liabilities.
Derivatives embedded in non-derivative host contracts are treated as separate derivatives when they meet the definition of a derivative, their risks and characteristics are not closely related to those of the host contracts and the contracts are not measured at FVTPL.
| 5) | Convertible bonds |
Convertible bonds issued by the Company that contain liability, conversion option, redemption option and put option (collectively the “Bonds Options”) components are classified separately into respective items on initial recognition. The conversion option that will be settled other than by the exchange of a fixed amount of cash or other financial asset for a fixed number of the Company’s own equity instruments is classified as a conversion option derivative.
On initial recognition, the Bonds Options are measured at fair value while the residual of total consideration from the Bonds options is recognized as initial carrying amount for the liability. In subsequent periods, the liability component of the convertible bonds is measured at amortized cost using the effective interest method. The Bonds Options are measured at fair value and the changes in fair value are recognized in profit or loss.
Transaction costs that relate to the offering of the convertible bonds are allocated to the liability (recognized as the carrying amount of the liability) and the Bonds options components (recognized in profit or loss) in proportion to their relative fair values.
-21-
| l. | Revenue Recognition |
Revenue is measured at the fair value of the consideration received or receivable take into account of estimated customer returns, rebates and other similar allowances.
| 1) | Sale of goods |
Revenue from the sale of goods is recognized when the goods are delivered and titles have passed, at the time all the following conditions are satisfied:
| — | The Company has transferred to the buyer the significant risks and rewards of ownership of the goods; |
| — | The Company retains neither continuing managerial involvement to the degree usually associated with ownership nor effective control over the goods sold; |
| — | The amount of revenue can be reliably measured; |
| — | It is probable that the economic benefits associated with the transaction will flow to the Company; and |
| — | The costs incurred or to be incurred in respect of the transaction can be reliably measured. |
| 2) | Rendering of services |
Service income is recognized when services are rendered.
| 3) | Dividend and interest income |
Dividend income from investments and interest income from financial assets are recognized when they are probable that the economic benefits will flow to the Company and the amount of income can be reliably measured. Interest income is accrued on a time basis, by reference to the principal outstanding and at the effective interest rate applicable.
| m. | Leasing |
Rental income or expense from operating leases is recognized on a straight-line basis over the term of the relevant lease.
| n. | Borrowing Costs |
Borrowing costs directly attributable to the acquisition of qualifying assets are added to the cost of those assets, until such time as the assets are substantially ready for their intended use or sale. All other borrowing costs are recognized in profit or loss in the period in which they are incurred.
| o. | Retirement Benefit Costs |
Payments to defined contribution retirement benefit plans are recognized as expenses when employees have rendered services entitling them to the contributions.
For defined benefit retirement benefit plans, the cost of providing benefits is determined using the Projected Unit Credit Method. All actuarial gains and losses on the defined benefit obligation are recognized immediately in other comprehensive income.
-22-
| p. | Share-based Payment Arrangements |
Equity-settled share-based payments to employees are measured at the fair value of the equity instruments at the grant date. The fair value determined at the grant date of the equity-settled share-based payments is expensed on a straight-line basis over the vesting period, based on the Group's best estimate of equity instruments that will eventually vest, with a corresponding increase in capital surplus - employee share options.
At each balance sheet date, the Group reviews its estimate of the number of employee share options expected to vest. The impact of the revision of the original estimates is recognized in profit or loss such that the cumulative expense reflects the revised estimate, with a corresponding adjustment to the capital surplus - employee share options.
| q. | Taxation |
Income tax expense represents the sum of the tax currently payable and deferred tax.
| 1) | Current tax |
Income tax on unappropriated earnings (excluding earnings from foreign consolidated subsidiaries) at a rate of 10% is expensed in the year the earnings arise and adjusted to the extent that distributions are approved by the shareholders in the following year.
Adjustments of prior years’ tax liabilities are added to or deducted from the current year’s tax provision.
| 2) | Deferred tax |
Deferred tax is recognized on temporary differences between the carrying amounts of assets and liabilities in the parent company only financial statements and the corresponding tax bases used in the computation of taxable profit. Deferred tax liabilities are generally recognized for all taxable temporary differences. Deferred tax assets are generally recognized for all deductible temporary differences and unused tax credits that it is probable that taxable profits will be available against which those deductible temporary differences can be utilized.
Deferred tax liabilities are recognized for taxable temporary differences associated with investments in subsidiaries except where the Company is able to control the reversal of the temporary differences and it is probable that the temporary differences will not reverse in the foreseeable future.
The carrying amounts of deferred tax assets is reviewed at each balance sheet date and reduced to the extent that it is no longer probable that sufficient taxable profits will be available to allow all or part of deferred tax assets to be utilized. A previously unrecognized deferred tax asset is also reviewed at each balance sheet date and recognized to the extent that it has become probable that future taxable profit will allow the deferred tax asset to be recovered.
Deferred tax assets and liabilities are measured at the tax rates that are expected to apply in the period in which assets are realized or the liabilities are settled. The measurement of deferred tax assets and liabilities reflects the tax consequences that would follow from the manner in which the Company expects, at the balance sheet date, to recover or settle the carrying amounts of its assets and liabilities.
3) Current and deferred tax for the year
Current and deferred tax are recognized in profit or loss, except when they relate to items that are recognized in other comprehensive income or directly in equity, in which case, the current and
-23-
deferred tax are also recognized in other comprehensive income, respectively
| 5. | CRITICAL ACCOUNTING JUDGMENTS AND KEY SOURCES OF ESTIMATION UNCERTAINTY |
In the application of the Company’s accounting policies, which are described in Note 4, management is required to make judgments, estimates and assumptions about the carrying amounts of assets and liabilities that are not readily apparent from other sources. The estimates and underlying assumptions are based on historical experience and other factors that are considered to be relevant. Actual results may differ from these estimates.
The estimates and underlying assumptions are reviewed on an ongoing basis. Revisions to accounting estimates are recognized in the period in which the estimate is revised if the revision affects only that period, or in the period of the revision and future periods if the revision affects both current and future periods.
Impairment of Goodwill
Determining whether goodwill is impaired requires an estimation of the value in use of the cash-generating units to which goodwill has been allocated. The value in use calculation requires management to estimate the future cash flows expected to arise from cash-generating units and suitable discount rates in order to calculate its present value. When the actual future cash flows are less than expected, a material impairment loss may arise.
Impairment of Tangible and Intangible Assets Other than Goodwill
In evaluating the impairment of tangible and intangible assets other than goodwill, the Company is required to make subjective judgments in determining the independent cash flows, useful lives, expected future revenue and expenses related to the specific asset groups with the consideration of its usage patterns and the nature of semiconductor industry. Any changes in these estimates based on changed economic conditions or business strategies could result in significant impairment charges in future periods.
Valuation of Inventory
Inventories are stated at the lower of cost or net realizable value and the net realizable value of inventory at balance sheet date is determined based on Company’s judgments and estimates.
Due to the rapid technology changes, the Company estimates the net realizable value of inventory for obsolescent and unmarketable items at balance sheet date and then writes down the cost of inventories to net realizable value. There may be significant changes in the net realizable value of inventories due to assumptions of future demand within a specific time period.
Income Taxes
The reliability of deferred tax assets mainly depends on whether sufficient future profits or taxable temporary differences will be available. In cases where the actual future profits generated are less than expected, a material reversal of deferred tax assets may arise, which would be recognized in profit or loss for the period in which such a reversal takes place.
Recognition and Measurement of Defined Benefit Plans
Accrued pension liabilities and the resulting pension expenses under defined benefit pension plans are calculated using the Projected Unit Credit Method. Actuarial assumptions comprise discount rates and expected rates of salary increase. Changes in economic circumstances and market conditions will affect these assumptions and may have a material impact on the amount of the expense and the liability.
-24-
Fair Value Measurements and Valuation Processes of Derivatives and Other Financial Instruments
As disclosed in Note 26, the Company’s management uses its judgments applying valuation techniques commonly applied by market practitioners. The assumptions applied are based on observable quoted market prices, foreign exchange rates and interest rates to the extent it is available. The fair value of unquoted equity instruments is estimated based on the assumptions supported by unobservable market prices and interest rates which are disclosed in Note 26. The Company’s management believes that the valuation techniques and the assumptions applied are appropriate in determining the fair value of financial instruments.
| 6. | CASH |
| December 31 | ||||||||
| 2014 | 2013 | |||||||
| NT$ | NT$ | |||||||
| Cash on hand | $ | 1,739 | $ | 34,273 | ||||
| Checking accounts and demand deposits | 11,252,778 | 14,924,995 | ||||||
| $ | 11,254,517 | $ | 14,959,268 | |||||
| 7. | FINANCIAL INSTRUMENTS AT FAIR VALUE THROUGH PROFIT OR LOSS |
| December 31 | ||||||||
| 2014 | 2013 | |||||||
| NT$ | NT$ | |||||||
| Financial assets designated as at FVTPL | ||||||||
| Private-placement convertible bonds | $ | 100,500 | $ | 100,500 | ||||
| Financial assets held for trading | ||||||||
| Swap contracts | 1,888,449 | 195,964 | ||||||
| Forward exchange contracts | 1,234 | 5,809 | ||||||
| 1,889,683 | 201,773 | |||||||
| $ | 1,990,183 | $ | 302,273 | |||||
| Financial liabilities held for trading | ||||||||
| Conversion option, redemption option and put option of convertible bonds (Note 15) | $ | 2,520,606 | $ | 1,742,996 | ||||
| Swap contracts | 13,726 | 33,950 | ||||||
| Forward exchange contracts | 6,086 | 11,882 | ||||||
| Cross currency swap contracts | — | 4,180 | ||||||
| Foreign currency option contracts | — | 644 | ||||||
| $ | 2,540,418 | $ | 1,793,652 | |||||
The Company invested in private-placement convertible bonds which included embedded derivative instruments and were not closely related to the host contracts. The Company designated the entire contracts as financial assets at FVTPL on initial recognition.
-25-
At each balance sheet date, the outstanding swap contracts not accounted for hedge accounting were as follows:
| Notional Amount | ||||
| Currency | Maturity Period | (In Thousands) | ||
| December 31, 2014 | ||||
| Sell NT$/Buy US$ | 2015.01-2015.12 | NT$35,919,205/US$1,200,000 | ||
| Sell US$/Buy NT$ | 2015.01 | US$44,000/NT$1,386,200 | ||
| December 31, 2013 | ||||
| Sell NT$/Buy US$ | 2014.01-2014.12 | NT$31,369,567/US$1,063,500 |
At each balance sheet date, the outstanding forward exchange contracts not accounted for hedge accounting were as follows:
| Notional Amount | ||||
| Currency | Maturity Period | (In Thousands) | ||
| December 31, 2014 | ||||
| Sell US$/Buy JPY | 2015.01 | US$16,600/JPY1,967,144 | ||
| December 31, 2013 | ||||
| Sell US$/Buy NT$ | 2014.01-2014.02 | US$44,800/NT$1,338,505 | ||
| Sell US$/Buy JPY | 2014.01-2014.02 | US$21,650/JPY2,238,967 |
At each balance sheet date, the outstanding cross currency swap contracts not accounted for hedge accounting were as follows:
Notional Amount (In Thousands) | Maturity Period | Range of Interest Rates Paid (%) | Range of Interest Rates Received (%) | |||
| December 31, 2013 | ||||||
| NT$598,600/US$20,000 | 2014.07 | (0.19) | 0.16 |
At each balance sheet date, the outstanding foreign currency option contracts not accounted for hedge accounting were as follows:
| Notional Amount | ||||
| Currency | Maturity Period | (In Thousands) | ||
| December 31, 2013 | ||||
| Sell US$ Put/NT$ Call | 2016.03 (Note) | US$4,000/NT$113,400 | ||
| Buy US$ Call/NT$ Put | 2016.03 (Note) | US$2,000/NT$56,700 |
| Note: | The contracts will be settled once a month and the counterparty has the right to early terminate the contracts. All of the aforementioned outstanding contracts were early terminated. |
-26-
| 8. | AVAILABLE-FOR-SALE FINANCIAL ASSETS |
| December 31 | ||||||||
| 2014 | 2013 | |||||||
| NT$ | NT$ | |||||||
| Open-end mutual funds | $ | 400,007 | $ | 2,301,824 | ||||
| Limited partnership | 438,953 | 457,756 | ||||||
| Unquoted ordinary shares | 103,194 | 65,146 | ||||||
| Private-placement ordinary shares | — | 69,655 | ||||||
| Quoted ordinary shares | — | 10,323 | ||||||
| 942,154 | 2,904,704 | |||||||
| Current | 400,007 | 2,312,147 | ||||||
| Non-current | $ | 542,147 | $ | 592,557 | ||||
| 9. | TRADE RECEIVABLES, NET |
| December 31 | ||||||||
| 2014 | 2013 | |||||||
| NT$ | NT$ | |||||||
| Trade receivables | $ | 16,497,435 | $ | 12,085,372 | ||||
| Less: Allowance for doubtful debts | 23,931 | 23,931 | ||||||
| Trade receivables, net | $ | 16,473,504 | $ | 12,061,441 | ||||
| a. | Trade receivables |
The Company’s average credit terms were 30 to 90 days. Allowance for doubtful debts is assessed by reference to the collectability of receivables by evaluating the account aging, historical experience and current financial condition of customers.
The Company serves a variety of customers and, therefore, the concentration of credit risk is not significant.
Age of receivables that are past due but not impaired
| December 31 | ||||||||
| 2014 | 2013 | |||||||
| NT$ | NT$ | |||||||
| Less than 30 days | $ | 1,690,033 | $ | 1,181,160 | ||||
| 31 to 90 days | 58,588 | 46,141 | ||||||
| Total | $ | 1,748,621 | $ | 1,227,301 | ||||
The above aging schedule was based on the past due date.
Except for those impaired, the Company had not provided an allowance for doubtful debts on trade receivables at each balance sheet date since there has not been a significant change in credit quality and the amounts were still considered collectible. The Company did not hold any collateral or other credit enhancements over these balances nor did it have a legal right to offset against any amounts owed by
-27-
the Company to counterparties.
Movement of the allowance for doubtful trade receivables
| For the Year Ended | ||||||||
| 2014 | 2013 | |||||||
| NT$ | NT$ | |||||||
| Balance at January 1 | $ | 23,931 | $ | 21,931 | ||||
| Impairment losses recognized | — | 2,000 | ||||||
| Balance at December 31 | $ | 23,931 | $ | 23,931 | ||||
The allowance for doubtful trade receivables for trade receivables that were individually impaired were 5,100 thousand and 6,622 thousand for the years ended December 31, 2014 and 2013, respectively. The impairment loss recognized was the difference between the carrying amount of the trade receivables and the present value of the expected recovery amounts.
Age of impaired trade receivables
| December 31 | ||||||||
| 2014 | 2013 | |||||||
| NT$ | NT$ | |||||||
| Not past due | $ | — | $ | — | ||||
| Less than 30 days | 76 | 5 | ||||||
| 31 to 90 days | 28,795 | 20,634 | ||||||
| More than 91 days | 24,854 | 11,881 | ||||||
| Total | $ | 53,725 | $ | 32,520 | ||||
The above aging schedule was based on the past due date.
| b. | Transfers of financial assets |
Factored trade receivables of the Company were as follows:
| Counterparties | Receivables Sold (In Thousands) | Amounts Collected (In Thousands) | Advances Received At Year-end (In Thousands) | Interest Rates on Advances Received (%) | Credit Line (In Thousands) | |||||||||||||||
| Year ended December 31, 2014 | ||||||||||||||||||||
| Citi bank | US$ 103,744 | US$ 103,744 | — | — | US$ 92,000 | |||||||||||||||
| Year ended December 31, 2013 | ||||||||||||||||||||
| Citi bank | US$ 258,660 | US$ 202,532 | US$ 56,128 | 1.06 | US$ 92,000 | |||||||||||||||
Pursuant to the factoring agreement, losses from commercial disputes (such as sales returns and discounts) should be borne by the Company, while losses from credit risk should be borne by the banks. The Company also issued promissory notes to the banks for commercial disputes which remained undrawn since. The promissory notes amounted to US$5,000 thousand and US$27,000 thousand as of December 31, 2014 and 2013, respectively. As of December 31, 2014, there was no significant losses from commercial disputes in the past and the Company does not expect any significant commercial dispute losses in the foreseeable future.
-28-
| 10. | INVENTORIES |
| December 31 | ||||||||
| 2014 | 2013 | |||||||
| NT$ | NT$ | |||||||
| Finished goods | $ | 245,301 | $ | 218,026 | ||||
| Work in process | 209,411 | 126,423 | ||||||
| Raw materials | 3,467,274 | 2,997,252 | ||||||
| Supplies | 316,515 | 212,776 | ||||||
| Raw materials and supplies in transit | 85,167 | 88,139 | ||||||
| $ | 4,323,668 | $ | 3,642,616 | |||||
The cost of inventories recognized as operating costs for the years ended December 31, 2014 and 2013 were NT$67,316,934 thousand and NT$60,064,369 thousand, respectively, which included write-downs of inventories at NT$170,555 thousand and NT$236,741 thousand, respectively.
| 11. | INVESTMENTS ACCOUNTED FOR USING THE EQUITY METHOD |
| December 31 | ||||||||
| 2014 | 2013 | |||||||
| NT$ | NT$ | |||||||
| Investments in subsidiaries | $ | 137,562,065 | $ | 116,795,517 | ||||
| Investments in associates | $ | 1,492,441 | $ | 1,216,201 | ||||
| a. | Investments in subsidiaries |
| December 31 | ||||||||||||||||
| 2014 | 2013 | |||||||||||||||
| Amount | % of Owner- ship | Amount | % of Owner- ship | |||||||||||||
| J & R Holding Limited (J&R Holding) | $ | 45,150,552 | 100.0 | $ | 41,497,251 | 100.0 | ||||||||||
| USI Inc. (“USIINC”) | 36,711,064 | 99.2 | 25,877,089 | 99.2 | ||||||||||||
| ASE Test, Inc. | 26,941,503 | 100.0 | 23,429,925 | 100.0 | ||||||||||||
| A.S.E. Holding Limited (ASE Holding) | 14,367,500 | 100.0 | 12,969,126 | 100.0 | ||||||||||||
| Omniquest Industrial Limited (Omniquest) | 11,044,272 | 70.6 | 10,003,686 | 70.6 | ||||||||||||
| Innosource Limited (Innosource) | 3,965,686 | 100.0 | 3,635,314 | 100.0 | ||||||||||||
| Luchu Development Corporation (“Luchu”) | 1,315,623 | 67.1 | 1,316,917 | 67.1 | ||||||||||||
| ASE Marketing & Service Japan Co., Ltd. (ASE MS Japan) | 24,972 | 100.0 | 25,316 | 100.0 | ||||||||||||
| 139,521,172 | 118,754,624 | |||||||||||||||
| Less : Shares held by subsidiaries accounted for as treasury shares | 1,959,107 | 1,959,107 | ||||||||||||||
| $ | 137,562,065 | $ | 116,795,517 | |||||||||||||
-29-
In August 2013, Luchu completed its cash capital increase and the Company’s shareholdings of Luchu decreased from 84.3% to 67.1% since the Company did not subscribe for additional new shares. The transaction was accounted for as an equity transaction since the Company did not cease to have control over Luchu.
In November 2014, a subsidiary of the Company, Universal Scientific Industrial (Shanghai) Co., Ltd. (“USISH”), completed its cash capital increase and the Company’s shareholdings of USISH decreased from 88.6% to 82.1% since the Company and its subsidiaries did not subscribe for additional new shares. The transaction was accounted for as an equity transaction since the Company did not cease to have control over USISH and, as a result, in the fourth quarter of 2014, capital surplus was increased by NT$6,871,062 thousand.
The Company’s share of profit or loss and other comprehensive income or loss of the subsidiaries for the years ended December 31, 2014 and 2013 was based on those subsidiaries’ audited financial statements for the same years.
b. Investments in associates
| 1) | Investments in associates accounted for using the equity method consisted of the following: |
| Carrying Amount as of December 31 | ||||||||||||||
| Operating | 2014 | 2013 | ||||||||||||
| Name of Associate | Main Business | Location | NT$ | NT$ | ||||||||||
| Listed company | ||||||||||||||
| Hung Ching Development & Construction Co. (“HC”) | Engaged in the development, construction and leasing of real estate properties | ROC | $ | 1,351,400 | $ | 1,163,196 | ||||||||
| Advanced Microelectronic Products Inc. (“AMPI”) | Engaged in integrated circuit | ROC | 99,052 | — | ||||||||||
| Unlisted companies | ||||||||||||||
| Hung Ching Kwan Co. (“HCK”) | Engaged in the leasing of real estate properties | ROC | 342,138 | 353,154 | ||||||||||
| StarChips Technology Inc. (“SCT”) | Engaged in design, manufacturing and sale of LED driver IC | ROC | — | 47,856 | ||||||||||
| 1,792,590 | 1,564,206 | |||||||||||||
| Less: Deferred gain on transfer of land | 300,149 | 300,149 | ||||||||||||
| Accumulated impairment - SCT | — | 47,856 | ||||||||||||
| $ | 1,492,441 | $ | 1,216,201 | |||||||||||
| 2) | At each balance sheet date, the percentages of ownership held by the Company were as follows: |
| December 31 | ||||||||
| Name of Associate | 2014 | 2013 | ||||||
| HC | 26.2 | % | 26.2 | % | ||||
| AMPI | 18.2 | % | — | |||||
| HCK | 27.3 | % | 27.3 | % | ||||
| SCT | — | 33.3 | % | |||||
| 3) | In January 2014, the Company subscribed for 20,000 thousand private-placement ordinary shares of AMPI in NT$100,000 thousand. The Company obtained significant influence over AMPI since the percentage of ownership was increased to 27.4% after taking into account the shares previously held which were recognized as available-for-sale financial assets. The private-placement ordinary shares were restricted for disposal during a 3-year lock-up period. In addition, the Company did not join AMPI’s cash capital increase in February and April 2014 and, as the result, the percentage of ownership decreased from 27.4% to 18.2%. After the consideration of potential voting rights |
-30-
that are currently convertible, the Company still has significant influence over AMPI.
| 4) | The Company did not subscribe for SCT’s cash capital increase in May 2014 and, therefore, the percentage of ownership decreased from 33.3% to 5.6%. As the result, the Company had no significant influence over SCT and the investment in SCT was reclassified to available-for-sale financial assets. |
| 5) | Fair values of investments in associates with available published price quotation as of the balance sheet date are summarized as follows: |
| December 31 | ||||||||
| 2014 | 2013 | |||||||
| Name of Associate | NT$ | NT$ | ||||||
| HC | $ | 1,427,499 | $ | 1,242,199 | ||||
| AMPI | $ | 184,862 | $ | — | ||||
| 6) | Aggregate information of associates that are not individually material |
| December 31 | ||||||||
| 2014 | 2013 | |||||||
| NT$ | NT$ | |||||||
| Total assets | $ | 16,992,101 | $ | 16,020,314 | ||||
| Total liabilities | $ | 8,679,614 | $ | 9,802,624 | ||||
For the Year Ended December 31 | ||||||||
| 2014 | 2013 | |||||||
| NT$ | NT$ | |||||||
| Operating revenue for the year | $ | 5,718,922 | $ | 2,403,386 | ||||
| Net profit for the year | $ | 508,376 | $ | 311,835 | ||||
| Other comprehensive income for the year | $ | 9,087 | $ | 215,427 | ||||
The investment accounted for using the equity method and the share of net profit and other comprehensive income were recorded based on the audited financial statements for the years ended December 31, 2014 and 2013.
| 12. | PROPERTY, PLANT AND EQUIPMENT |
The carrying amounts of each class of property, plant and equipment were as follows:
| December 31 | ||||||||
| 2014 | 2013 | |||||||
| NT$ | NT$ | |||||||
| Land | $ | 1,562,945 | $ | 1,562,945 | ||||
| Buildings and improvements | 25,952,734 | 19,429,145 | ||||||
| Machinery and equipment | 47,020,338 | 39,998,306 | ||||||
| Transportation equipment | 18,264 | 15,597 | ||||||
| Furniture and fixtures | 384,448 | 237,952 | ||||||
| Construction in progress and machinery in transit | 2,702,266 | 1,878,227 | ||||||
| $ | 77,640,995 | $ | 63,122,172 | |||||
-31-
For the year ended December 31, 2014
| Land | Buildings and improvements | Machinery and equipment | Transportation equipment | Furniture and fixtures | Construction in progress and machinery
in transit
| Total | ||||||||||||||||||||||
| NT$ | NT$ | NT$ | NT$ | NT$ | NT$ | NT$ | ||||||||||||||||||||||
| Cost | ||||||||||||||||||||||||||||
| Balance at January 1,2014 | $ | 1,562,945 | $ | 30,805,750 | $ | 95,019,106 | $ | 76,216 | $ | 1,162,701 | $ | 1,878,227 | $ | 130,504,945 | ||||||||||||||
| Additions | — | (7,955 | ) | 535,770 | — | 37,838 | 27,006,561 | 27,572,214 | ||||||||||||||||||||
| Disposals | — | (254,885 | ) | (2,459,275 | ) | (4,545 | ) | (90,841 | ) | (18,046 | ) | (2,827,592 | ) | |||||||||||||||
| Reclassification | — | 8,337,064 | 17,572,550 | 9,343 | 238,355 | (26,157,312 | ) | — | ||||||||||||||||||||
| Balance at December 31,2014 | $ | 1,562,945 | $ | 38,879,974 | $ | 110,668,151 | $ | 81,014 | $ | 1,348,053 | $ | 2,709,430 | $ | 155,249,567 | ||||||||||||||
| Accumulated depreciation and impairment | ||||||||||||||||||||||||||||
| Balance at January 1,2014 | $ | — | $ | 11,376,605 | $ | 55,020,800 | $ | 60,619 | $ | 924,749 | $ | — | $ | 67,382,773 | ||||||||||||||
| Depreciation expense | — | 1,715,421 | 10,816,943 | 5,946 | 129,644 | — | 12,667,954 | |||||||||||||||||||||
| Impairment losses recognized | — | 42,988 | 111,507 | — | — | 7,164 | 161,659 | |||||||||||||||||||||
| Disposals | — | (207,774 | ) | (2,301,437 | ) | (3,815 | ) | (90,788 | ) | — | (2,603,814 | ) | ||||||||||||||||
| Balance at December 31,2014 | $ | — | $ | 12,927,240 | $ | 63,647,813 | $ | 62,750 | $ | 963,605 | $ | 7,164 | $ | 77,608,572 | ||||||||||||||
For the year ended December 31, 2013
| Land | Buildings and improvements | Machinery and equipment | Transportation equipment | Furniture and fixtures | Construction in progress and machinery in transit | Total | ||||||||||||||||||||||
| NT$ | NT$ | NT$ | NT$ | NT$ | NT$ | NT$ | ||||||||||||||||||||||
| Cost | ||||||||||||||||||||||||||||
| Balance at January 1,2013 | $ | 1,562,945 | $ | 27,390,641 | $ | 84,867,701 | $ | 69,066 | $ | 956,306 | $ | 3,385,002 | $ | 118,231,661 | ||||||||||||||
| Additions | — | 3,724,793 | 12,762,341 | 10,572 | 157,609 | (1,436,827 | ) | 15,218,488 | ||||||||||||||||||||
| Disposals | — | (316,410 | ) | (3,834,446 | ) | (3,422 | ) | (9,712 | ) | (32,573 | ) | (4,196,563 | ) | |||||||||||||||
| Reclassification | — | (71,041 | ) | (21,691 | ) | — | 56,374 | (37,375 | ) | (73,733 | ) | |||||||||||||||||
| Acquisitions through business combinations | — | 77,767 | 1,245,201 | — | 2,124 | — | 1,325,092 | |||||||||||||||||||||
| Balance at December 31,2013 | $ | 1,562,945 | $ | 30,805,750 | $ | 95,019,106 | $ | 76,216 | $ | 1,162,701 | $ | 1,878,227 | $ | 130,504,945 | ||||||||||||||
| Accumulated depreciation and impairment | ||||||||||||||||||||||||||||
| Balance at January 1,2013 | $ | — | $ | 10,189,585 | $ | 48,895,395 | $ | 58,746 | $ | 816,270 | $ | — | $ | 59,959,996 | ||||||||||||||
| Depreciation expense | — | 1,501,576 | 9,189,347 | 5,295 | 82,460 | — | 10,778,678 | |||||||||||||||||||||
| Impairment losses recognized (reversed) | — | (13,555 | ) | — | — | — | — | (13,555 | ) | |||||||||||||||||||
| Disposals | — | (301,904 | ) | (3,398,169 | ) | (3,422 | ) | (9,398 | ) | — | (3,712,893 | ) | ||||||||||||||||
| Reclassification | — | (14,317 | ) | (37,522 | ) | — | 34,829 | — | (17,010 | ) | ||||||||||||||||||
| Acquisitions through business combinations | — | 15,220 | 371,749 | — | 588 | — | 387,557 | |||||||||||||||||||||
| Balance at December 31,2013 | $ | — | $ | 11,376,605 | $ | 55,020,800 | $ | 60,619 | $ | 924,749 | $ | — | $ | 67,382,773 | ||||||||||||||
Each class of property, plant and equipment was depreciated on a straight-line basis over the following useful lives:
| Buildings and improvements | ||
| Main plant buildings | 10-40 years | |
| Cleanrooms | 10-20 years | |
| Others | 3-20 years | |
| Machinery and equipment | 2-10 years | |
| Transportation equipment | 2-5 years | |
| Furniture and fixtures | 2-8 years |
| 13. | OTHER INTANGIBLE ASSETS |
The carrying amounts of each class of other intangible assets were as follows:
| December 31 | ||||||||
| 2014 | 2013 | |||||||
| NT$ | NT$ | |||||||
| Patents | $ | — | $ | 788 | ||||
| Computer software and others | 486,192 | 392,971 | ||||||
| $ | 486,192 | $ | 393,759 | |||||
-32-
For the year ended December 31, 2014
| Patents | Computer Software and Others | Total | ||||||||||
| NT$ | NT$ | NT$ | ||||||||||
| Cost | ||||||||||||
| Balance at January 1, 2014 | $ | 141,320 | $ | 2,152,430 | $ | 2,293,750 | ||||||
| Additions | — | 202,242 | 202,242 | |||||||||
| Disposals | — | (995,500 | ) | (995,500 | ) | |||||||
| Balance at December 31, 2014 | $ | 141,320 | $ | 1,359,172 | $ | 1,500,492 | ||||||
| Accumulated amortization and impairment | ||||||||||||
| Balance at January 1, 2014 | $ | 140,532 | $ | 1,759,459 | $ | 1,899,991 | ||||||
| Amortization expense | 788 | 109,021 | 109,809 | |||||||||
| Disposals | — | (995,500 | ) | (995,500 | ) | |||||||
| Balance at December 31, 2014 | $ | 141,320 | $ | 872,980 | $ | 1,014,300 | ||||||
For the year ended December 31, 2013
| Patents | Computer Software and Others | Total | ||||||||||
| NT$ | NT$ | NT$ | ||||||||||
| Cost | ||||||||||||
| Balance at January 1, 2013 | $ | 141,320 | $ | 2,031,927 | $ | 2,173,247 | ||||||
| Additions | — | 130,025 | 130,025 | |||||||||
| Disposals | — | (10,284 | ) | (10,284 | ) | |||||||
| Reclassification | — | 122 | 122 | |||||||||
| Acquisitions through business combinations | — | 640 | 640 | |||||||||
| Balance at December 31, 2013 | $ | 141,320 | $ | 2,152,430 | $ | 2,293,750 | ||||||
| Accumulated amortization and impairment | ||||||||||||
| Balance at January 1, 2013 | $ | 134,104 | $ | 1,657,338 | $ | 1,791,442 | ||||||
| Additions | 6,428 | 107,938 | 114,366 | |||||||||
| Disposals | — | (6,472 | ) | (6,472 | ) | |||||||
| Reclassification | — | 122 | 122 | |||||||||
| Acquisitions through business combinations | — | 533 | 533 | |||||||||
| Balance at December 31, 2013 | $ | 140,532 | $ | 1,759,459 | $ | 1,899,991 | ||||||
Each class of other intangible assets were amortized on the straight-line basis over the following useful lives:
| Patents | 5-8 years | |
| Computer software and others | 2-10 years |
-33-
| 14. | BORROWINGS |
| a. | Short-term borrowings |
Short-term borrowings represented unsecured revolving bank loans with annual interest rates at 0.82%-1.10% and 0.80%-1.11% as of December 31, 2014 and 2013, respectively.
| b. | Long-term borrowings |
The long-term bank loans are working capital mainly with floating interest rates and consisted of the followings:
| December 31 | ||||||||
| 2014 | 2013 | |||||||
| NT$ | NT$ | |||||||
| Syndicated bank loans - repayable through June 2015 to July 2018, annual interest rates were 0.90%-1.41% and 0.90%-2.28% as of December 31, 2014 and 2013, respectively | $ | 9,155,893 | $ | 10,026,021 | ||||
| Others - repayable through January 2016 to August 2019, annual interest rates were 1.03%-1.28% and 1.04%-1.36% as of December 31, 2014 and 2013, respectively | 10,315,500 | 16,839,885 | ||||||
| 19,471,393 | 26,865,906 | |||||||
| Less: Unamortized arrangement fee | 30,696 | 50,190 | ||||||
| Less: Current portion | 1,085,143 | 1,028,571 | ||||||
| $ | 18,355,554 | $ | 25,787,145 | |||||
Pursuant to the above syndicated bank loans agreements, the Company should maintain certain financial covenants including current ratio, leverage ratio, tangible net assets and interest coverage ratio. Such financial ratios are calculated based on the annual audited consolidated financial statements or semi-annual reviewed consolidated financial statements of the Company and its subsidiaries. The Company was in compliance with all of the loan covenants as of December 31, 2014 and 2013.
The Company had sufficient long term credit facility obtained before December 31, 2013 to refinance a portion of the loans on a long-term basis. Therefore, NT$5,962,343 thousand was not classified as current portion of long-term borrowings as of December 31, 2013.
| 15. | BONDS PAYABLE |
| December 31 | ||||||||
| 2014 | 2013 | |||||||
| NT$ | NT$ | |||||||
| Secured domestic bonds - secured by banks | ||||||||
| Repayable at maturity in August 2016 and interest due annually with annual interest rate 1.45% | $ | 8,000,000 | $ | 8,000,000 | ||||
| Unsecured convertible overseas bonds | 12,660,000 | 11,922,000 | ||||||
| 20,660,000 | 19,922,000 | |||||||
| Less: Discounts on bonds payable | 1,389,387 | 1,769,805 | ||||||
| $ | 19,270,613 | $ | 18,152,195 | |||||
-34-
In September 2013, the Company offered the third unsecured convertible overseas bonds (the “Bonds”) in US$400,000 thousand. The Bonds is zero coupon bonds with the maturity of 5 years, in denominations of US$200 thousand or in any integral multiples thereof. Each holder of the Bonds has the right at any time on or after October 16, 2013 and up to (and including) August 26, 2018, except during legal lock-up period, to convert the Bonds into newly issued listed common shares at the conversion price NT$33.085, determined on the basis of a fixed exchange rate of US$1 to NT$29.956. The conversion price will be adjusted in accordance with the conversion provisions due to anti-dilution clause. As of December 31, 2014, the conversion price was NT$31.93.
The Bonds may be redeemed at the option of the Company, in whole or in part, at any time on or after the third anniversary of the offering date provided that (1) the closing price, translated into U.S. dollars, of the common shares for a period of 20 consecutive trading days is at least 130% of the conversion price, (2) at least 90% in aggregate principal amount of the Bonds originally outstanding has been redeemed, repurchased and canceled or converted, or (3) the Company is required to pay additional taxes on the Bonds as a result of certain changes in tax laws in the ROC.
Each holder shall have the right to request the Company repurchase all or any portion of the principal amount thereof of a holder’s Bonds (1) on the third anniversary of the offering date, (2) in the event of a change of control, or (3) in the event of delisting.
The Bonds contained a debt host contract, recognized as bonds payable, and the conversion option, redemption option and put option (collectively the “Bonds Options”) aggregately recognized as financial liabilities at FVTPL. The effective interest rate of the debt host contract was 3.16% and the aggregate fair value of the Bonds Options was NT$1,667,950 thousand on initial recognition. As a result of changes in fair value, we recognized a loss of NT$777,610 thousand and NT$75,046 thousand for the years ended December 31, 2014 and 2013, respectively, in other gains and losses.
| 16. | OTHER PAYABLES |
| December 31 | ||||||||
| 2014 | 2013 | |||||||
| NT$ | NT$ | |||||||
| Payables for property, plant and equipment | $ | 3,445,582 | $ | 1,709,352 | ||||
| Accrued salary and bonus | 2,388,850 | 1,903,636 | ||||||
| Accrued bonus to employees and remuneration to directors and supervisors | 2,548,130 | 1,730,915 | ||||||
| Others | 3,969,513 | 2,597,304 | ||||||
| $ | 12,352,075 | $ | 7,941,207 | |||||
The Company and its subsidiary, ASE U.S. Inc. (“ASE US”), reached the final settlement agreement with Tessera Inc. (“Tessera”) in October 2014 to resolve the patent infringement lawsuit, and Tessera has dismissed all claims against the Company and ASE US. The Company recognized the originally agreed settlement amount of NT$894,150 thousand (US$30,000 thousand) in the fourth quarter of 2013 under the line item of long-term payables. The final settlement amount was reduced to NT$814,185 (US$27,000 thousand as resolved in the final settlement agreement in October 2014) and reclassified from long-term payables to other payables which was paid in January 2015.
-35-
| 17. | RETIREMENT BENEFIT PLANS |
| a. | Defined contribution plans |
The pension plan under the ROC Labor Pension Act (“LPA”) is a government-managed defined contribution plan. Based on the LPA, the Company makes monthly contributions to employees’ individual pension accounts at 6% of their monthly salaries.
The Company recognized pension costs of NT$716,293 thousand and NT$545,268 thousand in the parent company only statements of comprehensive income for the years ended December 31, 2014 and 2013, respectively.
| b. | Defined benefit plans |
| 1) | The Company and its subsidiaries in Taiwan joined the defined benefit pension plan under the ROC Labor Standards Law (“LS Law”). Pension benefits are calculated on the basis of the length of service and average monthly salaries of the last six months before retirement. The Company and its subsidiaries in Taiwan make contributions based on a certain percentage of their domestic employees monthly salaries to a pension fund administered by the pension fund monitoring committee and deposited in the names of the Committees in the Bank of Taiwan. Under the Labor Standards Law, the rate of return on assets shall not be less than the average interest rate on a two-year time deposit published by the local banks and the government is responsible for any shortfall in the event that the rate of return is less than the required rate of return. The plan assets are held in a commingled fund which is operated and managed by the government’s designated authorities; as such, the Company does not have any right to intervene in the investments of the funds. |
| 2) | The Company maintains pension plans for executive managers. Pension costs under the plans were NT$5,297 thousand and NT$1,080 thousand for the years ended December 31, 2014 and 2013, respectively, and were recognized as accrued pension liabilities. Pension payments were NT$15,315 thousand and NT$2,666 thousand for the years ended December 31, 2014 and 2013, respectively. As of December 31, 2014 and 2013, accrued pension liabilities for executive managers were NT$117,173 thousand and NT$127,191 thousand, respectively. |
| 3) | Except the pension plans for executive managers, the key assumptions used for the actuarial valuations were as follow: |
| December 31 | ||||||||
| 2014 | 2013 | |||||||
| Discount rates | 2.25 | % | 2.15 | % | ||||
| Expected return on plan assets | 1.25 | % | 1.25 | % | ||||
| Expected rates of salary increase | 2.75%-3.00 | % | 1.00%-3.00 | % | ||||
The expected rate of return was based on historical return trends and analysts’ predictions of the market where the plan assets located over the life of the related obligation, by reference to the aforementioned use of the plan assets and the impact of the related minimum return.
| 4) | An analysis of the amounts recognized in profit or loss in respect of the defined benefit plans excluding those for executive managers was as follows: |
-36-
| For the Years Ended December 31 | ||||||||
| 2014 | 2013 | |||||||
| NT$ | NT$ | |||||||
| Current service cost | $ | 48,809 | $ | 38,589 | ||||
| Interest cost | 76,376 | 66,822 | ||||||
| Expected return on plan assets | (15,742 | ) | (23,585 | ) | ||||
| Past service cost | 726 | 726 | ||||||
| $ | 110,169 | $ | 82,552 | |||||
An analysis by function was as follows:
| For the Years Ended December 31 | ||||||||
| 2014 | 2013 | |||||||
| NT$ | NT$ | |||||||
| Operating cost | $ | 68,581 | $ | 61,068 | ||||
| Selling and marketing expenses | 520 | 507 | ||||||
| General and administrative expenses | 28,360 | 9,873 | ||||||
| Research and development expenses | 12,669 | 11,070 | ||||||
| $ | 110,130 | $ | 82,518 | |||||
The differences between the aforementioned amounts recognized in profit or loss in respect of the defined benefit plans and the amounts categorized by function are mainly receivables from subsidiaries due to the Company’s employees short-term support.
| 5) | For the years ended December 31, 2014 and 2013, the Company recognized actuarial loss of NT$16,194 thousand and actuarial gain of NT$251,036 thousand in other comprehensive income or loss, respectively. As of December 31, 2014 and 2013, the accumulated actuarial income or loss of NT$322,886 thousand and NT$306,692 thousand were recognized in other comprehensive income or loss. |
| 6) | The amounts included in the parent company only balance sheets arising from the Company’s obligation in respect of its defined benefit plans excluding those for executive managers were as follows: |
| December 31 | ||||||||
| 2014 | 2013 | |||||||
| NT$ | NT$ | |||||||
| Present value of funded defined benefit obligation | $ | 3,660,738 | $ | 3,594,640 | ||||
| Fair value of plan assets | (1,348,084 | ) | (1,211,581 | ) | ||||
| Present value of unfunded defined benefit obligation | 2,312,654 | 2,383,059 | ||||||
| Unrecognized past service cost | 3,535 | (7,987 | ) | |||||
| Recorded under others payables | (14,173 | ) | (13,900 | ) | ||||
| Net defined benefit liability | $ | 2,302,016 | $ | 2,361,172 | ||||
-37-
| 7) | Movements in net defined benefit liability were as follows: |
| December 31 | ||||||||
| 2014 | 2013 | |||||||
| NT$ | NT$ | |||||||
| Balance, beginning of the year | $ | 3,594,640 | $ | 3,853,645 | ||||
| Current service cost | 48,809 | 38,589 | ||||||
| Interest cost | 76,376 | 66,822 | ||||||
| Actuarial losses (gains) | 29,122 | (260,119 | ) | |||||
| Past service cost | (10,796 | ) | — | |||||
| Benefits paid from plan assets | (77,413 | ) | (104,297 | ) | ||||
| Balance, end of the year | $ | 3,660,738 | $ | 3,594,640 | ||||
| 8) | Movements in the fair value of the plan assets were as follows: |
| December 31 | ||||||||
| 2014 | 2013 | |||||||
| NT$ | NT$ | |||||||
| Balance, beginning of the year | $ | 1,211,581 | $ | 1,123,266 | ||||
| Expected return on plan assets | 15,742 | 23,585 | ||||||
| Actuarial gains (losses) | 12,928 | (9,083 | ) | |||||
| Contributions from employer | 185,246 | 178,110 | ||||||
| Benefits paid from plan assets | (77,413 | ) | (104,297 | ) | ||||
| Balance, end of the year | $ | 1,348,084 | $ | 1,211,581 | ||||
For the years ended December 31, 2014 and 2013, the actual return on plan assets were NT$28,670 thousand and NT$14,502 thousand, respectively.
| 9) | The major categories of plan assets at the end of the reporting period were as follows: |
| Fair Value of Plan Assets (%) | ||||||||
| December 31 | ||||||||
| 2014 | 2013 | |||||||
| Equity instruments | 50 | 46 | ||||||
| Debt instruments | 26 | 31 | ||||||
| Others | 24 | 23 | ||||||
| Total | 100 | 100 | ||||||
| 10) | The Company elected to disclose the historical information of experience adjustments as the amounts determined for each accounting period prospectively from the date of transition to Taiwan-IFRSs (January 1, 2012). |
| December 31 | ||||||||
| 2014 | 2013 | |||||||
| NT$ | NT$ | |||||||
| Present value of defined benefit obligation | $ | 3,660,738 | $ | 3,594,640 | ||||
(Continued)
-38-
| December 31 | ||||||||
| 2014 | 2013 | |||||||
| NT$ | NT$ | |||||||
| Fair value of plan assets | $ | (1,348,084 | ) | $ | (1,211,581 | ) | ||
| Deficit | $ | 2,312,654 | $ | 2,383,059 | ||||
| Experience adjustments on plan liabilities | $ | 112,848 | $ | (10,646 | ) | |||
| Experience adjustments on plan assets | $ | (12,928 | ) | $ | 9,083 | |||
(Concluded)
| 11) | The Company expects to make contributions of NT$190,394 thousand to the defined benefit plans in the next year starting from January 1, 2015. |
| 18. | EQUITY |
| a. | Share capital |
Ordinary shares
| December 31, | ||||||||
| 2014 | 2013 | |||||||
| Numbers of shares authorized (in thousands) | 10,000,000 | 9,600,000 | ||||||
| Numbers of shares reserved (in thousands) | ||||||||
| Employee share options | 800,000 | 800,000 | ||||||
| Shares authorized | $ | 100,000,000 | $ | 96,000,000 | ||||
| Shares reserved | ||||||||
| Employee share options | $ | 8,000,000 | $ | 8,000,000 | ||||
| Numbers of shares registered (in thousands) | 7,852,538 | 7,756,004 | ||||||
| Numbers of shares subscribed in advance (in thousands) | 9,187 | 31,823 | ||||||
| Number of shares issued and fully paid (in thousands) | 7,861,725 | 7,787,827 | ||||||
The holders of issued ordinary shares with a par value at $10 per share are entitled the right to vote and receive dividends, except the shares held by the Company’s subsidiaries which are not entitled the right to vote. As of December 31, 2014 and 2013, there were 500,000 thousand and 100,000 thousand ordinary shares, respectively, included in the authorized shares that were not yet required to complete the share registration process.
American Depositary Receipts
The Company issued ADSs and each ADS represents five ordinary shares. As of December 31, 2014 and 2013, 125,731 thousand and 96,649 thousand ADSs were outstanding and represented approximately 628,657 thousand and 483,243 thousand ordinary shares of the Company, respectively.
-39-
| b. | Capital surplus |
| December 31, | ||||||||
| 2014 | 2013 | |||||||
| NT$ | NT$ | |||||||
| Arising from the excess of the consideration received over the carrying amounts of the subsidiaries’ net assets (Note 11) | $ | 9,036,941 | $ | 2,165,879 | ||||
| Arising from issuance of ordinary shares | 5,325,382 | 4,134,295 | ||||||
| Arising from employee share options | 1,178,210 | 1,369,232 | ||||||
| Arising from treasury share transactions | 425,004 | 236,214 | ||||||
| Arising from share of changes in capital surplus of associates | 30,134 | 3,250 | ||||||
| $ | 15,995,671 | $ | 7,908,870 | |||||
As of December 31, 2014 and 2013, capital surplus arising from issuance of ordinary shares of NT$3,626 thousand represented the unexercised portion for employees’ subscription on cash capital increase of the Company in 2013 (Note 22c).
The premium from ordinary shares issued in excess of par, including the premium from issuance of ordinary shares, treasury share transactions and carrying amount of expired options, may be used to offset deficits; in addition, when the Company has no deficit, such capital surplus may be distributed as cash dividends or transferred to capital up to a certain percentage of the Company’s capital surplus each year.
The capital surplus arising from investments accounted for using the equity method and employee share options may not be used for any purpose.
| c. | Retained earnings and dividend policy |
The Articles of Incorporation of ASE Inc. (the “Articles”) provides that annual net income shall be distributed in the following order:
| 1) | Replenishment of deficits; |
| 2) | 10.0% as legal reserve; |
| 3) | Special reserve appropriated or reversed in accordance with laws or regulations set forth by the authorities concerned; |
| 4) | An amount equal to the excess of the income from investments accounted for using the equity method over cash dividends as special reserve; |
| 5) | Addition or deduction of realized gains or losses on equity instruments at fair value through other comprehensive income; |
| 6) | Not more than 1.0% of the remainder, from 1) to 5), as remuneration to directors and supervisors; |
| 7) | Between 7.0% to 11.0% of the remainder, from 1) to 5), as bonus to employees, of which 7.0% shall be distributed in accordance with the employee bonus plan and the excess shall be distributed to specified employees at the board of directors’ discretion; and |
| 8) | Any remainder from above as dividends to shareholders. |
Employees to whom referred in 7) above include employees of subsidiaries that meet certain conditions, which are to be determined by the board of directors.
-40-
The Company is currently in the mature growth stage. To meet the capital needs for business development now and in the future and satisfy the shareholders’ demand for cash inflows, the Company shall use residual dividend policy to distribute dividends, of which the cash dividend is not lower than 30% of the total dividend distribution, with the remainder to be distributed in stock. A distribution plan is also to be made by the board of directors and passed for resolution in the shareholders’ meeting.
As of December 31, 2014 and 2013, the accrued bonus to employees of the Company was NT$2,335,786 thousand and NT$1,586,672 thousand, respectively, and the accrued remuneration to directors and supervisors of the Company was NT$212,344 thousand and NT$144,243 thousand, respectively. The accrued bonus to employees and remuneration to directors and supervisors represented 11% and 1%, respectively, of net income (net of the bonus and remuneration) for the years ended December 31, 2014 and 2013. Material differences between such estimated amounts and the amounts proposed by the board of directors on or before the parent company only financial statements are authorized for issue are adjusted in the year the bonus and remuneration were recognized. If there is a change in the proposed amounts after the parent company only financial statements are authorized for issue, the differences are recorded as a change in accounting estimate. If a share bonus is resolved to be distributed to employees, the number of shares is determined by dividing the amount of the share bonus by the closing price (after considering the effect of cash and stock dividends) of the shares of the day immediately preceding the shareholders’ meeting.
Under Rule No. 1010012865 and Rule No. 1010047490 issued by the FSC and the directive titled “Questions and Answers for Special Reserves Appropriated Following Adoption of IFRSs”, the Company should appropriate or reverse to a special reserve. Any special reserve appropriated may be reversed to the extent that the net debit balance reverses and thereafter distributed.
Appropriation of earnings to legal reserve shall be made until the legal reserve equals the Company’s capital surplus. Legal reserve may be used to offset deficits. If the Company has no deficit and the legal reserve has exceeded 25% of the Company’s capital surplus, the excess may be transferred to capital or distributed in cash.
The appropriations of earnings for 2013 and 2012 resolved at the Company’s annual shareholders’ meetings in June 2014 and June 2013, respectively, were as follows:
| Appropriation of Earnings | Dividends Per Share | |||||||||||||||
| For Year 2013 | For Year 2012 | For Year 2013 | For Year 2012 | |||||||||||||
| NT$ | NT$ | NT$ | NT$ | |||||||||||||
| (in dollars) | (in dollars) | |||||||||||||||
| Legal reserve | $ | 1,568,907 | $ | 1,309,136 | ||||||||||||
| Special reserve | (309,992 | ) | 309,992 | |||||||||||||
| Cash dividends | 10,156,005 | 7,987,974 | $ | 1.30 | $ | 1.05 | ||||||||||
| $ | 11,414,920 | $ | 9,607,102 | |||||||||||||
The bonus to employees and the remuneration to directors and supervisors for 2013 and 2012 distributed in cash were also approved in the aforementioned shareholders’ meetings. The information was as follows:
| For Year 2013 | For Year 2012 | |||||||
| NT$ | NT$ | |||||||
| Bonus to employees | $ | 1,587,300 | $ | 1,147,223 | ||||
| Remuneration to directors and supervisors | 144,000 | 228,000 | ||||||
-41-
The appropriations of earnings for 2012 were proposed according to the Corporation’s financial statements for the year ended December 31, 2012, which were prepared in accordance with the former Regulations Governing the Preparation of Financial Reports by Securities Issuers and ROC GAAP.
The differences between the resolved amounts of the bonus to employees and remuneration to directors and supervisors and the accrued amounts reflected in the consolidated financial statements for the years ended December 31, 2013 and 2012 were deemed changes in estimates. The difference was NT$385 thousand and NT$38,644 thousand and had been adjusted in earnings for the years ended December 31, 2014 and 2013, respectively.
Information regarding the bonus to employees and the remuneration to directors and supervisors resolved by the shareholders’ meeting is available on the Market Observation Post System website of the TSE.
| d. | Special reserve appropriated in accordance with the local regulations |
On January 1, 2013, the Company appropriated to the special reserve of NT$3,353,938 thousand relating to the exchange differences on translating foreign operations transferred to retained earnings in accordance with the local regulations.
| e. | Accumulated other comprehensive income |
| 1) | Exchange differences on translating foreign operations |
| For the Years Ended December 31 | ||||||||
| 2014 | 2013 | |||||||
| NT$ | NT$ | |||||||
| Balance at January 1 | $ | (525,521 | ) | $ | (3,210,248 | ) | ||
| Share of exchange difference of subsidiaries and associates accounted for using the equity method | 5,066,674 | 2,684,727 | ||||||
| Balance at December 31 | $ | 4,541,153 | $ | (525,521 | ) | |||
| 2) | Unrealized gain on available-for-sale financial assets |
| For the Years Ended December 31 | ||||||||
| 2014 | 2013 | |||||||
| NT$ | NT$ | |||||||
| Balance at January 1 | $ | 426,246 | $ | 355,254 | ||||
| Unrealized gain (loss) arising on revaluation of available-for-sale financial assets | (15,648 | ) | 42,904 | |||||
| Cumulative loss (gain) reclassified to profit or loss on disposal of available-for-sale financial assets | 18,024 | (650 | ) | |||||
| Share of unrealized gain on available-for-sale financial assets of subsidiaries and associates accounted for using the equity method | 98,156 | 28,738 | ||||||
| Balance at December 31 | $ | 526,778 | $ | 426,246 | ||||
-42-
| 3) | Cash flow hedges |
| For the Years Ended December 31 | ||||||||
| 2014 | 2013 | |||||||
| NT$ | NT$ | |||||||
| Balance at January 1 | $ | (3,279 | ) | $ | (3,755 | ) | ||
| Cumulative loss arising on changes in fair value of hedging instruments reclassified to profit or loss - Interest rate swap contracts | — | 4,524 | ||||||
| Income tax related to cash flow hedges | — | (769 | ) | |||||
| Share of cash flow hedges of subsidiaries accounted for using the equity method | 3,279 | (3,279 | ) | |||||
| Balance at December 31 | $ | — | $ | (3,279 | ) | |||
| f. | Treasury shares (in thousand shares) |
There was no change in the Company’s shares held by subsidiaries in 2014 and 2013. The Company’s shares held by its subsidiaries at each balance sheet date were as follows:
The Company’s shares held by its subsidiaries at each balance sheet date were as follows:
Shares Held By Subsidiaries (in thousand shares) | Carrying amount | Fair Value | ||||||||||
| NT$ | NT$ | |||||||||||
| December 31, 2014 | ||||||||||||
| ASE Test | 88,200 | $ | 1,380,721 | $ | 3,360,438 | |||||||
| J&R Holding | 46,704 | 381,709 | 1,779,413 | |||||||||
| ASE Test, Inc. | 10,979 | 196,677 | 418,291 | |||||||||
| 145,883 | $ | 1,959,107 | $ | 5,558,142 | ||||||||
| December 31, 2013 | ||||||||||||
| ASE Test | 88,200 | $ | 1,380,721 | $ | 2,443,153 | |||||||
| J&R Holding | 46,704 | 381,709 | 1,293,694 | |||||||||
| ASE Test, Inc. | 10,979 | 196,677 | 304,112 | |||||||||
| 145,883 | $ | 1,959,107 | $ | 4,040,959 | ||||||||
The Company issued ordinary shares in connection with its merger with its subsidiaries. The shares held by its subsidiaries were reclassified from investments accounted for using the equity method to treasury shares on the proportion owned by the Company.
Under the Securities and Exchange Act in the ROC, the Company shall neither pledge treasury shares nor exercise shareholders’ rights on these shares, such as rights to dividends and voting. The subsidiaries holding treasury shares, however, retain shareholders’ rights except the rights to participate in any share issuance for cash and voting.
-43-
In February 2015, the board of directors approved to repurchase up to 120,000 thousand of the Company’s ordinary shares which will be used for equity conversion of convertible overseas bonds to be issued in the future. The shares to be repurchased account for 1.53% of our total issued shares, at prices between NT$32.0 to NT$55.0 per share during the period from March 2, 2015 to April 30, 2015. The Company will keep buying back if the prices is under the lower limit.
| 19. | PROFIT BEFORE INCOME TAX |
| a. | Other income |
| For the Years Ended December 31 | ||||||||
| 2014 | 2013 | |||||||
| NT$ | NT$ | |||||||
| Interest income - mainly from bank deposit | $ | 6,848 | $ | 20,021 | ||||
| Rental income | 75,395 | 74,069 | ||||||
| Dividends income | 32,126 | 22,435 | ||||||
| $ | 114,369 | $ | 116,525 | |||||
| b. | Other gains (losses) |
| For the Years Ended December 31 | ||||||||
| 2014 | 2013 | |||||||
| NT$ | NT$ | |||||||
| Net gain arising on financial instruments held for trading | $ | 1,571,545 | $ | 773,778 | ||||
| Net gain (losses) on financial assets designated as at FVTPL | 164,104 | (6,553 | ) | |||||
| Gains (losses) on disposal of property, plant and equipment and other intangible assets | (17,769 | ) | 138,864 | |||||
| Foreign exchange loss, net | (1,759,676 | ) | (535,293 | ) | ||||
| Loss on damages and claims | (92,959 | ) | (920,732 | ) | ||||
| Others | 142,798 | 146,202 | ||||||
| $ | 8,043 | $ | (403,734 | ) | ||||
| c. | Finance costs |
| For the Years Ended December 31 | ||||||||
| 2014 | 2013 | |||||||
| NT$ | NT$ | |||||||
| Total interest expense for financial liabilities measured at amortized cost | $ | 1,039,746 | $ | 834,082 | ||||
| Less: Amounts included in the cost of qualifying property, plant and equipment | (47,204 | ) | (34,937 | ) | ||||
| 992,542 | 799,145 | |||||||
| Loss arising on derivatives as designated hedging instruments in cash flow hedge accounting relationship reclassified from equity to profit or loss | — | 4,524 | ||||||
| Other finance costs | 9,432 | 13,500 | ||||||
| $ | 1,001,974 | $ | 817,169 | |||||
-44-
The annual interest rates of capitalized borrowing costs included in qualifying property, plant and equipment was 1.12%-1.98% and 1.54%-1.84% for the years ended December 31, 2014 and 2013, respectively.
| d. | Depreciation and amortization |
| For the Years Ended December 31 | ||||||||
| 2014 | 2013 | |||||||
| NT$ | NT$ | |||||||
| Property, plant and equipment | $ | 12,667,954 | $ | 10,778,678 | ||||
| Intangible assets | 109,809 | 114,366 | ||||||
| Total | $ | 12,777,763 | $ | 10,893,044 | ||||
| Summary of depreciation by function | ||||||||
| Operating costs | $ | 11,824,860 | $ | 9,959,066 | ||||
| Operating expenses | 843,094 | 819,612 | ||||||
| $ | 12,667,954 | $ | 10,778,678 | |||||
| Summary of amortization by function | ||||||||
| Operating costs | $ | 22,419 | $ | 13,369 | ||||
| Selling and marketing expenses | 109 | 109 | ||||||
| General and administration expenses | 58,476 | 72,764 | ||||||
| Research and development expenses | 28,805 | 28,124 | ||||||
| $ | 109,809 | $ | 114,366 | |||||
| e. | Employee benefits expense |
| For the Years Ended December 31 | ||||||||
| 2014 | 2013 | |||||||
| NT$ | NT$ | |||||||
| Post-employment benefits (Note 17) | ||||||||
| Defined contribution plans | $ | 716,293 | $ | 545,268 | ||||
| Defined benefit plans | 115,427 | 83,598 | ||||||
| 831,720 | 628,866 | |||||||
| Equity-settled share-based payments | 82,408 | 194,601 | ||||||
| Salary, incentives and bonus | 19,829,602 | 15,940,181 | ||||||
| Other employee benefits | 2,258,744 | 1,746,508 | ||||||
| $ | 23,002,474 | $ | 18,510,156 | |||||
| Summary of employee benefits expense by function | ||||||||
| Operating costs | $ | 16,273,648 | $ | 13,020,858 | ||||
| Operating expenses | 6,728,826 | 5,489,298 | ||||||
| $ | 23,002,474 | $ | 18,510,156 | |||||
As of December 31, 2014 and 2013, the Company had 29,563 and 24,879 employees, respectively.
-45-
20. INCOME TAX
| a. | Income tax recognized in profit or loss |
The major components of income tax expense were as follows:
| For the Years Ended December 31 | ||||||||
| 2014 | 2013 | |||||||
| NT$ | NT$ | |||||||
| Current income tax | ||||||||
| In respect of the current year | $ | 1,464,096 | $ | 667,659 | ||||
| Adjustments for prior years | 27,218 | 5,966 | ||||||
| In respect of the income derived outside the ROC | 23,074 | 176 | ||||||
| 1,514,388 | 673,801 | |||||||
| Deferred income tax | ||||||||
| In respect of the current year | 1,006,317 | 1,032,268 | ||||||
| Income tax expense recognized in profit or loss | $ | 2,520,705 | $ | 1,706,069 | ||||
A reconciliation of income tax expense calculated at the statutory rate and income tax expense recognized in profit or loss was as follows:
| For the Years Ended December 31 | ||||||||
| 2014 | 2013 | |||||||
| NT$ | NT$ | |||||||
| Profit before income tax | $ | 26,113,372 | $ | 17,395,143 | ||||
| Income tax expense calculated at the statutory rate (17%) | $ | 4,439,273 | $ | 2,957,174 | ||||
| Nontaxable expense in determining taxable income | 54,879 | 63,080 | ||||||
| The origination and reversal of temporary differences | (2,337,894 | ) | (1,963,333 | ) | ||||
| Tax-exempt income | (353,881 | ) | (129,222 | ) | ||||
| Additional income tax on unappropriated earnings | 462,781 | 348,426 | ||||||
| Loss carry-forward and income tax credits currently used | (801,062 | ) | (608,466 | ) | ||||
| Net deferred income tax | 1,006,317 | 1,032,268 | ||||||
| Adjustments for prior years | 27,218 | 5,966 | ||||||
| Payment of income tax in respect of the income derived outside the ROC | 23,074 | 176 | ||||||
| Income tax expense recognized in profit or loss | $ | 2,520,705 | $ | 1,706,069 | ||||
| b. | Income tax recognized in other comprehensive income |
| For the Years Ended December 31 | ||||||||
| 2014 | 2013 | |||||||
| NT$ | NT$ | |||||||
| Deferred income tax | ||||||||
| Actuarial loss on defined benefit plan | $ | 2,753 | $ | (42,676 | ) | |||
| Fair value changes of hedging instruments for cash flow hedges | — | (769 | ) | |||||
| $ | 2,753 | $ | (43,455 | ) | ||||
-46-
| c. | Deferred tax assets and liabilities |
The movements of deferred tax assets and deferred tax liabilities were as follows:
Balance at January 1 | Recognized in Profit or Loss | Recognized in Other Comprehen-sive Income | Balance at December 31 | |||||||||||||
| NT$ | NT$ | NT$ | NT$ | |||||||||||||
| Year ended December 31, 2014 | ||||||||||||||||
| Temporary differences | ||||||||||||||||
| Property, plant and equipment | $ | (1,879,400 | ) | $ | (844,743 | ) | $ | — | $ | (2,724,143 | ) | |||||
| Defined benefit obligation | 414,161 | (34,306 | ) | 2,753 | 382,608 | |||||||||||
| Others | 114,744 | 108,288 | — | 223,032 | ||||||||||||
| (1,350,495 | ) | (770,761 | ) | 2,753 | (2,118,503 | ) | ||||||||||
| Investment credits | 477,307 | (235,556 | ) | — | 241,751 | |||||||||||
| $ | (873,188 | ) | $ | (1,006,317 | ) | $ | 2,753 | $ | (1,876,752 | ) | ||||||
| Year ended December 31, 2013 | ||||||||||||||||
| Temporary differences | ||||||||||||||||
| Property, plant and equipment | $ | (1,057,630 | ) | $ | (821,770 | ) | $ | — | $ | (1,879,400 | ) | |||||
| Defined benefit obligation | 461,780 | (4,943 | ) | (42,676 | ) | 414,161 | ||||||||||
| Others | 138,893 | (23,380 | ) | (769 | ) | 114,744 | ||||||||||
| (456,957 | ) | (850,093 | ) | (43,445 | ) | (1,350,495 | ) | |||||||||
| Investment credits | 659,482 | (182,175 | ) | — | 477,307 | |||||||||||
| $ | 202,525 | $ | (1,032,268 | ) | $ | (43,445 | ) | $ | (873,188 | ) | ||||||
| d. | Items for which no deferred tax assets have been recognized |
| December 31 | ||||||||
| 2014 | 2013 | |||||||
| NT$ | NT$ | |||||||
| Investment credits | $ | 124,184 | $ | 622,945 | ||||
The unrecognized investment credits will expire through 2015.
| e. | Information about unused investment credits and tax-exemption |
As of December 31, 2014, unused investment credits comprised of:
| Remaining Creditable Amount | ||||||||
| Laws and Statutes | NT$ | Expiry Year | ||||||
| Statute for Upgrading Industries | $ | 365,935 | 2015 | |||||
As of December 31, 2014, profits attributable to the following expansion projects were exempted from income tax for a 3 or 5-year period:
-47-
| Tax-exemption Period | ||
| Construction and expansion of 2004 by the Company | 2012.01-2016.12 | |
| Construction and expansion of 2005 by the Company | 2012.01-2016.12 | |
| Construction and expansion of 2007 by Power ASE Technology, Inc. which was merged into the Company | 2013.01-2015.12 | |
| Construction and expansion of 2008 by the Company. | 2014.01-2018.12 |
In addition, the Company had an unused project for construction and expansion of 2007.
| f. | Unrecognized deferred tax liabilities associated with investments |
As of December 31, 2014 and 2013, the taxable temporary differences associated with investments in subsidiaries for which no deferred tax liabilities have been recognized were NT$6,934,791 thousand and NT$5,898,380 thousand, respectively.
| g. | Integrated income tax |
As of December 31, 2014 and 2013, unappropriated earnings were all generated on and after January 1, 1998. As of December 31, 2014 and 2013, the balance of the Imputation Credit Account (“ICA”) was NT$934,038 thousand and NT$733,341 thousand, respectively.
The creditable ratio for the distribution of earnings of 2014 and 2013 was 6.19% (estimated) and 6.10% (actual), respectively.
Under the Integrated Income Tax System, ROC resident shareholders are allowed a tax credit for their proportionate share of the income tax paid in the ROC by the Company on earnings generated after January 1, 1998. Non-resident shareholders are allowed only a tax credit from the 10% income tax on undistributed earnings, which can be used to reduce the withholding income tax on dividends. Starting from 2015, the allowed tax credit is adjusted to 50% of the income tax paid in the ROC by the Company for ROC resident shareholders or 50% of the 10% income tax on undistributed earnings for non-resident shareholders. An ICA is maintained by the Company for such income tax and the tax credit allocated to each shareholder. The maximum credit available for allocation to each shareholder cannot exceed the balance shown in the ICA on the date of dividend distribution. The expected creditable ratio for the 2014 earnings may be adjusted, depending on the ICA balance on the date of dividend distribution.
| h. | Income tax assessments |
Income tax returns of the Company have been examined by authorities through 2012. ASE Inc. disagreed with the result of examinations relating to its income tax returns for 2004 through 2008 and 2010 through 2012 and applied for appeal procedures. The related income tax expenses in the years resulting from the examinations have been accrued in respective tax years.
| 21. | EARNINGS PER SHARE |
The earnings and weighted average number of ordinary shares outstanding in the computation of earnings per share were as follows:
-48-
Net profit for the year
| For the Years Ended December 31 | ||||||||
| 2014 | 2013 | |||||||
| NT$ | NT$ | |||||||
| Profit for the year | $ | 23,592,667 | $ | 15,689,074 | ||||
| Effect of potentially dilutive ordinary shares: | ||||||||
| Employee share options issued by subsidiaries | (260,925 | ) | (131,756 | ) | ||||
| Convertible bonds | 931,344 | 156,193 | ||||||
| Earnings used in the computation of diluted earnings per share | $ | 24,263,086 | $ | 15,713,511 | ||||
Weighted average number of ordinary shares outstanding (in thousand shares):
| For the Years Ended December 31 | ||||||||
| 2014 | 2013 | |||||||
| Weighted average number of ordinary shares in computation of basic earnings per share | 7,687,930 | 7,508,539 | ||||||
| Effect of potentially dilutive ordinary shares: | ||||||||
| Convertible bonds | 375,271 | 117,085 | ||||||
| Employee share options | 101,850 | 67,081 | ||||||
| Bonus to employees | 55,643 | 54,926 | ||||||
| Weighted average number of ordinary shares in computation of diluted earnings per share | 8,220,694 | 7,747,631 | ||||||
The Company is able to settle the bonuses paid to employees in cash or shares. The Company assumed that the entire amount of the bonus would be settled in shares and the resulting potential shares were included in the weighted average number of ordinary shares outstanding used in the computation of diluted earnings per share if the effect is dilutive. Such dilutive effect of the potential shares was included in the computation of diluted earnings per share until the shareholders approve the number of shares to be distributed to employees at their meeting in the following year.
| 22. | SHARE-BASED PAYMENT ARRANGEMENTS |
| a. | Employee share option plans |
In order to attract, retain and reward employees, the Company has four employee share option plans for full-time employees of the Company and its subsidiaries. Each share option represents the right to purchase one ordinary share of the Company when exercised. Under the terms of the plans, share options are granted at an exercise price equal to or not less than the closing price of the ordinary shares listed on the TSE at the grant date. The option rights of these plans are valid for 10 years, non-transferable and exercisable at certain percentages subsequent to the second anniversary of the grant date. For any subsequent changes in the Company’s capital structure, the exercise price is accordingly adjusted.
In December 2014, the board of directors approved the 5th employee share option plan.
Information about share options of the Company was as follows:
-49-
| For the Years Ended December 31 | ||||||||||||||||
| 2014 | 2013 | |||||||||||||||
| Weighted | Weighted | |||||||||||||||
| Average | Average | |||||||||||||||
| Number of | Exercise | Number of | Exercise | |||||||||||||
| Options | Price Per Share | Options | Price Per Share | |||||||||||||
| (In Thousands) | (NT$) | (In Thousands) | (NT$) | |||||||||||||
| Balance at January 1 | 285,480 | $ | 20.5 | 344,332 | $ | 20.3 | ||||||||||
| Options forfeited | (1,515 | ) | 20.5 | (3,307 | ) | 20.7 | ||||||||||
| Options expired | (322 | ) | 13.5 | (10 | ) | 7.4 | ||||||||||
| Options exercised | (73,898 | ) | 19.7 | (55,535 | ) | 19.3 | ||||||||||
| Balance at December 31 | 209,745 | 20.7 | 285,480 | 20.5 | ||||||||||||
| Options exercisable, end of year | 189,240 | 20.7 | 228,685 | 20.4 | ||||||||||||
The weighted average share price at exercise dates of share options for the years ended December 31, 2014 and 2013 was NT$35.1 and NT$26.2, respectively.
Information about the Company’s outstanding share options at each balance sheet date was as follows:
| Range of Exercise Price Per Share (NT$) | Weighted Average Remaining Contractual Life (Years) | |||||||
| December 31, 2014 | $11.1-13.5 | 0.4 | ||||||
| 20.4-22.6 | 4.4 | |||||||
| December 31, 2013 | 11.1-13.5 | 0.6 | ||||||
| 20.4-22.6 | 5.4 | |||||||
ASE Mauritius Inc., a subsidiary of the Company, has an employee share option plan with the identical terms of the Company’s. 19,265 thousand share options were granted to the Company’s employees and none was exercised for the years ended December 31, 2014 and 2013. As of December 31, 2014 and 2013, 19,265 thousand share options were exercisable and the weighted average exercise price was US$1.7.
The terms of the share option plans granted in 2007, 2010 and 2011 by USIE were the same with those of the Company’s. In December 2014 and 2013, USIE had modified the terms of its share option plan granted in 2007 to extend the valid period from 11 years to 12 years and from 10 years to 11 years, respectively. The incremental fair value of NT$5,952 thousand and NT$8,492 thousand were all recognized as employee benefit expense in 2014 and 2013, respectively, since the options were all vested. 20,718 thousand share options of USIE were granted to the Company’s employees. There was no share options exercised or forfeited in 2014 and 2013, and 209 thousand share options were transferred to subsidiaries and 76 thousand share options were transferred into the Company from subsidiaries for the years ended December 31, 2014 and 2013, respectively. For the years ended December 31, 2014 and 2013 in respect of the share options granted by USIE to the Company’s employees, outstanding share options were 20,135 thousand units and 20,344 thousand units, respectively; 18,446 thousand units and 16,358 thousand units were exercisable, respectively; and the weighted average exercise prices were US$2.0 and US$1.9, respectively.
-50-
| b. | Fair value of share options |
The aforementioned share options granted were measured using the Black-Scholes Option Pricing Model or the Hull & White Model (2004) incorporated with Ritchken’s Trinomial Tree Model (1995), and the inputs to the models were as follows:
| ASE Inc. | ASE Mauritius Inc. | USIE | ||||
| Share price/market price at the grant date | NT$28.60-30.65 | US$1.7 | US$1.53-2.62 | |||
| Exercise prices | NT$28.60-30.65 | US$1.7 | US$1.53-2.94 | |||
| Expected volatility | 28.59%-40.82% | 47.21% | 32.48%-42.58% | |||
| Expected lives | 10 years | 10 years | 10-12 years | |||
| Expected dividend yield | 3.00%-4.00% | - | - | |||
| Risk free interest rates | 1.56%-2.51% | 3.87%-3.90% | 1.63%-4.02% |
Expected volatility was based on the historical share price volatility over the past 10 years of ASE Inc. and the comparable companies of ASE Mauritius Inc. and USIE, respectively. Under the Hull & White Model (2004) incorporated with Ritchken’s Trinomial Tree Model (1995), to allow for the effects of early exercise, the Group assumed that employees would exercise the options after vesting date when the share price was 1.58-1.69 times the exercise price.
Employee benefits expense recognized on employee share options was NT$110,157 thousand and NT$234,093 thousand for the years ended December 31, 2014 and 2013, respectively.
| c. | New shares issued under cash capital increase reserved for subscription by employees |
In July 2013, the board of directors approved the cash capital increase and, as required under the Company Act of the ROC, simultaneously granted options to employees to purchase 15% of such newly issued shares with such options exercisable within 3 days and vested when granted. The grant of the options was treated as employee options, accordingly a share-based compensation, and measured at fair value in accordance with IFRS 2. The Group recognized employee benefits expense and capital surplus of NT$26,708 thousand in full at the grant date (also the vested date), of which 1,960 thousand shares had not been vested, therefore, NT$3,626 thousand was reclassified from capital surplus-employee share options to capital surplus-issuance of ordinary shares.
Information about the Company’s employee share options related to the aforementioned newly issued shares was as follows:
Number of Options
(In Thousand)
| Fair Value (NT$) | |||||||
| Balance at January 1, 2013 | — | $ | — | |||||
| Options granted | 14,437 | 1.85 | ||||||
| Options exercised | (12,477 | ) | 1.85 | |||||
| Options forfeited | (1,960 | ) | — | |||||
| Balance at December 31, 2013 | — | — | ||||||
Fair value was measured using the Black-Scholes Option Pricing Model and the inputs to the model were as follows:
| Share price at the grant date | NT$27.95 per share | |
| Exercise price | NT$26.10 per share |
(Continued)
| Expected volatility | 17.98% | |
| Expected lives | 3 days | |
| Expected dividend yield | - | |
| Risk free interest rate | 0.57% |
(Concluded)
Expected volatility was based on the Company’s historical share prices volatility.
| 23. | NON-CASH TRANSACTIONS |
| a. | For the years ended December 31, 2014 and 2013, the Company entered into the following non-cash investing activities which were not reflected in the parent company only statements of cash flows: |
| For the Years Ended December 31 | ||||||||
| 2014 | 2013 | |||||||
| NT$ | NT$ | |||||||
| Investing activities affecting both cash and non-cash item | ||||||||
| Purchase of property, plant and equipment | $ | 27,572,214 | $ | 15,218,488 | ||||
| Capitalized borrowing costs | (47,204 | ) | (34,937 | ) | ||||
| Increase in prepayments for property, plant and equipment | 30,453 | 13,080 | ||||||
| Decrease (increase) in payables | (1,696,412 | ) | 852,120 | |||||
| $ | 25,859,051 | $ | 16,048,751 | |||||
| Proceeds from disposal of property, plant and equipment | ||||||||
| Consideration from disposal of property, plant and equipment | $ | 206,009 | $ | 539,258 | ||||
| Decrease (increase) in other receivables | (18,951 | ) | 146,626 | |||||
| $ | 187,058 | $ | 685,884 | |||||
| b. | The Company merged Yang Ting on 30 August, 2013 (the record date) and the related assets and liabilities of Yang Ting were as follows: |
| NT$ | ||||
| Cash | $ | 13,191 | ||
| Trade receivables | 46,613 | |||
| Other receivables (including other receivables form related parties) | 38,677 | |||
| Other current assets | 54,292 | |||
| Property, plant and equipment | 937,535 | |||
| Other non-current assets | 1,122 | |||
| 1,091,430 | ||||
| Short-term borrowings | (669,318 | ) | ||
| Trade payables (including trade payables to related parties) | (1,590 | ) | ||
| Other payables | (34,202 | ) | ||
| Other current liabilities | (163 | ) | ||
| Long-term borrowings | (650,000 | ) | ||
| (1,355,273 | ) | |||
| Net assets acquired | $ | (263,843 | ) | |
-51-
| 24. | OPERATING LEASE ARRANGEMENTS |
The Company lease the land on which its buildings are located under various operating lease agreements with the ROC government expiring through December 2033. The agreements grant the Company the option to renew the leases and reserve the right for the lessor to adjust the lease payments upon an increase in the assessed value of the land and to terminate the leases under certain conditions. In addition, the Company leases buildings, machinery and equipment under operating leases.
The Company recognized rental expense of NT$479,838 thousand and NT$274,490 thousand for the years ended December 31, 2014 and 2013, respectively.
| 25. | CAPITAL MANAGEMENT |
The capital structure of the Company consists of debt and equity. The Company manages its capital to ensure that the Company will be able to continue as going concerns while maximizing the return to shareholders through the optimization of the debt and equity balance. Key management personnel of the Company periodically reviews the cost of capital and the risks associated with each class of capital. In order to balance the overall capital structure, the Company may adjust the amount of dividends paid to shareholders, the number of new shares issued or repurchased, and the amount of new debt issued or existing debt redeemed.
The Company is not subject to any externally imposed capital requirements except those discussed in Note 14.
| 26. | FINANCIAL INSTRUMENTS |
| a. | Fair value of financial instruments |
| 1) | Fair value of financial instruments that are not measured at fair value |
Except bonds payable measured at amortized cost, the management considers that the carrying amounts of financial assets and financial liabilities not measured at fair value approximate their fair values.
The carrying amounts and the fair value of bonds payable as of December 31, 2014 and 2013, respectively, were as follows:
| Carrying Amount | Fair Value | |||||||
| NT$ | NT$ | |||||||
| December 31, 2014 | $ | 19,270,613 | $ | 19,828,076 | ||||
| December 31, 2013 | 18,152,195 | 18,773,778 | ||||||
| 2) | Fair value measurements recognized in the parent company only balance sheets |
The following table provides an analysis of financial instruments that are measured at fair value subsequent to initial recognition, grouped into Levels 1 to 3 based on the degree to which the fair value is observable:
| a) | Level 1 fair value measurements are those derived from quoted prices (unadjusted) in active markets for identical assets or liabilities; |
-52-
| b) | Level 2 fair value measurements are those derived from inputs other than quoted prices included within Level 1 that are observable for the asset or liability, either directly (i.e. prices) or indirectly (i.e. derived from prices); and |
| c) | Level 3 fair value measurements are those derived from valuation techniques that include inputs for those assets or liabilities that are not based on observable market data (unobservable inputs). |
| Level 1 | Level 2 | Level 3 | Total | |||||||||||||
| NT$ | NT$ | NT$ | NT$ | |||||||||||||
| December 31, 2014 | ||||||||||||||||
| Financial assets at FVTPL | ||||||||||||||||
| Financial assets designated as at FVTPL | ||||||||||||||||
| Private-placement convertible bonds | $ | — | $ | 100,500 | $ | — | $ | 100,500 | ||||||||
| Derivative financial assets | ||||||||||||||||
| Swap contracts | — | 1,888,449 | — | 1,888,449 | ||||||||||||
| Forward exchange contracts | — | 1,234 | — | 1,234 | ||||||||||||
| $ | — | $ | 1,990,183 | $ | $ | 1,990,183 | ||||||||||
| Available-for-sale financial assets | ||||||||||||||||
| Open-end mutual funds | $ | 400,007 | $ | — | $ | — | $ | 400,007 | ||||||||
| Limited Partnership | — | — | 438,953 | 438,953 | ||||||||||||
| Unquoted shares | — | — | 103,194 | 103,194 | ||||||||||||
| $ | 400,007 | $ | — | $ | 542,147 | $ | 942,154 | |||||||||
| Financial liabilities at FVTPL | ||||||||||||||||
| Derivative financial liabilities | ||||||||||||||||
| Conversion option, redemption option and put option of convertible bonds | $ | — | $ | 2,520,606 | $ | — | $ | 2,520,606 | ||||||||
| Swap contracts | — | 13,726 | — | 13,726 | ||||||||||||
| Forward exchange contracts | — | 6,086 | — | 6,086 | ||||||||||||
| $ | — | $ | 2,540,418 | $ | — | $ | 2,540,418 | |||||||||
| December 31, 2013 | ||||||||||||||||
| Financial assets at FVTPL | ||||||||||||||||
| Financial assets designated as at FVTPL | ||||||||||||||||
| Private-placement convertible bonds | $ | — | $ | 100,500 | $ | — | $ | 100,500 | ||||||||
| Derivative financial assets | ||||||||||||||||
| Swap contracts | — | 195,964 | — | 195,964 | ||||||||||||
| Forward exchange contracts | — | 5,809 | — | 5,809 | ||||||||||||
| $ | — | $ | 302,273 | $ | — | $ | 302,273 | |||||||||
(Continued)
| Level 1 | Level 2 | Level 3 | Total | |||||||||||||
| NT$ | NT$ | NT$ | NT$ | |||||||||||||
| Available-for-sale financial assets | ||||||||||||||||
| Open-end mutual funds | $ | 2,301,824 | $ | — | $ | — | $ | 2,301,824 | ||||||||
| Quoted shares | 10,323 | — | — | 10,323 | ||||||||||||
| Limited partnership | — | — | 457,756 | 457,756 | ||||||||||||
| Private-placement shares | — | 69,655 | — | 69,655 | ||||||||||||
| Unquoted shares | — | — | 65,146 | 65,146 | ||||||||||||
| $ | 2,312,147 | $ | 69,655 | $ | 522,902 | $ | 2,904,704 | |||||||||
| Financial liabilities at FVTPL | ||||||||||||||||
| Derivative financial liabilities | ||||||||||||||||
| Conversion option, redemption option and put option of convertible bonds | $ | — | $ | 1,742,996 | $ | — | $ | 1,742,996 | ||||||||
| Swap contracts | — | 33,950 | — | 33,950 | ||||||||||||
| Forward exchange contracts | — | 11,882 | — | 11,882 | ||||||||||||
| Cross currency swap contracts | — | 4,180 | — | 4,180 | ||||||||||||
| Foreign currency option contracts | — | 644 | — | 644 | ||||||||||||
| $ | — | $ | 1,793,652 | $ | — | $ | 1,793,652 | |||||||||
(Concluded)
For assets and liabilities held as of December 31, 2014 and 2013 that were measured at fair value on a recurring basis, there were no transfers between Level 1 and Level 2 of the fair value hierarchy.
| 3) | Reconciliation of Level 3 fair value measurements of financial assets |
The financial assets measured at Level 3 fair value were equity investments with no quoted prices classified as available-for-sale financial assets - non-current. Reconciliations for the years ended December 31, 2014 and 2013 were as follows:
| For the Years Ended December 31 | ||||||||
| 2014 | 2013 | |||||||
| NT$ | NT$ | |||||||
| Balance at January 1 | $ | 522,902 | $ | 454,853 | ||||
| Purchases | 38,793 | 30,000 | ||||||
| Total gains (losses) recognized in other comprehensive income | (19,548 | ) | 38,049 | |||||
| Balance at December 31 | $ | 542,147 | $ | 522,902 | ||||
As of December 31, 2014 and 2013, unrealized gain or loss recorded in other comprehensive income under the heading of unrealized gain (loss) on available-for-sale financial assets was nil.
-53-
| 4) | Valuation techniques and assumptions applied for the purpose of measuring fair value |
The fair values of financial assets and financial liabilities were determined as follows:
| a) | The fair values of financial assets and financial liabilities with standard terms and conditions and traded in active markets were determined with reference to quoted market prices (includes quoted shares and open-end mutual funds). The fair value of private-placement shares was derived using quoted market prices and adjusted for the liquidity discount due to the selling restrictions relating to the lock-up period. The liquidity discount was the option value using the Black-Scholes Model with all observable inputs. |
| b) | The fair values of derivative instruments were calculated using quoted prices. Where such prices were not available, a discounted cash flow analysis was performed using the applicable yield curve for the duration of the instruments for non-optional derivatives, and option pricing models for optional derivatives. These models use market-based observable inputs including interest rate curves, foreign exchange rates, and forward and spot prices for currencies to project fair value. The estimates and assumptions used by the Company were consistent with those that market participants would use in pricing financial instruments. |
| c) | The fair value of the Company’s investments in unquoted shares on Level 3 fair value measurement were measured using market approach based on investees’ recent financing activities, technical development, valuation of investees comparable companies, market conditions and other economic indicators. |
| d) | Except the aforementioned, the fair values of other financial assets and financial liabilities were measured using the generally accepted pricing models based on a discounted cash flow analysis. |
| b. | Categories of financial instruments |
| December 31 | ||||||||
| 2014 | 2013 | |||||||
| NT$ | NT$ | |||||||
| Financial assets | ||||||||
| FVTPL | ||||||||
| Designated as at FVTPL | $ | 100,500 | $ | 100,500 | ||||
| Held for trading | 1,889,683 | 201,773 | ||||||
| Available-for-sale financial assets | 942,154 | 2,904,704 | ||||||
| Loans and receivables (Note 1) | 34,476,934 | 30,663,272 | ||||||
| Financial liabilities | ||||||||
| FVTPL | ||||||||
| Held for trading | 2,540,418 | 1,793,652 | ||||||
| Measured at amortized cost (Note 2) | 101,542,763 | 90,947,486 | ||||||
Note 1: The balances included loans and receivables measured at amortized cost which comprised cash, trade receivables (including trade receivables from related parties), other receivables (including loans to related parties) and other financial assets.
Note 2: The balances included financial liabilities measured at amortized cost which comprised short-term borrowings, trade and other payables (including payables to related parties), bonds payable, long-term borrowings and long-term payables.
-54-
| c. | Financial risk management objectives and policies |
The derivative instruments used by the Company are to mitigate risks arising from ordinary business operations. All derivative transactions entered into by the Company are designated as either hedging or trading. Derivative transactions entered into for hedging purposes must hedge risk against fluctuations in foreign exchange rates and interest rates arising from operating activities. The currencies and the amount of derivative instruments held by the Company must match its hedged assets and liabilities denominated in foreign currencies.
The Company’s risk management department monitors risks to mitigate risk exposures, reports unsettled position, transaction balances and related gains or losses to the Company’s chief financial officer on monthly basis.
| 1) | Market risk |
The Company’s activities exposed it primarily to the financial risks of changes in foreign currency exchange rates and interest rates. Gains or losses arising from fluctuations in foreign currency exchange rates of a variety of derivative financial instruments were approximately offset by those of hedged items. Interest rate risk was not significant due to the cost of capital was expected to be fixed.
There had been no change to the Company’s exposure to market risks or the manner in which these risks were managed and measured.
| a) | Foreign currency exchange rate risk |
The Company had sales and purchases as well as financing activities denominated in foreign currency which exposed the Company to foreign currency exchange rate risk. The Company entered into a variety of derivative financial instruments to hedge foreign currency exchange rate risk to minimize the fluctuations of assets and liabilities denominated in foreign currencies.
The carrying amounts of the Company’s foreign currency denominated monetary assets and liabilities as well as derivative instruments which exposed the Company to foreign currency exchange rate risk at each balance sheet date are presented in Note 31.
The Company was principally subject to the impact to exchange rate fluctuation in U.S. dollars and Japanese yen against NT$. 1% is the sensitivity rate used when reporting foreign currency exchange rate risk internally to key management personnel and represents management’s assessment of the reasonably possible change in foreign currency exchange rates. The sensitivity analysis included financial assets and liabilities and inter-company receivables and payables within the Company and its subsidiaries. The changes in profit before income tax due to a 1% change in U.S. dollars and Japanese yen both against NT$ would be NT$3,400 thousand and NT$11,800 thousand for the years ended December 31, 2014 and 2013, respectively. Hedging contracts and hedged items have been taken into account while measuring the changes in profit before income tax. As the year-end exposure did not reflect the exposure for the years ended December 31, 2014 and 2013, the abovementioned sensitivity analysis was unrepresentative of those years.
| b) | Interest rate risk |
Except bonds payable at fixed interest rates, the Company was exposed to interest rate risk because the Company borrowed funds at floating interest rates. Changes in market interest rates will lead to variances in effective interest rates of borrowings from which the future cash flow fluctuations arise.
-55-
The carrying amounts of the Company’s financial assets and financial liabilities with exposure to interest rates at each balance sheet date were as follows:
| December 31 | ||||||||
| 2014 | 2013 | |||||||
| NT$ | NT$ | |||||||
| Fair value interest rate risk | ||||||||
| Financial liabilities | $ | 21,736,100 | $ | 20,866,340 | ||||
| Cash flow interest rate risk | ||||||||
| Financial assets | 11,432,949 | 15,099,100 | ||||||
| Financial liabilities | 57,040,407 | 55,071,138 | ||||||
For assets and liabilities with floating interest rates, a 100 basis point increase or decrease was used when reporting interest rate risk internally to key management personnel. If interest rates had been 100 basis points (1%) higher or lower and all other variables held constant, the Company’s profit before income tax for the years ended December 31, 2014 and 2013 would have decreased or increased approximately by NT$456,000 thousand and NT$400,000 thousand, respectively.
| c) | Other price risk |
The Company was exposed to equity price risk through its investments in available-for-sale financial assets. If equity prices were 1% higher or lower, other comprehensive income before income tax for the years ended December 31, 2014 and 2013 would have increased or decreased approximately by NT$9,500 thousand and NT$30,000 thousand, respectively.
In addition, the Company was also exposed to the Company’s ordinary share price risk through Bonds Options recognized as financial liabilities held for trading. 7% is the sensitivity rate used when reporting price risk internally to key management personnel. If the Company’s ordinary share price increased or decreased by 7%, profit before income tax for the years ended December 31, 2014 would have decreased approximately by NT$651,000 thousand, or increased approximately by NT$608,000 thousand, respectively.
| 2) | Credit risk |
Credit risk refers to the risk that counterparty will default on its contractual obligations resulting in financial loss to the Company. The Company’s credit risk arises from cash, receivables and other financial assets. The Company’s maximum exposure to credit risk was the carrying amounts of financial assets in the consolidated balance sheets.
The Company dealt with counterparties creditworthy and has a credit policy and trade receivable management procedures to ensure recovery and evaluation of trade receivables. The Company’s counterparties consisted of a large number of customers and banks and there was no significant concentration of credit risk exposure.
| 3) | Liquidity risk |
The Company manages liquidity risk by maintaining adequate working capital and banking facilities to fulfill the demand for cash flow used in the Company’s operation and capital expenditure. In addition, some creditors to the Company’s current liabilities are the Company’s subsidiaries, and there’s no risk of obligation for prompt repayments. The Group also monitors its compliance with all the loan covenants. Liquidity risk is not considered to be significant.
-56-
In the table below, financial liabilities with a repayment on demand clause were included in the earliest time band regardless of the probability of counter-parties choosing to exercise their rights. The maturity dates for other non-derivative financial liabilities were based on the agreed repayment dates.
To the extent that interest flows are floating rate, the undiscounted amounts were derived from the interest rates at each balance sheet date.
On Demand or Less than 1 Month | 1 to 3 Months | 3 Months to 1 Year | 1 to 5 Years | More than 5 Years | ||||||||||||||||
| NT$ | NT$ | NT$ | NT$ | NT$ | ||||||||||||||||
| December 31, 2014 | ||||||||||||||||||||
| Non-derivative financial liabilities | ||||||||||||||||||||
| Non-interest bearing | $ | 8,339,715 | $ | 8,817,318 | $ | 66,299 | $ | — | $ | — | ||||||||||
| Floating interest rate liabilities | 11,462,504 | 2,025,963 | 26,638,522 | 17,648,985 | — | |||||||||||||||
| Fixed interest rate liabilities | 582,373 | 778,550 | 568,920 | 21,862,951 | — | |||||||||||||||
| $ | 20,384,592 | $ | 11,621,831 | $ | 27,273,741 | $ | 39,511,936 | $ | — | |||||||||||
| December 31, 2013 | ||||||||||||||||||||
| Non-derivative financial liabilities | ||||||||||||||||||||
| Non-interest bearing | $ | 4,868,363 | $ | 8,112,531 | $ | 69,735 | $ | 894,150 | $ | — | ||||||||||
| Floating interest rate liabilities | 10,577,776 | 1,888,157 | 23,238,634 | 20,246,035 | — | |||||||||||||||
| Fixed interest rate liabilities | — | — | 116,000 | 20,154,000 | — | |||||||||||||||
| $ | 15,446,139 | $ | 10,000,688 | $ | 23,424,369 | $ | 41,294,185 | $ | — | |||||||||||
The amounts included above for floating interest rate instruments for non-derivative financial liabilities was subject to change if changes in floating interest rates differ from those estimates of interest rates determined at each balance sheet date.
The following table detailed the Company’s liquidity analysis for its derivative financial instruments. The table was based on the undiscounted contractual net cash inflows and outflows on derivative instruments that settle on a net basis, and the undiscounted gross cash inflows and outflows on those derivatives that require gross settlement. When the amounts payable or receivable are not fixed, the amounts disclosed have been determined by reference to the projected interest rates as illustrated by the yield curves at each balance sheet date.
On Demand or Less than 1 Month | 1 to 3 Months | 3 Months to 1 Year | ||||||||||
| NT$ | NT$ | NT$ | ||||||||||
| December 31, 2014 | ||||||||||||
| Gross settled | ||||||||||||
| Forward exchange contracts | ||||||||||||
| Inflows | $ | 520,506 | $ | — | $ | — | ||||||
| Outflows | (525,390 | ) | — | — | ||||||||
| (4,884 | ) | — | — | |||||||||
| Swap contracts | ||||||||||||
| Inflows | 4,234,700 | 3,323,250 | 31,808,250 | |||||||||
| Outflows | (4,064,710 | ) | (3,147,315 | ) | (30,099,780 | ) | ||||||
| 169,990 | 175,935 | 1,708,470 | ||||||||||
| $ | 165,106 | $ | 175,935 | $ | 1,708,470 | |||||||
(Continued)
On Demand or Less than 1 Month | 1 to 3 Months | 3 Months to 1 Year | ||||||||||
| NT$ | NT$ | NT$ | ||||||||||
| December 31, 2013 | ||||||||||||
| Net settled | ||||||||||||
| Forward exchange contracts | $ | 3,520 | $ | 1,010 | $ | — | ||||||
| Gross settled | ||||||||||||
| Forward exchange contracts | ||||||||||||
| Inflows | $ | 538,147 | $ | 239,271 | $ | — | ||||||
| Outflows | (549,902 | ) | (238,440 | ) | — | |||||||
| (11,755 | ) | 831 | — | |||||||||
| Swap contracts | ||||||||||||
| Inflows | 5,215,875 | 4,127,993 | 22,353,750 | |||||||||
| Outflows | (5,180,715 | ) | (4,077,792 | ) | (22,111,060 | ) | ||||||
| 35,160 | 50,201 | 242,690 | ||||||||||
| Interest rate swap contracts | ||||||||||||
| Inflows | 2,910 | — | — | |||||||||
| Outflows | — | — | — | |||||||||
| 2,910 | — | — | ||||||||||
| Cross currency swap contracts | ||||||||||||
| Inflows | 175 | 356 | 596,801 | |||||||||
| Outflows | — | — | (598,600 | ) | ||||||||
| 175 | 356 | (1,799 | ) | |||||||||
| $ | 26,490 | $ | 51,388 | $ | 240,891 | |||||||
(Concluded)
| 27. | RELATED PARTY TRANSACTIONS |
The significant transactions between the Company and its related parties are summarized as follows:
| a. | Sales |
| For the Years Ended December 31 | ||||||||
| 2014 | 2013 | |||||||
| NT$ | NT$ | |||||||
| Subsidiaries | $ | 9,375,056 | $ | 3,319,713 | ||||
| b. | Purchases |
| For the Years Ended December 31 | ||||||||
| 2014 | 2013 | |||||||
| NT$ | NT$ | |||||||
| Subsidiaries | $ | 4,840,949 | $ | 4,646,653 | ||||
-57-
Terms of the transactions with related parties were not significantly different from those with non-related parties. The credit terms with related parties are mainly 60 days. Unrealized gross profit from the transactions with related parties had been eliminated.
| c. | Receivables from related parties |
| December 31, | ||||||||||
| 2014 | 2013 | |||||||||
| NT$ | NT$ | |||||||||
| Trade receivables from related parties | Subsidiaries | $ | 5,082,423 | $ | 2,418,651 | |||||
| Other receivables from related parties | Subsidiaries | $ | 36,699 | $ | 46,191 | |||||
| Associates | — | 11 | ||||||||
| $ | 36,699 | $ | 46,202 | |||||||
| d. | Payables to related parties (excluding loans from related parties) |
| December 31, | ||||||||||
| 2014 | 2013 | |||||||||
| NT$ | NT$ | |||||||||
| Accounts payables to related parties | Subsidiaries | $ | 1,223,750 | $ | 1,074,901 | |||||
| Other payables to related parties | Subsidiaries | $ | 1,840,573 | $ | 1,545,387 | |||||
| Associates | 6,328 | 28,920 | ||||||||
| $ | 1,846,901 | $ | 1,574,307 | |||||||
The outstanding payables to related parties of the Company will be paid in cash and no collateral were provided. The Company did not hold any collateral over the trade receivables from related parties. The Company had not provided an allowance for doubtful debts on receivables from related parties for the years ended December 31, 2014 and 2013.
| e. | Acquisition of property, plant and equipment |
| For the Years Ended December 31 | ||||||||
| 2014 | 2013 | |||||||
| NT$ | NT$ | |||||||
| Subsidiaries | $ | 559,544 | $ | 304,844 | ||||
| Associates | 4,889,732 | 1,553,280 | ||||||
| $ | 5,449,276 | $ | 1,858,124 | |||||
| f. | Disposal of property, plant and equipment: |
| For the Years Ended December 31 | ||||||||||||||||
| 2014 | 2013 | |||||||||||||||
| Proceeds | Gain from disposal | Proceeds | Gain from disposal | |||||||||||||
| NT$ | NT$ | NT$ | NT$ | |||||||||||||
| Subsidiaries | $ | 118,358 | $ | 1,299 | $ | 457,464 | $ | 19,703 | ||||||||
-58-
| g. | Loans from related parties |
| December 31 | ||||||||
| 2014 | 2013 | |||||||
| NT$ | NT$ | |||||||
| Subsidiaries | $ | 28,806,723 | $ | 16,533,498 | ||||
The interest rates of loans from related parties were not significantly different from normal market rates.
| h. | Endorsements/Guarantees provided |
| December 31 | ||||||||
| 2014 | 2013 | |||||||
| NT$ | NT$ | |||||||
| Subsidiaries | $ | 12,905,228 | $ | 19,903,442 | ||||
NT$16,392,750 thousand were not drawdown from the amount that the Company had provided endorsement/guarantees as of December 31, 2013 and, as a result, the Company’s board of directors resolved to cancel the endorsement/guarantees.
| i. | Other relate party transactions |
| For the Years Ended December 31 | ||||||||
| 2014 | 2013 | |||||||
| NT$ | NT$ | |||||||
| Service expenses incurred to subsidiaries | $ | 920,727 | $ | 744,643 | ||||
| Donations to related parties | 115,000 | — | ||||||
| $ | 1,035,727 | $ | 744,643 | |||||
| j. | Compensation to key management personnel |
| For the Years Ended December 31 | ||||||||
| 2014 | 2013 | |||||||
| NT$ | NT$ | |||||||
| Short-term employee benefits | $ | 632,920 | $ | 461,049 | ||||
| Post-employment benefits | 1,404 | 1,805 | ||||||
| Share-based payments | 29,125 | 31,206 | ||||||
| $ | 663,449 | $ | 494,060 | |||||
The compensation to the Company’s key management personnel is determined according to personal performance and market trends.
| 28. | ASSETS PLEDGED AS COLLATERAL OR FOR SECURITY |
In addition to Note 9, the Company provided time deposits of NT$181,283 thousand and NT$180,837 thousand as collateral for the tariff guarantees of imported raw materials and guarantees for hiring foreign labor as of December 31, 2014 and 2013, respectively.
-59-
| 29. | SIGNIFICANT CONTINGENT LIABILITIES AND UNRECOGNIZED COMMITMENTS |
In addition to those disclosed in other notes, significant commitments and contingencies of the Company as of each balance sheet date were as follows:
| a. | Significant commitments |
| 1) | As of December 31, 2014 and 2013, unused letters of credit of the Company were approximately NT$59,300 thousand and NT$85,500 thousand, respectively. |
| 2) | As of December 31, 2014 and 2013, the amounts that the Company has committed to purchase property, plant and equipment were approximately NT$5,564,000 thousand and NT$2,934,000 thousand, respectively, of which NT$641,684 thousand and NT$528,631 thousand had been prepaid, respectively. |
| 3) | In consideration of corporate social responsibility for environmental protection, the Company’s board of directors, in December 2013, approved contributions to be made in the next 30 years, at a total amount of NT$3,000,000 thousand, at the minimum, to environmental protection efforts in Taiwan. In January 2015, the Company’s board of directors approved to contribute NT$100,000 thousand to ASE Foundation for continuously implementing environmental effort in promoting the related domestic environmental protection and public service activities. |
| b. | Non-cancellable operating lease commitments |
| December 31, 2014 | ||||
| NT$ | ||||
| Less than 1 year | $ | 118,580 | ||
| 1-5 years | 143,330 | |||
| More than 5 years | 146,510 | |||
| $ | 408,420 | |||
| 30. | SIGNIFICANT SUBSEQUENT EVENTS |
To enhance operational flexibility via structural adjustments, the board of directors of the Company’s subsidiary, Universal Scientific Industrial Co., Ltd. (“USI”), resolved in January 2015 the spin-off of its investment business as well as capital reduction of NT$16,012,966 thousand by reducing 1,601,297 thousand shares (a reduction ratio of 97.56%), and will assign its investment business to USIINC, a newly established business entity. As the consideration of the business value to be spun-off by USI, USIINC will issue 1,000,000 thousand new ordinary shares to the shareholders of USI. Based on the shareholdings on the record date of the spin-off, the shareholders of USI will receive 609.27 shares of USIINC’s ordinary share in exchange of each 1,000 shares of USI’s ordinary share. The tentative record date of the spin-off is March 6, 2015. After the spin-off, the Company will have control over both USI and USIINC, and the spin-off will not have material impact on the financial position and business operation of the Company.
-60-
| 31. | SIGNIFICANT ASSETS AND LIABILITIES DENOMINATED IN FOREIGN CURRENCIES |
The significant assets and liabilities denominated in foreign currencies were as follows:
Foreign Currencies (In Thousand) | Exchange Rate | Carrying Amount (In Thousand) | ||||||||
| December 31, 2014 | ||||||||||
| Monetary financial assets | ||||||||||
| US$ | $ | 2,119,319 | US$1=NT$31.65 | $ | 67,076,446 | |||||
| JPY | 3,319,802 | JPY1=NT$0.2646 | 878,420 | |||||||
| Monetary financial liabilities | ||||||||||
| US$ | 2,131,682 | US$1=NT$31.65 | 67,467,735 | |||||||
| JPY | 3,111,135 | JPY1=NT$0.2646 | 823,206 | |||||||
| December 31, 2013 | ||||||||||
| Monetary financial assets | ||||||||||
| US$ | 1,924,848 | US$1=NT$29.805 | 57,370,095 | |||||||
| JPY | 3,844,089 | JPY1=NT$0.2839 | 1,091,337 | |||||||
| Monetary financial liabilities | ||||||||||
| US$ | 1,968,832 | US$1=NT$29.805 | 58,681,038 | |||||||
| JPY | 3,386,605 | JPY1=NT$0.2839 | 961,457 | |||||||
32. OTHERS
On December 20, 2013, the Kaohsiung Environmental Protection Bureau (“KEPB”) issued an official letter No. Kao-Shih-Huan-Chu-Tu-Tzu 10243758100 and an administrative sanction letter No. Kao-Shih-Huan-Chu-Shui-Chu-Tzu 30-102-120022 (“the Administrative Decision”). The Administrative Decision was to suspend the operation at ASE K7 Plant's wafer-level process where nickel is used and impose a fine of NT$110,065 thousand, which has been recorded under the line item of other income and expenses for the year ended December 31, 2013. On April 7, 2014, the amount of the fine was amended to NT$109,359 thousand by the KEPB. On January 17, 2014, the Company retained lawyers to file an administrative appeal to nullify the Administrative Decision with the Kaohsiung City Government, but the administrative appeal was dismissed. The Company next retained lawyers to file an administrative complaint to revoke the part of the Administrative Decision pertaining to the fine, and the case is being heard by the Kaohsiung High Administrative Court. As to the suspended operation at ASE K7 Plant's wafer-level process where nickel is used, the KEPB issued official letter No. Kao-Shih-Huan-Chu-Tu-Tzu 10343171000, on December 15, 2014, to grant the resumption.
Meanwhile, owing to the event above, on January 3, 2014, the Kaohsiung District Prosecutors Office charged the Company with violation of the Waste Disposal Act and the judgment was handed down on October 20, 2014, in which the Company was fined NT$3,000 thousand, recorded under the line item of other income and expenses for the year ended December 31, 2014, for violation of Article 47 of the Waste Disposal Act. The Company filed an appeal against the judgment, and the case is being heard by the Taiwan High Court's Kaohsiung Branch Court.
-61-
33. ADDITIONAL DISCLOSURES
Following are the additional disclosures required by the Securities and Futures Bureau for ASE Inc.:
| a. | Financial provided: Please see Table 1 attached; |
| b. | Endorsement/guarantees provided: Please see Table 2 attached; |
| c. | Marketable securities held (excluding investments in subsidiaries and associates): Please see Table 3 attached; |
| d. | Marketable securities acquired and disposed of at costs or prices of at least NT$300 million or 20% of the paid-in capital: Please see Table 4 attached; |
| e. | Acquisition of individual real estate properties at costs of at least NT$300 million or 20% of the paid-in capital: Please see Table 5 attached; |
| f. | Disposal of individual real estate properties at prices of at least NT$300 million or 20% of the paid-in capital: None; |
| g. | Total purchase from or sales to related parties of at least NT$100 million or 20% of the paid-in capital: Please see Table 6 attached; |
| h. | Receivables from related parties amounting to at least NT$100 million or 20% of the paid-in capital: Please see Table 7 attached; |
| i. | Information about the derivative financial instruments transaction: Please see Note 7; |
| j. | Names, locations, and related information of investees over which ASE Inc. exercises significant influence (excluding information on investment in Mainland China): Please see Table 8 attached; |
| k. | Information on investment in Mainland China |
| 1) | The name of the investee in Mainland China, the main businesses and products, its issued capital, method of investment, information on inflow or outflow of capital, percentage of ownership, income (losses) of the investee, share of profits/losses of investee, ending balance, amount received as dividends from the investee, and the limitation on investee: None; |
| 2) | Any of the following significant transactions with investee companies in mainland China, either directly or indirectly through a third party, and their prices, payment terms, and unrealized gains or losses: |
| a) | The amount and percentage of purchases and the balance and percentage of the related payables at the end of the period: Please see Table 6 attached; |
| b) | The amount and percentage of sales and the balance and percentage of the related receivables at the end of the period: None; |
| c) | The amount of property transactions and the amount of the resultant gains or losses: No significant transactions; |
| d) | The balance of negotiable instrument endorsements or guarantees or pledges of collateral at the end of the period and the purposes: None; |
-62-
| e) | The highest balance, the end of period balance, the interest rate range, and total current period interest with respect to financing of funds: None; |
| f) | Other transactions that have a material effect on the profit or loss for the period or on the financial position, such as the rendering or receiving of services: None. |
-63-
TABLE 1
ADVANCED SEMICONDUCTOR ENGINEERING, INC.
FINANCINGS PROVIDED
FOR THE YEAR ENDED DECEMBER 31, 2014
(Amounts In Thousands of New Taiwan Dollars)
| Financing Limits for | Financing Company's | |||||||||||||||||||||||||||||||||||||||
| Financial Statement | Related | Maximum Balance | Amount | Nature for | Transaction | Reason for | Allowance for | Collateral | Each Borrowing | Total Financing | ||||||||||||||||||||||||||||||
| No. | Financing Company | Counter-party | Account | Party | for the year | Ending Balance | Actual Drawn | Interest Rate | Financing | Amounts | Financing | Bad Debt | Item | Value | Company (Note 1) | Amount Limits (Note 2) | ||||||||||||||||||||||||
| 1 | A.S.E. Holding Limited | The Company | Other receivables | Yes | $ | 2,404,365 | $ | 2,088,900 | $ | 2,088,900 | 0.55~0.57 | The need for short-term | $ | - | Operating capital | $ | - | - | $ | - | $ | 2,927,288 | $ | 5,854,576 | ||||||||||||||||
| 2 | J & R Holding Limited | The Company | Other receivables | Yes | 8,935,529 | 7,849,200 | 7,849,200 | 0.55~1.00 | The need for short-term | - | Operating capital | - | - | - | 9,522,922 | 19,045,844 | ||||||||||||||||||||||||
| form related parties | financing | |||||||||||||||||||||||||||||||||||||||
| 3 | ASE Test Limited | The Company | Other receivables | Yes | 5,113,080 | 4,525,950 | 4,525,950 | 0.55~0.57 | The need for short-term | - | Operating capital | - | - | - | 5,682,061 | 11,364,122 | ||||||||||||||||||||||||
| form related parties | financing | |||||||||||||||||||||||||||||||||||||||
| 4 | ASE Test, Inc. | The Company | Other receivables | Yes | 4,800,000 | 4,499,200 | 4,499,200 | 0.98~1.03 | The need for short-term | - | Operating capital | - | - | - | 5,452,799 | 10,905,598 | ||||||||||||||||||||||||
| form related parties | financing | |||||||||||||||||||||||||||||||||||||||
| 5 | J&R Industrial Inc. | The Company | Other receivables | Yes | 190,000 | 190,000 | 190,000 | 0.98~1.03 | The need for short-term | - | Operating capital | - | - | - | 198,616 | 397,232 | ||||||||||||||||||||||||
| form related parties | financing | |||||||||||||||||||||||||||||||||||||||
| 6 | ASE (Korea) Inc. | The Company | Other receivables | Yes | 1,582,500 | 1,582,500 | 1,582,500 | 3.15~3.17 | The need for short-term | - | Operating capital | - | - | - | 3,017,323 | 6,034,646 | ||||||||||||||||||||||||
| form related parties | financing | |||||||||||||||||||||||||||||||||||||||
| 7 | USI Enterprise Limited | The Company | Other receivables | Yes | 4,431,000 | 4,431,000 | 4,431,000 | 0.55~0.57 | The need for short-term | - | Operating capital | - | - | - | 6,424,787 | 12,849,573 | ||||||||||||||||||||||||
| form related parties | financing | |||||||||||||||||||||||||||||||||||||||
| 8 | Huntington Holdings | The Company | Other receivables | Yes | 1,740,750 | 1,740,750 | 1,740,750 | 0.55~0.56 | The need for short-term | - | Operating capital | - | - | - | 7,343,287 | 14,686,574 | ||||||||||||||||||||||||
| International Co., Ltd. | form related parties | financing | ||||||||||||||||||||||||||||||||||||||
| 9 | Real Tech Holdings | The Company | Other receivables | Yes | 1,675,850 | 474,750 | 474,750 | 0.55~0.57 | The need for short-term | - | Operating capital | - | - | - | 6,882,164 | 13,764,328 | ||||||||||||||||||||||||
| Limited | form related parties | financing | ||||||||||||||||||||||||||||||||||||||
| 10 | Omniquest Industrial | The Company | Other receivables | Yes | 2,548,300 | 1,424,250 | 1,424,250 | 0.55~0.56 | The need for short-term | - | Operating capital | - | - | - | 3,218,935 | 6,437,871 | ||||||||||||||||||||||||
| Limited | form related parties | financing | ||||||||||||||||||||||||||||||||||||||
Note 1: Limit amount of lending to a company shall not exceed 20% of the net worth of the company.
Note 2: The total amount of such financing facility shall not exceed 40% of the amount of the net worth of the lending company.
-64-
TABLE 2
ADVANCED SEMICONDUCTOR ENGINEERING, INC.
ENDORSEMENTS/GUARANTEES PROVIDED
FOR THE YEAR ENDED DECEMBER 31, 2014
(Amounts In Thousands of New Taiwan Dollars)
| Limits on Endorsement | Ratio of Accumulated | Maximum | Guarantee | ||||||||||||||||||||||||||||
| Endorsement/ | /Guarantee Amount | Amount of Endorsement/ | Endorsement/Guarantee to | Endorsement | Guarantee | Guarantee | Provided to | ||||||||||||||||||||||||
| Guarantee Provider | Guaranteed Party | Provided to Each | Maximum Balance | Amount Actually | Guarantee Collateralized | Net Equity per Latest | /Guarantee Amount | Provided by | Provided by | Subsidiaries | |||||||||||||||||||||
| No. | Name | Name | Nature of Relationship | Guaranteed Party (Note 1) | for the Year | Ending Balance | Drawn | by Properties | Financial Statement | Allowable (Note 2) | Parent Company | A Subsidiary | in Mainland CHINA | ||||||||||||||||||
| 0 | The Company | Anstock Limited | 100% voting shares | $ | 45,065,086 | $ | 3,568,862 | $ | 2,804,922 | $ | 2,616,614 | $ | - | 1.87 | $ | 60,086,781 | Yes | No | No | ||||||||||||
| indirectly owned by | (Note3) | (Note3) | |||||||||||||||||||||||||||||
| the Company | |||||||||||||||||||||||||||||||
| USI Enterprise Limited | 99% voting shares | 45,065,086 | 16,758,500 | - | - | - | - | 60,086,781 | Yes | No | No | ||||||||||||||||||||
| indirectly owned by | (Note3) | ||||||||||||||||||||||||||||||
| the Company | |||||||||||||||||||||||||||||||
| Anstock II Limited | 100% voting shares | 45,065,086 | 10,100,306 | 10,100,306 | 9,585,235 | - | 6.72 | 60,086,781 | Yes | No | No | ||||||||||||||||||||
| indirectly owned by | (Note3) | (Note3) | |||||||||||||||||||||||||||||
| the Company | |||||||||||||||||||||||||||||||
Note 1: The ceilings on the amounts for any single entity is permitted to make in endorsements/guarantees shall not exceed 30% of total equity of shareholders according to “The Process of make in endorsements/guarantees” of ASE.
Note 2: The ceilings on the aggregate amounts are permitted to make in endorsements/guarantees shall not exceed 40% of total equity of shareholders according to “The Process of make in endorsements/guarantees” of ASE.
Note 3: Amount was included principal and interest.
-65-
TABLE 3
ADVANCED SEMICONDUCTOR ENGINEERING, INC.
MARKETABLE SECURITIES HELD
DECEMBER 31, 2014
(Amounts In Thousands of New Taiwan Dollars)
| December 31, 2014 | |||||||||||||||
| Relationship with | Percentage of | ||||||||||||||
| Held Company Name | Marketable Securities Type and Name | the Company | Financial Statement Account | Shares/ Units | Carrying Value | Ownership (%) | Fair Value | Note | |||||||
| The Company | Stock | ||||||||||||||
| H&HH Venture Investment Corporation | - | Available-for-sale financial assets - non-current | 4,435,245 | $ | 21,927 | 15 | $ | 21,927 | |||||||
| H&D Venture Capital Investment Corporation | - | Available-for-sale financial assets - non-current | 3,879,310 | 22,718 | 13 | 22,718 | |||||||||
| Claridy Solutions, Inc. | - | Available-for-sale financial assets - non-current | 12,611 | 58 | - | 58 | |||||||||
| Asia Pacifical Emerging Industry Venture Capital Co, Ltd. | - | Available-for-sale financial assets - non-current | 6,000,000 | 58,491 | 7 | 58,491 | |||||||||
| StarChips Technology Inc. | - | Available-for-sale financial assets - non-current | 333,334 | - | 6 | - | |||||||||
| Bond | |||||||||||||||
| AMPI Second Private of Domestic Unsecured | - | Financial assets at fair value through profit | 1,000 | 100,500 | - | 100,500 | |||||||||
| Convertible Bonds | or loss - current | ||||||||||||||
| Limited Liability Partnership | |||||||||||||||
| Ripley Cable Holdings I, L.P. | - | Available-for-sale financial assets - non-current | - | 438,953 | 4 | 438,953 | |||||||||
| Fund | |||||||||||||||
| Mega Diamond Money Market Fund | - | Available-for-sale financial assets - current | 32,504,205 | 400,007 | - | 400,007 | |||||||||
-66-
TABLE 4
ADVANCED SEMICONDUCTOR ENGINEERING, INC.
MARKETABLE SECURITIES ACQUIRED AND DISPOSED OF AT COSTS OR PRICES OF AT LEAST NT$300 MILLION OR 20% OF THE PAID-IN CAPITAL
FOR THE YEAR ENDED DECEMBER 31, 2014
(Amounts In Thousands of New Taiwan Dollars)
| Nature of | Beginning Balance | Acquisition | Disposal | Ending Balance | ||||||||||||||||||||||||||||||||
| Company Name | Marketable Securities Type and Name | Financial Statement Account | Counter-party | Relationship | Shares/Units | Amount (Note 1) | Shares/Units | Amount | Shares/Units | Amount | Carrying Value | Gain/Loss on Disposal | Shares/Units | Amount (Note) | ||||||||||||||||||||||
| The Company | Fund | |||||||||||||||||||||||||||||||||||
| Yuanta De- Bao Money Market Fund | Available-for-sale financial assets - current | - | - | 24,719,982 | $ | 290,381 | 25,536,262 | $ | 300,000 | 50,256,244 | $ | 591,347 | $ | 590,000 | $ | 1,347 | - | $ | - | |||||||||||||||||
| Jih Sun Money Market | Available-for-sale financial assets - current | - | - | 20,087,832 | 290,402 | 20,749,327 | 300,000 | 40,837,159 | 591,356 | 590,000 | 1,356 | - | - | |||||||||||||||||||||||
| UPAMC James Bond Money Market Fund | Available-for-sale financial assets - current | - | - | 17,779,195 | 290,384 | 18,365,923 | 300,000 | 36,145,118 | 591,318 | 590,000 | 1,318 | - | - | |||||||||||||||||||||||
| Franklin Templeton SinoAm Money Market Fund | Available-for-sale financial assets - current | - | - | - | - | 29,759,838 | 300,000 | 29,759,838 | 300,818 | 300,000 | 818 | - | - | |||||||||||||||||||||||
| Mega Diamond Money Market Fund | Available-for-sale financial assets - current | - | - | - | - | 32,504,205 | 400,000 | - | - | - | - | 32,504,205 | 400,007 | |||||||||||||||||||||||
Note: Including the adjustment to fair value.
-67-
TABLE 5
ADVANCED SEMICONDUCTOR ENGINEERING, INC.
ACQUISITION OF INDIVIDUAL REAL ESTATE PROPERTIES AT COSTS OF AT LEAST NT$300 MILLION OR 20% OF THE PAID-IN CAPITAL
FOR THE YEAR ENDED DECEMBER 31, 2014
(Amounts In Thousands of New Taiwan Dollars)
| Prior Transaction of Related Counter-party | |||||||||||||||||||
| Company | Transaction Date | Nature of | Transfer | Purpose of | Other | ||||||||||||||
| Name | Types of Property | Transaction Date | (Tax excluded) | Payment Term | Counter-party | Relationships | Owner | Relationships | Date | Amount | Price Reference | Acquisition | Terms | ||||||
| The Company | The Buildings, Located at No. 566、 | July 10, 2014 | $ | 4,540,086 | Paid | HC | Associate | - | - | - | $ | - | Based on independent | To facilitate the future | None | ||||
| 568、570 B1 and 572, Sec. 1, | (Tax excluded) | professional appraisal | production expansion | ||||||||||||||||
| Chung-Hwa Rd., Chungli | reports | plan | |||||||||||||||||
| City, Taoyuan County | |||||||||||||||||||
| Facilities and equipment of ASE's | January 03, 2014~ | 426,677 | There is 104,995 thousand will | Aircare Engineering | None | - | - | - | - | Request for quotation, | Facilities and equipment | None | |||||||
| Kaohsiung factory | December 11, 2014 | (Tax excluded) | be paid after acceptance check. | Corp. | price comparison | expansion | |||||||||||||
| and price negotiation | |||||||||||||||||||
| The plant and facility construction | January 07, 2014~ | 349,646 | There is 4,620 thousand will | Hu Hwa Construction | Associate | - | - | - | - | Based on independent | The wastewater treatment | None | |||||||
| of a new ”green building” project | November 09, 2014 | (Tax excluded) | be paid after acceptance check. | Co., Ltd. | professional appraisal | for further construction | |||||||||||||
| in Nantze Export Processing Zone, | reports, request for | and plant expansion | |||||||||||||||||
| Kaohsiung City | quotation, price | ||||||||||||||||||
| comparison and | |||||||||||||||||||
| price negotiation | |||||||||||||||||||
| Pumping and drainage works, etc. | January 09, 2014~ | 399,154 | There is 114,189 thousand will | Kun Lin Engineering | None | - | - | - | - | Request for quotation, | Facilities and equipment | None | |||||||
| December 23, 2014 | (Tax excluded) | be paid after acceptance check. | Co., Ltd. | price comparison | expansion | ||||||||||||||
| and price negotiation | |||||||||||||||||||
| Facilities and equipment of ASE's | January 10, 2014~ | 307,025 | There is 95,142 thousand will | Chia Wang Technology | None | - | - | - | - | Request for quotation, | Facilities and equipment | None | |||||||
| Kaohsiung factory | December 24, 2014 | (Tax excluded) | be paid after acceptance check. | Engineering Co., Ltd. | price comparison | expansion | |||||||||||||
| and price negotiation | |||||||||||||||||||
-68-
TABLE 6
ADVANCED SEMICONDUCTOR ENGINEERING, INC.
TOTAL PURCHASES FROM OR SALES TO RELATED PARTIES OF AT LEAST NT$100 MILLION OR 20% OF THE PAID-IN CAPITAL
FOR THE YEAR ENDED DECEMBER 31, 2014
(Amounts In Thousands of New Taiwan Dollars)
| Notes/Accounts Payable or Receivable | ||||||||||||||||||||||||||||
| Transaction Details | Abnormal Transaction | |||||||||||||||||||||||||||
| Buyer | Related Party | Relationships | Purchases/ | Ending Balance | % to Total | Note | ||||||||||||||||||||||
| Sales | Amount | % to Total | Payment Terms | Unit Price | Payment Terms | |||||||||||||||||||||||
| The Company | ASE (Shanghai) Inc. | Subsidiary | Purchases | $ | 2,033,164 | 8 | Net 60 days from the end | $ | - | - | $ | (615,718 | ) | (8 | ) | Note | ||||||||||||
| of the month of when | ||||||||||||||||||||||||||||
| invoice is issued | ||||||||||||||||||||||||||||
| ASE Electronics Inc. | Subsidiary | Purchases | 2,657,642 | 10 | Net 60 days from the end | - | - | (605,628 | ) | (7 | ) | Note | ||||||||||||||||
| of the month of when | ||||||||||||||||||||||||||||
| invoice is issued | ||||||||||||||||||||||||||||
| ISE Labs, Inc. | Subsidiary | Sales | (130,681 | ) | - | Net 45 days from invoice | - | - | 13,192 | - | Note | |||||||||||||||||
| date | ||||||||||||||||||||||||||||
| Universal Scientific | Subsidiary | Sales | (8,907,167 | ) | (9 | ) | Net 60 days from the end | - | - | 4,994,846 | 23 | Note | ||||||||||||||||
| Industrial Co., Ltd. | of the month of when | |||||||||||||||||||||||||||
| invoice is issued | ||||||||||||||||||||||||||||
| ASE Japan Co., Ltd. | Subsidiary | Sales | (172,358 | ) | - | Net 60 days from the end | - | - | 31,286 | - | Note | |||||||||||||||||
| of the month of when | ||||||||||||||||||||||||||||
| invoice is issued | ||||||||||||||||||||||||||||
-69-
TABLE 7
ADVANCED SEMICONDUCTOR ENGINEERING, INC.
RECEIVABLES FROM RELATED PARTIES AMOUNTING TO AT LEAST NT$100 MILLION OR 20% OF THE PAID-IN CAPITAL
DECEMBER 31, 2014
(Amounts In Thousands of New Taiwan Dollars)
| Turnover | Overdue | Amounts Received | Allowance for | ||||||||||||||||||
| Company Name | Related Party | Relationships | Ending Balance | Rate | Amount | Actions Taken | in Subsequent Period | Bad Debts | |||||||||||||
| The Company | Universal Scientific Industrial Co., Ltd. | Subsidiary | $ | 4,994,846 | 2 | $ | 203,068 | Continued collection | $ | 3,485,786 | $ | - | |||||||||
-70-
TABLE 8
ADVANCED SEMICONDUCTOR ENGINEERING, INC.
NAMES, LOCATIONS, AND RELATED INFORMATION OF INVESTEES OVER WHICH THE COMPANY EXERCISES SIGNIFICANT INFLUENCE
FOR THE YEAR ENDED DECEMBER 31, 2014
(Amounts In Thousands of New Taiwan Dollars, Unless Specified Otherwise)
| Original Investment Amount | Balance as of December 31, 2014 | Net Income | Share of Profits/Losses | |||||||||||||||||||||||||
| Investor Company | Investee Company | Location | Main Businesses and Products | December 31, 2014 | December 31, 2013 | Shares | Percentage of Ownership | Carrying Value | (Losses) of the Investee | of Investee | Note | |||||||||||||||||
| The Company | A.S.E. Holding Limited | Bermuda | Investment activities | US$ | 283,966 thousand | US$ | 283,966 thousand | 243,966 | 100 | $ | 14,367,500 | $ | 633,375 | $ | 621,744 | Subsidiary | ||||||||||||
| J & R Holding Limited | Bermuda | Investment activities | US$ | 479,693 thousand | US$ | 479,693 thousand | 435,128 | 100 | 45,150,552 | 2,304,535 | 2,129,949 | Subsidiary | ||||||||||||||||
| ASE Marketing & Service Japan Co., Ltd. | Japan | Engaged in marketing and sales services | JPY | 60,000 thousand | JPY | 60,000 thousand | 1,200 | 100 | 24,972 | 1,316 | 1,316 | Subsidiary | ||||||||||||||||
| Omniquest Industrial Limited | British Virgin Islands | Investment activities | US$ | 250,504 thousand | US$ | 250,504 thousand | 250,504,067 | 71 | 11,044,272 | 736,363 | 509,186 | Subsidiary | ||||||||||||||||
| Innosource Limited | British Virgin Islands | Investment activities | US$ | 86,000 thousand | US$ | 86,000 thousand | 86,000,000 | 100 | 3,965,686 | 163,878 | 160,657 | Subsidiary | ||||||||||||||||
| HCK | Taiwan | Engaged in the leasing of real estate properties | $ | 390,470 | $ | 390,470 | 35,497,273 | 27 | 342,138 | (40,338 | ) | (11,016 | ) | Associate | ||||||||||||||
| HC | Taiwan | Engaged in the development, construction and | 2,845,913 | 2,845,913 | 68,629,782 | 26 | 1,351,400 | 884,976 | 6,159 | Associate | ||||||||||||||||||
| leasing of real estate properties | ||||||||||||||||||||||||||||
| USI | Taiwan | Engaged in the manufacturing, processing and | 21,356,967 | 21,356,967 | 1,625,015,916 | 99 | 36,711,064 | 3,005,865 | 2,363,353 | Subsidiary | ||||||||||||||||||
| sale of computers, computer peripherals | ||||||||||||||||||||||||||||
| and related accessories | ||||||||||||||||||||||||||||
| ASE Test, Inc. | Taiwan | Engaged in the testing of semiconductors | 20,698,867 | 20,698,867 | 851,997,366 | 100 | 26,941,503 | 3,074,899 | 3,060,691 | Subsidiary | ||||||||||||||||||
| Luchu Development Corporation | Taiwan | Engaged in the development of real estate properties | 1,366,238 | 1,366,238 | 131,961,457 | 67 | 1,315,326 | (1,929 | ) | (1,294 | ) | Subsidiary | ||||||||||||||||
| AMPI | Taiwan | Engaged in integrated circuit | 178,861 | - | 33,308,452 | 18 | 99,052 | (361,860 | ) | (103,869 | ) | Associate | ||||||||||||||||
| StarChips Technology Inc. | Taiwan | Engaged in manufacturing, product desing, intellectual property | - | 84,000 | - | - | - | - | - | Transfer to | ||||||||||||||||||
| and global transaction | Available-for | |||||||||||||||||||||||||||
-71-
THE CONTENTS OF STATEMENTS OF MAJOR
ACCOUNTING ITEMS
| ITEM | STATEMENT INDEX | |
| MAJOR ACCOUNTING ITEMS IN ASSETS, LIABILITIES AND EQUITY | ||
| STATEMENT OF CASH | 1 | |
| STATEMENT OF FINANCIAL ASSETS AT FAIR VALUE THROUGH PROFIT OR LOSS - CURRENT | Note 7 | |
| STATEMENT OF TRADE RECEIVABLES, NET | 2 | |
| STATEMENT OF OTHER RECEIVABLES | 3 | |
| STATEMENT OF INVENTORIES | 4 | |
| STATEMENT OF CHANGES IN INVESTMENTS ACCOUNTED FOR USING THE EQUITY METHOD | 5 | |
| STATEMENT OF CHANGES IN PROPERTY, PLANT AND EQUIPMENT | Note 12 | |
| STATEMENT OF CHANGES IN ACCUMULATED DEPRECIATION AND ACCUMULATED IMPAIRMENT OF PROPERTY, PLANT AND EQUIPMENT | Note 12 | |
| STATEMENT OF CHANGES IN INTANGIBLE ASSETS | Note 13 | |
| STATEMENT OF DEFERRED INCOME TAX ASSETS | Note 20 | |
| STATEMENT OF SHORT-TERM BORROWINGS | 6 | |
| STATEMENT OF LONG-TERM BORROWINGS | 7 | |
| STATEMENT OF FINANCIAL LIABILITIES AT FAIR VALUE THROUGH PROFIT OR LOSS - CURRENT | Note 7 | |
| STATEMENT OF TRADE PAYABLES | 8 | |
| STATEMENT OF OTHER PAYABLES | Note 16, Table 1 | |
| STATEMENT OF BONDS PAYABLE | Note 15 | |
| MAJOR ACCOUNTING ITEMS IN PROFIT OR LOSS | ||
| STATEMENT OF OPERATING REVENUE | 9 | |
| STATEMENT OF OPERATING COSTS | 10 | |
| STATEMENT OF OPERATING EXPENSES | 11 | |
| STATEMENT OF OTHER INCOME AND EXPENSES, NET | Note 19 | |
| STATEMENT OF FINANCE COSTS | Note 19 | |
STATEMENT OF LABOR, DEPRECIATION AND
AMORTIZATION BY FUNCTION
| Note 19 |
-72-
STATEMENT 1
ADVANCED SEMICONDUCTOR ENGINEERING, INC.
STATEMENT OF CASH
DECEMBER 31, 2014
(In Thousands of New Taiwan Dollars, Unless Specified Otherwise)
| Item | Description | Amount | ||
| Cash on hand | Including US$10 thousand @31.65, JPY18 thousand @0.2646, HKD1 thousand @4.08, CNY4 thousand @5.1724 and NT$1,393 thousand | $ 1,739 | ||
| Cash in banks | ||||
| Checking accounts and demand deposits | 3,616,452 | |||
| Foreign currency deposits | Including US$223,765 thousand @31.65, JPY1,352,503 thousand @0.2646 and EUR5,102 thousand @38.47 | 7,636,326
| ||
| $ 11,254,517 |
-73-
STATEMENT 2
ADVANCED SEMICONDUCTOR ENGINEERING, INC.
STATEMENT OF TRADE RECEIVABLES, NET
DECEMBER 31, 2014
(In Thousands of New Taiwan Dollars)
| Client Name | Amount | Amount Overdue Over 1 Year | ||||||
| Non-Related Parties | ||||||||
| Company A | $ | 1,566,008 | $ | 5,368 | ||||
| Company B | 1,770,368 | — | ||||||
| Company C | 1,123,332 | — | ||||||
| Others (Note) | 12,037,727 | 4,503 | ||||||
| 16,497,435 | $ | 9,871 | ||||||
| Less: Allowance for doubtful accounts | 23,931 | |||||||
| 16,473,504 | ||||||||
| Related Parties | ||||||||
| USI | 4,994,846 | |||||||
| Others (Note) | 87,577 | |||||||
| 5,082,423 | ||||||||
| $ | 21,555,927 | |||||||
Note: The amount for each individual included in others does not exceed 5% of the account balance.
-74-
STATEMENT 3
ADVANCED SEMICONDUCTOR ENGINEERING, INC.
STATEMENT OF OTHER RECEIVABLES
DECEMBER 31, 2014
(In Thousands of New Taiwan Dollars)
| Item | Amount | Remark | ||||
| Non-Related Parties | ||||||
| Turnkey transaction | $ | 1,265,351 | Mainly from turnkey services. | |||
| Others (Note) | 148,656 | |||||
| Related Parties | 36,699 | |||||
| $ | 1,450,706 | |||||
| Note: | The amount for each individual included in others does not exceed 5% of the account balance. |
-75-
STATEMENT 4
ADVANCED SEMICONDUCTOR ENGINEERING, INC.
DECEMBER 31, 2014
STATEMENT OF INVENTORIES
(In Thousands of New Taiwan Dollars)
| Amount | ||||||||
Item
| Cost
| Net Realizable
Value
| ||||||
| Raw materials | $ | 3,467,274 | $ | 3,459,238 | ||||
| Supplies | 316,515 | 315,209 | ||||||
| Work in process | 209,411 | 335,861 | ||||||
| Finished goods | 245,301 | 436,799 | ||||||
| Materials and supplies in transit | 85,167 | 85,167 | ||||||
| $ | 4,323,668 | $ | 4,632,274 | |||||
-76-
STATEMENT 5
ADVANCED SEMICONDUCTOR ENGINEERING, INC.
STATEMENT OF CHANGES IN INVESTMENTS ACCOUNTED FOR USING THE EQUITY METHOD
FOR THE YEAR ENDED DECEMBER 31, 2014
(In Thousands of New Taiwan Dollars, Unless Specified Otherwise)
Balance at January 1, 2014
| Additions (Note 1)
| Decrease (Note 1)
| Balance at December 31, 2014
| Fair Value or Net Assets Value (Note 2) | ||||||||||||||||||||||||||||||||||||||||||||
| Investees | Shares | Amount | Shares | Amount | Shares | Amount | Shares | % | Amount | Unit Price | Total Amount | Collateral | ||||||||||||||||||||||||||||||||||||
| Ordinary Shares | ||||||||||||||||||||||||||||||||||||||||||||||||
| Quoted shares | ||||||||||||||||||||||||||||||||||||||||||||||||
| HC | 68,629,782 | $ | 1,163,196 | — | $ | 188,204 | — | $ | — | 68,629,782 | 26.2 | $ | 1,351,400 | $ | 20.8 | $ | 1,427,499 | Nil | ||||||||||||||||||||||||||||||
| Unquoted shares | ||||||||||||||||||||||||||||||||||||||||||||||||
| J&R Holding | 435,128 | 41,497,251 | — | 3,653,301 | — | — | 435,128 | 100.0 | 45,150,552 | 109,426.7 | 47,614,609 | Nil | ||||||||||||||||||||||||||||||||||||
| USI | 1,422,457,910 | 25,877,089 | 202,558,006 | 10,833,975 | — | — | 1,625,015,916 | 99.2 | 36,711,064 | 21.7 | 35,267,918 | Nil | ||||||||||||||||||||||||||||||||||||
| ASE Test, Inc. | 585,565,200 | 23,429,925 | 266,432,166 | 3,511,578 | — | — | 851,997,366 | 100.0 | 26,941,503 | 32.0 | 27,263,995 | Nil | ||||||||||||||||||||||||||||||||||||
| ASE Holding | 243,966 | 12,969,126 | — | 1,398,374 | — | — | 243,966 | 100.0 | 14,367,500 | 59,993.7 | 14,636,439 | Nil | ||||||||||||||||||||||||||||||||||||
| Omniquest | 250,504,067 | 10,003,686 | — | 1,040,586 | — | — | 250,504,067 | 70.6 | 11,044,272 | 45.4 | 11,367,670 | Nil | ||||||||||||||||||||||||||||||||||||
| Innosource | 86,000,000 | 3,635,314 | — | 330,372 | — | — | 86,000,000 | 100.0 | 3,965,686 | 46.2 | 3,969,201 | Nil | ||||||||||||||||||||||||||||||||||||
| Luchu | 131,961,457 | 1,316,917 | — | — | — | 1,294 | 131,961,457 | 67.1 | 1,315,623 | 10.0 | 1,315,623 | Nil | ||||||||||||||||||||||||||||||||||||
| HCK | 39,047,000 | 353,154 | — | — | 3,549,727 | 11,016 | 35,497,273 | 27.3 | 342,138 | 9.6 | 342,138 | Nil | ||||||||||||||||||||||||||||||||||||
| ASE MS Japan | 1,200 | 25,316 | — | — | — | 344 | 1,200 | 100.0 | 24,972 | 20,810.1 | 24,972 | Nil | ||||||||||||||||||||||||||||||||||||
| StarChips | 2,000,000 | 47,856 | — | — | 2,000,000 | 47,856 | — | — | — | — | — | Nil | ||||||||||||||||||||||||||||||||||||
| AMPI | — | — | 33,308,452 | 100,000 | — | 948 | 33,308,452 | 18.2 | 99,052 | 5.6 | 184,862 | Nil | ||||||||||||||||||||||||||||||||||||
| 120,318,830 | 21,056,390 | 61,458 | 141,313,762 | $ | 143,414,926 | |||||||||||||||||||||||||||||||||||||||||||
| Less: Deferred gain on transfer of land | 300,149 | — | — | 300,149 | ||||||||||||||||||||||||||||||||||||||||||||
| Reclassified from investments accounted for using the equity method to treasury shares | 1,959,107 | — | — | 1,959,107 | ||||||||||||||||||||||||||||||||||||||||||||
| Accumulated Impairment - | 47,856 | — | 47,856 | — | ||||||||||||||||||||||||||||||||||||||||||||
| StarChips | ||||||||||||||||||||||||||||||||||||||||||||||||
| $ | 118,011,718 | $ | 21,056,390 | $ | 13,602 | $ | 139,054,506 | |||||||||||||||||||||||||||||||||||||||||
Note 1: The aforementioned changes included share of profit or loss, other comprehensive income and cash dividends received from subsidiaries and associates.
Note 2: Fair value represented the closing prices of ordinary shares as of the balance sheet date; net assets value was based on the investees’ financial statements and the Company’s shareholdings.
-77-
STATEMENT 6
ADVANCED SEMICONDUCTOR ENGINEERING, INC.
STATEMENT OF SHORT-TERM BORROWINGS
DECEMBER 31, 2014
(In Thousands of New Taiwan Dollars, Unless Specified Otherwise)
| Type | Balance at December 31, 2014 | Contract Period | Range of
Interest Rates (%)
| Loan Commitments | Collateral | |||||||||
| Unsecured revolving bank loans | ||||||||||||||
| CITI Bank | $ | 4,098,675 | 2014.12-2015.01 | 0.84 | US$ 130,000 | Nil | ||||||||
| Mizuho Bank, Ltd. | 2,900,000 | 2014.12-2015.01 | 0.98 | US$ 150,000 | Nil | |||||||||
| Bank of America | 1,819,200 | 2014.09-2015.03 | 0.83-1.10 | US$ 100,000 | Nil | |||||||||
| SMBC Bank | 1,020,516 | 2014.12-2015.01 | 0.82-0.84 | US$ 80,000 | Nil | |||||||||
| HSBC Bank | 580,000 | 2014.09-2015.01 | 0.98 | US$ 50,000 | Nil | |||||||||
| Taiwan Bank | 474,750 | 2014.12-2015.03 | 0.82 | US$ 20,000 | Nil | |||||||||
| Mega Bank | 443,100 | 2014.12-2015.06 | 0.85 | US$ 65,000 | Nil | |||||||||
| China Construction | 300,000 | 2014.12-2015.01 | 0.86 | US$ 10,000 | Nil | |||||||||
| Bank | ||||||||||||||
| $ | 11,636,241 | |||||||||||||
-78-
STATEMENT 7
ADVANCED SEMICONDUCTOR ENGINEERING, INC.
STATEMENT OF LONG-TERM BORROWINGS
DECEMBER 31, 2014
(In Thousands of New Taiwan Dollars, Unless Specified Otherwise)
| Annual Interest | Balance at December 31, 2014 | |||||||||||||||||||||
| Creditor Bank | Amount, Contract Period and Reimbursements | Rate (%) | Current Portion | Non-current Portion | Total | Collateral | ||||||||||||||||
| Syndicated Bank Loan | ||||||||||||||||||||||
| Taiwan Bank | US$255,000 thousand and repayable in equal semiannually through July 2018. | 1.41 | $ | — | $ | 8,070,750 | $ | 8,070,750 | Nil | |||||||||||||
| CITI Bank | US$34,286 thousand and repayable in equal semiannually through June 2015. | 0.90 | 1,085,143 | — | 1,085,143 | Nil | ||||||||||||||||
| Working capital bank loans | ||||||||||||||||||||||
| Standard Chartered Bank | Repayable at maturity in December 2016. | 1.16 | — | 2,500,000 | 2,500,000 | Nil | ||||||||||||||||
| CTBC Bank | Repayable in equal quarterly from July 2016 to July 2018. | 1.28 | — | 1,500,000 | 1,500,000 | Nil | ||||||||||||||||
| CTBC Bank | Repayable in equal quarterly from August 2017 to August 2019. | 1.28 | — | 1,500,000 | 1,500,000 | Nil | ||||||||||||||||
| Bank of Nova Scotia | US$36,000 thousand and repayable at maturity in January 2016. | 1.03 | — | 1,139,400 | 1,139,400 | Nil | ||||||||||||||||
| HSBC Bank | US$34,000 thousand and repayable at maturity in November 2016. | 1.10 | — | 1,076,100 | 1,076,100 | Nil | ||||||||||||||||
| Industrial Bank of Taiwan | Repayable in equal quarterly from August 2017 to August 2019. | 1.27 | — | 1,000,000 | 1,000,000 | Nil | ||||||||||||||||
| HSBC Bank | Repayable at maturity in November 2016. | 1.16 | — | 800,000 | 800,000 | Nil | ||||||||||||||||
| ANZ Bank | Repayable at maturity in August 2016. | 1.16 | — | 500,000 | 500,000 | Nil | ||||||||||||||||
| Metrobank | Repayable at maturity in June 2016. | 1.15 | — | 300,000 | 300,000 | Nil | ||||||||||||||||
| 1,085,143 | 18,386,250 | 19,471,393 | ||||||||||||||||||||
| Less: Unamortized arrangement fee | — | 30,696 | 30,696 | |||||||||||||||||||
| $ | 1,085,143 | $ | 18,355,554 | $ | 19,440,697 | |||||||||||||||||
-79-
STATEMENT 8
ADVANCED SEMICONDUCTOR ENGINEERING, INC.
STATEMENT OF TRADE PAYABLES
DECEMBER 31, 2014
(In Thousands of New Taiwan Dollars)
| Vendor Name | Amount | |||
| Non – Related Party | ||||
| NAN YA PRINTED CIRCUIT BOARD CORPORATION | $ | 804,961 | ||
| KINSUS INTERCONNECT TECHNOLOGY CORP. | 500,131 | |||
| UNIMICRON TECHNOLOGY CORP. | 449,402 | |||
| Others (Note) | 5,211,269 | |||
| 6,965,763 | ||||
| Related Party | ||||
| ASE (Shanghai) Inc. | 615,718 | |||
| ASE Electronics Inc. | 605,629 | |||
| Others (Note) | 2,403 | |||
| 1,223,750 | ||||
| $ | 8,189,513 | |||
Note: The amount for each individual in others does not exceed 5% of the account balance.
-80-
STATEMENT 9
ADVANCED SEMICONDUCTOR ENGINEERING, INC.
STATEMENT OF OPERATING REVENUE
FOR THE YEAR ENDED DECEMBER 31, 2014
(In Thousands of New Taiwan Dollars)
Item
| Quantity
(In Thousands)
| Amount
| ||||||
| Advanced Substrate or Integrated Circuit Leadframes (QFP、Flip Chip、BGA…, etc.) | 13,750,911 | $ | 72,880,495 | |||||
| Others (Note) | 4,030,676 | 23,797,605 | ||||||
| $ | 96,678,100 | |||||||
Note: The amount for each individual in others does not exceed 10% of the transaction amount.
-81-
STATEMENT 10
ADVANCED SEMICONDUCTOR ENGINEERING, INC.
STATEMENT OF OPERATING COSTS
FOR THE YEAR ENDED DECEMBER 31, 2014
(In Thousands of New Taiwan Dollars)
| Item | Amount | |||
| Raw materials used | ||||
| Balance, beginning of year | $ | 2,997,252 | ||
| Raw material purchased | 26,541,178 | |||
| Less: Others | 517,887 | |||
| Raw materials, end of year | 3,467,274 | |||
| Transferred to manufacturing or operating expenses | 25,553,269 | |||
| Direct labor | 9,103,321 | |||
| Manufacturing expenses | 32,346,695 | |||
| Manufacturing cost | 67,003,285 | |||
| Add: Work in process, beginning of year | 126,423 | |||
| Others | 19,389 | |||
| Less: Work in process, end of year | 209,411 | |||
| Cost of finished goods | 66,939,686 | |||
| Add: Finished goods, beginning of year | 218,026 | |||
| Less: Finished goods, end of year | 245,301 | |||
| Others | 43,784 | |||
| 66,868,627 | ||||
| Others | 448,307 | |||
| $ | 67,316,934 | |||
-82-
STATEMENT 11
ADVANCED SEMICONDUCTOR ENGINEERING, INC.
STATEMENT OF OPERATING EXPENSES
FOR THE YEAR ENDED DECEMBER 31, 2014
(In Thousands of New Taiwan Dollars)
| Item | Selling and Marketing Expenses | General and Administrative Expenses | Research and Development Expenses | Total | ||||||||||||
| Payroll | $ | 86,871 | $ | 2,595,137 | $ | 3,157,485 | $ | 5,839,493 | ||||||||
| Sales service charge | 920,480 | — | — | 920,480 | ||||||||||||
| Depreciation | 638 | 163,591 | 678,865 | 843,094 | ||||||||||||
| Repair, maintenance and factory supplies | 78 | 128,000 | 304,052 | 432,130 | ||||||||||||
| Consumption-Tri Run and indirect material | 52 | 39,127 | 386,104 | 425,283 | ||||||||||||
| Professional service fee | 13 | 274,088 | 101,985 | 376,086 | ||||||||||||
| Employee insurance | 5,155 | 137,261 | 226,689 | 369,105 | ||||||||||||
| Pension | 2,851 | 96,751 | 125,650 | 225,252 | ||||||||||||
| Amortization | 109 | 58,476 | 28,805 | 87,390 | ||||||||||||
| Others | 93,869 | 1,029,596 | 463,330 | 1,586,795 | ||||||||||||
| $ | 1,110,116 | $ | 4,522,027 | $ | 5,472,965 | $ | 11,105,108 | |||||||||
-83-
Appendix 6
Advanced Semiconductor Engineering, Inc.
2015 Individual Financial Statements and Auditor Report
Advanced Semiconductor Engineering, Inc.
Parent Company Only Financial Statements for the
Years Ended December 31, 2015 and 2014 and
Independent Auditors’ Report
INDEPENDENT AUDITORS’ REPORT
The Board of Directors and Shareholders
Advanced Semiconductor Engineering, Inc.
We have audited the accompanying balance sheets of Advanced Semiconductor Engineering, Inc. (the “Company”) as of December 31, 2015, December 31, 2014 and January 1, 2014, and the related statements of comprehensive income, changes in equity and cash flows for the years ended December 31, 2015 and 2014. These financial statements are the responsibility of the Company’s management. Our responsibility is to express an opinion on these financial statements based on our audits. The financial statements of Siliconware Precision Industries Co., Ltd. (“SPIL”) as of December 31, 2015 and for the year then ended were audited by other auditors whose report has been furnished to us, and our opinion, insofar as it relates to the amounts and information disclosed, is based on the report of the other auditors. The accompanying financial statements of the Company include its investments accounted for using the equity method in SPIL of NT$35,423,058 thousand, which was 12% of the Company’s total assets, as of December 31, 2015, and its share of the profit of SPIL of NT$410,937 thousand, which was 2% of the Company’s profit before income tax for the year ended December 31, 2015.
We conducted our audits in accordance with the Regulations Governing Auditing and Attestation of Financial Statements by Certified Public Accountants and auditing standards generally accepted in the Republic of China. Those regulations and standards require that we plan and perform the audit to obtain reasonable assurance about whether the financial statements are free of material misstatement. An audit includes examining, on a test basis, evidence supporting the amounts and disclosures in the financial statements. An audit also includes assessing the accounting principles used and significant estimates made by management, as well as evaluating the overall financial statement presentation. We believe that our audits and the report of the other auditors provide a reasonable basis for our opinion.
In our opinion, based on our audits and the report of the other auditors, such financial statements referred to above present fairly, in all material respects, the financial position of the Company as of December 31, 2015, December 31, 2014 and January 1, 2014, and the results of operations and cash flows for the years ended December 31, 2015 and 2014, in conformity with the Regulations Governing the Preparation of Financial Reports by Securities Issuers.
As discussed in Note 3 to the financial statements, the Company has applied the amendments to the Regulations Governing the Preparation of Financial Reports by Securities Issuers and the 2013 version of the International Financial Reporting Standards (IFRS), International Accounting Standards (IAS), Interpretations of IFRS (IFRIC) and Interpretations of IAS (SIC) endorsed by the Financial Supervisory Commission of the Republic of China from January 1, 2015. Therefore, the Company retrospectively applied the aforementioned regulations, standards and interpretations and adjusted the affected items in the financial statements of the preceding periods.
-1-
The statements of major accounting items listed in the parent company only financial statements of the Company as of and for the year ended December 31, 2015 are presented for the purpose of additional analysis. Such statements have been subjected to the auditing procedures applied in our audits of the financial statements mentioned above. In our opinion, such statements are consistent in all material respects in relation to the financial statements as a whole.
March 16, 2016
Notice to Readers
The accompanying financial statements are intended only to present the financial position, results of operations and cash flows in accordance with accounting principles and practices generally accepted in the Republic of China and not those of any other jurisdictions. The standards, procedures and practices to audit such financial statements are those generally accepted and applied in the Republic of China.
For the convenience of readers, the independent auditors’ report and the accompanying financial statements have been translated into English from the original Chinese version prepared and used in the Republic of China. If there is any conflict between the English version and the original Chinese version or any difference in the interpretation of the two versions, the Chinese-language independent auditors’ report and financial statements shall prevail.
-2-
ADVANCED SEMICONDUCTOR ENGINEERING, INC.
PARENT COMPANY ONLY BALANCE SHEETS
(In Thousands of New Taiwan Dollars)
| December 31, 2015 | December 31, 2014 (Adjusted) | January 1, 2014 (Adjusted) | ||||||||||||||||||||||
| ASSETS | NT$ | % | NT$ | % | NT$ | % | ||||||||||||||||||
| CURRENT ASSETS | ||||||||||||||||||||||||
| Cash (Notes 4 and 6) | $ | 8,533,346 | 3 | $ | 11,254,517 | 4 | $ | 14,959,268 | 7 | |||||||||||||||
| Financial assets at fair value through profit or loss - | ||||||||||||||||||||||||
| current (Notes 4, 5 and 7) | 1,503,196 | 1 | 1,990,183 | 1 | 302,273 | - | ||||||||||||||||||
| Available-for-sale financial assets - current (Notes 4 and | ||||||||||||||||||||||||
| 8) | - | - | 400,007 | - | 2,312,147 | 1 | ||||||||||||||||||
| Trade receivables, net (Notes 4 and 9) | 14,030,441 | 5 | 16,473,504 | 6 | 12,061,441 | 6 | ||||||||||||||||||
| Trade receivables from related parties (Note 27) | 2,281,805 | 1 | 5,082,423 | 2 | 2,418,651 | 1 | ||||||||||||||||||
| Other receivables (Note 4) | 1,367,621 | - | 1,414,007 | 1 | 962,907 | - | ||||||||||||||||||
| Other receivables from related parties (Note 27) | 161,080 | - | 36,699 | - | 46,202 | - | ||||||||||||||||||
| Inventories (Notes 4, 5 and 10) | 3,769,108 | 1 | 4,323,668 | 2 | 3,642,616 | 2 | ||||||||||||||||||
| Other current assets | 485,422 | - | 508,010 | - | 303,545 | - | ||||||||||||||||||
| Total current assets | 32,132,019 | 11 | 41,483,018 | 16 | 37,009,050 | 17 | ||||||||||||||||||
| NON-CURRENT ASSETS | ||||||||||||||||||||||||
| Available-for-sale financial assets - non-current (Notes 4 and 8) | 473,107 | - | 542,147 | - | 592,557 | - | ||||||||||||||||||
| Investments accounted for using the equity method (Notes 3, 4 and 11) | 189,994,170 | 62 | 139,053,527 | 53 | 117,942,583 | 53 | ||||||||||||||||||
| Property, plant and equipment (Notes 4, 12, 19, 23, 27 and 29) | 80,375,695 | 26 | 77,640,995 | 30 | 63,122,172 | 29 | ||||||||||||||||||
| Goodwill (Notes 4 and 5) | 958,620 | 1 | 958,620 | - | 958,620 | - | ||||||||||||||||||
| Other intangible assets (Notes 4, 5, 13 and 19) | 655,689 | - | 486,192 | - | 393,759 | - | ||||||||||||||||||
| Deferred tax assets (Notes 3, 4 and 20) | 906,821 | - | 1,019,802 | 1 | 1,020,588 | 1 | ||||||||||||||||||
| Other financial assets - non-current (Note 4) | 209,817 | - | 215,784 | - | 214,803 | - | ||||||||||||||||||
| Long-term prepayments for lease | 80,887 | - | 195,879 | - | 19,141 | - | ||||||||||||||||||
| Other non-current assets | 156,113 | - | 131,181 | - | 72,761 | - | ||||||||||||||||||
| Total non-current assets | 273,810,919 | 89 | 220,244,127 | 84 | 184,336,984 | 83 | ||||||||||||||||||
| TOTAL | $ | 305,942,938 | 100 | $ | 261,727,145 | 100 | $ | 221,346,034 | 100 | |||||||||||||||
(Continued)
-3-
ADVANCED SEMICONDUCTOR ENGINEERING, INC.
PARENT COMPANY ONLY BALANCE SHEETS
(In Thousands of New Taiwan Dollars)
| December 31, 2015 | December 31, 2014 (Adjusted) | January 1, 2014 (Adjusted) | ||||||||||||||||||||||
| LIABILITIES AND STOCKHOLDERS’ EQUITY | NT$ | % | NT$ | % | NT$ | % | ||||||||||||||||||
| CURRENT LIABILITIES | ||||||||||||||||||||||||
| Short-term borrowings (Note 14) | $ | 11,231,973 | 4 | $ | 11,636,241 | 4 | $ | 11,721,924 | 5 | |||||||||||||||
| Commercial papers and bank acceptances payable (Note14) | 4,348,054 | 1 | - | - | - | - | ||||||||||||||||||
| Financial liabilities at fair value through profit or loss - current (Notes 4, 5 and 7) | 2,669,605 | 1 | 2,540,418 | 1 | 1,793,652 | 1 | ||||||||||||||||||
| Trade payables | 6,801,383 | 2 | 6,965,763 | 3 | 6,239,588 | 3 | ||||||||||||||||||
| Trade payables to related parties (Note 27) | 910,211 | 1 | 1,223,750 | - | 1,074,901 | 1 | ||||||||||||||||||
| Other payables (Notes 16 and 17) | 10,565,591 | 3 | 12,352,075 | 5 | 7,941,207 | 4 | ||||||||||||||||||
| Other payables to related parties (Note 27) | 40,191,954 | 13 | 30,653,624 | 12 | 18,107,805 | 8 | ||||||||||||||||||
| Current tax liabilities (Notes 4 and 20) | 1,685,349 | 1 | 1,617,605 | 1 | 803,419 | - | ||||||||||||||||||
| Current portion of bonds payable (Notes 4 and 15) | 12,162,192 | 4 | - | - | - | - | ||||||||||||||||||
| Current portion of long-term borrowings (Note 14) | - | - | 1,085,143 | - | 1,028,571 | - | ||||||||||||||||||
| Other current liabilities | 738,805 | - | 493,126 | - | 448,069 | - | ||||||||||||||||||
| Total current liabilities | 91,305,117 | 30 | 68,567,745 | 26 | 49,159,136 | 22 | ||||||||||||||||||
| NON-CURRENT LIABILITIES | ||||||||||||||||||||||||
| Bonds payable (Notes 4 and 15) | 13,938,894 | 5 | 19,270,613 | 8 | 18,152,195 | 8 | ||||||||||||||||||
| Long-term borrowings (Note 14) | 37,424,607 | 12 | 18,355,554 | 7 | 25,787,145 | 12 | ||||||||||||||||||
| Deferred tax liabilities (Notes 4 and 20) | 3,774,152 | 1 | 2,897,155 | 1 | 1,892,418 | 1 | ||||||||||||||||||
| Long-term payables (Note 16) | - | - | - | - | 894,150 | - | ||||||||||||||||||
| Net defined benefit liabilities (Notes 3, 4, 5 and 17) | 2,287,072 | 1 | 2,415,654 | 1 | 2,496,350 | 1 | ||||||||||||||||||
| Other non-current liabilities | 297,092 | - | 1,517 | - | 19,783 | - | ||||||||||||||||||
| Total non-current liabilities | 57,721,817 | 19 | 42,940,493 | 17 | 49,242,041 | 22 | ||||||||||||||||||
| Total liabilities | 149,026,934 | 49 | 111,508,238 | 43 | 98,401,177 | 44 | ||||||||||||||||||
| EQUITY (Notes 3, 4 and 18) | ||||||||||||||||||||||||
| Share capital | ||||||||||||||||||||||||
| Ordinary shares | 79,029,290 | 26 | 78,525,378 | 30 | 77,560,040 | 35 | ||||||||||||||||||
| Capital received in advance | 156,370 | - | 189,801 | - | 620,218 | - | ||||||||||||||||||
| Total share capital | 79,185,660 | 26 | 78,715,179 | 30 | 78,180,258 | 35 | ||||||||||||||||||
| Capital surplus | 23,757,099 | 8 | 16,013,058 | 6 | 7,920,220 | 4 | ||||||||||||||||||
| Retained earnings | ||||||||||||||||||||||||
| Legal reserve | 12,649,145 | 4 | 10,289,878 | 4 | 8,720,971 | 4 | ||||||||||||||||||
| Special reserve | 3,353,938 | - | 3,353,938 | 1 | 3,663,930 | 2 | �� | |||||||||||||||||
| Unappropriated earnings | 40,180,986 | 13 | 38,737,422 | 15 | 26,521,201 | 12 | ||||||||||||||||||
| Total retained earnings | 56,184,069 | 17 | 52,381,238 | 20 | 38,906,102 | 18 | ||||||||||||||||||
| Other equity | 5,081,689 | 2 | 5,068,539 | 2 | (102,616 | ) | - | |||||||||||||||||
| Treasury shares | (7,292,513 | ) | (2 | ) | (1,959,107 | ) | (1 | ) | (1,959,107 | ) | (1 | ) | ||||||||||||
| Total equity | 156,916,004 | 51 | 150,218,907 | 57 | 122,944,857 | 56 | ||||||||||||||||||
| TOTAL | $ | 305,942,938 | 100 | $ | 261,727,145 | 100 | $ | 221,346,034 | 100 | |||||||||||||||
(Concluded)
The accompanying notes are an integral part of the financial statements.
(With Deloitte & Touche audit report dated March 16, 2016)
-4-
ADVANCED SEMICONDUCTOR ENGINEERING, INC.
PARENT COMPANY ONLY STATEMENTS OF COMPREHENSIVE INCOME
(In Thousands of New Taiwan Dollars, Except Earnings Per Share)
| For the Years Ended December 31 | ||||||||||||||||
| 2015 | 2014 (Adjusted) | |||||||||||||||
| NT$ | % | NT$ | % | |||||||||||||
| OPERATING REVENUE (Note 4) | $ | 94,206,807 | 100 | $ | 96,678,100 | 100 | ||||||||||
| OPERATING COSTS (Notes 3, 10, 17 and 19) | 69,059,001 | 73 | 67,301,431 | 70 | ||||||||||||
| GROSS PROFIT | 25,147,806 | 27 | 29,376,669 | 30 | ||||||||||||
| OPERATING EXPENSES (Notes 3, 17 and 19) | ||||||||||||||||
| Selling and marketing expenses | 1,100,826 | 1 | 1,110,054 | 1 | ||||||||||||
| General and administrative expenses | 4,788,073 | 5 | 4,517,187 | 5 | ||||||||||||
| Research and development expenses | 5,366,121 | 6 | 5,470,440 | 5 | ||||||||||||
| Total operating expenses | 11,255,020 | 12 | 11,097,681 | 11 | ||||||||||||
| PROFIT FROM OPERATIONS | 13,892,786 | 15 | 18,278,988 | 19 | ||||||||||||
| NON-OPERATING INCOME AND EXPENSES | ||||||||||||||||
| Other income (Note 19) | 451,354 | - | 114,369 | - | ||||||||||||
| Other gains, net (Note 19) | 722,437 | 1 | 8,043 | - | ||||||||||||
| Finance costs (Note 19) | (1,166,632 | ) | (1 | ) | (1,001,974 | ) | (1 | ) | ||||||||
| Share of the profit of subsidiaries, associates and joint ventures (Notes 3 and 4) | 8,533,407 | 9 | 8,761,700 | 9 | ||||||||||||
| Total non-operating income and expenses | 8,540,566 | 9 | 7,882,138 | 8 | ||||||||||||
| PROFIT BEFORE INCOME TAX | 22,433,352 | 24 | 26,161,126 | 27 | ||||||||||||
| INCOME TAX EXPENSE (Notes 3, 4, 5 and 20) | 2,954,479 | 3 | 2,524,604 | 2 | ||||||||||||
| PROFIT FOR THE YEAR | 19,478,873 | 21 | 23,636,522 | 25 | ||||||||||||
| OTHER COMPREHENSIVE INCOME (LOSS) | ||||||||||||||||
| Items that will not be reclassified subsequently to profit or loss: | ||||||||||||||||
| Remeasurement of defined benefits obligation | 39,710 | - | (27,602 | ) | - | |||||||||||
| Share of other comprehensive income of subsidiaries, associates and joint ventures | (119,176 | ) | - | 17,528 | - | |||||||||||
| Income tax relating to items that will not be reclassified subsequently | (6,751 | ) | - | 4,693 | - | |||||||||||
| (86,217 | ) | - | (5,381 | ) | - | |||||||||||
| Items that may be reclassified subsequently to profit or loss: | ||||||||||||||||
| Unrealized gain (loss) on available-for-sale financial assets | (36,166 | ) | - | 2,376 | - | |||||||||||
(Continued)
-5-
ADVANCED SEMICONDUCTOR ENGINEERING, INC.
PARENT COMPANY ONLY STATEMENTS OF COMPREHENSIVE INCOME
(In Thousands of New Taiwan Dollars, Except Earnings Per Share)
| For the Years Ended December 31 | ||||||||||||||||
| 2015 | 2014 (Adjusted) | |||||||||||||||
| NT$ | % | NT$ | % | |||||||||||||
| Share of other comprehensive income of subsidiaries, associates and joint ventures | $ | 49,316 | - | $ | 5,168,779 | 5 | ||||||||||
| 13,150 | - | 5,171,155 | 5 | |||||||||||||
| Other comprehensive income (loss) for the year, net of income tax | (73,067 | ) | - | 5,165,774 | 5 | |||||||||||
| TOTAL COMPREHENSIVE INCOME FOR THE YEAR | $ | 19,405,806 | 21 | $ | 28,802,296 | 30 | ||||||||||
| EARNINGS PER SHARE (Note 21) | ||||||||||||||||
| Basic | $ | 2.55 | $ | 3.07 | ||||||||||||
| Diluted | $ | 2.44 | $ | 2.96 | ||||||||||||
(Concluded)
The accompanying notes are an integral part of the financial statements.
(With Deloitte & Touche audit report dated March 16, 2016)
-6-
ADVANCED SEMICONDUCTOR ENGINEERING, INC.
PARENT COMPANY ONLY STATEMENTS OF CHANGES IN EQUITY
(In Thousands of New Taiwan Dollars)
| Other Equity | ||||||||||||||||||||||||||||||||||||||||||||||||||||
Exchange Differences | Unrealized Gain on | |||||||||||||||||||||||||||||||||||||||||||||||||||
| Share Capital | Retained Earnings | on | Available-for- | |||||||||||||||||||||||||||||||||||||||||||||||||
Shares (In Thousands) | Amount | Capital Surplus | Legal Reserve | Special Reserve | Unappropriated Earnings | Total | Translating Foreign Operations | sale Financial Assets | Cash Flow Hedges | Total | Treasury Shares | Total Equity | ||||||||||||||||||||||||||||||||||||||||
| BALANCE AT JANUARY 1, 2014 | 7,787,827 | $ | 78,180,258 | $ | 7,908,870 | $ | 8,720,971 | $ | 3,663,930 | $ | 26,608,253 | $ | 38,993,154 | $ | (525,521 | ) | $ | 426,246 | $ | (3,279 | ) | $ | (102,554 | ) | $ | (1,959,107 | ) | $ | 123,020,621 | |||||||||||||||||||||||
| Effect of retrospective application | - | - | 11,350 | - | - | (87,052 | ) | (87,052 | ) | (62 | ) | - | - | (62 | ) | - | (75,764 | ) | ||||||||||||||||||||||||||||||||||
| ADJUSTED BALANCE AT JANUARY 1, 2014 | 7,787,827 | 78,180,258 | 7,920,220 | 8,720,971 | 3,663,930 | 26,521,201 | 38,906,102 | (525,583 | ) | 426,246 | (3,279 | ) | (102,616 | ) | (1,959,107 | ) | 122,944,857 | |||||||||||||||||||||||||||||||||||
| Change in capital surplus from investments in associates accounted for using the equity method | - | - | 26,884 | - | - | - | - | - | - | - | - | - | 26,884 | |||||||||||||||||||||||||||||||||||||||
| Profit for the year ended December 31, 2014 (After Adjusted) | - | - | - | - | - | 23,636,522 | 23,636,522 | - | - | - | - | - | 23,636,522 | |||||||||||||||||||||||||||||||||||||||
| Other comprehensive income (loss) for the year ended December 31, 2014, net of income tax (After Adjusted) | - | - | - | - | - | (5,381 | ) | (5,381 | ) | 5,067,344 | 100,532 | 3,279 | 5,171,155 | - | 5,165,774 | |||||||||||||||||||||||||||||||||||||
| Total comprehensive income for the year ended December 31, 2014 (After Adjusted) | - | - | - | - | - | 23,631,141 | 23,631,141 | 5,067,344 | 100,532 | 3,279 | 5,171,155 | - | 28,802,296 | |||||||||||||||||||||||||||||||||||||||
| Appropriation of 2013 earnings | ||||||||||||||||||||||||||||||||||||||||||||||||||||
| Legal reserve | - | - | - | 1,568,907 | - | (1,568,907 | ) | - | - | - | - | - | - | - | ||||||||||||||||||||||||||||||||||||||
| Cash dividends distributed by the Company | - | - | - | - | - | (10,156,005 | ) | (10,156,005 | ) | - | - | - | - | - | (10,156,005 | ) | ||||||||||||||||||||||||||||||||||||
| Special reserve | - | - | - | - | (309,992 | ) | 309,992 | - | - | - | - | - | - | - | ||||||||||||||||||||||||||||||||||||||
| - | - | - | 1,568,907 | (309,992 | ) | (11,414,920 | ) | (10,156,005 | ) | - | - | - | - | - | (10,156,005 | ) | ||||||||||||||||||||||||||||||||||||
| Issue of dividends received by subsidiaries from the Company | - | - | 188,790 | - | - | - | - | - | - | - | - | - | 188,790 | |||||||||||||||||||||||||||||||||||||||
| Partial disposal of interests in subsidiaries and additional acquisition of majority-owned subsidiaries | - | - | 6,877,099 | - | - | - | - | - | - | - | - | - | 6,877,099 | |||||||||||||||||||||||||||||||||||||||
| Issue of ordinary shares under employee share options | 73,898 | 534,921 | 1,000,065 | - | - | - | - | - | - | - | - | - | 1,534,986 | |||||||||||||||||||||||||||||||||||||||
| ADJUSTED BALANCE AT DECEMBER 31, 2014 | 7,861,725 | 78,715,179 | 16,013,058 | 10,289,878 | 3,353,938 | 38,737,422 | 52,381,238 | 4,541,761 | 526,778 | - | 5,068,539 | (1,959,107 | ) | 150,218,907 | ||||||||||||||||||||||||||||||||||||||
| Equity component of convertible bonds issued by the Company (Note 18) | - | - | 214,022 | - | - | - | - | - | - | - | - | - | 214,022 | |||||||||||||||||||||||||||||||||||||||
| Change in capital surplus from investments in associates and joint ventures accounted for using the equity method | - | - | 150 | - | - | - | - | - | - | - | - | - | 150 | |||||||||||||||||||||||||||||||||||||||
| Profit for the year ended December 31, 2015 | - | - | - | - | - | 19,478,873 | 19, 478,873 | - | - | - | - | - | 19,478,873 | |||||||||||||||||||||||||||||||||||||||
| Other comprehensive income (loss) for the year ended December 31, 2015, net of income tax | - | - | - | - | - | (86,217 | ) | (86,217 | ) | (48,191 | ) | 61,341 | - | 13,150 | - | (73,067 | ) | |||||||||||||||||||||||||||||||||||
| Total comprehensive income (loss) for the year ended December 31, 2015 | - | - | - | - | - | 19,392,656 | 19,392,656 | (48,191 | ) | 61,341 | - | 13,150 | - | 19,405,806 | ||||||||||||||||||||||||||||||||||||||
| Appropriation of 2014 earnings | ||||||||||||||||||||||||||||||||||||||||||||||||||||
| Legal reserve | - | - | - | 2,359,267 | (2,359,267 | ) | - | - | - | - | - | - | - | |||||||||||||||||||||||||||||||||||||||
| Cash dividends distributed by the Company | - | - | - | - | - | (15,589,825 | ) | (15,589,825 | ) | - | - | - | - | - | (15,589,825 | ) | ||||||||||||||||||||||||||||||||||||
| - | - | - | 2,359,267 | (17,949,092 | ) | (15,589,825 | ) | - | - | - | - | - | (15,589,825 | ) | ||||||||||||||||||||||||||||||||||||||
| Acquisition of treasury shares | - | - | - | - | - | - | - | - | - | - | - | (5,333,406 | ) | (5,333,406 | ) | |||||||||||||||||||||||||||||||||||||
| Issue of dividends received by subsidiaries from the Company | - | - | 292,351 | - | - | - | - | - | - | - | - | - | 292,351 | |||||||||||||||||||||||||||||||||||||||
| Partial disposal of interests in subsidiaries and additional acquisition of majority-owned subsidiaries (Note 11) | - | - | 7,197,510 | - | - | - | - | - | - | - | - | - | 7,197,510 | |||||||||||||||||||||||||||||||||||||||
| Changes in percentage of ownership interest in subsidiaries | (564,344 | ) | - | - | - | - | - | - | - | - | - | (564,344 | ) | |||||||||||||||||||||||||||||||||||||||
| Issue of ordinary shares under employee share options | 48,703 | 470,481 | 604,352 | - | - | - | - | - | - | - | - | - | 1,074,833 | |||||||||||||||||||||||||||||||||||||||
| BALANCE AT DECEMBER 31, 2015 | 7,910,428 | $ | 79,185,660 | $ | 23,757,099 | $ | 12,649,145 | $ | 3,353,938 | $ | 40,180,986 | $ | 56,184,069 | $ | 4,493,570 | $ | 588,119 | $ | - | $ | 5,081,689 | ($ | 7,292,513 | ) | $ | 156,916,004 | ||||||||||||||||||||||||||
The accompanying notes are an integral part of the financial statements.
(With Deloitte & Touche audit report dated March 16, 2016)
-7-
ADVANCED SEMICONDUCTOR ENGINEERING, INC.
PARENT COMPANY ONLY STATEMENTS OF CASH FLOWS
(In Thousands of New Taiwan Dollars)
For the Years Ended December 31 | ||||||||
| 2015 | 2014 (Adjusted) | |||||||
| NT$ | NT$ | |||||||
| CASH FLOWS FROM OPERATING ACTIVITIES | ||||||||
| Profit before income tax | $ | 22,433,352 | $ | 26,161,126 | ||||
| Adjustments for: | ||||||||
| Depreciation expense | 14,630,862 | 12,667,954 | ||||||
| Amortization expense | 139,065 | 109,809 | ||||||
| Net gain on fair value change of financial assets and liabilities at fair value through profit or loss | (2,089,130 | ) | (1,735,649 | ) | ||||
| Interest expenses | 1,136,748 | 992,542 | ||||||
| Compensation cost of employee share options | 89,768 | 82,408 | ||||||
| Share of profit of subsidiaries, associates and joint venture | (8,533,407 | ) | (8,761,700 | ) | ||||
| Impairment loss recognized on non-financial assets | 374,201 | 335,797 | ||||||
| Others | 1,014,001 | 1,414,695 | ||||||
| Changes in operating assets and liabilities | ||||||||
| Financial assets held for trading | 3,407,552 | 889,176 | ||||||
| Trade receivables | 2,443,202 | (4,412,063 | ) | |||||
| Trade receivables from related parties | 2,800,618 | (2,663,772 | ) | |||||
| Other receivables | 14,924 | (419,790 | ) | |||||
| Other receivables from related parties | (27,049 | ) | (2,856 | ) | ||||
| Inventories | 279,328 | (851,607 | ) | |||||
| Other current assets | (47,362 | ) | (230,071 | ) | ||||
| Financial liabilities held for trading | (1,047,740 | ) | (258,775 | ) | ||||
| Trade payables | (164,380 | ) | 726,175 | |||||
| Trade payables to related parties | (313,539 | ) | 148,849 | |||||
| Other payables | (1,239,689 | ) | 1,865,052 | |||||
| Other payables to related parties | 9,176 | 312,412 | ||||||
| Other current liabilities | 44,553 | 52,772 | ||||||
| Net defined benefit liabilities | (88,872 | ) | (108,298 | ) | ||||
| 35,266,182 | 26,314,186 | |||||||
| Dividend received | 456,044 | 87,030 | ||||||
| Interest paid | (709,474 | ) | (644,433 | ) | ||||
| Income tax paid | (1,903,810 | ) | (706,640 | ) | ||||
| Net cash generated from operating activities | 33,108,942 | 25,050,143 | ||||||
| CASH FLOWS FROM INVESTING ACTIVITIES | ||||||||
| Purchase of financial assets designated as at fair value through profit or loss | (22,059,285 | ) | (25,266,850 | ) | ||||
| Proceeds from disposal of financial assets designated as at fair value through profit or loss | 22,404,777 | 25,430,954 | ||||||
| Purchase of available-for-sale financial assets | (1,322 | ) | (1,941,283 | ) | ||||
| Proceeds on sale of available-for-sale financial assets | 433,165 | 3,809,325 | ||||||
| Acquisition of equity method investments | (35,673,097 | ) | (100,000 | ) | ||||
(Continued)
-8-
ADVANCED SEMICONDUCTOR ENGINEERING, INC.
PARENT COMPANY ONLY STATEMENTS OF CASH FLOWS
(In Thousands of New Taiwan Dollars)
For the Years Ended December 31 | ||||||||
| 2015 | 2014 (Adjusted) | |||||||
| NT$ | NT$ | |||||||
| Payments for property, plant and equipment | $ | (18,106,610 | ) | $ | (25,859,051 | ) | ||
| Proceeds from disposal of property, and plant equipment | 114,976 | 187,058 | ||||||
| Payments for intangible assets | (308,562 | ) | (202,242 | ) | ||||
| Other investing activities | (18,842 | ) | (282,825 | ) | ||||
| Net cash used in investing activities | (53,214,800 | ) | (24,224,914 | ) | ||||
| CASH FLOWS FROM FINANCING ACTIVITIES | ||||||||
| Net repayment of short-term borrowings | (404,268 | ) | (85,683 | ) | ||||
| Proceeds from commercial papers and bank acceptances payable | 4,347,406 | - | ||||||
| Proceeds from issue of convertible bonds | 6,136,425 | - | ||||||
| Proceeds from long-term borrowings | 36,638,397 | 28,718,192 | ||||||
| Repayments of long-term borrowings | (19,237,092 | ) | (36,739,806 | ) | ||||
| Increase in other payables to related parties | 9,431,152 | 12,273,225 | ||||||
| Dividends paid | (15,589,825 | ) | (10,156,005 | ) | ||||
| Payments for acquisition of treasury shares | (5,333,406 | ) | - | |||||
| Proceeds from exercise of employee share options | 1,003,789 | 1,458,088 | ||||||
| Other financing activities | 392,109 | 2,009 | ||||||
| Net cash generated (used in) from financing activities | 17,384,687 | (4,529,980 | ) | |||||
| NET DECREASE IN CASH | (2,721,171 | ) | (3,704,751 | ) | ||||
| CASH, AT THE BEGINNING OF THE YEAR | 11,254,517 | 14,959,268 | ||||||
| CASH, AT THE END OF THE YEAR | $ | 8,533,346 | $ | 11,254,517 | ||||
(Concluded)
The accompanying notes are an integral part of the financial statements.
(With Deloitte & Touche audit report dated March 16, 2016)
-9-
ADVANCED SEMICONDUCTOR ENGINEERING, INC.
NOTES TO PARENT COMPANY ONLY FINANCIAL STATEMENTS
(Amounts in Thousands, Unless Stated Otherwise)
| 1. | GENERAL INFORMATION |
Advanced Semiconductor Engineering, Inc. (the “Company”), a corporation incorporated in Nantze Export Processing Zone under the laws of Republic of China (the “ROC”). In August 2004, the Company merged its subsidiaries, ASE (Chung Li) Inc. and ASE Material Inc., and established Chung-Li Branch. In August 2006, the Company spun-off and assigned its substrate production business to ASE Electronics Inc. In January 2011, the Company established Nan-Tou Branch. In May 2012, the Company merged its subsidiary, PowerASE Technology, Inc. In August 2013, the Company merged its subsidiary, Yang Ting Tech Co., Ltd. The Company offers a comprehensive range of semiconductors packaging and testing services.
Since July 1989, the Company’s ordinary shares have been listed on the Taiwan Stock Exchange (the “TSE”) under the symbol “2311”. Since September 2000, the Company’s ordinary shares have been traded on the New York Stock Exchange (the “NYSE”) under the symbol “ASX” in the form of American Depositary Shares (“ADS”).
The parent company only financial statements are presented in the Company’s functional currency, New Taiwan dollar (NT$).
| 2. | APPROVAL OF FINANCIAL STATEMENTS |
The parent company only financial statements were approved for issue by board of directors on March 16, 2016.
| 3. | APPLICATION OF NEW AND REVISED STANDARDS, AMENDMENTS AND INTERPRETATIONS |
| a. | Initial application of the amendments to the Regulations Governing the Preparation of Financial Reports by Securities Issuers and the 2013 version of the International Financial Reporting Standards (IFRS), International Accounting Standards (IAS), Interpretations of IFRS (IFRIC), and Interpretations of IAS (SIC) endorsed by the FSC. |
Rule No. 1030029342 and Rule No. 1030010325 issued by the FSC on April 3, 2014, stipulated that the Company should apply the 2013 version of IFRS, IAS, IFRIC and SIC (collectively, the “IFRSs”) endorsed by the FSC and the related amendments to the Regulations Governing the Preparation of Financial Reports by Securities Issuers starting January 1, 2015.
Except for the following, whenever applied, the initial application of the amendments to the Regulations Governing the Preparation of Financial Reports by Securities Issuers and the 2013 version of IFRSs would not have any material impact on the Company’s accounting policies:
| 1) | IFRS 12 “Disclosure of Interests in Other Entities” |
IFRS 12 is a new disclosure standard and is applicable to entities that have interests in subsidiaries, joint arrangements, associates and/or unconsolidated structured entities. In general, the disclosure requirements in IFRS 12 are more extensive than in the current standards.
-10-
Refer to Note 11 for related disclosures.
| 2) | IFRS 13 “Fair Value Measurement” |
IFRS 13 establishes a single source of guidance for fair value measurements. It defines fair value, establishes a framework for measuring fair value, and requires disclosures about fair value measurements. The disclosure requirements in IFRS 13 are more extensive, for example, quantitative and qualitative disclosures based on the three-level fair value hierarchy currently required for financial instruments only will be extended by IFRS 13 to cover all assets and liabilities within its scope.
The fair value measurements under IFRS 13 will be applied prospectively from January 1, 2015. Refer to Note 26 for related disclosures.
| 3) | Amendments to IAS 1 “Presentation of Items of Other Comprehensive Income” |
The amendments to IAS 1 requires items of other comprehensive income to be grouped into those items that (1) will not be reclassified subsequently to profit or loss; and (2) may be reclassified subsequently to profit or loss. Income taxes on related items of other comprehensive income are grouped on the same basis. Under current IAS 1, there were no such requirements.
The Company retrospectively applied the above amendments starting in 2015. Items that will not be reclassified subsequently to profit or loss are remeasurements of the defined benefit plans and share of remeasurements of the defined benefit plans of associates accounted for using the equity method. Items that may be reclassified to profit or loss are unrealized gain (loss) on available-for-sale financial assets and share of the other comprehensive income (except the share of the remeasurements of the defined benefit plans) of associates accounted for using the equity method. However, the application of the above amendments will not have any impact on the net profit, other comprehensive income (net of income tax), and total comprehensive income for the period.
| 4) | Revision to IAS 19 “Employee Benefits” |
Revised IAS 19 requires the recognition of changes in defined benefit obligations and in the fair value of plan assets when they occur, and hence eliminates the “corridor approach” permitted under current IAS 19 and accelerate the recognition of past service costs. The revision requires all remeasurements of the defined benefit plans to be recognized immediately through other comprehensive income in order for the net pension asset or liability to reflect the full value of the plan deficit or surplus. Remeasurement of the defined benefit plans is presented separately as other equity.
Furthermore, the interest cost and expected return on plan assets used in current IAS 19 are replaced with a “net interest” amount, which is calculated by applying the discount rate to the net defined benefit liability or asset. In addition, the revised IAS 19 introduces certain changes in the presentation of the defined benefit cost, and also includes more extensive disclosures.
On initial application of the revised IAS 19, the changes in cumulative employee benefit costs as of January 1, 2014 resulting from the retrospective application are adjusted to deferred tax assets, investments accounted for using the equity method, net defined benefit liabilities, retained earnings, capital surplus and other equity; however, the carrying amount of inventory is not adjusted. In addition, in preparing the parent company only financial statements for the year ended December 31, 2015, the Company elects not to present 2014 comparative information about the sensitivity analysis of the defined benefit obligation.
The initial application of the revised IAS 19 has no material impact on the current period. The impact on the prior reporting periods is set out below:
-11-
| As Originally Stated | Adjustments Arising from Retrospective Application | Adjusted | ||||||||||
| NT$ | NT$ | NT$ | ||||||||||
| Impact on Assets, Liabilities and Equity | ||||||||||||
| December 31, 2014 | ||||||||||||
| Deferred tax assets | $ | 1,020,403 | $ | (601 | ) | $ | 1,019,802 | |||||
| Investment accounted for using the equity method | 139,054,506 | (979 | ) | 139,053,527 | ||||||||
| Net defined benefit liabilities | 2,419,189 | (3,535 | ) | 2,415,654 | ||||||||
| Retained earnings | 52,397,278 | (16,040 | ) | 52,381,238 | ||||||||
| Capital surplus | 15,995,671 | 17,387 | 16,013,058 | |||||||||
| Other equity | 5,067,931 | 608 | 5,068,539 | |||||||||
| January 1, 2014 | ||||||||||||
| Deferred tax assets | 1,019,230 | 1,358 | 1,020,588 | |||||||||
| Investment accounted for using the equity method | 118,011,718 | (69,135 | ) | 117,942,583 | ||||||||
| Net defined benefit liabilities | 2,488,363 | 7,987 | 2,496,350 | |||||||||
| Retained earnings | 38,993,154 | (87,052 | ) | 38,906,102 | ||||||||
| Capital surplus | 7,908,870 | 11,350 | 7,920,220 | |||||||||
| Other equity | (102,554 | ) | (62 | ) | (102,616 | ) | ||||||
| Impact on Total Comprehensive Income | ||||||||||||
| Year ended December 31, 2014 | ||||||||||||
| Operating cost | 67,316,934 | (15,503 | ) | 67,301,431 | ||||||||
| Operating expense | 11,105,108 | (7,427 | ) | 11,097,681 | ||||||||
| Share of profits of subsidiaries, associates and joint ventures | 8,736,876 | 24,824 | 8,761,700 | |||||||||
| Income tax expense | 2,520,705 | 3,899 | 2,524,604 | |||||||||
| Net profit for the year | 23,592,667 | 43,855 | 23,636,522 | |||||||||
| Items that will not be reclassified subsequently to profit or loss: | ||||||||||||
| Remeasurement of defined benefit obligation | (16,194 | ) | (11,408 | ) | (27,602 | ) | ||||||
| Share of profits of subsidiaries, associates and joint ventures | (19,097 | ) | 36,625 | 17,528 | ||||||||
| Income tax relating to items that will not be reclassified subsequently | 2,753 | 1,940 | 4,693 | |||||||||
| Impact on comprehensive income for the year, net of income tax | 5,137,947 | 27,827 | 5,165,774 | |||||||||
| Total comprehensive income for the year | 28,730,614 | 71,682 | 28,802,296 | |||||||||
| 5) | Annual Improvements to IFRSs: 2009-2011 Cycle |
Several standards including IFRS 1 “First-time Adoption of International Financial Reporting Standards”, IAS 1 “Presentation of Financial Statements”, IAS 16 “Property, Plant and Equipment”,
-12-
IAS 32 “Financial Instruments: Presentation” and IAS 34 “Interim Financial Reporting” were amended in this annual improvement.
The amendments to IAS 1 clarify that an entity is required to present a balance sheet as at the beginning of the preceding period when a) it applies an accounting policy retrospectively, or makes a retrospective restatement or reclassifies items in its financial statements, and b) the retrospective application, restatement or reclassification has a material effect on the information in the balance sheet at the beginning of the preceding period. The amendments also clarify that related notes are not required to accompany the balance sheet at the beginning of the preceding period.
The initial application of the amendments to the Regulations Governing the Preparation of Financial Reports by Securities Issuers and the 2013 version of IFRSs in 2015 has material effect on the parent company only balance sheet as of January 1, 2014. In preparing the parent company only financial statements for the year ended December 31, 2015, the Company would present the parent company only balance sheet as of January 1, 2014 in accordance of the above amendments to IAS 1 and disclose related information in accordance with IAS 8 “Accounting Policies, Changes in Accounting Estimates and Errors”, but the Company is not required to make disclosures about the line items of the balance sheet as of January 1, 2014.
| b. | New IFRSs in issue but not yet endorsed by the FSC |
On March 10, 2016, the FSC announced the scope of the 2016 version of IFRSs to be endorsed and will take effect from January 1, 2017. The scope includes all IFRSs that were issued by the IASB before January 1, 2016 and have effective dates on or before January 1, 2017, which means the scope excludes those that are not yet effective as of January 1, 2017 such as IFRS 9 “Financial Instruments” and IFRS 15 “Revenue from Contracts with Customers” and those with undetermined effective date. In addition, the FSC announced that the Company should apply IFRS 15 starting January 1, 2018. As of the date the parent company only financial statements were approved for issue, the FSC has not announced the effective dates of other new, amended and revised standards and interpretations.
The Company has not applied the following New IFRSs issued by the IASB but not yet endorsed by the FSC.
| New IFRSs | Effective Date Announced by IASB (Note 1) | |
| Annual Improvements to IFRSs 2010-2012 Cycle | July 1, 2014 or transactions on or after July 1, 2014 | |
| Annual Improvements to IFRSs 2011-2013 Cycle | July 1, 2014 | |
| Annual Improvements to IFRSs 2012-2014 Cycle | January 1, 2016 (Note 2) | |
| IFRS 9 “Financial Instruments” | January 1, 2018 | |
| Amendments to IFRS 9 and IFRS 7 “Mandatory Effective Date of IFRS 9 and Transition Disclosures” | January 1, 2018 | |
| Amendment to IAS 28 “Sale or Contribution of Assets between an Investor and its Associate or Joint Venture” | To be determined by IASB | |
| Amendments to IFRS 12 and IAS 28 “Investment Entities: Applying the Consolidation Exception” | January 1, 2016 | |
| Amendment to IFRS 11 “Accounting for Acquisitions of Interests in Joint Operations” | January 1, 2016 | |
| IFRS 14 “Regulatory Deferral Accounts” | January 1, 2016 | |
| IFRS 15 “Revenue from Contracts with Customers” | January 1, 2018 | |
| IFRS 16 “Leases” | January 1, 2019 | |
| Amendment to IAS 1 “Disclosure Initiative” | January 1, 2016 | |
| Amendment to IAS 7 “Disclosure Initiative” | January 1, 2017 |
(Continued)
-13-
| New IFRSs | Effective Date Announced by IASB (Note 1) | |
| Amendments to IAS 12 “Recognition of Deferred Tax Assets for Unrealized Losses” | January 1, 2017 | |
| Amendments to IAS 16 and IAS 38 “Clarification of Acceptable Methods of Depreciation and Amortization” | January 1, 2016 | |
| Amendments to IAS 16 and IAS 41 “Agriculture: Bearer Plants” | January 1, 2016 | |
| Amendment to IAS 19 “Defined Benefit Plans: Employee Contributions” | July 1, 2014 | |
| Amendment to IAS 36 “Impairment of Assets: Recoverable Amount Disclosures for Non-financial Assets” | January 1, 2014 | |
| Amendment to IAS 27 “Equity Method in Separate Financial Statements” | January 1, 2016 | |
| Amendment to IAS 39 “Novation of Derivatives and Continuation of Hedge Accounting” | January 1, 2014 | |
| IFRIC 21 “Levies” | January 1, 2014 |
(Concluded)
Note 1: Unless stated otherwise, the above New IFRSs are effective for annual periods beginning on or after their respective effective dates.
Note 2: The amendment to IFRS 5 is applied prospectively to changes in a method of disposal that occur in annual periods beginning on or after January 1, 2016; the remaining amendments are effective for annual periods beginning on or after January 1, 2016.
The initial application of the above New IFRSs, whenever applied, would not have any material impact on the Company’s accounting policies, except for the following:
| 1) | IFRS 9 “Financial Instruments” |
Recognition and measurement of financial assets
With regards to financial assets, all recognized financial assets that are within the scope of IAS 39 “Financial Instruments: Recognition and Measurement” are subsequently measured at amortized cost or fair value. Under IFRS 9, the requirement for the classification of financial assets is stated below:
For the Company’s debt instruments that have contractual cash flows that are solely payments of principal and interest on the principal amount outstanding, their classification and measurement are as follows:
| a) | For debt instruments, if they are held within a business model whose objective is to collect the contractual cash flows, the financial assets are measured at amortized cost and are assessed for impairment continuously with impairment loss recognized in profit or loss, if any. Interest revenue is recognized in profit or loss by using the effective interest method; |
| b) | For debt instruments, if they are held within a business model whose objective is achieved by both the collecting of contractual cash flows and the selling of financial assets, the financial assets are measured at fair value through other comprehensive income (FVTOCI) and are assessed for impairment. Interest revenue is recognized in profit or loss by using the effective interest method, and other gain or loss shall be recognized in other comprehensive income, except for impairment gains or losses and foreign exchange gains and losses. When the debt instruments are derecognized or reclassified, the cumulative gain or loss previously recognized in other comprehensive income is reclassified from equity to profit or loss. |
-14-
Except for above, all other financial assets are measured at fair value through profit or loss. However, the Company make an irrevocable election to present subsequent changes in the fair value of an equity investment (that is not held for trading) in other comprehensive income, with only dividend income generally recognized in profit or loss. No subsequent impairment assessment is required, and the cumulative gain or loss previously recognized in other comprehensive income cannot be reclassified from equity to profit or loss.
The impairment of financial assets
IFRS 9 requires that impairment loss on financial assets is recognized by using the “Expected Credit Losses Model”. The credit loss allowance is required for financial assets measured at amortized cost, financial assets mandatorily measured at FVTOCI, lease receivables, contract assets arising from IFRS 15 “Revenue from Contracts with Customers”, certain written loan commitments and financial guarantee contracts. A loss allowance for the 12-month expected credit losses is required for a financial asset if its credit risk has not increased significantly since initial recognition. A loss allowance for full lifetime expected credit losses is required for a financial asset if its credit risk has increased significantly since initial recognition and is not low. However, a loss allowance for full lifetime expected credit losses is required for trade receivables that do not constitute a financing transaction.
For purchased or originated credit-impaired financial assets, the Company takes into account the expected credit losses on initial recognition in calculating the credit-adjusted effective interest rate. Subsequently, any changes in expected losses are recognized as a loss allowance with a corresponding gain or loss recognized in profit or loss.
Hedge accounting
The main changes in hedge accounting amended the application requirements for hedge accounting to better reflect the entity’s risk management activities. Compared with IAS 39, the main changes include: (1) enhancing types of transactions eligible for hedge accounting, specifically broadening the risk eligible for hedge accounting of non-financial items; (2) changing the way hedging derivative instruments are accounted for to reduce profit or loss volatility; and (3) replacing retrospective effectiveness assessment with the principle of economic relationship between the hedging instrument and the hedged item.
| 2) | Amendment to IAS 36 “Recoverable Amount Disclosures for Non-financial Assets” |
In issuing IFRS 13 “Fair Value Measurement”, the IASB made consequential amendment to the disclosure requirements in IAS 36 “Impairment of Assets”, introducing a requirement to disclose in every reporting period the recoverable amount of an asset or each cash-generating unit. The amendment clarifies that such disclosure of recoverable amounts is required only when an impairment loss has been recognized or reversed during the period. Furthermore, the Company is required to disclose the discount rate used in measurements of the recoverable amount based on fair value less costs of disposal measured using a present value technique.
| 3) | IFRS 15 “Revenue from Contracts with Customers” |
IFRS 15 establishes principles for recognizing revenue that apply to all contracts with customers, and will supersedes IAS 18 “Revenue”, IAS 11 “Construction Contracts” and a number of revenue-related interpretations from January 1, 2017.
When applying IFRS 15, an entity shall recognize revenue by applying the following steps:
| — | Identify the contract with the customer; |
-15-
| — | Identify the performance obligations in the contract; |
| — | Determine the transaction price; |
| — | Allocate the transaction price to the performance obligations in the contracts; and |
| — | Recognize revenue when the entity satisfies a performance obligation. |
When IFRS 15 is effective, the Company may elect to apply this Standard either retrospectively to each prior reporting period presented or retrospectively with the cumulative effect of initially applying this Standard recognized at the date of initial application.
| 4) | Amendment to IAS 28 “Sale or Contribution of Assets between an Investor and its Associate or Joint Venture” |
The amendments stipulated that, when the Company sells or contributes assets that constitute a business (as defined in IFRS 3) to an associate or joint venture, the gain or loss resulting from the transaction is recognized in full. Also, when the Company loses control of a subsidiary that contains a business but retains significant influence or joint control, the gain or loss resulting from the transaction is recognized in full.
Conversely, when the Company sells or contributes assets that do not constitute a business to an associate or joint venture, the gain or loss resulting from the transaction is recognized only to the extent of the unrelated investors’ interest in the associate or joint venture, i.e. the entity’s share of the gain or loss is eliminated. Also, when the Company loses control of a subsidiary that does not contain a business but retains significant influence or joint control in an associate or a joint venture, the gain or loss resulting from the transaction is recognized only to the extent of the unrelated investors’ interest in the associate or joint venture, i.e. the entity’s share of the gain or loss is eliminated.
| 5) | IFRS 16 “Leases” |
IFRS 16 sets out the accounting standards for leases that will supersede IAS 17 and a number of related interpretations.
Under IFRS 16, if the Company is a lessee, it shall recognize right-of-use assets and lease liabilities for all leases on the parent company only balance sheets except for low-value and short-term leases. The Company may elect to apply the accounting method similar to the accounting for operating lease under IAS 17 to the low-value and short-term leases. On the parent company only statements of comprehensive income, the Company should present the depreciation expense charged on the right-of-use asset separately from interest expense accrued on the lease liability; interest is computed by using effective interest method. On the parent company only statements of cash flows, cash payments for the principal portion of the lease liability are classified within financing activities; cash payments for interest portion are classified within operating activities.
The application of IFRS 16 is not expected to have a material impact on the accounting of the Company as lessor.
When IFRS 16 becomes effective, the Company may elect to apply this Standard either retrospectively to each prior reporting period presented or retrospectively with the cumulative effect of the initial application of this Standard recognized at the date of initial application.
| 6) | Amendments to IAS 12 “Recognition of Deferred Tax Assets for Unrealized Losses” |
The amendment clarifies that the difference between the carrying amount of the debt instrument measured at fair value and its tax base gives rise to a temporary difference, even though there are
-16-
unrealized losses on that asset, irrespective of whether the Company expects to recover the carrying amount of the debt instrument by sale or by holding it and collecting contractual cash flows.
In addition, in determining whether to recognize a deferred tax asset, the Company should assess a deductible temporary difference in combination with all of its other deductible temporary differences, unless the tax law restricts the utilization of losses to deduction against income of a specific type, in which case, a deductible temporary difference is assessed in combination only with other deductible temporary differences of the appropriate type. The amendment also stipulates that, when determining whether to recognize a deferred tax asset, the estimate of probable future taxable profit may include some of the Company’s assets for more than their carrying amount if there is sufficient evidence that it is probable that the Company will achieve this, and that the estimate for future taxable profit should exclude tax deductions resulting from the reversal of deductible temporary differences.
Except for the above impact, as of the date the parent company only financial statements were approved for issue, the Company is continuously assessing the possible impact that the application of other standards and interpretations will have on the Company’s financial position and results of operations, and will disclose the relevant impact when the assessment is completed.
| 4. | SUMMARY OF SIGNIFICANT ACCOUNTING POLICIES |
| a. | Statement of Compliance |
The accompanying parent company only financial statements have been prepared in accordance with the Regulations Governing the Preparation of Financial Reports by Securities Issuers.
| b. | Basis of Preparation |
The accompanying parent company only financial statements have been prepared on the historical cost basis except for certain financial instruments that are measured at fair value.
The fair value measurements are grouped into Levels 1 to 3 based on the degree to which the fair value measurement inputs are observable and the significance of the inputs to the fair value measurement in its entirety, which are described as follows:
| 1) | Level 1 inputs are quoted prices (unadjusted) in active markets for identical assets or liabilities; |
| 2) | Level 2 inputs are inputs other than quoted prices included within Level 1 that are observable for the asset or liability, either directly (i.e. as prices) or indirectly (i.e. derived from prices); and |
| 3) | Level 3 inputs are unobservable inputs for the asset or liability. |
When preparing the parent company only financial statements, the Company used equity method to account for its investment in subsidiaries, associates and joint ventures. In order for the amount of the net profit for the year, other comprehensive income for the year and total equity in the parent company only financial statements to be the same with the amounts attributable to owners of the Company in its consolidated financial statements, adjustments arising from the differences in accounting treatment between parent company only basis and consolidated basis were made to investments accounted for using the equity method, share of profit or loss of subsidiaries, associates and joint ventures and share of other comprehensive income of subsidiaries, associates and joint ventures in the parent company only financial statements.
| c. | Classification of Current and Non-current Assets and Liabilities |
Current assets include cash and those assets held primarily for trading purposes or to be realized within
-17-
twelve months after the balance sheet date, unless the asset is to be used for an exchange or to settle a liability, or otherwise remains restricted, at more than twelve months after the balance sheet date. Current liabilities are obligations incurred for trading purposes or to be settled within twelve months after the balance sheet date and liabilities that do not have an unconditional right to defer settlement for at least twelve months after the balance sheet date. Assets and liabilities that are not classified as current are classified as non-current.
| d. | Foreign Currencies |
In preparing the parent company only financial statements, transactions in currencies other than the entity’s functional currency (foreign currencies) are recognized at the rates of exchange prevailing at the dates of the transactions. At each balance sheet date, monetary items denominated in foreign currencies are retranslated at the rates prevailing at that date. Non-monetary items carried at fair value that are denominated in foreign currencies are retranslated at the rates prevailing at the date when the fair value was determined. Non-monetary items that are measured in terms of historical cost in a foreign currency are not retranslated.
Exchange differences on monetary items arising from settlement or translation are recognized in profit or loss in the period in which they arise.
Exchange differences arising on the retranslation of non-monetary assets (such as equity instruments) or liabilities measured at fair value are included in profit or loss for the period at the rates prevailing at the balance sheet date except for exchange differences arising on the retranslation of non-monetary items in respect of which gains and losses are recognized directly in other comprehensive income, in which case, the exchange differences are also recognized directly in other comprehensive income.
For the purposes of presenting the parent company only financial statements, the assets and liabilities of the Company’s foreign operations (including subsidiaries, associates and joint ventures operating in other countries or using currencies that are different from the Company’s) are translated into New Taiwan dollars using exchange rates prevailing at each balance sheet date. Income and expense items are translated at the average exchange rates for the period. Exchange differences arising are recognized in other comprehensive income.
| e. | Inventories |
Inventories, including raw materials (materials received from customers for processing, mainly semiconductor wafers, are excluded from inventories as title and risk of loss remain with the customers), supplies, work in process, finished goods, and materials and supplies in transit are stated at the lower of cost or net realizable value. Inventory write-downs are made by item, except for those that may be appropriate to group items of similar or related inventories. Net realizable value is the estimated selling prices of inventories less all estimated costs of completion and estimated costs necessary to make the sale. Raw materials and supplies are recorded at moving average cost while work in process and finished goods are recorded at standard cost.
| f. | Investment in subsidiaries |
Investment in subsidiaries is accounted for using the equity method. A subsidiaries is an entity that is controlled by the company.
Under the equity method, an investment in a subsidiary is initially recognized at cost and adjusted thereafter to recognize the Company’s share of profit or loss and other comprehensive income of the subsidiary as well as the distribution received. The Company also recognized its share of the changes in other equity of the subsidiaries.
Changes in the Company’s ownership interests in subsidiaries that do not result in the Company’s losing control over the subsidiaries are accounted for as equity transactions. Any difference between the
-18-
carrying amount of the investment and the fair value of the consideration paid or received is recognized directly in equity.
Any excess of the cost of acquisition over the Company’s share of the net fair value of the identifiable assets and liabilities of subsidiaries at the date of acquisition is recognized as goodwill, which is included within the carrying amount of the investment and is not amortized. Any excess of the Company’s share of the net fair value of the identifiable assets and liabilities over the cost of acquisition, after reassessment, is recognized immediately in profit or loss.
Profits and losses from downstream transactions with subsidiaries are eliminated in full. Profits and losses from upstream with subsidiaries and sidestream transactions between subsidiaries are recognized in the Company’s parent company only financial statements only to the extent of interests in the subsidiaries that are not related to the Company.
| g. | Investments in associates and joint ventures |
An associate is an entity over which the Company has significant influence and that is neither a subsidiary nor an interest in a joint venture. Joint venture is a joint arrangement whereby the Company and other parties that have joint control of the arrangement have rights to the net assets of the arrangement.
The Company uses the equity method to account for its investments in associates and joint ventures.
Under the equity method, investments in an associate and a joint venture are initially recognized at cost and adjusted thereafter to recognize the Company’s share of the profit or loss and other comprehensive income of the associate and joint venture. The Company also recognizes the changes in the Company’s share of equity of associates and joint venture.
Any excess of the cost of acquisition over the Company’s share of the net fair value of the identifiable assets and liabilities of an associate or a joint venture at the date of acquisition is recognized as goodwill, which is included within the carrying amount of the investment and is not amortized.
Gains and losses resulting from upstream, downstream and sidestream transactions between the Company and its associates or joint ventures are recognized in the Company’s parent company only financial statements only to the extent of interests in the associates or joint ventures that are not related to the Company.
| h. | Property, Plant and Equipment |
Property, plant and equipment are stated at cost less accumulated depreciation and accumulated impairment.
Properties in the course of construction for production, supply or administrative purposes are carried at cost, less any recognized impairment loss. Cost includes professional fees and borrowing costs eligible for capitalization. Such properties are classified to the appropriate categories of property, plant and equipment when completed and ready for intended use. Depreciation of these assets, on the same basis as other property assets, commences when the assets are ready for their intended use.
Freehold land is not depreciated.
Depreciation on property, plant and equipment is recognized using the straight-line method. The estimated useful lives, residual values and depreciation method are reviewed at each balance sheet date, with the effect of any changes in estimate accounted for on a prospective basis.
On derecognition of an item of property, plant and equipment, the difference between the sales proceeds and the carrying amount of the asset is recognized in profit or loss.
-19-
| i. | Goodwill |
Goodwill arising from an acquisition of a business is carried at cost as established at the date of acquisition of the business less accumulated impairment loss.
For the purposes of impairment testing, goodwill is allocated to each of the Group’s cash-generating units or groups of cash-generating units (referred to as cash-generating units) that are expected to benefit from the synergies of the combination.
A cash-generating unit to which goodwill has been allocated is tested for impairment annually, or more frequently when there is an indication that the unit may be impaired, by comparing its carrying amount, including the attributed goodwill, with its recoverable amount. However, if the goodwill allocated to a cash-generating unit was acquired in a business combination during the current annual period, that unit shall be tested for impairment before the end of the current annual period. If the recoverable amount of the cash-generating unit is less than its carrying amount, the impairment loss is allocated first to reduce the carrying amount of any goodwill allocated to the unit and then to the other assets of the unit pro rata based on the carrying amount of each asset in the unit. Any impairment loss is recognized directly in profit or loss. An impairment loss recognized for goodwill is not reversed in subsequent periods.
| j. | Other Intangible Assets |
Other intangible assets with finite useful lives acquired separately are initially measured at cost and subsequently measured at cost less accumulated amortization and accumulated impairment. Other intangible assets are amortized using the straight-line method over their estimated useful lives. The estimated useful lives, residual value and amortization methods are reviewed at each balance sheet date, with the effect of any changes in estimate being accounted for on a prospective basis.
On derecognition of an intangible asset, the difference between the net disposal proceeds and the carrying amount of the asset are recognized in profit or loss.
| k. | Impairment of Tangible and Intangible Assets Other than Goodwill |
At each balance sheet date, the Company reviews the carrying amounts of its tangible and intangible assets, excluding goodwill (see above), to determine whether there is any indication that those assets have suffered an impairment loss. If any such indication exists, the recoverable amount of the asset is estimated in order to determine the extent of the impairment loss. When it is not possible to estimate the recoverable amount of an individual asset, the Company estimates the recoverable amount of the cash-generating unit to which the asset belongs. Recoverable amount is the higher of fair value less costs to sell and value in use. If the recoverable amount of an asset or cash-generating unit is estimated to be less than its carrying amount, the carrying amount of the asset or cash-generating unit is reduced to its recoverable amount, with the resulting impairment loss recognized in profit or loss.
When an impairment loss is subsequently reversed, the carrying amount of the asset or cash-generating unit is increased to the revised estimate of its recoverable amount, but only to the extent of the carrying amount that would have been determined had no impairment loss been recognized for the asset or cash-generating unit in prior years. A reversal of an impairment loss is recognized immediately in profit or loss.
| l. | Financial Instruments |
Financial assets and financial liabilities are recognized when a group entity becomes a party to the contractual provisions of the instruments. Financial assets and financial liabilities are initially measured at fair value. Transaction costs that are directly attributable to the acquisition or issue of financial assets and financial liabilities (other than financial assets and financial liabilities at fair value through profit or loss) are added to or deducted from the fair value of the financial assets or financial
-20-
liabilities, as appropriate, on initial recognition. Transaction costs directly attributable to the acquisition of financial assets or financial liabilities at fair value through profit or loss are recognized immediately in profit or loss.
| 1) | Financial assets |
All regular way purchases or sales of financial assets are recognized or derecognized on a settlement date basis.
| a) | Measurement category |
The classification of financial assets held by the Company depends on the nature and purpose of the financial assets and is determined at the time of initial recognition.
| i. | Financial assets at fair value through profit or loss (“FVTPL”) |
Financial assets are classified as at FVTPL when the financial assets are either held for trading or they are designated as at FVTPL.
A financial asset other than a financial asset held for trading may be designated as at FVTPL upon initial recognition if:
| — | Such designation eliminates or significantly reduces a measurement or recognition inconsistency that would otherwise arise; or |
| — | The financial asset forms part of a group of financial assets or financial liabilities or both, which is managed and its performance is evaluated on a fair value basis, in accordance with the Company’s documented risk management or investment strategy, and information about the grouping is provided internally on that basis; or |
| — | It forms part of a contract containing one or more embedded derivatives, and IAS 39 permits the entire combined contract to be designated as at FVTPL. |
Financial assets at FVTPL are stated at fair value with any gains or losses arising on remeasurement recognized in profit or loss. The net gain or loss recognized in profit or loss incorporates any dividend or interest earned on the financial asset.
Fair value is determined in the manner described in Note 26.
| ii. | Available-for-sale financial assets |
Available-for-sale financial assets are non-derivatives that are either designated as available-for-sale or are not classified as (a) loans and receivables, (b) held-to-maturity investments or (c) financial assets at fair value through profit or loss.
Available-for-sale financial assets are stated at fair value at each balance sheet date. Changes in the carrying amount of available-for-sale monetary financial assets relating to changes in foreign currency rates, interest income calculated using the effective interest method and dividends on available-for-sale equity investments are recognized in profit or loss. Other changes in the carrying amount of available-for-sale financial assets are recognized in other comprehensive income and accumulated under the heading of unrealized gain (loss) on available-for-sale financial assets. When the investment is disposed of or is determined to be impaired, the cumulative gain or loss previously accumulated in the unrealized gain (loss) on available-for-sale financial assets is reclassified to profit or loss.
-21-
Dividends on available-for-sale equity instruments are recognized in profit or loss when the Company’s right to receive the dividends is established.
| iii. | Loans and receivables |
Loans and receivables including cash, trade receivables, other receivables, other financial assets and debt investments with no active market are measured at amortized cost using the effective interest method, less any impairment. Interest income is recognized by applying the effective interest rate, except for short-term receivables when the effect of discounting is immaterial.
| b) | Impairment of financial assets |
Financial assets, other than those at FVTPL, are assessed for indicators of impairment at each balance sheet date. Financial assets are considered to be impaired when there is objective evidence that, as a result of one or more events that occurred after the initial recognition of the financial assets, the estimated future cash flows of the investments have been affected.
For financial assets carried at amortized cost, such as trade receivables and other receivables, assets that are assessed not to be impaired individually are, further, assessed for impairment on a collective basis. The Company assesses the collectability of receivables based on the Company’s past experience of collecting payments and observable changes that correlate with default on receivables.
For financial assets carried at amortized cost, the amount of the impairment loss recognized is the difference between the assets’ carrying amounts and the present value of estimated future cash flows, discounted at the financial assets’ original effective interest rates. If, in a subsequent period, the amount of the impairment loss decreases and the decreases can be objectively related to an event occurring after the impairment loss recognized, the previously recognized impairment loss is reversed either directly or by adjusting an allowance account through profit or loss. The reversal shall not result in carrying amounts of financial assets that exceed what the amortized cost would have been at the date the impairment is reversed.
When an available-for-sale financial asset is considered to be impaired, cumulative gains or losses previously recognized in other comprehensive income are reclassified to profit or loss in the period. In respect of available-for-sale equity securities, impairment loss previously recognized in profit or loss are not reversed through profit or loss. Any increase in fair value subsequent to an impairment loss is recognized in other comprehensive income and accumulated under the heading of unrealized gain (loss) on available-for-sale financial assets.
The carrying amount of the financial asset is reduced by the impairment loss directly for all financial assets with the exception of trade receivables where the carrying amount is reduced through the use of an allowance account. When a trade receivable is considered uncollectible, it is written off against the allowance account. Subsequent recoveries of amounts previously written off are credited against the allowance account. Changes in the carrying amount of the allowance account are recognized in profit or loss except for uncollectible trade receivables that are written off against the allowance account.
| c) | Derecognition of financial assets |
The Company derecognizes a financial asset only when the contractual rights to the cash flows from the asset expire, or when it transfers the financial asset and substantially all the risks and rewards of ownership of the asset to another entity. On derecognition of a financial asset in its entirety, the difference between the asset’s carrying amount and the sum of the consideration received and receivable and the cumulative gain or loss that had been recognized in other comprehensive income and accumulated in equity is recognized in profit or loss.
-22-
| 2) | Equity instruments |
Debt and equity instruments issued by the company are classified as either financial liabilities or as equity in accordance with the substance of the contractual arrangements and the definitions of a financial liability and an equity instrument.
Equity instruments issued by the company are recognized at the proceeds received, net of direct issue costs.
Repurchase of the Company’s own equity instruments is recognized in and deducted directly from equity. No gain or loss is recognized in profit or loss on the purchase, sale, issue or cancellation of the Company’s own equity instruments.
| 3) | Financial liabilities |
Financial liabilities are measured either at amortized cost using the effective interest method or at FVTPL. Financial liabilities measured at FVTPL are held for trading.
Financial liabilities at FVTPL are stated at fair value, with any gain or loss arising on remeasurement recognized in profit or loss. The net gain or loss recognized in profit or loss incorporates any interest or dividend paid on the financial liability. Fair value is determined in the manner described in Note 26.
The Company derecognizes financial liabilities when, and only when, the Company’s obligations are discharged, cancelled or they expire. The difference between the carrying amount of the financial liability derecognized and the consideration paid and payable, including any non-cash assets transferred or liabilities assumed, is recognized in profit or loss.
| 4) | Derivative financial instruments |
Derivatives are initially recognized at fair value at the date the derivative contracts are entered into and are subsequently remeasured to their fair value at each balance sheet date. The resulting gain or loss is recognized in profit or loss immediately. When the fair value of derivative financial instruments is positive, the derivative is recognized as a financial asset; when the fair value of derivative financial instruments is negative, the derivative is recognized as financial liabilities.
Derivatives embedded in non-derivative host contracts are treated as separate derivatives when they meet the definition of a derivative, their risks and characteristics are not closely related to those of the host contracts and the contracts are not measured at FVTPL.
| 5) | Convertible bonds |
| a) | Convertible bonds contain conversion option classified as an equity |
The component parts of compound instruments (convertible bonds) issued by the Company are classified separately as financial liabilities and equity in accordance with the substance of the contractual arrangements and the definitions of a financial liability and an equity instrument.
On initial recognition, the fair value of the liability component is estimated using the prevailing market interest rate for similar non-convertible instruments. This amount is recorded as a liability on an amortized cost basis using the effective interest method until extinguished upon conversion or the instrument’s maturity date. Any embedded derivative liability is measured at fair value.
-23-
The conversion option classified as equity is determined by deducting the amount of the liability component from the fair value of the compound instrument as a whole. This is recognized and included in equity, net of income tax effects, and is not subsequently remeasured. In addition, the conversion option classified as equity will remain in equity until the conversion option is exercised, in which case, the balance recognized in equity will be transferred to capital surplus - share premium. When the conversion option remains unexercised at maturity, the balance recognized in equity will be transferred to capital surplus - share premium.
Transaction costs that relate to the issue of the convertible bonds are allocated to the liability and equity components in proportion to the allocation of the gross proceeds. Transaction costs relating to the equity component are recognized directly in equity. Transaction costs relating to the liability component are included in the carrying amount of the liability component.
| b) | Convertible bonds contain conversion option classified as a liability |
The conversion options component of the convertible bonds issued by the Company that will be settled other than by the exchange of a fixed amount of cash or other financial asset for a fixed number of the Company’s own equity instruments is classified as derivative financial liabilities.
On initial recognition, the derivative financial liabilities component of the convertible bonds is recognized at fair value, and the initial carrying amount of the component of non-derivative financial liabilities is determined by deducting the amount of derivative financial liabilities from the fair value of the hybrid instrument as a whole. In subsequent periods, the non-derivative financial liabilities component of the convertible bonds is measured at amortized cost using the effective interest method. The derivative financial liabilities component is measured at fair value and the changes in fair value are recognized in profit or loss.
Transaction costs that relate to the issue of the convertible bonds are allocated to the derivative financial liabilities component and the non-derivative financial liabilities component in proportion to their relative fair values. Transaction costs relating to the derivative financial liabilities component are recognized immediately in profit or loss. Transaction costs relating to the non-derivative financial liabilities component are included in the carrying amount of the liability component.
| m. | Revenue Recognition |
Revenue is measured at the fair value of the consideration received or receivable take into account of estimated customer returns, rebates and other similar allowances.
| 1) | Sale of goods |
Revenue from the sale of goods is recognized when the goods are delivered and titles have passed, at the time all the following conditions are satisfied:
| — | The Company has transferred to the buyer the significant risks and rewards of ownership of the goods; |
| — | The Company retains neither continuing managerial involvement to the degree usually associated with ownership nor effective control over the goods sold; |
| — | The amount of revenue can be reliably measured; |
| — | It is probable that the economic benefits associated with the transaction will flow to the Company; and |
| — | The costs incurred or to be incurred in respect of the transaction can be reliably measured. |
-24-
| 2) | Rendering of services |
Service income is recognized when services are rendered.
| 3) | Dividend and interest income |
Dividend income from investments is recognized when the shareholder’s right to receive payment has been established, provided that it is probable that the economic benefits will flow to the Company and the amount of income can be measured reliably.
Interest income from a financial asset is recognized when it is probable that the economic benefits will flow to the Company and the amount of income can be measured reliably. Interest income is accrued on a time basis, by reference to the principal outstanding and at the effective interest rate applicable.
| n. | Leasing |
Operating lease income or payments are recognized as revenue or expenses on a straight-line basis over the lease term.
| o. | Borrowing Costs |
Borrowing costs directly attributable to the acquisition, construction or production of qualifying assets are added to the cost of those assets, until such time as the assets are substantially ready for their intended use or sale. All other borrowing costs are recognized in profit or loss in the period in which they are incurred.
| p. | Retirement Benefit Costs |
Payments to defined contribution retirement benefit plans are recognized as expenses when employees have rendered services entitling them to the contributions.
Defined benefit costs (including service cost, net interest and remeasurement) under the defined benefit retirement benefit plans are determined using the projected unit credit method. Service cost (including current service cost and past service cost) and net interest on the net defined benefit liability (asset) are recognized as employee benefits expense in the period they occur. Remeasurement, comprising actuarial gains and losses and the return on plan assets (excluding interest), is recognized in other comprehensive income in the period in which they occur. Remeasurement recognized in other comprehensive income is reflected immediately in retained earnings and will not be reclassified to profit or loss.
Net defined benefit liability (asset) represents the actual deficit (surplus) in the Company’s defined benefit plan. Any surplus resulting from this calculation is limited to the present value of any refunds from the plans or reductions in future contributions to the plans.
| q. | Employee share options |
Employee share options granted to employees are measured at the fair value at the grant date. The fair value determined at the grant date is expensed on a straight-line basis over the vesting period, based on the Company’s best estimate of the number of options that are expected to ultimately vest, with a corresponding increase in capital surplus - employee share options. It is recognized as an expense in full at the grant date if vesting immediately.
At each balance sheet date, the Company reviews its estimate of the number of employee share options expected to vest. The impact of the revision of the original estimates is recognized in profit or loss
-25-
such that the cumulative expense reflects the revised estimate, with a corresponding adjustment to the capital surplus - employee share options.
Employee share options granted by the Company to its subsidiaries’ employees are accounted for as investments by the Company to its subsidiaries. The employee share options granted are measured at fair value at the grant dates and recorded as increases in the carrying amount of the investments in subsidiaries and the capital surplus-employee share option during the vesting periods.
| r. | Taxation |
Income tax expense represents the sum of the tax currently payable and deferred tax.
| 1) | Current tax |
Income tax on unappropriated earnings (excluding earnings from foreign consolidated subsidiaries) at a rate of 10% is expensed in the year the earnings arise and adjusted to the extent that distributions are approved by the shareholders in the following year.
Adjustments of prior years’ tax liabilities are added to or deducted from the current year’s tax provision.
| 2) | Deferred tax |
Deferred tax is recognized on temporary differences between the carrying amounts of assets and liabilities in the parent company only financial statements and the corresponding tax bases used in the computation of taxable profit. Deferred tax liabilities are generally recognized for all taxable temporary differences. Deferred tax assets are generally recognized for all deductible temporary differences and unused tax credits that it is probable that taxable profits will be available against which those deductible temporary differences can be utilized.
Deferred tax liabilities are recognized for taxable temporary differences associated with investments in subsidiaries except where the Company is able to control the reversal of the temporary differences and it is probable that the temporary differences will not reverse in the foreseeable future.
The carrying amounts of deferred tax assets is reviewed at each balance sheet date and reduced to the extent that it is no longer probable that sufficient taxable profits will be available to allow all or part of deferred tax assets to be utilized. A previously unrecognized deferred tax asset is also reviewed at each balance sheet date and recognized to the extent that it has become probable that future taxable profit will allow the deferred tax asset to be recovered.
Deferred tax assets and liabilities are measured at the tax rates that are expected to apply in the period in which assets are realized or the liabilities are settled. The measurement of deferred tax assets and liabilities reflects the tax consequences that would follow from the manner in which the Company expects, at the balance sheet date, to recover or settle the carrying amounts of its assets and liabilities.
| 3) | Current and deferred tax for the year |
Current and deferred tax are recognized in profit or loss, except when they relate to items that are recognized in other comprehensive income or directly in equity, in which case, the current and deferred tax are also recognized in other comprehensive income, respectively.
-26-
| 5. | CRITICAL ACCOUNTING JUDGMENTS AND KEY SOURCES OF ESTIMATION UNCERTAINTY |
In the application of the Company’s accounting policies, which are described in Note 4, management is required to make judgments, estimates and assumptions about the carrying amounts of assets and liabilities that are not readily apparent from other sources. The estimates and underlying assumptions are based on historical experience and other factors that are considered to be relevant. Actual results may differ from these estimates.
The estimates and underlying assumptions are reviewed on an ongoing basis. Revisions to accounting estimates are recognized in the period in which the estimate is revised if the revision affects only that period, or in the period of the revision and future periods if the revision affects both current and future periods.
Impairment of Goodwill
Determining whether goodwill is impaired requires an estimation of the value in use of the cash-generating units to which goodwill has been allocated. The value in use calculation requires management to estimate the future cash flows expected to arise from cash-generating units and suitable discount rates in order to calculate its present value. When the actual future cash flows are less than expected, a material impairment loss may arise.
Impairment of Tangible and Intangible Assets Other than Goodwill
In evaluating the impairment of tangible and intangible assets other than goodwill, the Company is required to make subjective judgments in determining the independent cash flows, useful lives, expected future revenue and expenses related to the specific asset groups with the consideration of its usage patterns and the nature of semiconductor industry. Any changes in these estimates based on changed economic conditions or business strategies could result in significant impairment charges in future periods.
Valuation of Inventory
Inventories are stated at the lower of cost or net realizable value and the net realizable value of inventory at balance sheet date is determined based on Company’s judgments and estimates.
Due to the rapid technology changes, the Company estimates the net realizable value of inventory for obsolescent and unmarketable items at balance sheet date and then writes down the cost of inventories to net realizable value. There may be significant changes in the net realizable value of inventories due to assumptions of future demand within a specific time period.
Income Taxes
The reliability of deferred tax assets mainly depends on whether sufficient future profits or taxable temporary differences will be available. In cases where the actual future profits generated are less than expected, a material reversal of deferred tax assets may arise, which would be recognized in profit or loss for the period in which such a reversal takes place.
Recognition and Measurement of Defined Benefit Plans
Accrued pension liabilities and the resulting pension expenses under defined benefit pension plans are calculated using the Projected Unit Credit Method. Actuarial assumptions comprise discount rates and expected rates of salary increase. Changes in economic circumstances and market conditions will affect these assumptions and may have a material impact on the amount of the expense and the liability.
-27-
Fair Value Measurements and Valuation Processes of Derivatives and Other Financial Instruments
As disclosed in Note 26, the Company’s management uses its judgments applying appropriate valuation techniques commonly applied by market practitioners. The assumptions applied are based on observable quoted market prices, foreign exchange rates and interest rates to the extent it is available. The fair value of unquoted equity instruments is estimated based on the assumptions supported by unobservable market prices and interest rates which are disclosed in Note 26. The Company’s management believes that the valuation techniques and the assumptions applied are appropriate in determining the fair value of financial instruments.
| 6. | CASH |
| December 31 | ||||||||
| 2015 | 2014 | |||||||
| NT$ | NT$ | |||||||
| Cash on hand | $ | 1,657 | $ | 1,739 | ||||
| Checking accounts and demand deposits | 8,531,689 | 11,252,778 | ||||||
| $ | 8,533,346 | $ | 11,254,517 | |||||
| 7. | FINANCIAL INSTRUMENTS AT FAIR VALUE THROUGH PROFIT OR LOSS |
| December 31 | ||||||||
| 2015 | 2014 | |||||||
| NT$ | NT$ | |||||||
| Financial assets designated as at FVTPL | ||||||||
| Private-placement convertible bonds | $ | 100,500 | $ | 100,500 | ||||
| Financial assets held for trading | ||||||||
| Swap contracts | 1,389,931 | 1,888,449 | ||||||
| Forward exchange contracts | 7,745 | 1,234 | ||||||
| Foreign currency option contracts | 5,020 | - | ||||||
| 1,402,696 | 1,889,683 | |||||||
| $ | 1,503,196 | $ | 1,990,183 | |||||
| Financial liabilities held for trading | ||||||||
| Conversion option, redemption option and put option of convertible bonds (Note 15) | $ | 2,632,565 | $ | 2,520,606 | ||||
| Forward exchange contracts | 22,045 | 6,086 | ||||||
| Swap contracts | 14,876 | 13,726 | ||||||
| Interest rate swap contracts | 119 | - | ||||||
| $ | 2,669,605 | $ | 2,540,418 | |||||
The Company invested in private-placement convertible bonds which included embedded derivative instruments and were not closely related to the host contracts. The Company designated the entire contracts as financial assets at FVTPL on initial recognition.
-28-
At each balance sheet date, the outstanding swap contracts not accounted for hedge accounting were as follows:
| Notional Amount | ||||||
| Currency | Maturity Period | (In Thousands) | ||||
| December 31, 2015 | ||||||
| Sell NT$/Buy US$ | 2016.01-2016.12 | NT$55,220,316/US$1,731,334 | ||||
| Sell US$/Buy NT$ | 2016.01 | US$26,000/NT$849,486 | ||||
| Sell US$/Buy CNY | 2016.03 | US$53,734/CNY349,800 | ||||
| December 31, 2014 | ||||||
| Sell NT$/Buy US$ | 2015.01-2015.12 | NT$35,919,205/US$1,200,000 | ||||
| Sell US$/Buy NT$ | 2015.01 | US$44,000/NT$1,386,200 | ||||
At each balance sheet date, the outstanding forward exchange contracts not accounted for hedge accounting were as follows:
| Notional Amount | ||||||
| Currency | Maturity Period | (In Thousands) | ||||
| December 31, 2015 | ||||||
| Sell US$/Buy JPY | 2016.01 | US$14,000/JPY1,713,388 | ||||
| Sell US$/Buy NT$ | 2016.01-2016.03 | US$121,000/NT$3,971,877 | ||||
| December 31, 2014 | ||||||
| Sell US$/Buy JPY | 2015.01 | US$16,600/JPY1,967,144 | ||||
As of December 31, 2015 the outstanding foreign currency option contracts not accounted for hedge accounting were as follows:
| Notional Amount | ||||||
| Currency | Maturity Period | (In Thousands) | ||||
| Buy US$ Put/CNY Call | 2016.03 | US$20,000/CNY131,600 | ||||
As of December 31, 2015 the outstanding interest rate swap contracts not accounted for hedge accounting were as follows:
Notional Amount (In Thousands) | Maturity Period | Range of Interest Rates Paid | Range of Interest Rates Received | |||||
| NT$1,000,000 | 2016.10 | 4.6% (Fixed) | 0.0%~5.0% (Floating) | |||||
-29-
| 8. | AVAILABLE-FOR-SALE FINANCIAL ASSETS |
| December 31 | ||||||||
| 2015 | 2014 | |||||||
| NT$ | NT$ | |||||||
| Limited partnership | $ | 390,987 | $ | 438,953 | ||||
| Unquoted ordinary shares | 82,120 | 103,194 | ||||||
| Open-end mutual funds | - | 400,007 | ||||||
| 473,107 | 942,154 | |||||||
| Current | - | 400,007 | ||||||
| Non-current | $ | 473,107 | $ | 542,147 | ||||
| 9. | TRADE RECEIVABLES, NET |
| December 31 | ||||||||
| 2015 | 2014 | |||||||
| NT$ | NT$ | |||||||
| Trade receivables | $ | 14,054,233 | $ | 16,497,435 | ||||
| Less: Allowance for doubtful debts | 23,792 | 23,931 | ||||||
| Trade receivables, net | $ | 14,030,441 | $ | 16,473,504 | ||||
| a. | Trade receivables |
The Company’s average credit terms were 30 to 90 days. Allowance for doubtful debts is assessed by reference to the collectability of receivables by evaluating the account aging, historical experience and current financial condition of customers.
As of December 31, 2015 and 2014, except that the Company’s five largest customers accounted for 32% and 38% of accounts receivable, respectively, the concentration of credit risk is insignificant for the remaining accounts receivable.
Aging of receivables
| December 31 | ||||||||
| 2015 | 2014 | |||||||
| NT$ | NT$ | |||||||
| Not past due | $ | 12,074,151 | $ | 14,695,089 | ||||
| 1 to 30 days | 1,639,016 | 1,690,110 | ||||||
| 31 to 90 days | 231,365 | 87,382 | ||||||
| More than 91 days | 109,701 | 24,854 | ||||||
| Total | $ | 14,054,233 | $ | 16,497,435 | ||||
The above aging schedule was based on the past due date.
-30-
Age of receivables that are past due but not impaired
| December 31 | ||||||||
| 2015 | 2014 | |||||||
| NT$ | NT$ | |||||||
| Less than 30 days | $ | 1,636,231 | $ | 1,690,033 | ||||
| 31 to 90 days | 192,339 | 58,588 | ||||||
| Total | $ | 1,828,570 | $ | 1,748,621 | ||||
Except for those impaired, the Company had not provided an allowance for doubtful debts on trade receivables at each balance sheet date since there has not been a significant change in credit quality and the amounts were still considered collectible. The Company did not hold any collateral or other credit enhancements over these balances nor did it have a legal right to offset against any amounts owed by the Company to counterparties. In addition, the Company is not required to have the legal right of offset to offset trade receivables and payables from the same counterparties.
Movement of the allowance for doubtful trade receivables
Impaired Individually | Impaired Collectively | Total | ||||||||||
| NT$ | NT$ | NT$ | ||||||||||
| Balance at January 1, 2015 | $ | 5,100 | $ | 18,831 | $ | 23,931 | ||||||
| Impairment losses recognized (reversed) | 8,848 | (8,826 | ) | 22 | ||||||||
| Amount written off during the period as uncollectible | - | (161 | ) | (161 | ) | |||||||
| Balance at December 31, 2015 | $ | 13,948 | $ | 9,844 | $ | 23,792 | ||||||
| Balance at January 1, 2014 | $ | 5,100 | $ | 18,831 | $ | 23,931 | ||||||
| Impairment losses recognized | - | - | - | |||||||||
| Amount written off during the period as uncollectible | - | - | - | |||||||||
| Balance at December 31, 2014 | $ | 5,100 | $ | 18,831 | $ | 23,931 |
| |||||
| b. | Transfers of financial assets |
Factored trade receivables of the Company were as follows:
| Counterparties | Receivables Sold (In Thousands) | Amounts Collected (In Thousands) | Advances Received At Year-end (In Thousands) | Interest Rates on Advances Received (%) | Credit Line (In Thousands) | |||||||||
| Year ended December 31, 2015 | ||||||||||||||
| Citi bank | US$ 78,804 | US$ 36,955 | US$ 41,849 | 1.30 | % | US$ 92,000 | ||||||||
| Year ended December 31, 2014 | ||||||||||||||
| Citi bank | US$ 103,744 | US$ 103,744 | - | - | US$ 92,000 | |||||||||
Pursuant to the factoring agreement, losses from commercial disputes (such as sales returns and discounts) should be borne by the Company, while losses from credit risk should be borne by the banks. The Company also issued promissory notes to the banks for commercial disputes which remained undrawn since. The promissory notes both amounted to US$5,000 thousand as of December 31, 2015
-31-
and 2014. As of December 31, 2015, there was no significant losses from commercial disputes in the past and the Company does not expect any significant commercial dispute losses in the foreseeable future.
| 10. | INVENTORIES |
| December 31 | ||||||||
| 2015 | 2014 | |||||||
| NT$ | NT$ | |||||||
| Finished goods | $ | 243,240 | $ | 245,301 | ||||
| Work in process | 241,352 | 209,411 | ||||||
| Raw materials | 2,898,215 | 3,467,274 | ||||||
| Supplies | 335,229 | 316,515 | ||||||
| Raw materials and supplies in transit | 51,072 | 85,167 | ||||||
| $ | 3,769,108 | $ | 4,323,668 | |||||
The cost of inventories recognized as operating costs for the years ended December 31, 2015 and 2014 were NT$69,059,001 thousand and NT$67,301,431 thousand, respectively, which included write-downs of inventories at NT$275,232 thousand and NT$170,555 thousand, respectively.
| 11. | INVESTMENTS ACCOUNTED FOR USING THE EQUITY METHOD |
| December 31 | ||||||||
| 2015 | 2014
(Adjusted)
| |||||||
| NT$ | NT$ | |||||||
| Investments in subsidiaries | $ | 152,571,261 | $ | 137,561,086 | ||||
| Investments in associates | 36,809,068 | 1,492,441 | ||||||
| Investments in joint ventures | 613,841 | - | ||||||
| $ | 189,994,170 | $ | 139,053,527 | |||||
| a. | Investments in subsidiaries |
| December 31 | ||||||||||||||||
| 2015 | 2014 | |||||||||||||||
| Amount | % of Owner- ship | Amount | % of Owner- ship | |||||||||||||
| J & R Holding Limited (J&R Holding) | $ | 47,271,666 | 100.0 | $ | 45,150,697 | 100.0 | ||||||||||
| USI Inc. (“USIINC”) | 44,733,359 | 99.2 | - | - | ||||||||||||
| ASE Test, Inc. | 29,586,903 | 100.0 | 26,943,800 | 100.0 | ||||||||||||
| A.S.E. Holding Limited (ASE Holding) | 15,251,124 | 100.0 | 14,367,500 | 100.0 | ||||||||||||
(Continued)
-32-
| December 31 | ||||||||||||||||
| 2015 | 2014 | |||||||||||||||
| Amount | % of Owner- ship | Amount | % of Owner- ship | |||||||||||||
| Omniquest Industrial Limited (Omniquest) | $ | 11,140,252 | 70.6 | $ | 11,045,479 | 70.6 | ||||||||||
| Innosource Limited (Innosource) | 3,998,959 | 100.0 | 3,966,042 | 100.0 | ||||||||||||
| Luchu Development Corporation (“Luchu”) | 1,332,571 | 67.1 | 1,315,623 | 67.1 | ||||||||||||
| Universal Scientific Industrial Co., Ltd. (“USI”) | 1,187,548 | 99.0 | 36,706,080 | 99.2 | ||||||||||||
| ASE Marketing & Service Japan Co., Ltd. (ASE MS Japan) | 27,986 | 100.0 | 24,972 | 100.0 | ||||||||||||
| 154,530,368 | 139,520,193 | |||||||||||||||
| Less : Shares held by subsidiaries accounted for as treasury shares | 1,959,107 | 1,959,107 | ||||||||||||||
| $ | 152,571,261 | $ | 137,561,086 | |||||||||||||
(Concluded)
In November 2014, a subsidiary of the Company, Universal Scientific Industrial (Shanghai) Co., Ltd. (“USISH”), completed its cash capital increase and the Company’s shareholdings of USISH decreased from 88.6% to 82.1% since the Company and its subsidiaries did not subscribe for additional new shares. The transaction was accounted for as an equity transaction since the Company did not cease to have control over USISH and, as a result, in the fourth quarter of 2014, capital surplus was increased by NT$6,877,099 thousand (after adjusted).
To enhance operational flexibility via structural adjustments, the board of directors of the Company’s subsidiary, USI, approved to spin-off its investment business as well as capital reduction of NT$16,012,966 thousand by reducing 1,601,297 thousand shares (a reduction ratio of 97.56%), and would transfer its investment business to USIINC, a newly established business entity. The record date of the spin-off was April 1, 2015. USI completed the registration process of capital reduction on April 17, 2015 and USIINC also completed the registration of the incorporation on the same date. Based on the consideration of the business value to be spun-off by USI, USIINC issued 1,000,000 thousand new ordinary shares to the shareholders of USI. Based on the shareholdings on the record date of the spin-off, the shareholders of USI received 609.27 shares of USIINC’s ordinary share in exchange of each 1,000 shares of USI’s ordinary share. As of December 31, 2015, the Company received 990,081 thousand ordinary shares of USIINC and the shareholdings were 99.2%.
In April 2015, a subsidiary of the Company, USI Enterprise Limited, sold its shareholdings of 54,000 thousand ordinary shares of USISH amounting to CNY1,992,060 thousand and, as a result, the Company’s shareholdings of USISH decreased from 82.1% to 77.2%. The transaction was accounted for as an equity transaction since the Company did not cease to have control over USISH and, as a result, capital surplus was increased by NT$7,197,510 thousand in the second quarter of 2015.
In September 2015, the board of directors of the Company approved a disposal of 39,603 thousand USI’s ordinary shares at NT$20 per share held by the Company to its subsidiary, Universal Global Scientific Industrial Co., Ltd (UGTW), amounting to NT$792,064 thousand which was based on the earnings per share of the USI’s audited financial statements as of June 30, 2015. The disposal of USI’s ordinary shares was then approved by Investment Commission of Ministry of Economic Affairs in February 2016.
The shareholders of USIE approved in December 2015 to repurchase 4,500,820 USIE’s outstanding ordinary shares at US$18.82 per share. The board of directors of USIE resolved in February 2016 to
-33-
cancel the repurchased shares on February 17, 2016, the record date for the capital reduction.
The Company’s share of profit or loss and other comprehensive income or loss of the subsidiaries for the years ended December 31, 2015 and 2014 were based on those subsidiaries’ audited financial statements for the same years.
| b. | Investments in associates |
| 1) | Investments in associates accounted for using the equity method consisted of the following: |
| Operating | Carrying Amount as of December 31 | |||||||||||
| Name of Associate | Main Business | Location | 2015 | 2014 | ||||||||
| NT$ | NT$ | |||||||||||
| Material associate | ||||||||||||
| Siliconware Precision Industries Co., Ltd. (“SPIL”) | Engaged in assembly, testing and turnkey services of integrated circuits | ROC | $ | 35,423,058 | $ | - | ||||||
| Associates that are not individually material | ||||||||||||
| Hung Ching Development & Construction Co. (“HC”) | Engaged in the development, construction and leasing of real estate properties | ROC | 1,313,499 | 1,351,400 | ||||||||
| Hung Ching Kwan Co. (“HCK”) | Engaged in the leasing of real estate properties | ROC | 332,444 | 342,138 | ||||||||
| Advanced Microelectronic Products Inc. (“AMPI”) | Engaged in integrated circuit | ROC | 40,216 | 99,052 | ||||||||
| 37,109,217 | 1,792,590 | |||||||||||
| Less: Deferred gain on transfer of land | 300,149 | 300,149 | ||||||||||
| $ | 36,809,068 | $ | 1,492,441 | |||||||||
2) At each balance sheet date, the percentages of ownership held by the Group were as follows:
| December 31 | ||||||||
| 2015 | 2014 | |||||||
| SPIL | 24.99 | % | - | |||||
| HC | 26.22 | % | 26.22 | % | ||||
| AMPI | 18.24 | % | 18.24 | % | ||||
| HCK | 27.31 | % | 27.31 | % | ||||
| 3) | In September 2015, the Company acquired 725,749 thousand ordinary shares and 10,650 thousand units of ADS (one ADS represents five ordinary shares) of SPIL at NT$45 per ordinary share. The percentage of ownership was 24.99% and, as a result, the Company obtained significant influence over SPIL. As of December 31, 2015, the Company has not completed the calculation of the difference between the cost of the investment and the Company’s share of the net fair value of SPIL’s identifiable assets and liabilities. |
In December 2015, the Company’s board of directors resolved to purchase additional ordinary shares (including ordinary shares represented by ADS) of SPIL up to 770,000 thousand shares, accounting for approximately 24.71% of the outstanding ordinary shares of SPIL, through a tender offer for a consideration of NT$55 per ordinary share and NT$275 per ADS from December 29, 2015 to February 16, 2016. Since the Fair Trade Commission of the ROC is still reviewing the application for the combination between the Company and SPIL, the Company has extended the period of the tender offer from February 16, 2016 to March 17, 2016.
| 4) | In January 2014, the Company acquired additional ordinary shares of AMPI in a private placement and, as a result, obtained significant influence over AMPI. The private-placement ordinary shares |
-34-
were restricted for disposal during a 3-year lock-up period.
| 5) | Fair values (Level 1 inputs in terms of IFRS 13) of investments in associates with available published price quotation are summarized as follows: |
| December 31 | ||||||||
| 2015 | 2014 | |||||||
| NT$ | NT$ | |||||||
| SPIL | $ | 40,741,700 | $ | - | ||||
| HC | $ | 1,149,549 | $ | 1,427,499 | ||||
| AMPI | $ | 104,255 | $ | 184,862 | ||||
| 6) | Summarized financial information in respect of the Company’s material associate is set out below. The summarized financial information below represents amounts shown in SPIL’s consolidated financial statements prepared in accordance with the Regulations Governing the Preparation of Financial Reports by Securities Issuers and IFRSs as endorsed by the FSC, and adjusted by the Company for equity accounting purposes. |
| December 31, 2015 | ||||
| NT$ | ||||
| Current assets | $ | 48,785,212 | ||
| Non-current assets | 74,460,018 | |||
| Current liabilities | (30,677,239 | ) | ||
| Non-current liabilities | (21,967,349 | ) | ||
| Equity | $ | 70,600,642 | ||
| Proportion of the Company’s ownership interest in SPIL | 24.99 | % | ||
| Equity attributable to the Company | $ | 17,643,100 | ||
| The difference between investment cost and net equity | 17,779,958 | |||
| Carrying amount of the Company’s ownership interest in SPIL | $ | 35,423,058 | ||
For the Year Ended December 31, 2015 | ||||
| NT$ | ||||
| Operating revenue | $ | 82,839,922 | ||
| Net profit for the year | $ | 8,762,257 | ||
| Other comprehensive loss for the year | (906,053 | ) | ||
| Total comprehensive income for the year | $ | 7,856,204 | ||
The investments accounted for using the equity method and the share of profit or loss and other comprehensive income of the investments in associates for the years ended December 31, 2015 and 2014 was based on the associates’ financial statements audited by the auditors for the same years.
-35-
| 7) | Aggregate information of associates that are not individually material |
| For the Year Ended December 31 | ||||||||
| 2015 | 2014 | |||||||
| NT$ | NT$ | |||||||
| The Company’s share of: | ||||||||
| Net profit for the year | $ | 115,857 | $ | 147,085 | ||||
| Other comprehensive income (loss) for the year | (2,916 | ) | 234,125 | |||||
| Total comprehensive income for the year | $ | 112,941 | $ | 381,210 | ||||
| c. | Investments in joint ventures |
| 1) | Investment in joint ventures that are not individually material accounted for using the equity method consisted of the following: |
| December 31, 2015 | ||||||||||||
| Name of Joint Venture | Main Business | Operating Location | Percentages of Ownership | Carrying Amount | ||||||||
| NT$ | ||||||||||||
| ASE Embedded Electronics Inc. (“ASEEE”) | Engaged in the production of embedded substrate | ROC | 51.00 | % | $ | 613,841 | ||||||
In May 2015, the Company and TDK Corporation (“TDK”) entered into an agreement to establish a joint venture to invest in ASEEE. In August 2015, the Company invested NT$618,097 thousand for 51.00% shareholding in ASEEE. According to the joint arrangement, the Company and TDK must act together to direct the relevant operating activities and, as a result, the Company does not control ASEEE. The investment in ASEEE is accounted for using the equity method.
| 2) | Aggregate information of joint venture that is not individually material |
For the Year Ended December 31, 2015 | ||||
| NT$ | ||||
| The Company’s share of: | ||||
| Net loss for the year | $ | (4,274 | ) | |
| Other comprehensive income for the year | - | |||
| Total comprehensive loss for the year | $ | (4,274 | ) | |
The investments accounted for using the equity method and the share of profit or loss and other comprehensive income for the investments in joint ventures for the year ended December 31, 2015 was based on ASEEE’s financial statements audited by the auditors for the same year.
| 12. | PROPERTY, PLANT AND EQUIPMENT |
The carrying amounts of each class of property, plant and equipment were as follows:
-36-
| December 31 | ||||||||
| 2015 | 2014 | |||||||
| NT$ | NT$ | |||||||
| Land | $ | 1,562,945 | $ | 1,562,945 | ||||
| Buildings and improvements | 30,722,699 | 25,952,734 | ||||||
| Machinery and equipment | 44,069,302 | 47,020,338 | ||||||
| Transportation equipment | 17,136 | 18,264 | ||||||
| Office equipment | 443,563 | 384,448 | ||||||
| Construction in progress and machinery in transit | 3,560,050 | 2,702,266 | ||||||
| $ | 80,375,695 | $ | 77,640,995 | |||||
For the year ended December 31, 2015
| Land | Buildings and improvements | Machinery and equipment | Transportation equipment | Office equipment | Construction in progress and machinery in transit | Total | ||||||||||||||||||||||
| NT$ | NT$ | NT$ | NT$ | NT$ | NT$ | NT$ | ||||||||||||||||||||||
| Cost | ||||||||||||||||||||||||||||
| Balance at January 1, 2015 | $ | 1,562,945 | $ | 38,879,974 | $ | 110,668,151 | $ | 81,014 | $ | 1,348,053 | $ | 2,709,430 | $ | 155,249,567 | ||||||||||||||
| Additions | - | (16,412 | ) | 103,847 | 3,750 | 28,899 | 17,531,501 | 17,651,585 | ||||||||||||||||||||
| Disposals | - | (115,669 | ) | (3,111,192 | ) | (16,004 | ) | (20,717 | ) | (12,032 | ) | (3,275,614 | ) | |||||||||||||||
| Reclassification | - | 6,973,887 | 9,474,817 | 3,002 | 205,779 | (16,657,485 | ) | - | ||||||||||||||||||||
| Balance at December 31, 2015 | $ | 1,562,945 | $ | 45,721,780 | $ | 117,135,623 | $ | 71,762 | $ | 1,562,014 | $ | 3,571,414 | $ | 169,625,538 | ||||||||||||||
| Accumulated depreciation and impairment | ||||||||||||||||||||||||||||
| Balance at January 1, 2015 | $ | - | $ | 12,927,240 | $ | 63,647,813 | $ | 62,750 | $ | 963,605 | $ | 7,164 | $ | 77,608,572 | ||||||||||||||
| Depreciation expense | - | 2,095,142 | 12,360,166 | 7,130 | 168,424 | - | 14,630,862 | |||||||||||||||||||||
| Impairment losses recognized | - | 76,792 | 15,977 | - | - | 4,200 | 96,969 | |||||||||||||||||||||
| Disposals | - | (100,093 | ) | (2,957,635 | ) | (15,254 | ) | (13,578 | ) | - | (3,086,560 | ) | ||||||||||||||||
| Balance at December 31, 2015 | $ | - | $ | 14,999,081 | $ | 73,066,321 | $ | 54,626 | $ | 1,118,451 | $ | 11,364 | $ | 89,249,843 | ||||||||||||||
For the year ended December 31, 2014
| Land | Buildings and improvements | Machinery and equipment | Transportation equipment | Office equipment | Construction in progress and machinery in transit | Total | ||||||||||||||||||||||
| NT$ | NT$ | NT$ | NT$ | NT$ | NT$ | NT$ | ||||||||||||||||||||||
| Cost | ||||||||||||||||||||||||||||
| Balance at January 1, 2014 | $ | 1,562,945 | $ | 30,805,750 | $ | 95,019,106 | $ | 76,216 | $ | 1,162,701 | $ | 1,878,227 | $ | 130,504,945 | ||||||||||||||
| Additions | - | (7,955 | ) | 535,770 | - | 37,838 | 27,006,561 | 27,572,214 | ||||||||||||||||||||
| Disposals | - | (254,885 | ) | (2,459,275 | ) | (4,545 | ) | (90,841 | ) | (18,046 | ) | (2,827,592 | ) | |||||||||||||||
| Reclassification | - | 8,337,064 | 17,572,550 | 9,343 | 238,355 | (26,157,312 | ) | - | ||||||||||||||||||||
| Balance at December 31, 2014 | $ | 1,562,945 | $ | 38,879,974 | $ | 110,668,151 | $ | 81,014 | $ | 1,348,053 | $ | 2,709,430 | $ | 155,249,567 | ||||||||||||||
| Accumulated depreciation and impairment | ||||||||||||||||||||||||||||
| Balance at January 1, 2014 | $ | - | $ | 11,376,605 | $ | 55,020,800 | $ | 60,619 | $ | 924,749 | $ | - | $ | 67,382,773 | ||||||||||||||
| Depreciation expense | - | 1,715,421 | 10,816,943 | 5,946 | 129,644 | - | 12,667,954 | |||||||||||||||||||||
| Impairment losses recognized | - | 42,988 | 111,507 | - | - | 7,164 | 161,659 | |||||||||||||||||||||
| Disposals | - | (207,774 | ) | (2,301,437 | ) | (3,815 | ) | (90,788 | ) | - | (2,603,814 | ) | ||||||||||||||||
| Balance at December 31, 2014 | $ | - | $ | 12,927,240 | $ | 63,647,813 | $ | 62,750 | $ | 963,605 | $ | 7,164 | $ | 77,608,572 | ||||||||||||||
Each class of property, plant and equipment was depreciated on a straight-line basis over the following useful lives:
| Buildings and improvements | ||
| Main plant buildings | 10-40 years | |
| Cleanrooms | 10-20 years | |
| Others | 3-20 years | |
| Machinery and equipment | 2-10 years | |
| Transportation equipment | 2-5 years | |
| Office equipment | 2-8 years |
-37-
| 13. | OTHER INTANGIBLE ASSETS |
Other intangible assets are mainly computer software and the movements were as follows:
For the year ended December 31, 2015
| Cost | Accumulated Amortization and Impairment | Carrying Amount | ||||||||||
| NT$ | NT$ | NT$ | ||||||||||
| Balance at January 1, 2015 | $ | 1,500,492 | $ | 1,014,300 | $ | 486,192 | ||||||
| Addition /Amortization | 308,562 | 139,065 | 169,497 | |||||||||
| Disposals | (30 | ) | (30 | ) | - | |||||||
| Balance at December 31, 2015 | $ | 1,809,024 | $ | 1,153,335 | $ | 655,689 | ||||||
For the year ended December 31, 2014
| Cost | Accumulated Amortization and Impairment | Carrying Amount | ||||||||||
| NT$ | NT$ | NT$ | ||||||||||
| Balance at January 1, 2014 | $ | 2,293,750 | $ | 1,899,991 | $ | 393,759 | ||||||
| Addition /Amortization | 202,242 | 109,809 | 92,433 | |||||||||
| Disposals | (995,500 | ) | (995,500 | ) | - | |||||||
| Balance at December 31, 2014 | $ | 1,500,492 | $ | 1,014,300 | $ | 486,192 | ||||||
The aforementioned intangible assets were amortized on a straight-line basis over the useful lives from 2 to 5 years.
| 14. | BORROWINGS |
| a. | Short-term borrowings |
Short-term borrowings mainly represented unsecured revolving bank loans with annual interest rates at 0.68%-0.85% and 0.82%-1.10% as of December 31, 2015 and 2014, respectively.
| b. | Short-term bills payable |
Short-term bills payable outstanding as of December 31, 2015 represented commercial papers NT$4,350,000 thousand less unamortized discounts of NT$1,946 thousand with annual interest rate at 0.78%. The commercial papers were secured by China Bills Finance Corporation and Mega Bills Finance Corporation.
| c. | Long-term borrowings |
| 1) | Bank loans |
The long-term bank loans are working capital mainly with floating interest rates and consisted of the followings:
-38-
| December 31 | ||||||||
| 2015 | 2014 | |||||||
| NT$ | NT$ | |||||||
| Syndicated bank loans - repayable through July 2016 to July 2018, annual interest rates were 1.56% and 0.90%-1.41% as of December 31, 2015 and 2014, respectively | $ | 11,160,500 | $ | 9,155,893 | ||||
| Others - repayable through February 2017 to August 2019, annual interest rates were 0.90%-1.26% and 1.03%-1.28% as of December 31, 2015 and 2014, respectively | 24,283,112 | 10,315,500 | ||||||
| 35,443,612 | 19,471,393 | |||||||
| Less: unamortized arrangement fee | 17,994 | 30,696 | ||||||
| Less: current portion | - | 1,085,143 | ||||||
| $ | 35,425,618 | $ | 18,355,554 | |||||
Pursuant to the above syndicated bank loans agreements, the Company should maintain certain financial covenants including current ratio, leverage ratio, tangible net assets and interest coverage ratio. Such financial ratios are calculated based on the annual audited consolidated financial statements or semi-annual reviewed consolidated financial statements of the Company and its subsidiaries. The Company was in compliance with all of the loan covenants as of December 31, 2015 and 2014.
The Company had sufficient long term credit facility obtained before December 31, 2015 to refinance a portion of loans on a long-term basis. Therefore, NT$2,105,883 thousand was not classified as current portion of long-term borrowings as of December 31, 2015.
| 2) | Bills payable – only as of December 31, 2015 |
Long-term bills payable represented unsecured commercial paper NT$2,000,000 thousand less unamortized discounts of NT$1,011 thousand with annual interest rate at 1.03% as of December 31, 2015. The commercial paper contract was entered into with Ta Ching Bills Finance Corporation and the duration is 3 years.
| 15. | BONDS PAYABLE |
| December 31 | ||||||||
| 2015 | 2014 | |||||||
| NT$ | NT$ | |||||||
| Secured domestic bonds - secured by banks | ||||||||
| Repayable at maturity in August 2016 and interest due annually with annual interest rate 1.45% | $ | 8,000,000 | $ | 8,000,000 | ||||
| Unsecured convertible overseas bonds | ||||||||
| US$400,000 thousand | 13,130,000 | 12,660,000 | ||||||
| US$200,000 thousand (linked to New Taiwan dollar) | 6,185,600 | - | ||||||
| 27,315,600 | 20,660,000 | |||||||
| Less: Discounts on bonds payable | 1,214,514 | 1,389,387 | ||||||
| Current portion | 12,162,192 | - | ||||||
| $ | 13,938,894 | $ | 19,270,613 | |||||
-39-
The Company had sufficient long term credit facility obtained before December 31, 2015 to refinance a portion of the bonds payable on a long-term basis. Therefore, NT$8,000,000 thousand was not classified as current portion of bonds payable as of December 31, 2015.
| a. | In September 2013, the Company offered the third unsecured convertible overseas bonds (the “Bonds”) in US$400,000 thousand. The Bonds is zero coupon bonds with the maturity of 5 years, in denominations of US$200 thousand or in any integral multiples thereof. Each holder of the Bonds has the right at any time on or after October 16, 2013 and up to (and including) August 26, 2018, except during legal lock-up period, to convert the Bonds into newly issued listed common shares at the conversion price NT$33.085, determined on the basis of a fixed exchange rate of US$1 to NT$29.956. The conversion price will be adjusted in accordance with the conversion provisions due to anti-dilution clause. As of December 31, 2015 and 2014, the conversion price was NT$30.28 and NT$31.93, respectively. |
The Bonds may be redeemed at the option of the Company, in whole or in part, at any time on or after the third anniversary of the offering date provided that (1) the closing price, translated into U.S. dollars, of the common shares for a period of 20 consecutive trading days is at least 130% of the conversion price, (2) at least 90% in aggregate principal amount of the Bonds originally outstanding has been redeemed, repurchased and canceled or converted, or (3) the Company is required to pay additional taxes on the Bonds as a result of certain changes in tax laws in the ROC.
Each holder shall have the right to request the Company repurchase all or any portion of the principal amount thereof of a holder’s Bonds (1) on the third anniversary of the offering date, (2) in the event of a change of control, or (3) in the event of delisting.
The Bonds contained a debt host contract, recognized as bonds payable, and the conversion option, redemption option and put option (collectively the “Bonds Options”) aggregately recognized as financial liabilities at FVTPL. The effective interest rate of the debt host contract was 3.16% and the aggregate fair value of the Bonds Options was NT$1,667,950 thousand on initial recognition.
| b. | In July 2015, the Company offered the forth unsecured convertible overseas bonds (the “Currency Linked Bonds”) in US$200,000 thousand. The Currency Linked Bonds is zero coupon bonds with the maturity of 2.75 years, in denominations of US$200 thousand or in any integral multiples thereof. Repayment, redemption and put amount denominated in U.S. dollar will be converted into New Taiwan dollar amount using a fixed exchange rate of US$1 to NT$30.928 (the “Fixed Exchange Rate”) and then converted back to U.S. dollar amount using the applicable prevailing rate at the time of repayment, redemption or put. Each holder of the Currency Linked Bonds has the right at any time on or after August 11, 2015 and up to (and including) March 17, 2018, except during legal lock-up period, to convert the Currency Linked Bonds into common shares at the conversion price NT$54.55, determined on the basis of the Fixed Exchange Rate. The Company’s treasury shares will be available for delivery upon conversion of the Currency Linked Bonds. The conversion price will be adjusted in accordance with the conversion provisions due to anti-dilution clause. As of December 31, 2015, the conversion price was NT$51.73. |
The Currency Linked Bonds may be redeemed at the option of the Company, in whole or in part, at any time on or after March 19, 2018 provided that (1) the closing price, translated into U.S. dollars, of the common shares for a period of 20 out of 30 consecutive trading days is at least 130% of the conversion price, (2) at least 90% in aggregate principal amount of the Currency Linked Bonds originally outstanding has been redeemed, repurchased and canceled or converted, or (3) the Company is required to pay additional taxes on the Currency Linked Bonds as a result of certain changes in tax laws in the ROC.
Each holder shall have the right to request the Company repurchase all or any portion of the principal amount thereof of a holder’s Currency Linked Bonds (1) in the event of a change of control, or (2) in the event of delisting.
-40-
The Currency Linked Bonds contained a debt host contract, recognized as bonds payable, and the conversion option, recognized as capital surplus. The effective interest rate of the debt host contract was 1.58% and the fair value of the conversion option was NT$214,022 thousand on initial recognition.
| 16. | OTHER PAYABLES |
| December 31 | ||||||||
| 2015 | 2014 | |||||||
| NT$ | NT$ | |||||||
| Payables for property, plant and equipment | $ | 2,888,533 | $ | 3,445,582 | ||||
| Accrued salary and bonus | 2,379,823 | 2,388,850 | ||||||
| Accrued bonus to employees or employees’ compensation and remuneration to directors and supervisors | 2,218,000 | 2,548,130 | ||||||
| Others | 3,079,235 | 3,969,513 | ||||||
| $ | 10,565,591 | $ | 12,352,075 | |||||
The Company and its subsidiary, ASE US, reached the final settlement agreement with Tessera Inc. (“Tessera”) in October 2014 to resolve the patent infringement lawsuit, and Tessera has dismissed all claims against the Company and ASE US. The final settlement amount was NT$814,185 thousand (US$27,000 thousand as resolved in the final settlement agreement in October 2014) and paid in January 2015.
| 17. | RETIREMENT BENEFIT PLANS |
| a. | Defined contribution plans |
The pension plan under the ROC Labor Pension Act (“LPA”) is a government-managed defined contribution plan. Based on the LPA, the Company makes monthly contributions to employees’ individual pension accounts at 6% of their monthly salaries.
| b. | Defined benefit plans |
| 1) | The Company joined the defined benefit pension plan under the ROC Labor Standards Law operated by the government. Pension benefits are calculated on the basis of the length of service and average monthly salaries of the last six months before retirement. The Company makes contributions based on a certain percentage of their domestic employees’ monthly salaries to a pension fund administered by the pension fund monitoring committee. Pension contributions are deposited in the Bank of Taiwan in the committee’s name and are managed by the Bureau of Labor Funds, Ministry of Labor (“the Bureau”); the Company has no right to influence the investment policy and strategy. Before the end of each year, the Company assesses the balance in the pension fund. If the amount of the balance in the pension fund is inadequate to pay retirement benefits for employees who conform to retirement requirements in the next year, the Company is required to fund the difference in one appropriation that should be made before the end of March of the next year. |
| 2) | The Company maintains pension plans for executive managers. Pension costs under the plans were NT$1,180 thousand and NT$5,297 thousand for the years ended December 31, 2015 and 2014, respectively. Pension payments were NT$2,549 thousand and NT$15,315 thousand for the years ended December 31, 2015 and 2014, respectively. In addition, NT$18,457 thousand of the accrued pension liabilities for executive managers was transferred from its subsidiary, ASE Test, Inc. As of December 31, 2015 and 2014, accrued pension liabilities for executive managers were NT$134,261 thousand and NT$117,173 thousand, respectively. |
-41-
| 3) | The amounts included in the parent company only balance sheets arising from the Company’s obligation in respect of its defined benefit plans excluding those for executive managers were as follows: |
| December 31 | ||||||||
| 2015 | 2014 (Adjusted) | |||||||
| NT$ | NT$ | |||||||
| Present value of funded defined benefit obligation | $ | 3,634,267 | $ | 3,660,738 | ||||
| Fair value of plan assets | (1,467,174 | ) | (1,348,084 | ) | ||||
| Present value of unfunded defined benefit obligation | 2,167,093 | 2,312,654 | ||||||
| Recorded under others payables | (14,282 | ) | (14,173 | ) | ||||
| Net defined benefit liability | $ | 2,152,811 | $ | 2,298,481 | ||||
| 4) | Movements in net defined benefit liability (asset) were as follows: |
| Present value of the defined benefit obligation | Fair value of the plan assets | Net defined benefit liability (asset) | ||||||||||
| NT$ | NT$ | NT$ | ||||||||||
| Balance at January 1, 2015 | $ | 3,660,738 | $ | (1,348,084 | ) | $ | 2,312,654 | |||||
| Service cost | ||||||||||||
| Current service cost | 36,899 | - | 36,899 | |||||||||
| Net interest expense (income) | 81,249 | (31,356 | ) | 49,893 | ||||||||
| Recognized in profit or loss | 118,148 | (31,356 | ) | 86,792 | ||||||||
| Remeasurement | ||||||||||||
| Return on plan assets (excluding amounts included in net interest) | - | (4,226 | ) | (4,226 | ) | |||||||
| Actuarial loss arising from changes in financial assumptions | 152,319 | - | 152,319 | |||||||||
| Actuarial gain arising from experience adjustments | (168,955 | ) | - | (168,955 | ) | |||||||
| Actuarial gain arising from changes in demographic assumptions | (18,848 | ) | - | (18,848 | ) | |||||||
| Recognized in other comprehensive income | (35,484 | ) | (4,226 | ) | (39,710 | ) | ||||||
| Contributions from the employer | - | (192,643 | ) | (192,643 | ) | |||||||
Benefits paid from the pension fund | (109,135 | ) | 109,135 | - | ||||||||
| Balance at December 31, 2015 | $ | 3,634,267 | $ | (1,467,174 | ) | $ | 2,167,093 | |||||
(Continued)
-42-
| Present value of the defined benefit obligation | Fair value of the plan assets | Net defined benefit liability (asset) | ||||||||||
| NT$ | NT$ | NT$ | ||||||||||
| Balance at January 1, 2014 | $ | 3,594,640 | $ | (1,211,581 | ) | $ | 2,383,059 | |||||
| Service cost | ||||||||||||
| Current service cost | 48,735 | - | 48,735 | |||||||||
| Past service cost | (10,796 | ) | - | (10,796 | ) | |||||||
| Net interest expense (income) | 76,376 | (27,076 | ) | 49,300 | ||||||||
| Recognized in profit or loss | 114,315 | (27,076 | ) | 87,239 | ||||||||
| Remeasurement | ||||||||||||
| Return on plan assets (excluding amounts included in net interest) | - | (1,594 | ) | (1,594 | ) | |||||||
| Actuarial gain arising from changes in financial assumptions | (83,726 | ) | - | (83,726 | ) | |||||||
| Actuarial loss arising from experience adjustments | 112,922 | - | 112,922 | |||||||||
| Recognized in other comprehensive income | 29,196 | (1,594 | ) | 27,602 | ||||||||
| Contributions from the employer | - | (185,246 | ) | (185,246 | ) | |||||||
Benefits paid from the pension fund
| (77,413 | ) | 77,413 | - | ||||||||
| Balance at December 31, 2014 | $ | 3,660,738 | $ | (1,348,084 | ) | $ | 2,312,654 | |||||
(Concluded)
| 5) | Through the defined benefit plans under the Labor Standards Law, the Company is exposed to the following risks: |
| a) | Investment risk |
The plan assets are invested in equity and debt securities, bank deposits, etc. The investment is conducted at the discretion of the Bureau or under the mandated management. However, in accordance with relevant regulations, the return generated by plan assets should not be below the interest rate for a 2-year time deposit with local banks.
| b) | Interest risk |
A decrease in the government bond interest rate will increase the present value of the defined benefit obligation; however, this will be partially offset by an increase in the return on the plan’s debt investments.
| c) | Salary risk |
The present value of the defined benefit obligation is calculated by reference to the future salaries of plan participants. As such, an increase in the salary of the plan participants will increase the present value of the defined benefit obligation.
-43-
| 6) | Except the pension plans for executive managers, the key assumptions used for the actuarial valuations were as follow: |
| December 31 | ||||||||
| 2015 | 2014 | |||||||
| Discount rates (%) | 1.90 | 2.25 | ||||||
| Expected rates of salary increase (%) | 2.75-3.00 | 2.75-3.00 | ||||||
Significant actuarial assumptions for the determination of the defined obligation are discount rates and expected rates of salary increase. The sensitivity analysis below has been determined based on reasonably possible changes of the respective assumptions occurring at each balance sheet date, while holding all other assumptions constant.
| December 31, 2015 | ||||
| NT$ | ||||
| Discount Rate | ||||
| 0.5% higher | $ | (213,385 | ) | |
| 0.5% lower | $ | 236,088 | ||
| Expected rates of salary increase | ||||
| 0.5% higher | $ | 232,856 | ||
| 0.5% lower | $ | (212,647 | ) | |
The sensitivity analysis presented above may not be representative of the actual change in the defined benefit obligation as it is unlikely that the change in assumptions would occur in isolation of one another as some of the assumptions may be correlated.
| 7) | As of December 31, 2015 and 2014, the average duration of the defined benefit obligation excluding those for executive managers of the Company was both 12 years; furthermore, the Company expects to make contributions of NT$206,280 thousand and NT$190,394 thousand to the defined benefit plans in the next year starting from January 1, 2016 and 2015, respectively. |
| 8) | Maturity analysis of undiscounted pension benefit |
| December 31 | ||||||||
| 2015 | 2014 | |||||||
| NT$ | NT$ | |||||||
| No later than 1 year | $ | 100,459 | $ | 99,330 | ||||
| Later than 1 year and not later than 5 years | 533,315 | 522,113 | ||||||
| Later than 5 years | 4,434,125 | 4,828,451 | ||||||
| $ | 5,067,899 | $ | 5,449,894 | |||||
-44-
| 18. | EQUITY |
| a. | Share capital |
Ordinary shares
| December 31 | ||||||||
| 2015 | 2014 | |||||||
| Numbers of shares authorized (in thousands) | 10,000,000 | 10,000,000 | ||||||
| Numbers of shares reserved (in thousands) | ||||||||
| Employee share options | 800,000 | 800,000 | ||||||
| Shares authorized | $ | 100,000,000 | $ | 100,000,000 | ||||
| Shares reserved | ||||||||
| Employee share options | $ | 8,000,000 | $ | 8,000,000 | ||||
| Numbers of shares registered (in thousands) | 7,902,929 | 7,852,538 | ||||||
| Numbers of shares subscribed in advance (in thousands) | 7,499 | 9,187 | ||||||
| Number of shares issued and fully paid (in thousands) | 7,910,428 | 7,861,725 | ||||||
| Shares registered | $ | 79,029,290 | $ | 78,525,378 | ||||
| Shares subscribed in advance | 156,370 | 189,801 | ||||||
| Shares issued | $ | 79,185,660 | $ | 78,715,179 | ||||
The holders of issued ordinary shares with a par value at $10 per share are entitled the right to vote and receive dividends, except the shares held by the Company’s subsidiaries which are not entitled the right to vote. As of December 31, 2015 and 2014, there were 500,000 thousand ordinary shares included in the authorized shares that were not yet required to complete the share registration process.
American Depositary Receipts
The Company issued ADSs and each ADS represents five ordinary shares. As of December 31, 2015 and 2014, 115,240 thousand and 125,731 thousand ADSs were outstanding and represented approximately 576,198 thousand and 628,657 thousand ordinary shares of the Company, respectively.
| b. | Capital surplus |
| December 31 | ||||||||
| 2015 | 2014 (Adjusted) | |||||||
| NT$ | NT$ | |||||||
May be used to offset a deficit, distributed as cash dividends, or transferred to share capital (1) | ||||||||
| Arising from issuance of ordinary shares | $ | 5,479,616 | $ | 4,946,308 | ||||
| Arising from the difference between consideration received and the carrying amount of the subsidiaries’ net assets during actual disposal or acquisition | 7,197,510 | - | ||||||
(Continued)
-45-
| December 31 | ||||||||
| 2015 | 2014 (Adjusted) | |||||||
| NT$ | NT$ | |||||||
| May be used to offset a deficit only | ||||||||
| Arising from changes in percentage of ownership interest in subsidiaries (2) | $ | 8,489,984 | $ | 9,054,328 | ||||
| Arising from treasury share transactions | 717,355 | 425,004 | ||||||
| Arising from exercised employee share options | 544,112 | 375,448 | ||||||
| Arising from expired employee share options | 3,626 | 3,626 | ||||||
| May not be used for any purpose | ||||||||
| Arising from employee share options | 1,080,590 | 1,178,210 | ||||||
| Arising from equity component of convertible bonds | 214,022 | - | ||||||
| Arising from share of changes in capital surplus of associates | 30,284 | 30,134 | ||||||
| $ | 23,757,099 | $ | 16,013,058 | |||||
(Concluded)
| 1) | Such capital surplus may be used to offset a deficit; in addition, when the Company has no deficit, such capital surplus may be distributed as cash dividends or transferred to share capital (limited to a certain percentage of the Company’s capital surplus and once a year). |
| 2) | Such capital surplus arises from the effect of changes in ownership interest in a subsidiary resulted from equity transactions other than actual disposal or acquisition, or from changes in capital surplus of subsidiaries accounted for by using equity method. |
| c. | Retained earnings and dividend policy |
The Articles of Incorporation of ASE Inc. (the “Articles”) provides that annual net income shall be distributed in the following order:
| 1) | Replenishment of deficits; |
| 2) | 10.0% as legal reserve; |
| 3) | Special reserve appropriated or reversed in accordance with laws or regulations set forth by the authorities concerned; |
| 4) | An amount equal to the excess of the income from investments accounted for using the equity method over cash dividends as special reserve; |
| 5) | Addition or deduction of realized gains or losses on equity instruments at fair value through other comprehensive income; |
| 6) | Not more than 1.0% of the remainder, from 1) to 5), as remuneration to directors; |
| 7) | Between 7.0% to 11.0% of the remainder, from 1) to 5), as bonus to employees, of which 7.0% shall be distributed in accordance with the employee bonus plan and the excess shall be distributed to specified employees at the board of directors’ discretion; and |
| 8) | Any remainder from above as dividends to shareholders. |
-46-
Employees to whom referred in 7) above include employees of subsidiaries that meet certain conditions, which are to be determined by the board of directors.
The Company is currently in the mature growth stage. To meet the capital needs for business development now and in the future and satisfy the shareholders’ demand for cash inflows, the Company shall use residual dividend policy to distribute dividends, of which the cash dividend is not lower than 30% of the total dividend distribution, with the remainder to be distributed in stock. A distribution plan is also to be made by the board of directors and passed for resolution in the shareholders’ meeting.
In accordance with the amendments to the Company Act in May 2015, the recipients of dividends and bonuses are limited to shareholders and do not include employees. Accordingly, the Company expects to make amendments to the Company’s Articles of Incorporation to be approved during the 2016 annual shareholders’ meeting. For information about the accrual basis of the employee compensation and remuneration to directors and supervisors and the actual appropriations, please refer to employee benefits expense under profit before income tax in Note 19(e).
Under Rule No. 1010012865 and Rule No. 1010047490 issued by the FSC and the directive titled “Questions and Answers for Special Reserves Appropriated Following Adoption of IFRSs”, the Company should appropriate or reverse to a special reserve. Any special reserve appropriated may be reversed to the extent that the net debit balance reverses and thereafter distributed.
Appropriation of earnings to legal reserve shall be made until the legal reserve equals the Company’s capital surplus. Legal reserve may be used to offset deficits. If the Company has no deficit and the legal reserve has exceeded 25% of the Company’s capital surplus, the excess may be transferred to capital or distributed in cash.
The appropriations of earnings for 2014 and 2013 resolved at the Company’s annual shareholders’ meetings in June 2015 and June 2014, respectively, were as follows:
| Appropriation of Earnings | Dividends Per Share | |||||||||||
| For Year 2014 | For Year 2013 | For Year 2014 | For Year 2013 | |||||||||
| NT$ | NT$ | NT$ | NT$ | |||||||||
| (in dollars) | (in dollars) | |||||||||||
| Legal reserve | $ | 2,359,267 | $ | 1,568,907 | ||||||||
| Special reserve | - | (309,992 | ) | |||||||||
| Cash dividends | 15,589,825 | 10,156,005 | $2.00 | $1.30 | ||||||||
| $ | 17,949,092 | $ | 11,414,920 | |||||||||
| d. | Special reserve appropriated in accordance with the local regulations |
On January 1, 2013, the Company appropriated to the special reserve of NT$3,353,938 thousand relating to the exchange differences on translating foreign operations transferred to retained earnings in accordance with the local regulations.
-47-
| e. | Accumulated other comprehensive income |
| 1) | Exchange differences on translating foreign operations |
| For the Years Ended December 31 | ||||||||
| 2015 | 2014 (Adjusted) | |||||||
| NT$ | NT$ | |||||||
| Balance at January 1 | $ | 4,541,761 | $ | (525,583 | ) | |||
| Share of exchange difference of subsidiaries, associates and joint venture accounted for using the equity method | (48,191 | ) | 5,067,344 | |||||
| Balance at December 31 | $ | 4,493,570 | $ | 4,541,761 | ||||
| 2) | Unrealized gain on available-for-sale financial assets |
| For the Years Ended December 31 | ||||||||
| 2015 | 2014 | |||||||
| NT$ | NT$ | |||||||
| Balance at January 1 | $ | 526,778 | $ | 426,246 | ||||
| Unrealized loss arising on revaluation of available-for-sale financial assets | (4,304 | ) | (142,418 | ) | ||||
| Cumulative loss reclassified to profit or loss on disposal of available-for-sale financial assets | 10,827 | 9,561 | ||||||
| Share of unrealized gain on available-for-sale financial assets of associates accounted for using the equity method | 54,818 | 233,389 | ||||||
| Balance at December 31 | $ | 588,119 | $ | 526,778 | ||||
| 3) | Cash flow hedges - for the year ended December 31, 2014 |
| NT$ | ||||
| Balance at January 1 | $ | (3,279 | ) | |
| Share of cash flow hedges of subsidiaries accounted for using the equity method | 3,279 | |||
| Balance at December 31 | $ | - | ||
| f. | Treasury shares (in thousand shares) |
| Balance at | Balance at | |||||||||||||||
| January 1 | Addition | Decrease | December 31 | |||||||||||||
| 2015 | ||||||||||||||||
| Shares held by subsidiaries | 145,883 | - | - | 145,883 | ||||||||||||
| Shares reserved for bonds conversion | - | 120,000 | - | 120,000 | ||||||||||||
| 145,883 | 120,000 | - | 265,883 | |||||||||||||
| 2014 | ||||||||||||||||
| Shares held by subsidiaries | 145,883 | - | - | 145,883 | ||||||||||||
-48-
In February 2015, the board of directors approved to repurchase up to 120,000 thousand of the Company’s ordinary shares which will be used for equity conversion of convertible overseas bonds to be issued in the future. The Company has completed the repurchase during March 2015 and the shares repurchased accounted for 1.53% of the Company’s total issued shares. The average repurchase price was NT$44.45 per share.
The Company’s shares held by its subsidiaries at each balance sheet date were as follows:
Shares Held By Subsidiaries (in thousand shares) | Carrying amount | Fair Value | ||||||||||
| NT$ | NT$ | |||||||||||
| December 31, 2015 | ||||||||||||
| ASE Test | 88,200 | $ | 1,380,721 | $ | 3,351,618 | |||||||
| J&R Holding | 46,704 | 381,709 | 1,774,743 | |||||||||
| ASE Test, Inc. | 10,979 | 196,677 | 417,193 | |||||||||
| 145,883 | $ | 1,959,107 | $ | 5,543,554 | ||||||||
| December 31, 2014 | ||||||||||||
| ASE Test | 88,200 | $ | 1,380,721 | $ | 3,360,438 | |||||||
| J&R Holding | 46,704 | 381,709 | 1,779,413 | |||||||||
| ASE Test, Inc. | 10,979 | 196,677 | 418,291 | |||||||||
| 145,883 | $ | 1,959,107 | $ | 5,558,142 | ||||||||
Fair values of the Company’s shares held by subsidiaries are based on the closing price from an available published price quotation, which is a Level 1 input in terms of IFRS 13, at the balance sheet dates.
The Company issued ordinary shares in connection with its merger with its subsidiaries. The shares held by its subsidiaries were reclassified from investments accounted for using the equity method to treasury shares on the proportion owned by the Company.
Under the Securities and Exchange Act in the ROC, the Company shall neither pledge treasury shares nor exercise shareholders’ rights on these shares, such as rights to dividends and voting. The subsidiaries holding treasury shares, however, retain shareholders’ rights except the rights to participate in any share issuance for cash and voting.
| 19. | PROFIT BEFORE INCOME TAX |
| a. | Other income |
| For the Years Ended December 31 | ||||||||
| 2015 | 2014 | |||||||
| NT$ | NT$ | |||||||
| Interest income – mainly from bank deposit | $ | 7,259 | $ | 6,848 | ||||
| Rental income | 90,996 | 75,395 | ||||||
| Dividends income | 353,099 | 32,126 | ||||||
| $ | 451,354 | $ | 114,369 | ||||
-49-
| b. | Other gains (losses) |
| For the Years Ended December 31 | ||||||||
| 2015 | 2014 | |||||||
| NT$ | NT$ | |||||||
| Net gain arising on financial instruments held for trading | $ | 1,743,638 | $ | 1,571,545 | ||||
| Net gain on financial assets designated as at FVTPL | 345,492 | 164,104 | ||||||
| Loss on disposal of assets | (8,208 | ) | (17,769 | ) | ||||
| Foreign currency exchange losses, net | (750,179 | ) | (1,759,676 | ) | ||||
| Compensation loss | (604,587 | ) | (92,959 | ) | ||||
| Impairment loss | (96,969 | ) | (161,659 | ) | ||||
| Others | 93,250 | 304,457 | ||||||
| $ | 722,437 | $ | 8,043 | |||||
| c. | Finance costs |
| For the Years Ended December 31 | ||||||||
| 2015 | 2014 | |||||||
| NT$ | NT$ | |||||||
| Total interest expense for financial liabilities measured at amortized cost | $ | 1,171,258 | $ | 1,039,746 | ||||
| Less: Amounts included in the cost of qualifying property, plant and equipment | (34,510 | ) | (47,204 | ) | ||||
| 1,136,748 | 992,542 | |||||||
| Other finance costs | 29,884 | 9,432 | ||||||
| $ | 1,166,632 | $ | 1,001,974 | |||||
The annual interest rates of capitalized borrowing costs included in qualifying property, plant and equipment was 0.95%-1.26% and 1.12%-1.98% for the years ended December 31, 2015 and 2014, respectively.
| d. | Depreciation and amortization |
| For the Years Ended December 31 | ||||||||
| 2015 | 2014 | |||||||
| NT$ | NT$ | |||||||
| Property, plant and equipment | $ | 14,630,862 | $ | 12,667,954 | ||||
| Intangible assets | 139,065 | 109,809 | ||||||
| Total | $ | 14,769,927 | $ | 12,777,763 | ||||
| Summary of depreciation by function | ||||||||
| Operating costs | $ | 13,751,129 | $ | 11,824,860 | ||||
| Operating expenses | 879,733 | 843,094 | ||||||
| $ | 14,630,862 | $ | 12,667,954 | |||||
(Continued)
-50-
| For the Years Ended December 31 | ||||||||
| 2015 | 2014 | |||||||
| NT$ | NT$ | |||||||
| Summary of amortization by function | ||||||||
| Operating costs | $ | 41,471 | $ | 22,419 | ||||
| Selling and marketing expenses | 63 | 109 | ||||||
| General and administration expenses | 64,712 | 58,476 | ||||||
| Research and development expenses | 32,819 | 28,805 | ||||||
| $ | 139,065 | $ | 109,809 | |||||
(Concluded)
| e. | Employee benefits expense |
| For the Years Ended December 31 | ||||||||
| 2015 | 2014 (Adjusted) | |||||||
| NT$ | NT$ | |||||||
| Post-employment benefits (Note 17) | ||||||||
| Defined contribution plans | $ | 788,519 | $ | 716,293 | ||||
| Defined benefit plans | 87,904 | 92,497 | ||||||
| 876,423 | 808,790 | |||||||
| Equity-settled share-based payments | 89,768 | 82,408 | ||||||
| Salary, incentives and bonus | 19,852,325 | 19,829,602 | ||||||
| Other employee benefits | 2,414,150 | 2,258,744 | ||||||
| $ | 23,232,666 | $ | 22,979,544 | |||||
| Summary of employee benefits expense by function | ||||||||
| Operating costs | $ | 16,634,736 | $ | 16,258,145 | ||||
| Operating expenses | 6,597,930 | 6,721,399 | ||||||
| $ | 23,232,666 | $ | 22,979,544 | |||||
The existing Articles of Incorporation of the Company stipulate to distribute bonus to employees and remuneration to directors and supervisors at the rates in 7%-11% and no higher than 1% from net income (net of the bonus and remuneration), respectively (retained earnings and dividend policy in Note 18c). For the year ended December 31, 2014, the bonus to employees and the remuneration to directors and supervisors were NT$2,335,786 thousand and NT$212,344 thousand, respectively, representing 11% and 1%, respectively, of the net income (net of the bonus and remuneration).
To be in compliance with the Company Act as amended in May 2015, the amended Articles of Incorporation of the Company, as proposed by the board of directors in January 2016, stipulate to distribute employees’ compensation and remuneration to directors at the rates in 5.25%-8.25% and no higher than 0.75%, respectively, of net profit before income tax, employees’ compensation and remuneration to directors. For the year ended December 31, 2015, the employees’ compensation and the remuneration to directors were NT$2,033,500 thousand and NT$184,500 thousand, respectively, which were accrued based on 8.25% and 0.75% of net profit before income tax, employees’ compensation and remuneration to directors, respectively. The employees’ compensation and remuneration to directors for the year ended December 31, 2015 are subject to the resolution of the Company’s board of directors and the resolution of the amendments to the Company’s Articles of Incorporation for adoption by the shareholders in their meeting to be held in June 2016, and in addition thereto a report of such distribution shall be submitted to the shareholders’ meeting.
-51-
Material differences between such estimated amounts and the amounts proposed by the board of directors on or before the annual parent company only financial statements approved for issue are adjusted in the year the compensation and remuneration were recognized. If there is a change in the proposed amounts after the parent company only financial statements authorized for issue, the differences are recorded as a change in accounting estimate.
The bonus to employees and the remuneration to directors and supervisors for 2014 and 2013 distributed in cash resolved at the Company’s annual shareholders’ meetings in June 2015 and June 2014, respectively, were as follows:
| For Year 2014 | For Year 2013 | |||||||
| NT$ | NT$ | |||||||
| Bonus to employees | $ | 2,335,600 | $ | 1,587,300 | ||||
| Remuneration to directors and supervisors | 211,200 | 144,000 | ||||||
The differences between the resolved amounts of the bonus to employees and remuneration to directors and supervisors and the accrued amounts reflected in the parent company only financial statements for the years ended December 31, 2014 and 2013 was deemed changes in estimates. The difference was NT$1,330 thousand and NT$385 thousand and had been adjusted in earnings for the years ended December 31, 2015 and 2014, respectively.
Information regarding the bonus to employees and the remuneration to directors and supervisors resolved by the Company’s board of directors and the shareholders’ meeting is available on the Market Observation Post System website of the TSE.
As of December 31, 2015 and 2014, the Company had 28,921 and 29,563 employees, respectively.
| 20. | INCOME TAX |
| a. | Income tax recognized in profit or loss |
The major components of income tax expense were as follows:
| For the Years Ended December 31 | ||||||||
| 2015 | 2014 (Adjusted) | |||||||
| NT$ | NT$ | |||||||
| Current income tax | ||||||||
| In respect of the current year | $ | 1,995,861 | $ | 1,464,096 | ||||
| Adjustments for prior years | (24,609 | ) | 27,218 | |||||
| In respect of the income derived outside the ROC | - | 23,074 | ||||||
| 1,971,252 | 1,514,388 | |||||||
| Deferred income tax | ||||||||
| In respect of the current year | 983,227 | 1,010,216 | ||||||
| Income tax expense recognized in profit or loss | $ | 2,954,479 | $ | 2,524,604 | ||||
-52-
A reconciliation of income tax expense calculated at the statutory rate and income tax expense recognized in profit or loss was as follows:
| For the Years Ended December 31 | ||||||||
| 2015 | 2014 (Adjusted) | |||||||
| NT$ | NT$ | |||||||
| Profit before income tax | $ | 22,433,352 | $ | 26,161,126 | ||||
| Income tax expense calculated at the statutory rate (17%) | $ | 3,813,670 | $ | 4,447,391 | ||||
| Nontaxable expense in determining taxable income | 111,501 | 54,879 | ||||||
| The origination and reversal of temporary differences | (1,952,154 | ) | (2,346,012 | ) | ||||
| Tax-exempt income | (255,528 | ) | (353,881 | ) | ||||
| Additional income tax on unappropriated earnings | 561,104 | 462,781 | ||||||
| Loss carry-forward and income tax credits currently used | (282,732 | ) | (801,062 | ) | ||||
| Net deferred income tax | 983,227 | 1,010,216 | ||||||
| Adjustments for prior years | (24,609 | ) | 27,218 | |||||
| Payments of income tax in respect of the income derived outside the ROC | - | 23,074 | ||||||
| Income tax expense recognized in profit or loss | $ | 2,954,479 | $ | 2,524,604 | ||||
As the status of 2016 appropriations of earnings is uncertain, the potential income tax consequences of 2015 unappropriated earnings are not reliably determinable.
| b. | Income tax recognized in other comprehensive income |
| For the Years Ended December 31 | ||||||||
| 2015 | 2014 (Adjusted)
| |||||||
| NT$ | NT$ | |||||||
| Deferred income tax | ||||||||
| Remeasurement on defined benefit plan | $ | (6,751 | ) | $ | 4,693 |
| ||
| c. | Deferred tax assets and liabilities |
The movements of deferred tax assets and deferred tax liabilities were as follows:
| Balance at January 1 | Recognized in Profit or Loss | Recognized in Other Comprehensive Income | Balance at December 31 | |||||||||||||
| NT$ | NT$ | NT$ | NT$ | |||||||||||||
| Year ended December 31, 2015 | ||||||||||||||||
| Temporary differences | ||||||||||||||||
| Property, plant and equipment | $ | (2,724,143 | ) | $ | (796,577 | ) | $ | - | $ | (3,520,720 | ) | |||||
| Defined benefit obligation | 382,007 | 15,974 | (6,751 | ) | 391,230 | |||||||||||
| Others | 223,032 | 39,127 | - | 262,159 | ||||||||||||
| (2,119,104 | ) | (741,476 | ) | (6,751 | ) | (2,867,331 | ) | |||||||||
| Investment credits | 241,751 | (241,751 | ) | - | - | |||||||||||
| $ | (1,877,353 | ) | $ | (983,227 | ) | $ | (6,751 | ) | $ | (2,867,331 | ) | |||||
(Continued)
-53-
| Balance at January 1 | Recognized in Profit or Loss | Recognized in Other Comprehensive Income | Balance at December 31 | |||||||||||||
| NT$ | NT$ | NT$ | NT$ | |||||||||||||
| Year ended December 31, 2014 (Adjusted) | ||||||||||||||||
| Temporary differences | ||||||||||||||||
| Property, plant and equipment | $ | (1,879,400 | ) | $ | (844,743 | ) | $ | - | $ | (2,724,143 | ) | |||||
| Defined benefit obligation | 415,519 | (38,205 | ) | 4,693 | 382,007 | |||||||||||
| Others | 114,744 | 108,288 | - | 223,032 | ||||||||||||
| (1,349,137 | ) | (774,660 | ) | 4,693 | (2,119,104 | ) | ||||||||||
| Investment credits | 477,307 | (235,556 | ) | - | 241,751 | |||||||||||
| $ | (871,830 | ) | $ | (1,010,216 | ) | $ | 4,693 | $ | (1,877,353 | ) | ||||||
(Concluded)
| d. | Tax-exemption information |
As of December 31, 2015, profits attributable to the following expansion projects were exempted from income tax for a 3-year or 5-year period:
| Tax-exemption Period | ||
| Construction and expansion of 2004 by the Company | 2012.01-2016.12 | |
| Construction and expansion of 2005 by the Company | 2012.01-2016.12 | |
| Construction and expansion of 2007 by Power ASE Technology, Inc. which was merged into the Company | 2013.01-2015.12 | |
| Construction and expansion of 2007 by the Company | 2016.01-2020.12 | |
| Construction and expansion of 2008 by the Company | 2014.01-2018.12 |
| e. | Unrecognized deferred tax liabilities associated with investments |
As of December 31, 2015 and 2014, the taxable temporary differences associated with the investments in subsidiaries for which no deferred tax liabilities have been recognized were NT$7,729,422 thousand and NT$6,934,791 thousand, respectively.
| f. | Integrated income tax |
As of December 31, 2015 and 2014, unappropriated earnings were all generated on and after January 1, 1998. As of December 31, 2015 and 2014, the balance of the Imputation Credit Account (“ICA”) was NT$1,913,243 thousand and NT$934,038 thousand, respectively.
The creditable ratio for the distribution of earnings of 2015 and 2014 was 8.66% (estimated) and 6.88% (actual), respectively.
| g. | Income tax assessments |
Income tax returns of ASE Inc. have been examined by authorities through 2012. ASE Inc. disagreed with the result of examinations relating to its income tax returns for 2004 through 2008 and appealed to the tax authorities. A settlement was reached in June 2015. The related income tax expenses in the years resulting from the examinations have been accrued in respective tax years or in the year of the settlement.
-54-
| 21. | EARNINGS PER SHARE |
The earnings and weighted average number of ordinary shares outstanding in the computation of earnings per share were as follows:
Net profit for the year
| For the Years Ended December 31 | ||||||||
| 2015 | 2014
(Adjusted)
| |||||||
| NT$ | NT$ | |||||||
| Profit for the year | $ | 19,478,873 | $ | 23,636,522 | ||||
| Effect of potentially dilutive ordinary shares: | ||||||||
| Employee share options issued by subsidiaries | (210,126 | ) | (260,925 | ) | ||||
| Convertible bonds | 901,187 | 931,344 | ||||||
| Earnings used in the computation of diluted earnings per share | $ | 20,169,934 | $ | 24,306,941 | ||||
Weighted average number of ordinary shares outstanding (in thousand shares):
| For the Years Ended December 31 | ||||||||
| 2015 | 2014 | |||||||
| Weighted average number of ordinary shares in computation of basic earnings per share | 7,652,773 | 7,687,930 | ||||||
| Effect of potentially dilutive ordinary shares: | ||||||||
| Convertible bonds | 455,671 | 375,271 | ||||||
| Employee share options | 86,994 | 101,850 | ||||||
| Bonus to employees or employees’ compensation | 54,626 | 55,643 | ||||||
| Weighted average number of ordinary shares in computation of diluted earnings per share | 8,250,064 | 8,220,694 | ||||||
The Company is able to settle the compensation or bonuses paid to employees in cash or shares. The Company assumed that the entire amount of the compensation or bonus would be settled in shares and the resulting potential shares were included in the weighted average number of ordinary shares outstanding used in the computation of diluted earnings per share if the effect is dilutive. Such dilutive effect of the potential shares was included in the computation of diluted earnings per share until the shareholders approve the number of shares to be distributed to employees at their meeting in the following year.
| 22. | SHARE-BASED PAYMENT ARRANGEMENTS |
Employee share option plans
In order to attract, retain and reward employees, the Company has five employee share option plans for full-time employees of the Company and its subsidiaries, including 100,000 thousand share options approved to be granted in April 2015. Each share option represents the right to purchase one ordinary share of the Company when exercised. Under the terms of the plans, share options are granted at an exercise price equal to or not less than the closing price of the ordinary shares listed on the TSE at the grant date. The option rights of these plans are valid for 10 years, non-transferable and exercisable at certain percentages subsequent to the second anniversary of the grant date. For any subsequent changes in the Company’s capital structure, the exercise price is accordingly adjusted.
-55-
Information about share options of the Company was as follows:
| For the Years Ended December 31 | ||||||||||||||||
| 2015 | 2014 | |||||||||||||||
| Weighted | Weighted | |||||||||||||||
| Average | Average | |||||||||||||||
| Number of | Exercise | Number of | Exercise | |||||||||||||
| Options | Price | Options | Price | |||||||||||||
| (In | Per Share | (In | Per Share | |||||||||||||
| Thousands) | (NT$) | Thousands) | (NT$) | |||||||||||||
| Balance at January 1 | 209,745 | $ | 20.7 | 285,480 | $ | 20.5 | ||||||||||
| Options granted | 94,270 | 36.5 | - | - | ||||||||||||
| Options forfeited | (1,975 | ) | 30.3 | (1,515 | ) | 20.5 | ||||||||||
| Options expired | (730 | ) | 11.1 | (322 | ) | 13.5 | ||||||||||
| Options exercised | (48,703 | ) | 20.6 | (73,898 | ) | 19.7 | ||||||||||
| Balance at December 31 | 252,607 | 26.6 | 209,745 | 20.7 | ||||||||||||
| Options exercisable, end of year | 158,103 | 20.8 | 189,240 | 20.7 | ||||||||||||
| Weighted-average fair value of options granted (NT$) | $ 7.18-7.39 | $ | - | |||||||||||||
The weighted average share price at exercise dates of share options for the years ended December 31, 2015 and 2014 was NT$38.8 and NT$35.1, respectively.
Information about the Company’s outstanding share options at each balance sheet date was as follows:
| Range of Exercise Price Per Share (NT$) | Weighted Average Remaining Contractual Life (Years) | |||||||
| December 31, 2015 | $ 20.4-22.6 | 3.5 | ||||||
| 36.5 | 9.7 | |||||||
| December 31, 2014 | 11.1-13.5 | 0.4 | ||||||
| 20.4-22.6 | 4.4 | |||||||
ASE Mauritius Inc., a subsidiary of the Company, has an employee share option plan with the identical terms of the Company’s. 19,265 thousand share options were granted to the Company’s employees and none was exercised for the years ended December 31, 2015 and 2014. As of December 31, 2015 and 2014, 19,265 thousand share options were exercisable and the weighted average exercise price was US$1.7.
The terms of the share option plan issued by USIE were the same with those of the Company’s. In December 2015 and 2014, USIE had modified the terms of its share option plan granted in 2007 to extend the valid period from 12 years to 13 years and from 11 years to 12 years, respectively. The incremental fair value of NT$8,289 thousand and NT$5,952 thousand were all recognized as employee benefit expense in 2015 and 2014, respectively, since the options were all vested. 20,718 thousand share options of the USIE were granted to the Company’s employees. Information about shares options was as follows:
-56-
| For the Years Ended December 31 | ||||||||||||||||
| 2015 | 2014 | |||||||||||||||
| Weighted | Weighted | |||||||||||||||
| Average | Average | |||||||||||||||
| Number of | Exercise | Number of | Exercise | |||||||||||||
| Options | Price | Options | Price | |||||||||||||
| (In | Per Share | (In | Per Share | |||||||||||||
| Thousands) | (US$) | Thousands) | (US$) | |||||||||||||
| Balance at January 1 | 20,135 | $ | 2.1 | 20,344 | $ | 2.1 | ||||||||||
| Options forfeited | (19 | ) | 2.8 | - | - | |||||||||||
| Options exercised | (1,803 | ) | 1.9 | - | - | |||||||||||
| Options transferred in (out) from subsidiaries | 345 | 2.8 | (209 | ) | 2.6 | |||||||||||
| Balance at December 31 | 18,658 | 2.1 | 20,135 | 2.1 | ||||||||||||
| Options exercisable, end of year | 18,239 | 2.1 | 18,446 | 2.0 | ||||||||||||
Fair value of share options
Share options granted by the Company in 2015 was measured using the Hull & White Model (2004) incorporated with Ritchken’s Trinomial Tree Model (1995), and the inputs to the models were as follows:
| ASE Inc. | ||||
| Share price at the grant date | NT$36.5 | |||
| Exercise prices | NT$36.5 | |||
| Expected volatility | 27.02 | % | ||
| Expected lives | 10 years | |||
| Expected dividend yield | 4.00 | % | ||
| Risk free interest rates | 1.34 | % |
Expected volatility was based on the historical share price volatility over the past 10 years of ASE Inc. Under the Hull & White Model (2004) incorporated with Ritchken’s Trinomial Tree Model (1995), the Company assumed that employees would exercise the options after vesting date when the share price was 1.88 times the exercise price to allow for the effects of early exercise.
Employee benefits expense recognized on employee share options was NT$133,496 thousand and NT$110,157 thousand for the years ended December 31, 2015 and 2014, respectively.
| 23. | NON-CASH TRANSACTIONS |
For the years ended December 31, 2015 and 2014, the Company entered into the following non-cash investing activities which were not reflected in the consolidated statements of cash flows:
| For the Years Ended December 31 | ||||||||
| 2015 | 2014 | |||||||
| NT$ | NT$ | |||||||
| Payments for property, plant and equipment | ||||||||
| Purchase of property, plant and equipment | $ | 17,651,585 | $ | 27,572,214 | ||||
| Capitalized borrowing costs | (34,510 | ) | (47,204 | ) | ||||
(Continued)
-57-
| For the Years Ended December 31 | ||||||||
| 2015 | 2014 | |||||||
| NT$ | NT$ | |||||||
| Increase in prepayments for property, plant and equipment | $ | 30,488 | $ | 30,453 | ||||
| Decrease (increase) in payables for property, plant and equipment | 459,047 | (1,696,412 | ) | |||||
| $ | 18,106,610 | $ | 25,859,051 | |||||
| Proceeds from disposal of property, plant and equipment | ||||||||
| Consideration from disposal of property, plant and equipment | $ | 180,846 | $ | 206,009 | ||||
| Increase in other receivables | (65,870 | ) | (18,951 | ) | ||||
| $ | 114,976 | $ | 187,058 | |||||
(Concluded)
| 24. | OPERATING LEASE ARRANGEMENTS |
The Company lease the land on which its buildings are located under various operating lease agreements with the ROC government expiring through June 2035. The agreements grant the Company the option to renew the leases and reserve the right for the lessor to adjust the lease payments upon an increase in the assessed value of the land and to terminate the leases under certain conditions. In addition, the Company leases buildings, machinery and equipment under operating leases.
The Company recognized rental expense of NT$604,360 thousand and NT$479,838 thousand for the years ended December 31, 2015 and 2014, respectively.
| 25. | CAPITAL MANAGEMENT |
The capital structure of the Company consists of debt and equity. The Company manages its capital to ensure that the Company will be able to continue as going concerns while maximizing the return to shareholders through the optimization of the debt and equity balance. Key management personnel of the Company periodically reviews the cost of capital and the risks associated with each class of capital. In order to balance the overall capital structure, the Company may adjust the amount of dividends paid to shareholders, the number of new shares issued or repurchased, and the amount of new debt issued or existing debt redeemed.
The Company is not subject to any externally imposed capital requirements except those discussed in Note 14.
| 26. | FINANCIAL INSTRUMENTS |
| a. | Fair value of financial instruments that are not measured at fair value |
| 1) | Fair value of financial instruments not measured at fair value but for which fair value is disclosed |
Except bonds payable measured at amortized cost, the management considers that the carrying amounts of financial assets and financial liabilities not measured at fair value approximate their fair values.
The carrying amounts and fair value of bonds payable as of December 31, 2015 and 2014, respectively, were as follows:
-58-
| Carrying Amount | Fair Value | |||||||
| NT$ | NT$ | |||||||
| December 31, 2015 | $ | 26,101,086 | $ | 26,507,124 | ||||
| December 31, 2014 | 19,270,613 | 19,828,076 | ||||||
| 2) | Fair value hierarchy |
The aforementioned fair value hierarchy of bonds payable was Level 3 which was determined based on discounted cash flow analysis with the applicable yield curve for the duration or the last trading prices.
| b. | Fair value of financial instruments that are measured at fair value on a recurring basis |
| 1) | Fair value hierarchy |
| Level 1 | Level 2 | Level 3 | Total | |||||||||||||
| NT$ | NT$ | NT$ | NT$ | |||||||||||||
| December 31, 2015 | ||||||||||||||||
| Financial assets at FVTPL | ||||||||||||||||
| Financial assets designated as at FVTPL | ||||||||||||||||
| Private-placement convertible bonds | $ | - | $ | 100,500 | $ | - | $ | 100,500 | ||||||||
| Derivative financial assets | ||||||||||||||||
| Swap contracts | - | 1,389,931 | - | 1,389,931 | ||||||||||||
| Forward exchange contracts | - | 7,745 | - | 7,745 | ||||||||||||
| Forward currency options contracts | - | 5,020 | - | 5,020 | ||||||||||||
| $ | - | $ | 1,503,196 | $ | - | $ | 1,503,196 | |||||||||
| Available-for-sale financial assets | ||||||||||||||||
| Limited partnership | $ | - | $ | - | $ | 390,987 | $ | 390,987 | ||||||||
| Unquoted shares | - | - | 82,120 | 82,120 | ||||||||||||
| $ | - | $ | - | $ | 473,107 | $ | 473,107 | |||||||||
| Financial liabilities at FVTPL | ||||||||||||||||
| Derivative financial liabilities | ||||||||||||||||
| Conversion option, redemption option and put option of convertible bonds | $ | - | $ | 2,632,565 | $ | - | $ | 2,632,565 | ||||||||
(Continued)
-59-
| Level 1 | Level 2 | Level 3 | Total | |||||||||||||
| NT$ | NT$ | NT$ | NT$ | |||||||||||||
| Forward exchange contracts | $ | - | $ | 22,045 | $ | - | $ | 22,045 | ||||||||
| Swap contracts | - | 14,876 | - | 14,876 | ||||||||||||
| Interest rate swap contracts | - | 119 | - | 119 | ||||||||||||
| $ | - | $ | 2,669,605 | $ | - | $ | 2,669,605 | |||||||||
| December 31, 2014 | ||||||||||||||||
| Financial assets at FVTPL | ||||||||||||||||
| Financial assets designated as at FVTPL | ||||||||||||||||
| Private-placement convertible bonds | $ | - | $ | 100,500 | $ | - | $ | 100,500 | ||||||||
| Derivative financial assets | ||||||||||||||||
| Swap contracts | - | 1,888,449 | - | 1,888,449 | ||||||||||||
| Forward exchange contracts | - | 1,234 | - | 1,234 | ||||||||||||
| $ | - | $ | 1,990,183 | $ | - | $ | 1,990,183 | |||||||||
| Available-for-sale financial assets | ||||||||||||||||
| Open-end mutual funds | $ | 400,007 | $ | - | $ | - | $ | 400,007 | ||||||||
| Limited partnership | - | - | 438,953 | 438,953 | ||||||||||||
| Unquoted shares | - | - | 103,194 | 103,194 | ||||||||||||
| $ | 400,007 | $ | - | $ | 542,147 | $ | 942,154 | |||||||||
| Financial liabilities at FVTPL | ||||||||||||||||
| Derivative financial liabilities | ||||||||||||||||
| Conversion option, redemption option and put option of convertible bonds | $ | - | $ | 2,520,606 | $ | - | $ | 2,520,606 | ||||||||
| Swap contracts | - | 13,726 | - | 13,726 | ||||||||||||
| Forward exchange contracts | - | 6,086 | - | 6,086 | ||||||||||||
| $ | - | $ | 2,540,418 | $ | - | $ | 2,540,418 | |||||||||
(Concluded)
For assets and liabilities held as of December 31, 2015 and 2014 that were measured at fair value on a recurring basis, there were no transfers between Level 1 and Level 2 of the fair value hierarchy.
-60-
| 2) | Reconciliation of Level 3 fair value measurements of financial assets |
The financial assets measured at Level 3 fair value were equity investments with no quoted prices classified as available-for-sale financial assets - non-current. Reconciliations for the years ended December 31, 2015 and 2014 were as follows:
| For the Years Ended December 31 | ||||||||
| 2015 | 2014 | |||||||
| NT$ | NT$ | |||||||
| Balance at January 1 | $ | 542,147 | $ | 522,902 | ||||
| Purchases | 1,322 | 38,793 | ||||||
| Disposals | (34,203 | ) | - | |||||
| Total gains recognized in other | ||||||||
| comprehensive income | (36,159 | ) | (19,548 | ) | ||||
| Balance at December 31 | $ | 473,107 | $ | 542,147 | ||||
| 3) | Valuation techniques and assumptions applied for the purpose of measuring fair value |
| a) | Valuation techniques and inputs applied for the purpose of measuring Level 2 fair value measurement |
| Financial Instruments | Valuation Techniques and Inputs | |
| Derivatives - swap contracts, forward exchange contracts, foreign currency option contracts and interest rate swap contracts | Discounted cash flows - Future cash flows are estimated based on observable forward exchange rates or interest rates at balance sheet dates and contract forward exchange rates and interest rates or interest rates, discounted at rates that reflected the credit risk of various counterparties. | |
| Derivatives - conversion option, redemption option and put option of convertible bonds | Option pricing model - Incorporation of present value techniques and reflect both the time value and the intrinsic value of options | |
| Private-placement convertible bonds | Discounted cash flows - Future cash flows are estimated based on observable stock prices and conversion prices, discounted at rates that reflected the credit risk of various counterparties. |
| b) | Valuation techniques and inputs applied for the purpose of measuring Level 3 fair value measurement |
The fair value of the Company’s investments in unquoted shares on Level 3 fair value measurement were measured using market approach based on investees’ recent financing activities, technical development, valuation of investees comparable companies, market conditions and other economic indicators.
The fair values of investments in limited partnership are measured using discounted cash flow technique and a comparable multiple technique. The significant unobservable inputs used in the discounted cash flow technique were discount rates of 12.34% and the terminal growth rates of 2.50%. Any significant increase in discount rates or any significant decrease in terminal growth rates would result in a decrease in the fair value of the investments in limited partnership. The significant unobservable input used in the comparable multiple technique was EBITDA multiples of 9.73. Any significant decrease in multiples would result in a decrease in the fair value of the investments in limited partnership.
-61-
| c. | Categories of financial instruments |
| December 31 | ||||||||
| 2015 | 2014 | |||||||
| NT$ | NT$ | |||||||
| Financial assets | ||||||||
| FVTPL | ||||||||
| Designated as at FVTPL | $ | 100,500 | $ | 100,500 | ||||
| Held for trading | 1,402,696 | 1,889,683 | ||||||
| Available-for-sale financial assets | 473,107 | 942,154 | ||||||
| Loans and receivables (Note 1) | 26,584,110 | 34,476,934 | ||||||
| Financial liabilities | ||||||||
| FVTPL | ||||||||
| Held for trading | 2,669,605 | 2,540,418 | ||||||
| Measured at amortized cost (Note 2) | 137,574,859 | 101,542,763 | ||||||
Note 1: The balances included loans and receivables measured at amortized cost which comprised cash, trade receivable (including trade receivables from related parties), other receivables (including loans to related parties) and other financial assets.
Note 2: The balances included financial liabilities measured at amortized cost which comprised short-term borrowings, short-term bills payable, trade and other payables (including related parties), bonds payable and long-term borrowings.
| d. | Financial risk management objectives and policies |
The derivative instruments used by the Company are to mitigate risks arising from ordinary business operations. All derivative transactions entered into by the Company are designated as either hedging or trading. Derivative transactions entered into for hedging purposes must hedge risk against fluctuations in foreign exchange rates and interest rates arising from operating activities. The currencies and the amount of derivative instruments held by the Company must match its hedged assets and liabilities denominated in foreign currencies.
The Company’s risk management department monitors risks to mitigate risk exposures, reports unsettled position, transaction balances and related gains or losses to the Company’s chief financial officer on monthly basis.
| 1) | Market risk |
The Company’s activities exposed it primarily to the financial risks of changes in foreign currency exchange rates and interest rates. Gains or losses arising from fluctuations in foreign currency exchange rates of a variety of derivative financial instruments were approximately offset by those of hedged items. Interest rate risk was not significant due to the cost of capital was expected to be fixed.
There had been no change to the Company’s exposure to market risks or the manner in which these risks were managed and measured.
| a) | Foreign currency exchange rate risk |
The Company had sales and purchases as well as financing activities denominated in foreign currency which exposed the Company to foreign currency exchange rate risk. The Company
-62-
entered into a variety of derivative financial instruments to hedge foreign currency exchange rate risk to minimize the fluctuations of assets and liabilities denominated in foreign currencies.
The carrying amounts of the Company’s foreign currency denominated monetary assets and liabilities as well as derivative instruments which exposed the Company to foreign currency exchange rate risk at each balance sheet date are presented in Note 31.
The Company was principally subject to the impact to exchange rate fluctuation in U.S. dollars and Japanese yen against NT$. 1% is the sensitivity rate used when reporting foreign currency exchange rate risk internally to key management personnel and represents management’s assessment of the reasonably possible change in foreign currency exchange rates. The sensitivity analysis included financial assets and liabilities. The changes in profit before income tax due to a 1% change in U.S. dollars and Japanese yen both against NT$ would be NT$35,000 thousand and NT$3,400 thousand for the years ended December 31, 2015 and 2014, respectively. Hedging contracts and hedged items have been taken into account while measuring the changes in profit before income tax. As the year-end exposure did not reflect the exposure for the years ended December 31, 2015 and 2014, the abovementioned sensitivity analysis was unrepresentative of those years.
| b) | Interest rate risk |
Except a portion of long-term borrowings and bonds payable at fixed interest rates, the Company was exposed to interest rate risk because the Company borrowed funds at floating interest rates. Changes in market interest rates will lead to variances in effective interest rates of borrowings from which the future cash flow fluctuations arise.
The carrying amounts of the Company’s financial assets and financial liabilities with exposure to interest rates at each balance sheet date were as follows:
| December 31 | ||||||||
| 2015 | 2014 | |||||||
| NT$ | NT$ | |||||||
| Fair value interest rate risk | ||||||||
| Financial liabilities | $ | 7,981,190 | $ | 21,736,100 | ||||
| Cash flow interest rate risk | ||||||||
| Financial assets | 8,710,362 | 11,432,949 | ||||||
| Financial liabilities | 75,431,163 | 57,040,407 | ||||||
For assets and liabilities with floating interest rates, a 100 basis point increase or decrease was used when reporting interest rate risk internally to key management personnel. If interest rates had been 100 basis points (1%) higher or lower and all other variables held constant, the Company’s profit before income tax for the years ended December 31, 2015 and 2014 would have decreased or increased approximately by NT$677,000 thousand and NT$456,000 thousand, respectively.
| c) | Other price risk |
The Company was exposed to equity price risk through its investments in available-for-sale financial assets. If equity prices were 1% higher or lower, other comprehensive income before income tax for the years ended December 31, 2015 and 2014 would have increased or decreased approximately by NT$4,700 thousand and NT$9,500 thousand, respectively.
In addition, the Company was also exposed to the Company’s ordinary share price risk through Bonds Options recognized as financial liabilities held for trading. 7% is the sensitivity rate used when reporting price risk internally to key management personnel. If the Company’s
-63-
ordinary share price increased or decreased by 7%, profit before income tax for the years ended December 31, 2015 and 2014 would have decreased approximately by NT$605,000 thousand and NT$651,000 thousand, respectively, or increased approximately by NT$638,000 thousand and NT$608,000 thousand, respectively.
| 2) | Credit risk |
Credit risk refers to the risk that counterparty will default on its contractual obligations resulting in financial loss to the Company. The Company’s credit risk arises from cash, receivables and other financial assets. The Company’s maximum exposure to credit risk was the carrying amounts of financial assets in the parent company only balance sheets.
The Company dealt with counterparties creditworthy and has a credit policy and trade receivable management procedures to ensure recovery and evaluation of trade receivables. The Company’s counterparties consisted of a large number of customers and banks and there was no significant concentration of credit risk exposure.
| 3) | Liquidity risk |
The Company manages liquidity risk by maintaining adequate working capital and banking facilities to fulfill the demand for cash flow used in the Company’s operation and capital expenditure. In addition, some creditors to the Company’s current liabilities are the Company’s subsidiaries and there’s no risk of obligation for prompt repayments. The Company also monitors its compliance with all the loan covenants. Liquidity risk is not considered to be significant.
In the table below, financial liabilities with a repayment on demand clause were included in the earliest time band regardless of the probability of counter-parties choosing to exercise their rights. The maturity dates for other non-derivative financial liabilities were based on the agreed repayment dates.
To the extent that interest flows are floating rate, the undiscounted amounts were derived from the interest rates at each balance sheet date.
On Demand or Less than 1 Month | 1 to 3 Months | 3 Months to 1 Year | 1 to 5 Years | More than 5 Years | ||||||||||||||||
| NT$ | NT$ | NT$ | NT$ | NT$ | ||||||||||||||||
| December 31, 2015 | ||||||||||||||||||||
| Non-derivative financial liabilities | ||||||||||||||||||||
| Non-interest bearing | $ | 7,500,676 | $ | 7,819,035 | $ | 144,065 | $ | - | $ | - | ||||||||||
| Floating interest rate liabilities | 1,745,677 | 39,953,192 | 2,415,098 | 32,227,631 | - | |||||||||||||||
| Fixed interest rate liabilities | 12,344,873 | 3,028 | 27,535,656 | 3,830,690 | - | |||||||||||||||
| $ | 21,591,226 | $ | 47,775,255 | $ | 30,094,819 | $ | 36,058,321 | $ | - | |||||||||||
| December 31, 2014 | ||||||||||||||||||||
| Non-derivative financial liabilities | ||||||||||||||||||||
| Non-interest bearing | $ | 8,339,715 | $ | 8,817,318 | $ | 66,299 | $ | - | $ | - | ||||||||||
| Floating interest rate liabilities | 11,462,504 | 2,025,963 | 26,638,522 | 17,648,985 | - | |||||||||||||||
| Fixed interest rate liabilities | 582,373 | 778,550 | 568,920 | 21,862,951 | - | |||||||||||||||
| $ | 20,384,592 | $ | 11,621,831 | $ | 27,273,741 | $ | 39,511,936 | $ | - | |||||||||||
The amounts included above for floating interest rate instruments for non-derivative financial liabilities was subject to change if changes in floating interest rates differ from those estimates of interest rates determined at each balance sheet date.
The following table detailed the Company’s liquidity analysis for its derivative financial instruments. The table was based on the undiscounted contractual net cash inflows and outflows
-64-
on derivative instruments that settle on a net basis, and the undiscounted gross cash inflows and outflows on those derivatives that require gross settlement. When the amounts payable or receivable are not fixed, the amounts disclosed have been determined by reference to the projected interest rates as illustrated by the yield curves at each balance sheet date.
On Demand or Less than 1 Month | 1 to 3 Months | 3 Months to 1 Year | ||||||||||
| NT$ | NT$ | NT$ | ||||||||||
| December 31, 2015 | ||||||||||||
| Net settled | ||||||||||||
| Forward exchange contracts | $ | (23 | ) | $ | 75 | $ | - | |||||
| Foreign currency options contracts | - | 8,735 | - | |||||||||
| $ | (23 | ) | $ | 8,810 | $ | - | ||||||
| Gross settled | ||||||||||||
| Forward exchange contracts | ||||||||||||
| Inflows | $ | 467,241 | $ | - | $ | - | ||||||
| Outflows | (459,550 | ) | - | - | ||||||||
| 7,691 | - | - | ||||||||||
| Swap contracts | ||||||||||||
| Inflows | 7,250,361 | 17,601,055 | 34,597,550 | |||||||||
| Outflows | (7,037,259 | ) | (17,173,087 | ) | (33,627,250 | ) | ||||||
| 213,102 | 427,968 | 970,300 | ||||||||||
| Interest rate swap contracts | ||||||||||||
| Inflows | 12,603 | 12,466 | 25,069 | |||||||||
| Outflows | (11,595 | ) | (11,469 | ) | (23,063 | ) | ||||||
| 1,008 | 997 | 2,006 | ||||||||||
| $ | 221,801 | $ | 428,965 | $ | 972,306 | |||||||
| December 31, 2014 | ||||||||||||
| Gross settled | ||||||||||||
| Forward exchange contracts | ||||||||||||
| Inflows | $ | 520,506 | $ | - | $ | - | ||||||
| Outflows | (525,390 | ) | - | - | ||||||||
| (4,884 | ) | - | - | |||||||||
| Swap contracts | ||||||||||||
| Inflows | 4,234,700 | 3,323,250 | 31,808,250 | |||||||||
| Outflows | (4,064,710 | ) | (3,147,315 | ) | (30,099,780 | ) | ||||||
| 169,990 | 175,935 | 1,708,470 | ||||||||||
| $ | 165,106 | $ | 175,935 | $ | 1,708,470 | |||||||
| 27. | RELATED PARTY TRANSACTIONS |
The significant transactions between the Company and its related parties are summarized as follows:
-65-
| a. | Sales |
| For the Years Ended December 31 | ||||||||
| 2015 | 2014 | |||||||
| NT$ | NT$ | |||||||
| Subsidiaries | $ | 9,394,518 | $ | 9,375,056 | ||||
| b. | Purchases |
| For the Years Ended December 31 | ||||||||
| 2015 | 2014 | |||||||
| NT$ | NT$ | |||||||
| Subsidiaries | $ | 3,374,644 | $ | 4,840,949 | ||||
| Joint venture | 57 | - | ||||||
| $ | 3,374,701 | $ | 4,840,949 | |||||
Terms of the transactions with related parties were not significantly different from those with non-related parties. The credit terms with related parties are mainly 60 days. Unrealized gross profit from the transactions with related parties had been eliminated.
| c. | Receivables from related parties |
| December 31, | ||||||||||
| 2015 | 2014 | |||||||||
| NT$ | NT$ | |||||||||
| Trade receivables from related parties | Subsidiaries | $ | 2,281,805 | $ | 5,082,423 | |||||
| Other receivables from related parties | Subsidiaries | $ | 154,363 | $ | 36,699 | |||||
| Joint venture | 6,717 | - | ||||||||
| $ | 161,080 | $ | 36,699 | |||||||
The Company did not hold any collateral over the trade receivables from related parties. The Company had not provided an allowance for doubtful debts on receivables from related parties for the years ended December 31, 2015 and 2014.
| d. | Payables to related parties (excluding loans from related parties) |
| December 31, | ||||||||||
| 2015 | 2014 | |||||||||
| NT$ | NT$ | |||||||||
| Accounts payables to related parties | Subsidiaries | $ | 910,150 | $ | 1,223,750 | |||||
| Joint venture | 61 | - | ||||||||
| $ | 910,211 | $ | 1,223,750 | |||||||
| Other payables to related parties | Subsidiaries | $ | 1,912,834 | $ | 1,840,573 | |||||
| Associates | 41,245 | 6,328 | ||||||||
| $ | 1,954,079 | $ | 1,846,901 | |||||||
-66-
The outstanding payables to related parties of the Company were payables for raw materials, equipment and receipts under custody which will be paid in cash and no collateral were provided.
| e. | Acquisition of property, plant and equipment |
| For the Years Ended December 31 | ||||||||
| 2015 | 2014 | |||||||
| NT$ | NT$ | |||||||
| Subsidiaries | $ | 180,658 | $ | 559,544 | ||||
| Associates | 2,970,600 | 4,889,732 | ||||||
| $ | 3,151,258 | $ | 5,449,276 | |||||
| f. | Disposal of property, plant and equipment: |
| For the Years Ended December 31 | ||||||||||||||||
| 2015 | 2014 | |||||||||||||||
| Proceeds | Gain from disposal | Proceeds | Gain from disposal | |||||||||||||
| NT$ | NT$ | NT$ | NT$ | |||||||||||||
| Subsidiaries | $ | 142,442 | $ | 922 | $ | 118,358 | $ | 1,299 | ||||||||
| g. | Loans from related parties |
| December 31 | ||||||||
| 2015 | 2014 | |||||||
| NT$ | NT$ | |||||||
| Subsidiaries | $ | 38,237,875 | $ | 28,806,723 | ||||
The interest rates of loans from related parties were not significantly different from normal market rates.
| h. | Endorsements/Guarantees provided |
| December 31 | ||||||||
| 2015 | 2014 | |||||||
| NT$ | NT$ | |||||||
| Subsidiaries | $ | 12,900,154 | $ | 12,905,228 | ||||
| i. | Other relate party transactions |
| For the Years Ended December 31 | ||||||||
| 2015 | 2014 | |||||||
| NT$ | NT$ | |||||||
| Service expenses incurred to subsidiaries | $ | 921,269 | $ | 920,727 | ||||
| Donations to related parties | 100,000 | 115,000 | ||||||
| $ | 1,021,269 | $ | 1,035,727 | |||||
-67-
| j. | Compensation to key management personnel |
| For the Years Ended December 31 | ||||||||
| 2015 | 2014 | |||||||
| NT$ | NT$ | |||||||
| Short-term employee benefits | $ | 531,847 | $ | 632,920 | ||||
| Post-employment benefits | 1,017 | 1,404 | ||||||
| Share-based payments | 10,368 | 29,125 | ||||||
| $ | 543,232 | $ | 663,449 | |||||
The compensation to the Company’s key management personnel is determined according to personal performance and market trends.
| 28. | ASSETS PLEDGED AS COLLATERAL OR FOR SECURITY |
In addition to Note 9, the Company provided time deposits of NT$181,796 thousand and NT$181,283 thousand as collateral for the tariff guarantees of imported raw materials and guarantees for hiring foreign labor as of December 31, 2015 and 2014, respectively.
| 29. | SIGNIFICANT CONTINGENT LIABILITIES AND UNRECOGNIZED COMMITMENTS |
In addition to those disclosed in other notes, significant commitments and contingencies of the Company as of each balance sheet date were as follows:
| a. | Significant commitments |
| 1) | As of December 31, 2015 and 2014, unused letters of credit of the Company were approximately NT$0 thousand and NT$59,300 thousand, respectively. |
| 2) | As of December 31, 2015 and 2014, the amounts that the Company has committed to purchase property, plant and equipment were approximately NT$5,781,000 thousand and NT$5,564,000 thousand, respectively, of which NT$1,369,971 thousand and NT$641,684 thousand had been prepaid, respectively. |
| 3) | In consideration of corporate social responsibility for environmental protection, the Company’s board of directors, in December 2013, approved contributions to be made in the next 30 years, at a total amount of NT$3,000,000 thousand, at the minimum, to environmental protection efforts in Taiwan. In January 2016 and 2015, the Company’s board of directors both approved to contribute NT$100,000 thousand to ASE Foundation for continuously implementing environmental effort in promoting the related domestic environmental protection and public service activities. |
| b. | Non-cancellable operating lease commitments |
| December 31, 2015 | ||||
| NT$ | ||||
| Less than 1 year | $ | 104,804 | ||
| 1-5 years | 173,816 | |||
| More than 5 years | 198,090 | |||
| $ | 476,710 | |||
-68-
| 30. | SIGNIFICANT SUBSEQUENT EVENTS |
In January 2016, the Company issued unsecured domestic bonds in NT$7,000,000 thousand with a maturity of 5 years and due annually with annual interest rate 1.30%, and in NT$2,000,000 thousand with a maturity of 7 years and interest due annually with annual interest rate 1.50%.
31. SIGNIFICANT ASSETS AND LIABILITIES DENOMINATED IN FOREIGN CURRENCIES
The significant assets and liabilities denominated in foreign currencies of the Company were as follows:
Foreign Cuencies (In Thousand) | Exchange Rate | Carrying Amount (In Thousand) | ||||||||
| December 31, 2015 | ||||||||||
| Monetary financial assets | ||||||||||
| US$ | $ | 2,407,360 | US$1=NT$32.825 | $ | 79,021,592 | |||||
| JPY | 3,285,728 | JPY1=NT$0.2727 | 896,018 | |||||||
| Monetary financial liabilities | ||||||||||
| US$ | 2,512,262 | US$1=NT$32.825 | 82,465,000 | |||||||
| JPY | 3,606,237 | JPY1=NT$0.2727 | 983,421 | |||||||
| December 31, 2014 | ||||||||||
| Monetary financial assets | ||||||||||
| US$ | 2,119,319 | US$1=NT$31.65 | 67,076,446 | |||||||
| JPY | 3,319,802 | JPY1=NT$0.2646 | 878,420 | |||||||
| Monetary financial liabilities | ||||||||||
| US$ | 2,131,682 | US$1=NT$31.65 | 67,467,735 | |||||||
| JPY | 3,111,135 | JPY1=NT$0.2646 | 823,206 | |||||||
The significant unrealized foreign exchange gain (loss) were as follows:
| For the Years Ended December 31 | ||||||||||||||||
| 2015 | 2014 | |||||||||||||||
| Net Foreign Exchange Loss | Net Foreign Exchange Gain (Loss) | |||||||||||||||
| Functional Currencies | Exchange Rate | NT$ | Exchange Rate | NT$ | ||||||||||||
| US$ | US$1=NT$32.825 | $ | (2,279,778 | ) | US$1=NT$31.65 | $ | (2,095,242 | ) | ||||||||
| JPY | JPY1=NT$0.2727 | (6,981 | ) | JPY1=NT$0.2646 | 36,965 | |||||||||||
| $ | (2,286,759 | ) | $ | (2,058,277 | ) | |||||||||||
| 32. | OTHERS |
| a. | In November 2015, the Company received a legal brief made by SPIL in connection with a lawsuit brought by SPIL against the Company which was filed with Kaohsiung District Court. SPIL filed a civil lawsuit against the Company seeking to confirm that Company does not have the right to request SPIL to register it as a shareholder in SPIL's shareholder register. The Company has engaged attorney to defend this case and will submit defense brief to the court to protect the Company's interest. The Kaohsiung District Court has not scheduled a hearing on this case. The Company does not expect the lawsuit to have material impact on the financial position and business operation of the Company. |
-69-
| b. | On December 20, 2013, the Kaohsiung Environmental Protection Bureau (“KEPB”) issued an official letter No. Kao-Shih-Huan-Chu-Tu-Tzu 10243758100 and an administrative sanction letter No. Kao-Shih-Huan-Chu-Shui-Chu-Tzu 30-102-120022 (“the Administrative Decision”). The Administrative Decision was to impose a fine of NT$110,065 thousand which has been recorded under the line item of other losses for the year ended December 31, 2013. On April 7, 2014, the amount of the fine was amended to NT$109,359 thousand by the KEPB. On September 4, 2015, the amount of the fine was further amended to NT$102,014 thousand (US$3,093 thousand) by the KEPB. On January 17, 2014, the Company retained lawyers to file an administrative appeal to nullify the Administrative Decision with the Kaohsiung City Government, but the administrative appeal was dismissed. The Company next retained lawyers to file an administrative complaint to revoke the part of the Administrative Decision pertaining to the fine, and the case is being heard by the Kaohsiung High Administrative Court. Meanwhile, owing to the event above, on January 3, 2014, the Kaohsiung District Prosecutors Office charged the Company with violation of the Waste Disposal Act. The Kaohsiung District Court handed down the judgment on October 20, 2014 and the Company was fined NT$3,000 thousand for violation of Article 47 of the Waste Disposal Act and has been recorded under the line item of other gains and losses for the year ended December 31, 2014. Then the Company appealed against the judgment to the Kaohsiung Branch of Taiwan High Court. On September 29, 2015, the Kaohsiung Branch of Taiwan High Court rendered a final judgment of finding the Company not guilty of the criminal charge. |
| 33. | ADDITIONAL DISCLOSURES |
Following are the additional disclosures required by the Securities and Futures Bureau for ASE Inc.:
| a. | Financial provided: Please see Table 1 attached; |
| b. | Endorsement/guarantee provided: Please see Table 2 attached; |
| c. | Marketable securities held (excluding investments in subsidiaries, associates and joint venture): Please see Table 3 attached; |
| d. | Marketable securities acquired and disposed of at costs or prices of at least NT$300 million or 20% of the paid-in capital: Please see Table 4 attached; |
| e. | Acquisition of individual real estate properties at costs of at least NT$300 million or 20% of the paid-in capital: Please see Table 5 attached; |
| f. | Disposal of individual real estate properties at prices of at least NT$300 million or 20% of the paid-in capital: None; |
| g. | Total purchase from or sales to related parties of at least NT$100 million or 20% of the paid-in capital:Please see Table 6 attached; |
| h. | Receivables from related parties amounting to at least NT$100 million or 20% of the paid-in capital: Please see Table 7 attached; |
| i. | Information about the derivative financial instruments transaction: Please see Note 7; |
| j. | Names, locations, and related information of investees over which ASE Inc. exercises significant influence (excluding information on investment in Mainland China): Please see Table 8 attached; |
-70-
| k. | Information on investment in Mainland China |
| 1) | The name of the investee in Mainland China, the main businesses and products, its issued capital, method of investment, information on inflow or outflow of capital, percentage of ownership, income (losses) of the investee, share of profits/losses of investee, ending balance, amount received as dividends from the investee, and the limitation on investee: None; |
| 2) | Any of the following significant transactions with investee companies in mainland China, either directly or indirectly through a third party, and their prices, payment terms, and unrealized gains or losses: |
| a) | The amount and percentage of purchases and the balance and percentage of the related payables at the end of the period: Please see Table 6 attached; |
| b) | The amount and percentage of sales and the balance and percentage of the related receivables at the end of the period: None; |
| c) | The amount of property transactions and the amount of the resultant gains or losses: No significant transactions; |
| d) | The balance of negotiable instrument endorsements or guarantees or pledges of collateral at the end of the period and the purposes: None; |
| e) | The highest balance, the end of period balance, the interest rate range, and total current period interest with respect to financing of funds: None; |
| f) | Other transactions that have a material effect on the profit or loss for the period or on the financial position, such as the rendering or receiving of services: None. |
-71-
TABLE 1
ADVANCED SEMICONDUCTOR ENGINEERING, INC.
FINANCINGS PROVIDED
FOR THE YEAR ENDED DECEMBER 31, 2015
(Amounts In Thousands of New Taiwan Dollars)
| Financing Limits for | Financing Company's | |||||||||||||||||||||||||||||||||||||||
| Financial Statement | Related | Maximum Balance | Ending | Amount Actual | Nature for | Transaction | Reason for | Allowance for | Collateral | Each Borrowing Company | Total Financing | |||||||||||||||||||||||||||||
| No. | Financing Company | Counter-party | Account | Party | for the year | Balance | Drawn | Interest Rate | Financing | Amounts | Financing | Bad Debt | Item | Value | (Note 1) | Amount Limits (Note 2) | ||||||||||||||||||||||||
| 1 | A.S.E. Holding Limited | The Company | Other receivables | Yes | $ | 2,859,690 | $ | 2,757,300 | $ | 2,757,300 | 0.57-0.64 | The need for short-term | $ | - | Operating capital | $ | - | - | $ | - | $ | 3,103,833 | $ | 6,207,666 | ||||||||||||||||
| form related parties | financing | |||||||||||||||||||||||||||||||||||||||
| 2 | J & R Holding Limited | The Company | Other receivables | Yes | 9,367,950 | 9,256,650 | 9,256,650 | 0.57-0.64 | The need for short-term | - | Operating capital | - | - | - | 9,992,655 | 19,985,309 | ||||||||||||||||||||||||
| form related parties | financing | |||||||||||||||||||||||||||||||||||||||
| 3 | ASE Test Limited | The Company | Other receivables | Yes | 5,842,850 | 5,842,850 | 4,037,475 | 0.57-0.64 | The need for short-term | - | Operating capital | - | - | - | 6,059,525 | 12,119,051 | ||||||||||||||||||||||||
| form related parties | financing | |||||||||||||||||||||||||||||||||||||||
| 4 | ASE Test, Inc. | The Company | Other receivables | Yes | 5,600,000 | 5,600,000 | 5,600,000 | 0.87-1.03 | The need for short-term | - | Operating capital | - | - | - | 5,981,659 | 11,963,319 | ||||||||||||||||||||||||
| form related parties | financing | |||||||||||||||||||||||||||||||||||||||
| 5 | J&R Industrial Inc. | The Company | Other receivables | Yes | 190,000 | 190,000 | 190,000 | 0.87-1.03 | The need for short-term | - | Operating capital | - | - | - | 199,539 | 399,079 | ||||||||||||||||||||||||
| form related parties | financing | |||||||||||||||||||||||||||||||||||||||
| 6 | ASE (Korea) Inc. | The Company | Other receivables | Yes | 2,958,300 | 2,954,250 | 2,626,000 | 3.17-3.42 | The need for short-term | - | Operating capital | - | - | - | 3,187,595 | 6,375,190 | ||||||||||||||||||||||||
| form related parties | financing | |||||||||||||||||||||||||||||||||||||||
| 7 | USI Enterprise Limited | The Company | Other receivables | Yes | 5,916,600 | 2,626,000 | 2,626,000 | 0.57-0.64 | The need for short-term | - | Operating capital | - | - | - | 8,435,979 | 16,871,957 | ||||||||||||||||||||||||
| form related parties | financing | |||||||||||||||||||||||||||||||||||||||
| 8 | Huntington Holdings | The Company | Other receivables | Yes | 1,807,850 | 1,805,375 | 1,805,375 | 0.57-0.64 | The need for short-term | - | Operating capital | - | - | - | 9,161,282 | 18,322,564 | ||||||||||||||||||||||||
| International Co. Ltd. | form related parties | financing | - | - | - | |||||||||||||||||||||||||||||||||||
| 9 | Real Tech Holdings | The Company | Other receivables | Yes | 3,944,400 | 3,939,000 | 3,939,000 | 0.57-0.64 | The need for short-term | - | Operating capital | - | - | - | 8,704,050 | 17,408,100 | ||||||||||||||||||||||||
| Limited | form related parties | financing | ||||||||||||||||||||||||||||||||||||||
| 10 | Omniquest Industrial | The Company | Other receivables | Yes | 3,122,650 | 3,118,375 | 1,641,250 | 0.57-0.64 | The need for short-term | - | Operating capital | - | - | - | 3,236,524 | 6,473,048 | ||||||||||||||||||||||||
| Limited | form related parties | financing | ||||||||||||||||||||||||||||||||||||||
| 11 | Innosource Limited | The Company | Other receivables | Yes | 723,140 | 722,150 | 722,150 | 0.59-0.64 | The need for short-term | - | Operating capital | - | - | - | 798,494 | 1,596,988 | ||||||||||||||||||||||||
| form related parties | financing | |||||||||||||||||||||||||||||||||||||||
| 12 | ASE Investment | The Company | Other receivables | Yes | 3,118,375 | 3,118,375 | - | 0.59-0.61 | The need for short-term | - | Operating capital | - | - | - | 3,221,829 | 6,443,658 | ||||||||||||||||||||||||
| (Labuan) Inc. | form related parties | financing | ||||||||||||||||||||||||||||||||||||||
| 13 | ASE Labuan Inc. | The Company | Other receivables | Yes | 723,140 | - | - | 0.59-0.61 | The need for short-term | - | Operating capital | - | - | - | 769,385 | 1,538,770 | ||||||||||||||||||||||||
| form related parties | financing | |||||||||||||||||||||||||||||||||||||||
| 14 | Global Advanced | The Company | Other receivables | Yes | 1,939,330 | 1,936,675 | 1,936,675 | 0.59-0.64 | The need for short-term | - | Operating capital | - | - | - | 2,073,390 | 4,146,780 | ||||||||||||||||||||||||
| Packaging Technology | form related parties | financing | ||||||||||||||||||||||||||||||||||||||
| Limited, Cayman | ||||||||||||||||||||||||||||||||||||||||
| Islands | ||||||||||||||||||||||||||||||||||||||||
| 15 | ASE Corporation | The Company | Other receivables | Yes | 2,793,950 | 1,879,444 | 900,000 | 0.87-0.93 | The need for short-term | - | Operating capital | - | - | - | 3,237,259 | 6,474,518 | ||||||||||||||||||||||||
| form related parties | financing | |||||||||||||||||||||||||||||||||||||||
| 16 | ASE Electronics Inc. | The Company | Other receivables | Yes | 350,000 | 200,000 | 200,000 | 0.87-0.93 | The need for short-term | - | Operating capital | - | - | - | 765,609 | 1,531,218 | ||||||||||||||||||||||||
| form related parties | financing | |||||||||||||||||||||||||||||||||||||||
Note 1: Limit amount of lending to a company shall not exceed 20% of the net worth of the company.
Note 2: Where an inter-company or inter-firm short-term financing facility is necessary provided that the total amount of such financing facility shall not exceed 40% of the amount of the net worth of the lending company.
-72-
TABLE 2
ADVANCED SEMICONDUCTOR ENGINEERING, INC.
ENDORSEMENTS/GUARANTEES PROVIDED
FOR THE YEAR ENDED DECEMBER 31, 2015
(Amounts In Thousands of New Taiwan Dollars)
| Limits on Endorsement | Ratio of Accumulated | Maximum | Guarantee | ||||||||||||||||||||||||||||
| Endorsement/ | /Guarantee Amount | Amount of Endorsement/ | Endorsement/Guarantee to | Endorsement | Guarantee | Guarantee | Provided to | ||||||||||||||||||||||||
| Guarantee Provider | Guaranteed Party | Provided to Each | Maximum Balance | Amount Actually | Guarantee Collateralized | Net Equity per Latest | /Guarantee Amount | Provided by | Provided by | Subsidiaries | |||||||||||||||||||||
| No. | Name | Name | Nature of Relationship | Guaranteed Party (Note 1) | for the Year | Ending Balance | Drawn | by Properties | Financial Statement | Allowable (Note 2) | Parent Company | A Subsidiary | in Mainland CHINA | ||||||||||||||||||
| 0 | The Company | Anstock Limited | 100% voting shares | $ | 47,074,801 | $ | 2,783,448 | $ | 2,634,135 | $ | 2,557,224 | $ | - | 1.7 | $ | 62,766,402 | Yes | No | No | ||||||||||||
| indirectly owned by | (Note3) | (Note3) | (Note3) | ||||||||||||||||||||||||||||
| the Company | |||||||||||||||||||||||||||||||
| Anstock II Limited | 100% voting shares | 47,074,801 | 10,280,093 | 10,266,019 | 9,941,667 | - | 6.5 | 62,766,402 | Yes | No | No | ||||||||||||||||||||
| indirectly owned by | (Note3) | (Note3) | (Note3) | ||||||||||||||||||||||||||||
| the Company | |||||||||||||||||||||||||||||||
Note 1: The ceilings on the amounts for any single entity is permitted to make in endorsements/guarantees shall not exceed 30% of total equity of shareholders according to “The Process of make in endorsements/guarantees” of ASE.
Note 2: The ceilings on the aggregate amounts are permitted to make in endorsements/guarantees shall not exceed 40% of total equity of shareholders according to “The Process of make in endorsements/guarantees” of ASE.
Note 3: Amount was included principal and interest.
-73-
TABLE 3
ADVANCED SEMICONDUCTOR ENGINEERING, INC.
MARKETABLE SECURITIES HELD
DECEMBER 31, 2015
(Amounts In Thousands of New Taiwan Dollars, Unless Specified Otherwise)
| December 31, 2015 | |||||||||||||||
| Relationship with | Percentage of | ||||||||||||||
| Held Company Name | Marketable Securities Type and Name | the Company | Financial Statement Account | Shares/ Units | Carrying Value | Ownership (%) | Fair Value | Note | |||||||
| The Company | Stock | ||||||||||||||
| H&HH Venture Investment Corporation | - | Available-for-sale financial assets - non-current | 2,528,090 | $ | 10,771 | 15 | $ | 10,771 | |||||||
| H&D Venture Capital Investment Corporation | - | Available-for-sale financial assets - non-current | 2,482,758 | 33,798 | 13 | 33,798 | |||||||||
| MiTAC Information Technology Corp | - | Available-for-sale financial assets - non-current | 4,203 | 27 | - | 27 | |||||||||
| Asia Pacifical Emerging Industry Venture Capital Co, Ltd. | - | Available-for-sale financial assets - non-current | 6,000,000 | 37,524 | 7 | 37,524 | |||||||||
| StarChips Technology Inc. | - | Available-for-sale financial assets - non-current | 333,334 | - | 6 | - | |||||||||
| Bond | |||||||||||||||
| AMPI Second Private of Domestic Unsecured | - | Financial assets at fair value through profit | 1,000 | 100,500 | - | 100,500 | |||||||||
| Convertible Bonds | or loss - current | ||||||||||||||
| Limited Liability Partnership | |||||||||||||||
| Ripley Cable Holdings I, L.P. | - | Available-for-sale financial assets - non-current | - | 390,987 | 4 | 390,987 | |||||||||
| Note: | ASE, Inc.'s stocks held by ASE Test Limited, 88,200,472 shares, are all trusted without power to decide the allocation of the trust assets. |
-74-
TABLE 4
ADVANCED SEMICONDUCTOR ENGINEERING, INC.
MARKETABLE SECURITIES ACQUIRED AND DISPOSED OF AT COSTS OR PRICES OF AT LEAST NT$300 MILLION OR 20% OF THE PAID-IN CAPITAL
FOR THE YEAR ENDED DECEMBER 31, 2015
(Amounts In Thousands of New Taiwan Dollars, Unless Specified Otherwise)
| Marketable Securities Type | Nature of | Beginning Balance | Acquisition | Disposal | Ending Balance | |||||||||||||||||||||||||||||||
| Company Name | and Name | Financial Statement Account | Counter-party | Relationship | Shares/Units | Amount(Note1) | Shares/Units | Amount | Shares/Units | Amount | Carrying Amount | Gain/Loss on Disposal | Shares/Units | Amount(Note1) | ||||||||||||||||||||||
| The Company | Fund | |||||||||||||||||||||||||||||||||||
| Mega Diamond Money Market | Available-for-sale financial assets - current | - | - | 32,504,205 | $ | 400,007 | - | $ | - | 32,504,205 | $ | 400,085 | $ | 400,000 | $ | 85 | - | $ | - | |||||||||||||||||
| Fund Stock | ||||||||||||||||||||||||||||||||||||
| USI | Investments accounted for using the equity | (Note 2) | Subsidiary | 1,625,015,916 | 36,706,080 | - | - | 1,585,412,694 | 36,214,968 | 36,218,502 | (3,534 | ) | 39,603,222 | 1,187,548 | ||||||||||||||||||||||
| method | ||||||||||||||||||||||||||||||||||||
| USIINC | Investments accounted for using the equity | (Note 2) | Subsidiary | - | - | 990,080,566 | 36,214,968 | - | - | - | - | 990,080,566 | 44,733,359 | |||||||||||||||||||||||
| method | ||||||||||||||||||||||||||||||||||||
| ASEEE | Investments accounted for using the equity | (Note 3) | Joint Venture | - | - | 61,809,660 | 618,097 | - | - | - | - | 61,809,660 | 613,841 | |||||||||||||||||||||||
| method | ||||||||||||||||||||||||||||||||||||
| SPIL | Investments accounted for using the equity | (Note 4) | Associate | - | - | 779,000,000 | 35,055,000 | - | - | - | - | 779,000,000 | 35,423,058 | |||||||||||||||||||||||
| method | ||||||||||||||||||||||||||||||||||||
Note 1: The ending balance of Long-Term Stock Investment-Equity Method includes share of profits/losses of investees and other related adjustment to equity. The ending balance of other financial assets includes the adjustment to fair value.
Note 2: USI, Inc. divided from Universal Scientific Industrial Co., Ltd.
Note 3: Joint venture with TDK Corporation
Note 4: Public Tender Offer
-75-
TABLE 5
ADVANCED SEMICONDUCTOR ENGINEERING, INC.
ACQUISITION OF INDIVIDUAL REAL ESTATE PROPERTIES AT COSTS OF AT LEAST NT$300 MILLION OR 20% OF THE PAID-IN CAPITAL
FOR THE YEAR ENDED DECEMBER 31, 2015
(Amounts In Thousands of New Taiwan Dollars)
| Prior Transaction of Related Counter-party | |||||||||||||||||||
| Transaction Date | Nature of | Purpose of | Other | ||||||||||||||||
| Company Name | Types of Property | Transaction Date | (Tax excluded) | Payment Term | Counter-party | Relationships | Owner | Relationships | Transfer Date | Amount | Price Reference | Acquisition | Terms | ||||||
| The Company | No.1, Chuangyi N. Rd. | June 04, 2015 | $ | 1,718,000 | Paid | HC | Associate | - | - | - | $ | - | Based on independent | To facilitate the future | None | ||||
| in Nantze 2nd Export | professional appraisal | production expansion | |||||||||||||||||
| Processing Zone, Kaohsiung City | reports | plan | |||||||||||||||||
| No.66, Yenfa Rd. in Nantze | June 04, 2015 | 748,000 | Paid | HC | Associate | - | - | - | - | Based on independent | To facilitate the future | None | |||||||
| 2nd Export Processing Zone, | professional appraisal | production expansion | |||||||||||||||||
| Kaohsiung City | reports | plan | |||||||||||||||||
| The building construction of foreign | January 01, 2015~ | 504,600 | There is 37,800 thousand will | Hu Hwa Construction | Associate | - | - | - | - | Based on independent | To manage the demand for | None | |||||||
| worker dormitory of ASE's | December 31, 2015 | be paid after acceptance check. | Co., Ltd. | professional appraisal | accommodation resulted | ||||||||||||||
| Kaohsiung factory | reports | from the recruitment | |||||||||||||||||
| accommodation safety | |||||||||||||||||||
| and quality for foreign | |||||||||||||||||||
| workers | |||||||||||||||||||
| Facilities and equipment of ASE's | January 01, 2015~ | 355,282 | There is 121,521 thousand will | Kun Lin Engineering | - | - | - | - | - | Request for quotation, | Facilities and equipment | None | |||||||
| Kaohsiung factory | December 31, 2015 | be paid after acceptance check. | Co., Ltd. | price comparison | expansion | ||||||||||||||
| and price negotiation | |||||||||||||||||||
| Facilities and equipment of ASE's | January 01, 2015~ | 337,374 | There is 55,130 thousand will | Hyun Chang Enterprise | - | - | - | - | - | Request for quotation, | Facilities and equipment | None | |||||||
| Kaohsiung factory | December 31, 2015 | be paid after acceptance check. | Co., Ltd. | price comparison | expansion | ||||||||||||||
| and price negotiation | |||||||||||||||||||
| Facilities and equipment of ASE's | January 01, 2015~ | 310,414 | There is 62,600 thousand will | Aircare Engineering | - | - | - | - | - | Request for quotation, | Facilities and equipment | None | |||||||
| Kaohsiung factory | December 31, 2015 | be paid after acceptance check. | Corp. | price comparison | expansion | ||||||||||||||
| and price negotiation | |||||||||||||||||||
| Facilities and equipment of ASE's | January 01, 2015~ | 307,000 | There is 184,200 thousand will | Aqualab Inc. | - | - | - | - | - | Request for quotation, | Facilities and equipment | None | |||||||
| Kaohsiung factory | December 31, 2015 | be paid after acceptance check. | price comparison | expansion | |||||||||||||||
| and price negotiation | |||||||||||||||||||
-76-
TABLE 6
ADVANCED SEMICONDUCTOR ENGINEERING, INC.
TOTAL PURCHASES FROM OR SALES TO RELATED PARTIES OF AT LEAST NT$100 MILLION OR 20% OF THE PAID-IN CAPITAL
FOR THE YEAR ENDED DECEMBER 31, 2015
(Amounts In Thousands of New Taiwan Dollars, Unless Specified Otherwise)
| Transaction Details | Abnormal Transaction | |||||||||||||||||||||||||||
| Purchases/ | Payment | Notes/Accounts Payable or Receivable | ||||||||||||||||||||||||||
| Buyer | Related Party | Relationships | Sales | Amount | % to Total | Payment Terms | Unit Price | Terms | Ending Balance | % to Total | Note | |||||||||||||||||
| The Company | ASE (Shanghai) Inc. | Subsidiary | Purchases | $ | 1,713,266 | 6 | Net 60 days from the end | $ | - | - | $ | (433,581 | ) | (6 | ) | Note | ||||||||||||
| of the month of when | ||||||||||||||||||||||||||||
| invoice is issued | ||||||||||||||||||||||||||||
| ASE Electronics Inc. | Subsidiary | Purchases | 1,990,597 | 6 | Net 60 days from the end | - | - | (475,673 | ) | (6 | ) | Note | ||||||||||||||||
| of the month of when | ||||||||||||||||||||||||||||
| invoice is issued | ||||||||||||||||||||||||||||
| ISE Labs, Inc. | Subsidiary | Sales | (121,374 | ) | - | Net 45 days from | - | - | 30,216 | - | Note | |||||||||||||||||
| invoice date | ||||||||||||||||||||||||||||
| Universal Scientific | Subsidiary | Sales | (9,083,160 | ) | (10 | ) | Net 60 days from the end | - | - | 2,220,182 | 14 | Note | ||||||||||||||||
| Industrial Co., Ltd. | of the month of when | |||||||||||||||||||||||||||
| invoice is issued | ||||||||||||||||||||||||||||
| ASE Japan Co., Ltd. | Subsidiary | Sales | (116,993 | ) | - | Net 60 days from the end | - | - | 18,075 | - | Note | |||||||||||||||||
| of the month of when | ||||||||||||||||||||||||||||
| invoice is issued | ||||||||||||||||||||||||||||
| Note : | Amount was included principal and interest. |
-77-
TABLE 7
ADVANCED SEMICONDUCTOR ENGINEERING, INC.
RECEIVABLES FROM RELATED PARTIES AMOUNTING TO AT LEAST NT$100 MILLION OR 20% OF THE PAID-IN CAPITAL
DECEMBER 31, 2015
(Amounts In Thousands of New Taiwan Dollars, Unless Specified Otherwise)
| Overdue | Amounts Received | Allowance for | |||||||||||||||||||
| Company Name | Related Party | Relationships | Ending Balance (Note 1) | Turnover Rate | Amount | Actions Taken | in Subsequent Period | Bad Debts | |||||||||||||
| The Company | Universal Scientific Industrial Co., Ltd. | Subsidiary | $ | 2,220,182 | 3 | $ | 6,173 | Continued collection | $ | 1,766,202 | $ | - | |||||||||
-78-
TABLE 8
ADVANCED SEMICONDUCTOR ENGINEERING, INC.
NAMES, LOCATIONS, AND RELATED INFORMATION OF INVESTEES OVER WHICH THE COMPANY EXERCISES SIGNIFICANT INFLUENCE
FOR THE YEAR ENDED DECEMBER 31, 2015
(Amounts In Thousands of New Taiwan Dollars, Unless Specified Otherwise)
| Original Investment Amount | Balance as of December 31, 2015 | |||||||||||||||||||||||||||
| Investor Company | Investee Company | Location | Main Businesses and Products | December 31, 2015 | December 31, 2014 | Shares | Percentage of Ownership | Carrying Value | Net Income
(Losses) of the Investee
| Share of Profits/Losses
of Investee
| Note | |||||||||||||||||
| The Company | A.S.E. Holding Limited | Bermuda | Investment activities | US$ | 283,966 thousand | US$ | 283,966 thousand | 243,966 | 100 | $ | 15,251,124 | $ | 498,485 | $ | 480,474 | Subsidiary | ||||||||||||
| J & R Holding Limited | Bermuda | Investment activities | US$ | 479,693 thousand | US$ | 479,693 thousand | 435,128 | 100 | 47,271,666 | 2,304,578 | 2,049,623 | Subsidiary | ||||||||||||||||
| ASE Marketing & Service Japan Co., Ltd. | Japan | Engaged in marketing and sales services | JPY | 60,000 thousand | JPY | 60,000 thousand | 1,200 | 100 | 27,986 | 2,082 | 2,082 | Subsidiary | ||||||||||||||||
| Omniquest Industrial Limited | British Virgin Islands | Investment activities | US$ | 250,504 thousand | US$ | 250,504 thousand | 250,504,067 | 71 | 11,140,252 | 233,728 | 198,948 | Subsidiary | ||||||||||||||||
| Innosource Limited | British Virgin Islands | Investment activities | US$ | 86,000 thousand | US$ | 86,000 thousand | 86,000,000 | 100 | 3,998,959 | 67,639 | 77,641 | Subsidiary | ||||||||||||||||
| HCK | Taiwan | Engaged in the leasing of real estate properties | $ | 390,470 | $ | 390,470 | 35,497,273 | 27 | 332,444 | (35,497 | ) | (9,694 | ) | Associate | ||||||||||||||
| HC | Taiwan | Engaged in the development, construction and | 2,845,913 | 2,845,913 | 68,629,782 | 26 | 1,313,499 | 701,531 | 64,151 | Associate | ||||||||||||||||||
| leasing of real estate properties | ||||||||||||||||||||||||||||
| USI | Taiwan | Engaged in the manufacturing, processing and | 520,490 | 21,356,967 | 39,603,222 | 99 | 1,187,548 | 776,524 | 1,200,793 | Subsidiary | ||||||||||||||||||
| sale of computers, computer peripherals | ||||||||||||||||||||||||||||
| and related accessories | ||||||||||||||||||||||||||||
| ASE Test, Inc. | Taiwan | Engaged in the testing of semiconductors | 20,698,867 | 20,698,867 | 851,997,366 | 100 | 29,586,903 | 2,905,510 | 2,883,511 | Subsidiary | ||||||||||||||||||
| USIINC | Taiwan | Investment activities | 20,836,477 | - | 990,080,566 | 99 | 44,733,359 | 1,427,299 | 1,239,134 | Subsidiary | ||||||||||||||||||
| Luchu Development Corporation | Taiwan | Engaged in the development of real estate properties | 1,366,238 | 1,366,238 | 131,961,457 | 67 | 1,332,571 | (2,276 | ) | (1,527 | ) | Subsidiary | ||||||||||||||||
| ASEEE | Taiwan | Engaged in the production of embedded substrate | 618,097 | - | 61,809,660 | 51 | 613,841 | (8,375 | ) | (4,274 | ) | Associate | ||||||||||||||||
| SPIL | Taiwan | Engaged in assembly, testing and turnkey services of | 35,055,000 | - | 779,000,000 | 24 | 35,423,058 | 8,762,257 | 410,937 | Associate | ||||||||||||||||||
| integrated circuits | ||||||||||||||||||||||||||||
| AMPI | Taiwan | Engaged in integrated circuit | 178,861 | 178,861 | 33,308,452 | 18 | 40,216 | (217,534 | ) | (58,390 | ) | Associate | ||||||||||||||||
-79-
THE CONTENTS OF STATEMENTS OF MAJOR
ACCOUNTING ITEMS
| ITEM | STATEMENT INDEX | |
| MAJOR ACCOUNTING ITEMS IN ASSETS, LIABILITIES AND EQUITY | ||
| STATEMENT OF CASH | 1 | |
| STATEMENT OF FINANCIAL ASSETS AT FAIR VALUE THROUGH PROFIT OR LOSS - CURRENT | Note 7 | |
| STATEMENT OF TRADE RECEIVABLES, NET | 2 | |
| STATEMENT OF OTHER RECEIVABLES | 3 | |
| STATEMENT OF INVENTORIES | 4 | |
| STATEMENT OF CHANGES IN AVAILABLE-FOR-SALE FINANCIAL ASSETS – NON-CURRENT | 5 | |
| STATEMENT OF CHANGES IN INVESTMENTS ACCOUNTED FOR USING THE EQUITY METHOD | 6 | |
| STATEMENT OF CHANGES IN PROPERTY, PLANT AND EQUIPMENT | Note 12 | |
| STATEMENT OF CHANGES IN ACCUMULATED DEPRECIATION AND ACCUMULATED IMPAIRMENT OF PROPERTY, PLANT AND EQUIPMENT | Note 12 | |
| STATEMENT OF CHANGES IN OTHER INTANGIBLE ASSETS | Note 13 | |
STATEMENT OF DEFERRED INCOME TAX ASSETS /LIABILITIES | Note 20 | |
| STATEMENT OF SHORT-TERM BORROWINGS | 7 | |
| STATEMENT OF COMMERCIAL PAPERS AND BANK ACCEPTANCES PAYABLE | 8 | |
| STATEMENT OF LONG-TERM BORROWINGS | 9 | |
| STATEMENT OF FINANCIAL LIABILITIES AT FAIR VALUE THROUGH PROFIT OR LOSS - CURRENT | Note 7 | |
| STATEMENT OF TRADE PAYABLES | 10 | |
| STATEMENT OF OTHER PAYABLES | Note 16,Table 1 | |
| STATEMENT OF BONDS PAYABLE | Note 15 | |
| MAJOR ACCOUNTING ITEMS IN PROFIT OR LOSS | ||
| STATEMENT OF OPERATING REVENUE | 11 | |
| STATEMENT OF OPERATING COSTS | 12 | |
| STATEMENT OF OPERATING EXPENSES | 13 | |
| STATEMENT OF OTHER INCOME AND EXPENSES, NET | Note 19 | |
| STATEMENT OF FINANCE COSTS | Note 19 | |
| STATEMENT OF LABOR, DEPRECIATION ANDAMORTIZATION BY FUNCTION | Note 19 |
-80-
STATEMENT 1
ADVANCED SEMICONDUCTOR ENGINEERING, INC.
STATEMENT OF CASH
DECEMBER 31, 2015
(In Thousands of New Taiwan Dollars, Unless Specified Otherwise)
| Item | Description | Amount | ||||
| Cash on hand | Including JPY18 thousand @0.2727, HKD1 thousand @4.235, CNY3 thousand @5.055 and NT$1,633 thousand | $ | 1,657 | |||
| Cash in banks | ||||||
| Checking accounts and demand deposits | 2,861,962 | |||||
| Foreign currency deposits | Including US$159,582 thousand @32.825, JPY1,572,315 thousand @0.2727 and EUR75 thousand @35.88 | 5,669,727 | ||||
| $ | 8,533,346 | |||||
-81-
STATEMENT 2
ADVANCED SEMICONDUCTOR ENGINEERING, INC.
STATEMENT OF TRADE RECEIVABLES, NET
DECEMBER 31, 2015
(In Thousands of New Taiwan Dollars)
| Client Name | Amount | Amount overdue over 1 year | ||||||
| Non–Related Parties | ||||||||
| Company A | $ | 1,405,566 | $ | - | ||||
| Company B | 940,732 | - | ||||||
| Company C | 905,374 | - | ||||||
| Others (Note) | 10,802,561 | 5,388 | ||||||
| 14,054,233 | $ | 5,388 | ||||||
| Less: Allowance for doubtful accounts | 23,792 | |||||||
| 14,030,441 | ||||||||
| Related Parties | ||||||||
| USI | 2,220,182 | |||||||
| Others (Note) | 61,623 | |||||||
| 2,281,805 | ||||||||
| $ | 16,312,246 | |||||||
Note: The amount for each individual included in others does not exceed 5% of the account balance.
-82-
STATEMENT 3
ADVANCED SEMICONDUCTOR ENGINEERING, INC.
STATEMENT OF OTHER RECEIVABLES
DECEMBER 31, 2015
(In Thousands of New Taiwan Dollars)
| Item | Amount | Remark | ||||
| Non–Related Parties | ||||||
| Turnkey transaction | $ | 1,318,261 | Mainly from turnkey services. | |||
| Others (Note) | 49,360 | |||||
| 1,367,621 | ||||||
| Related Parties | ||||||
| Receivables from disposal of property, plant and equipment | 104,823 | |||||
| Others (Note) | 56,257 | |||||
| 161,080 | ||||||
| $ | 1,528,701 | |||||
| Note: | The amount for each individual included in others does not exceed 5% of the account balance. |
-83-
STATEMENT 4
ADVANCED SEMICONDUCTOR ENGINEERING, INC.
STATEMENT OF INVENTORIES
DECEMBER 31, 2015
(In Thousands of New Taiwan Dollars)
| Amount | ||||||||
Item | Cost | Net Realizable Value | ||||||
| Raw materials | $ | 2,898,215 | $ | 2,891,476 | ||||
| Supplies | 335,229 | 334,334 | ||||||
| Work in process | 241,352 | 378,098 | ||||||
| Finished goods | 243,240 | 409,491 | ||||||
| Materials and supplies in transit | 51,072 | 51,071 | ||||||
| $ | 3,769,108 | $ | 4,064,470 | |||||
-84-
STATEMENT 5
ADVANCED SEMICONDUCTOR ENGINEERING, INC.
STATEMENT OF CHANGES IN AVAILABLE-FOR-SALE FINANCIAL ASSETS – NON-CURRENT
FOR THE YEAR ENDED DECEMBER 31, 2015
(In Thousands of New Taiwan Dollars, Unless Specified Otherwise)
| Balance at December 31, 2015 | ||||||||||||||||||||||||||||||||||||
| Balance at January 1, 2015 | Additions | Decrease | Fair Value | |||||||||||||||||||||||||||||||||
| Name | Shares | Fair Value | Shares | Fair Value | Shares | Fair Value | Shares | (Note) | Collateral | |||||||||||||||||||||||||||
| Unquoted shares | ||||||||||||||||||||||||||||||||||||
| Asia Pacifical Emerging Industry Venture Capital Co, Ltd. | 6,000,000 | $ | 58,491 | - | $ | - | - | $ | (20,967 | ) | 6,000,000 | $ | 37,524 | Nil | ||||||||||||||||||||||
| H&HH Venture Investment Corporation | 4,435,245 | 21,927 | - | - | (1,907,155 | ) | (11,156 | ) | 2,528,090 | 10,771 | Nil | |||||||||||||||||||||||||
| H&D Venture Capital Investment Corporation | 3,879,310 | 22,718 | - | 11,080 | (1,396,552 | ) | - | 2,482,758 | 33,798 | Nil | ||||||||||||||||||||||||||
| MiTAC Information Technology Corp | - | - | 4,203 | 27 | - | - | 4,203 | 27 | Nil | |||||||||||||||||||||||||||
| ClarIDy Solutions, Inc. | 12,611 | 58 | - | - | (12,611 | ) | (58 | ) | - | - | Nil | |||||||||||||||||||||||||
| StarChips Technology Inc. | 333,334 | - | - | - | - | - | 333,334 | - | Nil | |||||||||||||||||||||||||||
| Limited partnership | ||||||||||||||||||||||||||||||||||||
| Ripley Cable Holdings I, L.P. | - | 438,953 | - | - | - | (47,966 | ) | - | 390,987 | Nil | ||||||||||||||||||||||||||
| $ | 542,147 | $ | 11,107 | $ | (80,147 | ) | $ | 473,107 | ||||||||||||||||||||||||||||
| Note: | Valuation techniques for fair value are disclosed in Note 26. |
-85-
STATEMENT 6
ADVANCED SEMICONDUCTOR ENGINEERING, INC.
STATEMENT OF CHANGES IN INVESTMENTS ACCOUNTED FOR USING THE EQUITY METHOD
FOR THE YEAR ENDED DECEMBER 31, 2015
(In Thousands of New Taiwan Dollars, Unless Specified Otherwise)
Balance at January 1, 2015
| Additions (Note 1)
| Decrease (Note 1)
| Balance at December 31, 2015
| Fair Value or Net Assets Value (Note 2) | ||||||||||||||||||||||||||||||||||||||||||||
| Investees | Shares | Amount | Shares | Amount | Shares | Amount | Shares | % | Amount | Unit Price | Total Amount | Collateral | ||||||||||||||||||||||||||||||||||||
| Ordinary Shares | ||||||||||||||||||||||||||||||||||||||||||||||||
| Quoted shares | ||||||||||||||||||||||||||||||||||||||||||||||||
| HC | 68,629,782 | $ | 1,351,400 | - | $ | - | - | $ | 37,901 | 68,629,782 | 26.2 | $ | 1,313,499 | $ | 16.8 | $ | 1,149,549 | Nil | ||||||||||||||||||||||||||||||
| SPIL | - | - | 779,000,000 | 35,423,058 | - | - | 779,000,000 | 24.9 | 35,423,058 | 52.3 | 40,741,700 | Nil | ||||||||||||||||||||||||||||||||||||
| AMPI | 33,308,452 | 99,052 | - | - | - | 58,836 | 33,308,452 | 18.2 | 40,216 | 3.1 | 104,255 | Nil | ||||||||||||||||||||||||||||||||||||
| Unquoted shares | ||||||||||||||||||||||||||||||||||||||||||||||||
| J&R Holding | 435,128 | 45,150,697 | - | 2,120,969 | - | - | 435,128 | 100.0 | 47,271,666 | 114,824.3 | 49,963,273 | Nil | ||||||||||||||||||||||||||||||||||||
| USIINC | - | - | 990,080,566 | 44,733,359 | - | - | 990,080,566 | 99.2 | 44,733,359 | 43.6 | 43,118,035 | Nil | ||||||||||||||||||||||||||||||||||||
| ASE Test, Inc. | 851,997,366 | 26,943,800 | - | 2,643,103 | - | - | 851,997,366 | 100.0 | 29,586,903 | 35.1 | 29,908,297 | Nil | ||||||||||||||||||||||||||||||||||||
| ASE Holding | 243,966 | 14,367,500 | - | 883,624 | - | - | 243,966 | 100.0 | 15,251,124 | 63,612.0 | 15,519,163 | Nil | ||||||||||||||||||||||||||||||||||||
| Omniquest | 250,504,067 | 11,045,479 | - | 94,773 | - | - | 250,504,067 | 70.6 | 11,140,252 | 45.6 | 11,429,785 | Nil | ||||||||||||||||||||||||||||||||||||
| Innosource | 86,000,000 | 3,966,042 | - | 32,917 | - | - | 86,000,000 | 100.0 | 3,998,959 | 46.4 | 3,992,471 | Nil | ||||||||||||||||||||||||||||||||||||
| Luchu | 131,961,457 | 1,315,623 | - | 16,948 | - | - | 131,961,457 | 67.1 | 1,332,571 | 10.0 | 1,332,571 | Nil | ||||||||||||||||||||||||||||||||||||
| USI | 1,625,015,916 | 36,706,080 | - | - | 1,585,412,694 | 35,518,532 | 39,603,222 | 99.0 | 1,187,548 | 17.1 | 679,090 | Nil | ||||||||||||||||||||||||||||||||||||
| ASEEE | - | - | 61,809,660 | 613,841 | - | - | 61,809,660 | 51.0 | 613,841 | 9.9 | 613,841 | Nil | ||||||||||||||||||||||||||||||||||||
| HCK | 35,497,273 | 342,138 | - | - | - | 9,694 | 35,497,273 | 27.3 | 332,444 | 9.4 | 332,444 | Nil | ||||||||||||||||||||||||||||||||||||
| ASE MS Japan | 1,200 | 24,972 | - | 3,014 | - | - | 1,200 | 100.0 | 27,986 | 23,321.4 | 27,986 | Nil | ||||||||||||||||||||||||||||||||||||
| 141,312,783 | 86,565,606 | 35,624,963 | 192,253,426 | $ | 198,912,460 | |||||||||||||||||||||||||||||||||||||||||||
| Less: Deferred gain on transfer of land | 300,149 | - | - | 300,149 | ||||||||||||||||||||||||||||||||||||||||||||
| Reclassified from investments accounted for using the equity method to treasury shares | 1,959,107 | - | - | 1,959,107 | ||||||||||||||||||||||||||||||||||||||||||||
| $ | 139,053,527 | $ | 86,565,606 | $ | 35,624,963 | $ | 189,994,170 | |||||||||||||||||||||||||||||||||||||||||
Note 1: The aforementioned changes included share of profit or loss, other comprehensive income and cash dividends received from subsidiaries, associates and joint venture.
Note 2 Fair value represented the closing prices of ordinary shares as of the balance sheet date; net assets value was based on the investees’ financial statements and the Company’s shareholdings.
-86-
STATEMENT 7
ADVANCED SEMICONDUCTOR ENGINEERING, INC.
STATEMENT OF SHORT-TERM BORROWINGS
DECEMBER 31, 2015
(In Thousands of New Taiwan Dollars, Unless Specified Otherwise)
| Type | Balance at December 31, 2015 | Contract Period | Range of Interest Rates (%) | Loan Commitments | Collateral | |||||||||||||
| Unsecured revolving bank loans | ||||||||||||||||||
| CITI Bank | $ | 2,235,597 | 2015.12-2016.01 | 0.68-0.85 | US$ 135,000 | Nil | ||||||||||||
| Mizuho Bank, Ltd. | 3,030,000 | 2015.12-2016.01 | 0.79 | US$ 250,000 | Nil | |||||||||||||
| The Bank Of Tokyo-Mitsubishi UFJ, Ltd. | 1,500,000 | 2015.12-2016.01 | 0.79 | US$ 50,000 | Nil | |||||||||||||
| SMBC Bank | 2,500,000 | 2015.12-2016.01 | 0.80 | US$ 130,000 | Nil | |||||||||||||
| HSBC Bank | 1,575,600 | 2015.12-2016.02 | 0.85 | US$ 55,000 | Nil | |||||||||||||
| Mega Bank | 90,776 | 2015.10-2016.06 | 0.68 | US$ 65,000 | Nil | |||||||||||||
| China Construction Bank | 300,000 | 2015.12-2016.01 | 0.80 | US$ 10,000 | Nil | |||||||||||||
| $ | 11,231,973 | |||||||||||||||||
-87-
STATEMENT 8
ADVANCED SEMICONDUCTOR ENGINEERING, INC.
STATEMENT OF COMMERCIAL PAPERS AND BANK ACCEPTANCES PAYABLE
DECEMBER 31, 2015
(In Thousands of New Taiwan Dollars)
Item | Underwriter | Contract Period | Annual Rate (%) | Issued Amount | Unamortized Discounts Amount | Carrying Amount | ||||||||||||||
| Commercial papers payables | China Bills Finance Corporation | 2015.12-2016.01 | 0.78 | $ | 3,000,000 | $ | 1,342 | $ | 2,998,658 | |||||||||||
| MEGA Bills Finance Co., Ltd. | 2015.12-2016.01 | 0.78 | 1,350,000 | 604 | 1,349,396 | |||||||||||||||
| $ | 4,350,000 | $ | 1,946 | $ | 4,348,054 | |||||||||||||||
-88-
STATEMENT 9
ADVANCED SEMICONDUCTOR ENGINEERING, INC.
STATEMENT OF LONG-TERM BORROWINGS
DECEMBER 31, 2015
(In Thousands of New Taiwan Dollars, Unless Specified Otherwise)
| Balance at December 31, 2015 | ||||||||||||||||||||
Creditor Bank
| Amount, Contract Period and Reimbursements | Annual Interest Rate (%) | Current Portion
| Non-current Portion | Total
| Collateral
| ||||||||||||||
| Syndicated Bank Loan | ||||||||||||||||||||
| Taiwan Bank | US$340,000 thousand and repayable in equal semiannually through July 2018. | 1.56 | $ | - | $ | 11,160,500 | $ | 11,160,500 | Nil | |||||||||||
| Working capital bank loans | ||||||||||||||||||||
| Standard Chartered Bank | Repayable at maturity in December 2017. | 1.00 | - | 2,510,000 | 2,510,000 | Nil | ||||||||||||||
| Standard Chartered Bank | US$11,500 thousand and repayable at maturity in December 2017. | 0.90 | - | 377,487 | 377,487 | Nil | ||||||||||||||
| CTBC Bank | Repayable in equal quarterly from July 2016 to July 2018. | 1.09 | - | 1,500,000 | 1,500,000 | Nil | ||||||||||||||
| CTBC Bank | Repayable in equal quarterly from August 2017 to August 2019. | 1.09 | - | 1,500,000 | 1,500,000 | Nil | ||||||||||||||
| Bank of Nova Scotia | Repayable at maturity in February 2017. | 1.01 | - | 2,000,000 | 2,000,000 | Nil | ||||||||||||||
| HSBC Bank | US$49,000 thousand and repayable at maturity in October 2017. | 1.04 | - | 1,608,425 | 1,608,425 | Nil | ||||||||||||||
| Industrial Bank of Taiwan | Repayable in equal quarterly from August 2017 to August 2019. | 1.08 | - | 1,000,000 | 1,000,000 | Nil | ||||||||||||||
| HSBC Bank | Repayable at maturity in October 2017. | 1.00 | - | 3,530,000 | 3,530,000 | Nil | ||||||||||||||
| ANZ Bank | US$56,000 thousand and repayable at maturity in September 2017. | 1.26 | - | 1,838,200 | 1,838,200 | Nil | ||||||||||||||
| DBS Bank Limited | Repayable at maturity in October 2017. | 1.00 | - | 1,100,000 | 1,100,000 | Nil | ||||||||||||||
| DBS Bank Limited | US$10,000 thousand and repayable at maturity in October 2017. | 1.05 | - | 328,250 | 328,250 | Nil | ||||||||||||||
| DBS Bank Limited | US$50,000 thousand and repayable at maturity in October 2018. | 0.99-1.07 | - | 1,641,250 | 1,641,250 | Nil | ||||||||||||||
| KGI Bank | Repayable at maturity in May 2018. | 0.91 | - | 600,000 | 600,000 | Nil | ||||||||||||||
| Taipei Fubon Bank | US$60,000 thousand and repayable at maturity in June 2017. | 0.90 | - | 1,969,500 | 1,969,500 | Nil | ||||||||||||||
| BNP Paribas | Repayable at maturity in July 2017. | 0.95 | - | 1,280,000 | 1,280,000 | Nil | ||||||||||||||
| The Bank Of Tokyo-Mitsubishi UFJ, Ltd. | Repayable at maturity in December 2018. | 1.17 | - | 1,500,000 | 1,500,000 | Nil | ||||||||||||||
| Long-Term Bills payable | ||||||||||||||||||||
| Ta Ching Bills Finance Corporation | Repayable at maturity in December 2018. | 1.03 | - | 1,998,989 | 1,998,989 | Nil | ||||||||||||||
| - | 37,442,601 | 37,442,601 | ||||||||||||||||||
| Less: unamortized arrangement fee | - | 17,994 | 17,994 | |||||||||||||||||
| $ | - | $ | 37,424,607 | $ | 37,424,607 | |||||||||||||||
-89-
STATEMENT 10
ADVANCED SEMICONDUCTOR ENGINEERING, INC.
STATEMENT OF TRADE PAYABLES
DECEMBER 31, 2015
(In Thousands of New Taiwan Dollars)
| Vendor Name | Amount | |||
| Non – Related Parties | ||||
| NAN YA PRINTED CIRCUIT BOARD CORPORATION | $ | 779,608 | ||
| UNIMICRON TECHNOLOGY CORP. | 624,319 | |||
| Others (Note) | 5,397,456 | |||
| 6,801,383 | ||||
| Related Parties | ||||
| ASE Electronics Inc. | 475,673 | |||
| ASE (Shanghai) Inc. | 433,581 | |||
| Others (Note) | 957 | |||
| 910,211 | ||||
| $ | 7,711,594 | |||
| Note: | The amount for each individual in others does not exceed 5% of the account balance. |
-90-
STATEMENT 11
ADVANCED SEMICONDUCTOR ENGINEERING, INC.
STATEMENT OF OPERATING REVENUE
FOR THE YEAR ENDED DECEMBER 31, 2015
(In Thousands of New Taiwan Dollars)
Item
| Quantity
(In Thousands)
| Amount
| ||||||
| Advanced Substrate or Integrated Circuit Leadframes (QFP、Flip Chip、BGA…, etc.) | 13,138,885 | $ | 68,564,331 | |||||
| Others (Note) | 4,154,795 | 25,642,476 | ||||||
| $ | 94,206,807 | |||||||
| Note: | The amount for each individual in others does not exceed 10% of the transaction amount. |
-91-
STATEMENT 12
ADVANCED SEMICONDUCTOR ENGINEERING, INC.
STATEMENT OF OPERATING COSTS
FOR THE YEAR ENDED DECEMBER 31, 2015
(In Thousands of New Taiwan Dollars)
| Item | Amount | |||
| Raw materials used | ||||
| Balance, beginning of year | $ | 3,467,274 | ||
| Raw material purchased | 24,090,125 | |||
| Less: Others | 655,170 | |||
| Raw materials, end of year | 2,898,215 | |||
| Transferred to manufacturing or operating expenses | 24,004,014 | |||
| Direct labor | 9,182,515 | |||
| Manufacturing expenses | 35,285,194 | |||
| Manufacturing cost | 68,471,723 | |||
| Add: Work in process, beginning of year | 209,411 | |||
| Others | 20,331 | |||
| Less: Work in process, end of year | 241,352 | |||
| Cost of finished goods | 68,460,113 | |||
| Add: Finished goods, beginning of year | 245,301 | |||
| Less: Finished goods, end of year | 243,240 | |||
| Others | 40,869 | |||
| 68,421,305 | ||||
| Others | 637,696 | |||
| $ | 69,059,001 | |||
-92-
STATEMENT 13
ADVANCED SEMICONDUCTOR ENGINEERING, INC.
STATEMENT OF OPERATING EXPENSES
FOR THE YEAR ENDED DECEMBER 31, 2015
(In Thousands of New Taiwan Dollars)
| Item | Selling and Marketing Expenses | General and Administrative Expenses | Research and Development Expenses | Total | ||||||||||||
| Payroll | $ | 73,485 | $ | 2,385,405 | $ | 3,233,270 | $ | 5,692,160 | ||||||||
| Sales service charge | 921,269 | - | - | 921,269 | ||||||||||||
| Depreciation | 603 | 223,256 | 655,874 | 879,733 | ||||||||||||
| Professional fee | 149 | 547,077 | 55,583 | 602,809 | ||||||||||||
| Consumption-Tri Run and indirect material | 691 | 36,412 | 412,327 | 449,430 | ||||||||||||
| Employee insurance | 4,878 | 147,625 | 245,051 | 397,554 | ||||||||||||
| Repair, maintenance and factory supplies | 30 | 145,998 | 153,350 | 299,378 | ||||||||||||
| Pension | 2,919 | 81,086 | 138,535 | 222,540 | ||||||||||||
| Amortization | 63 | 64,712 | 32,819 | 97,594 | ||||||||||||
| Others | 96,739 | 1,156,502 | 439,312 | 1,692,553 | ||||||||||||
| $ | 1,100,826 | $ | 4,788,073 | $ | 5,366,121 | $ | 11,255,020 | |||||||||
-93-
Appendix 7
Advanced Semiconductor Engineering, Inc.
Statement of Non-refund or Collectin of Expenses
Relating to Underwriting by Underwriter, Issuing
Company and its Related Parties
Statement
Under no circumstances have the Company, its directors, general manager, financial or accounting supervisor and managers involved in the Company's 2016 offer to issue new common stocks for cash, been involved whether directly or indirectly, in demanding, accepting, agreeing to accept or giving bribery and acceptance of bribery. Neither have they accepted the offer of nor demanded the securities underwriter to compensate or refund underwriting fees in any manner or under any pretext to the Company and the above individuals or their related or appointed parties. Furthermore the said parties have not made false statements or concealed relevant facts. Insofar as involvement in the above actions involves violation of Articles 20, 20-1 and 32 of the Securities Exchange Act, they shall bear relevant legal responsibility under Articles 171 and and 174 of the said Act.
| Declarant: Advanced Semiconductor Engineering, Inc. | |
| Legal Representative: Chian-Sheng Chang |
Date:
Statement
Our Company, as a legal entity director of Advanced Semiconductor Engineering, Inc. (hereinafter referred to as "said Company"), hereby solemnly declares that, with respect to said Company's 2016 offer to issue new common stocks for cash, our Company has not been involved whether directly or indirectly in demanding, accepting, agreeing to accept or giving bribery and acceptance of bribery. Neither has our Company accepted the offer of nor demanded the securities underwriter to compensate or refund underwriting fees in any manner or under any pretext to said Company or its related or appointed parties. Furthermore our Company has not made false statements or concealed relevant facts. Insofar as our Company’s involvement in the above actions involves violation of Articles 20, 20-1 and 32 of the Securities Exchange Act, we shall bear relevant legal responsibility under Articles 171 and 174 of the said Act.
| Declarant |
| Legal Entity Director: A.S.E. Enterprises Limited |
| Legal Representative: Chian-Sheng Chang |
Date:
Statement
I am a representative director and Chairman of Advanced Semiconductor Engineering, Inc. (hereinafter called "the Company") and I solemnly declare that, with respect to the Company's 2016 offer to issue new common stocks for cash, I have not been involved whether directly or indirectly, in demanding, accepting, agreeing to accept or giving bribery and acceptance of bribery. Neither have I accepted the offer of nor demanded the securities underwriter to compensate or refund underwriting fees in any manner or under any pretext to the Company or its related or appointed parties. Furthermore I have not made false statements or concealed relevant facts. Insofar as my involvement in the above actions involves violation of Articles 20, 20-1 and 32 of the Securities Exchange Act, I shall bear relevant legal responsibility under Articles 171 and 174 of the said Act.
| Declarant |
| Legal Entity Director A.S.E. Enterprises Limited |
| Person-in-charge of Legal Entity Director Chian-Sheng Chang |
| Representative Director and Chairman Chian-Sheng Chang |
Date:
Statement
I am the Vice Charmian and General Manager of Advanced Semiconductor Engineering, Inc. (hereinafter called "the Company") and I solemnly declare that, with respect to the Company's 2016 offer to issue new common stocks for cash, I have not been involved whether directly or indirectly, in demanding, accepting, agreeing to accept or giving bribery and acceptance of bribery. Neither have I accepted the offer of nor demanded the securities underwriter to compensate or refund underwriting fees in any manner or under any pretext to the Company or its related or appointed parties. Furthermore I have not made false statements or concealed relevant facts. Insofar as my involvement in the above actions involves violation of Articles 20, 20-1 and 32 of the Securities Exchange Act, I shall bear relevant legal responsibility under Articles 171 and 174 of the said Act.
| Declarant |
| Vice Charmian and General Manager: Hong-Ben Chang |
Date:
Statement
I am a representative director, Chief Operating Officer and General Manager of Advanced Semiconductor Engineering, Inc. (hereinafter called "the Company") and I solemnly declare that, with respect to the Company's 2016 offer to issue new common stocks for cash, I have not been involved whether directly or indirectly, in demanding, accepting, agreeing to accept or giving bribery and acceptance of bribery. Neither have I accepted the offer of nor demanded the securities underwriter to compensate or refund underwriting fees in any manner or under any pretext to the Company or its related or appointed parties. Furthermore I have not made false statements or concealed relevant facts. Insofar as my involvement in the above actions involves violation of Articles 20, 20-1 and 32 of the Securities Exchange Act, I shall bear relevant legal responsibility under Articles 171 and 174 of the said Act.
| Declarant |
| Legal Entity Director A.S.E. Enterprises Limited |
| Representative Director, Chief Operating Officer and General Manager Tien Wu |
Date:
Statement
I am a representative director and Chief Finance Officer of Advanced Semiconductor Engineering, Inc. (hereinafter called "the Company") and I solemnly declare that, with respect to the Company's 2016 offer to issue new common stocks for cash, I have not been involved whether directly or indirectly, in demanding, accepting, agreeing to accept or giving bribery and acceptance of bribery. Neither have I accepted the offer of nor demanded the securities underwriter to compensate or refund underwriting fees in any manner or under any pretext to the Company or its related or appointed parties. Furthermore I have not made false statements or concealed relevant facts. Insofar as my involvement in the above actions involves violation of Articles 20, 20-1 and 32 of the Securities Exchange Act, I shall bear relevant legal responsibility under Articles 171 and 174 of the said Act.
| Declarant |
| Legal Entity Director A.S.E. Enterprises Limited |
| Representative Director and Chief Finance Officer: Joseph Tung |
Date:
Statement
I am a representative director and General Manager of Advanced Semiconductor Engineering, Inc. (hereinafter called "the Company") and I solemnly declare that, with respect to the Company's 2016 offer to issue new common stocks for cash, I have not been involved whether directly or indirectly, in demanding, accepting, agreeing to accept or giving bribery and acceptance of bribery. Neither have I accepted the offer of nor demanded the securities underwriter to compensate or refund underwriting fees in any manner or under any pretext to the Company or its related or appointed parties. Furthermore I have not made false statements or concealed relevant facts. Insofar as my involvement in the above actions involves violation of Articles 20, 20-1 and 32 of the Securities Exchange Act, I shall bear relevant legal responsibility under Articles 171 and 174 of the said Act.
| Declarant |
| Legal Entity Director A.S.E. Enterprises Limited |
| Representative director and General Manager Raymond Lo |
Date:
Statement
I am a representative director and General Manager of Advanced Semiconductor Engineering, Inc. (hereinafter called "the Company") and I solemnly declare that, with respect to the Company's 2016 offer to issue new common stocks for cash, I have not been involved whether directly or indirectly, in demanding, accepting, agreeing to accept or giving bribery and acceptance of bribery. Neither have I accepted the offer of nor demanded the securities underwriter to compensate or refund underwriting fees in any manner or under any pretext to the Company or its related or appointed parties. Furthermore I have not made false statements or concealed relevant facts. Insofar as my involvement in the above actions involves violation of Articles 20, 20-1 and 32 of the Securities Exchange Act, I shall bear relevant legal responsibility under Articles 171 and 174 of the said Act.
| Declarant |
| Legal Entity Director A.S.E. Enterprises Limited |
| Representative director and General Manager Jeffery Chen |
Date:
| Statement |
I am a representative director and General Manager of Advanced Semiconductor Engineering, Inc. (hereinafter called "the Company") and I solemnly declare that, with respect to the Company's 2016 offer to issue new common stocks for cash, I have not been involved whether directly or indirectly, in demanding, accepting, agreeing to accept or giving bribery and acceptance of bribery. Neither have I accepted the offer of nor demanded the securities underwriter to compensate or refund underwriting fees in any manner or under any pretext to the Company or its related or appointed parties. Furthermore I have not made false statements or concealed relevant facts. Insofar as my involvement in the above actions involves violation of Articles 20, 20-1 and 32 of the Securities Exchange Act, I shall bear relevant legal responsibility under Articles 171 and 174 of the said Act.
| Declarant |
| Legal Entity Director A.S.E. Enterprises Limited |
| Representative director and General Manager Chen Tien-chi |
Date:
| Statement |
I am an Independent Director of Advanced Semiconductor Engineering, Inc. (hereinafter called "the Company") and I solemnly declare that, with respect to the Company's 2016 offer to issue new common stocks for cash, I have not been involved whether directly or indirectly, in demanding, accepting, agreeing to accept or giving bribery and acceptance of bribery. Neither have I accepted nor demanded the securities underwriter to compensate or refund underwriting fees in any manner or under any pretext to the Company or its related or appointed parties. Furthermore I have not made false statements or concealed relevant facts. Insofar as my involvement in the above actions involves violation of Articles 20, 20-1 and 32 of the Securities Exchange Act, I shall bear relevant legal responsibility under Articles 171 and 174 of the said Act.
| Declarant |
| Independent Director Ta-lin Hsu |
Date:
| Statement |
I am an Independent Director of Advanced Semiconductor Engineering, Inc. (hereinafter called "the Company") and I solemnly declare that, with respect to the Company's 2016 offer to issue new common stocks for cash, I have not been involved whether directly or indirectly, in demanding, accepting, agreeing to accept or giving bribery and acceptance of bribery. Neither have I accepted the offer of nor demanded the securities underwriter to compensate or refund underwriting fees in any manner or under any pretext to the Company or its related or appointed parties. Furthermore I have not made false statements or concealed relevant facts. Insofar as my involvement in the above actions involves violation of Articles 20, 20-1 and 32 of the Securities Exchange Act, I shall bear relevant legal responsibility under Articles 171 and 174 of the said Act.
| Declarant |
| Independent Director Mei-yue Ho |
Date:
| Statement |
I am a director of Advanced Semiconductor Engineering, Inc. (hereinafter called "the Company") and I solemnly declare that, with respect to the Company's 2016 offer to issue new common stocks for cash, I have not been involved whether directly or indirectly, in demanding, accepting, agreeing to accept or giving bribery and acceptance of bribery. Neither have I accepted the offer of nor demanded the securities underwriter to compensate or refund underwriting fees in any manner or under any pretext to the Company or its related or appointed parties. Furthermore I have not made false statements or concealed relevant facts. Insofar as my involvement in the above actions involves violation of Articles 20, 20-1 and 32 of the Securities Exchange Act, I shall bear relevant legal responsibility under Articles 171 and 174 of the said Act.
| Declarant |
| Director Rutherford Chang |
Date:
| Statement |
I am an Independent Director of Advanced Semiconductor Engineering, Inc. (hereinafter called "the Company") and I solemnly declare that, with respect to the Company's 2016 offer to issue new common stocks for cash, I have not been involved whether directly or indirectly, in demanding, accepting, agreeing to accept or giving bribery and acceptance of bribery. Neither have I accepted the offer of nor demanded the securities underwriter to compensate or refund underwriting fees in any manner or under any pretext to the Company or its related or appointed parties. Furthermore I have not made false statements or concealed relevant facts. Insofar as my involvement in the above actions involves violation of Articles 20, 20-1 and 32 of the Securities Exchange Act, I shall bear relevant legal responsibility under Articles 171 and 174 of the said Act.
| Declarant |
| Independent Director You Sheng-Fu |
Date:
Statement
I am the Supervisor of the Accounting Department of Advanced Semiconductor Engineering, Inc. (hereinafter called "the Company") and I solemnly declare that, with respect to the Company's 2016 offer to issue new common stocks for cash, I have not been involved whether directly or indirectly, in demanding, accepting, agreeing to accept or giving bribery and acceptance of bribery. Neither have I accepted the offer of nor demanded the securities underwriter to compensate or refund underwriting fees in any manner or under any pretext to the Company or its related or appointed parties. Furthermore I have not made false statements or concealed relevant facts. Insofar as my involvement in the above actions involves violation of Articles 20, 20-1 and 32 of the Securities Exchange Act, I shall bear relevant legal responsibility under Articles 171 and 174 of the said Act.
| Declarant |
| Supervisor of Accounting Department: Hong-Ming Kuo |
Date:
Statement
Our company has been appointed by Advanced Semiconductor Engineering, Inc. (hereinafter called "ASE") to act as the securities underwriter of ASE with respect to its issuance in 2016 of new stocks for cash. Our company hereby undertakes to exercise due care and diligence with respect to the matters set out below. Our company further warrants that under no circumstances have we made false representations or concealed the truth:
| I. | The formulation of price of securities issued by ASE and relevant work procedures are pursuant to the "Taiwan Securities Association Self-Disciplinary Regulations on Underwriter Members for Subscription and Issuance of Securities by Issuing Company" and "Taiwan Securities Association Rules Governing Underwriting and Resale of Securities by Securities Firms" and relevant regulations. |
| II. | Under no circumstances has our company, whether directly or indirectly, demanded, accepted, agreed to accept or given bribery and acceptance of bribery. Furthermore we have not offered to compensate or refund or compensated or refunded the underwriting fees received by our company to the issuer or its related parties or persons appointed by the aforesaid. |
| III. | If as a result of the aforesaid our company is in violation of Articles 20 and 32 of the Securities Exchange Act, our company shall in addition to being legally liable under the relevant regulations of Taiwan Securities Association, bear legal responsibility under Articles 171 and 174 of the said Act. |
| Securities Underwriter: KGI Securities Co., Ltd. |
| Legal Representative: Hsu Daw-yi |
Date: