UNITED STATES
SECURITIES AND EXCHANGE COMMISSION
Washington, D.C. 20549
FORM 6-K
REPORT OF FOREIGN PRIVATE ISSUER PURSUANT TO RULE 13a-16 OR 15d-16
UNDER THE SECURITIES EXCHANGE ACT OF 1934
April 29, 2020
| Commission File Number 001-16125 | |
| ASE Technology Holding Co., Ltd. | |
| (Translation of registrant’s name into English) | |
26 Chin Third Road Nantze Export Processing Zone Kaoshiung, Taiwan Republic of China | |
| (Address of principal executive offices) | |
Indicate by check mark whether the registrant files or will file annual reports under cover of Form 20-F or Form 40-F.
| Form 20-F ☒ Form 40-F ☐ |
Indicate by check mark if the registrant is submitting the Form 6-K in paper as permitted by Regulation S-T Rule 101(b)(1): ☐
Note: Regulation S-T Rule 101(b)(1) only permits the submission in paper of a Form 6-K if submitted solely to provide an attached annual report to security holders.
Indicate by check mark if the registrant is submitting the Form 6-K in paper as permitted by Regulation S-T Rule 101(b)(7): ☐
Note: Regulation S-T Rule 101(b)(7) only permits the submission in paper of a Form 6-K if submitted to furnish a report or other document that the registrant foreign private issuer must furnish and make public under the laws of the jurisdiction in which the registrant is incorporated, domiciled or legally organized (the registrant’s “home country”), or under the rules of the home country exchange on which the registrant’s securities are traded, as long as the report or other document is not a press release, is not required to be and has not been distributed to the registrant’s security holders, and, if discussing a material event, has already been the subject of a Form 6-K submission or other Commission filing on EDGAR.
SIGNATURES
Pursuant to the requirements of the Securities Exchange Act of 1934, the registrant has duly caused this report to be signed on its behalf by the undersigned, thereunto duly authorized.
| ASE TECHNOLOGY HOLDING CO., LTD. | ||
| Date: April 29, 2020 | By: | /s/ Joseph Tung |
| Name: Joseph Tung | ||
| Title: Chief Financial Officer | ||

1 ASE Technology Holding Co., Ltd. April 29, 2020 ASE Technology Holding First Quarter 2020 Earnings Release

2 Safe Harbor Notice This presentation contains "forward - looking statements" within the meaning of Section 27A of the United States Securities Act of 1933, as amended, and Section 21E of the United States Securities Exchange Act of 1934, as amended. Although these forward - looking statements, which may include statements regarding our future results of operations, financial condition or business prospects, are based on our own information and information from other sources we believe to be reliable, you should not place undue reliance on these forward - looking statements, which apply only as of the date of this presentation. The words “anticipate,” “believe,” “estimate,” “expect,” “intend,” “plan” and similar expressions, as they relate to us, are intended to identify these forward - looking statements in this presentation. These forward - looking statements are necessarily estimates reflecting the best judgment of our senior management and our actual results of operations, financial condition or business prospects may differ materially from those expressed or implied by the forward - looking statements for reasons including, among others, risks associated with cyclicality and market conditions in the semiconductor or electronic industry; changes in our regulatory environment, including our ability to comply with new or stricter environmental regulations and to resolve environmental liabilities; demand for the outsourced semiconductor packaging, testing and electronic manufacturing services we offer and for such outsourced services generally; the highly competitive semiconductor or manufacturing industry we are involved in; our ability to introduce new technologies in order to remain competitive; international business activities; our business strategy; our future expansion plans and capital expenditures; the strained relationship between the Republic of China and the People’s Republic of China; general economic and political conditions; the recent shift in United States trade policies; possible disruptions in commercial activities caused by natural or human - induced disasters; fluctuations in foreign currency exchange rates; and other factors. For a discussion of these risks and other factors, please see the documents we file from time to time with the Securities and Exchange Commission, including the 2019 Annual Report on Form 20 - F filed on March 31, 2020.

3 Consolidated Statements of Comprehensive Income Quarterly Comparison (unaudited) (NT$ Million) Q1 / 2020 % Q4 / 2019 % Q1 / 2019 % QoQ YoY Net Revenues: ATM 64,150 65.9% 66,769 57.5% 53,653 60.4% -4% 20% EMS 32,721 33.6% 48,734 42.0% 34,947 39.2% -33% -6% Others 486 0.5% 520 0.5% 261 0.4% -7% 86% Total Net Revenues 97,357 100.0% 116,023 100.0% 88,861 100.0% -16% 10% Gross Profit 16,156 16.6% 19,849 17.1% 11,385 12.8% -19% 42% Operating Income (Loss) 6,063 6.2% 8,705 7.5% 2,293 2.6% -30% 164% Pretax Income (Loss) 5,237 5.4% 8,582 7.4% 2,635 3.0% -39% 99% Income Tax Benefit (Expense) (1,175) -1.2% (1,779) -1.5% (405) -0.5% Noncontrolling Interest (163) -0.2% (420) -0.4% (187) -0.2% Net Income Attributable to Shareholders of the Parent 3,899 4.0% 6,383 5.5% 2,043 2.3% -39% 91% Basic EPS 0.92 1.50 0.48 -39% 92% Diluted EPS 0.89 1.47 0.46 -39% 93% Additional Commentary From Management: Gross Profit excl. PPA expenses 1 17,205 17.7% 21,040 18.1% 12,590 14.2% -18% 37% Operating Profit excl. PPA expenses 1 7,365 7.6% 10,150 8.7% 3,751 4.2% -27% 96% Net Profit excl. PPA expenses 1 5,231 5.4% 7,857 6.8% 3,501 3.9% -33% 49% Basic EPS excl. PPA expenses 1 1.23 1.85 0.82 -34% 50% 1 : PPA expenses are the P&L impacts from the accounting treatment of purchase price allocation in relation to the ASE/SPIL transaction, which resulted in increased asset values from purchase price premiums in PP&E, intangibles and long - term lease prepayments. The PPA expenses excluded are related to depreciation, amortization and other expenses $1.33bn in 1Q20, $1.47bn in 4Q19 and $1.46bn in 1Q19 .
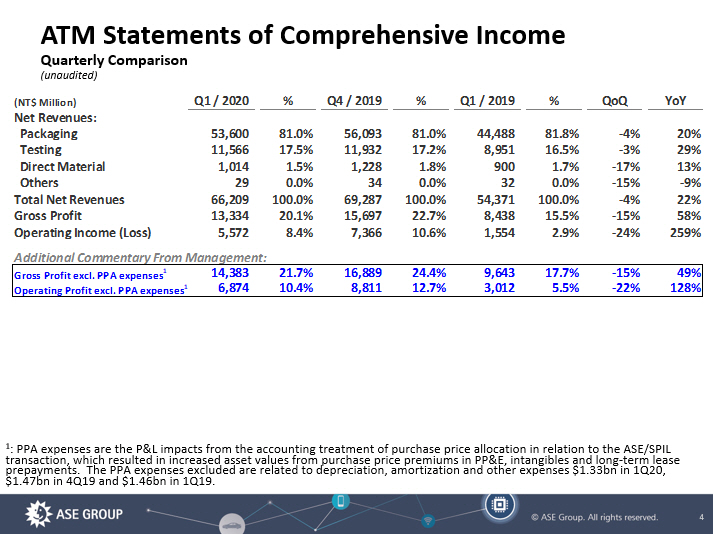
4 ATM Statements of Comprehensive Income Quarterly Comparison (unaudited) (NT$ Million) Q1 / 2020 % Q4 / 2019 % Q1 / 2019 % QoQ YoY Net Revenues: Packaging 53,600 81.0% 56,093 81.0% 44,488 81.8% -4% 20% Testing 11,566 17.5% 11,932 17.2% 8,951 16.5% -3% 29% Direct Material 1,014 1.5% 1,228 1.8% 900 1.7% -17% 13% Others 29 0.0% 34 0.0% 32 0.0% -15% -9% Total Net Revenues 66,209 100.0% 69,287 100.0% 54,371 100.0% -4% 22% Gross Profit 13,334 20.1% 15,697 22.7% 8,438 15.5% -15% 58% Operating Income (Loss) 5,572 8.4% 7,366 10.6% 1,554 2.9% -24% 259% Additional Commentary From Management: Gross Profit excl. PPA expenses 1 14,383 21.7% 16,889 24.4% 9,643 17.7% -15% 49% Operating Profit excl. PPA expenses 1 6,874 10.4% 8,811 12.7% 3,012 5.5% -22% 128% 1 : PPA expenses are the P&L impacts from the accounting treatment of purchase price allocation in relation to the ASE/SPIL transaction, which resulted in increased asset values from purchase price premiums in PP&E, intangibles and long - term lease prepayments. The PPA expenses excluded are related to depreciation, amortization and other expenses $1.33bn in 1Q20, $1.47bn in 4Q19 and $1.46bn in 1Q19.

5 ATM Operations (unaudited) 8,438 11,100 14,708 15,697 13,334 54,371 59,594 67,901 69,287 66,209 15.5% 18.6% 21.7% 22.7% 20.1% 0% 10% 20% 30% 0 10,000 20,000 30,000 40,000 50,000 60,000 70,000 Q1/19 Q2/19 Q3/19 Q4/19 Q1/20 NT$ Million Gross Profit Gross Margin Revenue
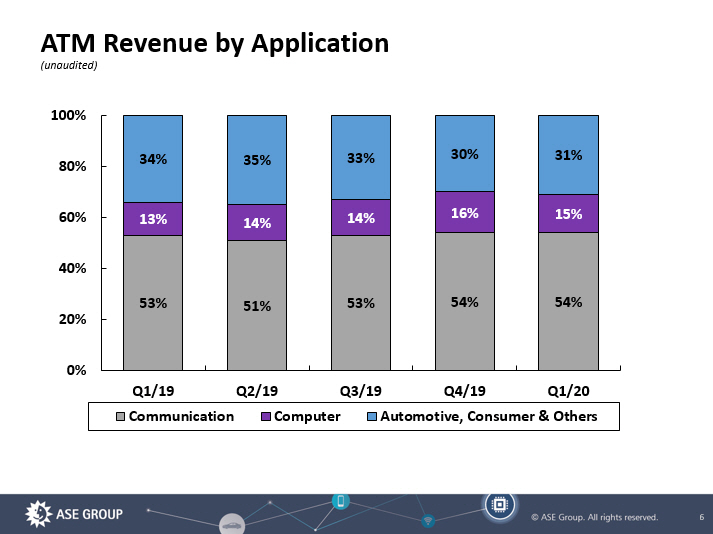
6 ATM Revenue by Application (unaudited) 53% 51% 53% 54% 54% 13% 14% 14% 16% 15% 34% 35% 33% 30% 31% 0% 20% 40% 60% 80% 100% Q1/19 Q2/19 Q3/19 Q4/19 Q1/20 Communication Computer Automotive, Consumer & Others
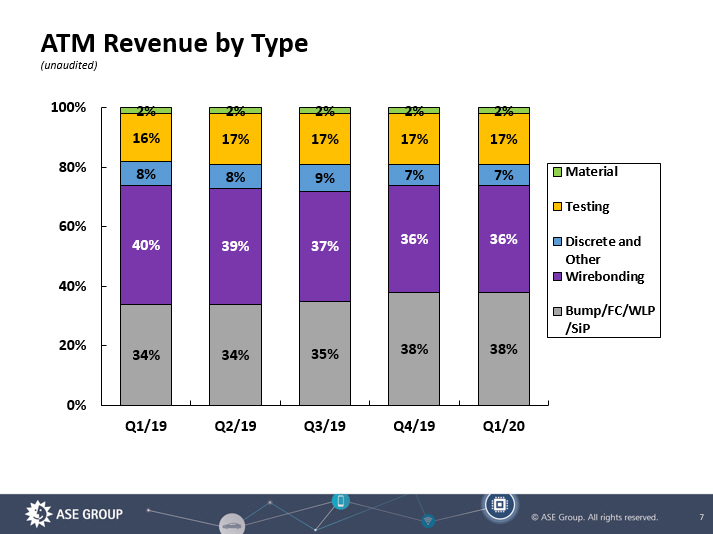
7 34% 34% 35% 38% 38% 40% 39% 37% 36% 36% 8% 8% 9% 7% 7% 16% 17% 17% 17% 17% 2% 2% 2% 2% 2% 0% 20% 40% 60% 80% 100% Q1/19 Q2/19 Q3/19 Q4/19 Q1/20 Material Testing Discrete and Other Wirebonding Bump/FC/WLP /SiP ATM Revenue by Type (unaudited)

8 EMS Operations Quarterly Comparison (unaudited ) (NT$ Million) Q1 / 2020 % Q4 / 2019 % Q1 / 2019 % QoQ YoY EMS Net Revenues 32,727 100.0% 48,762 100.0% 34,959 100.0% -33% -6% Gross Profit 3,048 9.3% 4,319 8.9% 2,930 8.4% -29% 4% Operating Income (Loss) 771 2.4% 1,553 3.2% 738 2.1% -50% 4% EBITDA 1,577 4.8% 2,650 5.4% 1,909 5.5% -40% -17%
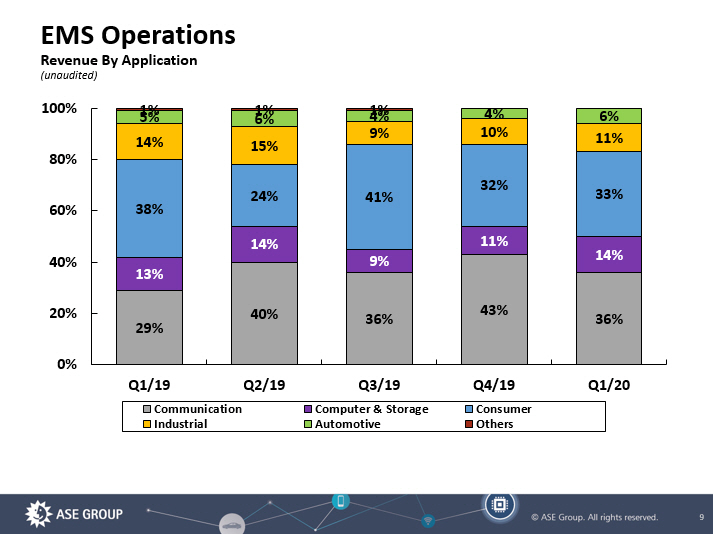
9 EMS Operations Revenue By Application (unaudited) 29% 40% 36% 43% 36% 13% 14% 9% 11% 14% 38% 24% 41% 32% 33% 14% 15% 9% 10% 11% 5% 6% 4% 4% 6% 1% 1% 1% 0% 20% 40% 60% 80% 100% Q1/19 Q2/19 Q3/19 Q4/19 Q1/20 Communication Computer & Storage Consumer Industrial Automotive Others
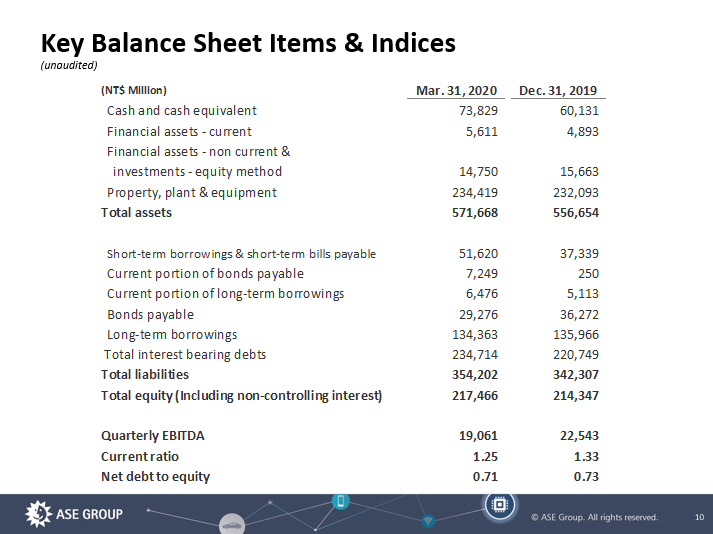
10 Key Balance Sheet Items & Indices (unaudited) (NT$ Million) Mar. 31, 2020 Dec. 31, 2019 Cash and cash equivalent 73,829 60,131 Financial assets - current 5,611 4,893 Financial assets - non current & investments - equity method 14,750 15,663 Property, plant & equipment 234,419 232,093 Total assets 571,668 556,654 Short-term borrowings & short-term bills payable 51,620 37,339 Current portion of bonds payable 7,249 250 Current portion of long-term borrowings 6,476 5,113 Bonds payable 29,276 36,272 Long-term borrowings 134,363 135,966 Total interest bearing debts 234,714 220,749 Total liabilities 354,202 342,307 Total equity (Including non-controlling interest) 217,466 214,347 Quarterly EBITDA 19,061 22,543 Current ratio 1.25 1.33 Net debt to equity 0.71 0.73

11 Equipment Capital Expenditure vs. EBITDA (unaudited) 239 444 436 457 410 537 582 681 738 635 0 200 400 600 800 Q1/19 Q2/19 Q3/19 Q4/19 Q1/20 US$ Million Capex EBITDA

12 Second Quarter 2020 Outlook* Based on our current business outlook and exchange rate assumptions, management projects overall performance for the Second quarter of 2020 to be as follows: • In NTD terms, ATM 2 nd quarter 2020 business should be similar to 3 rd quarter 2019 levels; • ATM 2 nd quarter 2020 gross margin should be close to 3 rd quarter 2019 levels; • In NTD terms, EMS 2 nd quarter 2020 business should be above 1 st quarter 2019 levels; • EMS 2 nd quarter 2020 operating margin should be slightly above 1 st quarter 2019 levels . *: Due to the impact of the COVID - 19 outbreak, our outlook continues to be subject to a higher degree of risk. The information prov ided is done so as a reference of our current view as of the date of this presentation. Our business, financial condition and results of operations are of greater adverse risk; and, as a result, there may be a higher likelihood of material variances between our expected and actua l r esults .

13 www.aseglobal.com Thank You
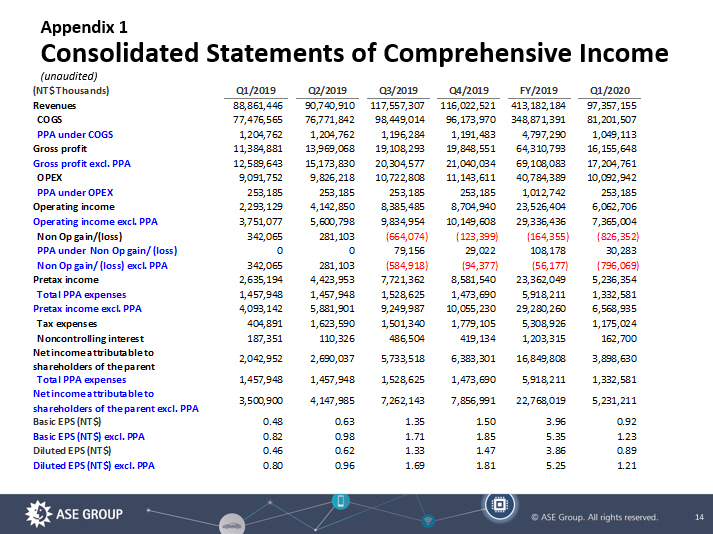
14 Appendix 1 Consolidated Statements of Comprehensive Income ( unaudited) (NT$ Thousands) Q1/2019 Q2/2019 Q3/2019 Q4/2019 FY/2019 Q1/2020 Revenues 88,861,446 90,740,910 117,557,307 116,022,521 413,182,184 97,357,155 COGS 77,476,565 76,771,842 98,449,014 96,173,970 348,871,391 81,201,507 PPA under COGS 1,204,762 1,204,762 1,196,284 1,191,483 4,797,290 1,049,113 Gross profit 11,384,881 13,969,068 19,108,293 19,848,551 64,310,793 16,155,648 Gross profit excl. PPA 12,589,643 15,173,830 20,304,577 21,040,034 69,108,083 17,204,761 OPEX 9,091,752 9,826,218 10,722,808 11,143,611 40,784,389 10,092,942 PPA under OPEX 253,185 253,185 253,185 253,185 1,012,742 253,185 Operating income 2,293,129 4,142,850 8,385,485 8,704,940 23,526,404 6,062,706 Operating income excl. PPA 3,751,077 5,600,798 9,834,954 10,149,608 29,336,436 7,365,004 Non Op gain/(loss) 342,065 281,103 (664,074) (123,399) (164,355) (826,352) PPA under Non Op gain/ (loss) 0 0 79,156 29,022 108,178 30,283 Non Op gain/ (loss) excl. PPA 342,065 281,103 (584,918) (94,377) (56,177) (796,069) Pretax income 2,635,194 4,423,953 7,721,362 8,581,540 23,362,049 5,236,354 Total PPA expenses 1,457,948 1,457,948 1,528,625 1,473,690 5,918,211 1,332,581 Pretax income excl. PPA 4,093,142 5,881,901 9,249,987 10,055,230 29,280,260 6,568,935 Tax expenses 404,891 1,623,590 1,501,340 1,779,105 5,308,926 1,175,024 Noncontrolling interest 187,351 110,326 486,504 419,134 1,203,315 162,700 Net income attributable to shareholders of the parent 2,042,952 2,690,037 5,733,518 6,383,301 16,849,808 3,898,630 Total PPA expenses 1,457,948 1,457,948 1,528,625 1,473,690 5,918,211 1,332,581 Net income attributable to shareholders of the parent excl. PPA 3,500,900 4,147,985 7,262,143 7,856,991 22,768,019 5,231,211 Basic EPS (NT$) 0.48 0.63 1.35 1.50 3.96 0.92 Basic EPS (NT$) excl. PPA 0.82 0.98 1.71 1.85 5.35 1.23 Diluted EPS (NT$) 0.46 0.62 1.33 1.47 3.86 0.89 Diluted EPS (NT$) excl. PPA 0.80 0.96 1.69 1.81 5.25 1.21