Exhibit 99 (c)-(2)

PRESENTATION TO SPIL BOARD OF DIRECTORS
Project Summit
June 30, 2016
STRICTLY PRIVATE AND CONFIDENTIAL
J.P. Morgan
CONFIDENTIAL
This presentation was prepared exclusively for the benefit and internal use of the J.P. Morgan client to whom it is directly addressed and delivered (including such client’s subsidiaries, the “Company”) in order to assist the Company in evaluating, on a preliminary basis, the feasibility of a possible transaction or transactions and does not carry any right of publication or disclosure, in whole or in part, to any other party. This presentation is for discussion purposes only and is incomplete without reference to, and should be viewed solely in conjunction with, the oral briefing provided by J.P. Morgan. Neither this presentation nor any of its contents may be disclosed or used for any other purpose without the prior written consent of J.P. Morgan.
The information in this presentation is based upon any management forecasts supplied to us and reflects prevailing conditions and our views as of this date, all of which are accordingly subject to change. J.P. Morgan’s opinions and estimates constitute J.P. Morgan’s judgment and should be regarded as indicative, preliminary and for illustrative purposes only. In preparing this presentation, we have relied upon and assumed, without independent verification, the accuracy and completeness of all information available from public sources or which was provided to us by or on behalf of the Company or which was otherwise reviewed by us. In addition, our analyses are not and do not purport to be appraisals of the assets, stock, or business of the Company or any other entity. J.P. Morgan makes no representations as to the actual value which may be received in connection with a transaction nor the legal, tax or accounting effects of consummating a transaction. Unless expressly contemplated hereby, the information in this presentation does not take into account the effects of a possible transaction or transactions involving an actual or potential change of control, which may have significant valuation and other effects.
Notwithstanding anything herein to the contrary, the Company and each of its employees, representatives or other agents may disclose to any and all persons, without limitation of any kind, the U.S. federal and state income tax treatment and the U.S. federal and state income tax structure of the transactions contemplated hereby and all materials of any kind (including opinions or other tax analyses) that are provided to the Company relating to such tax treatment and tax structure insofar as such treatment and/or structure relates to a U.S. federal or state income tax strategy provided to the Company by J.P. Morgan.
J.P. Morgan’s policies prohibit employees from offering, directly or indirectly, a favorable research rating or specific price target, or offering to change a rating or price target, to a subject company as consideration or inducement for the receipt of business or for compensation. J.P. Morgan also prohibits its research analysts from being compensated for involvement in investment banking transactions except to the extent that such participation is intended to benefit investors.
IRS Circular 230 Disclosure: JPMorgan Chase & Co. and its affiliates do not provide tax advice. Accordingly, any discussion of U.S. tax matters included herein (including any attachments) is not intended or written to be used, and cannot be used, in connection with the promotion, marketing or recommendation by anyone not affiliated with JPMorgan Chase & Co. of any of the matters addressed herein or for the purpose of avoiding U.S. tax-related penalties.
J.P. Morgan is a marketing name for investment banking businesses of JPMorgan Chase & Co. and its subsidiaries worldwide. Securities, syndicated loan arranging, financial advisory and other investment banking activities are performed by a combination of J.P. Morgan Securities Inc., J.P. Morgan plc, J.P. Morgan Securities Ltd. and the appropriately licensed subsidiaries of JPMorgan Chase & Co. in Asia-Pacific, and lending, derivatives and other commercial banking activities are performed by JPMorgan Chase Bank, N.A. J.P. Morgan deal team members may be employees of any of the foregoing entities.
This presentation does not constitute a commitment by any J.P. Morgan entity to underwrite, subscribe for or place any securities or to extend or arrange credit or to provide any other services.
Copyright 2014 JPMorgan Chase & Co. All rights reserved.
PRESENTATION TO SPIL BOARD OF DIRECTORS
SPIL J.P. Morgan
CONFIDENTIAL
Executive summary
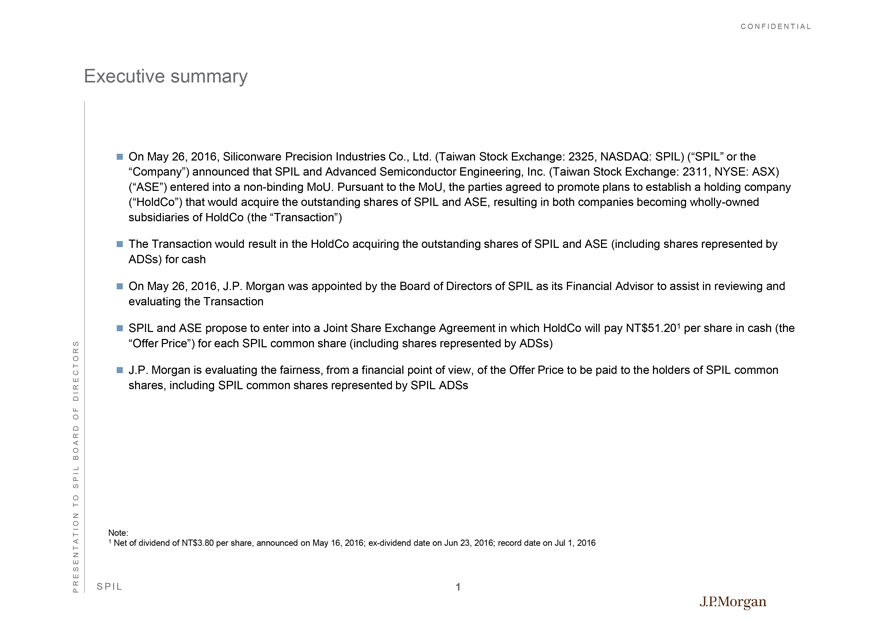
On May 26, 2016, Siliconware Precision Industries Co., Ltd. (Taiwan Stock Exchange: 2325, NASDAQ: SPIL) (“SPIL” or the “Company”) announced that SPIL and Advanced Semiconductor Engineering, Inc. (Taiwan Stock Exchange: 2311, NYSE: ASX) (“ASE”) entered into a non-binding MoU. Pursuant to the MoU, the parties agreed to promote plans to establish a holding company (“HoldCo”) that would acquire the outstanding shares of SPIL and ASE, resulting in both companies becoming wholly-owned subsidiaries of HoldCo (the “Transaction”)
The Transaction would result in the HoldCo acquiring the outstanding shares of SPIL and ASE (including shares represented by ADSs) for cash
On May 26, 2016, J.P. Morgan was appointed by the Board of Directors of SPIL as its Financial Advisor to assist in reviewing and evaluating the Transaction
SPIL and ASE propose to enter into a Joint Share Exchange Agreement in which HoldCo will pay NT$51.201 per share in cash (the “Offer Price”) for each SPIL common share (including shares represented by ADSs)
J.P. Morgan is evaluating the fairness, from a financial point of view, of the Offer Price to be paid to the holders of SPIL common shares, including SPIL common shares represented by SPIL ADSs
Note:
1 Net of dividend of NT$3.80 per share, announced on May 16, 2016; ex-dividend date on Jun 23, 2016; record date on Jul 1, 2016
PRESENTATION TO SPIL BOARD OF DIRECTORS
SPIL 1 J.P. Morgan
CONFIDENTIAL
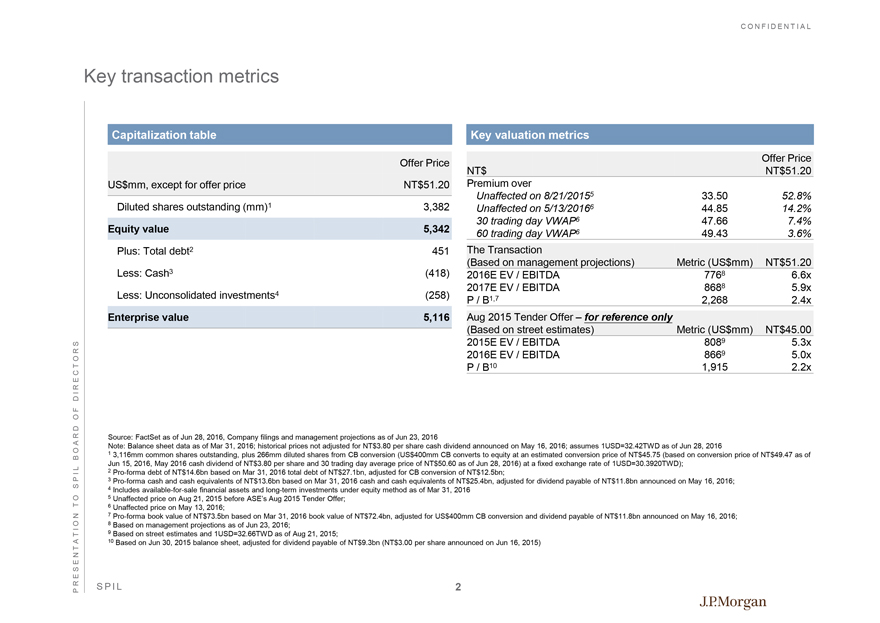
Key transaction metrics
Capitalization table
Offer Price
US$mm, except for offer price NT$51.20
Diluted shares outstanding (mm)1 3,382
Equity value 5,342
Plus: Total debt2 451
Less: Cash3 (418)
Less: Unconsolidated investments4 (258)
Enterprise value 5,116
Key valuation metrics
Offer Price
NT$ NT$51.20
Premium over
Unaffected on 8/21/20155 33.50 52.8%
Unaffected on 5/13/20166 44.85 14.2%
30 trading day VWAP6 47.66 7.4%
60 trading day VWAP6 49.43 3.6%
The Transaction
(Based on management projections) Metric (US$mm) NT$51.20
2016E EV / EBITDA 7768 6.6x
2017E EV / EBITDA 8688 5.9x
P / B1,7 2,268 2.4x
Aug 2015 Tender Offer – for reference only
(Based on street estimates) Metric (US$mm) NT$45.00
2015E EV / EBITDA 8089 5.3x
2016E EV / EBITDA 8669 5.0x
P / B10 1,915 2.2x
Source: FactSet as of Jun 28, 2016, Company filings and management projections as of Jun 23, 2016
Note: Balance sheet data as of Mar 31, 2016; historical prices not adjusted for NT$3.80 per share cash dividend announced on May 16, 2016; assumes 1USD=32.42TWD as of Jun 28, 2016
1 3,116mm common shares outstanding, plus 266mm diluted shares from CB conversion (US$400mm CB converts to equity at an estimated conversion price of NT$45.75 (based on conversion price of NT$49.47 as of Jun 15, 2016, May 2016 cash dividend of NT$3.80 per share and 30 trading day average price of NT$50.60 as of Jun 28, 2016) at a fixed exchange rate of 1USD=30.3920TWD);
2 Pro-forma debt of NT$14.6bn based on Mar 31, 2016 total debt of NT$27.1bn, adjusted for CB conversion of NT$12.5bn;
3 Pro-forma cash and cash equivalents of NT$13.6bn based on Mar 31, 2016 cash and cash equivalents of NT$25.4bn, adjusted for dividend payable of NT$11.8bn announced on May 16, 2016;
4 Includes available-for-sale financial assets and long-term investments under equity method as of Mar 31, 2016
5 Unaffected price on Aug 21, 2015 before ASE’s Aug 2015 Tender Offer;
6 Unaffected price on May 13, 2016;
7 Pro-forma book value of NT$73.5bn based on Mar 31, 2016 book value of NT$72.4bn, adjusted for US$400mm CB conversion and dividend payable of NT$11.8bn announced on May 16, 2016;
8 Based on management projections as of Jun 23, 2016;
9 Based on street estimates and 1USD=32.66TWD as of Aug 21, 2015;
10 Based on Jun 30, 2015 balance sheet, adjusted for dividend payable of NT$9.3bn (NT$3.00 per share announced on Jun 16, 2015)
PRESENTATION TO SPIL BOARD OF DIRECTORS
J.P. Morgan
SPIL 2
CONFIDENTIAL
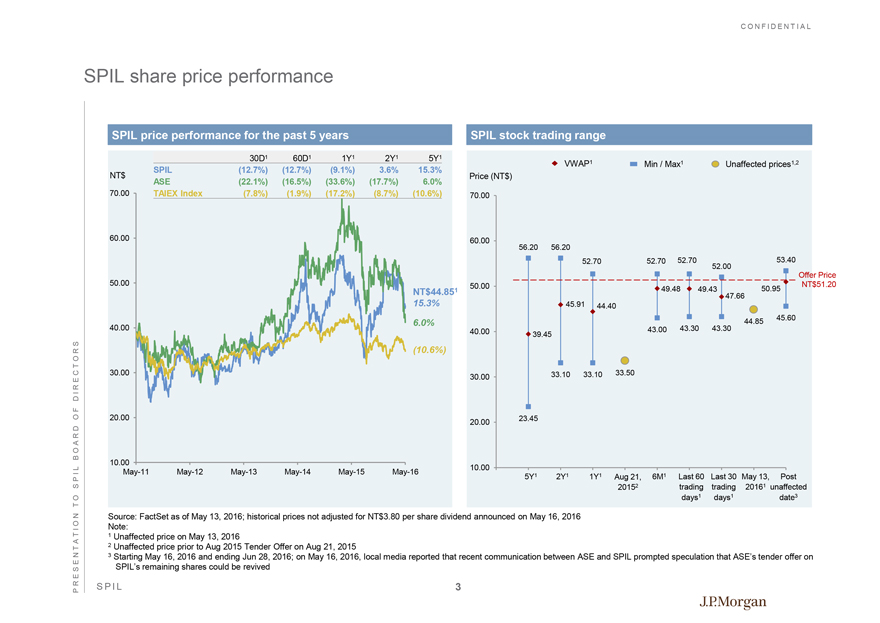
SPIL share price performance
SPIL price performance for the past 5 years
30D1 60D1 1Y1 2Y1 5Y1
SPIL (12.7%) (12.7%) (9.1%) 3.6% 15.3%
ASE (22.1%) (16.5%) (33.6%) (17.7%) 6.0%
TAIEX Index (7.8%) (1.9%) (17.2%) (8.7%) (10.6%)
NT$
70.00
60.00
50.00
40.00
30.00
20.00
10.00
May-11 May-12 May-13 May-14 May-15 May-16
NT$44.851
15.3%
6.0%
(10.6%)
SPIL stock trading range
VWAP1 Min / Max1 Unaffected prices1,2
Price (NT$)
70.00
60.00
50.00
40.00
30.00
20.00
10.00
56.20 56.20 52.70 52.70 52.70 52.00 53.40
Offer Price
49.48 49.43 50.95 NT$51.20
47.66
45.91 44.40
44.85 45.60
39.45 43.00 43.30 43.30
33.10 33.10 33.50
23.45
5Y1 2Y1 1Y1 Aug 21, 6M1 Last 60 Last 30 May 13, Post
20152 trading trading 20161 unaffected
days1 days1 date3
Source: FactSet as of May 13, 2016; historical prices not adjusted for NT$3.80 per share dividend announced on May 16, 2016
Note:
1 Unaffected price on May 13, 2016
2 Unaffected price prior to Aug 2015 Tender Offer on Aug 21, 2015
3 Starting May 16, 2016 and ending Jun 28, 2016; on May 16, 2016, local media reported that recent communication between ASE and SPIL prompted speculation that ASE’s tender offer on SPIL’s remaining shares could be revived
PRESENTATION TO SPIL BOARD OF DIRECTORS
SPIL 3
J.P. Morgan
CONFIDENTIAL
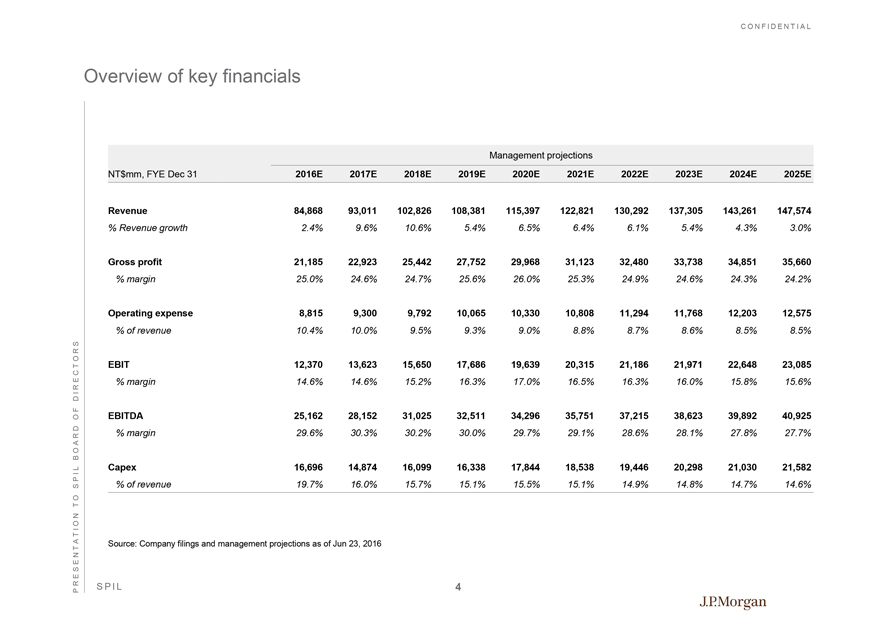
Overview of key financials
Management projections
NT$mm, FYE Dec 31 2016E 2017E 2018E 2019E 2020E 2021E 2022E 2023E 2024E 2025E
Revenue 84,868 93,011 102,826 108,381 115,397 122,821 130,292 137,305 143,261 147,574
% Revenue growth 2.4% 9.6% 10.6% 5.4% 6.5% 6.4% 6.1% 5.4% 4.3% 3.0%
Gross profit 21,185 22,923 25,442 27,752 29,968 31,123 32,480 33,738 34,851 35,660
% margin 25.0% 24.6% 24.7% 25.6% 26.0% 25.3% 24.9% 24.6% 24.3% 24.2%
Operating expense 8,815 9,300 9,792 10,065 10,330 10,808 11,294 11,768 12,203 12,575
% of revenue 10.4% 10.0% 9.5% 9.3% 9.0% 8.8% 8.7% 8.6% 8.5% 8.5%
EBIT 12,370 13,623 15,650 17,686 19,639 20,315 21,186 21,971 22,648 23,085
% margin 14.6% 14.6% 15.2% 16.3% 17.0% 16.5% 16.3% 16.0% 15.8% 15.6%
EBITDA 25,162 28,152 31,025 32,511 34,296 35,751 37,215 38,623 39,892 40,925
% margin 29.6% 30.3% 30.2% 30.0% 29.7% 29.1% 28.6% 28.1% 27.8% 27.7%
Capex 16,696 14,874 16,099 16,338 17,844 18,538 19,446 20,298 21,030 21,582
% of revenue 19.7% 16.0% 15.7% 15.1% 15.5% 15.1% 14.9% 14.8% 14.7% 14.6%
Source: Company filings and management projections as of Jun 23, 2016
PRESENTATION TO SPIL BOARD OF DIRECTORS
SPIL 4
J.P.Morgan
CONFIDENTIAL
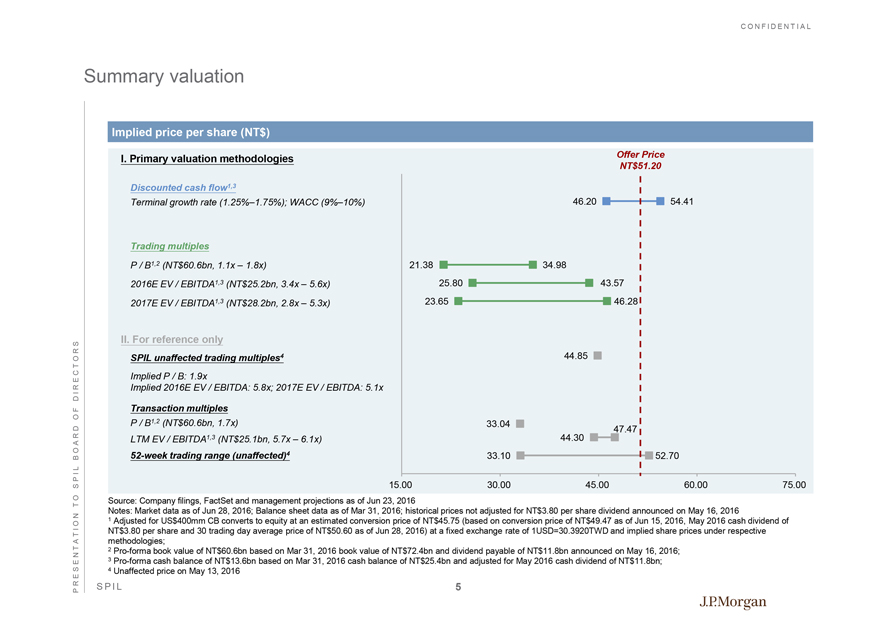
Summary valuation
Implied price per share (NT$)
I. Primary valuation methodologies
Discounted cash flow1,3
Terminal growth rate (1.25%–1.75%); WACC (9%–10%)
Trading multiples
P / B1,2 (NT$60.6bn, 1.1x – 1.8x)
2016E EV / EBITDA1,3 (NT$25.2bn, 3.4x – 5.6x)
2017E EV / EBITDA1,3 (NT$28.2bn, 2.8x – 5.3x)
II. For reference only
SPIL unaffected trading multiples4
Implied P / B: 1.9x
Implied 2016E EV / EBITDA: 5.8x; 2017E EV / EBITDA: 5.1x
Transaction multiples
P / B1,2 (NT$60.6bn, 1.7x)
LTM EV / EBITDA1,3 (NT$25.1bn, 5.7x – 6.1x)
52-week trading range (unaffected)4
Offer Price
NT$51.20
46.20 54.41
21.38 34.98
25.80 43.57
23.65 46.28
44.85
33.04 47.47
44.30
33.10 52.70
15.00 30.00 45.00 60.00 75.00
Source: Company filings, FactSet and management projections as of Jun 23, 2016
Notes: Market data as of Jun 28, 2016; Balance sheet data as of Mar 31, 2016; historical prices not adjusted for NT$3.80 per share dividend announced on May 16, 2016
1 Adjusted for US$400mm CB converts to equity at an estimated conversion price of NT$45.75 (based on conversion price of NT$49.47 as of Jun 15, 2016, May 2016 cash dividend of NT$3.80 per share and 30 trading day average price of NT$50.60 as of Jun 28, 2016) at a fixed exchange rate of 1USD=30.3920TWD and implied share prices under respective methodologies;
2 Pro-forma book value of NT$60.6bn based on Mar 31, 2016 book value of NT$72.4bn and dividend payable of NT$11.8bn announced on May 16, 2016;
3 Pro-forma cash balance of NT$13.6bn based on Mar 31, 2016 cash balance of NT$25.4bn and adjusted for May 2016 cash dividend of NT$11.8bn;
4 Unaffected price on May 13, 2016
PRESENTATION TO SPIL BOARD OF DIRECTORS
SPIL 5
J.P.Morgan
CONFIDENTIAL
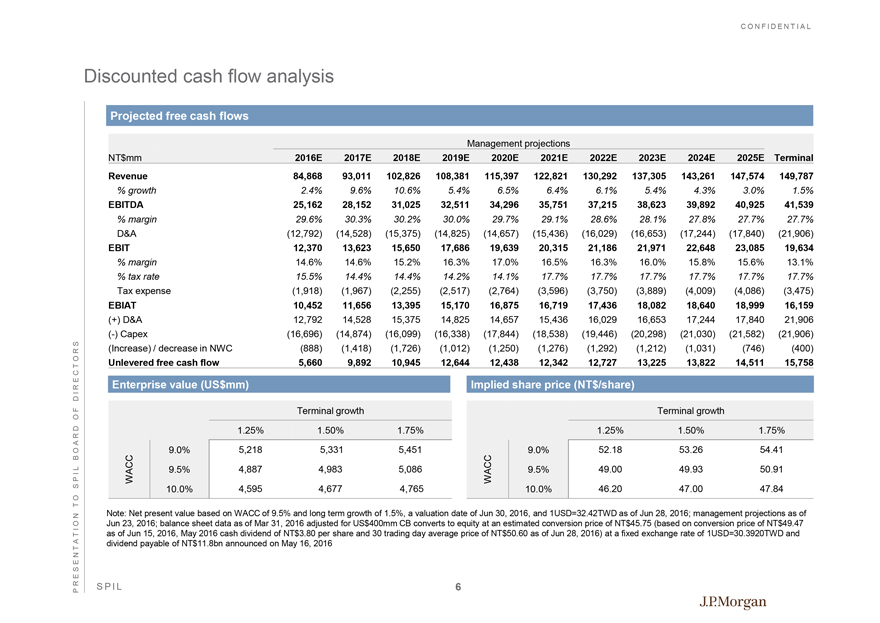
Discounted cash flow analysis
Projected free cash flows
Management projections
NT$mm 2016E 2017E 2018E 2019E 2020E 2021E 2022E 2023E 2024E 2025E Terminal
Revenue 84,868 93,011 102,826 108,381 115,397 122,821 130,292 137,305 143,261 147,574 149,787
% growth 2.4% 9.6% 10.6% 5.4% 6.5% 6.4% 6.1% 5.4% 4.3% 3.0% 1.5%
EBITDA 25,162 28,152 31,025 32,511 34,296 35,751 37,215 38,623 39,892 40,925 41,539
% margin 29.6% 30.3% 30.2% 30.0% 29.7% 29.1% 28.6% 28.1% 27.8% 27.7% 27.7%
D&A (12,792) (14,528) (15,375) (14,825) (14,657) (15,436) (16,029) (16,653) (17,244) (17,840) (21,906)
EBIT 12,370 13,623 15,650 17,686 19,639 20,315 21,186 21,971 22,648 23,085 19,634
% margin 14.6% 14.6% 15.2% 16.3% 17.0% 16.5% 16.3% 16.0% 15.8% 15.6% 13.1%
% tax rate 15.5% 14.4% 14.4% 14.2% 14.1% 17.7% 17.7% 17.7% 17.7% 17.7% 17.7%
Tax expense (1,918) (1,967) (2,255) (2,517) (2,764) (3,596) (3,750) (3,889) (4,009) (4,086) (3,475)
EBIAT 10,452 11,656 13,395 15,170 16,875 16,719 17,436 18,082 18,640 18,999 16,159
(+) D&A 12,792 14,528 15,375 14,825 14,657 15,436 16,029 16,653 17,244 17,840 21,906
(-) Capex (16,696) (14,874) (16,099) (16,338) (17,844) (18,538) (19,446) (20,298) (21,030) (21,582) (21,906)
(Increase) / decrease in NWC (888) (1,418) (1,726) (1,012) (1,250) (1,276) (1,292) (1,212) (1,031) (746) (400)
Unlevered free cash flow 5,660 9,892 10,945 12,644 12,438 12,342 12,727 13,225 13,822 14,511 15,758
Enterprise value (US$mm)
Terminal growth 1.25% 1.50% 1.75% 9.0% 5,218 5,331 5,451
WACC 9.5% 4,887 4,983 5,086 10.0% 4,595 4,677 4,765
Implied share price (NT$/share)
Terminal growth
1.25% 1.50% 1.75% 9.0% 52.18 53.26 54.41
WACC 9.5% 49.00 49.93 50.91 10.0% 46.20 47.00 47.84
Note: Net present value based on WACC of 9.5% and long term growth of 1.5%, a valuation date of Jun 30, 2016, and 1USD=32.42TWD as of Jun 28, 2016; management projections as of Jun 23, 2016; balance sheet data as of Mar 31, 2016 adjusted for US$400mm CB converts to equity at an estimated conversion price of NT$45.75 (based on conversion price of NT$49.47 as of Jun 15, 2016, May 2016 cash dividend of NT$3.80 per share and 30 trading day average price of NT$50.60 as of Jun 28, 2016) at a fixed exchange rate of 1USD=30.3920TWD and dividend payable of NT$11.8bn announced on May 16, 2016
PRESENTATION TO SPIL BOARD OF DIRECTORS
SPIL 6
J.P.Morgan
CONFIDENTIAL
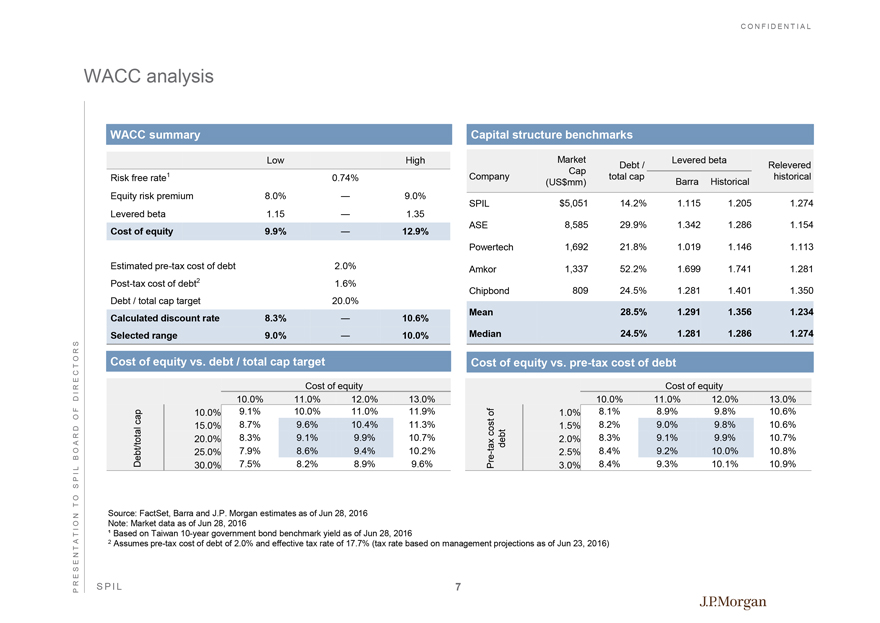
WACC analysis
WACC summary
Low High
Risk free rate1 0.74%
Equity risk premium 8.0% — 9.0%
Levered beta 1.15 — 1.35
Cost of equity 9.9% — 12.9%
Estimated pre-tax cost of debt 2.0%
Post-tax cost of debt2 1.6%
Debt / total cap target 20.0%
Calculated discount rate 8.3% — 10.6%
Selected range 9.0% — 10.0%
Cost of equity vs. debt / total cap target
Cost of equity
10.0% 11.0% 12.0% 13.0%
10.0% 9.1% 10.0% 11.0% 11.9%
15.0% 8.7% 9.6% 10.4% 11.3%
20.0% 8.3% 9.1% 9.9% 10.7%
Debt/total cap
25.0% 7.9% 8.6% 9.4% 10.2%
30.0% 7.5% 8.2% 8.9% 9.6%
Capital structure benchmarks
Company
Market Cap (US$mm)
Debt / total cap
Levered beta
Relevered historical
Barra
Historical
SPIL $5,051 14.2% 1.115 1.205 1.274 ASE 8,585 29.9% 1.342 1.286 1.154
Powertech 1,692 21.8% 1.019 1.146 1.113
Amkor 1,337 52.2% 1.699 1.741 1.281
Chipbond 809 24.5% 1.281 1.401 1.350
Mean 28.5% 1.291 1.356 1.234
Median 24.5% 1.281 1.286 1.274
Cost of equity vs. pre-tax cost of debt
Cost of equity 10.0% 11.0% 12.0% 13.0%
1.0% 8.1% 8.9% 9.8% 10.6%
1.5% 8.2% 9.0% 9.8% 10.6%
Pre-tax cost of debt
2.0% 8.3% 9.1% 9.9% 10.7%
2.5% 8.4% 9.2% 10.0% 10.8%
3.0% 8.4% 9.3% 10.1% 10.9%
Source: FactSet, Barra and J.P. Morgan estimates as of Jun 28, 2016 Note: Market data as of Jun 28, 2016
1 Based on Taiwan 10-year government bond benchmark yield as of Jun 28, 2016
2 Assumes pre-tax cost of debt of 2.0% and effective tax rate of 17.7% (tax rate based on management projections as of Jun 23, 2016)
PRESENTATION TO SPIL BOARD OF DIRECTORS
SPIL 7
J.P.Morgan
CONFIDENTIAL
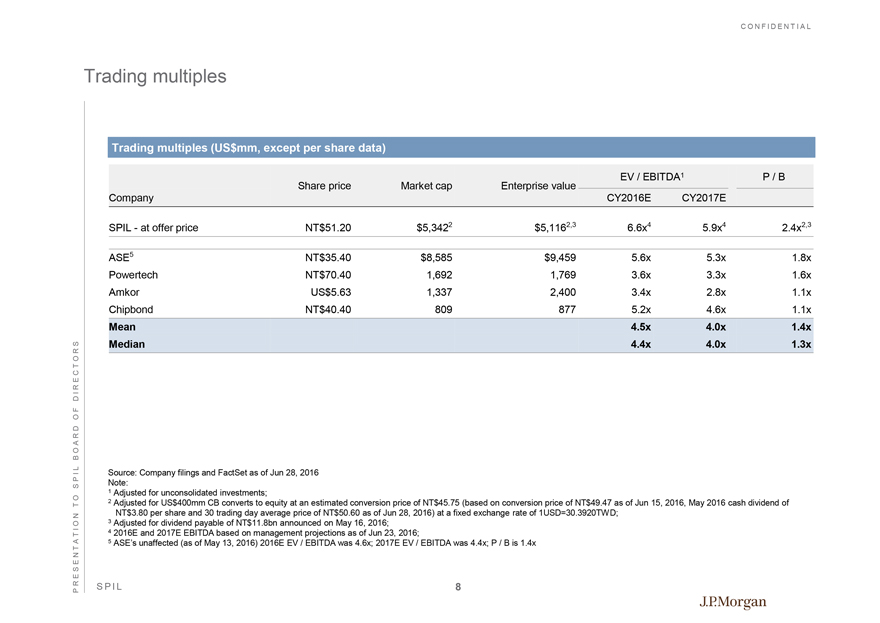
Trading multiples
Trading multiples (US$mm, except per share data)
EV / EBITDA1
P / B
Share price Market cap Enterprise value Company CY2016E CY2017E
SPIL - at offer price NT$51.20 $5,3422 $5,1162,3 6.6x4 5.9x4 2.4x2,3
ASE5 NT$35.40 $8,585 $9,459 5.6x 5.3x 1.8x
Powertech NT$70.40 1,692 1,769 3.6x 3.3x 1.6x
Amkor US$5.63 1,337 2,400 3.4x 2.8x 1.1x
Chipbond NT$40.40 809 877 5.2x 4.6x 1.1x
Mean 4.5x 4.0x 1.4x
Median 4.4x 4.0x 1.3x
Source: Company filings and FactSet as of Jun 28, 2016 Note:
1 Adjusted for unconsolidated investments;
2 Adjusted for US$400mm CB converts to equity at an estimated conversion price of NT$45.75 (based on conversion price of NT$49.47 as of Jun 15, 2016, May 2016 cash dividend of NT$3.80 per share and 30 trading day average price of NT$50.60 as of Jun 28, 2016) at a fixed exchange rate of 1USD=30.3920TWD;
3 Adjusted for dividend payable of NT$11.8bn announced on May 16, 2016;
4 2016E and 2017E EBITDA based on management projections as of Jun 23, 2016;
5 ASE’s unaffected (as of May 13, 2016) 2016E EV / EBITDA was 4.6x; 2017E EV / EBITDA was 4.4x; P / B is 1.4x
PRESENTATION TO SPIL BOARD OF DIRECTORS
SPIL 8
J.P. Morgan
CONFIDENTIAL
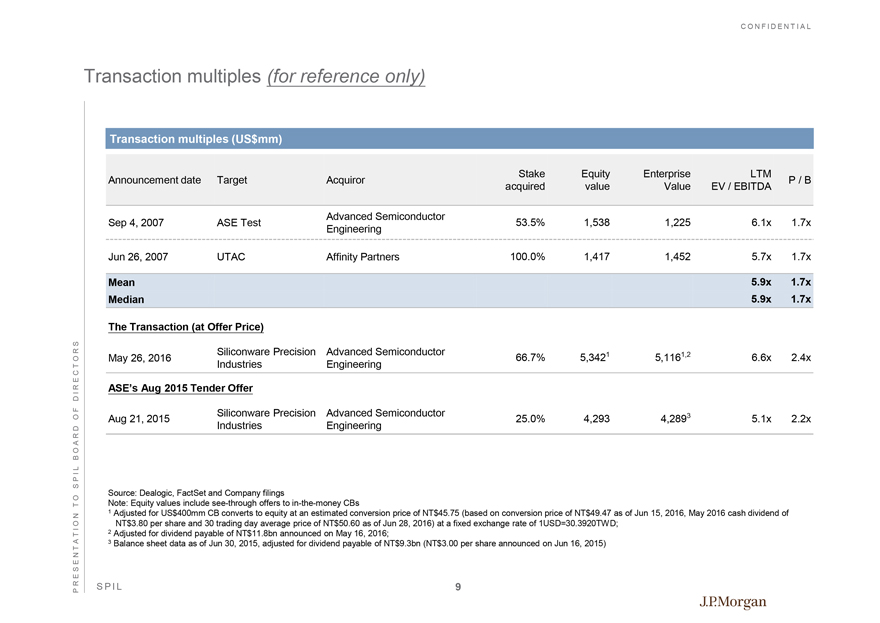
Transaction multiples (for reference only)
Transaction multiples (US$mm)
Announcement date Target Acquiror Stake Equity Enterprise LTM P / B
acquired value Value EV / EBITDA
Advanced Semiconductor
Sep 4, 2007 ASE Test 53.5% 1,538 1,225 6.1x 1.7x
Engineering
Jun 26, 2007 UTAC Affinity Partners 100.0% 1,417 1,452 5.7x 1.7x
Mean 5.9x 1.7x
Median 5.9x 1.7x
The Transaction (at Offer Price)
Siliconware Precision
Advanced Semiconductor
May 26, 2016 66.7% 5,3421 5,1161,2 6.6x 2.4x
Industries
Engineering
ASE’s Aug 2015 Tender Offer
Siliconware Precision
Advanced Semiconductor
Aug 21, 2015 25.0% 4,293 4,2893 5.1x 2.2x
Industries
Engineering
Source: Dealogic, FactSet and Company filings
Note: Equity values include see-through offers to in-the-money CBs
1 Adjusted for US$400mm CB converts to equity at an estimated conversion price of NT$45.75 (based on conversion price of NT$49.47 as of Jun 15, 2016, May 2016 cash dividend of NT$3.80 per share and 30 trading day average price of NT$50.60 as of Jun 28, 2016) at a fixed exchange rate of 1USD=30.3920TWD;
2 Adjusted for dividend payable of NT$11.8bn announced on May 16, 2016;
3 Balance sheet data as of Jun 30, 2015, adjusted for dividend payable of NT$9.3bn (NT$3.00 per share announced on Jun 16, 2015)
PRESENTATION TO SPIL BOARD OF DIRECTORS
SPIL 9
J.P. Morgan