(CONVENIENCE TRANSLATION INTO ENGLISH FROM THE ORIGINAL PREVIOUSLY ISSUED IN PORTUGUESE)
ITR – Quarterly Information – June 30, 2016 – BRF S.A. Index
|
Identification |
|
Capital Stock Breakdown | 1 |
Earnings Distribution | 2 |
Individual Financial Statements |
|
Balance Sheet Assets | 3 |
Balance Sheet Liabilities | 4 |
Statement of Income | 6 |
Statement of Comprehensive Income | 7 |
Statement of Cash Flows | 8 |
Statement of Changes in Shareholders' Equity |
|
Statement of Changes in Shareholders' Equity - from 01/01/2016 to 06/30/2016 | 9 |
Statement of Changes in Shareholders' Equity - from 01/01/2015 to 06/30/2015 | 10 |
Statement of Added Value | 11 |
Consolidated Financial Statements |
|
Balance Sheet Assets | 12 |
Balance Sheet Liabilities | 13 |
Statement of Income | 15 |
Statement of Comprehensive Income | 16 |
Statement of Cash Flows | 17 |
Statement of Changes in Shareholders' Equity |
|
Statement of Changes in Shareholders' Equity - from 01/01/2016 to 06/30/2016 | 18 |
Statement of Changes in Shareholders' Equity - from 01/01/2015 to 06/30/2015 | 19 |
Statement of Added Value | 20 |
Management Report | 21 |
Explanatory Notes | 55 |
Breakdown of the Capital by Owner | 133 |
Declarations and Opinion |
|
Independent Auditors' Report on Review of Quartely Financial Information | 134 |
Opinion of the Audit Commitee | 136 |
Statement of Executive Board on the Quartely Financial Information and Independent Auditor's Report on Review of Interim Financial Information | 137 |
(CONVENIENCE TRANSLATION INTO ENGLISH FROM THE ORIGINAL PREVIOUSLY ISSUED IN PORTUGUESE)
ITR – Quarterly Information – June 30, 2016 – BRF S.A. Identification / Capital Stock Breakdown
|
Number of shares | Current Quarter |
(Units) | 06.30.16 |
Paid-in Capital | |
Common | 812,473,246 |
Preferred | - |
Total | 812,473,246 |
| |
Treasury Shares |
|
Common | 13,505,317 |
Preferred | - |
Total | 13,505,317 |
1
(CONVENIENCE TRANSLATION INTO ENGLISH FROM THE ORIGINAL PREVIOUSLY ISSUED IN PORTUGUESE)
ITR – Quarterly Information – June 30, 2016 – BRF S.A. Identification / Earnings Distribution
|
Event | Approval | Corporate action | Begin payments | Type os shares | Earning per share | |||||
Executive Board Meeting | December 17, 2015 | Dividend | February 12, 2016 | Common | 0.11290 | |||||
Executive Board Meeting | December 17, 2015 | Interest on shareholders’ equity | February 12, 2016 | Common | 0.58446 | |||||
Executive Board Meeting | February 25, 2016 | Dividend | April 01, 2016 | Common | 0.12175 | |||||
Executive Board Meeting | June 30, 2016 | Interest on shareholders’ equity | August 15, 2016 | Common | 0.64235 |
2
(CONVENIENCE TRANSLATION INTO ENGLISH FROM THE ORIGINAL PREVIOUSLY ISSUED IN PORTUGUESE)
ITR – Quarterly Information – June 30, 2016 – BRF S.A. Individual FS /Balance Sheet Assets (in thousands of Brazilian Reais)
|
Account Code | Account Description | Current Quarter |
| Previous Year |
1 | Total Assets | 39,952,393 | 38,019,602 | |
1.01 | Current Assets | 15,380,530 | 12,212,817 | |
1.01.01 | Cash and Cash Equivalents | 1,927,035 | 845,085 | |
1.01.02 | Marketable Securities | 297,884 | 197,807 | |
1.01.02.01 | Financial Investments Evaluated at Fair Value | 297,884 | 197,807 | |
1.01.02.01.01 | Held for Trading | 297,884 | 197,807 | |
1.01.03 | Trade Accounts Receivable | 6,107,643 | 5,230,261 | |
1.01.03.01 | Trade Accounts Receivable | 5,981,071 | 4,948,745 | |
1.01.03.02 | Other Receivables | 126,572 | 281,516 | |
1.01.04 | Inventories | 3,051,837 | 2,703,330 | |
1.01.05 | Biological Assets | 1,617,440 | 1,322,317 | |
1.01.06 | Recoverable Taxes | 1,027,035 | 1,074,175 | |
1.01.06.01 | Current Recoverable Taxes | 1,027,035 | 1,074,175 | |
1.01.08 | Other Current Assets | 1,351,656 | 839,842 | |
1.01.08.02 | Assets of Discontinued Operations | 22,741 |
| 32,442 |
1.01.08.02.01 | Assets of Discontinued Operations and Held for Sale | 22,741 |
| 32,442 |
1.01.08.03 | Other | 1,328,915 | 807,400 | |
1.01.08.03.01 | Interest on Shareholders' Equity Receivable | 10,155 | 23,138 | |
1.01.08.03.02 | Derivatives | 519,816 | 118,680 | |
1.01.08.03.04 | Accounts Receivable from Disposal of Equity Interest | 81,177 | 78,801 | |
1.01.08.03.05 | Other | 659,767 | 586,781 | |
1.01.08.03.06 | Restricted Cash | 58,000 | - | |
1.02 | Non-current Assets | 24,571,863 | 25,806,785 | |
1.02.01 | Non-current Assets | 5,169,386 | 5,044,128 | |
1.02.01.01 | Financial Investments Evaluated at Fair Value | 265,640 | 385,700 | |
1.02.01.01.02 | Available for Sale | 265,640 | 385,700 | |
1.02.01.02 | Marketable Securities Valued at Amortized Cost | 75,071 | 70,338 | |
1.02.01.02.01 | Held to Maturity | 75,071 | 70,338 | |
1.02.01.03 | Trade Accounts Receivable | 202,616 | 232,223 | |
1.02.01.03.01 | Trade Accounts Receivable | 14,885 | 4,133 | |
1.02.01.03.02 | Other Receivables | 187,731 | 228,090 | |
1.02.01.05 | Biological Assets | 817,664 | 760,267 | |
1.02.01.06 | Deferred Taxes | 1,120,702 | 1,248,880 | |
1.02.01.06.01 | Deferred Income Tax and Social Contribution | 1,120,702 | 1,248,880 | |
1.02.01.09 | Other Non-current Assets | 2,687,693 | 2,346,720 | |
1.02.01.09.03 | Judicial Deposits | 822,342 | 725,324 | |
1.02.01.09.04 | Recoverable Taxes | 1,228,602 | 942,147 | |
1.02.01.09.06 | Accounts Receivable from Disposal of Equity Interest | 52,177 | 74,164 | |
1.02.01.09.07 | Restricted Cash | 459,898 | 479,828 | |
1.02.01.09.08 | Other | 124,674 | 125,257 | |
1.02.02 | Investments | 5,358,665 | 7,210,114 | |
1.02.02.01 | Investments | 5,358,665 | 7,210,114 | |
1.02.02.01.01 | Equity in Associates | 18,085 | 27,004 | |
1.02.02.01.02 | Interest on Wholly-owned Subsidiaries | 5,339,473 | 7,182,003 | |
1.02.02.01.04 | Other | 1,107 | 1,107 | |
1.02.03 | Property, Plant and Equipment, Net | 10,571,346 | 10,100,986 | |
1.02.03.01 | Property, Plant and Equipment in Operation | 9,624,127 | 9,264,458 | |
1.02.03.02 | Property, Plant and Equipment Leased | 127,275 | 120,696 | |
1.02.03.03 | Property, Plant and Equipment in Progress | 819,944 | 715,832 | |
1.02.04 | Intangible | 3,472,466 | 3,451,557 | |
1.02.04.01 | Intangible | 3,472,466 | 3,451,557 | |
1.02.04.01.02 | Software | 147,334 | 149,938 | |
1.02.04.01.03 | Trademarks | 1,173,000 | 1,173,000 | |
1.02.04.01.04 | Other | 19,791 | 10,048 | |
1.02.04.01.05 | Goodwill | 2,096,587 | 2,096,587 | |
1.02.04.01.06 | Software Leased | 35,754 | 21,984 |
3
(CONVENIENCE TRANSLATION INTO ENGLISH FROM THE ORIGINAL PREVIOUSLY ISSUED IN PORTUGUESE)
ITR – Quarterly Information – June 30, 2016 – BRF S.A. Individual FS /Balance Sheet Liabilities (in thousands of Brazilian Reais)
|
Account Code | Account Description | Current Quarter |
| Previous Year |
2 | Total Liabilities | 39,952,393 |
| 38,019,602 |
2.01 | Current Liabilities | 12,015,357 | 10,350,198 | |
2.01.01 | Social and Labor Obligations | 183,971 | 104,724 | |
2.01.01.01 | Social Obligations | 107,474 | 15,031 | |
2.01.01.02 | Labor Obligations | 76,497 | 89,693 | |
2.01.02 | Trade Accounts Payable | 5,215,739 | 5,199,319 | |
2.01.02.01 | Domestic Suppliers | 4,105,258 | 3,933,753 | |
2.01.02.01.01 | Domestic Suppliers | 3,779,951 |
| 3,248,156 |
2.01.02.01.02 | Supply Chain Finance | 325,307 |
| 685,597 |
2.01.02.02 | Foreign Suppliers | 1,110,481 | 1,265,566 | |
2.01.02.02.01 | Foreign Suppliers | 692,162 |
| 776,569 |
2.01.02.02.02 | Supply Chain Finance | 418,319 |
| 488,997 |
2.01.03 | Tax Obligations | 418,217 | 196,780 | |
2.01.03.01 | Federal Tax Obligations | 186,754 | 82,999 | |
2.01.03.01.01 | Income and Social Contribution Payable | 81,738 | - | |
2.01.03.01.02 | Other Federal | 105,016 | 82,999 | |
2.01.03.02 | State Tax Obligations | 228,578 | 110,912 | |
2.01.03.03 | Municipal Tax Obligations | 2,885 | 2,869 | |
2.01.04 | Short Term Debts | 3,069,834 | 2,525,646 | |
2.01.04.01 | Short Term Debts | 3,069,834 | 2,525,646 | |
2.01.04.01.01 | Local Currency | 1,549,513 | 1,462,046 | |
2.01.04.01.02 | Foreign Currency | 1,520,321 | 1,063,600 | |
2.01.05 | Other Obligations | 2,403,983 | 1,737,973 | |
2.01.05.01 | Advances from related parties | 929,342 | 17,492 | |
2.01.05.01.04 | Advances from related parties | 929,342 | 17,492 | |
2.01.05.02 | Other | 1,474,641 | 1,720,481 | |
2.01.05.02.01 | Dividends and Interest on Shareholders' Equity Payable | 438,535 | 518,450 | |
2.01.05.02.04 | Derivatives | 852,858 | 619,874 | |
2.01.05.02.05 | Management and Employees Profit Sharing | 6,827 | 264,633 | |
2.01.05.02.08 | Other Obligations | 176,421 | 317,524 | |
2.01.06 | Provisions | 723,613 | 585,756 | |
2.01.06.01 | Tax, Social Security, Labor and Civil Risk Provisions | 270,063 | 223,766 | |
2.01.06.01.01 | Tax Risk Provisions | 84,084 | 47,923 | |
2.01.06.01.02 | Social Security and Labor Risk Provisions | 160,430 | 153,210 | |
2.01.06.01.04 | Civil Risk Provisions | 25,549 | 22,633 | |
2.01.06.02 | Other Provisons | 453,550 | 361,990 | |
2.01.06.02.04 | Vacations & Christmas Bonuses Provisions | 386,286 | 294,726 | |
2.01.06.02.05 | Employee Benefits Provisions | 67,264 | 67,264 | |
2.02 | Non-current Liabilities | 15,378,320 | 14,152,627 | |
2.02.01 | Long-term Debt | 12,380,085 | 11,054,455 | |
2.02.01.01 | Long-term Debt | 12,380,085 | 11,054,455 | |
2.02.01.01.01 | Local Currency | 5,365,421 | 2,357,579 | |
2.02.01.01.02 | Foreign Currency | 7,014,664 | 8,696,876 | |
2.02.02 | Other Obligations | 1,764,789 | 1,909,243 | |
2.02.02.01 | Liabilities with Related Parties | 995,361 | 1,208,007 | |
2.02.02.01.04 | Advances from Related Parties and Other Liabilities | 995,361 | 1,208,007 | |
2.02.02.02 | Other | 769,428 | 701,236 | |
2.02.02.02.06 | Other Obligations | 769,428 | 701,236 |
4
(CONVENIENCE TRANSLATION INTO ENGLISH FROM THE ORIGINAL PREVIOUSLY ISSUED IN PORTUGUESE)
ITR – Quarterly Information – June 30, 2016 – BRF S.A. Individual FS /Balance Sheet Liabilities (in thousands of Brazilian Reais)
|
Account Code | Account Description | Current Quarter |
| Previous Year |
2.02.04 | Provisions | 1,233,446 | 1,188,929 | |
2.02.04.01 | Tax, Social Security, Labor and Civil Risk Provisions | 982,031 | 957,149 | |
2.02.04.01.01 | Tax Risk Provisions | 161,151 | 190,908 | |
2.02.04.01.02 | Social Security and Labor Risk Provisions | 248,400 | 206,258 | |
2.02.04.01.04 | Civil Risk Provision | 55,538 | 43,041 | |
2.02.04.01.05 | Contingent Liability | 516,942 | 516,942 | |
2.02.04.02 | Other Provisons | 251,415 | 231,780 | |
2.02.04.02.04 | Employee Benefits Provisions | 251,415 | 231,780 | |
2.03 | Shareholders' Equity | 12,558,716 | 13,516,777 | |
2.03.01 | Paid-in Capital | 12,460,471 | 12,460,471 | |
2.03.02 | Capital Reserves | (709,685) | (3,940,955) | |
2.03.02.01 | Goodwill on the Shares Issuance | 166,192 | 174,014 | |
2.03.02.04 | Granted Options | 194,613 | 160,323 | |
2.03.02.05 | Treasury Shares | (723,856) | (3,947,933) | |
2.03.02.07 | Gain on Disposal of Shares | (58,334) | (39,059) | |
2.03.02.08 | Goodwill on Acquisition of Non-Controlling Entities | (47,417) | (47,417) | |
2.03.02.09 | Acquisition of Non-Controlling Entities | (240,883) |
| (240,883) |
2.03.04 | Profit Reserves | 1,754,636 | 6,076,775 | |
2.03.04.01 | Legal Reserves | 540,177 | 540,177 | |
2.03.04.02 | Statutory Reserves | 646,601 | 5,019,408 | |
2.03.04.07 | Tax Incentives Reserve | 567,858 | 517,190 | |
2.03.05 | Accumulated Earnings | 19,000 |
| - |
2.03.08 | Other Comprehensive Income | (965,706) | (1,079,514) | |
2.03.08.01 | Derivative Financial Intruments | (297,028) | (1,123,196) | |
2.03.08.02 | Financial Instruments (Available for Sale) | (73,052) | (8,466) | |
2.03.08.03 | Cumulative Translation Adjustments of Foreign Currency | (623,030) | 32,277 | |
2.03.08.04 | Actuarial Losses | 27,404 | 19,871 |
5
(CONVENIENCE TRANSLATION INTO ENGLISH FROM THE ORIGINAL PREVIOUSLY ISSUED IN PORTUGUESE)
ITR – Quarterly Information – June 30, 2016 – BRF S.A. Individual FS / Statement of Income (in thousands of Brazilian Reais)
|
Account Code | Account Description | Current Quarter |
| Accumulated Current Year |
| Previous Quarter |
| Accumulated Previous Year |
3.01 | Net Sales | 7,315,165 | 13,930,157 | 6,734,237 | 12,587,115 | |||
3.02 | Cost of Goods Sold | (5,564,824) | (10,726,669) | (4,915,562) | (9,343,238) | |||
3.03 | Gross Profit | 1,750,341 | 3,203,488 | 1,818,675 | 3,243,877 | |||
3.04 | Operating (Expenses) Income | (2,018,502) | (3,327,361) | (933,119) | (1,201,727) | |||
3.04.01 | Selling | (916,176) | (1,829,039) | (958,906) | (1,879,969) | |||
3.04.02 | General and Administrative | (75,306) | (144,119) | (67,862) | (135,822) | |||
3.04.04 | Other Operating Income | 25,680 | 69,580 | 14,596 | 28,518 | |||
3.04.05 | Other Operating Expenses | (103,254) | (180,937) | (193,227) | (438,666) | |||
3.04.06 | Income from Associates and Joint Ventures | (949,446) | (1,242,846) | 272,280 | 1,224,212 | |||
3.05 | Income Before Financial and Tax Results | (268,161) | (123,873) | 885,556 | 2,042,150 | |||
3.06 | Financial Results | 285,022 | 178,852 | (473,325) | (1,116,522) | |||
3.06.01 | Financial Income | 1,257,385 | 2,256,553 | (135,533) | 698,542 | |||
3.06.02 | Financial Expenses | (972,363) | (2,077,701) | (337,792) | (1,815,064) | |||
3.07 | Income Before Taxes | 16,861 | 54,979 | 412,231 | 925,628 | |||
3.08 | Income and Social Contribution | 13,745 | 14,689 | (47,773) | (99,543) | |||
3.08.01 | Current | (151,429) | (243,891) | 2,779 | 3,798 | |||
3.08.02 | Deferred | 165,174 | 258,580 | (50,552) | (103,341) | |||
3.09 | Net Income from Continued Operations | 30,606 | 69,668 | 364,458 | 826,085 | |||
3.10 | Net Income from Discontinued Operations | - |
| - |
| (10,051) |
| (7,072) |
3.10.01 | Net Income/Loss of Discontinued Operations, Net | - |
| - |
| (10,051) |
| (7,072) |
3.11 | Net Income | 30,606 | 69,668 | 354,407 | 819,013 | |||
3.99 | Earnings per Share - (Brazilian Reais/Share) | |||||||
3.99.01 | Earnings per Share - Basic | |||||||
3.99.01.01 | ON | 0.03803 | 0.08656 | 0.41557 | 0.96036 | |||
3.99.02 | Earning per Share - Diluted | |||||||
3.99.02.01 | ON | 0.03803 | 0.08656 | 0.41525 | 0.95961 |
6
(CONVENIENCE TRANSLATION INTO ENGLISH FROM THE ORIGINAL PREVIOUSLY ISSUED IN PORTUGUESE)
ITR – Quarterly Information – June 30, 2016 – BRF S.A. Individual FS / Statement of Comprehensive Income (in thousands of Brazilian Reais)
|
Account Code | Account Description | Current Quarter | Accumulated Current Year | Previous Quarter | Accumulated Previous Year | |||
4.01 | Net Income | 30,606 | 69,668 | 354,407 | 819,013 | |||
4.02 | Other Comprehensive Income | (92,738) | 113,808 | 191,100 | (52,068) | |||
4.02.01 | Gains (Losses) in Foreign Currency Translation Adjustments | (360,601) | (655,307) | (39,490) | 111,268 | |||
4.02.02 | Unrealized Gains (Losses) in Available for Sale Marketable Securities | (55,715) | (104,598) | 1,699 | 18,223 | |||
4.02.03 | Taxes on unrealized gains (losses) on investments on available for sale | 21,016 | 40,012 | (102) | (67) | |||
4.02.04 | Unrealized gains (losses) on cash flow hedge | 451,813 | 1,250,347 | 334,712 | (289,803) | |||
4.02.05 | Taxes on unrealized gains (losses) on cash flow hedge | (153,015) | (424,179) | (110,206) | 99,337 | |||
4.02.06 | Actuarial gains (losses) on pension and post-employment plans | 5,705 | 11,415 | 6,798 | 13,596 | |||
4.02.07 | Taxes on realized gains (losses) on pension post-employment plans | (1,941) | (3,882) | (2,311) | (4,622) | |||
4.03 | Comprehensive Income | (62,132) | 183,476 | 545,507 | 766,945 |
7
(CONVENIENCE TRANSLATION INTO ENGLISH FROM THE ORIGINAL PREVIOUSLY ISSUED IN PORTUGUESE)
ITR – Quarterly Information – June 30, 2016 – BRF S.A. Individual FS / Statement of Cash Flow (in thousands of Brazilian Reais)
|
Account Code | Account Description | Accumulated Current Year |
| Accumulated Previous Year |
6.01 | Net Cash Provided by Operating Activities | (161,843) | 2,521,590 | |
6.01.01 | Cash from Operations | (75,587) | 1,836,045 | |
6.01.01.01 | Net Income for the Period | 69,668 | 826,085 | |
6.01.01.03 | Depreciation and Amortization | 365,749 | 327,916 | |
6.01.01.04 | Depreciation and Depletion of Biological Assets | 307,361 | 265,601 | |
6.01.01.05 | Results on Disposals of Property, Plant and Equipments | 9,885 | 16,840 | |
6.01.01.07 | Deferred Income Tax | (258,580) | 103,341 | |
6.01.01.08 | Provision for Tax, Civil and Labor Risks | 133,971 | 46,837 | |
6.01.01.09 | Other Provisions | (36,263) | 193,608 | |
6.01.01.10 | Interest and Exchange Rate Variations | (1,910,224) | 1,280,029 | |
6.01.01.11 | Equity Pick-Up | 1,242,846 |
| (1,224,212) |
6.01.02 | Changes in Operating Assets and Liabilities | (86,256) | 657,238 | |
6.01.02.01 | Trade Accounts Receivable | (1,007,083) | 1,168,798 | |
6.01.02.02 | Inventories | (347,892) | (19,268) | |
6.01.02.03 | Trade Accounts Payable | 474,462 | 387,228 | |
6.01.02.04 | Supply Chain Finance | (430,968) | - | |
6.01.02.05 | Payment of Tax, Civil and Labor Risks Provisions | (129,136) | (81,394) | |
6.01.02.06 | Others Rights and Obligations | 1,058,244 | 9,968 | |
6.01.02.07 | Investment in Held for Trading Securities | (198,662) | (76,873) | |
6.01.02.08 | Redemption of Held for Trading Securities | 118,088 | 163,466 | |
6.01.02.11 | Other Financial Assets and Liabilities | 1,074,411 | (509,573) | |
6.01.02.12 | Payment of Interest | (414,215) | (286,240) | |
6.01.02.14 | Interest on Shareholders' Equity Received | 11,618 | 14,834 | |
6.01.02.15 | Biological assets - Current | (295,123) |
| (113,708) |
6.01.03 | Other | - |
| 28,307 |
6.01.03.01 | Net Cash Provided by Operating Activities from Discontinued Operations | - |
| 28,307 |
6.02 | Net Cash Provided by Investing Activities | (1,240,810) | (912,271) | |
6.02.05 | Redemptions of Restricted Cash (Investments) | (38,070) | (11,934) | |
6.02.06 | Additions to Property, Plant and Equipment | (845,005) | (537,543) | |
6.02.07 | Receivable from Disposals of Property, Plant and Equipment | 57,224 | 60,996 | |
6.02.08 | Capital increase in subsidiaries | - |
| (93,825) |
6.02.09 | Additions to Intangible | (48,155) | (24,258) | |
6.02.10 | Additions to Biological Assets - Non-current | (366,174) | (276,531) | |
6.02.11 | Investments in Associates and Joint Venturies | (630) | (869) | |
6.02.17 | Net Cash Applied in Investing Activities from Discontinued Operations | - |
| (28,307) |
6.03 | Net Cash Provided by Financing Activities | 2,485,843 | (2,728,986) | |
6.03.01 | Proceeds from Debt Issuance | 4,752,040 | 2,448,788 | |
6.03.02 | Payment of Debt | (1,064,363) | (3,449,588) | |
6.03.03 | Dividends and Interest on Shareholders' Equity Paid | (663,051) | (463,254) | |
6.03.06 | Treasury Shares Acquisition | (543,258) | (1,292,293) | |
6.03.07 | Treasury Shares Disposal | 4,475 |
| 27,361 |
6.04 | Exchange Rate Variation on Cash and Cash Equivalents | (1,240) | 13,103 | |
6.05 | Increase (Decrease) in Cash and Cash Equivalents | 1,081,950 | (1,106,564) | |
6.05.01 | At the Beginning of the Period | 845,085 | 1,979,357 | |
6.05.02 | At the End of the Period | 1,927,035 | 872,793 |
8
(CONVENIENCE TRANSLATION INTO ENGLISH FROM THE ORIGINAL PREVIOUSLY ISSUED IN PORTUGUESE)
ITR – Quarterly Information – June 30, 2016 – BRF S.A. Individual FS / Statement of Changes in Shareholders’ Equity for the Period from 01/01/2016 to 06/30/2016 (in thousands of Brazilian Reais)
|
Account Code | Account Description | Capital Stock |
| Capital Reserves, Granted Options and Treasury Shares |
| Profit Reserves |
| Retained Earnings |
| Other Comprehensive Income |
| Shareholders' Equity |
5.01 | Balance at January 1, 2016 | 12,460,471 | (3,940,955) | 6,076,775 | - | (1,079,514) | 13,516,777 | |||||
5.03 | Opening Balance Adjusted | 12,460,471 | (3,940,955) | 6,076,775 | - | (1,079,514) | 13,516,777 | |||||
5.04 | Share-based Payments | - | 3,231,270 | (4,372,807) | - | - | (1,141,537) | |||||
5.04.03 | Options Granted | - | 34,290 | - | - | - | 34,290 | |||||
5.04.04 | Treasury Shares Acquired | - | (543,258) | - | - | - | (543,258) | |||||
5.04.05 | Treasury Shares Sold | - | 5,953 | - | - | - | 5,953 | |||||
5.04.06 | Dividends | - | - | (98,210) | - | - | (98,210) | |||||
5.04.07 | Interest on Shareholders' Equity | - | - | (513,215) | - | - | (513,215) | |||||
5.04.08 | Gain on Disposal of Shares | - | (1,478) | - | - | - | (1,478) | |||||
5.04.09 | Treasury Shares Canceled | - |
| 3,761,382 |
| (3,761,382) |
| - |
| - |
| - |
5.04.10 | Valuation of Shares | - | (7,822) | - | - | - | (7,822) | |||||
5.04.11 | Options Canceled | - | (17,797) | - | - | - | (17,797) | |||||
5.04.13 | Participation of Non-Controlling Shareholders' | - | - | - | - | - | - | |||||
5.05 | Total Comprehensive Income | - | - | - | 69,668 | 113,808 | 183,476 | |||||
5.05.01 | Net Income for the Period | - | - | - | 69,668 | - | 69,668 | |||||
5.05.02 | Other Comprehensive Income | - | - | - | - | 113,808 | 113,808 | |||||
5.05.02.01 | Financial Instruments Adjustments | - | - | - | - | 1,250,347 | 1,250,347 | |||||
5.05.02.02 | Tax on Financial Instruments Adjustments | - | - | - | - | (424,179) | (424,179) | |||||
5.05.02.06 | Unrealized Loss in Available for Sale Marketable Securities | - | - | - | - | (104,598) | (104,598) | |||||
5.05.02.07 | Tax on Unrealized Loss in Available for Sale Marketable Securities | - | - | - | - | 40,012 | 40,012 | |||||
5.05.02.08 | Actuarial Gains on Pension and Post-employment Plans | - | - | - | - | 7,533 | 7,533 | |||||
5.05.02.09 | Cumulative Translation Adjustments of Foreign Currency | - | - | - | - | (655,307) | (655,307) | |||||
5.06 | Statements of Changes in Shareholders' Equity | - | - | 50,668 | (50,668) | - | - | |||||
5.06.08 | Tax Incentives Reserve | - | - | 50,668 | (50,668) | - | - | |||||
5.07 | Balance at June 30, 2016 | 12,460,471 | (709,685) | 1,754,636 | 19,000 | (965,706) | 12,558,716 |
9
(CONVENIENCE TRANSLATION INTO ENGLISH FROM THE ORIGINAL PREVIOUSLY ISSUED IN PORTUGUESE)
ITR – Quarterly Information – June 30, 2016 – BRF S.A. Individual FS / Statement of Changes in Shareholders’ Equity for the Period from 01/01/2015 to 06/30/2015 (in thousands of Brazilian Reais)
|
Account Code | Account Description | Capital Stock |
| Capital Reserves, Granted Options and Treasury Shares |
| Profit Reserves |
| Retained Earnings |
| Other Comprehensive Income |
| Shareholders' Equity |
5.01 | Balance at January 1, 2015 | 12,460,471 | (195,428) | 3,945,825 | - | (620,391) | 15,590,477 | |||||
5.03 | Opening Balance Adjusted | 12,460,471 | (195,428) | 3,945,825 | - | (620,391) | 15,590,477 | |||||
5.04 | Share-based Payments | - | (1,403,152) | - | (425,859) | - | (1,829,011) | |||||
5.04.03 | Options Granted | - | 9,633 | - | - | - | 9,633 | |||||
5.04.04 | Treasury Shares Acquired | - |
| (1,292,293) |
| - |
| - |
| - |
| (1,292,293) |
5.04.05 | Treasury Shares Sold | - | 40,096 | - | - | - | 40,096 | |||||
5.04.07 | Interest on Shareholders' Equity | - | - | - | (425,859) | - | (425,859) | |||||
5.04.08 | Gain on Disposal of Shares | - | (12,735) | - | - | - | (12,735) | |||||
5.04.10 | Valuation of shares | - | 111,248 | - | - | - | 111,248 | |||||
5.04.12 | Acquisition of Non-Controlling Entities | - | (259,101) | - | - | - | (259,101) | |||||
5.04.13 | Participation of Non-Controlling Shareholders' | - | - | - | - | - | - | |||||
5.05 | Total Comprehensive Income | - | - | - | 819,013 | (52,068) | 766,945 | |||||
5.05.01 | Net Income for the Period | - | - | - | 819,013 | - | 819,013 | |||||
5.05.02 | Other Comprehensive Income | - | - | - | - | (52,068) | (52,068) | |||||
5.05.02.01 | Financial Instruments Adjustments | - | - | - | - | (289,803) | (289,803) | |||||
5.05.02.02 | Tax on Financial Instruments Adjustments | - | - | - | - | 99,337 | 99,337 | |||||
5.05.02.06 | Unrealized Gain in Available for Sale Marketable Securities | - | - | - | - | 18,223 | 18,223 | |||||
5.05.02.07 | Tax on Unrealized Gain in Available for Sale Marketable Securities | - | - | - | - | (67) | (67) | |||||
5.05.02.08 | Actuarial gains on pension and post-employment plans | - | - | - | - | 8,974 | 8,974 | |||||
5.05.02.09 | Cumulative Translation Adjustments of Foreign Currency | - | - | - | - | 111,268 | 111,268 | |||||
5.06 | Statements of Changes in Shareholders' Equity | - | - | 54,087 | (54,087) | - | - | |||||
5.06.08 | Tax Incentives Reserve | - | - | 54,087 | (54,087) | - | - | |||||
5.07 | Balance at June 30, 2015 | 12,460,471 | (1,598,580) | 3,999,912 | 339,067 | (672,459) | 14,528,411 |
10
(CONVENIENCE TRANSLATION INTO ENGLISH FROM THE ORIGINAL PREVIOUSLY ISSUED IN PORTUGUESE)
ITR – Quarterly Information – June 30, 2016 – BRF S.A. Individual FS / Statement of Value Added (in thousands of Brazilian Reais)
|
Account Code | Account Description | Accumulated Current Year |
| Accumulated Previous Year |
7.01 | Revenues | 15,923,344 | 14,108,028 | |
7.01.01 | Sales of Goods, Products and Services | 15,263,207 | 13,927,733 | |
7.01.02 | Other Income | (92,990) | (244,237) | |
7.01.03 | Revenue Related to Construction of Own Assets | 717,132 | 482,770 | |
7.01.04 | (Provision) Reversal for Doubtful Accounts Reversal | 35,995 | (58,238) | |
7.02 | Raw Material Acquired from Third Parties | (10,531,094) | (9,081,731) | |
7.02.01 | Costs of Products and Goods Sold | (8,476,491) | (7,340,441) | |
7.02.02 | Materials, Energy, Third Parties Services and Other | (2,055,218) | (1,747,341) | |
7.02.03 | Recovery (Loss) of Assets Values | 615 | 6,051 | |
7.03 | Gross Added Value | 5,392,250 | 5,026,297 | |
7.04 | Retentions | (673,110) | (593,517) | |
7.04.01 | Depreciation, Amortization and Exhaustion | (673,110) | (593,517) | |
7.05 | Net Added Value | 4,719,140 | 4,432,780 | |
7.06 | Received from Third Parties | 1,014,259 | 1,923,360 | |
7.06.01 | Equity Pick-Up | (1,242,846) | 1,224,212 | |
7.06.02 | Financial Income | 2,256,553 | 698,542 | |
7.06.03 | Other | 552 | 606 | |
7.07 | Added Value to be Distributed | 5,733,399 | 6,356,140 | |
7.08 | Distribution of Added Value | 5,733,399 | 6,356,140 | |
7.08.01 | Payroll | 1,981,788 | 1,951,083 | |
7.08.01.01 | Salaries | 1,496,931 | 1,508,836 | |
7.08.01.02 | Benefits | 377,551 | 341,059 | |
7.08.01.03 | Government Severance Indemnity Fund for Employees | 107,306 | 101,188 | |
7.08.02 | Taxes, Fees and Contributions | 1,484,325 | 1,637,307 | |
7.08.02.01 | Federal | 703,365 | 875,402 | |
7.08.02.02 | State | 763,757 | 747,068 | |
7.08.02.03 | Municipal | 17,203 | 14,837 | |
7.08.03 | Capital Remuneration from Third Parties | 2,197,618 | 1,941,665 | |
7.08.03.01 | Interests | 2,096,583 | 1,824,472 | |
7.08.03.02 | Rents | 101,035 | 117,193 | |
7.08.04 | Interest on Own Capital | 69,668 | 826,085 | |
7.08.04.01 | Interest on Shareholders' Equity | 513,215 | 425,859 | |
7.08.04.02 | Dividends | 98,210 |
| - |
7.08.04.03 | Retained Earnings | (541,757) | 400,226 |
11
(CONVENIENCE TRANSLATION INTO ENGLISH FROM THE ORIGINAL PREVIOUSLY ISSUED IN PORTUGUESE)
ITR – Quarterly Information – June 30, 2016 – BRF S.A. Consolidated FS / Balance Sheet Assets (in thousands of Brazilian Reais)
|
Account Code | Account Description | Current Quarter |
| Previous Year |
1 | Total Assets | 41,554,896 | 40,388,014 | |
1.01 | Current Assets | 18,053,246 | 19,180,049 | |
1.01.01 | Cash and Cash Equivalents | 4,630,909 | 5,362,890 | |
1.01.02 | Marketable Securities | 671,814 | 734,711 | |
1.01.02.01 | Financial Investments Evaluated at Fair Value | 671,814 | 734,711 | |
1.01.02.01.01 | Held for Trading | 363,402 | 375,562 | |
1.01.02.01.02 | Available for Sale | 308,412 | 359,149 | |
1.01.03 | Trade Accounts Receivable | 3,513,898 | 4,180,024 | |
1.01.03.01 | Trade Accounts Receivable | 3,377,761 | 3,876,308 | |
1.01.03.02 | Other Receivables | 136,137 | 303,716 | |
1.01.04 | Inventories | 4,724,899 | 4,032,911 | |
1.01.05 | Biological Assets | 1,646,538 | 1,329,861 | |
1.01.06 | Recoverable Taxes | 1,237,580 | 1,231,759 | |
1.01.06.01 | Current Recoverable Taxes | 1,237,580 | 1,231,759 | |
1.01.08 | Other Current Assets | 1,627,608 | 2,307,893 | |
1.01.08.02 | Assets of Discontinued Operations | 36,760 |
| 32,448 |
1.01.08.02.01 | Assets of Discontinued Operations and Held for Sale | 36,760 |
| 32,448 |
1.01.08.03 | Other | 1,590,848 | 2,275,445 | |
1.01.08.03.01 | Interest on Shareholders' Equity Receivable | 8,152 | 21,586 | |
1.01.08.03.02 | Derivatives | 525,763 | 129,387 | |
1.01.08.03.04 | Accounts Receivable from Disposal of Equity Interest | 81,177 | 78,801 | |
1.01.08.03.05 | Other | 793,576 | 699,397 | |
1.01.08.03.06 | Restricted Cash | 182,180 | 1,346,274 | |
1.02 | Non-current Assets | 23,501,650 | 21,207,965 | |
1.02.01 | Non-current Assets | 5,272,313 | 5,095,410 | |
1.02.01.01 | Financial Investments Evaluated at Fair Value | 265,640 | 385,700 | |
1.02.01.01.02 | Available for Sale | 265,640 | 385,700 | |
1.02.01.02 | Marketable Securities Evaluated at Amortized Cost | 75,071 | 70,338 | |
1.02.01.02.01 | Held to Maturity | 75,071 | 70,338 | |
1.02.01.03 | Trade Accounts Receivable | 206,610 | 234,914 | |
1.02.01.03.01 | Trade Accounts Receivable | 14,885 | 4,133 | |
1.02.01.03.02 | Other Receivables | 191,725 | 230,781 | |
1.02.01.05 | Biological Assets | 843,975 | 761,022 | |
1.02.01.06 | Deferred Taxes | 1,160,625 | 1,255,976 | |
1.02.01.06.01 | Deferred Income Tax and Social Contribution | 1,160,625 | 1,255,976 | |
1.02.01.09 | Other Non-current Assets | 2,720,392 | 2,387,460 | |
1.02.01.09.03 | Judicial Deposits | 829,024 | 732,106 | |
1.02.01.09.04 | Recoverable Taxes | 1,252,774 | 968,705 | |
1.02.01.09.06 | Accounts Receivable from Disposal of Equity Interest | 52,177 | 74,164 | |
1.02.01.09.07 | Restricted Cash | 459,898 | 479,828 | |
1.02.01.09.08 | Other | 126,519 | 132,657 | |
1.02.02 | Investments | 75,361 | 185,892 | |
1.02.02.01 | Investments | 75,361 | 185,892 | |
1.02.02.01.01 | Equity in Associates | 73,989 | 184,416 | |
1.02.02.01.04 | Other | 1,372 | 1,476 | |
1.02.03 | Property, Plant and Equipment, Net | 11,526,050 | 10,915,752 | |
1.02.03.01 | Property, Plant and Equipment in Operation | 10,419,863 | 10,005,274 | |
1.02.03.02 | Property, Plant and Equipment Leased | 129,393 | 120,696 | |
1.02.03.03 | Property, Plant and Equipment in Progress | 976,794 | 789,782 | |
1.02.04 | Intangible | 6,627,926 | 5,010,911 | |
1.02.04.01 | Intangible | 6,627,926 | 5,010,911 | |
1.02.04.01.02 | Software | 172,257 | 180,292 | |
1.02.04.01.03 | Trademarks | 1,314,695 | 1,372,018 | |
1.02.04.01.04 | Other | 503,731 | 658,515 | |
1.02.04.01.05 | Goodwill | 4,601,489 | 2,778,102 | |
1.02.04.01.06 | Software Leased | 35,754 | 21,984 |
12
(CONVENIENCE TRANSLATION INTO ENGLISH FROM THE ORIGINAL PREVIOUSLY ISSUED IN PORTUGUESE)
ITR – Quarterly Information – June 30, 2016 – BRF S.A. Consolidated FS / Balance Sheet Assets (in thousands of Brazilian Reais)
|
Account Code | Account Description | Current Quarter |
| Previous Year |
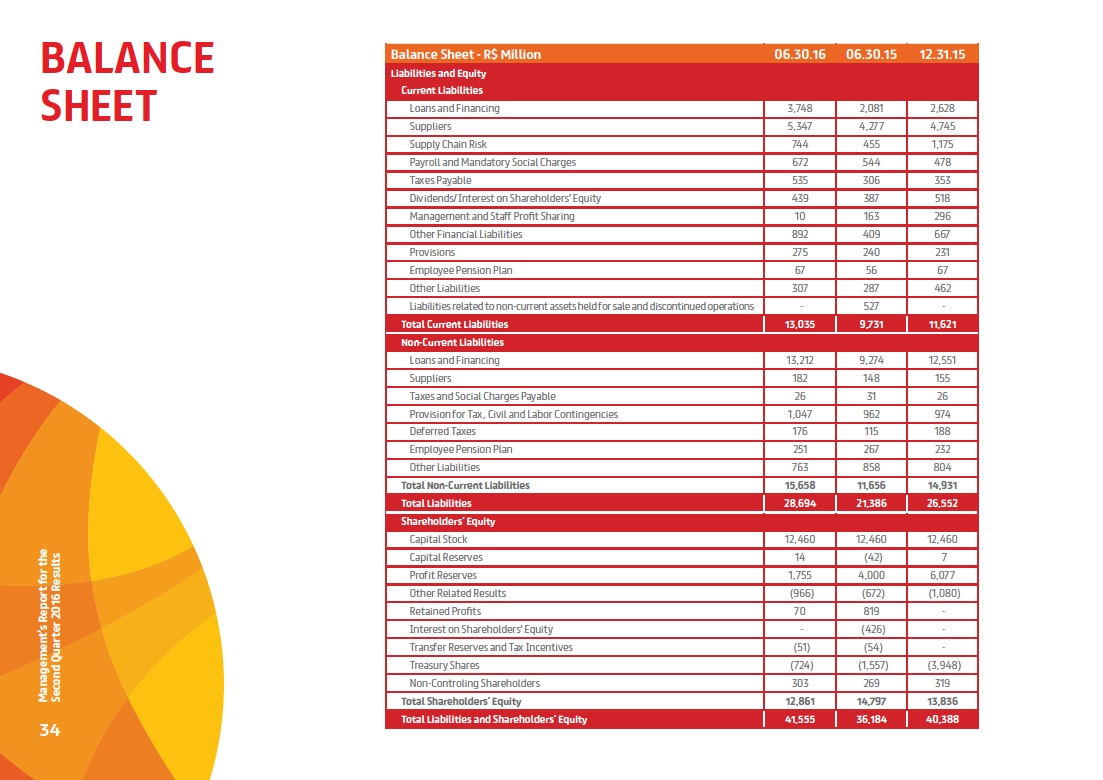
2 | Total Liabilities | 41,554,896 | 40,388,014 | |
2.01 | Current Liabilities | 13,035,368 | 11,621,113 | |
2.01.01 | Social and Labor Obligations | 255,245 | 159,189 | |
2.01.01.01 | Social Obligations | 140,705 | 29,382 | |
2.01.01.02 | Labor Obligations | 114,540 | 129,807 | |
2.01.02 | Trade Accounts Payable | 6,090,270 | 5,919,587 | |
2.01.02.01 | Domestic Suppliers | 4,105,341 | 3,933,757 | |
2.01.02.01.01 | Domestic Suppliers | 3,780,034 |
| 3,248,160 |
2.01.02.01.02 | Supply Chain Finance | 325,307 |
| 685,597 |
2.01.02.02 | Foreign Suppliers | 1,984,929 | 1,985,830 | |
2.01.02.02.01 | Foreign Suppliers | 1,566,610 |
| 1,496,833 |
2.01.02.02.02 | Supply Chain Finance | 418,319 |
| 488,997 |
2.01.03 | Tax Obligations | 535,080 | 353,278 | |
2.01.03.01 | Federal Tax Obligations | 264,371 | 177,911 | |
2.01.03.01.01 | Income Tax and Social Contribution Payable | 142,393 | 80,692 | |
2.01.03.01.02 | Other Federal | 121,978 | 97,219 | |
2.01.03.02 | State Tax Obligations | 267,709 | 172,497 | |
2.01.03.03 | Municipal Tax Obligations | 3,000 | 2,870 | |
2.01.04 | Short Term Debts | 3,748,265 | 2,628,179 | |
2.01.04.01 | Short Term Debts | 3,748,265 | 2,628,179 | |
2.01.04.01.01 | Local Currency | 1,549,513 | 1,462,046 | |
2.01.04.01.02 | Foreign Currency | 2,198,752 | 1,166,133 | |
2.01.05 | Other Obligations | 1,647,978 | 1,943,481 | |
2.01.05.02 | Other | 1,647,978 | 1,943,481 | |
2.01.05.02.01 | Dividends and Interest on Shareholders' Equity Payable | 438,763 | 518,450 | |
2.01.05.02.04 | Derivatives | 892,201 | 666,602 | |
2.01.05.02.05 | Management and Employees Profit Sharing | 10,025 | 296,292 | |
2.01.05.02.08 | Other Obligations | 306,989 | 462,137 | |
2.01.06 | Provisions | 758,530 | 617,399 | |
2.01.06.01 | Tax, Social Security, Labor and Civil Risk Provisions | 274,756 | 231,389 | |
2.01.06.01.01 | Tax Risk Provisions | 84,335 | 49,228 | |
2.01.06.01.02 | Social Security and Labor Risk Provisions | 164,872 | 159,528 | |
2.01.06.01.04 | Civil Risk Provisions | 25,549 | 22,633 | |
2.01.06.02 | Other Provisons | 483,774 | 386,010 | |
2.01.06.02.04 | Vacations and Christmas Bonuses Provisions | 416,510 | 318,746 | |
2.01.06.02.05 | Employee Benefits Provisions | 67,264 | 67,264 | |
2.02 | Non-current Liabilities | 15,658,276 | 14,931,048 | |
2.02.01 | Long-term Debt | 13,211,572 | 12,551,104 | |
2.02.01.01 | Long-term Debt | 13,211,572 | 12,551,104 | |
2.02.01.01.01 | Local Currency | 5,365,421 | 2,357,579 | |
2.02.01.01.02 | Foreign Currency | 7,846,151 | 10,193,525 | |
2.02.02 | Other Obligations | 971,650 | 985,384 | |
2.02.02.02 | Other | 971,650 | 985,384 | |
2.02.02.02.06 | Other Obligations | 971,650 | 985,384 | |
2.02.03 | Deferred Taxes | 176,141 | 188,320 | |
2.02.03.01 | Deferred Income Tax and Social Contribution | 176,141 | 188,320 | |
2.02.04 | Provisions | 1,298,913 | 1,206,240 | |
2.02.04.01 | Tax, Social Security, Labor and Civil Risk Provisions | 1,047,498 | 974,460 | |
2.02.04.01.01 | Tax Risk Provisions | 191,456 | 191,268 | |
2.02.04.01.02 | Social Security and Labor Risk Provisions | 272,754 | 217,495 | |
2.02.04.01.04 | Civil Risk Provision | 62,298 | 43,068 | |
2.02.04.01.05 | Contingent Liabilities | 520,990 | 522,629 | |
2.02.04.02 | Other Provisons | 251,415 | 231,780 | |
2.02.04.02.04 | Employee Benefits Provisions | 251,415 | 231,780 |
13
(CONVENIENCE TRANSLATION INTO ENGLISH FROM THE ORIGINAL PREVIOUSLY ISSUED IN PORTUGUESE)
ITR – Quarterly Information – June 30, 2016 – BRF S.A. Consolidated FS / Balance Sheet Liabilities (in thousands of Brazilian Reais)
|
Account Code | Account Description | Current Quarter |
| Previous Year |
2.03 | Shareholders' Equity | 12,861,252 | 13,835,853 | |
2.03.01 | Paid-in Capital | 12,460,471 | 12,460,471 | |
2.03.02 | Capital Reserves | (709,685) | (3,940,955) | |
2.03.02.01 | Goodwill on the Shares Issuance | 166,192 | 174,014 | |
2.03.02.04 | Granted Options | 194,613 | 160,323 | |
2.03.02.05 | Treasury Shares | (723,856) | (3,947,933) | |
2.03.02.07 | Gain on Disposal of Shares | (58,334) | (39,059) | |
2.03.02.08 | Goodwill on Acquisition of Non-Controlling Shareholders | (47,417) | (47,417) | |
2.03.02.09 | Acquisition of Non-Controlling Shareholders | (240,883) |
| (240,883) |
2.03.04 | Profit Reserves | 1,754,636 | 6,076,775 | |
2.03.04.01 | Legal Reserves | 540,177 | 540,177 | |
2.03.04.02 | Statutory Reserves | 646,601 | 5,019,408 | |
2.03.04.07 | Tax Incentives Reserve | 567,858 | 517,190 | |
2.03.05 | Accumulated Earnings / Loss | 19,000 |
| - |
2.03.08 | Other Comprehensive Income | (965,706) | (1,079,514) | |
2.03.08.01 | Derivative Financial Instruments | (297,028) | (1,123,196) | |
2.03.08.02 | Financial Instrument (Available for Sale) | (73,052) | (8,466) | |
2.03.08.03 | Cumulative Translation Adjustments of Foreign Currency | (623,030) | 32,277 | |
2.03.08.04 | Actuarial Losses | 27,404 | 19,871 | |
2.03.09 | Non-controlling Interest | 302,536 | 319,076 |
14
(CONVENIENCE TRANSLATION INTO ENGLISH FROM THE ORIGINAL PREVIOUSLY ISSUED IN PORTUGUESE)
ITR – Quarterly Information – June 30, 2016 – BRF S.A. Consolidated FS / Balance Sheet Liabilities (in thousands of Brazilian Reais)
|
Account Code | Account Description | Current Quarter |
| Accumulated Current Year |
| Previous Quarter |
| Accumulated Previous Year |
3.01 | Net Sales | 8,514,568 | 16,634,898 | 7,912,531 | 14,960,876 | |||
3.02 | Cost of Goods Sold | (6,596,310) | (12,685,915) | (5,387,933) | (10,272,597) | |||
3.03 | Gross Profit | 1,918,258 | 3,948,983 | 2,524,598 | 4,688,279 | |||
3.04 | Operating (Expenses) Income | (1,389,484) | (2,765,181) | (1,466,783) | (2,989,558) | |||
3.04.01 | Selling | (1,230,100) | (2,437,720) | (1,154,360) | (2,237,959) | |||
3.04.02 | General and Administrative | (142,265) | (276,060) | (114,876) | (222,417) | |||
3.04.04 | Other Operating Income | 89,331 | 135,882 | 30,101 | 45,109 | |||
3.04.05 | Other Operating Expenses | (111,035) | (204,009) | (219,216) | (507,215) | |||
3.04.06 | Income from Associates and Joint Ventures | 4,585 | 16,726 | (8,432) | (67,076) | |||
3.05 | Income Before Financial and Tax Results | 528,774 | 1,183,802 | 1,057,815 | 1,698,721 | |||
3.06 | Financial Results | (503,692) | (1,107,982) | (656,626) | (764,171) | |||
3.06.01 | Financial Income | 834,378 | 1,787,449 | (345,295) | 1,531,382 | |||
3.06.02 | Financial Expenses | (1,338,070) | (2,895,431) | �� | (311,331) | (2,295,553) | ||
3.07 | Income Before Taxes | 25,082 | 75,820 | 401,189 | 934,550 | |||
3.08 | Income and Social Contribution | (7,964) | (17,279) | (28,682) | (100,368) | |||
3.08.01 | Current | (168,037) | (277,514) | 661 | (9,744) | |||
3.08.02 | Deferred | 160,073 | 260,235 | (29,343) | (90,624) | |||
3.09 | Net Income from Continued Operations | 17,118 | 58,541 | 372,507 | 834,182 | |||
3.10 | Net Income from Discontinued Operations | - |
| - |
| (10,051) |
| (7,072) |
3.10.01 | Net Income/Loss of Discontinued Operations, Net | - |
| - |
| (10,051) |
| (7,072) |
3.11 | Net Income | 17,118 | 58,541 | 362,456 | 827,110 | |||
3.11.01 | Attributable to: Controlling Shareholders | 30,606 | 69,668 | 354,407 | 819,013 | |||
3.11.02 | Attributable to: Non-controlling Interest | (13,488) | (11,127) | 8,049 | 8,097 | |||
3.99 | Earnings per share - (Brazilian Reais/Share) | |||||||
3.99.01 | Earnings per Share - Basic | |||||||
3.99.01.01 | ON | 0.02127 | 0.07274 | 0.42501 | 0.96985 | |||
3.99.02 | Earning per Share - Diluted | |||||||
3.99.02.01 | ON | 0.02127 | 0.07273 | 0.42468 | 0.96909 |
15
(CONVENIENCE TRANSLATION INTO ENGLISH FROM THE ORIGINAL PREVIOUSLY ISSUED IN PORTUGUESE)
ITR – Quarterly Information – June 30, 2016 – BRF S.A. Consolidated FS / Statement of Income (in thousands of Brazilian Reais)
|
Account Code | Account Description | Current Quarter |
| Accumulated Current Year |
| Previous Quarter |
| Accumulated Previous Year |
4.01 | Net Income | 17,118 |
| 58,541 |
| 362,456 |
| 827,110 |
4.02 | Other Comprehensive Income | (92,738) |
| 113,808 |
| 191,100 |
| (52,068) |
4.02.01 | Gains (Losses) in Foreign Currency Translation Adjustments | (360,601) |
| (655,307) |
| (39,490) |
| 111,268 |
4.02.02 | Unrealized Gains (Losses) in Available for Sale Marketable Securities | (55,715) | (104,598) | 1,699 | 18,223 | |||
4.02.03 | Taxes on unrealized gains (losses) on investments on available for sale | 21,016 | 40,012 | (102) | (67) | |||
4.02.04 | Unrealized gains (losses) on cash flow hedge | 451,813 | 1,250,347 | 334,712 | (289,803) | |||
4.02.05 | Taxes on unrealized gains (losses) on cash flow hedge | (153,015) | (424,179) | (110,206) | 99,337 | |||
4.02.06 | Actuarial gains (losses) on pension and post-employment plans | 5,705 | 11,415 | 6,798 | 13,596 | |||
4.02.07 | Taxes on realized gains (losses) on pension post-employment plans | (1,941) | (3,882) | (2,311) | (4,622) | |||
4.03 | Comprehensive Income | (75,620) |
| 172,349 |
| 553,556 |
| 775,042 |
4.03.01 | Attributable to: BRF Shareholders | (62,132) |
| 183,476 |
| 545,507 |
| 766,945 |
4.03.02 | Attributable to: Non-Controlling Shareholders | (13,488) |
| (11,127) |
| 8,049 |
| 8,097 |
16
(CONVENIENCE TRANSLATION INTO ENGLISH FROM THE ORIGINAL PREVIOUSLY ISSUED IN PORTUGUESE)
ITR – Quarterly Information – June 30, 2016 – BRF S.A. Consolidated FS / Statement of Comprehensive Income (in thousands of Brazilian Reais)
|
Account Code | Account Description | Accumulated Current Year 06.30.16 |
| Accumulated Previous Year 06.30.15 |
6.01 | Net Cash Provided by Operating Activities | (36,393) | 2,249,160 | |
6.01.01 | Cash from Operations | (157,936) | 3,039,965 | |
6.01.01.01 | Net Income for the Period | 69,668 | 826,085 | |
6.01.01.02 | Non-controlling Interest | (11,127) | 8,097 | |
6.01.01.03 | Depreciation and Amortization | 455,021 | 374,853 | |
6.01.01.04 | Depreciation and Depletion of Biological Assets | 318,737 | 265,601 | |
6.01.01.05 | Results on Disposals of Property, Plant and Equipments | 8,413 | 15,399 | |
6.01.01.06 | Gain on the Acquisition of Equity Interest | (58,812) |
| - |
6.01.01.07 | Deferred Income Tax | (260,235) | 90,624 | |
6.01.01.08 | Provision for Tax, Civil and Labor Risks | 134,602 | 40,786 | |
6.01.01.09 | Other Provisions | (28,254) | 230,912 | |
6.01.01.10 | Interest and Exchange Rate Variations | (769,223) | 1,120,532 | |
6.01.01.11 | Equity Pick-Up | (16,726) |
| 67,076 |
6.01.02 | Changes in Operating Assets and Liabilities | 121,543 | (783,072) | |
6.01.02.01 | Trade Accounts Receivable | 947,681 | 112,321 | |
6.01.02.02 | Inventories | (355,414) | (495,109) | |
6.01.02.03 | Trade Accounts Payable | 316,669 | 705,055 | |
6.01.02.04 | Supply Chain Finance | (430,968) | - | |
6.01.02.05 | Payment of Tax, Civil and Labor Risks Provisions | (129,136) | (81,394) | |
6.01.02.06 | Others Rights and Obligations | (542,304) | (35,197) | |
6.01.02.07 | Investment in Held for Trading Securities | (611,720) | (154,384) | |
6.01.02.08 | Redemption of Held for Trading Securities | 610,902 | 163,467 | |
6.01.02.11 | Other Financial Assets and Liabilities | 1,079,563 | (523,729) | |
6.01.02.12 | Payment of Interest | (470,895) | (369,409) | |
6.01.02.13 | Payment of Income Tax and Social Contribution | (2,073) | (3,917) | |
6.01.02.14 | Interest on Shareholders' Equity Received | 11,618 | 14,834 | |
6.01.02.15 | Biological Assets - Current | (298,807) |
| (115,610) |
6.01.02.16 | Interest Received | (3,573) | - | |
6.01.03 | Other | - |
| (7,733) |
6.01.03.01 | Net Cash Provided by Operating Activities from Discontinued Operations | - |
| 2,420 |
6.01.03.02 | Cash and Cash Equivalents from Discontinued Operations | - | (10,153) | |
6.02 | Net Cash Provided by Investing Activities | (2,851,492) | (885,586) | |
6.02.03 | Investment in Available for Sale Securities | - | (1,100) | |
6.02.04 | Redemptions of Available for Sale Securities | - | 72,742 | |
6.02.05 | Redemptions of Restricted Cash (Investments) | 1,184,024 | (11,934) | |
6.02.06 | Additions to Property, Plant and Equipment | (922,465) | (579,359) | |
6.02.07 | Receivable from Disposals of Property, Plant and Equipment | 79,666 | 82,348 | |
6.02.09 | Additions to Intangible | (50,031) | (24,411) | |
6.02.10 | Additions to Biological Assets - Non-current | (380,083) | (276,531) | |
6.02.11 | Investments in Associates and Joint Venturies | (630) | (60,749) | |
6.02.12 | Business Combination, net of cash | (2,761,973) |
| (74,287) |
6.02.17 | Net Cash Applied in Investing Activities from Discontinued Operations | - | (12,305) | |
6.03 | Net Cash Provided by Financing Activities | 2,555,753 | (3,188,082) | |
6.03.01 | Proceeds from Debt Issuance | 5,019,228 | 3,197,716 | |
6.03.02 | Payment of Debt | (1,261,641) | (4,657,612) | |
6.03.03 | Dividends and Interest on Shareholders' Equity Paid | (663,051) | (463,254) | |
6.03.06 | Treasury Shares Acquisition | (543,258) | (1,292,293) | |
6.03.07 | Treasury Shares Disposal | 4,475 |
| 27,361 |
6.04 | Exchange Rate Variation on Cash and Cash Equivalents | (399,849) | 452,655 | |
6.05 | Decrease (Increase) in Cash and Cash Equivalents | (731,981) | (1,371,853) | |
6.05.01 | At the Beginning of the Period | 5,362,890 | 6,006,942 | |
6.05.02 | At the End of the Period | 4,630,909 | 4,635,089 |
17
(CONVENIENCE TRANSLATION INTO ENGLISH FROM THE ORIGINAL PREVIOUSLY ISSUED IN PORTUGUESE)
ITR – Quarterly Information – June 30, 2016 – BRF S.A. Consolidated FS / Statement of Cash Flow (in thousands of Brazilian Reais)
|
Account Code | Account Description | Capital Stock |
| Capital Reserves, Granted Options and Treasury Shares |
| Profit Reserves |
| Retained Earnings |
| Other Comprehensive Income |
| Shareholders' Equity |
| Participation of Non-Controlling Shareholders |
| Total Shareholders' Equity |
5.01 | Balance at January 1, 2016 | 12,460,471 | (3,940,955) | 6,076,775 | - | (1,079,514) | 13,516,777 | 319,076 | 13,835,853 | |||||||
5.03 | Opening Balance Adjusted | 12,460,471 | (3,940,955) | 6,076,775 | - | (1,079,514) | 13,516,777 | 319,076 | 13,835,853 | |||||||
5.04 | Share-based Payments | - | 3,231,270 | (4,372,807) | - | - | (1,141,537) | (5,413) | (1,146,950) | |||||||
5.04.03 | Options Granted | - | 34,290 | - | - | - | 34,290 | - | 34,290 | |||||||
5.04.04 | Treasury Shares Acquired | - | (543,258) | - | - | - | (543,258) | - | (543,258) | |||||||
5.04.05 | Treasury Shares Sold | - | 5,953 | - | - | - | 5,953 | - | 5,953 | |||||||
5.04.06 | Dividends | - | - | (98,210) | - | - | (98,210) | - | (98,210) | |||||||
5.04.07 | Interest on Shareholders' Equity | - | - | (513,215) | - | - | (513,215) | - | (513,215) | |||||||
5.04.08 | Gain on Disposal of Shares | - | (1,478) | - | - | - | (1,478) | - | (1,478) | |||||||
5.04.09 | Treasury Shares Canceled | - |
| 3,761,382 |
| (3,761,382) |
| - |
| - |
| - |
| - |
| - |
5.04.10 | Valuation of Shares | - | (7,822) | - | - | - | (7,822) | - | (7,822) | |||||||
5.04.11 | Options Canceled | - | (17,797) | - | - | - | (17,797) | - | (17,797) | |||||||
5.04.13 | Participation of Non-Controlling Shareholders' | - | - | - | - | - | - | (5,413) | (5,413) | |||||||
5.05 | Total Comprehensive Income | - | - | - | 69,668 | 113,808 | 183,476 | (11,127) | 172,349 | |||||||
5.05.01 | Net Income for the Period | - | - | - | 69,668 | - | 69,668 | (11,127) | 58,541 | |||||||
5.05.02 | Other Comprehensive Income | - | - | - | - | 113,808 | 113,808 | - | 113,808 | |||||||
5.05.02.01 | Financial Instruments Adjustments | - | - | - | - | 1,250,347 | 1,250,347 | - | 1,250,347 | |||||||
5.05.02.02 | Tax on Financial Instruments Adjustments | - | - | - | - | (424,179) | (424,179) | - | (424,179) | |||||||
5.05.02.06 | Unrealized Loss in Available for Sale Marketable Securities | - | - | - | - | (104,598) | (104,598) | - | (104,598) | |||||||
5.05.02.07 | Tax on Unrealized Loss in Available for Sale Marketable Securities | - | - | - | - | 40,012 | 40,012 | - | 40,012 | |||||||
5.05.02.08 | Actuarial Gains on Pension and Post-employment Plans | - | - | - | - | 7,533 | 7,533 | - | 7,533 | |||||||
5.05.02.09 | Cumulative Translation Adjustments of Foreign Currency | - | - | - | - | (655,307) | (655,307) | - | (655,307) | |||||||
5.06 | Statements of Changes in Shareholders' Equity | - | - | 50,668 | (50,668) | - | - | - | - | |||||||
5.06.08 | Tax Incentives Reserve | - | - | 50,668 | (50,668) | - | - | - | - | |||||||
5.07 | Balance at June 30, 2016 | 12,460,471 | (709,685) | 1,754,636 | 19,000 | (965,706) | 12,558,716 | 302,536 | 12,861,252 |
18
(CONVENIENCE TRANSLATION INTO ENGLISH FROM THE ORIGINAL PREVIOUSLY ISSUED IN PORTUGUESE)
ITR – Quarterly Information – June 30, 2016 – BRF S.A. Consolidated FS / Statement of Changes in Shareholders’ Equity for the Period from 01/01/2016 to 06/30/2016 (in thousands of Brazilian Reais)
|
Account Code | Account Description | Capital Stock |
| Capital Reserves, Granted Options and Treasury Shares |
| Profit Reserves |
| Retained Earnings |
| Other Comprehensive Income |
| Shareholders' Equity |
| Participation of Non-Controlling Shareholders |
| Total Shareholders' Equity |
5.01 | Balance at January 1, 2015 | 12,460,471 | (195,428) | 3,945,825 | - | (620,391) | 15,590,477 | 99,466 | 15,689,943 | |||||||
5.03 | Opening Balance Adjusted | 12,460,471 | (195,428) | 3,945,825 | - | (620,391) | 15,590,477 | 99,466 | 15,689,943 | |||||||
5.04 | Share-based Payments | - | (1,403,152) | - | (425,859) | - | (1,829,011) | 161,281 | (1,667,730) | |||||||
5.04.03 | Options Granted | - | 9,633 | - | - | - | 9,633 | - | 9,633 | |||||||
5.04.04 | Treasury Shares Acquired | - |
| (1,292,293) |
| - |
| - |
| - |
| (1,292,293) |
| - |
| (1,292,293) |
5.04.05 | Treasury Shares Sold | - | 40,096 | - | - | - | 40,096 | - | 40,096 | |||||||
5.04.07 | Interest on Shareholders' Equity | - | - | - | (425,859) | - | (425,859) | - | (425,859) | |||||||
5.04.08 | Gain on Disposal of Shares | - | (12,735) | - | - | - | (12,735) | - | (12,735) | |||||||
5.04.10 | Valuation of shares | - | 111,248 | - | - | - | 111,248 | - | 111,248 | |||||||
5.04.12 | Acquisition of Non-Controlling Entities | - | (259,101) | - | - | - | (259,101) | - | (259,101) | |||||||
5.04.13 | Participation of Non-Controlling Shareholders' | - | - | - | - | - | - | 161,281 | 161,281 | |||||||
5.05 | Total Comprehensive Income | - | - | - | 819,013 | (52,068) | 766,945 | 8,097 | 775,042 | |||||||
5.05.01 | Net Income for the Period | - | - | - | 819,013 | - | 819,013 | 8,097 | 827,110 | |||||||
5.05.02 | Other Comprehensive Income | - | - | - | - | (52,068) | (52,068) | - | (52,068) | |||||||
5.05.02.01 | Financial Instruments Adjustments | - | - | - | - | (289,803) | (289,803) | - | (289,803) | |||||||
5.05.02.02 | Tax on Financial Instruments Adjustments | - | - | - | - | 99,337 | 99,337 | - | 99,337 | |||||||
5.05.02.06 | Unrealized Gain in Available for Sale Marketable Securities | - | - | - | - | 18,223 | 18,223 | - | 18,223 | |||||||
5.05.02.07 | Tax on Unrealized Gain in Available for Sale Marketable Securities | - | - | - | - | (67) | (67) | - | (67) | |||||||
5.05.02.08 | Actuarial gains on pension and post-employment plans | - | - | - | - | 8,974 | 8,974 | - | 8,974 | |||||||
5.05.02.09 | Cumulative Translation Adjustments of Foreign Currency | - | - | - | - | 111,268 | 111,268 | - | 111,268 | |||||||
5.06 | Statements of Changes in Shareholders' Equity | - | - | 54,087 | (54,087) | - | - | - | - | |||||||
5.06.08 | Tax Incentives Reserve | - | - | 54,087 | (54,087) | - | - | - | - | |||||||
5.07 | Balance at June 30, 2015 | 12,460,471 | (1,598,580) | 3,999,912 | 339,067 | (672,459) | 14,528,411 | 268,844 | 14,797,255 |
19
(CONVENIENCE TRANSLATION INTO ENGLISH FROM THE ORIGINAL PREVIOUSLY ISSUED IN PORTUGUESE)
ITR – Quarterly Information – June 30, 2016 – BRF S.A. Consolidated FS / Statement of Changes in Shareholders’ Equity for the Period from 01/01/2015 to 06/30/2015 (in thousands of Brazilian Reais)
|
Account Code | Account Description | Accumulated Current Year 06.30.16 |
| Accumulated Previous Year 06.30.15 |
7.01 | Revenues | 18,995,955 | 16,641,627 | |
7.01.01 | Sales of Goods, Products and Services | 18,153,527 | 16,449,234 | |
7.01.02 | Other Income | (45,935) | (265,317) | |
7.01.03 | Revenue Related to Construction of Own Assets | 848,647 | 524,093 | |
7.01.04 | (Provision) Reversal for Doubtful Accounts Reversal | 39,716 | (66,383) | |
7.02 | Raw Material Acquired from Third Parties | (12,787,087) | (10,139,816) | |
7.02.01 | Costs of Products and Goods Sold | (10,191,445) | (8,113,028) | |
7.02.02 | Materials, Energy, Third Parties Services and Other | (2,587,521) | (2,024,057) | |
7.02.03 | Recovery of Assets Values | (8,121) | (2,731) | |
7.03 | Gross Added Value | 6,208,868 | 6,501,811 | |
7.04 | Retentions | (773,758) | (640,454) | |
7.04.01 | Depreciation, Amortization and Exhaustion | (773,758) | (640,454) | |
7.05 | Net Added Value | 5,435,110 | 5,861,357 | |
7.06 | Received from Third Parties | 1,804,791 | 1,464,967 | |
7.06.01 | Equity Pick-Up | 16,726 | (67,076) | |
7.06.02 | Financial Income | 1,787,449 | 1,531,382 | |
7.06.03 | Other | 616 | 661 | |
7.07 | Added Value to be Distributed | 7,239,901 | 7,326,324 | |
7.08 | Distribution of Added Value | 7,239,901 | 7,326,324 | |
7.08.01 | Payroll | 2,349,614 | 2,210,388 | |
7.08.01.01 | Salaries | 1,810,074 | 1,734,228 | |
7.08.01.02 | Benefits | 430,102 | 373,754 | |
7.08.01.03 | Government Severance Indemnity Fund for Employees | 109,438 | 102,406 | |
7.08.02 | Taxes, Fees and Contributions | 1,748,946 | 1,823,403 | |
7.08.02.01 | Federal | 942,210 | 1,023,969 | |
7.08.02.02 | State | 784,722 | 779,562 | |
7.08.02.03 | Municipal | 22,014 | 19,872 | |
7.08.03 | Capital Remuneration from Third Parties | 3,082,800 | 2,458,351 | |
7.08.03.01 | Interests | 2,914,313 | 2,305,115 | |
7.08.03.02 | Rents | 168,487 | 153,236 | |
7.08.04 | Interest on Own Capital | 58,541 | 834,182 | |
7.08.04.01 | Interest on Shareholders' Equity | 513,215 |
| 425,859 |
7.08.04.02 | Dividends | 98,210 |
| - |
7.08.04.03 | Retained Earnings | (541,757) | 400,226 | |
7.08.04.04 | Non-Controlling Interest | (11,127) | 8,097 |
20
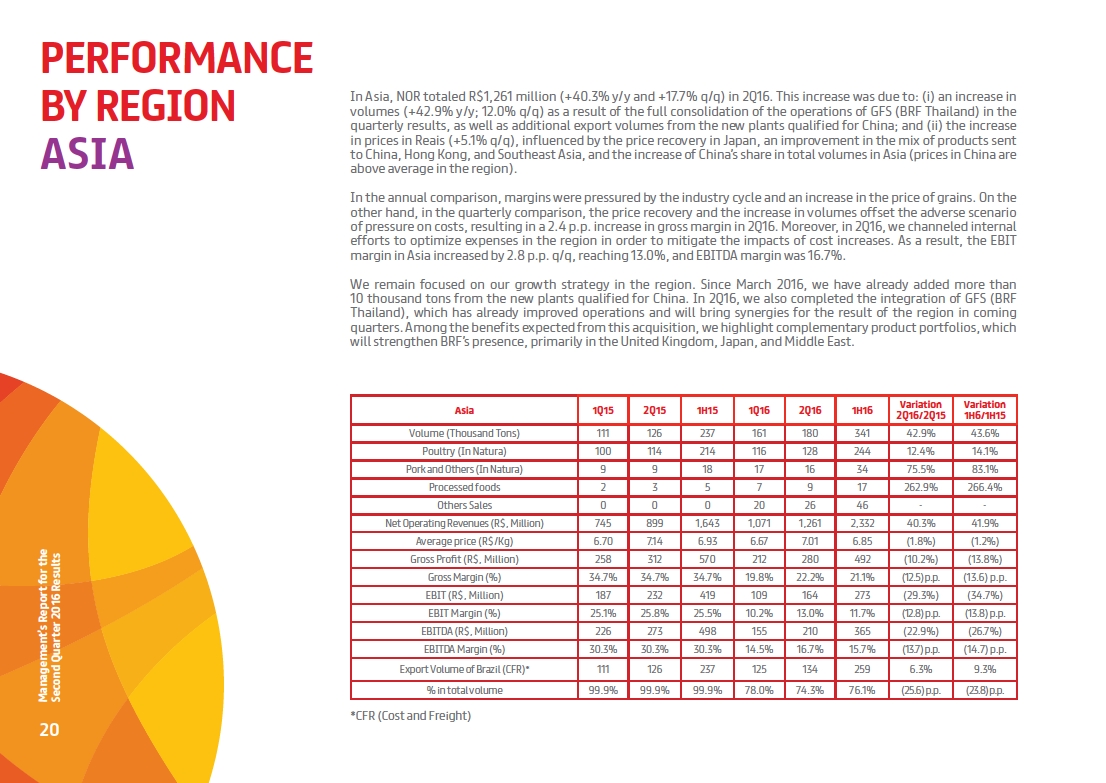
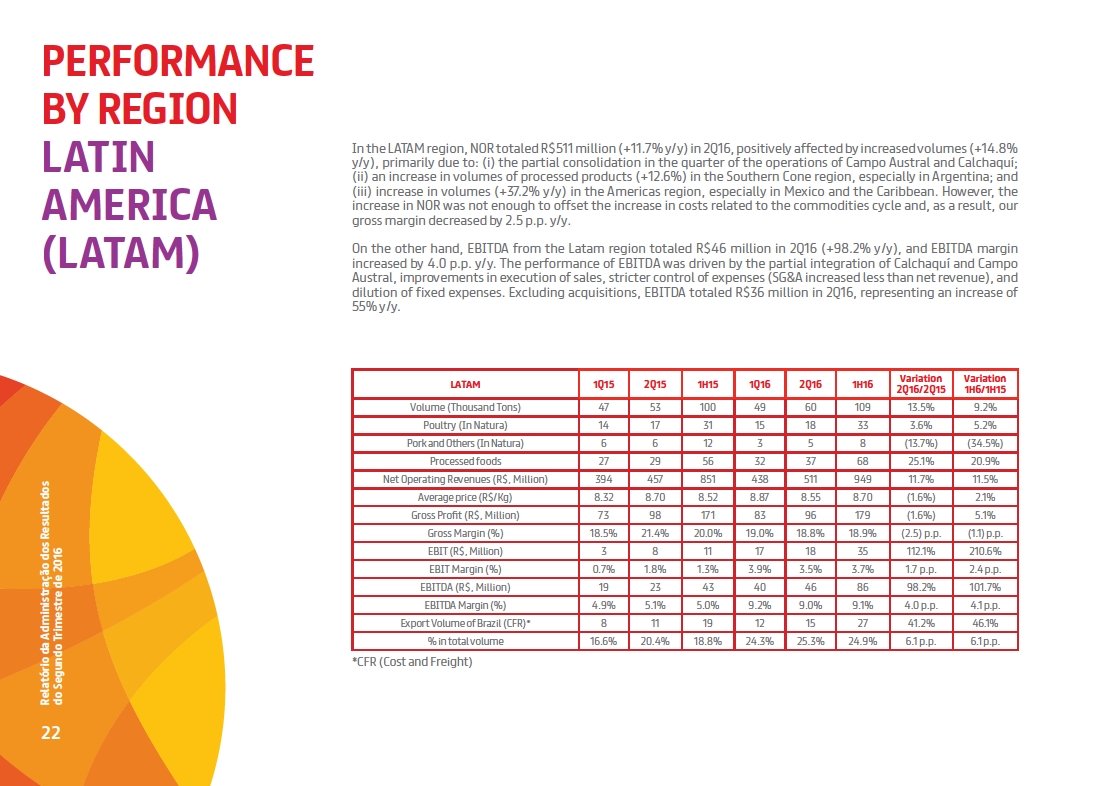
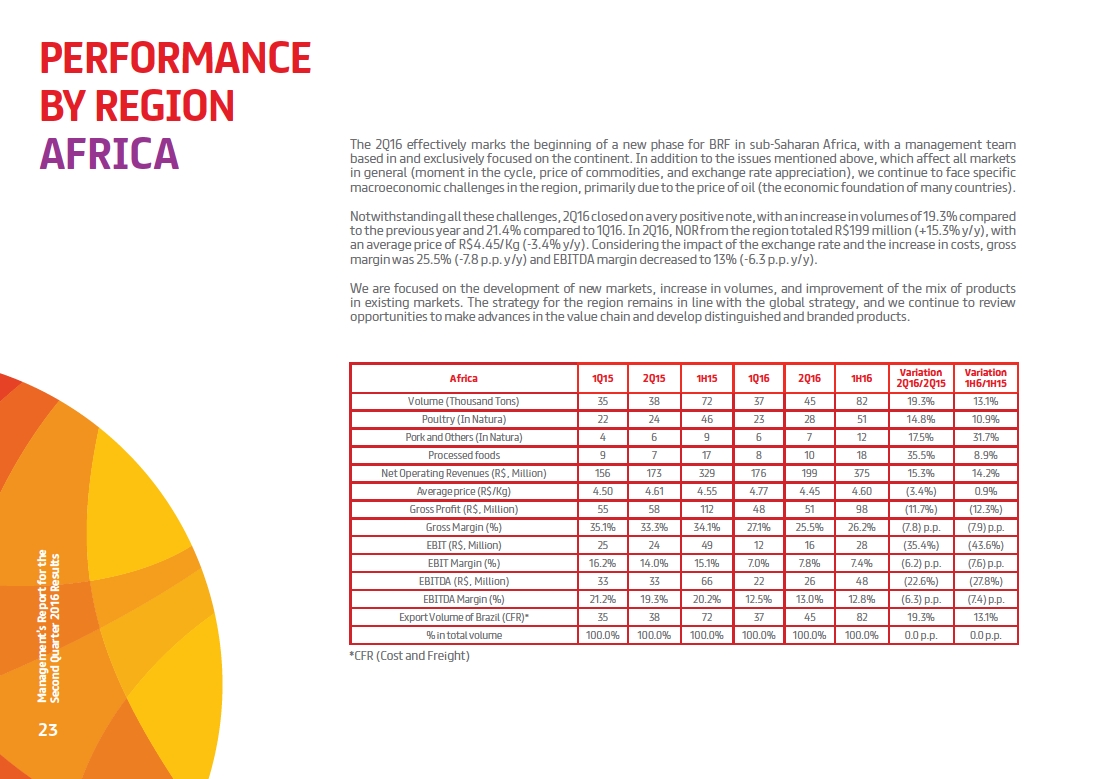
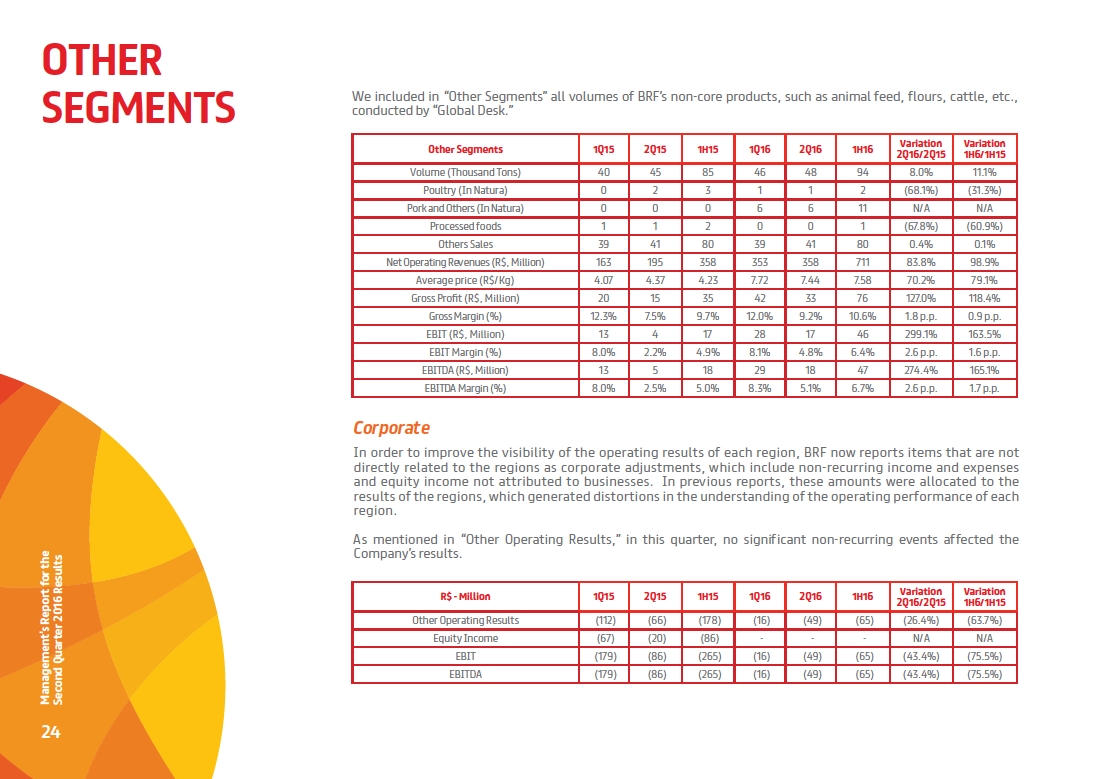
21
22
23
24
25
26
27
28

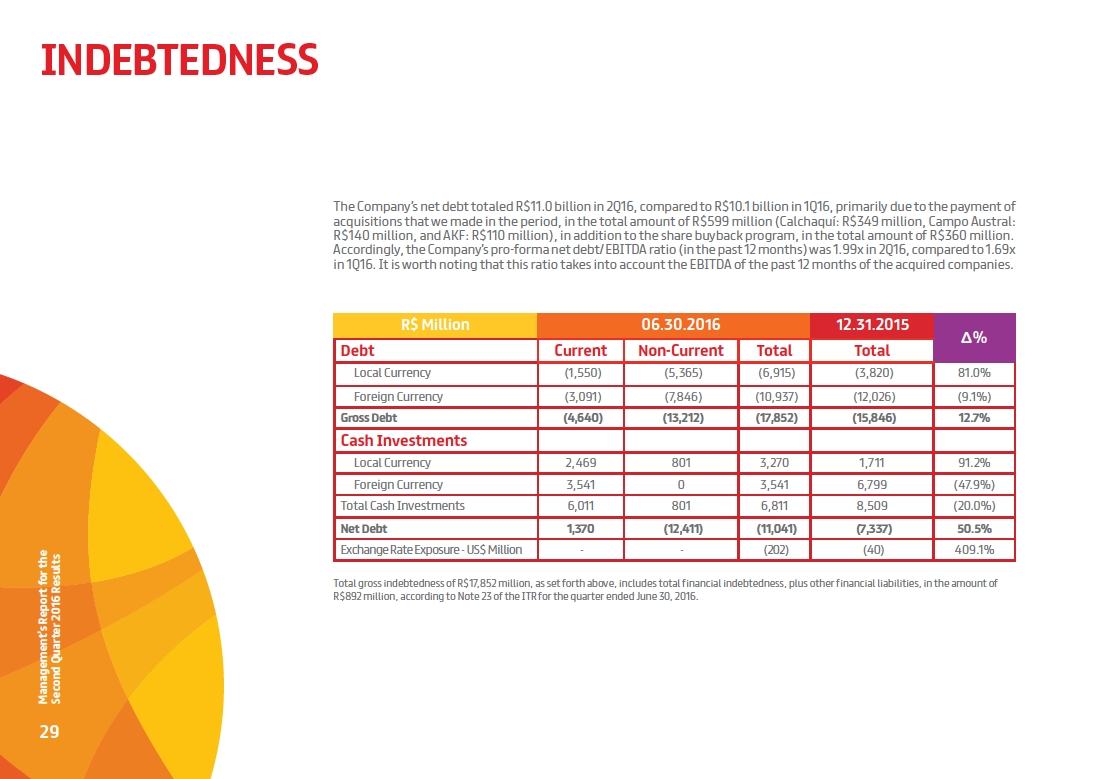
29
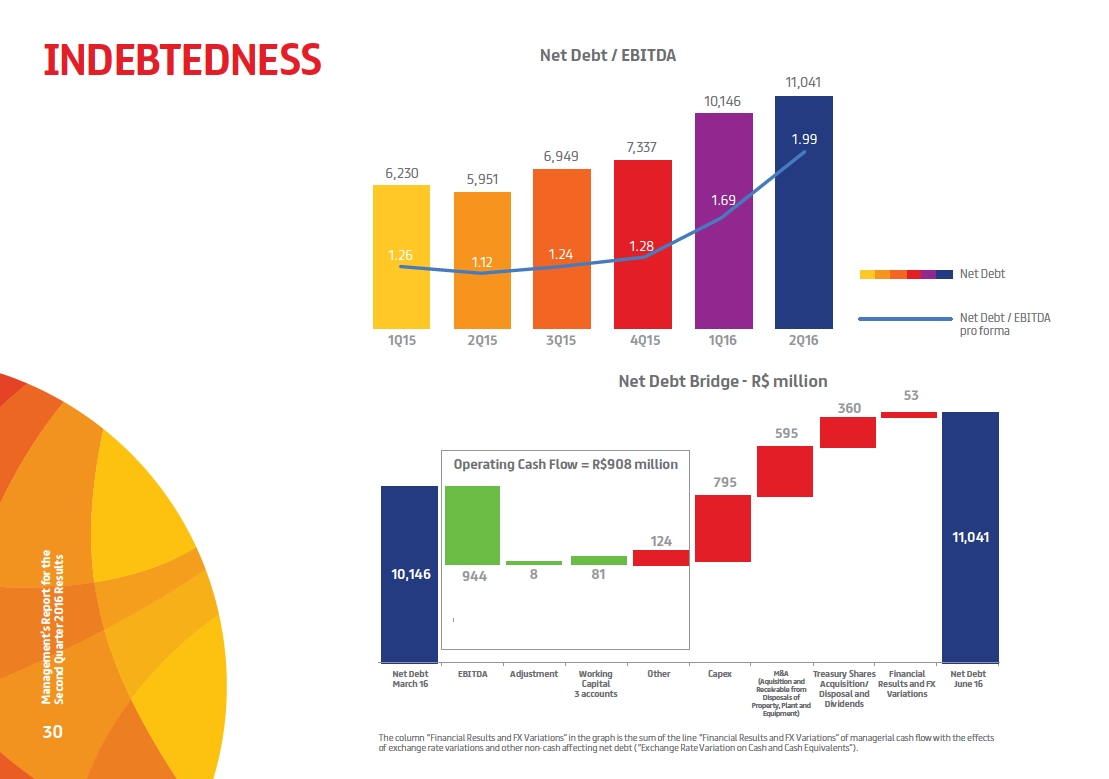
30
31
32
33
34
35
36
37
38
39
40
41
42
43
44
45
46
47
48
49
50
51
52
53
54
(CONVENIENCE TRANSLATION INTO ENGLISH FROM THE ORIGINAL PREVIOUSLY ISSUED IN PORTUGUESE)
ITR – Quarterly Information – June 30, 2016 – BRF S.A. Consolidated FS / Statement of Value Added (in thousands of Brazilian Reais)
|
1. COMPANY’S OPERATIONS
BRF S.A. (“BRF”) and its consolidated subsidiaries (collectively the “Company”) it is a multinational Brazilian company, owns a comprehensive and diverse portfolio of products, which globally acts as one of the world's largest producers of foods. With a focus on raising, producing and slaughtering of poultry and pork for processing, production and sale of fresh meat, processed products, pasta, sauce, mayonnaise, frozen vegetables and soybean by-products, among which the following are highlighted:
· Whole chickens and frozen cuts of chicken, turkey and pork;
· Ham products, bologna, sausages, frankfurters and other smoked products;
· Hamburgers, breaded meat products and meatballs;
· Lasagnas, pizzas, cheese breads, pies and frozen vegetables;
· Margarine, sauces and mayonnaise; and
· Soy meal and refined soy flour, as well as animal feed.
BRF is a public company, listed on the New Market of Brazilian Securities, Commodities & Futures Exchange (“BM&FBOVESPA”), under the ticker BRFS3, and listed on the New York Stock Exchange (“NYSE”), under the ticker BRFS. Its headquarters are located at 475, Rua Jorge Tzachel in the City of Itajaí, State of Santa Catarina.
Our portfolio strategy is focused on creating new, convenient, practical and healthy products for our consumers based on their needs. We seek to achieve that goal through strong innovation to provide us with increasing value-added items that will differentiate us from our competitors and strengthen our brands.
The Company's business model is by means of a vertical and integrated production system, which are distributed through an extensive distribution network, reaching the 5 continents, to meet the supermarkets, retail stores, wholesalers, restaurants and other institutional customers. In addition, our facilities are strategically located near to their raw material suppliers or its main consumption centers.
The Company has as main brandsSadia, Perdigão, Qualy, Chester®, Perdix andPaty that are highly recognized, especially in Brazil, Argentina and the Middle East.
Since 2016, Company´s activities were organizes into 7 operating segments, due to the importance and growth potential of Africa region, which now has the same autonomy and organizational structure of other regions. Thus, the segments have presented as follows: Brazil, Latin America (“LATAM”), Europe, Middle East and North of Africa (“MENA”), Asia, Africa and Other Segments (note 5).
55
(CONVENIENCE TRANSLATION INTO ENGLISH FROM THE ORIGINAL PREVIOUSLY ISSUED IN PORTUGUESE)
ITR – Quarterly Information – June 30, 2016 – BRF S.A. Explanatory Notes (in thousands of Brazilian Reais)
|
1.1. Interest in subsidiaries
% equity interest | |||||||||||||
Entity |
| Main activity | Country | Participation | Accounting method | 06.30.16 | 12.31.15 | ||||||
Avipal Centro-Oeste S.A. | (a) |
| Industrialization and commercialization of milk |
| Brazil |
| Direct |
| Consolidated |
| 100.00% |
| 100.00% |
BRF GmbH | Holding | Austria | Direct | Consolidated | 100.00% | 100.00% | |||||||
Al Khan Foodstuff LLC ("AKF") | (k) | Import, commercialization and distribution of products | Oman | Indirect | Consolidated | 70.00% | 40.00% | ||||||
Al-Wafi Food Products Factory LLC | (l) | Industrialization and commercialization of products | United Arab Emirates | Indirect | Consolidated | 49.00% | 49.00% | ||||||
Alimentos Calchaquí Productos 7 S.A. | (i) | Industrialization and commercialization of products | Argentina | Indirect | Consolidated | 95.00% | - | ||||||
Badi Ltd. | Holding | United Arab Emirates | Indirect | Consolidated | 100.00% | 100.00% | |||||||
Al-Wafi Al-Takamol International for Foods Products | Import and commercialization of products | Saudi Arabia | Indirect | Consolidated | 75.00% | 75.00% | |||||||
BRF Al Yasra Food K.S.C.C. ("BRF AFC") | Import, commercialization and distribution of products | Kuwait | Indirect | Consolidated | 75.00% | 75.00% | |||||||
BRF Foods GmbH | Industralization, import and commercialization of products | Austria | Indirect | Consolidated | 100.00% | 100.00% | |||||||
BRF Foods LLC | Import and commercialization of products | Russia | Indirect | Consolidated | 90.00% | 90.00% | |||||||
BRF France SARL | Marketing and logistics services | France | Indirect | Consolidated | 100.00% | 100.00% | |||||||
BRF Global Company Nigeria Ltd. | Marketing and logistics services | Nigeria | Indirect | Consolidated | 99.00% | 99.00% | |||||||
BRF Global Company South Africa Proprietary Ltd. | Import and commercialization of products | South Africa | Indirect | Consolidated | 100.00% | 100.00% | |||||||
BRF Global Company Nigeria Ltd. | Marketing and logistics services | Nigeria | Indirect | Consolidated | 1.00% | 1.00% | |||||||
BRF Global GmbH | (b) | Holding and trading | Austria | Indirect | Consolidated | 100.00% | 100.00% | ||||||
Qualy 5201 B.V. | (b) | Import, commercialization of products and holding | The Netherlands | Indirect | Consolidated | 100.00% | 100.00% | ||||||
Xamol Consultores Serviços Ltda. | Import and commercialization of products | Portugal | Indirect | Consolidated | 100.00% | 100.00% | |||||||
BRF Japan KK | Marketing and logistics services | Japan | Indirect | Consolidated | 100.00% | 100.00% | |||||||
BRF Korea LLC | Marketing and logistics services | Korea | Indirect | Consolidated | 100.00% | 100.00% | |||||||
BRF Malaysia Sdn Bhd | (j) | Marketing and logistics services | Malaysia | Indireta | Consolidated | 100.00% | - | ||||||
BRF Shanghai Management Consulting Co. Ltd. | Advisory and related services | China | Indirect | Consolidated | 100.00% | 100.00% | |||||||
BRF Shanghai Trading Co. Ltd. | Commercialization and distribution of products | China | Indirect | Consolidated | 100.00% | 100.00% | |||||||
BRF Singapore PTE Ltd. | Marketing and logistics services | Singapore | Indirect | Consolidated | 100.00% | 100.00% | |||||||
BRF Germany GmbH | Import and commercialization of products | Germany | Indirect | Consolidated | 100.00% | 100.00% | |||||||
BRF Holland B.V. | Import and commercialization of products | The Netherlands | Indirect | Consolidated | 100.00% | 100.00% | |||||||
Alimentos Calchaqui Productos S.A. | (i) | Industrialization and commercialization of products | Argentina | Indirect | Consolidated | 5.00% | - | ||||||
BRF B.V. | Industrialization, import and commercialization of products | The Netherlands | Indirect | Consolidated | 100.00% | 100.00% | |||||||
BRF Hungary LLC | Import and commercialization of products | Hungary | Indirect | Consolidated | 100.00% | 100.00% | |||||||
BRF Iberia Alimentos SL | Import and commercialization of products | Spain | Indirect | Consolidated | 100.00% | 100.00% | |||||||
BRF Invicta Ltd. | Import, commercialization and distribution of products | England | Indirect | Consolidated | 62.00% | 62.00% | |||||||
Invicta Food Products Ltd. | Import and commercialization of products | England | Indirect | Consolidated | 100.00% | 100.00% | |||||||
BRF Wrexham Ltd. | Industrialization, import and commercialization of products | England | Indirect | Consolidated | 100.00% | 100.00% | |||||||
Invicta Food Group Ltd. | (b) | Import, commercialization and distribution of products | England | Indirect | Consolidated | 100.00% | 100.00% | ||||||
Invicta Foods Ltd. | Import, commercialization and distribution of products | England | Indirect | Consolidated | 100.00% | 100.00% | |||||||
Invicta Foodservice Ltd. | Import, commercialization and distribution of products | England | Indirect | Consolidated | 100.00% | 100.00% | |||||||
Universal Meats (UK) Ltd. | (b) (e) | Import, Industrialization, commercialization and distribution of products | England | Indirect | Consolidated | 100.00% | - | ||||||
BRF Italia SPA | Import and commercialization of products | Italy | Indirect | Consolidated | 67.00% | 67.00% | |||||||
Compañía Paraguaya Comercial S.A. | (f) | Import and commercialization of products | Paraguay | Indirect | Consolidated | 99.00% | - | ||||||
Eclipse Holding Cöoperatief U.A. | (h) | Holding | Argentina | Indirect | Consolidated | 50.00% | - | ||||||
Buenos Aires Fortune S.A. | (h) | Holding | Argentina | Indirect | Consolidated | 5.00% | - | ||||||
Cabaña San Nestor S.A. | (h) | Rearing and fattening of porks | Argentina | Indirect | Consolidated | 43.33% | - | ||||||
Eporpan S.A. | (h) | Rearing and fattening of porks | Argentina | Indirect | Consolidated | 13.32% | - | ||||||
Campo Austral S.A. | (h) | Industrialization and commercialization of products | Argentina | Indirect | Consolidated | 65.50% | - | ||||||
Degesa Argentina S.A. | (h) | Rearing and fattening of porks | Argentina | Indirect | Consolidated | 4.99% | - | ||||||
Itega S.A. | (h) | Holding | Argentina | Indirect | Consolidated | 96.00% | - | ||||||
Porcinos Cordobeses S.A. | (h) | Rearing and fattening of porks | Argentina | Indirect | Consolidated | 51.04% | - | ||||||
Eclipse Latam Holdings | (h) | Holding | Argentina | Indirect | Consolidated | 100.00% | - | ||||||
Buenos Aires Fortune S.A. | (h) | Holding | Argentina | Indirect | Consolidated | 95.00% | - | ||||||
Cabaña San Nestor S.A. | (h) | Rearing and fattening of porks | Argentina | Indirect | Consolidated | 2.76% | - | ||||||
Campo Austral S.A. | (h) | Industrialization and commercialization of products | Argentina | Indirect | Consolidated | 34.50% | - | ||||||
Degesa Argentina S.A. | (h) | Rearing and fattening of porks | Argentina | Indirect | Consolidated | 95.01% | - | ||||||
Eporpan S.A. | (h) | Rearing and fattening of porks | Argentina | Indirect | Consolidated | 51.07% | - | ||||||
Hibridos Argentinos S.A. | (h) | Rearing and fattening of porks | Argentina | Indirect | Consolidated | 95.00% | - | ||||||
Indústria Frigorífico Expork S.A. | (h) | Slaughtering | Argentina | Indirect | Consolidated | 78.52% | - | ||||||
Itega S.A. | (h) | Holding | Argentina | Indirect | Consolidated | 4.00% | - | ||||||
Porcinos Cordobeses S.A. | (h) | Rearing and fattening of porks | Argentina | Indirect | Consolidated | 14.34% | - | ||||||
Porcinos Cordobeses S.A. | (h) | Rearing and fattening of porks | Argentina | Indirect | Consolidated | 5.88% | - | ||||||
Eporpan S.A. | (h) | Rearing and fattening of porks | Argentina | Indirect | Consolidated | 35.61% | - | ||||||
Cabaña San Nestor S.A. | (h) | Rearing and fattening of porks | Argentina | Indirect | Consolidated | 53.91% | - | ||||||
Hibridos Argentinos S.A. | (h) | Rearing and fattening of porks | Argentina | Indirect | Consolidated | 5.00% | - | ||||||
Porcinos Cordobeses S.A. | (h) | Rearing and fattening of porks | Argentina | Indirect | Consolidated | 28.74% | - | ||||||
Indústria Frigorífico Expork S.A. | (h) | Slaughtering | Argentina | Indirect | Consolidated | 21.48% | - | ||||||
Federal Foods LLC | (c) | Import, commercialization and distribution of products | United Arab Emirates | Indirect | Consolidated | 49.00% | 49.00% | ||||||
Federal Foods Omã | (a) | Import, commercialization and distribution of products | Oman | Indirect | Consolidated | 49.00% | 49.00% | ||||||
Federal Foods Qatar | Import, commercialization and distribution of products | Qatar | Indirect | Consolidated | 49.00% | 49.00% | |||||||
Golden Foods Poultry Limited | (d) | Holding | Thailand | Indirect | Consolidated | 48.52% | - | ||||||
Golden Poultry Siam Limited | (d) | Holding | Thailand | Indirect | Consolidated | 51.84% | - | ||||||
Golden Poultry Siam Limited | (d) | Holding | Thailand | Indirect | Consolidated | 48.16% | - | ||||||
BRF Thailand Limited | (d) | Import, Industrialization, commercialization and distribution of products | Thailand | Indirect | Consolidated | 100.00% | - | ||||||
BRF Feed Thailand Limited | (d) | Import, Industrialization, commercialization and distribution of products | Thailand | Indirect | Consolidated | 100.00% | - | ||||||
Golden Foods Sales (Europe) Limited | (d) | Holding e trading | Thailand | Indirect | Consolidated | 100.00% | - | ||||||
Golden Quality Foods Europe BV | (d) | Import, commercialization and distribution of products | Thailand | Indirect | Consolidated | 100.00% | - | ||||||
Golden Quality Foods Netherlands BV | (d) | Import, commercialization and distribution of products | Thailand | Indirect | Consolidated | 100.00% | - | ||||||
Golden Foods Siam Europe Limited | (b) (d) | Import, commercialization and distribution of products | Thailand | Indirect | Consolidated | 100.00% | - | ||||||
Perdigão Europe Lda. | Import and commercialization of products | Portugal | Indirect | Consolidated | 100.00% | 100.00% | |||||||
Perdigão International Ltd. | Import and commercialization of products | Cayman Island | Indirect | Consolidated | 100.00% | 100.00% | |||||||
BFF International Ltd. | Financial fundraising | Cayman Island | Indirect | Consolidated | 100.00% | 100.00% | |||||||
Highline International | (a) | Financial fundraising | Cayman Island | Indirect | Consolidated | 100.00% | 100.00% | ||||||
Sadia Chile S.A. | Import and commercialization of products | Chile | Indirect | Consolidated | 40.00% | 40.00% | |||||||
Sadia Foods GmbH | (a) | Import and commercialization of products | Germany | Indirect | Consolidated | 100.00% | 100.00% | ||||||
BRF Foods LLC | Import and commercialization of products | Russia | Indirect | Consolidated | 10.00% | 10.00% | |||||||
SATS BRF Food PTE Ltd. | Import, industrialization, commercialization and distribution of products | Singapore | Joint venture | Equity pick-up | 49.00% | 49.00% | |||||||
Wellax Food Logistics C.P.A.S.U. Lda. | Import and commercialization of products | Portugal | Indirect | Consolidated | 100.00% | 100.00% | |||||||
Establecimiento Levino Zaccardi y Cia. S.A. | (a) |
| Industrialization and commercializations of dairy products |
| Argentina |
| Direct |
| Consolidated |
| 98.26% |
| 98.26% |
K&S Alimentos S.A. | (g) |
| Industrialization and commercialization of products |
| Brazil |
| Affiliate |
| Consolidated |
| 100.00% |
| 49.00% |
PP-BIO Administração de bem próprio S.A. |
|
| Management of assets |
| Brazil |
| Affiliate |
| Equity pick-up |
| 33.33% |
| 33.33% |
PSA Laboratório Veterinário Ltda. |
| Veterinary activities |
| Brazil |
| Direct |
| Consolidated |
| 99.99% |
| 99.99% | |
Sino dos Alpes Alimentos Ltda. | (a) |
| Industrialization and commercialization of products |
| Brazil |
| Indirect |
| Consolidated |
| 99.99% |
| 99.99% |
PR-SAD Administração de bem próprio S.A. |
|
| Management of assets |
| Brazil |
| Affiliate |
| Equity pick-up |
| 33.33% |
| 33.33% |
56
(CONVENIENCE TRANSLATION INTO ENGLISH FROM THE ORIGINAL PREVIOUSLY ISSUED IN PORTUGUESE)
ITR – Quarterly Information – June 30, 2016 – BRF S.A. Explanatory Notes (in thousands of Brazilian Reais)
|
% equity interest | |||||||||||||
Entity |
| Main activity | Country | Participation | Accounting method | 06.30.16 | 12.31.15 | ||||||
Quickfood S.A. |
| Industrialization and commercialization of products |
| Argentina |
| Direct |
| Consolidated |
| 90.05% |
| 90.05% | |
Sadia Alimentos S.A. | Holding | Argentina | Direct | Consolidated | 43.10% | 43.10% | |||||||
Avex S.A. |
|
| Industrialization and commercialization of products |
| Argentina |
| Indirect |
| Consolidated |
| 33.98% |
| 33.98% |
Sadia International Ltd. | Import and commercialization of products | Cayman Island | Direct | Consolidated | 100.00% | 100.00% | |||||||
Sadia Chile S.A. | Import and commercialization of products | Chile | Indirect | Consolidated | 60.00% | 60.00% | |||||||
Sadia Uruguay S.A. | Import and commercialization of products | Uruguay | Indirect | Consolidated | 5.10% | 5.10% | |||||||
Avex S.A. | Industrialization and commercialization of products | Argentina | Indirect | Consolidated | 66.02% | 66.02% | |||||||
Compañía Paraguaya Comercial S.A. | (f) | Import and commercialization of products | Paraguay | Indirect | Consolidated | 1.00% | - | ||||||
Sadia Alimentos S.A. |
|
| Holding |
| Argentina |
| Indirect |
| Consolidated |
| 56.90% |
| 56.90% |
Sadia Overseas Ltd. |
|
| Financial fundraising |
| Cayman Island |
| Direct |
| Consolidated |
| 100.00% |
| 100.00% |
Sadia Uruguay S.A. | Import and commercialization of products | Uruguay | Direct | Consolidated | 94.90% | 94.90% | |||||||
UP Alimentos Ltda. |
|
| Industrialization and commercialization of products |
| Brazil |
| Affiliate |
| Equity pick-up |
| 50.00% |
| 50.00% |
Vip S.A. Emp. Part.Imobiliárias | Commercialization of owned real state | Brazil | Direct | Consolidated | 100.00% | 100.00% | |||||||
Establecimiento Levino Zaccardi y Cia. S.A. | (a) | Industrialization and commercialization of dairy products | Argentina | Indirect | Consolidated | 1.74% | 1.74% | ||||||
PSA Laboratório Veterinário Ltda. | Veterinary activities | Brazil | Indirect | Consolidated | 0.01% | 0.01% | |||||||
Sino dos Alpes Alimentos Ltda. | (a) |
| Industrialization and commercialization of products |
| Brazil |
| Indirect |
| Consolidated |
| 0.01% |
| 0.01% |
(a) Dormant subsidiaries.
(b) The wholly-owned subsidiary BRF Global GmbH started to operate as a trading in the European market as from May 1, 2013. In addition, it owns 101 direct subsidiaries in Madeira, Portugal, with an investment of R$8,070 as of March 31, 2016 (R$4,046 as of December 31, 2015) and a direct subsidiary in Den Bosch, The Netherlands, denominated Qualy 20 with an investment of R$7,987 as of March 31, 2016 (R$8,162 as of December 31, 2015). The wholly-owned subsidiary Qualy 5201 B.V. owns 212 subsidiaries in The Netherlands being the amount of this investment of R$26,864 as of March 31, 2016 (R$22,258 as of December 31, 2015). The indirect subsidiary Invicta Food Group Ltd. owns 120 direct subsidiaries in Ashford, England, with an investment of R$141,705 as of March 31, 2016 (R$161,197 as of December 31, 2015). The indirect subsidiary Universal Meats (UK) Ltd. owns 99 direct subsidiaries in Ashford, England. The indirect subsidiary Golden Foods Siam Europe Ltd. (GFE) owns 32 direct subsidiaries in London, England. The purpose of these 2 subsidiaries is to operate in the European market to increase the Company’s market share, which is regulated by a system of poultry and turkey meat import quotas.
(c) The company owns 49% of equity interest with rights for 60% of the dividends, permitted by the Federal Law 8/1984, which is effective in the United Arab Emirates and according to the shareholder’s agreement, as well as 100% of the economic rights resulting in the consolidation of this wholly owned subsidiary.
(d) On January 26, 2016 acquisition of 48.52% of equity interest in Golden Foods Poultry Limited and 48.16% of equity interest in Golden Poultry Siam Limited. The company, according to the shareholder’s agreement, owns substantial part of the economic rights of such entities. In addition, on January 26, 2016, acquisition of 100% of equity interest in Golden Foods Sales (Europe) Limited and Golden Foods Siam Europe Limited.
(e) On February 01, 2016, acquisition of 100% of equity interest in Universal Meats (UK) Ltd.
(f) On February 25, 2016, acquisition of 100% of equity interest in Compañía Paraguaya Comercial S.A.
(g) On March, 18, 2016, the Company acquired the remaining equity interest and thus holds 100% of equity interest in K&S Alimentos S.A.
(h) On April 13, 2016, acquisition of 50% of equity interest in Eclipse Holding Cöoperatief UA and its subsidiaries.
(i) On May 10, 2016, acquisition of 100% of equity interest in Alimentos Calchaquí Productos 7 S.A..
(j) On June 10, 2016, establishment of BRF Malaysia Snd Bhd with 100% of equity interest.
(k) On June 20, 2016, acquisition of 30% of equity interest, becoming the holder of 70% of equity interest with rights for 99% of the dividends, permitted by the Federal Law, which is effective in the Sultanate of Oman and according to the shareholder’s agreement, as well as 100% of the economic rights resulting in the consolidation of this wholly owned subsidiary.
(l) The company owns 49% of equity interest with rights for 90% of the dividends, permitted by the Federal Law 8/1984, which is effective in the United Arab Emirates and according to the shareholder’s agreement, as well as 100% of the economic rights resulting in the consolidation of this wholly owned subsidiary.
57
(CONVENIENCE TRANSLATION INTO ENGLISH FROM THE ORIGINAL PREVIOUSLY ISSUED IN PORTUGUESE)
ITR – Quarterly Information – June 30, 2016 – BRF S.A. Explanatory Notes (in thousands of Brazilian Reais)
|
1.2. Step acquisition – Al Khan Foodstuff LLC. (“AKF”)
On July 03, 14, BRF acquired 40% of equity interest of AKF, classifying the investment as a joint venture.
On June 20, 2016, the Company concluded the acquisition of the control of AKF, becoming the beneficiary of 99% of its economic interest. The acquisition of the additional 59% of economic interest in AKF totaled US$32,584 (equivalent to R$110,271) (note 6.1.3).
1.3. Business combination with Alimentos Calchaquí Productos 7 S.A. (“Calchaquí”)
On March 22, 2016, BRF signed, through its wholly owned subsidiaries BRF GmbH and BRF Holland B.V., an agreement for the acquisition of the total shares issued by Calchaquí (“transaction”), a traditional Argentine entity, reference in the region´s cold cuts market, and owner of leading brands such as Calchaquí and Bocatti.
The transaction was concluded in the amount of US$104,700 (equivalent to R$364,112) (note 6.1.2).
1.4. Shares purchase agreement with Globosuínos Agropecuária S.A. (“Globosuínos”)
On April 08, 2016, BRF announced to the Market that it has signed an agreement for the acquisition of the total shares of a limited company to be constituted by Globosuínos (“transaction”), which, on the transaction closing date, will hold certain assets currently held by Globosuínos.
Subject to the satisfaction of the conditions precedent set forth in the agreement, which includes the approval from the Administrative Council for Economic Defense – CADE, the parties will execute the documents providing for the acquisition in the total amount of R$20,200.
1.5. Step acquisition – Eclipse Holding Cöoperatief UA S.A. (“Eclipse”)
On April 14, 2016 the conditions precedent were fulfilled, and BRF concluded the first step of the transaction, acquiring 50% of equity interest in the amount of US$39,747 (equivalent to R$139,614), paid in cash (note 6.1.1).
1.6. Seasonality
In Brazil and LATAM operating segments, in November and December, the Company is impacted by seasonality due Christmas and New Year Celebrations, being the best-selling products in this period: turkey, Chester, ham and pork loins.
58
(CONVENIENCE TRANSLATION INTO ENGLISH FROM THE ORIGINAL PREVIOUSLY ISSUED IN PORTUGUESE)
ITR – Quarterly Information – June 30, 2016 – BRF S.A. Explanatory Notes (in thousands of Brazilian Reais)
|
In MENA operating segment, seasonality is due to Ramadan, which is the holy month of the Muslim calendar. The start of Ramadan depends on the beginning of the moon cycle and therefore can vary each year.
2. MANAGEMENT’S STATEMENT AND BASIS OF PREPARATION AND PRESENTATION OF QUARTELY FINANCIAL STATEMENTS
The Company’s individual and consolidated quarterly financial statements are prepared in accordance with International Financial Reporting Standards (“IFRS”), as issued by the International Accounting Standards Board (“IASB”) and interpretation issued by the International Financial Reporting Interpretations Committee (“IFRIC”), implemented in Brazil through Brazilian Accounting Pronouncements Committee (“CPC”) and its technical interpretations (“ICPC”) and guidelines (“OCPC”), approved by the Brazilian Securities Exchange Commission (“CVM”).
The Company’s individual and consolidated quarterly financial statements are expressed in millions of Brazilian Reais (“R$”), as well as the amounts of other currencies disclosed, when applicable, were also expressed in thousands.
The preparation of the Company’s individual and consolidated quarterly financial statements requires Management to make judgments, use estimates and adopt assumptions that affect the reported amounts of revenues, expenses, assets and liabilities, as well as the disclosures of contingent liabilities as of the reporting date. However, the uncertainty inherent to these judgments, assumptions and estimates could result in material adjustments to the carrying amounts of the affected assets and liabilities in future periods.
The Company reviews its judgments, estimates and assumptions on a quarterly basis.
The individual and consolidated financial statements were prepared on the historical cost except for the following items which are measured at fair value:
(i) derivative and non-derivative financial instruments measured at fair value;
(ii) available for sale financial assets at fair value;
(iii) marketable securities classified as cash and cash equivalents measured at fair value;
(iv) share-based payments and employee benefits at fair value, and
(v) biological assets at fair value.
59
(CONVENIENCE TRANSLATION INTO ENGLISH FROM THE ORIGINAL PREVIOUSLY ISSUED IN PORTUGUESE)
ITR – Quarterly Information – June 30, 2016 – BRF S.A. Explanatory Notes (in thousands of Brazilian Reais)
|
3. SUMMARY OF SIGNIFICANT ACCOUNTING POLICIES
The quarterly financial information was prepared according to CVM Deliberation Nº 673/11, which establishes the minimum content of interim financial statement and the principles for measurement and recognition of a full or condensed set of financial statements for an interim period.
The interim financial statements, in this case denominated as quarterly financial information, aims to provide updated information based on the last annual financial statements disclosed. Therefore, the quarterly financial information focused on new activities, events and circumstances and do not duplicate the information previously disclosed, except in the case where Management judged that the maintenance of the information was relevant.
The current quarterly financial information was consistently prepared based on the accounting policies and estimates calculation methodology adopted in the preparation of the annual financial statements for the year ended December 31, 2015 (note 3).
There were no changes of any nature related to such policies and estimates calculation methodology. As allowed by CVM Deliberation Nº 673/11, Management decided not to disclose again the details of the accounting policies adopted by the Company. Hence, the quarterly financial information should be read in conjunction with the annual financial statements for the year ended December 31, 2015, in order to allow the users of this financial information to further understand the Company’s capacity of profit and future cash flows generation as well as its financial conditions and liquidity.
The exchange rates in Brazilian Reais that are effective at the balance sheet dates are as follows:
60
(CONVENIENCE TRANSLATION INTO ENGLISH FROM THE ORIGINAL PREVIOUSLY ISSUED IN PORTUGUESE)
ITR – Quarterly Information – June 30, 2016 – BRF S.A. Explanatory Notes (in thousands of Brazilian Reais)
|
Exchange rate at the balance sheet date | 06.30.16 | 12.31.15 | ||
U.S. Dollar (US$ or USD) | 3.2098 | 3.9048 | ||
Euro (€ or EUR) | 3.5414 | 4.2504 | ||
Pound Sterling (£ or GBP) | 4.2511 | 5.7881 | ||
Argentine Peso ($ or ARS) | 0.2148 | 0.3017 | ||
Omani Riyal (OMR) | 8.3371 | 10.1529 | ||
Dirham (AED) | 0.8740 | 1.0631 | ||
Saudi Riyal (SAR) | 0.8564 | 1.0406 | ||
Bath (THB) | 0.0913 | 0.1083 | ||
Qatar Riyal (QAR) | 0.8815 | 1.0725 | ||
Kwanza (AOA) | 0.0195 | 0.0290 | ||
Average rates | 06.30.16 | 06.30.15 | ||
U.S. Dollar (US$ or USD) | 3.7099 | 2.9678 | ||
Euro (€ or EUR) | 4.1371 | 3.3084 | ||
Pound Sterling (£ or GBP) | 5.3162 | 4.5241 | ||
Argentine Peso ($ or ARS) | 0.2593 | 0.3364 | ||
Omani Riyal (OMR) | 9.6437 | 7.7097 | ||
Dirham (AED) | 1.0102 | 0.8080 | ||
Saudi Riyal (SAR) | 0.9894 | 0.7912 | ||
Bath (THB) | 0.1046 | 0.0901 | ||
Qatar Riyal (QAR) | 1.0190 | 0.8152 | ||
Kwanza (AOA) | 0.0231 | 0.0274 |
4. FINANCIAL INSTRUMENTS AND RISK MANAGEMENT
4.1. Overview
In the normal course of its business, the Company is exposed to credit, liquidity and market risks, which are actively managed in conformity to the Financial Risk and Strategic Documents Management Policy (“Risk Policy”) and internal guidelines subject to such policy. The policy and guidelines, as well as the monitoring process, evaluation and approval processes of risk management were disclosed in detail in the financial statements for the year ended December 31, 2015 (note 4) and there were no changes in the six-month period ended June 30, 2016.
a. Credit risk management
The Company is subject to the credit risk related to trade accounts receivable, financial investments and derivative contracts.
Credit risk associated with trade accounts receivable is actively managed by dedicated team, through specific systems. Furthermore, it should be noted the diversification of the customer portfolio and the concession of credit to customers with good financial and operational conditions. The Company does not usually require collateral for sales to customer, and it has contracted credit insurance policy for specific markets.
61
(CONVENIENCE TRANSLATION INTO ENGLISH FROM THE ORIGINAL PREVIOUSLY ISSUED IN PORTUGUESE)
ITR – Quarterly Information – June 30, 2016 – BRF S.A. Explanatory Notes (in thousands of Brazilian Reais)
|
Credit risk associated with financial investments and derivative contracts is mitigated by the Company’s policy of working with prime institutions.
On June 30, 2016, the Company had financial investments over R$100,000 at the following financial institutions: Banco BNP, Banco Bradesco, Banco do Brasil, Banco Itaú, Banco Santander, Caixa Econômica Federal, Deutsche Bank and Standard Chartered.
The Company also held derivative contracts with the following financial institutions: Banco BNP, Banco Bradesco, Banco do Brasil, Banco HSBC, Banco Itaú, Banco Safra, Banco Santander, Banco Votorantim, Citibank, Deutsche Bank, Ing Bank, Merrill Lynch, Morgan Stanley and Rabobank.
b. Liquidity risk management
Liquidity risk management aims to reduce the impacts caused by events that may affect the Company’s cash flow. Thus, the Company utilizes the following metrics:
· Cash Flow at Risk (“CFaR”), which aims to statistically estimates the cash flows for the next twelve months and the Company’s liquidity exposure. The Company determined that the minimum cash available should be equivalent mainly to the average monthly billing and EBITDA for the last twelve-month period; and
· Value at Risk ("VaR") is used for derivative transactions that require payments of periodic adjustments. Currently, the Company holds only BM&F operations with daily adjustments and in order to monitor them, such methodology is utilized, which statistically measures potential maximum adjustments to be paid at intervals of 1 to 21 days.
The Company maintains its leverage levels in order to avoid any impact to its ability to settle commitments and obligations. As a guideline, the majority of the debt should be in long term. On June 30, 2016, the long term debt portion accounted for 77.9% (82.7% as of December 31, 2015) of the total outstanding debt with an average term greater than 5 years.
The table below summarizes the commitments and contractual obligations that may impact the Company’s liquidity:
62
(CONVENIENCE TRANSLATION INTO ENGLISH FROM THE ORIGINAL PREVIOUSLY ISSUED IN PORTUGUESE)
ITR – Quarterly Information – June 30, 2016 – BRF S.A. Explanatory Notes (in thousands of Brazilian Reais)
|
Parent company | |||||||||||||||
06.30.16 | |||||||||||||||
Book | Cash flow contracted | Up to 6 months | 2017 | 2018 | 2019 | 2020 | After | ||||||||
Non derivative financial liabilities | |||||||||||||||
Loans and financing | 8,733,711 | 16,152,086 | 2,401,697 | 4,465,514 | 3,046,421 | 5,643,871 | 574,259 | 20,324 | |||||||
BRF bonds | 6,716,208 | 11,828,692 | 176,686 | 415,817 | 1,377,067 | 338,317 | 338,317 | 9,182,488 | |||||||
Trade accounts payable | 4,472,113 | 4,472,113 | 4,472,113 | - | - | - | - | - | |||||||
Supply chain finance | 743,626 | 743,626 | 743,626 | - | - | - | - | - | |||||||
Financial lease | 189,331 | 291,944 | 37,494 | 52,193 | 40,963 | 33,599 | 18,669 | 109,026 | |||||||
Operational lease | - | 389,717 | 168,439 | 141,574 | 43,382 | 12,328 | 5,770 | 18,224 | |||||||
Derivative financial liabilities | |||||||||||||||
Financial instruments designated as cash flow hedge | |||||||||||||||
Interest rate and exchange rate derivatives | 178,750 | 188,851 | (2,226) | 4,258 | 186,819 | - | - | - | |||||||
Currency derivatives (options) | 35,026 | 19,102 | 19,102 | - | - | - | - | - | |||||||
Commodities derivatives (NDF) | 3,035 | 74,756 | 74,756 | - | - | - | - | - | |||||||
Financial instruments not designated as cash flow hedge | |||||||||||||||
Currency derivatives (NDF) | 35,381 | 33,920 | 33,920 | - | - | - | - | - | |||||||
Currency derivatives (Future) | 2,542 | 2,542 | 2,542 | - | - | - | - | - | |||||||
Interest rate and exchange rate derivatives | 594,861 | 493,949 | 323,267 | 170,502 | 180 | - | - | - | |||||||
Commodities derivatives (Future) | 3,263 | 3,263 | 3,263 | - | - | - | - | - | |||||||
Consolidated | |||||||||||||||
06.30.16 | |||||||||||||||
Book | Cash flow contracted | Up to 6 months | 2017 | 2018 | 2019 | 2020 | After | ||||||||
Non derivative financial liabilities | |||||||||||||||
Loans and financing | 9,311,598 | 16,862,147 | 2,543,936 | 4,605,155 | 3,474,602 | 5,643,871 | 574,259 | 20,324 | |||||||
BRF bonds | 6,716,208 | 11,828,692 | 176,686 | 415,817 | 1,377,067 | 338,317 | 338,317 | 9,182,488 | |||||||
BFF bonds | 392,559 | 642,352 | 18,051 | 36,101 | 36,101 | 36,101 | 515,998 | - | |||||||
Sadia bonds | 364,425 | 507,333 | 16,318 | 491,015 | - | - | - | - | |||||||
Quickfood bonds | 175,047 | 151,041 | 24,842 | 37,019 | 27,413 | 18,954 | 42,813 | - | |||||||
Trade accounts payable | 5,346,644 | 5,346,644 | 5,346,644 | - | - | - | - | - | |||||||
Supply chain finance | 743,626 | 743,626 | 743,626 | - | - | - | - | - | |||||||
Financial lease | 190,805 | 294,475 | 38,156 | 53,065 | 41,960 | 33,599 | 18,669 | 109,026 | |||||||
Operational lease | - | 404,467 | 172,904 | 145,484 | 46,031 | 14,478 | 5,770 | 19,800 | |||||||
Derivative financial liabilities | |||||||||||||||
Financial instruments designated as cash flow hedge | |||||||||||||||
Interest rate and exchange rate derivatives | 217,810 | 233,864 | 6,045 | 20,801 | 206,096 | 922 | - | - | |||||||
Deliverable forwards contracts | 80 | 80 | 80 | - | - | - | - | - | |||||||
Currency derivatives (options) | 35,026 | 19,102 | 19,102 | - | - | - | - | - | |||||||
Commodities derivatives (NDF) | 3,035 | 74,756 | 74,756 | - | - | - | - | - | |||||||
Financial instruments not designated as cash flow hedge | |||||||||||||||
Currency derivatives (NDF) | 35,584 | 30,899 | 30,899 | - | - | - | - | - | |||||||
Currency derivatives (Future) | 2,542 | 2,542 | 2,542 | - | - | - | - | - | |||||||
Interest rate and exchange rate derivatives | 594,861 | 493,949 | 323,267 | 170,502 | 180 | - | - | - | |||||||
Commodities derivatives (Future) | 3,263 | 3,263 | 3,263 | - | - | - | - | - | |||||||
c. Interest rate risk management
Interest rate risk is the one the Company incurs in economic losses resulting from changes in these rates, which could affect its assets and liabilities.
The Company’s Risk Policy does not restrict exposure to different interest rates, neither establishes limits for fixed or floating rates. However, the Company continually monitors the market interest rates, in order to evaluate any need to enter into hedging transaction to protect from the exposure to fluctuation of such rates and manage the mismatch
63
(CONVENIENCE TRANSLATION INTO ENGLISH FROM THE ORIGINAL PREVIOUSLY ISSUED IN PORTUGUESE)
ITR – Quarterly Information – June 30, 2016 – BRF S.A. Explanatory Notes (in thousands of Brazilian Reais)
|
between its financial investments and debts. In these transactions the Company enters into contracts that exchange floating rate for fixed rate or vice-versa. Such transactions were designated by the Company as cash flow hedge.
The Company’s indebtedness is essentially tied to the London Interbank Offered rate ("LIBOR"), fixed coupon (“R$ and USD”), Long Term Interest Rate ("TJLP") and Monetary Unit of the Bank National Economic and Social Development ("UMBNDES") rates. In case of adverse changes in the market that result in LIBOR, TJLP and UMBNDES rise, the cost of the floating indebtedness rises and on the other hand, the cost of the fixed indebtedness decreases in relative terms.
With regards to the Company's marketable securities, the main index is the Interbank Deposit Certificate ("CDI") for investments in the domestic market and fixed coupon (“USD”) for investments in the foreign market.
d. Foreign exchange risk management
Foreign exchange risk is the one related to variations of foreign exchange rates that may cause the Company to incur unexpected losses, leading to a reduction of assets or an increase in liabilities.
The Risk Policy is intended to protect the Company's results from these variations, inorder to:
· Protect operating revenues and costs that are related to transactions arising from commercial activities, such as estimated exports and purchases of raw materials, utilizing hedging instruments, that is, to protect its future cash flow denominated in foreign currency; and
· Manage assets and liabilities denominated in foreign currencies in order to protect the balance sheet of the Company, through the use of over-the counter and futures transactions.
The Company’s consolidated financial statements are mainly impacted by the following currencies: U.S. Dollar, Euro, Iene, Pound Sterling, Baht and Argentine Peso.
Assets and liabilities denominated in foreign currency are as follows:
64
(CONVENIENCE TRANSLATION INTO ENGLISH FROM THE ORIGINAL PREVIOUSLY ISSUED IN PORTUGUESE)
ITR – Quarterly Information – June 30, 2016 – BRF S.A. Explanatory Notes (in thousands of Brazilian Reais)
|
Consolidated | |||
06.30.16 | 12.31.15 | ||
Total exposure | |||
Cash and cash equivalents and marketable securities | 3,015,506 | 5,322,907 | |
Trade accounts receivable | 2,114,942 | 2,146,020 | |
Accounts receivable from subsidiaries (unconsolidated) | 110,250 | 250,766 | |
Restricted cash | 124,180 | 1,346,274 | |
Future dollar agreements | 272,833 | 741,912 | |
Dollar purchase agreement (Regular Hedge) | 642,960 | - | |
Inventories | - | 246 | |
Exchange rate contracts (Swap) | 2,426,720 | 968,780 | |
Loans and financing | (10,044,903) | (11,359,658) | |
Bonds designated as cash flow hedge | 962,940 | 1,171,440 | |
Export prepayments designated as cash flow hedge | 962,940 | 1,171,440 | |
Trade accounts payable | (1,566,610) | (1,496,833) | |
Supply chain finance | (418,319) | (488,997) | |
Other assets and liabilities, net | 165,626 | (232,146) | |
(1,230,935) | (457,849) | ||
Foreign exchange exposure (in US$) liabilities | (383,493) | (117,253) | |
Foreign exchange exposure impacting the statement of income (in US$) liabilities | (202,439) | (39,776) | |
Foreign exchange exposure included in other comprehensive income (in US$) liabiities | (181,054) | (77,477) | |
Foreign exchange exposure (in US$) liabilities | (383,493) | (117,253) | |
The Company's net foreign exchange exposure as of June 30, 2016 is within the limit set by the Company's Risk Policy.
e. Commodity price risk management
In the normal course of its operations, the Company purchases commodities, mainly corn, soymeal, oil and live hogs, which are some of the individual components of production cost.
Corn, soymeal and oil prices are subject to volatility resulting from weather conditions, crop yield, transportation and storage costs, government’s agricultural policy, foreign exchange rates and the prices of these commodities on the international market, among others factors. The prices of hogs acquired from third parties are subject to market conditions and are influenced by internal availability and levels of demand in the international market, among other aspects.
The Risk Policy establishes limits for hedging the corn and soymeal purchase flow, aiming to reduce the impact resulting from a price increase of these raw materials, and may utilize derivative instruments or inventory management for this purpose. Currently, the management of inventory levels is used as a hedging instrument. Since June 2015, the company began using derivative financial instruments as hedge for variations in corn purchase prices.
65
(CONVENIENCE TRANSLATION INTO ENGLISH FROM THE ORIGINAL PREVIOUSLY ISSUED IN PORTUGUESE)
ITR – Quarterly Information – June 30, 2016 – BRF S.A. Explanatory Notes (in thousands of Brazilian Reais)
|
f. Capital management
The Company’s definition of the adequate capital structure is essentially associated with (i) cash strength as a tolerance factor to liquidity volatility, (ii) financial leverage and (iii) maximization of the opportunity cost of capital.
The cash and liquidity strategy takes into consideration the historical scenarios of volatility of results as well as simulations of sectorial and systemic crises and is based on permitting the resilience in scenarios of restricted access to capital.
Financial leverage aims the balance between the different sources of funding and their conditions of allocation in order to maximize the opportunity cost to BRF in its business expansion initiatives. Moreover, the objective of maintaining the investment grade disciplines the weighting of using own and third party capital.
The Company monitors levels of debt and net debt, which are shown below:
Consolidated | |||||||
06.30.16 | 12.31.15 | ||||||
Current | Non-current | Total | Total | ||||
Foreign currency debt | (2,198,752) | (7,846,151) | (10,044,903) | (11,359,658) | |||
Local currency debt | (1,549,513) | (5,365,421) | (6,914,934) | (3,819,625) | |||
Other financial liabilities | (892,201) | - | (892,201) | (666,602) | |||
Gross debt | (4,640,466) | (13,211,572) | (17,852,038) | (15,845,885) | |||
Marketable securities and cash and cash equivalents | 5,302,723 | 340,711 | 5,643,434 | 6,553,639 | |||
Other financial assets | 525,763 | - | 525,763 | 129,387 | |||
Restricted cash | 182,180 | 459,898 | 642,078 | 1,826,102 | |||
Net debt | 1,370,200 | (12,410,963) | (11,040,763) | (7,336,757) | |||
4.2. Derivative and non-derivative financial instruments designated as hedge accounting
As established by CVM Deliberation Nº 604/09, the Company applies hedge accounting
to its derivative instruments classified as cash flow hedge, in accordance with the Risk Policy. The cash flow hedge consists of hedging the exposure to variations of the cash flow and firm commitment which is attributable to a particular risk associated with a recognized asset or liability, or a highly probable transaction that could affect profit and loss. The firm commitment hedge is a protection against fluctuations of a specific type of risk associated to a firm agreement to exchange a determined quantity for a determined price in a specific date, or in future determined dates.
The Risk Policy has also the purpose of determining parameters of use of financial instruments, including derivatives, which are designed to protect the operating and financial assets and liabilities, which are exposed to the variations of foreign exchange rates, the fluctuation of the interest rates and changes to the commodity prices.
66
(CONVENIENCE TRANSLATION INTO ENGLISH FROM THE ORIGINAL PREVIOUSLY ISSUED IN PORTUGUESE)
ITR – Quarterly Information – June 30, 2016 – BRF S.A. Explanatory Notes (in thousands of Brazilian Reais)
|
The Company, within its hedge accounting strategy, utilizes the following financial instruments:
· Currency non-deliverable forwards – NDF;
· Commodities non-deliverable forwards – NDF;
· Interest rate and currency swap;
· Fixed exchange rate;
· Options;
· Export prepayments – PPEs; and
· Senior unsecured notes – Bonds
4.2.1 Breakdown of the balances of derivative financial instruments
The positions of outstanding derivative financial instruments are follows:
Parent company and Consolidated | ||||||||||||
06.30.16 |
| 12.31.15 | ||||||||||
Instrument | Hedge object | Reference currency (notional) | Reference | Fair value (1) | Reference | Fair value (1) | ||||||
Financial instruments designated as hedge accounting | ||||||||||||
NDF - Dollar sale | Currency | US$ | - | - | 44,000 | (17,858) | ||||||
NDF - Euro sale | Currency | EUR | 33,000 | 10,856 | 31,800 | (5,457) | ||||||
NDF - Pound Sterling sale | Currency | GBP | - | - | 11,000 | (1,566) | ||||||
NDF - Iene sale | Currency | JPY | - | - | 6,799,981 | (39,569) | ||||||
Currency swap - US$ | Currency | BRL | 250,000 | (154,445) | 250,000 | (248,456) | ||||||
Interest rate swap - US$ | Interest | US$ | 200,000 | (24,305) | 200,000 | (31,829) | ||||||
Fixed exchange rate - US$ | Currency | US$ | 76,000 | 69,969 | 201,000 | (33,765) | ||||||
Options (Collar) - US$ | Currency | US$ | 932,000 | 356,669 | 1,227,000 | (124,469) | ||||||
Options (Collar) - Euro | Currency | EUR | 67,000 | 25,135 | 31,000 | 3,500 | ||||||
NDF - Corn purchase | Commodities | Ton/US$ | 123,172 | (1,376) | 633,565 | (11,729) | ||||||
Total in Parent company | 282,503 | (511,198) | ||||||||||
Interest rate swap - US$ | Interest | US$ | 200,000 | (39,060) | 200,000 | (46,365) | ||||||
Fixed exchange rate - US$ | Currency | US$ | 10,397 | (32) | - | - | ||||||
Fixed exchange rate - Euro | Currency | EUR | 3,308 | 63 | - | - | ||||||
Fixed exchange rate - Pound Sterling | Currency | GBP | 7,592 | 3,265 | - | - | ||||||
Total Consolidated | 246,739 | (557,563) | ||||||||||
Financial instruments not designated as hedge accounting | ||||||||||||
NDF - Iene sale | Currency | JPY | - | - | 6,451,363 | (1,152) | ||||||
NDF - Purchase of US$ | Currency | US$ | 200,000 | (35,381) | 50,000 | (2,350) | ||||||
Currency swap - US$ | Currency | US$ | 650,548 | (567,191) | 250,000 | (977) | ||||||
Currency swap - Euro | Currency | EUR | 27,500 | (27,536) | - | - | ||||||
Interest rate - R$ | Interest | BRL | 50,000 | (134) | 50,000 | (2,341) | ||||||
NDF - Corn purchase | Commodities | Ton/US$ | 309,574 | 20,502 | 54,780 | 2,183 | ||||||
Future - BM&FBovespa | Currency | US$ | 85,000 | (2,542) | 190,000 | 14,641 | ||||||
Future - BM&FBovespa | Commodities | Ton/US$ | 215 | (3,263) | - | - | ||||||
Total in Parent company | (615,545) | 10,004 | ||||||||||
NDF - Purchase of Euro | Currency | EUR | 50,000 | (203) | 150,000 | 1,294 | ||||||
NDF - Pound Sterling sale | Currency | GBP | 15,000 | 2,434 | 20,000 | 1,066 | ||||||
NDF - Argentine Peso sale | Currency | US$ | 5,000 | 137 | 10,000 | 7,984 | ||||||
Total Consolidated | (613,177) | 20,348 | ||||||||||
Total in Parent company | (333,042) | (501,194) | ||||||||||
Total Consolidated | (366,438) | (537,215) | ||||||||||
(1) The market value determination method used by the Company consists of calculating the future value based on the contracted conditions and determining the present value based on market curves, obtained from the database of Bloomberg and BM&FBOVESPA.
67
(CONVENIENCE TRANSLATION INTO ENGLISH FROM THE ORIGINAL PREVIOUSLY ISSUED IN PORTUGUESE)
ITR – Quarterly Information – June 30, 2016 – BRF S.A. Explanatory Notes (in thousands of Brazilian Reais)
|
a. Non-deliverable forwards – NDF
i. Currency non-deliverable forwards - NDF
The position of the currency non-deliverable forward – NDF, by maturity, as well as the weighted average exchange rates and the fair value, are presented as follows:
Parent company and Consolidated | ||||||
06.30.16 | ||||||
PUT | R$ x EUR | |||||
Maturities | Notional (EUR) | Average rate | Fair value | |||
Financial instruments designated as cash flow hedge | ||||||
July 2016 | 13,000 | 4.0851 | 6,622 | |||
August 2016 | 20,000 | 3.8348 | 4,234 | |||
33,000 | 3.9334 | 10,856 | ||||
PUT | US$ x GBP | ARS x US$ | ||||||||||
Maturities | Notional (GBP) | Average rate | Fair value | Notional (US$) | Average rate | Fair value | ||||||
Financial instruments not designated as cash flow hedge | ||||||||||||
August 2016 | - | - | - | 5,000 | 14.2000 | 137 | ||||||
September 2016 | 15,000 | 1.3753 | 2,434 | - | - | - | ||||||
15,000 | 1.3753 | 2,434 | 5,000 | 14.2000 | 137 | |||||||
CALL | US$ x R$ | US$ x EUR | ||||||||||
Maturities | Notional (US$) | Average rate | Fair value | Notional (EUR) | Average rate | Fair value | ||||||
Financial instruments not designated as cash flow hedge | ||||||||||||
September 2016 | 200,000 | 3.4808 | (35,381) | 50,000 | 1.1119 | (203) | ||||||
200,000 | 3.4808 | (35,381) | 50,000 | 1.1119 | (203) | |||||||
ii. Commodities non-deliverable forwards - NDF
The position of the commodities non-deliverable forwards – NFD, by maturity, as well as weighted average exchange rates and fair value, are presented as follows:
Parent company and Consolidated | ||||||
06.30.16 | ||||||
Call | Quantity | Average rate | Fair | |||
Maturities | Ton | US$/Ton | value | |||
Designated as hedge accounting | ||||||
August 2016 | 59,172 | 157.44 | 20 | |||
September 2016 | 17,000 | 150.15 | (218) | |||
October 2016 | 42,000 | 153.71 | (1,018) | |||
November 2016 | 5,000 | 156.13 | (160) | |||
123,172 | 155.11 | (1,376) | ||||
68
(CONVENIENCE TRANSLATION INTO ENGLISH FROM THE ORIGINAL PREVIOUSLY ISSUED IN PORTUGUESE)
ITR – Quarterly Information – June 30, 2016 – BRF S.A. Explanatory Notes (in thousands of Brazilian Reais)
|
PUT | Quantity | Average rate | Fair | |||
Maturities | Ton | US$/Ton | value | |||
Not designated as hedge accounting | ||||||
August 2016 | 239,574 | 168.44 | 18,874 | |||
September 2016 | 70,000 | 153.40 | 1,628 | |||
309,574 | 165.04 | 20,502 |
b. Interest rate and currency swaps
The position of interest rate and currency swaps is presented as follows:
|
|
|
|
|
|
| Parent company | Consolidated | ||||||
06.30.16 | ||||||||||||||
Instrument | Maturity | Assets | Liabilities (Protected risk) | Notional | Fair value | Notional | Fair value | |||||||
Financial instruments designated as cash flow hedge | ||||||||||||||
Interest rate | 01.22.18 | LIBOR 6M + 2.82% p.a. | 5.86% p.a. | 100,000 | (10,745) | 100,000 | (10,745) | |||||||
Interest rate | 06.18.18 | LIBOR 3M + 2.60% p.a. | 5.47% p.a. | 100,000 | (13,560) | 100,000 | (13,560) | |||||||
Interest rate | 02.01.19 | LIBOR 6M + 2.70% p.a. | 5.90% p.a. | - | - | 100,000 | (19,612) | |||||||
Interest rate | 02.01.19 | LIBOR 6M + 2.70% p.a. | 5.88% p.a. | - | - | 100,000 | (19,448) | |||||||
(24,305) | (63,365) | |||||||||||||
Currency swap | 05.22.18 | R$ + 7.75% | US$ + 1.60% | 250,000 | (154,445) | 250,000 | (154,445) | |||||||
(178,750) | (217,810) | |||||||||||||
Financial instruments not designated as cash flow hedge | ||||||||||||||
Interest rate - Bond | 05.22.18 | R$ (Fixed rate of 7.75% p.a.) | 68.84% CDI | 50,000 | (134) | 50,000 | (134) | |||||||
Currency swap | 10.28.16 | US$ + 1,76 % p.a | 86,60% CDI | 100,000 | (112,848) | 100,000 | (112,848) | |||||||
Currency swap | 11.23.16 | US$ + 2,37 % p.a | 91,00% CDI | 50,000 | (53,212) | 50,000 | (53,212) | |||||||
Currency swap | 12.02.16 | US$ + L3M + 0,90 % p.a | 85,95% CDI | 50,000 | (33,575) | 50,000 | (33,575) | |||||||
Currency swap | 12.16.16 | US$ + L3M + 1,10 % p.a | 88,95% CDI | 50,000 | (33,748) | 50,000 | (33,748) | |||||||
Currency swap | 12.23.16 | US$ + 2,41 % p.a | 90,50% CDI | 50,000 | (43,411) | 50,000 | (43,411) | |||||||
Currency swap | 12.29.16 | US$ + 2,43% p.a. | 90,80% CDI | 50,000 | (47,389) | 50,000 | (47,389) | |||||||
Currency swap | 02.16.17 | US$ + 2,30% p.a. | 92,80% CDI | 50,000 | (46,452) | 50,000 | (46,452) | |||||||
Currency swap | 03.03.17 | US$ + 2,70% p.a. | 94,35% CDI | 14,000 | (7,493) | 14,000 | (7,493) | |||||||
Currency swap | 05.22.17 | US$ | 72,20% CDI | 54,438 | (42,921) | 54,438 | (42,921) | |||||||
Currency swap | 05.22.17 | US$ | 73,76% CDI | 29,625 | (24,233) | 29,625 | (24,233) | |||||||
Currency swap | 05.24.17 | US$ | 70,75% CDI | 124,388 | (97,657) | 124,388 | (97,657) | |||||||
Currency swap | 06.06.17 | US$ | 73,00% CDI | 15,234 | (12,334) | 15,234 | (12,334) | |||||||
Currency swap | 07.28.17 | US$ | 72,30% CDI | 12,863 | (11,918) | 12,863 | (11,918) | |||||||
(567,191) | (567,191) | |||||||||||||
Currency swap | 06.05.17 | EURO | 83,03% CDI | 27,500 | (27,536) | 27,500 | (27,536) | |||||||
(27,536) | (27,536) | |||||||||||||
(594,861) | (594,861) | |||||||||||||
69
(CONVENIENCE TRANSLATION INTO ENGLISH FROM THE ORIGINAL PREVIOUSLY ISSUED IN PORTUGUESE)
ITR – Quarterly Information – June 30, 2016 – BRF S.A. Explanatory Notes (in thousands of Brazilian Reais)
|
c. Fixed exchange rate
The position of fixed exchange rate designated as cash flow hedge is presented as follows:
06.30.16 | ||||||||||||||||||||||||
| R$ x US$ | THB x US$ | THB x EUR | THB x GBP | ||||||||||||||||||||
Maturities | Notional US$ | Average US$ | Fair value | Notional US$ | Average US$ | Fair value | Notional EUR | Average EUR | Fair value | Notional GBP | Average GBP | Fair value | ||||||||||||
Designated as hedge accounting | ||||||||||||||||||||||||
July 2016 | 19,000 | 4.1867 | 18,252 | - | - | - | - | - | - | - | - | - | ||||||||||||
August 2016 | 57,000 | 4.1688 | 51,717 | - | - | - | - | - | - | - | - | - | ||||||||||||
October 2016 | - | - | - | - | - | - | - | - | - | 2,310 | 55.1328 | 1,631 | ||||||||||||
December 2016 | - | - | - | 10,280 | 35.3088 | (30) | - | - | - | 4,486 | 51.0185 | 1,438 | ||||||||||||
March 2017 | - | - | - | 107 | 35.2027 | (2) | 1,528 | 39.2700 | (44) | 796 | 50.3800 | 196 | ||||||||||||
April 2017 | - | - | - | - | - | - | 1,780 | 40.3100 | 107 | - | - | - | ||||||||||||
76,000 | 4.1733 | 69,969 | 10,387 | 35.3077 | (32) | 3,308 | 39.8296 | 63 | 7,592 | 52.2034 | 3,265 | |||||||||||||
03.31.16 | ||||||
|
| THB x US$ | ||||
Maturities | Notional US$ | Average US$ | Fair value | |||
Not designated as hedge accounting | ||||||
June 2016 | 10 | 35.3350 | - | |||
10 | 35.3350 | - | ||||
70
(CONVENIENCE TRANSLATION INTO ENGLISH FROM THE ORIGINAL PREVIOUSLY ISSUED IN PORTUGUESE)
ITR – Quarterly Information – June 30, 2016 – BRF S.A. Explanatory Notes (in thousands of Brazilian Reais)
|
d. Options
The Company designates as a cash flow hedge only the variation in the intrinsic value of its options, recognizing the time value of the premium in the financial result. If the hedge is not effective and the option is not exercised due to devaluation of the Brazilian Real, the losses related to the options will be recognized as financial expenses in the statement of income.
The Company has designated transactions involving options denominated collar which is a purchase of a put option ("PUT") and a sale of a call option ("CALL").
When the market price of any of the options is not available in an active market, the fair value is based on an option pricing model (Black-Scholes or Binomial).
Parent company and Consolidated | ||||||||
06.30.16 | ||||||||
R$ x US$ | ||||||||
Type | Maturities | Notional (US$) | Average US$ | Fair value | ||||
Financial instruments designated as cash flow hedge | ||||||||
Collar - Call (Sale) | July 2016 | (229,000) | 4.0636 | (36) | ||||
Collar - Put (Purchase) | July 2016 | 229,000 | 3.6547 | 97,118 | ||||
Collar - Call (Sale) | August 2016 | (209,000) | 4.0701 | (891) | ||||
Collar - Put (Purchase) | August 2016 | 209,000 | 3.6143 | 75,881 | ||||
Collar - Call (Sale) | September 2016 | (199,000) | 4.2014 | (4,413) | ||||
Collar - Put (Purchase) | September 2016 | 199,000 | 3.6355 | 71,352 | ||||
Collar - Call (Sale) | October 2016 | (115,000) | 4.4232 | (910) | ||||
Collar - Put (Purchase) | October 2016 | 115,000 | 3.7383 | 49,995 | ||||
Collar - Call (Sale) | November 2016 | (95,000) | 4.5422 | (1,115) | ||||
Collar - Put (Purchase) | November 2016 | 95,000 | 3.7116 | 37,517 | ||||
Collar - Call (Sale) | December 2016 | (65,000) | 4.7255 | (888) | ||||
Collar - Put (Purchase) | December 2016 | 65,000 | 3.8154 | 30,774 | ||||
Collar - Call (Sale) | January 2017 | (10,000) | 3.7680 | (681) | ||||
Collar - Put (Purchase) | January 2017 | 10,000 | 3.4400 | 1,863 | ||||
Collar - Call (Sale) | February 2017 | (10,000) | 3.8650 | (695) | ||||
Collar - Put (Purchase) | February 2017 | 10,000 | 3.4350 | 1,798 | ||||
- | 356,669 | |||||||
Parent company and Consolidated | ||||||||
06.30.16 | ||||||||
R$ x EUR | ||||||||
Type | Maturities | Notional (EUR) | Average EUR | Fair value | ||||
Financial instruments designated as cash flow hedge | ||||||||
Collar - Call (Sale) | July 2016 | (37,000) | 4.3804 | (1) | ||||
Collar - Put (Purchase) | July 2016 | 37,000 | 4.0108 | 15,641 | ||||
Collar - Call (Sale) | August 2016 | (20,000) | 4.4100 | (15) | ||||
Collar - Put (Purchase) | August 2016 | 20,000 | 4.0000 | 7,763 | ||||
Collar - Call (Sale) | January 2017 | (10,000) | 4.5350 | (452) | ||||
Collar - Put (Purchase) | January 2017 | 10,000 | 3.8600 | 2,199 | ||||
- | 25,135 | |||||||
71
(CONVENIENCE TRANSLATION INTO ENGLISH FROM THE ORIGINAL PREVIOUSLY ISSUED IN PORTUGUESE)
ITR – Quarterly Information – June 30, 2016 – BRF S.A. Explanatory Notes (in thousands of Brazilian Reais)
|
4.2.2 Breakdown of the balances of non-derivative financial instruments
The position of non-derivative financial instruments is presented as follows:
Parent company and Consolidated | ||||||||||||
|
|
|
|
|
| 06.30.16 |
| 12.31.15 | ||||
Hedge Instrument | Hedge object | Reference currency (notional) | Value (notional) | Fair value | Value (notional) | Fair value | ||||||
Financial instruments designated as cash flow hedge | ||||||||||||
Export prepayment - PPEs | Exchange | USD | 300,000 | 962,940 | 300,000 | 1,171,440 | ||||||
Senior unsecured notes - Bonds | Exchange | USD | 300,000 | 962,940 | 300,000 | 1,171,440 | ||||||
600,000 | 1,925,880 | 600,000 | 2,342,880 | |||||||||
(1) Notional converted by Ptax rate in effect at year-end.
a. Export prepayments – PPEs
The position of PPEs is presented as follows:
Parent company and Consolidated | ||||||||||
06.30.16 | ||||||||||
Hedge Instrument | Type of risk hedged | Maturities | Notional | Average rate | Fair value | |||||
Export prepayment - PPE | US$ (E.R.) | 02.2017 to 02.2019 | 300,000 | 1.7796 | 962,940 | |||||
b. Senior unsecured notes – Bonds
The position of bonds designated as cash flow hedges is presented as follows:
Parent company and Consolidated | ||||||||||
06.30.16 | ||||||||||
Hedge Instrument | Type of risk hedged | Maturities | Notional | Average rate | Fair value | |||||
BRF SA BRFSBZ5 | US$ (E.R.) | 06.2022 | 150,000 | 2.0213 | 481,470 | |||||
BRF SA BRFSBZ3 | US$ (E.R.) | 05.2023 | 150,000 | 2.0387 | 481,470 | |||||
300,000 | 2.0300 | 962,940 | ||||||||
4.3. Gains and losses of derivative and non-derivative financial instruments
The unrealized gains and losses of derivative and non-derivative financial instruments designated as cash flow hedges are recorded as a component of other comprehensive income, as set forth below:
72
(CONVENIENCE TRANSLATION INTO ENGLISH FROM THE ORIGINAL PREVIOUSLY ISSUED IN PORTUGUESE)
ITR – Quarterly Information – June 30, 2016 – BRF S.A. Explanatory Notes (in thousands of Brazilian Reais)
|
Shareholders' Equity | |||||||
Parent company | Consolidated | ||||||
06.30.16 | 12.31.15 | 06.30.16 | 12.31.15 | ||||
Derivatives designated as cash flow hedges | |||||||
Foreign exchange risks | 388,332 | (420,649) | 391,629 | (420,649) | |||
Interest risks | (21,375) | (27,725) | (54,882) | (66,597) | |||
Commodity risks | 13,838 | 3,604 | 13,838 | 3,604 | |||
380,795 | (444,770) | 350,585 | (483,642) | ||||
Non derivatives designated as cash flow hedges | |||||||
Foreign exchange risks | (783,000) | (1,200,000) | (783,000) | (1,200,000) | |||
Gross losses | (402,205) | (1,644,770) | (432,415) | (1,683,642) | |||
Deferred taxes on losses | 136,750 | 560,446 | 136,091 | 560,446 | |||
OCI recognized by subsidiaries | (30,869) | (38,872) | - | - | |||
Losses, net of taxes | (296,324) | (1,123,196) | (296,324) | (1,123,196) | |||
Change in gross losses | 1,242,565 | (1,015,188) | 1,251,227 | (1,020,832) | |||
Income taxes on financial instruments adjustments | (423,696) | 346,388 | (424,355) | 346,388 | |||
OCI recognized by subsidiaries | 8,003 | (5,644) | - | - | |||
Impact in other comprehensive income | 826,872 | (674,444) | 826,872 | (674,444) | |||
On June 30, 2016, the realized transactions with derivative and non-derivative financial instruments designated as cash flow hedge resulted in a gain of R$168,933 (loss of R$155,576 as of June 30, 2015), composed by a net gain amounting to R$158,890 (loss of R$139,024 as of June 30, 2015) recorded as gross revenues and a net gain of R$10,043 (loss of R$16,552 as of June 30, 2015) recorded in the financial result.
4.4. Breakdown of financial instruments by category – except derivatives
Parent company | |||||||||||
06.30.16 | |||||||||||
Loans and receivables | Available for sale | Trading securities | Held to maturity | Financial liabilities | Total | ||||||
Assets | |||||||||||
Amortized cost | |||||||||||
Marketable securities | - | - | - | 75,071 | - | 75,071 | |||||
Restricted cash | - | - | - | 517,898 | - | 517,898 | |||||
Trade accounts receivable | 5,995,956 | - | - | - | - | 5,995,956 | |||||
Other credits | 314,303 | - | - | - | - | 314,303 | |||||
Other receivables | 133,354 | - | - | - | - | 133,354 | |||||
Fair value | |||||||||||
Marketable securities | - | 265,640 | 297,884 | - | - | 563,524 | |||||
Liabilities | |||||||||||
Amortized cost | |||||||||||
Trade accounts payable | - | - | - | - | (4,472,113) | (4,472,113) | |||||
Supply chain finance | - | - | - | - | (743,626) | (743,626) | |||||
Loans and financing | |||||||||||
Local currency | - | - | - | - | (6,914,934) | (6,914,934) | |||||
Foreign currency | - | - | - | - | (8,534,985) | (8,534,985) | |||||
Capital lease payable | - | - | - | - | (189,331) | (189,331) | |||||
6,443,613 | 265,640 | 297,884 | 592,969 | (20,854,989) | (13,254,883) | ||||||
73
(CONVENIENCE TRANSLATION INTO ENGLISH FROM THE ORIGINAL PREVIOUSLY ISSUED IN PORTUGUESE)
ITR – Quarterly Information – June 30, 2016 – BRF S.A. Explanatory Notes (in thousands of Brazilian Reais)
|
Parent company | |||||||||||
12.31.15 | |||||||||||
Loans and receivables | Available for sale | Trading securities | Held to maturity | Financial liabilities | Total | ||||||
Assets | |||||||||||
Amortized cost | |||||||||||
Marketable securities | - | - | - | 70,338 | - | 70,338 | |||||
Restricted cash | - | - | - | 479,828 | - | 479,828 | |||||
Trade accounts receivable | 4,952,878 | - | - | - | - | 4,952,878 | |||||
Other credits | 509,606 | - | - | - | - | 509,606 | |||||
Other receivables | 152,965 | - | - | - | - | 152,965 | |||||
Fair value | |||||||||||
Marketable securities | - | 385,700 | 197,807 | - | - | 583,507 | |||||
Liabilities | |||||||||||
Amortized cost | |||||||||||
Trade accounts payable | - | - | - | - | (4,024,725) | (4,024,725) | |||||
Supply chain finance | - | - | - | - | (1,174,594) | (1,174,594) | |||||
Loans and financing | |||||||||||
Local currency | - | - | - | - | (3,819,625) | (3,819,625) | |||||
Foreign currency | - | - | - | - | (9,760,476) | (9,760,476) | |||||
Capital lease payable | - | - | - | - | (186,618) | (186,618) | |||||
5,615,449 | 385,700 | 197,807 | 550,166 | (18,966,038) | (12,216,916) | ||||||
Consolidated | |||||||||||
06.30.16 | |||||||||||
Loans and receivables | Available for sale | Trading securities | Held to maturity | Financial liabilities | Total | ||||||
Assets | |||||||||||
Amortized cost | |||||||||||
Marketable securities | - | - | - | 75,071 | - | 75,071 | |||||
Restricted cash | - | - | 124,180 | 517,898 | - | 642,078 | |||||
Trade accounts receivable | 3,392,646 | - | - | - | - | 3,392,646 | |||||
Other credits | 327,862 | - | - | - | - | 327,862 | |||||
Other receivables | 133,354 | - | - | - | - | 133,354 | |||||
Fair value | |||||||||||
Marketable securities | - | 574,052 | 363,402 | - | - | 937,454 | |||||
Liabilities | |||||||||||
Amortized cost | |||||||||||
Trade accounts payable | - | - | - | - | (5,346,644) | (5,346,644) | |||||
Supply chain finance | - | - | - | - | (743,626) | (743,626) | |||||
Loans and financing | |||||||||||
Local currency | - | - | - | - | (6,914,934) | (6,914,934) | |||||
Foreign currency | - | - | - | - | (10,044,903) | (10,044,903) | |||||
Capital lease payable | - | - | - | - | (190,805) | (190,805) | |||||
3,853,862 | 574,052 | 487,582 | 592,969 | (23,240,912) | (17,732,447) | ||||||
74
(CONVENIENCE TRANSLATION INTO ENGLISH FROM THE ORIGINAL PREVIOUSLY ISSUED IN PORTUGUESE)
ITR – Quarterly Information – June 30, 2016 – BRF S.A. Explanatory Notes (in thousands of Brazilian Reais)
|
Consolidated | |||||||||||
12.31.15 | |||||||||||
Loans and receivables | Available for sale | Trading securities | Held to maturity | Financial liabilities | Total | ||||||
Assets | |||||||||||
Amortized cost | |||||||||||
Marketable securities | - | - | - | 70,338 | - | 70,338 | |||||
Restricted cash | - | - | - | 1,826,102 | - | 1,826,102 | |||||
Trade accounts receivable | 3,880,441 | - | - | - | - | 3,880,441 | |||||
Other credits | 534,497 | - | - | - | - | 534,497 | |||||
Other receivables | 152,965 | - | - | - | - | 152,965 | |||||
Fair value | |||||||||||
Marketable securities | - | 744,849 | 375,562 | - | - | 1,120,411 | |||||
Liabilities | |||||||||||
Amortized cost | |||||||||||
Trade accounts payable | - | - | - | - | (4,744,993) | (4,744,993) | |||||
Supply chain finance | - | - | - | - | (1,174,594) | (1,174,594) | |||||
Loans and financing | |||||||||||
Local currency | - | - | - | - | (3,819,625) | (3,819,625) | |||||
Foreign currency | - | - | - | - | (11,359,658) | (11,359,658) | |||||
Capital lease payable | - | - | - | - | (186,618) | (186,618) | |||||
4,567,903 | 744,849 | 375,562 | 1,896,440 | (21,285,488) | (13,700,734) | ||||||
4.5. Determination of the fair value of financial instruments
The Company discloses its financial assets and liabilities at fair value, based on the appropriate accounting standards, which refer to concepts of valuation and disclosure requirements.
Particularly related to the disclosure, the Company applies the hierarchy requirements set out in CVM Deliberation 699/12, which involves the following aspects:
· The fair value is the price that an asset could be exchanged and a liability could be settled, between knowledgeable willing parties in an arm’s length transaction; and
· Hierarchy on three levels for measurement of the fair value, according to observable inputs for the valuation of an asset or liability on the date of its measurement.
The fair value measurement is based on 3 levels of hierarchy which considers observable and non-observable inputs. Observable inputs reflect market data obtained from independent sources, while non-observable inputs reflect the Company’s valuation methodology. These 2 types of inputs create the hierarchy of fair value set forth below:
· Level 1 – Prices quoted (unadjusted) for identical instruments in active markets. Investments in Credit linked notes, Brazilian foreign debt securities, Financial Treasury Bills (“LFT”) and stocks are classified at Level 1 of the fair value hierarchy.
75
(CONVENIENCE TRANSLATION INTO ENGLISH FROM THE ORIGINAL PREVIOUSLY ISSUED IN PORTUGUESE)
ITR – Quarterly Information – June 30, 2016 – BRF S.A. Explanatory Notes (in thousands of Brazilian Reais)
|
· Level 2 – Prices quoted in active markets for similar instruments, prices quoted for identical or similar instruments in non-active markets and evaluation models for which inputs are observable. Investments in Bank Deposit Certificates (“CDB”) are classified at Level 2, since the determination of fair value is based on the price quotation of similar financial instruments in non-active markets. Readily observable market inputs are used, such as interest rate forecasts, volatility factors and foreign currency rates.
· Level 3 – Instruments whose significant inputs are non-observable.
The table below presents the overall classification of financial assets and liabilities according to the valuation hierarchy. During the six-month period ended June 30, 2016, there were no changes between the 3 levels of hierarchy.
Parent company | |||||||
06.30.16 | |||||||
Level 1 | Level 2 | Level 3 | Total | ||||
Assets | |||||||
Financial assets | |||||||
Stocks | 265,640 | - | - | 265,640 | |||
Held for trading | |||||||
Bank deposit certificates | - | 45,368 | - | 45,368 | |||
Financial treasury bills | 252,516 | - | - | 252,516 | |||
Other financial assets | |||||||
Derivatives designated as hedge accounting | - | 499,314 | - | 499,314 | |||
Derivatives not designated as hedge accounting | - | 20,502 | - | 20,502 | |||
518,156 | 565,184 | - | 1,083,340 | ||||
Liabilities | |||||||
Financial liabilities | |||||||
Other financial liabilities | |||||||
Derivatives designated as hedge accounting | - | (216,811) | - | (216,811) | |||
Derivatives not designated as hedge accounting | - | (636,047) | - | (636,047) | |||
- | (852,858) | - | (852,858) | ||||
Parent company | |||||||
12.31.15 | |||||||
Level 1 | Level 2 | Level 3 | Total | ||||
Assets | |||||||
Financial assets | |||||||
Stocks | 385,700 | - | - | 385,700 | |||
Held for trading | |||||||
Bank deposit certificates | - | 42,545 | - | 42,545 | |||
Financial treasury bills | 155,262 | - | - | 155,262 | |||
Other financial assets | |||||||
Derivatives designated as hedge accounting | - | 98,406 | - | 98,406 | |||
Derivatives not designated as hedge accounting | - | 20,274 | - | 20,274 | |||
540,962 | 161,225 | - | 702,187 | ||||
Liabilities | |||||||
Financial liabilities | |||||||
Other financial liabilities | |||||||
Derivatives designated as hedge accounting | - | (609,604) | - | (609,604) | |||
Derivatives not designated as hedge accounting | - | (10,270) | - | (10,270) | |||
- | (619,874) | - | (619,874) | ||||
76
(CONVENIENCE TRANSLATION INTO ENGLISH FROM THE ORIGINAL PREVIOUSLY ISSUED IN PORTUGUESE)
ITR – Quarterly Information – June 30, 2016 – BRF S.A. Explanatory Notes (in thousands of Brazilian Reais)
|
Consolidated | |||||||
06.30.16 | |||||||
Level 1 | Level 2 | Level 3 | Total | ||||
Assets | |||||||
Financial assets | |||||||
Available for sale | |||||||
Credit linked notes | 252,073 | - | - | 252,073 | |||
Brazilian foreign debt securities | 56,339 | - | - | 56,339 | |||
Stocks | 265,640 | - | - | 265,640 | |||
Held for trading | |||||||
Bank deposit certificates | - | 45,368 | - | 45,368 | |||
Financial treasury bills | 252,516 | - | - | 252,516 | |||
Investment funds | 65,518 | - | - | 65,518 | |||
Other financial assets | |||||||
Derivatives designed as hedge accounting | - | 502,690 | - | 502,690 | |||
Derivatives not designated as hedge accounting | - | 23,073 | - | 23,073 | |||
892,086 | 571,131 | - | 1,463,217 | ||||
Liabilities | |||||||
Financial liabilities | |||||||
Other financial liabilities | |||||||
Derivatives designed as hedge accounting | - | (255,951) | - | (255,951) | |||
Derivatives not designated as hedge accounting | - | (636,250) | - | (636,250) | |||
- | (892,201) | - | (892,201) | ||||
Consolidated | |||||||
12.31.15 | |||||||
Level 1 | Level 2 | Level 3 | Total | ||||
Assets | |||||||
Financial assets | |||||||
Available for sale | |||||||
Credit linked notes | 293,282 | - | - | 293,282 | |||
Brazilian foreign debt securities | 65,867 | - | - | 65,867 | |||
Stocks | 385,700 | - | - | 385,700 | |||
Held for trading | |||||||
Bank deposit certificates | - | 42,545 | - | 42,545 | |||
Financial treasury bills | 155,262 | - | - | 155,262 | |||
Investment funds | 177,755 | - | - | 177,755 | |||
Other financial assets | |||||||
Derivatives designed as hedge accounting | - | 98,406 | - | 98,406 | |||
Derivatives not designated as hedge accounting | - | 30,981 | - | 30,981 | |||
1,077,866 | 171,932 | - | 1,249,798 | ||||
Liabilities | |||||||
Financial liabilities | |||||||
Other financial liabilities | |||||||
Derivatives designed as hedge accounting | - | (655,969) | - | (655,969) | |||
Derivatives not designated as hedge accounting | - | (10,633) | - | (10,633) | |||
- | (666,602) | - | (666,602) | ||||
4.6. Comparison between book value and fair value of financial instruments
Except for the items presented below, the book value of all other financial instruments approximate fair value. The fair value of financial instruments presented below was based on prices observed in active markets, level 1 of the hierarchy for fair value measurement.
77
(CONVENIENCE TRANSLATION INTO ENGLISH FROM THE ORIGINAL PREVIOUSLY ISSUED IN PORTUGUESE)
ITR – Quarterly Information – June 30, 2016 – BRF S.A. Explanatory Notes (in thousands of Brazilian Reais)
|
Parent company and Consolidated | |||||||||
|
| 06.30.16 | 12.31.15 | ||||||
Maturity | Book | Fair | Book | Fair | |||||
BRF bonds | |||||||||
BRF SA BRFSBZ5 | 2022 | (535,429) | (595,249) | (656,068) | (695,203) | ||||
BRF SA BRFSBZ4 | 2024 | (2,384,737) | (2,436,277) | (2,906,435) | (2,718,636) | ||||
BRF SA BRFSBZ3 | 2023 | (1,537,935) | (1,576,002) | (1,881,569) | (1,781,229) | ||||
BRF SA BRFSBZ7 | 2018 | (502,495) | (459,988) | (502,061) | (427,016) | ||||
BRF SA BRFSBZ2 | 2022 | (1,755,612) | (1,750,121) | (2,139,463) | (1,990,770) | ||||
Parent company | (6,716,208) | (6,817,637) | (8,085,596) | (7,612,854) | |||||
BFF bonds | |||||||||
Sadia Overseas BRFSBZ7 | 2020 | (392,559) | (431,854) | (475,299) | (499,662) | ||||
Sadia bonds | |||||||||
Sadia Overseas BRFSBZ6 | 2017 | (364,425) | (374,139) | (443,332) | (461,999) | ||||
Quickfood bonds | |||||||||
Quickfood | 2016 | (175,047) | (175,047) | (285,709) | (285,709) | ||||
Consolidated | (7,648,239) | (7,798,677) | (9,289,936) | (8,860,224) | |||||
4.7. Table of sensitivity analysis
In preparation of the sensitivity analysis, Management considered the derivative financial instruments used to mitigate the currency risk and commodities as relevant risks and could impact the Company's results. The Management believes that fluctuations in interest rates do not significantly affect its financial results, since have opted for fixing through derivative financial instruments (interest rate swap), a considerable part of its post fixed debt.
The table below presents the possible impacts of derivative and non-derivative financial instruments considering scenarios of appreciation and depreciation of the main traded currencies by the Company with respect to its functional currency (Brazilian Real) and changes in corn prices on the Chicago Board of Trade (“CBOT”). The amount of exports utilized corresponds to notional value of derivative financial instruments entered into in order to hedge highly probable transaction.
Quantitative and qualitative information used in preparing these analyzes are based on the position for the period ended June 30, 2016. Future results to be measured may differ significantly from those estimates amounts, if the reality becomes different from the assumptions used.
78
(CONVENIENCE TRANSLATION INTO ENGLISH FROM THE ORIGINAL PREVIOUSLY ISSUED IN PORTUGUESE)
ITR – Quarterly Information – June 30, 2016 – BRF S.A. Explanatory Notes (in thousands of Brazilian Reais)
|
3.2098 | 2.8888 | 2.4074 | 4.0123 | 4.8147 | ||||||||
Parity - Brazilian Reais x U.S. Dollar | Current | Scenario I | Scenario II | Scenario III | Scenario IV | |||||||
Transaction/Instrument | Risk | Scenario | 10% appreciation | 25% appreciation | 25% devaluation | 50% devaluation | ||||||
Financial instruments designated as hedge accouting | ||||||||||||
Fixed exchange rate | Devaluation of R$ | 73,223 | 97,617 | 134,209 | 12,237 | (48,750) | ||||||
Options - currencies | Devaluation of R$ | 423,486 | 722,640 | 1,171,370 | - | 546,337 | ||||||
Export prepayments | Devaluation of R$ | (429,060) | (332,766) | (188,325) | (669,795) | (910,530) | ||||||
Bonds | Devaluation of R$ | (353,940) | (257,646) | (113,205) | (594,675) | (835,410) | ||||||
Swaps | Devaluation of R$ | (145,705) | (106,134) | (46,779) | (244,631) | (343,557) | ||||||
Exports | Appreciation of R$ | (437,117) | (774,039) | (1,279,423) | 80,791 | (371,123) | ||||||
Financial instruments not designated as hedge accouting | ||||||||||||
NDF - Purchase | Appreciation of R$ | (54,195) | (118,391) | (214,685) | 106,295 | 266,785 | ||||||
Dollar Future sales - BM&FBovespa | Devaluation of R$ | - | 27,283 | 68,208 | (68,208) | (136,417) | ||||||
Net effect | (923,308) | (741,436) | (468,630) | (1,377,986) | (1,832,665) | |||||||
Shareholders' equity | (928,705) | (696,546) | (348,309) | (1,509,101) | (2,089,497) | |||||||
Statement of income | 5,397 | (44,890) | (120,321) | 131,115 | 256,832 | |||||||
3.5414 | 3.1873 | 2.6561 | 4.4268 | 5.3121 | ||||||||
Parity - Brazilian Reais x Euro | Current | Scenario I | Scenario II | Scenario III | Scenario IV | |||||||
Transaction/Instrument | Risk | Scenario | 10% appreciation | 25% appreciation | 25% devaluation | 50% devaluation | ||||||
Financial instruments designated as hedge accouting | ||||||||||||
Non-deliverable forward | Devaluation of R$ | 12,936 | 24,622 | 42,152 | (16,281) | (45,497) | ||||||
Currency options | Devaluation of R$ | 29,726 | 53,454 | 89,045 | 967 | 60,286 | ||||||
Exports | Appreciation of R$ | (42,662) | (78,076) | (131,197) | 15,314 | (14,789) | ||||||
Financial instruments not designated as hedge accouting | ||||||||||||
Non-deliverable forward | Devaluation of R$ | (1,380) | (19,087) | (45,647) | 42,887 | 87,154 | ||||||
Net effect | (1,380) | (19,087) | (45,647) | 42,887 | 87,154 | |||||||
Shareholders' equity | - | - | - | - | - | |||||||
Statement of income | (1,380) | (19,087) | (45,647) | 42,887 | 87,154 | |||||||
4.2511 | 3.8260 | 3.1883 | 5.3139 | 6.3767 | ||||||||
Parity - Brazilian Reais x GBP | Current | Scenario I | Scenario II | Scenario III | Scenario IV | |||||||
Transaction/Instrument | Risk | Scenario | 10% appreciation | 25% appreciation | 25% devaluation | 50% devaluation | ||||||
Financial instruments not designated as hedge accouting | ||||||||||||
Non-deliverable forward and Deliverable forward (hedge accouting) | Devaluation of R$ | (2,448) | (8,825) | (18,390) | 13,493 | 29,435 | ||||||
Net effect | (2,448) | (8,825) | (18,390) | 13,493 | 29,435 | |||||||
Statement of income | (2,448) | (8,825) | (18,390) | 13,493 | 29,435 | |||||||
145.70 | 131.13 | 109.27 | 182.12 | 218.55 | ||||||||
Price parity CBOT - US$/Ton | Current | Scenario I | Scenario II | Scenario III | Scenario IV | |||||||
Transaction/Instrument | Risk | Scenario | Decrease 10% | Decrease 25% | Increase 25% | Increase 50% | ||||||
Designated as hedge accounting | ||||||||||||
Non-deliverable forward | Increase in the price of corn | (2,183) | (5,933) | (11,557) | 7,190 | 16,563 | ||||||
Not designated as hedge accounting | ||||||||||||
NDF - Corn purchase | Increase in the price of corn | 19,216 | 33,693 | 55,410 | (16,978) | (53,172) | ||||||
Net effect | 17,033 | 27,760 | 43,853 | (9,788) | (36,609) | |||||||
Shareholders' equity | (2,183) | (5,933) | (11,557) | 7,190 | 16,563 | |||||||
Statement of income | 19,216 | 33,693 | 55,410 | (16,978) | (53,172) |
79
(CONVENIENCE TRANSLATION INTO ENGLISH FROM THE ORIGINAL PREVIOUSLY ISSUED IN PORTUGUESE)
ITR – Quarterly Information – June 30, 2016 – BRF S.A. Explanatory Notes (in thousands of Brazilian Reais)
|
5. SEGMENT INFORMATION
The operating segments are reported consistently with the management reports provided to the main makers of strategic and operational decisions for assessing the performance of each segment and allocating resources.
As disclosed in note 1, in order to reflect the management structure changes the segment information of 2016 and 2015 were prepared considering the seven observable segments,
as follows: Brazil, Latin America (“LATAM”), Europe, Middle East and North of Africa (“MENA”), Africa, Asia and Other Segments, which primarily observe our geographical structure. The information for the period ended June 30, 2015 was prepared in order to be comparable to the information as of June 30, 2016, according to the new segments of the Company.
These segments include sales of all distribution channels and operations are subdivided according to the nature of products whose characteristics are described below:
· Poultry: involves the production and sale of whole poultry and in-natura cuts.
· Pork and other: involves the production and sale of in-natura cuts.
· Processed: involves the production and sale of processed foods, frozen and processed products derived from poultry, pork and beef, margarine, vegetable and soybean-based products.
· Other sales: involves the commercialization of flour for food service and others.
Other segments includes sale of in-natura beef cuts, agricultural products and animal feed.
The net sales for each operating segment are presented below:
80
(CONVENIENCE TRANSLATION INTO ENGLISH FROM THE ORIGINAL PREVIOUSLY ISSUED IN PORTUGUESE)
ITR – Quarterly Information – June 30, 2016 – BRF S.A. Explanatory Notes (in thousands of Brazilian Reais)
|
Consolidated | ||||
Net sales | 06.30.16 | 06.30.15 | ||
Brazil | ||||
In-natura | 1,475,155 | 1,480,327 | ||
Poultry | 1,112,266 | 1,087,699 | ||
Pork and other | 362,889 | 392,628 | ||
Processed | 5,585,176 | 5,898,598 | ||
Other sales | 46,024 | 10,477 | ||
7,106,355 | 7,389,402 | |||
Europe | ||||
In-natura | 902,730 | 617,132 | ||
Poultry | 521,302 | 293,849 | ||
Pork and other | 381,428 | 323,283 | ||
Processed | 1,074,546 | 851,224 | ||
1,977,276 | 1,468,356 | |||
MENA | ||||
In-natura | 2,865,468 | 2,736,065 | ||
Poultry | 2,845,322 | 2,721,833 | ||
Pork and other | 20,146 | 14,232 | ||
Processed | 318,274 | 186,335 | ||
Other sales | 2 | 47 | ||
3,183,744 | 2,922,447 | |||
Africa | ||||
In-natura | 297,368 | 263,897 | ||
Poultry | 241,911 | 214,981 | ||
Pork and other | 55,457 | 48,916 | ||
Processed | 77,944 | 64,823 | ||
375,312 | 328,720 | |||
Asia | ||||
In-natura | 2,005,289 | 1,604,924 | ||
Poultry | 1,734,689 | 1,449,379 | ||
Pork and other | 270,600 | 155,545 | ||
Processed | 243,694 | 38,387 | ||
Other sales | 83,229 | - | ||
2,332,212 | 1,643,311 | |||
|
| |||
LATAM | ||||
In-natura | 317,459 | 302,714 | ||
Poultry | 261,650 | 175,654 | ||
Pork and other | 55,809 | 127,060 | ||
Processed | 623,119 | 521,000 | ||
Other sales | 7,947 | 27,255 | ||
948,525 | 850,969 | |||
Other segments | 711,474 | 357,671 | ||
16,634,898 | 14,960,876 | |||
81
(CONVENIENCE TRANSLATION INTO ENGLISH FROM THE ORIGINAL PREVIOUSLY ISSUED IN PORTUGUESE)
ITR – Quarterly Information – June 30, 2016 – BRF S.A. Explanatory Notes (in thousands of Brazilian Reais)
|
The operating income for each operating segment is presented below:
Consolidated | ||||
06.30.16 | 06.30.15 | |||
Brazil | 536,330 | 781,863 | ||
Europe | 70,425 | 208,771 | ||
MENA | 259,732 | 475,586 | ||
Africa | 27,904 | 49,480 | ||
Asia | 273,449 | 418,962 | ||
LATAM | 34,891 | 11,233 | ||
Other segments | 45,757 | 17,363 | ||
Sub total | 1,248,488 | 1,963,258 | ||
Corporate | (64,686) | (264,537) | ||
1,183,802 | 1,698,721 | |||
The Corporate line presented above refers to extraordinary events not attributable to the operating segments, which are recognized as other operating income (expense). The main events of 2016 are related to losses with tax contingencies. For the period ended in June 30, 2015 the main events were: R$86,467 of equity pick-up of Minerva, R$83,632 of tax contingencies losses and R$41,657 of losses with the strike led by truck drivers.
No customer was individually or in aggregate responsible for more than 5% of net sales for the year ended June 30, 2016 and 2015.
The goodwill and intangible assets with indefinite useful life (trademarks) arising from business combination were allocated to the reportable operating segments, considering the nature of the products manufactured in each segment (cash-generating unit), as presented below:
Consolidated | |||||||||||
Goodwill | Trademarks | Total | |||||||||
06.30.16 | 12.31.15 | 06.30.16 | 12.31.15 | 06.30.16 | 12.31.15 | ||||||
Brazil | 1,151,498 | 1,151,498 | 982,478 | 982,478 | 2,133,976 | 2,133,976 | |||||
Europe | 681,285 | 481,658 | 20,140 | 20,149 | 701,425 | 501,807 | |||||
MENA | 1,405,846 | 834,368 | 170,407 | 170,407 | 1,576,253 | 1,004,775 | |||||
Asia | 749,947 | 78,270 | - | - | 749,947 | 78,270 | |||||
LATAM | 612,913 | 232,308 | 141,670 | 198,984 | 754,583 | 431,292 | |||||
4,601,489 | 2,778,102 | 1,314,695 | 1,372,018 | 5,916,184 | 4,150,120 | ||||||
Information referring to the total assets by operating segments is not being disclosed, as it is not included in the set of information made available to the Company’s Management, which take investment decisions and determine allocation of assets on a consolidated basis.
82
(CONVENIENCE TRANSLATION INTO ENGLISH FROM THE ORIGINAL PREVIOUSLY ISSUED IN PORTUGUESE)
ITR – Quarterly Information – June 30, 2016 – BRF S.A. Explanatory Notes (in thousands of Brazilian Reais)
|
6. BUSINESS COMBINATION
6.1. Business combination
6.1.1. Business combination with Eclipse Holding Cöoperatief UA. (“Eclipse”)
On December 01, 2015, BRF signed a binding offer with Pampa Agribusiness Fund L.P. and Pampa Agribusiness Follow-on Fund L.P. for the acquisition of the total shares issued by Eclipse (“transaction”), a Dutch entity that controls Campo Austral, a group of companies with commercial operations fully integrated in the Argentinian pork’s market, including the cold market.
On April 14, 2016 the conditions precedent were fulfilled, and BRF concluded the first step of the transaction, acquiring 50% of equity interest in the amount of US$39,747 (equivalent to R$139,614), paid in cash. The amount should be further adjusted according to certain conditions set out in the agreement.
On the same date, the amount of US$34,500 was deposited in an escrow account, which will be released to the seller in the second step of the transaction, when BRF will acquire the remaining part of the equity interest, limited to conclude until December 29, 2016.
A preliminary goodwill of R$143,106 was identified in the transaction.
In order to attend the requirements of CVM Deliberation 665/11, BRF will prepare a fair value report of the acquired assets and assumed liabilities in order to allocate the purchase price.
6.1.2. Business combination with Alimentos Calchaquí Productos 7 S.A. (“Calchaquí”)
On March 22, 2016, BRF signed, through its controlled subsidiaries BRF GmbH and BRF Holland B.V., an agreement for the acquisition of the total shares issued by Calchaquí (“transaction”), a traditional Argentine entity, reference in the region´s cold cuts market, and owner of leading brands such as Calchaquí and Bocatti.
On May 10, 2016 the condition precedent were fulfilled and the transaction was concluded in the amount of US$104,700 (equivalent to R$364,112), which should be further adjusted according to certain conditions set out in the agreement. From the total amount of the transaction, US$100,512 (equivalent to R$349,547) was paid in cash, and USD4,188 was transferred to an escrow account which will be released to the seller if certain conditions set out in the agreement are fulfilled.
A preliminary goodwill of R$345,966 was identified in the transaction.
83
(CONVENIENCE TRANSLATION INTO ENGLISH FROM THE ORIGINAL PREVIOUSLY ISSUED IN PORTUGUESE)
ITR – Quarterly Information – June 30, 2016 – BRF S.A. Explanatory Notes (in thousands of Brazilian Reais)
|
In order to attend the requirements of CVM Deliberation 665/11, BRF will prepare a fair value report of the acquired assets and assumed liabilities in order to allocate the purchase price. Management expects to complete this report in 2016, when the final purchase price allocation will be determined as well as its accounting impacts.
6.1.3. Step acquisition – Al Khan Foodstuff LLC (“AKF”)
On July 03, 14, BRF acquired 40% of equity interest of AKF, classifying the investment as a joint venture.
On June 20, 2016, the Company concluded the acquisition of the control of AKF, becoming the beneficiary of 99% of its economic interest. The acquisition of the additional 59% of economic interest in AKF totaled US$32,584 (equivalent to R$110,271)
Such transaction, in compliance with CVM Deliberation No. 665/11, which was approved the technical pronouncement CPC 15 (R1), in their paragraphs 41 and 42, was accounted for as step acquisition. Thus, the carrying amount of the investment prior to this acquisition was measured at fair value generating a gain of R$58,812 recorded as other operating income.
The total of the acquired net assets before the purchase price allocation (equal to the economic interest held) in order to determine the preliminary goodwill is demonstrated below:
Cash - consideration paid for acquiring the control | 110,271 |
Carrying amount of former equity interest of 40% | 58,045 |
Gain generated by the remeasurement of the former equity interest (40%) at fair value | 58,812 |
Fair value of consideration paid at the acquisition date | 227,128 |
Acquired net assets | 56,079 |
Preliminary goodwill | 171,049 |
In order to attend the requirements of CVM Deliberation 665/11, BRF will prepare a fair value report of the acquired assets and assumed liabilities in order to allocate the purchase price. Management expects to complete this report in 2016, when the final purchase price allocation will be determined as well as its accounting impacts.
84
(CONVENIENCE TRANSLATION INTO ENGLISH FROM THE ORIGINAL PREVIOUSLY ISSUED IN PORTUGUESE)
ITR – Quarterly Information – June 30, 2016 – BRF S.A. Explanatory Notes (in thousands of Brazilian Reais)
|
7. CASH AND CASH EQUIVALENTS
Average rate (p.a.) | Parent company | Consolidated | |||||||
06.30.16 | 12.31.15 | 06.30.16 | 12.31.15 | ||||||
Cash and bank accounts | |||||||||
U.S. Dollar | - | 3,412 | 33,523 | 592,628 | 665,550 | ||||
Brazilian Reais | - | 85,373 | 65,212 | 95,297 | 65,302 | ||||
Euro | - | 22,964 | 76,681 | 386,508 | 556,440 | ||||
Other currencies | - | 5,640 | 11,615 | 343,593 | 330,855 | ||||
117,389 | 187,031 | 1,418,026 | 1,618,147 | ||||||
Cash equivalents | |||||||||
In Brazilian Reais | |||||||||
Investment funds | 13.93% | 18,052 | 14,553 | 18,052 | 14,553 | ||||
Savings account | 5.65% | 2,606 | 10,990 | 2,606 | 10,990 | ||||
Bank deposit certificates | 14.18% | 1,788,572 | 449,716 | 1,873,378 | 486,042 | ||||
1,809,230 | 475,259 | 1,894,036 | 511,585 | ||||||
In U.S. Dollar | |||||||||
Term deposit | 1.51% | - | 172,899 | 1,083,301 | 2,785,926 | ||||
Overnight | 0.16% | 416 | 9,896 | 196,169 | 430,492 | ||||
Other currencies | |||||||||
Term deposit | 5.30% | - | - | 39,377 | 16,740 | ||||
416 | 182,795 | 1,318,847 | 3,233,158 | ||||||
1,927,035 | 845,085 | 4,630,909 | 5,362,890 | ||||||
8. MARKETABLE SECURITIES
Average interest rate (p.a.) | Parent company | Consolidated | |||||||||||
WATM(1) | Currency | 06.30.16 | 12.31.15 | 06.30.16 | 12.31.15 | ||||||||
Available for sale | |||||||||||||
Credit linked note(a) | 3.89 | US$ | 3.98% | - | - | 252,073 | 293,282 | ||||||
Brazilian foreign debt securities(b) | 1.84 | US$ | 2.98% | - | - | 56,339 | 65,867 | ||||||
Stocks(f) | - | R$ | - | 265,640 | 385,700 | 265,640 | 385,700 | ||||||
265,640 | 385,700 | 574,052 | 744,849 | ||||||||||
Held for trading | |||||||||||||
Bank deposit certificates ("CDB")(d) | 4.91 | R$ | 13.96% | 45,368 | 42,545 | 45,368 | 42,545 | ||||||
Financial treasury bills(e) | 4.13 | R$ | 14.15% | 252,516 | 155,262 | 252,516 | 155,262 | ||||||
Investment funds(c) | 1.00 | ARS | 19.00% | - | - | 65,518 | 177,755 | ||||||
297,884 | 197,807 | 363,402 | 375,562 | ||||||||||
Held to maturity | |||||||||||||
Financial treasury bills(e) | 1.31 | R$ | 14.15% | 75,071 | 70,338 | 75,071 | 70,338 | ||||||
638,595 | 653,845 | 1,012,525 | 1,190,749 | ||||||||||
Current | 297,884 | 197,807 | 671,814 | 734,711 | |||||||||
Non-current | 340,711 | 456,038 | 340,711 | 456,038 | |||||||||
(1) Weighted average maturity in years.
(2) Maturity within up to September 07, 2017.
85
(CONVENIENCE TRANSLATION INTO ENGLISH FROM THE ORIGINAL PREVIOUSLY ISSUED IN PORTUGUESE)
ITR – Quarterly Information – June 30, 2016 – BRF S.A. Explanatory Notes (in thousands of Brazilian Reais)
|
(a) The credit linked note is a structured operation with a first-class financial institution that bears periodic interest (LIBOR + spread) and corresponds to a credit note that contemplates the Company’s risk.
(b) Brazilian foreign debt securities are denominated in U.S. Dollars and remunerated at pre and post-fixed rates.
(c) The stock balance comprises the market value of 29,000,000 stocks from Minerva (BEEF3).
(d) Bank Deposit Certificate (“CDB”) investments are denominated in Brazilian Reais and remunerated at rates varying from 98% to 100% of the Interbank Deposit Certificate (“CDI”).
(e) Financial Treasury Bills (“LFT”) are remunerated at the rate of the Special System for Settlement and Custody (“SELIC”).
(f) The fund in foreign currency is basically represented of public and private securities.
There were no changes in the characteristics of the marketable securities disclosed above as compared to the information disclosed in the financial statements for the year ended December 31, 2015 (note 8).
The unrealized loss from the change in fair value of the available for sale securities, recorded in other comprehensive income, corresponds to an accumulated loss of R$73,052 net of income tax of R$38,025 as of June 30, 2016 (loss of R$8,466 net of income tax of R$1,987 as of December 31, 2015).
Additionally, on June 30, 2016, of the total of marketable securities, R$61,534 (R$99,264 as of December 31, 2015) were pledged as collateral (without restriction for use) for operations with future contracts denominated in U.S. Dollars and future contracts of corn, traded on the Futures and Commodities Exchange (“BM&FBOVESPA”).
The Company has also restricted cash of R$517,898 in the parent company and R$642,078 in the consolidated on June 30, 2016 (R$479,828 in the parent company and R$1,826,102 in the consolidated on December 31, 2015) (note16).
The Company conducted an analysis of sensitivity to foreign exchange rate (note 4.7).
86
(CONVENIENCE TRANSLATION INTO ENGLISH FROM THE ORIGINAL PREVIOUSLY ISSUED IN PORTUGUESE)
ITR – Quarterly Information – June 30, 2016 – BRF S.A. Explanatory Notes (in thousands of Brazilian Reais)
|
9. TRADE ACCOUNTS RECEIVABLE, NET AND NOTES RECEIVABLE
Parent company | Consolidated | ||||||
06.30.16 | 12.31.15 | 06.30.16 | 12.31.15 | ||||
Trade accounts receivable, net | |||||||
Domestic customers | 1,581,165 | 1,925,827 | 1,581,165 | 1,925,827 | |||
Domestic related parties | 1,666 | 3,015 | 1,666 | 3,015 | |||
Foreign customers | 355,440 | 419,153 | 2,114,942 | 2,146,020 | |||
Foreign related parties | 4,443,369 | 3,030,221 | 110,250 | 250,766 | |||
6,381,640 | 5,378,216 | 3,808,023 | 4,325,628 | ||||
( - ) Adjustment to present value | (9,573) | (13,232) | (9,573) | (13,232) | |||
( - ) Allowance for doubtful accounts | (376,111) | (412,106) | (405,804) | (431,955) | |||
5,995,956 | 4,952,878 | 3,392,646 | 3,880,441 | ||||
Current | 5,981,071 | 4,948,745 | 3,377,761 | 3,876,308 | |||
Non-current | 14,885 | 4,133 | 14,885 | 4,133 | |||
Credit notes | 346,516 | 544,951 | 360,075 | 569,842 | |||
( - ) Adjustment to present value | (314) | (2,982) | (314) | (2,982) | |||
( - ) Allowance for doubtful accounts | (31,899) | (32,363) | (31,899) | (32,363) | |||
314,303 | 509,606 | 327,862 | 534,497 | ||||
Current | 126,572 | 281,516 | 136,137 | 303,716 | |||
Non-current(1) | 187,731 | 228,090 | 191,725 | 230,781 | |||
(1) Weighted average maturity of 3.18 years.
Of the foreign related parties balance recorded in the parent company, R$2,196,297 were transferred in the Certificate of Agribusiness Receivables operation (“CRA”), being R$1,000,000 of the 1st issue occurred on September 29, 2015 an R$1,096,267 of the second issue as disclosed in note 20.1.
On June 30, 2016, notes receivable are comprised mainly by receivables from the (i) sale of Ana Rech assets to JBS, of R$76,882 and (ii) disposal of various other assets and farms, R$231,466.
The trade accounts receivable from related parties refers to transactions carried out with associates UP!, in the domestic market and with joint venture SATS BRF in the foreign market.
The rollforward of allowance for doubtful accounts is presented below:
87
(CONVENIENCE TRANSLATION INTO ENGLISH FROM THE ORIGINAL PREVIOUSLY ISSUED IN PORTUGUESE)
ITR – Quarterly Information – June 30, 2016 – BRF S.A. Explanatory Notes (in thousands of Brazilian Reais)
|
Parent company | Consolidated | ||||||
06.30.16 | 12.31.15 | 06.30.16 | 12.31.15 | ||||
Beginning balance | 412,106 | 98,551 | 431,955 | 107,781 | |||
Additions | 61,884 | 274,281 | 92,816 | 301,441 | |||
Business combination(1) | - | - | 13,565 | - | |||
Reversals | (30,085) | (57,618) | (59,813) | (65,753) | |||
Write-offs | (14,646) | (30,858) | (14,646) | (30,901) | |||
Exchange rate variation | (53,148) | 127,750 | (58,073) | 119,387 | |||
Ending balance | 376,111 | 412,106 | 405,804 | 431,955 | |||
(1) Balance arising from the business combination with Eclipse Holding Cöoperatief UA and GFS Group.
The aging of trade accounts receivable is as follows:
Parent company | Consolidated | ||||||
06.30.16 | 12.31.15 | 06.30.16 | 12.31.15 | ||||
Current | 5,976,074 | 4,902,657 | 3,063,552 | 3,483,359 | |||
Overdue | |||||||
01 to 60 days | 24,158 | 56,088 | 316,447 | 343,216 | |||
61 to 90 days | 4,799 | 7,927 | 25,248 | 30,301 | |||
91 to 120 days | 7,356 | 3,414 | 6,135 | 37,723 | |||
121 to 180 days | 17,718 | 1,922 | 20,053 | 7,027 | |||
181 to 360 days | 13,845 | 61,653 | 22,943 | 70,845 | |||
More than 361 days | 337,690 | 344,555 | 353,645 | 353,157 | |||
( - ) Adjustment to present value | (9,573) | (13,232) | (9,573) | (13,232) | |||
( - ) Allowance for doubtful accounts | (376,111) | (412,106) | (405,804) | (431,955) | |||
5,995,956 | 4,952,878 | 3,392,646 | 3,880,441 | ||||
10. INVENTORIES
Parent company | Consolidated | ||||||
06.30.16 | 12.31.15 | 06.30.16 | 12.31.15 | ||||
Finished goods | 1,721,612 | 1,437,670 | 3,162,081 | 2,601,130 | |||
Work in process | 172,679 | 141,780 | 200,962 | 157,807 | |||
Raw materials | 722,319 | 568,957 | 817,542 | 620,734 | |||
Packaging materials | 54,361 | 54,605 | 79,851 | 83,567 | |||
Secondary materials | 250,700 | 304,750 | 288,858 | 341,687 | |||
Spare parts | 143,337 | 129,902 | 186,911 | 173,113 | |||
Imports in transit | 81,399 | 143,757 | 108,675 | 154,769 | |||
Other | 4,163 | 14,751 | 9,293 | 14,751 | |||
(-) Provision for adjustment to realizable value | (21,241) | (1,596) | (47,408) | (19,959) | |||
(-) Provision for deterioration | (30,350) | (49,480) | (34,498) | (49,618) | |||
(-) Provision for obsolescense | (7,748) | (8,878) | (7,974) | (12,182) | |||
(-) Adjustment to present value | (39,394) | (32,888) | (39,394) | (32,888) | |||
3,051,837 | 2,703,330 | 4,724,899 | 4,032,911 | ||||
The write-offs of products sold from inventories to cost of sales during the six months ended on June 30, 2016 totaled R$10,726,669 in the parent company and R$12,685,915 in the consolidated (R$9,343,238 in the parent company and R$10,272,597 in the consolidated as of June 30, 2015). Such amounts include theadditions and reversals of inventory provisions presented in the table below:
88
(CONVENIENCE TRANSLATION INTO ENGLISH FROM THE ORIGINAL PREVIOUSLY ISSUED IN PORTUGUESE)
ITR – Quarterly Information – June 30, 2016 – BRF S.A. Explanatory Notes (in thousands of Brazilian Reais)
|
Parent company | |||||||
Provision for adjustment to realizable value | Provision for deterioration | Provision for obsolescence | Total | ||||
06.30.16 | |||||||
Beginning balance | (1,596) | (49,480) | (8,878) | (59,954) | |||
Additions | (19,815) | (12,711) | (740) | (33,266) | |||
Reversals | 170 | - | - | 170 | |||
Write-offs | - | 31,841 | 1,870 | 33,711 | |||
Ending balance | (21,241) | (30,350) | (7,748) | (59,339) | |||
Consolidated | |||||||
Provision for adjustment to realizable value | Provision for deterioration | Provision for obsolescence | Total | ||||
06.30.16 | |||||||
Beginning balance | (19,959) | (49,618) | (12,182) | (81,759) | |||
Additions | (39,496) | (14,909) | (967) | (55,372) | |||
Reversals | 10,471 | - | - | 10,471 | |||
Write-offs | - | 33,640 | 2,998 | 36,638 | |||
Exchange rate variation | 1,576 | (3,611) | 2,177 | 142 | |||
Ending balance | (47,408) | (34,498) | (7,974) | (89,880) | |||
On June 30, 2016 and 2015, there were no inventory items pledged as collateral for rural credit operations.
11. BIOLOGICAL ASSETS
The current and non-current balances of biological assets are presented below:
Parent company | Consolidated | ||||||
06.30.16 | 12.31.15 | 06.30.16 | 12.31.15 | ||||
Live animals | 1,617,440 | 1,322,317 | 1,646,538 | 1,329,861 | |||
Total current | 1,617,440 | 1,322,317 | 1,646,538 | 1,329,861 | |||
Live animals | 582,498 | 530,114 | 608,809 | 530,869 | |||
Forests | 235,166 | 230,153 | 235,166 | 230,153 | |||
Total non-current | 817,664 | 760,267 | 843,975 | 761,022 | |||
2,435,104 | 2,082,584 | 2,490,513 | 2,090,883 | ||||
Live animals are represented for poultry and pork and separated into consumable and for production. There were no changes in classification of nature of biological assets as compared to the information disclosed in the financial statements for the year ended December 31, 2015 (note 11).
89
(CONVENIENCE TRANSLATION INTO ENGLISH FROM THE ORIGINAL PREVIOUSLY ISSUED IN PORTUGUESE)
ITR – Quarterly Information – June 30, 2016 – BRF S.A. Explanatory Notes (in thousands of Brazilian Reais)
|
The rollforward of biological assets for the period is presented below:
Parent company | ||||||||||||||
Current | Non-current | |||||||||||||
Live animals | Live animals | Forests |
| Total | ||||||||||
Poultry |
| Pork |
| Total | Poultry |
| Pork | |||||||
06.30.16 | 06.30.16 | |||||||||||||
Beginning balance | 587,918 | 734,399 | 1,322,317 | 294,175 | 235,939 | 230,153 | 760,267 | |||||||
Acquisition | 120,965 | 788,146 | 909,111 | 18,191 | 89,031 | 20,254 | (2) | 127,476 | ||||||
Fair value variation(1) | 856,993 | 105,884 | 962,877 | 40,435 | (30,898) | - | 9,537 | |||||||
Harvest | - | - | - | - | - | (15,152) | (15,152) | |||||||
Write-off | - | - | - | - | - | (89) | (89) | |||||||
Transfer between current and non-current | 31,606 | 32,769 | 64,375 | (31,606) | (32,769) | - | (64,375) | |||||||
Transfer to inventories | (850,215) | (791,025) | (1,641,240) | - | - | - | - | |||||||
Ending balance | 747,267 | 870,173 | 1,617,440 | 321,195 | 261,303 | 235,166 | 817,664 | |||||||
Consolidated | ||||||||||||||
Current | Non-current | |||||||||||||
Live animals | Live animals | Forests |
| Total | ||||||||||
Poultry |
| Pork |
| Total | Poultry |
| Pork | |||||||
06.30.16 | 06.30.16 | |||||||||||||
Beginning balance | 595,462 | 734,399 | 1,329,861 | 294,930 | 235,939 | 230,153 | 761,022 | |||||||
Acquisition | 121,027 | 788,146 | 909,173 | 22,557 | 89,031 | 20,254 | (2) | 131,842 | ||||||
Business combination(3) | - | 17,870 | 17,870 | 24,008 | 5,780 | - | 29,788 | |||||||
Fair value variation(1) | 877,104 | 105,203 | 982,307 | 38,632 | (30,928) | - | 7,704 | |||||||
Harvest | - | - | - | - | - | (15,152) | (15,152) |
| ||||||
Write-off | - | - | - | - | - | (89) | (89) |
| ||||||
Transfer between current and non-current | 31,606 | 32,769 | 64,375 | (31,606) | (32,769) | - | (64,375) |
| ||||||
Transfer to sale | - | - | - | (2,129) | - | - | (2,129) |
| ||||||
Transfer to inventories | (864,180) | (791,025) | (1,655,205) | - | - | - | - | |||||||
Exchange variation | (2,906) | 1,063 | (1,843) | (4,980) | 344 | - | (4,636) | |||||||
Ending balance | 758,113 | 888,425 | 1,646,538 | 341,412 | 267,397 | 235,166 | 843,975 | |||||||
(1) The fair value variance of biological assets includes depreciation of breeding stock in the amount of R$307,361 (R$543,605 as of December 31, 2015) in the parent company and R$318,737 (R$545,033 as of December 31, 2015) in the consolidated.
(2) Transfer from property, plant and equipment of R$20,254 in the parent company and consolidated.
(3) Balance arising from the business combination with Eclipse Holding Cöoperatief UA (pork) and GFS Group (poultry).
The quantities and balances per category of live animals are presented below:
Parent company | |||||||
06.30.16 | 12.31.15 | ||||||
Quantity | Value | Quantity | Value | ||||
Consumable biological assets | |||||||
Immature poultry | 183,529 | 747,267 | 177,488 | 587,918 | |||
Immature pork | 3,644 | 870,173 | 3,545 | 734,399 | |||
Total current | 187,173 | 1,617,440 | 181,033 | 1,322,317 | |||
Production biological assets | |||||||
Immature poultry | 6,559 | 115,758 | 6,618 | 108,209 | |||
Mature poultry | 11,299 | 205,437 | 11,382 | 185,966 | |||
Immature pork | 179 | 57,694 | 184 | 51,188 | |||
Mature pork | 395 | 203,609 | 385 | 184,751 | |||
Total non-current | 18,432 | 582,498 | 18,569 | 530,114 | |||
205,605 | 2,199,938 | 199,602 | 1,852,431 | ||||
90
(CONVENIENCE TRANSLATION INTO ENGLISH FROM THE ORIGINAL PREVIOUSLY ISSUED IN PORTUGUESE)
ITR – Quarterly Information – June 30, 2016 – BRF S.A. Explanatory Notes (in thousands of Brazilian Reais)
|
Consolidated | |||||||
06.30.16 | 12.31.15 | ||||||
Quantity | Value | Quantity | Value | ||||
Consumable biological assets | |||||||
Immature poultry | 186,376 | 758,113 | 179,990 | 595,462 | |||
Immature pork | 3,739 | 888,425 | 3,545 | 734,399 | |||
Total current | 190,115 | 1,646,538 | 183,535 | 1,329,861 | |||
Production biological assets | |||||||
Immature poultry | 6,793 | 123,672 | 6,658 | 108,837 | |||
Mature poultry | 11,810 | 217,740 | 11,418 | 186,093 | |||
Immature pork | 181 | 58,587 | 184 | 51,188 | |||
Mature pork | 403 | 208,810 | 385 | 184,751 | |||
Total non-current | 19,187 | 608,809 | 18,645 | 530,869 | |||
209,302 | 2,255,347 | 202,180 | 1,860,730 | ||||
12. RECOVERABLE TAXES
Parent company | Consolidated | ||||||
06.30.16 | 12.31.15 | 06.30.16 | 12.31.15 | ||||
State ICMS ("VAT") | 1,366,128 | 1,119,761 | 1,469,969 | 1,219,662 | |||
PIS and COFINS ("Federal Taxes to Social Fund Programs") | 348,849 | 397,785 | 355,591 | 397,841 | |||
Income and social contribution tax (IR/CS) | 342,455 | 359,787 | 414,609 | 416,562 | |||
IPI ("Federal VAT") | 59,478 | 60,137 | 59,483 | 60,137 | |||
INSS ("Brazilian Social Security") | 258,320 | 146,162 | 258,396 | 146,234 | |||
Other | 58,711 | 97,296 | 115,684 | 131,471 | |||
(-) Provision for losses | (178,304) | (164,606) | (183,378) | (171,443) | |||
2,255,637 | 2,016,322 | 2,490,354 | 2,200,464 | ||||
Current | 1,027,035 | 1,074,175 | 1,237,580 | 1,231,759 | |||
Non-current | 1,228,602 | 942,147 | 1,252,774 | 968,705 | |||
The rollforward of the provision for losses is presented below:
Parent company | |||||||||||
State ICMS ("VAT") | PIS and COFINS ("Federal Taxes to Social Fund Programs") | Income and social contribution tax | IPI ("Federal VAT") | Other | Total | ||||||
|
|
|
|
|
|
|
|
|
| 06.30.16 | |
Beginning balance | (113,892) | (25,074) | (8,985) | (14,740) | (1,915) | (164,606) | |||||
Additions | (19,408) | - | - | - | (35) | (19,443) | |||||
Write-offs | 4,851 | 893 | - | - | 1 | 5,745 | |||||
Ending balance | (128,449) | (24,181) | (8,985) | (14,740) | (1,949) | (178,304) | |||||
Consolidated | |||||||||||
State ICMS ("VAT") | PIS and COFINS ("Federal Taxes to Social Fund Programs") | Income and social contribution tax | IPI ("Federal VAT") | Other | Total | ||||||
|
|
|
|
|
|
|
|
|
| 06.30.16 | |
Beginning balance | (113,893) | (25,074) | (9,029) | (14,740) | (8,707) | (171,443) | |||||
Additions | (19,408) | (177) | - | - | (224) | (19,809) | |||||
Write-offs | 4,851 | 893 | - | - | 202 | 5,946 | |||||
Exchange rate variation | - | - | - | - | 1,928 | 1,928 | |||||
Ending balance | (128,450) | (24,358) | (9,029) | (14,740) | (6,801) | (183,378) | |||||
91
(CONVENIENCE TRANSLATION INTO ENGLISH FROM THE ORIGINAL PREVIOUSLY ISSUED IN PORTUGUESE)
ITR – Quarterly Information – June 30, 2016 – BRF S.A. Explanatory Notes (in thousands of Brazilian Reais)
|
13. DISCONTINUED OPERATIONS
13.1. Discontinued operations
On July 01, 2015, BRF concluded with Lactalis (“buyer”), the disposal of its manufacturing facilities of dairy segment, being such segment classified as discontinued until the date of transaction conclusion.
The statements of income and cash flows from discontinued operations that represent the dairy segment performance of dairy segment in the period of six-months ended June 30, 2015 are disclosed as follows:
STATEMENTS OF CASH FLOWS
| Parent company | Consolidated | ||
| 06.30.15 | 06.30.15 | ||
| Net Sales | 983,535 | 1,122,764 | |
| Cost of Sales | (786,821) | (905,752) | |
| Gross Profit | 196,714 | 217,012 | |
| Operating Income (Expenses) | |||
Selling | (160,261) | (188,199) | |
General and Administrative | (9,191) | (13,477) | |
Other Operating Expenses, net | (11,071) | (20,682) | |
| Income from Associates and Joint Ventures | (19,465) | (1,876) | |
| Income (Loss) Before Financial Results | (3,274) | (7,222) | |
Financial Expenses | - | (292) | |
Financial Income | - | 10 | |
| Income (Loss) Before Taxes | (3,274) | (7,504) | |
| Income and Social Contribution Taxes | (3,798) | (8,507) | |
| Deferred Income Tax | - | 8,939 | |
| Net income (Loss) from Discontinued Operations | (7,072) | (7,072) |
92
(CONVENIENCE TRANSLATION INTO ENGLISH FROM THE ORIGINAL PREVIOUSLY ISSUED IN PORTUGUESE)
ITR – Quarterly Information – June 30, 2016 – BRF S.A. Explanatory Notes (in thousands of Brazilian Reais)
|
STATEMENTS OF CASH FLOWS
| Parent company | Consolidated | ||
| 06.30.15 | 06.30.15 | ||
| Net profit from discontinued operations | (7,072) | (7,072) | |
| Adjustments to reconcile net income to net cash provided by discontinued | |||
| operations | |||
| Depreciation and amortization | 76 | 4,035 | |
| Equity pick-up | 19,465 | 1,876 | |
| Deferred income tax | - | (8,939) | |
| Changes in operating assets and liabilities: | |||
| Trade accounts receivable | - | 81,622 | |
| Inventories | - | (67,504) | |
| Trade accounts payable | - | (54,600) | |
| Other rights and obligations | 15,838 | 53,002 | |
| Net cash provided by discontinued operating activities | 28,307 | 2,420 | |
| Investing activities from discontinued operations | |||
| Capital increase in subsidiaries | (20,038) | - | |
| Additions to property, plant and equipment | (8,269) | (12,305) | |
| Net cash used investing activities from discontinued operations | (28,307) | (12,305) | |
| Proceeds from debt issuance | - | 10,038 | |
| Advance for future capital increase | 10,000 | ||
| Net cash (used in) provided by financing activities from discontinued operations | - | 20,038 | |
| Net increase in cash and cash equivalents | - | 10,153 | |
| Net cash provided by discontinued operations | - | 10,153 |
93
(CONVENIENCE TRANSLATION INTO ENGLISH FROM THE ORIGINAL PREVIOUSLY ISSUED IN PORTUGUESE)
ITR – Quarterly Information – June 30, 2016 – BRF S.A. Explanatory Notes (in thousands of Brazilian Reais)
|
14.1. Deferred income and social contribution taxes
Parent company | Consolidated | ||||||
06.30.16 | 12.31.15 | 06.30.16 | 12.31.15 | ||||
Assets | |||||||
Tax loss carryforwards (corporate income tax) | 932,898 | 1,008,022 | 1,007,437 | 1,077,653 | |||
Negative calculation basis (social contribution tax) | 368,846 | 399,886 | 368,969 | 400,092 | |||
Temporary differences | |||||||
Provisions for tax, civil and labor risks | 240,721 | 216,564 | 244,204 | 220,047 | |||
Suspended collection taxes | 20,952 | 62,954 | 20,952 | 62,954 | |||
Allowance for doubtful accounts | 99,135 | 112,251 | 100,004 | 113,120 | |||
Provision for property, plant and equipment losses | 6,643 | 5,546 | 6,643 | 5,546 | |||
Provision for tax credits | 56,969 | 52,260 | 57,579 | 52,803 | |||
Provision for other obligations | 60,690 | 91,834 | 62,910 | 93,744 | |||
Employees' profit sharing | 2,321 | 87,254 | 2,321 | 87,254 | |||
Provision for inventory losses | 20,227 | 19,985 | 20,227 | 19,985 | |||
Employees' benefits plan | 108,351 | 101,675 | 108,351 | 101,675 | |||
Business combination - Sadia(1) | 390,116 | 451,222 | 390,116 | 451,222 | |||
Unrealized losses on derivatives financial instruments | 221,631 | 105,359 | 221,631 | 105,359 | |||
Provision for losses - other debtors | 11,837 | 11,321 | 11,837 | 11,321 | |||
Estimated annual effective tax rate - CPC 21 | 258,429 | - | 258,429 | - | |||
Other temporary differences | 80,133 | 77,280 | 97,509 | 85,110 | |||
2,879,899 | 2,803,413 | 2,979,119 | 2,887,885 | ||||
Liabilities | |||||||
Temporary differences | |||||||
Business combination - Sadia(1) | (710,196) | (719,374) | (710,196) | (719,374) | |||
Business combination - other companies(2) | - | - | (50,816) | (21,588) | |||
Unrealized gains on derivatives | (5,305) | (28,035) | (5,305) | (28,035) | |||
Difference between tax basis and accounting basis of goodwill amortization | (230,528) | (206,770) | (230,528) | (206,770) | |||
Difference between tax depreciation rate and accounting depreciation rate (useful life) | (651,068) | (601,040) | (651,068) | (601,040) | |||
Other temporary differences | (162,100) | 686 | (170,581) | (55,102) | |||
(1,759,197) | (1,554,533) | (1,818,494) | (1,631,909) | ||||
Total net deferred tax assets | 1,120,702 | 1,248,880 | 1,160,625 | 1,255,976 | |||
Business combination - Dánica and Avex | - | - | (8,029) | (12,474) | |||
Business combination - AFC | - | - | (35,709) | (45,164) | |||
Business combination - AKF | - | - | (4,609) | (5,870) | |||
Business combination - Federal Foods | - | - | (7,926) | (10,228) | |||
Business combination - Invicta | - | - | (32,883) | (50,067) | |||
Other - exchange variation | - | - | (86,985) | (64,517) | |||
- | - | (176,141) | (188,320) | ||||
Total deferred tax | 1,120,702 | 1,248,880 | 984,484 | 1,067,656 | |||
(1) The deferred tax asset on the business combination with Sadia is mainly computed on the difference between the accounting and tax basis of goodwill determined in the purchase price allocation. Deferred tax liabilities on business combinations Sadia are substantially represented by the fair value of property, plant and equipment, trademarks and contingent liabilities.
(2) Deferred tax asset related to the business combinations with Quickfood (Trademarks, Customer relationship, Fixed assets reevaluation) and AFC (Customer relationship).
The rollforward of deferred tax is set forth below:
94
(CONVENIENCE TRANSLATION INTO ENGLISH FROM THE ORIGINAL PREVIOUSLY ISSUED IN PORTUGUESE)
ITR – Quarterly Information – June 30, 2016 – BRF S.A. Explanatory Notes (in thousands of Brazilian Reais)
|
Parent company | Consolidated | ||||||
06.30.16 | 12.31.15 | 06.30.16 | 12.31.15 | ||||
Beginning balance | 1,248,880 | 751,932 | 1,067,656 | 623,831 | |||
Deferred income and social contribution taxes recognized in the statement of income | 258,580 | 372,283 | 260,235 | 406,587 | |||
Deferred income and social contribution taxes - write-off dairy business | - | (200,617) | - | (200,617) | |||
Deferred income and social contribution taxes recognized in other comprehensive income | (386,758) | 327,387 | (388,049) | 328,090 | |||
Business combination | - | - | (4,736) | (39,240) | |||
Exchange variation over deferred income and social contribution taxes related to business combination | - | - | 41,038 | (30,266) | |||
Other | - | (2,105) | 8,340 | (20,729) | |||
Ending balance | 1,120,702 | 1,248,880 | 984,484 | 1,067,656 | |||
Parte inferior do formulárioCertain subsidiaries of the Company have tax loss carryforwards and negative basis of social contribution of R$16,352 and R$16,169, respectively, (R$16,365 and R$16,181 as of December 31, 2015), for which no deferred tax asset was recorded. If there was an expectation that such tax credits would be realized the amount to be recognized in the balance sheet would be R$5,543 (R$5,547 as of December 31, 2015).
14.2. Estimated time of realization
Deferred tax arising from temporary differences that will be realized as they are settled or realized. The period of the settlement or realization of such differences would not be properly estimated and is tied to several factors that are not under control of Management.
When assessing the likelihood of the realization of deferred tax assets on income tax loss carryforward and negative calculation bases of social contribution tax, Management considers the Company’s budget, strategic plan and projected taxable income. Based on this estimate, Management believes that it is probable that the deferred tax will be realized, as shown below:
Parent company | Consolidated | ||
2016 | 155,995 | 160,513 | |
2017 | 221,438 | 236,136 | |
2018 | 294,633 | 310,135 | |
2019 | 342,229 | 358,016 | |
2020 onwards | 287,449 | 311,606 | |
1,301,744 | 1,376,406 |
95
(CONVENIENCE TRANSLATION INTO ENGLISH FROM THE ORIGINAL PREVIOUSLY ISSUED IN PORTUGUESE)
ITR – Quarterly Information – June 30, 2016 – BRF S.A. Explanatory Notes (in thousands of Brazilian Reais)
|
14.3. Income and social contribution taxes reconciliation
Parent company | Consolidated | ||||||
06.30.16 | 06.30.15 | 06.30.16 | 06.30.15 | ||||
Income before taxes from continued operations | 54,979 | 925,628 | 75,820 | 934,550 | |||
Nominal tax rate | 34% | 34% | 34% | 34% | |||
Expected tax expense at nominal tax rate | (18,693) | (314,714) | (25,779) | (317,747) | |||
Reconciling itens: | |||||||
Equity interest in income of subsidiaries, associates and joint venture | (219,769) | 328,741 | 5,687 | (24,081) | |||
Exchange rate variation on foreign investments | (202,799) | 88,076 | (215,638) | 119,561 | |||
Difference of tax rates on results of foreign subsidiaries | - | - | (235,274) | 324,480 | |||
Interest on shareholders' equity | 174,493 | 144,792 | 174,493 | 144,792 | |||
Penalties | (1,528) | (2,212) | (1,528) | (2,217) | |||
Investment grant | 17,227 | 18,389 | 17,227 | 18,389 | |||
Estimated annual effective tax rate - CPC 21 | 258,429 | (349,596) | 258,429 | (349,596) | |||
Other permanent differences | 7,329 | (13,019) | 5,104 | (13,949) | |||
14,689 | (99,543) | (17,279) | (100,368) | ||||
Current income tax | (243,891) | 3,798 | (277,514) | (9,744) | |||
Deferred income tax | 258,580 | (103,341) | 260,235 | (90,624) | |||
The taxable income, current and deferred income tax from foreign subsidiaries is presented below:
Consolidated | |||
06.30.16 | 06.30.15 | ||
Taxable income (loss) from foreign subsidiaries | (680,336) | 1,038,675 | |
Current income tax credit (expense) from foreign subsidiaries | (32,012) | (12,603) | |
Deferred income tax from foreign subsidiaries | 1,004 | 91 | |
The Company has determined that the earnings recorded by the holdings of its wholly-owned subsidiaries located abroad will not be redistributed.
Such resources will be used for investments in the subsidiaries, and thus no deferred income tax was recognized. The total of undistributed earnings corresponds to R$3,561,426 as of June 30, 2016 (R$4,949,957 as of December 31, 2015).
Brazilian income taxes are subject to review for a 5-year period, during which the tax authorities might audit and assess the Company for additional taxes and penalties. Subsidiaries located abroad are taxed in their respective jurisdictions, according to local regulations.
15. JUDICIAL DEPOSITS
The rollforward of the judicial deposits is presented below:
96
(CONVENIENCE TRANSLATION INTO ENGLISH FROM THE ORIGINAL PREVIOUSLY ISSUED IN PORTUGUESE)
ITR – Quarterly Information – June 30, 2016 – BRF S.A. Explanatory Notes (in thousands of Brazilian Reais)
|
Parent company | |||||||
Tax | Labor | Civil, commercial and other | Total | ||||
06.30.16 | |||||||
Beginning balance | 376,660 | 304,942 | 43,722 | 725,324 | |||
Additions | 26,333 | 67,445 | 3,642 | 97,420 | |||
Reversals | (404) | (7,293) | (3,934) | (11,631) | |||
Write-offs | - | (26,806) | (2,770) | (29,576) | |||
Price index update | 19,921 | 18,678 | 2,206 | 40,805 | |||
Ending balance | 422,510 | 356,966 | 42,866 | 822,342 | |||
Consolidated | |||||||
Tax | Labor | Civil, commercial and other | Total | ||||
06.30.16 | |||||||
Beginning balance | 376,667 | 311,319 | 44,120 | 732,106 | |||
Additions | 26,333 | 69,229 | 3,642 | 99,204 | |||
Business combination(1) | 124 | 36 | - | 160 | |||
Reversals | (808) | (7,293) | (2,770) | (10,871) | |||
Write-offs | - | (26,806) | (3,935) | (30,741) | |||
Price index update | 20,343 | 18,679 | 2,206 | 41,228 | |||
Exchange rate variation | - | (2,062) | - | (2,062) | |||
Ending balance | 422,659 | 363,102 | 43,263 | 829,024 | |||
(1) Balance arising from the business combination with Eclipse Holding Cöopertief UA.
16. RESTRITED CASH
Average interest rate (p.a.) | Parent company | Consolidated | |||||||||||
Maturity(1) | Currency | 06.30.16 | 12.31.15 | 06.30.16 | 12.31.15 | ||||||||
Bank deposit certificates(2) | 0.99 | R$ | 13.96% | 359,737 | 337,041 | 359,737 | 337,041 | ||||||
National treasury certificates(3) | 3.72 | R$ | 24.22% | 158,161 | 142,787 | 158,161 | 142,787 | ||||||
Bank deposit(4) | - | US$ | - | - | - | 124,180 | 1,346,274 | ||||||
517,898 | 479,828 | 642,078 | 1,826,102 | ||||||||||
Current | 58,000 | - | 182,180 | 1,346,274 | |||||||||
Non-current | 459,898 | 479,828 | 459,898 | 479,828 | |||||||||
(1) Weighted average maturity in years.
(2) Deposit with maturity in 2017, which was pledged as collateral in the disposal of the dairy segment to Groupe Lactalis (“Parmalat”).
(3) The national treasury certificates, which mature on 2020, are pledged as collateral for the loan obtained through the Special Program Asset Restructuring (“PESA”) (note 20).
(4) Deposit related to the business combination with Alimentos Calchaquí Productos 7 S.A. and Eclipse Holding Cöoperatief UA (note 6).
97
(CONVENIENCE TRANSLATION INTO ENGLISH FROM THE ORIGINAL PREVIOUSLY ISSUED IN PORTUGUESE)
ITR – Quarterly Information – June 30, 2016 – BRF S.A. Explanatory Notes (in thousands of Brazilian Reais)
|
17. INVESTMENTS IN SUBSIDIARIES, ASSOCIATES AND JOINT VENTURES
17.1. Investments breakdown
Parent company | Consolidated | ||||||
06.30.16 | 12.31.15 | 06.30.16 | 12.31.15 | ||||
Investment in subsidiaries and associates | 5,152,608 | 6,918,123 | 68,089 | 102,465 | |||
Goodwill Quickfood | 204,950 | 290,884 | - | - | |||
Goodwill SATS BRF | - | - | 5,900 | 6,838 | |||
Goodwill AKF | - | - | - | 75,113 | |||
5,357,558 | 7,209,007 | 73,989 | 184,416 | ||||
Other investments | 1,107 | 1,107 | 1,372 | 1,476 | |||
5,358,665 | 7,210,114 | 75,361 | 185,892 | ||||
98
(CONVENIENCE TRANSLATION INTO ENGLISH FROM THE ORIGINAL PREVIOUSLY ISSUED IN PORTUGUESE)
ITR – Quarterly Information – June 30, 2016 – BRF S.A. Explanatory Notes (in thousands of Brazilian Reais)
|
17.2. Summary of financial information of associates
Avipal Centro Oeste S.A. | BRF | Establec. Levino Zaccardi | K&S Alimentos S.A(1) | PSA Labor. Veter. Ltda. | Quickfood S.A. | Sadia Alimentos S.A. | Sadia International Ltd. | Sadia Uruguay S.A. | Sadia Overseas S.A. | VIP S.A. Empr. e | |||||||||||
06.30.16 | 06.30.16 | 06.30.16 | 06.30.16 | 06.30.16 | 06.30.16 | 06.30.16 | 06.30.16 | 06.30.16 | 06.30.16 | 06.30.16 | |||||||||||
Current assets | - | 540,025 | 492 | 29,192 | 3,760 | 239,871 | 12,111 | 1,831 | 17,545 | 1,321 | 55,638 | ||||||||||
Non-current assets | - | 4,948,744 | 1 | 6,758 | 2,634 | 170,907 | 117,100 | 232,577 | 198,345 | 289,852 | 797 | ||||||||||
Current liabilities | - | (393,503) | (324) | (773) | (563) | (338,804) | (15,252) | (1,827) | (5,101) | (364,425) | (1,630) | ||||||||||
Non-current liabilities | - | (541,721) | (36) | - | - | (135,146) | (8,365) | - | - | - | (26) | ||||||||||
Shareholders' equity | - | (4,553,545) | (133) | (35,177) | (5,831) | 63,172 | (105,594) | (232,581) | (210,789) | 73,252 | (54,779) | ||||||||||
Net revenues | - | 4,451 | - | - | - | 623,416 | 1,087 | - | 17,831 | - | - | ||||||||||
Net income (loss) | (38) | (607,790) | 22 | 1,708 | 267 | (64,396) | (8,358) | 20,098 | (11,102) | (3,578) | 2,017 | ||||||||||
12.31.15 | 12.31.15 | 12.31.15 | 12.31.15 | 12.31.15 | 12.31.15 | 12.31.15 | 12.31.15 | 12.31.15 | 12.31.15 | 12.31.15 | |||||||||||
Current assets | 38 | 1,983,779 | 694 | - | 3,627 | 376,754 | 15,566 | 1,761 | 22,563 | 16,754 | 53,216 | ||||||||||
Non-current assets | - | 4,985,251 | 105 | - | 2,497 | 215,704 | 171,536 | 264,059 | 295,004 | 341,238 | 1,090 | ||||||||||
Current liabilities | - | (24,150) | (614) | - | (560) | (358,517) | (15,790) | (2,182) | (9,503) | (3,027) | (1,518) | ||||||||||
Non-current liabilities | - | (736,469) | (22) | - | - | (248,232) | (12,928) | - | - | (440,306) | (25) | ||||||||||
Shareholders' equity | (38) | (6,208,411) | (163) | - | (5,564) | 14,291 | (158,384) | (263,638) | (308,064) | 85,341 | (52,763) | ||||||||||
Net revenues | - | 15,514 | - | - | - | 1,326,887 | 66 | - | 35,658 | - | - | ||||||||||
Net income (loss) | - | 2,094,392 | (1,107) | - | 550 | (43,418) | (15,230) | 5,956 | 85,345 | (19,819) | 5,907 |
(1) On March 18, 2016, the Company acquired control and total shares, being treated as wholly-owned subsidiary from this date.
99
(CONVENIENCE TRANSLATION INTO ENGLISH FROM THE ORIGINAL PREVIOUSLY ISSUED IN PORTUGUESE)
ITR – Quarterly Information – June 30, 2016 – BRF S.A. Explanatory Notes (in thousands of Brazilian Reais)
|
17.3. Rollforward of the interest in subsidiaries and associates – Parent company
Subsidiaries | Associates | ||||||||||||||||||||||||||||||||
Avipal Centro Oeste S.A. | BRF GmbH | Establec. Levino Zaccardi | K&S Alimentos S.A.(1) | PSA Labor. Veter. Ltda | Quickfood S.A. | Sadia Alimentos S.A. | Sadia International Ltd. | Sadia Uruguay S.A. | Sadia Overseas S.A. | VIP S.A. Empr. e Particip. Imob | K&S Alimentos S.A.(1) | PP-BIO | PR-SAD | UP! Alimentos Ltda | Total | ||||||||||||||||||
06.30.16 | 12.31.15 | ||||||||||||||||||||||||||||||||
a) Capital share as of June 30, 2016 | |||||||||||||||||||||||||||||||||
% of share | 100.00% | 100.00% | 98.26% | 100.00% | 99.99% | 90.05% | 43.10% | 100.00% | 94.90% | 100.00% | 100.00% | 0.00% | 33.33% | 33.33% | 50.00% | ||||||||||||||||||
Total number of shares and membership interests | 6,963,854 | 1 | 100 | 27,664,086 | 5,463,850 | 36,469,606 | 594,576,682 | 900 | 2,444,753,091 | 50,000 | 14,249,459 | - | - | - | 1,000 | ||||||||||||||||||
Number of shares and membership interest held | 6,963,854 | 1 | 98 | 27,664,086 | 5,463,849 | 32,841,224 | 256,253,695 | 900 | 2,319,989,778 | 50,000 | 14,249,459 | - | - | - | 500 | ||||||||||||||||||
b) Information as of June 30, 2016 | |||||||||||||||||||||||||||||||||
Capital stock | 5,972 | 6,719 | 1,420 | 27,664 | 5,564 | 28,117 | 257,336 | 2,889 | 262,582 | 3 | 40,061 | - | - | - | 1 | ||||||||||||||||||
Shareholders' equity | - | 4,553,545 | 133 | 35,177 | 5,831 | (63,172) | 105,594 | 232,581 | 210,789 | (73,252) | 54,779 | - | - | - | 24,725 | ||||||||||||||||||
Fair value adjustments of assets and liabilities acquired | - | - | - | - | - | 86,064 | - | - | - | - | - | - | - | - | - | ||||||||||||||||||
Goodwill based on expectation of future profitability | - | - | - | - | - | 118,886 | - | - | - | - | - | - | - | - | - | ||||||||||||||||||
Income (loss) for the period | (38) | (607,790) | 22 | 1,708 | 267 | (64,396) | (8,358) | 20,098 | (11,102) | (3,578) | 2,017 | 4,687 | - | - | 24,724 | ||||||||||||||||||
c) Balance of investments as of June 30, 2016 | |||||||||||||||||||||||||||||||||
Beginning balance | 38 | 6,208,415 | 160 | - | 5,561 | 290,884 | 68,203 | 263,637 | 292,344 | - | 52,761 | 21,911 | 1,664 | 3,428 | 1 | 7,209,007 | 3,998,880 | ||||||||||||||||
Equity pick-up | (38) | (607,790) | 22 | 1,708 | 267 | (57,989) | (3,602) | 20,098 | (10,535) | (3,578) | 2,017 | 2,297 | - | - | 12,362 | (644,761) | 1,994,569 | ||||||||||||||||
Unrealized profit in inventory | - | - | - | - | - | 853 | 38 | - | - | - | - | - | - | - | - | 891 | 8,644 | ||||||||||||||||
Exchange rate variation on goodwill in the acquisiton of non-controlling entities | - |
| 3,474 |
| - |
| - |
| - |
| - |
| - |
| - |
| - |
| - |
| - |
| - |
| - |
| - |
| - |
| 3,474 |
| (5,016) |
Exchange rate variation on goodwill | - |
| - |
| - |
| - |
| - |
| (83,426) |
| - |
| - |
| - |
| - |
| - |
| - |
| - |
| - |
| - |
| (83,426) |
| (14,087) |
Goodwill | - | - | - | - | - | (2,508) | - | - | - | - |
| - | - |
| - |
| - |
| - |
| (2,508) |
| (7,206) | ||||||||||
Exchange rate variation on foreign investments | - | (505,402) | - | - | - | - | - | (50,943) | (55,790) | 15,667 | - | - | - | - | - | (596,468) | 1,099,891 | ||||||||||||||||
Other comprehensive income | - | (539,434) | (51) | - | - | 13,203 | (19,141) | (211) | (25,986) | - | (1) | - | - | - | - | (571,621) | 220,588 | ||||||||||||||||
Increase / decrease in capital | - | - | - | - | - | - | - | - | - | - | - | - | 150 | 480 | - | 630 | 620,138 | ||||||||||||||||
Acquisition of non-controlling interest | - | - | - | - | - | - | - | - | - | - | - | - | - | - | - | - | (259,101) | ||||||||||||||||
Appreciation in exchange of shares | - | 1,234 | - | - | - | - | - | - | - | - | - | - | - | - | - | 1,234 | 111,247 | ||||||||||||||||
Dividends and interests on shareholders' equity | - | - | - | - | - | - | - | - | - | - | - | - | - | - | - | - | (67,197) | ||||||||||||||||
Write-off of investment | - | - | - | 24,208 | - | - | - | - | - | - | - | (24,208) | - | - | - | - | - | ||||||||||||||||
Loss of ownership interest | - | - | - | - | - | - | - | - | - | - | - | - | - | - | - | - | (2,696) | ||||||||||||||||
Write-off of investment | - | - | - | - | - | - | - | - | - | - | - | - | - | - | - | - | (247,282) | ||||||||||||||||
Acquisition of equity interest | - | - | - | 9,262 | - | - | - | - | - | - | - | - | - | - | - | 9,262 | - | ||||||||||||||||
Impairment losses for investments | - | - | - | - | - | 43,933 | - | - | - | (12,089) | - | - | - | - | - | 31,844 | 56,623 | ||||||||||||||||
Transfer to held for sale and discontinued operations | - | - | - | - | - | - | - | - | - | - | - | - | - | - | - | - | (298,988) | ||||||||||||||||
- | 4,560,497 | 131 | 35,178 | 5,828 | 204,950 | 45,498 | 232,581 | 200,033 | - | 54,777 | - | 1,814 | 3,908 | 12,363 | 5,357,558 | 7,209,007 | |||||||||||||||||
(1) On March 18, 2016, the Company acquired control and total shares, being treated as wholly-owned subsidiary from this date.
The losses related to exchange rate variation on the investments in foreign subsidiaries, whose functional currency is Brazilian Reais, totaled R$634,228 on June 30, 2016 (gain of R$351,647 as of June 30, 2015) and were recognized as financial income.
On June 30, 2016, these subsidiaries, associates and joint ventures do not have any significant restriction to transfer dividends or repay their loans or advances to the Company.
100
(CONVENIENCE TRANSLATION INTO ENGLISH FROM THE ORIGINAL PREVIOUSLY ISSUED IN PORTUGUESE)
ITR – Quarterly Information – June 30, 2016 – BRF S.A. Explanatory Notes (in thousands of Brazilian Reais)
|
17.4. Summary of financial information of associates
K&S(1) | Minerva | Nutrifont | PP-BIO | PR-SAD | UP! | Total | |||||||||||||||||
06.30.16 | 12.31.15 | 12.31.15 | 12.31.15 | 06.30.16 | 12.31.15 | 06.30.16 | 12.31.15 | 06.30.16 | 12.31.15 | 06.30.16 | 12.31.15 | ||||||||||||
Current assets | - | 54,679 | - | - | - | - | - | - | 74,376 | 79,250 | |||||||||||||
Non-current assets | - | 13,211 | - | - | 5,442 | 4,992 | 11,724 | 10,284 | 195 | 217 | |||||||||||||
Current liabilities | - | (22,293) | - | - | - | - | - | - | (49,846) | (79,466) | |||||||||||||
Non-current liabilities | - | (882) | - | - | - | - | - | - | - | - | |||||||||||||
Shareholder's equity | - | 44,715 | - | - | 5,442 | 4,992 | 11,724 | 10,284 | 24,725 | 1 | |||||||||||||
% of participation | 0.00% |
| 49.00% | 15.11% | 50.00% | 33.33% |
| 33.33% | 33.33% |
| 33.33% | 50.00% |
| 50.00% | |||||||||
Book value of investment | - | 21,911 | - | - | 1,814 | 1,664 | 3,908 | 3,428 | 12,363 | 1 | |||||||||||||
Transfer to held for sale | - | - | - | - | - | - | - | - | - | - | |||||||||||||
Book value of investment | - | 21,911 | - | - | 1,814 | 1,664 | 3,908 | 3,428 | 12,363 | 1 | 18,085 | 27,004 | |||||||||||
Dividends declared | - | 1,365 | - | - | - | - | - | - | - | 25,994 | - | 27,359 | |||||||||||
K&S(1) | Minerva | Nutrifont | PP-BIO | PR-SAD | UP! | ||||||||||||||||||
06.30.16 | 06.30.15 | 06.30.15 | 06.30.15 | 06.30.16 | 06.30.15 | 06.30.16 | 06.30.15 | 06.30.16 | 06.30.15 | ||||||||||||||
Net revenues | 24,843 | 63,655 | 2,572,183 | - | - | - | - | - | 93,065 | 92,804 | |||||||||||||
Net income (loss) | 4,687 | 10,310 | (530,797) | - | - | - | - | - | 24,724 | 22,959 | |||||||||||||
Equity pick-up | 2,297 | 5,050 | (86,467) | (1,301) | - | - | - | - | 12,362 | 11,480 | |||||||||||||
Transfer to held for sale | - | - | - | 1,301 | - | - | - | - | - | - | |||||||||||||
Equity pick-up | 2,297 | 5,050 | (86,467) | - | - | - | - | - | 12,362 | 11,480 | 14,659 | (69,937) | |||||||||||
(1) On March 18, 2016, the Company acquired control and total shares, being treated as wholly-owned subsidiary from this date.
101
(CONVENIENCE TRANSLATION INTO ENGLISH FROM THE ORIGINAL PREVIOUSLY ISSUED IN PORTUGUESE)
ITR – Quarterly Information – June 30, 2016 – BRF S.A. Explanatory Notes (in thousands of Brazilian Reais)
|
17.5. Summary of financial information of joint venture
AKF(1) | SATS BRF | Total | ||||||||||
06.30.16 | 12.31.15 | 06.30.16 | 12.31.15 | 06.30.16 | 12.31.15 | |||||||
Assets | ||||||||||||
Current | - | 138,208 | 184,573 | 253,452 | ||||||||
Cash and cash equivalents | - | 27,549 | 42,566 | 84,148 | ||||||||
Prepaid expenses | - | 1,642 | 2,053 | 386 | ||||||||
Other current assets | - | 109,017 | 139,954 | 168,918 | ||||||||
Non-current | - | 9,122 | 11,269 | 14,414 | ||||||||
Liabilities | ||||||||||||
Current | - | (105,290) | (93,794) | (145,547) | ||||||||
Trade accounts payable | - | (4,514) | (60,540) | (126,931) | ||||||||
Tax payable | - | (5,989) | - | - | ||||||||
Other current liabilities | - | (94,787) | (33,254) | (18,616) | ||||||||
Non-current | - | (3,228) | - | - | ||||||||
Deferred taxes | - | (3,228) | - | - | ||||||||
Shareholder's equity | - | 38,812 | 102,048 | 122,319 | ||||||||
% of equity interest | 0.00% | 40.00% | 49.00% | 49.00% | ||||||||
Book value of investment | - | 15,525 | 50,004 | 59,936 | 50,004 | 75,461 | ||||||
AKF | SATS BRF | Total | ||||||||||
06.30.16 | 06.30.15 | 06.30.16 | 06.30.15 | 06.30.16 | 06.30.15 | |||||||
Net sales | 223,634 | 148,512 | 343,783 | - | ||||||||
Depreciation and amortization | (657) | (730) | (863) | - | ||||||||
Financial expense | - | (301) | (855) | - | ||||||||
Income before taxes | 9,024 | 7,156 | (3,148) | - | ||||||||
Net income (loss) | 9,024 | 7,156 | (3,148) | - | ||||||||
% of equity interest | 40.00% |
| 40.00% | 49.00% | 0.00% | |||||||
Equity pick-up | 3,610 | 2,862 | (1,543) | - | 2,067 | 2,862 | ||||||
(1) On June 20, 2016, the Company acquired control, being treated as indirect subsidiary and consequently consolidated.
102
(CONVENIENCE TRANSLATION INTO ENGLISH FROM THE ORIGINAL PREVIOUSLY ISSUED IN PORTUGUESE)
ITR – Quarterly Information – June 30, 2016 – BRF S.A. Explanatory Notes (in thousands of Brazilian Reais)
|
18. PROPERTY, PLANT AND EQUIPMENT, NET
Property, plant and equipment rollforward is presented below:
Parent company | |||||||||||||
Weighted average depreciation rate (p.a.) | 12.31.15 | Additions | Disposals | Reversals | Transfers(1) | 06.30.16 | |||||||
Cost | |||||||||||||
Land | - | 593,601 | 12 | (27) | - | (3,806) | 589,780 | ||||||
Buildings and improvements | - | 5,084,454 | 15,743 | (4,867) | - | 85,608 | 5,180,938 | ||||||
Machinery and equipment | - | 6,534,819 | 82,920 | (50,713) | - | 372,436 | 6,939,462 | ||||||
Facilities | - | 1,699,013 | 192 | (1,980) | - | 119,832 | 1,817,057 | ||||||
Furniture | - | 112,947 | 153 | (1,090) | - | 5,387 | 117,397 | ||||||
Vehicles | - | 16,801 | - | (884) | - | (2,660) | 13,257 | ||||||
Construction in progress | - | 715,832 | 717,132 | - | - | (613,020) | 819,944 | ||||||
Advances to suppliers | - | 4,156 | 28,897 | - | - | (20,093) | 12,960 | ||||||
14,761,623 | 845,049 | (59,561) | - | (56,316) | 15,490,795 | ||||||||
Depreciation | |||||||||||||
Buildings and improvements | 3.04% | (1,477,380) | (72,925) | 1,134 | - | 6,043 | (1,543,128) | ||||||
Machinery and equipment | 5.89% | (2,576,709) | (196,422) | 41,934 | - | (2,094) | (2,733,291) | ||||||
Facilities | 3.73% | (530,384) | (36,742) | 1,293 | - | (357) | (566,190) | ||||||
Furniture | 7.96% | (47,185) | (4,530) | 889 | - | 24 | (50,802) | ||||||
Vehicles | 19.94% | (9,200) | (391) | 602 | - | 2,546 | (6,443) | ||||||
(4,640,858) | (311,010) | 45,852 | - | 6,162 | (4,899,854) | ||||||||
Provision for losses | (19,779) | - | - | 184 | - | (19,595) | |||||||
10,100,986 | 534,039 | (13,709) | 184 | (50,154) | 10,571,346 | ||||||||
(1) Refers to the transfer of R$27,374 to intangible assets, R$20,254 to biological assets (forests) and R$2,526 to assets held for sale.
103
(CONVENIENCE TRANSLATION INTO ENGLISH FROM THE ORIGINAL PREVIOUSLY ISSUED IN PORTUGUESE)
ITR – Quarterly Information – June 30, 2016 – BRF S.A. Explanatory Notes (in thousands of Brazilian Reais)
|
Consolidated | |||||||||||||||||
Weighted average depreciation rate (p.a.) | 12.31.15 | Additions | Business combinations(2) | Disposals | Reversals | Transfers(1) | Exchange rate variation | 06.30.16 | |||||||||
Cost | |||||||||||||||||
Land | - | 584,721 | 23 | 33,150 | (129) | - | (3,806) | (11,668) | 602,291 | ||||||||
Buildings and improvements | - | 5,437,937 | 17,515 | 164,359 | (4,868) | - | 85,609 | (92,315) | 5,608,237 | ||||||||
Machinery and equipment | - | 7,027,145 | 87,928 | 290,430 | (49,950) | - | 359,400 | (159,553) | 7,555,400 | ||||||||
Facilities | - | 1,854,467 | 338 | 53,154 | (1,982) | - | 121,705 | (34,420) | 1,993,262 | ||||||||
Furniture | - | 137,869 | 2,033 | 11,918 | (1,341) | - | 4,470 | (4,525) | 150,424 | ||||||||
Vehicles | - | 20,317 | 28 | 10,635 | (1,970) | - | 252 | (816) | 28,446 | ||||||||
Construction in progress | - | 789,782 | 848,647 | 4,693 | - | - | (624,343) | (41,985) | 976,794 | ||||||||
Advances to suppliers | - | 18,760 | 28,745 | 238 | - | - | (20,093) | (656) | 26,994 | ||||||||
15,870,998 | 985,257 | 568,577 | (60,240) | - | (76,806) | (345,938) | 16,941,848 | ||||||||||
Depreciation | |||||||||||||||||
Buildings and improvements | 3.04% | (1,525,943) | (82,054) | (75,952) | 1,136 | - | 6,331 | 26,871 | (1,649,611) | ||||||||
Machinery and equipment | 5.86% | (2,786,003) | (223,401) | (155,499) | 42,667 | - | (1,316) | 72,602 | (3,050,950) | ||||||||
Facilities | 3.79% | (549,890) | (41,047) | (29,316) | 1,295 | - | (357) | 7,553 | (611,762) | ||||||||
Furniture | 7.97% | (64,652) | (5,855) | (8,258) | 1,151 | - | 238 | 7,700 | (69,676) | ||||||||
Vehicles | 20.06% | (8,979) | (1,353) | (8,620) | 1,514 | - | 2,540 | 694 | (14,204) | ||||||||
(4,935,467) | (353,710) | (277,645) | 47,763 | - | 7,436 | 115,420 | (5,396,203) | ||||||||||
Provision for losses | (19,779) | - | - | - | 184 | - | - | (19,595) | |||||||||
10,915,752 | 631,547 | 290,932 | (12,477) | 184 | (69,370) | (230,518) | 11,526,050 | ||||||||||
(1) Refers to the transfer of R$87,812 to intangible assets, R$20,254 to biological assets (forests) and R$17,048 to assets held to sale.
(2) Balance arising from business combination with AKF, Alimentos Calchaquí Productos 7 S.A., Eclipse Holding Cöoperatief UA, GFS Group, K&S and Universal Meats (UK).
104
(CONVENIENCE TRANSLATION INTO ENGLISH FROM THE ORIGINAL PREVIOUSLY ISSUED IN PORTUGUESE)
ITR – Quarterly Information – June 30, 2016 – BRF S.A. Explanatory Notes (in thousands of Brazilian Reais)
|
The Company has fully depreciated items that are still operating, which are set forth below:
Parent company | Consolidated | ||||||
06.30.16 | 12.31.15 | 06.30.16 | 12.31.15 | ||||
Cost |
|
|
|
|
| ||
Buildings and improvements | 114,138 | 166,614 |
| 119,301 | 169,995 | ||
Machinery and equipment | 630,904 | 704,822 |
| 665,048 | 752,458 | ||
Facilities | 69,111 | 96,273 |
| 72,750 | 102,017 | ||
Furniture | 15,418 | 15,994 |
| 21,207 | 19,338 | ||
Vehicles | 4,011 | 3,500 |
| 4,756 | 4,166 | ||
Others | 52,253 | 56,185 |
| 52,253 | 56,185 | ||
885,835 | 1,043,388 |
| 935,315 | 1,104,159 | |||
During the six-month period ended June 30, 2016, the Company capitalized interest in the amount of R$18,882 in the parent company and in the consolidated (R$9,408 in the parent company and R$9,562 in the consolidated in June 30, 2015). The weighted average interest rate utilized to determine the capitalized amount was 5.82% p.a. in the parent company and 5.86% in the consolidated (5.86% p.a. in the parent company and 6.06% p.a. in the consolidated in June 30, 2015).
On June 30, 2016, except for the built to suit agreement mentioned in note 24.2, the Company had no commitments assumed related to acquisition or construction of property, plant and equipment items.
The property, plant and equipment items that are pledged as collateral for various transactions are presented below:
|
| Parent company and Consolidated | ||||
| 06.30.16 | 12.31.15 | ||||
Type of collateral | Book value of the collateral | Book value of the collateral | ||||
Land | Financial/Tax | 280,686 | 217,427 | |||
Buildings and improvements | Financial/Tax | 1,727,823 | 1,522,478 | |||
Machinery and equipment | Financial/Labor/Tax/Civil | 2,527,075 | 1,774,781 | |||
Facilities | Financial/Tax | 762,577 | 493,103 | |||
Furniture | Financial/Tax | 26,443 | 27,004 | |||
Vehicles | Financial/Tax | 834 | 2,306 | |||
Others | Financial/Tax | 83,486 | 70,083 | |||
5,408,924 | 4,107,182 | |||||
105
(CONVENIENCE TRANSLATION INTO ENGLISH FROM THE ORIGINAL PREVIOUSLY ISSUED IN PORTUGUESE)
ITR – Quarterly Information – June 30, 2016 – BRF S.A. Explanatory Notes (in thousands of Brazilian Reais)
|
19. INTANGIBLES
The intangible assets rollforward is set forth below:
| Parent company | ||||||||||
Weighted average amortization rate (p.a.) | 12.31.15 | Additions | Disposals | Transfers | 06.30.16 | ||||||
Cost | |||||||||||
Non-compete agreement | - | - | 10,382 | (277) | - | 10,105 | |||||
Goodwill | - | 2,096,587 | - | - | - | 2,096,587 | |||||
Ava | - | 49,368 | - | - | - | 49,368 | |||||
Eleva Alimentos | - | 808,140 | - | - | - | 808,140 | |||||
Incubatório Paraíso | - | 656 | - | - | - | 656 | |||||
Paraíso Agroindustrial | - | 16,751 | - | - | - | 16,751 | |||||
Perdigão Mato Grosso | - | 7,636 | - | - | - | 7,636 | |||||
Sadia | - | 1,214,036 | - | - | - | 1,214,036 | |||||
Outgrowers relationship | - | 14,197 | 506 | - | - | 14,703 | |||||
Trademarks | - | 1,173,000 | - | - | - | 1,173,000 | |||||
Patents | - | 3,720 | 2,250 | - | - | 5,970 | |||||
Software | - | 404,673 | 35,017 | (28,471) | 27,514 | 438,733 | |||||
3,692,177 | 48,155 | (28,748) | 27,514 | 3,739,098 | |||||||
Amortization | |||||||||||
Non-compete agreement | 42.34% | - | (1,890) | 277 | - | (1,613) | |||||
Outgrowers relationship | 12.50% | (5,777) | (932) | - | - | (6,709) | |||||
Patents | 17.82% | (2,092) | (573) | - | - | (2,665) | |||||
Software | 20.00% | (232,751) | (51,344) | 28,590 | (140) | (255,645) | |||||
(240,620) | (54,739) | 28,867 | (140) | (266,632) | |||||||
3,451,557 | (6,584) | 119 | 27,374 | 3,472,466 | |||||||
106
(CONVENIENCE TRANSLATION INTO ENGLISH FROM THE ORIGINAL PREVIOUSLY ISSUED IN PORTUGUESE)
ITR – Quarterly Information – June 30, 2016 – BRF S.A. Explanatory Notes (in thousands of Brazilian Reais)
|
| Consolidated | ||||||||||||||
Weighted average amortization rate (p.a.) | 12.31.15 | Additions | Disposals | Business combination(1) | Transfers | Exchange rate variation | 06.30.16 | ||||||||
Cost | |||||||||||||||
Non-compete agreement | - | 15,738 | 10,382 | (277) | - | - | (4,532) | 21,311 | |||||||
Goodwill | - | 2,778,102 | - | - | 2,358,148 | 42,404 | (577,165) | 4,601,489 | |||||||
AKF | - | - | - | - | 128,645 | 42,404 | - | 171,049 | |||||||
Alimentos Calchaquí | - | - | - | - | 345,966 | - | (35,663) | 310,303 | |||||||
Ava | - | 49,368 | - | - | - | - | - | 49,368 | |||||||
Avex | - | 27,550 | - | - | - | - | (7,936) | 19,614 | |||||||
BRF AFC | - | 196,063 | - | - | - | - | (33,990) | 162,073 | |||||||
BRF Invicta | - | 170,776 | - | - | - | - | (45,348) | 125,428 | |||||||
Dánica | - | 7,013 | - | - | - | - | (2,020) | 4,993 | |||||||
Eclipse Holding Cooperatief | - | - | - | - | 143,106 | - | (14,751) | 128,355 | |||||||
Eleva Alimentos | - | 808,140 | - | - | - | - | - | 808,140 | |||||||
Federal Foods | - | 84,419 | - | - | - | - | (15,016) | 69,403 | |||||||
GFS Group | - | - | - | - | 1,079,357 | - | (230,121) | 849,236 | |||||||
GQFE - Golden Quality Foods Europe | - | - | - | - | 3,108 | - | (629) | 2,479 | |||||||
Incubatório Paraíso | - | 656 | - | - | - | - | - | 656 | |||||||
Invicta Food Group | - | 925 | - | - | - | - | (246) | 679 | |||||||
Paraíso Agroindustrial | - | 16,751 | - | - | - | - | - | 16,751 | |||||||
Perdigão Mato Grosso | - | 7,636 | - | - | - | - | - | 7,636 | |||||||
Plusfood | - | 27,786 | - | - | - | - | (4,640) | 23,146 | |||||||
Quickfood | - | 166,983 | - | - | - | - | (48,097) | 118,886 | |||||||
Sadia | - | 1,214,036 | - | - | - | - | - | 1,214,036 | |||||||
Qatar National Import and Export Co | - | - | - | - | 564,242 | - | (114,807) | 449,435 | |||||||
Universal Meats Ltd. | - | - | - | - | 93,724 | - | (23,901) | 69,823 | |||||||
Import quotas | - | 62,233 | - | - | - | - | (16,526) | 45,707 | |||||||
Outgrowers relationship | - | 14,197 | 506 | - | - | - | - | 14,703 | |||||||
Trademarks | - | 1,372,018 | - | - | - | - | (57,323) | 1,314,695 | |||||||
Patents | - | 4,870 | 2,250 | - | - | 2 | (62) | 7,060 | |||||||
Customer relationship | - | 620,853 | - | - | - | 18,437 | (136,830) | 502,460 | |||||||
Supplier relationship | - | 9,670 | - | (6,510) | - | - | (1,168) | 1,992 | |||||||
Software | - | 462,760 | 36,893 | (28,635) | 5,708 | 30,111 | (14,648) | 492,189 | |||||||
5,340,441 | 50,031 | (35,422) | 2,363,856 | 90,954 | (808,254) | 7,001,606 | |||||||||
Amortization | |||||||||||||||
Non-compete agreement | 30.07% | (786) | (3,244) | 277 | - | - | 458 | (3,295) | |||||||
Import quotas | 9.76% | - | (14,360) | - | - | - | 2,934 | (11,426) | |||||||
Outgrowers relationship | 12.50% | (5,777) | (932) | - | - | - | - | (6,709) | |||||||
Patents | 18.16% | (3,025) | (766) | - | - | - | 54 | (3,737) | |||||||
Customer relationship | 7.71% | (49,788) | (25,322) | - | - | (2,727) | 15,494 | (62,343) | |||||||
Supplier relationship | 42.00% | (9,670) | - | 6,510 | - | - | 1,168 | (1,992) | |||||||
Software | 20.00% | (260,484) | (55,712) | 28,562 | (3,164) | (415) | 7,035 | (284,178) | |||||||
(329,530) | (100,336) | 35,349 | (3,164) | (3,142) | 27,143 | (373,680) | |||||||||
5,010,911 | (50,305) | (73) | 2,360,692 | 87,812 | (781,111) | 6,627,926 | |||||||||
(1) Balance arising from business combination with Alimentos Calchaquí Productos 7 S.A., Eclipse Holding Cöoperatief UA, Federal Foods Qatar, GFS Group and Universal Meats (UK).
For the six-month period ended June 30, 2015, Management did not identify and event that could indicate an impairment of such assets.
107
(CONVENIENCE TRANSLATION INTO ENGLISH FROM THE ORIGINAL PREVIOUSLY ISSUED IN PORTUGUESE)
ITR – Quarterly Information – June 30, 2016 – BRF S.A. Explanatory Notes (in thousands of Brazilian Reais)
|
20. LOANS AND FINANCING
Parent company | |||||||||||||||||
Charges (p.a.) | Weighted average | WAMT(1) | Current | Non-current | 06.30.16 | Current | Non-current | 12.31.15 | |||||||||
Local currency | |||||||||||||||||
|
|
| |||||||||||||||
Working capital | 8.75% |
| 8.75% | 0.8 | 1,109,571 | - | 1,109,571 | 1,169,635 | - | 1,169,635 | |||||||
|
|
| |||||||||||||||
Certificate of agribusiness receivables | 96.70% of CDI (96.90% of CDI on 12.31.15) |
| 13.66% (13.67% on 12.31.15) | 2.6 | 15,814 | 1,985,504 | 2,001,318 | 33,078 | 992,165 | 1,025,243 | |||||||
|
|
| |||||||||||||||
Development bank credit lines | Fixed rate / Selic / TJLP + 0.76% |
| 5.35% | 1.5 | 306,937 | 677,114 | 984,051 | 217,426 | 508,928 | 726,354 | |||||||
|
|
| |||||||||||||||
Bonds | 7.75% (7.75% on 12.31.15) |
| 7.75% (7.75% on 12.31.15) | 1.9 | 4,140 | 498,354 | 502,494 | 4,140 | 497,921 | 502,061 | |||||||
|
|
| |||||||||||||||
Export credit facility | 14.18% |
| 14.18% | 2.7 | 64,384 | 1,850,000 | 1,914,384 | - | - | - | |||||||
|
|
| |||||||||||||||
Special program asset restructuring | Fixed rate / IGPM + 4.90% |
| 17.11% | 3.7 | 1,784 | 242,286 | 244,070 | 3,315 | 231,488 | 234,803 | |||||||
|
|
| |||||||||||||||
Other secured debts | 8.50% (8.14% on 12.31.15) |
| 8.50% (8.14% on 12.31.15) | 2.4 | 32,376 | 112,163 | 144,539 | 32,580 | 127,077 | 159,657 | |||||||
Fiscal incentives | 2.40% |
| 2.40% | 0.1 | 14,507 | - | 14,507 | 1,872 | - | 1,872 | |||||||
|
| ||||||||||||||||
|
|
| 1,549,513 | 5,365,421 | 6,914,934 | 1,462,046 | 2,357,579 | 3,819,625 | |||||||||
|
|
| |||||||||||||||
Foreign currency |
|
|
| ||||||||||||||
|
|
| |||||||||||||||
Bonds | 4.08% | 4.08% | 7.0 | 26,548 | 6,187,166 | 6,213,714 | 61,808 | 7,521,727 | 7,583,535 | ||||||||
|
|
| |||||||||||||||
Export credit facility | LIBOR + 1.68% |
| 2.93% | 1.2 | 952,868 | 822,140 | 1,775,008 | 598,109 | 1,163,574 | 1,761,683 | |||||||
| |||||||||||||||||
Advances for foreign exchange rate contracts | 2.00% (1.76% + e.r. US$) + e.r. US$ | 2.00% (1.76% + e.r. US$) + e.r. US$ | 0.5 | 531,421 | - | 531,421 | 391,053 | - | 391,053 | ||||||||
Development bank credit lines | UMBNDES + 2.20% |
| 6.30% | 1.0 | 9,484 | 5,358 | 14,842 | 12,630 | 11,575 | 24,205 | |||||||
|
|
| |||||||||||||||
1,520,321 | 7,014,664 | 8,534,985 | 1,063,600 | 8,696,876 | 9,760,476 | ||||||||||||
3,069,834 | 12,380,085 | 15,449,919 | 2,525,646 | 11,054,455 | 13,580,101 | ||||||||||||
(1) Weighted average maturity in years.
108
(CONVENIENCE TRANSLATION INTO ENGLISH FROM THE ORIGINAL PREVIOUSLY ISSUED IN PORTUGUESE)
ITR – Quarterly Information – June 30, 2016 – BRF S.A. Explanatory Notes (in thousands of Brazilian Reais)
|
Consolidated | |||||||||||||||||
Charges (p.a.) | Weighted average | WAMT(1) | Current | Non-current | 06.30.16 | Current | Non-current | 12.31.15 | |||||||||
Local currency | |||||||||||||||||
Working capital | 8.75% |
| 8.75% | 0.8 | 1,109,571 | - | 1,109,571 | 1,169,635 | - | 1,169,635 | |||||||
Certificate of agribusiness receivables | 96.70% of CDI (96.90% of CDI on 12.31.15) | 13.66% (13.67% on 12.31.15) | 2.6 | 15,814 | 1,985,504 | 2,001,318 | 33,078 | 992,165 | 1,025,243 | ||||||||
Development bank credit lines | Fixed rate / Selic / TJLP + 0.76% | 5.35% | 1.5 | 306,937 | 677,114 | 984,051 | 217,426 | 508,928 | 726,354 | ||||||||
Bonds | 7.75% (7.75% on 12.31.15) | 7.75% (7.75% on 12.31.15) | 1.9 | 4,140 | 498,354 | 502,494 | 4,140 | 497,921 | 502,061 | ||||||||
Export credit facility | 14.18% |
| 14.18% | 2.7 | 64,384 | 1,850,000 | 1,914,384 | - | - | - | |||||||
Special program asset restructuring | Fixed rate / IGPM + 4.90% | 17.11% | 3.7 | 1,784 | 242,286 | 244,070 | 3,315 | 231,488 | 234,803 | ||||||||
Other secured debts | 8.50% (8.14% on 12.31.15) |
| 8.50% (8.14% on 12.31.15) | 2.4 | 32,376 | 112,163 | 144,539 | 32,580 | 127,077 | 159,657 | |||||||
Fiscal incentives | 2.40% |
| 2.40% | 0.1 | 14,507 | - | 14,507 | 1,872 | - | 1,872 | |||||||
1,549,513 | 5,365,421 | 6,914,934 | 1,462,046 | 2,357,579 | 3,819,625 | ||||||||||||
Foreign currency | |||||||||||||||||
Bonds | 5.11% | 5.11% | 6.4 | 447,721 | 6,698,024 | 7,145,745 | 159,445 | 8,628,430 | 8,787,875 | ||||||||
Export credit facility | LIBOR + 1.82% |
| 2.98% | 1.3 | 953,447 | 1,142,769 | 2,096,216 | 598,811 | 1,553,520 | 2,152,331 | |||||||
Advances for foreign exchange rate contracts | 2.00% (1.76% on 12.31.15) + e.r. US$ | 2.00% (1.76% on 12.31.15) + e.r. US$ | 0.5 | 531,421 | - | 531,421 | 391,053 | - | 391,053 | ||||||||
Development bank credit lines | UMBNDES + 2.20% |
| 6.30% | 1.0 | 9,484 | 5,358 | 14,842 | 12,630 | 11,575 | 24,205 | |||||||
Other secured debts | 15.02% |
| 15.02% | 0.4 | 818 | - | 818 | 3,535 | - | 3,535 | |||||||
Working capital | 19.37% | 19.37% | 0.5 | 255,861 | - | 255,861 | 659 | - | 659 | ||||||||
2,198,752 | 7,846,151 | 10,044,903 | 1,166,133 | 10,193,525 | 11,359,658 | ||||||||||||
3,748,265 | 13,211,572 | 16,959,837 | 2,628,179 | 12,551,104 | 15,179,283 | ||||||||||||
(1) Weighted average maturity in years.
109
(CONVENIENCE TRANSLATION INTO ENGLISH FROM THE ORIGINAL PREVIOUSLY ISSUED IN PORTUGUESE)
ITR – Quarterly Information – June 30, 2016 – BRF S.A. Explanatory Notes (in thousands of Brazilian Reais)
|
The main characteristics of loan and financing agreements entered into by the Company were disclosed in note 20 of financial statements for the year ended December 31, 2015.
20.1. Certificates of Agrobusiness Receivables (“CRA”)
On April 20, 2016 BRF concluded the CRA issuance related to the public distribution of the 1st series of 9rd Issue by Octante Securitizadora S.A. (“Securitization Company”), in the amount of R$1,000,000 net of interest, which will mature on April 19, 2019, and were issued with a coupon of 96.90% p.a. of the DI rate, payable every each 9 months. The CRA’s arise and were assigned and/or promised to the Securitization Company.
20.2. Loans and financing maturity schedule
The maturity schedule of the loans and financing is as follows:
Parent company | Consolidated | ||
06.30.16 | 06.30.16 | ||
2016 | 1,661,886 | 1,894,084 | |
2017 | 1,767,568 | 2,225,857 | |
2018 | 2,350,160 | 2,698,202 | |
2019 | 3,160,881 | 3,179,835 | |
2020 onwards | 6,509,424 | 6,961,859 | |
15,449,919 | 16,959,837 |
20.3. Guarantees
Parent company | Consolidated | ||||||
06.30.16 | 12.31.15 | 06.30.16 | 12.31.15 | ||||
Total of loans and financing | 15,449,919 | 13,580,101 | 16,959,837 | 15,179,283 | |||
Mortgage guarantees | 1,157,941 | 911,996 | 1,157,941 | 911,996 | |||
Related to FINEM-BNDES | 855,629 | 583,411 | 855,629 | 583,411 | |||
Related to FNE-BNB | 144,540 | 159,564 | 144,540 | 159,564 | |||
Related to tax incentives and other | 157,772 | 169,021 | 157,772 | 169,021 | |||
The Company is the guarantor of a loan obtained by Instituto Sadia de Sustentabilidade from the BNDES. The loan was obtained with the purpose of allowing the implementation of biodigesters in the farms of the outgrowers which take part in the Company´s integration system, targeting the reduction of the emission of Greenhouse Gases. The value of these guarantees on June 30, 2016 totaled R$33,776 (R$39,098 as of December 31, 2015).
The Company is the guarantor of loans related to a special program, which aimed the local development of outgrowers in the central region of Brazil. The proceeds of such loans are utilized by the outgrowers to improve farm conditions and will be paid by them in 10 years, taking as collateral the land and equipment acquired by the outgrowersthrough this program. The guarantee totaled R$167,992 as of June 30, 2016 (R$208,774 as of December 31, 2015).
110
(CONVENIENCE TRANSLATION INTO ENGLISH FROM THE ORIGINAL PREVIOUSLY ISSUED IN PORTUGUESE)
ITR – Quarterly Information – June 30, 2016 – BRF S.A. Explanatory Notes (in thousands of Brazilian Reais)
|
On June 30, 2016, the Company contracted bank guarantees in the amount of R$1,987,319 (R$2,086,589 as of December 31, 2015). The variation occurred in this period is related to bank guarantees offered mainly in litigations involving the Company´s use of tax credits. These guarantees have an average cost of 0.89% p.a. (0.91% p.a. as of December 31, 2015).
20.4. Commitments
In the normal course of the business, the Company enters into agreements with third parties which are mainly related to the purchases of raw materials, such as corn and soymeal, where the agreed prices can be fixed or to be fixed. The Company enters into other agreements, such as electricity, packaging supplies and manufacturing activities. The amounts of these agreements at the date of these financial statements are set forth below:
Parent company and Consolidated | ||
06.30.16 | ||
2016 | 4,931,964 | |
2017 | 1,745,704 | |
2018 | 305,325 | |
2019 | 294,520 | |
2020 onwards | 510,100 | |
7,787,613 |
21. TRADE ACCOUNTS PAYABLE
Parent company | Consolidated | ||||||
06.30.16 | 12.31.15 | 06.30.16 | 12.31.15 | ||||
Domestic suppliers | |||||||
Third parties | 3,813,490 | 3,263,197 | 3,813,573 | 3,263,201 | |||
Related parties | 11,125 | 23,375 | 11,125 | 23,375 | |||
3,824,615 | 3,286,572 | 3,824,698 | 3,286,576 | ||||
Foreign suppliers | |||||||
Third parties | 685,822 | 774,106 | 1,566,610 | 1,496,833 | |||
Related parties | 6,340 | 2,463 | - | - | |||
692,162 | 776,569 | 1,566,610 | 1,496,833 | ||||
(-) Adjustment to present value | (44,664) | (38,416) | (44,664) | (38,416) | |||
4,472,113 | 4,024,725 | 5,346,644 | 4,744,993 | ||||
During the six-month period ended on June 30, 2016, the average payment term tosuppliers is 78 days.
111
(CONVENIENCE TRANSLATION INTO ENGLISH FROM THE ORIGINAL PREVIOUSLY ISSUED IN PORTUGUESE)
ITR – Quarterly Information – June 30, 2016 – BRF S.A. Explanatory Notes (in thousands of Brazilian Reais)
|
Of the suppliers balance as of June 30, 2016, R$1,220,778 in the parent company and consolidated (R$1,070,583 in the parent company and consolidated as of December 31, 2015) corresponds to the supply chain finance transactions on which there were no
changes in the payment terms and prices negotiated with the suppliers.
The information on accounts payable involving related parties is presented in note 30. The trade accounts payable to related parties refer to transactions with associates UP! in the domestic market.
22. SUPPLY CHAIN FINANCE
Parent Company and Consolidated | |||
06.30.16 | 12.31.15 | ||
National suppliers | 325,307 | 685,597 | |
Foreign suppliers | 418,319 | 488,997 | |
743,626 | 1,174,594 | ||
The Company entered into supply chain finance transactions with first-class financial institutions in order to extend the payment period in purchases of raw material, machinery and equipment, and other inputs with internal and external market suppliers. As such, these transactions are presented in the operational cash flows for the period ended June 30, 2016.
On June 30, 2016, the discount rates applied to these transactions in the domestic market were set between 1.15% to 1.36% p.m. (1.10% to 1.34% p.m. on December 31, 2015) and foreign market were set between 1.57% to 2.56% p.a. (1.50% to 2.51% p.a. on December 31, 2015).
112
(CONVENIENCE TRANSLATION INTO ENGLISH FROM THE ORIGINAL PREVIOUSLY ISSUED IN PORTUGUESE)
ITR – Quarterly Information – June 30, 2016 – BRF S.A. Explanatory Notes (in thousands of Brazilian Reais)
|
23. OTHER FINANCIAL ASSETS AND LIABILITIES
Parent company | Consolidated | ||||||
06.30.16 | 12.31.15 | 06.30.16 | 12.31.15 | ||||
Derivatives designated as cash flow hedges | |||||||
Assets | |||||||
Non-deliverable forward (NDF) | 10,856 | 2,253 | 10,856 | 2,253 | |||
Commodities (soy meal) non-deliverable forward (NDF) | 1,659 | - | 1,659 | - | |||
Currency option contracts | 416,830 | 96,153 | 416,830 | 96,153 | |||
Deliverable forwards contracts | 69,969 | - | 73,345 | - | |||
499,314 | 98,406 | 502,690 | 98,406 | ||||
Liabilities | |||||||
Non-deliverable forward of currency (NDF) | - | (66,703) | - | (66,703) | |||
Commodities (soy meal) non-deliverable forward (NDF) | (852) | - | (852) | - | |||
Currency option contracts | (35,026) | (217,122) | (35,026) | (217,122) | |||
Deliverable forwards contracts | - | (33,765) | (80) | (33,765) | |||
Commodities (corn) non-deliverable forward (NDF) | (2,183) | (11,729) | (2,183) | (11,729) | |||
Exchange rate contracts currency (Swap) | (178,750) | (280,285) | (217,810) | (326,650) | |||
(216,811) | (609,604) | (255,951) | (655,969) | ||||
Non derivatives designated as cash flow hedges | |||||||
Assets | |||||||
Non-deliverable forward of currency (NDF) | - | - | 2,571 | 10,707 | |||
Non-deliverable forward of commodities (NDF) | 20,502 | 2,183 | 20,502 | 2,183 | |||
Exchange rate contracts currency (Swap) | - | 3,450 | - | 3,450 | |||
Dollar future contracts - BM&FBovespa | - | 14,641 | - | 14,641 | |||
20,502 | 20,274 | 23,073 | 30,981 | ||||
Liabilities | |||||||
Non-deliverable forward of currency (NDF) | (35,381) | (3,502) | (35,584) | (3,865) | |||
Exchange rate contracts currency (Swap) | (594,861) | (6,768) | (594,861) | (6,768) | |||
Dollar future contracts - BM&FBovespa | (2,542) | - | (2,542) | - | |||
Corn / soy meal future contratcs - BM&FBovespa | (3,263) | - | (3,263) | - | |||
(636,047) | (10,270) | (636,250) | (10,633) | ||||
Current assets | 519,816 | 118,680 | 525,763 | 129,387 | |||
Current liabilities | (852,858) | (619,874) | (892,201) | (666,602) | |||
The collateral given in the transactions presented above are disclosed in note 8.
24. LEASES
The Company is lessee in several contracts, which are classified as operating or finance leases.
24.1. Operating lease
The minimum future payments of non-cancellable operating lease are presented below:
113
(CONVENIENCE TRANSLATION INTO ENGLISH FROM THE ORIGINAL PREVIOUSLY ISSUED IN PORTUGUESE)
ITR – Quarterly Information – June 30, 2016 – BRF S.A. Explanatory Notes (in thousands of Brazilian Reais)
|
Parent company | Consolidated | ||
06.30.16 | 06.30.16 | ||
2016 | 168,439 | 172,904 | |
2017 | 141,574 | 145,484 | |
2018 | 43,382 | 46,031 | |
2019 | 12,328 | 14,478 | |
2020 onwards | 23,994 | 25,570 | |
389,717 | 404,467 |
The payments of operating lease agreements recognized as expense in the six-month period ended June 30, 2016 amounted to R$101,035 in the parent company and R$168,487 in the consolidated (R$117,193 in the parent company and R$153,236 in the consolidated as of June 30, 2015).
24.2. Finance lease
The Company enters into finance leases mainly for the acquisitions of machinery, equipment, vehicles, software and buildings, as presented below:
| Parent company | Consolidated | |||||||
Weighted average interest rate | 06.30.16 | 12.31.15 | 06.30.16 | 12.31.15 | |||||
Cost | |||||||||
Machinery and equipment | 27,780 | 29,160 | 35,654 | 37,096 | |||||
Software | 78,692 | 72,972 | 78,692 | 72,972 | |||||
Vehicles | - | - | 556 | - | |||||
Buildings | 141,732 | 128,938 | 141,811 | 128,938 | |||||
248,204 | 231,070 | 256,713 | 239,006 | ||||||
Accumulated depreciation | |||||||||
Machinery and equipment | 13.84% | (4,229) | (5,311) | (10,357) | (13,247) | ||||
Software | 52.38% | (42,938) | (50,988) | (42,938) | (50,988) | ||||
Vehicles | 20.00% | - | - | (225) | - | ||||
Buildings | 7.41% | (38,008) | (32,091) | (38,046) | (32,091) | ||||
(85,175) | (88,390) | (91,566) | (96,326) | ||||||
163,029 | 142,680 | 165,147 | 142,680 | ||||||
(1) The period of depreciation of leased assets corresponds to the lowest between the term of the contract and the useful life of the asset, as determined by CVM Deliberation Nº 645/10.
The minimum future payments required for these finance leases are demonstrated as follows, and were recorded as current and non-current liabilities:
114
(CONVENIENCE TRANSLATION INTO ENGLISH FROM THE ORIGINAL PREVIOUSLY ISSUED IN PORTUGUESE)
ITR – Quarterly Information – June 30, 2016 – BRF S.A. Explanatory Notes (in thousands of Brazilian Reais)
|
Parent company | |||||
06.30.16 | |||||
Present value of minimum payments | Interest | Minimum future payments | |||
2016 | 27,714 | 9,780 | 37,494 | ||
2017 | 34,857 | 17,336 | 52,193 | ||
2018 | 26,137 | 14,826 | 40,963 | ||
2019 | 21,003 | 12,596 | 33,599 | ||
2020 onwards | 79,620 | 48,075 | 127,695 | ||
189,331 | 102,613 | 291,944 | |||
Consolidated | |||||
06.30.16 | |||||
Present value of minimum payments | Interest | Minimum future payments | |||
2016 | 28,097 | 10,059 | 38,156 | ||
2017 | 35,349 | 17,716 | 53,065 | ||
2018 | 26,736 | 15,224 | 41,960 | ||
2019 | 21,003 | 12,596 | 33,599 | ||
2020 onwards | 79,620 | 48,075 | 127,695 | ||
190,805 | 103,670 | 294,475 | |||
The contract terms for both modalities, with respect to renewal, adjustment and purchase option, are according to market practices. In addition, there are no clauses of contingent payments or restrictions on dividends distribution, payments of interest on shareholders’ equity or obtaining debt.
The Company also has commitments regarding financial leases, related to a “built to suit” agreement for the construction of office facilities which will be build by third parties. The agreement term will be 15 years from the signing date as well as the charge of rent expenses. If the Company defaults on its obligations, it will be subject to fines and/or acceleration of rent outstanding installments falling due, according to the term of each contract.
The estimated schedule of future payments related to this agreement is set forth below:
Parent company and Consolidated | ||
06.30.16 | ||
2016 | 7,886 | |
2017 | 8,359 | |
2018 | 8,861 | |
2019 | 9,393 | |
2020 onwards | 149,062 | |
183,561 |
115
(CONVENIENCE TRANSLATION INTO ENGLISH FROM THE ORIGINAL PREVIOUSLY ISSUED IN PORTUGUESE)
ITR – Quarterly Information – June 30, 2016 – BRF S.A. Explanatory Notes (in thousands of Brazilian Reais)
|
25. SHARE BASED PAYMENT
The rules of the stock options plan granted to executives were disclosed in the financial statements for the year ended December 31, 2015 (note 24) and are unchanged for this period.
According to the ordinary meeting of the Board of Directors held on April 28, 2016 and May 31, 2016, were approved the granting of 8,724,733 and 3,351,220 shares, respectively.
The breakdown of the outstanding granted options is presented as follows:
Date | Quantity | Grant(1) | Price of converted share(1) | |||||||||||
Grant date | Beginning of the year | End of the year | Options granted | Outstanding options | Fair value of the option | Granting date | Updated IPCA | |||||||
Plan I |
|
|
|
|
|
|
|
|
|
|
|
|
|
|
05.02.11 |
| 05.01.12 |
| 05.01.16 | 2,463,525 | - | 11.36 | 30.85 | 43.72 | |||||
05.02.12 |
| 05.01.13 |
| 05.01.17 | 3,708,071 | 324,788 | 7.82 | 34.95 | 47.12 | |||||
05.02.13 |
| 05.01.14 |
| 05.01.18 | 3,490,201 | 769,668 | 11.88 | 46.86 | 59.33 | |||||
04.04.14 |
| 04.03.15 |
| 04.03.19 | 1,552,564 | 710,525 | 12.56 | 44.48 | 53.34 | |||||
05.02.14 |
| 05.01.15 |
| 05.01.19 | 1,610,450 | 930,383 | 14.11 | 47.98 | 57.16 | |||||
12.18.14 |
| 12.17.15 |
| 12.17.19 | 5,702,714 | 4,741,515 | 14.58 | 63.49 | 73.68 | |||||
|
|
|
|
| 18,527,525 | 7,476,879 | ||||||||
|
|
|
|
| ||||||||||
Plan II |
|
|
|
|
|
|
|
|
|
|
|
|
|
|
10.01.15 |
| 10.01.16 |
| 10.01.21 | 37,570 | 27,410 | 20.64 | 70.09 | 74.98 | |||||
04.26.16 |
| 04.30.17 |
| 04.30.21 | 8,724,733 | 8,724,733 | 9.21 | 56.00 | 56.44 | |||||
05.31.16 |
| 05.31.17 |
| 05.31.20 | 3,351,220 | 3,351,220 | 10.97 | 46.68 | 46.68 | |||||
12,113,523 | 12,103,363 | |||||||||||||
30,641,048 | 19,580,242 | |||||||||||||
(1) Values expressed in Brazilian Reais
The rollforward of the outstanding granted options for the six-month period ended June 30, 2016 is presented as follows:
116
(CONVENIENCE TRANSLATION INTO ENGLISH FROM THE ORIGINAL PREVIOUSLY ISSUED IN PORTUGUESE)
ITR – Quarterly Information – June 30, 2016 – BRF S.A. Explanatory Notes (in thousands of Brazilian Reais)
|
BR GAAP and IFRS | ||
Consolidated | ||
Outstanding options as of December 31, 2015 | 17,360,870 | |
Issued - grant of 2016 | ||
April 2016 | 8,724,733 | |
May 2016 | 3,351,220 | |
Exercised: | ||
Grant of 2012 | (6,410) | |
Grant of 2011 | (96,874) | |
Cancelled: | ||
Grant of 2015 | (8,729,813) | |
Grant of 2014 | (908,703) | |
Grant of 2013 | (52,665) | |
Grant of 2011 | (62,116) | |
Outstanding options as of June 30, 2016 | 19,580,242 |
The weighted average exercise prices of the outstanding options related to service conditions is R$58.84 (fifty-eight Brazilian Reais and eighty-four cents), and the weighted average of the remaining contractual term is 49 months.
The Company records as capital reserve in shareholders’ equity the fair value of the options in the amount of R$194,613 (R$160,323 as of December 31, 2015). During the six-month period ended June 30, 2016 the amount recognized as expense was R$34,290 (R$9,633 as of June 30, 2015).
During the six-month period ended June 30, 2016 the Company’s executives exercised 103,284 shares, with an average price of R$43.33 (forty-three Brazilian Reais and thirty-three cents), totaling R$4,475. In order to comply with this commitment, the Company utilized treasury shares with an acquisition cost of R$57.64 (fifty-seven Brazilian Reais and sixty-four cents), totaling R$5,953, recording a loss of R$1,478 as capital reserve.
The fair value of the granted stock options related to service condition was measured using the Black-Scholes pricing model, as disclosed in the annual financial statements for the year ended December 31, 2015 (note 24). There is no change in the methodology adopted during the six-month period ended June 30, 2016.
26. PENSION AND OTHER POST-EMPLOYMENT PLANS
The Company offers pension and other post-employment plans to the employees. The characteristics of such benefits were disclosed in the annual financial statements for the year ended December 31, 2015 (note 25) and have not been changed during this period.
The actuarial liabilities and the related effects in the statement of income are presented below
117
(CONVENIENCE TRANSLATION INTO ENGLISH FROM THE ORIGINAL PREVIOUSLY ISSUED IN PORTUGUESE)
ITR – Quarterly Information – June 30, 2016 – BRF S.A. Explanatory Notes (in thousands of Brazilian Reais)
|
Parent company and | |||
Liabilities | |||
06.30.16 | 12.31.15 | ||
Medical assistance | 137,828 | 130,028 | |
F.G.T.S. Penalty(1) | 112,617 | 105,139 | |
Award for length of service | 44,298 | 41,462 | |
Other | 23,936 | 22,415 | |
318,679 | 299,044 | ||
Current | 67,264 | 67,264 | |
Non-current | 251,415 | 231,780 | |
(1) FGTS – Government Severance Indemnity Fund for Employees
The Company based its estimated costs for the year 2016, according to an appraisal report prepared in 2015 by an actuarial expert, recorded in statement of income for the period in counterpart to comprehensive income an expense of R$11,415 (expense of R$13,596 on June 30, 2015), related to supplementary post-employment plans. Regarding other benefits to employees, the Company recorded in statement of income for the period in counterpart to liabilities an expense of R$19,635 (R$9,488 on June 30, 2015).
27. PROVISION FOR TAX, CIVIL AND LABOR RISKS
The Company and its subsidiaries are involved in certain legal proceedings arising from the normal course of business, which include civil, administrative, tax, social security and labor claims.
The Company classifies the risk of unfavorable decisions in the legal proceedings as “probable”, “possible” or “remote”. The provisions recorded relating to such proceedings is determined by the Company’s Management based on legal advice and reasonably reflect the estimated probable losses.
The Company’s management believes that its provision for tax, civil and labor risks, accounted for according to CVM Deliberation No. 594/09 is sufficient to cover estimated losses related to its legal proceedings, as presented below:
27.1. Contingencies for probable losses
The rollforward of the provisions for tax, civil and labor risks is summarized below:
118
(CONVENIENCE TRANSLATION INTO ENGLISH FROM THE ORIGINAL PREVIOUSLY ISSUED IN PORTUGUESE)
ITR – Quarterly Information – June 30, 2016 – BRF S.A. Explanatory Notes (in thousands of Brazilian Reais)
|
Parent company | |||||||||
Tax | Labor | Civil, commercial and other | Contingent liabilities | Total | |||||
|
|
|
|
|
|
|
| 06.30.16 | |
Beginning balance | 238,831 | 359,468 | 65,674 | 516,942 | 1,180,915 | ||||
Additions | 6,263 | 162,562 | 37,787 | - | 206,612 | ||||
Reversals | (7,870) | (59,190) | (5,581) | - | (72,641) | ||||
Payments | (2,555) | (94,136) | (32,445) | - | (129,136) | ||||
Exchange rate variation | 10,566 | 40,126 | 15,652 | - | 66,344 | ||||
Ending balance | 245,235 | 408,830 | 81,087 | 516,942 | 1,252,094 | ||||
Current | 270,063 | ||||||||
Non-current | 982,031 | ||||||||
Consolidated | |||||||||
Tax | Labor | Civil, commercial and other | Contingent liabilities | Total | |||||
|
|
|
|
|
|
|
| 06.30.16 | |
Beginning balance | 240,496 | 377,023 | 65,701 | 522,629 | 1,205,849 | ||||
Additions | 6,543 | 169,034 | 39,939 | - | 215,516 | ||||
Business combination(1) | 28,667 | 17,814 | 4,549 | - | 51,030 | ||||
Reversals | (9,213) | (66,120) | (5,581) | - | (80,914) | ||||
Payments | (2,555) | (94,136) | (32,445) | - | (129,136) | ||||
Price index update | 10,566 | 40,126 | 15,654 | - | 66,346 | ||||
Exchange rate variation | 1,287 | (6,115) | 30 | (1,639) | (6,437) | ||||
Ending balance | 275,791 | 437,626 | 87,847 | 520,990 | 1,322,254 | ||||
Current | 274,756 | ||||||||
Non-current | 1,047,498 | ||||||||
(1) Balance arising from business combination with Alimentos Calchaquí Productos 7 S.A. and Eclipse Holding Cöoperatief UA.
27.2. Contingencies classified as a risk of possible loss
The Company is involved in other tax, civil, labor and social security contingencies, for which losses have been assessed as possible by management with the support from legal counsel and therefore no provision was recorded. On June 30, 2016 the total amount of the possible contingencies was R$12,829,685 (R$11,707,258 as of December 31, 2015, from which R$520,990 (R$522,629 as of December 31, 2015) were recorded at the estimated fair value resulting from business combinations with Sadia, Avex and Dánica as determined by paragraph 23 of CVM Deliberation No. 665/11, disclosed in the table of item 24.1. The main natures of these contingencies were properly disclosed in the annual statements for the year ended December 31, 2015 (note 26.2).
28. SHAREHOLDERS’ EQUITY
28.1. Capital stock
119
(CONVENIENCE TRANSLATION INTO ENGLISH FROM THE ORIGINAL PREVIOUSLY ISSUED IN PORTUGUESE)
ITR – Quarterly Information – June 30, 2016 – BRF S.A. Explanatory Notes (in thousands of Brazilian Reais)
|
On June 30, 2016, the capital subscribed and paid by the Company is R$12,553,418, which is composed of 812,473,246 book-entry shares of common stock without par value. The value of the capital stock is net of the public offering expenses of R$92,947.
On February 25, 2016 the Board of Directors approved the cancellation of 60,000,000 (sixty million) common shares held in treasury by the Company, without any reduction in the capital stock. On April 07, 2016 the cancellation was ratified in the Shareholders Ordinary Meeting.
The Company is authorized to increase the capital stock, irrespective of amendment to the bylaws, up to the limit of 1,000,000,000 common shares, in book-entry form without par value.
28.2. Interest on shareholders’ equity and dividends
On February 12, 2016 the payment of R$473,398 was made related to the interest on shareholders’ equity and R$91,443 related to dividends approved by the Management on December 17, 2015 and ratified in the Shareholders Ordinary Meeting on April 7, 2016.
On February 25, 2016, the Board of Directors approved the payment of R$98,210 as complimentary dividends for the year ended December 31, 2015, settled on April 01, 2016.
On June 30, 2016, the Board of Directors approved the payment of R$513,215, related to interest on shareholder’s equity settled on August 15, 2016.
28.3. Breakdown of capital stock
Consolidated | |||
06.30.16 | 12.31.15 | ||
Common shares | 812,473,246 | 872,473,246 | |
Treasury shares | (13,505,317) | (62,501,001) | |
Outstanding shares | 798,967,929 | 809,972,245 | |
28.4. Rollforward of outstanding shares
120
(CONVENIENCE TRANSLATION INTO ENGLISH FROM THE ORIGINAL PREVIOUSLY ISSUED IN PORTUGUESE)
ITR – Quarterly Information – June 30, 2016 – BRF S.A. Explanatory Notes (in thousands of Brazilian Reais)
|
Consolidated | ||||
Quantity of outstanding of shares | ||||
06.30.16 | 12.31.15 | |||
Shares at the beggining of the period | 809,972,245 | 867,284,349 | ||
Purchase of treasury shares | (11,107,600) | (59,247,400) | ||
Sale of treasury shares | 103,284 | 1,935,296 | ||
Shares at the end of the period | 798,967,929 | 809,972,245 | ||
28.5. Treasury shares
The Company has 13,505,317 shares in treasury, with an average cost of R$53.60 (fifty-three Brazilian Reais and sixty cents) per share, with a market value corresponding to R$609,495.
On February 26, 2016, in a special meeting of Board of Directors was approved a “Repurchase Program” of the Company’s share, in the amount of R$20,000,000 (twenty million) shares.
During the six-month period ended June 30, 2016, as authorized by the Board of Directors, the Company acquired 11,107,600 shares of its own shares at a cost of R$543,258, with the objective of maintaining treasury shares to comply with the provisions of stock option plans, both approved by special meetings of Board of Directors held on November 09, 2015 and February 26, 2016.
29. EARNINGS PER SHARE
121
(CONVENIENCE TRANSLATION INTO ENGLISH FROM THE ORIGINAL PREVIOUSLY ISSUED IN PORTUGUESE)
ITR – Quarterly Information – June 30, 2016 – BRF S.A. Explanatory Notes (in thousands of Brazilian Reais)
|
Parent company | |||
06.30.16 | 06.30.15 | ||
Basic numerator | |||
Net profit for the period attributable to controlling shareholders | 69,668 | 819,013 | |
Basic denominator | |||
Common shares | 812,473,246 | 872,473,246 | |
Weighted average number of outstanding shares - basic | 804,853,116 | 852,819,886 | |
Net earnings per share basic - R$ | 0.08656 | 0.96036 | |
Diluted numerator | |||
Net profit for the period attributable to controlling shareholders | 69,668 | 819,013 | |
Diluted denominator | |||
Weighted average number of outstanding shares - basic | 804,853,116 | 852,819,886 | |
Number of potential shares (stock options) | 14,180 | 667,292 | |
Weighted average number of outstanding shares - diluted | 804,867,296 | 853,487,178 | |
Net earnings per share diluted - R$ | 0.08656 | 0.95961 | |
Parent company | |||
Continued operations | 06.30.16 | 06.30.15 | |
Basic numerator | |||
Net profit for the period from continued operations attributable to controlling shareholders | 69,668 | 826,085 | |
Basic denominator | |||
Common shares | 812,473,246 | 872,473,246 | |
Weighted average number of outstanding shares - basic | 804,853,116 | 852,819,886 | |
Net earnings per share basic - R$ | 0.08656 | 0.96865 | |
Diluted numerator | |||
Net profit for the period from continued operations attributable to controlling shareholders | 69,668 | 826,085 | |
Diluted denominator | |||
Weighted average number of outstanding shares - basic | 804,853,116 | 852,819,886 | |
Number of potential shares (stock options) | 14,180 | 667,292 | |
Weighted average number of outstanding shares - diluted | 804,867,296 | 853,487,178 | |
Net earnings per share diluted - R$ | 0.08656 | 0.96789 | |
122
(CONVENIENCE TRANSLATION INTO ENGLISH FROM THE ORIGINAL PREVIOUSLY ISSUED IN PORTUGUESE)
ITR – Quarterly Information – June 30, 2016 – BRF S.A. Explanatory Notes (in thousands of Brazilian Reais)
|
Parent company | |||
Discontinued operations | 06.30.16 | 06.30.15 | |
Basic numerator | |||
Net profit for the period from discontinued operations attributable to controlling shareholders | - | (7,072) | |
Basic denominator | |||
Common shares | 812,473,246 | 872,473,246 | |
Weighted average number of outstanding shares - basic | 804,853,116 | 852,819,886 | |
Net earnings per share basic - R$ | - | (0.00829) | |
Diluted numerator | |||
Net profit for the period from discontinued operations attributable to controlling shareholders | - | (7,072) | |
Diluted denominator | |||
Weighted average number of outstanding shares - basic | 804,853,116 | 852,819,886 | |
Number of potential shares (stock options) | 14,180 | 667,292 | |
Weighted average number of outstanding shares - diluted | 804,867,296 | 853,487,178 | |
Net earnings per share diluted - R$ | - | (0.00829) | |
On June 30, 2016, from the total of 19,580,242 stock options outstanding (10,295,963 as of June 30, 2015) granted to executives of the Company, 19,255,454 options (5,702,714 as of June 30, 2015) were not considered in the calculation of the diluted earnings per share due to the fact that the exercise price until the vesting period was higher than the average market price of the common shares during the period, so that they did not cause any dilution effect.
30. RELATED PARTIES – PARENT COMPANY
As part of the Company’s operations, rights and obligations arise between related parties, resulting from transactions of purchase and sale of products, loans agreed on normal conditions of market for similar transactions, based on contracts.
All the relationships between the company and its subsidiaries were disclosed irrespective of the existence or not of transactions between these parties.
All the transactions and balances among the companies were eliminated in the consolidation and refer to commercial and/or financial transactions.
123
(CONVENIENCE TRANSLATION INTO ENGLISH FROM THE ORIGINAL PREVIOUSLY ISSUED IN PORTUGUESE)
ITR – Quarterly Information – June 30, 2016 – BRF S.A. Explanatory Notes (in thousands of Brazilian Reais)
|
30.1. Transactions and balances
The balance of the transactions with the related parties are as follow:
Accounts receivable | Dividends and interest on the shareholders' equity receivable | Loan contracts | Trade accounts payable | Other rights | Other obligations | ||||||||||||||||||
06.30.16 | 12.31.15 | 06.30.16 | 12.31.15 | 06.30.16 | 12.31.15 | 06.30.16 | 12.31.15 | 06.30.16 | 12.31.15 | 06.30.16 | 12.31.15 | ||||||||||||
Al-Wafi Food Products Factory LLC | - | - |
| - | - |
| - | - |
| - | - | 394 | 89 |
| (264) | - | |||||||
Avex S.A. | 30,667 | 19,485 |
| - | - |
| - | - |
| - | (134) | 25,468 | 25,468 |
| - | - | |||||||
Avipal Centro Oeste S.A. | - | - |
| - | - |
| - | - |
| - | - |
| - | - |
| (38) | (38) | ||||||
BFF International Ltd. | - | - | - | - | - | - | - | - | 1,750 | 2,129 |
| - | - | ||||||||||
BRF Al Yasra | - | - | - | - | - | - | - | - | 162 | - |
| - | - | ||||||||||
BRF Foods LLC | - | - | - | - | - | - | - | - | 302 | 487 |
| - | - | ||||||||||
BRF Foods GmbH | 111,343 | 119,280 | - | - | - | - | (39) | - | 233 | 418 |
| - | - | ||||||||||
BRF Global GmbH | 4,181,470 | 2,780,457 | - | - | - | - | (6,178) | (1,596) | - | - | (913,040) | (1) | - | ||||||||||
BRF GmbH | - | - | - | - | - | - | (13) | (16) | - | - | (1,172) | (1,471) | |||||||||||
Federal Foods | - | - | - | - | - | - | - | - | - | - | (82) | - | |||||||||||
Highline International Ltd. | - | - | - | - | (5,854) | (7,121) |
| - | - |
| - | - |
| - | - | ||||||||
K&S Alimentos S.A. | - | - | - | 1,365 |
| - | - |
| - | (8,148) |
| - | 2,954 |
| - | (29) | |||||||
Perdigão International Ltd. | - | - | - | - | (26,567) | (29,446) | - | - | 382 | 4,551 | (975,892) | (1,186,841) | |||||||||||
PSA Laboratório Veterinário Ltda. | - | - | 550 | 550 |
| - | - |
| - | - |
| - | - |
| - | - | |||||||
Quickfood S.A. | 67,784 | 47,446 |
| - | - |
| - | - |
| - | (717) |
| - | - |
| (394) | (553) | ||||||
Sadia Alimentos S.A. | 14,172 | 12,366 |
| - | - |
| - | - |
| (110) | - | - | - |
| - | - | |||||||
Sadia Chile S.A. | 33,798 | 42,467 |
| - | - |
| - | - |
| - | - | - | - |
| - | - | |||||||
Sadia Uruguay S.A. | 4,135 | 8,720 |
| - | - |
| - | - |
| - | - | - | - |
| - | - | |||||||
UP! Alimentos Ltda. | 1,666 | 645 | 8,202 | 19,820 | - | - | (11,125) | (15,227) | 4,556 | 3,757 | (1,400) | - | |||||||||||
VIP S.A. Empreendimentos e Partic. Imob. | - | - | 1,403 | 1,403 | - | - | - | - | 49 | - | - | - | |||||||||||
Wellax Foods Logistics C.P.A.S.U. Lda. | - | - | - | - | - | - | - | - | 368 | 344 | - | - | |||||||||||
Corall Consultoria LTDA. | - | - | - | - | - | - | - | - | - | - | (58) | - | |||||||||||
Hortigil Hortifruti S.A. | - | 2,370 | - | - | - | - | - | - | - | - | - | - | |||||||||||
Instituto de Desenvolvimento Gerencial S.A. | - | - | - | - | - | - | - | - | - | - | (268) | (2,088) | |||||||||||
Total | 4,445,035 | 3,033,236 | 10,155 | 23,138 | (32,421) | (36,567) | (17,465) | (25,838) | 33,664 | 40,197 | (1,892,608) | (1,191,020) | |||||||||||
(1) The amount corresponds to advances for future export pre-payment.
124
(CONVENIENCE TRANSLATION INTO ENGLISH FROM THE ORIGINAL PREVIOUSLY ISSUED IN PORTUGUESE)
ITR – Quarterly Information – June 30, 2016 – BRF S.A. Explanatory Notes (in thousands of Brazilian Reais)
|
Revenue | Financial results, net | Purchases | |||||||||
06.30.16 | 06.30.15 | 06.30.16 | 06.30.15 | 06.30.16 | 06.30.15 | ||||||
Al-Wafi Foods | 42,155 | 10,976 | - | - | - | - | |||||
Avex S.A. | 21,061 | 2,202 | - | - | - | - | |||||
BRF Foods GmbH | 6,642 | 20,118 | - | - | - | - | |||||
BRF Global GmbH | 5,666,363 | 4,557,616 | (4,452) | (4) | (61) | - | |||||
K&S Alimentos Ltda. | - | - | - | - | - | (68,936) | |||||
Perdigão International Ltd. | - | - | (32,441) | (25,784) | - | - | |||||
Quickfood S.A. | 19,672 | 14,173 | - | - | (766) | (2,937) | |||||
Sadia Alimentos S.A. | 1,806 | - | - | - | - | - | |||||
Sadia Chile S.A. | 74,181 | 43,558 | - | - | - | - | |||||
Sadia Uruguay S.A. | 6,613 | 8,814 | - | - | - | - | |||||
UP! Alimentos Ltda. | 6,779 | 7,587 | - | - | (95,180) | (95,753) | |||||
Corall Consultoria LTDA.(1) | - | - | - | - | (874) | - | |||||
Hortigil Hortifruti S.A.(2) | 3,467 | 7,228 | - | - | - | - | |||||
Instituto de Desenvolvimento Gerencial S.A.(1) | - | - | - | - | (3,849) | (3,644) | |||||
Total | 5,848,739 | 4,672,272 | (36,893) | (25,788) | (100,730) | (171,270) | |||||
(1) Entities on which BRF has no equity interest, but have relationship with the Board of Directors. Instituto de Desenvolvimento Gerencial S.A. provided advisory services related to strategic management and organizational restructure. Corall Consultoria Ltda, provided organizational development consulting service.
(2) Since April 8, 2016, the entity is no longer considered related party, as the Board Member has ended is relationship with Hortigil Hortifruti S.A.
All companies disclosed in note 1.1 are controlled by BRF, except for UP! Alimentos, PP-BIO, PR-SAD, AKF and SATS BRF, which are associates or joint venture.
The Company also recorded a liability in the amount of R$7,317 (R$8,470 as of December 31, 2015) related to the fair value of the guarantees offered to BNDES concerning a loan made by the Instituto Sadia de Sustentabilidade.
Due to the acquisition of biodigesters from Instituto Sadia de Sustentabilidade, the Company has recorded a payable to this entity of R$26,458 included in other liabilities as of June 30, 2016 (R$30,628 as of December 31, 2015).
The Company entered into loan agreements with its subsidiaries. Below is a summary of
the balances and rates charged for the transactions at the balance sheet date:
125
(CONVENIENCE TRANSLATION INTO ENGLISH FROM THE ORIGINAL PREVIOUSLY ISSUED IN PORTUGUESE)
ITR – Quarterly Information – June 30, 2016 – BRF S.A. Explanatory Notes (in thousands of Brazilian Reais)
|
Counterparty | Balance | Interest rate (p.a.) | ||||||
Creditor | Debtor | Currency | 06.30.16 | |||||
Campo Austral S.A. | Degesa Argentina S.A. | ARS | 4,510,249 | 20.0% | ||||
Campo Austral S.A. | Buenos Aires Fortune S.A. | ARS | 1,136,346 |
| 20.0% | |||
Campo Austral S.A. | Cabaña San Nestor S.A. | ARS | 766,043 |
| 20.0% | |||
BRF GmbH | Federal Foods Qatar | US$ | 519,845 |
| 2.5% | |||
Campo Austral S.A. | Eporpam S.A. | ARS | 366,317 |
| 20.0% | |||
Sadia Overseas Ltd. | BRF Global GmbH | US$ | 289,852 |
| 7.0% | |||
Hibridos Argentinos S.A. | Eporpam S.A. | ARS | 284,906 |
| 20.0% | |||
BRF Global GmbH | BFF International Ltd. | US$ | 228,268 |
| 1.5% | |||
Hibridos Argentinos S.A. | Cabaña San Nestor S.A. | ARS | 222,482 |
| 20.0% | |||
Industria Frigorífica Expork S.A. | Degesa Argentina S.A. | ARS | 200,918 |
| 20.0% | |||
BRF GmbH | BRF Foods GmbH | US$ | 192,448 |
| 1.2% | |||
Hibridos Argentinos S.A. | Porcinos Cordobeses S.A. | ARS | 184,788 |
| 20.0% | |||
Sadia International Ltd. | Wellax Food Logistics | US$ | 181,902 | 1.5% | ||||
Campo Austral S.A. | Hibridos Argentinos S.A. | ARS | 175,191 | 20.0% | ||||
BRF GmbH | BRF Invicta | GBP | 154,905 |
| 3.0% | |||
Degesa Argentina S.A. | Cabaña San Nestor S.A. | ARS | 130,172 | 20.0% | ||||
Perdigão International Ltd. | BRF Global GmbH | US$ | 121,370 | 0.9% | ||||
Campo Austral S.A. | Itega S.A. | ARS | 93,961 | 20.0% | ||||
Industria Frigorífica Expork S.A. | Eporpam S.A. | ARS | 83,480 | 20.0% | ||||
BRF GmbH | BRF Holland B.V. | EUR | 81,674 | 3.0% | ||||
Industria Frigorífica Expork S.A. | Cabaña San Nestor S.A. | ARS | 74,991 | 20.0% | ||||
BRF GmbH | BRF Foods LLC | US$ | 62,037 | 2.5% | ||||
Degesa Argentina S.A. | Eporpam S.A. | ARS | 56,906 | 20.0% | ||||
Industria Frigorífica Expork S.A. | Hibridos Argentinos S.A. | ARS | 49,522 | 20.0% | ||||
Industria Frigorífica Expork S.A. | Porcinos Cordobeses S.A. | ARS | 43,862 | 20.0% | ||||
BRF Holland B.V. | BRF B.V. (NL) | EUR | 41,897 | 3.0% | ||||
Industria Frigorífica Expork S.A. | Campo Austral S.A. | ARS | 33,216 | 20.0% | ||||
Perdigão International Ltd. | BRF S.A | US$ | 26,567 | 0.8% | ||||
BRF Holland B.V. | BRF GmbH | EUR | 14,476 | 1.5% | ||||
BRF GmbH | AL Wafi | US$ | 9,454 | 1.2% | ||||
BRF GmbH | BRF Singapore | SGD | 4,830 | 1.5% | ||||
Perdigão International Ltd. | BRF Foods LLC | US$ | 3,912 | 1.0% | ||||
BRF Holland B.V. | BRF Wrexam | GBP | 2,366 | 3.0% | ||||
BRF GmbH | BRF Foods LLC | US$ | 2,270 | 1.6% | ||||
Wellax Food Logistics | BRF Foods LLC | US$ | 1,953 | 7.0% | ||||
BRF Holland B.V. | BRF Iberia | EUR | 1,623 | 3.0% | ||||
30.2. Other Related Parties
The Company has leased properties owned by FAF. For the six-month period ended June 30, 2016, the total amount paid as rent was R$7,276 (R$3,574 as of June 30, 2015). The rent value was set based on market conditions.
126
(CONVENIENCE TRANSLATION INTO ENGLISH FROM THE ORIGINAL PREVIOUSLY ISSUED IN PORTUGUESE)
ITR – Quarterly Information – June 30, 2016 – BRF S.A. Explanatory Notes (in thousands of Brazilian Reais)
|
30.3. Granted guarantees
All granted guarantees on behalf of related parties are disclosed in note 20.3.
30.4. Management compensation
The management key personnel include the directors and officers, members of the Board of Directors and the head of internal audit. As of June 30, 2016, there were 23 professionals (27 professionals as of December 31, 2015).
The total compensation and benefits paid to these professionals are demonstrated below:
Consolidated | |||
06.30.16 | 06.30.15 | ||
Salary and profit sharing | 14,166 | 20,520 | |
Short term benefits(1) | 275 | 434 | |
Private pension | 360 | 338 | |
Post-employment benefits | 92 | 92 | |
Termination benefits | 1,909 | 21,497 | |
Share based payment | 7,460 | 5,527 | |
24,262 | 48,408 | ||
(1) Comprises: Medical assistance, educational expenses and others.
127
(CONVENIENCE TRANSLATION INTO ENGLISH FROM THE ORIGINAL PREVIOUSLY ISSUED IN PORTUGUESE)
ITR – Quarterly Information – June 30, 2016 – BRF S.A. Explanatory Notes (in thousands of Brazilian Reais)
|
31. NET SALES
Parent company | Consolidated | ||||||
06.30.16 | 06.30.15 | 06.30.16 | 06.30.15 | ||||
Gross sales | |||||||
Brazil | 8,835,271 | 9,072,465 | 8,835,065 | 9,082,953 | |||
Europe | 1,325,599 | 1,070,338 | 2,119,010 | 1,574,638 | |||
MENA | 2,701,016 | 2,195,769 | 3,534,575 | 3,137,346 | |||
Africa | 368,111 | 257,232 | 378,888 | 340,399 | |||
Asia | 1,750,467 | 1,187,841 | 2,374,618 | 1,662,190 | |||
LATAM | 298,676 | 160,917 | 1,132,819 | 952,587 | |||
Other segments | 531,029 | 412,696 | 769,225 | 388,880 | |||
15,810,169 | 14,357,258 | 19,144,200 | 17,138,993 | ||||
Sales deductions | |||||||
Brazil | (1,728,743) | (1,693,058) | (1,728,710) | (1,693,551) | |||
Europe | (20,683) | (17,168) | (141,734) | (106,282) | |||
MENA | (28,883) | (12,561) | (350,831) | (214,899) | |||
Africa | (4,246) | (1,981) | (3,576) | (11,679) | |||
Asia | (43,926) | (10,344) | (42,406) | (18,879) | |||
LATAM | (1,709) | (1,107) | (184,294) | (101,618) | |||
Other segments | (51,822) | (33,924) | (57,751) | (31,209) | |||
(1,880,012) | (1,770,143) | (2,509,302) | (2,178,117) | ||||
|
|
|
| ||||
Net sales | |||||||
Brazil | 7,106,528 | 7,379,407 | 7,106,355 | 7,389,402 | |||
Europe | 1,304,916 | 1,053,170 | 1,977,276 | 1,468,356 | |||
MENA | 2,672,133 | 2,183,208 | 3,183,744 | 2,922,447 | |||
Africa | 363,865 | 255,251 | 375,312 | 328,720 | |||
Asia | 1,706,541 | 1,177,497 | 2,332,212 | 1,643,311 | |||
LATAM | 296,967 | 159,810 | 948,525 | 850,969 | |||
Other segments | 479,207 | 378,772 | 711,474 | 357,671 | |||
13,930,157 | 12,587,115 | 16,634,898 | 14,960,876 | ||||
32. RESEARCH AND DEVELOPMENT COSTS
Consist of expenditures on internal research and development of new products which are recognized when incurred. The expenditures amounted to R$23,216 for the six-month period ended June 30, 2016 (R$34,260 as of June 30, 2015).
128
(CONVENIENCE TRANSLATION INTO ENGLISH FROM THE ORIGINAL PREVIOUSLY ISSUED IN PORTUGUESE)
ITR – Quarterly Information – June 30, 2016 – BRF S.A. Explanatory Notes (in thousands of Brazilian Reais)
|
33. OTHER OPERATING INCOME (EXPENSES), NET
Parent company | Consolidated | ||||||
06.30.16 | 06.30.15 | 06.30.16 | 06.30.15 | ||||
Income | |||||||
Gain on business combination(1) | - | - | 58,812 | - | |||
Recovery of expenses(2) | 31,619 | 6,303 | 34,278 | 18,305 | |||
Provision reversal | 14,006 |
| - |
| 14,411 |
| - |
Other | 23,955 | 22,215 | 28,381 | 26,804 | |||
69,580 | 28,518 | 135,882 | 45,109 | ||||
Expenses | |||||||
Provision for civil, labor and tax risks | (50,745) | (23,942) | (48,147) | (25,150) | |||
Other employees benefits | (31,050) | (34,770) | (31,686) | (34,770) | |||
Idleness costs(3) | (17,386) | (39,147) | (30,622) | (56,274) | |||
Insurance claims costs | (17,022) | (22,980) | (16,959) | (22,973) | |||
Stock options plan | (16,493) | (9,634) | (16,493) | (9,634) | |||
Employees profit sharing | (6,872) | (141,657) | (9,042) | (172,096) | |||
Net loss on the disposals of property, plant and equipment | (9,885) | (16,840) | (8,413) | (15,399) | |||
Management profit sharing | (3,529) | (15,225) | (3,529) | (15,720) | |||
Allowance for doubtful accounts | (1,860) | - | (1,854) | - | |||
Restructuring charges | - | (48,510) | - | (57,852) | |||
Other | (26,095) | (85,961) | (37,264) | (97,347) | |||
(180,937) | (438,666) | (204,009) | (507,215) | ||||
(111,357) | (410,148) | (68,127) | (462,106) | ||||
(1) Gain from investment revaluation of the AKF (note 6.1.3) due to the appreciation of the entity’s shares, as a result of the new management model implemented after the BRF entering the business.
(2) The expenses recorded in the six-month period ended June 30, 2016 refer mainly to extemporaneous credit in the amount of R$19,479.
(3) Idleness cost includes depreciation charge R$6,939 (R$11,116 for the six-month period ended June 30, 2015) in the parent company and R$7,554 (R$11,523 for the six-month period ended June 30, 2015) in the consolidated.
129
(CONVENIENCE TRANSLATION INTO ENGLISH FROM THE ORIGINAL PREVIOUSLY ISSUED IN PORTUGUESE)
ITR – Quarterly Information – June 30, 2016 – BRF S.A. Explanatory Notes (in thousands of Brazilian Reais)
|
34. FINANCIAL INCOME (EXPENSES), NET
Parent company | Consolidated | ||||||
06.30.16 | 06.30.15 | 06.30.16 | 06.30.15 | ||||
Financial income | |||||||
Exchange rate variation on loans and financing | 1,454,940 | - | 1,453,310 | - | |||
Interest on assets | 156,945 | 135,504 | 160,602 | 139,293 | |||
Interest on cash and cash equivalents | 70,812 | 57,016 | 109,020 | 71,364 | |||
Interests on financial assets classified as | |||||||
Held to maturity | 41,940 | 15,620 | 41,940 | 15,620 | |||
Held for trading | 15,687 | 16,824 | 22,577 | 16,824 | |||
Available for sale | - | - | - | 6,537 | |||
Exchange rate variation on liabilities | 516,229 | - | - | - | |||
Exchange rate variation on other assets | - | 322,285 | - | 515,538 | |||
Gains from derivative transactions, net | - | 125,694 | - | 173,705 | |||
Financial income on accounts payable | - | 6,628 | - | 6,628 | |||
Exchange rate variation of foreign on net assets | - | - | - | 351,647 | |||
Exchange rate variation on marketable securities | - | 13,112 | - | 228,368 | |||
Others | - | 5,859 | - | 5,858 | |||
2,256,553 | 698,542 | 1,787,449 | 1,531,382 | ||||
Financial expenses | |||||||
Losses on derivative transactions, net | (1,009,654) | - | (996,217) | - | |||
Exchange rate variation of foreign on net assets(1) | - | - | (634,228) | - | |||
Interest on loans and financing | (458,972) | (286,493) | (546,582) | (371,136) | |||
Adjustment to present value | (159,894) | (99,126) | (159,715) | (98,282) | |||
Interest on liabilities | (119,167) | (77,542) | (124,369) | (79,736) | |||
Exchange rate variation on other liabilities | - | (225,385) | (98,448) | (549,740) | |||
Exchange rate variation on assets | (135,262) | - | (96,104) | - | |||
Financial expenses on accounts payable | (79,592) | - | (79,592) | - | |||
Exchange rate variation on marketable securities | (1,185) | - | (34,942) | - | |||
Exchange rate variation on loans and financing | - | (767,509) | - | (767,523) | |||
Premium paid for the repurchase of bonds (Tender Offer) | - | (246,208) | - | (310,322) | |||
Interest expenses on loans to related parties | (36,893) | (25,748) | - | - | |||
Others | (77,082) | (87,053) | (125,234) | (118,814) | |||
(2,077,701) | (1,815,064) | (2,895,431) | (2,295,553) | ||||
178,852 | (1,116,522) | (1,107,982) | (764,171) | ||||
(1)Refers to investments in subsidiaries whose functional currency is Brazilian Real.
130
(CONVENIENCE TRANSLATION INTO ENGLISH FROM THE ORIGINAL PREVIOUSLY ISSUED IN PORTUGUESE)
ITR – Quarterly Information – June 30, 2016 – BRF S.A. Explanatory Notes (in thousands of Brazilian Reais)
|
35. STATEMENT OF INCOME BY NATURE
The Company has chosen to disclose its statement of income by function and thus presents below the details by nature:
Parent company | Consolidated | ||||||
06.30.16 | 06.30.15 | 06.30.16 | 06.30.15 | ||||
Costs of sales | |||||||
Costs of goods | 7,510,940 | 6,353,342 | 9,129,293 | 6,939,827 | |||
Depreciation | 576,424 | 517,898 | 622,805 | 534,556 | |||
Amortization | 1,869 | 1,722 | 2,963 | 1,957 | |||
Salaries and employees benefits | 1,616,892 | 1,437,562 | 1,796,068 | 1,561,181 | |||
Others | 1,020,544 | 1,032,714 | 1,134,786 | 1,235,076 | |||
10,726,669 | 9,343,238 | 12,685,915 | 10,272,597 | ||||
Sales expenses | |||||||
Depreciation | 28,691 | 28,675 | 30,797 | 29,812 | |||
Amortization | 3,831 | 2,941 | 7,860 | 5,790 | |||
Salaries and employees benefits | 422,008 | 416,077 | 578,294 | 512,176 | |||
Indirect and direct logistics expenses | 845,427 | 950,625 | 1,088,561 | 1,073,976 | |||
Others | 529,082 | 481,651 | 732,208 | 616,205 | |||
1,829,039 | 1,879,969 | 2,437,720 | 2,237,959 | ||||
Administrative expenses | |||||||
Depreciation | 6,317 | 4,244 | 10,524 | 11,049 | |||
Amortization | 49,039 | 38,037 | 91,255 | 57,290 | |||
Salaries and employees benefits | 57,837 | 98,280 | 128,498 | 139,304 | |||
Fees | 14,783 | 12,993 | 14,850 | 13,114 | |||
Others | 16,143 | (17,732) | 30,933 | 1,660 | |||
144,119 | 135,822 | 276,060 | 222,417 | ||||
Other operating expenses(1) | |||||||
Depreciation | 6,939 | 11,116 | 7,554 | 11,523 | |||
Others | 173,998 | 427,550 | 196,455 | 495,692 | |||
180,937 | 438,666 | 204,009 | 507,215 | ||||
(1) The composition of other operating expenses is disclosed in note 33.
36. NEW ACCOUNTING STANDARDS AND PRONOUNCEMENTS RECENTLY ADOPTED AND NOT YET ADOPTED
During the six-month period ended June 30, 2016, the Company has not been required to adopted new accounting standards and pronouncements, though it’s necessary to read this interim financial statement in conjunction with the financial statements for the year ended December 31, 2015 in order to obtain the detail of recently adopted standards or not yet adopted.
131
(CONVENIENCE TRANSLATION INTO ENGLISH FROM THE ORIGINAL PREVIOUSLY ISSUED IN PORTUGUESE)
ITR – Quarterly Information – June 30, 2016 – BRF S.A. Explanatory Notes (in thousands of Brazilian Reais)
|
37. APPROVAL OF THE CONSOLIDATED FINANCIAL STATEMENTS
The consolidated financial statements were approved by the Board of Directors on April 28, 2016.
BOARD OF DIRECTORS |
|
|
|
Chairman (Independent) | Abilio dos Santos Diniz |
Vice-Chairman (Independent) | Renato Proença Lopes |
Independent Member | Henri Phelippe Reichstul |
Board Member | José Carlos Reis de Magalhães Neto |
Independent Member | Luiz Fernando Furlan |
Independent Member | Manoel Cordeiro Silva Filho |
Board Member | Aldemir Bendini |
Independent Member | Walter Fontana Filho |
Board Member | Vicente Falconi Campos |
|
|
FISCAL COUNCIL |
|
|
|
Independent Member | Attilio Guaspari |
Board Members | Marcus Vinicius Dias Severini |
Independent Member | Reginaldo Ferreira Alexandre
|
AUDIT COMITTÊE |
|
Comittee Coordinator | Sérgio Ricardo Silva Rosa |
Independent Member | Walter Fontana Filho |
External Member and Financial Specialist | Fernando Maida Dall Acqua |
Independent Member | Renato Proença Lopes |
BOARD OF EXECUTIVE OFFICERS |
|
|
|
Chief Executive Officer Global | Pedro de Andrade Faria |
Vice President of Finance, and Investor Relations | José Alexandre Carneiro Borges |
Vice President of Quality and Management | Rodrigo Reghini Vieira |
Vice President de Supply Chain | Hélio Rubens Mendes dos Santos |
Vice President of Legal and Corporate Relationships | José Roberto Pernomian Rodrigues |
Vice President of People | Artur Paranhos Tacla |
Vice President of Business (General Manager Brazil – Sales and Marketing) | Rafael Ivanisk Oliveira |
Vice President of Business (General Manager Brazil – Planning and Distribution) | Leonardo Almeida Byrro |
Marcos Roberto Badollato Joloir Nieblas Cavichini
Controller Accountant – CRC 1SP257406/O-5
132
(CONVENIENCE TRANSLATION INTO ENGLISH FROM THE ORIGINAL PREVIOUSLY ISSUED IN PORTUGUESE)
ITR – Quarterly Information – June 30, 2016 – BRF S.A. Explanatory Notes (in thousands of Brazilian Reais)
|
The shareholding position of the largest shareholders, management, members of the Board of Directors and Audit Committee of the Company is presented below:
06.30.16 | 12.31.15 | |||||||
Shareholders | Quantity | % | Quantity | % | ||||
Major shareholders | ||||||||
Tarpon | 97,032,185 | 11.94 | 91,529,085 | 10.49 | ||||
Fundação Petrobras de Seguridade Social - Petros(1) | 92,761,499 | 11.42 | 94,549,299 | 10.84 | ||||
Caixa de Previd. dos Func. Do Banco do Brasil(1) | 86,551,052 | 10.65 | 87,573,052 | 10.04 | ||||
Management | ||||||||
Board of Directors | 37,403,939 | 4.60 | 35,818,939 | 4.11 | ||||
Executives | 60,370 | 0.01 | 73,297 | 0.01 | ||||
Treasury shares | 13,505,317 | 1.66 | 62,501,001 | 7.16 | ||||
Other | 485,158,884 | 59.72 | 500,428,573 | 57.35 | ||||
812,473,246 | 100.00 | 872,473,246 | 100.00 | |||||
(1) The pension funds are controlled by employees that participate in the respective companies.
The shareholding position of the controlling shareholders that belong to the voting agreement and/or holders of more than 5% of the voting stock are presented below:
06.30.16 | 12.31.15 | |||||||
Shareholders | Quantity | % | Quantity | % | ||||
Tarpon | 97,032,185 | 11.94 | 91,529,085 | 10.49 | ||||
Fundação Petrobras de Seguridade Social - Petros(1) | 92,761,499 | 11.42 | 94,549,299 | 10.84 | ||||
Caixa de Previd. dos Func. Do Banco do Brasil(1) | 86,551,052 | 10.65 | 87,573,052 | 10.04 | ||||
276,344,736 | 34.01 | 273,651,436 | 31.37 | |||||
Other | 536,128,510 | 65.99 | 598,821,810 | 68.63 | ||||
812,473,246 | 100.00 | 872,473,246 | 100.00 | |||||
(1) The pension funds are controlled by employees that participate in the respective companies.
The Company is bound to arbitration in the Market Arbitration Chamber, as established by the arbitration clause in the by-laws.
133
(CONVENIENCE TRANSLATION INTO ENGLISH FROM THE ORIGINAL PREVIOUSLY ISSUED IN PORTUGUESE)
ITR – Quarterly Information – June 30, 2016 – BRF S.A. Breakdown of the Capital by Owner (Not reviewed)
|
Independent auditor’s report on review of quarterly financial information
The Shareholders and Officers
BRF S.A.
Itajaí - SC
Introduction
We have reviewed the accompanying individual and consolidated interim financial information of BRF S.A. (“Company”), contained in the Quarterly Information Form (ITR) for the quarter ended June 30, 2016, which comprise the balance sheet as at June 30, 2016 and the related statements of income and comprehensive income for the three and six months periods then ended, and statements of changes in equity and cash flows for the six months period then ended, including other explanatory information.
Management is responsible for the preparation of individual and consolidated interim financial information in accordance with Accounting Pronouncement CPC 21 (R1) - Demonstração Intermediária and International Accounting Standard IAS 34 - Interim Financial Reporting, issued by the International Accounting Standards Board (IASB), as well as for the presentation of this information in a manner consistent with the standards issued by the Brazilian Securities and Exchange Commission (CVM) applicable to the preparation of the Quarterly Information Form (ITR). Our responsibility is to express a conclusion on this interim financial information based on our review.
Scope of the review
We conducted our review in accordance with Brazilian and International Standards on Review Engagements (NBC TR 2410Revisão de Informações Intermediárias Executada pelo Auditor da Entidade) and ISRE 2410 - Review of Interim Financial Information Performed by the Independent Auditor of the Entity). A review of interim financial information consists of making inquiries, primarily of persons responsible for financial and accounting matters, and applying analytical and other review procedures. A review is substantially less in scope than an audit conducted in accordance with Brazilian and International Standards on Auditing and consequently does not enable us to obtain assurance that we would become aware of all significant matters that might be identified in an audit. Accordingly, we do not express an audit opinion.
Conclusion on the interim financial information
Based on our review, nothing has come to our attention that causes us to believe that the accompanying individual and consolidated interim financial information included in the quarterly information referred to above is not prepared, in all material respects, in accordance with CPC 21 (R1) and IAS 34, applicable to the preparation of quarterly financial information (ITR), consistently with the rules issued by the CVM.
134
A free translation from Portuguese into English of Independent Auditor’s Report on Review of Quarterly Financial Information
|
Other matters
Statements of value added
We have also reviewed the individual and consolidated statements of value added for the six-month period ended June 30, 2016, prepared under the responsibility of the Company’s management, the presentation of which in the interim financial information is required by the rules issued by the CVM applicable to the preparation of Quarterly Financial Information (ITR), and considered as supplementary information under IFRS – International Financial Reporting Standards, which does not require the presentation of the statement of value added. These statements have been subject to the same review procedures previously described and, based on our review, nothing has come to our attention that causes us to believe that they are not prepared, in all material respects, in a manner consistent with the overall individual and consolidated interim financial information.
São Paulo, April 28, 2015.
ERNST & YOUNG
Auditores Independentes S.S.
CRC-2SP015199/F-6
Antonio Humberto Barros dos Santos
Accountant CRC-1SP161745/O-3
135
A free translation from Portuguese into English of Independent Auditor’s Report on Review of Quarterly Financial Information
|
The Audit Committee of BRF S.A., in fulfilling its statutory and legal duties, reviewed:
(i) the quarterly financial information (parent company and consolidated) for the six-month period ended on June 30, 2016;
(ii) the Management Report; and
(iii) opinion report issued by Ernst & Young Auditores Independentes S.S.
Based on the documents reviewed and on the explanations provided, the members of the Audit Committee, undersigned, issued an opinion for the approval of the financial information identified above.
São Paulo, July 28, 2016.
Sergio Ricardo Silva Rosa
Committee Coordinator
Walter Fontana Filho
Independent Member
Fernando Maida Dall Acqua
External Member and Financial Specialist
Renato Proença Lopes
Independent Member
136
A free translation from Portuguese into English of Independent Auditor’s Report on Review of Quarterly Financial Information
|
In compliance with the dispositions of sections V and VI of article 25 of CVM Instruction No. 480/09, the executive board of BRF S.A., states:
(i) reviewed, discussed and agreed with the Company's quarterly financial information for the six-month period ended on June 30, 2016, and
(ii) reviewed, discussed and agreed with conclusions expressed in the review report issued by Ernst & Young Auditores Independentes S.S. for the Company's quarterly financial information for the six-month period ended on June 30, 2016.
São Paulo, July 28, 2016.
Pedro de Andrade Faria
Chief Executive Officer Global
José Alexandre Carneiro Borges
Vice President of Finance and Investor Relations
Rodrigo Reghini Vieira
Vice President of Quality and Management
Hélio Rubens Mendes dos Santos Junior
Vice President of Supply Chain
José Roberto Pernomian Rodrigues
Vice President of Legal and Corporate Relationships
Artur Paranhos Tacla
Vice President of People
Leonardo Almeida Byrro
Vice President of Business (General Manager Brazil – Planning and Distribution)
Rafael Ivanisk Oliveira
Vice President of Business (General Manager Brazil – Sales and Marketing)
137