
INDEX
| | |
BRF S.A. | INTERIM FINANCIAL INFORMATION – September 30, 2021 | 2 |
| | |
BRF S.A. | INTERIM FINANCIAL INFORMATION – September 30, 2021 | 3 |
STATEMENT OF FINANCIAL POSITION
| | | | Parent company | | Consolidated | | | | | Parent company | | Consolidated |
| ASSETS | Note | | 09.30.21 | | 12.31.20 | | 09.30.21 | | 12.31.20 | | LIABILITIES | Note | | 09.30.21 | | 12.31.20 | | 09.30.21 | | 12.31.20 |
| CURRENT ASSETS | | | | | | | | | | | CURRENT LIABILITIES | | | | | | | | | |
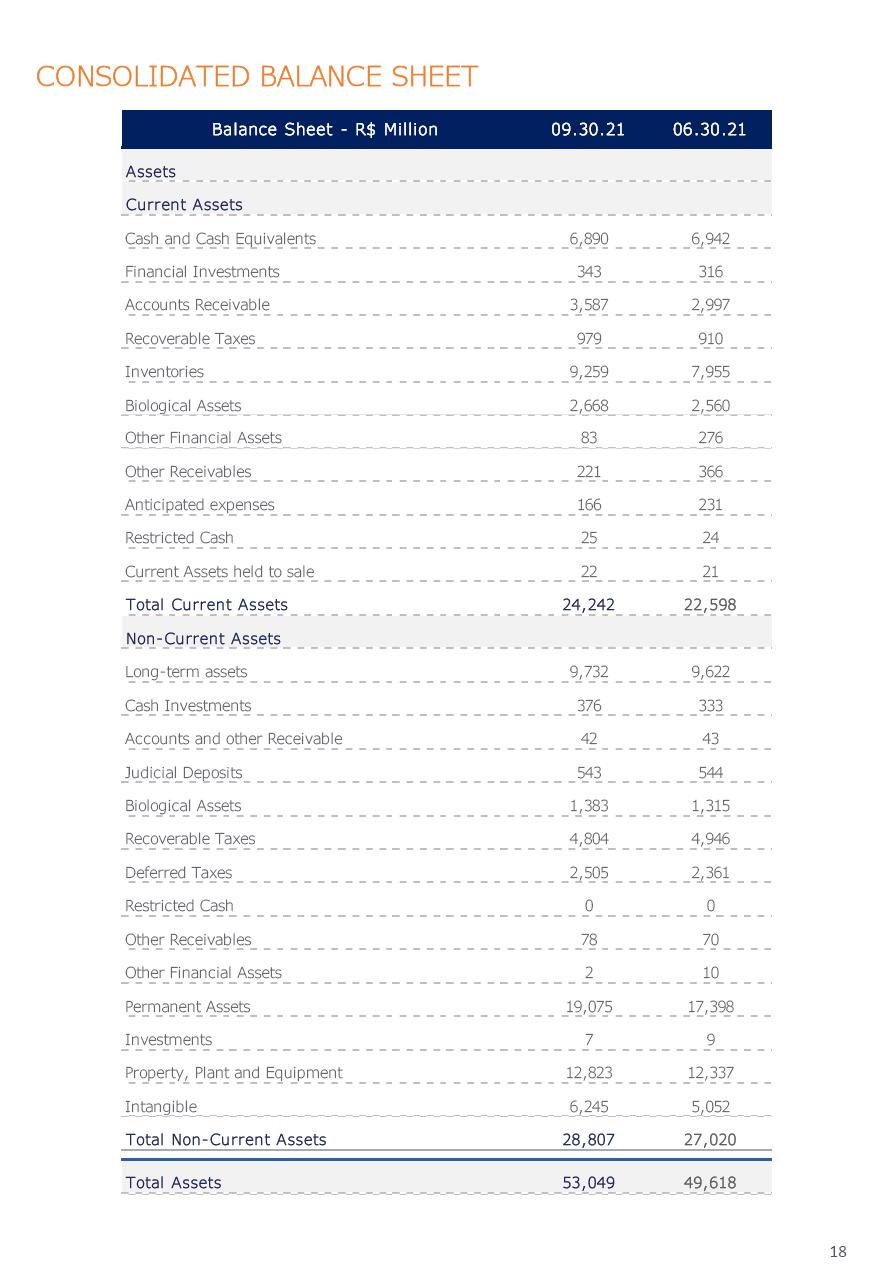
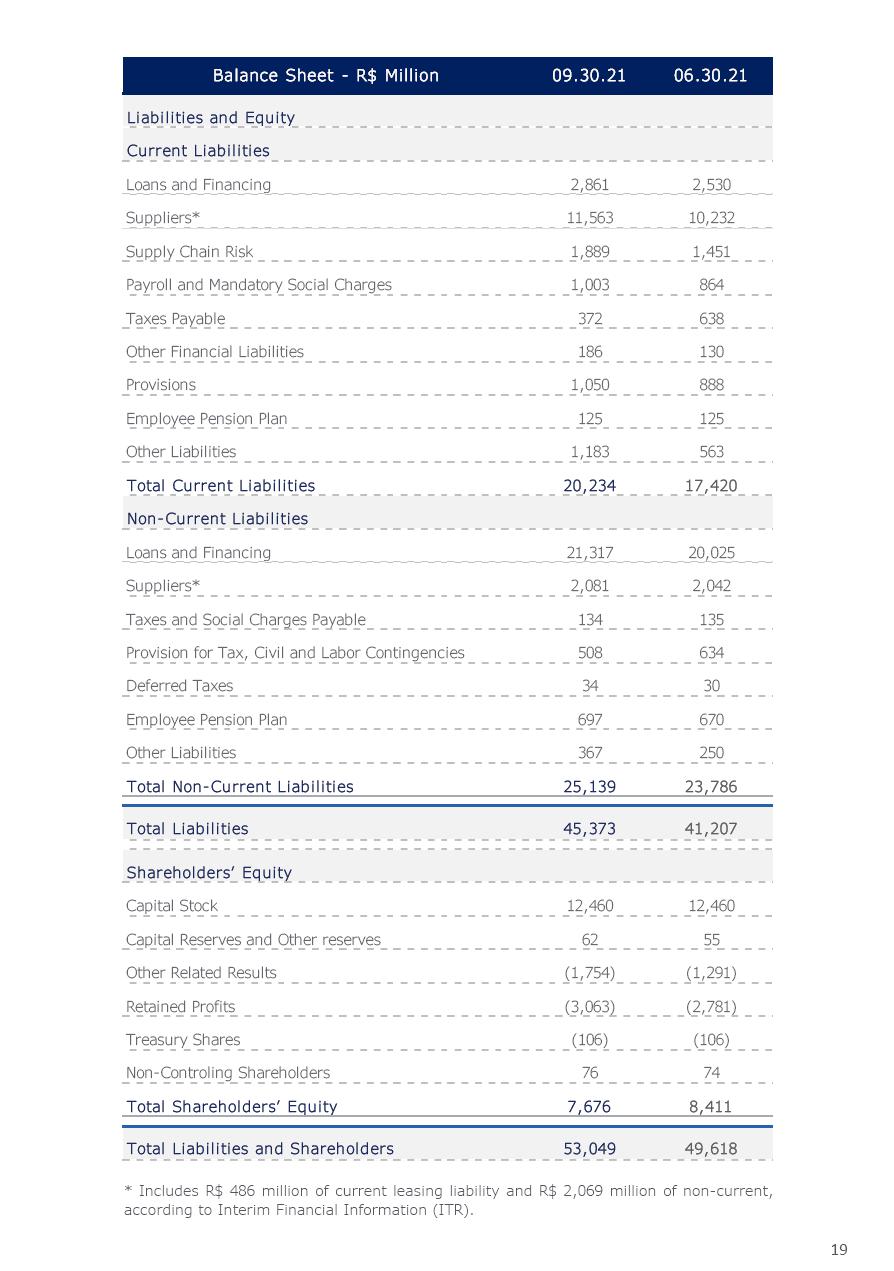
| Cash and cash equivalents | 4 | | 4,231,435 | | 3,876,139 | | 6,889,844 | | 7,576,625 | | Loans and borrowings | 15 | | 2,421,940 | | 811,919 | | 2,861,250 | | 1,059,984 |
| Marketable securities | 5 | | 318,893 | | 312,515 | | 343,182 | | 314,158 | | Trade accounts payable | 16 | | 9,922,746 | | 8,156,231 | | 11,077,197 | | 8,996,206 |
| Trade and other receivables | 6 | | 8,781,558 | | 5,254,064 | | 3,586,751 | | 4,136,421 | | Supply chain finance | 17 | | 1,889,219 | | 1,452,637 | | 1,889,219 | | 1,452,637 |
| Inventories | 7 | | 7,158,067 | | 5,161,261 | | 9,258,921 | | 6,802,759 | | Lease liability | 18 | | 367,085 | | 302,946 | | 485,905 | | 383,162 |
| Biological assets | 8 | | 2,569,929 | | 2,044,288 | | 2,668,065 | | 2,129,010 | | Payroll, related charges and employee profit sharing | | | 949,188 | | 860,836 | | 1,003,089 | | 940,816 |
| Recoverable taxes | 9 | | 776,456 | | 812,338 | | 883,740 | | 899,120 | | Taxes payable | | | 213,438 | | 268,347 | | 372,343 | | 395,630 |
| Recoverable income taxes | 9 | | 46,383 | | 28,888 | | 94,936 | | 43,840 | | Derivative financial instruments | 24 | | 185,270 | | 378,543 | | 186,147 | | 384,969 |
| Derivative financial instruments | 24 | | 79,921 | | 361,315 | | 83,144 | | 377,756 | | Provision for tax, civil and labor risks | 21 | | 1,046,122 | | 860,889 | | 1,050,188 | | 865,338 |
| Restricted cash | | | 24,529 | | 1 | | 24,529 | | 1 | | Employee benefits | 20 | | 114,938 | | 114,938 | | 125,312 | | 125,230 |
| Assets held for sale | | | 5,000 | | 15,637 | | 21,773 | | 186,025 | | Advances from related parties | 30 | | 14,250,968 | | 8,960,394 | | - | | - |
| Other current assets | | | 303,320 | | 348,722 | | 387,341 | | 446,269 | | Liabilities directly associated with assets held for sale | | | - | | - | | - | | 21,718 |
| | | | | | | | | | | | Other current liabilities | | | 247,447 | | 335,137 | | 1,183,243 | | 814,638 |
| Total current assets | | | 24,295,491 | | 18,215,168 | | 24,242,226 | | 22,911,984 | | Total current liabilities | | | 31,608,361 | | 22,502,817 | | 20,233,893 | | 15,440,328 |
| | | | | | | | | | | | | | | | | | | | | |
| NON-CURRENT ASSETS | | | | | | | | | | | NON-CURRENT LIABILITIES | | | | | | | | | |
| LONG-TERM RECEIVALBLES | | | | | | | | | | | Loans and borrowings | 15 | | 18,335,459 | | 18,498,335 | | 21,317,352 | | 21,344,442 |
| Marketable securities | 5 | | 14,966 | | 15,044 | | 375,906 | | 344,577 | | Trade accounts payable | 16 | | 11,999 | | 13,781 | | 11,999 | | 13,781 |
| Trade and other receivables | 6 | | 41,550 | | 49,569 | | 41,886 | | 49,864 | | Lease liability | 18 | | 1,843,364 | | 1,965,748 | | 2,069,305 | | 2,153,519 |
| Recoverable taxes | 9 | | 4,734,542 | | 4,868,219 | | 4,743,657 | | 4,868,198 | | Taxes payable | | | 132,815 | | 141,252 | | 133,560 | | 141,252 |
| Recoverable income taxes | 9 | | 54,327 | | 54,123 | | 59,864 | | 54,859 | | Provision for tax, civil and labor risks | 21 | | 499,421 | | 837,106 | | 508,353 | | 837,382 |
| Deferred income taxes | 10 | | 2,454,669 | | 2,068,769 | | 2,505,005 | | 2,109,064 | | Deferred income taxes | 10 | | - | | - | | 34,482 | | 26,527 |
| Judicial deposits | 11 | | 539,770 | | 553,276 | | 543,106 | | 553,341 | | Liabilities with related parties | 30 | | 45,001 | | 41,892 | | - | | - |
| Biological assets | 8 | | 1,310,156 | | 1,154,726 | | 1,382,832 | | 1,221,749 | | Employee benefits | 20 | | 551,809 | | 521,855 | | 696,862 | | 651,325 |
| Receivables from related parties | 30 | | 340 | | 315 | | - | | - | | Derivative financial instruments | 24 | | 36,077 | | 727 | | 36,077 | | 727 |
| Derivative financial instruments | 24 | | 2,139 | | 234 | | 2,139 | | 234 | | Other non-current liabilities | | | 255,882 | | 249,691 | | 330,719 | | 242,089 |
| Restricted cash | | | 1 | | 24,357 | | 1 | | 24,357 | | | | | | | | | | | |
| Other non-current assets | | | 71,152 | | 77,829 | | 77,528 | | 82,123 | | | | | | | | | | | |
| Total long-term receivables | | | 9,223,612 | | 8,866,461 | | 9,731,924 | | 9,308,366 | | Total non-current liabilities | | | 21,711,827 | | 22,270,387 | | 25,138,709 | | 25,411,044 |
| | | | | | | | | | | | | | | | | | | | | |
| | | | | | | | | | | | | | | | | | | | | |
| | | | | | | | | | | | EQUITY | 22 | | | | | | | | |
| | | | | | | | | | | | Capital | | | 12,460,471 | | 12,460,471 | | 12,460,471 | | 12,460,471 |
| | | | | | | | | | | | Capital reserves | | | 141,834 | | 141,834 | | 141,834 | | 141,834 |
| | | | | | | | | | | | Other equity transactions | | | (80,313) | | 246 | | (80,313) | | 246 |
| Investments | 12 | | 12,710,877 | | 11,922,325 | | 6,911 | | 8,874 | | Accumulated losses | | | (3,062,798) | | (2,594,028) | | (3,062,798) | | (2,594,028) |
| Property, plant and equipment, net | 13 | | 11,482,643 | | 11,168,558 | | 12,822,742 | | 12,215,580 | | Treasury shares | | | (105,620) | | (123,938) | | (105,620) | | (123,938) |
| Intangible assets | 14 | | 3,207,412 | | 3,186,476 | | 6,245,045 | | 5,220,102 | | Other comprehensive loss | | | (1,753,727) | | (1,298,801) | | (1,753,727) | | (1,298,801) |
| | | | | | | | | | | | Attributable to controlling shareholders | | | 7,599,847 | | 8,585,784 | | 7,599,847 | | 8,585,784 |
| | | | | | | | | | | | Non-controlling interests | | | - | | - | | 76,399 | | 227,750 |
| Total non-current assets | | | 36,624,544 | | 35,143,820 | | 28,806,622 | | 26,752,922 | | Total equity | | | 7,599,847 | | 8,585,784 | | 7,676,246 | | 8,813,534 |
| | | | | | | | | | | | | | | | | | | | | |
| TOTAL ASSETS | | | 60,920,035 | | 53,358,988 | | 53,048,848 | | 49,664,906 | | TOTAL LIABILITIES AND EQUITY | | | 60,920,035 | | 53,358,988 | | 53,048,848 | | 49,664,906 |
The accompanying notes are an integral part of the financial statements.
| | |
BRF S.A. | INTERIM FINANCIAL INFORMATION – September 30, 2021 | 4 |
STATEMENT OF INCOME (LOSS)
| | | | Parent company | | Consolidated |
| | | | | | 2021 | | | | 2020 | | | | 2021 | | | | 2020 |
| | Note | | Jul - Sep | | Jan - Sep | | Jul - Sep | | Jan - Sep | | Jul - Sep | | Jan - Sep | | Jul - Sep | | Jan - Sep |
| CONTINUING OPERATIONS | | | | | | | | | | | | | | | | | |
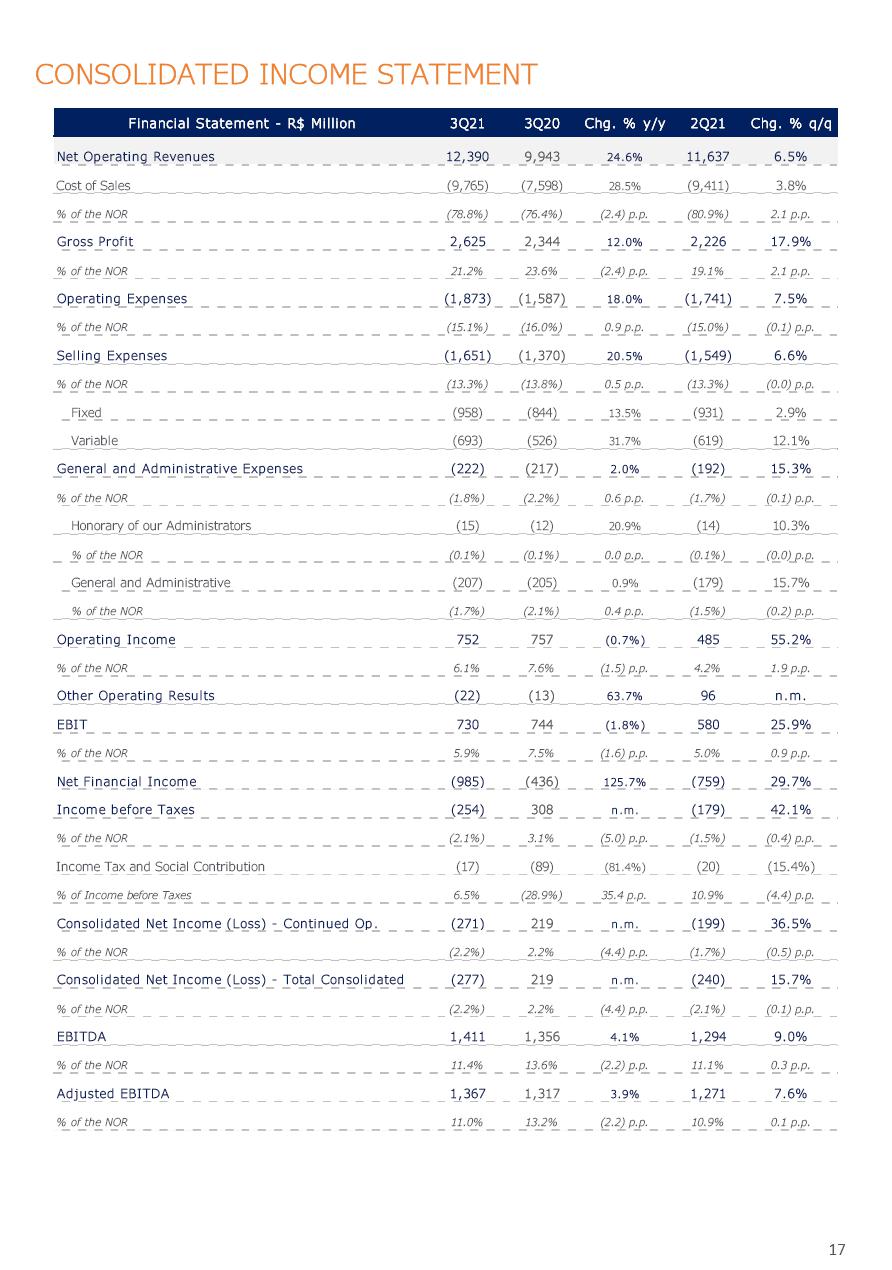
| NET SALES | 26 | | 11,082,728 | | 30,605,434 | | 8,204,499 | | 22,716,953 | | 12,389,985 | | 34,618,863 | | 9,942,591 | | 27,995,582 |
| Cost of sales | 29 | | (8,828,583) | | (24,499,439) | | (6,621,317) | | (18,633,112) | | (9,765,303) | | (27,573,239) | | (7,598,133) | | (21,419,255) |
| GROSS PROFIT | | | 2,254,145 | | 6,105,995 | | 1,583,182 | | 4,083,841 | | 2,624,682 | | 7,045,624 | | 2,344,458 | | 6,576,327 |
| OPERATING INCOME (EXPENSES) | | | | | | | | | | | | | | | | | |
| Selling expenses | 29 | | (1,336,551) | | (3,685,525) | | (1,059,722) | | (3,150,070) | | (1,647,761) | | (4,624,899) | | (1,366,469) | | (4,011,692) |
| General and administrative expenses | 29 | | (151,101) | | (376,954) | | (150,800) | | (360,690) | | (221,707) | | (573,966) | | (217,348) | | (550,373) |
| Impairment loss on trade receivables | 6 | | (2,318) | | (8,034) | | 2,228 | | (6,850) | | (3,135) | | (11,627) | | (3,371) | | (15,126) |
| Other operating income (expenses), net | 27 | | (66,689) | | 34,700 | | 1,249 | | (82,861) | | (21,599) | | 103,581 | | (13,193) | | (113,193) |
| Income from associates and joint ventures | 12 | | 767,247 | | 72,400 | | 1,118,703 | | 7,192,215 | | - | | - | | - | | - |
| INCOME BEFORE FINANCIAL RESULTS AND INCOME TAXES | | 1,464,733 | | 2,142,582 | | 1,494,840 | | 7,675,585 | | 730,480 | | 1,938,713 | | 744,077 | | 1,885,943 |
| Financial income | | | 110,336 | | 285,777 | | 59,604 | | 232,713 | | 133,806 | | 340,283 | | 72,702 | | 267,413 |
| Financial expenses | | | (715,619) | | (2,192,668) | | (749,766) | | (1,942,389) | | (1,047,189) | | (2,470,878) | | (591,666) | | (1,327,579) |
| Foreign exchange and monetary variations | | | (1,109,200) | | (691,061) | | (544,720) | | (5,396,236) | | (71,575) | | (216,381) | | 82,545 | | (173,025) |
| FINANCIAL INCOME (EXPENSES), NET | 28 | | (1,714,483) | | (2,597,952) | | (1,234,882) | | (7,105,912) | | (984,958) | | (2,346,976) | | (436,419) | | (1,233,191) |
| INCOME (LOSS) BEFORE TAXES | | | (249,750) | | (455,370) | | 259,958 | | 569,673 | | (254,478) | | (408,263) | | 307,658 | | 652,752 |
| Income taxes | 10 | | (25,850) | | 1,356 | | (43,167) | | (94,933) | | (16,505) | | (38,818) | | (88,949) | | (165,146) |
| INCOME (LOSS) FROM CONTINUING OPERATIONS | | | (275,600) | | (454,014) | | 216,791 | | 474,740 | | (270,983) | | (447,081) | | 218,709 | | 487,606 |
| | | | | | | | | | | | | | | | | | |
| LOSS FROM DISCONTINUED OPERATIONS | | | (6,516) | | (47,802) | | - | | - | | (6,516) | | (47,802) | | - | | - |
| INCOME (LOSS) FOR THE PERIOD | | | (282,116) | | (501,816) | | 216,791 | | 474,740 | | (277,499) | | (494,883) | | 218,709 | | 487,606 |
| | | | | | | | | | | | | | | | | | |
| Net Income (loss) from Continuing Operation Attributable to | | | | | | | | | | | | | | | | | |
| Controlling shareholders | | | (275,600) | | (454,014) | | 216,791 | | 474,740 | | (275,600) | | (454,014) | | 216,791 | | 474,740 |
| Non-controlling interest | | | - | | - | | - | | - | | 4,617 | | 6,933 | | 1,918 | | 12,866 |
| | | | (275,600) | | (454,014) | | 216,791 | | 474,740 | | (270,983) | | (447,081) | | 218,709 | | 487,606 |
| | | | | | | | | | | | | | | | | | |
| Net Loss From Discontinued Operations Attributable to | | | | | | | | | | | | | | | | | |
| Controlling shareholders | | | (6,516) | | (47,802) | | - | | - | | (6,516) | | (47,802) | | - | | - |
| Non-controlling interest | | | - | | - | | - | | - | | - | | - | | - | | - |
| | | | (6,516) | | (47,802) | | - | | - | | (6,516) | | (47,802) | | - | | - |
| | | | | | | | | | | | | | | | | | |
| INCOME (LOSS) PER SHARE FROM CONTINUED OPERATIONS | | | | | | | | | | | | | | | | | |
| Weighted average shares outstanding - basic | | | | | | | | | | | 807,709,278 | | 808,013,781 | | 807,406,368 | | 809,583,921 |
| Income (loss) per share - basic | 23 | | | | | | | | | | (0.34) | | (0.56) | | 0.27 | | 0.59 |
| Weighted average shares outstanding - diluted | | | | | | | | | | | 807,709,278 | | 808,013,781 | | 807,464,700 | | 809,642,253 |
| Income (loss) per share - diluted | 23 | | | | | | | | | | (0.34) | | (0.56) | | 0.27 | | 0.59 |
| | | | | | | | | | | | | | | | | | |
| LOSSES PER SHARE FROM DISCONTINUED OPERATIONS | | | | | | | | | | | | | | | | | |
| Weighted average shares outstanding - basic | | | | | | | | | | | 807,709,278 | | 808,013,781 | | - | | - |
| Losses per share - basic | 23 | | | | | | | | | | (0.01) | | (0.06) | | - | | - |
| Weighted average shares outstanding - diluted | | | | | | | | | | | 807,709,278 | | 808,013,781 | | - | | - |
| Losses per share - diluted | 23 | | | | | | | | | | (0.01) | | (0.06) | | - | | - |
The accompanying notes are an integral part of the financial statements.
| | |
BRF S.A. | INTERIM FINANCIAL INFORMATION – September 30, 2021 | 5 |
STATEMENT OF COMPREHENSIVE INCOME (LOSS)
| | | | Parent company | | Consolidated |
| | | | | | 2021 | | | | 2020 | | | | 2021 | | | | 2020 |
| | Note | | Jul - Sep | | Jan - Sep | | Jul - Sep | | Jan - Sep | | Jul - Sep | | Jan - Sep | | Jul - Sep | | Jan - Sep |
| Income (loss) for the period | | | (282,116) | | (501,816) | | 216,791 | | 474,740 | | (277,499) | | (494,883) | | 218,709 | | 487,606 |
| Other comprehensive income (loss) | | | | | | | | | | | | | | | | | |
| Loss on foreign currency translation of foreign operations | | | (62,480) | | (159,117) | | (91,751) | | (240,273) | | (64,635) | | (204,216) | | (90,273) | | (195,970) |
| Loss on net investment hedge | | | (106,956) | | (61,079) | | (43,428) | | (385,539) | | (106,956) | | (61,079) | | (43,428) | | (385,539) |
| Gain (loss) on cash flow hedge | 24 | | (296,679) | | (239,566) | | 197,296 | | (544,187) | | (296,612) | | (239,499) | | 197,296 | | (544,187) |
| Gain on debt investments measured at FVTOCI (1) | 5 | | - | | - | | 348 | | 178 | | - | | - | | 348 | | 178 |
| Net other comprehensive income (loss), to be reclassified to the statement of income in subsequent periods | | | (466,115) | | (459,762) | | 62,465 | | (1,169,821) | | (468,203) | | (504,794) | | 63,943 | | (1,125,518) |
| Gain (loss) on equity investments measured at FVTOCI (1) | 5 | | - | | 26,030 | | (924) | | 4,079 | | - | | 26,030 | | (924) | | 4,079 |
| Actuarial gains on pension and post-employment plans | 20 | | 3,753 | | 11,852 | | 7,194 | | 20,229 | | 3,694 | | 11,729 | | 7,170 | | 20,134 |
| Net other comprehensive income, with no impact into subsequent statement of income | | | 3,753 | | 37,882 | | 6,270 | | 24,308 | | 3,694 | | 37,759 | | 6,246 | | 24,213 |
| Comprehensive income (loss), net of taxes | | | (744,478) | | (923,696) | | 285,526 | | (670,773) | | (742,008) | | (961,918) | | 288,898 | | (613,699) |
| Attributable to | | | | | | | | | | | | | | | | | |
| Controlling shareholders | | | (744,478) | | (923,696) | | 285,526 | | (670,773) | | (744,478) | | (923,696) | | 285,526 | | (670,773) |
| Non-controlling interest | | | - | | - | | - | | - | | 2,470 | | (38,222) | | 3,372 | | 57,074 |
| | | | (744,478) | | (923,696) | | 285,526 | | (670,773) | | (742,008) | | (961,918) | | 288,898 | | (613,699) |
| (1) | FVTOCI: Fair Value Through Other Comprehensive Income. |
Items above are stated net of income taxes and the related taxes are disclosed in note 10.
The accompanying notes are an integral part of the financial statements.
| | |
BRF S.A. | INTERIM FINANCIAL INFORMATION – September 30, 2021 | 6 |
STATEMENT OF CHANGES IN EQUITY
| | | Attributed to controlling shareholders |
| | | | | | | | | | | Other comprehensive income (loss) | | | | | | | | |
| | | Capital | | Capital reserves | Other equity transactions (4) | | Treasury shares | | Accumulated foreign currency translation adjustments | | Gains (losses) on marketable securities at FVTOCI (2) | | Gains (losses) on cash flow hedge | | Actuarial gains (losses) | | Retained losses | | Total equity | | Non-controlling interest | | Total shareholders' equity
(consolidated) |
| BALANCES AT DECEMBER 31, 2019 | | 12,460,471 | | 141,834 | | 51,011 | | (38,239) | | (193,379) | | 4,454 | | (356,721) | | (176,823) | | (3,996,985) | | 7,895,623 | | 252,726 | | 8,148,349 |
| Comprehensive income (loss) (1) | | | | | | | | | | | | | | | | | | | | | | | | |
| Gains (losses) on foreign currency translation of foreign operations | | - | | - | | - | | - | | (207,734) | | - | | - | | - | | - | | (207,734) | | 28,308 | | (179,426) |
| Loss on net investment hedge | | - | | - | | - | | - | | (277,856) | | - | | - | | - | | - | | (277,856) | | - | | (277,856) |
| Unrealized gains on marketable securities at FVTOCI (2) | | - | | - | | - | | - | | - | | 2,562 | | - | | - | | - | | 2,562 | | - | | 2,562 |
| Unrealized losses in cash flow hedge | | - | | - | | - | | - | | - | | - | | (81,500) | | - | | - | | (81,500) | | - | | (81,500) |
| Actuarial losses on pension and post-employment plans | | - | | - | | - | | - | | - | | - | | - | | 7,589 | | - | | 7,589 | | (468) | | 7,121 |
| Income for the year | | - | | - | | - | | - | | - | | - | | - | | - | | 1,383,564 | | 1,383,564 | | 6,505 | | 1,390,069 |
| SUB-TOTAL COMPREHENSIVE INCOME (LOSS) | | - | | - | | - | | - | | (485,590) | | 2,562 | | (81,500) | | 7,589 | | 1,383,564 | | 826,625 | | 34,345 | | 860,970 |
| Employee benefits remeasurement - defined benefit | | - | | - | | | | - | | - | | - | | - | | (19,393) | | 19,393 | | - | | - | | - |
| Appropriation of income (loss) | | | | | | | | | | | | | | | | | | | | | | | | |
| Dividends | | - | | - | | - | | - | | - | | - | | - | | - | | - | | - | | (4,458) | | (4,458) |
| Share-based payments | | - | | - | | 180 | | 20,371 | | - | | - | | - | | - | | - | | 20,551 | | - | | 20,551 |
| Acquisition of non-controlling interests | | - | | - | | (50,945) | | - | | - | | - | | - | | - | | - | | (50,945) | | (54,863) | | (105,808) |
| Acquisition of treasury shares | | - | | - | | - | | (106,070) | | - | | - | | - | | - | | - | | (106,070) | | - | | (106,070) |
| BALANCES AT DECEMBER 31, 2020 | | 12,460,471 | | 141,834 | | 246 | | (123,938) | | (678,969) | | 7,016 | | (438,221) | | (188,627) | | (2,594,028) | | 8,585,784 | | 227,750 | | 8,813,534 |
| Comprehensive income (loss) (1) | | | | | | | | | | | | | | | | | | | | | | | | |
| Losses on foreign currency translation of foreign operations | | - | | - | | - | | - | | (159,117) | | - | | - | | - | | - | | (159,117) | | (45,099) | | (204,216) |
| Losses on net investment hedge | | - | | - | | - | | - | | (61,079) | | - | | - | | - | | - | | (61,079) | | - | | (61,079) |
| Unrealized gains on marketable securities at FVTOCI (2) | | - | | - | | - | | - | | - | | 26,030 | | - | | - | | - | | 26,030 | | - | | 26,030 |
| Unrealized gains (losses) in cash flow hedge | | - | | - | | - | | - | | - | | - | | (239,566) | | - | | - | | (239,566) | | 67 | | (239,499) |
| Actuarial gains (losses) on pension and post-employment plans | | - | | - | | - | | - | | - | | - | | - | | 11,852 | | - | | 11,852 | | (123) | | 11,729 |
| Income (loss) for the period | | - | | - | | - | | - | | - | | - | | - | | - | | (501,816) | | (501,816) | | 6,933 | | (494,883) |
| SUB-TOTAL COMPREHENSIVE INCOME (LOSS) | | - | | - | | - | | - | | (220,196) | | 26,030 | | (239,566) | | 11,852 | | (501,816) | | (923,696) | | (38,222) | | (961,918) |
| Realized gain in marketable securities at FVTOCI (2) | | - | | - | | | | - | | - | | (33,046) | | - | | - | | 33,046 | | - | | - | | - |
| Dividends | | - | | - | | | | - | | - | | - | | - | | - | | - | | - | | (80) | | (80) |
| Share-based payments | | - | | - | | (886) | | 18,318 | | - | | - | | - | | - | | - | | 17,432 | | - | | 17,432 |
| Acquisition of non-controlling interests (3) | | - | | - | | (79,673) | | - | | - | | - | | - | | - | | - | | (79,673) | | (113,049) | | (192,722) |
| BALANCES AT SEPTEMBER 30, 2021 | | 12,460,471 | | 141,834 | | (80,313) | | (105,620) | | (899,165) | | - | | (677,787) | | (176,775) | | (3,062,798) | | 7,599,847 | | 76,399 | | 7,676,246 |
| (1) | All changes in other comprehensive income are presented net of taxes. |
| (2) | FVTOCI: Fair Value Through Other Comprehensive Income. |
| (3) | Acquisition of remaining participation in the subsidiary AFC (note 1.1). |
| (4) | Comparative period was restated as described in note 22.2. |
The accompanying notes are an integral part of the financial statements.
| | |
BRF S.A. | INTERIM FINANCIAL INFORMATION – September 30, 2021 | 7 |
STATEMENT OF CASH FLOWS
| | Parent company | | Consolidated |
| | 2021 | | 2020 | | 2021 | | 2020 |
| | | | Restated (4) | | | | Restated (4) |
| | Jan - Sep | | Jan - Sep | | Jan - Sep | | Jan - Sep |
| OPERATING ACTIVITIES | | | | | | | |
| Income (loss) from continuing operations | (454,014) | | 474,740 | | (447,081) | | 487,606 |
| Adjustments for: | | | | | | | |
| Depreciation and amortization | 1,023,786 | | 936,404 | | 1,301,510 | | 1,127,954 |
| Depreciation and depletion of biological assets | 689,098 | | 578,814 | | 754,783 | | 645,551 |
| Result on disposal of property, plant and equipments and investment | (16,790) | | 15,778 | | (89,775) | | 24,279 |
| Write-down of inventories to net realizable value | 54,950 | | 70,454 | | 68,965 | | 96,916 |
| Provision for tax, civil and labor risks | 74,065 | | 259,250 | | 73,645 | | 260,311 |
| Income from investments under the equity method | (72,400) | | (7,192,215) | | - | | - |
| Financial results, net | 2,597,952 | | 7,105,912 | | 2,346,976 | | 1,233,191 |
| Tax recoveries and gains in tax lawsuits | (64,877) | | (294,890) | | (64,877) | | (294,890) |
| Deferred income tax | (257,446) | | 94,933 | | (271,803) | | 118,451 |
| Employee profit sharing | 49,624 | | 162,526 | | 65,255 | | 159,669 |
| Other provisions | 2,199 | | 258,920 | | 5,790 | | 271,994 |
| | 3,626,147 | | 2,470,626 | | 3,743,388 | | 4,131,032 |
| Trade accounts receivable | (3,472,227) | | (295,819) | | 849,748 | | 827,060 |
| Inventories | (2,051,756) | | (1,970,849) | | (2,385,327) | | (1,980,815) |
| Biological assets - current | (525,641) | | (284,663) | | (551,526) | | (295,995) |
| Trade accounts payable | 1,095,564 | | 1,384,016 | | 1,181,000 | | 1,521,185 |
| Supply chain finance | 443,092 | | 282,351 | | 443,092 | | 282,351 |
| Cash generated (applied) by operating activities | (884,821) | | 1,585,662 | | 3,280,375 | | 4,484,818 |
| Investments in securities at FVTPL (1) | (23,894) | | 2,800 | | (46,695) | | - |
| Redemptions of securities at FVTPL (1) | 36,628 | | 99,264 | | 66,797 | | 102,172 |
| Interest received | 60,108 | | 69,305 | | 61,872 | | 77,686 |
| Dividends and interest on shareholders' equity received | 10 | | 304,055 | | - | | - |
| Payment of tax, civil and labor provisions | (269,701) | | (215,439) | | (269,704) | | (215,439) |
| Derivative financial instruments | (55,913) | | 1,253,570 | | (35,097) | | 1,285,272 |
| Payment of income taxes | - | | - | | - | | (152) |
| Other operating assets and liabilities (2) | 4,101,282 | | (133,030) | | (123,894) | | 378,166 |
| Net cash provided by operating activities | 2,963,699 | | 2,966,187 | | 2,933,654 | | 6,112,523 |
| | | | | | | | |
| INVESTING ACTIVITIES | | | | | | | |
| Investments in securities at amortized cost | - | | - | | (4,060) | | - |
| Redemptions of securities at amortized cost | - | | - | | 166,112 | | - |
| Investments in securities at FVTOCI (3) | - | | - | | (12,866) | | - |
| Redemptions of securities at FVTOCI (3) | - | | - | | 86,059 | | 26,352 |
| Redemption of restricted cash | 400 | | 285,622 | | 400 | | 285,622 |
| Additions to property, plant and equipment | (958,688) | | (512,105) | | (1,050,838) | | (542,600) |
| Additions to biological assets - non-current | (843,281) | | (656,499) | | (922,801) | | (725,484) |
| Proceeds from disposals of property, plant, equipments and investment | 49,340 | | 69,696 | | 49,340 | | 69,696 |
| Additions to intangible assets | (137,760) | | (82,437) | | (133,436) | | (74,384) |
| Business combination, net of cash | (581) | | - | | (983,709) | | - |
| Sale of participation in subsidiaries with loss of control | - | | - | | 132,951 | | 38,546 |
| Acquisition of participation in joint ventures and subsidiaries | 1,973 | | (819) | | 1,974 | | (819) |
| Capital increase in associates | (87,398) | | (5,000) | | - | | - |
| Net cash used in investing activities | (1,975,995) | | (901,542) | | (2,670,874) | | (923,071) |
| Net cash provided by investing activities from discontinued operations | - | | - | | (17,550) | | - |
| Net cash used in investing activities | (1,975,995) | | (901,542) | | (2,688,424) | | (923,071) |
| | | | | | | | |
| FINANCING ACTIVITIES | | | | | | | |
| Proceeds from debt issuance | 1,578,249 | | 8,041,948 | | 1,831,117 | | 8,666,404 |
| Repayment of debt | (894,772) | | (5,975,345) | | (980,677) | | (6,360,934) |
| Payment of interest | (911,775) | | (851,575) | | (1,021,601) | | (1,002,146) |
| Payment of interest derivatives - fair value hedge | (1,086) | | - | | (1,086) | | - |
| Treasury shares acquisition | - | | (106,070) | | - | | (106,070) |
| Acquisition of non-controlling interests | - | | - | | (238,421) | | (100,390) |
| Payment of lease liabilities | (415,266) | | (339,198) | | (548,911) | | (402,259) |
| Net cash provided by (used in) financing activities | (644,650) | | 769,760 | | (959,579) | | 694,605 |
| EFFECT OF EXCHANGE RATE VARIATION ON CASH AND CASH EQUIVALENTS | 12,242 | | 298,432 | | 27,568 | | 1,276,745 |
| Net increase (decrease) in cash and cash equivalents | 355,296 | | 3,132,837 | | (686,781) | | 7,160,802 |
| Balance at the beginning of the period | 3,876,139 | | 1,368,980 | | 7,576,625 | | 4,237,785 |
| Balance at the end of the period | 4,231,435 | | 4,501,817 | | 6,889,844 | | 11,398,587 |
| (1) | FVTPL: Fair Value Through Profit and Loss. |
| (2) | In the Parent company, contemplates mainly the effects of prepayments of exports with subsidiaries in the amount of R$(4,998,148) in the nine-month period ended on September 30, 2021 (R$2,592,522) in the same period of the previous year). |
| (3) | FVTOCI: Fair Value Through Other Comprehensive Income. |
| (4) | Restated according to reclassifications described in note 3. |
The accompanying notes are an integral part of the financial statements.
| | |
BRF S.A. | INTERIM FINANCIAL INFORMATION – September 30, 2021 | 8 |
STATEMENT OF VALUE ADDED
| | | Parent company | | Consolidated |
| | | 2021 | | 2020 | | 2021 | | 2020 |
| | | Jan - Sep | | Jan - Sep | | Jan - Sep | | Jan - Sep |
| 1 - REVENUES | | 34,975,944 | | 26,089,939 | | 39,166,633 | | 31,326,797 |
| Sales of goods and products | | 33,945,439 | | 25,508,872 | | 37,991,120 | | 30,790,075 |
| Other income | | 87,409 | | 81,208 | | 171,921 | | 47,123 |
| Revenue related to construction of own assets | | 951,130 | | 506,709 | | 1,015,219 | | 504,725 |
| Expected credit losses | | (8,034) | | (6,850) | | (11,627) | | (15,126) |
| 2 - SUPPLIES ACQUIRED FROM THIRD PARTIES | | (23,495,331) | | (17,059,228) | | (26,993,361) | | (20,165,551) |
| Costs of goods sold | | (19,821,566) | | (14,343,665) | | (22,672,153) | | (16,908,250) |
| Materials, energy, third parties services and other | | (3,682,625) | | (2,714,804) | | (4,330,871) | | (3,245,659) |
| Reversal for inventories losses | | 8,860 | | (759) | | 9,663 | | (11,642) |
| 3 - GROSS ADDED VALUE (1-2) | | 11,480,613 | | 9,030,711 | | 12,173,272 | | 11,161,246 |
| 4 - DEPRECIATION AND AMORTIZATION | | (1,712,884) | | (1,515,218) | | (2,056,293) | | (1,773,505) |
| 5 - NET ADDED VALUE (3-4) | | 9,767,729 | | 7,515,493 | | 10,116,979 | | 9,387,741 |
| | | | | | | | | |
| 6 - RECEIVED FROM THIRD PARTIES | | 355,092 | | 7,423,384 | | 337,198 | | 266,854 |
| Income from associates and joint ventures | | 72,400 | | 7,192,215 | | - | | - |
| Financial income | | 285,777 | | 232,713 | | 340,283 | | 267,413 |
| Others | | (3,085) | | (1,544) | | (3,085) | | (559) |
| | | | | | | | | |
| 7 - ADDED VALUE TO BE DISTRIBUTED (5+6) | | 10,122,821 | | 14,938,877 | | 10,454,177 | | 9,654,595 |
| | | | | | | | | |
| 8 - DISTRIBUTION OF ADDED VALUE | | 10,122,821 | | 14,938,877 | | 10,454,177 | | 9,654,595 |
| Payroll | | 3,878,029 | | 3,830,054 | | 4,321,717 | | 4,208,504 |
| Salaries | | 2,762,931 | | 2,756,864 | | 3,110,366 | | 3,058,122 |
| Benefits | | 917,495 | | 886,717 | | 999,659 | | 949,287 |
| Government severance indemnity fund for employees | | 197,603 | | 186,473 | | 211,692 | | 201,095 |
| Taxes, Fees and Contributions | | 3,684,511 | | 3,187,053 | | 3,782,102 | | 3,281,743 |
| Federal | | 1,472,503 | | 1,345,060 | | 1,543,434 | | 1,432,862 |
| State | | 2,177,722 | | 1,810,829 | | 2,197,618 | | 1,810,774 |
| Municipal | | 34,286 | | 31,164 | | 41,050 | | 38,107 |
| Capital Remuneration from Third Parties | | 3,014,295 | | 7,447,030 | | 2,797,439 | | 1,676,742 |
| Interests, including exchange variation | | 2,920,349 | | 7,352,370 | | 2,723,879 | | 1,514,349 |
| Rents | | 93,946 | | 94,660 | | 73,560 | | 162,393 |
| Interest on Own-Capital | | (454,014) | | 474,740 | | (447,081) | | 487,606 |
| Income (loss) for the period from continuing operations | | (454,014) | | 474,740 | | (454,014) | | 474,740 |
| Non-controlling interest | | - | | - | | 6,933 | | 12,866 |
The accompanying notes are an integral part of the financial statements.
MANAGEMENT REPORT
| | |
BRF S.A. | INTERIM FINANCIAL INFORMATION – September 30, 2021 | 9 |
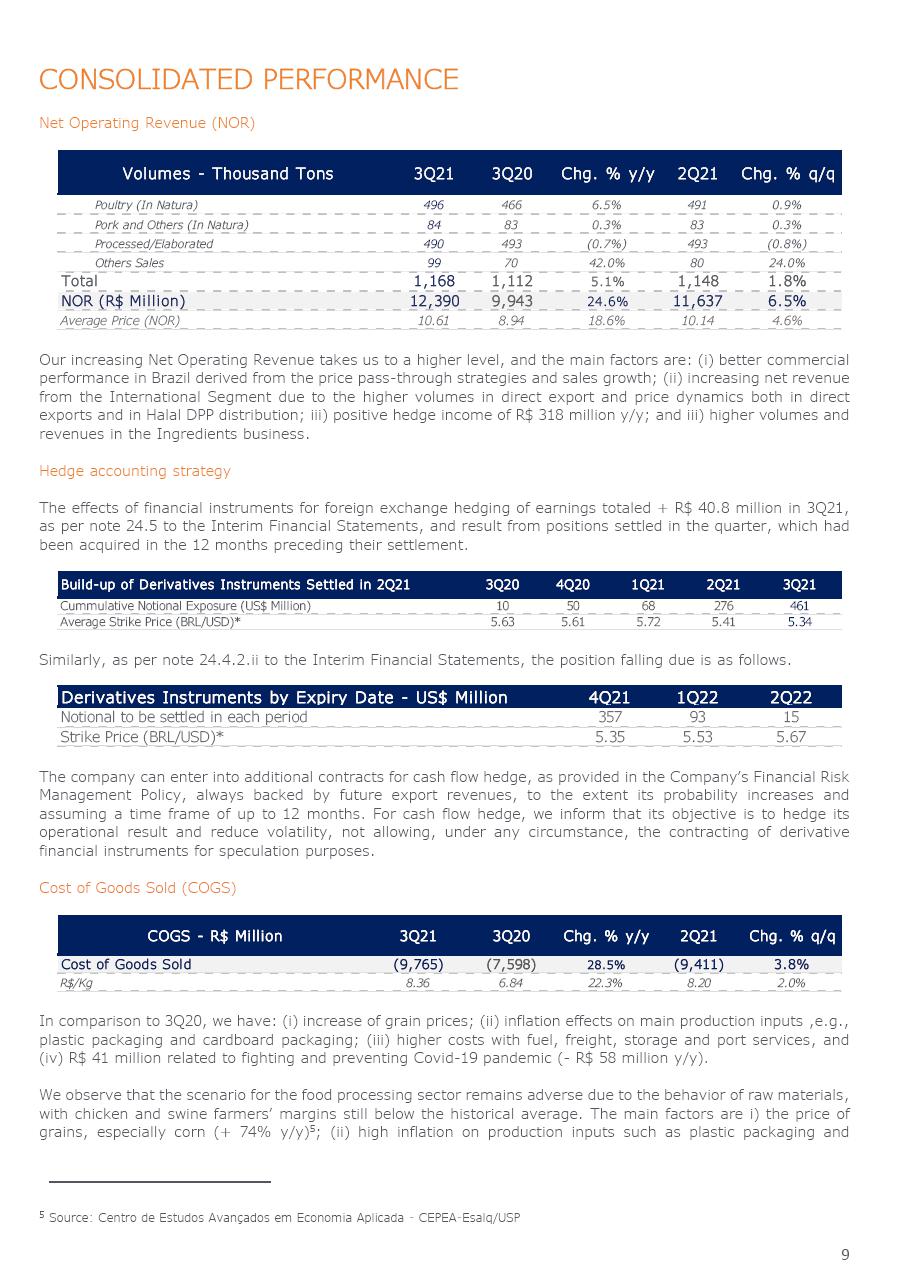
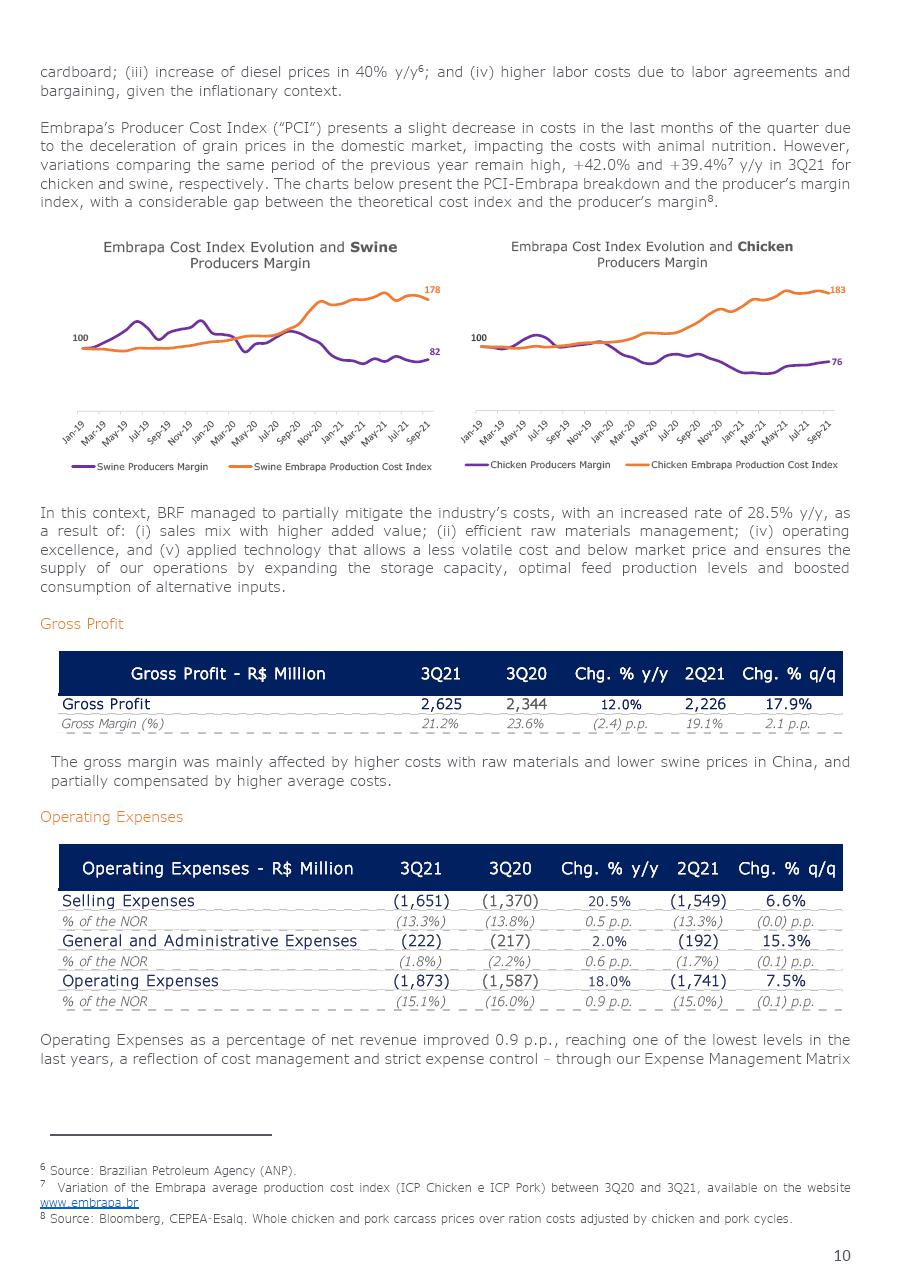
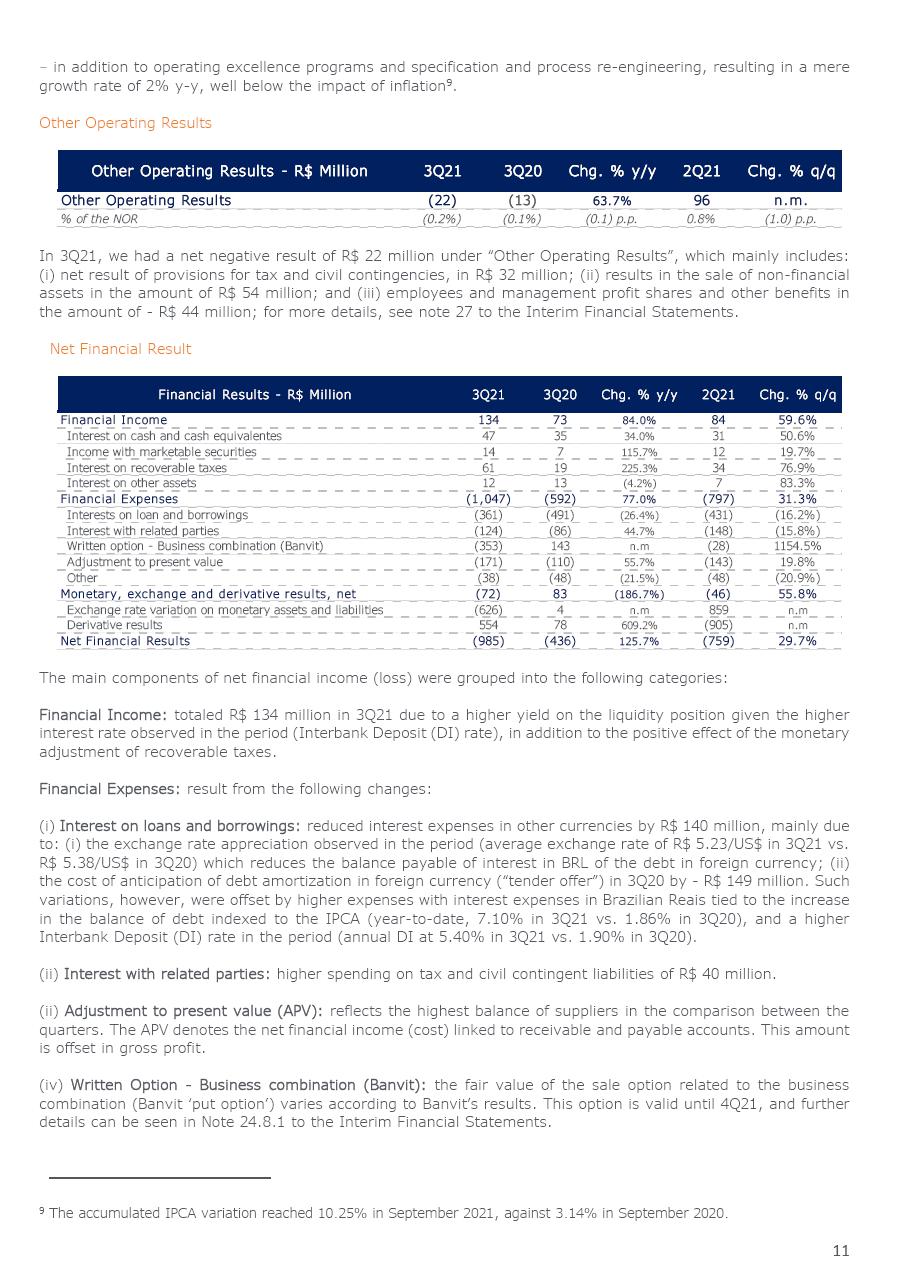
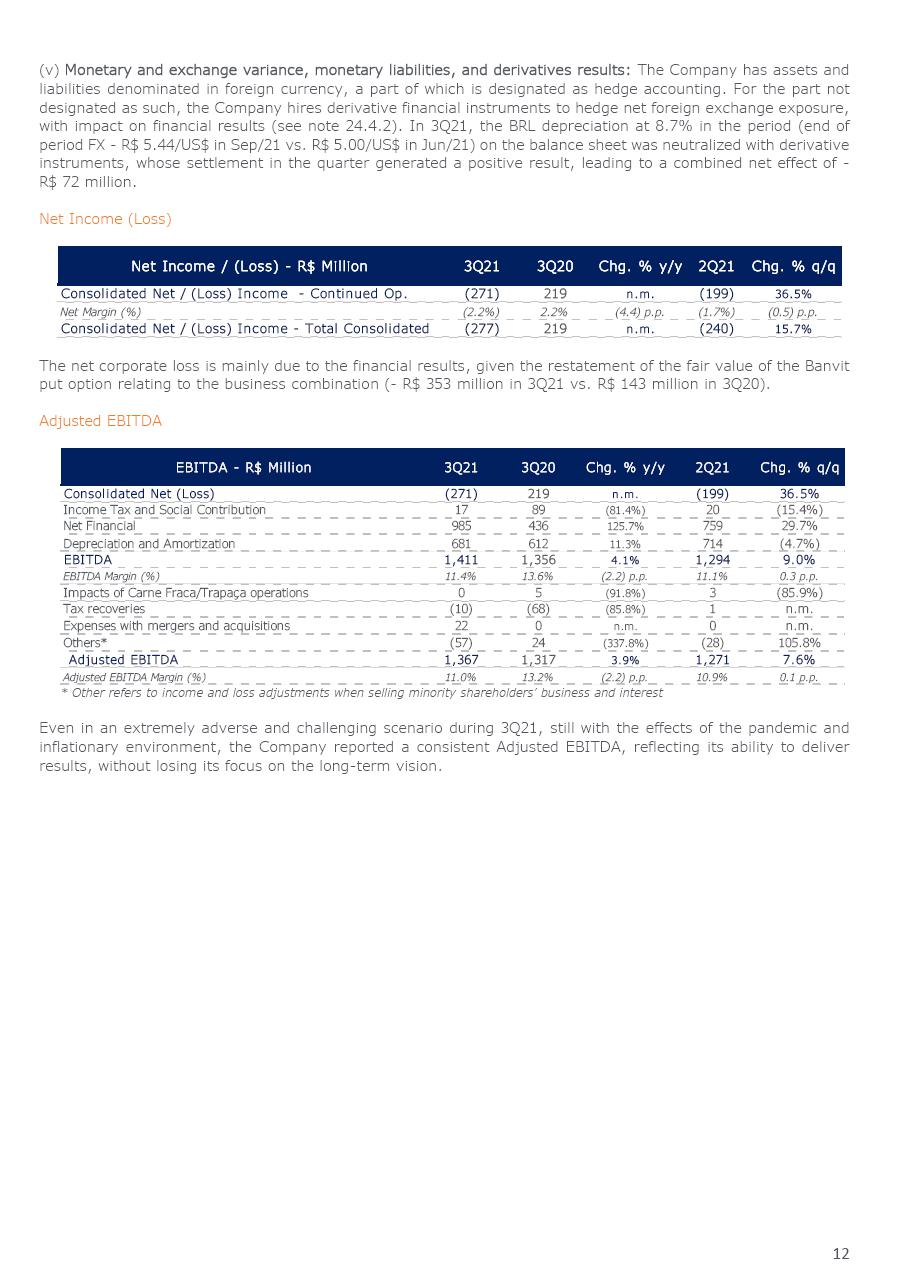
/
| | |
BRF S.A. | INTERIM FINANCIAL INFORMATION – September 30, 2021 | 10 |
| | |
BRF S.A. | INTERIM FINANCIAL INFORMATION – September 30, 2021 | 11 |
| | |
BRF S.A. | INTERIM FINANCIAL INFORMATION – September 30, 2021 | 12 |
| | |
BRF S.A. | INTERIM FINANCIAL INFORMATION – September 30, 2021 | 13 |
| | |
BRF S.A. | INTERIM FINANCIAL INFORMATION – September 30, 2021 | 14 |
| | |
BRF S.A. | INTERIM FINANCIAL INFORMATION – September 30, 2021 | 15 |
| | |
BRF S.A. | INTERIM FINANCIAL INFORMATION – September 30, 2021 | 16 |
| | |
BRF S.A. | INTERIM FINANCIAL INFORMATION – September 30, 2021 | 17 |
| | |
BRF S.A. | INTERIM FINANCIAL INFORMATION – September 30, 2021 | 18 |
| | |
BRF S.A. | INTERIM FINANCIAL INFORMATION – September 30, 2021 | 19 |
| | |
BRF S.A. | INTERIM FINANCIAL INFORMATION – September 30, 2021 | 20 |
| | |
BRF S.A. | INTERIM FINANCIAL INFORMATION – September 30, 2021 | 21 |
| | |
BRF S.A. | INTERIM FINANCIAL INFORMATION – September 30, 2021 | 22 |
| | |
BRF S.A. | INTERIM FINANCIAL INFORMATION – September 30, 2021 | 23 |
| | |
BRF S.A. | INTERIM FINANCIAL INFORMATION – September 30, 2021 | 24 |
| | |
BRF S.A. | INTERIM FINANCIAL INFORMATION – September 30, 2021 | 25 |
| | |
BRF S.A. | INTERIM FINANCIAL INFORMATION – September 30, 2021 | 26 |
| | |
BRF S.A. | INTERIM FINANCIAL INFORMATION – September 30, 2021 | 27 |
| | |
BRF S.A. | INTERIM FINANCIAL INFORMATION – September 30, 2021 | 28 |
BRF S.A. (“BRF”) and its subsidiaries (collectively the “Company”) is a publicly traded company, listed on the segment Novo Mercado of Brasil, Bolsa, Balcão (“B3”), under the ticker BRFS3, and listed on the New York Stock Exchange (“NYSE”), under the ticker BRFS. The Company’s registered office is at Rua Jorge Tzachel, nº 475, Bairro Fazenda, Itajaí - Santa Catarina and the main business office is in the city of São Paulo.
BRF is a Brazilian multinational company, with global presence, which owns a comprehensive portfolio of products, and it is one of the world’s largest companies of food products. The Company operates by raising, producing and slaughtering poultry and pork for processing, production and sale of fresh meat, processed products, pasta, margarine and others.
The Company holds as main brands Sadia, Perdigão, Qualy, Chester®, Kidelli, Perdix and Banvit, present mainly in Brazil, Turkey and Middle Eastern countries.
| | |
BRF S.A. | INTERIM FINANCIAL INFORMATION – September 30, 2021 | 29 |
| | | | | | | | % equity interest |
| Entity | | | Main activity | | Country (1) | | 09.30.21 | | 12.31.20 |
| BRF GmbH | | | Holding | | Austria | | 100.00 | | 100.00 |
| BRF Foods LLC | (g) | | Import, industrialization and commercialization of products | | Russia | | 99.99 | | 99.90 |
| BRF Global Company Nigeria Ltd. | | | Marketing and logistics services | | Nigeria | | 99.00 | | 99.00 |
| BRF Global Company South Africa Proprietary Ltd. | | | Administrative, marketing and logistics services | | South Africa | | 100.00 | | 100.00 |
| BRF Global Company Nigeria Ltd. | | | Marketing and logistics services | | Nigeria | | 1.00 | | 1.00 |
| BRF Global GmbH | | | Holding and trading | | Austria | | 100.00 | | 100.00 |
| BRF Foods LLC | (h) | | Import, industrialization and commercialization of products | | Russia | | 0.01 | | 0.10 |
| BRF Japan KK | | | Marketing and logistics services, import, export, industrialization and commercialization of products | | Japan | | 100.00 | | 100.00 |
| BRF Korea LLC | | | Marketing and logistics services | | Korea | | 100.00 | | 100.00 |
| BRF Shanghai Management Consulting Co. Ltd. | | | Provision of consultancy and marketing services | | China | | 100.00 | | 100.00 |
| BRF Shanghai Trading Co. Ltd. | | | Import, export and commercialization of products | | China | | 100.00 | | 100.00 |
| BRF Singapore Foods PTE Ltd. | | | Administrative, marketing and logistics services | | Singapore | | 100.00 | | 100.00 |
| Eclipse Holding Cöoperatief U.A. | | | Holding | | The Netherlands | | 99.99 | | 99.99 |
| Buenos Aires Fortune S.A. | | | Holding | | Argentina | | 4.36 | | 4.36 |
| Eclipse Latam Holdings | | | Holding | | Spain | | 100.00 | | 100.00 |
| Buenos Aires Fortune S.A. | | | Holding | | Argentina | | 95.64 | | 95.64 |
| Perdigão Europe Lda. | | | Import, export of products and administrative services | | Portugal | | 100.00 | | 100.00 |
| Perdigão International Ltd. | (d) | | Import and export of products | | Cayman Island | | - | | 100.00 |
| ProudFood Lda. | | | Import and commercialization of products | | Angola | | 90.00 | | 90.00 |
| Sadia Chile S.A. | | | Import, export and commercialization of products | | Chile | | 40.00 | | 40.00 |
| Wellax Food Logistics C.P.A.S.U. Lda. | | | Import, commercialization of products and administrative services | | Portugal | | 100.00 | | 100.00 |
| BRF Austria GmbH | (o) | | Holding | | Austria | | 100.00 | | 100.00 |
| One Foods Holdings Ltd. | | | Holding | | UAE | | 100.00 | | 100.00 |
| Al-Wafi Food Products Factory LLC | | | Import, export, industrialization and commercialization of products | | UAE | | 49.00 | | 49.00 |
| Badi Ltd. | | | Holding | | UAE | | 100.00 | | 100.00 |
| Al-Wafi Al-Takamol International for Foods Products | | | Import and commercialization of products | | Saudi Arabia | | 100.00 | | 100.00 |
| Joody Al Sharqiya Food Production Factory LLC | (b) | | Import and commercialization of products | | Saudi Arabia | | 100.00 | | - |
| BRF Al Yasra Food K.S.C.C. ("BRF AFC") | (c) | | Import, commercialization and distribution of products | | Kuwait | | 100.00 | | 75.00 |
| BRF Foods GmbH | | | Industrialization, import and commercialization of products | | Austria | | 100.00 | | 100.00 |
| Al Khan Foodstuff LLC ("AKF") | | | Import, commercialization and distribution of products | | Oman | | 70.00 | | 70.00 |
| FFQ GmbH | (e) | | Industrialization, import and commercialization of products | | Austria | | - | | 100.00 |
| TBQ Foods GmbH | | | Holding | | Austria | | 60.00 | | 60.00 |
| Banvit Bandirma Vitaminli | | | Import, industrialization and commercialization of products | | Turkey | | 91.71 | | 91.71 |
| Banvit Enerji ve Elektrik Üretim Ltd. Sti. | (a) | | Generation and commercialization of electric energy | | Turkey | | 100.00 | | 100.00 |
| Banvit Foods SRL | (f) | | Industrialization of grains and animal feed | | Romania | | - | | 0.01 |
| Nutrinvestments BV | | | Holding | | The Netherlands | | 100.00 | | 100.00 |
| Banvit ME FZE | | | Marketing and logistics services | | UAE | | 100.00 | | 100.00 |
| Banvit Foods SRL | (f) | | Industrialization of grains and animal feed | | Romania | | - | | 99.99 |
| One Foods Malaysia SDN. BHD. | | | Marketing and logistics services | | Malaysia | | 100.00 | | 100.00 |
| Federal Foods LLC | | | Import, commercialization and distribution of products | | UAE | | 49.00 | | 49.00 |
| Federal Foods Qatar | | | Import, commercialization and distribution of products | | Qatar | | 49.00 | | 49.00 |
| BRF Hong Kong LLC | (a) | | Import, commercialization and distribution of products | | Hong Kong | | 100.00 | | 100.00 |
| Eclipse Holding Cöoperatief U.A. | | | Holding | | The Netherlands | | 0.01 | | 0.01 |
| Establecimiento Levino Zaccardi y Cia. S.A. | (a) | | Industrialization and commercialization of dairy products | | Argentina | | 99.99 | | 99.99 |
| BRF Energia S.A. | | | Commercialization of eletric energy | | Brazil | | 100.00 | | 100.00 |
| BRF Pet S.A. | | | Industrialization, commercialization and distribution of feed and nutrients for animals | | Brazil | | 100.00 | | 100.00 |
| Affinity Petcare Brasil Participações Ltda. | (n) | | Holding | | Brazil | | 100.00 | | - |
| Mogiana Alimentos S.A. | (l) | | Manufacturing, distribution and sale of Pet Food products | | Brazil | | 50.00 | | - |
| Gewinner Participações Ltda. | (j) | | Industrialization, distribution and sale of feed and nutrients for animals | | Brazil | | 100.00 | | - |
| Hecosul Alimentos Ltda. | (j) | | Manufacturing and sale of animal feed | | Brazil | | 100.00 | | - |
| Hercosul Distribuição Ltda. | (j) | | Import, export, wholesale and retail sale of food products for animals | | Brazil | | 100.00 | | - |
| Hercosul Soluções em Transportes Ltda. | (j) | | Road freight | | Brazil | | 100.00 | | - |
| Hercosul International S.R.L. | (j) | | Manufacturing, export, import and sale of feed and nutrients for animals | | Paraguay | | 99.00 | | - |
| Paraguassu Participações S.A. | (m) | | Holding | | Brazil | | 100.00 | | - |
| Mogiana Alimentos S.A. | (l) | | Manufacturing, distribution and sale of Pet Food products | | Brazil | | 50.00 | | - |
| Hercosul International S.R.L. | (k) | | Manufacturing, export, import and sale of feed and nutrients for animals | | Paraguay | | 1.00 | | - |
| PP-BIO Administração de bem próprio S.A. | (i) | | Management of assets | | Brazil | | - | | 33.33 |
| PR-SAD Administração de bem próprio S.A. | | | Management of assets | | Brazil | | 33.33 | | 33.33 |
| ProudFood Lda. | | | Import and commercialization of products | | Angola | | 10.00 | | 10.00 |
| PSA Laboratório Veterinário Ltda. | | | Veterinary activities | | Brazil | | 99.99 | | 99.99 |
| Sino dos Alpes Alimentos Ltda. | (a) | | Industrialization and commercialization of products | | Brazil | | 99.99 | | 99.99 |
| Sadia Alimentos S.A. | | | Holding | | Argentina | | 43.10 | | 43.10 |
| Sadia Chile S.A. | | | Import, export and commercialization of products | | Chile | | 60.00 | | 60.00 |
| Sadia International Ltd. | (l) | | Import and commercialization of products | | Cayman Island | | - | | 100.00 |
| Sadia Uruguay S.A. | | | Import and commercialization of products | | Uruguay | | 100.00 | | 100.00 |
| Sadia Alimentos S.A. | | | Holding | | Argentina | | 56.90 | | 56.90 |
| Vip S.A. Empreendimentos e Participações Imobiliárias | | | Commercialization of owned real state | | Brazil | | 100.00 | | 100.00 |
| Establecimiento Levino Zaccardi y Cia. S.A. | (a) | | Industrialization and commercialization of dairy products | | Argentina | | 0.01 | | 0.01 |
| PSA Laboratório Veterinário Ltda. | | | Veterinary activities | | Brazil | | 0.01 | | 0.01 |
| Sino dos Alpes Alimentos Ltda. | (a) | | Industrialization and commercialization of products | | Brazil | | 0.01 | | 0.01 |
| (1) | UAE – United Arab Emirates. |
| (a) | Dormant subsidiaries. The Company is evaluating the liquidation of these subsidiaries. |
| (b) | On January 18, 2021, 100% of the capital stock of Joody Al Sharqiya Food Production Factory LLC was acquired (note 1.2.1). |
| (c) | On March 9, 2021, the minority stake on BRF AFC was acquired, as described below. |
| (d) | On March 24, 2021, the subsidiary Perdigão International Ltd. was dissolved. |
| | |
BRF S.A. | INTERIM FINANCIAL INFORMATION – September 30, 2021 | 30 |
| (e) | On March 30, 2021, the subsidiary FFQ GmbH was dissolved. |
| (f) | On May 4, 2021 the sale of shares held in Banvit Foods SRL was concluded, as described below. |
| (g) | On May 31, 2021, BRF GmbH became owner of 99.99% of BRF Food LLC. |
| (h) | On May 31, 2021, BRF Global GmbH became owner of 0.01% of BRF Food LLC. |
| (i) | On July 30, 2021, BRF S.A. sold all the shares held in PP-BIO Administração de bem próprio S.A. |
| (j) | On August 02, 2021, 99% of the capital stock of Hercosul International S.R.L. was acquired by BRF Pet S.A., as per note 1.2.2 |
| (k) | On August 02, 2021, 1% of the capital stock of Hercosul International S.R.L. was acquired by BRF S.A., as per note 1.2.2 |
| (l) | On August 19, 2021, the subsidiary Sadia International Ltd. was dissolved. |
| (m) | On September 01, 2021, Paraguassu Participações S.A. was acquired by BRF Pet S.A., as per note 1.2.3 |
| (n) | On September 01, 2021, Affinity Petcare Brasil Participações Ltda. was acquired by BRF Pet S.A., as per note 1.2.3 |
| (o) | On October 21, 2021 it was approved the merger of BRF Austria GmbH into BRF GmbH retroactively to 01 January 2021 according to the Austrian law. |
On March 9, 2021 the Company, through its wholly-owned subsidiary One Foods Holdings Ltd.(“One Foods”) acquired from Al Yasra Food Company W.L.L the minority stake of 25% of BRF Al Yasra Food K.S.C.C. (“BRF AFC”), entity located in Kuwait, responsible for the distribution of BRF products in the country. The transaction was concluded for the amount equivalent to R$238,421 (USD40,828) and from this date, BRF AFC became a wholly-owned subsidiary of One Foods. The amount paid is presented in the financing activities on the statement of cash flows and the difference between the amount paid and the book value of the participation acquired was recorded in Equity as Other Reserves, in the amount of R$79,673.
On May 4, 2021, Nutrinvestment BV and Banvit Bandirma Vitaminli, indirectly controlled subsidiaries of the Company, concluded the sale to Aaylex System Group S.A. of 100% of the shares held in Banvit Foods SRL, engaged in the activities of manufacture of animal feed and egg hatchery in Romania. The sale amount, received on that date, was equivalent to R$132,425 (EUR 20,300). In June, the parties established a price adjustment due to net debt and working capital, in the amount equivalent to R$13,059 (EUR2,157). In the nine-month period ended on September 30, 2021, the Company recognized a gain with the sale of R$76,148, mainly due to the write-off of the currency translation adjustment and to the price adjustment, recorded under Other Operating Income.
Except for the associate PR-SAD in which the Company records the investments by the equity method, all other entities shown in the table above were consolidated.
| | |
BRF S.A. | INTERIM FINANCIAL INFORMATION – September 30, 2021 | 31 |
| 1.2. | Business combinations |
1.2.1. Joody Al Sharqiya Food Production Factory
On January 18, 2021, through its wholly-owned subsidiary Badi Limited ("Badi"), the Company concluded the acquisition of 100% of the capital stock of Joody Al Sharqiya Food Production Factory ("Joody Al"), a food processing company in Saudi Arabia. The initial fair value of the consideration transferred was equivalent to R$41,620 (SAR29,793) paid in cash, and from this date, Joody Al has become a wholly-owned subsidiary of Badi. The consideration paid may be adjusted according to certain conditions established in the purchase agreement.
The goodwill of R$12,376 arising from the business combination consists mainly of the synergies expected with the combination of the operations of BRF and Joody Al, strengthening the Company’s presence in the Saudi Arabian market. The results and the goodwill are presented in the International segment (note 25).
The fair value of the acquired assets and assumed liabilities in the business combination is presented below:
| | | Fair value at the acquisition date |
| Assets | | |
| Cash and cash equivalents | | 408 |
| Inventories | | 832 |
| Advances | | 232 |
| Property, plant and equipment, net | | 30,128 |
| | | 31,600 |
| Liabilities | | |
| Trade accounts payable | | 1,420 |
| Taxes payable | | 550 |
| Employee benefits | | 286 |
| Other current liabilities | | 100 |
| | | 2,356 |
| | | |
| Net assets acquired | | 29,244 |
| | | |
| Fair value of consideration transferred | | 41,620 |
| | | |
| Preliminary goodwill | | 12,376 |
| | |
BRF S.A. | INTERIM FINANCIAL INFORMATION – September 30, 2021 | 32 |
1.2.2. Hercosul Group
On August 2, 2021 the Company concluded the acquisition of 100% of the capital stock of the companies that compose the Hercosul Group, after with the fulfillment of the conditions precedent. From this date, BRF Pet S.A. (“BRF Pet”) became owner of 100% of Gewinner Participações Ltda. and 99% of Hercosul International S.R.L. (“Hercosul International”) and BRF S.A. became owner of 1% of Hercosul International.
The initial fair value of the consideration transferred was of R$794,535 of which R$675,355 was paid in cash and R$119,180 will be paid in the next 4 years. The installments value was recorded as other liabilities and is subject to interest, which will be recorded as financial expenses. According to conditions established in the acquisition contract, which are common to transactions of this nature, the value of the consideration may be adjusted based on the net debt, working capital and contingent assets of the Hercosul Group.
The Company incurred in expenses with advisors, lawyers and other related to the acquisition and integration of Hercosul Group in the amount of R$14,335 for the nine-month period ended on September 30, 2021, which were recognized under administrative expenses.
The preliminary goodwill of R$766,183 recognized in the acquisition consists mainly of the value of the synergies expected from the combination of the operations of BRF Pet, Hercosul Group and Mogiana Group and the value of the acquired brands, which are strong in this market and reinforce BRF's presence in the pet food sector. The results, intangible assets with indefinite useful life and goodwill arising from this business combination are presented in Other segments (note 25).
Due to the size and complexity of the Hercosul Group operations, at the disclosure date of this interim financial information, the evaluation by an independent party of the fair value of the assets acquired and liabilities assumed is in progress. The Company's current best estimate of the fair value of the assets and liabilities is presented below and reflected in the Company's consolidated interim financial information:
| | | Fair value at the acquisition date |
| | | Gewinner Participações
Consolidated | | Hercosul International |
| Assets | | | | |
| Cash and cash equivalents | | 17,743 | | 4,402 |
| Trade and other receivables | | 40,838 | | 8,475 |
| Inventories | | 34,355 | | 9,623 |
| Recoverable taxes | | 15,771 | | 4,078 |
| Advances | | 29,103 | | - |
| Property, plant and equipment, net | | 23,829 | | 59,135 |
| Intangible assets | | 647 | | 393 |
| Other assets | | 773 | | 2,805 |
| | | 163,059 | | 88,911 |
| Liabilities | | | | |
| Social and Labor Obligations | | 6,681 | | 200 |
| Trade accounts payable | | 66,760 | | 8,320 |
| Taxes payable | | 14,879 | | 200 |
| Loans and borrowings | | 65,825 | | 29,555 |
| Other liabilities | | 10,720 | | 20,478 |
| | | 164,865 | | 58,753 |
| | | | | |
| Net assets acquired | | (1,806) | | 30,158 |
| | | | | |
| Fair value of consideration transferred | | 726,186 | | 68,349 |
| | | | | |
| Preliminary goodwill | | 727,992 | | 38,191 |
In addition to the information presented above, the following assets will probably have fair value allocations in the business combination and have not yet been measured: inventories, trademarks, customer relationship and fixed assets. Management expects this report to be completed during 2021, when the final allocation of the purchase price and its respective accounting effects will be determined.
| | |
BRF S.A. | INTERIM FINANCIAL INFORMATION – September 30, 2021 | 33 |
This business combination contributed with net revenue of R$32,458 and net income of R$2,016 from the acquisition date to September 30, 2021 in the consolidated statement of income. If the business combination had taken place at the beginning of the nine-month period ended September 30, 2021, the consolidated net revenues for this period would have increased by R$198,168 and the consolidated net loss for the period would have increased by R$36,258.
1.2.3. Mogiana Group
On September 1, 2021, the Company, through its wholly-owned subsidiary BRF Pet dedicated to the pet food sector, concluded the acquisition of Paraguassu Participações S.A. ("Paraguassu") and Affinity Petcare Brasil Participações Ltda. ("Affinity"), both owner of 100% of the capital stock of Mogiana Alimentos S.A. (together form the “Mogiana Group”), after fulfillment of all conditions precedent. Therefore, from this date, Paraguassu and Affinity became wholly-owned subsidiaries of BRF Pet.
The initial fair value of the consideration transferred was of R$435,773 of which R$290,225 was paid in cash and R$145,548 will be paid in the next 6 years. The installments value was recorded as other liabilities and is subject to interest, which will be recorded as financial expenses. In addition, from the term value, R$60,000 will be deposited in an escrow account after the first anniversary of the acquisition, as a guarantee for BRF Pet in case of eventual indemnities provided for in the acquisition contract. According to conditions established in the acquisition contract, which are common to transactions of this nature, the value of the consideration may be adjusted based on the net debt, working capital and contingent assets of Mogiana Alimentos S.A.
The Company incurred in expenses with advisors, lawyers and other related to the acquisition and integration of Mogiana in the amount of R$8,146 for the nine-month period ended on September 30, 2021, which were recognized under administrative expenses.
The preliminary goodwill of R$283,426 recognized in the acquisition consists mainly of the value of the synergies expected from the combination of the operations of BRF Pet, Mogiana Group and Hercosul Group and the value of the acquired brands, which are strong in this market and reinforce BRF's presence in the pet food sector. The results, intangible assets with indefinite useful life and goodwill arising from this business combination are presented in Other segments (note 25).
Due to the size and complexity of the Mogiana Group operations, at the disclosure date of this interim financial information, the evaluation by an independent party of the fair value of the assets acquired and liabilities assumed is in progress. The Company's current best estimate of the fair value of the assets and liabilities is presented below and reflected in the Company's consolidated interim financial information:
| | |
BRF S.A. | INTERIM FINANCIAL INFORMATION – September 30, 2021 | 34 |
| Mogiana Group Combined | | Fair value at the acquisition date |
| Assets | | |
| Cash and cash equivalents | | 938 |
| Marketable securities | | 29,842 |
| Trade and other receivables | | 61,184 |
| Inventories | | 55,334 |
| Recoverable taxes | | 29,020 |
| Property, plant and equipment, net | | 101,618 |
| Intangible assets | | 1,064 |
| Other assets | | 5,500 |
| | | 284,500 |
| Liabilities | | |
| Trade accounts payable | | 55,838 |
| Loans and borrowings | | 22,734 |
| Lease liability | | 11,147 |
| Taxes payable | | 10,438 |
| Labor Obligations | | 6,296 |
| Contingencies | | 8,363 |
| Employee benefits | | 2,081 |
| Deferred Taxes | | 750 |
| Other liabilities | | 14,506 |
| | | 132,153 |
| | | |
| Net assets acquired | | 152,347 |
| | | |
| Fair value of consideration transferred | | 435,773 |
| | | |
| Preliminary goodwill | | 283,426 |
In addition to the information presented above, the following assets will probably have fair value allocations in the business combination and have not yet been measured: inventories, trademarks, customer relationship, non-compete agreement and fixed assets. Management expects this report to be completed during 2021, when the final allocation of the purchase price and its respective accounting effects will be determined.
This business combination contributed with net revenue of R$41,438 and net income of R$1,901 from the acquisition date to September 30, 2021 in the consolidated statement of income. If the business combination had taken place at the beginning of the nine-month period ended on September 30, 2021, the consolidated net revenues for this period would have increased by R$329,418 and the consolidated net loss for the period would be reduced by R$27,955.
| 1.3. | Discontinued Operations |
In the nine-month period ended on September 30, 2021, the Company completed the price adjustment process related to sale of Campo Austral S.A. and determined a preliminary price adjustment related to the sale of Avex S.A., which is subject to modifications until the final agreement is signed between the parties.
The referred price adjustment totaled an expense of R$59,270 (R$47,802 net of taxes) and are presented in Net Loss of Discontinued Operations, consistently with the practice adopted in the sale of the operations in 2019.
| | |
BRF S.A. | INTERIM FINANCIAL INFORMATION – September 30, 2021 | 35 |
| 1.4. | Partnership – self-generation of energy |
1.4.1. Partnership with AES
On August 16, 2021, the Company executed an investment agreement with a subsidiary of AES Brasil Energia S.A. to incorporate a joint venture for the construction of a wind energy park for self-generation in the wind farm complex of Cajuína, Rio Grande do Norte, with an installed capacity of 160MWm (average Megawatt), generating 80MWm to be supplied to the Company by means of a 15-year power purchase agreement.
Through this partnership, the Company will meet about a third of its energy needs for the Brazilian operations. The estimated investment is approximately R$5.2 million/MW (Megawatt) installed, and BRF will directly invest approximately R$80 million, to be disbursed during the Project's development. The operation of the park is scheduled to begin by 2024.
The closing of this partnership is subject to approval of the competent authorities and the verification of other usual conditions in operations of this nature.
1.4.2. Partnership with PontoOn
On September 16, 2021, the Company executed with Intrepid Participações S.A. (“Intrepid”) a 15-year renewable energy power purchase agreement together with a call option agreement, which provides for the entry of BRF, through a holding company jointly held with Intrepid, aiming the construction of a sun energy self-generation plant in Mauriti and Milagres, Ceará, with an installed capacity of 320MWp (Megawatt-peak) generating, on average, 80MWm. The Project's estimated investment is approximately R$ 1.1 billion (R$3.7 million/MWp installed).
The call option agreement provides BRF with the right to acquire participation in Intrepid for a fixed price. Should BRF exercise the option, the Company will directly invest the approximate amount of R$50 million, to be disbursed during the Project’s development. The operation of the complex is scheduled to begin by 2024.
| 1.5. | Investigations involving BRF |
| 1.5.1. | Carne Fraca and Trapaça operations |
The Company has been subject to two investigations conducted by Brazilian governmental entities, denominated “Carne Fraca Operation” in 2017 and “Trapaça Operation” in 2018, as detailed in the financial statements for the year ended on December 31, 2020 (note 1.2). The Company’s Audit and Integrity Committee conducted independent investigations, along with the Independent Investigation Committee, composed of external members and with external legal advisors in Brazil and abroad with respect to the allegations involving BRF employees and former employees.
The main impacts observed as result of the referred investigations were recorded in Other Operating Expenses in the amount of R$8,554 for the nine-month period ended on September 30, 2021 (R$28,099 in the same period of the previous year) and R$412 for the three-month period ended on September 30, 2021 (R$4,027 in the same period of the previous year) mostly related to expenditures with lawyers, legal advisors and consultants.
In addition to the impacts already recorded, there are uncertainties about the outcome of these investigations which may result in penalties, fines and normative sanctions, right restrictions and other forms of liabilities, for which the Company is not able to make a reliable estimate of the potential losses. The outcomes may result in payments of substantial amounts, which may cause a material adverse effect on the Company’s financial position, results and cash flows in the future.
Regarding the investigations conducted by regulators offices and governmental entities in the United States of America about these operations, on February 25, 2021, the Division of Enforcement of the U.S. Securities and Exchange Commission (“SEC”) issued a letter to the Company stating that it has concluded its investigation and, based on information to date, does not intend to recommend an enforcement action by the SEC against the Company. On May 5, 2021, the U.S. Department of Justice (“DOJ”) issued a letter stating that it has closed its investigation against BRF, based on information to date. No sanctions or penalties were imposed against the Company.
| | |
BRF S.A. | INTERIM FINANCIAL INFORMATION – September 30, 2021 | 36 |
| 1.5.2. | Governance enhancement |
The Company has been taking actions to strengthen the compliance with its policies, procedures and internal controls.
The Company believes that its efforts strengthens and consolidates its governance to ensure the highest levels of safety standards, integrity and quality.
Among the actions implemented, are: (i) strengthening in the risk management, specially compliance, (ii) continuous improvement of the Compliance, Internal Audit and Internal Controls departments, (iii) review and issuance of new policies and procedures specifically related to applicable anticorruption laws, (iv) review and enhancement of the procedures for reputational verification of business partners, (v) review and enhancement of the processes of internal investigation, (vi) expansion of the independent reporting channel, (vii) review of transactional controls, and (viii) review and issuance of new consequence policy for misconduct.
| 1.6. | Coronavirus (COVID-19) |
On January 31, 2020 the World Health Organization announced that the COVID-19 is a global health emergency and on March 11, 2020 declared it a global pandemic. The outbreak has triggered significant decisions from governments and private sector entities, which in addition to the potential impact, increased the uncertainty level for the economic agents and may cause effects in the amounts recognized in the interim financial information.
BRF continues to operate its industrial complexes, distribution centers, logistics, supply chain and administrative offices, even if temporarily and partially under remote work regime in some of the corporate offices. Therefore, until the date of approval of this interim financial information, there has been no relevant change in its production plan, operation and/or commercialization. Additionally, management has developed and implemented contingency plans to maintain the operations and monitors the effects of the pandemic through a permanent multidisciplinary monitoring committee, formed by executives, specialists in the public health area and consultants.
Due to the pandemic, the Company has incurred in direct expenditures, such as transportation, personnel, prevention, control and donations, which are presented in the statement of income (loss) within the following line items:
| | | | | | | | | Consolidated |
| | | | | 2021 | | | | 2020 |
| | | Jul - Sep | | Jan - Sep | | Jul - Sep | | Jan - Sep |
| Cost of sales | | (41,391) | | (163,047) | | (99,019) | | (273,308) |
| Selling expenses | | (27,315) | | (51,405) | | (2,241) | | (48,558) |
| General and administrative expenses | | (3,714) | | (20,661) | | (43,911) | | (69,976) |
| | | (72,420) | | (235,113) | | (145,171) | | (391,842) |
The management considered in its projections of results and cash flows, to the best of its knowledge, the effects and uncertainties regarding the pandemic. Due to the high volatility and uncertainty around the length and the impact of the pandemic, the Company will continue to monitor the situation and evaluate the impacts on assumptions and estimates used in preparing our financial reporting.
During the months of November and December of each year, the Company is impacted by seasonality in the Brazil operating segment due to Christmas and New Year’s Celebrations. The products that are relevant contributors are: turkey, Chester®, ham and pork cuts (hind leg/pork loin).
In the International operating segment, seasonality is due to Ramadan, which is the holy month of the Muslim calendar. The beginning of Ramadan depends on the beginning of the moon cycle and in 2021 occurred between April 13, 2021 and May 12, 2021.
| | |
BRF S.A. | INTERIM FINANCIAL INFORMATION – September 30, 2021 | 37 |
| 2. | BASIS OF PREPARATION AND PRESENTATION OF INTERIM FINANCIAL INFORMATION |
The parent company’s and consolidated interim financial information was prepared in accordance with the CPC 21 (R1) – Interim Financial Statements and the IAS 34 – Interim Financial Reporting issued by the International Accounting Standards Board - IASB as well as with the standards issued by the Brazilian Securities and Exchange Commission. All the relevant information applicable to the interim financial information, and only them, are being evidenced and correspond to those used by administration in its management.
The parent company’s and consolidated interim financial information is expressed in thousands of Brazilian Reais (“R$”), unless otherwise stated. For disclosures of amounts in other currencies, the values were also expressed in thousands, unless otherwise stated.
The preparation of the parent company’s and consolidated interim financial information require Management to make judgments, use estimates and adopt assumptions that affect the reported amounts of revenues, expenses, assets and liabilities, as well as the disclosures of contingent liabilities. The uncertainty inherent to these judgments, assumptions and estimates could result in material adjustments to the carrying amount of certain assets and liabilities in future periods.
Any judgments, estimates and assumptions are reviewed at each reporting period.
The parent company’s and consolidated interim financial information was prepared based on the recoverable historical cost, except for the following material items recognized in the statements of financial position:
(i) derivative financial instruments and non-derivative financial instruments measured at fair value;
(ii) share-based payments and employee benefits measured at fair value;
(iii) biological assets measured at fair value; and
(iv) assets held for sale in instances where the fair value is lower than historical cost.
The Company prepared parent company’s and consolidated interim financial information under the going concern assumption and disclosed all relevant information in its explanatory notes, in order to clarify and complement the accounting basis adopted.
| 3. | SUMMARY OF SIGNIFICANT ACCOUNTING POLICIES |
The interim financial information, in this case quarterly financial information, aim to provide updated information based on the last annual financial statements disclosed. Therefore, the quarterly financial information focus on new activities, events and circumstances and do not repeat the information previously disclosed, except when Management judges that the maintenance of the information is relevant.
The interim financial information was prepared based on the accounting policies and estimates calculation methodologies adopted in the preparation of the annual financial statements for the year ended December 31, 2020 (note 3), except for: (i) the income taxes, which were measured according to CPC 21 / IAS 34 by applying the estimated annual effective tax rate to the pre-tax profit or loss for the interim period; and (ii) reclassification of payment of interest in the statements of cash flows, as described below.
In the nine-month period ended on September 30, 2021, the Company changed the classification of payment of interest in the statement of cash flows, reclassifying this item from Operating Activities to Financing Activities. This change was made for better presentation of the Company’s cash flows and convergence with the reports used by the administration in its management.
To ensure comparability between the periods presented, the Company performed the following reclassifications for the nine-month period ended on September 30, 2020:
| | |
BRF S.A. | INTERIM FINANCIAL INFORMATION – September 30, 2021 | 38 |
| | | | | | | | | | | Jan - Sep 2020 |
| | | | | | | Parent company | | | | | | Consolidated |
| | | Previously presented | | Reclassification | | Restated | | Previously presented | | Reclassification | | Restated |
| Net cash provided by operating activities | | 2,114,612 | | 851,575 | | 2,966,187 | | 5,110,377 | | 1,002,146 | | 6,112,523 |
| Net cash used in investing activities | | (901,542) | | - | | (901,542) | | (923,071) | | - | | (923,071) |
| Net cash provided by (used in) financing activities | | 1,621,335 | | (851,575) | | 769,760 | | 1,696,751 | | (1,002,146) | | 694,605 |
| Effect of exchange rate variation on cash and cash equivalents | | 298,432 | | - | | 298,432 | | 1,276,745 | | - | | 1,276,745 |
| Net increase in cash and cash equivalents | | 3,132,837 | | - | | 3,132,837 | | 7,160,802 | | - | | 7,160,802 |
There were no other changes on such policies and estimates calculation methodologies. As allowed by CPC 21 / IAS 34, Management decided not to disclose again the details of the accounting policies adopted by the Company. Hence, the interim financial information should be read along with the annual financial statements for the year ended on December 31, 2020, in order to allow the users to further understand the Company’s financial conditions and liquidity, as well as its capacity to generate profits and cash flows.
| 4. | CASH AND CASH EQUIVALENTS |
| | Average rate (1) | | Parent company | | Consolidated |
| | | 09.30.21 | | 12.31.20 | | 09.30.21 | | 12.31.20 |
| Cash and bank accounts | | | | | | | | | |
| Turkish lira | - | | - | | - | | 660,171 | | 347,740 |
| U.S. Dollar | - | | 544 | | 520 | | 633,222 | | 1,185,208 |
| Saudi Riyal | - | | - | | - | | 351,645 | | 250,879 |
| Brazilian Reais | - | | 89,141 | | 111,615 | | 117,762 | | 112,181 |
| Euro | - | | 1,305 | | 6,144 | | 67,973 | | 54,687 |
| Other currencies | - | | 459 | | 28 | | 372,324 | | 488,377 |
| | | | 91,449 | | 118,307 | | 2,203,097 | | 2,439,072 |
| Cash equivalents | | | | | | | | | |
| In Brazilian Reais | | | | | | | | | |
| Investment funds | 4.12% | | 4,120 | | 4,684 | | 4,120 | | 4,684 |
| Bank deposit certificates | 5.84% | | 4,059,645 | | 3,650,812 | | 4,082,178 | | 3,662,448 |
| | | | 4,063,765 | | 3,655,496 | | 4,086,298 | | 3,667,132 |
| In U.S. Dollar | | | | | | | | | |
| Term deposit | - | | - | | - | | - | | 198,878 |
| Overnight | 0.15% | | 76,221 | | 102,336 | | 600,449 | | 1,220,232 |
| Other currencies | | | | | | | | | |
| Term deposit | - | | - | | - | | - | | 51,311 |
| | | | 76,221 | | 102,336 | | 600,449 | | 1,470,421 |
| | | | 4,231,435 | | 3,876,139 | | 6,889,844 | | 7,576,625 |
| (1) | Weighted average annual rate. |
| | |
BRF S.A. | INTERIM FINANCIAL INFORMATION – September 30, 2021 | 39 |
| | | | | | Average rate (2) | | Parent company | | Consolidated |
| | WAM (1) | | Currency | | | 09.30.21 | | 12.31.20 | | 09.30.21 | | 12.31.20 |
| Fair value through other comprehensive income | | | | | | | | | | | | | |
| Stocks (3) | - | | USD / HKD | | - | | - | | - | | 13,290 | | 42,029 |
| Fair value through profit and loss | | | | | | | | | | | | | |
| Financial treasury bills | 3.29 | | R$ | | 1.90% | | 318,893 | | 312,515 | | 318,893 | | 312,515 |
| Investment funds - FIDC BRF | 2.46 | | R$ | | - | | 14,966 | | 15,044 | | 14,966 | | 15,044 |
| Committed | 0.50 | | R$ | | - | | - | | - | | 22,810 | | - |
| Other | 0.02 | | R$ / ARS | | - | | - | | - | | 1,479 | | 1,643 |
| | | | | | | | 333,859 | | 327,559 | | 358,148 | | 329,202 |
| Amortized cost | | | | | | | | | | | | | |
| Sovereign bond and other (4) | 1.57 | | AOA | | 4.00% | | - | | - | | 347,650 | | 287,504 |
| | | | | | | | 333,859 | | 327,559 | | 719,088 | | 658,735 |
| Current | | | | | | | 318,893 | | 312,515 | | 343,182 | | 314,158 |
| Non-current (5) | | | | | | | 14,966 | | 15,044 | | 375,906 | | 344,577 |
| (1) | Weighted average maturity in years. |
| (2) | Weighted average annual rate. |
| (3) | It’s comprised of Aleph Farms Ltd. stocks on September 30, 2021 and Cofco Meats stocks on December 31, 2020. |
| (4) | It’s comprised of private securities and sovereign securities of the Angola Government and are presented net of expected credit losses in the amount of R$17,943 (R$9,894 on December 31, 2020). |
| (5) | Maturity until December of 2023. |
On September 30, 2021, the amount of R$281,649 (R$366,671 on December 31, 2020) classified as cash and cash equivalents and marketable securities were pledged as guarantee, with no use restrictions, for USD denominated future contracts traded on B3.
| 6. | TRADE ACCOUNTS RECEIVABLE AND OTHER RECEIVABLES |
| | Parent company | | Consolidated |
| | 09.30.21 | | 12.31.20 | | 09.30.21 | | 12.31.20 |
| Trade accounts receivable | | | | | | | |
| Domestic market | | | | | | | |
| Third parties | 867,196 | | 1,999,807 | | 977,964 | | 2,002,586 |
| Related parties | 3,311 | | 6,228 | | - | | - |
| Foreign market | | | | | | | |
| Third parties | 530,751 | | 537,584 | | 3,218,914 | | 2,716,551 |
| Related parties | 7,931,390 | | 3,239,348 | | - | | - |
| | 9,332,648 | | 5,782,967 | | 4,196,878 | | 4,719,137 |
| ( - ) Adjustment to present value | (7,076) | | (10,026) | | (10,867) | | (13,316) |
| ( - ) Expected credit losses | (578,940) | | (555,712) | | (633,850) | | (605,940) |
| | 8,746,632 | | 5,217,229 | | 3,552,161 | | 4,099,881 |
| Current | 8,740,567 | | 5,210,498 | | 3,545,760 | | 4,092,855 |
| Non-current | 6,065 | | 6,731 | | 6,401 | | 7,026 |
| | | | | | | | |
| Other receivables | | | | | | | |
| Other receivables | 93,844 | | 113,949 | | 93,844 | | 113,949 |
| ( - ) Adjustment to present value | (1,409) | | (156) | | (1,409) | | (156) |
| ( - ) Expected credit losses | (15,959) | | (27,389) | | (15,959) | | (27,389) |
| | 76,476 | | 86,404 | | 76,476 | | 86,404 |
| Current | 40,991 | | 43,566 | | 40,991 | | 43,566 |
| Non-current (1) | 35,485 | | 42,838 | | 35,485 | | 42,838 |
| (1) | Weighted average maturity of 2.00 years. |
| | |
BRF S.A. | INTERIM FINANCIAL INFORMATION – September 30, 2021 | 40 |
The Company performs credit assignments with no right of return to the BRF Clients’ Credit Rights Investment Fund (“FIDC BRF“), which has the sole purpose to acquire credit rights arising from commercial transactions carried out between the Company and its clients in Brazil. On September 30, 2021, FIDC BRF had an outstanding balance of R$770,894 (R$549,083 on December 31, 2020) in the parent company and consolidated related to such credit rights, which were written-off of the Company’s statement of financial position when the credits were sold.
On September 30, 2021, other receivables are mainly represented by receivables from the sale of farms and various properties, with a balance of R$59,468 (R$78,258 on December 31, 2020).
The movements of the expected credit losses are presented below:
| Parent company | Consolidated |
| | 09.30.21 | | 09.30.21 |
| Beginning balance | (555,712) | | (605,940) |
| Business combination (note 1.2) | - | | (5,605) |
| (Additions) Reversals | (8,034) | | (11,627) |
| Write-offs | 3,774 | | 9,060 |
| Exchange rate variation | (18,968) | | (19,738) |
| Ending balance | (578,940) | | (633,850) |
The aging of trade accounts receivable is as follows:
| | Parent company | | Consolidated |
| | 09.30.21 | | 12.31.20 | | 09.30.21 | | 12.31.20 |
| Not overdue | 8,739,804 | | 5,206,584 | | 3,334,545 | | 4,010,140 |
| Overdue | | | | | | | |
| 01 to 60 days | 13,884 | | 29,631 | | 228,974 | | 104,195 |
| 61 to 90 days | 1,182 | | 1,357 | | 4,837 | | 6,045 |
| 91 to 120 days | 706 | | 469 | | 3,368 | | 398 |
| 121 to 180 days | 2,635 | | 458 | | 7,206 | | 7,024 |
| 181 to 360 days | 4,847 | | 3,448 | | 10,209 | | 15,688 |
| More than 360 days | 569,590 | | 541,020 | | 607,739 | | 575,647 |
| ( - ) Adjustment to present value | (7,076) | | (10,026) | | (10,867) | | (13,316) |
| ( - ) Expected credit losses | (578,940) | | (555,712) | | (633,850) | | (605,940) |
| | 8,746,632 | | 5,217,229 | | 3,552,161 | | 4,099,881 |
| | Parent company | | Consolidated |
| | 09.30.21 | | 12.31.20 | | 09.30.21 | | 12.31.20 |
| Finished goods | 3,374,804 | | 2,162,977 | | 5,211,775 | | 3,610,585 |
| Work in progress | 230,778 | | 191,110 | | 234,600 | | 192,335 |
| Raw materials | 2,463,263 | | 1,920,891 | | 2,614,888 | | 2,046,681 |
| Packaging materials | 147,681 | | 88,359 | | 172,165 | | 92,256 |
| Secondary materials | 600,995 | | 522,125 | | 610,494 | | 531,801 |
| Supplies | 177,459 | | 173,030 | | 219,876 | | 207,033 |
| Imports in transit | 161,922 | | 107,829 | | 162,140 | | 107,829 |
| Other | 130,504 | | 75,508 | | 162,378 | | 94,816 |
| (-) Adjustment to present value | (129,339) | | (80,568) | | (129,395) | | (80,577) |
| | 7,158,067 | | 5,161,261 | | 9,258,921 | | 6,802,759 |
The movements in the write-down of inventories to the net realizable value, for which the additions, reversals and write-offs were recorded against Cost of Sales, are presented in the table below:
| | |
BRF S.A. | INTERIM FINANCIAL INFORMATION – September 30, 2021 | 41 |
| | Parent company |
| | | | | | | | 09.30.21 |
| | Realizable value through sale | Impaired inventories | Obsolete inventories | Total |
| Beginning balance | (23,957) | | (23,579) | | (7,715) | | (55,251) |
| Additions | (97,533) | | (57,022) | | (5,502) | | (160,057) |
| Reversals | 105,107 | | - | | - | | 105,107 |
| Write-offs | - | | 59,080 | | 4,730 | | 63,810 |
| Ending balance | (16,383) | | (21,521) | | (8,487) | | (46,391) |
Consolidated 09.30.21 |
| | Realizable value through sale | Impaired inventories | Obsolete inventories | Total |
| Beginning balance | (31,155) | | (29,831) | | (14,719) | | (75,705) |
| Additions | (117,668) | | (68,608) | | (7,254) | | (193,530) |
| Reversals | 124,565 | | - | | - | | 124,565 |
| Write-offs | - | | 71,824 | | 7,499 | | 79,323 |
| Business combination (note 1.2) | - | | (42) | | - | | (42) |
| Exchange rate variation | (237) | | (190) | | (226) | | (653) |
| Ending balance | (24,495) | | (26,847) | | (14,700) | | (66,042) |
| | |
BRF S.A. | INTERIM FINANCIAL INFORMATION – September 30, 2021 | 42 |
The live animals are represented by poultry and pork and segregated into consumables and animals for production. The rollforward of the biological assets are presented below:
| | Parent company |
| | | | | | | | | | | | | | | 09.30.21 |
| | Current | | Non-current |
| | Live animals | | Live animals | | | |
| | Poultry | Pork | Total | | Poultry | Pork | Forests | Total |
| Beginning balance | 783,706 | | 1,260,582 | | 2,044,288 | | | 405,030 | | 425,252 | | 324,444 | | 1,154,726 |
| Additions/Transfer | 10,097,690 | | 7,014,758 | | 17,112,448 | | | 65,259 | | 331,740 | | 29,489 | | 426,488 |
| Changes in fair value (1) | 1,835,941 | | 330,097 | | 2,166,038 | | | 84,807 | | (152,576) | | - | | (67,769) |
| Harvest | - | | - | | - | | | - | | - | | (36,945) | | (36,945) |
| Write-off | - | | - | | - | | | - | | - | | (2,067) | | (2,067) |
| Transfer between current and non-current | 72,776 | | 91,501 | | 164,277 | | | (72,776) | | (91,501) | | - | | (164,277) |
| Transfer to inventories | (11,793,780) | | (7,123,342) | | (18,917,122) | | | - | | - | | - | | - |
| Ending balance | 996,333 | | 1,573,596 | | 2,569,929 | | | 482,320 | | 512,915 | | 314,921 | | 1,310,156 |
| | | | | | | | | | | | | | | |
| | | | | | | | | | | | | | | |
| | Consolidated |
| | | | | | | | | | | | | | | 09.30.21 |
| | Current | | Non-current |
| | Live animals | | Live animals | | | |
| | Poultry | Pork | Total | | Poultry | Pork | Forests | Total |
| Beginning balance | 868,428 | | 1,260,582 | | 2,129,010 | | | 472,053 | | 425,252 | | 324,444 | | 1,221,749 |
| Additions/Transfer | 10,109,223 | | 7,014,758 | | 17,123,981 | | | 66,375 | | 331,740 | | 29,489 | | 427,604 |
| Changes in fair value (1) | 1,850,293 | | 330,097 | | 2,180,390 | | | 97,527 | | (152,576) | | - | | (55,049) |
| Harvest | - | | - | | - | | | - | | - | | (36,945) | | (36,945) |
| Write-off | - | | - | | - | | | - | | - | | (2,067) | | (2,067) |
| Transfer between current and non-current | 72,776 | | 91,501 | | 164,277 | | | (72,776) | | (91,501) | | - | | (164,277) |
| Transfer to inventories | (11,793,780) | | (7,123,342) | | (18,917,122) | | | - | | - | | - | | - |
| Exchange variation | (12,471) | | - | | (12,471) | | | (8,183) | | - | | - | | (8,183) |
| Ending balance | 1,094,469 | | 1,573,596 | | 2,668,065 | | | 554,996 | | 512,915 | | 314,921 | | 1,382,832 |
| (1) | The change in the fair value of biological assets includes depreciation of breeders and depletion of forests in the amount of R$689,098 in the parent company and R$754,783 in the consolidated. |
| | |
BRF S.A. | INTERIM FINANCIAL INFORMATION – September 30, 2021 | 43 |
The estimated balances and quantities of live animals are set forth below:
| | Parent company |
| | 09.30.21 | | 12.31.20 |
| | Quantity
(thousand of heads) | | Book value | | Quantity
(thousand of heads) | | Book value |
| Consumable biological assets | | | | | | | |
| Immature poultry | 208,670 | | 996,333 | | 178,143 | | 783,706 |
| Immature pork | 4,171 | | 1,573,596 | | 4,204 | | 1,260,582 |
| Total current | 212,841 | | 2,569,929 | | 182,347 | | 2,044,288 |
| | | | | | | | |
| | | | | | | | |
| Production biological assets | | | | | | | |
| Immature poultry | 5,653 | | 180,292 | | 6,243 | | 152,632 |
| Mature poultry | 10,089 | | 302,028 | | 10,207 | | 252,398 |
| Immature pork | 208 | | 126,619 | | 203 | | 93,466 |
| Mature pork | 454 | | 386,296 | | 457 | | 331,786 |
| Total non-current | 16,404 | | 995,235 | | 17,110 | | 830,282 |
| | 229,245 | | 3,565,164 | | 199,457 | | 2,874,570 |
| | Consolidated |
| | 09.30.21 | | 12.31.20 |
| | Quantity
(thousand of heads) | | Book value | | Quantity
(thousand of heads) | | Book value |
| Consumable biological assets | | | | | | | |
| Immature poultry | 228,202 | | 1,094,469 | | 199,877 | | 868,428 |
| Immature pork | 4,171 | | 1,573,596 | | 4,204 | | 1,260,582 |
| Total current | 232,373 | | 2,668,065 | | 204,081 | | 2,129,010 |
| | | | | | | | |
| | | | | | | | |
| Production biological assets | | | | | | | |
| Immature poultry | 6,525 | | 210,896 | | 7,320 | | 188,967 |
| Mature poultry | 11,502 | | 344,100 | | 11,395 | | 283,086 |
| Immature pork | 208 | | 126,619 | | 203 | | 93,466 |
| Mature pork | 454 | | 386,296 | | 457 | | 331,786 |
| Total non-current | 18,689 | | 1,067,911 | | 19,375 | | 897,305 |
| | 251,062 | | 3,735,976 | | 223,456 | | 3,026,315 |
The Company has forests pledged as collateral for financing and tax/civil contingencies on September 30, 2021 in the amount of R$72,677 in the parent company and in the consolidated (R$68,381 in the parent company and in the consolidated on December 31, 2020).
| | |
BRF S.A. | INTERIM FINANCIAL INFORMATION – September 30, 2021 | 44 |
The rollforward of recoverable taxes are set forth below:
| | | | | Parent company |
| | | Note | | 12.31.20 | | Additions | | Compensations / Reversals | | Transfers (1) | | Interest | | 09.30.21 |
| ICMS and VAT | | | | | | | | | | | | | | |
| Recoverable ICMS and VAT | | | | 1,483,612 | | 378,212 | | (47,470) | | (134,393) | | 180 | | 1,680,141 |
| (-) Impairment | | | | (154,721) | | (23,020) | | 28,557 | | 17,102 | | - | | (132,082) |
| PIS and COFINS | | 9.1 | | | | | | | | | | | | |
| Recoverable PIS and COFINS | | | | 3,167,001 | | 370,909 | | (888,029) | | - | | 56,880 | | 2,706,761 |
| (-) Impairment | | | | (14,228) | | - | | - | | - | | - | | (14,228) |
| IPI | | 9.2 | | | | | | | | | | | | |
| Recoverable IPI | | | | 808,524 | | 5,264 | | (460) | | - | | 76,525 | | 889,853 |
| (-) Impairment | | | | (1,984) | | - | | - | | - | | - | | (1,984) |
| INSS | | | | | | | | | | | | | | |
| Recoverable INSS | | | | 341,824 | | 13,955 | | (56,356) | | - | | 3,800 | | 303,223 |
| (-) Impairment | | | | (102) | | - | | - | | - | | - | | (102) |
| Other | | | | | | | | | | | | | | |
| Other recoverable taxes | | | | 52,115 | | 28,765 | | - | | - | | - | | 80,880 |
| (-) Impairment | | | | (1,484) | | - | | 20 | | - | | - | | (1,464) |
| | | | | 5,680,557 | | 774,085 | | (963,738) | | (117,291) | | 137,385 | | 5,510,998 |
| | | | | | | | | | | | | | | |
| Current | | | | 812,338 | | | | | | | | | | 776,456 |
| Non-current | | | | 4,868,219 | | | | | | | | | | 4,734,542 |
| | | | | | | | | | | | | | | |
| | | | | 12.31.20 | | Additions | | Compensations / Reversals | | Transfers (1) | | Restatement | | 09.30.21 |
| Income taxes | | | | | | | | | | | | | | |
| Recoverable income taxes | | | | 91,996 | | 17,572 | | (8) | | - | | 135 | | 109,695 |
| (-) Impairment | | | | (8,985) | | - | | - | | - | | - | | (8,985) |
| | | | | 83,011 | | 17,572 | | (8) | | - | | 135 | | 100,710 |
| | | | | | | | | | | | | | | |
| Current | | | | 28,888 | | | | | | | | | | 46,383 |
| Non-current | | | | 54,123 | | | | | | | | | | 54,327 |
| (1) | The transfers occur from Recoverable Taxes to Other Current Assets and Other Non-Current Assets when sales of credits are made to third parties. |
| | | | | Consolidated |
| | | Note | | 12.31.20 | | Business combination (note 1.2) | | Additions | | Compensations / Reversals | | Transfers (1) | | Interest | | Exchange variation | | 09.30.21 |
| ICMS and VAT | | | | | | | | | | | | | | | | | | |
| Recoverable ICMS and VAT | | | | 1,568,975 | | 7,523 | | 425,762 | | (108,947) | | (134,393) | | 180 | | (2,621) | | 1,756,479 |
| (-) Impairment | | | | (154,721) | | - | | (23,020) | | 28,557 | | 17,104 | | - | | - | | (132,080) |
| PIS and COFINS | | 9.1 | | | | | | | | | | | | | | | | |
| Recoverable PIS and COFINS | | | | 3,168,099 | | 35,268 | | 371,314 | | (888,864) | | - | | 56,881 | | - | | 2,742,698 |
| (-) Impairment | | | | (14,228) | | - | | - | | - | | - | | - | | - | | (14,228) |
| IPI | | 9.2 | | | | | | | | | | | | | | | | |
| Recoverable IPI | | | | 808,528 | | 1,149 | | 5,368 | | (460) | | - | | 76,526 | | - | | 891,111 |
| (-) Impairment | | | | (1,984) | | - | | - | | - | | - | | - | | - | | (1,984) |
| INSS | | | | | | | | | | | | | | | | | | |
| Recoverable INSS | | | | 341,825 | | 12 | | 13,955 | | (56,356) | | - | | 3,800 | | - | | 303,236 |
| (-) Impairment | | | | (102) | | - | | - | | - | | - | | - | | - | | (102) |
| Other | | | | | | | | | | | | | | | | | | |
| Other recoverable taxes | | | | 52,889 | | 3,995 | | 28,768 | | (1,408) | | - | | - | | (34) | | 84,210 |
| (-) Impairment | | | | (1,963) | | - | | - | | 20 | | - | | - | | - | | (1,943) |
| | | | | 5,767,318 | | 47,947 | | 822,147 | | (1,027,458) | | (117,289) | | 137,387 | | (2,655) | | 5,627,397 |
| | | | | | | | | | | | | | | | | | | |
| Current | | | | 899,120 | | | | | | | | | | | | | | 883,740 |
| Non-current | | | | 4,868,198 | | | | | | | | | | | | | | 4,743,657 |
| | | | | | | | | | | | | | | | | | | |
| | | | | 12.31.20 | | Business combination | | Additions | | Compensations / Reversals | | Transfers (1) | | Interest | | Exchange variation | | 09.30.21 |
| Income taxes | | | | | | | | | | | | | | | | | | |
| Recoverable income taxes | | | | 107,728 | | 922 | | 69,015 | | (13,634) | | - | | 135 | | (337) | | 163,829 |
| (-) Impairment | | | | (9,029) | | - | | - | | - | | - | | - | | - | | (9,029) |
| | | | | 98,699 | | 922 | | 69,015 | | (13,634) | | - | | 135 | | (337) | | 154,800 |
| | | | | | | | | | | | | | | | | | | |
| Current | | | | 43,840 | | | | | | | | | | | | | | 94,936 |
| Non-current | | | | 54,859 | | | | | | | | | | | | | | 59,864 |
| (1) | The transfers occur from Recoverable Taxes to Other Current Assets and Other Non-Current Assets when sales of credits are made to third parties. |
| | |
BRF S.A. | INTERIM FINANCIAL INFORMATION – September 30, 2021 | 45 |
| 9.1. | PIS and COFINS –Social Integration Plan and Contribution for Social Security Financing |
On December 7, 2020 and July 13, 2021, the processes filed by Batávia S.A. (subsidiary incorporated by BRF S.A.) and UP! Alimentos Ltda. (an entity jointly controlled by BRF S.A., whose operations were closed), respectively, granting the Company the right to exclude ICMS from the PIS and COFINS calculation basis. The Company, supported by its consultants, obtained the fiscal files for the period and reconciled them with the accessory obligations, measuring the credits reliably through the ICMS presented in the invoices. Thus, the amount of R$90,935 was recognized under Recoverable PIS and COFINS, being R$40,501 of principal recorded in Other Operating Income and R$50,434 of interests recorded in Financial Income.
As of September 30, 2021, the updated balance of the processes related to the exclusion of the ICMS from the PIS and COFINS calculation basis recognized by the Company is R$2,396,028 (R$2,818,391 as of December 31, 2020). The amount of R$554,287 related do these credits was offset against other federal taxes in the nine-month period ended on September 30, 2021 (null in the same period of the previous year).
In the study prepared by the Management, its realization is estimated through offsetting with federal taxes or through reimbursement of the amounts as expected below:
| | PIS and COFINS |
| Current | 499,000 |
| Non-current | 1,897,028 |
| October to december 2022 | 327,516 |
| 2023 | 537,000 |
| 2024 | 672,000 |
| 2025 | 360,512 |
| | 2,396,028 |
| 9.2. | IPI - Industrialized Product Tax |
The Company recognized relevant tax assets as result of gains from lawsuits related to IPI, specially “crédito prêmio”. The balance referring to these assets in the parent company and consolidated on September 30, 2021 is R$938,824 (R$860,820 on December 31, 2020), of which R$881,527 (R$805,001 on December 31, 2020) is recorded as Recoverable Taxes and the remainder, referring to cases in which the government will reimburse in cash, is recorded as Other Current Assets, in the amount of R$40,370 (the same amount on December 31, 2020) and as Other Non-Current Assets, in the amount of R$16,927 (R$15,449 on December 31, 2020).
In the study prepared by the Management, its realization is estimated through the refund of the amounts as expected below:
| | IPI |
| Current | 40,370 |
| Non-current | 898,454 |
| October to december 2022 | 16,927 |
| 2025 | 647,252 |
| 2026 | 234,275 |
| | 938,824 |
| 9.3. | Realization of Brazilian federal tax credits |
The Company received in cash, through court orders related to IPI credits, the amount of R$1,368 in the nine-month period ended on September 30, 2021 in the parent company and consolidated (R$235,405 in the same period of the previous year).
The Company used PIS, COFINS, IPI, IRPJ, CSLL, INSS and other tax credits to offset federal taxes payable such as INSS and Income Taxes in the amount of R$944,853 in the parent company and consolidated in the nine-month period ended September 30, 2021 (R$694,206 in the parent company and consolidated in the same period of the previous year), preserving its liquidity and optimizing its capital structure.
| | |
BRF S.A. | INTERIM FINANCIAL INFORMATION – September 30, 2021 | 46 |
| | Parent company | | Consolidated |
| | 09.30.21 | | 12.31.20 | | 09.30.21 | | 12.31.20 |
| Assets | | | | | | | |
| Tax losses carryforward | 2,052,840 | | 2,052,843 | | 2,065,129 | | 2,060,846 |
| Negative calculation basis (social contribution) | 769,405 | | 769,402 | | 773,829 | | 772,283 |
| | | | | | | | |
| Temporary differences - Assets | | | | | | | |
| Provisions for tax, civil and labor risks | 476,563 | | 458,019 | | 479,238 | | 458,019 |
| Suspended collection taxes | 2,754 | | 1,871 | | 2,754 | | 1,871 |
| Expected credit losses | 180,720 | | 194,969 | | 180,735 | | 194,977 |
| Impairment on tax credits | 56,136 | | 67,900 | | 56,136 | | 67,900 |
| Provision for other obligations | 101,457 | | 115,959 | | 106,406 | | 115,959 |
| Employees' profit sharing | 24,646 | | 86,752 | | 24,646 | | 86,752 |
| Write-down to net realizable value of inventories | 16,092 | | 19,184 | | 17,461 | | 19,189 |
| Employees' benefits plan | 226,694 | | 216,510 | | 242,815 | | 216,510 |
| Lease basis difference | 111,216 | | 86,308 | | 111,216 | | 86,308 |
| Adjustment to the expcted annual rate | 557,112 | | - | | 557,112 | | - |
| Other temporary differences | 13,131 | | 10,632 | | 21,624 | | 40,028 |
| | 4,588,766 | | 4,080,349 | | 4,639,101 | | 4,120,642 |
| | | | | | | | |
| Temporary differences - Liabilities | | | | | | | |
| Goodwill amortization basis difference | (292,732) | | (320,729) | | (292,732) | | (320,729) |
| Depreciation (useful life) basis difference | (881,339) | | (851,436) | | (871,534) | | (851,436) |
| Business combination (1) | (888,918) | | (740,385) | | (909,127) | | (761,429) |
| Unrealized gains on derivatives, net | (18,045) | | (42,493) | | (18,045) | | (42,493) |
| Unrealized fair value gains, net | (33,203) | | (39,269) | | (32,340) | | (39,269) |
| Other temporary differences | (19,860) | | (17,268) | | (44,800) | | (22,749) |
| | (2,134,097) | | (2,011,580) | | (2,168,578) | | (2,038,105) |
| | | | | | | | |
| Total deferred taxes | 2,454,669 | | 2,068,769 | | 2,470,523 | | 2,082,537 |
| | | | | | | | |
| Total Assets | 2,454,669 | | 2,068,769 | | 2,505,005 | | 2,109,064 |
| Total Liabilities | - | | - | | (34,482) | | (26,527) |
| | 2,454,669 | | 2,068,769 | | 2,470,523 | | 2,082,537 |
| (1) | The deferred tax asset on the Sadia business combination was recorded on the amortization difference between the accounting and tax goodwill calculated as of the purchase price allocation date. The deferred tax liability on the Sadia business combination is substantially represented by the allocation of goodwill to property, plant and equipment, brands and contingent liabilities. |
The roll-forward of deferred income taxes, net, is set forth below:
| Parent company | Consolidated |
| | 09.30.21 | | 09.30.21 |
| Beginning balance | 2,068,769 | | 2,082,537 |
| Deferred taxes on profit recognized in income of continuing operations | 257,446 | | 271,803 |
| Deferred income taxes recognized in other comprehensive income | 116,986 | | 116,986 |
| Deferred taxes on profit recognized in income of discontinued operations | 11,468 | | 11,468 |
| Other (1) | - | | (12,271) |
| Ending balance | 2,454,669 | | 2,470,523 |
| (1) | Related to the foreign exchange variation effect on the balances in foreign companies. |
| | |
BRF S.A. | INTERIM FINANCIAL INFORMATION – September 30, 2021 | 47 |
| 10.2. | Estimated period of realization |
Deferred tax assets arising from temporary differences will be realized as the differences are settled or realized. The period of settlement or realization of such differences is subject to externalities and is linked to several factors that are not under the control of Management.
In estimating the realization of deferred tax credits on tax losses carryforward, Management considers its budget and strategic plans, which were approved by the Board of Directors, adjusted based on the estimates of the main tax additions and exclusions. The recoverability study is reviewed by the Fiscal Council and approved by the Board of Directors. Based on this estimate, Management believes that it is probable that these deferred tax credits will be realized, as presented below:
| | Parent company | | Consolidated |
| 2021 | 111,727 | | 111,727 |
| 2022 | 140,612 | | 140,612 |
| 2023 | 230,254 | | 231,408 |
| 2024 | 288,074 | | 291,677 |
| 2025 | 329,733 | | 335,681 |
| 2026 to 2028 | 1,035,323 | | 1,035,323 |
| 2029 onwards | 686,522 | | 692,530 |
| | 2,822,245 | | 2,838,958 |
The Company has tax losses carryforward in Brazil, which at current tax rates represent R$5,381,785 on September 30, 2021 (R$4,589,674 on December 31, 2020). Within this amount, R$2,822,245 on September 30, 2021 and on December 31, 2020 are recognized as an asset, according to the recoverability expectation above. The deferred tax credits on tax losses and negative social contribution basis related to the parent company and its subsidiaries domiciled in Brazil do not expire and the use to offset income taxes payable is limited to 30% of future taxable income.
| 10.3. | Effective income tax rate reconciliation |
| | Parent company | | Consolidated |
| | | | 2021 | | | | 2020 | | | | 2021 | | | | 2020 |
| | Jul - Sep | | Jan - Sep | | Jul - Sep | | Jan - Sep | | Jul - Sep | | Jan - Sep | | Jul - Sep | | Jan - Sep |
| | | | | | | | | | | | | | | | |
| Income (loss) before taxes - continued operations | (249,750) | | (455,370) | | 259,958 | | 569,673 | | (254,478) | | (408,263) | | 307,658 | | 652,752 |
| Nominal tax rate | 34% | | 34% | | 34% | | 34% | | 34% | | 34% | | 34% | | 34% |
| Expense at nominal rate | 84,915 | | 154,826 | | (88,386) | | (193,689) | | 86,523 | | 138,809 | | (104,604) | | (221,936) |
| Adjustments to income taxes | | | | | | | | | | | | | | | |
| Income from associates and joint ventures | 260,864 | | 24,616 | | 380,359 | | 2,445,353 | | - | | - | | - | | - |
| Difference of tax rates on results of foreign subsidiaries | - | | - | | - | | - | | 3,969 | | 26,062 | | 62,127 | | 1,060,802 |
| Difference of functional currency of foreign subsidiaries | - | | - | | - | | - | | 264,645 | | (25,589) | | 289,404 | | 1,343,322 |
| Deferred tax assets not recognized (1) | (420,364) | | (792,387) | | (136,621) | | (2,427,841) | | (420,364) | | (792,387) | | (136,621) | | (2,427,841) |
| Share-based payment | (6,928) | | (18,215) | | (11,906) | | (16,718) | | (6,928) | | (18,215) | | (11,906) | | (16,718) |
| Penalties | (3,686) | | (7,008) | | 367 | | (5,813) | | (3,690) | | (7,012) | | 367 | | (5,813) |
| Investment grant | 25,293 | | 59,454 | | 21,441 | | 40,955 | | 25,293 | | 59,454 | | 21,441 | | 40,955 |
| Adjustment to the expcted annual rate | 38,464 | | 557,112 | | (216,245) | | 58,806 | | 38,464 | | 557,112 | | (216,245) | | 58,806 |
| Other permanent differences | (4,408) | | 22,958 | | 7,824 | | 4,014 | | (4,417) | | 22,948 | | 7,088 | | 3,277 |
| | (25,850) | | 1,356 | | (43,167) | | (94,933) | | (16,505) | | (38,818) | | (88,949) | | (165,146) |
| | | | | | | | | | | | | | | | |
| Effective rate | -10.4% | | 0.3% | | 16.6% | | 16.7% | | -6.5% | | -9.5% | | 28.9% | | 25.3% |
| | | | | | | | | | | | | | | | |
| Current tax | - | | (256,090) | | - | | - | | 5,020 | | (310,621) | | (8,363) | | (46,695) |
| Deferred tax | (25,850) | | 257,446 | | (43,167) | | (94,933) | | (21,525) | | 271,803 | | (80,586) | | (118,451) |
| (1) | Amount related to the non-recognition of deferred tax on tax losses carryforward in the amount of R$2,330,550 in the parent company and in the consolidated, due to limited capacity of realization (note 10.2). |
The Company’s management determined that the total profits recorded by the holdings of its wholly-owned subsidiaries abroad will not be redistributed. Such funds will be used for investments in the wholly-owned subsidiaries.
Income tax returns in Brazil are subject to review by the tax authorities for a period of five years from the date of their delivery. The Company may be subject to additional collection of taxes, fines and interest as a result of these reviews. The results obtained by subsidiaries abroad are subject to taxation in accordance with the tax laws of each country.
| | |
BRF S.A. | INTERIM FINANCIAL INFORMATION – September 30, 2021 | 48 |
The rollforward of the judicial deposits is set forth below:
| | Parent company |
| | | | | | | | 09.30.21 |
| | Tax | Labor | Civil, commercial and other | Total |
| Beginning balance | 248,990 | | 269,747 | | 34,539 | | 553,276 |
| Additions | 5,002 | | 78,162 | | 8,956 | | 92,120 |
| Release in favor of the Company | (1,728) | | (31,309) | | (817) | | (33,854) |
| Release in favor of the counterparty | (207) | | (93,479) | | (3,168) | | (96,854) |
| Interest | 2,802 | | 19,972 | | 2,308 | | 25,082 |
| Ending balance | 254,859 | | 243,093 | | 41,818 | | 539,770 |
| | Consolidated |
| | | | | | | | 09.30.21 |
| | Tax | Labor | Civil, commercial and other | Total |
| Beginning balance | 248,990 | | 269,812 | | 34,539 | | 553,341 |
| Additions | 5,005 | | 78,478 | | 8,956 | | 92,439 |
| Release in favor of the Company | (1,728) | | (31,350) | | (817) | | (33,895) |
| Release in favor of the counterparty | (207) | | (93,479) | | (3,168) | | (96,854) |
| Business combination (note 1.2) | 2,132 | | 859 | | - | | 2,991 |
| Interest | 2,811 | | 19,972 | | 2,308 | | 25,091 |
| Exchange rate variation | - | | (7) | | - | | (7) |
| Ending balance | 257,003 | | 244,285 | | 41,818 | | 543,106 |
| | |
BRF S.A. | INTERIM FINANCIAL INFORMATION – September 30, 2021 | 49 |
The rollforward of the direct investments in subsidiaries and affiliates of the parent company is set forth below:
| | Subsidiaries | | Affiliates | |
| | BRF Energia S.A. | | BRF GmbH | | Establec. Levino Zaccardi | | BRF Pet S.A. | | BRF Austria GmbH | | PSA Labor. Veter. Ltda | | Hercosul International S.R.L. | | Sadia Alimentos S.A. | | Proud Food Lda | | Sadia International Ltd. | | Sadia Uruguay S.A. | | Sadia Chile S.A. | | Eclipse Holding Cooperatief | | VIP S.A. Empr. e Particip. Imob | | PP-BIO
Adm. Bem próprio S.A. | | PR-SAD
Adm. Bem próprio S.A. | | Total |
| | | | | | | | | | | | | | | | | | 09.30.21 |
| a) Participation as of September 30, 2021 | | | | | | | | | | | | | | | | | | | | | | | | | | | | | | | | | |
| % of participation | 100.00% | | 100.00% | | 99.99% | | 100.00% | | 100.00% | | 99.99% | | 1.00% | | 43.10% | | 10.00% | | 100.00% | | 100.00% | | 60.00% | | 0.01% | | 100.00% | | 33.33% | | 33.33% | | |
| Total quantity of shares and quotas | 7,176,530 | | 1 | | 9,918,875 | | 228,389,352 | | 100 | | 5,463,850 | | 200,000 | | 594,576,682 | | 150,000 | | - | | 2,352,881,073 | | 3,027,987,368 | | 10,000 | | 14,249,459 | | - | | - | | |
| Quantity of shares and quotas held | 7,176,530 | | 1 | | 9,918,538 | | 228,389,352 | | 100 | | 5,463,849 | | 2,000 | | 256,253,695 | | 15,000 | | - | | 2,352,881,073 | | 1,816,792,421 | | 1 | | 14,249,459 | | - | | - | | |
| | | | | | | | | | | | | | | | | | | | | | | | | | | | | | - | | | | |
| b) Information as of September 30, 2021 | | | | | | | | | | | | | | | | | | | | | | | | | | | | | | | | | |
| Share capital | 1,311 | | 6,523 | | 1,765 | | 151,064 | | 120 | | 5,564 | | 63,362 | | 338,054 | | 3 | | - | | 497,012 | | 16,169 | | 334,999 | | 1,311 | | - | | - | | |
| Shareholders' equity | 711 | | 11,537,642 | | (238) | | 129,728 | | 14,491 | | 5,465 | | 32,264 | | 4,828 | | 5,510 | | - | | 91,569 | | (58,798) | | (146) | | 2,332 | | - | | - | | |
| Goodwill | - | | - | | - | | - | | - | | - | | 410 | | - | | - | | - | | - | | - | | - | | - | | - | | - | | |
| Income (loss) for the year | 193 | | 141,283 | | (313) | | (7,714) | | (50,294) | | 64 | | 252 | | 1,919 | | 3,432 | | 2,219 | | (758) | | (20,370) | | (14,376) | | 25 | | - | | - | | |
| | | | | | | | | | | | | | | | | | | | | | | | | | | | | | | | | | |
| c) Movements of investments | | | | | | | | | | | | | | | | | | | | | | | | | | | | | | | | | |
| Beginning balance (12.31.20) | 518 | | 11,455,186 | | 51 | | 14,412 | | 314,811 | | 5,402 | | - | | 1,130 | | 154 | | 29,557 | | 89,924 | | - | | - | | 2,307 | | 2,591 | | 5,699 | | 11,921,742 |
| Result Movements | | | | | | | | | | | | | | | | | | | | | | | | | | | | | | | | | |
| Income (loss) | 193 | | 141,283 | | (313) | | (7,663) | | (50,294) | | 64 | | 3 | | 927 | | 343 | | 2,219 | | (1,150) | | (13,236) | | (1) | | 25 | | - | | - | | 72,400 |
| Capital movements | | | | | | | | | | | | | | | | | | | | | | | | | | | | | | | | | |
| Capital increase (reduction) | - | | - | | - | | 118,400 | | - | | - | | - | | - | | - | | (31,002) | | - | | - | | - | | - | | 114 | | 618 | | 88,130 |
| Advance for future capital increase | - | | - | | - | | 918,675 | | - | | - | | - | | - | | - | | - | | - | | - | | - | | - | | - | | - | | 918,675 |
| Capital transaction between subsidiaries | - | | 504 | | - | | - | | - | | - | | - | | - | | - | | - | | - | | - | | - | | - | | - | | - | | 504 |
| Acquisition (sale) of equity interest | - | | - | | - | | - | | - | | - | | 712 | | - | | - | | - | | - | | - | | - | | - | | (2,705) | | - | | (1,993) |
| Goodwill on acquisition of non-controlling interests | - | | - | | - | | - | | (79,673) | | - | | - | | - | | - | | - | | - | | - | | - | | - | | - | | - | | (79,673) |
| Other | | | | | | | | | | | | | | | | | | | | | | | | | | | | | | | | | |
| Other comprehensive income | - | | (33,788) | | 24 | | 4,579 | | (170,353) | | - | | 18 | | 22 | | 54 | | (774) | | 2,795 | | 2,602 | | - | | - | | - | | - | | (194,821) |
| Constitution (reversal) of provision for loss | - | | - | | 238 | | - | | - | | - | | - | | - | | - | | - | | - | | 10,634 | | 1 | | - | | - | | - | | 10,873 |
| Discontinued operations | - | | (25,543) | | - | | - | | - | | - | | - | | - | | - | | - | | - | | - | | - | | - | | - | | - | | (25,543) |
| Ending balance (09.30.21) | 711 | | 11,537,642 | | - | | 1,048,403 | | 14,491 | | 5,466 | | 733 | | 2,079 | | 551 | | - | | 91,569 | | - | | - | | 2,332 | | - | | 6,317 | | 12,710,294 |
The Company owns other investments in the amount of R$583 in the parent company and R$593 in the consolidated (R$583 in the parent company and in the consolidated as of December 31, 2020).
On September 30, 2021, these associates, affiliates and joint ventures do not have any restriction to amortize their loans or advances to the Company.
| | |
BRF S.A. | INTERIM FINANCIAL INFORMATION – September 30, 2021 | 50 |
| 13. | PROPERTY, PLANT AND EQUIPMENT, NET |
The rollforward of property, plant and equipment is set forth below:
| | Parent company |
| | Average rate (1) | | 12.31.20 | | Additions | | Disposals | | Transfers (2) | | 09.30.21 |
| Cost | | | | | | | | | | | |
| Land | | | 560,856 | | 3,581 | | (5,577) | | 8,043 | | 566,903 |
| Buildings, facilities and improvements | | | 9,772,665 | | 218,296 | | (114,027) | | 395,883 | | 10,272,817 |
| Machinery and equipment | | | 7,864,533 | | 102,865 | | (168,632) | | 163,071 | | 7,961,837 |
| Furniture and fixtures | | | 106,031 | | 349 | | (1,824) | | 6,183 | | 110,739 |
| Vehicles | | | 209,770 | | 1,811 | | (2,933) | | 724 | | 209,372 |
| Construction in progress | | | 595,353 | | 951,130 | | - | | (589,285) | | 957,198 |
| Advances to suppliers | | | 923 | | 2,467 | | - | | - | | 3,390 |
| | | | 19,110,131 | | 1,280,499 | | (292,993) | | (15,381) | | 20,082,256 |
| | | | | | | | | | | | |
| Depreciation | | | | | | | | | | | |
| Land (3) | 20.97% | | (12,648) | | (6,486) | | 489 | | - | | (18,645) |
| Buildings, facilities and improvements | 9.54% | | (3,683,103) | | (463,541) | | 68,303 | | (3,457) | | (4,081,798) |
| Machinery and equipment | 7.04% | | (4,127,347) | | (370,583) | | 157,016 | | 2,782 | | (4,338,132) |
| Furniture and fixtures | 6.67% | | (54,722) | | (3,953) | | 1,252 | | 667 | | (56,756) |
| Vehicles | 27.33% | | (63,753) | | (42,171) | | 1,641 | | 1 | | (104,282) |
| | | | (7,941,573) | | (886,734) | | 228,701 | | (7) | | (8,599,613) |
| | | | 11,168,558 | | 393,765 | | (64,292) | | (15,388) | | 11,482,643 |
| (1) | Weighted average annual rate. |
| (2) | Refers to the transfer of R$23,431 for intangible assets and R$8,043 from assets held for sale. |
| (3) | Land depreciation refers to right-of-use assets. The amount of R$3,083 of depreciation was recognized in the cost of formation of forests and will be realized in the result according to the depletion (note 18.1). |
| | |
BRF S.A. | INTERIM FINANCIAL INFORMATION – September 30, 2021 | 51 |
| | Consolidated |
| | Average rate (1) | | 12.31.20 | | Additions | | Disposals | | Business combination (note 1.2) | | Transfers (2) | | Exchange rate variation | | 09.30.21 |
| Cost | | | | | | | | | | | | | | | |
| Land | | | 608,389 | | 4,799 | | (6,879) | | 11,351 | | 97,103 | | (1,590) | | 713,173 |
| Buildings, facilities and improvements | | | 10,444,526 | | 398,380 | | (123,275) | | 102,640 | | 307,450 | | (3,068) | | 11,126,653 |
| Machinery and equipment | | | 8,395,520 | | 109,967 | | (184,601) | | 230,504 | | 186,388 | | 10,509 | | 8,748,287 |
| Furniture and fixtures | | | 157,085 | | 671 | | (5,020) | | 5,583 | | 6,480 | | (3,058) | | 161,741 |
| Vehicles | | | 346,218 | | 46,355 | | (23,460) | | 10,665 | | 724 | | 2,049 | | 382,551 |
| Construction in progress | | | 608,255 | | 1,015,219 | | (4) | | 9,915 | | (613,508) | | 2,436 | | 1,022,313 |
| Advances to suppliers | | | 12,748 | | 21,934 | | - | | - | | (16) | | (1,360) | | 33,306 |
| | | | 20,572,741 | | 1,597,325 | | (343,239) | | 370,658 | | (15,379) | | 5,918 | | 22,188,024 |
| | | | | | | | | | | | | | | | |
| Depreciation | | | | | | | | | | | | | | | |
| Land (3) | 15.34% | | (13,800) | | (8,963) | | 1,734 | | - | | (11,335) | | (1,169) | | (33,533) |
| Buildings, facilities and improvements | 9.09% | | (3,851,225) | | (598,869) | | 75,706 | | (34,462) | | 7,876 | | (5,586) | | (4,406,560) |
| Machinery and equipment | 6.93% | | (4,304,007) | | (402,819) | | 166,577 | | (110,145) | | 2,777 | | (7,387) | | (4,655,004) |
| Furniture and fixtures | 6.66% | | (79,924) | | (8,597) | | 4,023 | | (2,713) | | 672 | | 1,529 | | (85,010) |
| Vehicles | 25.25% | | (108,205) | | (77,548) | | 14,653 | | (8,628) | | 1 | | (5,448) | | (185,175) |
| | | | (8,357,161) | | (1,096,796) | | 262,693 | | (155,948) | | (9) | | (18,061) | | (9,365,282) |
| | | | 12,215,580 | | 500,529 | | (80,546) | | 214,710 | | (15,388) | | (12,143) | | 12,822,742 |
| (1) | Weighted average annual rate. |
| (2) | Refers to the transfer of R$23,431 for intangible assets and R$8,043 from assets held for sale. |
| (3) | Land depreciation refers to right-of-use assets. The amount of R$3,083 of depreciation was recognized in the cost of formation of forests and will be realized in the result according to the depletion (note 18.1). |
| | |
BRF S.A. | INTERIM FINANCIAL INFORMATION – September 30, 2021 | 52 |
The amount of capitalized borrowing costs during the nine-month period ended on September 30, 2021 was of R$36,620 in the parent company and in the consolidated (R$13,745 in the parent company and in the consolidated in the same period of the previous year) and during the three-month period ended on September 30, 2021 was of R$13,278 in the parent company and in the consolidated (R$5,357 in the parent company and in the consolidated in the same period of the previous year).
The weighted average rate used to determine the amount of borrowing costs subject to capitalization was 7.27% p.a. in the parent company and in the consolidated (6.15% p.a. in the parent company and in the consolidated in the same period of the previous year).
The book value of the property, plant and equipment items that are pledged as collateral for transactions of different natures are set forth below:
| | | Parent company and Consolidated |
| | | Type of collateral | | 09.30.21 | | 12.31.20 |
| Land | | Financial/Tax | | 150,852 | | 223,918 |
| Buildings, facilities and improvements | | Financial/Tax | | 1,204,773 | | 1,491,531 |
| Machinery and equipment | | Financial/Labor/Tax/Civil | | 1,288,772 | | 1,470,295 |
| Furniture and fixtures | | Financial/Tax | | 15,034 | | 15,700 |
| Vehicles | | Financial/Tax | | 305 | | 294 |
| | | | | 2,659,736 | | 3,201,738 |
The intangible assets rollforward is set forth below:
| | | | Parent company |
| | Average rate (1) | | 12.31.20 | | Additions | | Disposals | | Transfers | | 09.30.21 |
| Cost | | | | | | | | | | | |
| Goodwill | | | 1,783,655 | | - | | - | | - | | 1,783,655 |
| Trademarks | | | 1,152,885 | | - | | - | | - | | 1,152,885 |
| Non-compete agreement | | | 71,764 | | 378 | | (3,079) | | - | | 69,063 |
| Outgrowers relationship | | | 5,328 | | 197 | | - | | - | | 5,525 |
| Patents | | | 6,205 | | - | | (3,720) | | - | | 2,485 |
| Software | | | 613,041 | | 5,214 | | (575) | | 142,914 | | 760,594 |
| Intangible in progress | | | 45,918 | | 131,968 | | - | | (119,488) | | 58,398 |
| | | | 3,678,796 | | 137,757 | | (7,374) | | 23,426 | | 3,832,605 |
| | | | | | | | | | | | |
| Amortization | | | | | | | | | | | |
| Non-compete agreement | 42.41% | | (69,089) | | (2,165) | | 3,079 | | - | | (68,175) |
| Outgrowers relationship | 15.82% | | (4,695) | | (439) | | - | | - | | (5,134) |
| Patents | 10.00% | | (5,997) | | (18) | | 3,720 | | - | | (2,295) |
| Software | 40.73% | | (412,539) | | (137,512) | | 457 | | 5 | | (549,589) |
| | | | (492,320) | | (140,134) | | 7,256 | | 5 | | (625,193) |
| | | | 3,186,476 | | (2,377) | | (118) | | 23,431 | | 3,207,412 |
| (1) | Weighted average annual rate. |
| | |
BRF S.A. | INTERIM FINANCIAL INFORMATION – September 30, 2021 | 53 |
| | | | Consolidated |
| | Average rate (1) | | 12.31.20 | | Additions | | Disposals | | Business combination (note 1.2) | | Transfers | | Exchange rate variation | 09.30.21 |
| Cost | | | | | | | | | | | | | | |
| Goodwill | | | 2,935,577 | | - | | (6,145) | | 1,061,987 | | - | | 40,012 | 4,031,431 |
| Trademarks | | | 1,327,738 | | - | | - | | 275 | | - | | (21,752) | 1,306,261 |
| Non-compete agreement | | | 107,162 | | 378 | | (3,079) | | - | | - | | 1,652 | 106,113 |
| Outgrowers relationship | | | 5,328 | | 197 | | - | | - | | - | | - | 5,525 |
| Patents | | | 6,205 | | - | | (3,723) | | - | | - | | 3 | 2,485 |
| Customer relationship | | | 1,067,713 | | - | | - | | - | | - | | (3,161) | 1,064,552 |
| Software | | | 657,255 | | 5,218 | | (581) | | 7,836 | | 143,434 | | (324) | 812,838 |
| Intangible in progress | | | 46,054 | | 132,856 | | - | | - | | (120,008) | | (14) | 58,888 |
| | | | 6,153,032 | | 138,649 | | (13,528) | | 1,070,098 | | 23,426 | | 16,416 | 7,388,093 |
| | | | | | | | | | | | | | | |
| Amortization | | | | | | | | | | | | | | |
| Non-compete agreement | 21.56% | | (97,408) | | (7,596) | | 3,079 | | - | | - | | (1,447) | (103,372) |
| Outgrowers relationship | 15.82% | | (4,695) | | (439) | | - | | - | | - | | - | (5,134) |
| Patents | 10.00% | | (5,999) | | (18) | | 3,723 | | - | | - | | (1) | (2,295) |
| Customer relationship | 7.39% | | (375,131) | | (59,525) | | - | | - | | - | | (2,236) | (436,892) |
| Software | 40.48% | | (449,697) | | (140,218) | | 463 | | (6,010) | | 5 | | 102 | (595,355) |
| | | | (932,930) | | (207,796) | | 7,265 | | (6,010) | | 5 | | (3,582) | (1,143,048) |
| | | | 5,220,102 | | (69,147) | | (6,263) | | 1,064,088 | | 23,431 | | 12,834 | 6,245,045 |
| (1) | Weighted average annual rate. |
During the nine-month period ended on September 30, 2021, Management did not identify any event that could indicate an impairment of such assets.
| | |
BRF S.A. | INTERIM FINANCIAL INFORMATION – September 30, 2021 | 54 |
| | Parent company |
| | Charges (p.a.) | | Average rate (1) | | WAMT (2) | | 12.31.20 | | Borrowing | | Amortization | | Interest paid | | Interest accrued | | Exchange rate variation | | 09.30.21 |
| Local currency | | | | | | | | | | | | | | | | | | | |
| Working capital | Fixed | | 5.23%
(3.25% on 12.31.20) | | 0.9 | | 368,681 | | 300,000 | | (363,962) | | (11,466) | | 8,725 | | - | | 301,978 |
| Certificate of agribusiness receivables (3) | IPCA | | 15.58%
(10.21% on 12.31.20) | | 2.2 | | 821,093 | | - | | - | | 95 | | 100,446 | | - | | 921,634 |
| Export credit facility (4) | Fixed / CDI / FX USD | | 8.82% (3.69% on 12.31.20) | | 1.2 | | 2,408,697 | | - | | - | | (107,941) | | 84,154 | | 96,642 | | 2,481,552 |
| Debentures | CDI / IPCA | | 14.36%
(8.28% on 12.31.20) | | 7.6 | | 3,022,005 | | 965,549 | | - | | (143,009) | | 282,313 | | - | | 4,126,858 |
| | | | | | | | | | | | | | | | | | | | |
| Fiscal incentives | Fixed | | 2.40%
(2.40% on 12.31.20) | | - | | 44,816 | | 63,700 | | (82,401) | | (627) | | 647 | | - | | 26,135 |
| | | | | | | | | | | | | | | | | | | | |
| | | | | | | | 6,665,292 | | 1,329,249 | | (446,363) | | (262,948) | | 476,285 | | 96,642 | | 7,858,157 |
| | | | | | | | | | | | | | | | | | | | |
| Foreign currency | | | | | | | | | | | | | | | | | | | |
| Bonds | Fixed / FX USD and EUR | | 4.92%
(4.91% on 12.31.20) | | 13.2 | | 12,252,326 | | - | | (312,741) | | (642,178) | | 574,714 | | 491,774 | | 12,363,895 |
| Export credit facility | Fixed / LIBOR /FX USD | | 8.82%
(3.13% on 12.31.20) | | 1.2 | | 392,636 | | - | | (135,668) | | (6,649) | | 7,625 | | 18,173 | | 276,117 |
| Advances for foreign exchange rate contracts | Fixed / FX USD | | 1.29% | | 0.4 | | - | | 249,000 | | - | | - | | 401 | | 9,829 | | 259,230 |
| | | | | | | | 12,644,962 | | 249,000 | | (448,409) | | (648,827) | | 582,740 | | 519,776 | | 12,899,242 |
| | | | | | | | 19,310,254 | | 1,578,249 | | (894,772) | | (911,775) | | 1,059,025 | | 616,418 | | 20,757,399 |
| | | | | | | | | | | | | | | | | | | | |
| Current | | | | | | | 811,919 | | | | | | | | | | | | 2,421,940 |
| Non-current | | | | | | | 18,498,335 | | | | | | | | | | | | 18,335,459 |
| (1) | Weighted average annual rate. |
| (2) | Weighted average maturity in years. |
| (3) | The Certificates of Agribusiness Receivables (“CRA”) issued by the Company are backed by receivables of BRF S.A. from certain subsidiaries abroad. |
| (4) | The Export Credit Facility was issued in Reais simultaneously and in connection with a foreign exchange rate swap, resulting essentially in a net cash flow in U.S. Dollars. As the transactions are inseparable, both are recorded together under Loans and Borrowings by their amortized cost. |
The maturity schedule of the loans and borrowings is presented on note 24.3.
| | |
BRF S.A. | INTERIM FINANCIAL INFORMATION – September 30, 2021 | 55 |
| | Consolidated |
| | Charges (p.a.) | | Average rate (1) | | WAMT (2) | | 12.31.20 | | Borrowing | | Business combination (note 1.2) | | Amortization | | Interest paid | | Interest accrued | | Exchange rate variation | | 09.30.21 |
| Local currency | | | | | | | | | | | | | | | | | | | | | |
| Working capital | Fixed / CDI | | 5.36%
(3.25% on 12.31.20) | | 1.0 | | 368,681 | | 300,000 | | 25,950 | | (364,451) | | (11,466) | | 8,764 | | - | | 327,478 |
| Certificate of agribusiness receivables (3) | IPCA | | 15.58%
(10.21% on 12.31.20) | | 2.2 | | 821,093 | | - | | - | | - | | 95 | | 100,446 | | - | | 921,634 |
| Development bank credit lines | TJLP / TLP/ IPCA / FINAME | | 3.13% | | 6.1 | | - | | - | | 9,006 | | (344) | | - | | 14 | | - | | 8,676 |
| Debentures | CDI / IPCA | | 14.36%
(8.28% on 12.31.20) | | 7.6 | | 3,022,005 | | 965,549 | | - | | - | | (143,009) | | 282,313 | | - | | 4,126,858 |
| Export credit facility (4) | Fixed / CDI / FX USD | | 8.40% (3.69% on 12.31.20) | | 1.2 | | 2,408,697 | | - | | 20,456 | | (524) | | (107,941) | | 84,278 | | 96,641 | | 2,501,607 |
| | | | | | | | | | | | | | | | | | | | | | |
| Fiscal incentives | Fixed | | 2.40%
(2.40% on 12.31.20) | | - | | 44,816 | | 63,700 | | - | | (82,401) | | (627) | | 647 | | - | | 26,135 |
| | | | | | | | 6,665,292 | | 1,329,249 | | 55,412 | | (447,720) | | (262,948) | | 476,462 | | 96,641 | | 7,912,388 |
| | | | | | | | | | | | | | | | | | | | | | |
| Foreign currency | | | | | | | | | | | | | | | | | | | | | |
| Bonds | Fixed / FX USD and EUR | | 4.82%
(4.81% on 12.31.20) | | 11.7 | | 14,829,993 | | - | | - | | (312,741) | | (703,844) | | 667,042 | | 560,242 | | 15,040,692 |
| Export credit facility | Fixed / LIBOR / FX USD | | 3.50% (3.13% on 12.31.20) | | 1.6 | | 392,636 | | - | | 30,476 | | (135,668) | | (6,649) | | 7,807 | | 18,300 | | 306,902 |
| Advances for foreign exchange rate contracts | Fixed / FX USD | | 1.32% | | 0.4 | | - | | 249,000 | | 2,672 | | - | | - | | 472 | | 9,840 | | 261,984 |
| Working capital | Fixed / FX TRY and USD | | 13.64% (10.98% on 12.31.20) | | 1.8 | | 516,505 | | 252,868 | | 29,555 | | (84,548) | | (48,160) | | 61,976 | | (71,560) | | 656,636 |
| | | | | | | | | | | | | | | | | | | | | | |
| | | | | | | | 15,739,134 | | 501,868 | | 62,703 | | (532,957) | | (758,653) | | 737,297 | | 516,822 | | 16,266,214 |
| | | | | | | | 22,404,426 | | 1,831,117 | | 118,115 | | (980,677) | | (1,021,601) | | 1,213,759 | | 613,463 | | 24,178,602 |
| | | | | | | | | | | | | | | | | | | | | | |
| Current | | | | | | | 1,059,984 | | | | | | | | | | | | | | 2,861,250 |
| Non-current | | | | | | | 21,344,442 | | | | | | | | | | | | | | 21,317,352 |
| (1) | Weighted average annual rate. |
| (2) | Weighted average maturity in years. |
| (3) | The Certificate of Agribusiness Receivable (“CRA”) issued by the Company are backed by receivables of BRF S.A. from certain subsidiaries abroad. |
| (4) | The Export Credit Facility was issued in Reais simultaneously and in connection with a foreign exchange rate swap, resulting essentially in a net cash flow in U.S. Dollars. As the transactions are inseparable, both are recorded together under Loans and Borrowings by their amortized cost. |
On September 30, 2021 and on December 31, 2020 the Company did not have any financial covenant clauses related to its loans and borrowings agreements.
The maturity schedule of the loans and borrowings is presented on note 24.3.
| | |
BRF S.A. | INTERIM FINANCIAL INFORMATION – September 30, 2021 | 56 |
| 15.1. | Revolving credit facility |
With the purpose of maintaining a prudential and sustainable short-term liquidity position, in line with the adoption of measures to extend its average debt maturity and reduce the cost of debt, on December 27, 2019, the Company retained from Banco do Brasil a revolving credit facility up to the limit of R$1,500,000 for a period of three years. On October 28, 2020 the Company retained an additional revolving credit facility before Banco do Brasil, up to the limit of R$1,500,000, for the next three years. The referenced credit facilities can be withdrawn totally or partially, at the Company’s will, whenever necessary. As of September 30, 2021, the credit facilities were available, but unused.
| 15.2. | Issuance of debentures |
On June 02, 2021, 1,000,000 (one million) Debentures were subscribed with a notional value of R$ 1,000.00 (one thousand Brazilian Reais), in a total amount of R$1,000,000, in a single series. The Debentures are simple, not convertible into shares, unsecured and for private placement. The Debentures were privately placed with VERT Companhia Securitizadora, to back its sixtieth issuance of Agribusiness Receivables Certificates which were object of public distribution with restricted placement efforts.
| Parent company and Consolidated |
| 09.30.21 |
| Operation | | Series | | Issue date | | Maturity | | Rate | | Notional | | Updated Value |
| Debenture - 3rd Issue | | 1st Series | | 06.02.21 | | 05.14.31 | | IPCA + 4.78% p.a. | | 1,000,000 | | 1,018,992 |
The issuance costs of R$34,258 are recognized on the statement of income over the term of the debt according to the effective interest rate method.
| 15.3. | Senior Notes repurchase offer |
During June 2021, the Company made an offer to repurchase its 4.875% Senior Notes due on 2030, in which it repurchased the principal amount equivalent to R$297,141 (USD59,402). The Company paid the amount of R$317,532 for the repurchase of these liabilities, amount that includes principal, interest and premium. The Company incurred in financial expenses in the amount of R$14,114 with the premium paid, R$2,491 with taxes and R$3,089 with the write-off of the costs of issuance. The principal outstanding after the repurchase is equivalent to R$3,454,509 (USD690,598).
| | Parent company | | Consolidated |
| | 09.30.21 | | 12.31.20 | | 09.30.21 | | 12.31.20 |
| Total loans and borrowings | 20,757,399 | | 19,310,254 | | 24,178,602 | | 22,404,426 |
| Mortgage guarantees | 26,135 | | 44,816 | | 44,182 | | 44,816 |
| Related to tax incentives and other | 26,135 | | 44,816 | | 44,182 | | 44,816 |
On September 30, 2021, the amount of bank guarantees contracted by the Company was of R$556,103 (R$590,933 as of December 31, 2020) which were offered mainly in litigations involving the Company’s use of tax credits. These guarantees have an average cost of 1.93% p.a. (1.95% p.a. as of December 31, 2020).
| | |
BRF S.A. | INTERIM FINANCIAL INFORMATION – September 30, 2021 | 57 |
| 16. | TRADE ACCOUNTS PAYABLE |
| | Parent company | | Consolidated |
| | 09.30.21 | | 12.31.20 | | 09.30.21 | | 12.31.20 |
| Trade accounts payable | | | | | | | |
| Domestic market | | | | | | | |
| Third parties | 9,098,488 | | 7,596,325 | | 9,216,162 | | 7,611,170 |
| Related parties | 28,445 | | 13,100 | | - | | - |
| Foreign market | | | | | | | |
| Third parties | 913,981 | | 648,960 | | 1,979,481 | | 1,487,206 |
| | 10,040,914 | | 8,258,385 | | 11,195,643 | | 9,098,376 |
| | | | | | | | |
| (-) Adjustment to present value | (106,169) | | (88,373) | | (106,447) | | (88,389) |
| | 9,934,745 | | 8,170,012 | | 11,089,196 | | 9,009,987 |
| | | | | | | | |
| Current | 9,922,746 | | 8,156,231 | | 11,077,197 | | 8,996,206 |
| Non-current | 11,999 | | 13,781 | | 11,999 | | 13,781 |
Within the trade accounts payable balance as of September 30, 2021, R$3,420,609 in the parent company and R$3,551,550 in the consolidated (R$2,510,757 in the parent company and R$2,576,071 in the consolidated as of December 31, 2020) correspond to supply chain finance transactions in which there were no changes in the payment terms and prices negotiated with the suppliers.
| Parent company and Consolidated |
| | | 09.30.21 | | 12.31.20 |
| Supply chain finance | | | | |
| Domestic market | | 1,749,226 | | 1,309,167 |
| Foreign market | | 168,093 | | 165,060 |
| | | 1,917,319 | | 1,474,227 |
| | | | | |
| (-) Adjustment to present value | | (28,100) | | (21,590) |
| | | 1,889,219 | | 1,452,637 |
The Company has agreements with several financial institutions that allow the suppliers to anticipate their receivables. The suppliers may choose whether to participate and if so, with which institution. The anticipation allows the suppliers to better manage their cash flow needs. This flexibility allows the Company to intensify its commercial relations with the network of suppliers by potentially leveraging benefits such as preference for supply in case of restricted supply, better price conditions and/or more flexible payment terms, among others, without identifiable changes in other commercial conditions. The operations presented in this line item are the ones in which there were changes in the payment terms and prices negotiated with the suppliers.
On September 30, 2021, the discount rates applied to the supply chain finance transactions agreed between our suppliers and the financial institutions in the domestic market were set between 0.54% and 0.74% p.m. (0.38% to 0.47% p.m. on December 31, 2020).
On September 30, 2021, the discount rates applied to the supply chain finance transactions agreed between our suppliers and the financial institutions in the external market were set between 0.18% and 0.38% p.m. (0.18% to 0.40% p.m. on December 31, 2020).
| | |
BRF S.A. | INTERIM FINANCIAL INFORMATION – September 30, 2021 | 58 |
The Company is lessee in several lease agreements for forest lands, offices, distribution centers, outgrowers, vehicles, among others. Some contracts have a renewal option for an additional period at the end of the agreement, established by contractual amendments. Automatic renewals or renewals for undetermined periods are not allowed.
The contract clauses mentioned, with respect to renewal, readjustment and purchase option, are contracted according to market practices. In addition, there are no clauses of contingent payments or restrictions on dividends distribution, payments of interest on shareholders’ equity or obtaining debt.
The right-of-use assets as set forth below are part of the balances of property, plant and equipment and intangible assets (notes 13 and 14).
| | Parent company |
| | Average rate (1) | | 12.31.20 | | Additions | | Disposals | | 09.30.21 |
| Cost | | | | | | | | | |
| Land | | | 45,592 | | 3,429 | | (1,300) | | 47,721 |
| Buildings | | | 2,642,544 | | 218,217 | | (41,943) | | 2,818,818 |
| Machinery and equipment | | | 112,195 | | 98,353 | | (98,553) | | 111,995 |
| Vehicles | | | 201,924 | | 1,811 | | (1,812) | | 201,923 |
| Software | | | 74,582 | | 5,214 | | (64) | | 79,732 |
| | | | 3,076,837 | | 327,024 | | (143,672) | | 3,260,189 |
| | | | | | | | | | |
| Depreciation | | | | | | | | | |
| Land | 15.67% | | (12,376) | | (6,428) | | 488 | | (18,316) |
| Buildings | 27.22% | | (848,016) | | (307,105) | | 31,090 | | (1,124,031) |
| Machinery and equipment | 67.66% | | (107,089) | | (46,829) | | 98,344 | | (55,574) |
| Vehicles | 27.81% | | (57,575) | | (41,801) | | 905 | | (98,471) |
| Software | 42.19% | | (33,048) | | (21,216) | | 64 | | (54,200) |
| | | | (1,058,104) | | (423,379) | | 130,891 | | (1,350,592) |
| | | | 2,018,733 | | (96,355) | | (12,781) | | 1,909,597 |
| (1) | Weighted average annual rate. |
| | Consolidated |
| | Average rate (1) | | 12.31.20 | | Additions | | Disposals | | Transfers | | Business combination (note 1.2) | | Exchange rate variation | | 09.30.21 |
| Cost | | | | | | | | | | | | | | | |
| Land | | | 48,661 | | 3,761 | | (1,845) | | 89,060 | | - | | 3,361 | | 142,998 |
| Buildings | | | 2,861,916 | | 397,918 | | (48,583) | | (89,060) | | 11,693 | | 4,897 | | 3,138,781 |
| Machinery and equipment | | | 112,593 | | 98,353 | | (98,660) | | - | | 6,481 | | 364 | | 119,131 |
| Vehicles | | | 344,918 | | 46,309 | | (23,112) | | - | | 2,069 | | 6,622 | | 376,806 |
| Software | | | 74,582 | | 5,213 | | (64) | | - | | - | | - | | 79,731 |
| | | | 3,442,670 | | 551,554 | | (172,264) | | - | | 20,243 | | 15,244 | | 3,857,447 |
| | | | | | | | | | | | | | | | |
| Depreciation | | | | | | | | | | | | | | | |
| Land | 8.76% | | (13,526) | | (8,906) | | 995 | | (11,335) | | - | | (430) | | (33,202) |
| Buildings | 25.13% | | (914,816) | | (429,368) | | 37,712 | | 11,335 | | (6,957) | | (4,418) | | (1,306,512) |
| Machinery and equipment | 53.81% | | (107,316) | | (47,102) | | 98,415 | | - | | (3,135) | | (283) | | (59,421) |
| Vehicles | 27.86% | | (101,495) | | (76,969) | | 11,807 | | - | | (1,144) | | (3,357) | | (171,158) |
| Software | 42.22% | | (33,048) | | (21,216) | | 64 | | - | | - | | - | | (54,200) |
| | | | (1,170,201) | | (583,561) | | 148,993 | | - | | (11,236) | | (8,488) | | (1,624,493) |
| | | | 2,272,469 | | (32,007) | | (23,271) | | - | | 9,007 | | 6,756 | | 2,232,954 |
| (1) | Weighted average annual rate. |
| | |
BRF S.A. | INTERIM FINANCIAL INFORMATION – September 30, 2021 | 59 |
| | Parent company |
| | WAM (1) | | 12.31.20 | | Additions | | Payments | | Interest paid | | Interest accrued | | Disposals | | 09.30.21 |
| Land | 6.8 | | 35,934 | | 3,429 | | (4,396) | | (3,569) | | 3,569 | | (931) | | 34,036 |
| Buildings | 6.8 | | 2,033,405 | | 218,217 | | (303,135) | | (62,500) | | 111,439 | | (16,930) | | 1,980,496 |
| Machinery and equipment | 1.5 | | 3,591 | | 98,353 | | (45,042) | | (2,772) | | 2,772 | | - | | 56,902 |
| Vehicles | 2.3 | | 152,554 | | 1,811 | | (41,159) | | (8,598) | | 8,598 | | (1,081) | | 112,125 |
| Software | 1.5 | | 43,210 | | 5,214 | | (21,534) | | (1,906) | | 1,906 | | - | | 26,890 |
| | | | | | | | | | | | | | | | |
| | | | 2,268,694 | | 327,024 | | (415,266) | | (79,345) | | 128,284 | | (18,942) | | 2,210,449 |
| | | | | | | | | | | | | | | | |
| Current | | | 302,946 | | | | | | | | | | | | 367,085 |
| Non-current | | | 1,965,748 | | | | | | | | | | | | 1,843,364 |
| (1) | Weighted average maturity in years. |
| | Consolidated |
| | WAM (1) | | 12.31.20 | | Additions | | Payments | | Interest paid | | Interest accrued | | Disposals | | Transfers | | Business combination (note 1.2) | | Exchange rate variation | | 09.30.21 |
| Land | 4.6 | | 37,868 | | 3,761 | | (5,256) | | (6,360) | | 6,360 | | (970) | | 82,851 | | - | | 7,252 | | 125,506 |
| Buildings | 1.9 | | 2,195,407 | | 397,918 | | (402,354) | | (84,086) | | 133,023 | | (16,994) | | (82,851) | | 6,557 | | (22,587) | | 2,124,033 |
| Machinery and equipment | 0.9 | | 3,773 | | 98,353 | | (45,352) | | (2,783) | | 2,783 | | (34) | | - | | 3,703 | | 97 | | 60,540 |
| Vehicles | 1.8 | | 256,423 | | 46,309 | | (74,416) | | (13,893) | | 13,893 | | (1,574) | | - | | 886 | | (9,387) | | 218,241 |
| Software | 1.5 | | 43,210 | | 5,213 | | (21,533) | | (1,906) | | 1,906 | | - | | - | | | | - | | 26,890 |
| | | | 2,536,681 | | 551,554 | | (548,911) | | (109,028) | | 157,965 | | (19,572) | | - | | 11,146 | | (24,625) | | 2,555,210 |
| | | | | | | | | | | | | | | | | | | | | | |
| Current | | | 383,162 | | | | | | | | | | | | | | | | | | 485,905 |
| Non-current | | | 2,153,519 | | | | | | | | | | | | | | | | | | 2,069,305 |
| (1) | Weighted average maturity in years. |
| 18.3. | Lease liabilities maturity schedule |
The maturity schedule of the minimum required future payments are presented below:
| | Parent company | | Consolidated |
| | 09.30.21 | | 09.30.21 |
| Current | 367,085 | | 485,905 |
| Non-current | 1,843,364 | | 2,069,305 |
| October to December 2022 | 107,554 | | 132,751 |
| 2023 | 371,292 | | 444,474 |
| 2024 | 300,518 | | 326,767 |
| 2025 | 220,579 | | 234,653 |
| 2026 onwards | 843,421 | | 930,660 |
| | 2,210,449 | | 2,555,210 |
| | |
BRF S.A. | INTERIM FINANCIAL INFORMATION – September 30, 2021 | 60 |
| 18.4. | Incremental borrowing rate |
The Company uses nominal incremental borrowing rates to measure its lease liabilities. The nominal and real interest rates are presented below:
| | | 09.30.21 | | 12.31.20 |
| Contract Terms | | Nominal rate % p.a. | | Real rate % p.a. | | Nominal rate % p.a. | | Real rate % p.a. |
| 1 year | | 4.92% | | 0.43% | | 5.69% | | 1.05% |
| 2 years | | 4.81% | | 0.49% | | 5.96% | | 2.61% |
| 3 years | | 6.31% | | 2.14% | | 6.80% | | 2.53% |
| 4 years | | 7.15% | | 2.90% | | 8.50% | | 4.56% |
| 5 years | | 9.69% | | 4.85% | | 8.98% | | 4.40% |
| 6 years | | 10.61% | | 5.15% | | - | | - |
| 7 years | | 10.96% | | 5.74% | | - | | - |
| 8 years | | - | | - | | 10.47% | | 5.71% |
| 9 years | | - | | - | | 10.75% | | 5.97% |
| 10 years | | - | | - | | 11.39% | | 6.64% |
| 12 years | | 9.85% | | 5.55% | | - | | - |
| 13 years | | - | | - | | 11.68% | | 7.38% |
| 14 years | | - | | - | | 11.84% | | 7.13% |
| 16 years | | 12.44% | | 6.70% | | - | | - |
| 20 years | | 12.95% | | 7.07% | | 13.26% | | 9.00% |
The nominal rates presented above as of September 30, 2021 refer to the incremental borrowing rates used in contracts recognized in the nine-month period ended on September 30, 2021 and the rates as of December 31, 2020 refer to the rates used in contracts recognized during the year ended on December 31, 2020.
| 18.5. | Amounts recognized in the statement of income |
The amounts directly recognized in the statement of income presented below relate to items exempt of recognition: low-value assets, short-term leases and leases with variable payments.
| Parent Company | | Consolidated |
| | | 2021 | | 2021 | |
| | | Jul - Sep | | Jan - Sep | | Jul - Sep | | Jan - Sep | |
| Variable payments not included in the lease liabilities | | 15,552 | | 46,402 | | 74,078 | | 226,488 | |
| Expenses related to short-term leases | | 15,670 | | 42,992 | | 42,833 | | 134,928 | |
| Expenses related to low-value assets | | 1,432 | | 2,813 | | 1,432 | | 2,887 | |
| | | 32,654 | | 92,207 | | 118,343 | | 364,303 | |
| | |
BRF S.A. | INTERIM FINANCIAL INFORMATION – September 30, 2021 | 61 |
The rules of stock options and restricted shares plans granted to executives were disclosed in the financial statements for the year ended December 31, 2020 (note 19).
The breakdown of the outstanding granted restricted shares is set forth as follows:
| Date | | Quantity | | Grant (1) |
| Grant | | Vesting date | | Shares granted | | Outstanding shares | | Fair value of the shares |
| | | | | | | | | |
| 10.01.18 | | 10.01.21 | | 2,311,394 | | 867,956 | | 21.44 |
| 06.01.19 | | 06.01.22 | | 674,296 | | 186,424 | | 30.61 |
| 07.01.19 | | 07.01.22 | | 1,141,353 | | 267,909 | | 30.61 |
| 09.16.19 | | 10.01.22 | | 68,605 | | 20,580 | | 30.61 |
| 06.01.20 | | 06.01.23 | | 3,571,736 | | 2,163,272 | | 21.28 |
| 07.01.21 | | 07.01.24 | | 2,883,737 | | 2,764,913 | | 28.58 |
| | | | | 10,651,121 | | 6,271,054 | | |
| (1) | Amounts expressed in Brazilian Reais. |
The rollforward of the granted options and shares for the nine-month period ended on September 30, 2021, is presented as follows:
| | | Consolidated |
| | | |
| Outstanding options/stocks as of December 31, 2020 (1) | | 7,873,348 |
| Granted | | |
| Restricted stocks - July 2021 | | 2,883,737 |
| Exercised / Delivered: | | |
| Restricted stocks – grant of June, 2020 | | (457,939) |
| Restricted stocks – grant of September, 2019 | | (18,237) |
| Restricted stocks – grant of July, 2019 | | (113,957) |
| Restricted stocks – grant of June, 2019 | | (114,271) |
| Forfeiture (2) : | | |
| Restricted stocks – grant of July, 2021 | | (118,824) |
| Restricted stocks – grant of June, 2020 | | (838,436) |
| Restricted stocks - grant of July, 2019 | | (275,372) |
| Restricted stocks – grant of June, 2019 | | (113,582) |
| Restricted stocks - grant of October, 2018 | | (15,083) |
| Expired: | | |
| Stock options - grant of May, 2016 | | (1,145,330) |
| Stock options - grant of April, 2016 | | (1,275,000) |
| Outstanding options/stocks as of September 30, 2021 | | 6,271,054 |
| (1) | Includes stock options outstanding on December 31, 2020, as presented in the financial statements for the year of 2020. |
| (2) | The forfeitures are related to the resignation of eligible executive before the end of the vesting period. |
The Company has registered under shareholders’ equity, the fair value of share-based compensation plans in the amount of R$213,825 (R$223,191 as of December 31, 2020) and in the amount of R$17,397 under non-current liabilities (R$21,521 as of December 31, 2020). In the statement of income for the nine-month ended September 30, 2021 the amount recognized as expense was R$31,392 in the parent company and R$40,074 in the consolidated (R$43,263 in the same period of the previous year in the parent company and in the consolidated), and during the three-month period ended on September 30, 2021 the amount recognized as expense was R$12,014 in the parent company and R$12,749 in the consolidated (expense of R$21,239 in the parent company and in the consolidated in the same period of the previous year).
| | |
BRF S.A. | INTERIM FINANCIAL INFORMATION – September 30, 2021 | 62 |
| 20. | EMPLOYEES BENEFITS PLANS |
The Company offers pension and other post-employment plans to the employees. The characteristics of such benefits were disclosed in the annual financial statements for the year ended on December 31, 2020 (note 20) and have not been changed during the following periods. The actuarial liabilities are presented below:
| | Parent company | | Consolidated |
| | Liabilities | | Liabilities |
| | 09.30.21 | | 12.31.20 | | 09.30.21 | | 12.31.20 |
| Medical assistance | 196,283 | | 185,802 | | 196,283 | | 185,802 |
| F.G.T.S. Penalty (1) | 294,012 | | 282,229 | | 294,012 | | 282,229 |
| Award for length of service | 113,900 | | 108,908 | | 113,900 | | 108,908 |
| Other | 62,552 | | 59,854 | | 217,979 | | 199,616 |
| | 666,747 | | 636,793 | | 822,174 | | 776,555 |
| | | | | | | | |
| Current | 114,938 | | 114,938 | | 125,312 | | 125,230 |
| Non-current | 551,809 | | 521,855 | | 696,862 | | 651,325 |
| (1) | FGTS – Government Severance Indemnity Fund for Employees |
The Company estimated costs for pension and post-employment plans for the year of 2021, according to an appraisal report prepared in 2020 by an actuarial expert and recorded in the statement of income for nine-month ended September 30, 2021 against other comprehensive income a gain of R$11,852 in the parent company and R$11,729 in consolidated, net of taxes (R$20,229 in the parent company and R$20,134 in consolidated in the same period of the previous year) and for the three-month period ended on September 30, 2021 a gain of R$3,753 in the parent company and R$3,694 in consolidated, net of taxes (R$7,194 in the parent company and R$7,170 in consolidated in the same period of the previous year).
| 21. | PROVISION FOR TAX, CIVIL AND LABOR RISKS |
The Company and its subsidiaries are involved in certain legal matters arising in the normal course of business, which include civil, tax, social security, labor, commercial and other processes.
Company’s Management believes that, based on the elements existing at the base date of this interim financial information, the provision for tax, civil, labor, commercial and other risks, is sufficient to cover eventual losses with administrative and legal proceedings, as set forth below.
| 21.1. | Contingencies with probable losses |
The rollforward of the provisions for tax, labor, civil, commercial and other risks classified as with probable loss, and contingent liabilities is presented below:
| | Parent company |
| | | | | | | | | | 09.30.21 |
| | Tax | Labor | Civil, commercial and other | Contingent liabilities (1) | Total |
| Beginning balance | 427,166 | | 631,025 | | 342,707 | | 297,097 | | 1,697,995 |
| Additions | 157,624 | | 203,374 | | 52,904 | | - | | 413,902 |
| Reversals | (67,752) | | (109,437) | | (53,393) | | (194,773) | | (425,355) |
| Payments | (144,276) | | (204,947) | | (17,335) | | - | | (366,558) |
| Interest | 52,439 | | 91,194 | | 81,926 | | - | | 225,559 |
| Ending balance | 425,201 | | 611,209 | | 406,809 | | 102,324 | | 1,545,543 |
| | | | | | | | | | |
| Current | | | | | | | | | 1,046,122 |
| Non-current | | | | | | | | | 499,421 |
| (1) | Contingent liabilities recognized at fair value as of the acquisition date, arising from the business combination with Sadia. The reversals in the period refer mainly to the closing of the processes related to ICMS credits in the context of the “Guerra Fiscal” (note 21.2.1 of the 2020 financial statements). |
| | |
BRF S.A. | INTERIM FINANCIAL INFORMATION – September 30, 2021 | 63 |
| | Consolidated |
| | | | | | | | | | 09.30.21 |
| | Tax | Labor | Civil, commercial and other | Contingent liabilities (1) | Total |
| Beginning balance | 427,302 | | 634,706 | | 343,530 | | 297,182 | | 1,702,720 |
| Additions | 157,624 | | 204,697 | | 52,977 | | - | | 415,298 |
| Business combination (note 1.2) | 2,553 | | 1,972 | | 4,725 | | - | | 9,250 |
| Reversals | (67,752) | | (110,114) | | (54,475) | | (194,845) | | (427,186) |
| Payments | (144,276) | | (204,947) | | (17,335) | | - | | (366,558) |
| Interest | 52,451 | | 91,194 | | 81,942 | | - | | 225,587 |
| Exchange rate variation | (16) | | (466) | | (75) | | (13) | | (570) |
| Ending balance | 427,886 | | 617,042 | | 411,289 | | 102,324 | | 1,558,541 |
| | | | | | | | | | |
| Current | | | | | | | | | 1,050,188 |
| Non-current | | | | | | | | | 508,353 |
| (1) | Contingent liabilities recognized at fair value as of the acquisition date, arising from the business combination with Sadia. The reversals in the period refer mainly to the closing of the processes related to ICMS credits in the context of the “Guerra Fiscal” (note 21.2.1 of the 2020 financial statements). |
| 21.2. | Contingencies with possible losses |
The Company is involved in contingencies for which losses are possible, in accordance with the assessment prepared by Management with support from legal advisors. Such contingencies have the same characteristics of those disclosed in the 2020 financial statements and on September 30, 2021 had balances of, R$1,619,032 (R$1,523,987 on December 31, 2020) for civil risks, R$315,579 (R$197,097 on December 31, 2020) for labor risks and R$13,187,530 (R$12,536,528 on December 31, 2020) for tax risks, for which only those resulting from the business combination with Sadia have a provision, recorded at the fair value estimated on the date of the business combination, in the amount of R$102,324 (R$297,182 as of December 31, 2020).
On September 30, 2021, the subscribed and paid capital of the Company was R$12,553,418, which is composed of 812,473,246 common book-entry shares with no par value. The value of the capital stock is net of the public offering expenses of R$92,947, made on July 22, 2009.
The Company is authorized to increase the capital stock, irrespective of amendment to the bylaws, up to the limit of 1,000,000,000 (one billion) common book-entry shares with no par value.
| 22.1.1. | Breakdown of capital stock by nature |
| Parent company |
| | 09.30.21 | | 12.31.20 |
| Common shares | 812,473,246 | | 812,473,246 |
| Treasury shares | (4,061,680) | | (4,766,084) |
| Outstanding shares | 808,411,566 | | 807,707,162 |
| 22.1.2. | Rollforward of outstanding shares |
On September 30, 2021, the quantity of outstanding of shares was 808,411,566, in the period were delivered of 704,404 shares, in accordance with Restricted Share plan of Company.
| | |
BRF S.A. | INTERIM FINANCIAL INFORMATION – September 30, 2021 | 64 |
| Parent company |
| Quantity of outstanding of shares |
| | | 09.30.21 | |
| Shares at the beginning of the period | | 807,707,162 | |
| Delivery of restricted shares | | 704,404 | |
| Shares at the end of the period | | 808,411,566 | |
| 22.2. | Capital reserves and Other equity transactions |
The balances of Capital reserves and Other equity transactions were restated for better presentation of the transactions within each line item. In the current presentation, Capital reserves contemplate only the balances related with results on the sale and exchange of stocks, in compatibility with the Law 6.404/1976 (“Lei das S.A”).
| Parent company and Consolidated |
| | | 09.30.21 | | 12.31.20 |
| Capital reserves | | 141,834 | | 141,834 |
| Other equity transactions | | (80,313) | | 246 |
| Share-based payments | | 213,825 | | 214,711 |
| Acquisition of non-controlling entities | | (293,918) | | (214,245) |
| Capital transactions with controlled entities | | (220) | | (220) |
| | | 61,521 | | 142,080 |
The Company has 4,061,680 shares held in treasury, with an average cost of R$26.00 (twenty-six Brazilian Reais) per share, and corresponding market value of R$110,031, in the period were delivered of 704,404 shares, in accordance with Restricted Share plan of Company.
| Parent company |
| Quantity of outstanding of shares |
| | | 09.30.21 | |
| Shares at the beggining of the period | | 4,766,084 | |
| Delivery of restricted shares | | (704,404) | |
| Shares at the end of the period | | 4,061,680 | |
On September 30, 2021, the Company’s Board of Directors approved the Company’s share buyback program up to the limit of 3,696,858 (three million, six hundred and ninety-six thousand, eight hundred and fifty-eight) common shares, in a 18-month term. The goal of the program is to comply with the obligations assumed by the Company under the Restricted Stock Plan.
In October, 2021, the Company purchased 1,232,300 (one million, two hundred and thirty-two thousand, three hundred) common shares at the cost of R$27,722.
| | |
BRF S.A. | INTERIM FINANCIAL INFORMATION – September 30, 2021 | 65 |
| 23. | EARNINGS (LOSS) PER SHARE |
| | Continued operations |
| | | | 2021 | | | | 2020 |
| | Jul - Sep | | Jan - Sep | | Jul - Sep | | Jan - Sep |
| Basic numerator | | | | | | | |
| Net earnings (loss) for the period attributable to controlling shareholders | (275,600) | | (454,014) | | 216,791 | | 474,740 |
| Basic denominator | | | | | | | |
| Common shares | 812,473,246 | | 812,473,246 | | 812,473,246 | | 812,473,246 |
| Weighted average number of outstanding shares - basic (except treasury shares) | 807,709,278 | | 808,013,781 | | 807,406,368 | | 809,583,921 |
| Net earnings (loss) per share basic - R$ | (0.34) | | (0.56) | | 0.27 | | 0.59 |
| | | | | | | | |
| Diluted numerator | | | | | | | |
| Net earnings (loss) for the period attributable to controlling shareholders | (275,600) | | (454,014) | | 216,791 | | 474,740 |
| | | | | | | | |
| Diluted denominator | | | | | | | |
| Weighted average number of outstanding shares - basic (except treasury shares) | 807,709,278 | | 808,013,781 | | 807,406,368 | | 809,583,921 |
| Number of potential shares | - | | - | | 58,332 | | 58,332 |
| Weighted average number of outstanding shares - diluted | 807,709,278 | | 808,013,781 | | 807,464,700 | | 809,642,253 |
| Net earnings (loss) per share diluted - R$ | (0.34) | | (0.56) | | 0.27 | | 0.59 |
| | Discontinued operations | | Continued and discontinued operations |
| | | | 2021 | | | | 2021 |
| | Jul - Sep | | Jan - Sep | | Jul - Sep | | Jan - Sep |
| Basic numerator | | | | | | | |
| Net earnings (loss) for the exercise attributable to controlling shareholders | (6,516) | | (47,802) | | (282,116) | | (501,816) |
| Basic denominator | | | | | | | |
| Common shares | 812,473,246 | | 812,473,246 | | 812,473,246 | | 812,473,246 |
| Weighted average number of outstanding shares - basic (except treasury shares) | 807,709,278 | | 808,013,781 | | 807,709,278 | | 808,013,781 |
| Net earnings (loss) per share basic - R$ | (0.01) | | (0.06) | | (0.35) | | (0.62) |
| | | | | | | | |
| Diluted numerator | | | | | | | |
| Net earnings (loss) for the exercise attributable to controlling shareholders | (6,516) | | (47,802) | | (282,116) | | (501,816) |
| | | | | | | | |
| Diluted denominator | | | | | | | |
| Weighted average number of outstanding shares - basic (except treasury shares) | 807,709,278 | | 808,013,781 | | 807,709,278 | | 808,013,781 |
| Number of potential shares | - | | - | | - | | - |
| Weighted average number of outstanding shares - diluted | 807,709,278 | | 808,013,781 | | 807,709,278 | | 808,013,781 |
| Net earnings (loss) per share diluted - R$ | (0.01) | | (0.06) | | (0.35) | | (0.62) |
| 24. | FINANCIAL INSTRUMENTS AND RISK MANAGEMENT |
In the ordinary course of business, the Company is exposed to credit, liquidity and market risks, which are actively managed in compliance with the Financial Risk Management Policy (“Risk Policy”) and internal guidelines and strategic documents subject to such policy, executing the formal designation of its hedge accounting relations, as disclosed in the financial statements for the year ended on December 31, 2020.
| 24.2. | Credit risk management |
The Company is exposed to the credit risk related to the financial assets held: trade and non-trade accounts receivable, marketable securities, derivative instruments and cash and equivalents. The Company’s credit risk exposure can be assessed in notes 4, 5, 6 and 24.
On September 30, 2021, the Company held financial investments over R$100,000 at the following financial institutions: : Banco Bradesco, Banco do Brasil, Banco BTG Pactual, Banco Itaú, Banco Safra, Banco Santander, Banco XP, Caixa Econômica Federal, Citibank, HSBC, J.P. Morgan Chase Bank, T.Garanti Bankasi A.Ş. and Vakiflar Bankasi.
| | |
BRF S.A. | INTERIM FINANCIAL INFORMATION – September 30, 2021 | 66 |
The Company also held derivative contracts with the following financial institutions: Banco Bradesco, Banco do Brasil, Banco Itaú, Banco Santander, Banco Votorantim, Bank of America Merrill Lynch, Banco BNP Paribas, Citibank, Goldman Sachs, J.P. Morgan Chase Bank, Morgan Stanley, Rabobank, T.Garanti Bankasi A.Ş. and Banco XP.
| 24.3. | Capital management and liquidity risk |
As a guideline, the gross debt must be concentrated at long-term. On September 30, 2021, the long-term consolidated gross debt represented 87.51% (93.66% as of December 31, 2020) of the total gross indebtedness, which has an average term higher than nine years.
The Company monitors the gross debt and net debt as set forth below:
| | Consolidated |
| | 09.30.21 | | 12.31.20 |
| | Current | | Non-current | | Total | | Total |
| Foreign currency loans and borrowings | (2,334,507) | | (13,931,707) | | (16,266,214) | | (15,739,134) |
| Local currency loans and borrowings | (526,743) | | (7,385,645) | | (7,912,388) | | (6,665,292) |
| Derivative financial liabilities | (186,147) | | (36,077) | | (222,224) | | (385,696) |
| Gross debt | (3,047,397) | | (21,353,429) | | (24,400,826) | | (22,790,122) |
| | | | | | | | |
| Marketable securities and cash and cash equivalents | 7,233,026 | | 375,906 | | 7,608,932 | | 8,235,360 |
| Derivative financial assets | 83,144 | | 2,139 | | 85,283 | | 377,990 |
| Restricted cash | 24,529 | | 1 | | 24,530 | | 24,358 |
| Net debt | | | | | (16,682,081) | | (14,152,414) |
The table below summarizes the significant commitments and contractual obligations that may impact the Company’s liquidity:
| | Parent company |
| | 09.30.21 |
| | Book
value | | Contractual cash flow | | Up to 12 months | | Oct - Dec 2022 | | 2023 | | 2024 | | 2025 | | 2026 onwards |
| Non derivative financial liabilities | | | | | | | | | | | | | | | |
| Loans and borrowings | 20,757,399 | | 36,408,738 | | 3,323,438 | | 530,504 | | 3,830,521 | | 2,893,452 | | 1,694,080 | | 24,136,743 |
| Principal | | | 24,280,414 | | 2,226,146 | | 400,000 | | 2,839,213 | | 2,054,081 | | 907,058 | | 15,853,916 |
| Interest | | | 12,128,324 | | 1,097,292 | | 130,504 | | 991,308 | | 839,371 | | 787,022 | | 8,282,827 |
| Trade accounts payable | 9,934,745 | | 10,040,914 | | 10,028,909 | | 3,272 | | 5,778 | | 2,849 | | 106 | | - |
| Supply chain finance | 1,889,219 | | 1,917,319 | | 1,917,319 | | - | | - | | - | | - | | - |
| Lease liabilities | 2,210,449 | | 2,799,985 | | 392,230 | | 116,857 | | 431,040 | | 372,775 | | 292,411 | | 1,194,672 |
| Derivative financial liabilities | | | | | | | | | | | | | | | |
| Financial instruments designated as cash flow hedge | | | | | | | | | | | | | | | |
| Interest rate derivatives | 36,077 | | 36,077 | | - | | - | | - | | - | | - | | 36,077 |
| Currency derivatives | 82,654 | | 82,654 | | 82,654 | | - | | - | | - | | - | | - |
| Commodities derivatives | 94,094 | | 94,094 | | 94,094 | | - | | - | | - | | - | | - |
| | |
BRF S.A. | INTERIM FINANCIAL INFORMATION – September 30, 2021 | 67 |
| | Consolidated |
| | 09.30.21 |
| | Book
value | | Contractual cash flow | | Up to 12 months | | Oct - Dec 2022 | | 2023 | | 2024 | | 2025 | | 2026 onwards |
| Non derivative financial liabilities | | | | | | | | | | | | | | | |
| Loans and borrowings | 24,178,602 | | 39,715,036 | | 3,441,569 | | 530,504 | | 3,948,651 | | 3,011,583 | | 1,812,210 | | 26,970,519 |
| Principal | | | 26,996,059 | | 2,226,146 | | 400,000 | | 2,839,213 | | 2,054,081 | | 907,058 | | 18,569,561 |
| Interest | | | 12,718,977 | | 1,215,423 | | 130,504 | | 1,109,438 | | 957,502 | | 905,152 | | 8,400,958 |
| Trade accounts payable | 11,089,196 | | 11,195,643 | | 11,183,638 | | 3,272 | | 5,778 | | 2,849 | | 106 | | - |
| Supply chain finance | 1,889,219 | | 1,917,319 | | 1,917,319 | | - | | - | | - | | - | | - |
| Lease liabilities | 2,555,210 | | 3,214,065 | | 519,189 | | 144,233 | | 515,998 | | 405,335 | | 311,068 | | 1,318,242 |
| Derivative financial liabilities | | | | | | | | | | | | | | | |
| Financial instruments designated as cash flow hedge | | | | | | | | | | | | | | | |
| Interest rate derivatives | 36,077 | | 36,077 | | - | | - | | - | | - | | - | | 36,077 |
| Currency derivatives | 82,654 | | 82,654 | | 82,654 | | - | | - | | - | | - | | - |
| Commodities derivatives | 94,094 | | 94,094 | | 94,094 | | - | | - | | - | | - | | - |
| Financial instruments not designated as cash flow hedge | | | | | | | | | | | | | | | |
| Currency derivatives | 9,399 | | 9,399 | | 9,399 | | - | | - | | - | | - | | - |
The Company does not expect that the cash outflows to fulfill the obligations shown above will be significantly influenced by factors unrelated to its best interests, or substantially modified outside the normal course of business.
| 24.4. | Market risk management |
| 24.4.1. | Interest rate risk |
The indebtedness is essentially linked to fixed coupon (R$, USD, EUR e TRY), Interbank Deposit Certificate (“CDI”), Broad Consumer Price Index (“IPCA”) and London Interbank Offered Rate (“LIBOR”). In situations of adverse market changes that result in an increase in these rates, the cost of floating-rate debt rises and on the other hand, the cost of fixed-rate debt decreases in relative terms.
Regarding the marketable securities, the Company holds, mainly, instruments indexed by the CDI for investments in Brazil and fixed coupon in USD for investments in the foreign market.
The Company’s exposure to interest rates can be assessed in notes 5 and 15.
The derivative financial instruments used to hedge the exposure to interest rates as of September 30, 2021 are presented in the table below:
| 09.30.21 |
| | | | | | | | | | | | | | Fair value (R$) |
| Fair value hedge - Derivative instruments | | Hedged Object | | Maturity | | Asset | | Liability | | Notional | | Instrument | | Object (1) |
| Parent company and Consolidated | | | | | | | | | | | | | |
| Interest rate swap | | Debenture - 2nd Issue - 1st series - IPCA + 5.30% p.a | | 3rd Qtr. 2027 | | IPCA + 5.30% p.a | | CDI + 2.16% p.a. | | 705,000 | BRL | | (2,351) | | 27,316 |
| Interest rate swap | | Debenture - 2nd Issue - 2nd series - IPCA + 5.60% p.a | | 3rd Qtr. 2030 | | IPCA + 5.60% p.a | | CDI + 2.32% p.a. | | 1,495,000 | BRL | | (31,528) | | 71,026 |
| Interest rate swap | | Debenture - 3rd Issue - single series - IPCA + 4.78% p.a | | 2nd Qtr. 2031 | | IPCA + 4.78% p.a | | CDI + 0.60% p.a. | | 200,000 | BRL | | (59) | | (1,376) |
| | | | | | | | | | | | | | (33,938) | | 96,966 |
| (1) | Corresponds to the accumulated amount of fair value hedge adjustments on the hedged items, included in the carrying amount of the debentures. |
| 24.4.2. | Foreign exchange risk |
This risk is the one that may cause unexpected losses to the Company resulting from volatility of the FX rates, reducing its assets and revenues, or increasing its liabilities and costs. The Company’s exposure is managed in three dimensions: statement of financial position exposure, operating income exposure and investments exposure.
| | |
BRF S.A. | INTERIM FINANCIAL INFORMATION – September 30, 2021 | 68 |
| i. | Statement of financial position exposure |
Assets and liabilities denominated in foreign currency for which the exchange variations are recognized in the Financial Results are as follows, summarized in Brazilian Reais:
| | | Consolidated |
| | | 09.30.21 | | 12.31.20 |
| Cash and cash equivalents | | 1,562,136 | | 2,855,979 |
| Trade accounts receivable | | 6,567,534 | | 5,765,753 |
| Trade accounts payable | | (1,144,743) | | (859,790) |
| Loans and borrowings | | (15,274,760) | | (14,947,793) |
| Other assets and liabilities, net | | 12,934 | | 225,694 |
| Exposure of assets and liabilities in foreign currencies | | (8,276,899) | | (6,960,157) |
| Derivative financial instruments (hedge) | | 7,764,347 | | 6,849,947 |
| Exposure in result, net | | (512,552) | | (110,210) |
The net P&L exposure is mainly composed of the following currencies:
| Net P&L Exposure | | 09.30.21 | | 12.31.20 |
| Argentinian Peso (ARS) | | (5,804) | | (5,310) |
| Angolan kwanza (AOA) | | 263,009 | | - |
| Euros (EUR) | | (57,530) | | 112,672 |
| Yen (JPY) | | 82,372 | | 29,976 |
| Turkish Liras (TRY) | | (241,033) | | 178,906 |
| U.S. Dollars (USD) | | (553,566) | | (426,454) |
| Total | | (512,552) | | (110,210) |
The Company is exposed to other different currencies, although they have been grouped in the currencies above due to its high correlation or for not being individually significant.
The derivative financial instruments hired to hedge the foreign currency statement of financial position exposure on September 30, 2021 are not designated as hedge accounting and are set forth below:
| 09.30.21 |
| Derivative instruments not designated | | Asset | | Liability | | Maturity | | Notional | | Exercise rate | | Fair value (R$) |
| Parent company | | | | | | | | | | | | | |
| Non-deliverable forward | | EUR | | BRL | | 4th Qtr. 2021 | | EUR | 265,000 | | 6.4336 | | (8,522) |
| Non-deliverable forward | | USD | | BRL | | 4th Qtr. 2021 | | USD | 715,000 | | 5.4864 | | 12,727 |
| Futures - B3 | | USD | | BRL | | 4th Qtr. 2021 | | USD | 358,000 | | 5.4672 | | 6,462 |
| Currency swap | | USD + 1.29% p.a. | | CDI + 0.80% p.a. | | 1st Qtr. 2022 | | USD | 47,583 | | - | | 8,450 |
| | | | | | | | | | | | | | 19,117 |
| | | | | | | | | | | | | | |
| Subsidiaries | | | | | | | | | | | | | |
| Non-deliverable forward | | EUR | | JPY | | 4th Qtr. 2021 | | EUR | 19,230 | | 130.0080 | | (877) |
| Non-deliverable forward | | USD | | EUR | | 4th Qtr. 2021 | | EUR | 34,133 | | 1.1719 | | 2,225 |
| Total Consolidated | | | | | | | | | | | | | 20,465 |
| | |
BRF S.A. | INTERIM FINANCIAL INFORMATION – September 30, 2021 | 69 |
| ii. | Operating income exposure |
The derivative and non-derivative financial instruments designated as cash flow hedges for foreing exchange operating income exposure on September 30, 2021 are set forth below:
| 09.30.21 |
| Cash flow hedge - Derivative instruments | | Hedged object | | Asset | | Liability | | Maturity | | Notional | | Designation rate | | Fair value |
| Parent company and consolidated | | | | | | | | | | | | | | | |
| Non-deliverable forward | | USD Exports | | BRL | | USD | | 4th Qtr. 2021 | | USD | 313,000 | | 5.3157 | | (48,724) |
| Non-deliverable forward | | USD Exports | | BRL | | USD | | 1st Qtr. 2022 | | USD | 63,000 | | 5.4348 | | (8,220) |
| Non-deliverable forward | | USD Exports | | BRL | | USD | | 2nd Qtr. 2022 | | USD | 5,000 | | 5.5782 | | (365) |
| Collar | | USD Exports | | BRL | | USD | | 4th Qtr. 2021 | | USD | 44,000 | | 5.5772 | | 3,204 |
| Collar | | USD Exports | | BRL | | USD | | 1st Qtr. 2022 | | USD | 30,000 | | 5.7162 | | 1,869 |
| Collar | | USD Exports | | BRL | | USD | | 2nd Qtr. 2022 | | USD | 10,000 | | 5.7125 | | (187) |
| | | | | | | | | | | | | | | | (52,423) |
| | | | | | | | | | | | | | | | |
| | | | | | | | | | | | | | | | |
| 09.30.21 |
| Cash flow hedge - Non-derivative instruments | | Hedged object | | | | Liability | | Maturity | | Notional | | Designation rate | | Fair value (1) |
| Parent company and consolidated | | | | | | | | | | | | | | | |
| Bond BRF SA BRFSBZ 5 7/8 (2) | | USD Exports | | | | USD | | 2nd Qtr. 2022 | | USD | 70,928 | | 2.0213 | | (426,732) |
| Bond BRF SA BRFSBZ 3.95 | | USD Exports | | | | USD | | 2nd Qtr. 2023 | | USD | 150,000 | | 2.0387 | | (510,105) |
| | | | | | | | | | | | | | | | |
| | | | | | | | | | | | | | | | (936,837) |
| (1) | Corresponds to the effective portion of the hedge result accumulated in Other Comprehensive Income. |
| (2) | For this instrument, the initial designation was of USD150,000, however there were repurchases with corresponding revocation of the designation in the amounts of USD31,338 at the rate of 3.2408, USD9,350 at the rate of 4.1827, USD27,190 at the rate of 5.1889 e USD11,194 at the rate of 5.5714. The accumulated exchange rate variation of the revoked portions is fixed and reserved in Other Comprehensive Income until the recognition of the hedge object in the second quarter of 2022. |
The Company holds investments abroad in functional currencies different than the Brazilian Real, which generate currency exposure that affects directly the Company’s Equity, in Other Comprehensive Income.
The non-derivative financial instruments designated as net investment hedge instruments on September 30, 2021 are set forth below:
| 09.30.21 |
Net investment hedge -
Non-derivative instruments | | Object (Investment) | | Liability | | Maturity | | Notional | | Rate | | Fair value (1) |
| Parent company and consolidated | | | | | | | | | | | | | |
| Bond - BRF SA BRFSBZ 4.35 | | Federal Foods LLC | | USD | | 3rd Qtr. 2026 | | USD | 75,673 | | 3.7649 | | (127,395) |
| Bond - BRF SA BRFSBZ 4.35 | | BRF Al Yasra Food | | USD | | 3rd Qtr. 2026 | | USD | 108,757 | | 3.7649 | | (169,128) |
| Bond - BRF SA BRFSBZ 4.35 | | Al Khan Foodstuff LLC | | USD | | 3rd Qtr. 2026 | | USD | 65,570 | | 3.7649 | | (109,230) |
| | | | | | | | | | | | | | (405,753) |
| (1) | Corresponds to the effective portion of the hedge result accumulated in Other Comprehensive Income. |
| | |
BRF S.A. | INTERIM FINANCIAL INFORMATION – September 30, 2021 | 70 |
| 24.4.3. | Commodities price risk |
The financial instruments designated as cash flow hedges and fair value hedges for the commodities price exposure on September 30, 2021 are set forth below:
| 09.30.21 |
| Cash flow hedge - Derivative instruments | | Hedged object | | Index | | Maturity | | Quantity | | Exercise rate (1) | | Fair value |
| Parent company and consolidated | | | | | | | | | | | | | |
| Non-deliverable forward - buy | | Soybean meal purchase - floating price | | Soybean meal - CBOT | | 4th Qtr. 2021 | | 32,977 | ton | | 417.29 | | (9,400) |
| Non-deliverable forward - buy | | Soybean meal purchase - floating price | | Soybean meal - CBOT | | 1st Qtr. 2022 | | 85,963 | ton | | 412.66 | | (21,089) |
| Non-deliverable forward - buy | | Soybean meal purchase - floating price | | Soybean meal - CBOT | | 2nd Qtr. 2022 | | 184,877 | ton | | 395.96 | | (22,888) |
| Non-deliverable forward - buy | | Soybean meal purchase - floating price | | Soybean meal - CBOT | | 3rd Qtr. 2022 | | 30,946 | ton | | 387.86 | | (1,943) |
| Collar - buy | | Soybean meal purchase - floating price | | Soybean meal - CBOT | | 4th Qtr. 2021 | | 9,989 | ton | | 421.11 | | (2,156) |
| Collar - buy | | Soybean purchase - floating price | | Soybean - CBOT | | 4th Qtr. 2021 | | 19,999 | ton | | 458.84 | | 172 |
| Non-deliverable forward - buy | | Corn purchase - floating price | | Corn - B3 | | 3rd Qtr. 2022 | | 2,025 | ton | | 1,333.16 | | (33) |
| Collar - buy | | Corn purchase - floating price | | Corn - B3 | | 4th Qtr. 2021 | | 13,230 | ton | | 1,587.07 | | 126 |
| Collar - buy | | Corn purchase - floating price | | Corn - B3 | | 1st Qtr. 2022 | | 17,037 | ton | | 1,683.33 | | (303) |
| Collar - buy | | Corn purchase - floating price | | Corn - B3 | | 2nd Qtr. 2022 | | 7,992 | ton | | 1,616.67 | | (97) |
| Collar - buy | | Soybean oil purchase - floating price | | Soybean oil - CBOT | | 4th Qtr. 2021 | | 2,994 | ton | | 794.77 | | 7,069 |
| | | | | | | | | | | | | | (50,542) |
| (1) | Base price of each commodity in USD/ton, except for Corn – B3 denominated in R$/ton. |
| 09.30.21 |
Cash flow hedge -
Derivative instruments | | Protection object | | Assets | | Liabilities | | Maturity | | Notional | | Exercise rate | | Fair value (R$) |
| Subsidiaries | | | | | | | | | | | | | | | |
| Non-deliverable forward | | Cost in USD | | USD | | TRY | | 4th Qtr. 2021 | | USD | 7,098 | | 8.8251 | | 998 |
| | | | | | | | | | | | | | | | 998 |
| 09.30.21 |
| Fair value hedge - Derivative instruments | | Hedged object | | Index | | Maturity | | Quantity | | Exercise rate (1) | | Fair value |
| Parent company and consolidated | | | | | | | | | | | | | |
| Non-deliverable forward - sell | | Soybean purchase - fixed price | | Soybean - CBOT | | 1st Qtr. 2022 | | 15,000 | ton | | 503.65 | | 2,956 |
| Non-deliverable forward - sell | | Corn purchase - fixed price | | Corn - CBOT | | 4th Qtr. 2021 | | 179,299 | ton | | 202.24 | | (8,839) |
| Non-deliverable forward - sell | | Corn purchase - fixed price | | Corn - CBOT | | 1st Qtr. 2022 | | 63,077 | ton | | 200.41 | | (4,783) |
| Non-deliverable forward - sell | | Corn purchase - fixed price | | Corn - CBOT | | 2nd Qtr. 2022 | | 170,790 | ton | | 216.20 | | 59 |
| Non-deliverable forward - sell | | Corn purchase - fixed price | | Corn - CBOT | | 3rd Qtr. 2022 | | 39,995 | ton | | 184.67 | | (5,034) |
| Corn future - sell | | Corn purchase - fixed price | | Corn - B3 | | 4th Qtr. 2021 | | 7,803 | ton | | 1,562.51 | | 186 |
| Corn future - sell | | Corn purchase - fixed price | | Corn - B3 | | 1st Qtr. 2022 | | 104,571 | ton | | 1,631.40 | | 2,488 |
| Corn future - sell | | Corn purchase - fixed price | | Corn - B3 | | 2nd Qtr. 2022 | | 9,882 | ton | | 1,537.49 | | 124 |
| Corn future - sell | | Corn purchase - fixed price | | Corn - B3 | | 3rd Qtr. 2022 | | 176,985 | ton | | 1,339.50 | | 1,459 |
| Corn future - sell | | Corn purchase - fixed price | | Corn - B3 | | 4th Qtr. 2022 | | 14,985 | ton | | 1,350.41 | | - |
| Collar - sell | | Corn purchase - fixed price | | Corn - B3 | | 4th Qtr. 2021 | | 62,910 | ton | | 1,649.32 | | 4,350 |
| Collar - sell | | Corn purchase - fixed price | | Corn - B3 | | 1st Qtr. 2022 | | 25,380 | ton | | 1,567.91 | | 248 |
| Put - Buy | | Corn purchase - fixed price | | Corn - B3 | | 4th Qtr. 2021 | | 5,994 | ton | | 1,616.67 | | 583 |
| | | | | | | | | | | | | | (6,203) |
| (1) | Base price of each commodity in USD/ton, except for Corn – B3 denominated in R$/ton. |
| 09.30.21 |
Fair value hedge -
Derivative instruments | | Protection object | | Assets | | Liabilities | | Maturity | | Notional | | Exercise rate | | Fair value |
| Parent company and consolidated | | | | | | | | | | | | | | | |
| Non-deliverable forward | | Cost in USD | | BRL | | USD | | 4th Qtr. 2021 | | USD | 36,262 | | 5.3508 | | (5,001) |
| Non-deliverable forward | | Cost in USD | | BRL | | USD | | 1st Qtr. 2022 | | USD | 20,196 | | 5.3666 | | (4,335) |
| Non-deliverable forward | | Cost in USD | | BRL | | USD | | 2nd Qtr. 2022 | | USD | 36,924 | | 5.6119 | | (4,575) |
| Non-deliverable forward | | Cost in USD | | BRL | | USD | | 3rd Qtr. 2022 | | USD | 7,386 | | 5.6278 | | (1,387) |
| | | | | | | | | | | | | | | | (15,298) |
| | |
BRF S.A. | INTERIM FINANCIAL INFORMATION – September 30, 2021 | 71 |
| 24.5. | Effects of hedge instruments on financial information |
The effects of financial instruments for hedging exchange rate, commodities price and interest rates in the income for the period, in Other Comprehensive Income and in the financial position are set forth below:
| Income for the period | | | | | | | | | | Consolidated |
| Jul - Sep 2021 | | Note | | Exposure | | Hedge accounting | | Foreign Exchange | | Commodities | | Interest Rate | | Total |
| Net Sales | | | | | | | | 12,349,193 | | - | | - | | 12,349,193 |
| Derivatives result | | | | Operating Results | | Cash flow | | 40,792 | | - | | - | | 40,792 |
| Net Revenue | | 26 | | | | | | 12,389,985 | | - | | - | | 12,389,985 |
| | | | | | | | | | | | | | | |
| Cost of Sales | | | | | | | | - | | (9,757,320) | | - | | (9,757,320) |
| Derivatives result | | | | Operating Results | | Cash flow / Fair value | | - | | (7,983) | | - | | (7,983) |
| Cost of Sales | | | | | | | | - | | (9,765,303) | | - | | (9,765,303) |
| | | | | | | | | | | | | | | |
| Interests on loans and borrowings | | | | | | | | - | | - | | (361,115) | | (361,115) |
| Interest Rate Derivatives result | | | | Interest expenses | | Fair value | | - | | - | | (40,065) | | (40,065) |
| Foreign Exchange variation on assets and liabilities | | | | | | | | (625,672) | | - | | - | | (625,672) |
| Foreign Exchange Derivatives result | | | | Financial Position | | Not designated | | 594,162 | | - | | - | | 594,162 |
| Effects on Financial Result | | 28 | | | | | | (31,510) | | - | | (401,180) | | (432,690) |
| | | | | | | | | | | | | | | |
| | | | | | | | | | | |
| Other Comprehensive Income | | | | | | | | | | Consolidated |
| Jul - Sep 2021 | | | | Exposure | | Hedge accounting | | Foreign Exchange | | Commodities | | Interest Rate | | Total |
| | | | | | | | | | | | | | | |
| Derivative Instruments - current | | | | Operating Results | | Cash flow | | (183,860) | | (169,440) | | - | | (353,300) |
| Non-derivative Instruments – current | | | | Operating Results | | Cash flow | | (31,010) | | - | | - | | (31,010) |
| Non-derivative Instruments – non-current | | | | Operating Results | | Cash flow | | (65,580) | | - | | - | | (65,580) |
| Non-derivative Instruments - non-current | | | | Foreign investments | | Net investment | | (106,955) | | - | | - | | (106,955) |
| Other Comprehensive Income (1) | | | | | | | | (387,405) | | (169,440) | | - | | (556,845) |
| | | | | | | | | | | | | | | |
| | | | | | | | | | | |
| Income for the period | | | | | | | | | | Consolidated |
| Jan - Sep 2021 | | Note | | Exposure | | Hedge accounting | | Foreign Exchange | | Commodities | | Interest Rate | | Total |
| | | | | | | | | | | | | | | |
| Net Sales | | | | | | | | 34,539,353 | | - | | - | | 34,539,353 |
| Derivatives result | | | | Operating Results | | Cash flow | | 79,510 | | - | | - | | 79,510 |
| Net Revenue | | 26 | | | | | | 34,618,863 | | - | | - | | 34,618,863 |
| | | | | | | | | | | | | | | |
| Cost of Sales | | | | | | | | - | | (27,388,645) | | - | | (27,388,645) |
| Derivatives result | | | | Operating Results | | Cash flow / Fair value | | - | | (184,594) | | - | | (184,594) |
| Cost of Sales | | | | | | | | - | | (27,573,239) | | - | | (27,573,239) |
| | | | | | | | | | | | | | | |
| Interests on loans and borrowings | | | | | | | | - | | - | | (1,216,925) | | (1,216,925) |
| Interest Rate Derivatives result | | | | Interest expenses | | Fair value | | - | | - | | (35,025) | | (35,025) |
| Foreign Exchange variation on assets and liabilities | | | | | | | | (359,457) | | - | | - | | (359,457) |
| Foreign Exchange Derivatives result | | | | Financial Position | | Not designated | | 178,101 | | - | | - | | 178,101 |
| Effects on Financial Result | | 28 | | | | | | (181,356) | | - | | (1,251,950) | | (1,433,306) |
| | | | | | | | | | | | | | | |
| | | | | | | | | | | |
| Other Comprehensive Income | | | | | | | | | | Consolidated |
| Jan - Sep 2021 | | | | Exposure | | Hedge accounting | | Foreign Exchange | | Commodities | | Interest Rate | | Total |
| | | | | | | | | | | | | | | |
| Derivative Instruments - current | | | | Operating Results | | Cash flow | | (100,366) | | (209,373) | | - | | (309,739) |
| Non-derivative Instruments – current | | | | Operating Results | | Cash flow | | (17,214) | | - | | - | | (17,214) |
| Non-derivative Instruments – non-current | | | | Operating Results | | Cash flow | | (36,405) | | - | | - | | (36,405) |
| Non-derivative Instruments - non-current | | | | Foreign investments | | Net investment | | (61,079) | | - | | - | | (61,079) |
| Other Comprehensive Income (1) | | | | | | | | (215,064) | | (209,373) | | - | | (424,437) |
| (1) | All effects are presented gross of taxes. |
| | |
BRF S.A. | INTERIM FINANCIAL INFORMATION – September 30, 2021 | 72 |
| Statement of financial position | | | | | | | | | | Consolidated |
| 09.30.21 | | Note | | Exposure | | Hedge accounting | | Foreign Exchange | | Commodities | | Interest Rate | | Total |
| | | | | | | | | | | | | | | |
| Designated derivatives | | | | Operating Results | | Cash flow / Fair value | | (66,723) | | (56,745) | | (33,938) | | (157,406) |
| Not designated derivatives | | | | Financial Position | | Not designated | | 20,465 | | - | | - | | 20,465 |
| Asset / (Liability) net | | | | | | | | (46,258) | | (56,745) | | (33,938) | | (136,941) |
| | | | | | | | | | | | | | | |
| Derivative Instruments - current (2) | | | | Operating Results | | Cash flow | | (52,423) | | (38,067) | | - | | (90,490) |
| Non-derivative instruments – current | | | | Operating Results | | Cash flow | | (426,732) | | - | | - | | (426,732) |
| Non-derivative instruments – non-current | | | | Operating Results | | Cash flow | | (510,105) | | - | | - | | (510,105) |
| Non-derivative Instruments - non-current | | | | Foreign investments | | Net investment | | (405,753) | | - | | - | | (405,753) |
| Other Comprehensive Income (1) | | | | | | | | (1,395,013) | | (38,067) | | - | | (1,433,080) |
| | | | | | | | | | | | | | | |
| Derivatives result | | | | Operating Results | | Cash flow / Fair value | | - | | 538,512 | | - | | 538,512 |
| Inventories | | 7 | | | | | | - | | 538,512 | | - | | 538,512 |
| (1) | All effects are presented gross of taxes. |
| (2) | Includes R$(2,192) related to the time value of the foreign exchange option contracts, and R$(234) related to the time value of the commodity options contracts. |
| Statement of financial position | | | | | | | | | | Consolidated |
| 12.31.20 | | Note | | Exposure | | Hedge accounting | | Foreign Exchange | | Commodities | | Interest Rate | | Total |
| | | | | | | | | | | | | | | |
| Designated derivatives | | | | Operating Results | | Cash flow / Fair value | | 95,558 | | (144,057) | | - | | (48,499) |
| Not designated derivatives | | | | Financial Position | | Not designated | | 55,442 | | - | | (14,649) | | 40,793 |
| Asset / (Liability) net | | | | | | | | 151,000 | | (144,057) | | (14,649) | | (7,706) |
| | | | | | | | | | | | | | | |
| Derivative Instruments - current (2) | | | | Operating Results | | Cash flow | | 47,942 | | 171,306 | | - | | 219,248 |
| Non-derivative instruments – non-current | | | | Operating Results | | Cash flow | | (883,218) | | - | | - | | (883,218) |
| Non-derivative Instruments - non-current | | | | Foreign investments | | Net investment | | (344,674) | | - | | - | | (344,674) |
| Other Comprehensive Income (1) | | | | | | | | (1,179,950) | | 171,306 | | - | | (1,008,644) |
| | | | | | | | | | | | | | | |
| Derivatives result | | | | Operating Results | | Cash flow / Fair value | | - | | 442,398 | | - | | 442,398 |
| Inventories | | 7 | | | | | | - | | 442,398 | | - | | 442,398 |
In the statement of cash flows, the effect of the derivative financial instruments designated as hedge accounting is presented in the line item in which the hedged object is recorded. For the instruments not designated, the effects are presented in the Derivative Financial Instruments line item.
Summarized financial position of derivative financial instruments:
| | Parent company | | Consolidated |
| | 09.30.21 | | 12.31.20 | | 09.30.21 | | 12.31.20 |
| Assets | | | | | | | |
| Designated as hedge accounting | | | | | | | |
| Currency derivatives | 14,933 | | 177,208 | | 15,931 | | 177,208 |
| Commodities derivatives | 37,349 | | 125,304 | | 37,349 | | 125,304 |
| Interest rate derivatives | 2,139 | | - | | 2,139 | | - |
| Not designated as hedge accounting | | | | | | | |
| Currency derivatives | 27,639 | | 59,037 | | 29,864 | | 75,478 |
| | 82,060 | | 361,549 | | 85,283 | | 377,990 |
| | | | | | | | |
| Current assets | 79,921 | | 361,315 | | 83,144 | | 377,756 |
| Non-current assets | 2,139 | | 234 | | 2,139 | | 234 |
| | | | | | | | |
| Liabilities | | | | | | | |
| Designated as hedge accounting | | | | | | | |
| Currency derivatives | (82,654) | | (81,650) | | (82,654) | | (81,650) |
| Commodities derivatives | (94,094) | | (269,361) | | (94,094) | | (269,361) |
| Interest rate derivatives | (36,077) | | - | | (36,077) | | - |
| Not designated as hedge accounting | | | | | | | |
| Currency derivatives | (8,522) | | (13,610) | | (9,399) | | (20,036) |
| Interest rate derivatives | - | | (14,649) | | - | | (14,649) |
| | (221,347) | | (379,270) | | (222,224) | | (385,696) |
| | | | | | | | |
| Current liabilities | (185,270) | | (378,543) | | (186,147) | | (384,969) |
| Non-current liabilities | (36,077) | | (727) | | (36,077) | | (727) |
| | |
BRF S.A. | INTERIM FINANCIAL INFORMATION – September 30, 2021 | 73 |
| 24.6. | Sensitivity analysis |
The Management understands that the most relevant risks that may affect the Company’s results are the volatility of commodities prices and foreign exchange rates. Currently the fluctuation of the interest rates does not affect significantly the Company’s results since Management has chosen to keep at fixed rates a considerable portion of its debts.
The amounts below represent the possible impacts (incremental results) of the hedging instruments and their respective hedged positions, considering situations of increase and decrease in the selected risk factors.
The information used in the preparation of the analysis is based on the position as of September 30, 2021, which has been described in the items above. The future results may diverge significantly of the estimated values if the reality presents different than the assumptions used. Positive values indicate gains and negative values indicate losses.
| | | Scenario |
| Exchange rate - Balance | | Base | | - 50% | | - 25% | | - 10% | | + 10% | | + 25% | | + 50% |
| USD | | 5.4394 | | 2.7197 | | 4.0796 | | 4.8955 | | 5.9833 | | 6.7993 | | 8.1591 |
| | | | | | | | | | | | | | | |
| Monetary Assets and Liabilities | | | | 3,433,220 | | 1,716,610 | | 686,644 | | (686,644) | | (1,716,610) | | (3,433,220) |
| Derivative Instruments - Not designated | | | | (3,156,437) | | (1,578,218) | | (631,287) | | 631,287 | | 1,578,218 | | 3,156,437 |
| Net effect | | | | 276,783 | | 138,392 | | 55,357 | | (55,357) | | (138,392) | | (276,783) |
| | | | | | | | | | | | | | | |
| EUR | | 6.2983 | | 3.1492 | | 4.7237 | | 5.6685 | | 6.9281 | | 7.8729 | | 9.4475 |
| | | | | | | | | | | | | | | |
| Monetary Assets and Liabilities | | | | 820,571 | | 410,286 | | 164,114 | | (164,114) | | (410,286) | | (820,571) |
| Derivative Instruments - Not designated | | | | (786,712) | | (393,356) | | (157,342) | | 157,342 | | 393,356 | | 786,712 |
| Net effect | | | | 33,859 | | 16,930 | | 6,772 | | (6,772) | | (16,930) | | (33,859) |
| | | | | | | | | | | | | | | |
| JPY | | 0.0488 | | 0.0244 | | 0.0366 | | 0.0439 | | 0.0537 | �� | 0.0610 | | 0.0732 |
| | | | | | | | | | | | | | | |
| Monetary Assets and Liabilities | | | | (102,161) | | (51,080) | | (20,432) | | 20,432 | | 51,080 | | 102,161 |
| Derivative Instruments - Not designated | | | | 60,975 | | 30,488 | | 12,195 | | (12,195) | | (30,488) | | (60,975) |
| Net effect | | | | (41,186) | | (20,592) | | (8,237) | | 8,237 | | 20,592 | | 41,186 |
| | | | | | | | | | | | | | | |
| TRY | | 0.6124 | | 0.3062 | | 0.4593 | | 0.5512 | | 0.6736 | | 0.7655 | | 0.9186 |
| | | | | | | | | | | | | | | |
| Monetary Assets and Liabilities | | | | 120,516 | | 60,258 | | 24,103 | | (24,103) | | (60,258) | | (120,516) |
| Net effect | | | | 120,516 | | 60,258 | | 24,103 | | (24,103) | | (60,258) | | (120,516) |
| | | | | | | | | | | | | | | |
| | | | | | | | | | | | | | | |
| AOA | | 0.0091 | | 0.0045 | | 0.0068 | | 0.0082 | | 0.0100 | | 0.0113 | | 0.0136 |
| | | | | | | | | | | | | | | |
| Monetary Assets and Liabilities | | | | (131,504) | | (65,752) | | (26,301) | | 26,301 | | 65,752 | | 131,504 |
| Net effect | | | | (131,504) | | (65,752) | | (26,301) | | 26,301 | | 65,752 | | 131,504 |
| | | Scenario |
| Exchange rate - Operating results | | Base | | - 50% | | - 25% | | - 10% | | + 10% | | + 25% | | + 50% |
| USD | | 5.4394 | | 2.7197 | | 4.0796 | | 4.8955 | | 5.9833 | | 6.7993 | | 8.1591 |
| | | | | | | | | | | | | | | |
| Revenue in USD | | | | (1,865,518) | | (932,759) | | (373,104) | | 373,104 | | 932,759 | | 1,865,518 |
| NDF | | | | 1,036,206 | | 518,103 | | 207,241 | | (207,241) | | (518,103) | | (1,036,206) |
| Collar | | | | 222,657 | | 108,429 | | 39,893 | | (23,342) | | (88,388) | | (202,615) |
| Loans - Designated | | | | 600,858 | | 300,429 | | 120,172 | | (120,172) | | (300,429) | | (600,858) |
| Net effect | | | | (5,797) | | (5,798) | | (5,798) | | 22,349 | | 25,839 | | 25,839 |
| | |
BRF S.A. | INTERIM FINANCIAL INFORMATION – September 30, 2021 | 74 |
| | | Scenario |
| Exchange rate - Operating results | | Base | | - 50% | | - 25% | | - 10% | | + 10% | | + 25% | | + 50% |
| USD | | 5.4394 | | 2.7197 | | 4.0796 | | 4.8955 | | 5.9833 | | 6.7993 | | 8.1591 |
| | | | | | | | | | | | | | | |
| Cost of Sales | | | | (274,059) | | (137,030) | | (54,812) | | 54,812 | | 137,030 | | 274,059 |
| NDF | | | | 274,059 | | 137,030 | | 54,812 | | (54,812) | | (137,030) | | (274,059) |
| Net effect | | | | - | | - | | - | | - | | - | | - |
| | | | | | | | | | | | | | | |
| | | | | | | | | | | | | | | |
| | | | | | | | | | | | | | | |
| | | Scenario |
| Operating results - Commodities | | Base (1) | | - 50% | | - 25% | | - 10% | | + 10% | | + 25% | | + 50% |
| Soy Grain - CBOT | | 464 | | 232 | | 348 | | 418 | | 510 | | 580 | | 696 |
| | | | | | | | | | | | | | | |
| Cost of Sales | | | | 1,160 | | 580 | | 232 | | (232) | | (580) | | (1,160) |
| Collar | | | | (4,139) | | (1,832) | | (447) | | 554 | | 1,938 | | 4,246 |
| NDF | | | | 3,505 | | 1,753 | | 701 | | (701) | | (1,753) | | (3,505) |
| Net effect | | | | 526 | | 501 | | 486 | | (379) | | (395) | | (419) |
| | | | | | | | | | | | | | | |
| Soybean Meal - CBOT | | 371 | | 185 | | 278 | | 334 | | 408 | | 464 | | 556 |
| | | | | | | | | | | | | | | |
| Cost of Sales | | | | 63,940 | | 31,970 | | 12,788 | | (12,788) | | (31,970) | | (63,940) |
| Collar | | | | (1,810) | | (905) | | (362) | | 238 | | 537 | | 1,369 |
| NDF | | | | (62,130) | | (31,065) | | (12,426) | | 12,426 | | 31,065 | | 62,130 |
| Net effect | | | | - | | - | | - | | (124) | | (368) | | (441) |
| | | | | | | | | | | | | | | |
| Soybean Oil - CBOT | | 1,294 | | 647 | | 970 | | 1,165 | | 1,423 | | 1,617 | | 1,941 |
| | | | | | | | | | | | | | | |
| Cost of Sales | | | | 1,937 | | 968 | | 387 | | (387) | | (968) | | (1,937) |
| Collar | | | | (1,547) | | (968) | | (387) | | 387 | | 968 | | 1,937 |
| Net effect | | | | 390 | | - | | - | | - | | - | | - |
| | | | | | | | | | | | | | | |
| Corn - CBOT | | 213 | | 107 | | 160 | | 192 | | 235 | | 267 | | 320 |
| | | | | | | | | | | | | | | |
| Cost of Sales | | | | (48,318) | | (24,159) | | (9,664) | | 9,664 | | 24,159 | | 48,318 |
| NDF | | | | 48,318 | | 24,159 | | 9,664 | | (9,664) | | (24,159) | | (48,318) |
| Net effect | | | | - | | - | | - | | - | | - | | - |
| | | | | | | | | | | | | | | |
| Corn - B3 | | 1,445 | | 722 | | 1,084 | | 1,300 | | 1,589 | | 1,806 | | 2,167 |
| | | | | | | | | | | | | | | |
| Cost of Sales | | | | (266,037) | | (133,018) | | (53,207) | | 53,207 | | 133,018 | | 266,037 |
| Collar | | | | 40,052 | | 20,741 | | 9,025 | | (5,087) | | (13,216) | | (32,528) |
| NDF | | | | 219,671 | | 109,835 | | 43,934 | | (43,934) | | (109,835) | | (219,671) |
| Put | | | | 4,594 | | 2,297 | | 919 | | (502) | | (502) | | (502) |
| Net effect | | | | (1,720) | | (145) | | 671 | | 3,684 | | 9,465 | | 13,336 |
| (1) | Base price of each commodity in USD/ton, except for Corn – B3 denominated in R$/ton. |
| | |
BRF S.A. | INTERIM FINANCIAL INFORMATION – September 30, 2021 | 75 |
| 24.7. | Financial instruments by category |
| | Parent company |
| | 09.30.21 |
| | Amortized cost | | Fair value through profit and loss | | Total |
| Assets | | | | | |
| Cash and bank | 91,449 | | - | | 91,449 |
| Cash equivalents | - | | 4,139,986 | | 4,139,986 |
| Marketable securities | - | | 333,859 | | 333,859 |
| Restricted cash | 24,530 | | - | | 24,530 |
| Trade accounts receivable | 8,430,975 | | 315,657 | | 8,746,632 |
| Other receivables | 76,476 | | - | | 76,476 |
| Derivatives not designated | - | | 27,639 | | 27,639 |
| Derivatives designated as hedge accounting (1) | - | | 54,421 | | 54,421 |
| | | | | | |
| Liabilities | | | | | |
| Trade accounts payable | (9,934,745) | | - | | (9,934,745) |
| Supply chain finance | (1,889,219) | | - | | (1,889,219) |
| Loans and borrowings (2) | (18,361,285) | | (2,396,114) | | (20,757,399) |
| Derivatives not designated | - | | (8,522) | | (8,522) |
| Derivatives designated as hedge accounting (1) | - | | (212,825) | | (212,825) |
| | (21,561,819) | | 2,254,101 | | (19,307,718) |
| (1) | All derivatives are classified at fair value through profit and loss. Those designated as hedge accounting instruments have their gains and losses also affecting Equity and Inventories. |
| (2) | The part of the loans and borrowings the is object in a fair value hedge is classified as Fair value through profit and loss. The rest of the loans and borrowings balance is classified as amortized cost and those designated as cash flow or net investment hedge accounting instruments have their gains and losses also affecting Equity. |
| | Parent company |
| | 12.31.20 |
| | Amortized cost | | Fair value through profit and loss | | Total |
| Assets | | | | | |
| Cash and bank | 118,307 | | - | | 118,307 |
| Cash equivalents | - | | 3,757,832 | | 3,757,832 |
| Marketable securities | - | | 327,559 | | 327,559 |
| Restricted cash | 24,358 | | - | | 24,358 |
| Trade accounts receivable | 4,906,964 | | 310,265 | | 5,217,229 |
| Other receivables | 86,404 | | - | | 86,404 |
| Derivatives not designated | - | | 59,037 | | 59,037 |
| Derivatives designated as hedge accounting | - | | 302,512 | | 302,512 |
| | | | | | |
| Liabilities | | | | | |
| Trade accounts payable | (8,170,012) | | - | | (8,170,012) |
| Supply chain finance | (1,452,637) | | - | | (1,452,637) |
| Loans and borrowings | (19,310,254) | | - | | (19,310,254) |
| Derivatives not designated | - | | (28,259) | | (28,259) |
| Derivatives designated as hedge accounting | - | | (351,011) | | (351,011) |
| | (23,796,870) | | 4,377,935 | | (19,418,935) |
| | |
BRF S.A. | INTERIM FINANCIAL INFORMATION – September 30, 2021 | 76 |
| | Consolidated |
| | 09.30.21 |
| | Amortized cost | | Fair value through other comprehensive income | Fair value through profit and loss | | Total |
| | | Equity instruments | | |
| Assets | | | | | | | |
| Cash and bank | 2,203,097 | | - | | - | | 2,203,097 |
| Cash equivalents | - | | - | | 4,686,747 | | 4,686,747 |
| Marketable securities | 347,650 | | 13,290 | | 358,148 | | 719,088 |
| Restricted cash | 24,530 | | - | | - | | 24,530 |
| Trade accounts receivable | 3,236,504 | | - | | 315,657 | | 3,552,161 |
| Other receivables | 76,476 | | - | | - | | 76,476 |
| Derivatives not designated | - | | - | | 29,864 | | 29,864 |
| Derivatives designated as hedge accounting (1) | - | | - | | 55,419 | | 55,419 |
| | | | | | | | |
| Liabilities | | | | | | | |
| Trade accounts payable | (11,089,196) | | - | | - | | (11,089,196) |
| Supply chain finance | (1,889,219) | | - | | - | | (1,889,219) |
| Loans and borrowings (2) | (21,782,488) | | - | | (2,396,114) | | (24,178,602) |
| Derivatives not designated | - | | - | | (9,399) | | (9,399) |
| Derivatives designated as hedge accounting (1) | - | | - | | (212,825) | | (212,825) |
| Written option– business combination | - | | - | | (471,738) | | (471,738) |
| | (28,872,646) | | 13,290 | | 2,355,759 | | (26,503,597) |
| (1) | All derivatives are classified at fair value through profit and loss. Those designated as hedge accounting instruments have their gains and losses also affecting Equity and Inventories. |
| (2) | The part of the loans and borrowings the is object in a fair value hedge is classified as Fair value through profit and loss. The rest of the loans and borrowings balance is classified as amortized cost and those designated as cash flow or net investment hedge accounting instruments have their gains and losses also affecting Equity. |
| | Consolidated |
| | 12.31.20 |
| | Amortized cost | | Fair value through other comprehensive income | Fair value through profit and loss | | Total |
| | | Equity instruments | | |
| Assets | | | | | | | |
| Cash and bank | 2,439,072 | | - | | - | | 2,439,072 |
| Cash equivalents | - | | - | | 5,137,553 | | 5,137,553 |
| Marketable securities | 287,504 | | 42,029 | | 329,202 | | 658,735 |
| Restricted cash | 24,358 | | - | | - | | 24,358 |
| Trade accounts receivable | 3,789,616 | | - | | 310,265 | | 4,099,881 |
| Other receivables | 86,404 | | - | | - | | 86,404 |
| Derivatives not designated | - | | - | | 75,478 | | 75,478 |
| Derivatives designated as hedge accounting | - | | - | | 302,512 | | 302,512 |
| | | | | | | | |
| Liabilities | | | | | | | |
| Trade accounts payable | (9,009,987) | | - | | - | | (9,009,987) |
| Supply chain finance | (1,452,637) | | - | | - | | (1,452,637) |
| Loans and borrowings | (22,404,426) | | - | | - | | (22,404,426) |
| Derivatives not designated | - | | - | | (34,685) | | (34,685) |
| Derivatives designated as hedge accounting | - | | - | | (351,011) | | (351,011) |
| Written option– business combination | - | | - | | (185,401) | | (185,401) |
| | (26,240,096) | | 42,029 | | 5,583,913 | | (20,614,154) |
| | |
BRF S.A. | INTERIM FINANCIAL INFORMATION – September 30, 2021 | 77 |
| 24.8. | Fair value of financial instruments |
The fair value is the price that would be received to sell an asset or paid to transfer a liability in an orderly transaction between market participants at the measurement date.
Depending on the inputs used for measurement, the financial instruments at fair value may be classified into 3 hierarchy levels:
| » | Level 1 – Uses quoted prices (unadjusted) for identical instruments in active markets. In this category are classified investments in stocks, savings accounts, overnights, term deposits, Financial Treasury Bills (“LFT”) and investment funds; |
| » | Level 2 – Uses prices quoted in active markets for similar instruments, prices quoted for identical or similar instruments in non-active markets and evaluation models for which inputs are observable. In this level are classified the investments in Bank Deposit Certificates (“CDB”) and derivatives, which are measured by well-known pricing models: discounted cash flows and Black-Scholes. The observable inputs are interest rates and curves, volatility factors and foreign exchange rates; |
| » | Level 3 – Instruments for which significant inputs are non-observable. The Company has a financial liability arising from a put option written in the context of a business combination. |
The table below presents the overall classification of financial instruments measured at fair value by measurement hierarchy. For the nine-month period ended on September 30, 2021, there were no changes among the 3 levels of hierarchy.
| | Parent company |
| | 09.30.21 | | 12.31.20 |
| | Level 1 | | Level 2 | | Total | | Level 1 | | Level 2 | | Total |
| Financial Assets | | | | | | | | | | | |
| Fair value through profit and loss | | | | | | | | | | | |
| Savings account and overnight | 76,221 | | - | | 76,221 | | 102,336 | | - | | 102,336 |
| Bank deposit certificates | - | | 4,059,645 | | 4,059,645 | | - | | 3,650,812 | | 3,650,812 |
| Financial treasury bills | 318,893 | | - | | 318,893 | | 312,515 | | - | | 312,515 |
| Investment funds | 19,086 | | - | | 19,086 | | 19,728 | | - | | 19,728 |
| Trade accounts receivable | - | | 315,657 | | 315,657 | | - | | 310,265 | | 310,265 |
| Derivatives | - | | 82,060 | | 82,060 | | - | | 361,549 | | 361,549 |
| Financial Liabilities | | | | | | | | | | | |
| Fair value through profit and loss | | | | | | | | | | | |
| Derivatives | - | | (221,347) | | (221,347) | | - | | (379,270) | | (379,270) |
| Loans and borrowings | - | | (2,396,114) | | (2,396,114) | | - | | - | | - |
| | 414,200 | | 1,839,901 | | 2,254,101 | | 434,579 | | 3,943,356 | | 4,377,935 |
| | Consolidated |
| | 09.30.21 | | 12.31.20 |
| | Level 1 | | Level 2 | | Level 3 | | Total | | Level 1 | | Level 2 | | Level 3 | | Total |
| Financial Assets | | | | | | | | | | | | | | | |
| Fair value through other comprehensive income | | | | | | | | | | | | | | | |
| Stocks | 13,290 | | - | | - | | 13,290 | | 42,029 | | - | | - | | 42,029 |
| Fair value through profit and loss | | | | | | | | | | | | | | | |
| Savings account and overnight | 600,449 | | - | | - | | 600,449 | | 1,220,232 | | - | | - | | 1,220,232 |
| Term deposits | - | | - | | - | | - | | 250,189 | | - | | - | | 250,189 |
| Bank deposit certificates | - | | 4,082,178 | | - | | 4,082,178 | | - | | 3,662,448 | | - | | 3,662,448 |
| Financial treasury bills | 318,893 | | - | | - | | 318,893 | | 312,515 | | - | | - | | 312,515 |
| Investment funds | 43,375 | | - | | - | | 43,375 | | 21,371 | | - | | - | | 21,371 |
| Trade accounts receivable | - | | 315,657 | | - | | 315,657 | | - | | 310,265 | | - | | 310,265 |
| Derivatives | - | | 85,283 | | - | | 85,283 | | - | | 377,990 | | - | | 377,990 |
| Financial Liabilities | | | | | | | | | | | | | | | |
| Fair value through profit and loss | | | | | | | | | | | | | | | |
| Derivatives | - | | (222,224) | | - | | (222,224) | | - | | (385,696) | | - | | (385,696) |
| Loans and borrowings | - | | (2,396,114) | | - | | (2,396,114) | | - | | - | | - | | - |
| Written option– business combination | - | | - | | (471,738) | | (471,738) | | - | | - | | (185,401) | | (185,401) |
| | 976,007 | | 1,864,780 | | (471,738) | | 2,369,049 | | 1,846,336 | | 3,965,007 | | (185,401) | | 5,625,942 |
Except for the items set forth below, the fair value of all other financial instruments is approximate to their book value. The fair value of the bonds set forth below is based on prices observed in active markets, level 1 of the fair value hierarchy, while the debentures are based on level 2 and are measured by discounted cash flows.
| | |
BRF S.A. | INTERIM FINANCIAL INFORMATION – September 30, 2021 | 78 |
| | | | | Parent company and Consolidated |
| | | | | | | 09.30.21 | | 12.31.20 |
| | | Currency | | Maturity | | Book
value | | Fair
value | | Book
value | | Fair
value |
| BRF S.A. | | | | | | | | | | | | |
| BRF SA BRFSBZ 5 7/8 | | USD | | 2022 | | (392,757) | | (405,968) | | (367,714) | | (389,611) |
| BRF SA BRFSBZ 4 3/4 | | USD | | 2024 | | (1,633,188) | | (1,726,110) | | (1,538,086) | | (1,659,891) |
| BRF SA BRFSBZ 3.95 | | USD | | 2023 | | (1,283,410) | | (1,329,486) | | (1,207,468) | | (1,275,598) |
| BRF SA BRFSBZ 2 3/4 | | EUR | | 2022 | | (1,060,043) | | (1,072,548) | | (1,081,404) | | (1,105,478) |
| BRF SA BRFSBZ 4 7/8 | | USD | | 2030 | | (3,760,174) | | (3,817,461) | | (3,951,539) | | (4,333,054) |
| BRF SA BRFSBZ 5 3/4 | | USD | | 2050 | | (4,234,323) | | (4,182,534) | | (4,106,115) | | (4,705,851) |
| Debenture - 1st Issue | | BRL | | 2026 | | (815,842) | | (817,075) | | (771,138) | | (778,016) |
| Debenture - 2nd Issue | | BRL | | 2030 | | (2,292,024) | | (2,297,006) | | (2,250,867) | | (2,225,796) |
| Debenture - 3rd Issue | | BRL | | 2031 | | (1,018,992) | | (882,766) | | - | | - |
| Parent company | | | | | | (16,490,753) | | (16,530,954) | | (15,274,331) | | (16,473,295) |
| | | | | | | | | | | | | |
| BRF GmbH | | | | | | | | | | | | |
| BRF SA BRFSBZ 4.35 | | USD | | 2026 | | (2,676,797) | | (2,813,142) | | (2,577,667) | | (2,779,574) |
| Consolidated | | | | | | (19,167,550) | | (19,344,096) | | (17,851,998) | | (19,252,869) |
| 24.8.1. | Level 3 measurement |
The Company holds a financial liability arising from a put option written in the context of a business combination. This option gives the non-controlling shareholder the right to sell its equity stake in the subsidiary for an amount equivalent, in Turkish Liras, to a multiple of the Earnings Before Interest, Taxes, Depreciation and Amortization (EBITDA) of the economic group of this subsidiary in the last 12 months prior to the exercise. The exercise period is comprised of the six-month period beginning on May 25, 2021. This liability is measured at the present value of redemption amount using internal assumptions regarding the results of that economic group.
The effects of the subsequent measurement resulted in a loss in financial results of R$278,618 in the nine-month ended on September 30, 2021 (gain of R$533,774 in the same period of the prior year) and a loss of R$352,790 for the three-month period ended on September 30, 2021 (gain of R$143,421 in the same period of the prior year), as per note 28.
The operating segments are reported consistently with the management reports provided to the main strategic and operational decision makers for assessing the performance of each segment and allocation of resources. The operating segments information is prepared considering three reportable segments, being: Brazil, International and Other Segments.
The operating segments include the sales of all distribution channels and are subdivided according to the nature of the products, for which the characteristics are described below:
| » | Poultry: production and sale of whole poultry and in-natura cuts. |
| » | Pork and others: production and sale of in-natura cuts. |
| » | Processed: production and sale of processed food, frozen and processed products derived from poultry, pork and beef, margarine, vegetables and soybean-based products. |
| » | Other sales: sale of flour for food service and others. |
Other segments are comprised of commercialization and development of animal nutrition ingredients, human nutrition, plant nutrition (fertilizers), healthcare (health and wellness), pet food, as well as commercialization of agricultural products.
The items not allocated to the segments are presented as Corporate and refer to relevant events not attributable to the operating segments.
The net sales for each reportable operating segment is set forth below:
| | |
BRF S.A. | INTERIM FINANCIAL INFORMATION – September 30, 2021 | 79 |
| | | Consolidated |
| | | | | 2021 | | | | 2020 |
| Net sales | | Jul - Sep | | Jan - Sep | | Jul - Sep | | Jan - Sep |
| Brazil | | | | | | | | |
| In-natura | | 1,634,165 | | 4,380,670 | | 1,251,395 | | 3,601,927 |
| Poultry | | 1,255,312 | | 3,324,314 | | 907,235 | | 2,670,960 |
| Pork and other | | 378,853 | | 1,056,356 | | 344,160 | | 930,967 |
| Processed | | 4,740,367 | | 13,167,042 | | 4,032,656 | | 10,966,468 |
| Other sales | | 17,509 | | 54,550 | | 7,654 | | 21,321 |
| | | 6,392,041 | | 17,602,262 | | 5,291,705 | | 14,589,716 |
| | | | | | | | | |
| International | | | | | | | | |
| In-natura | | 4,642,946 | | 13,250,947 | | 3,635,187 | | 10,651,454 |
| Poultry | | 4,047,027 | | 11,291,729 | | 3,016,452 | | 8,994,799 |
| Pork and other | | 595,919 | | 1,959,218 | | 618,735 | | 1,656,655 |
| Processed | | 758,768 | | 2,162,453 | | 589,996 | | 1,664,171 |
| Other sales | | 46,992 | | 284,362 | | 84,187 | | 216,733 |
| | | 5,448,706 | | 15,697,762 | | 4,309,370 | | 12,532,358 |
| | | | | | | | | |
| Other segments | | 549,238 | | 1,318,839 | | 341,516 | | 873,508 |
| | | 12,389,985 | | 34,618,863 | | 9,942,591 | | 27,995,582 |
The income (loss) before financial results for each segment and for Corporate is set forth below:
| | | Consolidated |
| | | | | 2021 | | | | 2020 |
| | | Jul - Sep | | Jan - Sep | | Jul - Sep | | Jan - Sep |
| Brazil | | 515,846 | | 1,015,749 | | 566,784 | | 1,282,928 |
| International | | 113,515 | | 569,495 | | 200,302 | | 868,636 |
| Other segments | | 105,017 | | 282,076 | | 62,496 | | 122,654 |
| Sub total | | 734,378 | | 1,867,320 | | 829,582 | | 2,274,218 |
| Corporate | | (3,898) | | 71,393 | | (85,505) | | (388,275) |
| | | 730,480 | | 1,938,713 | | 744,077 | | 1,885,943 |
The composition of the main effects not allocated to the operating segments and presented as Corporate is set forth below:
| | | Consolidated |
| | | | | 2021 | | | | 2020 |
| Corporate | | Jul - Sep | | Jan - Sep | | Jul - Sep | | Jan - Sep |
| Expenses COVID-19 (1) | | (23,386) | | (48,382) | | (40,568) | | (66,828) |
| Investigations involving the Company (note 1.5) | | (412) | | (8,554) | | (4,027) | | (28,099) |
| Expenses with demobilization | | (634) | | (3,654) | | (5,034) | | (5,034) |
| Impairment and result in the sale of investments | | 52,557 | | 76,147 | | - | | (6,763) |
| Reversal/(provision) for tax and civil contingencies | | (35,230) | | 39,695 | | (5,350) | | (65,239) |
| Results with sale and disposal of fixed assets | | 4,173 | | 16,258 | | (5,544) | | (11,531) |
| Results with disposal of businesses | | - | | | | (26,943) | | (26,943) |
| Agreement - Class Action | | - | | - | | - | | (204,436) |
| Arbitration reversal | | - | | - | | - | | 14,520 |
| Restructuring plan | | - | | - | | - | | 13 |
| Other | | (966) | | (117) | | 1,961 | | 12,065 |
| | | (3,898) | | 71,393 | | (85,505) | | (388,275) |
| (1) | Mainly comprised of donations in Brazil, consultants and expenses with health and safety, which are not associated with the business segments. |
| | |
BRF S.A. | INTERIM FINANCIAL INFORMATION – September 30, 2021 | 80 |
No customer individually or in aggregate (economic group) accounted for more than 5% of net sales for the nine-month period ended on September 30, 2021 and 2020.
The goodwill arising from business combinations and the intangible assets with indefinite useful life (trademarks) were allocated to the reportable operating segments, considering the economic benefits generated by such intangible assets. The allocation of these intangible assets is presented below:
| | Consolidated |
| | Goodwill | | Trademarks | | Total |
| | 09.30.21 | | 12.31.20 | | 09.30.21 | | 12.31.20 | | 09.30.21 | | 12.31.20 |
| Brazil | 1,151,498 | | 1,151,498 | | 982,478 | | 982,478 | | 2,133,976 | | 2,133,976 |
| International | 1,868,105 | | 1,784,079 | | 323,485 | | 345,260 | | 2,191,590 | | 2,129,339 |
| Other segments | 1,011,828 | | - | | 298 | | - | | 1,012,126 | | - |
| | 4,031,431 | | 2,935,577 | | 1,306,261 | | 1,327,738 | | 5,337,692 | | 4,263,315 |
Information related to total assets by reportable segment is not disclosed, as it is not included in the set of information made available to the Company’s management, which makes investment decisions and determine allocation of resources based on information about the consolidated assets.
| | Parent company | | Consolidated |
| | | | 2021 | | | | 2020 | | | | 2021 | | | | 2020 |
| | Jul - Sep | | Jan - Sep | | Jul - Sep | | Jan - Sep | | Jul - Sep | | Jan - Sep | | Jul - Sep | | Jan - Sep |
| Gross sales | | | | | | | | | | | | | | | |
| Brazil | 7,916,297 | | 21,802,401 | | 6,512,264 | | 18,018,393 | | 7,916,297 | | 21,802,401 | | 6,512,264 | | 18,018,393 |
| International | 4,262,740 | | 11,868,422 | | 2,607,278 | | 7,359,010 | | 5,839,915 | | 16,826,837 | | 4,636,072 | | 13,440,650 |
| Other segments | 483,392 | | 1,273,498 | | 364,659 | | 930,702 | | 625,962 | | 1,473,572 | | 378,246 | | 968,825 |
| | 12,662,429 | | 34,944,321 | | 9,484,201 | | 26,308,105 | | 14,382,174 | | 40,102,810 | | 11,526,582 | | 32,427,868 |
| | | | | | | | | | | | | | | | |
| Sales deductions | | | | | | | | | | | | | | | |
| Brazil | (1,524,256) | | (4,200,139) | | (1,220,558) | | (3,428,677) | | (1,524,256) | | (4,200,139) | | (1,220,559) | | (3,428,677) |
| International | (11,130) | | (21,887) | | (24,632) | | (73,278) | | (391,209) | | (1,129,075) | | (326,702) | | (908,292) |
| Other segments | (44,315) | | (116,861) | | (34,512) | | (89,197) | | (76,724) | | (154,733) | | (36,730) | | (95,317) |
| | (1,579,701) | | (4,338,887) | | (1,279,702) | | (3,591,152) | | (1,992,189) | | (5,483,947) | | (1,583,991) | | (4,432,286) |
| | | | | | | | | | | | | | | | |
| Net sales | | | | | | | | | | | | | | | |
| Brazil | 6,392,041 | | 17,602,262 | | 5,291,706 | | 14,589,716 | | 6,392,041 | | 17,602,262 | | 5,291,705 | | 14,589,716 |
| International | 4,251,610 | | 11,846,535 | | 2,582,646 | | 7,285,732 | | 5,448,706 | | 15,697,762 | | 4,309,370 | | 12,532,358 |
| Other segments | 439,077 | | 1,156,637 | | 330,147 | | 841,505 | | 549,238 | | 1,318,839 | | 341,516 | | 873,508 |
| | 11,082,728 | | 30,605,434 | | 8,204,499 | | 22,716,953 | | 12,389,985 | | 34,618,863 | | 9,942,591 | | 27,995,582 |
| 27. | OTHER OPERATING INCOME (EXPENSES), NET |
| | Parent company | | Consolidated |
| | | | 2021 | | | | 2020 | | | | 2021 | | | | 2020 |
| | Jul - Sep | | Jan - Sep | | Jul - Sep | | Jan - Sep | | Jul - Sep | | Jan - Sep | | Jul - Sep | | Jan - Sep |
| Recovery of expenses (1) | 16,137 | | 85,350 | | 83,074 | | 317,726 | | 16,136 | | 85,372 | | 83,114 | | 318,172 |
| Provision reversal | 805 | | 805 | | 1,756 | | 72,381 | | 809 | | 809 | | 1,756 | | 72,381 |
| Scrap sales | 3,222 | | 9,076 | | 3,072 | | 8,506 | | 3,317 | | 9,273 | | 3,111 | | 8,672 |
| Provision for civil and tax risks | (31,998) | | 42,974 | | (13,298) | | (78,569) | | (32,202) | | 42,518 | | (13,719) | | (79,238) |
| Other employees benefits | (8,225) | | (22,637) | | (6,862) | | (22,512) | | (8,225) | | (22,637) | | (6,862) | | (22,512) |
| Insurance claims costs | (17,279) | | (28,805) | | (2,008) | | (7,485) | | (16,741) | | (28,023) | | (877) | | (3,394) |
| Gains (losses) on the disposal of non-financial assets | 9,487 | | 16,790 | | (13,399) | | (15,778) | | 53,761 | | 89,775 | | (16,874) | | (24,026) |
| Employee participation and bonuses | (35,097) | | (49,624) | | (41,127) | | (162,526) | | (36,200) | | (65,255) | | (41,678) | | (159,669) |
| Demobilization expenses | 521 | | (2,472) | | (8,705) | | (14,569) | | (634) | | (3,654) | | (8,534) | | (14,790) |
| Expected credit losses in other receivables | 1,831 | | 742 | | 32 | | (3,153) | | 1,831 | | 742 | | 32 | | (3,125) |
| Other (2) | (6,093) | | (17,499) | | (1,286) | | (176,882) | | (3,451) | | (5,339) | | (12,662) | | (205,664) |
| | (66,689) | | 34,700 | | 1,249 | | (82,861) | | (21,599) | | 103,581 | | (13,193) | | (113,193) |
| (1) | Includes recovery of PIS and COFINS taxes on inputs in the amount of R$27,280 and effects of the final decision related to the exclusion of ICMS from the PIS and COFINS calculation basis of Batávia and UP! Alimentos Ltda. in the amount of R$40,501 (note 9.1) for the nine-month period ended on September 30, 2021 (R$295,593 of recovery of PIS and COFINS taxes on inputs in the same period of previous year). |
| (2) | Includes expenditures with investigations (note 1.5) and in 2020 expenses with class action agreement.
|
| | |
BRF S.A. | INTERIM FINANCIAL INFORMATION – September 30, 2021 | 81 |
| 28. | FINANCIAL INCOME (EXPENSES), NET |
| | | | Parent company | | | Consolidated |
| | | | | | 2021 | | | | 2020 | | | | | 2021 | | | | 2020 |
| | Note | | Jul - Sep | | Jan - Sep | | Jul - Sep | | Jan - Sep | | | Jul - Sep | | Jan - Sep | | Jul - Sep | | Jan - Sep |
| Financial income | | | | | | | | | | | | | | | | | | |
| Interest on cash and cash equivalents | 4 | | 33,626 | | 74,030 | | 27,069 | | 80,916 | | | 46,831 | | 104,195 | | 34,938 | | 85,967 |
| Income with marketable securities | 5 | | 4,141 | | 8,419 | | 1,707 | | 23,628 | | | 14,082 | | 32,100 | | 6,530 | | 51,917 |
| Fair value through other comprehensive income | | | - | | - | | - | | - | | | - | | - | | 84 | | 538 |
| Fair value through profit and loss | | | 3,856 | | 7,843 | | 1,588 | | 7,648 | | | 3,888 | | 7,884 | | 1,588 | | 7,304 |
| Amortized cost | | | 285 | | 576 | | 119 | | 15,980 | | | 10,194 | | 24,216 | | 4,858 | | 44,075 |
| Interest on recoverable taxes (1) | 9 | | 60,848 | | 172,770 | | 18,690 | | 98,946 | | | 60,908 | | 172,869 | | 18,723 | | 99,063 |
| Interest on other assets | | | 11,721 | | 30,558 | | 12,138 | | 29,223 | | | 11,985 | | 31,119 | | 12,511 | | 30,466 |
| | | | 110,336 | | 285,777 | | 59,604 | | 232,713 | | | 133,806 | | 340,283 | | 72,702 | | 267,413 |
| Financial expenses | | | | | | | | | | | | | | | | | | |
| Interests on loans and borrowings | 15 | | (307,126) | | (1,062,148) | | (447,266) | | (997,730) | | | (361,115) | | (1,216,925) | | (490,955) | | (1,122,525) |
| Interest with related parties | 30 | | (99,841) | | (256,588) | | (80,833) | | (262,159) | | | - | | - | | - | | - |
| Interest on contingencies | 21 | | (64,696) | | (185,584) | | (25,004) | | (110,581) | | | (64,696) | | (185,584) | | (25,004) | | (110,581) |
| Interest on leases | 18 | | (42,509) | | (128,282) | | (46,628) | | (141,889) | | | (48,555) | | (165,536) | | (50,829) | | (154,692) |
| Interest on actuarial liabilities | | | (9,984) | | (29,952) | | (9,303) | | (27,890) | | | (11,181) | | (33,810) | | (10,178) | | (30,541) |
| Interest on other liabilities | | | 4,117 | | 3,831 | | 4,032 | | 9,392 | | | 2,278 | | 1,927 | | 4,030 | | 9,414 |
| Written option - Business combination | 24.8.1 | | - | | - | | - | | - | | | (352,790) | | (278,618) | | 143,421 | | 533,774 |
| Adjustment to present value | 6 and 16 | | (168,525) | | (455,019) | | (109,511) | | (290,979) | | | (170,911) | | (457,011) | | (109,760) | | (291,258) |
| Other | | | (27,055) | | (78,926) | | (35,253) | | (120,553) | | | (40,219) | | (135,321) | | (52,391) | | (161,170) |
| | | | (715,619) | | (2,192,668) | | (749,766) | | (1,942,389) | | | (1,047,189) | | (2,470,878) | | (591,666) | | (1,327,579) |
| Monetary, exchange and derivative results, net | | | | | | | | | | | | | | | | | | |
| Exchange rate variation on monetary assets and liabilities | | | (1,656,614) | | (822,234) | | (605,899) | | (6,725,955) | | | (625,672) | | (359,457) | | 4,420 | | (1,529,314) |
| Derivative results | | | 547,414 | | 131,173 | | 61,179 | | 1,329,719 | | | 554,097 | | 143,076 | | 78,125 | | 1,356,289 |
| | | | (1,109,200) | | (691,061) | | (544,720) | | (5,396,236) | | | (71,575) | | (216,381) | | 82,545 | | (173,025) |
| | | | (1,714,483) | | (2,597,952) | | (1,234,882) | | (7,105,912) | | | (984,958) | | (2,346,976) | | (436,419) | | (1,233,191) |
| (1) | For the nine-month period ended on September 30, 2021, the effect includes the final decision related to the exclusion of ICMS from the PIS and COFINS calculation basis from Batávia and UP! Alimentos Ltda. (note 9) in the amount of R$50,434 (null in the same period of the previous year). |
| 29. | STATEMENT OF INCOME BY NATURE |
The Company discloses its statement of income by function and thus presents below the details by nature:
| | Parent company | | Consolidated |
| | | | 2021 | | | | 2020 | | | | 2021 | | | | 2020 |
| | Jul - Sep | | Jan - Sep | | Jul - Sep | | Jan - Sep | | Jul - Sep | | Jan - Sep | | Jul - Sep | | Jan - Sep |
| Costs of sales | | | | | | | | | | | | | | | |
| Raw materials and supplies (1) | 6,534,525 | | 17,836,496 | | 4,498,527 | | 12,637,782 | | 7,370,370 | | 20,634,986 | | 5,417,106 | | 15,140,087 |
| Salaries and employees benefits | 1,082,313 | | 3,147,431 | | 1,041,424 | | 2,955,676 | | 1,106,742 | | 3,210,703 | | 1,060,402 | | 3,007,577 |
| Depreciation | 488,834 | | 1,410,371 | | 424,617 | | 1,259,721 | | 529,589 | | 1,537,582 | | 466,876 | | 1,379,928 |
| Amortization | 16,160 | | 55,031 | | 24,739 | | 51,128 | | 32,106 | | 103,626 | | 40,500 | | 98,083 |
| Other | 706,751 | | 2,050,110 | | 632,010 | | 1,728,805 | | 726,496 | | 2,086,342 | | 613,249 | | 1,793,580 |
| | 8,828,583 | | 24,499,439 | | 6,621,317 | | 18,633,112 | | 9,765,303 | | 27,573,239 | | 7,598,133 | | 21,419,255 |
| | | | | | | | | | | | | | | | |
| Sales expenses | | | | | | | | | | | | | | | |
| Indirect and direct logistics expenses | 749,253 | | 1,969,731 | | 525,863 | | 1,588,941 | | 835,633 | | 2,251,726 | | 619,365 | | 1,827,774 |
| Marketing | 128,563 | | 361,337 | | 102,510 | | 306,182 | | 166,046 | | 482,650 | | 137,473 | | 427,706 |
| Salaries and employees benefits | 272,974 | | 789,555 | | 276,608 | | 793,694 | | 362,960 | | 1,059,427 | | 363,920 | | 1,035,654 |
| Depreciation | 45,277 | | 138,793 | | 37,073 | | 105,694 | | 81,781 | | 273,804 | | 49,703 | | 160,816 |
| Amortization | 16,314 | | 57,742 | | 20,194 | | 49,232 | | 21,971 | | 76,121 | | 27,454 | | 70,166 |
| Other | 124,170 | | 368,367 | | 97,474 | | 306,327 | | 179,370 | | 481,171 | | 168,554 | | 489,576 |
| | 1,336,551 | | 3,685,525 | | 1,059,722 | | 3,150,070 | | 1,647,761 | | 4,624,899 | | 1,366,469 | | 4,011,692 |
| | | | | | | | | | | | | | | | |
| Administrative expenses | | | | | | | | | | | | | | | |
| Salaries and employees benefits | 54,632 | | 163,106 | | 54,782 | | 145,502 | | 92,080 | | 276,389 | | 91,931 | | 247,770 |
| Fees | 14,977 | | 39,801 | | 12,387 | | 41,600 | | 14,977 | | 39,801 | | 12,387 | | 41,600 |
| Depreciation | 5,099 | | 22,252 | | 8,547 | | 23,030 | | 8,176 | | 34,882 | | 13,917 | | 35,544 |
| Amortization | 6,793 | | 28,695 | | 12,168 | | 26,413 | | 7,212 | | 30,278 | | 13,255 | | 28,968 |
| Other | 69,600 | | 123,100 | | 62,916 | | 124,145 | | 99,262 | | 192,616 | | 85,858 | | 196,491 |
| | 151,101 | | 376,954 | | 150,800 | | 360,690 | | 221,707 | | 573,966 | | 217,348 | | 550,373 |
| (1) | Includes recoveries of PIS and COFINS taxes on inputs and export credits in the amount of R$43,817 for the nine-month period ended on September 30, 2021 (null in the same period of the previous year). |
The Company incurred in expenses with internal research and development of new products of R$30,840 for the nine-month period ended on September 30, 2021 in the parent company and in the consolidated (R$48,228 in the parent company and in the consolidated in the same period of the prior year) and R$10,385 for the three-month period ended on September 30, 2021 in the parent company and in the consolidated (R$17,041 in the parent company and in the consolidated in the same period of the prior year).
| | |
BRF S.A. | INTERIM FINANCIAL INFORMATION – September 30, 2021 | 82 |
In the normal course of business, rights and obligations arise between related parties, resulting from transactions of sale and purchase of products, as well as from financial operations.
The Company holds a Related Parties Transactions Policy, which was reviewed and approved by the Board of Directors and applies to all subsidiaries of the group.
The policy mentioned above provides the conditions that must be observed for the realization of a transaction between related parties, as well as establishes approval hierarchies according to the value and nature of the transactions involved. The policy also foresees situations of conflict of interests and how they must be conducted.
In May and June 2021, Marfrig Global Foods S.A. (“Marfrig”) acquired common shares issued by BRF S.A., achieving 31.66% of participation in the Company’s capital stock. With such participation, Marfrig is able to exercise significant influence over BRF S.A., becoming a related party. On October 20, 2021, the Administrative Council for Economic Defense’s Court (Tribunal do Conselho Administrativo de Defesa Econômica − CADE) confirmed the approval without restrictions of the acquisition by Marfrig of a corporate interest in the Company’s capital stock. The transactions and balances with Marfrig and its subsidiaries during the period are presented below.
| | |
BRF S.A. | INTERIM FINANCIAL INFORMATION – September 30, 2021 | 83 |
The balances of the transactions with related parties are as follows:
| | | | | | | | | | | | | Parent company |
| | Accounts receivable | | Dividends and interest on shareholders' equity receivable | | Loans | | Trade accounts payable | | Advance for future capital increase | | Other rights | | Advances and other liabilities |
| | 09.30.21 | | 12.31.20 | | 12.31.20 | | 09.30.21 | | 12.31.20 | | 09.30.21 | | 12.31.20 | | 09.30.21 | | 09.30.21 | | 12.31.20 | | 09.30.21 | | 12.31.20 |
| Banvit | - | | - | | - | | - | | - | | - | | - | | - | | 365 | | 190 | | - | | - |
| BRF Energia S.A. | - | | - | | - | | - | | - | | (28,445) | | (13,063) | | - | | - | | - | | - | | - |
| BRF Foods GmbH | 617,240 | | 799,571 | | - | | - | | - | | - | | - | | - | | 104 | | 54 | | (59) | | (56) |
| BRF Foods LLC | - | | - | | - | | - | | - | | - | | - | | - | | - | | 501 | | - | | (2) |
| BRF Global GmbH | 7,165,231 | | 2,319,292 | | - | | - | | - | | - | | - | | - | | - | | - | | (12,426,727) | (1) | (7,095,587) |
| BRF GmbH | - | | - | | - | | - | | - | | - | | - | | - | | 107 | | 995 | | (1,823,678) | (2) | (1,845,759) |
| BRF Pet S.A. | 3,311 | | 6,228 | | - | | - | | - | | - | | (37) | | 918,675 | | 552 | | 480 | | - | | - |
| Establecimiento Levino Zaccardi y Cia. S.A. | - | | - | | - | | 340 | | 315 | | - | | - | | - | | - | | - | | - | | - |
| Federal Foods | - | | - | | - | | - | | - | | - | | - | | - | | - | | - | | (504) | | - |
| Joody Al Sharqiya Food Production Factory LLC | - | | - | | - | | - | | - | | - | | ��- | | - | | 50 | | - | | - | | - |
| Sadia Alimentos S.A. | - | | - | | - | | - | | - | | - | | - | | - | | - | | - | | (4,224) | | (3,069) |
| Sadia Chile S.A. | 143,994 | | 114,742 | | - | | - | | - | | - | | - | | - | | 4 | | 3 | | - | | - |
| Sadia International Ltd. | - | | - | | - | | - | | - | | - | | - | | | | - | | - | | - | | (18,990) |
| Sadia Uruguay S.A. | 4,925 | | 5,743 | | - | | - | | - | | - | | - | | - | | - | | - | | (40,777) | | (38,823) |
| VIP S.A. Empreendimentos e Partic. Imob. | - | | - | | 10 | | - | | - | | - | | - | | - | | - | | - | | - | | - |
| Marfrig Global Foods S.A. | 4,813 | | - | | - | | - | | - | | (21,708) | | - | | - | | - | | - | | - | | - |
| Quickfood S.A. | 12,184 | | - | | - | | - | | - | | - | | - | | - | | - | | - | | - | | - |
| Marfrig Alimentos S.A. | 99 | | - | | - | | - | | - | | - | | - | | - | | - | | - | | - | | - |
| Total | 7,951,797 | | 3,245,576 | | 10 | | 340 | | 315 | | (50,153) | | (13,100) | | 918,675 | | 1,182 | | 2,223 | | (14,295,969) | | (9,002,286) |
| (1) | The amount corresponds to export pre-payments, usual operation between the productive units in Brazil with the wholly-owned subsidiaries that operate as trading companies in the international market. |
| (2) | BRF S.A. performs reimbursement to certain subsidiaries for losses incurred in the normal course of their operations, generating liabilities recorded as Other Obligations with Related Parties. |
| | Consolidated |
| | Accounts receivable | Trade accounts payable |
| | 09.30.21 | | 09.30.21 |
| Marfrig Global Foods S.A. | 4,813 | | (21,708) |
| Marfrig Chile S.A. | 610 | | - |
| Quickfood S.A. | 12,184 | | - |
| Marfrig Alimentos S.A. | 99 | | - |
| Total | 17,706 | | (21,708) |
| | |
BRF S.A. | INTERIM FINANCIAL INFORMATION – September 30, 2021 | 84 |
| | | | | | Parent company |
| | Sales | | Financial results, net | | Purchases |
| | | | 2021 | | | | 2020 | | | | 2021 | | | | 2020 | | | | 2021 | | | | 2020 |
| | Jul - Sep | | Jan - Sep | | Jul - Sep | | Jan - Sep | | Jul - Sep | | Jan - Sep | | Jul - Sep | | Jan - Sep | | Jul - Sep | | Jan - Sep | | Jul - Sep | | Jan - Sep |
| BRF Energia S.A. | - | | - | | - | | - | | - | | - | | - | | - | | (99,627) | | (169,145) | | (55,791) | | (187,251) |
| BRF Foods GmbH | 71,773 | | 179,113 | | 45,742 | | 139,104 | | - | | - | | - | | - | | - | | - | | - | | - |
| BRF Global GmbH | 3,905,988 | | 11,029,983 | | 2,721,865 | | 8,029,171 | | (98,922) | | (254,526) | | (63,810) | | (211,716) | | - | | - | | - | | - |
| BRF Pet S.A. | 3,954 | | 9,742 | | 1,650 | | 4,137 | | - | | - | | - | | - | | - | | - | | (4) | | (62) |
| Establecimiento Levino Zaccardi y Cia. S.A. | - | | - | | - | | - | | 3 | | 10 | | 4 | | 10 | | - | | - | | - | | - |
| Perdigão International Ltd. | - | | - | | - | | - | | - | | - | | (16,498) | | (48,377) | | - | | - | | - | | - |
| Sadia Alimentos S.A. | - | | - | | - | | - | | (35) | | (119) | | (44) | | (405) | | - | | - | | - | | - |
| Sadia Chile S.A. | 45,307 | | 129,213 | | 31,762 | | 111,280 | | - | | - | | - | | - | | - | | - | | - | | - |
| Sadia Uruguay S.A. | 16,345 | | 47,705 | | 14,790 | | 35,504 | | (887) | | (1,953) | | (485) | | (1,671) | | - | | - | | - | | - |
| Marfrig Global Foods S.A. (1) | 12,982 | | 20,925 | | - | | - | | - | | - | | - | | - | | (80,986) | | (130,861) | | - | | - |
| Marfrig Chile S.A. (1) | - | | 1,376 | | - | | - | | - | | - | | - | | - | | - | | - | | - | | - |
| Quickfood S.A. (1) | 19,207 | | 19,207 | | - | | - | | - | | - | | - | | - | | - | | - | | - | | - |
| Marfrig Alimentos S.A. (1) | 139 | | 139 | | - | | - | | - | | - | | - | | - | | - | | - | | - | | - |
| Total | 4,075,695 | | 11,437,403 | | 2,815,809 | | 8,319,196 | | (99,841) | | (256,588) | | (80,833) | | (262,159) | | (180,613) | | (300,006) | | (55,795) | | (187,313) |
| (1) | The period ranges from May 21,2021 to September 30, 2021. |
| | Consolidated |
| | Sales | Purchases |
| | | | 2021 | | | | 2021 |
| | Jul - Sep | | Jan - Sep | | Jul - Sep | | Jan - Sep |
| Marfrig Global Foods S.A. (1) | 12,982 | | 20,925 | | (96,907) | | (151,437) |
| Marfrig Chile S.A. (1) | 899 | | 3,055 | | - | | - |
| Quickfood S.A. (1) | 19,207 | | 19,207 | | - | | - |
| Marfrig Alimentos S.A. (1) | 139 | | 139 | | (54,530) | | (54,530) |
| Total | 33,227 | | 43,326 | | (151,437) | | (205,967) |
| (1) | The period ranges from May 21,2021 to September 30, 2021. |
The subsidiaries of the Company enter into loan agreements pursuant its cash management strategy. As of September 30, 2021, the balance of these transactions was R$2,458,346 (R$2,116,463 as of December 31, 2020) with a weighted average rate of 3.94% p.a. (3.01% p.a. as of December 31, 2020).
The Company has made contributions related to the post-employment benefit plans of its employees to BRF Previdência, which holds these plans (note 20). Additionally, the Company leased properties owned by BRF Previdência, and for the nine-month period ended on September 30, 2021 the total amount of lease payments was R$15,410 (R$14,646 in the same period of the prior year) for the three-month period ended on September 30, 2021, the total amount of lease payments was R$5,202 (R$4,882 in the same period of the prior year).
The Company maintains other transactions with related parties resulting from guarantees, transferences and donations to related associations and institutes, as well as leasing and other commercial transactions with related people and entities. Such transactions are compliant with the Related Party Transactions Policy and are not relevant, individually or in aggregate.
| 30.1. | Management remuneration |
The total remuneration and benefits expense with board members, statutory directors and the head of internal audit are set forth below:
| | Consolidated |
| | | | 2021 | | | | 2020 |
| | Jul - Sep | | Jan - Sep | | Jul - Sep | | Jan - Sep |
| Salary and profit sharing | 14,930 | | 46,117 | | 14,064 | | 49,669 |
| Short-term benefits (1) | 76 | | 500 | | 680 | | 2,291 |
| Private pension | 282 | | 872 | | 304 | | 1,200 |
| Termination benefits | 200 | | 1,698 | | 2,104 | | 6,507 |
| Share-based payment | 7,668 | | 21,854 | | 5,561 | | 13,955 |
| | 23,156 | | 71,041 | | 22,713 | | 73,622 |
| (1) | Comprises: medical assistance, educational expenses and others. |
In addition, the executive officers (non-statutory) received among remuneration and benefits the total amount of R$19,484 for the nine-month period ended on September 30, 2021 (R$15,739 in the same period of the prior year) and R$6,257 for the three-month period ended on September 30, 2021 (R$6,304 in the same period of the prior year).
| | |
BRF S.A. | INTERIM FINANCIAL INFORMATION – September 30, 2021 | 85 |
In the normal course of the business, the Company enters into agreements with third parties for the purchase of raw material, mainly corn and soymeal. The agreed prices in these agreements can be fixed or variable. The Company also enters into other agreements, such as electricity supply, packaging supplies, construction of buildings and others for the supply of its manufacturing activities. The firm commitments schedule is set forth below:
| Parent company | | Consolidated |
| | | 09.30.21 | | 09.30.21 |
| Current | | 5,148,786 | | 5,508,563 |
| Non-current | | 1,704,417 | | 1,996,385 |
| October to December 2022 | | 271,445 | | 425,407 |
| 2023 | | 613,764 | | 704,311 |
| 2024 | | 250,841 | | 289,910 |
| 2025 | | 165,488 | | 173,878 |
| 2026 onwards | | 402,879 | | 402,879 |
| | | 6,853,203 | | 7,504,948 |
| 32. | TRANSACTIONS THAT DO NOT INVOLVE CASH |
The following transactions did not involve cash or cash equivalents during the nine-month period ended on September 30, 2021:
| (i) | Capitalized loan interest: as referred in note 13. |
| (ii) | Addition of lease by right-of-use assets and respective lease liability: in the nine-month period ended on September 30, 2021 amounted to R$327,024 in the parent company and R$551,554 in the consolidated (R$202,832 in the parent company and R$268,520 in the same period of the prior year) and in the three-month period ended on September 30, 2021, amounted to R$131,195 in the parent company and R$172,979 in the consolidated (R$31,163 in the parent company and R$40,920 in the same period of the prior year). |
| | |
BRF S.A. | INTERIM FINANCIAL INFORMATION – September 30, 2021 | 86 |
| 33. | APPROVAL OF THE INTERIM FINANCIAL INFORMATION |
The interim financial information was approved and the issuance authorized by the Board of Directors on November 10, 2021.
| BOARD OF DIRECTORS | |
| | |
| Chairman (Independent) | Pedro Pullen Parente |
| Vice-Chairman (Independent) | Augusto Marques da Cruz Filho |
| Independent Member | Dan Ioschpe |
| Independent Member | Flavia Buarque de Almeida |
| Independent Member | Flavia Maria Bittencourt |
| Non-Independent Member | Ivandré Motiel da Silva |
| Independent Member | José Luiz Osório de Almeida Filho |
| Independent Member | Luiz Fernando Furlan |
| Independent Member | Marcelo Feriozzi Bacci |
| Independent Member | Roberto Rodrigues |
| | |
| FISCAL COUNCIL | |
| | |
| Chairman | Attílio Guaspari |
| Member | André Vicentini |
| Member | Maria Paula Soares Aranha |
| | |
| | |
| AUDIT AND INTEGRITY COMMITTEE | |
| | |
| Comittee Coordinator (Independent) | Augusto Marques da Cruz Filho |
| Non-Independent Member | Ivandré Motiel da Silva |
| Independent Member | Marcelo Feriozzi Bacci |
| External Member | Jerônimo Antunes |
| External Member | Valmir Pedro Rossi |
| | |
| | |
| BOARD OF EXECUTIVE OFFICERS | |
| | |
| Global Chief Executive Officer | Lorival Nogueira Luz Júnior |
| Chief Financial and Investor Relations Officer | Carlos Alberto Bezerra de Moura |
| Vice-President of People, Services and Technology | Alessandro Rosa Bonorino |
| Vice-President of Institutional Relations and Sustainability | Grazielle Tallia Parenti |
| Vice-President of Integrated Planning and Logistics | Leonardo Campo Dallorto |
| Vice-President of New Business | Marcel Sacco |
| Vice-President of Brazil Market | Sidney Rogério Manzaro |
| Vice-President of Operations and Procurement | Vinícius Guimarães Barbosa |
| | |
| | |
| | |
| | |
| | |
| Marcos Roberto Badollato | Heitor Carpigiani de Paula |
| Accounting Director | Accountant – CRC 1SP336262/O-4 |
| | |
BRF S.A. | INTERIM FINANCIAL INFORMATION – September 30, 2021 | 87 |
COMENTARY ABOUT THE BEHAVIOR OF THE COMPANY’S PROJECTIONS
On December 08, 2020, the management disclosed certain estimates and expectations in connection with the Company for the next ten years, including the following projections:
(a) Expectation to make investments of, approximately, R$ 55 billion within the next ten years, setting up a prudent net financial leverage limit (ratio between net debt and Adjusted EBITDA of the 12 prior months) up to three times;
(b) Period between 2021 and 2023: expectation to achieve a net revenue of approximately R$ 65 billion, with a growing EBITDA twice the size in comparison to the current one, considering the last 12 months ended September 30, 2020;
(c) Period between 2024 and 2026: growth expectation of the net revenue and of the EBITDA of approximately 2,5 times in relation to the current levels, considering the last 12 months ended September 30, 2020 and a revenue growth of more than 60% in the Brazilian market;
(d) Period between 2027 and 2030: expectation to reach a net revenue of more than R$ 100 billion and an EBTIDA growth of more than 3,5 times in relation to the current level, considering the last 12 months ended September 30, 2020, consistent EBITDA Margins above 15%, net margin of approximately 6% and return on invested capital (“ROIC”) of approximately 16%.
The projections disclosed above are mere forecast and reflect the current management’s expectation in relation to BRF’s future. Nevertheless, these projections depend on certain factors and market conditions that escape the Company’s control and, therefore, may differ in relation to numbers and results that will be effectively recorded by the Company.
BREAKDOWN OF THE CAPITAL BY OWNER (NOT REVIEWED)
The shareholding position of the shareholders holding more than 5% of the voting stock, management, members of the Board of Directors is presented below:
| | | 09.30.21 | | 12.31.20 |
| Shareholders | | Quantity | | % | | Quantity | | % |
| Major shareholders | | | | | | | | |
| Marfrig Global Food S.A. | | 257,267,671 | | 31.66 | | Not available (2) |
| Fundação Petrobras de Seguridade Social - Petros (1) | | 56,947,828 | | 7.01 | | 92,716,266 | | 11.41 |
| Caixa de Previd. dos Func. do Banco do Brasil (1) | | 49,837,752 | | 6.13 | | 74,856,852 | | 9.21 |
| Kapitalo Investimentos Ltda. | | 40,784,398 | | 5.02 | | Not available (2) |
| Management | | | | | | | | |
| Board of Directors | | 6,306,302 | | 0.78 | | 6,865,302 | | 0.84 |
| Executives | | 843,756 | | 0.10 | | 605,902 | | 0.07 |
| Treasury shares | | 4,061,680 | | 0.50 | | 4,766,084 | | 0.59 |
| Other | | 396,423,859 | | 48.80 | | 632,662,840 | | 77.88 |
| | | 812,473,246 | | 100.00 | | 812,473,246 | | 100.00 |
| (1) | The pension funds are controlled by employees that participate in the respective entities. |
| (2) | Information not available, as participation is less than 5%. |
The Company is bound to arbitration in the Market Arbitration Chamber, as established by the arbitration clause in the by-laws.
| | |
BRF S.A. | INTERIM FINANCIAL INFORMATION – September 30, 2021 | 88 |

INDEPENDENT AUDITORS’ REPORT ON REVIEW OF INTERIM FINANCIAL INFORMATION
To the Board of Directors and Shareholders of
BRF S.A.
Itajaí - SC
Introduction
We have reviewed the accompanying individual and consolidated interim financial information of BRF S.A. (“the Company”) contained in the Quarterly Information Form - ITR for the quarter ended September 30, 2021, which comprises the statement of financial position as of September 30, 2021 and the respective statements of income (loss) and comprehensive income (loss) for the three and nine-month periods then ended and changes in equity and cash flows for the nine-month period then ended, including the explanatory notes.
The Company's management is responsible for the preparation of this individual and consolidated interim financial information in accordance with Technical Pronouncement CPC 21 (R1) – Demonstração Intermediária and IAS 34 - Interim Financial Reporting, issued by the International Accounting Standards Board - IASB, as well as for the presentation of this information in accordance with standards issued by the Comissão de Valores Mobiliários – CVM, applicable to the preparation of Quarterly Information Form - ITR. Our responsibility is to express a conclusion on this interim financial information based on our review.
Scope of review
We conducted our review in accordance with the Brazilian and International standards on review engagements of interim financial information (NBC TR 2410 - Revisão de Informações Intermediárias Executada pelo Auditor da Entidade and ISRE 2410 - Review of Interim Financial Information Performed by the Independent Auditor of the Entity, respectively). A review of interim financial information consists of making inquiries, primarily of persons responsible for the financial and accounting matters and applying analytical and other review procedures. A review is substantially less in scope than an audit conducted in accordance with the auditing standards and, consequently, does not enable us to obtain assurance that we would become aware of all significant matters that might be identified in an audit. Accordingly, we do not express an audit opinion.
Conclusion on the individual and consolidated interim financial information
Based on our review, nothing has come to our attention that causes us to believe that the accompanying individual and consolidated interim financial information included in the Quarterly Information Form – ITR referred to above has not been prepared, in all material respects, in accordance with CPC 21 (R1) and IAS 34, issued by IASB, applicable to the preparation of Quarterly Information Form - ITR, and presented in accordance with the standards issued by the Comissão de Valores Mobiliários – CVM.
Emphasis of matter
We draw attention to explanatory note 1.5 to the interim financial information, individual and consolidated, which describe the investigations concluded by United States Government authorities and the ongoing investigations conducted by Brazilian Government authorities involving the Company, as well as their current and potential developments. In the current stage of the ongoing investigations, it is not possible to determine the potential financial and non-financial impacts on the Company resulting from them and their potential developments and, consequently, to record potential losses which could have a material adverse effect on the Company´s financial position, results of operations and cash flows in the future. Our conclusion is not qualified in respect of these matters.
Other matters - Statements of Value Added
The interim financial information mentioned above includes Statements of Value Added, individual and consolidated, for the nine-month period ended September 30, 2021, prepared under the responsibility of the Company's management, presented as supplementary information for the purposes of IAS 34. These statements were submitted to review procedures together with the review of the Quarterly Information, with the objective of concluding whether they are reconciled with the interim financial information and accounting records, as applicable, and whether their form and content are in accordance with the criteria defined in Technical Pronouncement CPC 09 - Statement of Added Value. Based on our review, nothing has come to our attention that causes us to believe that it has not been prepared, in all material respects, in accordance with the criteria defined in this Pronouncement and consistent with the individual and consolidated interim financial information taken as a whole.
São Paulo, November 10, 2021
KPMG Auditores Independentes Ltda.
CRC 2SP014428/O-6
Original report in Portuguese signed by
Fabian Junqueira Sousa
Accountant CRC 1SP235639/O-0
| | |
BRF S.A. | INTERIM FINANCIAL INFORMATION – September 30, 2021 | 89 |
OPINION OF THE AUDIT AND INTEGRITY COMMITTEE
The Audit and Integrity Committee of BRF S.A., in fulfilling its statutory and legal duties, examined the interim financial information (parent company and consolidated) for the nine-month period ended on September 30, 2021, the Management Report and the review report issued without modification by KPMG Auditores Independentes.
There were no situations of significant divergence between the Company's Management, the independent auditors and the Audit Committee in relation to the Company's interim financial information.
Based on the documents reviewed and the explanations provided, the members of the Audit and Integrity Committee, undersigned, issued the opinion that the interim financial information are in a position to be approved.
São Paulo, November 10, 2021.
Augusto Marques da Cruz Filho
Coordinator (Independent)
Ivandré Motiel da Silva
Non-Independent member
Marcelo Feriozzi Bacci
Independent member
Jerônimo Antunes
External member
Valmir Pedro Rossi
External member
| | |
BRF S.A. | INTERIM FINANCIAL INFORMATION – September 30, 2021 | 90 |
STATEMENT OF EXECUTIVE BOARD ON THE INTERIM FINANCIAL INFORMATION AND INDEPENDENT AUDITOR’S REPORT
In compliance with the dispositions of sections V and VI of the article 25 of the CVM Instruction No. 480/09, the executive board of BRF S.A. states that:
| (i) | reviewed, discussed and agreed with the Company's interim financial information for the nine-month period ended on September 30, 2021, and |
| (ii) | reviewed, discussed and agreed with the opinions expressed in the audit report issued by KPMG Auditores Independentes for the Company's interim financial information for the nine-month period ended on September 30, 2021. |
São Paulo, November 10, 2021.
Lorival Nogueira Luz Júnior
Global Chief Executive Officer
Carlos Alberto Bezerra de Moura
Chief Financial and Investor Relations Officer
Alessandro Rosa Bonorino
Vice-President of People, Services and Technology
Grazielle Tallia Parenti
Vice-President of Institutional Relations and Sustainability
Leonardo Campo Dallorto
Vice-President of Integrated Planning and Logistics
Marcel Sacco
Vice-President of New Business
Sidney Rogério Manzaro
Vice-President of Brazil Market
Vinícius Guimarães Barbosa
Vice-President of Operations and Procurement
| | |
BRF S.A. | INTERIM FINANCIAL INFORMATION – September 30, 2021 | 91 |