 | Interim Financial Information, Individual and Consolidated | March 31, 2024 |
Índex
| | Interim Financial Information, Individual and Consolidated | March 31, 2024 |
| | Interim Financial Information, Individual and Consolidated | March 31, 2024 |
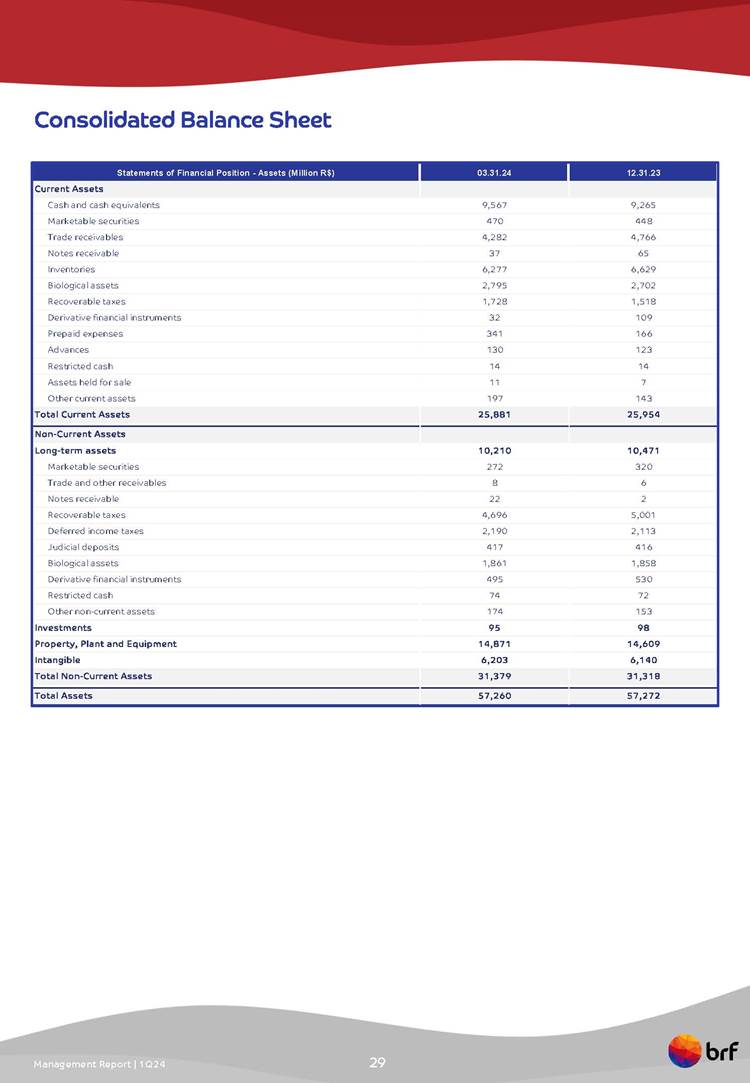
Statements of Financial Position
| | | | Parent company | | Consolidated | | | | | Parent company | | Consolidated |
| ASSETS | Note | | 03.31.24 | | 12.31.23 | | 03.31.24 | | 12.31.23 | | LIABILITIES | Note | | 03.31.24 | | 12.31.23 | | 03.31.24 | | 12.31.23 |
| CURRENT ASSETS | | | | | | | | | | | CURRENT LIABILITIES | | | | | | | | | |
| Cash and cash equivalents | 4 | | 4,523,944 | | 4,701,549 | | 9,567,208 | | 9,264,664 | | Loans and borrowings | 15 | | 2,114,310 | | 2,237,214 | | 2,260,733 | | 2,451,838 |
| Marketable securities | 5 | | 422,925 | | 412,107 | | 469,515 | | 447,878 | | Trade accounts payable | 16 | | 13,381,858 | | 14,011,988 | | 11,956,380 | | 12,592,006 |
| Trade receivables | 6 | | 4,276,970 | | 5,655,967 | | 4,281,896 | | 4,766,071 | | Lease liability | 17.2 | | 881,319 | | 835,154 | | 1,043,159 | | 944,326 |
| Notes receivable | 6 | | 37,499 | | 64,731 | | 37,499 | | 64,731 | | Payroll, related charges and employee profit sharing | | | 993,405 | | 886,974 | | 1,095,629 | | 984,457 |
| Inventories | 7 | | 4,305,076 | | 4,717,540 | | 6,276,532 | | 6,628,890 | | Taxes payable | | | 205,333 | | 316,600 | | 742,892 | | 585,129 |
| Biological assets | 8 | | 2,662,080 | | 2,580,383 | | 2,795,193 | | 2,702,164 | | Derivative financial instruments | 23 | | 48,299 | | 74,112 | | 49,284 | | 76,940 |
| Recoverable taxes | 9 | | 1,285,826 | | 1,210,028 | | 1,727,753 | | 1,517,548 | | Provision for tax, civil and labor risks | 20 | | 706,369 | | 717,119 | | 709,492 | | 720,187 |
| Derivative financial instruments | 23 | | 31,818 | | 109,222 | | 31,818 | | 109,222 | | Employee benefits | 19 | | 58,894 | | 58,894 | | 84,906 | | 86,423 |
| Prepaid expenses | | | 296,370 | | 126,557 | | 341,097 | | 166,230 | | Customer advances | | | 10,030 | | 6,320 | | 344,610 | | 290,279 |
| Advances | | | 61,621 | | 64,677 | | 130,067 | | 123,319 | | Advances from related parties | 28 | | 5,771,640 | | 6,119,677 | | 1 | | - |
| Restricted cash | | | - | | - | | 14,177 | | 13,814 | | Other current liabilities | | | 183,157 | | 282,712 | | 559,678 | | 658,763 |
| Assets held for sale | | | 4,284 | | 684 | | 11,375 | | 7,204 | | | | | | | | | | | |
| Other current assets | | | 183,741 | | 132,989 | | 196,804 | | 142,527 | | | | | | | | | | | |
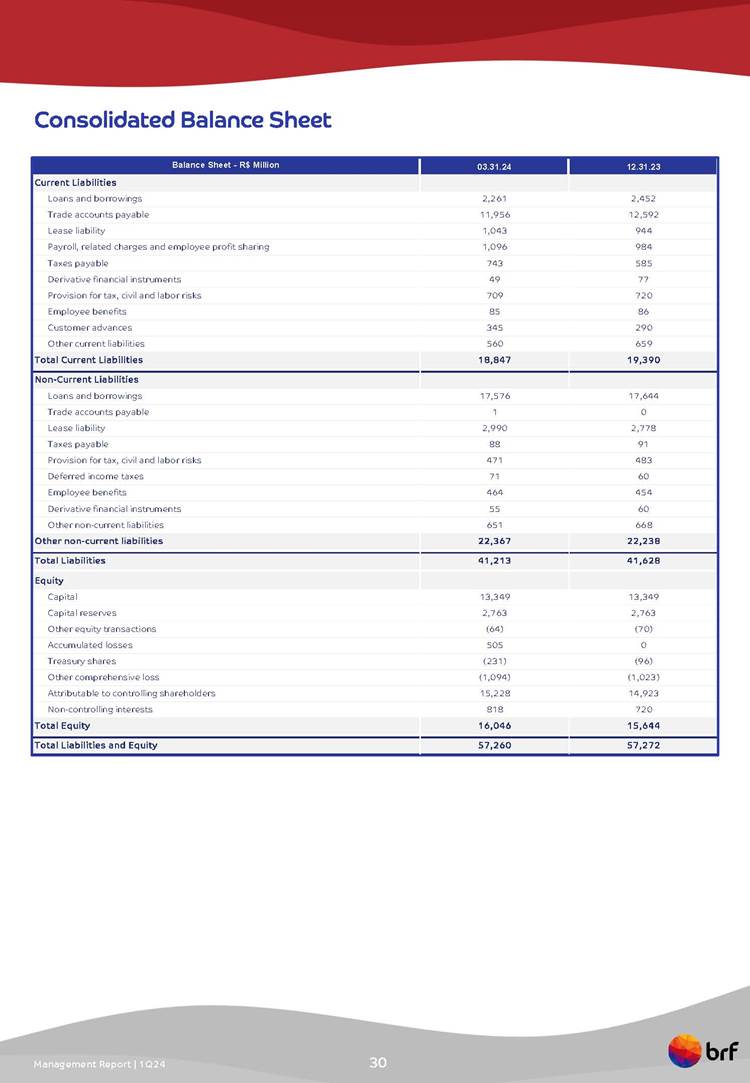
| Total current assets | | | 18,092,154 | | 19,776,434 | | 25,880,934 | | 25,954,262 | | Total current liabilities | | | 24,354,614 | | 25,546,764 | | 18,846,764 | | 19,390,348 |
| | | | | | | | | | | | | | | | | | | | | |
| NON-CURRENT ASSETS | | | | | | | | | | | NON-CURRENT LIABILITIES | | | | | | | | | |
| LONG-TERM RECEIVALBLES | | | | | | | | | | | Loans and borrowings | 15 | | 15,324,356 | | 15,462,088 | | 17,576,020 | | 17,643,710 |
| Marketable securities | 5 | | 18,237 | | 16,490 | | 272,244 | | 319,995 | | Trade accounts payable | 16 | | 691 | | 422 | | 691 | | 422 |
| Trade receivables | 6 | | 5,943 | | 5,897 | | 7,882 | | 5,897 | | Lease liability | 17.2 | | 2,750,426 | | 2,624,979 | | 2,989,942 | | 2,777,521 |
| Notes receivable | 6 | | 22,052 | | 1,530 | | 22,052 | | 1,530 | | Taxes payable | | | 85,459 | | 88,211 | | 87,737 | | 90,669 |
| Recoverable taxes | 9 | | 4,677,785 | | 4,981,378 | | 4,696,060 | | 5,000,740 | | Provision for tax, civil and labor risks | 20 | | 431,420 | | 442,621 | | 470,940 | | 482,983 |
| Deferred income taxes | 10 | | 2,131,624 | | 2,054,826 | | 2,190,159 | | 2,113,108 | | Deferred income taxes | 10 | | - | | - | | 70,716 | | 60,125 |
| Judicial deposits | 11 | | 405,734 | | 405,450 | | 416,647 | | 415,718 | | Liabilities with related parties | 28 | | 53,308 | | 52,581 | | - | | - |
| Biological assets | 8 | | 1,776,517 | | 1,788,383 | | 1,860,790 | | 1,858,316 | | Employee benefits | 19 | | 271,692 | | 264,731 | | 464,354 | | 454,398 |
| Derivative financial instruments | 23 | | 495,492 | | 529,830 | | 495,492 | | 529,830 | | Derivative financial instruments | 23 | | 54,935 | | 59,819 | | 54,935 | | 59,819 |
| Restricted cash | | | 31,732 | | 30,952 | | 74,262 | | 72,395 | | Other non-current liabilities | | | 320,793 | | 286,982 | | 651,267 | | 668,439 |
| Other non-current assets | | | 168,878 | | 148,262 | | 174,359 | | 153,052 | | | | | | | | | | | |
| Total long-term receivables | | | 9,733,994 | | 9,962,998 | | 10,209,947 | | 10,470,581 | | Total non-current liabilities | | | 19,293,080 | | 19,282,434 | | 22,366,602 | | 22,238,086 |
| | | | | | | | | | | | | | | | | | | | | |
| | | | | | | | | | | | EQUITY | 21 | | | | | | | | |
| | | | | | | | | | | | Capital | | | 13,349,156 | | 13,349,156 | | 13,349,156 | | 13,349,156 |
| | | | | | | | | | | | Capital reserves | | | 2,763,364 | | 2,763,364 | | 2,763,364 | | 2,763,364 |
| | | | | | | | | | | | Other equity transactions | | | (64,493) | | (70,106) | | (64,493) | | (70,106) |
| Investments | 12 | | 14,654,950 | | 13,683,725 | | 95,249 | | 97,895 | | Accumulated earnings | | | 504,993 | | - | | 504,993 | | - |
| Property, plant and equipment | 13 | | 13,196,922 | | 13,127,930 | | 14,870,629 | | 14,608,914 | | Treasury shares | | | (231,240) | | (96,145) | | (231,240) | | (96,145) |
| Intangible assets | 14 | | 3,197,816 | | 3,201,539 | | 6,203,100 | | 6,140,438 | | Other comprehensive loss | | | (1,093,638) | | (1,022,841) | | (1,093,638) | | (1,022,841) |
| | | | | | | | | | | | Attributable to controlling shareholders | | | 15,228,142 | | 14,923,428 | | 15,228,142 | | 14,923,428 |
| | | | | | | | | | | | Non-controlling interests | | | - | | - | | 818,351 | | 720,228 |
| Total non-current assets | | | 40,783,682 | | 39,976,192 | | 31,378,925 | | 31,317,828 | | Total equity | | | 15,228,142 | | 14,923,428 | | 16,046,493 | | 15,643,656 |
| TOTAL ASSETS | | | 58,875,836 | | 59,752,626 | | 57,259,859 | | 57,272,090 | | TOTAL LIABILITIES AND EQUITY | | | 58,875,836 | | 59,752,626 | | 57,259,859 | | 57,272,090 |
The accompanying notes are an integral part of the interim financial information.
(In thousands of Brazilian Reais)
| | Interim Financial Information, Individual and Consolidated | March 31, 2024 |
Statements of Income (Loss)
| | | | Parent company | | Consolidated |
| | | | 2024 | | 2023 | | 2024 | | 2023 |
| | Note | | Jan - mar | | Jan - mar | | Jan - mar | | Jan - mar |
| NET SALES | 25 | | 10,867,663 | | 11,997,860 | | 13,377,509 | | 13,177,969 |
| Cost of sales | 26 | | (8,645,982) | | (9,720,386) | | (10,153,222) | | (11,504,756) |
| GROSS PROFIT | | | 2,221,681 | | 2,277,474 | | 3,224,287 | | 1,673,213 |
| OPERATING INCOME (EXPENSES) | | | | | | | | | |
| Selling expenses | 26 | | (1,523,767) | | (1,584,564) | | (1,771,818) | | (1,770,641) |
| General and administrative expenses | 26 | | (129,258) | | (95,086) | | (201,493) | | (159,807) |
| Impairment loss on trade receivables | 6 | | (15,920) | | (5,545) | | (27,218) | | (6,507) |
| Other operating income (expenses), net | 26 | | 30,130 | | 77,458 | | 30,944 | | 84,398 |
| Income from associates and joint ventures | 12 | | 898,641 | | (1,023,781) | | (2,407) | | (17) |
| INCOME (LOSS) BEFORE FINANCIAL RESULTS AND INCOME TAXES | | | 1,481,507 | | (354,044) | | 1,252,295 | | (179,361) |
| Financial income | | | 196,746 | | 157,563 | | 274,679 | | 198,130 |
| Financial expenses | | | (931,482) | | (1,058,307) | | (907,113) | | (1,036,189) |
| Foreign exchange and monetary variations | | | (252,604) | | 200,051 | | 94,807 | | (22,012) |
| FINANCIAL INCOME (EXPENSES), NET | 27 | | (987,340) | | (700,693) | | (537,627) | | (860,071) |
| INCOME (LOSS) BEFORE TAXES | | | 494,167 | | (1,054,737) | | 714,668 | | (1,039,432) |
| Income taxes | 10 | | 10,826 | | 20,718 | | (120,924) | | 15,805 |
| INCOME (LOSS) FOR THE YEAR | | | 504,993 | | (1,034,019) | | 593,744 | | (1,023,627) |
| | | | | | | | | | |
| Income (Loss) Attributable to | | | | | | | | | |
| Controlling shareholders | | | 504,993 | | (1,034,019) | | 504,993 | | (1,034,019) |
| Non-controlling interest | | | - | | - | | 88,751 | | 10,392 |
| | | | 504,993 | | (1,034,019) | | 593,744 | | (1,023,627) |
| | | | | | | | | | |
| | | | | | | | | | |
| INCOME (LOSS) PER SHARE | | | | | | | | | |
| Weighted average shares outstanding - basic | | | | | | | 1,670,951,834 | | 1,078,116,849 |
| Loss per share - basic | 22 | | | | | | 0.30 | | (0.96) |
| Weighted average shares outstanding - diluted | | | | | | | 1,672,476,188 | | 1,078,116,849 |
| Income (Loss) per share - diluted | 22 | | | | | | 0.30 | | (0.96) |
The accompanying notes are an integral part of the interim financial information.
(In thousands of Brazilian Reais)
| | Interim Financial Information, Individual and Consolidated | March 31, 2024 |
Statements of Comprehensive Income (Loss)
| | | | Parent company | | Consolidated |
| | | | 2024 | | 2023 | | 2024 | | 2023 |
| | Note | | Jan - mar | | Jan - mar | | Jan - mar | | Jan - mar |
| Income (loss) for the period | | | 504,993 | | (1,034,019) | | 593,744 | | (1,023,627) |
| Other comprehensive income (loss), net of taxes | | | | | | | | | |
| Gain on foreign currency translation of foreign operations | | | 67,575 | | 28,113 | | 85,156 | | 56,469 |
| Gain (loss) on net investment hedge (1) | | | (38,880) | | 52,942 | | (38,880) | | 52,942 |
| Cash flow hedges – effective portion of changes in fair value (1) | | | (44,885) | | 1,251 | | (44,544) | | 8 |
| Cash flow hedges – reclassified to profit or loss | 23 | | (47,437) | | (55,949) | | (47,437) | | (55,949) |
| Items that are or may be reclassified subsequently to profit or loss | | | (63,627) | | 26,357 | | (45,705) | | 53,470 |
| Actuarial gains (losses) on pension and post-employment plans (1) | 19 | | (7,170) | | 2,995 | | (15,623) | | 862 |
| Items that will not be reclassified to profit or loss | | | (7,170) | | 2,995 | | (15,623) | | 862 |
| Comprehensive income (loss) for the period | | | 434,196 | | (1,004,667) | | 532,416 | | (969,295) |
| Attributable to | | | | | | | | | |
| Controlling shareholders | | | 434,196 | | (1,004,667) | | 434,196 | | (1,004,667) |
| Non-controlling interest | | | - | | - | | 98,220 | | 35,372 |
| | | | 434,196 | | (1,004,667) | | 532,416 | | (969,295) |
| (1) | Items above are stated net of deferred taxes on income and the related taxes are disclosed in note 10. |
The accompanying notes are an integral part of the interim financial information.
(In thousands of Brazilian Reais)
| | Interim Financial Information, Individual and Consolidated | March 31, 2024 |
Statements of Changes in Equity
| | | | Attributed to controlling shareholders |
| | | | | | | | | | | | Other comprehensive income (loss) | | | | | | | | |
| | | | Capital | | Capital reserves | | Other equity transactions | | Treasury shares | | Accumulated foreign currency translation adjustments | | Gains (losses) on cash flow hedge (1) | | Actuarial gains (losses) | | Accumulated aearnings (losses) | | Total equity | | Non-controlling interest | | Total shareholders' equity
(consolidated) |
| BALANCES AT DECEMBER 31, 2022 | | | 12,835,915 | | 2,338,476 | | (77,825) | | (109,727) | | (1,024,897) | | (307,389) | | (21,472) | | (2,363,073) | | 11,270,008 | | 552,861 | | 11,822,869 |
| Comprehensive income (loss) (1) | | | | | | | | | | | | | | | | | | | | | | | |
| Losses on foreign currency translation of foreign operations | | | - | | - | | - | | - | | (169,326) | | | | | | | | (169,326) | | (139,739) | | (309,065) |
| Gains on net investment hedge | | | - | | - | | - | | - | | 145,328 | | | | | | | | 145,328 | | - | | 145,328 |
| Unrealized gains in cash flow hedge | | | - | | - | | - | | - | | | | 372,958 | | | | | | 372,958 | | 418 | | 373,376 |
| Actuarial losses on pension and post-employment plans | | | - | | - | | - | | - | | | | | | (1,523) | | | | (1,523) | | (40,702) | | (42,225) |
| Income (loss) for the year | | | - | | - | | - | | - | | | | | | | | (2,028,559) | | (2,028,559) | | 159,707 | | (1,868,852) |
| SUB-TOTAL COMPREHENSIVE INCOME (LOSS) | | | - | | - | | - | | - | | (23,998) | | 372,958 | | (1,523) | | (2,028,559) | | (1,681,122) | | (20,316) | | (1,701,438) |
| Employee benefits remeasurement - defined benefit | | | - | | - | | - | | - | | | | | | (16,520) | | 16,520 | | - | | - | | - |
| Capital increase through issuance of shares | | | 600,000 | | 4,800,000 | | | | - | | | | | | | | | | 5,400,000 | | - | | 5,400,000 |
| Expenses with public exchange offer of shares | | | (86,759) | | - | | | | - | | | | | | | | | | (86,759) | | - | | (86,759) |
| Capital increase in subsidiaries | | | - | | - | | - | | - | | | | | | | | | | - | | 187,777 | | 187,777 |
| Appropriation of income (loss) | | | | | | | | | | | | | | | | | | | | | | | |
| Dividends | | | - | | - | | - | | - | | | | | | | | | | - | | (94) | | (94) |
| Compensation of accumulated losses with capital reserve | | | - | | (4,375,112) | | | | - | | | | | | | | 4,375,112 | | - | | - | | - |
| Share-based payments | | | - | | - | | 7,719 | | 13,582 | | | | | | | | | | 21,301 | | - | | 21,301 |
| BALANCES AT DECEMBER 31, 2023 | | | 13,349,156 | | 2,763,364 | | (70,106) | | (96,145) | | (1,048,895) | | 65,569 | | (39,515) | | | | 14,923,428 | | 720,228 | | 15,643,656 |
| Comprehensive income (loss) (1) | | | | | | | | | | | | | | | | | | | | | | | |
| Gain on foreign currency translation of foreign operations | | | - | | - | | - | | - | | 67,575 | | | | | | | | 67,575 | | 17,581 | | 85,156 |
| Loss on net investment hedge | | | - | | - | | - | | - | | (38,880) | | | | | | | | (38,880) | | - | | (38,880) |
| Unrealized gains (losses) in cash flow hedge | | | - | | - | | - | | - | | | | (92,322) | | | | | | (92,322) | | 341 | | (91,981) |
| Actuarial losses on pension and post-employment plans | | | - | | - | | - | | - | | | | | | (7,170) | | | | (7,170) | | (8,453) | | (15,623) |
| Income for the period | | | - | | - | | - | | - | | | | | | | | 504,993 | | 504,993 | | 88,751 | | 593,744 |
| SUB-TOTAL COMPREHENSIVE INCOME (LOSS) | | | - | | - | | - | | - | | 28,695 | | (92,322) | | (7,170) | | 504,993 | | 434,196 | | 98,220 | | 532,416 |
| Appropriation of income (loss) | | | | | | | | | | | | | | | | | | | | | | | |
| Dividends | | | - | | - | | - | | - | | | | | | | | | | - | | (97) | | (97) |
| Share-based payments | | | - | | - | | 5,613 | | - | | | | | | | | | | 5,613 | | - | | 5,613 |
| Acquisition of treasury shares | | | - | | - | | | | (135,095) | | | | | | | | | | (135,095) | | - | | (135,095) |
| BALANCES AT MARÇO 31, 2024 | | | 13,349,156 | | 2,763,364 | | (64,493) | | (231,240) | | (1,020,200) | | (26,753) | | (46,685) | | 504,993 | | 15,228,142 | | 818,351 | | 16,046,493 |
| (1) | All changes in other comprehensive income are presented net of deferred taxes on profit, when applicable, are disclosed in note 10. |
The accompanying notes are an integral part of the interim financial information.
(In thousands of Brazilian Reais)
| | Interim Financial Information, Individual and Consolidated | March 31, 2024 |
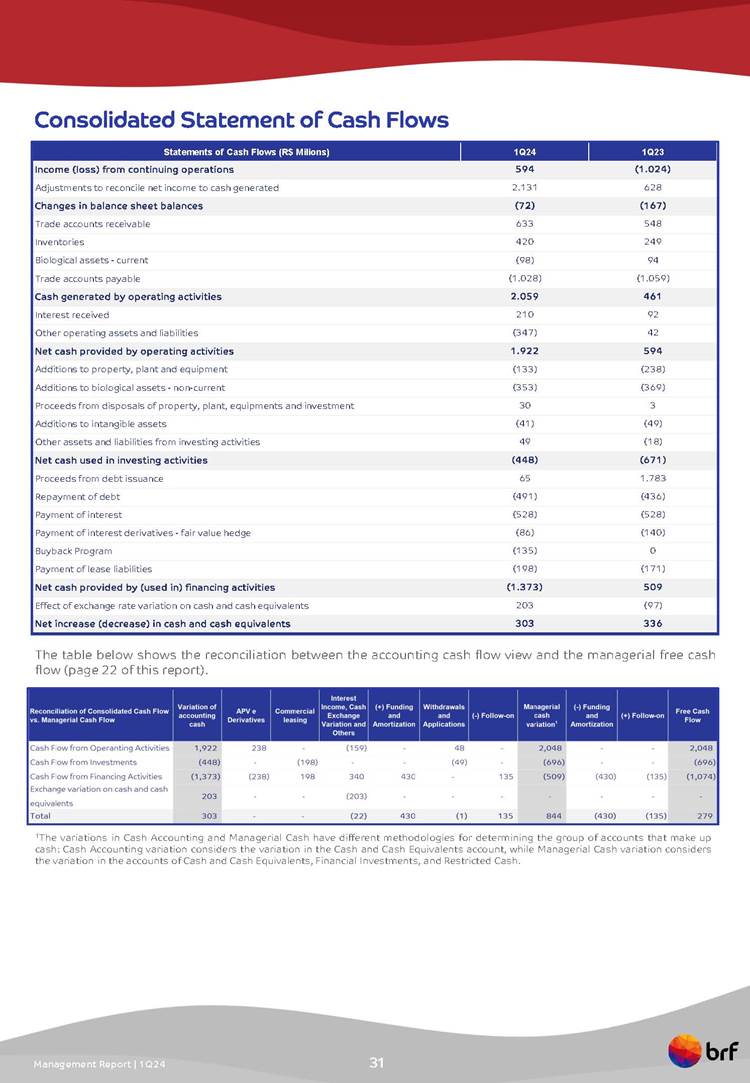
Statements of Cash Flows
| | | Parent company | | Consolidated |
| | | 2024 | | 2023 | | 2024 | | 2023 |
| | | Jan - mar | | Jan - mar | | Jan - mar | | Jan - mar |
| CASH FLOWS FROM OPERATING ACTIVITIES | | | | | | | | |
| Income (loss) from continuing operations | | 504,993 | | (1,034,019) | | 593,744 | | (1,023,627) |
| Adjustments for: | | | | | | | | |
| Depreciation and amortization | | 376,823 | | 337,933 | | 479,465 | | 438,992 |
| Depreciation and depletion of biological assets | | 335,242 | | 319,344 | | 368,066 | | 344,703 |
| Result on disposal of property, plant and equipments and intangible | | (17,715) | | (74,276) | | (17,654) | | (78,372) |
| Provision for tax, civil and labor risks | | 78,432 | | 74,248 | | 77,654 | | 74,373 |
| Income from investments under the equity method | | (898,641) | | 1,023,781 | | 2,407 | | 17 |
| Financial results, net | | 987,340 | | 700,693 | | 537,623 | | 860,071 |
| Deferred income tax | | (10,623) | | (20,718) | | (6,934) | | (20,191) |
| Short-term employee benefits | | 87,188 | | 886 | | 77,626 | | 1,001 |
| Other | | 13,033 | | 15,458 | | 19,149 | | 30,940 |
| | | 1,456,072 | | 1,343,330 | | 2,131,146 | | 627,907 |
| Changes in assets and liabilities: | | | | | | | | |
| Trade accounts and notes receivables | | 1,406,005 | | 1,226,287 | | 633,198 | | 548,105 |
| Inventories | | 412,615 | | 161,641 | | 420,456 | | 249,450 |
| Biological assets - current | | (81,697) | | 100,812 | | (97,633) | | 94,239 |
| Trade accounts payable | | (957,735) | | (1,025,844) | | (1,027,873) | | (1,058,622) |
| Cash generated by operating activities | | 2,235,260 | | 1,806,226 | | 2,059,294 | | 461,079 |
| | | | | | | | | |
| Redemptions (investments) in securities at FVTPL (1) | | 5,839 | | - | | (47,740) | | 7,786 |
| Interest received | | 83,426 | | 65,299 | | 209,655 | | 91,786 |
| Payment of tax, civil and labor provisions | | (76,904) | | (127,081) | | (76,795) | | (127,078) |
| Derivative financial instruments | | (57,077) | | (109,019) | | (60,266) | | (108,268) |
| Other operating assets and liabilities (2) | | (689,052) | | (151,243) | | (162,489) | | 269,109 |
| Net cash provided by operating activities | | 1,501,492 | | 1,484,182 | | 1,921,659 | | 594,414 |
| | | | | | | | | |
| CASH FLOWS FROM INVESTING ACTIVITIES | | | | | | | | |
| Redemption (additions) on investments in securities at amortized cost | | - | | - | | 49,149 | | (17,325) |
| Additions to property, plant and equipment | | (120,860) | | (196,857) | | (133,268) | | (238,084) |
| Additions to biological assets - non-current | | (323,309) | | (338,094) | | (353,242) | | (369,070) |
| Proceeds from disposals of property, plant, equipments and investment | | 29,933 | | 3,262 | | 29,933 | | 3,262 |
| Additions to intangible | | (40,572) | | (48,364) | | (40,896) | | (49,187) |
| Capital increase in affiliates | | - | | (195) | | - | | (195) |
| Capital increase in subsidiaries | | (10,000) | | - | | - | | - |
| Net cash used in investing activities | | (464,808) | | (580,248) | | (448,324) | | (670,599) |
| | | | | | | | | |
| CASH FLOWS FROM FINANCING ACTIVITIES | | | | | | | | |
| Proceeds from debt issuance | | 19,647 | | 734,291 | | 64,867 | | 1,783,263 |
| Repayment of debt | | (404,307) | | (171,732) | | (491,439) | | (435,704) |
| Payment of interest | | (461,358) | | (455,612) | | (527,764) | | (528,255) |
| Payment of interest derivatives - fair value hedge | | (85,737) | | (139,842) | | (85,737) | | (139,842) |
| Treasury shares acquisition | | (135,094) | | - | | (135,094) | | - |
| Payment of lease liabilities | | (154,295) | | (123,500) | | (198,134) | | (170,898) |
| Net cash provided (used in) by financing activities | | (1,221,144) | | (156,395) | | (1,373,301) | | 508,564 |
| | | | | | | | | |
| Effect of exchange rate variation on cash and cash equivalents | | 6,855 | | 177 | | 202,510 | | (96,826) |
| Net increase (decrease) in cash and cash equivalents | | (177,605) | | 747,716 | | 302,544 | | 335,553 |
| Balance at the beginning of the period | | 4,701,549 | | 3,984,071 | | 9,264,664 | | 8,130,929 |
| Balance at the end of the period | | 4,523,944 | | 4,731,787 | | 9,567,208 | | 8,466,482 |
| (1) | FVTPL: Fair Value Through Profit and Loss. |
| (2) | In the Parent Company, contemplates mainly the effects of prepayments of exports with subsidiaries in the amount of R$(310,591) in the three-month period ended March 31, 2024 (R$50,718 in the same period of the previous year). |
The accompanying notes are an integral part of the interim financial information.
(In thousands of Brazilian Reais)
| | Interim Financial Information, Individual and Consolidated | March 31, 2024 |
Statements of Value Added
| | | Parent company | | Consolidated |
| | | 2024 | | 2023 | | 2024 | | 2023 |
| | | Jan-mar | | Jan-mar | | Jan-mar | | Jan-mar |
| 1 - REVENUES | | 12,091,469 | | 13,226,804 | | 14,668,848 | | 14,510,691 |
| Sales of goods and products | | 11,958,760 | | 12,962,161 | | 14,537,515 | | 14,210,378 |
| Other income | | 30,544 | | 77,407 | | 31,358 | | 84,347 |
| Revenue related to construction of own assets | | 118,085 | | 192,781 | | 127,193 | | 222,473 |
| Expected credit losses | | (15,920) | | (5,545) | | (27,218) | | (6,507) |
| 2 - SUPPLIES ACQUIRED FROM THIRD PARTIES | | (8,019,572) | | (9,414,312) | | (9,412,730) | | (11,073,235) |
| Costs of goods sold | | (6,778,089) | | (7,992,831) | | (8,062,617) | | (9,563,444) |
| Materials, energy, third parties services and other | | (1,241,633) | | (1,417,033) | | (1,355,240) | | (1,489,884) |
| Reversal for inventories losses | | 150 | | (4,448) | | 5,127 | | (19,907) |
| 3 - GROSS ADDED VALUE (1-2) | | 4,071,897 | | 3,812,492 | | 5,256,118 | | 3,437,456 |
| 4 - DEPRECIATION AND AMORTIZATION | | (712,065) | | (657,277) | | (847,531) | | (783,695) |
| 5 - NET ADDED VALUE (3-4) | | 3,359,832 | | 3,155,215 | | 4,408,587 | | 2,653,761 |
| | | | | | | | | |
| 6 - VALUE ADDED RECEIVED THROUGH TRANSFER | | 1,094,969 | | (866,167) | | 271,849 | | 198,164 |
| Income from associates and joint ventures | | 898,641 | | (1,023,781) | | (2,407) | | (17) |
| Financial income | | 196,746 | | 157,563 | | 274,674 | | 198,130 |
| Others | | (418) | | 51 | | (418) | | 51 |
| | | | | | | | | |
| 7 - ADDED VALUE TO BE DISTRIBUTED (5+6) | | 4,454,801 | | 2,289,048 | | 4,680,436 | | 2,851,925 |
| | | | | | | | | |
| 8 - DISTRIBUTION OF ADDED VALUE | | 4,454,801 | | 2,289,048 | | 4,680,436 | | 2,851,925 |
| Payroll | | 1,513,376 | | 1,323,130 | | 1,772,107 | | 1,554,326 |
| Salaries | | 1,030,183 | | 953,313 | | 1,256,717 | | 1,157,787 |
| Benefits | | 408,234 | | 298,113 | | 434,349 | | 318,263 |
| Government severance indemnity fund for employees | | 74,959 | | 71,704 | | 81,041 | | 78,276 |
| Taxes, Fees and Contributions | | 1,211,319 | | 1,064,457 | | 1,439,102 | | 1,159,080 |
| Federal | | 494,574 | | 360,472 | | 670,580 | | 402,359 |
| State | | 700,408 | | 690,181 | | 749,668 | | 740,283 |
| Municipal | | 16,337 | | 13,804 | | 18,854 | | 16,438 |
| Capital Remuneration from Third Parties | | 1,225,113 | | 935,480 | | 875,483 | | 1,162,146 |
| Interests, including exchange variation | | 1,193,521 | | 875,277 | | 822,124 | | 1,078,784 |
| Rents | | 31,592 | | 60,203 | | 53,359 | | 83,362 |
| Interest on Own-Capital | | 504,993 | | (1,034,019) | | 593,744 | | (1,023,627) |
| Income (loss) for the period | | 504,993 | | (1,034,019) | | 504,993 | | (1,034,019) |
| Non-controlling interest | | - | | - | | 88,751 | | 10,392 |
The accompanying notes are an integral part of the interim financial information.
(In thousands of Brazilian Reais)
| | Interim Financial Information, Individual and Consolidated | March 31, 2024 |
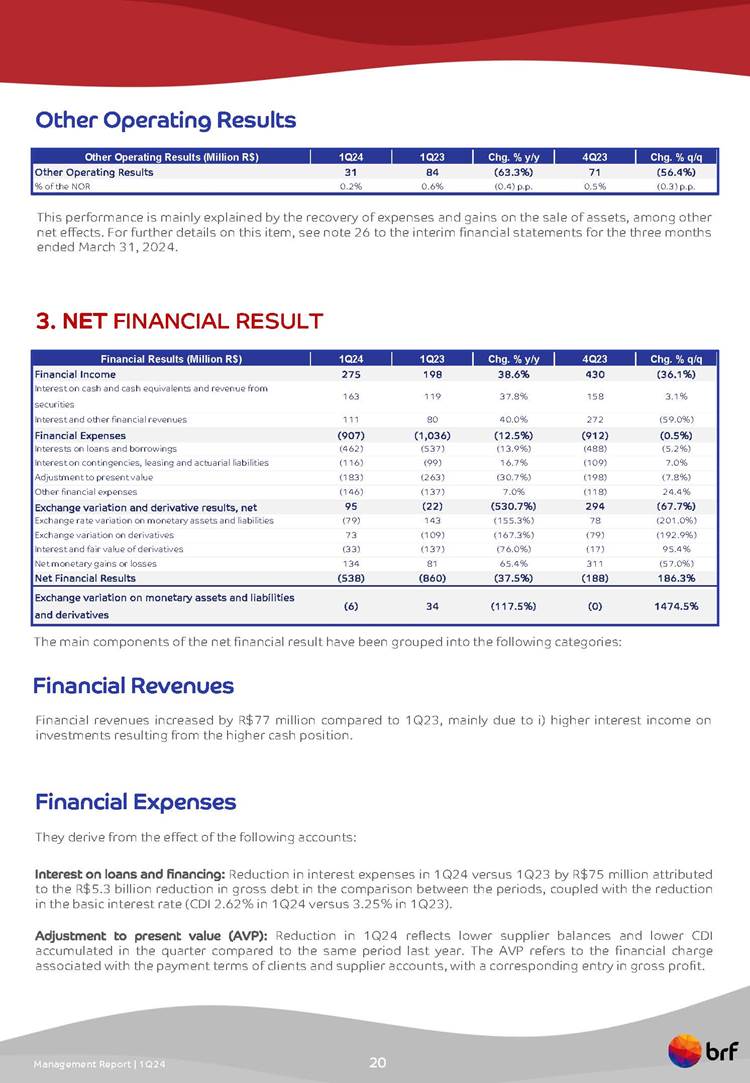
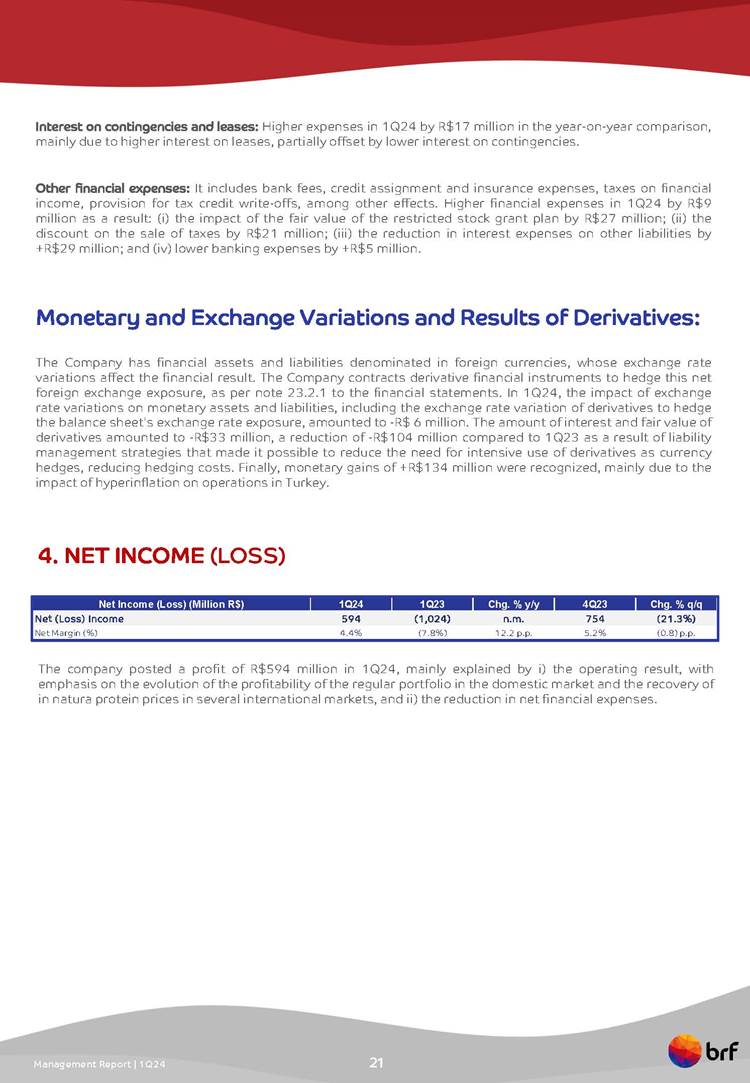
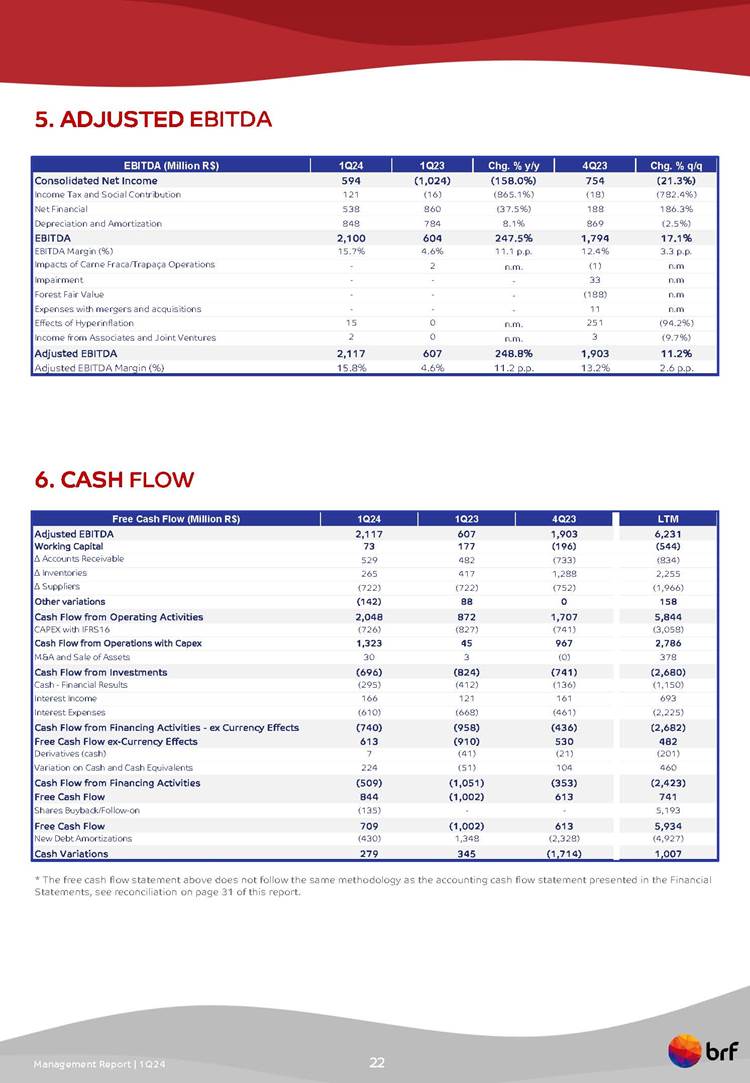
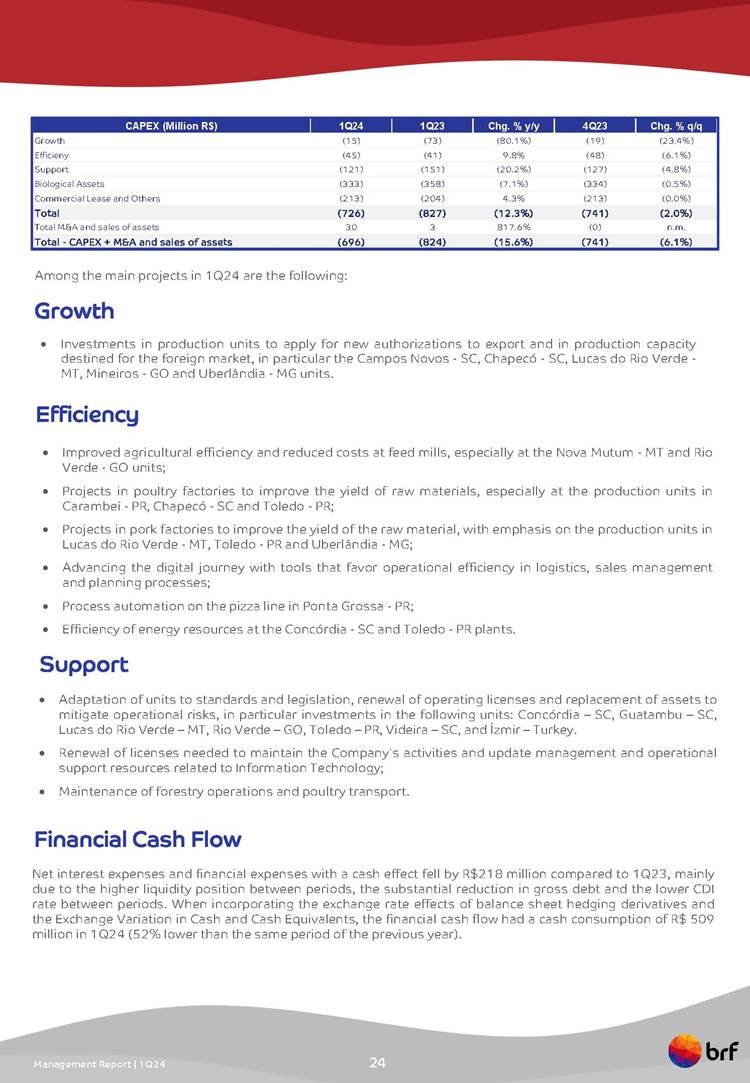
1Q24 RESULTS

| | Interim Financial Information, Individual and Consolidated | March 31, 2024 |
| | Interim Financial Information, Individual and Consolidated | March 31, 2024 |
| | Interim Financial Information, Individual and Consolidated | March 31, 2024 |

| | Interim Financial Information, Individual and Consolidated | March 31, 2024 |
| | Interim Financial Information, Individual and Consolidated | March 31, 2024 |
| | Interim Financial Information, Individual and Consolidated | March 31, 2024 |
| | Interim Financial Information, Individual and Consolidated | March 31, 2024 |

| | Interim Financial Information, Individual and Consolidated | March 31, 2024 |

| | Interim Financial Information, Individual and Consolidated | March 31, 2024 |
| | Interim Financial Information, Individual and Consolidated | March 31, 2024 |

| | Interim Financial Information, Individual and Consolidated | March 31, 2024 |
| | Interim Financial Information, Individual and Consolidated | March 31, 2024 |

| | Interim Financial Information, Individual and Consolidated | March 31, 2024 |

| | Interim Financial Information, Individual and Consolidated | March 31, 2024 |
| | Interim Financial Information, Individual and Consolidated | March 31, 2024 |

| | Interim Financial Information, Individual and Consolidated | March 31, 2024 |
| | Interim Financial Information, Individual and Consolidated | March 31, 2024 |
| | Interim Financial Information, Individual and Consolidated | March 31, 2024 |
| | Interim Financial Information, Individual and Consolidated | March 31, 2024 |
| | Interim Financial Information, Individual and Consolidated | March 31, 2024 |
| | Interim Financial Information, Individual and Consolidated | March 31, 2024 |
| | Interim Financial Information, Individual and Consolidated | March 31, 2024 |

| | Interim Financial Information, Individual and Consolidated | March 31, 2024 |
| | Interim Financial Information, Individual and Consolidated | March 31, 2024 |
| | Interim Financial Information, Individual and Consolidated | March 31, 2024 |
| | Interim Financial Information, Individual and Consolidated | March 31, 2024 |
| | Interim Financial Information, Individual and Consolidated | March 31, 2024 |
| | Interim Financial Information, Individual and Consolidated | March 31, 2024 |
| | Interim Financial Information, Individual and Consolidated | March 31, 2024 |
| | Interim Financial Information, Individual and Consolidated | March 31, 2024 |
| | Interim Financial Information, Individual and Consolidated | March 31, 2024 |

| | Interim Financial Information, Individual and Consolidated | March 31, 2024 |
| | Interim Financial Information, Individual and Consolidated | March 31, 2024 |
| | Interim Financial Information, Individual and Consolidated | March 31, 2024 |
| | Interim Financial Information, Individual and Consolidated | March 31, 2024 |
| | Interim Financial Information, Individual and Consolidated | March 31, 2024 |

| | Interim Financial Information, Individual and Consolidated | March 31, 2024 |

| | Interim Financial Information, Individual and Consolidated | March 31, 2024 |
BRF S.A. (“BRF”), and its subsidiaries (collectively the “Company”) is a publicly traded company, listed on the segment Novo Mercado of Brasil, Bolsa, Balcão (“B3”), under the ticker BRFS3, and listed on the New York Stock Exchange (“NYSE”), under the ticker BRFS. The Company’s registered office is at 475 Jorge Tzachel Street, Fazenda District, Itajaí - Santa Catarina and the main business office is in the city of São Paulo.
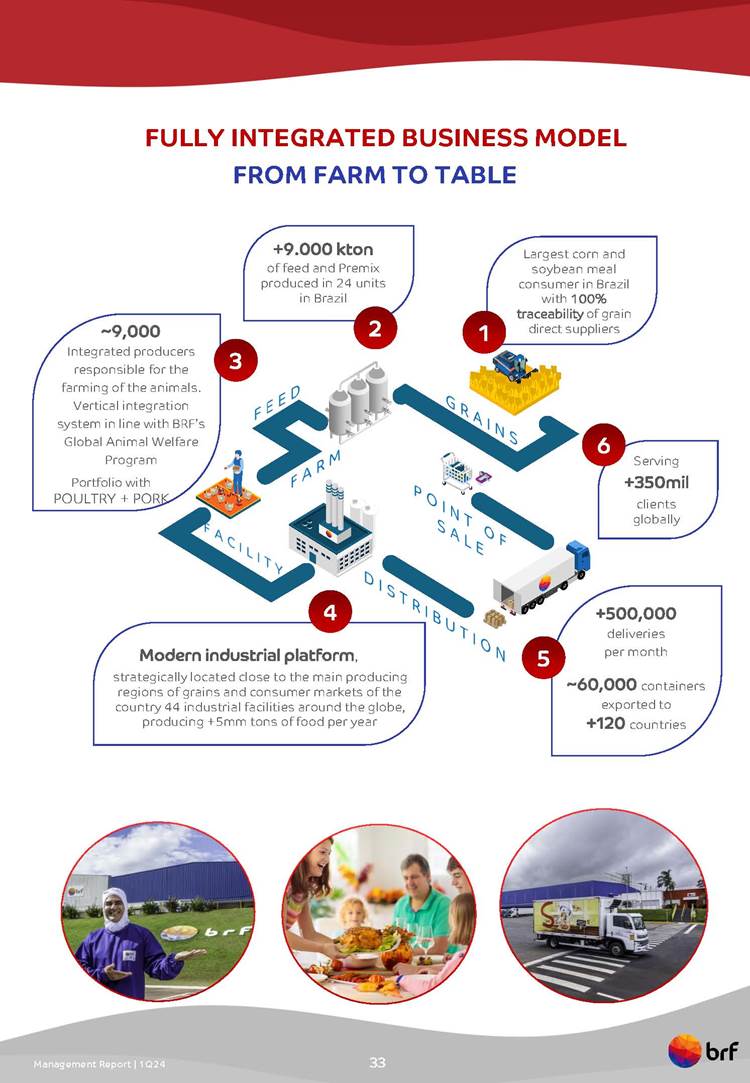
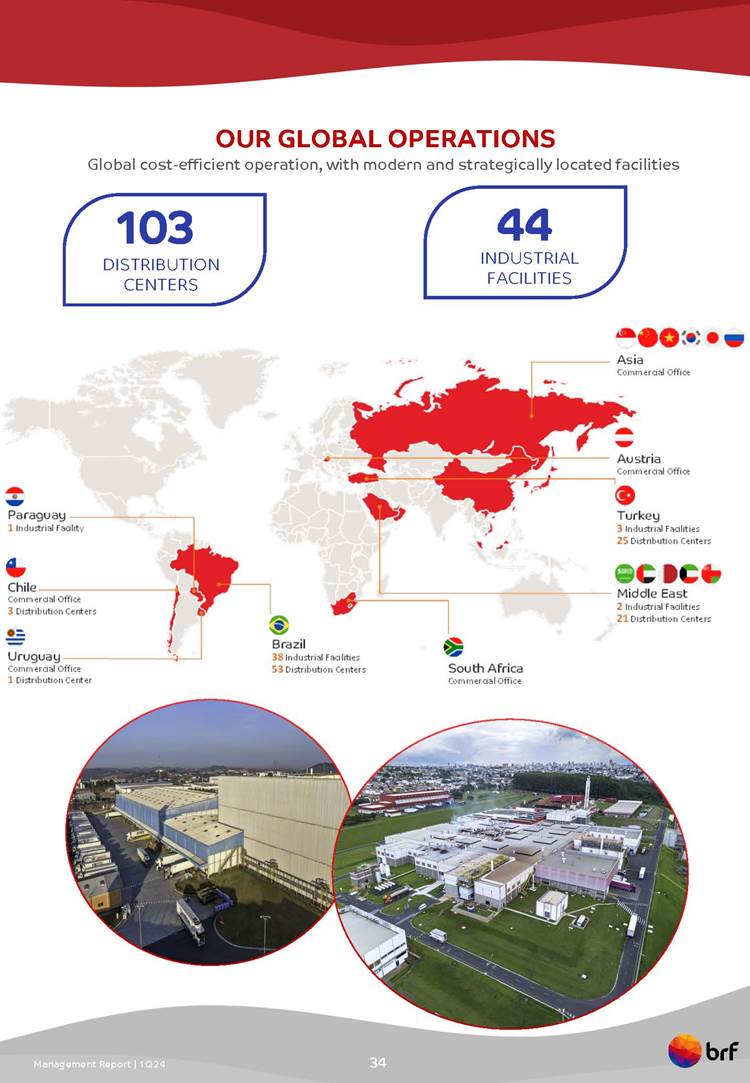
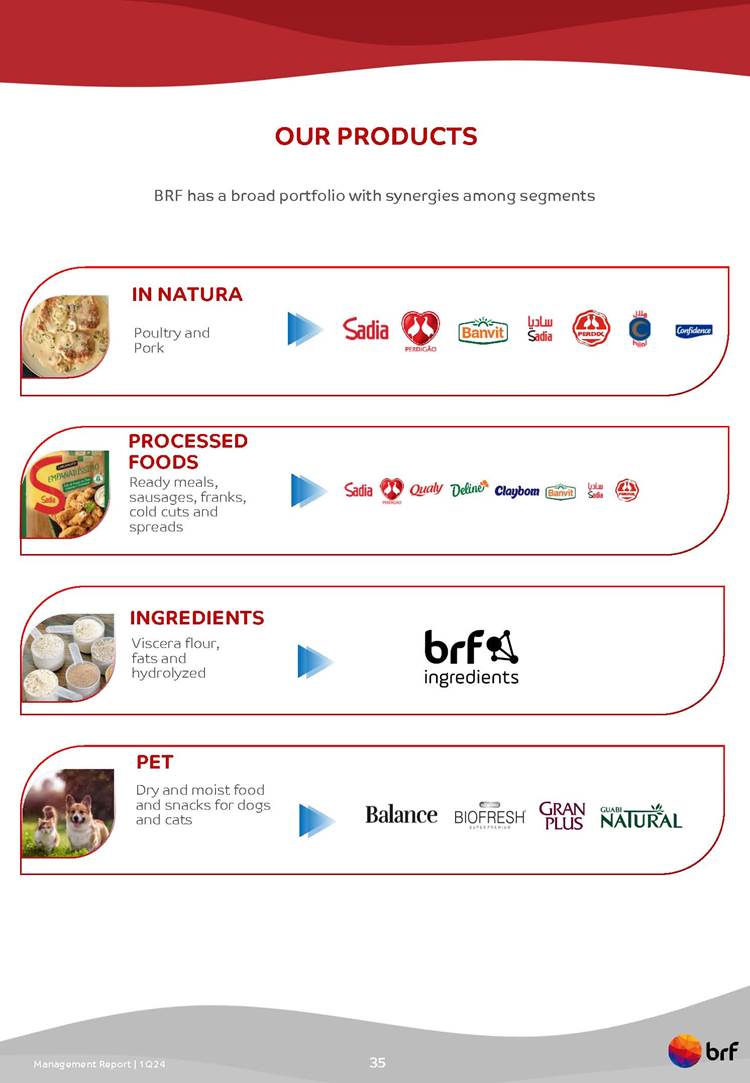
BRF is a Brazilian multinational company, with global presence, which owns a comprehensive portfolio of products, and it is one of the world’s largest companies of food products. The Company operates by raising, producing and slaughtering poultry and pork for processing, production and sale of fresh meat, processed products, pasta, margarine, pet food and others.
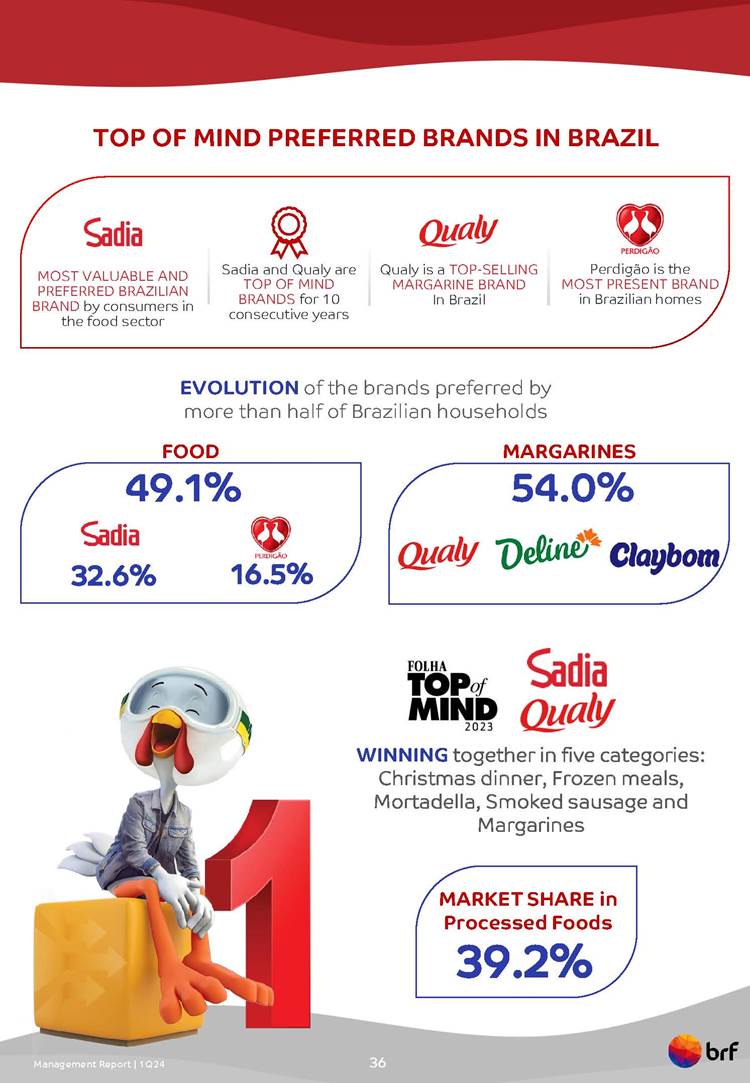
The Company holds as main brands Sadia, Perdigão, Qualy, Chester®, Kidelli, Perdix, Banvit, Biofresh and Gran Plus, present mainly in Brazil, Turkey and Middle Eastern countries.
| | Interim Financial Information, Individual and Consolidated | March 31, 2024 |
| | | | | | | | % equity interest |
| Entity | | | Main activity | | Country (1) | | 03.31.24 | | 12.31.23 |
| Direct subsidiaries | | | | | | | | |
| BRF Energia S.A. | | | Commercialization of eletric energy | | Brazil | | 100.00 | | 100.00 |
| BRF Foods UK Ltd. | | | Administrative and marketing services | | England | | 100.00 | | 100.00 |
| BRF GmbH | | | Holding | | Austria | | 100.00 | | 100.00 |
| BRF Pet S.A. | | | Industrialization, commercialization and distribution of feed and nutrients for animals | | Brazil | | 100.00 | | 100.00 |
| Sadia Alimentos S.A. | | | Holding | | Argentina | | 100.00 | | 100.00 |
| Sadia Uruguay S.A. | | | Import and commercialization of products | | Uruguay | | 100.00 | | 100.00 |
| Vip S.A. Empreendimentos e Participações Imobiliárias | (f) | | Commercialization of owned real state | | Brazil | | - | | 100.00 |
| | | | | | | | | | |
| Indirect subsidiaries | | | | | | | | | |
| Al Khan Foodstuff LLC ("AKF") | (b) | | Import, commercialization and distribution of products | | Oman | | 70.00 | | 70.00 |
| Al-Wafi Al-Takamol International for Foods Products | | | Import and commercialization of products | | Saudi Arabia | | 100.00 | | 100.00 |
| Al-Wafi Food Products Factory LLC | | | Import, export, industrialization and commercialization of products | | UAE | | 100.00 | | 100.00 |
| Badi Ltd. | | | Holding | | UAE | | 100.00 | | 100.00 |
| Banvit Bandirma Vitaminli | | | Import, industrialization and commercialization of products | | Turkey | | 91.71 | | 91.71 |
| Banvit Enerji ve Elektrik Üretim Ltd. Sti. | (a) | | Generation and commercialization of electric energy | | Turkey | | 100.00 | | 100.00 |
| BRF Arabia Holding Company | | | Holding | | Saudi Arabia | | 70.00 | | 70.00 |
| BRF Foods GmbH | (g) | | Industrialization, import and commercialization of products | | Austria | | 100.00 | | 100.00 |
| BRF Foods LLC | (d) | | Import, industrialization and commercialization of products | | Russia | | - | | 100.00 |
| BRF Global Company Nigeria Ltd. | | | Marketing and logistics services | | Nigeria | | 100.00 | | 100.00 |
| BRF Global Company South Africa Proprietary Ltd. | | | Administrative, marketing and logistics services | | South Africa | | 100.00 | | 100.00 |
| BRF Global GmbH | | | Holding and trading | | Austria | | 100.00 | | 100.00 |
| BRF Investimentos Ltda. | | | Holding, management of companies and assets | | Brazil | | 100.00 | | 100.00 |
| BRF Japan KK | | | Marketing and logistics services, import, export, industrialization and commercialization of products | | Japan | | 100.00 | | 100.00 |
| BRF Korea LLC | | | Marketing and logistics services | | Korea | | 100.00 | | 100.00 |
| BRF Kuwait Food Management Company WLL | (b) | | Import, commercialization and distribution of products | | Kuwait | | 49.00 | | 49.00 |
| BRF Shanghai Management Consulting Co. Ltd. | | | Provision of consultancy and marketing services | | China | | 100.00 | | 100.00 |
| BRF Shanghai Trading Co. Ltd. | | | Import, export and commercialization of products | | China | | 100.00 | | 100.00 |
| BRF Singapore Foods PTE Ltd. | | | Administrative, marketing and logistics services | | Singapore | | 100.00 | | 100.00 |
| Buenos Aires Fortune S.A. | (e) | | Holding | | Argentina | | - | | 100.00 |
| Eclipse Holding Cöoperatief U.A. | | | Holding | | The Netherlands | | 100.00 | | 100.00 |
| Eclipse Latam Holdings | | | Holding | | Spain | | 100.00 | | 100.00 |
| Federal Foods LLC | (b) | | Import, commercialization and distribution of products | | UAE | | 49.00 | | 49.00 |
| Federal Foods Qatar | (b) | | Import, commercialization and distribution of products | | Qatar | | 49.00 | | 49.00 |
| Hercosul Alimentos Ltda. | | | Manufacturing and sale of animal feed | | Brazil | | 100.00 | | 100.00 |
| Hercosul Distribuição Ltda. | | | Import, export, wholesale and retail sale of food products for animals | | Brazil | | 100.00 | | 100.00 |
| Hercosul International S.R.L. | | | Manufacturing, export, import and sale of feed and nutrients for animals | | Paraguay | | 100.00 | | 100.00 |
| Hercosul Soluções em Transportes Ltda. | | | Road freight | | Brazil | | 100.00 | | 100.00 |
| Joody Al Sharqiya Food Production Factory LLC | | | Import and commercialization of products | | Saudi Arabia | | 100.00 | | 100.00 |
| Mogiana Alimentos S.A. | | | Manufacturing, distribution and sale of Pet Food products | | Brazil | | 100.00 | | 100.00 |
| Nutrinvestments BV | (a) | | Holding | | The Netherlands | | 100.00 | | 100.00 |
| One Foods Holdings Ltd. | | | Holding | | UAE | | 100.00 | | 100.00 |
| Perdigão Europe Lda. | (h) | | Import, export of products and administrative services | | Portugal | | 100.00 | | 100.00 |
| ProudFood Lda. | | | Import and commercialization of products | | Angola | | 100.00 | | 100.00 |
| PSA Laboratório Veterinário Ltda. | (f) | | Veterinary activities | | Brazil | | - | | 100.00 |
| Sadia Chile S.A. | | | Import, export and commercialization of products | | Chile | | 100.00 | | 100.00 |
| TBQ Foods GmbH | | | Holding | | Austria | | 60.00 | | 60.00 |
| | | | | | | | | | |
| Affiliated | | | | | | | | | |
| Potengi Holdings S.A. | (c) | | Holding | | Brazil | | 50.00 | | 50.00 |
| PR-SAD Administração de bem próprio S.A. | | | Management of assets | | Brazil | | 33.33 | | 33.33 |
| (1) | UAE – United Arab Emirates. |
| (a) | Dormant subsidiaries. The Company is evaluating the liquidation of these subsidiaries. |
| (b) | For these entities, the Company has agreements that ensure full economic rights, except for AKF, in which the economic rights are of 99%. |
| (c) | Affiliate with subsidiary of AES Brasil Energia S.A. in which the economic participation is 24% (note 12). |
| (d) | On January 15, 2024 the subsidiary BRF Foods LLC was dissolved. |
| (e) | On March 19, 2024 the subsidiary Buenos Aires Fortune S.A. was dissolved. |
| (f) | On March 28, 2024 the subsidiaries VIP S.A. Empreendimentos e Participações Imobiliárias e a PSA Laboratório Veterinário Ltda. were incorporated by BRF S.A. |
| (g) | The BRF Foods GMBH, an Austrian company, had a branch located in the UAE, which, on April 05, 2024 was converted into a limited company entity, called BRF Foods LLC. |
| (h) | On April 29, 2024 the subsidiary Perdigão Europe Lda. was dissolved. |
| | Interim Financial Information, Individual and Consolidated | March 31, 2024 |
Except for the associates PR-SAD Administração de bem próprio S.A. and Potengi Holdings S.A., in which the Company recognizes the investments by the equity method, all other entities presented in the table above are consolidated.
During the months of November and December of each year, the Company is impacted by seasonality in the Brazil operating segment due to Christmas and New Year’s Celebrations. The products that are relevant contributors are: turkey, Chester®, ham and pork cuts (hind leg/pork loin).
In the International operating segment, seasonality is due to Ramadan, which is the holy month of the Muslim calendar. The beginning of Ramadan depends on the beginning of the moon cycle and in 2024 occurred between, March 10, 2024 and April 8, 2024.
| 2. | Basis of preparation and presentation of interim financial information |
The Parent Company’s and Consolidated interim financial information were prepared in accordance with i) the accounting practices adopted in Brazil, which include those included in Brazilian corporate legislation and the pronouncements, guidelines and technical interpretations issued by the Accounting Pronouncements Committee - ("CPC”) and approved by the Board Federal Accounting – (“CFC”) and the Securities and Exchange Commission – (“CVM”), in accordance with the CPC 21 (R1) – Interim Financial Statements, and ii) international financial reporting standards (“IFRS”), IAS 34 – Interim Financial Reporting, issued by International Accounting Standards Board (“IASB”). All the relevant information applicable to the financial statements, and only them, are being evidenced and correspond to those used by administration in its management.
The Parent Company’s and Consolidated interim financial information are expressed in thousands of Brazilian Reais (“R$”), unless otherwise stated. For disclosures of amounts in other currencies, the values are also expressed in thousands, unless otherwise stated.
The preparation of the Parent Company’s and Consolidated interim financial information require Management to make judgments, use estimates and adopt assumptions that affect the reported amounts of revenues, expenses, assets and liabilities, as well as the disclosures of contingent liabilities. The uncertainty inherent to these judgments, assumptions and estimates could result in material adjustments to the carrying amount of certain assets and liabilities in future periods.
Any judgments, estimates and assumptions are reviewed at each reporting period.
The Parent Company’s and Consolidated interim financial information were prepared based on the recoverable historical cost, except for the items maintained at fair value as described in note 3.2 of the Financial Statements for the year ended on December 31, 2023.
The Company prepared Parent Company’s and Consolidated interim financial information under the going concern assumption and disclosed all relevant information in its explanatory notes, in order to clarify and complement the accounting basis adopted.
| | Interim Financial Information, Individual and Consolidated | March 31, 2024 |
| 3. | Summary of material accounting policies |
The Consolidated interim financial information, in this case quarterly financial information, aim to provide updated information based on the last annual financial statements disclosed. Therefore, the quarterly financial information focus on new activities, events and circumstances and do not repeat the information previously disclosed, except when Management judges that the maintenance of the information is relevant.
The interim financial information was prepared based on the accounting policies and estimates calculation methodologies adopted in the preparation of the annual financial statements for the year ended December 31, 2023 (note 3), on a uniform basis for all group entities.
The Company has subsidiaries in Argentina and in Turkey, which are considered a hyperinflationary economy.
For the Turkish subsidiary the price index used for the period ended March 31, 2024 was 15.1%, and the inflation adjustment affected the Income (Loss) before financial results and income taxes in R$(47,602) (R$(19,333) in the same period of the previous year), and we recognized a revenue that impacted the Financial Result in the amount of R$ R$137,752 (R$83,989 in the same period of the previous year) and the Loss from continuing operations in the amount of R$53,028 (R$28,984 in the same period of the previous year).
For the subsidiary in Argentina the price index used for the period ended March 31, 2024 was 36.2%, and the inflation adjustment affected the inflation adjustment impacted the Income (Loss) before financial results and income taxes in the amount of R$(289) (R$5 in the same period of the previous year), the Financial Result in the amount of R$(3,915) (R$(3,055) in the same period of the previous year) and the Loss from continuing operations in the amount of R$(4,586) (R$(2,125) in the same period of the previous year).
| 3.1. | Standards issued but not yet effective |
On May 25, 2023 the IASB published amendments to IAS 7/CPC 03 - Statement of cash flows and IFRS 7/CPC 40 - Financial Instruments: Disclosure, which establish new disclosure requirements for financing operations with suppliers (supply chain finance). Such requirements must be adopted by the Company from the year 2024 onwards, however, no additional presentation is required in the interim financial statements in the first year of adoption of the implemented changes. The Company is evaluating the impacts arising from these changes.
| | Interim Financial Information, Individual and Consolidated | March 31, 2024 |
| 4. | Cash and cash equivalents |
| | Average rate (1) | | Parent company | | Consolidated |
| | | 03.31.24 | | 12.31.23 | | 03.31.24 | | 12.31.23 |
| Cash and bank accounts | | | | | | | | | |
| Brazilian reais | - | | 173,202 | | 145,200 | | 184,740 | | 160,310 |
| Saudi riyal | - | | - | | - | | 363,431 | | 307,151 |
| U.S. dollar | - | | 2,113 | | 99,828 | | 522,222 | | 768,868 |
| Euro | - | | 2,401 | | 1,392 | | 28,786 | | 24,506 |
| Turkish lira | - | | - | | - | | 106,951 | | 93,641 |
| Other currencies | - | | 45 | | 124 | | 363,574 | | 252,781 |
| | | | 177,761 | | 246,544 | | 1,569,704 | | 1,607,257 |
| Cash equivalents | | | | | | | | | |
| In Brazilian reais | | | | | | | | | |
| Investment funds | 10.65% | | 4,327 | | 4,676 | | 4,327 | | 4,676 |
| Bank deposit certificates | 10.78% | | 4,318,422 | | 4,438,970 | | 4,630,438 | | 4,876,861 |
| | | | 4,322,749 | | 4,443,646 | | 4,634,765 | | 4,881,537 |
| In U.S. Dollar | | | | | | | | | |
| Term deposit | 5.77% | | - | | - | | 2,343,320 | | 2,069,531 |
| Overnight | 5.35% | | 23,434 | | 11,359 | | 232,467 | | 17,570 |
| Other currencies | | | | | | | | | |
| Term deposit (Saudi riyal) | 6.15% | | - | | - | | 641,002 | | 612,110 |
| Term deposit (2) | | | - | | - | | 145,950 | | 76,659 |
| | | | 23,434 | | 11,359 | | 3,362,739 | | 2,775,870 |
| | | | 4,523,944 | | 4,701,549 | | 9,567,208 | | 9,264,664 |
| (1) | Weighted average annual rate. |
| (2) | Amounts are substantially denominated in Turkish Lira (TRY) at a weighted average annual rate of 50.29% (43.00% on December 31, 2023). |
| | | | | | Average rate (2) | | Parent company | | Consolidated |
| | WAM (1) | | Currency | | | 03.31.24 | | 12.31.23 | | 03.31.24 | | 12.31.23 |
| Fair value through other comprehensive income | | | | | | | | | | | | | |
| Equity securities (3) | - | | USD | | - | | - | | - | | 12,491 | | 12,103 |
| Fair value through profit and loss | | | | | | | | | | | | | |
| Financial treasury bills | 0.54 | | R$ | | 12.36% | | 422,925 | | 412,107 | | 422,925 | | 412,107 |
| Investment funds - FIDC II | 1.08 | | R$ | | - | | 18,237 | | 16,490 | | 18,237 | | 16,490 |
| Repurchase agreement | 0.05 | | R$ | | 9.59% | | - | | - | | 46,570 | | 35,751 |
| Other | 0.08 | | R$ | | - | | - | | - | | 20 | | 20 |
| | | | | | | | 441,162 | | 428,597 | | 487,752 | | 464,368 |
| Amortized cost | | | | | | | | | | | | | |
| Sovereign bonds and other (4) | 2.48 | | AOA | | | | - | | - | | 241,516 | | 291,402 |
| | | | | | | | 441,162 | | 428,597 | | 741,759 | | 767,873 |
| Current | | | | | | | 422,925 | | 412,107 | | 469,515 | | 447,878 |
| Non-current (5) | | | | | | | 18,237 | | 16,490 | | 272,244 | | 319,995 |
| (1) | Weighted average maturity in years. |
| | Interim Financial Information, Individual and Consolidated | March 31, 2024 |
| (2) | Weighted average annual rate. |
| (3) | It’s comprised of Aleph Farms Ltd. stocks. |
| (4) | It’s comprised of private securities and sovereign securities of the Angola Government and are presented net of expected credit losses in the amount of R$12,204 (R$16,466 on December 31, 2023). Amounts are substantially denominated in Angolan kwanza (AOA) and correspond to Time Deposit at a weighted average annual rate of 10.84% (11,75% Time Deposit and 16,50% Bonds on December 31, 2023). They also include marketable securities indexed to the U.S. Dollar at a weighted average annual rate of 7.21% and Bonds in U.S. Dollar at a weighted average annual rate of 5.90% (U.S. Dollar 6.34% and Bonds in U.S. Dollar 5.90% on December 31, 2023) |
| (5) | Maturity until March of 2026. |
On March 31, 2024, the amount of R$14,198 (R$9,179 on December 31, 2023) classified as cash and cash equivalents and marketable securities were pledged as guarantee, with no use restrictions, for future contracts traded on B3.
| 6. | Trade accounts and notes receivable |
| | | Parent company | | Consolidated |
| | | 03.31.24 | | 12.31.23 | | 03.31.24 | | 12.31.23 |
| Trade accounts receivable | | | | | | | | |
| Domestic market | | | | | | | | |
| Third parties | | 859,916 | | 1,729,067 | | 998,297 | | 1,860,089 |
| Related parties | | 30,959 | | 24,339 | | 7,818 | | 8,419 |
| Foreign market | | | | | | | | |
| Third parties | | 731,096 | | 764,750 | | 3,892,009 | | 3,496,442 |
| Related parties | | 3,249,760 | | 3,713,478 | | 47,085 | | 27,781 |
| | | 4,871,731 | | 6,231,634 | | 4,945,209 | | 5,392,731 |
| ( - ) Adjustment to present value | | (14,510) | | (22,692) | | (24,025) | | (29,284) |
| ( - ) Expected credit losses | | (574,308) | | (547,078) | | (631,406) | | (591,479) |
| | | 4,282,913 | | 5,661,864 | | 4,289,778 | | 4,771,968 |
| Current | | 4,276,970 | | 5,655,967 | | 4,281,896 | | 4,766,071 |
| Non-current | | 5,943 | | 5,897 | | 7,882 | | 5,897 |
| | | | | | | | | |
| | | | | | | | | |
| Notes receivable | | 81,739 | | 83,863 | | 81,739 | | 83,863 |
| ( - ) Adjustment to present value | | (6,832) | | (2,223) | | (6,832) | | (2,223) |
| ( - ) Expected credit losses | | (15,356) | | (15,379) | | (15,356) | | (15,379) |
| | | 59,551 | | 66,261 | | 59,551 | | 66,261 |
| Current | | 37,499 | | 64,731 | | 37,499 | | 64,731 |
| Non-current (1) | | 22,052 | | 1,530 | | 22,052 | | 1,530 |
| (1) | On March 31, 2024, the weighted average maturity is 2.23 year. |
The Company has insurance for trade accounts receivable from exports in the amount of R$1,282,526 (R$1,003,891 on December 31, 2023).
The Company performs credit assignments with no right of return to the BRF Clients’ Credit Rights Investment Fund (“FIDC BRF II”), which has the sole purpose to acquire credit rights arising from commercial transactions carried out between the Company and its clients in Brazil.
| | Interim Financial Information, Individual and Consolidated | March 31, 2024 |
On March 31, 2024, FIDC BRF II has an outstanding balance of R$889,002 (R$1,072,964 on December 31, 2023) related to such credit rights, which were ceased to be recognized of the Company’s statement of financial position when the credits were sold.
On March 31, 2024, other receivables are mainly represented by receivables from the sale of farms and various properties not linked to production.
The movements of the expected credit losses are presented below:
| Parent company | | Consolidated |
| | 03.31.24 | | | 03.31.24 | |
| Beginning balance | (547,078) | | | (591,479) | |
| (Additions) reversals | (15,920) | | | (27,218) | |
| Write-offs | 1,136 | | | 808 | |
| Exchange rate variation | (12,446) | | | (13,517) | |
| Ending balance | (574,308) | | | (631,406) | |
The aging of trade accounts receivable is as follows:
| | Parent company | | Consolidated |
| | 03.31.24 | | 12.31.23 | | 03.31.24 | | 12.31.23 |
| Not overdue | 4,145,494 | | 5,532,133 | | 4,024,203 | | 4,515,445 |
| Overdue | | | | | | | |
| 01 to 60 days | 99,888 | | 115,871 | | 212,753 | | 225,135 |
| 61 to 90 days | 33,687 | | 39,584 | | 45,033 | | 46,347 |
| 91 to 120 days | 29,528 | | 4,558 | | 40,322 | | 15,248 |
| 121 to 180 days | 11,476 | | 5,803 | | 19,006 | | 11,101 |
| 181 to 360 days | 13,722 | | 12,665 | | 25,015 | | 22,116 |
| More than 360 days | 537,936 | | 521,020 | | 578,877 | | 557,339 |
| ( - ) Adjustment to present value | (14,510) | | (22,692) | | (24,025) | | (29,284) |
| ( - ) Expected credit losses | (574,308) | | (547,078) | | (631,406) | | (591,479) |
| | 4,282,913 | | 5,661,864 | | 4,289,778 | | 4,771,968 |
| | Parent company | | Consolidated |
| | 03.31.24 | | 12.31.23 | | 03.31.24 | | 12.31.23 |
| Finished goods | 2,266,770 | | 1,988,163 | | 3,915,599 | | 3,564,379 |
| Work in progress | 332,262 | | 340,780 | | 375,530 | | 378,788 |
| Raw materials | 924,532 | | 1,521,744 | | 1,061,674 | | 1,675,323 |
| Packaging materials | 108,691 | | 112,232 | | 145,463 | | 150,444 |
| Secondary materials | 470,551 | | 503,613 | | 510,864 | | 546,213 |
| Supplies | 141,897 | | 150,298 | | 211,070 | | 216,998 |
| Imports in transit | 112,244 | | 150,514 | | 113,216 | | 150,947 |
| Other | 49,994 | | 75,679 | | 49,964 | | 75,646 |
| (-) Adjustment to present value (1) | (101,865) | | (125,483) | | (106,848) | | (129,848) |
| | 4,305,076 | | 4,717,540 | | 6,276,532 | | 6,628,890 |
| | Interim Financial Information, Individual and Consolidated | March 31, 2024 |
| (1) | The adjustment refers to the counter-entry of the adjustment of present value from trade accounts payable and is carried out for cost according to inventories turnover. |
The movements of estimated losses for realizable value of inventories accrual, for which the additions, reversals and write-offs were recorded against Cost of Sales, are presented in the table below:
| | Parent company |
| | | | | | | | | | | 03.31.24 |
| | Realizable value through sale | | Impaired inventories | | Obsolete inventories | | Total |
| Beginning balance | (23,315) | | | (13,262) | | | (5,375) | | | (41,952) |
| Additions | (12,650) | | | (14,117) | | | (1,777) | | | (28,544) |
| Reversals | 13,441 | | | - | | | - | | | 13,441 |
| Write-offs | - | | | 14,311 | | | 942 | | | 15,253 |
| Ending balance | (22,524) | | | (13,068) | | | (6,210) | | | (41,802) |
| | Consolidated |
| | | | | | | | | | | 03.31.24 | |
| | Realizable value through sale | | Impaired inventories | | Obsolete inventories | | Total |
| Beginning balance | (26,308) | | | (22,981) | | | (8,232) | | | (57,521) | |
| Additions | (15,112) | | | (16,370) | | | (2,777) | | | (34,259) | |
| Reversals | 17,374 | | | - | | | - | | | 17,374 | |
| Write-offs | - | | | 20,482 | | | 1,770 | | | 22,252 | |
| Exchange rate variation | (81) | | | (95) | | | (64) | | | (240) | |
| Ending balance | (24,127) | | | (18,964) | | | (9,303) | | | (52,394) | |
| | Interim Financial Information, Individual and Consolidated | March 31, 2024 |
The live animals are represented by poultry and pork and segregated into consumables and animals for production. The rollforward of the biological assets are presented below:
| | Parent company |
| | | | | | | | 03.31.24 |
| | Current | | Non-current |
| | Live animals | | | | | | |
| | Total | | Live animals | | Forests | | Total |
| Beginning balance | 2,580,383 | | 1,245,285 | | 543,098 | | 1,788,383 |
| Additions/Transfer | 5,747,078 | | 146,236 | | 20,894 | | 167,130 |
| Changes in fair value | 818,059 | | (110,929) | | - | | (110,929) |
| Harvest | - | | - | | (12,669) | | (12,669) |
| Write-off | - | | - | | (493) | | (493) |
| Transfer between current and non-current | 54,905 | | (54,905) | | - | | (54,905) |
| Transfer to inventories | (6,538,345) | | - | | - | | - |
| Ending balance | 2,662,080 | | 1,225,687 | | 550,830 | | 1,776,517 |
| | | | | | | | |
| | | | | | | | |
| | Consolidated |
| | | | | | | | 03.31.24 |
| | Current | | Non-current |
| | Live animals | | | | | | |
| | Total | | Live animals | | Forests | | Total |
| | 03.31.24 | | 03.31.24 | | 03.31.24 | | 03.31.24 |
| Beginning balance | 2,702,164 | | 1,315,219 | | 543,098 | | 1,858,317 |
| Additions/Transfer | 6,225,090 | | 158,950 | | 20,894 | | 179,844 |
| Changes in fair value | 913,657 | | (126,462) | | - | | (126,462) |
| Harvest | - | | - | | (12,669) | | (12,669) |
| Write-off | - | | - | | (493) | | (493) |
| Transfer between current and non-current | 54,977 | | (54,977) | | - | | (54,977) |
| Transfer to inventories | (7,096,092) | | - | | - | | - |
| Exchange variation | (7,331) | | (4,683) | | - | | (4,683) |
| Monetary correction by Hyperinflation | 2,728 | | 21,913 | | - | | 21,913 |
| Ending balance | 2,795,193 | | 1,309,960 | | 550,830 | | 1,860,790 |
The change in the biological assets includes depreciation of breeders and depletion of forests in the amount of R$335,242 in the Parent Company and R$368,066 in the Consolidated (R$319,344 in the Parent Company and R$344,703 in the Consolidated in the same period of the previous year).
The estimated quantities of live animals on March 31, 2024 are 181,526 thousand head of poultry and 4,895 thousand head of pork at the Parent Company (177,143 thousand head of poultry and 4,866 thousand head of pork on December 31, 2023). In the Consolidated, there are 202,710 thousand heads of poultry and 4,895 thousand heads of pork (198,729 thousand heads of poultry and 4,866 thousand heads of pork on December 31, 2023).
The Company has forests pledged as collateral for financing and tax and civil contingencies on March 31, 2024 in the amount of R$113,201 in the Parent Company and in the Consolidated (R$71,399 in the Parent Company and in the Consolidated on December 31, 2023).
| | Interim Financial Information, Individual and Consolidated | March 31, 2024 |
| | Parent company | | Consolidated |
| | 03.31.24 | | 12.31.23 | | 03.31.24 | | 12.31.23 |
| Recoverable ICMS and VAT | 1,815,693 | | 1,895,852 | | 2,157,221 | | 2,089,543 |
| Recoverable PIS and COFINS | 2,382,526 | | 2,451,146 | | 2,393,182 | | 2,461,807 |
| Recoverable IPI | 1,118,657 | | 1,092,729 | | 1,120,399 | | 1,094,466 |
| Recoverable INSS | 403,901 | | 485,084 | | 403,913 | | 485,096 |
| Recoverable income taxes | 294,168 | | 316,992 | | 399,788 | | 437,103 |
| Other recoverable taxes | 91,748 | | 89,193 | | 92,698 | | 90,136 |
| (-) Impairment | (143,082) | | (139,590) | | (143,388) | | (139,863) |
| | 5,963,611 | | 6,191,406 | | 6,423,813 | | 6,518,288 |
| | | | | | | | |
| Current | 1,285,826 | | 1,210,028 | | 1,727,753 | | 1,517,548 |
| Non-current | 4,677,785 | | 4,981,378 | | 4,696,061 | | 5,000,740 |
| 9.1. | ICMS – tax on movement of goods and services and VAT – value added taxes |
As result of the activity, the Company generates recoverable ICMS balances that are offset against ICMS payables arising from sales in the domestic market or that are transferred to third parties.
The Company has recoverable ICMS balances in the States of Paraná, Santa Catarina, Mato Grosso do Sul, Minas Gerais and Amazonas, which will be realized in the short and long term, based on the recoverability study reviewed and approved by the Management.
In other jurisdictions outside Brazil, value added taxes (VAT) are due in regular operations of the Company with goods and services, with expectations of achievement in the short and long term.
| 9.2. | PIS and COFINS – social integration plan and contribution for social security |
The accumulated recoverable PIS and COFINS balances arise from taxes on raw material purchases subsequently used in the production of exported products or products for which sale is not taxed, as well as recoverable taxes on commercial and labor expenses. The realization of these balances usually occurs through the offsetting with taxes payable on sales of taxed products in the domestic market, with other federal taxes and social security contributions payable, or even, if applicable, through refund or reimbursement requests.
As of March 31, 2024, the updated balance of the processes related to the exclusion of the ICMS from the PIS and COFINS calculation basis recognized by the Company is R$1,919,804 (R$2,013,799 as of March 31, 2023). The monetary update of balances is recognized against Net financial income (expenses).
| | Interim Financial Information, Individual and Consolidated | March 31, 2024 |
| 9.3. | IPI – industrialized product tax |
The Company recognized tax assets as result of gains from lawsuits related to IPI, specially “crédito prêmio”. The balance referring to these assets in the Parent Company and Consolidated on March 31, 2024 is R$1,144,659 (R$1,110,006 for the year ended December 31, 2023), of which R$1,112,108 (R$1,087,749 for the year ended December 31, 2023) is recorded as Recoverable Taxes and the remainder, referring to cases in which the government will reimburse in cash, is recorded as Other Non-Current Assets, in the amount of R$32,551 (R$22,257 for the year ended December 31, 2023). The monetary update of balances is recognized against Net financial income (expenses).
The accumulated recoverable income taxes arise, mostly, from withholding taxes on securities, interest and prepayments of income tax and social contribution in Brazil. The realization occurs through the offset with federal taxes and contributions payable.
| 9.5. | Realization of Brazilian federal tax credits |
The Company used PIS, COFINS, IPI, and other recoverable taxes to offset federal taxes payable such as INSS, Income Taxes and other in the amount of R$379,328 in the Parent Company and Consolidated for the three-month period ended on March 31, 2024 (R$374,623 in the Parent Company and Consolidated in the same period of the previous year), preserving its liquidity and optimizing its capital structure.
| | Interim Financial Information, Individual and Consolidated | March 31, 2024 |
| | Parent company | | Consolidated |
| | 03.31.24 | | 12.31.23 | | 03.31.24 | | 12.31.23 |
| Assets | | | | | | | |
| Tax losses carryforward | 2,496,088 | | 2,496,088 | | 2,536,597 | | 2,532,720 |
| Negative calculation basis (social contribution) | 898,592 | | 898,592 | | 913,175 | | 911,779 |
| | | | | | | | |
| Temporary differences - Assets | | | | | | | |
| Provisions for tax, civil and labor risks | 358,503 | | 363,186 | | 360,383 | | 365,381 |
| Expected credit losses | 180,912 | | 172,699 | | 185,093 | | 176,776 |
| Impairment on tax credits | 51,438 | | 55,253 | | 51,438 | | 55,253 |
| Provision for other obligations | 64,398 | | 101,048 | | 82,018 | | 115,216 |
| Write-down to net realizable value of inventories | 14,213 | | 14,264 | | 16,144 | | 19,627 |
| Employees' benefits plan | 112,399 | | 110,033 | | 162,955 | | 137,947 |
| Lease basis difference | 207,214 | | 189,305 | | 207,592 | | 189,753 |
| Other temporary differences | 133,423 | | 101,203 | | 153,911 | | 118,846 |
| | 4,517,180 | | 4,501,671 | | 4,669,306 | | 4,623,298 |
| | | | | | | | |
| Temporary differences - Liabilities | | | | | | | |
| Goodwill amortization basis difference | (323,005) | | (323,005) | | (335,998) | | (336,135) |
| Depreciation (useful life) basis difference | (827,762) | | (848,246) | | (842,349) | | (863,896) |
| Business combination (1) | (966,981) | | (971,832) | | (966,981) | | (971,832) |
| Monetary correction by Hyperinflation | - | | - | | (138,069) | | (95,981) |
| Unrealized gains on derivatives, net | (106,751) | | (127,036) | | (106,751) | | (127,036) |
| Unrealized fair value gains, net | (144,250) | | (163,417) | | (144,839) | | (163,744) |
| Other temporary differences | (16,807) | | (13,309) | | (14,876) | | (11,691) |
| | (2,385,556) | | (2,446,845) | | (2,549,863) | | (2,570,315) |
| | | | | | | | |
| Total deferred taxes | 2,131,624 | | 2,054,826 | | 2,119,443 | | 2,052,983 |
| | | | | | | | |
| Total Assets | 2,131,624 | | 2,054,826 | | 2,190,159 | | 2,113,108 |
| Total Liabilities | - | | - | | (70,716) | | (60,125) |
| | 2,131,624 | | 2,054,826 | | 2,119,443 | | 2,052,983 |
| (1) | The deferred tax liability on business combination is substantially represented by the allocation of goodwill to property, plant and equipment, brands and contingent liabilities. |
On March 31, 2024 the Parent Company has tax losses of Income Tax (IRPJ) and negative bases Contributions on the Net Profit (CSLL) in Brazil, which at current tax rates represent R$6,783,802 on March 31, 2024 (R$6,632,460 on December 31, 2023). In Consolidated, tax losses at local income tax rates represent the amount of R$6,936,330 (R$6,782,499 on December 31, 2023). Within this amount, R$3,394,680 in the Parent Company and R$3,449,772 in the Consolidated (R$3,394,679 in the Parent Company and R$3,444,499 in the Consolidated on December 31, 2023) are recognized as an asset, according to the recoverability expectation, over a ten-year horizon. The recoverability study uses financial projections made by Management for operational and financial results, which are in line with the recoverability test for cash-generating units.
The roll-forward of deferred income taxes, net, is set forth below:
| | Interim Financial Information, Individual and Consolidated | March 31, 2024 |
| | Parent company | | | Consolidated |
| | 03.31.24 | | | 03.31.24 |
| Beginning balance | 2,054,826 | | | 2,052,983 |
| Deferred income taxes recognized in income | 10,623 | | | 6,934 |
| Deferred income taxes recognized in other comprehensive income | 66,175 | | | 66,174 |
| Other | - | | | (6,648) |
| Ending balance | 2,131,624 | | | 2,119,443 |
| 10.2. | Effective income tax rate reconciliation |
| | Parent company | | Consolidated |
| | 2024 | | | 2023 | | 2024 | | | 2023 |
| | Jan - mar | | | Jan - mar | | Jan - mar | | | Jan - mar |
| | | | | | | | | | | |
| Income (loss) before taxes | 494,167 | | | (1,054,737) | | | 714,668 | | | (1,039,432) |
| Nominal tax rate | 34% | | | 34% | | | 34% | | | 34% |
| Benefit at nominal rate | (168,017) | | | 358,611 | | | (242,987) | | | 353,407 |
| Adjustments to income taxes | | | | | | | | | | |
| Income from associates and joint ventures | 305,539 | | | (348,086) | | | (818) | | | (6) |
| Tax rate, GAAP and permanent differences on the results of a subsidiary | - | | | - | | | 219,171 | | | (302,257) |
| Effect of exchange rate variation on assets and liabilities of subsidiaries | - | | | - | | | 30,588 | | | (45,274) |
| Deferred tax assets not recognized (1) | (151,343) | | | (4,644) | | | (151,321) | | | (4,974) |
| Interest on taxes | 20,033 | | | 20,780 | | | 20,073 | | | 20,811 |
| Other permanent differences | 4,614 | | | (5,943) | | | 4,370 | | | (5,902) |
| | 10,826 | | | 20,718 | | | (120,924) | | | 15,805 |
| | | | | | | | | | | |
| Effective rate | -2.2% | | | 2.0% | | | 16.9% | | | 1.5% |
| | | | | | | | | | | |
| Current tax | 203 | | | - | | | (127,858) | | | (4,386) |
| Deferred tax | 10,623 | | | 20,718 | | | 6,934 | | | 20,191 |
| (1) | Amount related to the non-recognition of deferred tax on tax losses carryforward in the Parent Company and in the Consolidated, due to limited capacity of realization. |
Income tax returns in Brazil are subject to review by the tax authorities for a period of five years from the date of their delivery. The Company may be subject to additional collection of taxes, fines and interest as a result of these reviews. The results obtained by subsidiaries abroad are subject to taxation in accordance with the tax laws of each country.
| | Interim Financial Information, Individual and Consolidated | March 31, 2024 |
11. Judicial deposits
The rollforward of the judicial deposits is set forth below:
| | Parent company |
| | | | | | | | | | | 03.31.24 |
| | Tax | | Labor | | Civil, commercial and other | | Total |
| Beginning balance | 189,455 | | | 154,424 | | | 61,571 | | | 405,450 |
| Additions | 13 | | | 19,519 | | | 56 | | | 19,588 |
| Release in favor of the Company | (251) | | | (5,536) | | | (148) | | | (5,935) |
| Release in favor of the counterparty | - | | | (18,807) | | | (527) | | | (19,334) |
| Interest | 3,202 | | | 2,146 | | | 617 | | | 5,965 |
| Ending balance | 192,419 | | | 151,746 | | | 61,569 | | | 405,734 |
| | Consolidated |
| | | | | | | | 03.31.24 |
| | Tax | | Labor | | Civil, commercial and other | | Total |
| Beginning balance | 192,661 | | 156,241 | | 66,816 | | 415,718 |
| Additions | 34 | | 20,025 | | 56 | | 20,115 |
| Release in favor of the Company | (251) | | (5,536) | | (148) | | (5,935) |
| Release in favor of the counterparty | - | | (18,915) | | (527) | | (19,442) |
| Interest | 3,286 | | 2,151 | | 755 | | 6,192 |
| Exchange rate variation | - | | (1) | | - | | (1) |
| Ending balance | 195,730 | | 153,965 | | 66,952 | | 416,647 |
| 12.1. | Composition and rollforward the investments |
| | Parent company | | Consolidated |
| | 03.31.24 | | 12.31.23 | | 03.31.24 | | 12.31.23 |
| Investments | 14,654,367 | | 13,683,142 | | 94,727 | | 97,134 |
| Investment in subsidiaries | 14,559,640 | | 13,586,008 | | - | | - |
| Investment in affiliates | 94,727 | | 97,134 | | 94,727 | | 97,134 |
| Other investments | 583 | | 583 | | 522 | | 761 |
| | 14,654,950 | | 13,683,725 | | 95,249 | | 97,895 |
| | Interim Financial Information, Individual and Consolidated | March 31, 2024 |
The rollforward of the direct investments in subsidiaries and affiliates of the Parent Company is set forth below:
| | | | Income (loss) for the year | | Capital transaction | | Goodwill and allocations | | Other | | |
| | Beginning balance (12.31.23) | | Income (loss) | | Capital increase (reduction) | | Termination of equity interest participation | | Merger of companies (1) | | Exchange rate variation on goodwill | | Other comprehensive income | | Constitution (reversal) of provision for loss | | Ending balance (03.31.24) |
| Direct subsidiaries | | | | | | | | | | | | | | | | | |
| BRF Energia S.A. | 338 | | (46) | | 10,000 | | - | | | | - | | - | | - | | 10,292 |
| BRF GmbH | 12,220,014 | | 920,382 | | - | | - | | | | - | | 41,852 | | - | | 13,182,248 |
| BRF Investimentos | - | | - | | - | | - | | 5,841 | | - | | - | | - | | 5,841 |
| BRF Pet S.A. | 1,257,834 | | (1,860) | | - | | - | | | | - | | 1,535 | | - | | 1,257,509 |
| Sadia Alimentos S.A. | 3,367 | | (4,757) | | - | | - | | | | - | | 4,499 | | - | | 3,109 |
| Sadia Uruguay S.A. | 91,823 | | 390 | | - | | - | | | | - | | 6,722 | | - | | 98,935 |
| VIP S.A. Empr. e Particip. Imob | 1,379 | | 27 | | - | | (1,406) | | | | - | | - | | - | | - |
| | | | | | | | | | | | | | | | | | |
| Indirect subsidiaries | | | | | | | | | | | | | | | | | - |
| Hercosul International S.R.L. | 1,112 | | 43 | | - | | - | | | | 6 | | 5 | | - | | 1,166 |
| PSA Labor. Veter. Ltda | 9,638 | | 164 | | - | | (9,802) | | | | - | | - | | - | | - |
| Proud Food Lda | 501 | | 23 | | - | | - | | | | - | | 14 | | - | | 538 |
| Sadia Chile S.A. | 2 | | (13,317) | | - | | - | | | | - | | 3,012 | | 10,305 | | 2 |
| | | | | | | | | | | | | | | | | | |
| Affiliated | | | | | | | | | | | | | | | | | - |
| Potengi Holdings S.A. (1) | 89,051 | | (2,407) | | - | | - | | | | - | | - | | - | | 86,644 |
| PR-SAD Adm. Bem próprio S.A. | 8,083 | | - | | - | | - | | | | - | | - | | - | | 8,083 |
| | | | | | | | | | | | | | | | | | |
| | 13,683,142 | | 898,642 | | 10,000 | | (11,208) | | | | 6 | | 57,639 | | 10,305 | | 14,654,367 |
| (1) | On March 28, 2024, the subsidiaries VIP S.A. Empreendimentos e Participações Imobiliária and PSA Laboratório Veterinário Ltda. were merged by BRF S.A., therefore, BRF S.A. became the direct holder of BRF Investimentos shares. |
On March 31, 2024, these subsidiaries and affiliates do not have any restriction to amortize their loans or advances to the Company.
| | Interim Financial Information, Individual and Consolidated | March 31, 2024 |
| 13. | Property, plant and equipment |
The rollforward of property, which include right-of-use assets balances (note 17.1), plant and equipment is set forth below:
| | Parent company |
| | Average rate (1) | | 12.31.23 | | Additions | | Disposals | | Transfers (2) | | 03.31.24 |
| Cost | | | | | | | | | | | |
| Land | | | 550,339 | | 758 | | (7,493) | | - | | 543,604 |
| Buildings, facilities and improvements | | | 12,262,442 | | 282,388 | | (65,765) | | 44,351 | | 12,523,416 |
| Machinery and equipment | | | 9,510,187 | | 5,679 | | (36,750) | | 100,914 | | 9,580,030 |
| Furniture and fixtures | | | 135,466 | | 96 | | (664) | | 1,371 | | 136,269 |
| Vehicles | | | 195,224 | | 24,510 | | (1,517) | | - | | 218,217 |
| Construction in progress | | | 456,099 | | 118,085 | | (281) | | (154,657) | | 419,246 |
| Advances to suppliers | | | - | | 30 | | - | | (30) | | - |
| | | | 23,109,757 | | 431,546 | | (112,470) | | (8,051) | | 23,420,782 |
| | | | | | | | | | | | |
| Depreciation | | | | | | | | | | | |
| Land (3) | 5.00% | | (19,478) | | (1,156) | | 2,607 | | - | | (18,027) |
| Buildings, facilities and improvements | 2.62% | | (4,850,062) | | (192,665) | | 53,116 | | 3,366 | | (4,986,245) |
| Machinery and equipment | 5.45% | | (4,962,048) | | (115,397) | | 28,890 | | 547 | | (5,048,008) |
| Furniture and fixtures | 5.19% | | (65,344) | | (1,832) | | 571 | | (14) | | (66,619) |
| Vehicles | 13.84% | | (84,895) | | (21,354) | | 1,288 | | - | | (104,961) |
| | | | (9,981,827) | | (332,404) | | 86,472 | | 3,899 | | (10,223,860) |
| | | | 13,127,930 | | 99,142 | | (25,998) | | (4,152) | | 13,196,922 |
| (1) | Weighted average annual rate. |
| (2) | Refers to the transfer of R$683 to intangible assets and R$3,469 to assets held for sale. |
| (3) | Land depreciation refers to right-of-use assets (note 17.1). The amount of R$559 of depreciation was recognized in the cost of formation of forests and will be realized in the result according to the depletion.
|
| | Interim Financial Information, Individual and Consolidated | March 31, 2024 |
| | Consolidated |
| | Average rate (1) | | 12.31.23 | | Additions | | Disposals | | Monetary correction by Hyperinflation | | Transfers (2) | | Exchange rate variation | | 03.31.24 |
| Cost | | | | | | | | | | | | | | | |
| Land | | | 730,103 | | 758 | | (7,625) | | 15,799 | | - | | (1,149) | | 737,886 |
| Buildings, facilities and improvements | | | 13,283,922 | | 305,708 | | (150,857) | | 20,057 | | 48,689 | | 11,077 | | 13,518,596 |
| Machinery and equipment | | | 10,497,307 | | 20,081 | | (42,500) | | 56,952 | | 104,301 | | (11,795) | | 10,624,346 |
| Furniture and fixtures | | | 224,706 | | 141 | | (675) | | 9,330 | | 1,837 | | (3,041) | | 232,298 |
| Vehicles | | | 445,298 | | 164,503 | | (21,311) | | 7,264 | | - | | 6,849 | | 602,603 |
| Construction in progress | | | 483,514 | | 127,193 | | (281) | | (2,133) | | (159,847) | | (440) | | 448,006 |
| Advances to suppliers | | | 3,372 | | 1,611 | | - | | (1,064) | | (2,854) | | (81) | | 984 |
| | | | 25,668,222 | | 619,995 | | (223,249) | | 106,205 | | (7,874) | | 1,420 | | 26,164,719 |
| | | | | | | | | | | | | | | | |
| Depreciation | | | | | | | | | | | | | | | |
| Land (3) | 5.00% | | (41,953) | | (2,488) | | 2,738 | | 58 | | - | | (737) | | (42,382) |
| Buildings, facilities and improvements | 2.79% | | (5,281,798) | | (214,888) | | 138,224 | | (3,313) | | 3,367 | | (8,872) | | (5,367,280) |
| Machinery and equipment | 5.77% | | (5,390,588) | | (132,408) | | 34,592 | | (15,097) | | 546 | | 2,781 | | (5,500,174) |
| Furniture and fixtures | 8.60% | | (98,039) | | (3,390) | | 577 | | (3,012) | | (15) | | 738 | | (103,141) |
| Vehicles | 14.82% | | (246,930) | | (51,259) | | 21,082 | | (294) | | - | | (3,712) | | (281,113) |
| | | | (11,059,308) | | (404,433) | | 197,213 | | (21,658) | | 3,898 | | (9,802) | | (11,294,090) |
| | | | 14,608,914 | | 215,562 | | (26,036) | | 84,547 | | (3,976) | | (8,382) | | 14,870,629 |
| (1) | Weighted average annual rate. |
| (2) | Refers to the transfer of R$507 to intangible assets and R$3,469 to assets held for sale. |
| (3) | Land depreciation refers to right-of-use assets (note 17.1). The amount of R$559 of depreciation was recognized in the cost of formation of forests and will be realized in the result according to the depletion. |
| | Interim Financial Information, Individual and Consolidated | March 31, 2024 |
The amount of capitalized borrowing costs during the three-month period ended March 31, 2024 was of R$9,436 in the Parent Company and R$9,823 in the Consolidated (R$17,021 in the Parent Company and R$20,583 in the Consolidated in the same period of the previous year).
The weighted average rate used to determine the amount of borrowing costs subject to capitalization during the three-months period ended March 31, 2024 was 9.45% p.a. in the Parent Company and 10.41% p.a. in the Consolidated (9.62% p.a. in the Parent Company and 10.18% p.a. in the Consolidated in the in the same period of the previous year).
The intangible assets rollforwardis set forth below:
| | | | | Parent company | | Consolidated |
| | | Type of collateral | | 03.31.24 | | 12.31.23 | | 03.31.24 | | 12.31.23 |
| Land | | Financial/tax | | 88,161 | | 87,530 | | 88,161 | | 87,530 |
| Buildings, facilities and improvements | | Financial/tax | | 1,390,559 | | 1,393,528 | | 1,392,878 | | 1,395,846 |
| Machinery and equipment | | Financial/labor/tax/civil | | 1,454,099 | | 1,463,205 | | 1,455,123 | | 1,464,229 |
| Furniture and fixtures | | Financial/tax | | 14,966 | | 15,102 | | 14,966 | | 15,102 |
| Vehicles | | Financial/tax | | 102 | | 109 | | 102 | | 109 |
| | | | | 2,947,887 | | 2,959,474 | | 2,951,230 | | 2,962,816 |
The intangible assets rollforward, is set forth below:
| | | | Parent company |
| | Average rate (1) | | 12.31.23 | | Additions | | Disposals | | Transfers | | 03.31.24 |
| Cost | | | | | | | | | | | |
| Goodwill | | | 1,783,655 | | - | | - | | - | | 1,783,655 |
| Trademarks | | | 1,152,885 | | - | | - | | - | | 1,152,885 |
| Non-compete agreement | | | 14,650 | | - | | - | | - | | 14,650 |
| Outgrowers relationship | | | 517 | | - | | - | | - | | 517 |
| Patents | | | 1,810 | | - | | - | | - | | 1,810 |
| Software | | | 698,096 | | - | | (182) | | 41,579 | | 739,493 |
| Intangible in progress | | | 35,232 | | 40,572 | | - | | (40,896) | | 34,908 |
| | | | 3,686,845 | | 40,572 | | (182) | | 683 | | 3,727,918 |
| | | | | | | | | | | | |
| Amortization | | | | | | | | | | | |
| Non-compete agreement | 46.01% | | (8,797) | | (1,500) | | - | | - | | (10,297) |
| Outgrowers relationship | 16.45% | | (419) | | (18) | | - | | - | | (437) |
| Patents | 5.70% | | (1,673) | | (6) | | - | | - | | (1,679) |
| Software | 39.84% | | (474,417) | | (43,454) | | 182 | | - | | (517,689) |
| | | | (485,306) | | (44,978) | | 182 | | - | | (530,102) |
| | | | 3,201,539 | | (4,406) | | - | | 683 | | 3,197,816 |
| (1) | Weighted average annual remaining rate. |
| | Interim Financial Information, Individual and Consolidated | March 31, 2024 |
| | | | Consolidated |
| | Average rate (1) | | 12.31.23 | | Additions | | Disposals | | Transfers | | Monetary correction by Hyperinflation | | Exchange rate variation | | 03.31.24 |
| Cost | | | | | | | | | | | | | | | |
| Goodwill | | | 3,390,938 | | - | | - | | - | | 29,556 | | 18,936 | | 3,439,430 |
| Trademarks | | | 1,873,253 | | - | | - | | - | | 34,950 | | (13,481) | | 1,894,722 |
| Non-compete agreement | | | 54,892 | | - | | - | | - | | - | | 1,214 | | 56,106 |
| Outgrowers relationship | | | 517 | | - | | - | | - | | - | | - | | 517 |
| Patents | | | 4,129 | | - | | - | | - | | 330 | | (127) | | 4,332 |
| Customer relationship | | | 1,217,742 | | - | | - | | - | | 65,566 | | (868) | | 1,282,440 |
| Software | | | 787,048 | | 42 | | (182) | | 42,161 | | 6,998 | | (1,702) | | 834,365 |
| Intangible in progress | | | 35,479 | | 40,854 | | - | | (41,654) | | 240 | | (9) | | 34,910 |
| | | | 7,363,998 | | 40,896 | | (182) | | 507 | | 137,640 | | 3,963 | | 7,546,822 |
| | | | | | | | | | | | | | | | |
| Amortization | | | | | | | | | | | | | | | |
| Non-compete agreement | 46.01% | | (47,841) | | (1,611) | | - | | - | | - | | (1,215) | | (50,667) |
| Outgrowers relationship | 16.45% | | (419) | | (18) | | - | | - | | - | | - | | (437) |
| Patents | 8.56% | | (3,195) | | (80) | | - | | - | | (162) | | 84 | | (3,353) |
| Customer relationship | 6.67% | | (635,655) | | (26,201) | | - | | - | | (38,292) | | (1,615) | | (701,763) |
| Software | 41.27% | | (536,450) | | (47,683) | | 161 | | - | | (4,302) | | 772 | | (587,502) |
| | | | (1,223,560) | | (75,593) | | 161 | | - | | (42,756) | | (1,974) | | (1,343,722) |
| | | | 6,140,438 | | (34,697) | | (21) | | 507 | | 94,884 | | 1,989 | | 6,203,100 |
| (1) | Weighted average annual remaining rate. |
| | Interim Financial Information, Individual and Consolidated | March 31, 2024 |
| | Parent company |
| | Charges (p.a.) | | Average rate (1) | | WAMT (2) | | 12.31.23 | | Borrowing | | Amortization | | Interest paid | | Interest accrued (3) | | Exchange rate variation | | 03.31.24 |
| Local currency | | | | | | | | | | | | | | | | | | | |
| Working capital | Fixed / CDI | | 10.59%
(12.29% on 12.31.23) | | 0.63 | | 773,840 | | | | (251,407) | | (36,985) | | 20,023 | | - | | 505,471 |
| Export credit facility | CDI | | 12.25% (13.26% on 12.31.23) | | 3.43 | | 1,583,596 | | - | | - | | (24,098) | | 47,619 | | - | | 1,607,117 |
| Debentures | CDI / IPCA | | 10.61%
(10.94% on 12.31.23) | | 5.50 | | 6,634,434 | | - | | - | | (157,306) | | 95,661 | | - | | 6,572,789 |
| | | | | | | | | | | | | | | | | | | | |
| Fiscal incentives | Fixed | | 2.40%
(2.40% on 12.31.23) | | - | | 6,604 | | 19,647 | | | | (97) | | 89 | | - | | 26,243 |
| | | | | | | | | | | | | | | | | | | | |
| | | | | | | | 8,998,474 | | 19,647 | | (251,407) | | (218,486) | | 163,392 | | - | | 8,711,620 |
| | | | | | | | | | | | | | | | | | | | |
| Foreign currency | | | | | | | | | | | | | | | | | | | |
| Bonds | Fixed / FX USD | | 5.34%
(5.34% on 12.31.23) | | 16.80 | | 6,105,757 | | - | | - | | (197,802) | | 102,722 | | 199,371 | | 6,210,048 |
| Export credit facility | Fixed / SOFR /FX USD | | 5.53%
(5.49% on 12.31.23) | | 2.96 | | 2,436,651 | | - | | - | | (34,099) | | 36,241 | | 78,205 | | 2,516,998 |
| Advances for foreign exchange rate contracts | Fixed / FX USD | | 0%
(7.10% on 12.31.23) | | - | | 158,420 | | - | | (152,900) | | (10,972) | | (2,466) | | 7,918 | | - |
| | | | | | | | 8,700,828 | | - | | (152,900) | | (242,873) | | 136,497 | | 285,494 | | 8,727,046 |
| | | | | | | | 17,699,302 | | 19,647 | | (404,307) | | (461,359) | | 299,889 | | 285,494 | | 17,438,666 |
| | | | | | | | | | | | | | | | | | | | |
| Current | | | | | | | 2,237,214 | | | | | | | | | | | | 2,114,310 |
| Non-current | | | | | | | 15,462,088 | | | | | | | | | | | | 15,324,356 |
| (1) | Weighted average annual rate. |
| (2) | Weighted average maturity in years. |
| (3) | Includes interest amounts, monetary restatement of the principal coupon and mark-to-market for debts hedged object to fair value hedge protection. |
| | Interim Financial Information, Individual and Consolidated | March 31, 2024 |
| | Consolidated |
| | Charges (p.a.) | | Average rate (1) | | WAMT (2) | | 12.31.23 | | Borrowing | | Amortization | | Interest paid | | Interest accrued (3) | | Exchange rate variation | | 03.31.24 |
| Local currency | | | | | | | | | | | | | | | | | | | |
| Working capital | Fixed / CDI | | 10.58%
(12.28% on 12.31.23) | | 0.63 | | 777,528 | | - | | (252,421) | | (36,985) | | 20,021 | | - | | 508,143 |
| Export credit facility | CDI | | 12.25%
(13.26% on 12.31.23) | | 3.43 | | 1,583,597 | | - | | - | | (24,098) | | 47,619 | | - | | 1,607,118 |
| Debentures | CDI / IPCA | | 10.61%
(10.94% on 12.31.23) | | 5.50 | | 6,634,434 | | - | | - | | (157,306) | | 95,661 | | - | | 6,572,789 |
| | | | | | | | | | | | | | | | | | | | |
| Fiscal incentives | Fixed | | 2.40%
(2.40% on 12.31.23) | | - | | 6,604 | | 19,647 | | - | | (97) | | 89 | | - | | 26,243 |
| | | | | | | | 9,002,163 | | 19,647 | | (252,421) | | (218,486) | | 163,390 | | - | | 8,714,293 |
| | | | | | | | | | | | | | | | | | | | |
| Foreign currency | | | | | | | | | | | | | | | | | | | |
| Bonds | Fixed / FX USD | | 5.15%
(5.15% on 12.31.23) | | 14.04 | | 7,559,562 | | - | | - | | (230,270) | | 120,232 | | 246,234 | | 7,695,758 |
| Export credit facility | Fixed /SOFR / FX USD | | 5.53% (5.49% on 12.31.23) | | 2.96 | | 2,436,651 | | - | | - | | (34,099) | | 36,241 | | 78,206 | | 2,516,999 |
| Advances for foreign exchange rate contracts | Fixed / FX USD | | 0% (7.10% on 12.31.23) | | - | | 158,420 | | - | | (152,900) | | (10,972) | | (2,466) | | 7,918 | | - |
| Working capital | Fixed / EIBOR3M + 1,8% FX TRY, AED and USD | | 12.60% (13.13% on 12.31.23) | | 1.72 | | 938,752 | | 45,220 | | (86,118) | | (33,937) | | 33,186 | | 12,600 | | 909,703 |
| | | | | | | | | | | | | | | | | | | | |
| | | | | | | | 11,093,385 | | 45,220 | | (239,018) | | (309,278) | | 187,193 | | 344,958 | | 11,122,460 |
| | | | | | | | 20,095,548 | | 64,867 | | (491,439) | | (527,764) | | 350,583 | | 344,958 | | 19,836,753 |
| | | | | | | | | | | | | | | | | | | | |
| Current | | | | | | | 2,451,838 | | | | | | | | | | | | 2,260,733 |
| Non-current | | | | | | | 17,643,710 | | | | | | | | | | | | 17,576,020 |
| (1) | Weighted average annual rate. |
| (2) | Weighted average maturity in years. |
| (3) | Includes interest amounts, monetary restatement of the principal coupon and mark-to-market for debts hedged object to fair value hedge protection. |
The maturity schedule of the loans and borrowings is presented on note 23.1.
| | Interim Financial Information, Individual and Consolidated | March 31, 2024 |
On March 31, 2024 and on December 31, 2023 the Company did not have any financial covenant clauses related to its loans and borrowings agreements.
| 15.1. | Revolving credit facility |
With the purpose of maintaining a prudential and sustainable short term liquidity position, in line with the adoption of measures to extend its average debt maturity and reduce the cost of debt, the Company renewed on October 26, 2022 from Banco do Brasil a revolving credit facility up to the limit of R$1,500,000 for a period of two years. The referenced credit facility can be withdrawn totally or partially, at the Company’s will, whenever necessary. As of March 31, 2024, the credit facility was available, but unused.
| | Parent company | | Consolidated |
| | 03.31.24 | | 12.31.23 | | 03.31.24 | | 12.31.23 |
| Total loans and borrowings | 17,438,666 | | 17,699,302 | | 19,836,753 | | 20,095,548 |
| Mortgage guarantees | | | | | | | |
| Related to tax incentives | 26,243 | | 6,604 | | 26,243 | | 6,604 |
On March 31, 2024, the amount of bank guarantees contracted by the Company was of R$209,508 (R$207,006 as of December 31, 2023) which were offered mainly in litigations involving the Company’s use of tax credits. These guarantees have an average cost of 1.63% p.a. (1.64% p.a. as of December 31, 2023).
| 16. | Trade accounts payable |
| | Parent company | | Consolidated |
| | 03.31.24 | | 12.31.23 | | 03.31.24 | | 12.31.23 |
| Trade accounts payable | | | | | | | |
| Domestic market | | | | | | | |
| Third parties | 9,795,882 | | 10,367,364 | | 10,002,564 | | 10,575,915 |
| Related parties | 333,781 | | 229,650 | | 51,616 | | 21,482 |
| | | | | | | | |
| Foreign market | | | | | | | |
| Third parties | 842,539 | | 1,048,472 | | 2,050,373 | | 2,157,491 |
| Related parties | 2,550,989 | | 2,527,384 | | 189 | | 3,663 |
| | 13,523,191 | | 14,172,870 | | 12,104,742 | | 12,758,551 |
| | | | | | | | |
| (-) Adjustment to present value | (140,642) | | (160,460) | | (147,671) | | (166,123) |
| | 13,382,549 | | 14,012,410 | | 11,957,071 | | 12,592,428 |
| | | | | | | | |
| Current | 13,381,858 | | 14,011,988 | | 11,956,380 | | 12,592,006 |
| Non-current | 691 | | 422 | | 691 | | 422 |
The Company has agreements with several financial institutions that allow the suppliers to anticipate their receivables and, therefore, transfer the right to receive invoices with financial institutions (“Supply Chain Finance” or “Program”). The suppliers may choose whether to participate and if so, with which financial institution, with no participation by BRF.
| | Interim Financial Information, Individual and Consolidated | March 31, 2024 |
The Program can generate benefits in the commercial relations of BRF and its suppliers, such as preference and priority of supply in case of restricted supply, better commercial conditions, among others, without modification to the commercial essence of the transaction.
Invoices included in the Program are paid according to the same price and term conditions negotiated with its suppliers, without incurring any charge to the Company, so that there are no changes in commercial conditions after negotiation and invoicing of goods or services.
Invoices included in the Supply Chain Finance are R$3,951,700 in the Parent Company and R$4,150,606 in the Consolidated on March 31, 2024 (R$4,760,488 in the Parent Company and R$4,941,716 in the Consolidated on December 31, 2023).
The Company measures and discriminates the adjustment to present value for all its commercial operations carried out in installments, specifying financial and operational items.
The Company is lessee in several lease agreements for forest lands, offices, distribution centers, outgrowers, vehicles, among others. Some contracts have a renewal option for an additional period at the end of the agreement, established by contractual amendments. Automatic renewals or renewals for undetermined periods are not allowed.
The contract clauses mentioned, with respect to renewal, readjustment and purchase option, are contracted according to market practices. In addition, there are no clauses of contingent payments or restrictions on dividends distribution, payments of interest on shareholders’ equity or obtaining debt.
The right-of-use assets as set forth below are part of the balances of property, plant and equipment and intangible assets (note 13).
| | Parent company |
| | Average rate (1) | | 12.31.23 | | Additions | | Disposals | | 03.31.24 |
| Cost | | | | | | | | | |
| Land | | | 43,554 | | 126 | | (2,976) | | 40,704 |
| Buildings, facilities and improvements | | | 4,006,200 | | 282,388 | | (40,103) | | 4,248,485 |
| Machinery and equipment | | | 253,408 | | 3,663 | | (6,216) | | 250,855 |
| Vehicles | | | 188,004 | | 24,509 | | (1,514) | | 210,999 |
| | | | 4,491,166 | | 310,686 | | (50,809) | | 4,751,043 |
| | | | | | | | | | |
| Depreciation | | | | | | | | | |
| Land | 3.45% | | (18,978) | | (1,135) | | 2,607 | | (17,506) |
| Buildings, facilities and improvements | 13.26% | | (1,478,573) | | (142,433) | | 30,071 | | (1,590,935) |
| Machinery and equipment | 19.46% | | (52,475) | | (12,531) | | 1,848 | | (63,158) |
| Vehicles | 15.02% | | (78,558) | | (21,272) | | 1,287 | | (98,543) |
| | | | (1,628,584) | | (177,371) | | 35,813 | | (1,770,142) |
| | | | 2,862,582 | | 133,315 | | (14,996) | | 2,980,901 |
| (1) | Weighted average annual rate. |
| | Interim Financial Information, Individual and Consolidated | March 31, 2024 |
| | Consolidated |
| | Average rate (1) | | 12.31.23 | | Additions | | Disposals | | Monetary correction by Hyperinflation | | Exchange rate variation | | 03.31.24 |
| Cost | | | | | | | | | | | | | |
| Land | | | 130,072 | | 126 | | (3,107) | | 6,493 | | 2,425 | | 136,009 |
| Buildings, facilities and improvements | | | 4,345,335 | | 305,160 | | (125,194) | | (4,646) | | 7,686 | | 4,528,341 |
| Machinery and equipment | | | 298,548 | | 16,939 | | (11,603) | | (898) | | (45) | | 302,941 |
| Vehicles | | | 422,558 | | 164,503 | | (21,299) | | 7,099 | | 6,883 | | 579,744 |
| | | | 5,196,513 | | 486,728 | | (161,203) | | 8,048 | | 16,949 | | 5,547,035 |
| | | | | | | | | | | | | | |
| Depreciation | | | | | | | | | | | | | |
| Land | 7.18% | | (41,450) | | (2,431) | | 2,738 | | 21 | | (737) | | (41,859) |
| Buildings, facilities and improvements | 13.83% | | (1,736,196) | | (158,427) | | 115,099 | | (74) | | (6,340) | | (1,785,938) |
| Machinery and equipment | 19.48% | | (81,950) | | (14,831) | | 7,234 | | (3,339) | | 77 | | (92,809) |
| Vehicles | 33.14% | | (226,910) | | (50,194) | | 21,070 | | (513) | | (3,736) | | (260,283) |
| | | | (2,086,506) | | (225,883) | | 146,141 | | (3,905) | | (10,736) | | (2,180,889) |
| | | | 3,110,007 | | 260,845 | | (15,062) | | 4,143 | | 6,213 | | 3,366,146 |
| (1) | Weighted average annual rate. |
| | | | Parent company |
| | Weighted average
interest rate (p.a.) | | WAM (1) | | 12.31.23 | | Additions | | Payments | | Interest paid | | Interest accrued | | Disposals | | 03.31.24 |
| Land | - | | - | | 30,249 | | 126 | | (471) | | (955) | | 955 | | (461) | | 29,443 |
| Buildings, facilities and improvements (2) | - | | - | | 3,093,021 | | 282,388 | | (123,598) | | (35,503) | | 75,086 | | (19,060) | | 3,272,334 |
| Machinery and equipment | - | | - | | 214,509 | | 3,663 | | (10,038) | | (7,545) | | 7,545 | | (4,542) | | 203,592 |
| Vehicles | - | | - | | 122,354 | | 24,509 | | (20,189) | | (3,572) | | 3,572 | | (298) | | 126,376 |
| | | | | | | | | | | | | | | | | | |
| | 10.0% | | 6.5 | | 3,460,133 | | 310,686 | | (154,296) | | (47,575) | | 87,158 | | (24,361) | | 3,631,745 |
| | | | | | | | | | | | | | | | | | |
| Current | | | | | 835,154 | | | | | | | | | | | | 881,319 |
| Non-current | | | | | 2,624,979 | | | | | | | | | | | | 2,750,426 |
| (1) | Weighted average maturity in years. |
| (2) | Includes the amount of R$2,142,311 in the Parent Company and in the Consolidated (R$1,984,044 in the Parent Company and in the Consolidated on December 31, 2023) referring to the right of use identified on integrated producers contracts. |
| | | | Consolidated |
| | Weighted average
interest rate (p.a.) | | WAM (1) | | 12.31.23 | | Additions | | Payments | | Interest paid | | Interest accrued | | Disposals | | Exchange rate variation | | 03.31.24 |
| Land | - | | - | | 106,695 | | 126 | | (1,056) | | (2,308) | | 2,308 | | (462) | | 2,392 | | 107,695 |
| Buildings, facilities and improvements (2) | - | | - | | 3,174,862 | | 305,160 | | (138,601) | | (36,977) | | 76,561 | | (19,126) | | 2,011 | | 3,363,890 |
| Machinery and equipment | - | | - | | 225,272 | | 16,939 | | (11,102) | | (8,013) | | 8,013 | | (4,543) | | (22) | | 226,544 |
| Vehicles | - | | - | | 215,018 | | 164,503 | | (47,375) | | (6,538) | | 6,538 | | (298) | | 3,124 | | 334,972 |
| | 9.6% | | 6.3 | | 3,721,847 | | 486,728 | | (198,134) | | (53,836) | | 93,420 | | (24,429) | | 7,505 | | 4,033,101 |
| | | | | | | | | | | | | | | | | | | | |
| Current | | | | | 944,326 | | | | | | | | | | | | | | 1,043,159 |
| Non-current | | | | | 2,777,521 | | | | | | | | | | | | | | 2,989,942 |
| (1) | Weighted average maturity in years. |
(2) Includes the amount of R$2,142,311 in the Parent Company and in the Consolidated (R$1,984,044 in the Parent Company and in the Consolidated on December 31, 2023) referring to the right of use identified on integrated producers contracts.
| 17.3. | Lease liabilities maturity schedule |
The maturity schedule of the minimum required future payments is presented below:
| | Interim Financial Information, Individual and Consolidated | March 31, 2024 |
| | Parent company | | Consolidated |
| | 03.31.24 | | 03.31.24 |
| Current | 881,319 | | 1,043,159 |
| Non-current | 2,750,426 | | 2,989,942 |
| 2024 | 487,161 | | 565,690 |
| 2025 | 548,769 | | 624,256 |
| 2026 | 473,318 | | 493,539 |
| 2027 | 316,011 | | 330,465 |
| 2028 onwards | 925,167 | | 975,992 |
| | 3,631,745 | | 4,033,101 |
| 17.4. | Amounts recognized in the statement of income |
The amounts directly recognized in the statement of income presented below relate to items not capitalized, including: low-value assets, short-term leases and leases with variable payments.
| | | Parent Company | | Consolidated |
| | | 2024 | | 2024 |
| | | Jan - mar | | Jan - mar |
| Variable payments not included in the lease liabilities | | 990 | | 9,345 |
| Expenses related to short-term leases | | 6,352 | | 19,046 |
| Expenses related to low-value assets | | 3,092 | | 3,201 |
| | | 10,435 | | 31,592 |
18. Share-based payment
The rules for the restricted shares plans granted to executives were disclosed in the financial statements for the year ended December 31, 2023 (note 18).
The breakdown of the outstanding shares granted is set forth as follows:
| Date | | Quantity | | Grant (1) |
| Grant | | Vesting date | | Shares granted | | Outstanding shares | | Fair value of the shares |
| | | | | | | | | |
| 07/01/21 | | 07/01/24 | | 2,883,737 | | 362,633 | | 28.58 |
| 07/01/22 | | 07/01/25 | | 4,703,472 | | 2,007,228 | | 14.11 |
| 06/01/23 | | 06/01/26 | | 4,758,877 | | 4,715,483 | | 7.38 |
| 07/01/23 | | 07/071/26 | | 2,108,504 | | 1,986,276 | | 8.98 |
| | | | | 14,454,590 | | 9,071,620 | | |
| (1) | Amounts expressed in Brazilian Reais. |
The rollforward of the granted options and shares for the year ended on March 31, 2024, is presented as follows:
| | Interim Financial Information, Individual and Consolidated | March 31, 2024 |
| | | Consolidated |
| | | |
| Outstanding stocks as of December 31, 2023 | | 9,234,128 |
| Forfeiture (1) : | | |
| Restricted stocks – grant of July, 2023 | | (96,583) |
| Restricted stocks – grant of June, 2023 | | (11,477) |
| Restricted stocks – grant of July, 2022 | | (48,794) |
| Restricted stocks – grant of July, 2021 | | (5,654) |
| Outstanding stocks as of March 31, 2024 | | 9,071,620 |
| (1) | The forfeitures are related to the resignation of eligible executive before the end of the vesting period. |
The Company has registered under shareholders’ equity, the fair value of share-based compensation plans in the amount of R$208,987 (R$203,374 as of December 31, 2023) and in the amount of R$41,049 under non-current liabilities (R$19,821 of December 31, 2023). In the statement of income for the three-month period ended on March 31, 2024 the amount recognized as expense was R$28,289 in the Parent Company and R$28,345 in the Consolidated (R$1,661 in the Parent Company and in the Consolidated in the same period of the previous year).
The Company offers pension and other post-employment plans to the employees. The characteristics of such benefits were disclosed in the annual financial statements for the year ended on December 31, 2023 (note 19) and have not been changed during the following periods. The actuarial liabilities are presented below:
| | Parent company | | Consolidated |
| | Liabilities | | Liabilities |
| | 03.31.24 | | 12.31.23 | | 03.31.24 | | 12.31.23 |
| Medical assistance | 67,072 | | 65,522 | | 67,812 | | 66,245 |
| F.G.T.S. Penalty (1) | 71,952 | | 70,535 | | 71,952 | | 70,535 |
| Award for length of service | 128,714 | | 125,991 | | 128,714 | | 125,991 |
| Other | 62,848 | | 61,577 | | 280,782 | | 278,050 |
| | 330,586 | | 323,625 | | 549,260 | | 540,821 |
| | | | | | | | |
| Current | 58,894 | | 58,894 | | 84,906 | | 86,423 |
| Non-current | 271,692 | | 264,731 | | 464,354 | | 454,398 |
| (1) | FGTS – Government Severance Indemnity Fund for Employees. |
| 20. | Provision for tax, civil and labor risks |
The Company and its subsidiaries are involved in certain legal matters arising in the normal course of business, which include tax, social security, labor, civil, environmental, administrative and other processes.
Company’s Management believes that, based on the elements existing at the base date of these interim financial information, the provision for tax, labor, civil, environmental, administrative and other risks, is sufficient to cover eventual losses with administrative and legal proceedings, as set forth below.
The rollforward of the provisions for tax, labor, civil, environmental, administrative and other risks, classified as with probable loss, and contingent liabilities is presented below:
| | Interim Financial Information, Individual and Consolidated | March 31, 2024 |
| | Parent company |
| | | | | | | | | | 03.31.24 |
| | Tax | | Labor | | Civil and other | | Contingent liabilities (1) | | Total |
| Beginning balance | 321,124 | | 430,420 | | 349,255 | | 58,941 | | 1,159,740 |
| Additions | 41,871 | | 80,003 | | 4,951 | | - | | 126,825 |
| Reversals | (52,990) | | (28,329) | | (4,718) | | (147) | | (86,184) |
| Payments | (38,107) | | (50,391) | | (7,738) | | - | | (96,236) |
| Interest | 10,022 | | 21,379 | | 2,243 | | - | | 33,644 |
| Ending balance | 281,920 | | 453,082 | | 343,993 | | 58,794 | | 1,137,789 |
| | | | | | | | | | |
| Current | | | | | | | | | 706,369 |
| Non-current | | | | | | | | | 431,420 |
| (1) | Contingent liabilities recognized at fair value as of the acquisition date, arising from the business combination with Sadia. |
| | Consolidated |
| | | | | | | | | | 03.31.24 |
| | Tax | | Labor | | Civil and other | | Contingent liabilities (1) | | Total |
| Beginning balance | 321,995 | | 435,929 | | 352,414 | | 92,832 | | 1,203,170 |
| Additions | 41,871 | | 80,534 | | 4,971 | | - | | 127,376 |
| Reversals | (52,990) | | (29,658) | | (4,718) | | (147) | | (87,513) |
| Payments | (38,107) | | (50,391) | | (7,738) | | - | | (96,236) |
| Interest | 10,045 | | 21,428 | | 2,329 | | - | | 33,802 |
| Exchange rate variation | - | | (153) | | (14) | | - | | (167) |
| Ending balance | 282,814 | | 457,689 | | 347,244 | | 92,685 | | 1,180,432 |
| | | | | | | | | | |
| Current | | | | | | | | | 709,492 |
| Non-current | | | | | | | | | 470,940 |
| (1) | Contingent liabilities recognized at fair value as of the acquisition date, arising from the business combination with Sadia, Hercosul and Mogiana. |
The Company is involved in contingencies for which losses are possible, in accordance with the assessment prepared by Management with support from legal advisors. On March 31, 2024, the total amount of contingencies classified as possible was R$19,125,738 (R$18,627,512 on December 31, 2023) and have the same characteristics of those disclosed on December 31, 2023 financial statements and on March 31, 2024. Of these, R$16,584,107 (R$16,082,532 as of December 31, 2023) are of a tax nature, R$320,466 and (R$304,133 as of December 31, 2023) labor nature and R$2,221,165 (R$2,240,847 as of December 31, 2023) civil and other nature, and, of which solely the ones arising from the business combination with Sadia, Hercosul and Mogiana are provisioned, measured by the estimated fair value at the business combination date: R$92,685 (R$92,832 as of December 31, 2023).
On March 31, 2024, the subscribed and paid capital of the Company was R$13,653,418, which is composed of 1,682,473,246 common book-entry shares with no par value. The value of the capital stock is net of the public offering expenses of R$304,262.
| | Interim Financial Information, Individual and Consolidated | March 31, 2024 |
| 21.1.1. | Rollforward of outstanding shares |
Outstanding shares are determined by the number of common shares reduced by the number of shares held in treasury.
| | | | | Parent company |
| Quantity of outstanding of shares |
| | | 03.31.24 | | 12.31.23 |
| Beginning balance | | 1,678,656,067 | | 1,078,116,849 |
| Repurchase of shares | | (10,219,600) | | - |
| Issue of shares on 07.13.23 | | - | | 600,000,000 |
| Delivery of restricted shares | | - | | 539,218 |
| Ending balance | | 1,668,436,467 | | 1,678,656,067 |
| 21.2. | Capital reserves and other equity transactions |
The capital reserves contemplate the balances related with results on the sale, issue and exchange of stocks, in compatibility with the Law 6.404/1976 (“Lei das S.A”) – Brazilian Corporate Law.
| Parent company and Consolidated |
| | | 03.31.24 | | 12.31.23 |
| Capital reserves | | 2,763,364 | | 2,763,364 |
| Other equity transactions | | (64,493) | | (70,106) |
| Share-based payments | | 208,987 | | 203,374 |
| Acquisition of non-controlling interest | | (273,260) | | (273,260) |
| Capital transactions with controlled entities | | (220) | | (220) |
On December 7, 2023 the Company's Board of Directors approved the creation of a new program for the acquisition of shares issued by the Company up to the limit of 14,000,000 common shares, within a maximum period of 18 months (“Program”). There were no share buybacks in 2023 under this program.
During the first quarter of 2024, the Company acquired 10,219,600 shares, recorded at the average cost, in units of Reais, of R$13.22, totaling R$135,095.
The Program was completed on April 02, 2024, an event after the reporting period to the closure of the interim financial information for the period ended on March 31, 2024, with the additional repurchase of 3,780,400 shares, totaling the acquisition of the 14,000,000 envisaged in the Program. The repurchased shares were recorded at an average cost, in units of Reais, of R$14.01 per share, totaling R$196,137.
After the end of the Program, the Company now holds 17,817,179 treasury shares, recorded at the average cost, in units of Reais, of R$16.40 per share.
| | | | | Parent company |
| Quantity of outstanding of shares |
| | | 03.31.24 | | 12.31.23 |
| Shares at the beggining of the period | | 3,817,179 | | 4,356,397 |
| Repurchase of shares | | 10,219,600 | | - |
| Delivery of restricted shares | | - | | (539,218) |
| Shares at the end of the period (1) | | 14,036,779 | | 3,817,179 |
| 1. | | Treasury shares are registered at an average cost, in units of Reais, of R$16.47 per share and market value corresponding to R$229,080. |
| | Interim Financial Information, Individual and Consolidated | March 31, 2024 |
| 22. | Earnings (loss) per share |
| | |
| | 2024 | | 2023 |
| | Jan - mar | | Jan - mar |
| Basic numerator | | | |
| Net income (loss) for the period attributable to controlling shareholders | 504,993 | | (1,034,019) |
| Basic denominator | | | |
| Common shares | 1,682,473,246 | | 1,082,473,246 |
| Weighted average number of outstanding shares - basic | 1,670,951,834 | | 1,078,116,849 |
| Net income (loss) per share basic - R$ | 0.30 | | (0.96) |
| | | | |
| | | | |
| Diluted numerator | | | |
| Net earnings (loss) for the period attributable to controlling shareholders | 504,993 | | (1,034,019) |
| | | | |
| Diluted denominator | | | |
| Weighted average number of outstanding shares - basic | 1,670,951,834 | | 1,078,116,849 |
| Number of potential shares | 1,524,354 | | - |
| Weighted average number of outstanding shares - diluted | 1,672,476,188 | | 1,078,116,849 |
| Net income (loss) per share diluted - R$ | 0.30 | | (0.96) |
| 23. | Financial instruments and risk management |
In the ordinary course of business, the Company is exposed to credit, liquidity and market risks, which are actively managed in compliance with the Financial Risk Management Policy (“Risk Policy”) and internal guidelines and strategic documents subject to such policy. The Risk Policy was approved by the Board of Directors on December 7, 2023, valid until the end of 2024 and is available at the Company’s website.
The Company’s risk management strategy, guided by the Risk Policy, has as main objectives:
» To protect the Company’s operating and financial results, as well as its equity from adverse changes in the market prices, particularly commodities, foreign exchange and interests;
» To protect the Company against counterparty risks in existing financial operations as well as to establish guidelines for sustaining the necessary liquidity to fulfil its financial commitments;
» To protect the cash of Company against price volatilities, adverse conditions in the markets in which the Company acts and adverse conditions in its production chain.
The Risk Policy defines the governance of the bodies responsible for the execution, tracking and approval of the risk management strategies, as well as the limits and instruments that can be used.
Additionally, the Management of the Company approved the following policies on November 10, 2021, which are available at the Company’s website:
| | Interim Financial Information, Individual and Consolidated | March 31, 2024 |
» Financial Policy, which aims to: (i) establish guidelines for the management of the Company's financial debt and capital structure; and (ii) guide the Company's decision-making in connection with cash management (financial investments).
» Profit Allocation Policy, which aims to establish the practices adopted by the Company regarding the allocation of its profits, providing, among others, the periodicity of payment of dividends and the baseline used to establish the respective amount.
i) Indebtedness
The ideal capital structure definition at BRF is essentially associated with (i) strong cash position as a tolerance factor for liquidity shocks, which includes minimum cash analysis; (ii) net indebtedness; and (iii) minimization of the capital opportunity cost.
On March 31, 2024, the non-current consolidated gross debt, as presented below, represented 88.26% (87.65% as of December 31, 2023) of the total gross debt, which has an average term higher than eight years.
The Company monitors the gross debt and net debt as set forth below:
| | Consolidated |
| | 03.31.24 | | 12.31.23 |
| | Current | | Non-current | | Total | | Total |
| Foreign currency loans and borrowings | (1,413,628) | | (9,708,832) | | (11,122,460) | | (11,093,385) |
| Local currency loans and borrowings | (847,105) | | (7,867,188) | | (8,714,293) | | (9,002,163) |
| Derivative financial instruments, net | (17,466) | | 440,557 | | 423,091 | | 502,293 |
| Gross debt | (2,278,199) | | (17,135,463) | | (19,413,662) | | (19,593,255) |
| | | | | | | | |
| | | | | | | | |
| Cash and cash equivalents | 9,567,208 | | - | | 9,567,208 | | 9,264,664 |
| Marketable securities | 469,515 | | 272,244 | | 741,759 | | 767,873 |
| Restricted cash | 14,177 | | 74,262 | | 88,439 | | 86,209 |
| | 10,050,900 | | 346,506 | | 10,397,406 | | 10,118,746 |
| Net debt | 7,772,701 | | (16,788,957) | | (9,016,256) | | (9,474,509) |
ii) Derivative financial instruments
Summarized financial position of derivative financial instruments, that aim to protect the risks described below:
| | Interim Financial Information, Individual and Consolidated | March 31, 2024 |
| | | Parent company | | Consolidated |
| | Note | 03.31.24 | | 12.31.23 | | 03.31.24 | | 12.31.23 |
| Assets | | | | | | | | |
| Designated as hedge accounting | | | | | | | | |
| Foreign exchange risk on statement of financial position | 23.2.1 i) | 194 | | - | | 194 | | - |
| Foreign exchange risk on operating income | 23.2.1 ii) | 28,061 | | 103,558 | | 28,061 | | 103,558 |
| Commodities price risk | 23.2.2 | 3,244 | | 5,510 | | 3,244 | | 5,510 |
| Interest rate risk | 23.2.3 | 495,492 | | 529,830 | | 495,492 | | 529,830 |
| Not designated as hedge accounting | | | | | | | | |
| Foreign exchange risk on statement of financial position | 23.2.1 i) | 319 | | 154 | | 319 | | 154 |
| | | 527,310 | | 639,052 | | 527,310 | | 639,052 |
| | | | | | | | | |
| Current assets | | 31,818 | | 109,222 | | 31,818 | | 109,222 |
| Non-current assets | | 495,492 | | 529,830 | | 495,492 | | 529,830 |
| | | | | | | | | |
| Liabilities | | | | | | | | |
| Designated as hedge accounting | | | | | | | | |
| Foreign exchange risk on statement of financial position | 23.2.1 i) | (77,299) | | (52,149) | | (77,299) | | (52,149) |
| Foreign exchange risk on operating income | 23.2.1 ii) | (15,237) | | (7,600) | | (15,237) | | (7,600) |
| Commodities price risk | 23.2.2 | (10,698) | | (14,363) | | (10,698) | | (14,363) |
| Not designated as hedge accounting | | | | | | | | |
| Foreign exchange risk on statement of financial position | 23.2.1 i) | - | | (59,819) | | (985) | | (62,647) |
| | | (103,234) | | (133,931) | | (104,219) | | (136,759) |
| | | | | | | | | |
| Current liabilities | | (48,299) | | (74,112) | | (49,284) | | (76,940) |
| Non-current liabilities | | (54,935) | | (59,819) | | (54,935) | | (59,819) |
| | | | | | | | | |
| Position of derivative financial instruments - net | | 424,076 | | 505,121 | | 423,091 | | 502,293 |
iii) Financial commitments
The table below summarizes the significant commitments and contractual obligations that may impact the Company’s liquidity:
| | Parent company |
| | 03.31.24 |
| | Book
value | | Contractual cash flow | | Up to 12
months | | Apr - Dec
2025 | | 2026 | | 2027 | | 2028 | | 2029 onwards |
| Non derivative financial liabilities | | | | | | | | | | | | | | | |
| Loans and borrowings | 17,438,666 | | 26,368,423 | | 2,983,259 | | 1,593,228 | | 1,649,603 | | 3,826,660 | | 1,571,174 | | 14,744,499 |
| Principal | | | 17,447,549 | | 1,858,084 | | 998,680 | | 763,680 | | 3,007,654 | | 986,728 | | 9,832,723 |
| Interest | | | 8,920,874 | | 1,125,175 | | 594,548 | | 885,923 | | 819,006 | | 584,446 | | 4,911,776 |
| Trade accounts payable | 13,382,549 | | 13,523,191 | | 13,520,747 | | 848 | | 1,596 | | - | | - | | - |
| Lease liabilities | 3,631,745 | | 4,601,184 | | 941,689 | | 556,188 | | 669,442 | | 616,952 | | 440,124 | | 1,376,789 |
| Derivative financial liabilities | | | | | | | | | | | | | | | |
| Financial instruments designated hedge accounting for protection of: |
| Foreign exchange risk | 92,536 | | 92,536 | | 15,237 | | - | | 77,299 | | - | | - | | - |
| Commodities price risk | 10,698 | | 10,698 | | 10,698 | | - | | - | | - | | - | | - |
| | Interim Financial Information, Individual and Consolidated | March 31, 2024 |
| | Consolidated |
| | 03.31.24 |
| | Book
value | | Contractual cash flow | | Up to 12
months | | Apr - Dec
2025 | | 2026 | | 2027 | | 2028 | | 2029 onwards |
| Non derivative financial liabilities | | | | | | | | | | | | | | | |
| Loans and borrowings | 19,836,753 | | 29,062,276 | | 3,273,555 | | 1,654,579 | | 3,987,752 | | 3,830,717 | | 1,571,174 | | 14,744,499 |
| Principal | | | 19,850,669 | | 2,001,548 | | 1,005,101 | | 3,013,704 | | 3,010,865 | | 986,728 | | 9,832,723 |
| Interest | | | 9,211,607 | | 1,272,007 | | 649,478 | | 974,048 | | 819,852 | | 584,446 | | 4,911,776 |
| Trade accounts payable | 11,957,071 | | 12,104,742 | | 12,102,298 | | 848 | | 1,596 | | - | | - | | - |
| Lease liabilities | 4,033,101 | | 5,077,976 | | 1,114,615 | | 645,844 | | 761,529 | | 643,309 | | 460,255 | | 1,452,424 |
| Derivative financial liabilities | | | | | | | | | | | | | | | |
| Financial instruments designated hedge accounting for protection of: |
| Foreign exchange risk | 92,536 | | 92,536 | | 15,237 | | - | | 77,299 | | - | | - | | - |
| Commodities price risk | 10,698 | | 10,698 | | 10,698 | | - | | - | | - | | - | | - |
| Financial instruments not designated as hedge accounting for protection of: |
| Foreign exchange risk | 985 | | 985 | | 985 | | - | | - | | - | | - | | - |
The Company does not expect that the cash outflows to fulfill the obligations shown above will be significantly anticipated by factors unrelated to its best interests, or have its value substantially modified outside the normal course of business.
| 23.2. | Market risk management |
| 23.2.1. | Foreign exchange risk |
The risk is the one that may cause unexpected losses to the Company resulting from volatility of the FX rates, reducing its assets and revenues, or increasing its liabilities and costs. The Company’s exposure is managed in three dimensions: statement of financial position exposure, operating income exposure and investments exposure.
i) Statement of financial position exposure
The Risk Policy regarding statement of financial position exposure has the objective to balance assets and liabilities denominated in foreign currencies, hedging the Company’s statement of financial position by using natural hedges, over-the-counter derivatives and exchange traded futures.
Assets and liabilities denominated in foreign currency for which the exchange variations are recognized in the Financial Results are as follows, summarized in Brazilian Reais:
| | | Consolidated |
| | | 03.31.24 | | 12.31.23 |
| Cash and cash equivalents | | 3,233,120 | | 2,970,268 |
| Trade accounts receivable | | 4,918,438 | | 4,788,635 |
| Trade accounts payable | | (1,029,309) | | (1,195,133) |
| Loans and borrowings | | (8,760,881) | | (8,715,484) |
| Other assets and liabilities, net | | 100,092 | | (30,310) |
| Exposure of assets and liabilities in foreign currencies | | (1,538,540) | | (2,182,024) |
| Derivative financial instruments (hedge) | | 1,948,518 | | 2,033,346 |
| Exposure in result, net | | 409,978 | | (148,678) |
| | Interim Financial Information, Individual and Consolidated | March 31, 2024 |
The net exposure in Reais is mainly composed of the following currencies:
| Net Exposure (1) | | 03.31.24 | | 12.31.23 |
| U.S. Dollars (USD) | | (106,076) | | (513,164) |
| Euros (EUR) | | (59,330) | | (25,050) |
| Yen (JPY) | | (968) | | (1,241) |
| Angolan kwanza (AOA) | | 200,793 | | 97,368 |
| Turkish Liras (TRY) | | 115,749 | | 76,439 |
| Argentinian Peso (ARS) | | (3,389) | | (3,146) |
| Chilean Pesos (CLP) | | 263,199 | | 220,116 |
| Total | | 409,978 | | (148,678) |
| (1) | The Company is exposed to other currencies, although they have been grouped in the currencies above due to its high correlation or for not being individually significant. |
The Company holds more financial liabilities in foreign currencies than assets and, therefore, holds derivative financial instruments to reduce such exposure.
As a result of this protection strategy the Company recognized as Financial Expenses in the Consolidate an income of foreign exchange of derivatives of R$73,185 for the three-month period ended on March 31, 2024 (expense of R$108,804 in the same period of the previous year). This derivative result offsets a foreign exchange expense over assets and liabilities in the Consolidate of R$79,211 for the three-month period ended on March 31, 2024 (income of R$143,194 in the same period of the previous year).
The derivative financial instruments acquired to hedge the foreign currency statement of financial position exposure on March 31, 2024 and are set forth below:
| 03.31.24 |
| Derivative instruments not designated | | Asset | | Liability | | Maturity | | Notional | | Exercise rate | | Fair value (R$) |
| Parent company | | | | | | | | | | | | | |
| Futures | | BRL / USD | | USD / BRL | | 2nd Qtr. 2024 | | USD | (355.000) / 355.000 | | 4.9962 | | 319 |
| | | | | | | | | | | | | | 319 |
| | | | | | | | | | | | | | |
| Subsidiaries | | | | | | | | | | | | | |
| Non-deliverable forward | | EUR | | TRY | | 2nd Qtr. 2024 | | EUR | 2,500 | | 35.9150 | | (340) |
| Non-deliverable forward | | USD | | TRY | | 2nd Qtr. 2024 | | USD | 10,000 | | 34.9213 | | (78) |
| Non-deliverable forward | | USD | | AOA | | 2nd Qtr. 2024 | | USD | 2,000 | | 893.0000 | | (567) |
| | | | | | | | | | | | | | (985) |
| | | | | | | | | | | | | | |
| Total Consolidated | | | | | | | | | | | | | (666) |
| 03.31.24 |
| | | | | | | | | | | | | | Fair value (R$) |
| Derivative instruments designated - Fair value hedge | | Hedged Object | | Maturity | | Asset | | Liability | | Notional | | Instrument | | Object (1) |
| Parent company and Consolidated | | | | | | | | | | | | | |
| FX and interest rate swap | | USD debt | | 2nd Qtr. 2024 | | FX + 6.32% p.a. | | 100% CDI + 1,61% p.a. | | 130,000 | USD | (22,170) | | (4,122) |
| | | | | | | | | | | 130,000 | | | (22,170) | | (4,122) |
| (1) | Corresponds to the accumulated amount of fair value hedge adjustments on the hedged items. |
| | Interim Financial Information, Individual and Consolidated | March 31, 2024 |
| 03.31.24 |
| Cash flow hedge - Derivative instruments | | Hedged object | | Maturity | | Asset | | Liability | | Notional | | Instrument | | Fair value (2) |
| Parent company and consolidated | | | | | | | | | | | | | | | |
| FX and interest rate swap | | USD debt | | 3rd Qtr. 2026 | | FX + 4.35% p.a. | | 86.52% CDI | | USD | 145,000 | | (38,089) | | 2,996 |
| FX and interest rate swap | | USD debt | | 3rd Qtr. 2026 | | FX + 4.35% p.a. | | CDI - 0.51% | | USD | 115,000 | | (16,846) | | 2,443 |
| | | | | | | | | | | | | | | | |
| | | | | | | | | | | | 260,000 | | (54,935) | | 5,439 |
| (2) | Correspond to the not realized portion of the hedge which is registered in Other comprehensive income. |
ii) Operating income exposure
The Risk Policy regarding operating income exposure has the objective to hedge revenues and costs denominated in foreign currencies. The Company is supported by internal models to measure and monitor these risks, and uses financial instruments for hedging, designating the relations as cash flow hedges.
The Company has more sales in foreign currency than expenditures and, therefore, holds derivative financial instruments to reduce such exposure.
As a result of this protection strategy the Company recognized in the Consolidate Net Revenue an income of R$47,437 for the three-month period ended on March 31, 2024 (R$55,206 in the same period of the previous year).
The derivative financial instruments designated as cash flow hedges for foreing exchange operating income exposure on March 31, 2024 are set forth below:
| 03.31.24 |
| Cash flow hedge - Derivative instruments | | Hedged object | | Asset | | Liability | | Maturity | | Notional | | Designation rate | | Fair value (1) |
| Parent company and consolidated | | | | | | | | | | | | | | | |
| Non-deliverable forward | | USD Exports | | BRL | | USD | | 2nd Qtr. 2024 | | USD | 65,500 | | 5.1633 | | 8,557 |
| Non-deliverable forward | | USD Exports | | BRL | | USD | | 3rd Qtr. 2024 | | USD | 45,500 | | 5.2487 | | 7,647 |
| Non-deliverable forward | | USD Exports | | BRL | | USD | | 4rd Qtr. 2024 | | USD | 46,000 | | 5.1134 | | (21) |
| Non-deliverable forward | | USD Exports | | BRL | | USD | | 1st Qtr. 2025 | | USD | 20,500 | | 5.1583 | | 154 |
| Collar | | USD Exports | | BRL | | USD | | 2nd Qtr. 2024 | | USD | 320,000 | | 5.0234 | | (2,792) |
| Collar | | USD Exports | | BRL | | USD | | 3rd Qtr. 2024 | | USD | 55,000 | | 5.0698 | | (721) |
| | | | | | | | | | | | 552,500 | | | | 12,824 |
| (1) | Correspond to the not realized portion of the hedge which is registered in Other comprehensive income. |
iii) Investments exposure
The Company holds both investments (net assets) and loans (financial liabilities) denominated in foreign currency. To balance the accounting effects of such exposures, some non-derivative financial liabilities are designated as hedging instruments for the investments exposure.
As a result of this strategy, the Company recognized expense of R$38,880, net of income tax, under Other comprehensive income for the three-month period ended on March 31, 2024 (R$52,942 in the same period of the previous year).
The non-derivative financial instruments designated as net investment hedge instruments on March 31, 2024 are set forth below:
| | Interim Financial Information, Individual and Consolidated | March 31, 2024 |
| 03.31.24 |
Net investment hedge -
Non-derivative instruments | | Object (Investment) | | Liability | | Maturity | | Notional | | Rate | | Exchange variation (1) |
| Parent company and consolidated | | | | | | | | | | | | | |
| Bond - BRF SA BRFSBZ 4.35 | | Federal Foods LLC | | USD | | 3rd Qtr. 2050 | | USD (2) | 44,158 | | 3.7649 | | (89,249) |
| Bond - BRF SA BRFSBZ 4.35 | | BRF Kuwait Food Management Company WLL | | USD | | 3rd Qtr. 2050 | | USD (2) | 88,552 | | 3.7649 | | (109,915) |
| Bond - BRF SA BRFSBZ 4.35 | | Al Khan Foodstuff LLC | | USD | | 3rd Qtr. 2050 | | USD (2) | 53,446 | | 3.7649 | | (78,464) |
| Bond - BRF SA BRFSBZ 4.35 | | BRF Foods GmbH | | USD | | 3rd Qtr. 2050 | | USD (3) | 170,721 | | 5.1629 | | 6,694 |
| Bond - BRF SA BRFSBZ 4.35 | | Al-Wafi Al-Takamol International for Foods Products | | USD | | 3rd Qtr. 2050 | | USD (3) | 23,426 | | 5.1629 | | 5,011 |
| | | | | | | | | | 380,303 | | | | (265,923) |
| (1) | Corresponds to the effective portion of the hedge result accumulated in Other Comprehensive Income. |
| (2) | Designated on August 1st, 2019. |
| (3) | Designated on November 9, 2022. |
| 23.2.2. | Commodities price risk |
The Company uses commodities as production inputs and is exposed to commodities price risk arising from future purchases. The management of such risk is performed through physical inventories, future purchases at fixed price and through derivative financial instruments.
The Risk Policy establishes coverage limits to the flow of purchases of corn, meal and soy, soybeans and soybean oil with the purpose of reducing the impact due to a price increase of these raw materials. The hedge may be reached using derivatives or by inventory management.
As a result of this protection strategy the Company recognized in the Consolidate Cost of goods sold an expense of R$120,742 for the three-month period ended on March 31, 2024 (income of R$14,413 in the same period of the previous year).
The Company performs purchases at variable prices in future and spot markets and, to hedge such exposure, it holds derivative financial instruments in long position (buy) to fix these prices in advance.
The financial instruments designated as cash flow hedges for the variable commodities price exposure on March 31, 2024 are set forth below:
| 03.31.24 |
| Cash flow hedge - Derivative instruments | | Hedged object | | Index | | Maturity | | Quantity | | Exercise price (1) | | Fair value |
| Parent company and consolidated | | | | | | | | | | | | | |
| Collar - buy | | Soybean meal purchase - floating price | | Soybean meal - CBOT | | 2nd Qtr. 2024 | | 9,997 | ton | | 435.41 | | (2,279) |
| Collar - buy | | Corn purchase - floating price | | Corn - CBOT | | 2nd Qtr. 2023 | | 35,003 | ton | | 175.22 | | 22 |
| Collar - buy | | Corn purchase - floating price | | Corn - B3 | | 2nd Qtr. 2024 | | 167,130 | ton | | 1,091.30 | | (3,040) |
| Collar - buy | | Corn purchase - floating price | | Corn - B3 | | 3rd Qtr. 2024 | | 75,600 | ton | | 1,027.68 | | 298 |
| Non-deliverable forward - buy | | Soybean oil purchase - floating price | | Soybean oil - CBOT | | 2nd Qtr. 2024 | | 6,001 | ton | | 1,107.23 | | (1,257) |
| Non-deliverable forward - buy | | Soybean oil purchase - floating price | | Soybean oil - CBOT | | 3rd Qtr. 2024 | | 4,001 | ton | | 1,094.04 | | (488) |
| | | | | | | | | 297,732 | | | | | (6,744) |
| (1) | Base price of each commodity in USD/ton, except for Corn – B3 denominated in R$/ton. |
In certain cases, the Company performs futures purchases at fixed prices and, to hedge such exposure, it holds derivative financial instruments in short position (sell) to keep these prices at market value. The financial instruments designated as fair value hedges for the fixed commodities price exposure on March 31, 2024 are set forth below:
| | Interim Financial Information, Individual and Consolidated | March 31, 2024 |
| 03.31.24 |
| Fair value hedge - Derivative instruments | | Hedged object | | Index | | Maturity | | Quantity | | Exercise price (1) | | Fair value |
| Parent company and consolidated | | | | | | | | | | | | | |
| Corn future - sell | | Corn purchase - fixed price | | Corn - B3 | | 3rd Qtr. 2024 | | 58,401 | ton | | 1,015.93 | | (665) |
| Corn future - sell | | Corn purchase - fixed price | | Corn - B3 | | 1st. Qtr. 2025 | | 4,995 | ton | | 1,116.67 | | (72) |
| Corn future - sell | | Corn purchase - fixed price | | Corn - B3 | | 3rd Qtr. 2025 | | 2,889 | ton | | 1,059.34 | | 27 |
| | | | | | | | | 66,285 | | | | | (710) |
| (1) | Base price of each commodity in USD/ton, except for Corn – B3 denominated in R$/ton. |
The open and liquidated derivative financial instrument represent effects in the statement of financial position of: i) Consolidate Inventory a credit in the amount of R$41,538 on March 31, 2024 (R$95,986 on December 31, 2023); ii) Other comprehensive income a debit in the amount of R$61,455 on March 31, 2024 (credit of R$322 on December 31, 2023).
| 23.2.3. | Interest rate risk |
The interest rate risk may cause economic losses to the Company resulting from volatility in interest rates that affect its assets and liabilities.
The Company’s Risk Policy does not restrict exposure to different interest rates, neither establishes limits for fixed or floating rates. However, the Company continually monitors the market interest rates in order to evaluate any need to enter into hedging transactions to protect from the volatility of such rates and manage the mismatch between its financial assets and liabilities.
As a result of this protection strategy the Company recognize in the Consolidated Financial Income and Expenses an income of R$105,375 for the three-month period ended on March 31, 2024 (expense of R$13,509 in the same period of the previous year).
The derivative financial instruments used to hedge the exposure to interest rates as of March 31, 2024 are presented in the table below:
| 03.31.24 |
| | | | | | | | | | | | | | Fair value (R$) |
| Fair value hedge - Derivative instruments | | Hedged Object | | Maturity | | Asset | | Liability | | Notional | | Instrument | | Object (1) |
| Parent company and Consolidated | | | | | | | | | | | | | |
| Interest rate swap | | Debenture - 1st issue - 3rd series - IPCA + 5.50% p.a. | | 2nd Qtr. 2026 | | IPCA + 5.50% p.a. | | CDI + 0.57% p.a. | | 200,000 | BRL | 31,273 | | (7,816) |
| Interest rate swap | | Debenture - 1st issue - 3rd series - IPCA + 5.50% p.a. | | 2nd Qtr. 2026 | | IPCA + 5.50% p.a. | | 100% of CDI | | 200,000 | BRL | 25,782 | | (9,179) |
| Interest rate swap | | Debenture - 2nd issue - 1st series - IPCA + 5.30% p.a. | | 3rd Qtr. 2027 | | IPCA + 5.30% p.a. | | CDI + 2.20% p.a. | | 400,000 | BRL | 73,658 | | 21,379 |
| Interest rate swap | | Debenture - 2nd issue - 2nd series - IPCA + 5.60% p.a. | | 3rd Qtr. 2030 | | IPCA + 5.60% p.a. | | CDI + 2.29% p.a. | | 595,000 | BRL | 90,346 | | 102,765 |
| Interest rate swap | | Debenture - 3rd issue - single series - IPCA + 4.78% p.a. | | 2nd Qtr. 2031 | | IPCA + 4.78% p.a. | | CDI + 0,12% a.a. | | 1,000,000 | BRL | 133,606 | | (4,295) |
| Interest rate swap | | Debenture - 1st issue - 1ª series - IPCA + 6.83% p.a. | | 3rd Qtr. 2032 | | IPCA + 6.83% p.a. | | 109,32% of CDI | | 990,000 | BRL | 140,827 | | (84,711) |
| | | | | | | | | | | 3,385,000 | | | 495,492 | | 18,143 |
| (1) | Corresponds to the accumulated amount of fair value hedge adjustments on the hedged items, included in the carrying amount of the debentures. |
| 23.3. | Credit risk management |
| | Interim Financial Information, Individual and Consolidated | March 31, 2024 |
The Company is exposed to the credit risk related to the financial assets held: trade and non-trade accounts receivable, marketable securities, derivative instruments and cash and equivalents. The Company’s credit risk exposure can be assessed in notes 4, 5 and 6.
| 23.3.1. | Credit risk in accounts receivable |
The credit risk associated with trade accounts receivable is actively managed through specific systems and is supported by internal policies for credit analysis. The significant level of diversification and geographical dispersion of the customer portfolio significantly reduces the risk. However, the Company chooses to complement the risk management by contracting insurance policies for specific markets. The impairment of these financial assets is carried out based on expected credit losses.
| 23.3.2. | Counterparty credit risk |
The credit risk associated with marketable securities, cash and cash equivalents and derivative instruments in general is directed to counterparties with Investment Grade ratings. The maintenance of assets with counterparty risk is constantly assessed according to credit ratings and the Company’s portfolio concentration, aligned with the applicable impairment requisites.
| 23.4. | Capital management and liquidity risk |
The Company is exposed to liquidity risk as far as it needs cash or other financial assets to settle its obligations in the respective terms. The Company’s cash and liquidity strategy takes into consideration historical volatility scenarios of results as well as simulations of sectorial and systemic crisis. It is grounded on allowing resilience in scenarios of capital restriction.
| 23.5. | Sensitivity analysis |
Management believes that the most relevant risks that may affect the Company’s results, for which it uses derivative financial instruments to protect, are the volatility of commodities prices, foreign exchange rates and interest rates.
For the probable scenario of commodities, Management uses as a reference the future value of assets on March 31, 2024 and therefore understands that there will be no changes in the results of operations. As for the exchange rate, Management uses the Focus report for the American Dollar as a reference inserting the quotes for the current and subsequent years. The likely scenario for other currencies is determined based on the US Dollar parity.
In the possible and remote scenarios, both positive and negative variations of 15% and 30% respectively were considered in both cases from the probable scenario. Such sensitivity scenarios originate from information and assumptions used by Management in monitoring the previously mentioned risks.
The information used in the preparation of the analysis is based on the position as of March 31, 2024, which has been described in the items above. The estimated values may differ significantly to numbers and results that will be effectively registered by the Company. Positive values indicate gains and negative values indicate losses.
| | Interim Financial Information, Individual and Consolidated | March 31, 2024 |
| | | Scenario |
| | | Remote | | Possible | | Probable | | Possible | | Remote |
| Exchange rate - Balance | | - 30% | | - 15% | | | | + 15% | | + 30% |
| USD | | 3.4738 | | 4.2181 | | 4.9625 | | 5.7069 | | 6.4513 |
| | | | | | | | | | | |
| Monetary assets and liabilities | | 644,349 | | 329,306 | | 14,263 | | (300,780) | | (615,823) |
| Derivative instruments - not designated | | (612,025) | | (312,786) | | (13,547) | | 285,691 | | 584,930 |
| Net effect | | 32,324 | | 16,520 | | 716 | | (15,089) | | (30,893) |
| | | | | | | | | | | |
| EUR | | 3.7633 | | 4.5697 | | 5.3761 | | 6.1825 | | 6.9889 |
| | | | | | | | | | | |
| Monetary assets and liabilities | | 22,053 | | 11,174 | | 294 | | (10,585) | | (21,465) |
| Derivative instruments - not designated | | (4,087) | | (2,071) | | (55) | | 1,962 | | 3,978 |
| Net effect | | 17,966 | | 9,103 | | 239 | | (8,623) | | (17,487) |
| | | | | | | | | | | |
| JPY | | 0.0230 | | 0.0279 | | 0.0328 | | 0.0377 | | 0.0426 |
| | | | | | | | | | | |
| Monetary assets and liabilities | | 295 | | 151 | | 7 | | (138) | | (282) |
| Net effect | | 295 | | 151 | | 7 | | (138) | | (282) |
| | | | | | | | | | | |
| TRY | | 0.1072 | | 0.1302 | | 0.1532 | | 0.1762 | | 0.1992 |
| | | | | | | | | | | |
| Monetary assets and liabilities | | (55,142) | | (28,557) | | (1,972) | | 24,613 | | 51,198 |
| Derivative instruments - not designated | | 19,526 | | 10,112 | | 698 | | (8,716) | | (18,129) |
| Net effect | | (35,616) | | (18,445) | | (1,274) | | 15,897 | | 33,069 |
| | | | | | | | | | | |
| | | | | | | | | | | |
| AOA | | 0.0041 | | 0.0050 | | 0.0059 | | 0.0068 | | 0.0076 |
| | | | | | | | | | | |
| Monetary assets and liabilities | | (64,157) | | (32,736) | | (1,316) | | 30,105 | | 61,525 |
| Derivative instruments - not designated | | 3,041 | | 1,552 | | 62 | | (1,427) | | (2,917) |
| Net effect | | (61,116) | | (31,184) | | (1,254) | | 28,678 | | 58,608 |
| | | | | | | | | | | |
| ARS | | 0.0041 | | 0.0049 | | 0.0058 | | 0.0067 | | 0.0076 |
| | | | | | | | | | | |
| Monetary assets and liabilities | | 1,024 | | 518 | | 11 | | (495) | | (1,002) |
| Net effect | | 1,024 | | 518 | | 11 | | (495) | | (1,002) |
| | | | | | | | | | | |
| CLP | | 0.0036 | | 0.0043 | | 0.0051 | | 0.0058 | | 0.0066 |
| | | | | | | | | | | |
| Monetary assets and liabilities | | (79,485) | | (40,117) | | (400) | | 32,557 | | 65,515 |
| Net effect | | (79,485) | | (40,117) | | (400) | | 32,557 | | 65,515 |
| | | Scenario |
| | | Remote | | Possible | | Probable | | Possible | | Remote |
| Exchange rate - Operating results | | - 30% | | - 15% | | | | + 15% | | + 30% |
| USD | | 3.4738 | | 4.2181 | | 4.9625 | | 5.7069 | | 6.4513 |
| | | | | | | | | | | |
| Revenue in USD | | (841,154) | | (429,886) | | (18,619) | | 392,648 | | 803,915 |
| NDF | | 270,235 | | 138,108 | | 5,982 | | (126,145) | | (258,271) |
| Collar | | 539,143 | | 257,893 | | (57) | | (235,432) | | (516,682) |
| Net effect | | (31,776) | | (33,885) | | (12,694) | | 31,071 | | 28,962 |
| | Interim Financial Information, Individual and Consolidated | March 31, 2024 |
| | | Scenario |
| | | Remote | | Possible | | Probable | | Possible | | Remote |
| Exchange rate - Operating results | | - 30% | | - 15% | | | | + 15% | | + 30% |
| Soybean meal - CBOT | | 263 | | 320 | | 376 | | 432 | | 489 |
| | | | | | | | | | | |
| Cost of sales | | 1,127 | | 564 | | - | | (564) | | (1,127) |
| Collar | | (1,127) | | (564) | | - | | 375 | | 687 |
| Net effect | | - | | - | | - | | (189) | | (440) |
| | | | | | | | | | | |
| Soybean oil - CBOT | | 747 | | 907 | | 1,067 | | 1,227 | | 1,387 |
| | | | | | | | | | | |
| Cost of sales | | 3,200 | | 1,600 | | - | | (1,600) | | (3,200) |
| NDF | | (3,200) | | (1,600) | | - | | 1,600 | | 3,200 |
| Net effect | | - | | - | | - | | - | | - |
| | | | | | | | | | | |
| Corn - CBOT | | 122 | | 148 | | 174 | | 200 | | 226 |
| | | | | | | | | | | |
| Cost of sales | | 1,827 | | 914 | | - | | (914) | | (1,827) |
| Collar | | (1,307) | | (394) | | - | | 310 | | 1,223 |
| Net effect | | 520 | | 520 | | - | | (604) | | (604) |
| | | | | | | | | | | |
| Corn - B3 | | 712 | | 864 | | 1,017 | | 1,170 | | 1,322 |
| | | | | | | | | | | |
| Cost of sales | | 53,834 | | 26,917 | | - | | (26,917) | | (53,834) |
| Collar | | (55,208) | | (18,359) | | - | | 10,329 | | 33,909 |
| Future | | 20,585 | | 10,292 | | - | | (10,292) | | (20,585) |
| Net effect | | 19,211 | | 18,850 | | - | | (26,880) | | (40,510) |
| | Interim Financial Information, Individual and Consolidated | March 31, 2024 |
| 23.6. | Financial instruments by category |
| | Parent company |
| | 03.31.24 |
| | Amortized cost | | Fair value through profit and loss | | Total |
| Assets | | | | | |
| Cash and bank | 177,761 | | - | | 177,761 |
| Cash equivalents | - | | 4,346,183 | | 4,346,183 |
| Marketable securities | - | | 441,162 | | 441,162 |
| Restricted cash | 31,732 | | - | | 31,732 |
| Trade accounts receivable | 4,030,143 | | 252,770 | | 4,282,913 |
| Notes receivables | 59,551 | | - | | 59,551 |
| Derivatives not designated | - | | 319 | | 319 |
| Derivatives designated as hedge accounting (1) | - | | 526,991 | | 526,991 |
| | | | | | |
| Liabilities | | | | | |
| Trade accounts payable | (13,382,549) | | - | | (13,382,549) |
| Loans and borrowings (2) | (12,616,647) | | (4,822,019) | | (17,438,666) |
| Derivatives not designated | - | | - | | - |
| Derivatives designated as hedge accounting (1) | - | | (103,234) | | (103,234) |
| | (21,700,009) | | 642,172 | | (21,057,837) |
| (1) | All derivatives are classified at fair value through profit and loss. Those designated as hedge accounting instruments have their gains and losses also affecting Equity and Inventories. |
| (2) | The part of the loans and borrowings that is object in a fair value hedge is classified as Fair value through profit and loss. The rest of the loans and borrowings balance is classified as amortized cost and those designated as cash flow or net investment hedge accounting instruments have their gains and losses also affecting Equity. |
| | Consolidated |
| | 03.31.24 |
| | Amortized cost | | FVTOCI (3) | | Fair value through profit and loss | | Total |
| | | Equity instruments | | |
| Assets | | | | | | | |
| Cash and bank | 1,569,704 | | - | | - | | 1,569,704 |
| Cash equivalents | - | | - | | 7,997,504 | | 7,997,504 |
| Marketable securities | 241,516 | | 12,491 | | 487,752 | | 741,759 |
| Restricted cash | 88,439 | | - | | - | | 88,439 |
| Trade accounts receivable | 4,037,008 | | - | | 252,770 | | 4,289,778 |
| Notes receivables | 59,551 | | - | | - | | 59,551 |
| Derivatives not designated | - | | - | | 319 | | 319 |
| Derivatives designated as hedge accounting (1) | - | | - | | 526,991 | | 526,991 |
| | | | | | | | |
| Liabilities | | | | | | | |
| Trade accounts payable | (11,957,071) | | - | | - | | (11,957,071) |
| Loans and borrowings (2) | (15,014,734) | | - | | (4,822,019) | | (19,836,753) |
| Derivatives not designated | - | | - | | (985) | | (985) |
| Derivatives designated as hedge accounting (1) | - | | - | | (103,234) | | (103,234) |
| | (20,975,587) | | 12,491 | | 4,339,098 | | (16,623,998) |
| (1) | All derivatives are classified at fair value through profit and loss. Those designated as hedge accounting instruments have their gains and losses also affecting Equity and Inventories. |
| (2) | The part of the loans and borrowings that is object in a fair value hedge is classified as Fair value through profit and loss. The rest of the loans and borrowings balance is classified as amortized cost and those designated as cash flow or net investment hedge accounting instruments have their gains and losses also affecting Equity. |
| (3) | FVTOCI: Fair Value Through Other Comprehensive Income. |
| | Interim Financial Information, Individual and Consolidated | March 31, 2024 |
| 23.7. | Fair value of financial instruments |
The fair value is the price that would be received to sell an asset or paid to transfer a liability in an orderly transaction between market participants at the measurement date.
Depending on the inputs used for measurement, the financial instruments at fair value may be classified into 3 hierarchy levels:
» Level 1 - Uses quoted prices (unadjusted) for identical instruments in active markets. In this category are classified investments in stocks, savings accounts, overnights, term deposits, Financial Treasury Bills (“LFT”) and investment funds;
» Level 2 - Uses prices quoted in active markets for similar instruments, prices quoted for identical or similar instruments in non-active markets and evaluation models for which inputs are observable. In this level are classified the investments in Bank Deposit Certificates (“CDB”) and derivatives, which are measured by well-known pricing models: discounted cash flows and Black-Scholes. The observable inputs are interest rates and curves, volatility factors and foreign exchange rates;
» Level 3 - Instruments for which significant inputs are non-observable. The Company does not have financial instruments in this category.
The table below presents the overall classification of financial instruments accounted at fair value by measurement hierarchy. For the three-month period ended on March 31, 2024, there were no changes among the 3 levels of hierarchy.
| | Parent company |
| | 03.31.24 | | 12.31.23 |
| | Level 1 | | Level 2 | | Total | | Level 1 | | Level 2 | | Total |
| Financial Assets | | | | | | | | | | | |
| Fair value through profit and loss | | | | | | | | | | | |
| Savings account and overnight | 23,434 | | - | | 23,434 | | 11,359 | | - | | 11,359 |
| Term deposits | - | | - | | - | | - | | - | | - |
| Bank deposit certificates | - | | 4,318,422 | | 4,318,422 | | - | | 4,438,970 | | 4,438,970 |
| Financial treasury bills | 422,925 | | - | | 422,925 | | 412,107 | | - | | 412,107 |
| Investment funds | 22,564 | | - | | 22,564 | | 21,166 | | - | | 21,166 |
| Trade accounts receivable | - | | 252,770 | | 252,770 | | - | | 337,898 | | 337,898 |
| Derivatives | - | | 527,310 | | 527,310 | | - | | 639,052 | | 639,052 |
| Financial Liabilities | | | | | | | | | | | |
| Fair value through profit and loss | | | | | | | | | | | |
| Derivatives | - | | (103,234) | | (103,234) | | - | | (133,931) | | (133,931) |
| Loans and borrowings | - | | (4,822,019) | | (4,822,019) | | - | | (5,021,342) | | (5,021,342) |
| | 468,923 | | 173,249 | | 642,172 | | 444,632 | | 260,647 | | 705,279 |
| | Interim Financial Information, Individual and Consolidated | March 31, 2024 |
| | Consolidated |
| | 03.31.24 | | 12.31.23 |
| | Level 1 | | Level 2 | | Total | | Level 1 | | Level 2 | | Total |
| Financial Assets | | | | | | | | | | | |
| Fair value through other comprehensive income | | | | | | | | | | | |
| Stocks | 12,491 | | - | | 12,491 | | 12,103 | | - | | 12,103 |
| Fair value through profit and loss | | | | | | | | | | | |
| Savings account and overnight | 232,467 | | - | | 232,467 | | 17,570 | | - | | 17,570 |
| Term deposits | 3,130,272 | | - | | 3,130,272 | | 2,758,300 | | - | | 2,758,300 |
| Bank deposit certificates | - | | 4,630,438 | | 4,630,438 | | - | | 4,876,861 | | 4,876,861 |
| Financial treasury bills | 422,925 | | - | | 422,925 | | 412,107 | | - | | 412,107 |
| Investment funds | 22,564 | | - | | 22,564 | | 21,186 | | - | | 21,186 |
| Trade accounts receivable | - | | 252,770 | | 252,770 | | - | | 337,898 | | 337,898 |
| Derivatives | - | | 527,310 | | 527,310 | | - | | 639,052 | | 639,052 |
| Other titles | 46,590 | | - | | 46,590 | | 35,751 | | - | | 35,751 |
| Financial Liabilities | | | | | | | | | | | |
| Fair value through profit and loss | | | | | | | | | | | |
| Derivatives | - | | (104,219) | | (104,219) | | - | | (136,759) | | (136,759) |
| Loans and borrowings | - | | (4,822,019) | | (4,822,019) | | - | | (5,021,342) | | (5,021,342) |
| | 3,867,309 | | 484,280 | | 4,351,589 | | 3,257,017 | | 695,710 | | 3,952,727 |
Except for the items set forth below, the fair value of all other financial instruments is approximate to their book value. The fair value of the bonds set forth below is based on prices observed in active markets, level 1 of the fair value hierarchy, while the debentures are based on level 2 and are measured by discounted cash flows.
| | | | | Parent company and Consolidated |
| | | | | | | 03.31.24 | | 12.31.23 |
| | | Currency | | Maturity | | Book
value | | Fair
value | | Book
value | | Fair
value |
| BRF S.A. | | | | | | | | | | | | |
| BRF SA BRFSBZ 4 7/8 | | USD | | 2030 | | (2,949,157) | | (2,647,956) | | (2,896,104) | | (2,506,390) |
| BRF SA BRFSBZ 5 3/4 | | USD | | 2050 | | (3,260,891) | | (2,686,207) | | (3,209,653) | | (2,398,081) |
| Debenture - 1st issue | | BRL | | 2026 | | (849,869) | | (831,533) | | (830,144) | | (853,640) |
| Debenture - 2nd issue | | BRL | | 1st serie 2027 and 2nd series 2030 | | (2,678,647) | | (2,988,100) | | (2,681,294) | | (3,048,882) |
| Debenture - 3rd issue | | BRL | | 2031 | | (1,203,852) | | (1,203,852) | | (1,214,044) | | (1,214,044) |
| Debenture - 4rd issue | | BRL | | 1st serie 2027 and 2nd series 2032 | | (1,840,421) | | (2,017,201) | | (1,908,952) | | (2,032,361) |
| Parent company | | | | | | (12,782,837) | | (12,374,849) | | (12,740,191) | | (12,053,398) |
| | | | | | | | | | | | | |
| BRF GmbH | | | | | | | | | | | | |
| BRF SA BRFSBZ 4.35 | | USD | | 2026 | | (1,485,710) | | (1,430,213) | | (1,453,805) | | (1,360,530) |
| Consolidated | | | | | | (14,268,547) | | (13,805,062) | | (14,193,996) | | (13,413,928) |
| | Interim Financial Information, Individual and Consolidated | March 31, 2024 |
The operating segments are reported consistently with the management reports provided to the main strategic and operational decision makers for assessing the performance of each segment and allocation of resources. The operating segments information is prepared considering three reportable segments, being: Brazil, International and Other segments.
The operating segments include the sales of all distribution channels and are subdivided according to the nature of the products, for which the characteristics are described below:
| » | | In-natura: production and sale of whole poultry and cuts and pork and other cuts. |
| » | | Semi-processed: production and sale of cooked, smoked, marinated and/or seasoned in natura foods. |
| » | | Processed: production and sale of processed food, frozen and processed products derived from poultry, pork and beef, margarine, vegetables and soybean-based products. |
| » | | Other sales: sale of flour for food service and others. |
Other segments are comprised of commercialization and development of animal nutrition ingredients, human nutrition, plant nutrition (fertilizers), healthcare (health and wellness), pet food, as well as commercialization of agricultural products.
The items not allocated to the segments are presented as Corporate and refer to relevant events not attributable to the operating segments.
The net sales by nature for each reportable operating segment is set forth below:
| | | Consolidated |
| | | 2024 | | 2023 |
| Net sales | | Jan - mar | | Jan - mar |
| Brazil | | | | |
| In-natura | | 1,585,165 | | 1,514,420 |
| Semi-processed (1) | | 444,185 | | 424,959 |
| Processed | | 4,124,098 | | 4,349,734 |
| Other sales | | 8,942 | | 129,159 |
| | | 6,162,390 | | 6,418,272 |
| | | | | |
| International | | | | |
| In-natura | | 5,535,817 | | 5,222,178 |
| Semi-processed (1) | | 123,529 | | 82,252 |
| Processed | | 786,958 | | 792,157 |
| Other sales | | 38,792 | | 32,851 |
| | | 6,485,096 | | 6,129,438 |
| | | | | |
| Other segments | | 730,023 | | 630,259 |
| | | 13,377,509 | | 13,177,969 |
| (1) | The Company, during the first quarter of 2024, included a new type of products called “semi-processed”, thus, the 2023 numbers were restated. |
The gross profit and income (loss) before financial results for each segment and for Corporate are set forth below:
| | Interim Financial Information, Individual and Consolidated | March 31, 2024 |
| | | | | | | | Consolidated |
| | | Gross profit | | Income (loss) before financial results and income taxes |
| | | 2024 | | 2023 | | 2024 | | 2023 |
| | | Jan - mar | | Jan - mar | | Jan - mar | | Jan - mar |
| Brazil | | 1,587,074 | | 1,146,423 | | 514,696 | | 136,188 |
| Margin (%) | | 25.8% | | 17.9% | | 8.4% | | 2.1% |
| International | | 1,463,273 | | 351,334 | | 671,513 | | (495,454) |
| Margin (%) | | 22.6% | | 5.7% | | 10.4% | | -8.1% |
| Other segments | | 173,940 | | 175,456 | | 54,223 | | 100,566 |
| Margin (%) | | 23.8% | | 27.8% | | 7.4% | | 16.0% |
| Subtotal | | 3,224,287 | | 1,673,213 | | 1,240,432 | | (258,700) |
| Corporate | | - | | - | | 11,863 | | 79,339 |
| Total | | 3,224,287 | | 1,673,213 | | 1,252,295 | | (179,361) |
| Margin (%) | | 24.1% | | 12.7% | | 9.4% | | -1.4% |
The composition of selected items that were not allocated to the Company’s operating segments as they are not linked to its main activity and, therefore, were presented as Corporate is set forth below:
| | | Consolidated |
| | | 2024 | | 2023 |
| Corporate | | Jan - mar | | Jan - mar |
| Results with sale and disposal of fixed assets | | 17,654 | | 81,207 |
| Reversal/(provision) for tax and civil contingencies | | (1,854) | | 4,983 |
| Expenses with demobilization | | (5,367) | | 959 |
| Other | | 1,430 | | (7,810) |
| | | 11,863 | | 79,339 |
No customer individually or in aggregate (economic group) accounted for more than 5% of net sales for the three-month period ended on March 31, 2024 and 2023.
The goodwill arising from business combinations and the intangible assets with indefinite useful life (trademarks) were allocated to the reportable operating segments, considering the economic benefits generated by such intangible assets. The allocation of these intangible assets is presented below:
| | Consolidated |
| | Goodwill | | Trademarks | | Total |
| | 03.31.24 | | 12.31.23 | | 03.31.24 | | 12.31.23 | | 03.31.24 | | 12.31.23 |
| Brazil | 1,151,498 | | 1,151,498 | | 982,478 | | 982,478 | | 2,133,976 | | 2,133,976 |
| International | 1,831,951 | | 1,783,873 | | 437,373 | | 415,904 | | 2,269,324 | | 2,199,777 |
| Other segments | 455,981 | | 455,567 | | 474,871 | | 474,871 | | 930,852 | | 930,438 |
| | 3,439,430 | | 3,390,938 | | 1,894,722 | | 1,873,253 | | 5,334,152 | | 5,264,191 |
Information related to total assets by reportable segment is not disclosed, as it is not included in the set of information made available to the Company’s management, which makes investment decisions and determine allocation of resources based on information about the consolidated assets.
| | Interim Financial Information, Individual and Consolidated | March 31, 2024 |
| | Parent company | | Consolidated |
| | 2024 | | 2023 | | 2024 | | 2023 |
| | Jan - mar | | Jan - mar | | Jan - mar | | Jan - mar |
| Gross sales | | | | | | | |
| Brazil | 7,564,995 | | 7,723,356 | | 7,564,995 | | 7,723,356 |
| International | 4,225,773 | | 5,190,531 | | 6,800,858 | | 6,486,084 |
| Other segments | 552,834 | | 467,110 | | 866,513 | | 770,019 |
| | 12,343,602 | | 13,380,997 | | 15,232,366 | | 14,979,459 |
| | | | | | | | |
| Sales deductions | | | | | | | |
| Brazil | (1,402,605) | | (1,305,085) | | (1,402,605) | | (1,305,084) |
| International | (19,133) | | (22,078) | | (315,762) | | (356,646) |
| Other segments | (54,201) | | (55,974) | | (136,490) | | (139,760) |
| | (1,475,939) | | (1,383,137) | | (1,854,857) | | (1,801,490) |
| | | | | | | | |
| Net sales | | | | | | | |
| Brazil | 6,162,390 | | 6,418,271 | | 6,162,390 | | 6,418,272 |
| International | 4,206,640 | | 5,168,453 | | 6,485,096 | | 6,129,438 |
| Other segments | 498,633 | | 411,136 | | 730,023 | | 630,259 |
| | 10,867,663 | | 11,997,860 | | 13,377,509 | | 13,177,969 |
| | Interim Financial Information, Individual and Consolidated | March 31, 2024 |
The Company discloses its statement of income by function and thus presents below the details by nature:
| | Parent company | | Consolidated |
| | 2024 | | 2023 | | 2024 | | 2023 |
| | Jan - mar | | Jan - mar | | Jan - mar | | Jan - mar |
| Costs of sales | | | | | | | |
| Raw materials and supplies | (5,998,762) | | (7,186,776) | | (7,213,860) | | (8,689,209) |
| Salaries and employees benefits | (1,207,111) | | (1,104,528) | | (1,350,598) | | (1,224,580) |
| Depreciation | (598,732) | | (551,622) | | (654,160) | | (595,406) |
| Amortization | (27,608) | | (27,683) | | (53,104) | | (54,182) |
| Other | (813,769) | | (849,777) | | (881,500) | | (941,379) |
| | (8,645,982) | | (9,720,386) | | (10,153,222) | | (11,504,756) |
| | | | | | | | |
| Sales expenses | | | | | | | |
| Indirect and direct logistics expenses | (858,789) | | (965,852) | | (836,582) | | (887,088) |
| Marketing | (153,344) | | (145,438) | | (200,565) | | (189,911) |
| Salaries and employees benefits | (320,331) | | (272,876) | | (422,747) | | (372,625) |
| Depreciation | (61,571) | | (44,872) | | (102,695) | | (89,754) |
| Amortization | (15,854) | | (15,697) | | (19,956) | | (20,898) |
| Other | (113,878) | | (139,829) | | (189,273) | | (210,365) |
| | (1,523,767) | | (1,584,564) | | (1,771,818) | | (1,770,641) |
| | | | | | | | |
| Administrative expenses | | | | | | | |
| Salaries and employees benefits | (81,104) | | (39,370) | | (118,436) | | (69,631) |
| Fees | (19,484) | | (13,368) | | (19,557) | | (13,441) |
| Depreciation | (6,783) | | (8,520) | | (11,756) | | (10,848) |
| Amortization | (1,519) | | (8,883) | | (5,678) | | (12,607) |
| Other | (20,368) | | (24,945) | | (46,066) | | (53,280) |
| | (129,258) | | (95,086) | | (201,493) | | (159,807) |
| | | | | | | | |
| Impairment loss on trade receivables | (15,920) | | (5,545) | | (27,218) | | (6,507) |
| | | | | | | | |
| Other operating income (expenses), net | | | | | | | |
| Recovery of expenses | 16,071 | | 6,330 | | 15,920 | | 6,401 |
| Civil and tax contingencies (assets or liabilities) | (4,405) | | 5,098 | | (4,744) | | 4,764 |
| Gains on the disposal and write-off of non-financial assets | 17,715 | | 74,276 | | 17,654 | | 78,372 |
| Other | 749 | | (8,246) | | 2,114 | | (5,139) |
| | 30,130 | | 77,458 | | 30,944 | | 84,398 |
The Company incurred in expenses with internal research and development of new products of R$15,503 for the three-month period ended on March 31, 2024 in the Parent Company and in the Consolidated (R$6,543 in the Parent Company and in the Consolidated in the same period of the previous year).
| | Interim Financial Information, Individual and Consolidated | March 31, 2024 |
| 27. | Financial income (expenses) |
| | | | Parent company | | | Consolidated |
| | | | 2024 | | 2023 | | | 2024 | | 2023 |
| | Note | | Jan - mar | | Jan - mar | | | Jan - mar | | Jan - mar |
| Financial income | | | | | | | | | | |
| Interest on cash and cash equivalents | 4 | | 66,905 | | 63,172 | | | 136,912 | | 94,774 |
| Income with marketable securities | 5 | | 20,569 | | 17,747 | | | 26,415 | | 23,794 |
| Fair value through profit and loss | | | 20,569 | | 17,747 | | | 20,569 | | 17,747 |
| Amortized cost | | | - | | - | | | 5,846 | | 6,047 |
| Interest on recoverable taxes | 9 | | 86,204 | | 65,441 | | | 86,322 | | 65,532 |
| Interest and financial income on other assets | | | 23,068 | | 11,203 | | | 25,030 | | 14,030 |
| | | | 196,746 | | 157,563 | | | 274,679 | | 198,130 |
| Financial expenses | | | | | | | | | | |
| Interests on loans and borrowings | 15 | | (412,094) | | (480,758) | | | (462,205) | | (536,619) |
| Interest with related parties | 28 | | (93,767) | | (112,051) | | | - | | - |
| Interest on contingencies | 20 | | (22,658) | | (34,010) | | | (22,659) | | (34,010) |
| Interest on leases | 17 | | (87,159) | | (59,706) | | | (93,445) | | (65,457) |
| Interest on actuarial liabilities | | | (6,960) | | (7,590) | | | (13,111) | | (9,500) |
| Taxes on financial income | | | (9,458) | | (8,184) | | | (10,580) | | (8,685) |
| Adjustment to present value (2) | 6 and 16 | | (199,445) | | (264,999) | | | (182,579) | | (263,435) |
| Other financial expenses | | | (99,941) | | (91,009) | | | (122,534) | | (118,483) |
| | | | (931,482) | | (1,058,307) | | | (907,113) | | (1,036,189) |
| Foreign exchange, prices and monetary variations | | | | | | | | | | |
| Exchange rate variation on monetary assets and liabilities and prices | | | (294,090) | | 443,483 | | | (79,211) | | 143,194 |
| Foreign exchange of derivatives | | | 74,157 | | (107,688) | | | 73,185 | | (108,804) |
| Interest and fair value of derivatives | | | (32,671) | | (135,744) | | | (33,004) | | (137,336) |
| Net Monetary Gains or Losses (1) | | | - | | - | | | 133,837 | | 80,934 |
| | | | (252,604) | | 200,051 | | | 94,807 | | (22,012) |
| | | | (987,340) | | (700,693) | | | (537,627) | | (860,071) |
| (1) | Effects of monetary correction resulting from operations in hyperinflationary economy. |
| (2) | The adjustment to present value considers the balances of trade accounts receivable and trade accounts payable and the rate used for the three-month period ended on March 31, 2024 was 12.01% p.a. (15.33% p.a. in the same period of the previous year). |
| | Interim Financial Information, Individual and Consolidated | March 31, 2024 |
28. Related parties
The balances of the transactions with related parties are as follows:
| | | | | | | | | | Parent company |
| | Accounts receivable | | Dividends and interest on shareholders' equity receivable | | Trade accounts payable | | Other rights | | Advances and other liabilities |
| | 03.31.24 | | 12.31.23 | | 03.31.24 | | 12.31.23 | | 03.31.24 | | 12.31.23 | | 03.31.24 | | 12.31.23 | | 03.31.24 | | 12.31.23 |
| Al Khan Foodstuff LLC ("AKF") | - | | - | | - | | - | | - | | - | | - | | - | | (356) | | | - |
| Banvit | - | | - | | - | | - | | | | - | | 1,089 | | 708 | | - | | | - |
| BRF Energia S.A. | - | | - | | - | | - | | (283,335) | | (208,168) | | - | | - | | - | | | - |
| BRF Foods GmbH | 334,497 | | 346,703 | | - | | - | | - | | - | | 124 | | 124 | | - | | | - |
| BRF Global GmbH | 2,598,978 | | 3,118,425 | | - | | - | | (2,549,021) | | (2,527,079) | | - | | - | | (4,461,046) | (1) | | (4,807,979) |
| BRF GmbH | - | | - | | - | | - | | - | | - | | - | | - | | (1,310,238) | (2) | | (1,300,782) |
| Hercosul Alimentos Ltda. | 8,761 | | 5,968 | | - | | - | | - | | - | | 335 | | 440 | | - | | | - |
| Hercosul Distrib. Ltda. | 57 | | - | | - | | - | | - | | - | | - | | - | | - | | | - |
| Hercosul International S.R.L. | 19 | | 19 | | - | | - | | (2,046) | | (305) | | - | | - | | - | | | - |
| Mogiana Alimentos S.A. | 14,380 | | 9,953 | | - | | - | | (4) | | - | | 704 | | 497 | | - | | | - |
| BRF Singapore Foods PTE Ltd. | - | | - | | - | | - | | - | | - | | - | | - | | - | | | (2,683) |
| Sadia Alimentos S.A. | - | | - | | - | | - | | - | | - | | - | | - | | (2,946) | | | (3,247) |
| Sadia Chile S.A. | 263,694 | | 221,298 | | - | | - | | - | | - | | 90 | | 90 | | - | | | - |
| Sadia Uruguay S.A. | 5,873 | | 418 | | - | | - | | - | | - | | - | | - | | (50,362) | | | (57,567) |
| VIP S.A. Empreendimentos e Partic. Imob. | - | | - | | - | | 13 | | - | | - | | - | | - | | - | | | - |
| Marfrig Global Foods S.A. | 7,818 | | 7,945 | | - | | - | | (50,126) | | (21,370) | | - | | - | | - | | | - |
| Marfrig Chile S.A. | 4,352 | | 1,762 | | - | | - | | - | | - | | - | | - | | - | | | - |
| Quickfood S.A. | 42,290 | | 24,852 | | - | | - | | - | | - | | - | | - | | - | | | - |
| MFG Agropecuária Ltda. | - | | 1 | | - | | - | | - | | - | | - | | - | | - | | | - |
| Pampeano Alimentos S.A. | - | | 473 | | - | | - | | (238) | | (112) | | - | | - | | - | | | - |
| Total | 3,280,719 | | 3,737,817 | | - | | 13 | | (2,884,770) | | (2,757,034) | | 2,342 | | 1,859 | | (5,824,948) | | | (6,172,258) |
| (1) | The amount corresponds to export pre-payments, usual operation between the productive units in Brazil with the wholly-owned subsidiaries that operate as trading companies in the international market. |
| (2) | BRF S.A. performs reimbursement to certain subsidiaries for losses incurred in the normal course of their operations, generating liabilities recorded as Other obligations with Related parties. |
| | Interim Financial Information, Individual and Consolidated | March 31, 2024 |
| | Consolidated |
| | Accounts receivable | | Trade accounts payable |
| | 03.31.24 | | 12.31.23 | | 03.31.24 | | 12.31.23 |
| Marfrig Global Foods S.A. | 7,818 | | 7,945 | | (51,378) | | (24,838) |
| Marfrig Chile S.A. | 4,553 | | 2,563 | | (189) | | (195) |
| Quickfood S.A. | 42,290 | | 24,852 | | - | | - |
| Weston Importers Ltd. | 242 | | 366 | | - | | - |
| MFG Agropecuária Ltda. | - | | 1 | | - | | - |
| Pampeano Alimentos S.A. | - | | 473 | | (238) | | (112) |
| Total | 54,903 | | 36,200 | | (51,805) | | (25,145) |
| | Parent company |
| | Sales | | Financial results, net | | Purchases | | Other operating income (expenses) |
| | 2024 | | 2023 | | 2024 | | 2023 | | 2024 | | 2023 | | 2024 | | 2023 |
| | Jan - mar | | Jan - mar | | Jan - mar | | Jan - mar | | Jan - mar | | Jan - mar | | Jan - mar | | Jan - mar |
| BRF Energia S.A. | - | | - | | - | | - | | (66,304) | | (85,308) | | - | | - |
| BRF Global GmbH | 3,680,110 | | 4,811,715 | | (92,693) | | (111,030) | | - | | - | | - | | - |
| Hercosul Alimentos Ltda. | 9,043 | | 8,034 | | - | | - | | - | | - | | - | | - |
| Hercosul International S.R.L. | | | 1,427 | | - | | - | | - | | - | | - | | - |
| Mogiana Alimentos S.A. | 8,962 | | 20,553 | | - | | - | | - | | - | | - | | - |
| Sadia Alimentos S.A. | - | | - | | (44) | | (43) | | - | | - | | - | | - |
| Sadia Chile S.A. | 94,997 | | 114,959 | | - | | - | | - | | - | | - | | - |
| Sadia Uruguay S.A. | 13,407 | | 26,716 | | (1,030) | | (978) | | - | | - | | - | | - |
| AES Brasil | 19,893 | | - | | - | | - | | - | | - | | - | | - |
| Marfrig Global Foods S.A. | 15,206 | | 20,300 | | - | | - | | (73,805) | | (86,034) | | 1,179 | | - |
| Marfrig Chile S.A. | 6,468 | | 1,794 | | - | | - | | - | | - | | - | | - |
| Quickfood S.A. | 26,402 | | 33,055 | | - | | - | | - | | - | | - | | - |
| Agropecuária Jacarezinho | - | | - | | - | | - | | - | | - | | 54 | | - |
| Fazenda São Marcelo | - | | - | | - | | - | | - | | - | | 54 | | - |
| Pampeano Alimentos S/A | - | | - | | - | | - | | (416) | | - | | - | | - |
| Total | 3,874,488 | | 5,038,553 | | (93,767) | | (112,051) | | (140,525) | | (171,342) | | 1,287 | | - |
| | Interim Financial Information, Individual and Consolidated | March 31, 2024 |
| | Consolidated |
| | Sales | | | Purchases | | Other operating income (expenses) |
| | 2024 | | 2023 | | | 2024 | | 2023 | | 2024 | | 2023 |
| | Jan - mar | | Jan - mar | | | Jan - mar | | Jan - mar | | Jan - mar | | Jan - mar |
| Marfrig Global Foods S.A. | 15,206 | | 20,300 | | | (73,805) | | (121,041) | | 1,179 | | - |
| Marfrig Chile S.A. | 7,080 | | 3,127 | | | (382) | | (318) | | - | | - |
| Quickfood S.A. | 26,402 | | 33,055 | | | - | | - | | - | | - |
| Agropecuária Jacarezinho | - | | - | | | - | | - | | 54 | | - |
| Fazenda São Marcelo | - | | - | | | - | | - | | 54 | | - |
| Weston Importers Ltd. | 551 | | - | | | (30,088) | | - | | - | | - |
| Pampeano Alimentos S/A | - | | - | | | (416) | | - | | - | | - |
| Total | 49,239 | | 56,482 | | | (104,691) | | (121,359) | | 1,287 | | - |
The subsidiaries of the Company enter into loan agreements pursuant its cash management strategy respecting market conditions. As of March 31, 2024 the balance of these transactions was R$1,210,178 (R$1,132,634 as of December 31, 2023).
The Company made contributions related to the post-employment benefit plans of its employees to BRF Previdência, which holds these plans (note 19). Additionally, the Company leased properties owned by BRF Previdência, and for the three-month period ended on March 31, 2024 the total amount of lease payments was R$5,869 (R$4,301 in the same period of the previous year).
The Company maintains other transactions with related parties resulting from guarantees, transferences and donations to related associations and institutes, as well as leasing and other commercial transactions with related people and entities. Such transactions are compliant with the Related Party Transactions Policy and are not relevant, individually or in aggregate.
On December 16, 2022, BRF issued a guarantee to the promissory commercial notes issued by Potengi, public offering with limited distribution efforts with maturity in eighteen (18) months. The total amount of the Offer is R$700,000. BRF issued a joint guarantee limited to the amount corresponding to 24% of the Offer amount.
On August 14, 2023, BRF provided financing guarantees to Potengi, with Banco do Brasil S.A., through the opening of fixed credit up to a limit of R$144,000, coming from ordinary resources from the Fundo de Desenvolvimento do Nordeste – (“FDNE”), transferred to finance the implementation of the Cajuína 1 Wind Generating Plant, located in Rio Grande do Norte.
On January 19, 2024, BRF provided guarantees with the purpose of ensuring compliance with the main and additional obligations undertaken by Potengi at its first issue of 300,000 simple debentures, not convertible into shares, in a single series, with a maturity period of eighteen (18) years. The nominal unit value expressed in Reais is R$1, with BRF providing a personal guarantee for the amount corresponding to 24% of the issue value.
On March 27, 2024, BRF provided guarantees with the purpose of ensuring compliance with the main and additional obligations undertaken by Potengi at its second issue of 2,100,000 simple debentures, not convertible into shares, in a single series, with a maturity period of eighteen (18) years. The nominal unit value expressed in Reais is R$0,1, with BRF providing a personal guarantee for the amount corresponding to 24% of the issue value.
| | Interim Financial Information, Individual and Consolidated | March 31, 2024 |
| 28.1. | Management remuneration |
The total remuneration and benefits expense with board members, statutory directors and the head of internal audit are set forth below:
| | Consolidated |
| | 2024 | | 2023 |
| | Jan - mar | | Jan - mar |
| Salary and profit sharing | 15,404 | | 10,232 |
| Short-term benefits (1) | 40 | | 113 |
| Private pension | 186 | | 185 |
| Termination benefits | 1,027 | | 1,519 |
| Share-based payment | 4,515 | | 3,335 |
| | 21,172 | | 15,383 |
| (1) | Comprises: medical assistance, educational expenses and others. |
In addition, the executive officers (non-statutory) received among remuneration and benefits the total amount of R$3,529 the three-month period ended on March 31, 2024 (R$3,736 in the same period of the previous year).
29. Commitments
In the normal course of the business, the Company entered into long-term agreements with third parties, which mainly include purchase of, secondary materials, energy inputs, storage and industrialization services, among others to support its activities. In these agreements, the prices agreed may be fixed or to be fixed. These agreements contain termination clauses for non-compliance with essential obligations and the minimum contractually agreed is generally purchased and, for this reason, there are no liabilities recorded in addition to the amount that is recognized on an accrual basis. On March 31, 2024, firm purchase commitments in the Parent Company totaled R$3,825,133 and R$4,260,668 in the Consolidated (R$4,524,719 in the Parent Company and R$5,023,227 in the Consolidated on December 31, 2023).
| 30. | Transactions that do not involve cash |
The following transactions did not involve cash or cash equivalents during the three-month period ended on March 31, 2024:
| (i) | Capitalized loan interest: for the three-month period ended on March 31, 2024 amounted to R$9,436 in the Parent Company and R$9,823 in the Consolidated (R$17,021 in the Parent Company and R$20,853 in the same period of the previous year). |
| (ii) | Addition of lease by right-of-use assets and respective lease liability: the three-month period ended on March 31, 2024 amounted to R$310,686 in the parent company and R$486,728 in the consolidated (R$287,697 in the parent company and R$288,023 in the consolidated in the same period of the previous year). |
| | Interim Financial Information, Individual and Consolidated | March 31, 2024 |
| 31. | Events after the reporting period |
The credit rating agency Fitch, on May 02, 2024, upgraded BRF’s credit rating on global corporate scale from “BB” to “BB+” and on national scale from “AA+” to “AAA”.
| 32. | Approval of the Financial Statements |
The financial statements were approved and the issuance authorized by the Board of Directors on May 06, 2024.
| BOARD OF DIRECTORS | |
| | |
| Global President Office (Non-Independent) | Marcos Antonio Molina dos Santos |
| Vice-Chairman (Non-Independent) | Márcia Aparecida Pascoal Marçal dos Santos |
| Non-Independent Member | Marcos Fernando Marçal dos Santos |
| Non-Independent Member | Márcio Hamilton Ferreira |
| Independent Member | Eduardo Augusto Rocha Pocetti |
| Non-Independent Member | Sérgio Agapito Lires Rial |
| Independent Member | Pedro de Camargo Neto |
| Independent Member | Augusto Marques da Cruz Filho |
| Independent Member | Flavia Maria Bittencourt |
| | |
| FISCAL COUNCIL | |
| | |
| Member | Marco Antônio Peixoto Simões Velozo |
| Member | Ricardo Florence dos Santos |
| Member | Alexandre Eduardo De Melo |
| | |
| AUDIT AND INTEGRITY COMMITTEE | |
| | |
| Comittee Coordinator | Augusto Marques da Cruz Filho |
| Member | Eduardo Augusto Rocha Pocetti |
| External Member | Esmir Oliveira |
| | |
| | |
| BOARD OF EXECUTIVE OFFICERS | |
| | |
| Global Chief Executive Officer | Miguel de Souza Gularte |
| Financial and Investor Relations Vice-President | Fábio Luis Mendes Mariano |
| People, Sustainability and Digital Vice-Presiden | Alessandro Rosa Bonorino |
| Vice President of Industrial Operations and Logistics | Artemio Listoni |
| Agribusiness and Product Quality Vice-President | Fabio Duarte Stumpf |
| International Markets and Planning Vice-President | Leonardo Campo Dallorto |
| Brazil Commercial Vice-President | Manoel Reinaldo Manzano Martins Junior |
| Marketing and New Businesses Vice-President | Marcel Sacco |
| | |
| | |
| | |
| Marcos Roberto Badollato | |
| Accounting Director - CRC 1SP219369/O-4 | |
| | Interim Financial Information, Individual and Consolidated | March 31, 2024 |
Breakdown of capital stock by nature
The shareholding position of the shareholders holding more than 5% of the voting stock, management and members of the Board of Directors is presented below:
| | | 03.31.24 | | 12.31.23 |
| Shareholders | | Quantity | | % | | Quantity | | % |
| Major shareholders | | | | | | | | |
| Marfrig Global Foods S.A. | | 842,547,574 | | 50.08 | | 842,165,702 | | 50.06 |
| Salic | | 180,000,000 | | 10.70 | | 180,000,000 | | 10.70 |
| Kapitalo Investimentos Ltda. | | 107,982,757 | | 6.42 | | 107,982,757 | | 6.42 |
| Caixa de Previd. dos Func. do Banco do Brasil | | 103,328,121 | | 6.14 | | 103,328,121 | | 6.14 |
| Management | | | | | | | | |
| Board of Directors | | 518,900 | | 0.03 | | 518,900 | | 0.03 |
| Executives | | 576,235 | | 0.03 | | 626,458 | | 0.04 |
| Fiscal Council | | 31,400 | | 0.00 | | 32,700 | | 0.00 |
| Treasury shares | | 14,036,779 | | 0.83 | | 3,817,179 | | 0.23 |
| Other | | 433,451,480 | | 25.77 | | 444,001,429 | | 26.38 |
| | | 1,682,473,246 | | 100.00 | | 1,682,473,246 | | 100.00 |
| | Interim Financial Information, Individual and Consolidated | March 31, 2024 |
INDEPENDENT AUDITORS’ REPORT ON INDIVIDUAL AND CONSOLIDATED INTERIM FINANCIAL INFORMATION
To the Board of directors and shareholders of
BRF S.A.
Itajaí – SC
Introduction
We have reviewed the accompanying individual and consolidated interim financial information of BRF S.A. (the Company), comprised in the Quarterly Information Form for the quarter ended March 31, 2024, comprising the balance sheet as of March 31, 2024 and the respective statements of income, of comprehensive income, of changes in shareholders’ equity and of cash flows for the period of three months then ended, including the explanatory notes.
Management is responsible for the preparation of the individual and consolidated interim financial information in accordance with NBC TG 21 – Interim Financial Reporting and with the international standard IAS 34 – Interim Financial Reporting, as issued by the International Accounting Standards Board (Iasb), such as for the presentation of these information in accordance with the standards issued by the Brazilian Securities and Exchange Commission, applicable to the preparation of interim financial information. Our responsibility is to express a conclusion on this interim financial information based on our review.
Review scope
We conducted our review in accordance with the Brazilian and International standards on reviews of interim information (NBC TR 2410 – Review of Interim Financial Information Performed by the Independent Auditor of the Entity and ISRE 2410 – Review of Interim Financial Information Performed by the Independent Auditor of the Entity, respectively). The review of interim information consists of making inquiries, primarily of persons responsible for the financial and accounting matters and applying analytical and other review procedures. A review is substantially less in scope than an audit conducted in accordance with the standards on auditing and, consequently, does not enable us to obtain assurance that we would become aware of all significant matters that might be identified in an audit. Accordingly, we do not express an audit opinion.
Conclusion on the individual and consolidated interim financial information
Based on our review, nothing has come to our attention that causes us to believe that the individual and consolidated interim financial information included in the quarterly information form referred to above has not been prepared, in all material respects, in accordance with NBC TG 21 and IAS 34 applicable to the preparation of interim financial information and presented in accordance with the standards issued by the Brazilian Securities and Exchange Commission.
Other matters
Statements of value added
The quarterly information referred to above includes the individual and consolidated statements of value added for the period of three months ended March 31, 2024, prepared under the responsibility of the Company's management and presented as supplementary information for the purposes of IAS 34. These statements were submitted to the same review procedures in conjunction with the review of the Company's interim financial information to conclude they are reconciliated to the interim financial information and to the accounting records, as applicable, and whether the structure and content are in accordance with the criteria established in the NBC TG 09 - Statement of Value Added. Based on our review, nothing has come to our attention that causes us to believe that the accompanying statements of value added were not prepared, in all material respects, in accordance to the criteria defined in that standard and consistently in relation to the individual and consolidated interim financial information taken as a whole.São Paulo, May 06, 2024
São Paulo, May 06, 2024
Grant Thornton Auditores Independentes Ltda.
CRC 2SP-025.583/O-1
Octavio Zampirollo Neto
Accountant CRC 1SP-289.095/O-3
| | Interim Financial Information, Individual and Consolidated | March 31, 2024 |
Opinion of the Audit and Integrity Commitee
The Audit and Integrity Committee of BRF S.A., in fulfilling its statutory and legal duties, examined the interim financial information (Parent Company and Consolidated) for the three-month period ended on March 31, 2024, the Management Report and the review report issued without modification by Grant Thornton Auditores Independentes Ltda.
There were no situations of significant divergence between the Company's Management, the independent auditors and the Audit Committee in relation to the Company's interim financial information.
Based on the documents reviewed and the explanations provided, the members of the Audit and Integrity Committee, undersigned, issued the opinion that the interim financial information are in a position to be approved.
São Paulo, May 06, 2024.
Augusto Marques da Cruz Filho
Coordinator
Eduardo Augusto Rocha Pocetti
Member
Esmir de Oliveira
External Member
| | Interim Financial Information, Individual and Consolidated | March 31, 2024 |
Statement of Executive Board on the Consolidated Interim Financial Information and Independent Auditor’s Report
In compliance with the dispositions of sections V and VI of the article 25 of the CVM Instruction Nº 480/09, the executive board of BRF S.A. states that:
(i) reviewed, discussed and agreed with the Company’s interim financial information for the fiscal for the three-month period ended on March 31, 2024, and
(ii) reviewed, discussed and agreed with the opnions expressed in the audit report issued by Grant Thornton Auditores Independentes Ltda. for the three-month period ended on March 31, 2024.
São Paulo, May 06, 2024.
Miguel de Souza Gularte
Global Chief Executive Officer
Fábio Luis Mendes Mariano
Financial and Investor Relations Vice-President
Alessandro Rosa Bonorino
People, Sustainability and Digital Vice-President
Artemio Listoni
Vice President of Industrial Operations and Logistics
Fabio Duarte Stumpf
Agribusiness and Product Quality Vice-President
Leonardo Campo Dallorto
International Markets and Planning Vice-President
Manoel Reinaldo Manzano Martins Junior
Brazil Commercial Vice-President
Marcel Sacco
Marketing and New Businesses Vice-President