
 | Financial Statements, Individual and Consolidated | 2024 a 2023 |
| 2 |
| Financial Statements, Individual and Consolidated | 2024 a 2023 |
| 3 |
| Financial Statements, Individual and Consolidated | 2024 a 2023 |
Statements of Financial Position
| Parent company | Consolidated | Parent company | Consolidated | |||||||||||||||||
| ASSETS | Note | 12.31.24 | 12.31.23 | 12.31.24 | 12.31.23 | LIABILITIES | Note | 12.31.24 | 12.31.23 | 12.31.24 | 12.31.23 | |||||||||
| CURRENT ASSETS | CURRENT LIABILITIES | |||||||||||||||||||
| Cash and cash equivalents | 4 | 3,989,024 | 4,701,549 | 11,165,364 | 9,264,664 | Loans and borrowings | 15 | 952,565 | 2,237,214 | 1,230,273 | 2,451,838 | |||||||||
| Marketable securities | 5 | 894,060 | 412,107 | 894,080 | 447,878 | Trade accounts payable | 16 | 12,227,480 | 14,011,988 | 13,558,284 | 12,592,006 | |||||||||
| Trade receivables | 6 | 7,834,133 | 5,655,967 | 6,075,013 | 4,766,071 | Lease | 17.2 | 847,407 | 835,154 | 1,014,813 | 944,326 | |||||||||
| Notes receivable | 6 | 32,302 | 64,731 | 32,302 | 64,731 | Payroll, related charges and employee profit sharing | 1,348,225 | 886,974 | 1,557,051 | 984,457 | ||||||||||
| Inventories | 7 | 4,289,502 | 4,717,540 | 6,728,002 | 6,628,890 | Taxes payable | 292,069 | 316,600 | 1,141,951 | 585,129 | ||||||||||
| Biological assets | 8 | 2,659,317 | 2,580,383 | 2,844,633 | 2,702,164 | Derivative financial instruments | 23 | 382,976 | 74,112 | 382,976 | 76,940 | |||||||||
| Recoverable taxes | 9 | 1,393,036 | 1,210,028 | 2,214,186 | 1,517,548 | Provision for tax, civil and labor risks | 20 | 687,712 | 717,119 | 692,650 | 720,187 | |||||||||
| Derivative financial instruments | 23 | 63,033 | 109,222 | 63,033 | 109,222 | Employee benefits | 19.2 | 63,959 | 58,894 | 95,276 | 86,423 | |||||||||
| Prepaid expenses | 126,189 | 126,557 | 176,290 | 166,230 | Customer advances | 222,055 | 6,320 | 475,650 | 290,279 | |||||||||||
| Advances | 57,397 | 64,677 | 114,469 | 123,319 | Advances from related parties | 28 | 6,859,502 | 6,119,677 | - | - | ||||||||||
| Restricted cash | 1,674 | - | 276,025 | 13,814 | Other current liabilities | 229,723 | 282,712 | 671,653 | 658,763 | |||||||||||
| Assets held for sale | 3,445 | 684 | 3,445 | 7,204 | ||||||||||||||||
| Other current assets | 264,907 | 132,989 | 243,643 | 142,527 | ||||||||||||||||
| Total current assets | 21,608,019 | 19,776,434 | 30,830,485 | 25,954,262 | Total current liabilities | 24,113,673 | 25,546,764 | 20,820,577 | 19,390,348 | |||||||||||
| NON-CURRENT ASSETS | NON-CURRENT LIABILITIES | |||||||||||||||||||
| LONG-TERM RECEIVALBLES | Loans and borrowings | 15 | 16,827,677 | 15,462,088 | 19,510,275 | 17,643,710 | ||||||||||||||
| Marketable securities | 5 | 18,450 | 16,490 | 323,811 | 319,995 | Trade accounts payable | 16 | 11,766 | 422 | 11,766 | 422 | |||||||||
| Trade receivables | 6 | 21,726 | 5,897 | 22,620 | 5,897 | Lease | 17.2 | 2,746,294 | 2,624,979 | 2,978,116 | 2,777,521 | |||||||||
| Notes receivable | 6 | 8,035 | 1,530 | 8,035 | 1,530 | Taxes payable | 76,121 | 88,211 | 77,854 | 90,669 | ||||||||||
| Recoverable taxes | 9 | 4,529,397 | 4,981,378 | 4,545,446 | 5,000,740 | Provision for tax, civil and labor risks | 20 | 1,493,517 | 442,621 | 1,539,464 | 482,983 | |||||||||
| Deferred income taxes | 10 | 2,238,313 | 2,054,826 | 2,331,012 | 2,113,108 | Deferred income taxes | 10 | - | - | 1,933 | 60,125 | |||||||||
| Judicial deposits | 11 | 408,039 | 405,450 | 422,333 | 415,718 | Liabilities with related parties | 28 | 2,535 | 52,581 | - | - | |||||||||
| Biological assets | 8 | 1,685,731 | 1,788,383 | 1,787,237 | 1,858,316 | Employee benefits | 19.2 | 248,200 | 264,731 | 467,127 | 454,398 | |||||||||
| Derivative financial instruments | 23 | 251,570 | 529,830 | 251,570 | 529,830 | Derivative financial instruments | 23 | 236,206 | 59,819 | 236,206 | 59,819 | |||||||||
| Restricted cash | 32,501 | 30,952 | 60,790 | 72,395 | Other non-current liabilities | 354,469 | 286,982 | 532,554 | 668,439 | |||||||||||
| Other non-current assets | 213,717 | 148,262 | 221,014 | 153,052 | ||||||||||||||||
| Total long-term receivables | 9,407,479 | 9,962,998 | 9,973,868 | 10,470,581 | Total non-current liabilities | 21,996,785 | 19,282,434 | 25,355,295 | 22,238,086 | |||||||||||
| EQUITY | 21 | |||||||||||||||||||
| Capital | 13,349,156 | 13,349,156 | 13,349,156 | 13,349,156 | ||||||||||||||||
| Capital reserves | 2,763,364 | 2,763,364 | 2,763,364 | 2,763,364 | ||||||||||||||||
| Profit reserves | 2,079,253 | - | 2,079,253 | - | ||||||||||||||||
| Investments | 12 | 13,925,719 | 13,683,725 | 129,283 | 97,895 | Other equity transactions | (141,608) | (70,106) | (141,608) | (70,106) | ||||||||||
| Property, plant and equipment | 13 | 13,062,018 | 13,127,930 | 15,068,229 | 14,608,914 | Treasury shares | (1,345,657) | (96,145) | (1,345,657) | (96,145) | ||||||||||
| Intangible assets | 14 | 3,192,874 | 3,201,539 | 6,673,211 | 6,140,438 | Other comprehensive loss | (1,618,857) | (1,022,841) | (1,618,857) | (1,022,841) | ||||||||||
| Attributable to controlling shareholders | 15,085,651 | 14,923,428 | 15,085,651 | 14,923,428 | ||||||||||||||||
| Non-controlling interests | - | - | 1,413,553 | 720,228 | ||||||||||||||||
| Total non-current assets | 39,588,090 | 39,976,192 | 31,844,591 | 31,317,828 | Total equity | 15,085,651 | 14,923,428 | 16,499,204 | 15,643,656 | |||||||||||
| TOTAL ASSETS | 61,196,109 | 59,752,626 | 62,675,076 | 57,272,090 | TOTAL LIABILITIES AND EQUITY | 61,196,109 | 59,752,626 | 62,675,076 | 57,272,090 | |||||||||||
The accompanying notes are an integral part of the financial statements.
(In thousands of Brazilian Reais).
| 4 |
| Financial Statements, Individual and Consolidated | 2024 a 2023 |
| Parent company | Consolidated | ||||||||
| Note | 12.31.24 | 12.31.23 | 12.31.24 | 12.31.23 | |||||
| NET SALES | 25 | 52,506,272 | 47,580,919 | 61,379,038 | 53,615,440 | ||||
| Cost of sales | 26 | (38,125,758) | (38,216,023) | (45,543,222) | (44,781,739) | ||||
| GROSS PROFIT | 14,380,514 | 9,364,896 | 15,835,816 | 8,833,701 | |||||
| OPERATING INCOME (EXPENSES) | |||||||||
| Selling expenses | 26 | (6,856,244) | (6,589,753) | (8,082,662) | (7,454,163) | ||||
| General and administrative expenses | 26 | (549,235) | (475,584) | (953,059) | (757,836) | ||||
| Impairment loss on trade receivables | 6; 26 | (13,473) | (24,072) | (28,817) | (32,809) | ||||
| Other operating income (expenses), net | 26 | (83,816) | 241,421 | 82,783 | 250,512 | ||||
| Income from associates and joint ventures | 12 | 3,177,505 | (2,076,089) | (13,675) | (3,264) | ||||
| INCOME BEFORE FINANCIAL RESULTS AND INCOME TAXES | 10,055,251 | 440,819 | 6,840,386 | 836,141 | |||||
| Financial income | 744,173 | 905,205 | 1,225,792 | 1,202,520 | |||||
| Financial expenses | (3,822,822) | (4,210,966) | (3,645,839) | (4,136,312) | |||||
| Foreign exchange and monetary variations | (2,812,197) | 597,019 | 629,534 | 112,945 | |||||
| FINANCIAL INCOME (EXPENSES), NET | 27 | (5,890,846) | (2,708,742) | (1,790,513) | (2,820,847) | ||||
| INCOME (LOSS) BEFORE TAXES | 4,164,405 | (2,267,923) | 5,049,873 | (1,984,706) | |||||
| Income taxes | 10 | (951,131) | 239,364 | (1,357,969) | 115,854 | ||||
| INCOME (LOSS) FOR THE YEAR | 3,213,274 | (2,028,559) | 3,691,904 | (1,868,852) | |||||
| Income (Loss) Attributable to | |||||||||
| Controlling shareholders | 3,213,274 | (2,028,559) | 3,213,274 | (2,028,559) | |||||
| Non-controlling interest | - | - | 478,630 | 159,707 | |||||
| 3,213,274 | (2,028,559) | 3,691,904 | (1,868,852) | ||||||
| INCOME (LOSS) PER SHARE | |||||||||
| Weighted average shares outstanding - basic | 1,653,093,656 | 1,360,268,402 | |||||||
| Loss per share - basic | 22 | 1.94379 | (1.49129) | ||||||
| Weighted average shares outstanding - diluted | 1,655,501,136 | 1,360,268,402 | |||||||
| Income (Loss) per share - diluted | 22 | 1.94097 | (1.49129) | ||||||
The accompanying notes are an integral part of the financial statements.
(In thousands of Brazilian Reais).
| 5 |
| Financial Statements, Individual and Consolidated | 2024 a 2023 |
Statements of Comprehensive Income (Loss)
| Parent company | Consolidated | ||||||||
| Note | 12.31.24 | 12.31.23 | 12.31.24 | 12.31.23 | |||||
| Income (loss) for the year | 3,213,274 | (2,028,559) | 3,691,904 | (1,868,852) | |||||
| Other comprehensive income (loss), net of taxes | |||||||||
| Gain (loss) on foreign currency translation of foreign operations | 122,951 | (169,326) | 348,503 | (309,065) | |||||
| Gain (loss) on net investment hedge (1) | (339,101) | 145,328 | (339,101) | 145,328 | |||||
| Cash flow hedges – effective portion of changes in fair value (1) | (549,520) | 130,182 | (549,182) | 130,600 | |||||
| Cash flow hedges – reclassified to profit or loss | 23 | 236,988 | 242,776 | 236,988 | 242,776 | ||||
| Debt investments measured at FVTOCI (1) - changes in fair value | 5 | (46,529) | - | (46,529) | - | ||||
| Items that are or may be reclassified subsequently to profit or loss | (575,211) | 348,960 | (349,321) | 209,639 | |||||
| Actuarial gains (losses) on pension and post-employment plans (1) | 19.2 | (8,827) | (1,523) | (19,763) | (42,225) | ||||
| Items that will not be reclassified to profit or loss | (8,827) | (1,523) | (19,763) | (42,225) | |||||
| Comprehensive income (loss) for the year | 2,629,236 | (1,681,122) | 3,322,820 | (1,701,438) | |||||
| Attributable to | |||||||||
| Controlling shareholders | 2,629,236 | (1,681,122) | 2,629,236 | (1,681,122) | |||||
| Non-controlling interest | - | - | 693,584 | (20,316) | |||||
| 2,629,236 | (1,681,122) | 3,322,820 | (1,701,438) | ||||||
| (1) | Items above are stated net of deferred taxes on income and the related taxes are disclosed in note 10. |
The accompanying notes are an integral part of the financial statements.
(In thousands of Brazilian Reais).
| 6 |
| Financial Statements, Individual and Consolidated | 2024 a 2023 |
Statements of Changes in Equity
| Attributed to controlling shareholders | |||||||||||||||||||||||||||||||||||
| Income reserves | Other comprehensive income (loss) | ||||||||||||||||||||||||||||||||||
| Capital | Capital reserves | Other equity transactions | Treasury shares | Legal reserve | Reserve for capital increases | Reserve for expansion | Reserve for tax incentives | Accumulated foreign currency translation adjustments | Gains (losses) on marketable securities at FVTOCI (2) | Gains (losses) on cash flow hedge | Actuarial gains (losses) | Accumulated aearnings (losses) | Total equity | Non-controlling interest | Total shareholders' equity (consolidated) | ||||||||||||||||||||
| BALANCES AT DECEMBER 31, 2022 | 12,835,915 | 2,338,476 | (77,825) | (109,727) | - | - | - | - | (1,024,897) | - | (307,389) | (21,472) | (2,363,073) | 11,270,008 | 552,861 | 11,822,869 | |||||||||||||||||||
| Comprehensive income (loss) (1) | |||||||||||||||||||||||||||||||||||
| Losses on foreign currency translation of foreign operations | - | - | - | - | - | - | - | - | (169,326) | - | - | - | - | (169,326) | (139,739) | (309,065) | |||||||||||||||||||
| Gains on net investment hedge | - | - | - | - | 145,328 | - | - | - | - | 145,328 | - | 145,328 | |||||||||||||||||||||||
| Unrealized gains in cash flow hedge | - | - | - | - | - | - | - | - | - | - | 372,958 | - | - | 372,958 | 418 | 373,376 | |||||||||||||||||||
| Actuarial losses on pension and post-employment plans | - | - | - | - | - | - | - | - | - | - | - | (1,523) | - | (1,523) | (40,702) | (42,225) | |||||||||||||||||||
| Income (loss) for the year | - | - | - | - | - | - | - | - | - | - | - | - | (2,028,559) | (2,028,559) | 159,707 | (1,868,852) | |||||||||||||||||||
| SUB-TOTAL COMPREHENSIVE INCOME (LOSS) | - | - | - | - | - | (23,998) | - | 372,958 | (1,523) | (2,028,559) | (1,681,122) | (20,316) | (1,701,438) | ||||||||||||||||||||||
| Employee benefits remeasurement - defined benefit | - | - | - | - | - | - | - | - | - | - | - | (16,520) | 16,520 | - | - | - | |||||||||||||||||||
| Capital increase through issuance of shares | 600,000 | 4,800,000 | - | - | - | - | - | - | - | - | - | 5,400,000 | - | 5,400,000 | |||||||||||||||||||||
| Expenses with public exchange offer of shares | (86,759) | - | - | - | - | - | - | - | - | - | - | (86,759) | - | (86,759) | |||||||||||||||||||||
| Capital increase in subsidiaries | - | - | - | - | - | - | - | - | - | 187,777 | 187,777 | ||||||||||||||||||||||||
| Appropriation of income (loss) | |||||||||||||||||||||||||||||||||||
| Dividends | - | - | - | - | - | - | - | - | - | - | - | - | - | (94) | (94) | ||||||||||||||||||||
| Compensation of accumulated losses with capital reserve | - | (4,375,112) | - | - | - | - | - | - | - | - | 4,375,112 | - | - | - | |||||||||||||||||||||
| Share-based payments | - | - | 7,719 | 13,582 | - | - | - | - | - | - | - | - | - | 21,301 | - | 21,301 | |||||||||||||||||||
| BALANCES AT DECEMBER 31, 2023 | 13,349,156 | 2,763,364 | (70,106) | (96,145) | - | - | - | - | (1,048,895) | - | 65,569 | (39,515) | - | 14,923,428 | 720,228 | 15,643,656 | |||||||||||||||||||
| Comprehensive income (loss) (1) | |||||||||||||||||||||||||||||||||||
| Gain on foreign currency translation of foreign operations | - | - | - | - | - | - | - | - | 122,951 | - | - | - | - | 122,951 | 225,552 | 348,503 | |||||||||||||||||||
| Loss on net investment hedge | - | - | - | - | (339,101) | - | - | - | - | (339,101) | - | (339,101) | |||||||||||||||||||||||
| Unrealized gains (losses) in cash flow hedge | - | - | - | - | - | - | - | - | - | - | (312,532) | - | - | (312,532) | 338 | (312,194) | |||||||||||||||||||
| Actuarial losses on pension and post-employment plans | - | - | - | - | - | - | - | - | - | - | - | (8,827) | - | (8,827) | (10,936) | (19,763) | |||||||||||||||||||
| Realized loss in marketable securities at FVTOCI (2) | - | - | - | - | - | - | - | - | (46,529) | - | - | - | (46,529) | - | (46,529) | ||||||||||||||||||||
| Income for the year | - | - | - | - | - | - | - | - | - | - | - | - | 3,213,274 | 3,213,274 | 478,630 | 3,691,904 | |||||||||||||||||||
| SUB-TOTAL COMPREHENSIVE INCOME (LOSS) | - | - | - | - | - | (216,150) | (46,529) | (312,532) | (8,827) | 3,213,274 | 2,629,236 | 693,584 | 3,322,820 | ||||||||||||||||||||||
| Employee benefits remeasurement - defined benefit | - | - | - | - | - | - | - | (11,978) | 11,978 | - | - | - | |||||||||||||||||||||||
| Appropriation of income (loss) | |||||||||||||||||||||||||||||||||||
| Dividends | - | - | - | - | - | - | - | - | - | - | - | - | - | - | (259) | (259) | |||||||||||||||||||
| Interest on shareholders' equity - R$0.69325 per outstanding share at the end of exercise | - | - | - | - | - | - | - | - | - | - | - | (1,145,999) | (1,145,999) | - | (1,145,999) | ||||||||||||||||||||
| Legal reserve | - | - | - | 160,664 | - | - | - | - | - | - | - | (160,664) | - | - | - | ||||||||||||||||||||
| Reserve for expansion | - | - | - | - | - | 796,275 | - | - | - | - | - | (796,275) | - | - | - | ||||||||||||||||||||
| Reserve for capital increases | - | - | - | - | 482,573 | - | - | - | - | - | - | (482,573) | - | - | - | ||||||||||||||||||||
| Reserve for tax incentives | - | - | - | - | - | - | 639,741 | - | - | - | - | (639,741) | - | - | - | ||||||||||||||||||||
| Share-based payments | - | - | (71,502) | 38,730 | - | - | - | - | - | - | - | - | - | (32,772) | - | (32,772) | |||||||||||||||||||
| Acquisition of treasury shares | - | - | - | (1,288,242) | - | - | - | - | - | - | - | - | - | (1,288,242) | - | (1,288,242) | |||||||||||||||||||
| BALANCES AT DECEMBER 31, 2024 | 13,349,156 | 2,763,364 | (141,608) | (1,345,657) | 160,664 | 482,573 | 796,275 | 639,741 | (1,265,045) | (46,529) | (246,963) | (60,320) | - | 15,085,651 | 1,413,553 | 16,499,204 | |||||||||||||||||||
| (1) | All changes in Other Comprehensive Income are presented net of deferred income taxes, when applicable, which are disclosed in note 10. |
| (2) | FVTOCI: Fair Value through Other Comprehensive Income. |
The accompanying notes are an integral part of the financial statements.
(In thousands of Brazilian Reais).
| 7 |
| Financial Statements, Individual and Consolidated | 2024 a 2023 |
| Parent company | Consolidated | |||||||
| 12.31.24 | 12.31.23 | 12.31.24 | 12.31.23 | |||||
| CASH FLOWS FROM OPERATING ACTIVITIES | ||||||||
| Income (loss) for the period | 3,213,274 | (2,028,559) | 3,691,904 | (1,868,852) | ||||
| Adjustments for: | ||||||||
| Depreciation and amortization | 1,524,052 | 1,463,385 | 2,006,113 | 1,834,232 | ||||
| Depreciation and depletion of biological assets | 1,338,942 | 1,293,193 | 1,518,391 | 1,390,550 | ||||
| Result on disposal of property, plant and equipments, investment and intangible | 5,880 | (62,638) | (163,983) | (63,229) | ||||
| Provision for tax, civil and labor risks | 1,342,558 | 273,037 | 1,349,026 | 271,063 | ||||
| Income from investments under the equity method | (3,177,505) | 2,076,089 | 13,675 | 3,264 | ||||
| Financial results, net | 5,890,846 | 2,708,742 | 1,790,513 | 2,820,850 | ||||
| Deferred income tax | 99,501 | (262,197) | 8,180 | (244,172) | ||||
| Other | 661,791 | (220,971) | 808,446 | (159,748) | ||||
| 10,899,339 | 5,240,081 | 11,022,265 | 3,983,958 | |||||
| Changes in assets and liabilities: | ||||||||
| Trade accounts and notes receivables | (1,739,038) | 496,745 | (14,552) | (606,550) | ||||
| Inventories | 450,331 | 1,479,701 | 545,882 | 1,961,810 | ||||
| Biological assets - current | (78,934) | 422,875 | (134,427) | 385,027 | ||||
| Trade accounts payable | (3,473,637) | (2,682,608) | (1,155,516) | (3,295,127) | ||||
| Cash generated by operating activities | 6,058,061 | 4,956,794 | 10,263,652 | 2,429,118 | ||||
| Redemptions (investments) in securities at FVTPL (1) | 272,829 | (1,419) | 272,942 | 18,768 | ||||
| Interest received | 549,291 | 310,918 | 923,798 | 455,827 | ||||
| Dividends and interest on shareholders' equity received | 13 | 423 | - | (851) | ||||
| Payment of tax, civil and labor provisions | (261,362) | (398,455) | (260,967) | (397,872) | ||||
| Derivative financial instruments | (142,564) | 77,197 | (154,476) | (237,773) | ||||
| Other operating assets and liabilities (2) | 2,563,629 | (2,033,262) | (268,207) | 1,672,180 | ||||
| Net cash provided by operating activities | 9,039,897 | 2,912,196 | 10,776,742 | 3,939,397 | ||||
| CASH FLOWS FROM INVESTING ACTIVITIES | ||||||||
| Redemption (additions) on investments in securities at amortized cost | - | - | 36,425 | (60,711) | ||||
| Investments in securities at FVTOCI (3) | (886,751) | - | (886,751) | - | ||||
| Redemption of restricted cash | - | - | (258,484) | 12,851 | ||||
| Additions to property, plant and equipment | (736,165) | (715,409) | (809,765) | (791,817) | ||||
| Additions to biological assets - non-current | (1,324,126) | (1,348,395) | (1,454,225) | (1,457,174) | ||||
| Proceeds from disposals of property, plant, equipments and investment | 78,338 | 167,704 | 78,339 | 167,704 | ||||
| Additions to intangible | (156,597) | (162,179) | (158,945) | (167,601) | ||||
| Capital increase in affiliates | (45,173) | (768) | (45,173) | (768) | ||||
| Capital increase in subsidiaries | 1,048 | - | - | 183,672 | ||||
| Net cash used in investing activities | (3,069,426) | (2,059,047) | (3,498,579) | (2,113,844) | ||||
| CASH FLOWS FROM FINANCING ACTIVITIES | ||||||||
| Proceeds from debt issuance | 2,014,178 | 2,153,375 | 2,344,762 | 3,836,483 | ||||
| Repayment of debt | (3,635,263) | (4,876,320) | (3,986,019) | (6,889,936) | ||||
| Payment of interest | (1,429,307) | (1,463,122) | (1,676,827) | (1,679,825) | ||||
| Payment of interest derivatives - fair value hedge | (110,043) | (699,345) | (110,041) | (699,345) | ||||
| Capital increase through issuance of shares | - | 5,313,241 | - | 5,313,241 | ||||
| Treasury shares acquisition | (1,288,242) | - | (1,288,242) | - | ||||
| Dividends and interests on shareholders' equity paid | (1,144,313) | - | (1,144,453) | - | ||||
| Payment of lease liabilities | (659,462) | (568,004) | (866,492) | (742,455) | ||||
| Net cash used in financing activities | (6,252,452) | (140,175) | (6,727,312) | (861,837) | ||||
| Effect of exchange rate variation on cash and cash equivalents | (430,544) | 4,504 | 1,349,849 | 170,019 | ||||
| Net increase (decrease) in cash and cash equivalents | (712,525) | 717,478 | 1,900,700 | 1,133,735 | ||||
| Balance at the beginning of the year | 4,701,549 | 3,984,071 | 9,264,664 | 8,130,929 | ||||
| Balance at the end of the year | 3,989,024 | 4,701,549 | 11,165,364 | 9,264,664 | ||||
| (1) | FVTPL: Fair Value through Profit or Loss. |
| (2) | In the Parent Company, mainly includes the effects of export advances made with subsidiaries, in the amount of R$472,003 in the year ended on December 31, 2024 (in the amount of R$(2,387,285) in the year ended on December 31, 2023). |
| (3) | FVTOCI: Fair Value through Other Comprehensive Income. |
The accompanying notes are an integral part of the financial statements.
(In thousands of Brazilian Reais)
| 8 |
| Financial Statements, Individual and Consolidated | 2024 a 2023 |
| Parent company | Consolidated | |||||||
| 12.31.24 | 12.31.23 | 12.31.24 | 12.31.23 | |||||
| 1 - REVENUES | 58,114,214 | 52,937,957 | 67,504,305 | 59,335,719 | ||||
| Sales of goods and products | 57,495,827 | 52,015,894 | 66,676,067 | 58,359,983 | ||||
| Other income | (82,188) | 240,682 | 84,411 | 249,773 | ||||
| Revenue related to construction of own assets | 714,048 | 705,453 | 772,644 | 758,772 | ||||
| Expected credit losses | (13,473) | (24,072) | (28,817) | (32,809) | ||||
| 2 - SUPPLIES ACQUIRED FROM THIRD PARTIES | (35,885,237) | (36,621,936) | (42,575,567) | (42,868,984) | ||||
| Costs of goods sold | (30,157,660) | (31,001,432) | (36,238,215) | (36,890,081) | ||||
| Materials, energy, third parties services and other | (5,749,870) | (5,710,704) | (6,367,592) | (6,071,691) | ||||
| Reversal for inventories losses | 22,293 | 90,200 | 30,240 | 92,788 | ||||
| 3 - GROSS ADDED VALUE (1-2) | 22,228,977 | 16,316,021 | 24,928,738 | 16,466,735 | ||||
| 4 - DEPRECIATION AND AMORTIZATION | (2,862,994) | (2,756,578) | (3,524,504) | (3,224,782) | ||||
| 5 - NET ADDED VALUE (3-4) | 19,365,983 | 13,559,443 | 21,404,234 | 13,241,953 | ||||
| 6 - VALUE ADDED RECEIVED THROUGH TRANSFER | 3,920,011 | (1,170,144) | 1,210,271 | 1,199,995 | ||||
| Income from associates and joint ventures | 3,177,505 | (2,076,089) | (13,675) | (3,264) | ||||
| Financial income | 744,173 | 905,205 | 1,225,792 | 1,202,519 | ||||
| Others | (1,667) | 740 | (1,846) | 740 | ||||
| 7 - ADDED VALUE TO BE DISTRIBUTED (5+6) | 23,285,994 | 12,389,299 | 22,614,505 | 14,441,948 | ||||
| 8 - DISTRIBUTION OF ADDED VALUE | 23,285,994 | 12,389,299 | 22,614,505 | 14,441,948 | ||||
| Payroll | 6,776,699 | 5,875,185 | 8,292,382 | 6,741,308 | ||||
| Salaries | 4,456,104 | 4,069,305 | 5,554,432 | 4,825,321 | ||||
| Benefits | 1,997,860 | 1,504,043 | 2,382,752 | 1,594,557 | ||||
| Government severance indemnity fund for employees | 322,735 | 301,837 | 355,198 | 321,430 | ||||
| Taxes, Fees and Contributions | 6,480,613 | 4,717,506 | 7,342,214 | 5,239,440 | ||||
| Federal | 3,199,060 | 1,549,016 | 3,829,208 | 1,835,969 | ||||
| State | 3,225,234 | 3,116,249 | 3,443,851 | 3,342,680 | ||||
| Municipal | 56,319 | 52,241 | 69,155 | 60,791 | ||||
| Capital Remuneration from Third Parties | 6,815,408 | 3,825,167 | 3,288,005 | 4,330,052 | ||||
| Interests, including exchange variation | 6,667,151 | 3,665,171 | 3,050,306 | 4,080,237 | ||||
| Rents | 148,257 | 159,996 | 237,699 | 249,815 | ||||
| Interest on Own-Capital | 3,213,274 | (2,028,559) | 3,691,904 | (1,868,852) | ||||
| Interest on shareholders' equity | 1,145,999 | - | 1,145,999 | - | ||||
| Income (loss) for the year | 2,067,275 | (2,028,559) | 2,067,275 | (2,028,559) | ||||
| Non-controlling interest | - | - | 478,630 | 159,707 | ||||
The accompanying notes are an integral part of the financial statements.
(In thousands of Brazilian Reais)
| 9 |
| Financial Statements, Individual and Consolidated | 2024 a 2023 |

2024 RESULTS
| 10 |
| Financial Statements, Individual and Consolidated | 2024 a 2023 |

| 11 |
| Financial Statements, Individual and Consolidated | 2024 a 2023 |

| 12 |
| Financial Statements, Individual and Consolidated | 2024 a 2023 |

| 13 |
| Financial Statements, Individual and Consolidated | 2024 a 2023 |

| 14 |
| Financial Statements, Individual and Consolidated | 2024 a 2023 |

| 15 |
| Financial Statements, Individual and Consolidated | 2024 a 2023 |

| 16 |
| Financial Statements, Individual and Consolidated | 2024 a 2023 |

| 17 |
| Financial Statements, Individual and Consolidated | 2024 a 2023 |

| 18 |
| Financial Statements, Individual and Consolidated | 2024 a 2023 |

| 19 |
| Financial Statements, Individual and Consolidated | 2024 a 2023 |

| 20 |
| Financial Statements, Individual and Consolidated | 2024 a 2023 |
| 21 |
| Financial Statements, Individual and Consolidated | 2024 a 2023 |
| 22 |
| Financial Statements, Individual and Consolidated | 2024 a 2023 |

| 23 |
| Financial Statements, Individual and Consolidated | 2024 a 2023 |

| 24 |
| Financial Statements, Individual and Consolidated | 2024 a 2023 |

| 25 |
| Financial Statements, Individual and Consolidated | 2024 a 2023 |

| 26 |
| Financial Statements, Individual and Consolidated | 2024 a 2023 |
| 27 |
| Financial Statements, Individual and Consolidated | 2024 a 2023 |

| 28 |
| Financial Statements, Individual and Consolidated | 2024 a 2023 |

| 29 |
| Financial Statements, Individual and Consolidated | 2024 a 2023 |

| 30 |
| Financial Statements, Individual and Consolidated | 2024 a 2023 |

| 31 |
| Financial Statements, Individual and Consolidated | 2024 a 2023 |

| 32 |
| Financial Statements, Individual and Consolidated | 2024 a 2023 |

| 33 |
| Financial Statements, Individual and Consolidated | 2024 a 2023 |

| 34 |
| Financial Statements, Individual and Consolidated | 2024 a 2023 |

| 35 |
| Financial Statements, Individual and Consolidated | 2024 a 2023 |

| 36 |
| Financial Statements, Individual and Consolidated | 2024 a 2023 |

| 37 |
| Financial Statements, Individual and Consolidated | 2024 a 2023 |

| 38 |
| Financial Statements, Individual and Consolidated | 2024 a 2023 |
| 39 |
| Financial Statements, Individual and Consolidated | 2024 a 2023 |

| 40 |
| Financial Statements, Individual and Consolidated | 2024 a 2023 |

| 41 |
| Financial Statements, Individual and Consolidated | 2024 a 2023 |
| 42 |
| Financial Statements, Individual and Consolidated | 2024 a 2023 |
| 43 |
| Financial Statements, Individual and Consolidated | 2024 a 2023 |

| 44 |
| Financial Statements, Individual and Consolidated | 2024 a 2023 |

| 45 |
| Financial Statements, Individual and Consolidated | 2024 a 2023 |

| 46 |
| Financial Statements, Individual and Consolidated | 2024 a 2023 |
| 1. | Company’s Operations |
BRF S.A. (“BRF”), and its subsidiaries (collectively the “Company”) is a publicly traded company, listed on the segment Novo Mercado of Brasil, Bolsa, Balcão (“B3”), under the ticker BRFS3, and listed on the New York Stock Exchange (“NYSE”), under the ticker BRFS. The Company’s registered office is at 475 Jorge Tzachel Street, Fazenda District, Itajaí - Santa Catarina and the main business office is in São Paulo city.
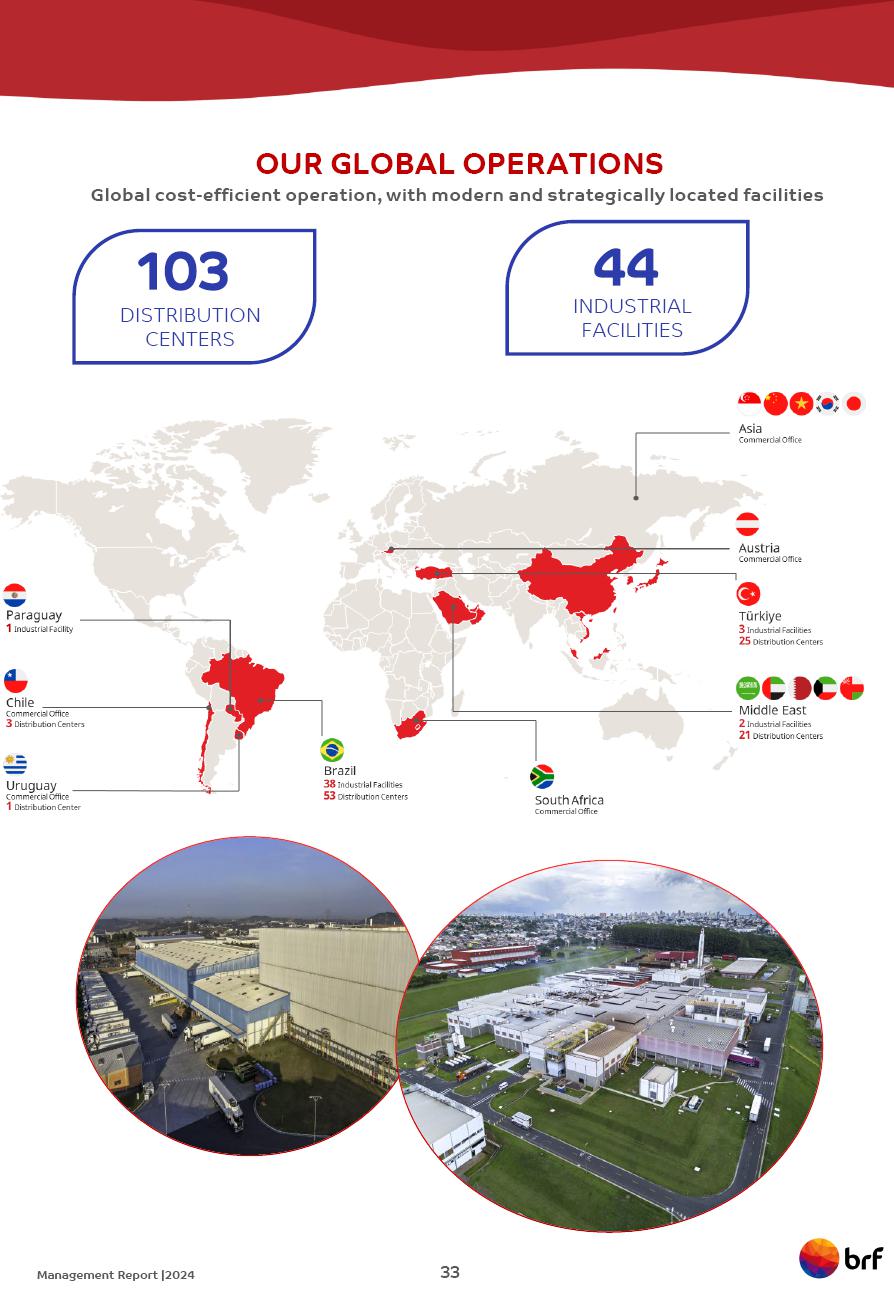
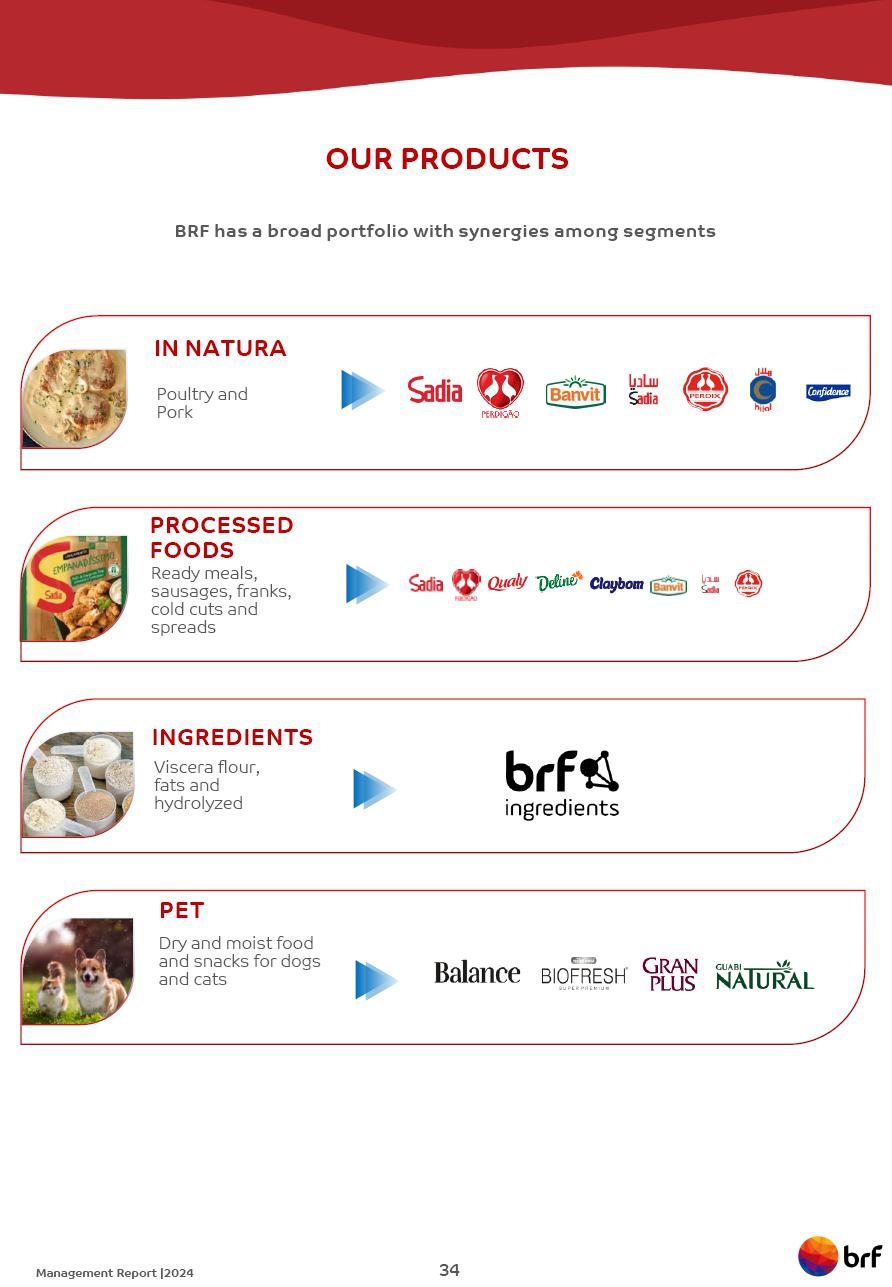
BRF is a Brazilian multinational company, with global presence, which owns a comprehensive portfolio of products, and it is one of the world’s largest companies of food products. The Company operates by raising, producing and slaughtering poultry and pork for processing, production and sale of fresh meat, processed products, pasta, margarine, pet food and others.
The Company holds as main brands Sadia, Perdigão, Qualy, Chester®, Kidelli, Perdix, Banvit, Biofresh and Gran Plus, present mainly in Brazil, Turkey and Middle Eastern countries.
| 47 |
| Financial Statements, Individual and Consolidated | 2024 a 2023 |
| 1.1. | Equity interest |
| % equity interest | |||||||||
| Entity | Main activity | Country | 12.31.24 | 12.31.23 | |||||
| Direct subsidiaries | |||||||||
| BRF Energia S.A. | Commercialization of eletric energy | Brazil | 100.00 | 100.00 | |||||
| BRF Foods UK Ltd. | Administrative and marketing services | England | 100.00 | 100.00 | |||||
| BRF GmbH | Holding | Austria | 100.00 | 100.00 | |||||
| BRF Pet S.A. | Industrialization, commercialization and distribution of feed and nutrients for animals | Brazil | 100.00 | 100.00 | |||||
| MBR Investimentos Ltda. | (f) | Holding, management of companies and assets | Brazil | 100.00 | 100.00 | ||||
| Sadia Alimentos S.A.U. | Holding | Argentina | 100.00 | 100.00 | |||||
| Sadia Uruguay S.A. | (g) | Import and commercialization of products | Uruguay | 100.00 | 100.00 | ||||
| Vip S.A. Empreendimentos e Participações Imobiliárias | (f) | Commercialization of owned real state | Brazil | - | 100.00 | ||||
| Indirect subsidiaries | |||||||||
| Al Khan Foodstuff LLC ("AKF") | (b) | Import, commercialization and distribution of products | Oman | 70.00 | 70.00 | ||||
| Al-Wafi Al-Takamol International for Foods Products | Import and commercialization of products | Saudi Arabia | 100.00 | 100.00 | |||||
| Al-Wafi Food Products Factory LLC | Import, export, industrialization and commercialization of products | UAE (1) | 100.00 | 100.00 | |||||
| Badi Ltd. | Holding | UAE (1) | 100.00 | 100.00 | |||||
| Banvit Bandirma Vitaminli | Import, industrialization and commercialization of products | Turkey | 91.71 | 91.71 | |||||
| Banvit Enerji ve Elektrik Üretim Ltd. Sti. | (a) | Generation and commercialization of electric energy | Turkey | - | 100.00 | ||||
| BRF Arabia Holding Company JCS | Holding | Saudi Arabia | 70.00 | 70.00 | |||||
| BRF Arabia Food Industry Ltd. | (l) | Preparation and preservation of meat, fish, crustaceans and mollusks and production of oils and animal and plant based fats | Saudi Arabia | 100.00 | - | ||||
| BRF Foods GmbH | (h) | Industrialization, import and commercialization of products | Austria | 100.00 | 100.00 | ||||
| BRF Foods LLC | (h) | Industrialization, import and commercialization of products | UAE (1) | 100.00 | - | ||||
| BRF Foods LLC | (d) | Import, industrialization and commercialization of products | Russia | - | 100.00 | ||||
| BRF Global Company Nigeria Ltd. | Marketing and logistics services | Nigeria | 100.00 | 100.00 | |||||
| BRF Global Company South Africa Proprietary Ltd. | Administrative, marketing and logistics services | South Africa | 100.00 | 100.00 | |||||
| BRF Global GmbH | Holding and trading | Austria | 100.00 | 100.00 | |||||
| BRF Japan KK | Marketing and logistics services, import, export, industrialization and commercialization of products | Japan | 100.00 | 100.00 | |||||
| BRF Korea LLC | Marketing and logistics services | Korea | 100.00 | 100.00 | |||||
| BRF Kuwait Food Supply Management Co. | (b) | Import, commercialization and distribution of products | Kuwait | 49.00 | 49.00 | ||||
| BRF Shanghai Management Consulting Co. Ltd. | Provision of consultancy and marketing services | China | 100.00 | 100.00 | |||||
| BRF Shanghai Trading Co. Ltd. | Import, export and commercialization of products | China | 100.00 | 100.00 | |||||
| BRF Singapore Foods PTE Ltd. | Administrative, marketing and logistics services | Singapore | 100.00 | 100.00 | |||||
| Buenos Aires Fortune S.A. | (e) | Holding | Argentina | - | 100.00 | ||||
| Eclipse Holding Cöoperatief U.A. | Holding | The Netherlands | 100.00 | 100.00 | |||||
| Eclipse Latam Holdings | (k) | Holding | Spain | - | 100.00 | ||||
| Federal Foods LLC | (b) | Import, commercialization and distribution of products | UAE (1) | 49.00 | 49.00 | ||||
| Federal Foods Qatar | (b) | Import, commercialization and distribution of products | Qatar | 49.00 | 49.00 | ||||
| Hercosul Alimentos Ltda. | (m) | Manufacturing and sale of animal feed | Brazil | 100.00 | 100.00 | ||||
| Hercosul Distribuição Ltda. | (m) | Import, export, wholesale and retail sale of food products for animals | Brazil | 100.00 | 100.00 | ||||
| Hercosul International S.R.L. | Manufacturing, export, import and sale of feed and nutrients for animals | Paraguay | 100.00 | 100.00 | |||||
| Hercosul Soluções em Transportes Ltda. | Road freight | Brazil | 100.00 | 100.00 | |||||
| Joody Al Sharqiya Food Production Factory LLC | Import and commercialization of products | Saudi Arabia | 100.00 | 100.00 | |||||
| Mogiana Alimentos S.A. | Manufacturing, distribution and sale of Pet Food products | Brazil | 100.00 | 100.00 | |||||
| Nutrinvestments BV | (j) | Holding | The Netherlands | - | 100.00 | ||||
| One Foods Holdings Ltd. | Holding | UAE (1) | 100.00 | 100.00 | |||||
| Perdigão Europe Lda. | (i) | Import, export of products and administrative services | Portugal | - | 100.00 | ||||
| ProudFood Lda. | Import and commercialization of products | Angola | 100.00 | 100.00 | |||||
| PSA Laboratório Veterinário Ltda. | (f) | Veterinary activities | Brazil | - | 100.00 | ||||
| Sadia Chile SpA | Import, export and commercialization of products | Chile | 100.00 | 100.00 | |||||
| TBQ Foods GmbH | Holding | Austria | 60.00 | 60.00 | |||||
| Affiliated | |||||||||
| Potengi Holdings S.A. | (c) | Holding | Brazil | 50.00 | 50.00 | ||||
| PR-SAD Administração de Bem Próprio S.A. | Management of assets | Brazil | 33.33 | 33.33 | |||||
(1) UAE – United Arab Emirates
| (a) | On September 09, 2024, the subsidiary Banvit Enerji ve Elektric Üretim Ltd. Sti. was dissolved. |
| (b) | For these entities, the Company has agreements that ensure full economic rights, except for AKF, in which the economic rights are of 99%. |
| (c) | Affiliated with a subsidiary of Auren Energia S.A., whose economic stake is 24% (note 12). On 10.09.24 a share capital increase was approved in the total amount of R$94,221, of which R$22,613 by BRF S.A. And on 12.11.24 a share capital increase was approved in the total amount of R$94,000, of which R$22,560 by BRF S.A. |
| (d) | On January 15, 2024, the subsidiary BRF Foods LLC (Russia) was dissolved. |
| 48 |
| Financial Statements, Individual and Consolidated | 2024 a 2023 |
| (e) | On March 19, 2024, the subsidiary Buenos Aires Fortune S.A. was dissolved. |
| (f) | On March 28, 2024, the subsidiaries VIP S.A. Empreendimentos e Participações Imobiliárias and PSA Laboratório Veterinário Ltda. were merged into BRF S.A. and the indirect subsidiary BRF Investimentos Ltda. became direct subsidiary of da BRF S.A. On December 23, 2024, the name of BRF Investimentos Ltda. became MBR Investimentos Ltda. |
| (g) | On March 31, 2024, the share capital of the subsidiary Sadia Uruguay S.A. was reduced by UYU 415,000 (R$55,365), and on June 17, 24 there was a further capital reduction of UYU 415,000 (R$58,515). |
| (h) | The BRF Foods GmbH, an Austrian company, had a subsidiary in the United Arab Emirates, which on April 05, 24 was converted into a limited company called BRF Foods LLC (UAE). On February 01, 2025, this subsidiary was merged into BRF GmbH. |
| (i) | On April 29, 2024, the subsidiary Perdigão Europe Lda. was dissolved. |
| (j) | On July 19, 2024, the subsidiary Nutrinvestments BV was dissolved. |
| (k) | On November 08, 2024, the subsidiary Eclipse Latam Holdings was dissolved. |
| (l) | On November 28, 2024, the company BRF Arabia Food Industry Ltd. was incorporated, a wholly owned subsidiary of the company BRF Arabia Holding Company JCS. |
| (m) | On January 02, 2025, the subsidiaries Hercosul Alimentos Ltda. and Hercosul Distribuição Ltda. were merged into Mogiana Alimentos S.A. |
Location of Subsidiaries and Affiliates

| 1.2. | Climate events in Rio Grande do Sul |
On May 1st, 2024, Rio Grande do Sul declared a state of public calamity throughout its territory affected by extreme weather events causing material and environmental damage, with the destruction of homes, roads and bridges, as well as the compromise of the functioning of local and regional public and private institutions and the closure of public roads.
The Company was affected by total and partial shutdowns in its regional operations, industrial complexes, distribution centers and support offices, and made the necessary efforts to resume operations.
Due to these weather events, the Company incurred losses and additional expenses, mainly related to the agricultural and industrial production process, structural and equipment repairs and expenses with donations, which are presented in the financial statements, net of partial advances, under the following items:
| 49 |
| Financial Statements, Individual and Consolidated | 2024 a 2023 |
| Parent Company and Consolidated | ||||
| 12.31.24 | ||||
| Cost of sales | (104,418) | |||
| Selling expenses | (3,774) | |||
| General and administrative expenses | (4,509) | |||
| (112,701) |
The Company has insurance policies for events of this nature and continue in the process of regulating this claim in Rio Grande do Sul.
| 1.3. | Incident at the plant in Carambeí - PR |
On August 1st, 2024, the Company informed its shareholders and the market in general that a fire had occurred in part of its Carambeí - PR unit. There were no fatalities and all employees were safe. In the same month, the Company was able to gradually resume operations at the unit.
Due to the fire, the Company recognized in its income statement for the period expenses mainly related to losses in the production process, expenses for structural and equipment repairs, as well as partial reimbursement of the loss, generating a practically neutral impact up to the date of approval of these financial statements.
The Company has insurance policies for events of this nature and continue in the process of regulating this claim in Carambeí - PR.
| 1.4. | Acquisition of stake in Addoha Poultry Company |
On October 31, 2024, BRF Arabia Holding Company (“BRF Arabia”), joint venture 70% owned by BRF and 30% by Halal Products Development Company, a wholly owned subsidiary of the Public Investment Fund da Arabia Saudita (“PIF”), has entered into a binding agreement to acquire 26% da Addoha Poultry Company, a company that operates in the slaughtering of poultry in the Kingdom of Saudi Arabia.
The transaction has a total value of SAR316,200 equivalent to R$511,105, of which SAR216,200 equivalent to R$349,466 will be paid into Addoha. On January 14, 2025, a shareholders' agreement was signed between BRF Arabia and the current shareholders of Addoha, ensuring effective participation in the company's management and allowing the know-how of BRF and HPDC to contribute to maximizing synergies between the entities.
On the same date the company completed the acquisition, Addoha being an associate of BRF, which will have its investment accounted for using the equity method.
| 1.5. | Acquisition of processed foods factory in Henan Province in China |
On November 20, 2024, BRF GmbH, a wholly owned subsidiary of the Company, has signed a binding agreement with Henan Best Foods Co. Ltd., a subsidiary of the OSI Group, a U.S.-based company specializing in food processing, to acquire a processed foods factory in Henan Province, China.
The total value of the transaction is U$42,700 equivalent to R$246,563. The Factory has two food processing lines with an annual capacity of 28,000 tons and the potential to expand to two additional lines.
| 50 |
| Financial Statements, Individual and Consolidated | 2024 a 2023 |
Completion is subject to the fulfillment of applicable conditions precedent for transactions of this nature, including regulatory approvals and corporate restructuring of the assets that comprise the Factory.
1.6. Term sheet Gelprime
On December 17, 2024, MBR Investimentos Ltda., a company controlled by BRF, has signed a term sheet with the companies Viposa Participações Ltda., Indústria e Comércio de Couros Britali Ltda. and Vanz Holding Ltda., holders of 100% (one hundred percent) of the capital stock of Gelprime Indústria e Comércio de Produtos Alimentos Ltda. ("Gelprime"), a company that produces, sells and distributes gelatin and collagen through the processing of animal origin raw material.
The Term Sheet establishes the main terms and conditions for the acquisition, by MBR, of 50% of Gelprime capital stock ("Acquisition") for the value of R$ 312,500, subject to possible adjustment.
The closing of the transaction is subject to the negotiation and execution of the definitive documents and the approval by the Brazilian antitrust authorities.
1.7. Acquisition of stake in joint venture PlantPlus Foods, LLC.
On November 7, 2009, Marfrig Global Foods (“Marfrig”) and Archer-Daniels-Midland Company (“ADM”) mutually agreed to dissolve their partnership through a joint venture called PlantPlus Foods, LLC (“PlantPlus LLC”) located in the United States, in which Marfrig held a 70% stake, responsible for the operation, production and distribution of the products, and ADM held a 30% stake, through the supply of ingredients and technical know-how for the development of plant-based products.
Considering that ADM expressed an interest in discontinuing its participation in the joint venture and the existence of synergies between PlantPlus LLC's product portfolio and BRF's, the Company took over ADM's 30% stake in PlantPlus LLC and 0.29% in PlantPlus Foods Brasil Ltda, with no cash disbursement to BRF, nor assumption of obligations.
The operation was approved without reservations by the Administrative Council for Economic Defense (“CADE”) and, on January 23, 2025, the transfer of the shares of Plant Plus LLC from ADM to BRF was completed.
The investment in the joint venture PlantPlus LLC will be accounted for using the equity method.
| 2. | Basis of Preparation and Presentation of Financial Statements |
The Parent Company’s and Consolidated financial statements were prepared in accordance with i) the accounting practices adopted in Brazil, which include those included in Brazilian corporate legislation and the pronouncements, guidelines and technical interpretations issued by the Accounting Pronouncements Committee - ("CPC”) and approved by the Board Federal Accounting – (“CFC”) and the Securities and Exchange Commission – (“CVM”) and ii) international financial reporting standards (“IFRS”), issued by International Accounting Standards Board (“IASB”). All the relevant information applicable to the financial statements, and only them, are being evidenced and correspond to those used by administration in its management.
| 51 |
| Financial Statements, Individual and Consolidated | 2024 a 2023 |
The Parent Company’s and Consolidated financial statements are expressed in thousands of Brazilian Reais (“R$”), unless otherwise stated. For disclosures of amounts in other currencies, the values were also expressed in thousands, unless otherwise stated.
The preparation of the Parent Company’s and Consolidated financial statements require Management to make judgments, use estimates and adopt assumptions that affect the reported amounts of revenues, expenses, assets and liabilities, as well as the disclosures of contingent liabilities. The uncertainty inherent to these judgments, assumptions and estimates could result in material adjustments to the carrying amount of certain assets and liabilities in future periods.
Any judgments, estimates and assumptions are reviewed at each reporting period.
The Parent Company’s and Consolidated financial statements were prepared based on the recoverable historical cost, except of items held at fair value as described in Note 3.2.
The Company prepared Parent Company’s and Consolidated financial statements under the going concern assumption and disclosed all relevant information in its explanatory notes, in order to clarify and complement the accounting basis adopted.
| 3. | Material Accounting Policies |
The material accounting policies applied in the preparation of these financial statements have been included in the respective notes and are consistent for all years presented.
| 3.1. | Consolidation |
The Consolidated financial statements include BRF and the subsidiaries (note 1.1) of which BRF has direct or indirect control, obtained when the Company is exposed to or has right to variable returns and has the power to influence such subsidiaries.
The financial information of the subsidiaries was prepared using the same accounting policies of the Parent Company.
All transactions and balances between BRF and its subsidiaries have been eliminated upon consolidation, as well as the unrealized profits or losses arising from these transactions, net of taxes. Non-controlling interests are presented separately.
Except for the associates PR-SAD Administração de Bem Próprio S.A. and Potengi Holdings S.A., in which the Company recognizes the investments by the equity method, all other entities presented in the table in note 1.1. were consolidated.
| 52 |
| Financial Statements, Individual and Consolidated | 2024 a 2023 |
| 3.2. | Functional currency and foreign currency |
The financial statements are presented in Reais (R$), which is the Company's functional and presentation currency.
For transactions in foreign currency, non-monetary assets and liabilities, as well as income and expenses, are translated at the historical rate of the transaction, monetary assets and liabilities are translated at the exchange rate at the end of the year, and the cumulative effects of gains or losses on the translation of monetary items are recorded directly in the income statement for the year.
The Statements of Income (Loss) and the Statements of Cash Flows of subsidiaries with a functional currency other than the Parent Company are translated into Reais at the exchange rate obtained by averaging the daily rates for each month, assets and liabilities are translated at the exchange rate at the end of the year and other equity items are translated at the historical transaction rate. All exchange differences are recorded in Other Comprehensive Income.
The main exchange rates used by the Company to translate the financial information of subsidiaries with a currency different from the Parent Company's functional currency were as follows:
| Currency | Final rate | Average rate | ||
| U.S. Dollars ("USD") | 6.1923 | 6.0970 | ||
| Euro ("EUR") | 6.4363 | 6.3834 | ||
| Turkish Liras ("TRY") | 0.1751 | 0.1743 | ||
| Argentinian Peso ("ARS") | 0.0060 | 0.0060 | ||
Saudi Arabian Riyal ("SAR") | 1.6489 | 1.6233 | ||
| United Arab Emirates Dirhan ("AED") | 1.6861 | 1.6601 |
| 3.3. | Hyperinflationary economies |
The Company has subsidiaries in countries considered to be hyperinflationary economies, currently Turkey and Argentina, which are subject to the requirements of CPC 42 / IAS 29 - Accounting in Hyperinflationary Economies. The following practices have been adopted for these subsidiaries: non-monetary assets and liabilities, shareholders' equity and the income statement are adjusted for the change in the general purchasing power of the currency by applying a general price index. The balances of these subsidiaries were translated into the presentation currency at the exchange rate in force at the end of the year, both for equity and income items.
For new cases, when an economy becomes hyperinflationary, the correction of the balance sheet balances up to the previous year of the subsidiary in which it is located in this economy is recorded under the heading of accumulated profits and losses, since the functional currency of the Parent Company is not the currency of a hyperinflationary economy.
3.3.1. Türkiye
The inflation in the year ended December 31, 2024, was 44.4% (65.0% for the year ended on December 31, 2023). In the Consolidated financial information for the year ended December 31, 2024, the inflation adjustment affected the Income before financial results and income taxes in R$(102,540) (R$(306,213) for the year ended on December 31, 2023), and revenue was calculated which impacted Financial Result by R$341,052 (R$560,665 for the year ended December 31, 2023) and Net Profit by R$234,975 (R$210,603 in the same period of the previous year).
| 53 |
| Financial Statements, Individual and Consolidated | 2024 a 2023 |
3.4.2. Argentina
Inflation in the year ended on December 31, 2024, was 117.8% (211.4% for the year ended on December 31, 2023). In the Consolidated financial information for the year ended December 31, 2024, the inflation adjustment impacted the Income before Financial Results in the amount of R$(502) (R$1,474 for the year ended December 31, 2023), Financial Result by R$(6.420) (R$(11,961) for the year ended December 31, 2023) and Net Profit (Loss) by R$(10,132) (R$(12,089) for the year ended December 31, 2023).
| 3.4. | Accounting judgments, estimates and assumptions |
The Management made the following judgments which have a material impact on the amounts recognized in the financial statements:
| Note | Accounting judgments, estimates and assumptions | |
| 25 | Determination of the moment when control is transferred for revenue recognition | |
| 17 | Determination or change of the probability of exercise of a renewal option or anticipated termination of the lease agreements | |
| 14 | Determination of recoverable amount non-financial assets. Main assumptions: discount and growth rates | |
| 6 and 23 | Determination of loss rate in the measurement of expected credit losses | |
| 8 | Determination of fair value of biological assets due to significant unobservable inputs | |
| 13 and 14 | Reduction factor on technical useful lives such as deterioration, obsolescence and influence of external factors when determining the useful lives of property, plant, equipment and intangible assets with definite useful life | |
| 19 | Actuarial assumptions on measurement of employee benefits liabilities | |
| 20 | Assessment of the loss probability and liability measurement on provision for tax, civil and labor risks |
| 3.5. | Contingent assets |
Contingent assets are possible assets to which existence needs to be confirmed by the occurrence or not of one or more uncertain future events. The Company does not record contingent assets, however when the inflow of economic benefits is more likely than not to occur, the contingent assets are disclosed.
| 3.6. | Employee and management profit sharing |
Employees are entitled to profit sharing based on certain targets agreed upon on an annual basis, whereas directors are entitled to profit sharing based on the provisions of the bylaws, proposed by the Board of Directors and approved by the shareholders. The profit-sharing amount expected to be paid is recognized by function in the statement of income (loss), according to the probability of the target´s achievement.
| 54 |
| Financial Statements, Individual and Consolidated | 2024 a 2023 |
| 3.7. | Statements of Value Added |
The Company prepared the individual and Consolidated statements of added value (“DVA”) under the technical pronouncement CPC 09 – Statement of Value Added, which are presented as part of the financial statements in accordance with practices adopted in Brazil. For IFRS, they do not require the presentation of these statements, and therefore it represents supplemental financial information, without prejudice to the set of financial statements.
| 3.8. | Standards issued but not yet effective |
The following amendments to standards have been issued by IASB but are not effective for the 2024 year:
• Amendments to CPC 18 (R3) - Investments in Associates, Subsidiaries and Joint Ventures and ICPC 09 - Individual Financial Statements, Separate Financial Statements, Consolidated Financial Statements and Application of the Equity Method - Implementation on January 1, 2025;
• Amendments to IAS 21, CPC 02 (R3) - Effects of Changes in Foreign Exchange Rates and Translation of Financial Statements and Amendments to CPC 02 (R2) - Effects of Changes in Foreign Exchange Rates and Translation of Financial Statements and CPC 37 (R1) - Initial Adoption of International Accounting Standards - Implementation on January 1, 2025;
• Technical Guidance OCPC 10: Carbon Credits (tCO2e), Emission Allowances and Decarbonization Credits (CBIO) - Implementation on January 1, 2025.
• IAS 12 / CPC 32 – International Tax Reform – In December 2021, the Organization for Economic Cooperation and Development (“OECD”) released the rules of the Pillar Two model for international tax reform, which apply to multinational groups with consolidated revenues of €750 million or more in at least two of the last four fiscal years.
Multinational economic groups within the scope of these rules will have to calculate their effective tax rate in each country where they operate, arriving at an effective tax rate for the jurisdiction.
When the effective tax rate in the jurisdiction where the group operates is lower than the minimum rate set at 15%, the multinational group will have to pay a supplementary amount of tax on its profit, referring to the difference between this rate and the effective tax rate in the jurisdiction where the group operates.
Since 2024, the Company has been subject to the OECD's Pillar Two model rules in Austria, South Africa, the Netherlands, the United Kingdom and Turkey, with no significant impacts for these jurisdictions.
At the same time, Brazil published Provisional Measure 1.262, Normative Instruction 2.228/24 and Law 15.079/24, which instituted the Qualified Domestic Minimum Top-Up Tax (QDMTT) in the form of Additional CSLL, effective from 01.01.25, characterizing a partial adoption of the Pillar Two rules;
• CVM Resolution No. 193/23, as amended by CVM Resolution No. 219/24 - Provides for the preparation and disclosure of financial information reports related to sustainability, based on the international standard issued by the International Sustainability Standards Board (“ISSB”) - Implementation on January 1, 2026;
• Amendments to IFRS 18: Presentation and Disclosure in Financial Statements - Implementation on January 1, 2027;
• Amendments to IFRS 19: Subsidiaries without Public Liability: Disclosures - Implementation on January 1, 2027.
| 55 |
| Financial Statements, Individual and Consolidated | 2024 a 2023 |
| 4. | Cash and Cash Equivalents |
| Average rate (1) | Parent company | Consolidated | |||||||
| 12.31.24 | 12.31.23 | 12.31.24 | 12.31.23 | ||||||
| Cash and bank accounts | |||||||||
| Brazilian reais | - | 269,699 | 145,200 | 296,529 | 160,310 | ||||
| Saudi riyal | - | - | - | 256,879 | 307,151 | ||||
| U.S. dollar | - | 162,389 | 99,828 | 630,990 | 768,868 | ||||
| Euro | - | 4,603 | 1,392 | 16,995 | 24,506 | ||||
| Turkish lira | - | - | - | 6,348 | 93,641 | ||||
| Other currencies | - | 78 | 124 | 170,621 | 252,781 | ||||
| 436,769 | 246,544 | 1,378,362 | 1,607,257 | ||||||
| Cash equivalents | |||||||||
| In Brazilian reais | |||||||||
| Investment funds | 12.15% | 4,727 | 4,676 | 4,727 | 4,676 | ||||
| Offshore note (3) | 11.18% | - | - | 1,501,608 | - | ||||
| Bank deposit certificates | 12.16% | 3,545,946 | 4,438,970 | 3,716,958 | 4,876,861 | ||||
| 3,550,673 | 4,443,646 | 5,223,293 | 4,881,537 | ||||||
| In U.S. Dollar | |||||||||
| Term deposit | 5.22% | - | - | 2,721,270 | 2,069,531 | ||||
| Overnight | - | 1,582 | 11,359 | 1,582 | 17,570 | ||||
| Other currencies | |||||||||
| Term deposit (Saudi riyal) | 5.42% | - | - | 959,103 | 612,110 | ||||
| Term deposit (2) | - | - | 881,754 | 76,659 | |||||
| 1,582 | 11,359 | 4,563,709 | 2,775,870 | ||||||
| 3,989,024 | 4,701,549 | 11,165,364 | 9,264,664 | ||||||
| (1) | Weighted average annual rate. |
| (2) | The amounts are substantially denominated in Turkish Lira (TRY) at a weighted average rate of 49.57% (43.00% on December 31, 2023). |
| (3) | Investment in financial institutions in the international market, with the balance in Reais (R$), indexed to the DI. |
Accounting policy: Comprise the balances of cash, banks and financial applications of immediate liquidity whose maturities, at the time of acquisition, are equal to or less than 90 days, readily convertible into a known amount of cash and which are subject to an insignificant risk of change in value. |
| 56 |
| Financial Statements, Individual and Consolidated | 2024 a 2023 |
| 5. | Marketable Securities |
| Average rate (2) | Parent company | Consolidated | |||||||||||
| WAM (1) | Currency | 12.31.24 | 12.31.23 | 12.31.24 | 12.31.23 | ||||||||
| Fair value through other comprehensive income | |||||||||||||
| National treasury notes (5) | 8.76 | R$ | 11.44% | 859,029 | - | 859,029 | - | ||||||
| Equity securities (3) | - | USD | - | - | - | 15,481 | 12,103 | ||||||
| Fair value through profit and loss | |||||||||||||
| Financial treasury bills | 1.17 | R$ | 10.87% | 35,031 | 412,107 | 35,031 | 412,107 | ||||||
| Investment funds - FIDC II | 1.08 | R$ | - | 18,450 | 16,490 | 18,450 | 16,490 | ||||||
| Repurchase agreement | - | R$ | - | - | - | - | 35,751 | ||||||
| Other | 0.08 | R$ | - | - | - | 20 | 20 | ||||||
| 53,481 | 428,597 | 53,501 | 464,368 | ||||||||||
| Amortized cost | |||||||||||||
| Sovereign bonds and other (4) | 5.40 | USD | 6.82% | - | - | 289,880 | 291,402 | ||||||
| 912,510 | 428,597 | 1,217,891 | 767,873 | ||||||||||
| Current | 894,060 | 412,107 | 894,080 | 447,878 | |||||||||
| Non-current (6) | 18,450 | 16,490 | 323,811 | 319,995 | |||||||||
| (1) | Weighted average maturity in years. |
| (2) | Weighted average annual rate. |
| (3) | It’s comprised of Aleph Farms Ltd. stocks. |
| (4) | This is represented by private and Angolan government bonds and is presented net of expected credit losses in the amount of R$22,530 (R$16,466 on December 31, 2023). The amounts refer to US Dollar Bonds at a weighted average rate of 6.82% (US Dollar 6.34% and Bonds 5.90% on December 31, 2023). |
| (5) | FVTOCI - Fair Value through Other Comprehensive Income R$46.529. |
| (6) | Maturity until May 2035. |
On December 31, 2023, the amount of R$69,753 (R$9,179 on December 31, 2023) classified as cash and cash equivalents and marketable securities were pledged as guarantee, with no use restrictions, for future contracts traded on B3.
Accounting policy: Comprises the balances of securities with immediate liquidity whose maturities, at the time of acquisition, are short-term. They are measured at fair value through other comprehensive income, fair value through profit or loss and amortized cost. |
| 57 |
| Financial Statements, Individual and Consolidated | 2024 a 2023 |
| 6. | Trade Accounts and Notes Receivable |
| Parent company | Consolidated | |||||||
| 12.31.24 | 12.31.23 | 12.31.24 | 12.31.23 | |||||
| Trade accounts receivable | ||||||||
| Domestic market | ||||||||
| Third parties | 2,285,150 | 1,729,067 | 2,420,942 | 1,860,089 | ||||
| Related parties | 51,834 | 24,339 | 16,402 | 8,419 | ||||
| Foreign market | ||||||||
| Third parties | 2,906,380 | 764,750 | 4,395,420 | 3,496,442 | ||||
| Related parties | 3,299,865 | 3,713,478 | 30,924 | 27,781 | ||||
| 8,543,229 | 6,231,634 | 6,863,688 | 5,392,731 | |||||
| ( - ) Adjustment to present value ("APV") | (28,340) | (22,692) | (39,291) | (29,284) | ||||
| ( - ) Expected credit losses | (659,030) | (547,078) | (726,764) | (591,479) | ||||
| 7,855,859 | 5,661,864 | 6,097,633 | 4,771,968 | |||||
| Current | 7,834,133 | 5,655,967 | 6,075,013 | 4,766,071 | ||||
| Non-current | 21,726 | 5,897 | 22,620 | 5,897 | ||||
| Notes receivable | 61,628 | 83,863 | 61,628 | 83,863 | ||||
| ( - ) Adjustment to present value ("APV") | (5,910) | (2,223) | (5,910) | (2,223) | ||||
| ( - ) Expected credit losses | (15,381) | (15,379) | (15,381) | (15,379) | ||||
| 40,337 | 66,261 | 40,337 | 66,261 | |||||
| Current | 32,302 | 64,731 | 32,302 | 64,731 | ||||
| Non-current (1) | 8,035 | 1,530 | 8,035 | 1,530 | ||||
| (1) | At 31.12.24 the weighted average maturity is 2 years. |
For sales in the foreign market on credit, the Company has insurance, letters of credit and other guarantees in the amount of R$1,441,599 (R$1,003,891 on 12/31/23), which cover 78.8% (60.9% on 12/31/23) of this modality.
The Company performs credit assignments with no right of return to the BRF Clients’ Credit Rights Investment Fund, which has the sole purpose to acquire credit rights arising from commercial transactions carried out between the Company and its clients in Brazil.
| 58 |
| Financial Statements, Individual and Consolidated | 2024 a 2023 |
On December 31, 2024, FIDC BRF II has an outstanding balance of R$959,434 (R$1,072,964 for the year ended December 31, 2023) relating to these credit rights, which were derecognized from the Company's statements of financial position at the time of the assignment.
On December 31, 2024, receivables are mainly represented by receivables arising from the sale of farms and various properties not linked to production.
The movements of the expected credit losses are presented below:
| Parent company | Consolidated | ||||||
| 12.31.24 | 12.31.23 | 12.31.24 | 12.31.23 | ||||
| Beginning balance | (547,078) | (558,328) | (591,479) | (604,167) | |||
| (Additions) reversals | (13,473) | (24,072) | (28,817) | (32,809) | |||
| Write-offs | 12,418 | 4,790 | 18,451 | 8,539 | |||
| Exchange rate variation | (110,897) | 30,532 | (124,919) | 36,958 | |||
| Ending balance | (659,030) | (547,078) | (726,764) | (591,479) | |||
The aging of trade accounts receivable is as follows:
| Parent company | Consolidated | ||||||
| 12.31.24 | 12.31.23 | 12.31.24 | 12.31.23 | ||||
| Not overdue | 7,749,078 | 5,532,133 | 5,904,865 | 4,515,445 | |||
| Overdue | |||||||
| 01 to 60 days | 120,451 | 115,871 | 203,179 | 225,135 | |||
| 61 to 90 days | 5,050 | 39,584 | 9,228 | 46,347 | |||
| 91 to 120 days | 711 | 4,558 | 2,891 | 15,248 | |||
| 121 to 180 days | 934 | 5,803 | 9,307 | 11,101 | |||
| 181 to 360 days | 23,131 | 12,665 | 41,254 | 22,116 | |||
| More than 360 days | 643,874 | 521,020 | 692,964 | 557,339 | |||
| ( - ) Adjustment to present value ("APV") | (28,340) | (22,692) | (39,291) | (29,284) | |||
| ( - ) Expected credit losses | (659,030) | (547,078) | (726,764) | (591,479) | |||
| 7,855,859 | 5,661,864 | 6,097,633 | 4,771,968 | ||||
| 59 |
| Financial Statements, Individual and Consolidated | 2024 a 2023 |
Accounting policy: Trade accounts and notes receivables: accounts and notes receivable from customers: accounts receivable from customers are recorded at fair value and, where applicable, adjusted to their present value. The Company measures the adjustment to present value (“AVP”) on the short- and long-term balances of accounts receivable, which are recorded in a reduction account of the respective item against the items Sales revenue and Financial income (expenses), net. The rate used by the Company represents the average of the Interbank Deposit Certificates plus a spread representing the credit risk. On December 31, 2024, this rate was 14.32% p.a. (13.13% p.a. on December 31, 2023). Assignment of receivables: Trade receivables sold in assignment of receivables transactions are derecognized at the time of assignment, i.e. when the Company hands over control and transfers substantially all the associated risks and rewards to the buyer. Expected credit losses in accounts receivable from customers and other receivables: the Company regularly assesses the historical losses on the customer portfolios it has in each region, taking in consideration the dynamics of the markets in which it operates and instruments it has for reducing credit risks, such as: letters of credit, insurance and collateral, as well as identifying specific customers whose risks are significantly different than the portfolio, which are treated according to individual expectations. Based on these assessments, estimated loss factors are generated by portfolio and aging class, which, applied to the amounts of accounts receivable, generate the expected credit losses. Additionally, the Company evaluates macroeconomic factors that may influence these losses and, if necessary, adjusts the calculation model. Securities receivable with legal proceedings in place are reclassified to noncurrent as well as the related estimated credit losses. The securities are written off against the estimated loss when the Management considers that they are no longer recoverable after taking all appropriate actions to collect them.
|
| 7. | Inventories |
| Parent company | Consolidated | ||||||
| 12.31.24 | 12.31.23 | 12.31.24 | 12.31.23 | ||||
| Finished goods | 1,553,208 | 1,988,163 | 3,574,304 | 3,564,379 | |||
| Work in progress | 354,152 | 340,780 | 409,037 | 378,788 | |||
| Raw materials | 1,373,016 | 1,521,744 | 1,589,282 | 1,675,323 | |||
| Packaging materials | 116,731 | 112,232 | 154,696 | 150,444 | |||
| Secondary materials | 571,303 | 503,613 | 621,207 | 546,213 | |||
| Supplies | 128,313 | 150,298 | 190,041 | 216,998 | |||
| Imports in transit | 235,125 | 150,514 | 236,453 | 150,947 | |||
| Other | 68,521 | 75,679 | 68,528 | 75,646 | |||
| (-) Adjustment to present value ("APV") (1) | (110,867) | (125,483) | (115,546) | (129,848) | |||
| 4,289,502 | 4,717,540 | 6,728,002 | 6,628,890 | ||||
| (1) | The adjustment refers to the counter-entry of the adjustment of present value from trade accounts payable and is carried out for cost according to inventories turnover. |
The movements of estimated losses for realizable value of inventories accrual, for which the additions, reversals and write-offs were recorded against Cost of Sales, are presented in the table below:
| Parent company | |||||||||||||||
| Realizable value through sale | Impaired inventories | Obsolete inventories | Total | ||||||||||||
| 12.31.24 | 12.31.23 | 12.31.24 | 12.31.23 | 12.31.24 | 12.31.23 | 12.31.24 | 12.31.23 | ||||||||
| Beginning balance | (23,315) | (62,269) | (13,262) | (64,584) | (5,375) | (5,299) | (41,952) | (132,152) | |||||||
| Additions | (30,204) | (346,314) | (95,638) | (92,436) | (4,981) | (5,339) | (130,823) | (444,089) | |||||||
| Reversals | 52,263 | 385,268 | - | - | - | - | 52,263 | 385,268 | |||||||
| Write-offs | - | - | 91,161 | 143,758 | 9,692 | 5,263 | 100,853 | 149,021 | |||||||
| Ending balance | (1,256) | (23,315) | (17,739) | (13,262) | (664) | (5,375) | (19,659) | (41,952) | |||||||
| 60 |
| Financial Statements, Individual and Consolidated | 2024 a 2023 |
| Consolidated | |||||||||||||||
| Realizable value through sale | Impaired inventories | Obsolete inventories | Total | ||||||||||||
| 12.31.24 | 12.31.23 | 12.31.24 | 12.31.23 | 12.31.24 | 12.31.23 | 12.31.24 | 12.31.23 | ||||||||
| Beginning balance | (26,308) | (66,671) | (22,981) | (73,694) | (8,232) | (9,944) | (57,521) | (150,309) | |||||||
| Additions | (38,540) | (461,373) | (114,852) | (113,370) | (11,322) | (8,871) | (164,714) | (583,614) | |||||||
| Reversals | 63,757 | 504,860 | - | - | - | - | 63,757 | 504,860 | |||||||
| Write-offs | - | - | 113,145 | 164,245 | 18,600 | 10,603 | 131,745 | 174,848 | |||||||
| Monetary correction by Hyperinflation | - | - | - | (208) | - | (7) | - | (215) | |||||||
| Exchange rate variation | (312) | (3,124) | (173) | 46 | (63) | (13) | (548) | (3,091) | |||||||
| Ending balance | (1,403) | (26,308) | (24,861) | (22,981) | (1,017) | (8,232) | (27,281) | (57,521) | |||||||
Accounting policy: Inventories are measured at the lower of the average cost of acquisition or production of finished products and the net realizable value. The cost of finished products includes purchased raw materials, labor, production costs, transportation and storage and non-recoverable taxes, which are related to all the processes necessary for bringing the products to sales conditions. Write-down to net realizable value due to obsolescence, impaired items, slow-moving and realizable value through sale are evaluated and recorded in each reporting period, as appropriate. Normal production losses are included in the production cost for the respective month, while abnormal losses, if any, are expensed in Cost of sales without movement through inventories.
|
| 8. | Biological Assets |
The live animals are represented by poultry and pork and segregated into consumables and animals for production. The roll-forward of the biological assets are presented below:
| Parent company | |||||||||||||||
| Current | Non-current | ||||||||||||||
| Live animals | |||||||||||||||
| Total | Live animals | Forests | Total | ||||||||||||
| 12.31.24 | 12.31.23 | 12.31.24 | 12.31.23 | 12.31.24 | 12.31.23 | 12.31.24 | 12.31.23 | ||||||||
| Beginning balance | 2,580,382 | 3,003,258 | 1,245,285 | 1,211,187 | 543,098 | 347,162 | 1,788,383 | 1,558,349 | |||||||
| Additions/Transfer | 23,434,401 | 25,171,685 | 646,124 | 667,348 | 86,008 | 72,576 | 732,132 | 739,924 | |||||||
| Changes in fair value | 3,034,272 | 2,641,423 | (472,701) | (361,462) | (78,578) | 187,736 | (551,279) | (173,726) | |||||||
| Harvest | - | - | - | - | (69,060) | (48,410) | (69,060) | (48,410) | |||||||
| Write-off | - | - | - | - | (11,130) | (15,966) | (11,130) | (15,966) | |||||||
| Transfer between current and non-current | 203,315 | 271,788 | (203,315) | (271,788) | - | - | (203,315) | (271,788) | |||||||
| Transfer to inventories | (26,593,053) | (28,507,771) | - | - | - | - | - | - | |||||||
| Ending balance | 2,659,317 | 2,580,383 | 1,215,393 | 1,245,285 | 470,338 | 543,098 | 1,685,731 | 1,788,383 | |||||||
| Consolidated | |||||||||||||||
| Current | Non-current | ||||||||||||||
| Live animals | |||||||||||||||
| Total | Live animals | Forests | Total | ||||||||||||
| 12.31.24 | 12.31.23 | 12.31.24 | 12.31.23 | 12.31.24 | 12.31.23 | 12.31.24 | 12.31.23 | ||||||||
| Beginning balance | 2,702,164 | 3,151,551 | 1,315,217 | 1,301,971 | 543,098 | 347,162 | 1,858,315 | 1,649,133 | |||||||
| Additions/Transfer | 25,575,764 | 27,098,935 | 702,790 | 710,121 | 86,008 | 72,576 | 788,798 | 782,697 | |||||||
| Changes in fair value | 3,457,499 | 2,959,703 | (576,956) | (380,608) | (78,578) | 187,736 | (655,534) | (192,872) | |||||||
| Harvest | - | - | - | - | (69,060) | (48,410) | (69,060) | (48,410) | |||||||
| Write-off | - | - | - | - | (11,130) | (15,966) | (11,130) | (15,966) | |||||||
| Transfer between current and non-current | 205,082 | 284,002 | (205,082) | (284,002) | - | - | (205,082) | (284,002) | |||||||
| Transfer to inventories | (29,103,917) | (30,727,668) | - | - | - | - | - | - | |||||||
| Exchange variation | 11,677 | (71,052) | 5,174 | (37,316) | - | - | 5,174 | (37,316) | |||||||
| Monetary correction by Hyperinflation | (3,636) | 6,693 | 75,756 | 5,052 | - | - | 75,756 | 5,052 | |||||||
| Ending balance | 2,844,633 | 2,702,164 | 1,316,899 | 1,315,218 | 470,338 | 543,098 | 1,787,237 | 1,858,316 | |||||||
| 61 |
| Financial Statements, Individual and Consolidated | 2024 a 2023 |
The change in the fair value of biological assets includes depreciation of breeders and depletion of forests in the amount of R$1,338,942 in the Parent Company and R$1,518,391 in the Consolidated (R$1,293,193 in the Parent Company and R$1,390,550 in the Consolidated in the same period of the previous year).
The estimated quantities of live animals on December 31, 2024, are 177,889 thousand head of poultry and 4,865 thousand head of pork at the Parent Company (177,143 thousand head of poultry and 4,866 thousand head of pork on December 31, 2023). In the Consolidated, there are 201,241 thousand heads of poultry and 4,865 thousand heads of pork (198,729 thousand heads of poultry and 4,866 thousand heads of pork on December 31, 2023).
The Company has forests pledged as collateral for financing and tax and civil contingencies on December 31, 2024, in the amount of R$70,025 in the Parent Company and in the Consolidated (R$71,399 in the Parent Company and in the Consolidated on December 31, 2023).
| 8.1. | Sensitivity analysis |
The fair value of animals and forests is determined using unobservable inputs; therefore, it is classified in the Level 3 of the fair value hierarchy. The main assumptions used in the measurement of the fair value and their impact on measurement are presented below.
| The estimated fair value can change if: | ||||||||
| Asset | Valuation methodology | Non observable significant inputs | Increase | Decrease | ||||
| Forests | Income approach | Estimated price of standing wood | Increase in the price of wood | Decrease in the price of wood | ||||
| Productivity per hectare estimated | Increase in yield per hectare | Decrease in yield per hectare | ||||||
| Harvest and transport cost | Decrease of harvest cost | Increase of harvest cost | ||||||
| Discount rate | Descrease in discount rate | Increase in discount rate | ||||||
| Live animals | Cost approach | Price of the feed inputs | Increase in feed cost | Decrease in feed cost | ||||
| Storage costs | Increase in storage cost | Decrease in storage cost | ||||||
| Outgrowers cost | Increase in outgrowers cost | Decrease in outgrowers cost | ||||||
The prices used in the valuation are those practiced in the regions where the Company is located and were obtained through market research. The discount rate corresponds to the average cost of capital and other economic assumptions for a market participant.
The weighted average price used in the valuation of biological assets (forests) on December 31, 2024, was equivalent to R$85.12 per stere (R$76.22 per stere on December 31, 2023). The real discount rate used in the valuation of the biological asset (forests) on December 31, 2024, was 9.2% p.a. (8.1% p.a. on December 31, 2023).
Accounting policy: The company classifies live animals and forests as biological assets. These assets are valued at fair value, using the cost approach for live animals and the income approach for forests. Every year, the Company carries out a fair value assessment study using the discounted cash flow method and the gain or loss arising from the change in the fair value of the biological asset is recognized in the income statement for the year in which it originates. The calculation of the fair value of live animals already includes all the losses inherent in the breeding process. |
| 62 |
| Financial Statements, Individual and Consolidated | 2024 a 2023 |
| 9. | Recoverable Taxes |
| Parent company | Consolidated | ||||||
| 12.31.24 | 12.31.23 | 12.31.24 | 12.31.23 | ||||
| Recoverable ICMS and VAT | 1,900,655 | 1,895,852 | 2,473,731 | 2,089,543 | |||
| Recoverable PIS and COFINS | 2,031,212 | 2,451,146 | 2,040,746 | 2,461,807 | |||
| Recoverable IPI | 1,176,162 | 1,092,729 | 1,177,941 | 1,094,466 | |||
| Recoverable INSS | 422,154 | 485,084 | 422,163 | 485,096 | |||
| Recoverable income taxes | 430,454 | 316,992 | 683,051 | 437,103 | |||
| Other recoverable taxes | 102,546 | 89,193 | 102,951 | 90,136 | |||
| (-) Impairment | (140,750) | (139,590) | (140,951) | (139,863) | |||
| 5,922,433 | 6,191,406 | 6,759,632 | 6,518,288 | ||||
| Current | 1,393,036 | 1,210,028 | 2,214,186 | 1,517,548 | |||
| Non-current | 4,529,397 | 4,981,378 | 4,545,446 | 5,000,740 | |||
| 9.1 | ICMS – tax on movement of goods and services and VAT – value added taxes |
As result of the activity, the Company generates recoverable ICMS balances that are offset against ICMS payables arising from sales in the domestic market or that are transferred to third parties.
The Company has recoverable ICMS balances in the States of Paraná, Santa Catarina, Mato Grosso do Sul, Minas Gerais and Amazonas, which will be realized in the short and long term, based on the recoverability study reviewed and approved by the Management.
In other jurisdictions outside Brazil, value added taxes (VAT) are due in regular operations of the Company with goods and services, with expectations of achievement in the short and long term.
On June 20, 2024, the Company negotiated the purchase of ICMS credits from Marfrig Global Foods S.A., in the state of São Paulo, totaling R$113,000, with a discount applied compatible with the market. And on October 16, 2014, BRF and Marfrig entered into an agreement for the acquisition of up to R$350,000 in ICMS credits calculated in the state of São Paulo owned by Marfrig, with a discount compatible with the market. The credits will be used in accordance with the Company's monthly calculation in the state, with full compensation expected by April 2025. As of December 31, 2024, R$256,000 had been transferred and the Company had offset the amount of R$178,076 related to these credits.
| 63 |
| Financial Statements, Individual and Consolidated | 2024 a 2023 |
| 9.2 | PIS and COFINS – social integration plan and contribution for social security |
The accumulated recoverable PIS and COFINS balances arise from taxes on raw material purchases subsequently used in the production of exported products or products for which sale is not taxed, as well as recoverable taxes on commercial and labor expenses. The realization of these balances usually occurs through the offsetting with taxes payable on sales of taxed products in the domestic market, with other federal taxes and social security contributions payable, or even, if necessary, through refund or reimbursement requests.
As of December 31, 2024, the updated balance of the processes related to the exclusion of the ICMS from the PIS and COFINS calculation basis recognized by the Company is R$1,720,431 (R$2,013,799 as of December 31, 2023). The monetary update of balances is recognized against Net financial income (expenses).
| 9.3 | IPI – industrialized product tax |
The Company recognized tax assets as result of gains from lawsuits related to IPI, specially “crédito prêmio”. The balance referring to these assets in the Parent Company and Consolidated on December 31, 2024 is R$1,185,146 (R$1,110,006 for the year ended December 31, 2023), of which R$1,162,991 (R$1,087,749 for the year ended December 31, 2023) is recorded as Recoverable Taxes and the remainder, referring to cases in which the government will reimburse in cash, is recorded as Other Non-Current Assets, in the amount of R$22,155 (R$22,257 for the year ended December 31, 2023). The monetary update of balances is recognized against Net financial income (expenses).
| 9.4 | Income taxes |
The accumulated recoverable income taxes arise, mostly, from withholding taxes on securities, interest and prepayments of income tax and social contribution in Brazil. The realization occurs through the offset with federal taxes and contributions payable.
| 9.5 | Realization of Brazilian federal tax credits |
The Company used PIS, COFINS, IPI, and other recoverable taxes to offset federal taxes payable such as INSS, Income Taxes and other in the amount of R$1,433,559 in the Parent Company and Consolidated for year ended on December 31, 2024 (R$1,414,273 in the Parent Company and Consolidated for the year ended December 31, 2023), preserving its liquidity and optimizing its capital structure.
| 64 |
| Financial Statements, Individual and Consolidated | 2024 a 2023 |
| 10. | Income Taxes |
| 10.1 | Deferred income taxes |
| Parent company | Consolidated | ||||||
| 12.31.24 | 12.31.23 | 12.31.24 | 12.31.23 | ||||
| Assets | |||||||
| Tax losses carryforward | 2,504,706 | 2,496,088 | 2,543,398 | 2,532,720 | |||
| Negative calculation basis (social contribution) | 901,694 | 898,592 | 915,623 | 911,779 | |||
| Temporary differences - Assets | |||||||
| Provisions for tax, civil and labor risks | 392,062 | 363,186 | 394,642 | 365,381 | |||
| Expected credit losses | 209,378 | 172,699 | 215,626 | 176,776 | |||
| Impairment on tax credits | 54,853 | 55,253 | 54,853 | 55,253 | |||
| Provision for other obligations | 86,636 | 101,048 | 110,059 | 115,216 | |||
| Write-down to net realizable value of inventories | 6,842 | 14,264 | 10,248 | 19,627 | |||
| Employees' benefits plan | 106,134 | 110,033 | 133,783 | 137,947 | |||
| Lease basis difference | 256,005 | 189,305 | 256,418 | 189,753 | |||
| Share-based payment | 26,967 | - | 26,967 | - | |||
| Other temporary differences | 243,259 | 101,203 | 299,549 | 118,846 | |||
| 4,788,536 | 4,501,671 | 4,961,166 | 4,623,298 | ||||
| Temporary differences - Liabilities | |||||||
| Goodwill amortization basis difference | (323,005) | (323,005) | (337,038) | (336,135) | |||
| Depreciation (useful life) basis difference | (1,096,046) | (848,246) | (1,118,093) | (863,896) | |||
| Business combination (1) | (959,663) | (971,832) | (959,663) | (971,832) | |||
| Monetary correction by Hyperinflation | - | - | (46,319) | (95,981) | |||
| Unrealized gains on derivatives, net | (120,326) | (127,036) | (120,326) | (127,036) | |||
| Unrealized fair value gains, net | (26,986) | (163,417) | (29,977) | (163,744) | |||
| Other temporary differences | (24,197) | (13,309) | (20,671) | (11,691) | |||
| (2,550,223) | (2,446,845) | (2,632,087) | (2,570,315) | ||||
| Total deferred taxes | 2,238,313 | 2,054,826 | 2,329,079 | 2,052,983 | |||
| Total Assets | 2,238,313 | 2,054,826 | 2,331,012 | 2,113,108 | |||
| Total Liabilities | - | - | (1,933) | (60,125) | |||
| 2,238,313 | 2,054,826 | 2,329,079 | 2,052,983 | ||||
| (1) | The deferred tax liability on business combination is substantially represented by the allocation of goodwill to property, plant and equipment, brands and contingent liabilities. |
On December 31, 2024, the Parent Company has tax losses of Income Tax (IRPJ) and negative bases Contributions on the Net Profit (CSLL) in Brazil, which at current tax rates represent R$6,266,431 (R$6,632,460 on December 31, 2023). In Consolidated, tax losses at local income tax rates represent the amount of R$6,380,870 (R$6,782,499 for the year ended December 31, 2023). Of these amounts, R$3,406,401 in the Parent Company and R$3,459,022 in Consolidated (R$3,394,679 in the Parent Company and R$3,444,499 in Consolidated as at 31.12.23) are recognized in assets, according to the expectation of recoverability over a ten-year period
The roll-forward of deferred income taxes, net, is set forth below:
| 65 |
| Financial Statements, Individual and Consolidated | 2024 a 2023 |
| Parent company | Consolidated | ||||||
| 12.31.24 | 12.31.23 | 12.31.24 | 12.31.23 | ||||
| Beginning balance | 2,054,826 | 2,476,334 | 2,052,983 | 2,454,998 | |||
| Deferred income taxes recognized in income | (99,501) | 262,197 | (8,180) | 244,172 | |||
| Deferred income taxes recognized in other comprehensive income | 282,988 | (217,297) | 282,988 | (217,297) | |||
| Deferred income and social contribution taxes used in the leniency agreement | - | (435,128) | - | (435,128) | |||
| Other | - | (31,280) | 1,288 | 6,238 | |||
| Ending balance | 2,238,313 | 2,054,826 | 2,329,079 | 2,052,983 | |||
| 10.2 | Effective income tax rate reconciliation |
| Parent company | Consolidated | ||||||
| 12.31.24 | 12.31.23 | 12.31.24 | 12.31.23 | ||||
| Income (loss) before taxes | 4,164,405 | (2,267,923) | 5,049,873 | (1,984,706) | |||
| Nominal tax rate | 34% | 34% | 34% | 34% | |||
| Expenses at nominal tax rates | (1,415,898) | 771,094 | (1,716,957) | 674,800 | |||
| Adjustments to income taxes | |||||||
| Income from associates and joint ventures | 1,080,356 | (705,871) | (4,649) | (1,110) | |||
| Tax rate, GAAP and permanent differences on the results of a subsidiary | - | - | 62,206 | (536,428) | |||
| Effect of exchange rate variation on assets and liabilities of subsidiaries | - | - | 922,204 | (190,743) | |||
| Interest on equity capital | 389,640 | - | 389,640 | - | |||
| Interest on taxes | 74,368 | 139,873 | 74,652 | 140,056 | |||
| Profits taxed by foreign jurisdictions | (322,911) | (105,681) | (329,147) | (110,655) | |||
| Tax paid on international subsidiaries | 141,206 | 26,416 | 141,206 | 26,416 | |||
| Recognition of tax assets from previous years | 11,722 | 61,348 | 11,722 | 61,348 | |||
| Provision for contingencies (1) (IRPJ e CSLL) | (977,277) | - | (977,277) | - | |||
| Other permanent differences | 67,663 | 52,185 | 68,431 | 52,170 | |||
| (951,131) | 239,364 | (1,357,969) | 115,854 | ||||
| Effective rate | 22.8% | 10.6% | 26.9% | 5.8% | |||
| Current tax | (851,630) | (22,833) | (1,349,789) | (128,318) | |||
| Deferred tax | (99,501) | 262,197 | (8,180) | 244,172 | |||
| (1) | Contingency reported in note 20.2.1. |
Income tax returns in Brazil are subject to review by the tax authorities for a period of five years from the date of their delivery. The Company may be subject to additional collection of taxes, fines and interest as a result of these reviews. The results obtained by subsidiaries abroad are subject to taxation in accordance with the tax laws of each country.
| 66 |
| Financial Statements, Individual and Consolidated | 2024 a 2023 |
Accounting policy: Current income taxes: In Brazil it comprises income tax (“IRPJ“) and social contribution on profit (“CSLL“), which are calculated monthly based on taxable profit, after offsetting tax losses and negative social contribution base, limited to 30% of the taxable income, applying the rate of 15% plus an additional 10% for the IRPJ and 9% for the CSLL.
The results obtained from foreign subsidiaries are subject to taxation by the countries where they are based, according to applicable rates and legislation. In Brazil, these results suffer the effects of taxation on universal basis established by the Law No. 12,973 / 14. The Company analyzes the results of each subsidiary for the application of its Income Tax legislation, in order to respect the treaties signed by Brazil and avoid double taxation.
Deferred income taxes: These are recognized when there are tax credits and debits on tax losses and negative CSLL bases, as well as temporary differences between the tax base and the accounting base. Deferred tax assets and liabilities are classified as non-current. When the company's internal studies indicate that the future use of these credits over a 10-year horizon is not probable, the asset is derecognized (note 10.1).
Deferred tax assets and liabilities are presented net if there is enforceable legal right to be offset, and if they are under the responsibility of the same tax authority and under the same taxable entity.
Deferred tax assets and liabilities must be measured at the rates applicable in the year in which the asset is realized or the liability is settled, based on the tax rates that have been enacted or substantively enacted by the end of the reporting period. In compliance with the interpretation ICPC 22 / IFRIC 23, the Company analyzed relevant tax decisions of higher courts and whether they conflict in any way with the positions adopted by the Company. Regarding the known uncertain tax positions, the Company reviewed the corresponding legal opinions and jurisprudence and did not identify impacts to be recorded. The Company periodically assesses the positions taken in which there are uncertainties about the tax treatment adopted and sets up a provision when applicable. |
| 11. | Judicial Deposits |
The roll-forward of the judicial deposits is set forth below:
| Parent company | |||||||||||||||
| Tax | Labor | Civil, commercial and other | Total | ||||||||||||
| 12.31.24 | 12.31.23 | 12.31.24 | 12.31.23 | 12.31.24 | 12.31.23 | 12.31.24 | 12.31.23 | ||||||||
| Beginning balance | 189,455 | 188,431 | 154,424 | 193,350 | 61,571 | 59,970 | 405,450 | 441,751 | |||||||
| Additions | 1,249 | 8,660 | 96,445 | 67,303 | 3,500 | 5,679 | 101,194 | 81,642 | |||||||
| Release in favor of the Company | (2,120) | (17,692) | (24,480) | (28,409) | (2,965) | (1,202) | (29,565) | (47,303) | |||||||
| Release in favor of the counterparty | (13,019) | (4,382) | (79,906) | (86,574) | (2,811) | (5,533) | (95,736) | (96,489) | |||||||
| Interest | 11,307 | 14,438 | 10,350 | 8,754 | 5,039 | 2,657 | 26,696 | 25,849 | |||||||
| Ending balance | 186,872 | 189,455 | 156,833 | 154,424 | 64,334 | 61,571 | 408,039 | 405,450 | |||||||
| Consolidated | |||||||||||||||
| Tax | Labor | Civil, commercial and other | Total | ||||||||||||
| 12.31.24 | 12.31.23 | 12.31.24 | 12.31.23 | 12.31.24 | 12.31.23 | 12.31.24 | 12.31.23 | ||||||||
| Beginning balance | 192,661 | 191,161 | 156,241 | 194,906 | 66,816 | 64,609 | 415,718 | 450,676 | |||||||
| Additions | 2,800 | 8,816 | 98,479 | 68,124 | 3,519 | 5,679 | 104,798 | 82,619 | |||||||
| Release in favor of the Company | (2,120) | (17,692) | (24,663) | (28,419) | (2,965) | (1,202) | (29,748) | (47,313) | |||||||
| Release in favor of the counterparty | (13,019) | (4,417) | (80,290) | (87,114) | (2,829) | (5,533) | (96,138) | (97,064) | |||||||
| Interest | 11,735 | 14,793 | 10,364 | 8,770 | 5,605 | 3,263 | 27,704 | 26,826 | |||||||
| Exchange rate variation | - | - | (1) | (26) | - | - | (1) | (26) | |||||||
| Ending balance | 192,057 | 192,661 | 160,130 | 156,241 | 70,146 | 66,816 | 422,333 | 415,718 | |||||||
| 67 |
| Financial Statements, Individual and Consolidated | 2024 a 2023 |
| 12. | Investments |
| 12.1 | Composition and roll-forward of the investments |
| Parent company | Consolidated | ||||||
| 12.31.24 | 12.31.23 | 12.31.24 | 12.31.23 | ||||
| Investments | 13,925,136 | 13,683,142 | 128,699 | 97,134 | |||
| Investment in subsidiaries | 13,796,437 | 13,586,008 | - | - | |||
| Investment in affiliates | 128,699 | 97,134 | 128,699 | 97,134 | |||
| Other investments | 583 | 583 | 584 | 761 | |||
| 13,925,719 | 13,683,725 | 129,283 | 97,895 | ||||
| 68 |
| Financial Statements, Individual and Consolidated | 2024 a 2023 |
The roll-forward of the direct investments in subsidiaries and affiliates of the Parent Company is set forth below:
| Income (loss) for the year | Capital transaction | Goodwill and allocations | Other | ||||||||||||||||
| Beginning balance (12.31.23) | Income (loss) from associates and joint ventures | Dividends and interests on shareholders' equity | Capital increase (reduction) | Capital transaction between subsidiaries | Merger of companies (1) | Exchange rate variation on goodwill | Other comprehensive income | Constitution (reversal) of provision for loss | Ending balance (12.31.24) | ||||||||||
| Direct subsidiaries | |||||||||||||||||||
| BRF Energia S.A. | 338 | 1,641 | - | 11,000 | - | - | - | - | - | 12,979 | |||||||||
| BRF Foods UK Ltd. | - | 498 | - | 1,294 | - | - | - | 207 | - | 1,999 | |||||||||
| BRF GmbH | 12,220,014 | 3,206,249 | (3,277,542) | - | 229,755 | - | - | 59,027 | - | 12,437,503 | |||||||||
| MBR Investimentos | - | 418 | - | - | - | 5,841 | - | - | - | 6,259 | |||||||||
| BRF Pet S.A. | 1,257,834 | 8,729 | - | - | - | - | - | 21,111 | - | 1,287,674 | |||||||||
| Sadia Alimentos S.A.U. | 3,367 | (11,430) | - | - | - | - | - | 10,087 | - | 2,024 | |||||||||
| Sadia Uruguay S.A. | 91,823 | (71) | - | (58,515) | - | - | - | 13,037 | - | 46,274 | |||||||||
| VIP S.A. Empr. e Particip. Imob (1) | 1,379 | 27 | - | - | - | (1,406) | - | - | - | - | |||||||||
| Indirect subsidiaries | - | ||||||||||||||||||
| Hercosul International S.R.L. | 1,112 | 152 | - | - | - | - | (11) | (247) | - | 1,006 | |||||||||
| PSA Labor. Veter. Ltda (1) | 9,638 | 163 | - | - | - | (9,801) | - | - | - | - | |||||||||
| Proud Food Lda | 501 | 113 | - | - | - | - | - | 105 | - | 719 | |||||||||
| Sadia Chile SpA | 2 | (15,309) | - | - | - | - | - | (4,894) | 20,256 | 55 | |||||||||
| Affiliated | - | ||||||||||||||||||
| Potengi Holdings S.A. | 89,051 | (13,675) | - | 45,173 | - | - | - | 67 | - | 120,616 | |||||||||
| PR-SAD Adm. Bem próprio S.A. | 8,083 | - | - | - | - | - | - | - | - | 8,083 | |||||||||
| 13,683,142 | 3,177,505 | (3,277,542) | (1,048) | 229,755 | (5,366) | (11) | 98,500 | 20,256 | 13,925,191 | ||||||||||
(1) On March 28, 2024, the subsidiaries VIP S.A. Empreendimentos e Participações Imobiliárias and PSA Laboratório Veterinário Ltda. were merged into BRF S.A., so BRF S.A. became the direct holder of MBR Investimentos' shares.
On December 31, 2024, these subsidiaries and affiliates do not have any restriction to amortize their loans or advances to the Company.
| 69 |
| Financial Statements, Individual and Consolidated | 2024 a 2023 |
Accounting policy: Investments classified in this group are: i) in associated companies, that are entities over which the Company has significant influence, which is the power to participate in decisions on the investee’s financial and operational policies, but without individual or joint control of these policies; and ii) in joint ventures, in which the control of the business is shared through contractual agreement and decisions about the relevant activities require the unanimous consent of the parties. Investments are initially recognized at cost and subsequently adjusted using the equity method, where gains and losses are recorded under Equity in earnings of affiliated companies. |
| 70 |
| Financial Statements, Individual and Consolidated | 2024 a 2023 |
| 13. | Property, Plant and Equipment |
The roll-forward of property, which include right-of-use assets balances (note 17.1), plant and equipment is set forth below:
| Parent company | |||||||||||
| Average rate (1) | 12.31.23 | Additions | Disposals | Transfers (2) | 12.31.24 | ||||||
| Cost | |||||||||||
| Land | 550,339 | 2,560 | (17,856) | - | 535,043 | ||||||
| Buildings, facilities and improvements | 12,262,442 | 763,303 | (386,482) | 146,541 | 12,785,804 | ||||||
| Machinery and equipment | 9,510,187 | 23,932 | (292,686) | 411,919 | 9,653,352 | ||||||
| Furniture and fixtures | 135,466 | 497 | (5,887) | 5,556 | 135,632 | ||||||
| Vehicles | 195,224 | 84,437 | (132,038) | - | 147,623 | ||||||
| Construction in progress | 456,099 | 714,048 | (1,367) | (569,541) | 599,239 | ||||||
| Advances to suppliers | - | 16,202 | - | (998) | 15,204 | ||||||
| 23,109,757 | 1,604,979 | (836,316) | (6,523) | 23,871,897 | |||||||
| Depreciation | |||||||||||
| Land (3) | 4.89% | (19,478) | (4,279) | 6,409 | - | (17,348) | |||||
| Buildings, facilities and improvements | 2.61% | (4,850,062) | (794,959) | 287,409 | 5,229 | (5,352,383) | |||||
| Machinery and equipment | 5.45% | (4,962,048) | (459,123) | 161,822 | (3,092) | (5,262,441) | |||||
| Furniture and fixtures | 4.83% | (65,344) | (7,418) | 4,088 | 260 | (68,414) | |||||
| Vehicles | 14.80% | (84,895) | (95,626) | 71,228 | - | (109,293) | |||||
| (9,981,827) | (1,361,405) | 530,956 | 2,397 | (10,809,879) | |||||||
| 13,127,930 | 243,574 | (305,360) | (4,126) | 13,062,018 | |||||||
| (1) | Weighted average annual rate. |
| (2) | Refers to the transfer of R$1,039 to intangible assets and R$3,087 to assets held for sale. |
| (3) | Refers to right-of-use assets (note 17.1) and the land concession. The amount of R$1,869 of depreciation was recognized in the cost of formation of forests and will be realized in the result according to the depletion. |
| 71 |
| Financial Statements, Individual and Consolidated | 2024 a 2023 |
| Parent company | |||||||||||
| Average rate (1) | 12.31.22 | Additions | Disposals | Transfers | 12.31.23 | ||||||
| Cost | |||||||||||
| Land | 562,476 | 10,090 | (22,882) | 655 | 550,339 | ||||||
| Buildings, facilities and improvements | 11,588,488 | 1,003,244 | (729,981) | 400,691 | 12,262,442 | ||||||
| Machinery and equipment | 8,778,379 | 235,141 | (168,185) | 664,852 | 9,510,187 | ||||||
| Furniture and fixtures | 129,479 | 414 | (4,641) | 10,214 | 135,466 | ||||||
| Vehicles | 246,604 | 131,668 | (183,276) | 228 | 195,224 | ||||||
| Construction in progress | 958,198 | 705,453 | (17,965) | (1,189,587) | 456,099 | ||||||
| Advances to suppliers | 1,426 | 3,125 | - | (4,551) | - | ||||||
| 22,265,050 | 2,089,135 | (1,126,930) | (117,498) | 23,109,757 | |||||||
| Depreciation | |||||||||||
| Land | 5.00% | (25,058) | (5,810) | 11,390 | - | (19,478) | |||||
| Buildings, facilities and improvements | 2.60% | (4,733,193) | (704,171) | 586,808 | 494 | (4,850,062) | |||||
| Machinery and equipment | 5.35% | (4,721,154) | (441,329) | 129,695 | 70,740 | (4,962,048) | |||||
| Furniture and fixtures | 5.13% | (60,703) | (7,177) | 2,536 | - | (65,344) | |||||
| Vehicles | 13.72% | (176,604) | (86,828) | 178,537 | - | (84,895) | |||||
| (9,716,712) | (1,245,315) | 908,966 | 71,234 | (9,981,827) | |||||||
| 12,548,338 | 843,820 | (217,964) | (46,264) | 13,127,930 | |||||||
| (1) | Weighted average annual rate. |
| 72 |
| Financial Statements, Individual and Consolidated | 2024 a 2023 |
| Consolidated | |||||||||||||||
| Average rate (1) | 12.31.23 | Additions | Disposals | Monetary correction by Hyperinflation | Transfers (2) | Exchange rate variation | 12.31.24 | ||||||||
| Cost | |||||||||||||||
| Land | 730,103 | 2,560 | (17,988) | 38,478 | 341 | 31,224 | 784,718 | ||||||||
| Buildings, facilities and improvements | 13,283,922 | 850,525 | (597,099) | 78,656 | 165,225 | 188,924 | 13,970,153 | ||||||||
| Machinery and equipment | 10,497,307 | 47,027 | (336,469) | 184,973 | 437,306 | 133,142 | 10,963,286 | ||||||||
| Furniture and fixtures | 224,706 | 582 | (10,315) | 29,672 | 13,482 | 11,718 | 269,845 | ||||||||
| Vehicles | 445,298 | 350,602 | (382,969) | 7,202 | (82) | 82,494 | 502,545 | ||||||||
| Construction in progress | 483,514 | 772,644 | (1,614) | 155 | (610,917) | 1,839 | 645,621 | ||||||||
| Advances to suppliers | 3,372 | 27,479 | - | (1,090) | (10,202) | 160 | 19,719 | ||||||||
| 25,668,222 | 2,051,419 | (1,346,454) | 338,046 | (4,847) | 449,501 | 27,155,887 | |||||||||
| Depreciation | |||||||||||||||
| Land (3) | 4.89% | (41,953) | (11,496) | 6,540 | (4,528) | - | (7,539) | (58,976) | |||||||
| Buildings, facilities and improvements | 2.93% | (5,281,798) | (907,934) | 491,538 | (9,491) | 6,674 | (78,008) | (5,779,019) | |||||||
| Machinery and equipment | 5.81% | (5,390,588) | (538,029) | 199,570 | (55,675) | (2,202) | (60,032) | (5,846,956) | |||||||
| Furniture and fixtures | 6.83% | (98,039) | (13,639) | 7,900 | (10,247) | (2,210) | (5,306) | (121,541) | |||||||
| Vehicles | 15.06% | (246,930) | (219,736) | 221,495 | 5,982 | 73 | (42,050) | (281,166) | |||||||
| (11,059,308) | (1,690,834) | 927,043 | (73,959) | 2,335 | (192,935) | (12,087,658) | |||||||||
| 14,608,914 | 360,585 | (419,411) | 264,087 | (2,512) | 256,566 | 15,068,229 | |||||||||
| (1) | Weighted average annual rate. |
| (2) | Refers to the transfer of R$544 to intangible assets and R$1,968 to assets held for sale. |
| (3) | Refers to right-of-use assets (note 17.1) and the land concession. The amount of R$1,869 of depreciation was recognized in the cost of formation of forests and will be realized in the result according to the depletion. |
| 73 |
| Financial Statements, Individual and Consolidated | 2024 a 2023 |
| Consolidated | |||||||||||||||
| Average rate (1) | 12.31.22 | Additions | Disposals | Monetary correction by Hyperinflation | Transfers | Exchange rate variation | 12.31.23 | ||||||||
| Cost | |||||||||||||||
| Land | 751,551 | 10,090 | (22,900) | 31,818 | 655 | (41,111) | 730,103 | ||||||||
| Buildings, facilities and improvements | 12,620,828 | 1,032,674 | (787,519) | 104,826 | 463,943 | (150,830) | 13,283,922 | ||||||||
| Machinery and equipment | 9,730,038 | 251,162 | (176,072) | 176,896 | 762,238 | (246,955) | 10,497,307 | ||||||||
| Furniture and fixtures | 187,609 | 514 | (5,450) | 34,793 | 35,623 | (28,383) | 224,706 | ||||||||
| Vehicles | 627,672 | 138,429 | (296,680) | 5,483 | 228 | (29,834) | 445,298 | ||||||||
| Construction in progress | 1,095,143 | 758,772 | (17,965) | 3,947 | (1,331,969) | (24,414) | 483,514 | ||||||||
| Advances to suppliers | 31,886 | 20,205 | - | - | (46,064) | (2,655) | 3,372 | ||||||||
| 25,044,727 | 2,211,846 | (1,306,586) | 357,763 | (115,346) | (524,182) | 25,668,222 | |||||||||
| Depreciation | |||||||||||||||
| Land | 5.00% | (44,434) | (10,785) | 11,408 | 254 | - | 1,604 | (41,953) | |||||||
| Buildings, facilities and improvements | 2.90% | (5,130,376) | (792,198) | 643,273 | (49,230) | 494 | 46,239 | (5,281,798) | |||||||
| Machinery and equipment | 5.66% | (5,121,757) | (501,143) | 134,430 | (71,727) | 70,740 | 98,869 | (5,390,588) | |||||||
| Furniture and fixtures | 8.73% | (90,543) | (10,439) | 3,114 | (11,283) | - | 11,112 | (98,039) | |||||||
| Vehicles | 14.78% | (366,733) | (183,250) | 291,490 | (8,382) | - | 19,945 | (246,930) | |||||||
| (10,753,843) | (1,497,815) | 1,083,715 | (140,368) | 71,234 | 177,769 | (11,059,308) | |||||||||
| 14,290,884 | 714,031 | (222,871) | 217,395 | (44,112) | (346,413) | 14,608,914 | |||||||||
| (1) | Weighted average annual rate. |
| 74 |
| Financial Statements, Individual and Consolidated | 2024 a 2023 |
The amount of capitalized borrowing costs during the year ended December 31, 2024 was of R$32,131 in the Parent Company and R$34,003 in the Consolidated (R$51,225 in the Parent Company and R$56,872 in the Consolidated during the year ended December 31, 2023).
The weighted average rate used to determine the amount of borrowing costs subject to capitalization during year ended December 31, 2024, was 8.47% p.a. in the Parent Company and 11.03% p.a. in the Consolidated (9.38% p.a. in the Parent Company and 10.44% p.a. in the Consolidated during the year ended December 31, 2023).
The book value of the property, plant and equipment items that are pledged as collateral for transactions of different natures are set forth below:
| Parent company | Consolidated | |||||||||
| Type of collateral | 12.31.24 | 12.31.23 | 12.31.24 | 12.31.23 | ||||||
| Land | Financial/tax/civil | 62,144 | 87,530 | 62,144 | 87,530 | |||||
| Buildings, facilities and improvements | Financial/tax | 947,286 | 1,393,528 | 947,286 | 1,395,846 | |||||
| Machinery and equipment | Financial/labor/tax/civil | 1,036,448 | 1,463,205 | 1,036,448 | 1,464,229 | |||||
| Furniture and fixtures | Financial/tax | 11,751 | 15,102 | 11,751 | 15,102 | |||||
| Vehicles | Financial/tax | 82 | 109 | 82 | 109 | |||||
| 2,057,711 | 2,959,474 | 2,057,711 | 2,962,816 | |||||||
Accounting policy: Property, plant and equipment are measured by the cost of acquisition, formation, construction or dismantling, less accumulated depreciation. Loans and borrowings costs are recorded as part of the costs of property, plant and equipment in progress, considering the weighted average rate of loans and borrowings effective on the capitalization date. Subsequent costs are capitalized only when it is probable that future economic benefits associated with the expenses will be earned by the Company. Depreciation is recognized based on the estimated economic useful life of each asset using the straight-line method. The estimated useful life, residual values and depreciation methods are reviewed annually and the effects of any changes in estimates are accounted for prospectively. Land is not depreciated, except for itens relating to rights-of-use. The Company annually performs an impairment analysis for its cash-generating units, which include the balances of property, plant and equipment. Gains and losses on disposal of property, plant and equipment are determined by comparing the sale value with the residual book value and are recognized in the statement of income on the date of sale under Other operating income (expense).
|
| 75 |
| Financial Statements, Individual and Consolidated | 2024 a 2023 |
| 14. | Intangible Assets |
The intangible assets roll-forward, is set forth below:
| Parent company | |||||||||||
| Average rate (1) | 12.31.23 | Additions | Disposals | Transfers | 12.31.24 | ||||||
| Cost | |||||||||||
| Goodwill | 1,783,655 | - | - | - | 1,783,655 | ||||||
| Trademarks | 1,152,885 | - | - | - | 1,152,885 | ||||||
| Non-compete agreement | 14,650 | 737 | (2,741) | - | 12,646 | ||||||
| Outgrowers relationship | 517 | - | (517) | - | - | ||||||
| Patents | 1,810 | - | - | - | 1,810 | ||||||
| Software | 698,096 | - | (264,407) | 153,437 | 587,126 | ||||||
| Intangible in progress | 35,232 | 155,860 | (1,434) | (152,398) | 37,260 | ||||||
| 3,686,845 | 156,597 | (269,099) | 1,039 | 3,575,382 | |||||||
| Amortization | |||||||||||
| Non-compete agreement | 41.22% | (8,797) | (4,788) | 2,741 | - | (10,844) | |||||
| Outgrowers relationship | - | (419) | (49) | 468 | - | - | |||||
| Patents | 5.42% | (1,673) | (24) | - | - | (1,697) | |||||
| Software | 31.37% | (474,417) | (159,655) | 264,105 | - | (369,967) | |||||
| (485,306) | (164,516) | 267,314 | - | (382,508) | |||||||
| 3,201,539 | (7,919) | (1,785) | 1,039 | 3,192,874 | |||||||
| (1) | Weighted average annual remaining rate. |
| Parent company | |||||||||||
| Average rate (1) | 12.31.22 | Additions | Disposals | Transfers | 12.31.23 | ||||||
| Cost | |||||||||||
| Goodwill | 1,783,655 | - | - | - | 1,783,655 | ||||||
| Trademarks | 1,152,885 | - | - | - | 1,152,885 | ||||||
| Non-compete agreement | 14,185 | 465 | - | - | 14,650 | ||||||
| Outgrowers relationship | 517 | - | - | - | 517 | ||||||
| Patents | 2,485 | - | (675) | - | 1,810 | ||||||
| Software | 847,875 | - | (354,712) | 204,933 | 698,096 | ||||||
| Intangible in progress | 69,119 | 161,714 | (2,749) | (192,852) | 35,232 | ||||||
| 3,870,721 | 162,179 | (358,136) | 12,081 | 3,686,845 | |||||||
| Amortization | |||||||||||
| Non-compete agreement | 46.01% | (1,379) | (7,418) | - | - | (8,797) | |||||
| Outgrowers relationship | 16.45% | (347) | (72) | - | - | (419) | |||||
| Patents | 5.56% | (2,324) | (24) | 675 | - | (1,673) | |||||
| Software | 42.15% | (614,286) | (213,615) | 353,484 | - | (474,417) | |||||
| (618,336) | (221,129) | 354,159 | - | (485,306) | |||||||
| 3,252,385 | (58,950) | (3,977) | 12,081 | 3,201,539 | |||||||
| (1) | Weighted average annual remaining rate. |
| 76 |
| Financial Statements, Individual and Consolidated | 2024 a 2023 |
| Consolidated | |||||||||||||||
| Average rate (1) | 12.31.23 | Additions | Disposals | Transfers | Monetary correction by Hyperinflation | Exchange rate variation | 12.31.24 | ||||||||
| Cost | |||||||||||||||
| Goodwill | 3,390,938 | - | - | - | 92,444 | 287,880 | 3,771,262 | ||||||||
| Trademarks | 1,873,253 | - | (156) | - | 109,314 | 23,855 | 2,006,266 | ||||||||
| Non-compete agreement | 54,892 | 737 | (8,436) | - | - | 9,826 | 57,019 | ||||||||
| Outgrowers relationship | 517 | - | (517) | - | - | - | - | ||||||||
| Patents | 4,129 | - | (2) | - | 1,034 | 225 | 5,386 | ||||||||
| Customer relationship | 1,217,742 | - | - | - | 205,074 | 231,794 | 1,654,610 | ||||||||
| Software | 787,048 | 474 | (267,404) | 154,051 | 11,992 | 14,047 | 700,208 | ||||||||
| Intangible in progress | 35,479 | 157,734 | (1,434) | (153,507) | (570) | (10) | 37,692 | ||||||||
| 7,363,998 | 158,945 | (277,949) | 544 | 419,288 | 567,617 | 8,232,443 | |||||||||
| Amortization | |||||||||||||||
| Non-compete agreement | 41.22% | (47,841) | (5,236) | 8,436 | - | - | (9,827) | (54,468) | |||||||
| Outgrowers relationship | - | (419) | (49) | 468 | - | - | - | - | |||||||
| Patents | 8.47% | (3,195) | (566) | - | - | (230) | (159) | (4,150) | |||||||
| Customer relationship | 6.94% | (635,655) | (131,595) | - | - | (119,784) | (147,236) | (1,034,270) | |||||||
| Software | 32.79% | (536,450) | (179,702) | 266,841 | - | (5,083) | (11,950) | (466,344) | |||||||
| (1,223,560) | (317,148) | 275,745 | - | (125,097) | (169,172) | (1,559,232) | |||||||||
| 6,140,438 | (158,203) | (2,204) | 544 | 294,191 | 398,445 | 6,673,211 | |||||||||
| (1) | Weighted average annual remaining rate. |
| Consolidated | |||||||||||||||
| Average rate (1) | 12.31.22 | Additions | Disposals | Transfers | Monetary correction by Hyperinflation | Exchange rate variation | 12.31.23 | ||||||||
| Cost | |||||||||||||||
| Goodwill | 3,474,103 | - | - | - | 96,843 | (180,008) | 3,390,938 | ||||||||
| Trademarks | 1,881,199 | - | - | - | 114,516 | (122,462) | 1,873,253 | ||||||||
| Non-compete agreement | 57,426 | 465 | - | - | - | (2,999) | 54,892 | ||||||||
| Outgrowers relationship | 517 | - | - | - | - | - | 517 | ||||||||
| Patents | 4,878 | - | (675) | - | 1,335 | (1,409) | 4,129 | ||||||||
| Customer relationship | 1,340,251 | - | - | - | 156,141 | (278,650) | 1,217,742 | ||||||||
| Software | 930,090 | 140 | (357,470) | 214,757 | 33,916 | (34,385) | 787,048 | ||||||||
| Intangible in progress | 77,263 | 166,995 | (2,757) | (204,828) | (657) | (537) | 35,479 | ||||||||
| 7,765,727 | 167,600 | (360,902) | 9,929 | 402,094 | (620,450) | 7,363,998 | |||||||||
| Amortization | |||||||||||||||
| Non-compete agreement | 46.01% | (39,336) | (11,353) | - | - | 2,848 | (47,841) | ||||||||
| Outgrowers relationship | 16.45% | (347) | (72) | - | - | - | (419) | ||||||||
| Patents | 8.52% | (3,824) | (448) | 675 | - | (834) | 1,236 | (3,195) | |||||||
| Customer relationship | 6.67% | (622,106) | (101,575) | - | - | (48,487) | 136,513 | (635,655) | |||||||
| Software | 43.58% | (665,504) | (226,029) | 356,053 | (21,656) | 20,686 | (536,450) | ||||||||
| (1,331,117) | (339,477) | 356,728 | - | (70,977) | 161,283 | (1,223,560) | |||||||||
| 6,434,610 | (171,877) | (4,174) | 9,929 | 331,117 | (459,167) | 6,140,438 | |||||||||
| (1) | Weighted average annual remaining rate. |
| 14.1 | Impairment test |
The impairment test of assets is carried out annually based on the discounted cash flow method, which is prepared in order to determine the value in use of the Company’s cash-generating units (“CGU”) (note 24), which were defined in line with the management format. In 2024, the Company used its budget, strategic and financial planning with projections until 2027 and average perpetuity of the cash generating units of 3.5% p.a., based on the history of recent years, as well as in the economic and financial projections of each market in which the Company operates, in addition to official information from independent and governmental institutions.
| 77 |
| Financial Statements, Individual and Consolidated | 2024 a 2023 |
The discount rate used by Management to prepare discounted cash flows varied from 11.9% p.a. to 13.4% p.a. according to the CGU. The assumptions presented in the table below were also adopted:
| 2025 | 2026 | 2027 | ||||
| Inflation Brazil (1) | 3.93% | 4.65% | 4.60% | |||
| Inflation - United States (1) | 2.48% | 2.57% | 2.57% | |||
| Exchange rate - BRL / USD (2) | 5.80 | 5.73 | 5.69 |
| (1) | Source: Macroeconomic Outlook and Scenarios Report - 05.11.24 (LCA Consultoria Econômica). |
| (2) | Source: Focus - Market Report - 06.12.24 (Central Bank of Brazil). |
The rates presented above doesn’t consider the effects of income taxes.
Based on Management’s analysis, no impairment adjustments were identified.
In addition to the recovery analysis mentioned above, Management carried out sensitivity analysis, increasing and decreasing by 2 p.p. the operating margin1 (operating income over net sales) and the nominal discount rate and did not identify any scenarios which would determine the need to set up a provision for impairment of the CGUs.
¹ Weighted average remaining rate per year.
Accounting policy: Acquired intangible assets are measured at cost at initial recognition, while those arising from a business combination are recognized at fair value on the acquisition date. After initial recognition, are presented at cost less accumulated amortization and impairment losses, when applicable. Internally generated intangible assets, excluding development costs, are not capitalized and the expense is recognized in the tatements of income (loss) when incurred. Intangible assets with definite useful lives are amortized on a straight-line basis over their economic useful lives. The amortization period and method for an intangible asset with definite life are reviewed at least at the end of each year, and any changes observed are applied prospectively. The amortization of intangible assets with finite lives is recognized in the statements of income (loss) in the expense category related to their use. Intangible assets with indefinite useful lives are not amortized, but are tested annually for impairment, being allocated to the cash-generating units. The Company records in this subgroup mainly goodwill and trademarks, which are expected to contribute indefinitely to its cash flows.
In the event of impairment, the company records the effects in the income statement, according to the nature of the asset.
|
| 78 |
| Financial Statements, Individual and Consolidated | 2024 a 2023 |
| 15. | Loans and Borrowings |
| Parent company | |||||||||||||||||||
| Charges (p.a.) | Average rate (1) | WAMT (2) | 12.31.23 | Borrowing | Amortization | Interest paid | Interest accrued (3) | Exchange rate variation | 12.31.24 | ||||||||||
| Local currency | |||||||||||||||||||
| Working capital | Fixed / CDI | (12.29% on 12.31.23) | - | 773,840 | - | (740,000) | (77,910) | 44,070 | - | - | |||||||||
| Export credit facility | CDI | 13.77% (13.26% on 12.31.23) | 2.70 | 1,583,596 | - | (470,000) | (166,081) | 165,886 | - | 1,113,401 | |||||||||
| Debentures | CDI / IPCA | 11.45% (10.94% on 12.31.23) | 5.96 | 6,634,434 | 1,937,680 | (978,268) | (538,822) | 171,712 | - | 7,226,736 | |||||||||
| Fiscal incentives | Fixed | 0% (2.40% on 12.31.23) | - | 6,604 | 76,498 | (83,108) | (677) | 683 | - | - | |||||||||
| 8,998,474 | 2,014,178 | (2,271,376) | (783,490) | 382,351 | - | 8,340,137 | |||||||||||||
| Foreign currency | |||||||||||||||||||
| Bonds | Fixed / FX USD | 5.34% (5.34% on 12.31.23) | 16.06 | 6,105,757 | - | (6,839) | (415,950) | 436,657 | 1,722,379 | 7,842,004 | |||||||||
| Export credit facility | Fixed / SOFR /FX USD | 4.24% (5.49% on 12.31.23) | 3.74 | 2,436,651 | - | (1,204,148) | (218,895) | 106,276 | 478,217 | 1,598,101 | |||||||||
| Advances for foreign exchange rate contracts | Fixed / FX USD | (7.10% on 12.31.23) | - | 158,420 | - | (152,900) | (10,972) | (2,466) | 7,918 | - | |||||||||
| 8,700,828 | - | (1,363,887) | (645,817) | 540,467 | 2,208,514 | 9,440,105 | |||||||||||||
| 17,699,302 | 2,014,178 | (3,635,263) | (1,429,307) | 922,818 | 2,208,514 | 17,780,242 | |||||||||||||
| Current | 2,237,214 | 952,565 | |||||||||||||||||
| Non-current | 15,462,088 | 16,827,677 | |||||||||||||||||
| (1) | Weighted average annual rate. |
| (2) | Weighted average maturity in years. |
| (3) | lncludes interest amounts, monetary restatement of the principal coupon and mark-to-market for debts hedged with an annual balance of R$662,443, which are object to fair value hedge protection. |
| 79 |
| Financial Statements, Individual and Consolidated | 2024 a 2023 |
| Parent company | |||||||||||||||||||||
| Charges (p.a.) | Average rate (1) | WAMT (2) | 12.31.22 | Reclassification (3) | Borrowing | Amortization | Interest paid | Interest accrued | Exchange rate variation | 12.31.23 | |||||||||||
| Local currency | |||||||||||||||||||||
| Working capital | Fixed | 12.29% (10.75% on 12.31.22) | 0.65 | 401,661 | - | 740,000 | (386,844) | (37,255) | 56,278 | - | 773,840 | ||||||||||
| Certificate of agribusiness receivables | IPCA | 10.86% (11.80% on 12.31.22) | - | 999,646 | - | - | (1,018,131) | (91,121) | 109,606 | - | - | ||||||||||
| Export credit facility | Fixed / CDI | 13.26% (9.05% on 12.31.22) | 3.67 | 3,613,555 | (2,019,866) | - | - | (234,038) | 223,945 | - | 1,583,596 | ||||||||||
| Debentures | CDI / IPCA | 10.94% (12.09% on 12.31.22) | 5.75 | 5,940,146 | - | - | - | (441,639) | 1,135,927 | - | 6,634,434 | ||||||||||
| Fiscal incentives | Fixed | 2.40% (2.40% on 12.31.22) | - | 5,286 | - | 100,195 | (98,877) | (832) | 832 | - | 6,604 | ||||||||||
| 10,960,294 | (2,019,866) | 840,195 | (1,503,852) | (804,885) | 1,526,588 | - | 8,998,474 | ||||||||||||||
| Foreign currency | |||||||||||||||||||||
| Bonds | Fixed / FX USD and EUR | 5.34% (5.06% on 12.31.22) | 17.06 | 9,293,677 | - | - | (2,683,791) | (497,750) | 552,874 | (559,253) | 6,105,757 | ||||||||||
| Export credit facility | Fixed / LIBOR /FX USD | 5.49% (7.10% on 12.31.22) | 3.23 | 132,887 | 2,019,866 | 1,006,496 | (534,993) | (156,178) | 126,784 | (158,211) | 2,436,651 | ||||||||||
| Advances for foreign exchange rate contracts | Fixed / FX USD | 7.10% (0.00% on 12.31.22) | 0.23 | - | - | 306,684 | (153,684) | (4,309) | 19,122 | (9,393) | 158,420 | ||||||||||
| 9,426,564 | 2,019,866 | 1,313,180 | (3,372,468) | (658,237) | 698,780 | (726,857) | 8,700,828 | ||||||||||||||
| 20,386,858 | - | 2,153,375 | (4,876,320) | (1,463,122) | 2,225,368 | (726,857) | 17,699,302 | ||||||||||||||
| Current | 3,379,835 | 2,237,214 | |||||||||||||||||||
| Non-current | 17,007,023 | 15,462,088 | |||||||||||||||||||
| (1) | Weighted average annual rate. |
| (2) | Weighted average maturity in years. |
| (3) | The Company, in order to improve the presentation of the financial statements, reclassified the export credit facility issued in Reais (R$) simultaneously and in connection with a foreign exchange rate swap, resulting essentially in a net cash flow in U.S. Dollars (US$). |
| 80 |
| Financial Statements, Individual and Consolidated | 2024 a 2023 |
| Consolidated | |||||||||||||||||||
| Charges (p.a.) | Average rate (1) | WAMT (2) | 12.31.23 | Borrowing | Amortization | Interest paid | Interest accrued (3) | Exchange rate variation | 12.31.24 | ||||||||||
| Local currency | |||||||||||||||||||
| Working capital | Fixed / CDI | - (12.28% on 12.31.23) | - | 777,528 | - | (743,687) | (77,910) | 44,069 | - | - | |||||||||
| Export credit facility | CDI | 13.77% (13.26% on 12.31.23) | 2.70 | 1,583,597 | - | (470,000) | (166,081) | 165,884 | - | 1,113,400 | |||||||||
| Debentures | CDI / IPCA | 11.24% (10.94% on 12.31.23) | 5.84 | 6,634,434 | 1,937,680 | (978,268) | (538,822) | 171,712 | - | 7,226,736 | |||||||||
| Fiscal incentives | Fixed | - (2.40% on 12.31.23) | - | 6,604 | 76,498 | (83,108) | (677) | 683 | - | - | |||||||||
| 9,002,163 | 2,014,178 | (2,275,063) | (783,490) | 382,348 | - | 8,340,136 | |||||||||||||
| Foreign currency | |||||||||||||||||||
| Bonds | Fixed / FX USD | 5.16% (5.15% on 12.31.23) | 13.44 | 7,559,562 | - | (105,735) | (484,110) | 509,749 | 2,121,887 | 9,601,353 | |||||||||
| Export credit facility | Fixed /SOFR / FX USD | 4.24% (5.49% on 12.31.23) | 3.74 | 2,436,651 | 777 | (1,204,148) | (219,661) | 106,276 | 478,207 | 1,598,102 | |||||||||
| Advances for foreign exchange rate contracts | Fixed / FX USD | 0% (7.10% on 12.31.23) | - | 158,420 | - | (152,900) | (10,972) | (2,466) | 7,918 | - | |||||||||
| Working capital | Fixed / EIBOR3M + 1,8% FX TRY, AED and USD | 10.62% (13.13% on 12.31.23) | 1.07 | 938,752 | 329,807 | (248,173) | (178,594) | 140,620 | 218,545 | 1,200,957 | |||||||||
| 11,093,385 | 330,584 | (1,710,956) | (893,337) | 754,179 | 2,826,557 | 12,400,412 | |||||||||||||
| 20,095,548 | 2,344,762 | (3,986,019) | (1,676,827) | 1,136,527 | 2,826,557 | 20,740,548 | |||||||||||||
| Current | 2,451,838 | 1,230,273 | |||||||||||||||||
| Non-current | 17,643,710 | 19,510,275 | |||||||||||||||||
| (1) | Weighted average annual rate. |
| (2) | Weighted average maturity in years. |
| (3) | lncludes interest amounts, monetary restatement of the principal coupon and mark-to-market for debts hedged with an annual balance of R$662,443, which are object to fair value hedge protection. |
| 81 |
| Financial Statements, Individual and Consolidated | 2024 a 2023 |
| Consolidated | |||||||||||||||||||||
| Charges (p.a.) | Average rate (1) | WAMT (2) | 12.31.22 | Reclassification (3) | Borrowing | Amortization | Interest paid | Interest accrued | Exchange rate variation | 12.31.23 | |||||||||||
| Local currency | |||||||||||||||||||||
| Working capital | Fixed / CDI | 12.28% (10.72% on 12.31.22) | 0.65 | 409,186 | - | 740,000 | (390,582) | (37,352) | 56,276 | - | 777,528 | ||||||||||
| Certificate of agribusiness receivables | IPCA | 10.86% (11.80% on 12.31.22) | - | 999,646 | - | - | (1,018,131) | (91,121) | 109,606 | - | - | ||||||||||
| Debentures | CDI / IPCA | 10.94% (12.09% on 12.31.22) | 5.75 | 5,940,146 | - | - | - | (441,639) | 1,135,927 | - | 6,634,434 | ||||||||||
| Export credit facility | Fixed / CDI | 13.26% (9.05% on 12.31.22) | 3.67 | 3,613,555 | (2,019,866) | - | - | (234,038) | 223,946 | - | 1,583,597 | ||||||||||
| Fiscal incentives | Fixed | 2.40% (2.40% on 12.31.22) | - | 5,286 | - | 100,195 | (98,877) | (832) | 832 | - | 6,604 | ||||||||||
| 10,967,819 | (2,019,866) | 840,195 | (1,507,590) | (804,982) | 1,526,587 | - | 9,002,163 | ||||||||||||||
| Foreign currency | |||||||||||||||||||||
| Bonds | Fixed / FX USD and EUR | 5.15% (4.91% on 12.31.22) | 14.30 | 11,902,290 | - | - | (3,672,960) | (606,725) | 663,684 | (726,727) | 7,559,562 | ||||||||||
| Export credit facility | Fixed / LIBOR / FX USD | 5.49% (7.10% on 12.31.22) | 3.23 | 132,887 | 2,019,866 | 1,006,496 | (534,993) | (156,178) | 126,784 | (158,211) | 2,436,651 | ||||||||||
| Advances for foreign exchange rate contracts | Fixed / FX USD | 7.10% (0.00% on 12.31.22) | 0.23 | - | - | 306,684 | (153,684) | (4,304) | 19,122 | (9,398) | 158,420 | ||||||||||
| Working capital | Fixed / FX TRY and USD | 13.13% (16.83% on 12.31.22) | 1.84 | 514,004 | - | 1,683,112 | (1,020,713) | (107,636) | 122,454 | (252,469) | 938,752 | ||||||||||
| 12,549,181 | 2,019,866 | 2,996,292 | (5,382,350) | (874,843) | 932,044 | (1,146,805) | 11,093,385 | ||||||||||||||
| 23,517,000 | - | 3,836,487 | (6,889,940) | (1,679,825) | 2,458,631 | (1,146,805) | 20,095,548 | ||||||||||||||
| Current | 3,879,874 | 2,451,838 | |||||||||||||||||||
| Non-current | 19,637,126 | 17,643,710 | |||||||||||||||||||
| (1) | Weighted average annual rate. |
| (2) | Weighted average maturity in years. |
| (3) | The Company, in order to improve the presentation of the financial statements, reclassified the export credit facility issued in Reais (R$) simultaneously and in connection with a foreign exchange rate swap, resulting essentially in a net cash flow in U.S. Dollars (US$). |
The maturity schedule of the loans and borrowings is presented on note 23.1.
| 82 |
| Financial Statements, Individual and Consolidated | 2024 a 2023 |
On December 31, 2024 and on December 31, 2023, the Company did not have any financial covenant clauses related to its loans and borrowings agreements.
| 15.1 | Issuance of debentures |
On June 27, 2024, the Company settled its fifth issuance of simple, non-convertible into shares, unsecured debentures, in three series as shown in the table below, for private placement, in the total amount of R$ 2,000,000.
The debentures were subject to Private Placement with ECO Securitizadora de Direitos Creditórios do Agronegócio S.A. (“Securitization Company”), in the context of its 332nd issuance of agribusiness receivables certificates, in three series, backed by agribusiness credit rights arising from the debentures, for public distribution.
| Parent company and Consolidated | ||||||||||||
| 12.31.24 | ||||||||||||
| Operation | Series | Issue date | Maturity | Rate | Notional | Updated Value | ||||||
| Debenture - 5th Issue | 1st Series | 06.27.24 | 06.14.29 | CDI +0.8% p.a. | 140,000 | 136,766 | ||||||
| Debenture - 5th Issue | 2nd Series | 06.27.24 | 06.13.31 | 12.9% p.a. | 925,000 | 789,811 | ||||||
| Debenture - 5th Issue | 3rd Series | 06.27.24 | 06.14.34 | IPCA +7.2% p.a. | 935,000 | 838,970 | ||||||
| 2,000,000 | 1,765,547 | |||||||||||
The issuances costs of R$62,320 are recognized on the statement of income over the term of the debt according to the effective interest rate method.
| 15.2 | Guarantees |
On December 31, 2024, the amount of bank guarantees contracted by the Company was of R$195,798 (R$207,006 as of December 31, 2023) which were offered mainly in litigations involving the Company’s use of tax credits. These guarantees have an average cost of 1.63% p.a. (1.64% p.a. as of December 31, 2023). Guarantees for the mortgage of assets linked to tax incentives were nil at 12.31.24 (R$6,604 at 12.31.23).
| 15.3 | Advanced amortization |
In 2024, early repayments totaled the principal amount of R$2,213,301 and R$92,341 in interest and others, as a result of the execution of a gross debt reduction program focused on the prepayment of debts with original maturity in the first years and with a higher financial burden.
This amount was allocated mainly to: (i)R$978,268 in principal and R$40,685 in interest and others in Debentures and CRA; (ii) R$105,735 in principal, R$574 in interest and others, and R$1,212 in premium on the repurchase of Bonds 2026 and 2030; (iii) R$1,129,298 in principal and R$52,294 in interest and other amounts in bilateral lines.
| 83 |
| Financial Statements, Individual and Consolidated | 2024 a 2023 |
| 16. | Trade Accounts Payable |
| Parent company | Consolidated | ||||||
| 12.31.24 | 12.31.23 | 12.31.24 | 12.31.23 | ||||
| Trade accounts payable | |||||||
| Domestic market | |||||||
| Third parties | 10,691,833 | 10,367,364 | 10,888,870 | 10,575,915 | |||
| Related parties | 404,215 | 229,650 | 36,380 | 21,482 | |||
| Foreign market | |||||||
| Third parties | 1,311,144 | 1,048,472 | 2,833,403 | 2,157,491 | |||
| Related parties | 17,466 | 2,527,384 | 5,587 | 3,663 | |||
| 12,424,658 | 14,172,870 | 13,764,240 | 12,758,551 | ||||
| (-) Adjustment to present value ("APV") | (185,412) | (160,460) | (194,190) | (166,123) | |||
| 12,239,246 | 14,012,410 | 13,570,050 | 12,592,428 | ||||
| Current | 12,227,480 | 14,011,988 | 13,558,284 | 12,592,006 | |||
| Non-current | 11,766 | 422 | 11,766 | 422 | |||
The Company has agreements with several financial institutions that allow the suppliers to anticipate their receivables and, therefore, transfer the right to receive invoices with financial institutions (“Supply Chain Finance” or “Program”). The suppliers may choose whether to participate and if so, with which financial institution, with no participation by BRF.
The Program can generate benefits in the commercial relations of BRF and its suppliers, such as preference and priority of supply in case of restricted supply, better commercial conditions, among others, without modification to the commercial essence of the transaction.
Invoices included in the Program are paid according to the same price and term conditions negotiated with its suppliers, without incurring any charge to the Company, so that there are no changes in commercial conditions after negotiation and invoicing of goods or services.
Invoices included in the Supply Chain Finance are R$4,735,503 in the Parent Company and R$4,942,713 in the Consolidated as on December 31, 2024 (R$4,760,488 in the Parent Company and R$4,941,716 in the Consolidated as on December 31, 2023). The average payment period agreed with suppliers who choose to participate in the Program is substantially similar to the average payment period agreed with non-participating suppliers.
The Company measures and discriminates the adjustment to present value for all its commercial operations carried out in installments, specifying financial and operational items.
| 17. | Leases |
The Company is lessee in several lease agreements for forest lands, offices, distribution centers, outgrowers, vehicles, among others. Some contracts have a renewal option for an additional period at the end of the agreement, established by contractual amendments. Automatic renewals or renewals for undetermined periods are not allowed.
The contract clauses mentioned, with respect to renewal, readjustment and purchase option, are contracted according to market practices. In addition, there are no clauses of contingent payments or restrictions on dividends distribution, payments of interest on shareholders’ equity or obtaining debt.
| 84 |
| Financial Statements, Individual and Consolidated | 2024 a 2023 |
| 17.1 | Right-of-use assets |
The right-of-use assets as set forth below are part of the balances of property, plant and equipment (notes 13).
| Parent company | |||||||||
| Average rate (1) | 12.31.23 | Additions | Disposals | 12.31.24 | |||||
| Cost | |||||||||
| Land | 43,554 | 1,929 | (9,402) | 36,081 | |||||
| Buildings, facilities and improvements | 4,006,200 | 763,299 | (273,116) | 4,496,383 | |||||
| Machinery and equipment | 253,408 | 19,149 | (120,776) | 151,781 | |||||
| Vehicles | 188,004 | 84,437 | (132,004) | 140,437 | |||||
| 4,491,166 | 868,814 | (535,298) | 4,824,682 | ||||||
| Depreciation | |||||||||
| Land | 2.77% | (18,978) | (4,202) | 6,409 | (16,771) | ||||
| Buildings, facilities and improvements | 13.15% | (1,478,573) | (589,618) | 229,460 | (1,838,731) | ||||
| Machinery and equipment | 19.94% | (52,475) | (35,883) | 33,437 | (54,921) | ||||
| Vehicles | 15.29% | (78,558) | (95,326) | 71,195 | (102,689) | ||||
| (1,628,584) | (725,029) | 340,501 | (2,013,112) | ||||||
| 2,862,582 | 143,785 | (194,797) | 2,811,570 | ||||||
| (1) | Weighted average annual rate. |
| Parent company | |||||||||
| Average rate (1) | 12.31.22 | Additions | Disposals | 12.31.23 | |||||
| Cost | |||||||||
| Land | 46,088 | 9,330 | (11,864) | 43,554 | |||||
| Buildings, facilities and improvements | 3,620,769 | 1,003,430 | (617,999) | 4,006,200 | |||||
| Machinery and equipment | 41,893 | 229,350 | (17,835) | 253,408 | |||||
| Vehicles | 239,309 | 131,668 | (182,973) | 188,004 | |||||
| Software | 12,303 | - | (12,303) | - | |||||
| 3,960,362 | 1,373,778 | (842,974) | 4,491,166 | ||||||
| Depreciation | |||||||||
| Land | 3.74% | (24,631) | (5,734) | 11,387 | (18,978) | ||||
| Buildings, facilities and improvements | 13.13% | (1,513,478) | (505,778) | 540,683 | (1,478,573) | ||||
| Machinery and equipment | 19.37% | (22,900) | (44,036) | 14,461 | (52,475) | ||||
| Vehicles | 20.23% | (170,357) | (86,433) | 178,232 | (78,558) | ||||
| Software | - | (10,814) | (1,487) | 12,301 | - | ||||
| (1,742,180) | (643,468) | 757,064 | (1,628,584) | ||||||
| 2,218,182 | 730,310 | (85,910) | 2,862,582 | ||||||
| (1) | Weighted average annual rate. |
| 85 |
| Financial Statements, Individual and Consolidated | 2024 a 2023 |
| Consolidated | |||||||||||||
| Average rate (1) | 12.31.23 | Additions | Disposals | Monetary correction by Hyperinflation | Exchange rate variation | 12.31.24 | |||||||
| Cost | |||||||||||||
| Land | 130,072 | 1,929 | (9,533) | 9,663 | 24,687 | 156,818 | |||||||
| Buildings, facilities and improvements | 4,345,335 | 849,236 | (478,689) | (2,517) | 57,553 | 4,770,918 | |||||||
| Machinery and equipment | 298,548 | 39,887 | (133,708) | (495) | (274) | 203,958 | |||||||
| Vehicles | 422,558 | 350,602 | (382,581) | 6,707 | 82,070 | 479,356 | |||||||
| 5,196,513 | 1,241,654 | (1,004,511) | 13,358 | 164,036 | 5,611,050 | ||||||||
| Depreciation | |||||||||||||
| Land | 2.83% | (41,450) | (10,958) | 6,540 | (4,997) | (7,532) | (58,397) | ||||||
| Buildings, facilities and improvements | 13.51% | (1,736,196) | (675,400) | 429,905 | (1,050) | (40,263) | (2,023,004) | ||||||
| Machinery and equipment | 19.99% | (81,950) | (47,624) | 46,369 | 1,743 | (423) | (81,885) | ||||||
| Vehicles | 38.90% | (226,910) | (216,429) | 221,110 | 4,873 | (41,638) | (258,994) | ||||||
| (2,086,506) | (950,411) | 703,924 | 569 | (89,856) | (2,422,280) | ||||||||
| 3,110,007 | 291,243 | (300,587) | 13,927 | 74,180 | 3,188,770 | ||||||||
| (1) | Weighted average annual rate. |
| Consolidated | |||||||||||||||
| Average rate (1) | 12.31.22 | Additions | Disposals | Transfers | Monetary correction by hyperinflation | Exchange rate variation | 12.31.23 | ||||||||
| Cost | |||||||||||||||
| Land | 139,740 | 9,330 | (11,883) | - | 1,286 | (8,401) | 130,072 | ||||||||
| Buildings, facilities and improvements | 4,031,143 | 1,031,073 | (675,341) | (27,655) | 12,940 | (26,825) | 4,345,335 | ||||||||
| Machinery and equipment | 47,688 | 241,292 | (18,148) | 27,655 | 575 | (514) | 298,548 | ||||||||
| Vehicles | 602,116 | 138,388 | (294,854) | - | 4,992 | (28,084) | 422,558 | ||||||||
| Software | 12,303 | - | (12,303) | - | - | - | - | ||||||||
| 4,832,990 | 1,420,083 | (1,012,529) | - | 19,793 | (63,824) | 5,196,513 | |||||||||
| Depreciation | |||||||||||||||
| Land | 7.37% | (44,006) | (10,680) | 11,405 | - | 277 | 1,554 | (41,450) | |||||||
| Buildings, facilities and improvements | 13.56% | (1,784,777) | (574,800) | 597,221 | 15,686 | (3,786) | 14,260 | (1,736,196) | |||||||
| Machinery and equipment | 19.40% | (27,283) | (52,424) | 14,795 | (15,686) | (1,957) | 605 | (81,950) | |||||||
| Vehicles | 35.27% | (346,907) | (179,841) | 289,744 | - | (7,879) | 17,973 | (226,910) | |||||||
| Software | - | (10,814) | (1,487) | 12,301 | - | - | - | - | |||||||
| (2,213,787) | (819,232) | 925,466 | - | (13,345) | 34,392 | (2,086,506) | |||||||||
| 2,619,203 | 600,851 | (87,063) | - | 6,448 | (29,432) | 3,110,007 | |||||||||
| (1) | Weighted average annual rate. |
| 17.2 | Lease liabilities |
| Parent company | |||||||||||||||||
| Weighted average interest rate (p.a.) | WAM (1) | 12.31.23 | Additions | Payments | Interest paid | Interest accrued | Disposals | 12.31.24 | |||||||||
| Land | - | - | 30,249 | 1,929 | (2,549) | (3,587) | 3,587 | (4,476) | 25,153 | ||||||||
| Buildings, facilities and improvements (2) | - | - | 3,093,021 | 763,299 | (532,096) | (135,757) | 320,001 | (91,409) | 3,417,059 | ||||||||
| Machinery and equipment | - | - | 214,509 | 19,149 | (31,802) | (19,913) | 19,913 | (93,752) | 108,104 | ||||||||
| Vehicles | - | - | 122,354 | 84,437 | (93,015) | (12,629) | 12,629 | (70,391) | 43,385 | ||||||||
| 9.9% | 6.4 | 3,460,133 | 868,814 | (659,462) | (171,886) | 356,130 | (260,028) | 3,593,701 | |||||||||
| Current | 835,154 | 847,407 | |||||||||||||||
| Non-current | 2,624,979 | 2,746,294 | |||||||||||||||
| (1) | Weighted average maturity in years. |
| (2) | Includes the amount of R$2,349,173 in the Parent Company and in the Consolidated (R$1,984,044 in the Parent Company and in the Consolidated as on December 31, 2023) referring to the right of use identified on integrated producers contracts. |
| 86 |
| Financial Statements, Individual and Consolidated | 2024 a 2023 |
| Parent company | |||||||||||||||||
| Weighted average interest rate (p.a.) | WAM (1) | 12.31.22 | Additions | Payments | Interest paid | Interest accrued | Disposals | 12.31.23 | |||||||||
| Land | - | - | 27,451 | 9,330 | (4,740) | (3,803) | 3,803 | (1,792) | 30,249 | ||||||||
| Buildings, facilities and improvements (2) | - | - | 2,495,987 | 1,003,430 | (455,631) | (134,758) | 261,171 | (77,178) | 3,093,021 | ||||||||
| Machinery and equipment | - | - | 20,158 | 229,350 | (31,465) | (27,521) | 27,521 | (3,534) | 214,509 | ||||||||
| Vehicles | - | - | 81,763 | 131,668 | (74,565) | (10,006) | 10,006 | (16,512) | 122,354 | ||||||||
| Software | - | - | 1,604 | - | (1,604) | (45) | 45 | - | - | ||||||||
| 8.7% | 6.5 | 2,626,963 | 1,373,778 | (568,005) | (176,133) | 302,546 | (99,016) | 3,460,133 | |||||||||
| Current | 521,544 | 835,154 | |||||||||||||||
| Non-current | 2,105,419 | 2,624,979 | |||||||||||||||
| (1) | Weighted average maturity in years. |
| (2) | Includes the amount of R$1,984,044 in the Parent Company and Consolidated (R$1,578,723 on December 31, 2022) referring to the right of use identified in integration contracts. |
| Consolidated | ||||||||||||||||||
| Weighted average interest rate (p.a.) | WAM (1) | 12.31.23 | Additions | Payments | Interest paid | Interest accrued | Disposals | Exchange rate variation | 12.31.24 | |||||||||
| - | - | 106,695 | 1,929 | (5,145) | (9,395) | 9,395 | (4,477) | 20,803 | 119,805 | |||||||||
| - | - | 3,174,862 | 849,236 | (612,876) | (143,763) | 328,007 | (96,818) | 16,088 | 3,514,736 | |||||||||
| - | - | 225,272 | 39,887 | (38,794) | (22,928) | 22,928 | (93,796) | 2,581 | 135,150 | |||||||||
| - | - | 215,018 | 350,602 | (209,677) | (25,522) | 25,522 | (173,741) | 41,036 | 223,238 | |||||||||
| 9.7% | 6.2 | 3,721,847 | 1,241,654 | (866,492) | (201,608) | 385,852 | (368,832) | 80,508 | 3,992,929 | |||||||||
| 944,326 | 1,014,813 | |||||||||||||||||
| 2,777,521 | 2,978,116 | |||||||||||||||||
| (1) | Weighted average maturity in years. |
| (2) | Includes the amount of R$2,349,173 in the Parent Company and in the Consolidated (R$1,984,044 in the Parent Company and in the Consolidated as on December 31, 2023) referring to the right of use identified on integrated producers contracts. |
| Consolidated | ||||||||||||||||||
| Weighted average interest rate (p.a.) | WAM (1) | 12.31.22 | Additions | Payments | Interest paid | Interest accrued | Disposals | Exchange rate variation | 12.31.23 | |||||||||
| - | - | 112,476 | 9,330 | (6,844) | (9,404) | 9,404 | (1,792) | (6,475) | 106,695 | |||||||||
| - | - | 2,634,074 | 1,031,073 | (530,779) | (142,245) | 268,659 | (77,896) | (8,024) | 3,174,862 | |||||||||
| - | - | 22,565 | 241,292 | (34,756) | (28,660) | 28,660 | (3,533) | (296) | 225,272 | |||||||||
| - | - | 274,215 | 138,388 | (168,473) | (16,677) | 16,677 | (16,841) | (12,271) | 215,018 | |||||||||
| - | - | 1,604 | - | (1,604) | (45) | 45 | - | - | - | |||||||||
| 7.5% | 7.6 | 3,044,934 | 1,420,083 | (742,456) | (197,031) | 323,445 | (100,062) | (27,066) | 3,721,847 | |||||||||
| 676,864 | 944,326 | |||||||||||||||||
| 2,368,070 | 2,777,521 | |||||||||||||||||
| (1) | Weighted average maturity in years. |
| (2) | Includes the amount of R$1,984,044 in the Parent Company and Consolidated (R$1,578,723 on December 31, 2022) referring to the right of use identified in integration contracts. |
| 17.3 | Lease liabilities maturity schedule |
The maturity schedule of the minimum required future payments is presented below:
| 87 |
| Financial Statements, Individual and Consolidated | 2024 a 2023 |
| Parent company | Consolidated | ||
| 12.31.24 | 12.31.24 | ||
| Current | 847,407 | 1,014,813 | |
| Non-current | 2,746,294 | 2,978,116 | |
| 2026 | 649,185 | 719,971 | |
| 2027 | 535,845 | 587,398 | |
| 2028 | 381,720 | 413,702 | |
| 2029 | 327,729 | 339,134 | |
| 2030 onwards | 851,815 | 917,911 | |
| 3,593,701 | 3,992,929 |
| 17.4 | Amount recognized in the Statements of Income (Loss) |
The amounts directly recognized in the statement of income presented below relate to items not capitalized, including: low-value assets, short-term leases and leases with variable payments.
| Parent Company | Consolidated | |||
| 12.31.24 | 12.31.24 | |||
| Variable payments not included in the lease liabilities | 7,162 | 39,830 | ||
| Expenses related to short-term leases | 17,806 | 38,670 | ||
| Expenses related to low-value assets | 8,656 | 8,815 | ||
| 33,624 | 87,315 |
| 88 |
| Financial Statements, Individual and Consolidated | 2024 a 2023 |
Accounting policy: The Company recognizes a right-of-use asset and a lease liability, which represents the obligation to make payments related to the underlying asset of the lease.
The right-of-use asset is initially measured at cost and comprises the initial amount of the lease liability adjusted by any payment made on or before the contract start date, plus any initial direct cost incurred and estimated cost of dismantling, removing, restoring the asset to its current location, less any incentive received. The options to extend the term, terminate the contracts early and purchase are analyzed individually considering the type of asset involved as well as its relevance to the Company's production process. The right-of-use asset is subsequently depreciated using the straight-line method from the commencement date until the end of the useful life of the right-of-use asset or the end of the lease term. In addition, the right-of-use asset is periodically written down to its recoverable amount, when applicable, and adjusted by the subsequent measurement of the lease liability. The Company does not apply lease accounting model to leases with a term of 12 months or less and that do not contain a purchase option; and leases for which the underlying asset is of low value. For these exemptions, the lease payments are recognized as an expense on a straight-line basis over the lease term. The lease liability is initially measured at the present value of the future lease payments using the incremental borrowing rate, and subsequently, measured at amortized cost using the effective interest method, which are recorded against financial income (expenses), net. The liability is remeasured when there is a change in (i) future payments resulting from a change in index or rate, (ii) the amount expected to be payable under a residual value guarantee, or (iii) the assessment of whether the Company will exercise the purchase, renewal or termination option. When the lease liability is remeasured, the corresponding adjustment is recorded in the book value of the right-of-use asset, or in the statement of income if the book value of the right-of-use asset has been reduced to zero. Additionally, contracts with indefinite term and no fixed payments are expensed as incurred. |
| 18. | Share-based Payment |
The Company grants to its eligible employees, restricted stocks, ruled by plans approved at the General Shareholder’s Meeting, with the purpose of: (i) stimulating the expansion, success and achievement of the Company’s social objectives; (ii) aligning the interests of the Company’s shareholders with those of the eligible employees; and (iii) enabling the Company and its subsidiaries to attract and retain the employees. The limit of grants is 2.5% of the common, registered, book-entry shares with no par value, representative of the Company’s total capital stock.
Annually, or whenever it deems appropriate, the Board of Directors approves the grant of restricted stocks, electing the beneficiaries in favor of which the Company will transfer the restricted stocks, establishing the terms, quantities and conditions of acquisition of rights related to restricted stocks.
The vesting is conditional to the: (i) continuity of the employment relationship with the Company for three years after the grant date; (ii) achievement of a minimum shareholder return defined by the Board of Directors in the granting agreements and measured at the end of the vesting period; or (iii) any other conditions determined by the Board of Directors in each grant.
The breakdown of the outstanding shares granted is set forth as follows:
| Date | Quantity | Grant (1) | ||||||
| Grant | Vesting date | Shares granted (2) | Outstanding shares | Fair value of the shares | ||||
| 07/01/22 | 07/01/25 | 4,703,472 | 1,370,135 | 14.11 | ||||
| 06/01/23 | 06/01/26 | 4,758,877 | 3,424,764 | 7.38 | ||||
| 07/01/23 | 07/01/26 | 2,108,504 | 1,324,205 | 8.98 | ||||
| 04/01/24 | 04/01/27 | 2,323,377 | 2,478,285 | 16.35 | ||||
| 07/01/24 | 07/01/27 | 1,086,352 | 1,114,967 | 19.54 | ||||
| 14,980,582 | 9,712,356 | |||||||
| (1) | Amounts expressed in Brazilian Reais (R$). |
| (2) | Basis of shares granted before income tax deduction. |
The roll-forward of the granted options and shares for the year ended on December 31, 2024, is presented as follows:
| 89 |
| Financial Statements, Individual and Consolidated | 2024 a 2023 |
| Consolidated | ||
| Outstanding stocks as of December 31, 2023 | 9,234,128 | |
| Exercised / Delivered | (3,818,994) | |
| Granted | ||
| Restricted stocks - April 2024 | 2,323,377 | |
| Restricted stocks - July 2024 | 1,086,352 | |
| Forfeiture (1) : | ||
| Restricted stocks – grant of July, 2024 | (24,511) | |
| Restricted stocks – grant of July, 2023 | (207,876) | |
| Restricted stocks – grant of June, 2023 | (56,848) | |
| Restricted stocks – grant of July, 2022 | (101,252) | |
| Restricted stocks – grant of July, 2021 | (11,990) | |
| True up: | ||
| Performance stocks | 1,289,970 | |
| Outstanding stocks as of December 31, 2024 | 9,712,356 |
| (1) | The forfeitures are related to the resignation of eligible executive before the end of the vesting period. |
The Company has registered under shareholders’ equity, the fair value of share-based compensation plans in the amount of R$131,872 (R$203,374 as of December 31, 2023) and in the amount of R$47,301 under non-current liabilities (R$19,821 of December 31, 2023). In the statement of income for the year ended on December 31, 2024 the amount recognized as expense was R$106,725 in the Parent Company and R$122,726 in the Consolidated (R$35,276 in the Parent Company and R$38,499 in the Consolidated for the year ended December 31, 2023).
Accounting policy: The company offers its eligible employees restricted and performance share plans issued by the company. The Company recognizes as expense the fair value of the shares, measured at the grant date, on a straight-line basis during the period of service required by the plan, with a corresponding entry: i) to the shareholders’ equity for plans exercisable in shares; and ii) to liabilities for cash exercisable plans. When the conditions associated to the right to restricted stocks are no longer met, the expense recognized is reversed, so that the accumulated expense recognized reflects the vesting period and the Company’s best estimate of the number of shares to be delivered. The expense of the plans is recognized in the statements of income (loss) in accordance with the function performed by the beneficiary. |
| 19. | Employees Benefits |
19.1. Supplementary pension plans
The Company is the sponsor of the following pension plans for its employees and executives: i) Plan II – Variable Contribution with Defined Benefit option – closed for adminissions; ii) Plan III – Defined Contribution – open for admissions; and iii) FAF Plan – Defined Benefit - closed for adminissions.
| 90 |
| Financial Statements, Individual and Consolidated | 2024 a 2023 |
These plans are managed by BRF Previdência, a closed supplementary pension entity, of non-economic and non-profit nature, and through its Deliberative Board, is responsible for defining pension objectives and policies, as well as establishing fundamental guidelines aa well as organization, operation and management rules. The Deliberative Board is composed of representatives from the sponsor and participants, in the proportion of 2/3 and 1/3 respectively.
| 19.1.1 | Defined benefit plan |
The Plan II is a variable contribution plan structured as defined contribution during the accumulation of mathematic provisions and at the benefit grant date the beneficiary may choose to convert the accumulated balance in a lifetime monthly income (defined benefit). The main related actuarial risks are (i) survival rates above the mortality tables and (ii) actual return on equity below the actual discount rate.
The FAF (Fundação Attílio Francisco Xavier Fontana) Plan aims to complement the benefit paid by the Brazilian Social Security (“INSS – Instituto Nacional de Seguridade Social”). The benefit is calculated based on the income of the participant and the amounts vary according to the type of the retirement and other criteria defined by the plan.
The main actuarial risks related are: (i) survival rates above the mortality tables, (ii) turnover lower than expected, (iii) salary growth higher than expected, (iv) actual return on equity below the actual discount rate, (v) changes to the rules of social security, and (vi) actual family composition of the retired employee or executive different than the established assumption.
The actuarial calculations of the plans managed by BRF Previdência are prepared annually by independent specialists and reviewed by Management, according to the rules in force.
In the case of a deficit in the plans results, in amounts higher than those defined by legislation, the sponsor, the participants and the beneficiaries, must support the plan according to the proportion of their contributions.
The economic benefit presented as an asset considers only the portion of the surplus that is actually recoverable. The recovery of the surplus on the plans is through reductions in future contributions.
| 19.1.2 | Defined contribution plan |
The Plan III is a defined contribution plan, in which the contributions are known and the benefit depends directly on the contributions made by participants and sponsors, on the contribution time and on the returns obtained through the investment of the contributions.
The contributions made by the Company in the year ended December 31, 2024 amounted R$28,903 (R$26,911 for the year ended December 31, 2023). On December 31, 2024, the plan had 34,354 participants (35,644 participants as of December 31, 2023).
When the participants of the Plans II and III terminate the employment relationship with the sponsor, the unused balance of the contributions made by the sponsor forms a surplus fund that may be used to compensate future contributions of the sponsor
| 91 |
| Financial Statements, Individual and Consolidated | 2024 a 2023 |
| 19.1.3 | Roll-forward of defined benefit and variable contribution |
The assets and actuarial liabilities, as well as the movement of the related rights and obligations are presented below:
| Consolidated | |||||||
| FAF | Plan II | ||||||
| 12.31.24 | 12.31.23 | 12.31.24 | 12.31.23 | ||||
| Composition of actuarial assets and liabilities | |||||||
| Present value of actuarial liabilities | 3,181,366 | 3,348,786 | 20,547 | 21,789 | |||
| Fair value of assets | (3,734,685) | (3,647,431) | (21,712) | (22,845) | |||
| (Surplus) Deficit | (553,319) | (298,645) | (1,165) | (1,056) | |||
| Irrecoverable surplus - (asset ceiling) | 553,319 | 298,645 | 1,165 | 1,056 | |||
| Net actuarial (assets) liabilities | - | - | - | - | |||
| Rollforward of irrecoverable surplus | |||||||
| Beginning balance of irrecoverable surplus | 298,645 | 482,263 | 1,056 | 1,923 | |||
| Interest on irrecoverable surplus | 28,491 | 47,021 | 99 | 187 | |||
| Changes in irrecoverable surplus during the year | 226,183 | (230,639) | 10 | (1,054) | |||
| Ending balance of irrecoverable surplus | 553,319 | 298,645 | 1,165 | 1,056 | |||
| Rollforward of present value of actuarial liabilities | |||||||
| Beginning balance of the present value of liabilities | 3,348,786 | 3,121,348 | 21,789 | 20,822 | |||
| Interest on actuarial obligations | 308,002 | 293,231 | 1,963 | 1,935 | |||
| Current service cost | 19,226 | 18,153 | - | - | |||
| Benefit paid | (229,382) | (233,865) | (1,937) | (1,947) | |||
| Actuarial losses - experience | 35,984 | 81,782 | 377 | 460 | |||
| Actuarial (gains) losses - economic hypotheses | (301,250) | 68,137 | (1,645) | 519 | |||
| Actuarial (gains) losses - demographic hypothesis | - | - | - | - | |||
| Ending balance of actuarial liabilities | 3,181,366 | 3,348,786 | 20,547 | 21,789 | |||
| Rollforward of the fair value of the assets | |||||||
| Beginning balance of the fair value of plan assets | (3,647,431) | (3,603,611) | (22,845) | (22,745) | |||
| Interest income on assets plan | (336,492) | (340,252) | (2,062) | (2,122) | |||
| Benefit paid | 229,382 | 233,865 | 1,937 | 1,947 | |||
| Return on assets higher (lower) than projection | 19,856 | 62,567 | 1,258 | 75 | |||
| Ending Balance of the fair value of the assets | (3,734,685) | (3,647,431) | (21,712) | (22,845) | |||
| Rollforward of comprehensive income | |||||||
| Beginning balance | 18,153 | 23,190 | - | 3,385 | |||
| Reversion to accumulated losses | (18,153) | (23,190) | - | (3,385) | |||
| Actuarial gains (losses) | 265,266 | (149,919) | 1,268 | (979) | |||
| Return on assets higher (lower) than projection | (19,856) | (62,567) | (1,258) | (75) | |||
| Changes on irrecoverable surplus | (226,183) | 230,639 | (10) | 1,054 | |||
| Ending balance of comprehensive income | 19,227 | 18,153 | - | - | |||
| Costs recognized in statement of income | |||||||
| Current service costs | (19,226) | (18,153) | - | - | |||
| Interest on actuarial obligations | (308,002) | (293,231) | (1,963) | (1,935) | |||
| Projected return on assets | 336,492 | 340,252 | 2,062 | 2,122 | |||
| Interest on irrecoverable surplus | (28,491) | (47,021) | (99) | (187) | |||
| Costs recognized in statement of income | (19,227) | (18,153) | - | - | |||
| Estimated costs for the next year | |||||||
| Costs of defined benefit | (16,927) | (19,226) | - | - | |||
| Estimated costs for the next year | (16,927) | (19,226) | - | - | |||
| 92 |
| Financial Statements, Individual and Consolidated | 2024 a 2023 |
| 19.1.4 | Actuarial assumptions and demographic data |
The main actuarial assumptions and demographic data used in the actuarial calculations are presented below:
| Consolidated | |||||||
| FAF | Plan II | ||||||
| 12.31.24 | 12.31.23 | 12.31.24 | 12.31.23 | ||||
| Actuarial assumptions | |||||||
| Economic hypothesis | |||||||
| Discount rate | 10.49% | 9.54% | 10.44% | 9.43% | |||
| Inflation rate | 3.50% | 3.50% | 3.50% | 3.50% | |||
| Wage growth rate | 4.60% | 4.60% | N/A | N/A | |||
| Demographic hypothesis | |||||||
| Mortality schedule | AT-2000 Basic, by gender | AT-2000 Basic, by gender | AT-2000 Basic, by gender | AT-2000 Basic, by gender | |||
| Mortality schedule - Disabled | CSO-58 | CSO-58 | CSO-58 | CSO-58 | |||
| Demographic data | |||||||
| Number of active participants | 5,030 | 5,314 | - | - | |||
| Number of beneficiary participants assisted | 8,171 | 7,972 | 51 | 51 | |||
| 19.1.5 | The composition of the investment portfolios |
The composition of the investment portfolios is presented below:
| FAF | Plan II | |||||||||||||||
| 12.31.24 | 12.31.23 | 12.31.24 | 12.31.23 | |||||||||||||
| Composition of the fund's portfolio | ||||||||||||||||
| Fixed income | 2,919,403 | 78.2% | 2,607,913 | 71.5% | 19,424 | 89.5% | 20,629 | 90.3% | ||||||||
| Variable income | 361,891 | 9.7% | 339,211 | 9.3% | 1,874 | 8.6% | 937 | 4.1% | ||||||||
| Real estate | 308,858 | 8.3% | 368,391 | 10.1% | - | 0.0% | 23 | 0.1% | ||||||||
| Other | 144,533 | 3.9% | 331,916 | 9.1% | 414 | 1.9% | 1,256 | 5.5% | ||||||||
| 3,734,685 | 100.0% | 3,647,431 | 100.0% | 21,712 | 100.0% | 22,845 | 100.0% | |||||||||
| % of nominal return on assets | 9.23% | 9.44% | 9.03% | 9.33% | ||||||||||||
| 19.1.6 | Expected benefit payments and average term of payments |
The following amounts represent the expected benefit payments for future periods and the average duration of the plan’s obligations:
| 93 |
| Financial Statements, Individual and Consolidated | 2024 a 2023 |
| FAF | Plan II | ||
| 2025 | 252,912 | 2,038 | |
| 2026 | 252,642 | 2,016 | |
| 2027 | 253,066 | 1,991 | |
| 2028 | 252,502 | 1,961 | |
| 2029 | 253,677 | 1,927 | |
| 2030 to 2034 | 1,289,942 | 8,934 | |
| Weighted average duration - in years | 10.10 | 8.20 |
| 19.1.7 | Sensitivity analysis of the defined benefit plan - FAF |
The quantitative sensitivity analysis regarding the relevant assumptions of defined benefit plan – FAF on December 31, 2024 is presented below:
| Assumptions utilized | Variation of (+1%) | Variation of (-1%) | ||||||||
| Relevant assumptions | Average rate | Actuarial liabilities | Average rate | Actuarial liabilities | ||||||
| Benefit plan - FAF | ||||||||||
| Discount rate | 10.49% | 11.49% | 2,903,579 | 9.49% | 3,510,948 | |||||
| Wage growth rate (1) | 1.06% | 2.06% | 3,206,208 | 0.06% | 3,160,684 | |||||
| (1) | Actual rate. |
| 19.2 | Employees benefits: description and characteristics of benefits and associated risks |
| Parent company | Consolidated | ||||||
| Liabilities | Liabilities | ||||||
| 12.31.24 | 12.31.23 | 12.31.24 | 12.31.23 | ||||
| Medical assistance | 60,486 | 65,522 | 61,278 | 66,245 | |||
| F.G.T.S. Penalty (1) | 75,771 | 70,535 | 75,771 | 70,535 | |||
| Award for length of service | 111,071 | 125,991 | 111,071 | 125,991 | |||
| Other (2) | 64,831 | 61,577 | 314,283 | 278,050 | |||
| 312,159 | 323,625 | 562,403 | 540,821 | ||||
| Current | 63,959 | 58,894 | 95,276 | 86,423 | |||
| Non-current | 248,200 | 264,731 | 467,127 | 454,398 | |||
| (1) | FGTS – Government Severance Indemnity Fund for Employees. |
| (2) | Includes retirement bonus, life insurance and liabilities related to subsidiaries located abroad, if certain conditions are met upon termination, in accordance with the legislation of each country. |
The Company has the policy to offer the following post-employment and other employee benefits plans in addition to the pension plans, which are measured by actuarial calculation and recognized in the financial statements:
| 94 |
| Financial Statements, Individual and Consolidated | 2024 a 2023 |
19.2.1 Medical plan
The Company offers a medical plan with fixed contribution to the retired employees according to the Law No. 9,656/98.
It is ensured to the retired employee that has contributed to the health plan during the employment relationship for at least 10 years, the right of maintenance as beneficiary, on the same conditions of coverage existing when the employment contract was in force. The main related actuarial risks are (i) survival rates above the mortality tables, (ii) turnover lower than expected and (iii) medical costs growth higher than expected.
19.2.2 F.G.T.S. penality by dismissional on retirement
As settled by the Regional Labor Court (“TRT”) on April 20, 2007, retirement does not affect the employment contract between the Company and its employees. However, when the employee is retired through INSS and is dismissed from the Company, the Company may, in certain cases, enter into a mutual agreement granting the payment of the benefit equivalent to the 20% penalty on the F.G.T.S. balance. The main related actuarial risks are: (i) survival rates above the mortality tables, (ii) turnover lower than expected and (iii) salary growth higher than expected.
19.2.3 Award for length of service
The Company has the policy to reward active employees that attain at least 10 years of services rendered and subsequently every 5 years, with an additional remuneration. The main related actuarial risks rare, (i) turnover lower than expected, (ii) salary growth higher than expected and (iii) survival rates above the mortality tables.
19.2.4 Other – parent company
| i. | Retirement compensation |
On retirement, employees with more than 8 years of services rendered to the Company are eligible for additional compensation. The main actuarial related risks are (i) turnover lower than expected, (ii) salary growth higher than expected and (iii) survival rates above the mortality tables.
| ii. | Life insurance |
The Company offers life insurance benefits to the employees who, at the time of their termination, are retired and during the employment contract opted for the insurance, with the period of benefit varying from 2 to 3 years. The main related actuarial risks are (i) survival rates above the mortality tables, (ii) turnover lower than expected and (iii) salary growth higher than expected.
19.2.5 Other - consolidated
The Company has a liability recorded for defined benefit plans to certain subsidiaries located in Turkey, Saudi Arabia, Qatar, United Arab Emirates, Oman and Kuwait, related to end of service payments when certain conditions are met, which varies based on the labor laws for each country. The main related actuarial risks are: (i) survival rates above the mortality tables, (ii) turnover lower than expected and (iii) salary growth higher than expected.
| 95 |
| Financial Statements, Individual and Consolidated | 2024 a 2023 |
| 19.2.6 | Roll-forward of actuarial liabilities |
The roll-forward of actuarial liabilities related to other benefits, which was prepared based on actuarial report reviewed by the Management, are as follows:
| Consolidated | ||||||||||||||||
| Medical plan | F.G.T.S. penalty | Award for length of service | Other (1) | |||||||||||||
| 12.31.24 | 12.31.23 | 12.31.24 | 12.31.23 | 12.31.24 | 12.31.23 | 12.31.24 | 12.31.23 | |||||||||
| Composition of actuarial liabilities | ||||||||||||||||
| Present value of actuarial liabilities | 61,278 | 66,245 | 75,771 | 70,535 | 111,071 | 125,991 | 314,283 | 278,050 | ||||||||
| Net actuarial liabilities | 61,278 | 66,245 | 75,771 | 70,535 | 111,071 | 125,991 | 314,283 | 278,050 | ||||||||
| Rollforward of present value of actuarial liabilities | ||||||||||||||||
| Beginning balance of present value of actuarial liabilities | 66,245 | 119,729 | 70,535 | 60,657 | 125,991 | 112,225 | 278,050 | 228,700 | ||||||||
| Interest on actuarial liabilities | 6,268 | 11,434 | 5,668 | 5,052 | 10,893 | 10,104 | 36,487 | 16,947 | ||||||||
| Current service costs | 19 | 508 | 3,021 | 2,669 | 6,146 | 5,707 | 31,573 | 22,123 | ||||||||
| Past service costs | - | - | - | - | (15,040) | - | - | 3,326 | ||||||||
| Benefits paid directly by the Company | (3,679) | (4,562) | (5,146) | (4,937) | (20,995) | (16,201) | (24,850) | (44,141) | ||||||||
| Business combination | - | - | - | - | - | - | - | - | ||||||||
| Actuarial (gains) losses - experience | 1,350 | (62,276) | 5,952 | 5,938 | 11,472 | 12,745 | 81,695 | 103,847 | ||||||||
| Actuarial (gains) losses - demographic hypothesis | (811) | - | - | - | - | - | (122) | (6,504) | ||||||||
| Actuarial (gains) losses - economic hypothesis | (8,114) | 1,412 | (4,258) | 1,156 | (7,397) | 1,411 | (124,617) | (6,747) | ||||||||
| Actuarial (gains) losses - exchange variation | - | - | - | - | - | - | 36,067 | (39,501) | ||||||||
| Ending balance of liabilities | 61,278 | 66,245 | 75,772 | 70,535 | 111,070 | 125,991 | 314,283 | 278,050 | ||||||||
| Rollforward of the fair value of the assets | ||||||||||||||||
| Benefits paid directly by the Company | 3,679 | 4,562 | 5,146 | 4,937 | 20,995 | 16,201 | 24,850 | 44,141 | ||||||||
| Contributions of the sponsor | (3,679) | (4,562) | (5,146) | (4,937) | (20,995) | (16,201) | (24,850) | (44,141) | ||||||||
| Ending Balance of the fair value of the assets | - | - | - | - | - | - | - | - | ||||||||
| Rollforward of comprehensive income | ||||||||||||||||
| Beginning balance | 110,432 | 49,568 | (12,165) | (5,071) | - | - | (134,273) | (84,008) | ||||||||
| Actuarial gains (losses) | 7,575 | 60,864 | (1,694) | (7,094) | - | - | 43,044 | (90,596) | ||||||||
| Exchange variation | - | - | - | - | - | - | 36,067 | 40,331 | ||||||||
| Ending balance of comprehensive income | 118,007 | 110,432 | (13,859) | (12,165) | - | - | (55,162) | (134,273) | ||||||||
| Costs recognized in statement of income | ||||||||||||||||
| Interest on actuarial liabilities | (6,268) | (11,434) | (5,668) | (5,052) | (10,893) | (10,104) | (36,487) | (16,947) | ||||||||
| Current service costs | (19) | (508) | (3,021) | (2,669) | (6,146) | (5,707) | (31,573) | (22,123) | ||||||||
| Past service costs | - | - | - | - | 15,040 | - | - | (3,326) | ||||||||
| Immediate recognition of reduction | - | - | - | - | (4,075) | (14,156) | - | - | ||||||||
| Cost recognized in statement of income | (6,287) | (11,942) | (8,689) | (7,721) | (6,074) | (29,967) | (68,060) | (42,396) | ||||||||
| Estimated costs for the next year | ||||||||||||||||
| Current service costs | - | (19) | (3,103) | (3,021) | (5,423) | (6,146) | (2,257) | (30,317) | ||||||||
| Interest on actuarial liabilities | (6,265) | (6,268) | - | (5,669) | - | (10,893) | - | (35,728) | ||||||||
| Estimated costs for the next year | (6,265) | (6,287) | (3,103) | (8,690) | (5,423) | (17,039) | (2,257) | (66,045) | ||||||||
| (1) | Considers the sum of the retirement compensation, life insurance benefits and compensation for time of service granted in certain subsidiaries of Company. |
19.2.7 Actuarial assumptions and demographic data
The main actuarial assumptions and demographic data used in the actuarial calculations are summarized below:
| 96 |
| Financial Statements, Individual and Consolidated | 2024 a 2023 |
| Consolidated | ||||||||||||
| Medical plan | F.G.T.S. penalty | Other (1) | ||||||||||
| Actuarial assumptions | 12.31.24 | 12.31.23 | 12.31.24 | 12.31.23 | 12.31.24 | 12.31.23 | ||||||
| Economic hypothesis | ||||||||||||
| Discount rate | 9.61% | 9.61% | 10.61% | 9.42% | 10.61% | 13.77% | ||||||
| Inflation rate | 3.50% | 3.50% | 3.50% | 3.50% | 3.50% | 11.75% | ||||||
| Medical inflation | 6.60% | 6.60% | N/A | N/A | N/A | N/A | ||||||
| Wage growth rate | N/A | N/A | 3.50% | 3.50% | 3.50% | 8.34% | ||||||
| F.G.T.S. balance growth | N/A | N/A | 3.50% | 3.41% | N/A | N/A | ||||||
| Demographic hypothesis | ||||||||||||
| Mortality schedule | AT-2000 Basic by gender | AT-2000 Basic by gender | AT-2000 Basic by gender | AT-2000 Basic by gender | ||||||||
| Disability entry schedule | N/A | N/A | Vindas Álvaro's attenuated 30% | Vindas Álvaro's attenuated 30% | ||||||||
| Schedule of turnover - BRF's historical | 2024 | 2023 | 2024 | 2023 | ||||||||
| Demoraphic data | ||||||||||||
| Number of active participants | - | 1,015 | 93,575 | 92,120 | ||||||||
| Number of assisted beneficiary participants | 1,189 | 1,415 | - | - | ||||||||
| (1) | Includes retirement bonus and life insurance benefits. |
19.2.8 Expected benefit payments and average duration of obligations
The following amounts represent the expected benefit payments for future years (10 years), from the obligation of benefits granted and the average duration of the plan obligations:
| Payments | Medical plan | F.G.T.S. penalty | Award for length of service | Other | Total | |||||
| 2025 | 2,055 | 25,006 | 17,979 | 50,236 | 95,276 | |||||
| 2026 | 2,472 | 5,788 | 15,904 | 25,247 | 49,411 | |||||
| 2027 | 2,922 | 6,343 | 15,231 | 27,544 | 52,040 | |||||
| 2028 | 3,294 | 6,233 | 18,204 | 28,432 | 56,163 | |||||
| 2029 | 3,779 | 7,791 | 17,757 | 29,827 | 59,154 | |||||
| 2030 to 2034 | 26,569 | 46,271 | 80,764 | 275,565 | 429,169 | |||||
| Weighted average duration - in years | 15.20 | 5.10 | 4.80 | 7.64 |
19.2.9 Sensitivity analysis of post-employment plans
The Company prepared sensitivity analysis regarding the relevant assumptions of the plans as of December 31, 2024, as presented below:
| 97 |
| Financial Statements, Individual and Consolidated | 2024 a 2023 |
| Assumptions utilized | (+) Variation | (-) Variation | ||||||||
| Relevant assumptions | Average (%) | Actuarial liabilities | Average (%) | Actuarial liabilities | ||||||
| Medical plan | ||||||||||
| Discount rate | 9.61% | 11.43% | 52,860 | 9.43% | 71,376 | |||||
| Medical inflation | 6.60% | 7.60% | 71,411 | 5.60% | 52,721 | |||||
| Award for length of service | ||||||||||
| Discount rate | 10.66% | 11.66% | 106,477 | 9.66% | 116,108 | |||||
| Turnover | Historical | +3% | 95,576 | -3% | 131,456 | |||||
| F.G.T.S. penalty | ||||||||||
| Discount rate | 10.61% | 11.61% | 72,486 | 9.61% | 79,451 | |||||
| Wage growth rate | 3.50% | 4.50% | 76,423 | 2.50% | 75,170 | |||||
| Turnover | Historical | +3% | 65,196 | -3% | 90,708 | |||||
Accounting policy: The Company sponsors supplementary defined benefit and defined contribution pension plans, as well as other post-employment benefits for which an actuarial appraisal is annually prepared by an independent actuary and is reviewed by Management. The cost of defined benefits is established separately for each plan using the projected unit credit method. The measurements comprise the actuarial gains and losses, the effect of the limit on contributions and returns on the plan assets and are recognized in the financial position against Other Comprehensive Income when incurred, except Award for Length of Service, which its recognition occurs against statement of income. These measurements are not reclassified to statement of income in subsequent periods. The Company recognizes the net defined benefit asset when certain conditions are met. Past service costs are recognized in income for the year on the following dates, whichever comes first: · date of changing the plan or significantly reducing the expected length of service. · date in which the Company recognizes the costs related to restructuring. The cost of services and net interest on the value of the defined benefit liability or asset are recognized in the expense categories related to the function the beneficiary performs and to the financial result, respectively. |
| 98 |
| Financial Statements, Individual and Consolidated | 2024 a 2023 |
| 20. | Provision for Tax, Civil and Labor Risks |
The Company and its subsidiaries are involved in certain legal matters arising in the normal course of business, which include tax, social security, labor, civil and other processes.
Company’s Management believes that, based on the elements existing at the base date of these interim financial information, the provision for tax, social security, labor, civil and other risks, is sufficient to cover eventual losses with administrative and legal proceedings, as set forth below.
The roll-forward of the provisions for tax, social security, labor, civil and other risks, classified as with probable loss, and contingent liabilities is presented below:
| Parent company | |||||||||||||||||||
| Tax | Labor | Civil and other | Contingent liabilities (1) | Total | |||||||||||||||
| 12.31.24 | 12.31.23 | 12.31.24 | 12.31.23 | 12.31.24 | 12.31.23 | 12.31.24 | 12.31.23 | 12.31.24 | 12.31.23 | ||||||||||
| Beginning balance | 321,124 | 396,119 | 430,420 | 520,976 | 349,255 | 355,125 | 58,941 | 96,956 | 1,159,740 | 1,369,176 | |||||||||
| Additions | 1,158,454 | 100,454 | 320,983 | 357,821 | 50,265 | 55,716 | - | - | 1,529,702 | 513,991 | |||||||||
| Reversals | (126,200) | (63,542) | (161,135) | (239,496) | (42,774) | (48,317) | (8,111) | (38,015) | (338,220) | (389,370) | |||||||||
| Payments | (99,408) | (164,104) | (232,264) | (270,771) | (25,425) | (43,045) | - | - | (357,097) | (477,920) | |||||||||
| Interest | 83,134 | 52,197 | 70,155 | 61,890 | 33,815 | 29,776 | - | - | 187,104 | 143,863 | |||||||||
| Ending balance | 1,337,104 | 321,124 | 428,159 | 430,420 | 365,136 | 349,255 | 50,830 | 58,941 | 2,181,229 | 1,159,740 | |||||||||
| Current | 687,712 | 717,119 | |||||||||||||||||
| Non-current | 1,493,517 | 442,621 | |||||||||||||||||
| (1) | Contingent liabilities recognized at fair value as of the acquisition date, arising from the business combination with Sadia. |
| Consolidated | |||||||||||||||||||
| Tax | Labor | Civil and other | Contingent liabilities (1) | Total | |||||||||||||||
| 12.31.24 | 12.31.23 | 12.31.24 | 12.31.23 | 12.31.24 | 12.31.23 | 12.31.24 | 12.31.23 | 12.31.24 | 12.31.23 | ||||||||||
| Beginning balance | 321,995 | 399,675 | 435,929 | 526,710 | 352,414 | 358,304 | 92,832 | 130,848 | 1,203,170 | 1,415,537 | |||||||||
| Additions | 1,160,051 | 100,454 | 325,086 | 359,512 | 53,061 | 55,734 | - | - | 1,538,198 | 515,700 | |||||||||
| Reversals | (126,200) | (66,405) | (163,016) | (240,152) | (42,922) | (48,480) | (8,111) | (38,016) | (340,249) | (393,053) | |||||||||
| Payments | (99,408) | (164,104) | (232,264) | (270,771) | (25,425) | (43,045) | - | - | (357,097) | (477,920) | |||||||||
| Interest | 83,228 | 52,426 | 70,376 | 62,135 | 34,169 | 30,128 | - | - | 187,773 | 144,689 | |||||||||
| Exchange rate variation | - | (51) | 311 | (1,505) | 8 | (227) | - | - | 319 | (1,783) | |||||||||
| Ending balance | 1,339,666 | 321,995 | 436,422 | 435,929 | 371,305 | 352,414 | 84,721 | 92,832 | 2,232,114 | 1,203,170 | |||||||||
| Current | 692,650 | 720,187 | |||||||||||||||||
| Non-current | 1,539,464 | 482,983 | |||||||||||||||||
| (1) | Contingent liabilities recognized at fair value as of the acquisition date, arising from the business combination with Sadia, Hercosul and Mogiana. |
| 20.1 | Contingencies with probable losses |
20.1.1 Tax
The tax contingencies classified as probable losses relate to the following main legal proceedings:
ICMS: The Company is involved in administrative and judicial disputes related to the ICMS tax on the acquisition of goods for consumption and fixed assets, presumed credit, credit on electrical energy consumed in distribution center, lack of proof of export within the legal deadline, defeat, tax substitution, isolated fines, rate increase and others, in the amount of R$73,763 (R$87,661 on December 31, 2023).
PIS and COFINS: The Company is involved in administrative and judicial disputes related to the use of certain tax credits arising from the acquisition of supplies to offset federal taxes payable, in the amount of R$128,681 (131,271 as of December 31, 2023).
IRPJ/CSLL: The Company is discussing in court the full offsetting of tax benefits and negative CSLL calculation bases from the 2012 calendar year, in the amount of R$977,277, which includes fines, interest and legal charges.
| 99 |
| Financial Statements, Individual and Consolidated | 2024 a 2023 |
Other tax contingencies: The Company has other provisions for tax claims related to the payment of social security contribution, INCRA, debts included in the government regularization program (REFIS) with deposits awaiting consolidation and conversion into payment, differences in supplementary fiscal obligations, disputes related to presumed IPI credit, revenue omission - IRPJ estimate, import taxes, IOF and others, in the amount of R$159,945 (R$103,063 as of December 31, 2023).
20.1.1 Labor
The Company is defendant in several labor claims either filed by individuals or by the Public Prosecutors Office, mainly related to overtime, thermal rest, unhealthy environment, occupational accidents, among others. None of these claims is individually significant. The Company recorded a provision based on history of payments, statistical models and on prognosis of loss.
20.1.2 Civil and others
Civil and other (environmental, administrative, regulatory, real estate, etc.) contingencies are mainly related to litigations containing allegations of contractual breaches and noncompliance of legal obligations of several natures as disputes arising from contracts in general, intellectual property disputes, regulatory issues, environmental and real state, consumer relations, among others. The claims are mostly for compensation of losses and damages, application of penalties and compliance with obligations to do or not to do.
| 20.2 | Contingencies with possible losses |
The Company is involved in contingencies for which losses are possible, in accordance with the assessment prepared by Management with support from legal advisors. On December 31, 2024, the total amount of contingencies classified as possible was R$22,388,927 (R$18,627,512 as of December 31, 2023), of which solely the ones arising from the business combination with Sadia, Hercosul and Mogiana are provisioned, measured by the estimated fair value at the business combination date: R$84,721 (R$92,832 as of December 31, 2023). The remaining possible contingencies are presented below.
20.2.1 Tax
The tax contingencies for which losses have been assessed as possible amounted to R$19,881,466 as of December 31, 2024 (R$16,082,532 as of December 31, 2023). The most relevant cases are set forth below
PIS and COFINS: The Company discusses alleged differences charged under PIS/COFINS on: (i) sales of seasoned meats, pasta and pies; (ii) presumed ICMS credits; (iii) extemporaneous adjustments to the reduction in the calculation base relating to the ICMS subsidy and additional ICMS; (iv) disallowances of extemporaneous credits on marketing, rebates, commercial representation, employee benefits, food vouchers, medical assistance, transport vouchers, vaccines, medicines, fixed assets, wood shavings, fuels and lubricants, disinfectants and cleaning products; and (v) disallowances of ordinary credits on freight in the transfer of finished products, cross docking, port expenses, maintenance materials, exempt inputs, suspended inputs, presumed credits from agro-industrial activities and disallowances on other goods and services due to the RFB's restriction of the concept of inputs, totaling R$12,863,154 (R$8,740,838 on December 31, 2023).
| 100 |
| Financial Statements, Individual and Consolidated | 2024 a 2023 |
ICMS: The Company is involved in disputes processes totaling R$4,440,884 (R$4,042,445 as of December 31, 2023) related to: (i) non-acceptance of ICMS credits in interstate sales from states that unilaterally granted fiscal benefits without the approval of the National Finance Policy Council (“CONFAZ”), the so-called “guerra fiscal” in the amount of R$14,541 (R$17.464 as of December 31, 2023); (ii) lack of evidence of exports in the amount of R$84,305 (R$67,766 as of December 31, 2023); (iii) infraction notices from State of Rio de Janeiro, for the period from 2014 to 2018, related to the supposed non-compliance of Agreement Terms (“TARE”) regarding tax benefits, in the amount of R$698,006 (R$680,058 as of December 31, 2023); (iv) Public Civil Action in Rio de Janeiro due do the use of tax benefits, in the amount of R$330,417 (R$306,060 as of December 31, 2023); (v) R$3,313,615 (R$2,760,221 on December 31, 2023) related to other claims, highlighting the debts related to (a) supposed differences in tax substitution in the amount of R$549,890; (b) disallowance of presumed ICMS credit arising from tax benefit provided for in PRODEPE due to alleged non-compliance with ancillary obligations in the amount of R$371,369; (c) disallowance of presumed credit on transfers as the Tax Authorities understand that the PRODEIC benefit only applies to sales transactions in the amount of R$260,924; (d) disallowance of ICMS credit on entries for transfer of goods intended for commercialization on the grounds that the calculation basis used would have been higher than the production cost defined in complementary law 87/96 (art. 13, § 4) in the amount of R$238,801 and (e) disallowance of ICMS credit on intermediate materials that the Tax Authorities classified as use and consumption in the amount of R$ 315,880; and (f) disallowance of presumed ICMS credit supposedly above the limit set out in Santa Catarina legislation in the amount of R$315,559.
IRPJ/CSLL: The Company is involved in administrative and judicial disputes related to refunds and compensation of negative income tax and social contribution balances, including because of the recognition of a court decision relating to the Plan. Contingencies relating to these taxes total R$390,435 (R$1,468,810 as of December 31, 2023).
Profits earned abroad: The Company was assessed by the Brazilian Federal Revenue for alleged underpayment of income tax and social contribution on profits earned by its subsidiaries located abroad, in a total amount of R$974,964 (R$837,060 as of December 31, 2023). The Company’s legal defense is based on the facts that the subsidiaries located abroad are subject exclusively to the full taxation in the countries in which they are based because of the treaties signed to avoid double taxation.
IPI: The Company disputes administratively and judicially the denial of compensation of presumed IPI credits resulting from purchases of duty-free goods and secondary items. Such discussed cases totaled the amount of R$155,766 (R$168,212 as of December 31, 2023).
Social security taxes: The Company disputes cases related to the charges of social security on payroll, employees profit sharing, GILRAT additional for special retirement financing, SAT/RAT, as well as other cases, in a total amount of R$730,647 (R$671,699 as of December 31, 2023).
Other contingencies: The Company disputes cases related to the isolated fine for alleged non-compliance with ancillary obligations, customs fine on importation, alleged lack of proof of drawback, disallowance of reinstatement credit, and alleged differences in property tax, fees and services tax totaling R$176,783 (R$153,469 as of December 31, 2023). The Company's subsidiaries have various other tax contingencies totaling R$148,354.
| 101 |
| Financial Statements, Individual and Consolidated | 2024 a 2023 |
| 20.2.2 | Labor |
On December 31, 2024, the labor contingencies assessed as possible loss totaled R$331,877 (R$304,133 as of December 31, 2023).
| 20.2.3 | Civil and others |
Civil and other contingencies (of an environmental, administrative, regulatory, real estate nature, etc.) with possible losses total R$2,175,584 (R$2,240,847 as on December 31, 2023) and are mostly disputes arising from allegations of breach of contract and allegations of non-compliance with legal obligations of various kinds, such as disputes arising from contracts in general, controversies relating to intellectual property, administrative and regulatory issues, environmental, real estate, consumer relations, among other topics. They mainly discuss claims for damages, penalties and obligations to do or not to do.
Accounting policy: The provisions are recognized when the Company has: i) a present obligation, formalized or not, because of a past event, ii) the outflow of resources to settle the obligation is likely to occur and iii) a reliable estimate can be made. The Company is involved in several legal and administrative procedures, mainly in Brazil. Assessments of the likelihood of loss in these lawsuits include an analysis of the available evidences, the hierarchy of laws, the available jurisprudence, the most recent court decisions and their relevance in the legal system, as well as the assessment of outside lawyers. Provisions are reviewed and adjusted to reflect changes in circumstances, such as the applicable limitation period, conclusions of tax inspections or additional exposures identified based on new matters or court decisions. Furthermore, provisions are monetarily adjusted against financial income (expenses), net, except in situations where the characteristics and risks are similar, where the complementary amounts of interest and charges follow the classification of the principal amount in aggregate. In cases where there are a large number of lawsuits and the amounts are not individually relevant, the Company uses historical studies to determine the probability and amounts of losses. Contingent liabilities from business combinations are recognized if they arise from a present obligation that arose from past events and if their fair value can be measured reliably. The initial measurement is done by the fair value and subsequent measurements by the higher value between: the fair value on its acquisition date; and the amount by which the provision would be recognized. |
| 21. | Equity |
| 21.1 | Capital stock |
On December 31, 2024, the subscribed and paid capital of the Company was R$13,653,418, which is composed of 1,682,473,246 common book-entry shares with no par value. The value of the capital stock is net of the public offering expenses of R$304,262, which covers the period from 2009 to 2024.
| 21.1.1 | Breakdown of capital stock by nature |
The shareholding position of the shareholders holding more than 5% of the voting stock, management and members of the Board of Directors is presented below:
| 102 |
| Financial Statements, Individual and Consolidated | 2024 a 2023 |
| 12.31.24 | 12.31.23 | |||||||
| Shareholders | Quantity | % | Quantity | % | ||||
| Major shareholders | ||||||||
| Marfrig Global Foods S.A. | 849,526,130 | 50.49 | 842,165,702 | 50.06 | ||||
| Salic | 185,556,900 | 11.03 | 180,000,000 | 10.70 | ||||
| Kapitalo Investimentos Ltda. | - | - | 107,982,757 | 6.42 | ||||
| Caixa de Previd. dos Func. do Banco do Brasil | 103,328,121 | 6.14 | 103,328,121 | 6.14 | ||||
| Management | ||||||||
| Board of Directors | 4,300 | 0.00 | 518,900 | 0.03 | ||||
| Executives | 256,099 | 0.02 | 626,458 | 0.04 | ||||
| Fiscal Council | 29,400 | 0.00 | 32,700 | 0.00 | ||||
| Treasury shares | 61,629,171 | 3.66 | 3,817,179 | 0.23 | ||||
| Other | 482,143,125 | 28.66 | 444,001,429 | 26.38 | ||||
| 1,682,473,246 | 100.00 | 1,682,473,246 | 100.00 | |||||
| 21.1.2 | Roll-forward of outstanding shares |
Outstanding shares are determined by the number of common shares reduced by the number of shares held in treasury.
| Parent company | |||
| 12.31.24 | 12.31.23 | ||
| Common shares | 1,682,473,246 | 1,682,473,246 | |
| Treasury shares | (61,629,171) | (3,817,179) | |
| Outstanding shares | 1,620,844,075 | 1,678,656,067 | |
| 21.2 | Capital reserves |
| Parent company and Consolidated | |||||
| 12.31.24 | 12.31.23 | ||||
| Capital reserves | 2,763,364 | 2,763,364 | |||
| Other equity transactions | (141,608) | (70,106) | |||
| Share-based payments | 131,872 | 203,374 | |||
| Acquisition of non-controlling interest | (273,260) | (273,260) | |||
| Capital transactions with controlled entities | (220) | (220) | |||
| 21.3 | Treasury shares |
The movement in treasury shares in the period ended December 31, 2024 are shown below:
| 103 |
| Financial Statements, Individual and Consolidated | 2024 a 2023 |
| Parent company | |||
| Quantity of outstanding of shares | |||
| 12.31.24 | 12.31.23 | ||
| Shares at the beggining of the year | 3,817,179 | 4,356,397 | |
| Repurchase of shares | 59,835,200 | - | |
| Delivery of restricted shares | (2,023,208) | (539,218) | |
| Shares at the end of the year (1) | 61,629,171 | 3,817,179 | |
(1) Treasury shares are recorded at an average cost, in units of reais, of R$21.84 per share.
| 21.3.1 | Repurchase of shares |
On December 7, 2023, the Company's Board of Directors approved the creation of a program for the acquisition of shares issued by the Company up to the limit of 14,000,000 common shares, within a maximum period of 18 months (“Program I”), which was completed on April 4, 2024.
On May 7, 2024, the Company's Board of Directors approved the creation of a new program for the acquisition of shares issued by the Company up to the limit of 14,000,000 common shares, within a maximum period of 18 months (“Program II”).
On August 14, 2024, the Company's Board of Directors authorized the acquisition of up to an additional 17,000,000 shares in addition to the amount already repurchased by the Company, with the other conditions of the Repurchase Program II remaining unchanged.
On November 13, 2024, the Company's Board of Directors authorized the acquisition of an additional 30,000,000 shares to the amount already repurchased by the Company, with the other conditions of Program II remaining unchanged.
The share repurchase was as follows:
| 2024 | ||||||||||||||
| Jan - mar | Apr - jun | Jul - sep | Oct - dec | Total | Subsequent events | Total | ||||||||
| Program I | ||||||||||||||
| Number of shares acquired | 10,219,600 | 3,780,400 | - | - | 14,000,000 | - | 14,000,000 | |||||||
| Average unit price (in units of reais) | 13.22 | 16.15 | - | - | 14.01 | - | 14.01 | |||||||
| Total value | 135,095 | 61,042 | - | - | 196,137 | - | 196,137 | |||||||
| Program II | ||||||||||||||
| Number of shares acquired | - | 8,131,900 | 20,380,900 | 17,322,400 | 45,835,200 | 6,544,000 | 52,379,200 | |||||||
| Average unit price (in units of reais) | - | 18.71 | 24.33 | 25.64 | 23.83 | 23.59 | 23.80 | |||||||
| Total value | - | 152,138 | 495,847 | 444,120 | 1,092,105 | 154,402 | 1,246,507 | |||||||
| Number of shares acquired | 10,219,600 | 11,912,300 | 20,380,900 | 17,322,400 | 59,835,200 | 6,544,000 | 66,379,200 | |||||||
| Average unit price (in units of reais) | 13.22 | 17.90 | 24.33 | 25.64 | 21.53 | 23.59 | 21.73 | |||||||
| Total value | 135,095 | 213,180 | 495,847 | 444,120 | 1,288,242 | 154,402 | 1,442,644 |
| 104 |
| Financial Statements, Individual and Consolidated | 2024 a 2023 |
| 21.4 | Shareholder’s remuneration |
| Parent company | |
| 12.31.24 | |
| Net profit | 3,213,274 |
| Legal reserve (5.0%) | (160,664) |
| Tax incentive reserve | (639,741) |
| Interest on shareholders' equity calculation base | 2,412,869 |
| Minimum mandatoryinterest on shareholders' equity (25.0%) | 603,217 |
| Remuneration of shareholders' exceeding the mandatory minimum | 542,782 |
| Total remuneration of shareholders' in the year, as interest on shareholders' equity | 1,145,999 |
| Withholding income tax on interest on shareholders' equity | (150,778) |
| Remuneration of shareholders', net of withholding income tax | 995,221 |
| Percentage of calculation base | 47.5% |
| Total remuneration of shareholders' outstanding | 1,145,999 |
| Withholding income tax on interest on shareholders' equity | (150,778) |
| Remaining amounts outstanding | (1,686) |
| Interest on shareholders' equity outstanding | 993,535 |
On December 5, 2024, a net IRRF payment of R$821,605 was made, referring to the interest on equity approved by the Board of Directors on November 13, 24.
On December 30, 2024, a net payment of IRRF of R$173,616 was made, relating to interest on equity approved by the Board of Directors on 12.04.24.
| 105 |
| Financial Statements, Individual and Consolidated | 2024 a 2023 |
| 21.5 | Allocation of income |
| Limit on | Net income for distribution | Income reserve balances | ||||
| capital % | 12.31.24 | 12.31.24 | ||||
| Income for the year | 3,213,274 | - | ||||
| Actuarial gain | - | 11,978 | - | |||
| Interest on shareholdes' equity | - | (1,145,999) | - | |||
| Legal reserve | 20.0 | (160,664) | 160,664 | |||
| Capital increase reserve | 20.0 | (482,573) | 482,573 | |||
| Reserve for expansion | 80.0 | (796,275) | 796,275 | |||
| Reserve for tax incentives | - | (639,741) | 639,741 |
| 21.6 | Profit reserves |
Legal reserve: constituted on the basis of 5.0% of net profit for the year under the terms of article 193 of Law 6.404/76, amended by Law 11.638/07, limited to 20% of share capital. On 12.31.24, the balance of this reserve corresponded to 1.0% of the share capital (nil on December 31, 2023).
Reserve for capital increase: set up on the basis of 20.0% of net profit for the year, limited to 20.0% of share capital. On December 31, 2024, the balance of this reserve corresponded to 3.6% of share capital (nil on December 31, 2023).
Reserve for expansion: set up to 50.0% of net profit for the year to meet expansion plans, limited to 80.0% of share capital. On December 31, 2024, the balance of this reserve corresponded to 6.0% of share capital (nil on December 31, 2023).
Tax incentive reserve: set up under the terms of article 195-A of Law 6.404/76, amended by Law 14.789/23, based on the value of government donations or subsidies for investments.
Accounting policy: The distribution of interest on equity and dividends is calculated based on corporate legislation and the Company's Bylaws and Profit Allocation Policy. For the purposes of presenting the financial statements, interest on equity is shown as an allocation of profit directly in equity. |
| 106 |
| Financial Statements, Individual and Consolidated | 2024 a 2023 |
| 22. | Earnings (Loss) per Share |
| 12.31.24 | 12.31.23 | |||
| Basic numerator | ||||
| Net income (loss) for the period attributable to controlling shareholders | 3,213,274 | (2,028,559) | ||
| Basic denominator | ||||
| Common shares | 1,682,473,246 | 1,682,473,246 | ||
| Weighted average number of outstanding shares - basic | 1,653,093,656 | 1,360,268,402 | ||
| Net income (loss) per share basic - R$ | 1.94379 | (1.49129) | ||
| Diluted numerator | ||||
| Net income (loss) for the period attributable to controlling shareholders | 3,213,274 | (2,028,559) | ||
| Diluted denominator | ||||
| Weighted average number of outstanding shares - basic | 1,653,093,656 | 1,360,268,402 | ||
| Number of potential shares | 2,407,480 | - | ||
| Weighted average number of outstanding shares - diluted | 1,655,501,136 | 1,360,268,402 | ||
| Net income (loss) per share diluted - R$ | 1.94097 | (1.49129) |
Accounting policy: The basic earnings (losses) per share are calculated by dividing the earnings (losses) attributable to the owners of ordinary shares, by the weighted average quantity of ordinary shares outstanding during the year. The diluted earnings (losses) per share are calculated by dividing the earnings (losses) attributable to the owners of ordinary shares by the weighted average quantity of ordinary shares outstanding during the year summed to the weighted average quantity of ordinary shares that would be available on the conversion of all potential dilutive ordinary shares (restricted shares within the share-based payment plans). |
| 23. | Financial Instruments and Risk Management |
| 23.1 | Overview |
In the ordinary course of business, the Company is exposed to credit, liquidity and market risks, which are actively managed in compliance with the Financial Risk Management Policy (“Risk Policy”) and internal guidelines and strategic documents subject to such policy. The Risk Policy was approved by the Board of Directors on December 7, 2023, valid for one year and is available at the Company’s website.
| 107 |
| Financial Statements, Individual and Consolidated | 2024 a 2023 |
The Company’s risk management strategy, guided by the Risk Policy, has as main objectives:
| » | To protect the Company’s operating and financial results, as well as its equity from adverse changes in the market prices, particularly commodities, foreign exchange and interests; |
| » | To protect the Company against counterparty risks in existing financial operations as well as to establish guidelines for sustaining the necessary liquidity to fulfil its financial commitments; |
| » | To protect the cash of Company against price volatilities, adverse conditions in the markets in which the Company acts and adverse conditions in its production chain. |
The Risk Policy defines the governance of the bodies responsible for the execution, tracking and approval of the risk management strategies, as well as the limits and instruments that can be used.
Additionally, the Management of the Company approved the following policies on November 10, 2021, which are available at the Company’s website:
| » | Financial Policy, which aims to: (i) establish guidelines for the management of the Company's financial debt and capital structure; and (ii) guide the Company's decision-making in connection with cash management (financial investments). |
| » | Profit Allocation Policy, which aims to establish the practices adopted by the Company regarding the allocation of its profits, providing, among others, the periodicity of payment of dividends and the baseline used to establish the respective amount. |
i) Indebtedness
The ideal capital structure definition at BRF is essentially associated with (i) strong cash position as a tolerance factor for liquidity shocks, which includes minimum cash analysis; (ii) net indebtedness; and (iii) minimization of the capital opportunity cost.
On December 31, 2024, the non-current consolidated gross debt, as presented below, represented 92.63% (87.65% as of December 31, 2023) of the total gross debt, which has an average term higher than 8.4 years.
The Company monitors the gross debt and net debt as set forth below:
| Consolidated | |||||||
| 12.31.24 | 12.31.23 | ||||||
| Current | Non-current | Total | Total | ||||
| Foreign currency loans and borrowings | (844,601) | (11,555,811) | (12,400,412) | (11,093,385) | |||
| Local currency loans and borrowings | (385,672) | (7,954,464) | (8,340,136) | (9,002,163) | |||
| Derivative financial instruments, net | (319,943) | 15,364 | (304,579) | 502,293 | |||
| Gross debt | (1,550,216) | (19,494,911) | (21,045,127) | (19,593,255) | |||
| Cash and cash equivalents | 11,165,364 | - | 11,165,364 | 9,264,664 | |||
| Marketable securities | 894,080 | 323,811 | 1,217,891 | 767,873 | |||
| Restricted cash | 276,025 | 60,790 | 336,815 | 86,209 | |||
| 12,335,469 | 384,601 | 12,720,070 | 10,118,746 | ||||
| Net debt | 10,785,253 | (19,110,310) | (8,325,057) | (9,474,509) | |||
| 108 |
| Financial Statements, Individual and Consolidated | 2024 a 2023 |
ii) Derivative financial instruments
Summarized financial position of derivative financial instruments, that aim to protect the risks described below:
| Parent company | Consolidated | |||||||
| Note | 12.31.24 | 12.31.23 | 12.31.24 | 12.31.23 | ||||
| Assets | ||||||||
| Designated as hedge accounting | ||||||||
| Foreign exchange risk on operating income | 23.2.1 ii) | 35,484 | 103,558 | 35,484 | 103,558 | |||
| Commodities price risk | 23.2.2 | 20,727 | 5,510 | 20,727 | 5,510 | |||
| Interest rate risk | 23.2.3 | 251,795 | 529,830 | 251,795 | 529,830 | |||
| Not designated as hedge accounting | ||||||||
| Foreign exchange risk on statement of financial position | 23.2.1 i) | 6,597 | 154 | 6,597 | 154 | |||
| 314,603 | 639,052 | 314,603 | 639,052 | |||||
| Current assets | 63,033 | 109,222 | 63,033 | 109,222 | ||||
| Non-current assets | 251,570 | 529,830 | 251,570 | 529,830 | ||||
| Liabilities | ||||||||
| Designated as hedge accounting | ||||||||
| Foreign exchange risk on statement of financial position | 23.2.1 i) | - | (52,149) | - | (52,149) | |||
| Foreign exchange risk on operating income | 23.2.1 ii) | (360,557) | (7,600) | (360,557) | (7,600) | |||
| Commodities price risk | 23.2.2 | (22,102) | (14,363) | (22,102) | (14,363) | |||
| Interest rate risk | 23.2.3 | (236,523) | - | (236,523) | - | |||
| Not designated as hedge accounting | ||||||||
| Foreign exchange risk on statement of financial position | 23.2.1 i) | - | (59,819) | - | (62,647) | |||
| (619,182) | (133,931) | (619,182) | (136,759) | |||||
| Current liabilities | (382,976) | (74,112) | (382,976) | (76,940) | ||||
| Non-current liabilities | (236,206) | (59,819) | (236,206) | (59,819) | ||||
| Position of derivative financial instruments - net | (304,579) | 505,121 | (304,579) | 502,293 | ||||
iii) Financial commitments
The table below summarizes the significant commitments and contractual obligations that may impact the Company’s liquidity:
| Parent company | |||||||||||||||
| 12.31.24 | |||||||||||||||
| Book value | Contractual cash flow | 2025 | 2026 | 2027 | 2028 | 2029 | 2030 onwards | ||||||||
| Non derivative financial liabilities | |||||||||||||||
| Loans and borrowings | 17,780,242 | 29,265,857 | 1,808,397 | 1,851,336 | 3,515,982 | 2,044,261 | 1,608,760 | 18,437,121 | |||||||
| Principal | 18,541,379 | 683,568 | 756,514 | 2,476,425 | 1,168,583 | 800,997 | 12,655,292 | ||||||||
| Interest | 10,724,478 | 1,124,829 | 1,094,822 | 1,039,557 | 875,678 | 807,763 | 5,781,829 | ||||||||
| Trade accounts payable | 12,239,246 | 12,424,658 | 12,410,948 | 13,710 | - | - | - | - | |||||||
| Lease liabilities | 3,593,701 | 4,521,930 | 905,454 | 741,169 | 653,676 | 497,557 | 456,444 | 1,267,630 | |||||||
| Derivative financial liabilities | |||||||||||||||
| Financial instruments designated hedge accounting for protection of: | |||||||||||||||
| Interest rate risk | 236,523 | (236,522) | - | - | - | - | - | (236,522) | |||||||
| Foreign exchange risk | 360,557 | 360,557 | 360,557 | - | - | - | - | ||||||||
| Commodities price risk | 22,102 | 22,102 | 22,102 | - | - | - | - | - | |||||||
| 109 |
| Financial Statements, Individual and Consolidated | 2024 a 2023 |
| Consolidated | |||||||||||||||
| 12.31.24 | |||||||||||||||
| Book value | Contractual cash flow | 2025 | 2026 | 2027 | 2028 | 2029 | 2030 onwards | ||||||||
| Non derivative financial liabilities | |||||||||||||||
| Loans and borrowings | 20,740,548 | 32,496,796 | 2,246,762 | 4,639,324 | 3,520,568 | 2,044,261 | 1,608,760 | 18,437,121 | |||||||
| Principal | 21,529,249 | 984,119 | 3,440,204 | 2,480,054 | 1,168,583 | 800,997 | 12,655,292 | ||||||||
| Interest | 10,967,547 | 1,262,643 | 1,199,120 | 1,040,514 | 875,678 | 807,763 | 5,781,829 | ||||||||
| Trade accounts payable | 13,570,050 | 13,764,240 | 13,750,530 | 13,710 | - | - | - | - | |||||||
| Lease liabilities | 3,992,929 | 5,000,443 | 1,084,328 | 821,985 | 716,566 | 539,245 | 472,328 | 1,365,991 | |||||||
| Derivative financial liabilities | |||||||||||||||
| Financial instruments designated hedge accounting for protection of: | |||||||||||||||
| Interest rate risk | 236,523 | (236,522) | - | - | - | - | - | (236,522) | |||||||
| Foreign exchange risk | 360,557 | 360,557 | 360,557 | - | - | - | - | - | |||||||
| Commodities price risk | 22,102 | 22,102 | 22,102 | - | - | - | - | - | |||||||
The Company does not expect that the cash outflows to fulfill the obligations shown above will be significantly anticipated by factors unrelated to its best interests, or have its value substantially modified outside the normal course of business.
| 23.2 | Market risk management |
| 23.2.1 | Foreign exchange risk |
The risk is the one that may cause unexpected losses to the Company resulting from volatility of the FX rates, reducing its assets and revenues, or increasing its liabilities and costs. The Company’s exposure is managed in three dimensions: statement of financial position exposure, operating income exposure and investments exposure.
i) Statements of financial position exposure
The Risk Policy regarding statement of financial position exposure has the objective to balance assets and liabilities denominated in foreign currencies, hedging the Company’s statement of financial position by using natural hedges, over-the-counter derivatives and exchange traded futures.
Assets and liabilities denominated in foreign currency for which the exchange variations are recognized in the Financial Results are as follows, summarized in Brazilian Reais (R$):
| Consolidated | ||||
| 12.31.24 | 12.31.23 | |||
| Cash and cash equivalents | 4,276,065 | 2,970,268 | ||
| Trade accounts receivable | 6,238,093 | 4,788,635 | ||
| Trade accounts payable | (1,377,169) | (1,195,133) | ||
| Loans and borrowings | (9,726,343) | (8,715,484) | ||
| Other assets and liabilities, net | 1,570,012 | (30,310) | ||
| Exposure of assets and liabilities in foreign currencies | 980,658 | (2,182,024) | ||
| Derivative financial instruments (hedge) | (773,197) | 2,033,346 | ||
| Exposure in result, net | 207,461 | (148,678) | ||
| 110 |
| Financial Statements, Individual and Consolidated | 2024 a 2023 |
The net exposure in Reais is mainly composed of the following currencies:
| Net Exposure (1) | 12.31.24 | 12.31.23 | ||
| U.S. Dollars (USD) | (2,052,569) | (513,164) | ||
| Euros (EUR) | 1,879,079 | (25,050) | ||
| Yen (JPY) | (1,501) | (1,241) | ||
| Angolan kwanza (AOA) | 36,366 | 97,368 | ||
| Turkish Liras (TRY) | 267,834 | 76,439 | ||
| Argentinian Peso (ARS) | (2,125) | (3,146) | ||
| Chilean Pesos (CLP) | 80,377 | 220,116 | ||
| Total | 207,461 | (148,678) |
(1) The Company is exposed to other currencies, although they have been grouped in the currencies above due to its high correlation or for not being individually significant.
The Company holds more financial liabilities in foreign currencies than assets and, therefore, holds derivative financial instruments to reduce such exposure.
As a result of this protection strategy the Company recognized as Financial Expenses in the Consolidated an expense of foreign exchange of derivatives of R$198,107 for the year ended on December 31, 2024 (expense of R$312,201 during the year ended on December 31, 2023). The foreign exchange of assets and liabilities in Consolidated was income of R$123,681 in the year ended on December 31, 2024 (income R$161,154 in the year ended on December 31, 2023).
The derivative financial instruments acquired to hedge the foreign currency statement of financial position exposure on December 31, 2024, and are set forth below:
| 12.31.24 | |||||||||||||
| Derivative instruments not designated | Asset | Liability | Maturity | Notional | Exercise rate | Fair value (R$) | |||||||
| Parent company and consolidated | |||||||||||||
| Non-deliverable forward | BRL | EUR | 1st Qtr. 2025 | EUR | (60,000) | 6.5610 | 1,040 | ||||||
| Non-deliverable forward | USD | CLP | 1st Qtr. 2025 | CLP | 25,000 | 962.4800 | 4,425 | ||||||
| Futures | BRL / USD | USD / BRL | 1st Qtr. 2025 | USD | (62,500) | 6.1923 | 1,132 | ||||||
| 6,597 | |||||||||||||
ii) Operating income exposure
The Risk Policy regarding operating income exposure has the objective to hedge revenues and costs denominated in foreign currencies. The Company is supported by internal models to measure and monitor these risks, and uses financial instruments for hedging, designating the relations as cash flow hedges.
The Company has more sales in foreign currency than expenditures and, therefore, holds derivative financial instruments to reduce such exposure.
As a result of this protection strategy, the Company recognized in the Consolidated Net Revenue an expense of R$236,988 for the year ended on December 31, 2024 (revenue of R$303,387 during the year ended on December 31, 2023). Additionally, in the second quarter of 2023, the loan of Bond BRF SA BRFSBZ 3.95, designated as an export protection instrument, was settled and the amount of R$(548,639) previously accumulated in Other Comprehensive Income was reclassified to income for the year under Net Revenue.
| 111 |
| Financial Statements, Individual and Consolidated | 2024 a 2023 |
The derivative financial instruments designated as cash flow hedges for foreing exchange operating income exposure on December 31, 2024 are set forth below:
| 12.31.24 | |||||||||||||||
| Cash flow hedge - Derivative instruments | Hedged object | Asset | Liability | Maturity | Notional | Designation rate | Fair value (1) | ||||||||
| Parent company and consolidated | |||||||||||||||
| Non-deliverable forward | USD Exports | BRL | USD | 1st Qtr. 2025 | USD | 105,500 | 5.6807 | (58,721) | |||||||
| Non-deliverable forward | USD Exports | BRL | USD | 2nd Qtr. 2025 | USD | 258,500 | 5.9204 | (104,650) | |||||||
| Non-deliverable forward | USD Exports | BRL | USD | 3rd Qtr. 2025 | USD | 165,000 | 6.1309 | (54,315) | |||||||
| Non-deliverable forward | USD Exports | BRL | USD | 4th Qtr. 2025 | USD | 82,000 | 6.4083 | (15,657) | |||||||
| Collar | USD Exports | BRL | USD | 1st Qtr. 2025 | USD | 479,500 | 5.9991 | (81,092) | |||||||
| Collar | USD Exports | BRL | USD | 2nd Qtr. 2025 | USD | 90,500 | 6.2590 | (5,787) | |||||||
| Collar | USD Exports | BRL | USD | 3rd Qtr. 2025 | USD | 42,500 | 6.4616 | (3,204) | |||||||
| Collar | USD Exports | BRL | USD | 4th Qtr. 2025 | USD | 20,000 | 6.5806 | (1,647) | |||||||
| 1,243,500 | (325,073) | ||||||||||||||
(1) Corresponds to the unrealized portion of the hedge result recorded under Other Comprehensive Income.
iii) Investments exposure
The Company holds both investments (net assets) and loans (financial liabilities) denominated in foreign currency. To balance the accounting effects of such exposures, some non-derivative financial liabilities are designated as hedging instruments for the investments exposure.
As a result of this strategy, the Company recognized expense of R$339,101, net of income tax, under Other comprehensive income in the year ended on December 31, 2024 (income of R$145,328 in the year ended on December 31, 2023).
The non-derivative financial instruments designated as net investment hedge instruments on December 31, 2024 are set forth below:
| 12.31.24 | |||||||||||||
| Net investment hedge - Non-derivative instruments | Object (Investment) | Liability | Maturity | Notional | Rate | Exchange variation (1) | |||||||
| Parent company and consolidated | |||||||||||||
| Bond - BRF SA BRFSBZ 4.35 | Federal Foods LLC | USD | 3rd Qtr. 2050 | USD (2) | 44,158 | 3.7649 | (142,067) | ||||||
| Bond - BRF SA BRFSBZ 4.35 | BRF Kuwait Food Management Company WLL | USD | 3rd Qtr. 2050 | USD (2) | 88,552 | 3.7649 | (215,832) | ||||||
| Bond - BRF SA BRFSBZ 4.35 | Al Khan Foodstuff LLC | USD | 3rd Qtr. 2050 | USD (2) | 53,446 | 3.7649 | (142,392) | ||||||
| Bond - BRF SA BRFSBZ 4.35 | BRF Foods GmbH | USD | 3rd Qtr. 2050 | USD (3) | 170,721 | 5.1629 | (197,505) | ||||||
| Bond - BRF SA BRFSBZ 4.35 | Al-Wafi Al-Takamol International for Foods Products | USD | 3rd Qtr. 2050 | USD (3) | 23,426 | 5.1629 | (23,009) | ||||||
| 380,303 | (720,805) | ||||||||||||
(1) Corresponds to the effective portion of the hedge result accumulated in Other Comprehensive Income.
(2) Designated on August 1st, 2019.
(3) Designated on November 9, 2022.
| 23.2.2 | Commodities price risk |
The Company uses commodities as production inputs and is exposed to commodities price risk arising from future purchases. The management of such risk is performed through physical inventories, future purchases at fixed price and through derivative financial instruments.
| 112 |
| Financial Statements, Individual and Consolidated | 2024 a 2023 |
The Risk Policy establishes coverage limits to the flow of purchases of corn, meal and soy, soybeans and soybean oil with the purpose of reducing the impact due to a price increase of these raw materials. The hedge may be reached using derivatives or by inventory management.
As a result of this protection strategy the Company recognized in the Consolidated Cost of goods sold an expense of R$121,873 for year ended on December 31, 2024 (expense of R$103,305 during the year ended on December 31, 2023).
The Company performs purchases at variable prices in future and spot markets and, to hedge such exposure, it holds derivative financial instruments in long position (buy) to fix these prices in advance.
The financial instruments designated as cash flow hedges for the variable commodities price exposure on December 31, 2024, are set forth below:
| 12.31.24 | |||||||||||||
| Cash flow hedge - Derivative instruments | Hedged object | Index | Maturity | Quantity | Exercise price (1) | Fair value | |||||||
| Parent company and consolidated | |||||||||||||
| Collar - buy | Soybean meal purchase - floating price | Soybean meal - CBOT | 2nd Qtr. 2025 | 17,989 | ton | 336.79 | 948 | ||||||
| Collar - buy | Soybean meal purchase - floating price | Soybean meal - CBOT | 3rd Qtr. 2025 | 17,989 | ton | 341.13 | 548 | ||||||
| Non-deliverable forward - buy | Corn purchase - floating price | Corn - CBOT | 3rd Qtr. 2025 | 99,999 | ton | 171.76 | 403 | ||||||
| Collar - buy | Corn purchase - floating price | Corn - CBOT | 1st Qtr. 2025 | 20,003 | ton | 177.85 | (26) | ||||||
| Collar - buy | Corn purchase - floating price | Corn - CBOT | 2nd Qtr. 2025 | 135,998 | ton | 176.94 | 1,174 | ||||||
| Collar - buy | Corn purchase - floating price | Corn - B3 | 1st Qtr. 2025 | 16,200 | ton | 1,208.33 | 124 | ||||||
| Collar - buy | Corn purchase - floating price | Corn - B3 | 2nd Qtr. 2025 | 40,500 | ton | 1,213.33 | 193 | ||||||
| Non-deliverable forward - buy | Soybean oil purchase - floating price | Soybean oil - CBOT | 2nd Qtr. 2025 | 6,001 | ton | 912.57 | (516) | ||||||
| 354,679 | 2,848 | ||||||||||||
(1) Base price of each commodity in USD/ton, except for Corn – B3 denominated in R$/ton.
In certain cases, the Company performs futures purchases at fixed prices and, to hedge such exposure, it holds derivative financial instruments in short position (sell) to keep these prices at market value. The financial instruments designated as fair value hedges for the fixed commodities price exposure on December 31, 2024, are set forth below:
| 12.31.24 | |||||||||||||
| Fair value hedge - Derivative instruments | Hedged object | Index | Maturity | Quantity | Exercise price (1) | Fair value | |||||||
| Parent company and consolidated | |||||||||||||
| Non-deliverable forward - sell | Soybean purchase - fixed price | Soybean - CBOT | 1st Qtr. 2025 | 38,298 | ton | 409.09 | 10,526 | ||||||
| Non-deliverable forward - sell | Corn purchase - fixed price | Corn - CBOT | 1st Qtr. 2025 | 9,001 | ton | 185.42 | 409 | ||||||
| Non-deliverable forward - sell | Corn purchase - fixed price | Corn - CBOT | 3rd Qtr. 2025 | 76,216 | ton | 173.46 | 471 | ||||||
| Corn future - sell | Corn purchase - fixed price | Corn - B3 | 1st Qtr. 2025 | 12,609 | ton | 1,252.06 | (71) | ||||||
| Corn future - sell | Corn purchase - fixed price | Corn - B3 | 3rd Qtr. 2025 | 189,486 | ton | 1,116.86 | (947) | ||||||
| 325,610 | 10,388 | ||||||||||||
(1) Base price of each commodity in USD/ton, except Corn - B3 denominated in R$/ton.
The Company assessed that part of its cost, future physical purchases of commodities in dollars, also generates exchange rate exposure and therefore contracted the following derivatives and designated them as fair value hedges:
| 113 |
| Financial Statements, Individual and Consolidated | 2024 a 2023 |
| 12.31.24 | |||||||||||||||
| Fair value hedge - Derivative instruments | Protection object | Assets | Liabilities | Maturity | Notional | Exercise price | Fair value | ||||||||
| Parent company and consolidated | |||||||||||||||
| Non-deliverable forward | Cost in USD | BRL | USD | 1st Qtr. 2025 | USD | 15,823 | 5.5465 | (10,851) | |||||||
| Non-deliverable forward | Cost in USD | BRL | USD | 3rd Qtr. 2025 | USD | 9,426 | 6.0634 | (3,760) | |||||||
| 25,249 | (14,611) | ||||||||||||||
The open and liquidated derivative financial instrument still generate impacts in the statement of financial position of: i) Consolidated Inventory a debit in the amount of R$28,811 on December 31, 2024 (R$95,986 on December 31, 2023); ii) Other comprehensive income a credit amount of R$29,447 on December 31, 2024 (credit of R$322 on December 31, 2023).
| 23.2.3 | Interest rate risk |
The interest rate risk may cause economic losses to the Company resulting from volatility in interest rates that affect its assets and liabilities.
The Company’s Risk Policy does not restrict exposure to different interest rates, neither establishes limits for fixed or floating rates. However, the Company continually monitors the market interest rates in order to evaluate any need to enter into hedging transactions to protect from the volatility of such rates and manage the mismatch between its financial assets and liabilities.
As a result of this protection strategy the Company recognize in the Consolidated Financial Income and Expenses an expense of R$705,006 for the year ended on December 31, 2024 (revenue of R$313,103 during the year ended on December 31, 2023).
The derivative financial instruments used to hedge the exposure to interest rates as of December 31, 2024, are presented in the table below:
| 12.31.24 | |||||||||||||||
| Fair value (R$) | |||||||||||||||
| Fair value hedge - Derivative instruments | Hedged Object | Maturity | Asset | Liability | Notional | Instrument | Object (1) | ||||||||
| Parent company and Consolidated | |||||||||||||||
| Interest rate swap | Debenture - 1st issue - 3rd series - IPCA + 5.50% p.a. | 2nd Qtr. 2026 | IPCA + 5.50% p.a. | CDI + 0.57% p.a. | 200,000 | BRL | 28,464 | (5,341) | |||||||
| Interest rate swap | Debenture - 1st issue - 3rd series - IPCA + 5.50% p.a. | 2nd Qtr. 2026 | IPCA + 5.50% p.a. | 100% of CDI | 200,000 | BRL | 22,176 | (4,141) | |||||||
| Interest rate swap | Debenture - 2nd issue - 1st series - IPCA + 5.30% p.a. | 3rd Qtr. 2027 | IPCA + 5.30% p.a. | CDI + 2.20% p.a. | 400,000 | BRL | 53,395 | (53,483) | |||||||
| Interest rate swap | Debenture - 2nd issue - 2nd series - IPCA + 5.60% p.a. | 3rd Qtr. 2030 | IPCA + 5.60% p.a. | CDI + 2.29% p.a. | 595,000 | BRL | 48,624 | (161,588) | |||||||
| Interest rate swap | Debenture - 3rd issue - single series - IPCA + 4.78% p.a. | 2nd Qtr. 2031 | IPCA + 4.78% p.a. | CDI + 0.12% a.a. | 1,000,000 | BRL | 65,394 | (116,498) | |||||||
| Interest rate swap | Debenture - 1st issue - 1ª series - IPCA + 6.83% p.a. | 3rd Qtr. 2032 | IPCA + 6.83% p.a. | 109.32% of CDI | 990,000 | BRL | 33,741 | (33,477) | |||||||
| Interest rate swap | Debenture - 5th issue IPCA + 7.23% | 2nd Qtr. 2034 | IPCA + 7.23% a.a. | CDI + 0.98% a.a. | 1,635,000 | BRL | (112,078) | (89,528) | |||||||
| Interest rate swap | Debenture - 5th issue PRÉ + 12.92% | 2nd Qtr. 2031 | PRÉ 12.92% a.a. | CDI + 0.89% a.a. | 925,000 | BRL | (124,444) | (112,960) | |||||||
| 5,945,000 | 15,272 | (577,016) | |||||||||||||
| (1) | Corresponds to the accumulated fair value of the fair value hedge adjustments on the hedged items, reduced by the carrying amount of the debentures. |
| 114 |
| Financial Statements, Individual and Consolidated | 2024 a 2023 |
| 23.3 | Credit risk management |
The Company is exposed to the credit risk related to the financial assets held: trade and non-trade accounts receivable, marketable securities, derivative instruments and cash and equivalents. The Company’s credit risk exposure can be assessed in notes 4, 5 and 6.
| 23.3.1 | Credit risk in accounting receivable |
The credit risk associated with trade accounts receivable is actively managed through specific systems and is supported by internal policies for credit analysis. The significant level of diversification and geographical dispersion of the customer portfolio significantly reduces the risk. However, the Company chooses to complement the risk management by contracting insurance policies for specific markets. The impairment of these financial assets is carried out based on expected credit losses.
| 23.3.2 | Counterparty credit risk |
The credit risk associated with marketable securities, cash and cash equivalents and derivative instruments in general is directed to counterparties with Investment Grade ratings. The maintenance of assets with counterparty risk is constantly assessed according to credit ratings and the Company’s portfolio concentration, aligned with the applicable impairment requisites.
| 23.4 | Capital management and liquidity risk |
The Company is exposed to liquidity risk as far as it needs cash or other financial assets to settle its obligations in the respective terms. The Company’s cash and liquidity strategy takes into consideration historical volatility scenarios of results as well as simulations of sectorial and systemic crisis. It is grounded on allowing resilience in scenarios of capital restriction.
| 23.5 | Sensitivity analysis |
Management believes that the most relevant risks that may affect the Company’s results, for which it uses derivative financial instruments to protect, are the volatility of commodities prices, foreign exchange rates and interest rates.
For the probable scenario of commodities, Management uses as a reference the future value of assets on December 31, 2024 and therefore understands that there will be no changes in the results of operations. As for the exchange rate, management uses the Focus report as a reference for the US dollar, interpolating the quotes for the current and subsequent years. The probable scenario for the other currencies is calculated based on the parity of the US dollar.
In the possible and remote scenarios, both positive and negative variations of 15% and 30% respectively were considered in both cases from the probable scenario. Such sensitivity scenarios originate from information and assumptions used by Management in monitoring the previously mentioned risks.
The information used in the preparation of the analysis is based on the position as of December 31, 2024, which has been described in the items above. The estimated values may differ significantly to numbers and results that will be effectively registered by the Company. Positive values indicate gains and negative values indicate losses.
| 115 |
| Financial Statements, Individual and Consolidated | 2024 a 2023 |
| Scenario | ||||||||||
| Remote | Possible | Probable | Possible | Remote | ||||||
| Exchange rate - Balance | - 30% | - 15% | + 15% | + 30% | ||||||
| USD | 4.1563 | 5.0469 | 5.9375 | 6.8281 | 7.7188 | |||||
| Monetary assets and liabilities | 598,540 | 336,722 | 74,904 | (186,914) | (448,732) | |||||
| Derivative instruments - not designated | 76,352 | 42,953 | 9,555 | (23,843) | (57,242) | |||||
| Net effect | 674,892 | 379,675 | 84,459 | (210,757) | (505,974) | |||||
| EUR | 4.3200 | 5.2457 | 6.1715 | 7.0972 | 8.0229 | |||||
| Monetary assets and liabilities | (744,824) | (419,017) | (93,211) | 232,596 | 558,403 | |||||
| Derivative instruments - not designated | 126,977 | 71,434 | 15,890 | (39,653) | (95,196) | |||||
| Net effect | (617,847) | (347,583) | (77,321) | 192,943 | 463,207 | |||||
| JPY | 0.0265 | 0.0322 | 0.0378 | 0.0435 | 0.0492 | |||||
| Monetary assets and liabilities | 494 | 278 | 62 | (154) | (370) | |||||
| Net effect | 494 | 278 | 62 | (154) | (370) | |||||
| TRY | 0.1175 | 0.1427 | 0.1679 | 0.1931 | 0.2183 | |||||
| Monetary assets and liabilities | (88,065) | (49,543) | (11,021) | 27,501 | 66,023 | |||||
| Net effect | (88,065) | (49,543) | (11,021) | 27,501 | 66,023 | |||||
| AOA | 0.0046 | 0.0055 | 0.0065 | 0.0075 | 0.0085 | |||||
| Monetary assets and liabilities | (11,957) | (6,727) | (1,496) | 3,734 | 8,965 | |||||
| Net effect | (11,957) | (6,727) | (1,496) | 3,734 | 8,965 | |||||
| ARS | 0.0040 | 0.0049 | 0.0058 | 0.0066 | 0.0075 | |||||
| Monetary assets and liabilities | 698 | 393 | 87 | (219) | (525) | |||||
| Net effect | 698 | 393 | 87 | (219) | (525) | |||||
| CLP | 0.0042 | 0.0051 | 0.0060 | 0.0069 | 0.0078 | |||||
| Monetary assets and liabilities | (77,355) | (43,534) | (9,713) | 24,107 | 57,928 | |||||
| Derivative Instruments - Not designated | 50,918 | 28,656 | 6,394 | (15,868) | (38,130) | |||||
| Net effect | (26,437) | (14,878) | (3,319) | 8,239 | 19,798 | |||||
| Scenario | ||||||||||
| Remote | Possible | Probable | Possible | Remote | ||||||
| Exchange rate - Operating results | - 30% | - 15% | + 15% | + 30% | ||||||
| USD | 4.1563 | 5.0469 | 5.9375 | 6.8281 | 7.7188 | |||||
| Revenue in USD | (2,531,828) | (1,424,336) | (316,844) | 790,648 | 1,898,141 | |||||
| NDF | 1,244,027 | 699,855 | 155,683 | (388,489) | (932,661) | |||||
| Collar | 62,472 | 62,472 | 45,231 | (291,484) | (846,003) | |||||
| Net effect | (1,225,329) | (662,009) | (115,930) | 110,675 | 119,477 | |||||
| 116 |
| Financial Statements, Individual and Consolidated | 2024 a 2023 |
| Scenario | ||||||||||
| Remote | Possible | Probable | Possible | Remote | ||||||
| Exchange rate - Operating results | - 30% | - 15% | + 15% | + 30% | ||||||
| USD | 4.1563 | 5.0469 | 5.9375 | 6.8281 | 7.7188 | |||||
| Cost of Sales | (51,409) | (28,921) | (6,434) | 16,054 | 38,542 | |||||
| NDF | 51,409 | 28,921 | 6,434 | (16,054) | (38,542) | |||||
| Net effect | - | - | - | - | - | |||||
| Scenario | ||||||||||
| Remote | Possible | Probable | Possible | Remote | ||||||
| Operating results - Commodities | - 30% | - 15% | + 15% | + 30% | ||||||
| Soy Grain - CBOT | 255 | 310 | 364 | 419 | 474 | |||||
| Cost of Sales | (4,187) | (2,093) | - | 2,093 | 4,187 | |||||
| NDF | 4,187 | 2,093 | - | (2,093) | (4,187) | |||||
| Net effect | - | - | - | - | - | |||||
| Soybean meal - CBOT | 248 | 301 | 354 | 407 | 461 | |||||
| Cost of sales | 3,825 | 1,912 | - | (1,912) | (3,825) | |||||
| Collar | (2,545) | (632) | - | 1,738 | 3,651 | |||||
| Net effect | 1,280 | 1,280 | - | (174) | (174) | |||||
| Soybean oil - CBOT | 629 | 764 | 898 | 1,033 | 1,168 | |||||
| Cost of sales | 1,617 | 809 | - | (809) | (1,617) | |||||
| NDF | (1,617) | (809) | - | 809 | 1,617 | |||||
| Net effect | - | - | - | - | - | |||||
| Corn - CBOT | 123 | 150 | 176 | 203 | 229 | |||||
| Cost of sales | 9,036 | 4,518 | - | (4,518) | (9,036) | |||||
| Collar | (6,117) | (1,888) | - | 2,964 | 7,192 | |||||
| NDF | (766) | (383) | - | 383 | 766 | |||||
| Net effect | 2,153 | 2,247 | - | (1,171) | (1,078) | |||||
| Corn - B3 | 822 | 998 | 1,174 | 1,351 | 1,527 | |||||
| Cost of sales | (51,225) | (25,613) | - | 25,613 | 51,225 | |||||
| Collar | (14,600) | (4,316) | - | 4,454 | 14,298 | |||||
| Future | 70,609 | 35,305 | - | (35,305) | (70,609) | |||||
| Net effect | 4,784 | 5,376 | - | (5,238) | (5,086) | |||||
| 117 |
| Financial Statements, Individual and Consolidated | 2024 a 2023 |
| 23.6 | Financial instruments by category |
| Parent company | |||||||
| 12.31.24 | |||||||
| Amortized cost | Fair value through other comprehensive income | Fair value through profit and loss | Total | ||||
| Assets | |||||||
| Cash and bank | 436,769 | - | - | 436,769 | |||
| Cash equivalents | - | - | 3,552,255 | 3,552,255 | |||
| Marketable securities | - | 859,029 | 53,481 | 912,510 | |||
| Restricted cash | 34,175 | - | - | 34,175 | |||
| Trade accounts receivable | 7,589,649 | - | 266,210 | 7,855,859 | |||
| Notes receivables | 40,337 | - | - | 40,337 | |||
| Derivatives not designated | - | - | 6,597 | 6,597 | |||
| Derivatives designated as hedge accounting (1) | - | - | 308,006 | 308,006 | |||
| Liabilities | |||||||
| Trade accounts payable | (12,239,246) | - | - | (12,239,246) | |||
| Loans and borrowings (2) | (11,445,406) | - | (6,334,836) | (17,780,242) | |||
| Derivatives not designated | - | - | - | - | |||
| Derivatives designated as hedge accounting (1) | - | - | (619,182) | (619,182) | |||
| (15,583,722) | 859,029 | (2,767,469) | (17,492,162) | ||||
| Consolidated | |||||||
| 12.31.24 | |||||||
| Amortized cost | FVTOCI (3) | Fair value through profit and loss | Total | ||||
| Equity instruments | |||||||
| Assets | |||||||
| Cash and bank | 1,378,362 | - | - | 1,378,362 | |||
| Cash equivalents | - | - | 9,787,002 | 9,787,002 | |||
| Marketable securities | 289,880 | 874,510 | 53,501 | 1,217,891 | |||
| Restricted cash | 336,815 | - | - | 336,815 | |||
| Trade accounts receivable | 5,831,423 | - | 266,210 | 6,097,633 | |||
| Notes receivables | 40,337 | - | - | 40,337 | |||
| Derivatives not designated | - | - | 6,597 | 6,597 | |||
| Derivatives designated as hedge accounting (1) | - | - | 308,006 | 308,006 | |||
| Liabilities | |||||||
| Trade accounts payable | (13,570,050) | - | - | (13,570,050) | |||
| Loans and borrowings (2) | (14,405,712) | - | (6,334,836) | (20,740,548) | |||
| Derivatives not designated | - | - | - | - | |||
| Derivatives designated as hedge accounting (1) | - | - | (619,182) | (619,182) | |||
| (20,098,945) | 874,510 | 3,467,298 | (15,757,137) | ||||
(1) All derivatives are classified at fair value through profit and loss. Those designated as hedge accounting instruments have their gains and losses also affecting Equity and Inventories .
(2) The part of the loans and borrowings that is object in a fair value hedge is classified as Fair value through profit and loss. The rest of the loans and borrowings balance is classified as amortized cost and those designated as cash flow or net investment hedge accounting instruments have their gains and losses also affecting Equity.
(3) FVTOCI: Fair Value Through Other Comprehensive Income.
| 118 |
| Financial Statements, Individual and Consolidated | 2024 a 2023 |
| 23.7 | Fair value of financial instruments |
The fair value is the price that would be received to sell an asset or paid to transfer a liability in an orderly transaction between market participants at the measurement date.
Depending on the inputs used for measurement, the financial instruments at fair value may be classified into 3 hierarchy levels:
| » | Level 1 - Uses quoted prices (unadjusted) for identical instruments in active markets. In this category are classified investments in stocks, savings accounts, overnights, term deposits, Financial Treasury Bills (“LFT”) and investment funds; |
| » | Level 2 - Uses prices quoted in active markets for similar instruments, prices quoted for identical or similar instruments in non-active markets and evaluation models for which inputs are observable. In this level are classified the investments in Bank Deposit Certificates (“CDB”) and derivatives, which are measured by well-known pricing models: discounted cash flows and Black-Scholes. The observable inputs are interest rates and curves, volatility factors and foreign exchange rates; |
| » | Level 3 - Instruments for which significant inputs are non-observable. The Company does not have financial instruments in this category. |
The table below presents the overall classification of financial instruments accounted at fair value by measurement hierarchy. For year ended December 31, 2023, there were no changes among the 3 levels of hierarchy.
| Parent company | |||||||||||
| 12.31.24 | 12.31.23 | ||||||||||
| Level 1 | Level 2 | Total | Level 1 | Level 2 | Total | ||||||
| Financial Assets | |||||||||||
| Fair value through other comprehensive income | |||||||||||
| Treasury national notes | 859,029 | - | 859,029 | - | - | - | |||||
| Fair value through profit and loss | |||||||||||
| Savings account and overnight | 1,582 | - | 1,582 | 11,359 | - | 11,359 | |||||
| Term deposits | - | - | - | - | - | - | |||||
| Bank deposit certificates | - | 3,545,946 | 3,545,946 | - | 4,438,970 | 4,438,970 | |||||
| Financial treasury bills | 35,031 | - | 35,031 | 412,107 | - | 412,107 | |||||
| Investment funds | 23,177 | - | 23,177 | 21,166 | - | 21,166 | |||||
| Trade accounts receivable | - | 266,210 | 266,210 | - | 337,898 | 337,898 | |||||
| Derivatives | - | 314,603 | 314,603 | - | 639,052 | 639,052 | |||||
| Financial Liabilities | |||||||||||
| Fair value through profit and loss | |||||||||||
| Derivatives | - | (619,182) | (619,182) | - | (133,931) | (133,931) | |||||
| Loans and borrowings | - | (6,334,836) | (6,334,836) | - | (5,021,342) | (5,021,342) | |||||
| 918,819 | (2,827,259) | (1,908,440) | 444,632 | 260,647 | 705,279 | ||||||
| 119 |
| Financial Statements, Individual and Consolidated | 2024 a 2023 |
| Consolidated | |||||||||||
| 12.31.24 | 12.31.23 | ||||||||||
| Level 1 | Level 2 | Total | Level 1 | Level 2 | Total | ||||||
| Financial Assets | |||||||||||
| Fair value through other comprehensive income | |||||||||||
| National treasury notes | 859,029 | - | 859,029 | - | - | - | |||||
| Stocks | 15,481 | - | 15,481 | 12,103 | - | 12,103 | |||||
| Fair value through profit and loss | |||||||||||
| Savings account and overnight | 1,582 | - | 1,582 | 17,570 | - | 17,570 | |||||
| Term deposits | 4,562,127 | - | 4,562,127 | 2,758,300 | - | 2,758,300 | |||||
| Bank deposit certificates | - | 3,716,958 | 3,716,958 | - | 4,876,861 | 4,876,861 | |||||
| Financial treasury bills | 35,031 | - | 35,031 | 412,107 | - | 412,107 | |||||
| Off-shore notes | - | 1,501,608 | 1,501,608 | - | - | - | |||||
| Investment funds | 23,177 | - | 23,177 | 21,186 | - | 21,186 | |||||
| Trade accounts receivable | - | 266,210 | 266,210 | - | 337,898 | 337,898 | |||||
| Derivatives | - | 314,603 | 314,603 | - | 639,052 | 639,052 | |||||
| Other titles | 20 | - | 20 | 35,751 | - | 35,751 | |||||
| Financial Liabilities | |||||||||||
| Fair value through profit and loss | |||||||||||
| Derivatives | - | (619,182) | (619,182) | - | (136,759) | (136,759) | |||||
| Loans and borrowings | - | (6,334,836) | (6,334,836) | - | (5,021,342) | (5,021,342) | |||||
| 5,496,447 | (1,154,639) | 4,341,808 | 3,257,017 | 695,710 | 3,952,727 | ||||||
The fair value of the financial instruments approximates the book value, with the exception of the cases presented below and for disclosure purposes only, the bonds are stated based on observable prices in active markets and the debentures are measured using discounted cash flows.
| Parent company and Consolidated | ||||||||||||
| 12.31.24 | 12.31.23 | |||||||||||
| Currency | Maturity | Book value | Fair value | Book value | Fair value | |||||||
| BRF S.A. | ||||||||||||
| BRF SA BRFSBZ 4 7/8 | USD | 2030 | (3,706,212) | (3,351,896) | (2,896,104) | (2,506,390) | ||||||
| BRF SA BRFSBZ 5 3/4 | USD | 2050 | (4,135,792) | (3,262,625) | (3,209,653) | (2,398,081) | ||||||
| Debenture - 1st issue | BRL | 2026 | (550,542) | (520,552) | (830,144) | (853,640) | ||||||
| Debenture - 2nd issue | BRL | 1st serie 2027 and 2nd series 2030 | (2,739,446) | (2,897,325) | (2,681,294) | (3,048,882) | ||||||
| Debenture - 3rd issue | BRL | 2031 | (1,109,135) | (1,109,135) | (1,214,044) | (1,214,044) | ||||||
| Debenture - 4rd issue | BRL | 1st serie 2027 and 2nd series 2032 | (1,062,066) | (1,139,664) | (1,908,952) | (2,032,361) | ||||||
| Debenture - 5rd issue | BRL | 1st serie 2029, 2nd series 2031 and 3rd series 2034 | (1,765,547) | (1,780,894) | - | - | ||||||
| Parent company | (15,068,740) | (14,062,091) | (12,740,191) | (12,053,398) | ||||||||
| BRF GmbH | ||||||||||||
| BRF SA BRFSBZ 4.35 | USD | 2026 | (1,759,349) | (1,712,346) | (1,453,805) | (1,360,530) | ||||||
| Consolidated | (16,828,089) | (15,774,437) | (14,193,996) | (13,413,928) | ||||||||
Accounting policy: Financial instruments are contracts that give rise to a financial asset for one entity and a financial liability or equity instrument for another. Their presentation in the statement of financial position and explanatory notes takes place according to the characteristics of each contract. Financial assets: Financial assets are recognized when the entity becomes party to the contractual provisions of the instrument and classified based on the characteristics of its cash flows and on the management model for the asset. The table below shows financial assets are classified and measured: |
| 120 |
| Financial Statements, Individual and Consolidated | 2024 a 2023 |
| Category | Initial Measurement | Subsequent Measurement | ||
| Amortized cost | Accounts receivable from clients and other receivables: billed amount adjusted to present value and, when applicable, reduced by expected credit losses For other assets: fair value less costs directly attributable to its issuance, reduced by expected credit losses | Interest, changes in amortized cost and expected credit losses recognized in the income statement. | ||
| Fair value through profit and loss (“FVTPL”) | Fair value | Variation on the fair value recognized in the income statement. | ||
| Fair value through other comprehensive Income (“FVTOCI”). | Fair value less costs directly attributable to its issuance. | Changes in fair value recognized in other comprehensive income. |
The Company evaluates expected credit losses in each reporting period for instruments measured at amortized cost and for debt instruments measured at Fair value through Other comprehensive income. Losses and reversals of losses are recorded in the income statement. The interests of financial assets are recorded on Financial income (expenses), net. Financial assets: Only derecognized when contractual rights expire or are effectively transferred. · Cash and cash equivalents: comprise the balances of cash, banks and securities of immediate liquidity whose maturities, at the time of acquisition, are equal to or less than 90 days, readily convertible into a known amount of cash and which are subject to an insignificant risk of change in value. Securities classified in this group, by their very nature, are measured at fair value through profit or loss.
· Expected credit losses in accounts receivable from customers and other receivables: the Company regularly assesses the historical losses on the customer portfolios it has in each region, taking in consideration the dynamics of the markets in which it operates and instruments it has for reducing credit risks, such as: letters of credit, insurance and collateral, as well as identifying specific customers whose risks are significantly different than the portfolio, which are treated according to individual expectations. Based on these assessments, estimated loss factors are generated by portfolio and aging class, which, applied to the amounts of accounts receivable, generate the expected credit losses. Additionally, the Company evaluates macroeconomic factors that may influence these losses and, if necessary, adjusts the calculation model.
Securities receivable with legal proceedings in place are reclassified to noncurrent as well as the related estimated credit losses. The securities are written off against the estimated loss when the Management considers that they are no longer recoverable after taking all appropriate actions to collect them.
· Restricted cash: the Company has restricted cash arising from business combinations to guarantee certain indemnity events. The classification of cash between current and non-current assets takes place in accordance with the contractual rules for releasing the amounts to each party. Financial liabilities: Financial liabilities are recognized when the entity becomes party to the contractual provisions of the instrument. The initial measurement is at fair value and subsequently at amortized cost using the effective interest rate method. The interests of financial liabilities are recorded on Financial income (expenses), net. A financial liability is only derecognized when the contractual obligation expires, is settled or canceled. Adjustment to present value: The Company measures the adjustment to present value on short and long-term balances of accounts receivable, suppliers and other obligations, being recognized as a deduction in the asset accounts against Financial income (expenses), net. Hedge accounting: Cash flow hedge: the effective portion of the gain or loss on the hedge instrument is recognized under Other Comprehensive Income and the ineffective portion in the Financial result. Accumulated gains and losses are reclassified to the Income statement or statement of financial position when the hedge object is recognized, adjusting the item in which the hedge object was accounted for. When the instrument is designated in a cash flow hedge relationship, changes in the fair value of the future element of the forward contracts and the time value of the options are recognized under Other Comprehensive Income. When the instrument is settled, these hedge costs are reclassified to the income statement together with the intrinsic value of the instruments. A hedging relationship is discontinued prospectively when it no longer meets the criteria for qualifying as hedge accounting. Upon discontinuation of a cash flow hedge relationship in which the hedged future cash flows are still expected to occur, the accumulated amount remains under Other Comprehensive Income until the flows occur and are reclassified to income. Fair value hedge: the effective portion of the hedge instrument’s gain or loss is recognized in the Income Statement or statement of financial position, adjusting the item under which the hedge object is or will be recognized. The hedge object, when designated in this relationship, is also measured at fair value. Net investment hedge: the effective result of the exchange variation of the instrument is recorded under Other Comprehensive Income, in the same item in which the accumulated translation adjustments of the investments (hedge objects) are recognized. Only when the hedged investments are sold, the accumulated amount is reclassified to the income statement, adjusting the gain or loss on the sale. |
| 121 |
| Financial Statements, Individual and Consolidated | 2024 a 2023 |
| 24. | Segment Information |
The operating segments are reported consistently with the management reports provided to the main strategic and operational decision makers for assessing the performance of each segment and allocation of resources. The operating segments information is prepared considering three reportable segments, being: Brazil, International and Other segments.
The operating segments include the sales of all distribution channels and are subdivided according to the nature of the products, for which the characteristics are described below:
| » | In-natura: production and sale of whole poultry and cuts and pork and other cuts; |
| » | Semi processed: production and marketing of in-natura cooked and smoked foods; |
| » | Processed: production and sale of processed food, frozen and processed products derived from poultry, pork and beef, margarine, vegetables and soybean-based products; |
| » | Other sales: sale of flour for food service and others. |
Other segments are comprised of commercialization and development of animal nutrition ingredients, human nutrition, plant nutrition (fertilizers), healthcare (health and wellness), pet food, as well as commercialization of agricultural products.
The items not allocated to the segments are presented as Corporate and refer to relevant events not attributable to the operating segments.
| 122 |
| Financial Statements, Individual and Consolidated | 2024 a 2023 |
The net sales by nature for each reportable operating segment is set forth below:
| Consolidated | ||||
| Net sales | 12.31.24 | 12.31.23 | ||
| Brazil | ||||
| In-natura | 7,082,453 | 6,133,183 | ||
| Semi processed (1) | 1,988,415 | 1,733,981 | ||
| Processed | 19,675,454 | 18,683,405 | ||
| Other sales | 94,311 | 308,349 | ||
| 28,840,633 | 26,858,918 | |||
| International | ||||
| In-natura | 24,597,920 | 20,252,213 | ||
| Semi processed (1) | 651,624 | 352,087 | ||
| Processed | 3,755,026 | 3,104,193 | ||
| Other sales | 168,585 | 143,271 | ||
| 29,173,155 | 23,851,764 | |||
| Other segments | 3,365,250 | 2,904,758 | ||
| 61,379,038 | 53,615,440 | |||
(1) In 2024, the company included a new type of product called “semi processed products”, so the figures for 2023 have been restated.
The gross profit and income (loss) before financial results for each segment and for Corporate are set forth below:
| Consolidated | ||||||||||
| Gross profit | Income (loss) before financial results and income taxes | |||||||||
| 12.31.24 | 12.31.23 | 12.31.24 | 12.31.23 | |||||||
| Brazil | 7,733,707 | 5,916,699 | 2,750,655 | 1,602,298 | ||||||
| Margin (%) | 26.8% | 22.0% | 9.5% | 6.0% | ||||||
| International | 7,431,712 | 2,121,851 | 3,981,318 | (1,214,167) | ||||||
| Margin (%) | 25.5% | 8.9% | 13.6% | -5.1% | ||||||
| Other segments | 775,647 | 764,791 | 322,569 | 357,720 | ||||||
| Margin (%) | 23.0% | 26.3% | 9.6% | 12.3% | ||||||
| Subtotal | 15,941,066 | 8,803,341 | 7,054,542 | 745,851 | ||||||
| Corporate | (105,250) | 30,360 | (214,156) | 90,290 | ||||||
| Total | 15,835,816 | 8,833,701 | 6,840,386 | 836,141 | ||||||
| Margin (%) | 25.8% | 16.5% | 11.1% | 1.6% | ||||||
The composition of selected items that were not allocated to the Company’s operating segments as they are not linked to its main activity and, therefore, were presented as Corporate is set forth below:
| Consolidated | ||||
| Corporate | 12.31.24 | 12.31.23 | ||
| Results with sale and disposal of fixed assets and investments | (3,527) | 86,475 | ||
| Reversal/(provision) for tax and civil contingencies | (79,546) | 21,707 | ||
| Expenses with demobilization | (8,915) | (277) | ||
| Weather events | (112,701) | - | ||
| Other | (9,467) | (17,615) | ||
| (214,156) | 90,290 | |||
| 123 |
| Financial Statements, Individual and Consolidated | 2024 a 2023 |
No customer individually or in aggregate (economic group) accounted for more than 5% of net sales in the years ended December 31, 2024, and 2023.
The goodwill arising from business combinations and the intangible assets with indefinite useful life (trademarks) were allocated to the reportable operating segments, considering the economic benefits generated by such intangible assets. The allocation of these intangible assets is presented below:
| Consolidated | |||||||||||
| Goodwill | Trademarks | Total | |||||||||
| 12.31.24 | 12.31.23 | 12.31.24 | 12.31.23 | 12.31.24 | 12.31.23 | ||||||
| Brazil | 1,151,498 | 1,151,498 | 982,478 | 982,478 | 2,133,976 | 2,133,976 | |||||
| International | 2,159,259 | 1,783,873 | 549,072 | 415,904 | 2,708,331 | 2,199,777 | |||||
| Other segments | 460,505 | 455,567 | 474,716 | 474,871 | 935,221 | 930,438 | |||||
| 3,771,262 | 3,390,938 | 2,006,266 | 1,873,253 | 5,777,528 | 5,264,191 | ||||||
Information related to total assets by reportable segment is not disclosed, as it is not included in the set of information made available to the Company’s management, which makes investment decisions and determine allocation of resources based on information about the consolidated assets.
Accounting policy: An operating segment is a component of the Company that develops business activities to obtain revenues and incur expenses. The operating segments reflect the way in which the Company’s management reviews the financial information for decision making. The Company’s management identified the operating segments, which meet the quantitative and qualitative parameters of disclosure, pursuant its current management model. |
| 25. | Net Sales |
| Parent company | Consolidated | ||||||
| 12.31.24 | 12.31.23 | 12.31.24 | 12.31.23 | ||||
| Gross sales | |||||||
| Brazil | 35,424,594 | 32,922,387 | 35,424,872 | 32,922,332 | |||
| International | 21,524,346 | 18,920,322 | 30,784,576 | 25,203,968 | |||
| Other segments | 2,516,113 | 2,120,752 | 3,955,631 | 3,494,983 | |||
| 59,465,053 | 53,963,461 | 70,165,079 | 61,621,283 | ||||
| Sales deductions | |||||||
| Brazil | (6,584,242) | (6,063,414) | (6,584,239) | (6,063,414) | |||
| International | (162,261) | (117,697) | (1,611,421) | (1,352,204) | |||
| Other segments | (212,278) | (201,431) | (590,381) | (590,225) | |||
| (6,958,781) | (6,382,542) | (8,786,041) | (8,005,843) | ||||
| Net sales | |||||||
| Brazil | 28,840,352 | 26,858,973 | 28,840,633 | 26,858,918 | |||
| International | 21,362,085 | 18,802,625 | 29,173,155 | 23,851,764 | |||
| Other segments | 2,303,835 | 1,919,321 | 3,365,250 | 2,904,758 | |||
| 52,506,272 | 47,580,919 | 61,379,038 | 53,615,440 | ||||
| 124 |
| Financial Statements, Individual and Consolidated | 2024 a 2023 |
Accounting policy: Sales revenues are recognized and measured observing the following steps: (i) identification of the contracts with customers, formalized through sales orders; (ii) identification of the performance obligations in the contract; (iii) determination of the transaction price; (iv) allocation of the transaction price to the performance obligations in the contract; and (v) revenue recognition as it satisfies the performance obligations. Revenues are recognized by the amount that reflects the Company’s expectation to receive for the sale of products, net of applicable taxes, returns, rebates and discounts. The sales process begins with sales orders. The discounts and rebates may be negotiated on a spot basis or may have its conditions formally defined in the agreements, generally signed with large retail and wholesale chains. In all cases, the performance obligation is satisfied when the control of the goods is transferred to the client, which will depend on the type of freight contracted by the customer. The Company has sales with immediate and deferred payments. The deferred payments are adjusted to present value to recognize the financial component (note 23.1). |
| 125 |
| Financial Statements, Individual and Consolidated | 2024 a 2023 |
| 26. | Expenses by Nature |
The Company discloses its statement of income by function and thus presents below the details by nature:
| Parent company | Consolidated | ||||||
| 12.31.24 | 12.31.23 | 12.31.24 | 12.31.23 | ||||
| Costs of sales | |||||||
| Raw materials and supplies | (26,917,785) | (27,854,359) | (32,717,134) | (33,474,310) | |||
| Salaries and employees benefits | (5,322,081) | (4,773,282) | (6,248,972) | (5,161,849) | |||
| Depreciation | (2,420,882) | (2,280,131) | (2,705,436) | (2,448,711) | |||
| Amortization | (103,124) | (111,082) | (213,578) | (210,288) | |||
| Other | (3,361,886) | (3,197,169) | (3,658,102) | (3,486,581) | |||
| (38,125,758) | (38,216,023) | (45,543,222) | (44,781,739) | ||||
| Operating income (expenses): | |||||||
| Sales | |||||||
| Indirect and direct logistics expenses | (3,778,671) | (3,903,856) | (3,775,463) | (3,691,443) | |||
| Marketing | (761,953) | (635,096) | (963,537) | (802,754) | |||
| Salaries and employees benefits | (1,492,886) | (1,277,399) | (2,000,136) | (1,697,652) | |||
| Depreciation | (251,430) | (221,825) | (443,188) | (382,267) | |||
| Amortization | (58,985) | (63,191) | (92,898) | (82,911) | |||
| Other | (512,319) | (488,386) | (807,440) | (797,136) | |||
| (6,856,244) | (6,589,753) | (8,082,662) | (7,454,163) | ||||
| Administrative expenses | |||||||
| Salaries and employees benefits | (316,368) | (228,937) | (531,780) | (366,142) | |||
| Fees | (128,856) | (65,107) | (129,348) | (65,417) | |||
| Depreciation | (26,206) | (33,483) | (47,308) | (41,710) | |||
| Amortization | (2,416) | (46,866) | (22,305) | (58,894) | |||
| Other | (75,389) | (101,191) | (222,318) | (225,673) | |||
| (549,235) | (475,584) | (953,059) | (757,836) | ||||
| Impairment loss on trade receivables | (13,473) | (24,072) | (28,817) | (32,809) | |||
| Other operating income (expenses), net | |||||||
| Recovery of expenses | 54,178 | 47,092 | 62,495 | 52,600 | |||
| Civil and tax contingencies (assets or liabilities) | (119,391) | 150,281 | (124,680) | 146,423 | |||
| Results with sale and disposal of fixed assets and investments | 5,880 | 62,638 | 163,983 | 63,229 | |||
| Other | (24,483) | (18,590) | (19,015) | (11,740) | |||
| (83,816) | 241,421 | 82,783 | 250,512 | ||||
| 126 |
| Financial Statements, Individual and Consolidated | 2024 a 2023 |
The Company incurred in expenses with internal research and development of new products of R$66,068 for the year ended December 31, 2024, in the Parent Company and in the Consolidated (R$48,041 in the Parent Company and in the Consolidated for the year ended December 31, 2023).
| 27. | Financial Income (Expenses) |
| Parent company | Consolidated | |||||||
| 12.31.24 | 12.31.23 | 12.31.24 | 12.31.23 | |||||
| Financial income | ||||||||
| Interest on cash and cash equivalents | 330,603 | 332,005 | 781,761 | 544,009 | ||||
| Income with marketable securities | 114,488 | 66,867 | 138,860 | 93,410 | ||||
| Fair value through profit and loss | 114,488 | 66,867 | 114,310 | 66,868 | ||||
| Amortized cost | - | - | 24,550 | 26,542 | ||||
| Interest on recoverable taxes | 253,114 | 434,194 | 254,034 | 434,737 | ||||
| Interest and financial income on other assets | 45,968 | 72,139 | 51,137 | 130,364 | ||||
| 744,173 | 905,205 | 1,225,792 | 1,202,520 | |||||
| Financial expenses | ||||||||
| Interests on loans and borrowings | (1,674,732) | (1,910,225) | (1,903,199) | (2,156,842) | ||||
| Interest with related parties | (503,126) | (449,791) | - | - | ||||
| Interest on contingencies | (141,383) | (144,281) | (141,385) | (144,281) | ||||
| Interest on leases | (356,130) | (302,546) | (386,683) | (323,452) | ||||
| Interest on actuarial liabilities | (36,771) | (39,581) | (74,199) | (53,193) | ||||
| Taxes on financial income | (38,450) | (43,543) | (40,773) | (49,531) | ||||
| Adjustment to present value (2) | (780,976) | (1,024,518) | (663,456) | (1,001,451) | ||||
| Other financial expenses | (291,254) | (296,481) | (436,144) | (407,562) | ||||
| (3,822,822) | (4,210,966) | (3,645,839) | (4,136,312) | |||||
| Foreign exchange, prices and monetary variations | ||||||||
| Exchange rate variation on monetary assets and liabilities and prices | (2,992,441) | 1,242,103 | 123,681 | 161,154 | ||||
| Foreign exchange of derivatives | 206,772 | (363,373) | 198,107 | (312,201) | ||||
| Interest and fair value of derivatives | (26,528) | (281,711) | (26,886) | (284,716) | ||||
| Net Monetary Gains or Losses (1) | - | - | 334,632 | 548,708 | ||||
| (2,812,197) | 597,019 | 629,534 | 112,945 | |||||
| (5,890,846) | (2,708,742) | (1,790,513) | (2,820,847) | |||||
| (1) | Effects of monetary correction resulting from operations in hyperinflationary economy. |
| (2) | The adjustment to present value considers the balances of trade accounts receivable and trade accounts payable and the rate used for the year ended on December 31, 2024, was 14.32% p.a. (13.13% p.a. for the year ended on December 31, 2023). |
| 127 |
| Financial Statements, Individual and Consolidated | 2024 a 2023 |
| 28. | Related Parties |
The balances of the transactions with related parties are as follows:
| Parent company | ||||||||||||||||||||
| Accounts receivable | Dividends and interest on shareholders' equity receivable | Trade accounts payable | Other rights | Advances and other liabilities | ||||||||||||||||
| 12.31.24 | 12.31.23 | 12.31.23 | 12.31.24 | 12.31.23 | 12.31.24 | 12.31.23 | 12.31.24 | 12.31.23 | ||||||||||||
| AES Brasil | - | - | - | (152) | - | - | - | - | - | |||||||||||
| Al Khan Foodstuff LLC ("AKF") | 121,815 | - | - | - | - | - | - | - | - | |||||||||||
| Al-Wafi Al-Takamol International for Foods Products | 329,766 | - | - | - | - | - | - | - | - | |||||||||||
| Al-Wafi Factory | 273,253 | - | - | - | - | - | - | - | - | |||||||||||
| Banvit Bandirma Vitaminli | - | - | - | - | - | 29,065 | 708 | - | - | |||||||||||
| BRF Energia S.A. | - | - | - | (357,870) | (208,168) | - | - | - | - | |||||||||||
| BRF Foods GmbH | 170,508 | 346,703 | - | - | - | - | 124 | - | - | |||||||||||
| BRF Foods LLC | - | - | - | - | - | - | - | (311) | - | |||||||||||
| BRF Global GmbH | 1,665,209 | 3,118,425 | - | (11,104) | (2,527,079) | - | - | (5,279,524) | (1) | (4,807,979) | ||||||||||
| BRF Global Company South Africa Proprietary Ltd. | - | - | - | (3,786) | - | - | - | - | - | |||||||||||
| BRF GmbH | - | - | - | - | - | - | - | (1,561,003) | (2) | (1,300,782) | ||||||||||
| BRF Japan KK | - | - | - | (2,144) | - | - | - | - | - | |||||||||||
| BRF Korea LLC | - | - | - | (684) | - | - | - | - | - | |||||||||||
| BRF Kuwait Food Management Company WLL | 27,951 | - | - | - | - | - | - | - | - | |||||||||||
| BRF Shanghai Management Consulting Co. Ltd. | - | - | - | (4,717) | - | - | - | - | - | |||||||||||
| BRF Singapore Foods PTE Ltd. | - | - | - | (203) | - | - | - | - | (2,683) | |||||||||||
| Federal Foods LLC | 238,631 | - | - | - | - | - | - | - | - | |||||||||||
| Federal Foods Qatar | 171,384 | - | - | - | - | - | - | (9) | - | |||||||||||
| Hercosul Alimentos Ltda. | 20,178 | 5,968 | - | - | - | 446 | 440 | - | - | |||||||||||
| Hercosul International S.R.L. | 83 | 19 | - | (4,641) | (305) | - | - | - | - | |||||||||||
| Joody Al Sharqiya Food Production Factory LLC | 76,775 | - | - | - | - | - | - | - | - | |||||||||||
| Mogiana Alimentos S.A. | 16,343 | 9,953 | - | - | - | 517 | 497 | - | - | |||||||||||
| Sadia Alimentos S.A.U. | - | - | - | - | - | - | - | (2,535) | (3,247) | |||||||||||
| Sadia Chile SpA | 188,431 | 221,298 | - | - | - | 45,826 | 90 | (31) | - | |||||||||||
| Sadia Uruguay S.A. | 6,563 | 418 | - | - | - | 1,146 | - | (18,624) | (57,567) | |||||||||||
| VIP S.A. Empreendimentos e Partic. Imob. | - | - | 13 | - | - | - | - | - | ||||||||||||
| Marfrig Global Foods S.A. | 15,044 | 7,945 | - | (36,266) | (21,370) | 582 | - | (229) | - | |||||||||||
| Marfrig Chile S.A. | 3,626 | 1,762 | - | - | - | - | - | - | - | |||||||||||
| Quickfood S.A. | 24,223 | 24,852 | - | - | - | - | - | - | - | |||||||||||
| Dicasold S.A. | 1,659 | - | - | - | - | - | - | - | - | |||||||||||
| MFG Agropecuária Ltda. | - | 1 | - | - | - | - | - | - | - | |||||||||||
| Weston Importers Ltd. | - | - | - | - | - | 2,177 | - | - | - | |||||||||||
| Pampeano Alimentos S.A. | 257 | 473 | - | (114) | (112) | - | - | - | - | |||||||||||
| Total | 3,351,699 | 3,737,817 | 13 | (421,681) | (2,757,034) | 79,759 | 1,859 | (6,862,266) | (6,172,258) | |||||||||||
| 128 |
| Financial Statements, Individual and Consolidated | 2024 a 2023 |
| (1) | The amount corresponds to export pre-payments, usual operation between the productive units in Brazil with the wholly-owned subsidiaries that operate as trading companies in the international market. |
| (2) | BRF S.A. performs reimbursement to certain subsidiaries for losses incurred in the normal course of their operations, generating liabilities recorded as Other obligations with Related parties. |
| Consolidated | |||||||||||
| Accounts receivable | Trade accounts payable | Other rights | Advances and other liabilities | ||||||||
| 12.31.24 | 12.31.23 | 12.31.24 | 12.31.23 | 12.31.24 | 12.31.24 | ||||||
| Marfrig Global Foods S.A. | 16,145 | 7,945 | (36,266) | (24,838) | 582 | (229) | |||||
| Marfrig Chile S.A. | 3,626 | 2,563 | - | (195) | - | - | |||||
| Quickfood S.A. | 24,223 | 24,852 | - | - | - | - | |||||
| Marfrig Alimentos S.A. | 1,659 | - | - | - | - | - | |||||
| Weston Importers Ltd. | 1,416 | 366 | (5,587) | - | - | - | |||||
| MFG Agropecuária Ltda. | - | 1 | - | - | - | - | |||||
| Pampeano Alimentos S.A. | 257 | 473 | (114) | (112) | - | - | |||||
| Total | 47,326 | 36,200 | (41,967) | (25,145) | 582 | (229) | |||||
| 129 |
| Financial Statements, Individual and Consolidated | 2024 a 2023 |
| Parent company | |||||||||||||
| Sales | Financial results, net | Purchases | Other operating income (expenses) | ||||||||||
| 12.31.24 | 12.31.23 | 12.31.24 | 12.31.23 | 12.31.24 | 12.31.23 | 12.31.24 | |||||||
| AES Brasil | 114,821 | - | - | - | - | - | - | ||||||
| Al Khan Foodstuff LLC ("AKF") | 223,698 | - | - | - | - | - | - | ||||||
| Al-Wafi Al-Takamol International for Foods Products | 1,113,357 | - | - | - | - | - | - | ||||||
| Al-Wafi Factory | 178,839 | - | - | - | - | - | - | ||||||
| BRF Energia S.A. | - | - | - | - | (266,893) | (298,247) | - | ||||||
| BRF Global GmbH (1) | 7,520,164 | 17,520,230 | (499,102) | (445,631) | - | - | - | ||||||
| BRF Japan KK | - | - | - | - | (4,618) | - | - | ||||||
| BRF Korea LLC | - | - | - | - | (1,382) | - | - | ||||||
| BRF Kuwait Food Management Company WLL | 231,280 | - | - | - | - | - | - | ||||||
| BRF Shanghai Management Consulting Co. Ltd. | - | - | - | - | (7,414) | - | - | ||||||
| BRF Singapore Foods PTE Ltd. | - | - | - | - | (16,532) | - | - | ||||||
| BRF Global Company South Africa Proprietary Ltd. | - | - | - | - | (5,522) | - | - | ||||||
| Federal Foods LLC | 761,526 | - | - | - | - | - | - | ||||||
| Federal Foods Qatar | 232,919 | - | - | - | - | - | - | ||||||
| Hercosul Alimentos Ltda. | 44,113 | 22,756 | - | - | - | - | - | ||||||
| Hercosul Distrib. Ltda. | 8 | 11 | - | - | - | - | - | ||||||
| Hercosul International S.R.L. | - | 1,427 | - | - | - | (2,286) | - | ||||||
| Joody Al Factory | 85,328 | - | - | - | - | - | - | ||||||
| Mogiana Alimentos S.A. | 49,756 | 41,753 | - | - | - | - | - | ||||||
| Partner companies | 57,337 | - | - | - | - | - | - | ||||||
| Sadia Alimentos S.A.U. | - | - | (189) | (176) | - | - | - | ||||||
| Sadia Chile SpA | 350,120 | 414,832 | - | - | - | - | - | ||||||
| Sadia Uruguay S.A. | 56,088 | 110,456 | (3,835) | (3,984) | - | - | - | ||||||
| Marfrig Global Foods S.A. | 72,684 | 61,320 | 8,227 | - | (413,850) | (362,793) | 17,601 | ||||||
| Marfrig Chile S.A. | 26,080 | 8,167 | - | - | - | - | - | ||||||
| Quickfood S.A. | 118,860 | 95,631 | - | - | - | - | - | ||||||
| Dicasold S.A. | 21,045 | - | - | - | - | - | - | ||||||
| Pampeano Alimentos S.A. | 1,147 | 866 | - | - | (1,934) | (112) | - | ||||||
| Total | 11,259,170 | 18,277,449 | (494,899) | (449,791) | (718,145) | (663,438) | 17,601 | ||||||
| (1) | As of 2024, BRF S.A. began to consider direct sales to some customers abroad. |
| 130 |
| Financial Statements, Individual and Consolidated | 2024 a 2023 |
| Consolidated | ||||||||||||
| Sales | Financial results, net. | Purchases | Other operating income (expenses) | |||||||||
| 12.31.24 | 12.31.23 | 12.31.24 | 12.31.24 | 12.31.23 | 12.31.24 | |||||||
| Marfrig Global Foods S.A. | 72,684 | 61,320 | 8,227 | (413,850) | (472,903) | 17,601 | ||||||
| Marfrig Chile S.A. | 26,691 | 12,790 | - | (668) | (1,290) | - | ||||||
| Quickfood S.A. | 118,859 | 95,631 | - | - | - | - | ||||||
| Weston Importers Ltd. | 4,389 | 1,536 | - | (186,315) | - | - | ||||||
| Dicasold S.A. | 21,045 | - | - | - | - | - | ||||||
| Pampeano Alimentos S/A | 1,147 | 866 | - | (1,934) | (112) | - | ||||||
| Total | 244,815 | 172,143 | 8,227 | (602,767) | (474,305) | 17,601 | ||||||
The subsidiaries of the Company enter into loan agreements pursuant its cash management strategy respecting market conditions. As of December 31, 2024, the balance of these transactions was R$1,099,857 (R$1,132,634 as of December 31, 2023).
The Company made contributions related to the post-employment benefit plans of its employees to BRF Previdência, which holds these plans (note 19). Additionally, the Company leased properties owned by BRF Previdência, and for the year ended December 31, 2024, the total amount of lease payments was R$22,971 (R$21,936 for the year ended December 31, 2023).
The Company maintains other transactions with related parties resulting from guarantees, transferences and donations to related associations and institutes, as well as leasing and other commercial transactions with related people and entities. Such transactions are compliant with the Related Party Transactions Policy and are not relevant, individually or in aggregate.
On August 14, 2023, BRF provided financing guarantees to Potengi, with Banco do Brasil S.A., through the opening of fixed credit up to a limit of R$144,000, coming from ordinary resources from the Fundo de Desenvolvimento do Nordeste – (“FDNE”), transferred to finance the implementation of the Cajuína 1 Wind Generating Plant, located in Rio Grande do Norte.
On January 19, 2024, BRF provided guarantees with the purpose of ensuring compliance with the main and additional obligations undertaken by Potengi at its first issue of 300,000 simple debentures, not convertible into shares, in a single series, with a maturity period of eighteen (18) years. The nominal unit value is R$1, with BRF providing a personal guarantee for the amount corresponding to 24% of the issue value.
On March 27, 2024, BRF provided guarantees to ensure compliance with the main and ancillary obligations assumed by Potengi under its 2nd issue of 2,100,000 simple debentures, not convertible into shares, in a single series, with a maturity of 18 years. The nominal unit value expressed in Reais is R$0.10, and BRF has provided a fiduciary guarantee for an amount corresponding to 24% of the issue value.
On May 21, 2024, BRF signed a strategic product supply contract with the Saudi Agricultural and Livestock Investment Company (“SALIC”). The contract allows SALIC to purchase up to 200,000 tons of product per year whenever there is a state of food emergency in the Kingdom of Saudi Arabia.
The price to SALIC will be equivalent to an average of market prices charged by the Company to other customers and the obligation to supply will only exist if BRF has plants authorized to export to the Kingdom of Saudi Arabia with sufficient volume to also supply its other customers in that country. Up to the date of approval of this interim financial information, no transaction linked to this contract had been carried out.
| 131 |
| Financial Statements, Individual and Consolidated | 2024 a 2023 |
On September 3, 2024, BRF and Marfrig signed a supply contract under which BRF will buy inputs and meat products produced by Marfrig. The contract will run for twenty-four months from the date of signature, and Marfrig will invoice on a monthly basis, based on the volume of inputs and meat products purchased by BRF. The estimated expenditure for the entire period of the contract is R$ 550,000.
During the year ended on December 12, 2024, the company signed an agreement with Marfrig Global Foods S.A. to acquire ICMS credits calculated in the state of São Paulo and held by Marfrig. In the year ended on December 31, 2024, R$256,000 was transferred, with a discount in line with the market (note 9.1).
| 28.1 | Management remuneration |
The total remuneration and benefits expense with board members, statutory directors and the head of internal audit are set forth below:
| Consolidated | |||
| 12.31.24 | 12.31.23 | ||
| Salary and profit sharing | 105,829 | 61,427 | |
| Short-term benefits (1) | 250 | 266 | |
| Private pension | 896 | 800 | |
| Termination benefits | 1,395 | 8,413 | |
| Share-based payment | 28,149 | 14,923 | |
| 136,519 | 85,829 | ||
| (1) | Comprises: medical assistance, educational expenses and others. |
In addition, the executive officers (non-statutory) received among remuneration and benefits the total amount of R$22,396 for the year ended December 31, 2024 (R$16,917 for the year ended December 31, 2023). Furthermore, one director held an executive position in one of our subsidiaries, receiving a total of R$492 in remuneration and benefits in the year ended December 31, 2024.
| 29. | Government Grants |
The Company has tax benefits related to ICMS granted by the state governments as follows: Programa de Desenvolvimento Industrial e Comercial de Mato Grosso (“PRODEIC”), Programa de Desenvolvimento do Estado de Pernambuco (“PRODEPE”) and Fundo de Participação e Fomento à Industrialização do Estado de Goiás (“FOMENTAR”), which was migrated to the Regional Development Program (ProGoiás). Such incentives are directly associated to the manufacturing facilities operations, job generation and to the economic and social development.
In the year ended on December 31, 2024, the balance of the tax incentive reserve is R$639,741.
Investment grants totaled R$413,191 on December 31, 2024 (R$349,390 on December 31, 2023), which were recorded in the income statement under Net revenue, Cost of goods sold and Other operating income (expenses), net, according to the nature of each grant.
| 132 |
| Financial Statements, Individual and Consolidated | 2024 a 2023 |
Accounting policy: Government grants are recognized at fair value when there is reasonable assurance that the conditions established will be met and the benefit will be received. |
| 30. | Commitments |
In the normal course of the business, the Company entered into long-term agreements with third parties, which mainly include purchase of, secondary materials, energy inputs, storage and industrialization services, among others to support its activities. In these agreements, the prices agreed may be fixed or to be fixed. These agreements contain termination clauses for non-compliance with essential obligations and the minimum contractually agreed is generally purchased and, for this reason, there are no liabilities recorded in addition to the amount that is recognized on an accrual basis. On December 31, 2024, firm purchase commitments in the Parent Company totaled R$4,164,738 and R$4,523,501 in the Consolidated (R$4,524,719 in the Parent Company and R$5,023,227 in the Consolidated as on December 31, 2023).
| 31. | Insurance Coverage - Consolidated |
The Company’s policy for insurance considers the concentration and relevance of the risks identified in its risk management program.
| 12.31.24 | ||||
| Assets covered | Coverage | Amount of coverage | ||
| Operational risks | Coverage against damage to buildings, facilities, inventory, machinery and equipment, loss of profits. | 4,321,206 | ||
| Transport of goods | Coverage of goods in transit and in inventories. | 1,191,749 | ||
| Civil responsability | Third party complaints. | 487,762 |
Each legal entity has its own coverages, which are not complementary.
| 32. | Transactions that do not Involve Cash |
The following transactions did not involve cash or cash equivalents during the year ended December 31, 2024:
| (i) | Capitalized loan interest: for the year ended December 31, 2024, amounted to R$32,131 in the Parent Company and R$34,003 in the Consolidated (R$51,225 in the Parent Company and R$56,871 in the Consolidated for the year ended December 31, 2023). |
| (ii) | Addition of lease by right-of-use assets and respective lease liability: for year ended on December 31, 2024, amounted to R$868,814 in the parent company and R$1,241,654 in the consolidated (R$1,373,778 in the Parent Company and R$1,420,083 in the Consolidated for the year ended December 31, 2023). |
| 133 |
| Financial Statements, Individual and Consolidated | 2024 a 2023 |
| 33. | Approval of the Financial Statements |
The financial statements were approved and the issuance authorized by the Board of Directors on February 26, 2025.
| BOARD OF DIRECTORS | |
| Global President Office (Non-Independent) | Marcos Antonio Molina dos Santos |
| Vice-Chairman (Non-Independent) | Márcia Aparecida Pascoal Marçal dos Santos |
| Non-Independent Member | Marcos Fernando Marçal dos Santos |
| Non-Independent Member | Márcio Hamilton Ferreira |
| Independent Member | Eduardo Augusto Rocha Pocetti |
| Non-Independent Member | Sérgio Agapito Lires Rial |
| Independent Member | Pedro de Camargo Neto |
| Independent Member | Augusto Marques da Cruz Filho |
| Independent Member | Flavia Maria Bittencourt |
| FISCAL COUNCIL | |
| Member | Marco Antônio Peixoto Simões Velozo |
| Member | Ricardo Florence dos Santos |
| Member | Alexandre Eduardo De Melo |
| AUDIT AND INTEGRITY COMMITTEE | |
| Comittee Coordinator | Augusto Marques da Cruz Filho |
| Member | Eduardo Augusto Rocha Pocetti |
| External Member | Esmir Oliveira |
| BOARD OF EXECUTIVE OFFICERS | |
| Global Chief Executive Officer | Miguel de Souza Gularte |
| Financial and Investor Relations Vice-President | Fábio Luis Mendes Mariano |
| People, Sustainability and Digital Vice-President | Alessandro Rosa Bonorino |
| Vice President of Industrial Operations and Logistics | Artemio Listoni |
| Agribusiness and Product Quality Vice-President | Fabio Duarte Stumpf |
| International Markets and Planning Vice-President | Leonardo Campo Dallorto |
| Brazil Commercial Vice-President | Manoel Reinaldo Manzano Martins Junior |
| Marketing and New Businesses Vice-President | Marcel Sacco |
| Marcos Roberto Badollato | |
| Accounting Director - CRC 1SP219369/O-4 |
| 134 |
 |
INDEPENDENT AUDITORS’ REPORT ON INDIVIDUAL AND CONSOLIDATED FINANCIAL STATEMENTS
To the Board of directors and shareholders of
BRF S.A.
Itajaí – SC
Opinion
We have audited the accompanying individual and consolidated financial statements of BRF S.A. (the Company), identified as parent and consolidated, respectively, which comprise the statement of financial position as of December 31, 2024 and the respective statements of income, of comprehensive income, of changes in equity and of cash flows for the year then ended, and the corresponding explanatory notes, including material accounting policies and other explanatory information.
In our opinion, the financial statements referred to above present fairly, in all material respects, the individual and consolidated financial position of BRF S.A. as of December 31, 2024, its individual and consolidated financial performance and individual and consolidated cash flows for the year then ended, in accordance with accounting practices adopted in Brazil and International Financial Reporting Standards (IFRS) issued by the International Accounting Standards Board (IASB) (currently denominated IFRS Accounting Standards).
Basis for Opinion
We conducted our audit in accordance with Brazilian and International Standards on Auditing (ISAs). Our responsibilities under those standards are further described in the “Auditor’s responsibilities for the audit of the individual and consolidated financial statements” section of our report. We are independent of the Company and its subsidiaries in accordance with the relevant ethical requirements set forth in the Code of Ethics for Professional Accountants and the professional standards issued by the Federal Accounting Council and we have fulfilled our other ethical responsibilities in accordance with these requirements. We believe that the audit evidence we have obtained is sufficient and appropriate to provide a basis for our opinion.
Key audit matters
Key audit matters are those matters that, in our judgment, were of most significance in our audit in the current year. These matters were addressed in the context of our audit of the individual and consolidated financial statements taken as a whole and in forming our opinion on such individual and consolidated financial statements and, therefore, we do not provide a separate opinion on these matters.
| 135 |
| |
| 1. | Impairment of cash-generating units, including intangible assets with indefinite useful life (goodwill) – Notes 13, 14 and 14.1 |
Reason why the matter was considered a key audit matter
The Company has significant amounts recorded under property, plant and equipment and intangible assets (consolidated) on December 31, 2024, in the amounts of R$15,068,229 thousand and R$6,673,211 thousand, respectively. Accounting practices adopted in Brazil and International Financial Reporting Standards (IFRS) issued by the International Accounting Standards Board (IASB) (currently denominated IFRS Accounting Standards) require the Company to annually test the recoverability of amounts recorded as intangible assets with no defined useful life and/or assets with indicators of recoverability losses.
As mentioned in Explanatory Note 14.1, assets impairment test involves a high degree of subjectivity and judgment on the part of management, based on the discounted cash flow method, considering complex subjective and significant assumptions such as sales revenue, commodity costs, discount rate, inflation projection, economic growth, among others.
Therefore, the use of different assumptions can significantly modify the perspective of recoverability of these assets and the possible need to record an impairment adjustment, with a consequent impact on the individual and consolidated financial statements, having been considered an area of risk due to the uncertainties inherent in the process of determining the estimates and judgments involved. Due to these aspects, this topic was, again, considered one of the key audit matters in our audit of the current year.
How the matter was addressed in our audit
Our audit procedures included, among others:
| · | Evaluation of the design of internal control framework implemented by management related to impairment testing (and operational effectiveness of key internal controls); |
| · | Evaluation of the analysis prepared by management, supported by our internal specialists in corporate finance, to evaluate the reasonableness of the model used in management´s evaluation, the logical and arithmetic adequacy of the cash flows projections as well as evaluation of consistency of the key information and assumptions used in the projections of future cash flows, by comparing the budgets approved by the Executive Board and the assumptions and market input (such as sales and cost of commodities), in addition to discount and perpetuity growth rates considered; |
| · | Discussion with management about the business plan; |
| · | Challenge of the assumptions used by management to corroborate if there were assumptions not consistent and/or that required review; |
| · | Assessment of the adequacy of the Company's disclosures regarding certain sensitive assumptions used in the impairment test, that is, those with a significant effect on determining the recoverable amount of the assets subject to the impairment test; and |
| · | Evaluation if the disclosures in notes are consistent with the information and representations obtained from management. |
Based on the procedures performed, we considered that the assumptions and methodologies used by the Company to evaluate the recoverable value of such assets are reasonable, and the information presented in the individual and consolidated financial statements is consistent with the information analyzed in our auditing procedures in the context of those individual and consolidated financial statements taken as a whole.
| 2. | Recoverability of the deferred tax asset (parent and consolidated) – Note 10 |
As of December 31, 2024 the Company has balances of deferred income tax and social contribution assets substantially related to tax losses, negative basis of social contribution and temporary differences arising from temporary provisions recognized in the amounts of R$ 2,238,313 thousand and R$ R$2,331,012 thousand (parent and consolidated, respectively), recognized as non-current assets. These balances of deferred taxes were recognized based on studies that contain projections of future taxable income. The annual study of the recoverability of such assets involves, among others, the use of critical judgments that imply subjectivity concerning taxable income projections and may differ from the actual data and amounts realized.
| 136 |
| |
Therefore, the use of different assumptions and respective uncertainties (such as revenues and cost of commodities) may significantly change the expected realization of these assets and may require recognition of impairment, which would consequently impact the individual and consolidated financial statements. Due to these aspects, this issue was considered, again, a key audit matter in our audit for the current year.
How the matter was addressed in our audit
Our audit procedures included, among others:
| · | Evaluation of the design of internal control framework implemented by management related to the estimate of future taxable income to support the recoverability of deferred tax assets; |
| · | Evaluation of the analysis prepared by management, supported by our internal specialists in corporate finance, to evaluate the reasonableness of the model used in management´s evaluation, the logical and arithmetic adequacy of the cash flows projections as well as evaluation of consistency of the key information and assumptions used in the projections of future taxable income and cash flows, by comparing the budgets approved by the Executive Board and the assumptions and market inputs; |
| · | Discussion with management about the business plan; |
| · | Challenge of the assumptions used by management to corroborate if there were assumptions not consistent and/or that required review; |
| · | Involvement of our professionals specialized in taxes to evaluate the calculation bases of tax losses and negative basis of social contribution and analysis of compliance with tax legislation, as well as temporary differences used by the Company, comparing them with the corresponding tax records; |
| · | Analyzes of the disclosures required in the individual and consolidated financial statements; and |
| · | Evaluation if the disclosures in notes are consistent with the information and representations obtained from management. |
Based on the procedures performed, we considered that the assumptions and methodologies used by the Company to evaluate the recoverable value of such assets are reasonable, and the information presented in the individual and consolidated financial statements is consistent with the information analyzed in our auditing procedures in the context of those individual and consolidated financial statements taken as a whole.
Other matters
Statements of value added
The individual and consolidated statements of value added (DVA) for the year ended December 31, 2024, prepared under the responsibility of the Company’s management and presented as supplemental information for IFRS purposes, have been subject to auditing procedures which were performed together with the audit of the Company’s financial statements. In forming our opinion, we evaluated if these statements are reconciled to the financial statements and accounting records, as applicable, and if their form and content are in accordance with the criteria defined in NBC TG 09 – Statement of Value Added. In our opinion, these statements of value added were appropriately prepared, in all material respects, according to the criteria defined in said technical pronouncement and are consistent in relation to the individual and consolidated financial statements taken as a whole.
| 137 |
| |
Other information accompanying the individual and consolidated financial statements and auditor’s report thereon
The Company’s Management is responsible for this other information that is included in the Management Report.
Our opinion on the individual and consolidated financial statements does not cover the Management Report and we do not express any form of assurance conclusion thereon.
In connection with our audit of the individual and consolidated financial statements, our responsibility is to read the Management Report and, in doing so, consider whether this report is materially inconsistent with the financial statements or our knowledge obtained in the audit, or otherwise, appears to be materially misstated. If, based on the work we have performed, we conclude that there is a material misstatement in the Management Report, we are required to report this fact. We have nothing to report in this regard.
Responsibilities of Management and those charged with governance for the individual and consolidated financial statements
Management is responsible for the preparation and fair presentation of the individual and consolidated financial statements in accordance with accounting practices adopted in Brazil and International Financial Reporting Standards (IFRS) issued by the International Accounting Standards Board (IASB) (currently denominated IFRS Accounting Standards), and for such internal control as management determines is necessary to enable the preparation of financial statements that are free from material misstatement, whether due to fraud or error.
In preparing the individual and consolidated financial statements, management is responsible for assessing the Company’s ability to continue as a going concern, disclosing, as applicable, matters related to going concern and using the going concern basis of accounting in preparing the financial statements, unless management either intends to liquidate the Company or to cease operations, or has no realistic alternative but to do so.
Those charged with the Company’s and its subsidiaries’ governance are responsible for overseeing the financial reporting process.
Auditor’s responsibility for the audit of the individual and consolidated financial statements
Our objectives are to obtain reasonable assurance about whether the individual and consolidated financial statements, taken as a whole, are free from material misstatement, whether due to fraud or error, and to issue an auditor’s report that includes our opinion. Reasonable assurance is a high level of assurance but is not a guarantee that an audit conducted in accordance with Brazilian and International Standards on Auditing will always detect a material misstatement when it exists. Misstatements can arise from fraud or error and are considered material if, individually or in the aggregate, they could reasonably be expected to influence the economic decisions of users taken on the basis of these financial statements.
As part of an audit in accordance with Brazilian and International Standards on Auditing, we exercise professional judgment and maintain professional skepticism throughout the audit. We also:
| 138 |
| |
| · | Identify and assess the risks of material misstatement of the individual and consolidated financial statements, whether due to fraud or error, design and perform audit procedures responsive to those risks, and obtain audit evidence that is sufficient and appropriate to provide a basis for our opinion. The risk of not detecting a material misstatement resulting from fraud is higher than for one resulting from error, as fraud may involve override of internal control, collusion, forgery, intentional omissions or misrepresentations; |
| · | Obtain an understanding of internal control relevant to the audit to design audit procedures that are appropriate in the circumstances, but not for the purpose of expressing an opinion on the effectiveness of the Company’s and its subsidiaries’ internal controls; |
| · | Evaluate the appropriateness of accounting policies used and the reasonableness of accounting estimates and related disclosures made by management; |
| · | Conclude on the appropriateness of management’s use of the going concern basis of accounting and, based on the audit evidence obtained, whether a material uncertainty exists related to events or conditions that may cast significant doubt on the Company’s ability to continue as a going concern. If we conclude that a material uncertainty exists, we are required to draw attention in our auditor’s report to the related disclosures in the individual and consolidated financial statements or, if such disclosures are inadequate, to modify our opinion. Our conclusions are based on the audit evidence obtained up to the date of our auditor’s report. However, future events or conditions may cause the Company to cease to continue as a going concern; |
| · | Evaluate the overall presentation, structure and content of the financial statements, including the disclosures, and whether the individual and consolidated financial statements represent the underlying transactions and events in a manner that achieves fair presentation; and |
| · | Obtain sufficient and appropriate audit evidence regarding the financial statements of the entities or business activities within the group to express an opinion on the individual and consolidated financial statements. We are responsible for the direction, supervision and performance of the group audit and, consequently, for the audit opinion. |
We communicate with those charged with governance regarding, among other matters, the planned scope and timing of the audit and significant audit findings, including any significant deficiencies in internal control that we may have identified during our audit.
We also provide those charged with governance with a statement that we have complied with relevant ethical requirements, including those regarding independence, and communicate to them all relationships and other matters that may reasonably be thought to bear on our independence and, where applicable, related safeguards.
From the matters communicated with those charged with governance, we determined those matters that were of most significance in the audit of the financial statements for the current year and are, therefore, the key audit matters. We describe these matters in our audit report, unless law or regulation preclude public disclosure about the matter or when, in extremely rare circumstances, we determine that a matter should not be communicated in our report because the adverse consequences of doing so would reasonably be expected to outweigh the public interest benefits of such communication.
São Paulo, February 26, 2025.
Grant Thornton Auditores Independentes Ltda.
CRC 2SP-025.583/O-1
Octavio Zampirollo Neto
Accountant CRC 1SP-289.095/O-3
| 139 |
| Financial Statements, Individual and Consolidated | 2024 a 2023 |
The Fiscal Council of BRF S.A., in fulfilling its statutory and legal duties, examined:
| (i) | the financial statements (Parent Company and Consolidated) for the fiscal year ended December 31, 2024; |
| (ii) | the Management Report; and |
| (iii) | the report issued without qualification by Grant Thornton Auditores Independentes Ltda. on February 26, 2025. |
Based on the documents reviewed and the explanations provided, the members of the Fiscal Council, undersigned, issued the opinion that the financial statements and the management report are appropriately presented and in condition of appreciation by the Annual General Meeting.
São Paulo, February 26, 2025.
Marco Antônio Peixoto Simões Velozo
Fiscal Council Member
Ricardo Florence dos Santos
Fiscal Council Member
Alexandre Eduardo De Melo
Fiscal Council Member
| 140 |
| Financial Statements, Individual and Consolidated | 2024 a 2023 |
Summarized Annual Report of the Audit and Integrity Committee
Summary of the Audit Committee Activities in 2024
The current composition of the Audit and Integrity Committee (“CAI”) was elected on April 15, 2024, pursuant to the meeting of the Board of Directors. The Internal Bylaws of the CAI is available at the website https://ri.brf-global.com. The Committee (“CAI”) met periodically as provided in its Internal Regulations, in ordinary and extraordinary meetings, which in the year 2024, totaled 8 meetings. The main topics of discussion are described below, which were presented and discussed with the Company’s Board of Directors.
Issues discussed by the Audit and Integrity Committee
The meetings were attended, whenever required and in accordance with the Agenda, by the Global Chief Executive Officer of the Company, the Vice-Presidents, Executive Directors, Executive Managers, Internal Auditors, Independent Auditors and external advisors to enable the understanding of the processes, internal controls, risks, possible deficiencies and eventual plans for improvement, as well as issuing their recommendations to the Board of Directors and Executive Board of the Company.
The main topics discussed by the Audit and Integrity Committee were:
| · | The Internal Audit received in 2021 a “Certification of Evaluation of the Quality of the Internal Audit Department”, granted by the Institute of Internal Auditors (The IIA), international independent organization which evaluates globally the quality of the internal audit activities in public and private organizations, making BRF the 25th certified company in Brazil, which demonstrates the ongoing investment in an efficient structure of governance, with high ethical and transparency standards; |
| · | Monitoring and supervision of the international investigations by the international authorities, specifically the Saudi Arabia and Turkish Competition Authority; |
| · | Discussion of the planning, scope and main conclusions obtained in the quarterly review (“ITR”) and opinion on the issuance of the financial statements of 2024; |
| · | Monitoring the status of tests on the effectiveness of the Company's internal controls, with a view to addressing any significant deficiencies significant deficiencies that could be reported in the financial statements; |
| · | Discussion, approval and supervision of the work plan and budget of the Internal Audit, as well and its reviews; |
| · | Monitoring and analysis of the outcomes of special investigations; |
| · | Monitoring on the Internal Audit reports; |
| · | Monitoring on the implementation of the action plans resulting from the audit reports, with emphasis on the most critical issues, reporting to the Board of Directors the most relevant ones; |
| 141 |
| Financial Statements, Individual and Consolidated | 2024 a 2023 |
| · | Monitoring on the operation of the Transparency Hotline and on the inquiries and complaints classified as highly critical; |
| · | Monitoring on the review of the Compliance Policies System, practices, trainings and controls by both management and employees, pursuant the anti-corruption law requirements, as well as initiatives focused on maintenance of the 37001:2016 Certification (Anti-Bribery Management Systems); |
| · | Monitoring of actions related to the Integrity System Improvement Plan, which culminated in the signing, on December 28, 2022, of the Leniency Agreement between BRF and the Controladoria Geral da União (“CGU”) and the Advocacia Geral da União ("AGU"); |
| · | Monitoring on the management of the conduct adjustment terms entered with regulatory bodies; |
| · | Monitoring on the questions related to the regulatory bodies and the respective answers sent by management; |
| · | Opinion for approval, by the Board of Directors, of the annual financial statements; |
| · | Review and comments on the quarterly financials reports (“ITR”) and financial statements (“DFP”); |
| · | Evaluation and monitoring, with the management and Internal Audit, of the adequacy of the related parties’ transactions executed by the Company; |
| · | Discussion and monitoring on the update of the Reference Form (“Formulário de Referência”); |
| · | Analysis and opinion of the proposal sent to the Board of Directors for Independent Auditors services, supervision of activities of Independent Audit, involving the scope and the work plan, the insurance of their independence and of the quality of the services provided; |
| · | Monitoring on the themes related to LGPD – General Data Protection Law and themes related to cyber security. |
| 142 |
| Financial Statements, Individual and Consolidated | 2024 a 2023 |
Statutory Audit and Integrity Committee Opinion
In the exercise of its legal and statutory duties, BRF’s Audit Committee has examined the financial statements (Parent Company and Consolidated) for the fiscal year ended December 31, 2024, the management report and the report issued without qualification by Grant Thornton Auditores Independentes Ltda. on February 26, 2025.
There were no instances of significant divergences between the Company’s management, the independent auditors and the Audit Committee with respect to the Company’s Financial Statements.
Based on the examined documents and the clarifications rendered, the members of the Audit Committee, undersigned, issued the opinion that the financial statements are appropriately presented and in conditions for approval.
São Paulo, February 26, 2025.
Augusto Marques da Cruz Filho
Coordinator
Eduardo Augusto Rocha Pocetti
Member
Esmir de Oliveira
Member
| 143 |
| Financial Statements, Individual and Consolidated | 2024 a 2023 |
Opinion of Executive Board on the Consolidated Financial Statements and Independent Auditor’s Report
In compliance with the dispositions of article 27, §1, sections V and VI, of the CVM Resolution Nº 80/22, the executive board of BRF S.A. states that:
| (i) | reviewed, discussed and agreed with the options expressed in the audit report issued by Grant Thornton Auditores Independentes Ltda. on December 31, 2024, and |
| (ii) | reviewed, discussed and agreed with the Company’s financial statements for the fiscal year ended December 31, 2024. |
São Paulo, February 26, 2025.
Miguel de Souza Gularte
Global Chief Executive Officer
Fábio Luis Mendes Mariano
Financial and Investor Relations Vice-President
Alessandro Rosa Bonorino
People, Sustainability and Digital Vice-President
Artemio Listoni
Vice President of Industrial Operations and Logistics
Fabio Duarte Stumpf
Agribusiness and Product Quality Vice-President
Leonardo Campo Dallorto
International Markets and Planning Vice-President
Manoel Reinaldo Manzano Martins Junior
Brazil Commercial Vice-President
Marcel Sacco
Marketing and New Businesses Vice-President
| 144 |