SECURITIES AND EXCHANGE COMMISSION
Washington, D.C. 20549
FORM 6-K
Report of Foreign Private Issuer
Pursuant to Rule 13a -16 or 15d -16 of
the Securities Exchange Act of 1934
Report on Form 6-K dated July 22, 2019
(Commission File No. 000-30918)
TELE2 AB (PUBL)
Skeppsbron 18
P.O. Box 2094
SE-103 13
Stockholm, Sweden
(Name and address of registrant’s principal executive office)
Indicate by check mark whether the registrant files or will file annual reports under cover of Form 20-F or Form 40-F:
Form 20-F: ☒ Form 40-F: ☐
Indicate by check mark if the registrant is submitting the Form 6-K in paper as permitted by Regulation S-T Rule 101(b)(1):
Yes: ☐ No: ☒
Indicate by check mark if the registrant is submitting the Form 6-K in paper as permitted by Regulation S-T Rule 101(b)(7):
Yes: ☐ No: ☒
Indicate by check mark whether the registrant by furnishing the information contained in this form is also thereby furnishing the information to the Commission pursuant to Rule 12g3-2(b) under the Securities Exchange Act of 1934.
Yes: ☐ No: ☒
Enclosures:
| ● | Press Release: Interim Report Second Quarter 2019, dated July 17, 2019 |
| ● | Interim Report Second Quarter 2019, dated July 17, 2019 |
| ● | Second Quarter 2019 Results Presentation, dated July 17, 2019 |
| ● | 2019 Q2 Financials to the Market |
| ● | Press Release: Notice To Attend The Extraordinary General Meeting, dated July 17, 2019 |
Tele2 AB
Skeppsbron 18
P.O Box 2094
SE-103 13 Stockholm, Sweden
Telephone +46 8 5620 0060
Fax: +46 8 5620 0040
www.tele2.com
2019-07-17
PRESS RELEASE
Interim Report Second Quarter 2019
Stockholm – Tele2 AB (“Tele2”) (Nasdaq Stockholm: TEL2 A and TEL2 B) today announces its consolidated results for the second quarter 2019.
CEO comment by Anders Nilsson
“In the second quarter of 2019 we took additional steps to focus our geographical footprint by closing the sale in Kazakhstan and announcing the sale of our Croatian business. We also propose an extraordinary dividend of SEK 6 per share to distribute the proceeds from the transactions in Kazakhstan and the Netherlands to our shareholders. The Com Hem integration is well under way and we realized an additional SEK 100 million of synergies, reaching our full year run-rate target of SEK 450 million already after six months. In Sweden, we launched a rebranding campaign of the Tele2 brand and continued to see progress on our fixed mobile convergence (FMC) strategy with 93,000 customers now on FMC offers, paving the way for future revenue growth as we reduce churn and increase pricing power.”
Highlights
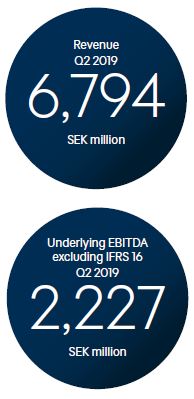
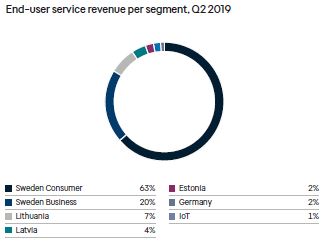
| · | Revenue of SEK 6.8 billion, representing organic decline of –2 percent |
| · | End-user service revenue of SEK 5.1 billion, representing organic decline of –1 percent |
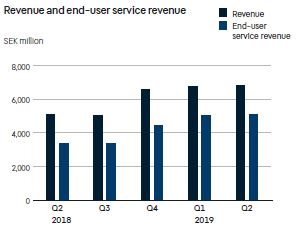
| · | Organic growth of 3 percent in underlying EBITDA, excluding IFRS 16, to SEK 2.2 billion for the Group |
| · | Organic growth of 3 percent in underlying EBITDA, excluding IFRS 16, to SEK 1.8 billion in Sweden, driven by synergies from the Com Hem merger |
| · | Net profit from total operations of SEK 2.1 billion impacted by a SEK 1.6 billion capital gain from the sale in Kazakhstan and a goodwill impairment of SEK –0.5 billion in Estonia |
| · | Profit after financial items (EBT) was SEK 0.3 billion (0.7 billion) |
| · | Earnings per share after dilution was SEK 2.98 (0.81) |
| · | Proposed extraordinary dividend of SEK 6.00 per share to distribute proceeds from asset sales in Kazakhstan and the Netherlands |
| · | Equity free cash flow more than doubled to SEK 1.1 billion, driven by the Com Hem merger |
| · | Financial guidance unchanged, capex updated to reflect Croatia now reported as a discontinued operation |
Teleconference and webcast
Tele2 will host a teleconference and webcast with presentation at 10:00 CEST (09:00 BST, 04:00 EDT) on Wednesday, July 17, 2019. The presentation will be held in English and will also be available as a webcast at Tele2’s website: www.tele2.com
Dial-in information
To make sure you are connected in time for the teleconference, please dial in a few minutes in advance and register your attendance. Use Confirmation Code 3047523.

Tele2 AB
Skeppsbron 18
P.O Box 2094
SE-103 13 Stockholm, Sweden
Telephone +46 8 5620 0060
Fax: +46 8 5620 0040
www.tele2.com
2019-07-17
Dial-in numbers:
SE: +46 (0) 8 50 69 21 80
UK: +44 (0) 2071 928000
US: +1 631 510 74 95
For more information, please contact:
Joel Ibson, Head of Corporate Communications, Phone: +46 766 26 44 00
Marcus Lindberg, Head of Investor Relations, Phone: +46 73 439 25 40
This information is information that Tele2 AB is obliged to make public pursuant to the EU Market Abuse Regulation and the Securities Markets Act. The information was submitted for publication, through the agency of the contact persons set out above, at 07:00 CEST on July 17, 2019.
TELE2’S MISSION IS TO FEARLESSLY LIBERATE PEOPLE TO LIVE A MORE CONNECTED LIFE.
We constantly strive to be the truly integrated challenger – providing speed, data and video content, no matter where or when. Ever since Tele2 was founded in 1993, we have continued to challenge prevailing norms and dusty monopolies. Today, our award winning networks enable mobile and fixed connectivity, telephony, data network services, TV, streaming and global IoT solutions for millions of customers. We drive growth through customer satisfaction and smart combined offerings. Tele2 has been listed on Nasdaq Stockholm since 1996. In 2018, Tele2 generated revenue of SEK 30 billion and reported an underlying EBITDA of SEK 9 billion. For latest news and definitions of measures, please see our homepage www.tele2.com

TELE2
Interim Report – Second Quarter
Interim Report – Second Quarter
Q2 2019 HIGHLIGHTS | |
| ● | Revenue of SEK 6.8 billion, representing organic decline of -2 percent |
| ● | End user service revenue of SEK 5.1 billion, representing organic decline of -1 percent |
| ● | Organic growth of 3 percent in underlying EBITDA excluding IFRS 16 to SEK 2.2 billion for the Group |
| ● | Organic growth of 3 percent in underlying EBITDA excluding IFRS 16 to SEK 1.8 billion in Sweden, driven by synergies from the Com Hem merger |
| ● | Net profit from total operations of SEK 2.1 billion impacted by a SEK 1.6 billion capital gain from the sale in Kazakhstan and a goodwill impairment of SEK -0.5 billion in Estonia |
| ● | Proposed extraordinary dividend of SEK 6.00 per share to distribute proceeds from asset sales in Kazakhstan an the Netherlands SEK 1.1 billion, driven by the Com Hem merger |
| ● | Equity free cash flow more than doubled to |
| ● | Financial guidance unchanged, capex updated to reflect Croatia now reported as a discontinued operation, see page 7 |
Key Financial Data
| SEK million | Apr–Jun 2019 IFRS 16 | Apr–Jun 2018 IAS 17 | Jan–Jun 2019 IFRS 16 | Jan–Jun 2018 IAS 17 |
| Continuing operations | ||||
| End-user service revenue | 5,079 | 3,356 | 10,106 | 6,658 |
| Revenue | 6,794 | 5,113 | 13,537 | 10,107 |
| Underlying EBITDA | 2,502 | 1,460 | 5,048 | 2,894 |
| EBITDA | 2,231 | 1,332 | 4,515 | 2,680 |
| Operating profit | 431 | 835 | 1,478 | 1,709 |
| Profit after financial items | 311 | 725 | 1,257 | 1,516 |
| Total operations | ||||
| Net profit/loss | 2,130 | 443 | 3,154 | 793 |
| Earnings per share after dilution (SEK) | 2.98 | 0.81 | 4.38 | 1.49 |
Key financial data including Com Hem proforma
| SEK million | Apr–Jun 2019 | Apr–Jun 2018 | Organic % | Jan–Jun 2019 | Jan–Jun 2018 | Organic % |
| Continuing operations | ||||||
| End-user service revenue | 5,079 | 5,101 | –1% | 10,106 | 10,121 | –1% |
| – Mobile end-user service revenue | 2,766 | 2,707 | 1% | 5,474 | 5,338 | 2% |
| – Fixed end-user service revenue | 1,858 | 1,946 | –5% | 3,738 | 3,890 | –4% |
| Revenue | 6,794 | 6,928 | –2% | 13,537 | 13,706 | –2% |
| Underlying EBITDA excluding IFRS 16 | 2,227 | 2,150 | 3% | 4,482 | 4,264 | 4% |
| Capex excluding spectrum and leases | 549 | 638 | 1,177 | 1,238 | ||
OCF excluding spectrum paid, rolling 12 months1) | 6,362 | 6,227 | ||||
| Total operations | ||||||
| Economic net debt to underlying EBITDAaL | 2.4x |
1) Operating cash flow, see Non-IFRS measures page 31.
Continuing operations
Figures presented in this report refer to Q2 2019 and continuing operations unless otherwise stated. Figures shown in parentheses refer to the comparable periods in 2018. Tele2 Croatia is reported as a discontinued operation for all periods. Discontinued operations also include the former operations in the Netherlands and Kazakhstan. See Note 11.
Non-IFRS measures
This report contains certain non-IFRS measures which are defined and reconciliated to the closest reconcilable line items in the section Non-IFRS measures on page 31. Note that organic growth rates, as further defined in the Non-IFRS section, includes Com Hem pro forma for all periods. For further definitions of industry terms and acronyms, please refer to the Investor section at www.Tele2.com.
2 (40)
TELE2
Interim Report – Second Quarter
Interim Report – Second Quarter

CEO WORD – Q2 2019
In the second quarter of 2019 we took additional steps to focus our geographical footprint by closing the sale in Kazakhstan and announcing the sale of our Croatian business. We also propose an extraordinary dividend of SEK 6 per share to distribute the proceeds from the transactions in Kazakhstan and the Netherlands to our shareholders. The Com Hem integration is well under way and we realized an additional SEK 100 million of synergies, reaching our full year run-rate target of SEK 450 million already after six months. In Sweden, we launched a rebranding campaign of the Tele2 brand and continued to see progress on our fixed mobile convergence (FMC) strategy with 93,000 customers now on FMC-offers, paving the way for future revenue growth as we reduce churn and increase pricing power.
Q2 2019 summary
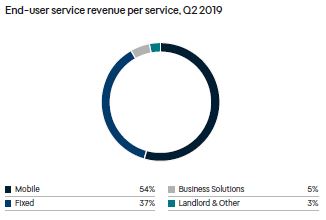
Group organic end-user service revenue (EUSR) declined by 1 percent with the Baltics growing 6 percent while Sweden declined by 2 percent. In Sweden there was pressure on EUSR within both the consumer and business segments. In the consumer segment we saw a 1 percent growth in mobile EUSR while fixed EUSR declined by 3 percent because of lower fixed-line price increases compared to last year and volume decline in legacy services. The business segment had a strong mobile RGU intake in the quarter but pressure on ASPU resulted in continued EUSR decline. Group underlying EBITDA excluding IFRS 16 grew by 3 percent organically, with the Baltics growing by 10 percent and Sweden by 3 percent driven by synergies which were partially offset by reinvestment into the business and pressure on EUSR.
Future growth through a combination of volume and price via FMC
In the Sweden Consumer segment, we see two ways to create revenue growth going forward – through volume growth and price adjustments. During the first half of 2019, our efforts have been aimed at the first part of this equation, and we have made good progress so far. We saw strong volumes in the quarter with net adds for core services (mobile postpaid, fixed broadband and digital TV via cable & fiber) of 34,000 RGUs as a result of successful rebranding of the Tele2 brand, attractive introductory pricing on broadband and reduced churn due to lower price increases and increased FMC penetration, as well as a widened pricing gap between Tele2 and competitors. While volume growth is positive as we gain a larger customer base providing recurring revenue, we see pressure on ASPU, resulting in a slowdown in EUSR growth to 2 percent in our core services. Combined with decline in EUSR from legacy services, this resulted in negative EUSR growth in the segment this quarter.
The key here is to find a balance between volume and price, and our FMC-strategy is a way to do both. We already see signs of reduced churn for FMC-customers, helping us grow volumes, and we also see strong pricing power among this customer base as customer satisfaction is significantly higher than for non-FMC customers. Over the mid-term, FMC will be key to create revenue growth through reduced churn, and in the near-term we expect it to support price adjustments which we plan already this year.
Continued delivery on cost synergies
The transformation of Tele2 and the integration with Com Hem made great progress this quarter and we realized an additional SEK 100 million of cost synergies, reaching our full year annual run-rate target of SEK 450 million already after six months. We now aim to reach an annual run-rate of SEK 600 million by the end of 2019.
The cost synergies were mainly related to headcount reductions across the Swedish organization as well as changes to the organizational structure to improve collaboration across the network, IT and commercial departments. We incurred SEK 227 million of integration costs this quarter and have so far incurred SEK 592 million of the expected SEK 1 billion of restructuring costs.
While we realized SEK 100 million of cost synergies in the quarter, the net effect in underlying EBITDA was partly offset by revenue decline as well as investments into the business which will help us return to revenue growth over time, such as the rebranding of Tele2 and product development connected to our FMC offerings. We expect to return to revenue growth as we ramp up revenue synergies next year and execute on price adjustments later this year. Meanwhile we see an opportunity for further cost reduction by turning Tele2 into a truly integrated operator. We are currently planning this second phase of cost reductions and aim to communicate scope and timing later this year.
3 (40)
TELE2
Interim Report – Second Quarter
Interim Report – Second Quarter
Taking steps to optimize our network strategy
As a part of our ongoing effort to ensure that we have the most reliable and cost-efficient networks in the countries where we operate, we announced two new initiatives in the quarter. We signed an agreement with the operator Bite to create a network sharing JV in Latvia and Lithuania. Given the success of our network JVs in Sweden, we are confident that this will help us improve network capacity and coverage for our customers, while reducing cost and capex and strengthen our mobile centric convergence strategy.
In Sweden we have initiated an audit of our mobile and IP core networks to ensure that we have a reliable network, prevent future outages and find potential improvements in our processes. We see this audit as a prudent step to secure delivery of high-quality services to our customers and we do not expect that this will result in need for additional investments above the levels we guide for.
Looking forward
With the steps taken to optimize our geographical footprint, we can now focus on our core Baltic Sea region where we see a future of sustainable revenue growth and cash flow generation. We will continue to deliver cost synergies in Sweden during the second half of the year, while ramping up our initiatives to return to revenue growth. We expect initiatives taken this quarter, such as the rebranding campaign and introduction of FMC offers to the Boxer customer base, to help us return to revenue growth next year and support price adjustments in the near term. We will continue working towards the announced cost reduction target and take concrete steps towards our vision of Tele2 becoming a truly integrated operator, running an agile operation that can serve our customers even better while operating the business more efficiently.
Anders Nilsson
President and Group CEO
4 (40)
TELE2
Interim Report – Second Quarter
Interim Report – Second Quarter
Financial overview
Analysis of income statement
Continuing operations SEK million | Apr–Jun 2019 IFRS 16 | Apr–Jun 2018 IAS 17 | Jan–Jun 2019 IFRS 16 | Jan–Jun 2018 IAS 17 | |
| End-user service revenue | 5,079 | 3,356 | 10,106 | 6,658 | |
| Revenue | 6,794 | 5,113 | 13,537 | 10,107 | |
| Underlying EBITDA | 2,502 | 1,460 | 5,048 | 2,894 | |
| Items affecting comparability | –271 | –129 | –532 | –214 | |
| EBITDA | 2,231 | 1,332 | 4,515 | 2,680 | |
| Depreciation/amortization | –1,276 | –496 | –2,522 | –984 | |
| – of which amortization of surplus from acquisitions | –298 | –39 | –596 | –75 | |
| Impairment | –452 | – | –452 | – | |
| Result from shares in joint ventures and associated companies | –73 | –0 | –63 | 13 | |
| Operating profit | 431 | 835 | 1,478 | 1,709 | |
| Net interest and other financial items | –120 | –111 | –221 | –193 | |
| Income tax | –204 | –166 | –426 | –362 | |
| Net profit | 107 | 559 | 831 | 1,154 | |
| Reconciliation of leasing effects | |||||
| Underlying EBITDA | 2,502 | 1,460 | 5,048 | 2,894 | |
| Reverse IFRS 16 effect | –276 | – | –566 | – | |
Underlying EBITDA excluding IFRS 161) | 2,227 | 1,460 | 4,482 | 2,894 | |
| Underlying EBITDA | 2,502 | 1,460 | 5,048 | 2,894 | |
| Lease depreciation | –296 | – | –570 | – | |
| Lease interest costs | –20 | – | –39 | – | |
| Underlying EBITDAaL | 2,187 | 1,460 | 4,438 | 2,894 |
1) Underlying EBITDA excluding IFRS 16, see Non-IFRS measures page 31.
Revenue increased by 33 percent due to the merger with Com Hem. Organic revenue declined by 2 percent, mainly driven by decline in end-user service revenue and equipment revenue in Sweden. Mobile end-user service revenue contributed positively with growth of 1 percent, while fixed end-user service revenue declined organically by 5 percent.
Underlying EBITDA grew by 71 percent mainly as a result of the merger with Com Hem and the implementation of IFRS 16 which removes the cost of operating leases from underlying EBITDA, starting January 1, 2019. To facilitate comparability during 2019, Tele2 reports underlying EBITDA excluding IFRS 16. Organic growth in underlying EBITDA excluding IFRS 16 was 3 percent.
Following the implementation of IFRS 16, Tele2 uses underlying EBITDAaL (EBITDA after Leases) as a complementary measure of profitability going forward since it reflects the cost of operating leases. It will also be used as denominator when measuring financial leverage.
Items affecting comparability amounted to SEK –271 (–129) million, mainly as a result of the merger with Com Hem, Note 3.
Depreciation/amortization increased both as a result of the inclusion of Com Hem and the implementation of IFRS 16, with SEK 296 million of depreciation of right-of-use assets (leased assets) in the quarter.
Operating profit declined to SEK 431 (835) million, mainly due to a good-will impairment of SEK –452 million which was recognized in Estonia. Please refer to Note 3 for more details. Further, operating profit was impacted negatively by amortization of surplus values from Tele2’s 25 percent share in T-Mobile Netherlands.
 |  |
5 (40)
TELE2
Interim Report – Second Quarter
Interim Report – Second Quarter
Analysis of cash flow statement
Total operations SEK million | Apr–Jun 2019 IFRS 16 | Apr–Jun 2018 IAS 17 | Jan–Jun 2019 IFRS 16 | Jan–Jun 2018 IAS 17 |
| Underlying EBITDA, continuing operations | 2,502 | 1,460 | 5,048 | 2,894 |
| Items affecting comparability, continuing operations | –271 | –129 | –532 | –214 |
| EBITDA, continuing operations | 2,231 | 1,332 | 4,515 | 2,680 |
| EBITDA, discontinued operations | 2,134 | 361 | 2,681 | 599 |
| Amortization of lease liabilities | –297 | –0 | –679 | –1 |
| Capex paid | –720 | –675 | –2,391 | –1,515 |
| Changes in working capital | –84 | –115 | 32 | –582 |
| Net financial items paid | –178 | –117 | –309 | –205 |
| Taxes paid | –411 | –280 | –703 | –425 |
| Other cash items | –1,580 | 6 | –1,614 | 27 |
| Equity free cash flow | 1,095 | 510 | 1,533 | 578 |
| Equity free cash flow, continuing operations | 995 | 409 | 1,326 | 850 |
| Equity free cash flow, continuing operations, rolling 12 months | 2,474 | 2,401 |
EBITDA from total operations amounted to SEK 4,365 million, including a SEK 141 million contribution from the discontinued operation in Croatia, SEK 395 million from the discontinued operation in Kazakhstan and SEK 1,608 million of capital gains from the sale of the Kazakhstan operation. For more details please refer to Note 11.
Capex paid increased to SEK –720 (–675) million, driven by the inclusion of Com Hem.
Amortization of lease liabilities is reported since January 1, 2019, following the implementation of IFRS 16 and reflects the payment for leased assets which is no longer reflected within EBITDA.
Other cash items amounted to SEK –1,580 (6) million due a reversal of the capital gains in Kazakhstan. The cash proceeds from the sale are reflected in the cash flow from investing activities in the cash flow statement.
Equity free cash flow (EFCF) was higher than in the corresponding period last year, mainly as a result of the merger with Com Hem.
Analysis of financial position
Total operations SEK million | Jun 30 2019 IFRS 16 | Dec 31 2018 IAS 17 |
| Bonds | 20,440 | 20,580 |
| Commercial papers | 800 | 4,491 |
| Financial institutions and other liabilities | 4,709 | 3,220 |
| Cash and cash equivalents | –3,713 | –404 |
| Other adjustments | –185 | –37 |
| Economic net debt | 22,051 | 27,849 |
| Lease liabilities | 6,041 | 17 |
| Liabilities related to Kazakhstan | – | 1,016 |
| Net debt | 28,093 | 28,881 |
| Economic net debt to Underlying EBITDAaL | 2.4x | 2.8x |
| Unutilized overdraft facilities and credit lines | 9,323 | 9,116 |
Economic net debt/underlying EBITDAaL (financial leverage) of 2.4x (2.8x) was temporarily below our target range of 2.5x–3.0x. We expect financial leverage to return to the target range once the proposed extraordinary dividend of 6.00 SEK per share (approximately SEK 4.1 billion) is paid out to shareholders.
 |  |
6 (40)
TELE2
Interim Report – Second Quarter
Interim Report – Second Quarter
Financial guidance
Financial guidance unchanged, capex updated to reflect Croatia reported as a discontinued operation Tele2 AB gives the following guidance for continuing operations in constant currencies and including Com Hem pro forma |
| Mid-term ambition | |
| ● | Low-single digit growth of end-user service revenue (unchanged) |
| ● | Mid-single digit growth of underlying EBITDAaL (unchanged) |
| ● | Capex excluding spectrum and leasing assets of SEK 2.8–3.3 billion (SEK 3.0–3.5 billion previously) during roll-out of 5G and Remote-PHY |
| Full-year 2019 | |
| ● | End-user service revenue is expected to be approximately unchanged compared with 2018 as revenue growth-enhancing initiatives are being rolled out and are estimated to have impact in the following years (unchanged) |
| ● | Mid-single digit growth of underlying EBITDA excluding IFRS 16 (unchanged) |
| ● | Capex excluding spectrum and leasing assets of between SEK 2.6–2.9 billion (SEK 2.9–3.2 billion previously) |
Dividend
The Annual General Meeting on May 6, 2019 approved an ordinary dividend of SEK 4.40 per ordinary A and B share, to be paid out in two equal tranches. The first tranche of SEK 2.20 was paid out to shareholders on May 13, 2019 and the second tranche will be paid out on October 7, 2019.
In addition, the Board has proposed an extraordinary dividend of SEK 6.00 per ordinary A and B share connected to the proceeds from the sales in Kazakhstan and the Netherlands. Shareholders have been invited to an Extraordinary General Meeting (EGM) on August 22, 2019 to vote on the extraordinary dividend. If the EGM decides in accordance with the proposal by the Board of Directors, the extraordinary dividend is expected to be distributed to shareholders on August 29, 2019. The first day of trading in the shares excluding the right to receive dividend is expected to be August 22 and the record date August 26.
Financial policy
The financial policy has been updated to reflect the implementation of the IFRS 16 accounting standard from January 1, 2019. The changes are currently not expected to have any implications for the level of borrowings or shareholder remuneration of the Group.
| ● | Tele2 will seek to operate within a range for economic net debt to underlying EBITDAaL of between 2.5–3.0x, and to maintain investment grade credit metrics |
| ● | Tele2’s policy will aim to maintain target leverage by distributing capital to shareholders through: |
| - | An ordinary dividend of at least 80 percent of equity free cash flow; and |
| - | Extraordinary dividends and/or share repurchases, based on remaining equity free cash flow, proceeds from asset sales and re-leveraging of underlying EBITDAaL growth |
7 (40)
TELE2
Interim Report – Second Quarter
Interim Report – Second Quarter
Overview by segment
Sweden
The integration with Com Hem, which is the main focus of the Swedish business, progressed faster than planned and cost synergies had an impact of approximately SEK 100 million in the quarter. The net effect in underlying EBITDA was partly offset by revenue decline as well as investments into the business. The annualized run-rate of the cost synergies reached SEK 450 million at the end of Q2 and the target has been increased to a run-rate of SEK 600 million by the end of 2019 (up from SEK 450 million). Integration costs of SEK 227 million for the Com Hem merger were incurred in the quarter, for a total of SEK 592 million since the integration program started.
Proforma review including Com Hem
The following proforma review of the Swedish business describes the business as if Com Hem had been part of the Tele2 Group throughout all reviewed periods.
Revenue and total end-user service revenue decreased by 2 percent as legacy fixed services in both the consumer and business segments continued to decline, while mobile end-user service revenue growth was positive. Underlying EBITDA excluding IFRS 16 grew by 3 percent, driven by cost synergies from the integration and restructuring, partly offset by the decline in end-user service revenue and investment into FMC-capabilities.
| Financials SEK million | Apr–Jun 2019 | Apr–Jun 2018 Proforma | Organic % | Jan–Jun 2019 | Jan–Jun 2018 proforma | Organic % |
| Revenue | 5,457 | 5,587 | –2% | 10,928 | 11,145 | –2% |
| – Sweden Consumer | 3,859 | 3,944 | –2% | 7,658 | 7,800 | –2% |
| – Sweden Business | 1,598 | 1,643 | –3% | 3,270 | 3,345 | –2% |
| Underlying EBITDA | 2,022 | 1,731 | 4,129 | 3,494 | ||
| Underlying EBITDA excluding IFRS 16 | 1,782 | 1,731 | 3% | 3,630 | 3,494 | 4% |
| – Sweden Consumer | 1,447 | 1,408 | 3% | 2,917 | 2,797 | 4% |
| – Sweden Business | 335 | 323 | 4% | 713 | 697 | 2% |
| Underlying EBITDA margin excluding IFRS 16 | 33% | 31% | 33% | 31% | ||
| Capex | ||||||
| Network | 237 | 172 | 439 | 353 | ||
| IT | 160 | 118 | 337 | 230 | ||
| Customer equipment | 16 | 106 | 142 | 227 | ||
| Other | 44 | 16 | 85 | 32 | ||
| Capex excluding spectrum and leases | 458 | 413 | 1,003 | 842 | ||
| Spectrum | – | – | – | – | ||
| Right-of-use-assets (leases) | 398 | – | 638 | – | ||
| Capex | 857 | 413 | 1,641 | 842 | ||
| Capex excluding spectrum and leases / revenue | 8% | 7% | 9% | 8% |
8 (40)
TELE2
Interim Report – Second Quarter
Interim Report – Second Quarter
Sweden Consumer
The consumer market was stable overall with some positive pricing movements in the premium end of the market. A rebranding campaign was launched for the Tele2 brand with the aim of lifting it to a more premium position, and the Boxer brand was included in the FMC benefit scheme for the first time. Out of the addressable FMC-base of approximately 300,000 customers who have both mobile and fixed services from the Tele2 Group, 93,000 customers are now on FMC-bundles.
The Mobile Postpaid RGU stock saw strong growth with net adds of 31,000 RGUs driven by both the Tele2 and Comviq brands due to a successful rebranding campaign of the Tele2 brand and lower churn. Mobile end-user service revenue returned to growth this quarter as prepaid end-user service revenue decline abated on improvements in both volume and ASPU, and growth in postpaid end-user service revenue continued, mainly driven by higher net adds.
The Fixed Broadband RGU stock grew steadily with 13,000 net adds while revenue growth slowed down to 5%, mainly due to smaller price increases compared to last year along with temporary campaigns focusing on introductory discounts which put pressure on ASPU in the quarter.
The Com Hem TV RGU base grew by 2,000, an improvement compared to Q2 2018 due to lower churn following smaller price increases. The DTT RGU base contracted by –9,000, mainly because of customers churning in areas that get connected to fiber. TV end-user service revenue decreased by 6 percent, driven mainly by the decline in the Boxer RGU stock, somewhat offset by successful price adjustments in the DTT RGU base.
Underlying EBITDA excluding IFRS 16 increased by 3 percent, driven by synergies from the integration with Com Hem.
| Operating data thousands | Apr–Jun 2019 | Apr–Jun 2018 proforma | Jun 30 2019 | Jun 30 2018 Proforma | Organic % | |
| RGUs | Net Intake | RGU base | ||||
| Mobile | 31 | –8 | 2,958 | 2,968 | 0% | |
| – Postpaid | 19 | –1 | 1,841 | 1,794 | 3% | |
| – Prepaid | 12 | –7 | 1,117 | 1,173 | –5% | |
| Fixed | –10 | –13 | 2,191 | 2,243 | –2% | |
| – Fixed broadband | 13 | 11 | 852 | 801 | 6% | |
| – Digital TV | –7 | –12 | 1,041 | 1,074 | –3% | |
| – Cable & Fiber | 2 | 1 | 663 | 654 | 1% | |
| – DTT | –9 | –13 | 378 | 420 | –10% | |
| – Fixed telephony & DSL | –15 | –13 | 298 | 368 | –19% | |
| Addressable fixed footprint | 71 | 78 | 3,249 | 2,948 | 10% | |
| KPIs and financials | Apr–Jun 2019 | Apr–Jun 2018 proforma | Organic % | Jun 30 2019 | Jun 30 2018 Proforma | Organic % |
| ASPU (SEK) | ||||||
| Mobile | 168 | 164 | 2% | 166 | 162 | 2% |
| – Postpaid | 217 | 217 | 0% | 216 | 215 | 0% |
| – Prepaid | 87 | 84 | 4% | 84 | 83 | 2% |
| Fixed | 233 | 233 | 0% | 232 | 231 | 1% |
| – Fixed broadband | 247 | 249 | –1% | 247 | 246 | 0% |
| – Digital TV | 258 | 264 | –2% | 257 | 263 | –2% |
| – Cable & Fiber | 234 | 244 | –4% | 235 | 242 | –3% |
| – DTT | 300 | 295 | 2% | 294 | 294 | 0% |
| – Fixed telephony & DSL | 107 | 110 | –2% | 109 | 109 | 0% |
| Financials (SEK million) | ||||||
| Mobile | 1,481 | 1,463 | 1% | 2,938 | 2,914 | 1% |
| – Postpaid | 1,190 | 1,168 | 2% | 2,369 | 2,320 | 2% |
| – Prepaid | 290 | 295 | –1% | 569 | 594 | –4% |
| Fixed | 1,533 | 1,575 | –3% | 3,063 | 3,130 | –2% |
| – Fixed broadband | 627 | 595 | 5% | 1,244 | 1,166 | 7% |
| – Digital TV | 808 | 856 | –6% | 1,615 | 1,713 | –6% |
| – Cable & Fiber | 464 | 479 | –3% | 930 | 952 | –2% |
| – DTT | 344 | 377 | –9% | 685 | 761 | –10% |
| – Fixed telephony & DSL | 98 | 124 | –20% | 204 | 252 | –19% |
| Landlord & Other | 178 | 184 | –3% | 354 | 368 | –4% |
| End-user service revenue | 3,191 | 3,221 | –1% | 6,355 | 6,412 | –1% |
| Operator revenue | 220 | 203 | 410 | 390 | ||
| Equipment revenue | 448 | 520 | 893 | 998 | ||
| Revenue | 3,859 | 3,944 | –2% | 7,658 | 7,800 | –2% |
| Underlying EBITDA | 1,603 | 1,408 | 3,245 | 2,797 | ||
| Underlying EBITDA excluding IFRS 16 | 1,447 | 1,408 | 3% | 2,917 | 2,797 | 4% |
| Underlying EBITDA margin excluding IFRS 16 | 38% | 36% | 38% | 36% | ||
9 (40)
TELE2
Interim Report – Second Quarter
Interim Report – Second Quarter
Sweden Business
The business is undergoing a period of restructuring to focus on higher-margin, network-based ICT services, regain revenue growth and make structural cost savings.
There was intense competition in the public sector segment as operators focus on defending existing contracts and the number of appeals in public tenders have increased, causing delays in implementation. The SME segment continues to be competitive with fighter brands offering consumer-like pricing to SOHO customers.
Tele2 continued its positive trend in RGU growth, driven by the Large Enterprise segment.
New contracts were signed with both municipalities and large enterprises including Stena Fastigheter, the Municipality of Gotland, the Swedish Transport Agency and Ovako.
Total end-user service revenue declined by 4 percent driven by price erosion on the mobile and fixed data market and declining demand for legacy fixed voice services, partly offset by growth in Network as a Service and Cloud PBX solutions.
Underlying EBITDA excluding IFRS 16 increased by 4 percent as cost reductions mitigated declines in end-user service revenue.
Operating data thousands | Apr–Jun 2019 | Apr–Jun 2018 proforma | Jun 30 2019 | Jun 30 2018 proforma | Organic % | ||
| RGUs | Net Intake | RGU base | |||||
| Mobile | |||||||
| – Postpaid | 17 | 12 | 913 | 867 | 5% | ||
| KPIs and financials | Apr–Jun 2019 | Apr–Jun 2018 proforma | Organic % | Jun 30 2019 | Jun 30 2018 proforma | Organic % | |
| ASPU (SEK) | |||||||
| Mobile | |||||||
| – Postpaid | 168 | 184 | –9% | 171 | 186 | –8% | |
| Financials (SEK million) | |||||||
| Mobile | 456 | 475 | –4% | 931 | 947 | –2% | |
| Fixed | 276 | 309 | –11% | 571 | 633 | –10% | |
| Solutions | 276 | 264 | 5% | 540 | 525 | 3% | |
| End-user service revenue | 1,008 | 1,047 | –4% | 2,042 | 2,106 | –3% | |
| Operator revenue, excluding Wholesale | 35 | 35 | 59 | 66 | |||
| Equipment revenue | 375 | 421 | 821 | 888 | |||
| Wholesale | 170 | 139 | 338 | 284 | |||
| Internal sales | 10 | 1 | 10 | 2 | |||
| Revenue | 1,598 | 1,643 | –3% | 3,270 | 3,345 | –2% | |
| Underlying EBITDA | 419 | 323 | 884 | 697 | |||
| Underlying EBITDA excluding IFRS 16 | 335 | 323 | 4% | 713 | 697 | 2% | |
| – of which Wholesale | 77 | 37 | 150 | 104 | |||
| Underlying EBITDA margin excluding IFRS 16 | 21% | 20% | 22% | 21% | |||
10 (40)
TELE2
Interim Report – Second Quarter
Interim Report – Second Quarter
Baltics
Lithuania
During the quarter, Tele2 migrated postpaid customers from legacy minute-based plans to higher ASPU price plans. This resulted in lower net intake of 18,000 RGUs compared to 25,000 last year while ASPU grew by 4 percent in local currency.
End-user service revenue grew by 7 percent in local currency, mainly driven by increased postpaid consumer ASPU.
Underlying EBITDA excluding IFRS 16 grew by 16 percent in local currency driven by higher revenue, with the margin reaching 38 (34) percent.
Operating data thousands | Apr–Jun 2019 | Apr–Jun 2018 | Jun 30 2019 | Jun 30 2018 | Organic % | |
| RGUs | Net intake | RGU base | ||||
| Mobile | 18 | 25 | 1,875 | 1,833 | 2% | |
| KPIs and financials | Apr–Jun 2019 | Apr–Jun 2018 | Organic % | Jan–Jun 2019 | Jan–Jun 2018 | Organic % |
| ASPU (EUR) | ||||||
| Mobile | 6.2 | 5.9 | 4% | 6.1 | 5.8 | 6% |
| Financials (SEK million) | ||||||
| End-user service revenue | 368 | 335 | 7% | 719 | 637 | 9% |
| Operator revenue | 63 | 63 | 123 | 119 | ||
| Equipment revenue | 206 | 198 | 399 | 368 | ||
| Internal sales | 11 | 7 | 20 | 13 | ||
| Revenue | 648 | 603 | 4% | 1,261 | 1,136 | 7% |
| Underlying EBITDA | 259 | 204 | 504 | 382 | ||
| Underlying EBITDA excluding IFRS 16 | 244 | 204 | 16% | 475 | 382 | 20% |
| Underlying EBITDA margin excluding IFRS 16 | 38% | 34% | 38% | 34% | ||
| Capex | 38 | 38 | 67 | 60 | ||
| Capex excluding spectrum and leases | 30 | 38 | 57 | 60 | ||
| Capex excluding spectrum and leases / revenue | 5% | 6% | 4% | 5% | ||
11 (40)
TELE2
Interim Report – Second Quarter
Interim Report – Second Quarter
Latvia
During the quarter, Tele2 Latvia introduced new price plans focusing on larger mobile data allowances in order to monetize increasing demand for data. We launched a new marketing campaign focusing on socially responsible use of smart devices and was awarded the gold category in Latvia Enterprise Sustainability Index.
Volume growth accelerated in the quarter with net adds of 16,000 RGUs despite prepaid decline.
End-user service revenue grew by 10 percent in local currency, driven by both volume and ASPU growth.
Underlying EBITDA excluding IFRS 16 grew by 6 percent in local currency, driven by higher revenue, with the margin reaching 38 (37) percent.
Operating data thousands | Apr–Jun 2019 | Apr–Jun 2018 | Jun 30 2019 | Jun 30 2018 | Organic % | |
| RGUs | Net intake | RGU base | ||||
| Mobile | 16 | 0 | 961 | 942 | 2% | |
| KPIs and financials | Apr–Jun 2019 | Apr–Jun 2018 | Organic % | Jan–Jun 2019 | Jan–Jun 2018 | Organic % |
| ASPU (EUR) | ||||||
| Mobile | 7.2 | 6.6 | 9% | 6.9 | 6.5 | 7% |
| Financials (SEK million) | ||||||
| End-user service revenue | 219 | 194 | 10% | 418 | 373 | 8% |
| Operator revenue | 47 | 51 | 95 | 98 | ||
| Equipment revenue | 75 | 75 | 147 | 141 | ||
| Internal sales | 5 | 5 | 9 | 9 | ||
| Revenue | 347 | 325 | 4% | 669 | 621 | 4% |
| Underlying EBITDA | 141 | 121 | 266 | 224 | ||
| Underlying EBITDA excluding IFRS 16 | 132 | 121 | 6% | 248 | 224 | 7% |
| Underlying EBITDA margin excluding IFRS 16 | 38% | 37% | 37% | 36% | ||
| Capex | 60 | 21 | 161 | 44 | ||
| Capex excluding spectrum and leases | 38 | 21 | 69 | 44 | ||
| Capex excluding spectrum and leases / revenue | 11% | 6% | 10% | 7% | ||
12 (40)
TELE2
Interim Report – Second Quarter
Interim Report – Second Quarter
Estonia
Tele2 Estonia focused Q2 marketing on end-of-school offers and handset campaigns in the consumer market and launched a new SME B2B bundled offer which was well received.
Net adds turned positive in the quarter with 8,000 new RGUs which is the highest quarterly growth since 2012. Volumes were driven by both the business segment and the consumer segment with improvement in both postpaid and prepaid.
While ASPU grew by 3 percent, end-user service revenue decreased by 2 percent in local currency due the decline of the RGU base over the past twelve months.
Underlying EBITDA excluding IFRS 16 decreased by 9 percent, and the margin contracted to 19 (20) percent due to the decline in end-user service revenue.
In Q2 2019, a goodwill impairment of SEK –452 million was recognized in Estonia. Please refer to Note 3 for more details.
Operating data thousands | Apr–Jun 2019 | Apr–Jun 2018 | Jun 30 2019 | Jun 30 2018 | Organic % | |
| RGUs | Net intake | RGU base | ||||
| Mobile | 8 | –0 | 439 | 459 | –4% | |
| KPIs and financials | Apr–Jun 2019 | Apr–Jun 2018 | Organic % | Jan–Jun 2019 | Jan–Jun 2018 | Organic % |
| ASPU (EUR) | ||||||
| Mobile | 8.0 | 7.7 | 3% | 7.8 | 7.6 | 2% |
| Financials (SEK million) | ||||||
| End-user service revenue | 116 | 115 | –2% | 226 | 223 | –2% |
| Operator revenue | 34 | 36 | 65 | 66 | ||
| Equipment revenue | 42 | 43 | 82 | 93 | ||
| Internal sales | 2 | 2 | 3 | 3 | ||
| Revenue | 194 | 196 | –4% | 376 | 385 | –6% |
| Underlying EBITDA | 47 | 40 | 94 | 76 | ||
| Underlying EBITDA excluding IFRS 16 | 37 | 40 | –9% | 75 | 76 | –4% |
| Underlying EBITDA margin excluding IFRS 16 | 19% | 20% | 20% | 20% | ||
| Capex | 28 | 23 | 57 | 41 | ||
| Capex excluding spectrum and leases | 18 | 23 | 38 | 41 | ||
| Capex excluding spectrum and leases / revenue | 9% | 12% | 10% | 11% | ||
13 (40)
TELE2
Interim Report – Second Quarter
Interim Report – Second Quarter
Other markets
Germany
The RGU base continued to decline with net adds of –18,000 in the quarter. The closing RGU base amounted to 277,000 (338,000) and end-user service revenue declined by 18 percent as a result.
The underlying EBITDA margin excluding IFRS 16 contracted to 46 (49) percent as margins in Q2 2018 were affected by release of bad debt accruals.
Financials SEK million | Apr–Jun 2019 | Apr–Jun 2018 | Organic % | Jan–Jun 2019 | Jan–Jun 2018 | Organic % |
| End-user service revenue | 116 | 137 | –18% | 237 | 275 | –17% |
| Operator revenue | 0 | 0 | 0 | 0 | ||
| Equipment revenue | 0 | 1 | 1 | 1 | ||
| Revenue | 116 | 138 | –18% | 238 | 277 | –17% |
| Underlying EBITDA | 54 | 67 | 110 | 126 | ||
| Underlying EBITDA excluding IFRS 16 | 53 | 67 | –22% | 110 | 126 | –16% |
| Underlying EBITDA margin excluding IFRS 16 | 46% | 49% | 46% | 46% |
Discontinued operations
Croatia
During the quarter, Tele2 Croatia marketing focused on unlimited smart-phone offers with attractive hardware bundles and unlimited mobile broadband. We continued the efforts to strengthen the retail channel and insourced another four stores ending the quarter with a total of 22 Tele2- managed stores.
End-user service revenue grew by 11 percent in local currency, driven by growth in both volume and ASPU.
Underlying EBITDA excluding IFRS 16 increased by 71 percent in local currency as a result of higher end-user service revenue and lower spectrum fees.
On May 31, 2019, Tele2 entered into an agreement to sell Tele2 Croatia to United Group for an enterprise value of EUR 220 million. Please refer to Note 11 for more details.
Operating data thousands | Apr–Jun 2019 | Apr–Jun 2018 | Jun 30 2019 | Jun 30 2018 | Organic % | |
| RGUs | Net intake | RGU base | ||||
| Mobile | 54 | 40 | 948 | 885 | 7% | |
| KPIs and financials | Apr–Jun 2019 | Apr–Jun 2018 | Organic % | Jan–Jun 2019 | Jan–Jun 2018 | Organic % |
| ASPU (HRK) | ||||||
| Mobile | 78 | 75 | 4% | 76 | 72 | 5% |
| Financials (SEK million) | ||||||
| End-user service revenue | 309 | 272 | 11% | 595 | 531 | 12% |
| Operator revenue | 69 | 61 | 119 | 104 | ||
| Equipment revenue | 137 | 115 | 275 | 243 | ||
| Internal sales | 4 | 2 | 5 | 4 | ||
| Revenue | 519 | 450 | 13% | 994 | 883 | 9% |
| Underlying EBITDA | 141 | 63 | 254 | 91 | ||
| Underlying EBITDA excluding IFRS 16 | 111 | 63 | 71% | 196 | 91 | 106% |
| Underlying EBITDA margin excluding IFRS 16 | 21% | 14% | 20% | 10% | ||
| Capex | 80 | 36 | 162 | 46 | ||
| Capex excluding spectrum and leases | 37 | 36 | 51 | 46 | ||
| Capex excluding spectrum and leases / revenue | 7% | 8% | 5% | 5% | ||
14 (40)
TELE2
Interim Report – Second Quarter
Interim Report – Second Quarter
Proforma Group Summary
Continuing operations SEK million | Apr–Jun 2019 | Apr–Jun 2018 proforma | Jan–Jun 2019 | Jan–Jun 2018 proforma |
| REVENUE | ||||
| Sweden Consumer | 3,859 | 3,944 | 7,658 | 7,800 |
| Sweden Business | 1,598 | 1,643 | 3,270 | 3,345 |
| Lithuania | 648 | 603 | 1,261 | 1,136 |
| Latvia | 347 | 325 | 669 | 621 |
| Estonia | 194 | 196 | 376 | 385 |
| Germany | 116 | 138 | 238 | 277 |
| IoT | 60 | 51 | 108 | 94 |
| Other | – | 42 | – | 73 |
| Internal sales, elimination | –27 | –15 | –43 | –26 |
| Total | 6,794 | 6,928 | 13,537 | 13,706 |
| UNDERLYING EBITDA | ||||
| Sweden Consumer | 1,603 | 1,408 | 3,245 | 2,797 |
| Sweden Business | 419 | 323 | 884 | 697 |
| Lithuania | 259 | 204 | 504 | 382 |
| Latvia | 141 | 121 | 266 | 224 |
| Estonia | 47 | 40 | 94 | 76 |
| Germany | 54 | 67 | 110 | 126 |
| IoT | 10 | –31 | 4 | –49 |
| Other | –31 | 17 | –58 | 11 |
| Total | 2,502 | 2,150 | 5,048 | 4,264 |
| UNDERLYING EBITDA EXCLUDING IFRS 16 | ||||
| Sweden Consumer | 1,447 | 1,408 | 2,917 | 2,797 |
| Sweden Business | 335 | 323 | 713 | 697 |
| Lithuania | 244 | 204 | 475 | 382 |
| Latvia | 132 | 121 | 248 | 224 |
| Estonia | 37 | 40 | 75 | 76 |
| Germany | 53 | 67 | 110 | 126 |
| IoT | 10 | –31 | 4 | –49 |
| Other | –32 | 17 | –60 | 11 |
| Total | 2,227 | 2,150 | 4,482 | 4,264 |
| CAPEX | ||||
| Sweden | 857 | 413 | 1,641 | 842 |
| Lithuania | 38 | 38 | 67 | 60 |
| Latvia | 60 | 21 | 161 | 44 |
| Estonia | 28 | 23 | 57 | 41 |
| Germany | 0 | – | 0 | – |
| IoT | 4 | 8 | 10 | 14 |
| Other | 0 | 136 | 0 | 237 |
| Total | 987 | 637 | 1,934 | 1,236 |
| of which: | ||||
| Network | 283 | 270 | 541 | 529 |
| IT | 184 | 237 | 378 | 437 |
| Customer equipment | 18 | 106 | 143 | 228 |
| Other | 65 | 25 | 115 | 44 |
| Capex excluding spectrum and leases | 549 | 637 | 1,175 | 1,236 |
| Spectrum | 1 | – | 67 | – |
| Rights-of-use assets (leases) | 437 | – | 692 | – |
| Total | 987 | 637 | 1,934 | 1,236 |
15 (40)
TELE2
Interim Report – Second Quarter
Interim Report – Second Quarter
Other items
Risks and uncertainty factors
Tele2’s operations are affected by a number of external factors. The risk factors considered to be most significant to Tele2’s future development are spectrum auctions, regulation, market competitiveness and changing technology, strategy implementation and integration, network and IT infrastructure and quality, data protection and cyber security, external relationships, suppliers and Joint Ventures, customer churn, recruitment of skilled personnel, geopolitical conditions and financial risks such as currency risk, interest risk, liquidity risk, credit risk, risks related to tax matters and impairment of assets. Additionally, there is a risk that Tele2 may not be able to obtain sufficient funding for its operations. Please refer to Tele2’s annual report for 2018 (Administration report and Note 2) for a detailed description of Tele2’s risk exposure and risk management.
Closing of the sale of the operations in Kazakhstan
On December 28, 2018 Tele2 announced that Tele2 has given notice to exercise the put option stipulated in the jointly owned company in Kazakhstan between Tele2 and Kazakhtelecom. The divestment of Tele2 Kazakhstan was closed on June 28, 2019. The Kazakhstan operation was sold for approximately SEK 2.5 billion (USD 267 million) and the net proceeds to Tele2 after deducting cash and the existing earn-out liability to Asianet, which was paid in July, 2019, was approximately SEK 1.4 billion. Please refer to Note 11 for more details.
Extraordinary General Meeting
Extraordinary General Meeting on Thursday 22 August 2019 at 1.00 p.m. CEST at Tele2’s premises on Torshamnsgatan 17 in Kista, Stockholm. Shareholders who wish to attend the Extraordinary General Meeting shall be entered in the share register maintained by Euroclear Sweden on Friday 16 August 2019, and give notice of their intention to attend no later than Friday 16 August 2019. Notice to attend is to be made on the company’s website at www.tele2.com, under the heading “Extraordinary General Meeting 2019”, found under the section “Governance”, by telephone to +46 (0) 771 246 400 or by mail to Computershare AB “EGM Tele2”, P.O. Box 610, SE–182 16 Danderyd, Sweden.
Other
Tele2 will release its financial and operating results for the period ending September 30, 2019 on October 17, 2019.
16 (40)
TELE2
Interim Report – Second Quarter
Interim Report – Second Quarter
Board’s assurance
The Board of Directors and CEO declare that the interim report provides a fair overview of the parent company’s and Group’s operations, their financial position and performance, and describes material risks and uncertainties facing the parent company and other companies in the Group.
Stockholm, July 17, 2019 Tele2 AB | ||
Carla Smits-Nusteling Chairman | ||
Andrew Barron Deputy Chairman | Anders Björkman | Cynthia Gordon |
| Eva Lindqvist | Georgi Ganev | Lars-Åke Norling |
Anders Nilsson President and CEO |
Auditors’ review report
Introduction
We have reviewed the interim report for Tele2 AB (publ) for the period January 1 – June 30, 2019. The Board of Directors and the President are responsible for the preparation and presentation of this interim report in accordance with IAS 34 and the Annual Accounts Act. Our responsibility is to express a conclusion on this interim report based on our review.
Scope of Review
We conducted our review in accordance with the International Standard on Review Engagements ISRE 2410, Review of Interim Financial Information Performed by the Independent Auditor of the Entity. A review consists of making inquiries, primarily of persons responsible for financial and accounting matters, and applying analytical and other review procedures. A review has a different focus and is substantially less in scope than an audit conducted in accordance with ISA and other generally accepted auditing practices. The procedures performed in a review do not enable us to obtain a level of assurance that would make us aware of all significant matters that might be identified in an audit. Therefore, the conclusion expressed based on a review does not give the same level of assurance as a conclusion expressed based on an audit.
Conclusion
Based on our review, nothing has come to our attention that causes us to believe that the interim report is not, in all material respects, prepared for the Group in accordance with IAS 34 and the Annual Accounts Act, and for the Parent Company in accordance with the Annual Accounts Act.
Stockholm, July 17, 2019
Deloitte AB
Pontus Pålsson
Authorized Public Accountant
Authorized Public Accountant
17 (40)
TELE2
Interim Report – Second Quarter
Interim Report – Second Quarter
| Q2 2019 PRESENTATION |
Tele2 will host a presentation, with the possibility to join through a conference call, for the global financial community at 10:00 am CET (09:00 am GMT/04:00 am EST) on Wednesday, July 17, 2019.
The presentation will be held in English and also made available as a webcast on Tele2’s website: www.tele2.com.
| Dial-in information: |
| To ensure that you are connected to the conference call, please dial in a few minutes before the start of the conference call to register your attendance. |
| Dial-in numbers: |
SE: +46 (0) 8 50 69 21 80 UK: +44 (0) 2071 928000 US: +1 631 510 74 95 |
| Contacts |
Marcus Lindberg
Head of Investor Relations
Telephone: +46 (0)73 439 25 40
Tele2 AB
Company registration nr: 556410-8917
Company registration nr: 556410-8917
Skeppsbron 18
P.O. Box 2094
SE–103 13 Stockholm
Sweden
Tel + 46 (0) 8 5620 0060
www.tele2.com
Visit our website: www.tele2.com
| Appendices |
Condensed consolidated comprehensive income
Condensed consolidated balance sheet
Condensed consolidated cash flow statement
Condensed consolidated statement of changes in equity
Condensed parent company
Notes
Non-IFRS measures
18 (40)
TELE2
Interim Report – Second Quarter
Interim Report – Second Quarter
Condensed consolidated
income statement
| SEK million | Note | Apr–Jun 2019 | Apr–Jun 2018 | Jan–Jun 2019 | Jan–Jun 2018 |
| Revenue | 2 | 6,794 | 5,113 | 13,537 | 10,107 |
| Cost of services provided and equipment sold | 3 | –4,411 | –2,860 | –8,374 | –5,640 |
| Gross profit | 2,383 | 2,253 | 5,163 | 4,467 | |
| Selling expenses | 3 | –1,171 | –864 | –2,216 | –1,707 |
| Administrative expenses | 3 | –691 | –471 | –1,367 | –937 |
| Result from shares in joint ventures and associated companies | –73 | –0 | –63 | 13 | |
| Other operating income | 77 | 48 | 152 | 95 | |
| Other operating expenses | 3 | –94 | –130 | –191 | –223 |
| Operating profit | 431 | 835 | 1,478 | 1,709 | |
| Interest income | 8 | 0 | 14 | 7 | |
| Interest expenses | 5 | –129 | –84 | –242 | –159 |
| Other financial items | 2 | –27 | 7 | –40 | |
| Profit after financial items | 311 | 725 | 1,257 | 1,516 | |
| Income tax | 4 | –204 | –166 | –426 | –362 |
| Net profit, continuing operations | 107 | 559 | 831 | 1,154 | |
| Net profit, discontinued operations | 11 | 2,022 | –116 | 2,323 | –362 |
| Net profit, total operations | 2,130 | 443 | 3,154 | 793 | |
| Continuing operations | |||||
Attributable to: | |||||
| Equity holders of the parent company | 107 | 559 | 831 | 1,154 | |
| Net profit, continuing operations | 107 | 559 | 831 | 1,154 | |
| Earnings per share (SEK) | 8 | 0.16 | 1.11 | 1.21 | 2.29 |
| Earnings per share, after dilution (SEK) | 8 | 0.15 | 1.10 | 1.20 | 2.28 |
| Total operations | |||||
Attributable to: | |||||
| Equity holders of the parent company | 2,056 | 411 | 3,024 | 754 | |
| Non-controlling interests | 74 | 32 | 130 | 38 | |
| Net profit, total operations | 2,130 | 443 | 3,154 | 793 | |
| Earnings per share (SEK) | 8 | 2.99 | 0.82 | 4.40 | 1.50 |
| Earnings per share, after dilution (SEK) | 8 | 2.98 | 0.81 | 4.38 | 1.49 |
19 (40)
TELE2
Interim Report – Second Quarter
Interim Report – Second Quarter
Condensed consolidated
comprehensive income
| SEK million | Note | Apr–Jun 2019 | Apr–Jun 2018 | Jan–Jun 2019 | Jan–Jun 2018 |
| NET PROFIT | 2,130 | 443 | 3,154 | 793 | |
| Components not to be reclassified to net profit | |||||
| Pensions, actuarial gains/losses | 10 | –8 | –98 | –8 | |
| Pensions, actuarial gains/losses, tax effect | –2 | 2 | 21 | 2 | |
| Components not to be reclassified to net profit | 8 | –6 | –77 | –6 | |
| Components that may be reclassified to net profit | |||||
| Translation differences in foreign operations | 245 | 241 | 541 | 1,084 | |
| Tax effect on above | –17 | –24 | –32 | –137 | |
| Reversed cumulative translation differences from divested companies | 11 | 514 | – | –264 | – |
| Tax effect on above | 11 | –290 | – | –168 | – |
| Translation differences | 451 | 217 | 77 | 947 | |
| Hedge of net investments in foreign operations | –44 | –45 | –92 | –198 | |
| Tax effect on above | 9 | 10 | 20 | 43 | |
| Reversed cumulative hedge from divested companies | 11 | – | – | 721 | – |
| Tax effect on above | 11 | – | – | –169 | – |
| Hedge of net investments | –35 | –35 | 480 | –154 | |
| Exchange rate differences | 416 | 182 | 557 | 793 | |
| Profit arising on changes in fair value of hedging instruments | –2 | –17 | 3 | –17 | |
| Reclassified cumulative profit/loss to income statement | 1 | 35 | –2 | 53 | |
| Tax effect on cash flow hedges | –1 | –6 | 4 | –10 | |
| Cash flow hedges | –3 | 12 | 4 | 26 | |
| Components that may be reclassified to net profit | 414 | 194 | 561 | 818 | |
| OTHER COMPREHENSIVE INCOME FOR THE PERIOD, NET OF TAX | 422 | 188 | 484 | 812 | |
| TOTAL COMPREHENSIVE INCOME FOR THE PERIOD | 2,551 | 631 | 3,637 | 1,605 | |
Attributable to: | |||||
| Equity holders of the parent company | 2,631 | 595 | 3,659 | 1,571 | |
| Non-controlling interests | –80 | 36 | –22 | 34 | |
| TOTAL COMPREHENSIVE INCOME FOR THE PERIOD | 2,551 | 631 | 3,637 | 1,605 |
20 (40)
TELE2
Interim Report – Second Quarter
Interim Report – Second Quarter
Condensed consolidated
balance sheet
| SEK million | Note | Jun 30 2019 | Dec 31 2018 |
| ASSETS | |||
| Goodwill | 29,782 | 30,158 | |
| Other intangible assets | 18,985 | 19,604 | |
| Intangible assets | 48,767 | 49,763 | |
| Tangible assets | 8,169 | 9,192 | |
| Right-of-use assets | 5,724 | – | |
| Shares in joint ventures and associated companies | 9 | 7,090 | 13 |
| Other financial assets | 5 | 685 | 1,015 |
| Capitalized contract costs | 365 | 374 | |
| Deferred tax assets | 4 | 392 | 367 |
| Non-current assets | 71,191 | 60,723 | |
| Inventories | 741 | 670 | |
| Current receivables | 6,154 | 6,824 | |
| Current investments | 2 | 2 | |
| Cash and cash equivalents | 6 | 3,713 | 404 |
| Current assets | 10,610 | 7,901 | |
| Assets classified as held for sale | 11 | 2,630 | 14,020 |
| TOTAL ASSETS | 84,431 | 82,644 | |
| EQUITY AND LIABILITIES | |||
| Attributable to equity holders of the parent company | 37,039 | 36,334 | |
| Non-controlling interests | 0 | 28 | |
| Equity | 8 | 37,039 | 36,362 |
| Interest-bearing liabilities | 5 | 29,559 | 23,238 |
| Non-interest-bearing liabilities | 4,205 | 4,204 | |
| Non-current liabilities | 33,765 | 27,443 | |
| Interest-bearing liabilities | 5 | 2,927 | 6,763 |
| Non-interest-bearing liabilities | 8,079 | 8,088 | |
| Current liabilities | 11,006 | 14,851 | |
| Liabilities directly associated with assets classified as held for sale | 11 | 2,622 | 3,988 |
| TOTAL EQUITY AND LIABILITIES | 84,431 | 82,644 |
21 (40)
TELE2
Interim Report – Second Quarter
Interim Report – Second Quarter
Condensed consolidated
Cash flow statement
Total operations SEK million | Note | Apr–Jun 2019 | Apr–Jun 2018 | Jan–Jun 2019 | Jan–Jun 2018 | |
| Operating activities | ||||||
| Net profit | 2,130 | 443 | 3,154 | 793 | ||
| Adjustments for non-cash items in net profit | 67 | 857 | 1,417 | 1,883 | ||
| Changes in working capital | –84 | –115 | 32 | –582 | ||
| Cash flow from operating activities | 2,112 | 1,186 | 4,602 | 2,094 | ||
| Investing activities | ||||||
| Additions to intangible and tangible assets | –720 | –675 | –2,391 | –1,515 | ||
| Acquisition and sale of shares and participations | 9 | 2,343 | – | 4,695 | 1 | |
| Other financial assets, lending | –5 | –66 | –5 | –66 | ||
| Cash flow from investing activities | 1,619 | –742 | 2,300 | –1,580 | ||
| Financing activities | ||||||
| Proceeds from loans | 5 | 2,132 | 1,392 | 3,888 | 1,459 | |
| Repayments of loans | 5 | –1,729 | –28 | –6,366 | –546 | |
| Dividends paid | –1,513 | –2,013 | –1,513 | –2,013 | ||
| Cash flow from financing activities | –1,110 | –648 | –3,991 | –1,100 | ||
| Net change in cash and cash equivalents | 2,621 | –204 | 2,910 | –586 | ||
| Cash and cash equivalents at beginning of period | 914 | 441 | 404 | 802 | ||
| Exchange rate differences in cash and cash equivalents | 179 | 11 | 398 | 32 | ||
| Cash and cash equivalents at end of the period | 6 | 3,713 | 248 | 3,713 | 248 |
22 (40)
TELE2
Interim Report – Second Quarter
Interim Report – Second Quarter
Condensed consolidated
Statement of changes in equity
| Total operations SEK million | Note | Jun 30, 2019 | |||||||
| Attributable to equity holders of the parent company | |||||||||
| Share capital | Other paid-in capital | Hedge reserve | Translation reserve | Retained earnings | Total | Non-controlling interests | Total equity | ||
| Equity at January 1 | 863 | 27,378 | –734 | 3,252 | 5,576 | 36,334 | 28 | 36,362 | |
| Net profit | – | – | – | – | 3,024 | 3,024 | 130 | 3,154 | |
| Other comprehensive income for the period, net of tax | – | – | 484 | 229 | –77 | 635 | –152 | 484 | |
| Total comprehensive income for the period | – | – | 484 | 229 | 2,946 | 3,659 | –22 | 3,637 | |
| Other changes in equity | |||||||||
| Share-based payments | 8 | – | – | – | – | 61 | 61 | – | 61 |
| Share-based payments, tax effect | 8 | – | – | – | – | 11 | 11 | – | 11 |
| Dividends | 8 | – | – | – | – | –3,026 | –3,026 | – | –3,026 |
| Divestment of non-controlling interest | 11 | – | – | – | – | – | – | –6 | –6 |
| Equity at end of the period | 863 | 27,378 | –250 | 3,481 | 5,568 | 37,039 | – | 37,039 | |
Total operations SEK million | Note | Jun 30, 2018 | |||||||
| Attributable to equity holders of the parent company | |||||||||
| Share capital | Other paid-in capital | Hedge reserve | Translation reserve | Retained earnings | Total | Non-controlling interests | Total equity | ||
| Equity at January 1 | 634 | 7,842 | –651 | 2,670 | 6,709 | 17,203 | –114 | 17,089 | |
| Net profit | – | – | – | – | 754 | 754 | 38 | 793 | |
| Other comprehensive income for the period, net of tax | – | – | –128 | 951 | –6 | 817 | –5 | 812 | |
| Total comprehensive income for the period | – | – | –128 | 951 | 748 | 1,571 | 34 | 1,605 | |
| Other changes in equity | |||||||||
| Share-based payments | 8 | – | – | – | – | 12 | 12 | – | 12 |
| Share-based payments, tax effect | 8 | – | – | – | – | 8 | 8 | – | 8 |
| Dividends | 8 | – | – | – | – | –2,013 | –2,013 | – | –2,013 |
| Equity at end of the period | 634 | 7,842 | –779 | 3,621 | 5,464 | 16,782 | –80 | 16,701 | |
23 (40)
TELE2
Interim Report – Second Quarter
Interim Report – Second Quarter
Parent company
Condensed Income Statement
| SEK million | Apr–Jun 2019 | Apr–Jun 2018 | Jan–Jun 2019 | Jan–Jun 2018 |
| Revenue | 7 | 13 | 18 | 26 |
| Administrative expenses | –41 | –36 | –80 | –62 |
| Other operating expenses | –39 | –160 | –110 | –185 |
| Operating loss | –73 | –183 | –172 | –221 |
| Interest revenue and similar income | 39 | 0 | 75 | 0 |
| Interest expense and similar costs | –146 | –105 | –286 | –240 |
| Loss after financial items | –180 | –288 | –382 | –461 |
| Tax on loss | 39 | 66 | 78 | 104 |
| Net loss | –141 | –222 | –304 | –357 |
Condensed balance sheet
| SEK million | Note | Jun 30 2019 | Dec 31 2018 |
| ASSETS | |||
| Financial assets | 47,310 | 47,083 | |
| Non-current assets | 47,310 | 47,083 | |
| Current receivables | 10,680 | 15,786 | |
| Cash and cash equivalents | 12 | 25 | |
| Current assets | 10,692 | 15,810 | |
| TOTAL ASSETS | 58,002 | 62,893 | |
| EQUITY AND LIABILITIES | |||
| Restricted equity | 8 | 5,848 | 5,848 |
| Unrestricted equity | 8 | 25,614 | 28,874 |
| Equity | 31,462 | 34,722 | |
| Interest-bearing liabilities | 5 | 23,529 | 21,721 |
| Non-current liabilities | 23,529 | 21,722 | |
| Interest-bearing liabilities | 5 | 1,338 | 6,112 |
| Non-interest-bearing liabilities | 1,673 | 337 | |
| Current liabilities | 3,011 | 6,450 | |
| TOTAL EQUITY AND LIABILITIES | 58,002 | 62,893 |
24 (40)
TELE2
Interim Report – Second Quarter
Interim Report – Second Quarter
Notes
NOTE 1 ACCOUNTING PRINCIPLES AND DEFINITIONS
The interim financial information for the Group for the six and three month period ended June 30, 2019 has been prepared in accordance with International Accounting Standard (IAS) 34 Interim Financial Reporting as issued by the International Accounting Standards Board (IASB) and the Swedish Annual Accounts Act, and for the parent company in accordance with the Swedish Annual Accounts Act and RFR 2 Reporting for legal entities and other statements issued by the Swedish Financial Reporting Board. In all respects other than those described below, Tele2 has presented the financial statements for the period ended June 30, 2019 in accordance with the accounting policies and principles applied in the 2018 Annual Report. The description of these principles and definitions is found in Note 1 and Note 35 in the Annual Report 2018.
On January 1, 2019 Tele2 changed the accounting principles for leases, by applying IFRS 16. Tele2 has chosen to apply the reliefs in the standard and not restate prior periods. Description of changes as a result of applying IFRS 16 and the effects on the opening balance January 1, 2019 are found in Note 10.
The other amendments to IFRSs applicable from January 1, 2019 had no significant effects to Tele2’s financial reports for the six month period ended June 30, 2019.
To more properly reflect the underlying performance of the business, Tele2’s measure of segment profit/loss has changed from adjusted EBITDA to underlying EBITDA. The change is a somewhat increased scope of items affecting comparability to make the underlying EBITDA clearer, please refer to Note 3.
Figures presented in this report refer to April 1 – June 30 (Q2), 2019 and continuing operations unless otherwise stated. Figures shown in parentheses refer to the comparable periods in 2018.
NOTE 2 REVENUE
Revenue per segment
Continuing operations SEK million | Apr–Jun 2019 | Apr–Jun 2018 | Jan–Jun 2019 | Jan–Jun 2018 |
| Sweden Consumer | 3,859 | 2,198 | 7,658 | 4,336 |
| Sweden Business | 1,598 | 1,575 | 3,270 | 3,211 |
| Lithuania | 648 | 603 | 1,261 | 1,136 |
| Latvia | 347 | 325 | 669 | 621 |
| Estonia | 194 | 196 | 376 | 385 |
| Germany | 116 | 138 | 238 | 277 |
| IoT | 60 | 51 | 108 | 94 |
| Other | – | 42 | – | 73 |
| Including internal sales | 6,821 | 5,128 | 13,580 | 10,133 |
| Internal sales, elimination | –27 | –15 | –43 | –26 |
| TOTAL | 6,794 | 5,113 | 13,537 | 10,107 |
Internal Sales
Continuing operations SEK million | Apr��Jun 2 019 | Apr–Jun 2018 | Jan–Jun 2019 | Jan–Jun 2018 |
| Sweden Business | 10 | 1 | 10 | 2 |
| Lithuania | 11 | 7 | 20 | 13 |
| Latvia | 5 | 5 | 9 | 9 |
| Estonia | 2 | 2 | 3 | 3 |
| TOTAL | 27 | 15 | 43 | 26 |
25 (40)
TELE2
Interim Report – Second Quarter
Interim Report – Second Quarter
Revenue split per category
Continuing operations SEK million | Apr–Jun 2019 | Apr–Jun 2018 | Jan–Jun 2019 | Jan–Jun 2018 |
| Sweden Consumer | ||||
| End-user service revenue | 3,191 | 1,543 | 6,355 | 3,078 |
| Operator revenue | 220 | 163 | 410 | 312 |
| Equipment revenue | 448 | 492 | 893 | 945 |
| Total | 3,859 | 2,198 | 7,658 | 4,336 |
| Sweden Business | ||||
| End-user service revenue | 1,008 | 982 | 2,042 | 1,977 |
| Operator revenue | 205 | 174 | 397 | 350 |
| Equipment revenue | 375 | 418 | 821 | 882 |
| Internal sales | 10 | 1 | 10 | 2 |
| Total | 1,598 | 1,575 | 3,270 | 3,211 |
| Lithuania | ||||
| End-user service revenue | 368 | 335 | 719 | 637 |
| Operator revenue | 63 | 63 | 123 | 119 |
| Equipment revenue | 206 | 198 | 399 | 368 |
| Internal sales | 11 | 7 | 20 | 13 |
| Total | 648 | 603 | 1,261 | 1,136 |
| Latvia | ||||
| End-user service revenue | 219 | 194 | 418 | 373 |
| Operator revenue | 47 | 51 | 95 | 98 |
| Equipment revenue | 75 | 75 | 147 | 141 |
| Internal sales | 5 | 5 | 9 | 9 |
| Total | 347 | 325 | 669 | 621 |
| Estonia | ||||
| End-user service revenue | 116 | 115 | 226 | 223 |
| Operator revenue | 34 | 36 | 65 | 66 |
| Equipment revenue | 42 | 43 | 82 | 93 |
| Internal sales | 2 | 2 | 3 | 3 |
| Total | 194 | 196 | 376 | 385 |
| Germany | ||||
| End-user service revenue | 116 | 137 | 237 | 275 |
| Operator revenue | 0 | 0 | 0 | 0 |
| Equipment revenue | 0 | 1 | 1 | 1 |
| Total | 116 | 138 | 238 | 277 |
| IoT | ||||
| End-user service revenue | 60 | 51 | 108 | 94 |
| Total | 60 | 51 | 108 | 94 |
| Other | ||||
| Operator revenue | – | 42 | – | 73 |
| Total | – | 42 | – | 73 |
| CONTINUING OPERATIONS | ||||
| End-user service revenue | 5,079 | 3,356 | 10,106 | 6,658 |
| Operator revenue | 570 | 529 | 1,089 | 1,018 |
| Equipment revenue | 1,146 | 1,228 | 2,342 | 2,431 |
| Internal sales | 27 | 15 | 43 | 26 |
| TOTAL | 6,821 | 5,128 | 13,580 | 10,133 |
26 (40)
TELE2
Interim Report – Second Quarter
Interim Report – Second Quarter
Revenue in Sweden
| SEK million | Apr–Jun 2019 | Apr–Jun 2018 | Jan–Jun 2019 | Jan–Jun 2018 |
| Sweden Consumer | ||||
| Mobile | 1,481 | 1,463 | 2,938 | 2,914 |
| Fixed | 1,533 | 80 | 3,063 | 164 |
| Landlord & Other | 178 | – | 354 | – |
| End-user service revenue | 3,191 | 1,543 | 6,355 | 3,078 |
| Operator revenue | 220 | 163 | 410 | 312 |
| Equipment revenue | 448 | 492 | 893 | 945 |
| Revenue Consumer | 3,859 | 2,198 | 7,658 | 4,336 |
| Sweden Business | ||||
| Mobile | 456 | 463 | 931 | 922 |
| Fixed | 276 | 259 | 571 | 537 |
| Solutions | 276 | 260 | 540 | 518 |
| End-user service revenue | 1,008 | 982 | 2,042 | 1,977 |
| Operator revenue, excluding Wholesale | 35 | 35 | 59 | 66 |
| Wholesale | 170 | 139 | 338 | 284 |
| Equipment revenue | 375 | 418 | 821 | 882 |
| Internal sales | 10 | 1 | 10 | 2 |
| Revenue Business | 1,598 | 1,575 | 3,270 | 3,211 |
| Revenue Sweden | 5,457 | 3,772 | 10,928 | 7,546 |
NOTE 3 SEGMENT REPORTING
Underlying EBITDA
Continuing operations SEK million | Apr–Jun 2019 | Apr–Jun 2018 | Jan–Jun 2019 | Jan–Jun 2018 |
| Sweden Consumer | 1,603 | 737 | 3,245 | 1,462 |
| Sweden Business | 419 | 305 | 884 | 661 |
| Lithuania | 259 | 204 | 504 | 382 |
| Latvia | 141 | 121 | 266 | 224 |
| Estonia | 47 | 40 | 94 | 76 |
| Germany | 54 | 67 | 110 | 126 |
| IoT | 10 | –31 | 4 | –49 |
| Other | –31 | 17 | –58 | 11 |
| TOTAL | 2,502 | 1,460 | 5,048 | 2,894 |
Reconciling items to reported operating profit/loss
Continuing operations SEK million | Apr–Jun 2019 | Apr–Jun 2018 | Jan–Jun 2019 | Jan–Jun 2018 |
| Underlying EBITDA | 2,502 | 1,460 | 5,048 | 2,894 |
| Acquisition costs | –42 | –111 | –86 | –160 |
| Integration costs | –227 | –19 | –382 | –39 |
| Disposal of non-current assets | –2 | 1 | –4 | –15 |
| Other items affecting comparability | 1 | – | –61 | – |
| Items affecting comparability | –271 | –129 | –532 | –214 |
| EBITDA | 2,231 | 1,332 | 4,515 | 2,680 |
| Depreciation/amortization | –1,276 | –496 | –2,522 | –984 |
| Impairment of goodwill | –452 | – | –452 | – |
| Result from shares in joint ventures and associated companies | –73 | –0 | –63 | 13 |
| Operating profit | 431 | 835 | 1,478 | 1,709 |
Acquisition costs
Continuing operations SEK million | Apr–Jun 2019 | Apr–Jun 2018 | Jan–Jun 2019 | Jan–Jun 2018 |
| Com Hem, Sweden | –42 | –111 | –86 | –160 |
| Acquisition costs | –42 | –111 | –86 | –160 |
Integration costs
Continuing operations SEK million | Apr–Jun 2019 | Apr–Jun 2018 | Jan–Jun 2019 | Jan–Jun 2018 |
| Com Hem, Sweden | –227 | –5 | –382 | –5 |
| TDC, Sweden | – | –14 | – | –34 |
| Integration costs | –227 | –19 | –382 | –39 |
| Reported as: | ||||
| – cost of services provided | –75 | –9 | –93 | –9 |
| – selling expenses | –93 | –14 | –169 | –14 |
| – administrative expenses | –58 | 3 | –120 | –16 |
| Consists of: | ||||
| – redundancy costs | –192 | –5 | –303 | –5 |
| – other employee and consultancy costs | –32 | –13 | –67 | –22 |
| – exit of contracts and other costs | –3 | –1 | –12 | –12 |
27 (40)
TELE2
Interim Report – Second Quarter
Interim Report – Second Quarter
Disposal of non-current assets
Disposal of non-current assets are reported as other operating income and other operating expenses.
Other items affecting comparability
Continuing operations SEK million | Apr–Jun 2019 | Apr–Jun 2018 | Jan–Jun 2019 | Jan–Jun 2018 |
| Costs of services provided | 0 | – | –59 | – |
| Selling expenses | 0 | – | 11 | – |
| Administrative expenses | 0 | – | –13 | – |
| Total | 1 | – | –61 | – |
| Consist of: | ||||
| – Sweden; provision for roaming dispute | 1 | – | –55 | – |
| – Lithuania; adjustment of expected credit loss rate | – | – | 18 | – |
| – Incentive program; adjustment of performance level | – | – | –24 | – |
Impairment of goodwill
In Q2 2019, a goodwill impairment of SEK 452 million was recognized in Estonia. It is related to a reassessment of the estimated future cash gener- ation, reflecting a lower starting point following last year’s decline in profitability. The value attached to the Estonian operation is now SEK 850 million on a debt free basis, derived from the value in use calculation with a pre-tax WACC of 11 percent.
NOTE 4 TAXES
On April 1, 2019 Tele2 was notified that the Swedish Tax Agency rejects Tele2’s claim for a deduction of an exchange loss related to a conversion of a shareholder loan to Tele2 Kazakhstan from USD to Kazakh Tenge in connection to the establishment of Tele2’s previously jointly owned company in Kazakhstan. The additional tax claim amounts to SEK 405 million and a tax surcharge and interest of SEK 180 million. Tele2 has appealed the decision and assesses it as probable that the appeal will be successful. No provision has been recognized.
NOTE 5 FINANCIAL ASSETS AND LIABILITIES
Financing
| SEK million | Interest-bearing liabilities | |||
| Jun 30, 2019 | Dec 31, 2018 | |||
| Current | Non-current | Current | Non-current | |
| Bonds SEK, Sweden | 250 | 9,546 | 1,500 | 8,796 |
| Bonds EUR, Sweden | – | 10,644 | – | 10,284 |
| Commercial papers, Sweden | 800 | – | 4,491 | – |
| Financial institutions | 192 | 3,282 | 415 | 2,583 |
| Financial debt | 1,242 | 23,472 | 6,406 | 21,663 |
| Provisions | 304 | 1,498 | 224 | 1,471 |
| Lease liability | 1,106 | 4,444 | 2 | 14 |
| Other liabilities | 276 | 146 | 131 | 90 |
| Other liabilities | 1,686 | 6,087 | 357 | 1,575 |
| Total interest-bearing liabilities | 2,927 | 29,559 | 6,763 | 23,238 |
On March 29, 2019 Tele2 completed the issuance of a SEK 1 billion private placement bond. The bond has a final maturity of 7 years with a floating coupon rate.
On December 17, 2018 Tele2 announced its SEK 2 billion loan agreement with the Nordic Investment Bank (NIB) for the financing of Tele2’s merger with Com Hem. The additional funding from NIB extends Tele2’s maturity profile and achieve further diversification of its funding. The additional funding was conditioned by the existing loan of EUR 130 million as of December 31, 2018 was cancelled. The cancellation took place in January 2019.
28 (40)
TELE2
Interim Report – Second Quarter
Interim Report – Second Quarter
Tele2 has a credit facility with a syndicate of banks. The facility was extended by one year in January 2019 to 2024 and has a remaining extension option of one year.
Transfer of right of payment of receivables
Tele2 Sweden transfers the right for payment of certain operating receivables to financial institutions. The receiving payment obtained from financial institutions, in relation to the transfer of right of payment of receivables for sold handsets and other equipment, has been netted against the receivables in the balance sheet and resulted in a positive effect on cash flow. The right of payment transferred to third parties without recourse or remaining credit exposure for Tele2 corresponded to SEK 511 (386) million in Q2 2019 and SEK 1,098 (688) million for the six months period ended on June 30, 2019.
Classification and fair values
Tele2’s financial assets consist mainly of receivables from end customers, other operators and resellers as well as cash and cash equivalents. Tele2’s financial liabilities consist mainly of loans, bonds, lease liabilities and accounts payables. Classification of financial assets and liabilities including their fair value is presented below. During 2019, no transfers were made between the different levels in the fair value hierarchy and no significant changes were made to valuation techniques, inputs used or assumptions.
| SEK million | Jun 30, 2019 | |||||
| Assets and liabilities at fair value through profit/loss | ||||||
| Derivative instruments designated for hedge accounting | Other instruments (level 3) | Assets at amortized cost | Financial liabilities at amortized cost | Total reported value | Fair value | |
| Other financial assets | – | 7 | 561 | – | 568 | 568 |
| Accounts receivables | – | – | 2,185 | – | 2,185 | 2,185 |
| Other current receivables | 180 | – | 1,779 | – | 1,959 | 1,959 |
| Current investments | – | – | 2 | – | 2 | 2 |
| Cash and cash equivalents | – | – | 3,713 | – | 3,713 | 3,713 |
| Assets classified as held for sale | – | – | 809 | – | 809 | 809 |
| Total financial assets | 180 | 7 | 9,049 | – | 9,236 | 9,236 |
| Liabilities to financial institutions and similar liabilities | – | – | – | 24,714 | 24,714 | 25,309 |
Other interest-bearing liabilities | 181 | 9 | – | 5,781 | 5,972 | 5,971 |
| Accounts payable | – | – | – | 1,815 | 1,815 | 1,815 |
| Other current liabilities | – | – | – | 2,088 | 2,088 | 2,088 |
| Liabilities directly associated with assets classified as held for sale | – | 895 | – | 833 | 1,728 | 1,731 |
| Total financial liabilities | 181 | 903 | – | 35,231 | 36,316 | 36,914 |
| SEK million | Dec 31, 2018 | |||||
| Assets and liabilities at fair value through profit/loss | ||||||
| Derivative instruments designated for hedge accounting | Other instruments (level 3) | Assets at amortized cost | Financial liabilities at amortized cost | Total reported value | Fair value | |
| Other financial assets | – | 7 | 898 | – | 905 | 905 |
| Accounts receivables | – | – | 2,509 | – | 2,509 | 2,509 |
| Other current receivables | 33 | – | 2,364 | – | 2,397 | 2,397 |
| Current investments | – | – | 2 | – | 2 | 2 |
| Cash and cash equivalents | – | – | 404 | – | 404 | 404 |
| Assets classified as held for sale | – | – | 2,659 | – | 2,659 | 2,659 |
| Total financial assets | 33 | 7 | 8,836 | – | 8,876 | 8,876 |
| Liabilities to financial institutions and similar liabilities | – | – | – | 28,069 | 28,069 | 28,136 |
Other interest-bearing liabilities | 113 | 15 | – | 109 | 237 | 237 |
| Accounts payable | – | – | – | 3,004 | 3,004 | 3,004 |
| Other current liabilities | – | – | – | 689 | 689 | 689 |
| Liabilities directly associated with assets classified as held for sale | – | 764 | – | 1,361 | 2,125 | 2,113 |
| Total financial liabilities | 113 | 779 | – | 33,232 | 34,124 | 34,179 |
29 (40)
TELE2
Interim Report – Second Quarter
Interim Report – Second Quarter
Changes in financial assets and liabilities valued at fair value through profit/loss in level 3
| SEK million | Jun 30, 2019 | Dec 31, 2018 | ||
| Assets | Liabilities | Assets | Liabilities | |
| As of January 1 | 7 | 779 | 1 | 456 |
| Business combinations | – | – | 6 | – |
| Changes in fair value, earn-out Kazakhstan | – | 131 | – | 332 |
| Other contingent considerations: | ||||
| – paid | – | –3 | – | –12 |
| – other changes | 0 | –2 | – | 3 |
| As of the end of the period | 7 | 903 | 7 | 779 |
On December 31, 2018 the liability for the long-term incentive program (IoTP) for Tele2 employees of Tele2’s IoT business (internet-of-things), based on the estimated fair value of the program, amounted to SEK 4 million. The program was built on transferrable synthetic options. During Q1 2019, the incentive program was closed down by settlement in cash.
In 2016, a liability was reported for contingent deferred consideration to the former owners of Kombridge, Sweden. The estimated fair value of the deferred consideration amounted on June 30, 2019 to SEK 9 (December 31, 2018: 11) million which was paid in July, 2019. The fair value was calculated based on expected future cash flows at which a maximum turnout has been assumed.
Asianet, the former non-controlling shareholder of Tele2 Kazakhstan, had the right to 18 percent of the economic interest in the jointly owned company with Kazakhtelecom in Kazakhstan which was divested during the second quarter 2019. The divestment of Tele2 Kazakhstan was closed on June 28, 2019. The estimated fair value of the deferred consideration amounted on June 30, 2019 to SEK 895 (December 31, 2018: 764) million and is calculated as 18 percent of the total consideration after deduction of sales costs. As of December 31, 2018 the fair value was calculated based on expected future cash flows of the jointly owned company. From December 31, 2018, onwards, the earn-out liability has been classified as a liability associated with assets held for sale, please refer to Note 11.
NOTE 6 RELATED PARTIES
Tele2’s share of cash and cash equivalents in joint operations (Svenska UMTS-nät AB and Net4Mobility HB), for which Tele2 has limited disposal rights was included in the Group’s cash and cash equivalents and amounted at each closing date to the sums stated below.
| SEK million | Jun 30 2019 | Dec 31 2018 |
| Cash and cash equivalents in joint operations | 49 | 60 |
| Total | 49 | 60 |
On June 28, 2019, Tele2 utilized the put option and sold its shares in the previous jointly owned company in Kazakhstan, see Note 11. From January 2, 2019, Tele2 has 25 percent ownership in T-Mobile Netherlands. During a transition period, Tele2 provides IT and network services to T-Mobile. In addition, T-Mobile will continue to dispose the Tele2 brand. Business relations and pricing between the parties are based on commercial terms and conditions. Apart from transactions with joint operations and previously described transactions, no other significant related party transactions were carried out during 2019. Other related parties are presented in Note 37 of the 2018 Annual Report.
30 (40)
TELE2
Interim Report – Second Quarter
Interim Report – Second Quarter
NOTE 7 CONTINGENT LIABILITIES
Total operations SEK million | Jun 30 2019 | Dec 31 2018 |
| Tax deduction exchange loss | 585 | – |
| Asset dismantling obligation, discontinued operation | – | 159 |
| Total contingent liabilities | 585 | 159 |
Tele2’s claim for a deduction of an exchange loss, please refer to Note 4.
NOTE 8 EQUITY, NUMBER OF SHARES AND INCENTIVE PROGRAMS
Number of shares
Jun 30 2019 | Dec 31 2018 | |
| Total number of shares | 690,341,597 | 690,341,597 |
| Number of treasury shares | –2,628,121 | –3,338,529 |
| Number of outstanding shares | 687,713,476 | 687,003,068 |
| Number of outstanding shares, weighted average | 687,266,698 | 531,098,522 |
| Number of shares after dilution | 691,151,646 | 690,115,713 |
| Number of shares after dilution, weighted average | 690,275,157 | 534,505,915 |
As a result of share rights in the LTI 2016 being exercised during Q2 2019, Tele2 delivered 572,714 B-shares in treasury shares to the participants in the program. As a result of early vesting of the LTI 2016, LTI 2017 and LTI 2018 being exercised in the first six months 2019, Tele2 delivered 137,694 B-shares in treasury shares to some of the participants in the program, see information below.
In Q1 2019, 40,770 class A shares were reclassified into class B shares. Changes in shares during previous year are stated in Note 25 in the 2018 Annual Report.
Outstanding share right programs
Jun 30 2019 | Dec 31 2018 | |
| LTI 2019 | 1,365,908 | – |
| LTI 2018 | 1,223,625 | 1,482,420 |
| LTI 2017 | 848,637 | 1,050,018 |
| LTI 2016 | – | 801,040 |
| Total outstanding share rights | 3,438,170 | 3,333,478 |
| – of which will be settled in cash | – | 220,833 |
All outstanding long-term incentive programs (LTI 2017, LTI 2018 and LTI 2019) are based on the same structure, except for that LTI 2017 have a ROCE performance measure. Additional information regarding the objective, conditions and requirements related to the LTI programs is stated in Note 33 of the 2018 Annual Report. During the first six months 2019, the total cost including social security costs for the long-term incentive programs (LTI) amounted to SEK 93 (27) million before tax, whereof items affecting comparability SEK 45 (-) million.
LTI 2016– 2018, reorganization as an effect of the Com Hem merger
As a result of the Com Hem merger and the following reorganization, an early vesting was performed for some of the participants in LTI 2016, LTI 2017 and LTI 2018 programs. The exercise of the share rights was conditional upon the fulfilment of certain retention and performance-based conditions. To determine the number of share rights allowed for early vesting the actual outcome of the conditions as of the early vesting date has been compared with the conditions in the programs. If the conditions were fulfilled the number of share rights have been reduced proportionally with the remaining vesting period to the initial vesting period of three years. If the conditions were partly met, the number of share rights have been reduced in proportion to the fulfillment level. The number of share rights exchanged in the first six month 2019 for shares in Tele2 amounts to 137,694 share rights at a weighted average share price of SEK 125,90.
31 (40)
TELE2
Interim Report – Second Quarter
Interim Report – Second Quarter
LTI 2019
At the Annual General Meeting held on May 6, 2019, the shareholders approved a retention and performance-based incentive program (LTI 2019) for senior executives and other key employees in the Tele2 Group. The program has the same structure as last year’s incentive program (LTI 2018). The measurement period for retention and performance-based conditions for LTI 2019 is from April 1, 2019 until March 31, 2022. Total costs before tax for outstanding rights in the incentive program are expensed over the three-year vesting period. These costs are expected to amount to SEK 99 million, of which social security costs amount to SEK 34 million. To ensure the delivery of Class B shares under the program, the Annual General Meeting decided to authorize the Board of Directors to resolve on a directed share issue of a maximum of 2,040,000 Class C shares and subsequently to repurchase the Class C shares. The Board of Directors has not yet used its mandate.
LTI 2016
The exercise of the share rights in LTI 2016 was conditional upon the fulfilment of certain retention and performance-based conditions, measured from April 1, 2016 until March 31, 2019. The outcome of these performance conditions were in accordance with below and the outstanding share rights of 572,714 have been exchanged for shares in Tele2 during Q2 2019.
| Serie | Retention and performance- based conditions | Minimum hurdle (20%) | Stretch targets (100%) | Performance outcome | Allotment |
| Series A | Total Shareholder Return Tele2 (TSR) | – | ≥ 0% | 103.9% | 100% |
| Series B | Average normalized Return on Capital Employed (ROCE) | 5.5% | 8% | 7.0% | 68.0% |
| Series C | Total Shareholder Return Tele2 (TSR) compared to a peer group | > 0% | ≥ 10% | 75.8% | 100% |
Dividend
The Annual General Meeting held on May 6, 2019 resolved on a dividend of SEK 4.40 (4.00) per share in respect of the financial year 2018 to be paid in two equal tranches during 2019. This corresponds to a total of SEK 3 billion. The first dividend payment was distributed to the shareholders on May 13, 2019 amounting to SEK 1,513 (2,013) million, the second dividend payment will be distributed to the shareholders on October 7, 2019.
NOTE 9 BUSINESS ACQUISITIONS AND DIVESTMENTS
Acquisitions and divestments of shares and participations affecting cash flow were as follows:
| SEK million | Apr–Jun 2019 | Apr–Jun 2018 | Jan–Jun 2019 | Jan–Jun 2018 |
| Acquisitions | ||||
| Mobile payment, Lithuania | – | – | –4 | – |
| Altlorenscheuerhof , Luxembourg repayment capital | – | – | – | 1 |
| Total acquisition of shares and participations | – | – | –4 | 1 |
| Divestments | ||||
| Tele2 Kazakhstan | 2,344 | – | 2,344 | – |
| Tele2 Netherlands | –0 | – | 2,355 | – |
| Total sale of shares and participations | 2,343 | – | 4,699 | – |
| TOTAL CASH FLOW EFFECT | 2,343 | – | 4,695 | 1 |
32 (40)
TELE2
Interim Report – Second Quarter
Interim Report – Second Quarter
Acquisitions
T-Mobile, the Netherlands
The divestment of Tele2 Netherlands was closed on January 2, 2019, please refer to Note 11. As part of the divestment Tele2 acquired 25 percent of the shares in the new combined company T-Mobile Netherlands Holding BV. The fair value of the shares is estimated to SEK 6.9 billion. The transaction combines two mobile customer champions with complementary brands, technologies and customer bases. Based on current numbers the combined company has a revenue of around EUR 2 billion. Tele2’s 25 percent of the share is reported as an associated company in the financial statements of Tele2.
Information about acquisitions made in 2018 is provided in Note 15 in the 2018 Annual Report.
Divestments
Please refer to Note 11 Discontinued operations.
NOTE 10 CHANGES IN ACCOUNTING PRINCIPLES
IFRS 16 Leases
On January 1, 2019 Tele2 changed the accounting principles for leases, by applying IFRS 16 Leases. Tele2 has chosen to apply the modified retrospective approach in the standard and not restate prior periods. The qualitative effects of the transition to IFRS 16 are described in Note 35 in the 2018 Annual Report. The effects of applying IFRS 16 on the opening balance January 1, 2019 is presented below. The data exclude the Dutch operations since Tele2 considered the effects of IFRS 16 on Tele2 Netherlands to have no or negligible impact going forward. The weighted average incremental borrowing rate applied at the discounting of the lease liability at transition January 1, 2019 amounted to 1 percent for continued operations and 2 percent including discontinued operations.
Balance sheet
| SEK million | Jan 1, 2019 Adjusted | IFRS 16 Effect | Dec 31, 2018 Reported |
| ASSETS | |||
| Goodwill | 30,159 | – | 30,159 |
| Other intangible assets | 19,560 | –44 | 19,604 |
| Intangible assets | 49,719 | –44 | 49,763 |
| Machinery and technical plant | 7,998 | –104 | 8,102 |
| Other tangible assets | 1,090 | – | 1,090 |
| Tangible assets | 9,088 | –104 | 9,192 |
| Right-of-use assets | 6,076 | 6,076 | – |
| Financial assets | 1,028 | – | 1,028 |
| Capitalized contract costs | 373 | – | 373 |
| Deferred tax assets | 368 | – | 368 |
| TOTAL NON-CURRENT ASSETS | 66,652 | 5,928 | 60,724 |
| Inventories | 669 | – | 669 |
| Current receivables | 6,794 | –31 | 6,825 |
| Current investments | 2 | – | 2 |
| Cash and cash equivalents | 404 | – | 404 |
| TOTAL CURRENT ASSETS | 7,869 | –31 | 7,900 |
| ASSETS CLASSIFIED AS HELD FOR SALE | 14,588 | 568 | 14,020 |
| TOTAL ASSETS | 89,109 | 6,465 | 82,644 |
| EQUITY AND LIABILITIES | |||
| Attributable to equity holders of the parent company | 36,334 | – | 36,334 |
| Non-controlling interest | 28 | 28 | |
| TOTAL EQUITY | 36,362 | – | 36,362 |
| – | |||
| Interest-bearing liabilities | 27,977 | 4,739 | 23,238 |
| Non-interest-bearing liabilities | 4,206 | – | 4,206 |
| TOTAL NON-CURRENT LIABILITIES | 32,183 | 4,739 | 27,444 |
| Interest-bearing liabilities | 7,921 | 1,158 | 6,763 |
| Non-interest-bearing liabilities | 8,088 | – | 8,088 |
| TOTAL CURRENT LIABILITIES | 16,009 | 1,158 | 14,851 |
| LIABILITIES DIRECTLY ASSOCIATED WITH ASSETS CLASSIFIED AS HELD FOR SALE | 4,555 | 568 | 3,987 |
| TOTAL EQUITY AND LIABILITIES | 89,109 | 6,465 | 82,644 |
33 (40)
TELE2
Interim Report – Second Quarter
Interim Report – Second Quarter
The bridge between future minimum expenses according to the previous IAS 17 Leases standard (please refer to Note 31 in the 2018 Annual Report) and the change in the lease liability for continuing operations due to adoption of IFRS 16 is presented below.
Change in lease liability due to adoption of IFRS 16
| SEK million | |
| Total future lease expenses for operating leases (Note 31) | 4,626 |
| Adjustment for: | |
| Discounting | –264 |
| Not determined as leases according to IFRS 16 (mainly leased capacity) | –585 |
| Short term leases | –114 |
| Low value leases | –14 |
| Extension options | 2,248 |
| Total adjustments | 1,271 |
| Change in lease liability due to adoption of IFRS 16 | 5,897 |
NOTE 11 DISCONTINUED OPERATIONS
Tele2 Croatia
On May 31, 2019 Tele2 announced the agreement to sell its Croatian business to United Group for an enterprise value of EUR 220 million (approximately SEK 2,320 million as per June 30, 2019). The transaction is subject to regulatory approval. Closing is expected before the end of 2019, and following the agreement Tele2 Croatia is reported separately under discontinued operations in the income statement, with a retrospective effect on previous periods.
Tele2 Kazakhstan
On December 28, 2018 Tele2 announced that Tele2 has given notice to exercise the put option stipulated in the jointly owned company in Kazakhstan between Tele2 and Kazakhtelecom. The divestment of Tele2 Kazakhstan was closed on June 28, 2019. The Kazakhstan operation was sold for approximately SEK 2.5 billion (USD 267 million) and the net proceeds to Tele2 after deducting cash and the existing earn-out liability to Asianet, which was paid in July, 2019, was approximately SEK 1.4 billion. The capital gain in Q2 2019 amounted to SEK 1.6 billion, or SEK 2.3 billion excluding recycled exchange rate differences. The capital gain was affected negatively with SEK 0.7 billion related to reversal of exchange rate differences previously reported in other comprehensive income, as a result of the divestment reversed over the income statement but with no effect on total equity or cash flow. Tax attributable to exchange rate differences amounted to SEK 0.3 billion.
Tele2 Netherlands
On December 15, 2017 Tele2 announced that Tele2 and Deutsche Telekom have agreed to combine Tele2 Netherlands and T-Mobile Netherlands. The divestment of Tele2 Netherlands was closed on January 2, 2019. The Dutch operation was sold for SEK 1.9 billion and 25 percent share in the combined company. The capital gain in Q1 2019 amounted to SEK 24 million, including costs for central support system for the Dutch operation and other transaction costs. In addition, the capital gain and taxes was affected positively with SEK 57 and 47 million respectively related to reversal of exchange rate differences previously reported in other comprehensive income, as a result of the divestment reversed over the income statement but with no effect on total equity or cash flow.
34 (40)
TELE2
Interim Report – Second Quarter
Interim Report – Second Quarter
Net assets at the time of divestment
Assets, liabilities and contingent liabilities included in the divested operations in the Netherlands and Kazakhstan are stated below.
| SEK million | Netherlands Jan 2, 2019 | Kazakhstan Jun 28, 2019 | Total |
| Goodwill | 1,015 | 132 | 1,147 |
| Other intangible assets | 1,293 | 224 | 1,517 |
| Tangible assets | 5,300 | 2,118 | 7,418 |
| Right of use assets | – | 649 | 649 |
| Financial assets | 712 | 8 | 720 |
| Capitalized contract costs | 177 | – | 177 |
| Deferred tax assets | – | 359 | 359 |
| Inventories | 156 | 23 | 179 |
| Current receivables | 2,085 | 506 | 2,591 |
| Cash and cash equivalents | 46 | 132 | 178 |
| Non-current provisions | –233 | –116 | –349 |
| Non-current interest-bearing liabilites | – | –703 | –703 |
| Non-current non-interest-bearing liabilities | –88 | –2,008 | –2,096 |
| Current provisions | – | –8 | –8 |
| Current interest bearing liabilities | – | –167 | –167 |
| Current non-interest-bearing liabilities | –1,639 | –852 | –2,491 |
| Non-controlling interest | – | –152 | –152 |
| Divested net assets | 8,824 | 146 | 8,970 |
| Capital gain, excluding sales costs | 24 | 2,330 | 2,354 |
| Sales price | 8,848 | 2,476 | 11,324 |
| Received shares in T-mobile, non-cash | –6,904 | – | –6,904 |
| Price adjustments, non-cash | 458 | – | 458 |
| Less: cash in divested operations | –46 | –132 | –178 |
| TOTAL CASH FLOW EFFECT | 2,356 | 2,344 | 4,700 |
Income statement
All discontinued operations are stated below. Tele2 Netherlands was divested on January 2, 2019 and Tele2 Kazakhstan on June 28, 2019. The divestment of Tele2 Croatia is expected to be closed before the end of 2019.
Discontinued operations SEK million | Apr–Jun 2019 | Apr–Jun 2018 | Jan–Jun 2019 | Jan–Jun 2018 |
| Revenue | 1,391 | 2,800 | 2,651 | 5,454 |
| Cost of services provided and equipment sold | –791 | –1,886 | –1,546 | –3,768 |
| Gross profit | 599 | 914 | 1,105 | 1,686 |
| Selling expenses | –166 | –579 | –314 | –1,183 |
| Administrative expenses | –86 | –328 | –165 | –639 |
| Other operating income | 4 | 2 | 6 | 13 |
| Other operating expenses | –0 | –11 | –1 | –22 |
| Operating profit/loss | 351 | –2 | 631 | –144 |
| Interest income | 2 | 2 | 3 | 5 |
| Interest expenses | –58 | –12 | –91 | –23 |
| Other financial items | –101 | –54 | –129 | –124 |
| Profit/loss after financial items | 194 | –66 | 415 | –285 |
| Income tax from the operation | –60 | –31 | –108 | –55 |
| NET PROFIT/LOSS FROM THE OPERATION | 134 | –97 | 307 | –340 |
| Profit/loss on disposal of operation | 1,598 | –19 | 1,679 | –22 |
| – of which Netherlands | –10 | –20 | 71 | –23 |
| – of which Kazakhstan | 1,608 | – | 1,608 | – |
| – of which Austria, sold 2017 | – | 1 | – | 1 |
| Income tax from capital gain | 290 | – | 337 | – |
| – of which Netherlands | – | – | 47 | – |
| – of which Kazakhstan | 290 | – | 290 | – |
| NET PROFIT/LOSS | 2,022 | –116 | 2,323 | –362 |
| Attributable to: | ||||
| Equity holders of the parent company | 1,948 | –148 | 2,193 | –400 |
| Non-controlling interests | 74 | 32 | 130 | 38 |
| NET PROFIT/LOSS | 2,022 | –116 | 2,323 | –362 |
| Earnings per share (SEK) | 2.83 | –0.29 | 3.19 | –0.79 |
| Earnings per share, after dilution (SEK) | 2.83 | –0.29 | 3.18 | –0.79 |
35 (40)
TELE2
Interim Report – Second Quarter
Interim Report – Second Quarter
Balance sheet
Assets held for sale as of June 30, 2019 refer to Tele2 Croatia and provisions for price adjustments and similar for the divestment of Tele2 Netherlands and Tele2 Kazakhstan. As of December 31, 2018 assets held for sale refer to Tele2 Kazakhstan and Tele2 Netherlands.
Discontinued operations SEK million | Jun 30 2019 | Dec 31 2018 |
| ASSETS | ||
| Goodwill | – | 1,144 |
| Other intangible assets | 182 | 1,545 |
| Intangible assets | 182 | 2,689 |
| Tangible assets | 731 | 7,357 |
| Right-of-use assets | 497 | – |
| Financial assets | 108 | 721 |
| Capitalized contract costs | 39 | 177 |
| Deferred tax assets | 54 | 393 |
| NON-CURRENT ASSETS | 1,611 | 11,337 |
| Inventories | 77 | 180 |
| Current receivables | 939 | 2,503 |
| Current investments | 3 | – |
| CURRENT ASSETS | 1,019 | 2,684 |
| ASSETS CLASSIFIED AS HELD FOR SALE | 2,630 | 14,020 |
| LIABILITIES | ||
| Interest-bearing liabilities | 591 | 641 |
| Non-interest-bearing liabilities | – | 100 |
| Non-current liabilities | 591 | 741 |
| Interest-bearing liabilities | 1,500 | 813 |
| Non-interest-bearing liabilities | 531 | 2,434 |
| Current liabilities | 2,031 | 3,247 |
| LIABILITIES DIRECTLY ASSOCIATED WITH ASSETS CLASSIFIED AS HELD FOR SALE | 2,622 | 3,988 |
Cash flow statement
Discontinued operations SEK million | Apr–Jun 2019 | Apr–Jun 2018 | Jan–Jun 2019 | Jan–Jun 2018 |
| Cash flow from operating activities | 295 | 394 | 518 | 464 |
| Cash flow from investing activities | 2,207 | –357 | 4,473 | –800 |
| Cash flow from financing activities | 1,859 | – | 1,810 | – |
| NET CHANGE IN CASH AND CASH EQUIVALENTS | 4,361 | 37 | 6,801 | –336 |
36 (40)
TELE2
Interim Report – Second Quarter
Interim Report – Second Quarter
Non-IFRS measures
This report contains certain financial measures that are not defined by IFRS, but are used by Tele2 to assess the financial performance of the business. These measures are included in the report as they are considered important supplementary measures of operating performance and liquidity. They should not be considered a substitute to Tele2’s financial statements prepared in accordance with IFRS. Tele2’s definitions of these measures are described below, but other companies may calculate non-IFRS measures differently and these measures are therefore not always comparable to similar measures used by other companies.
EBITDA
Tele2 considers EBITDA to be relevant measure to present profitability aligned with industry standard.
EBITDA: Operating profit/loss before depreciation/amortization, impairment as well as results from shares in joint ventures and associated companies.
Underlying EBITDA and underlying EBITDA margin
Tele2 considers underlying EBITDA and underlying EBITDA margin to be relevant measures to present in order to illustrate the profitability of the underlying business, and as these are used by management to assess the performance of the business.
Underlying EBITDA: EBITDA excluding items affecting comparability.
Items affecting comparability: Disposals of non-current assets and transactions from strategic decisions, such as capital gains and losses from sales of operations, acquisition costs, integration costs due to acquisition or merger, restructuring programs from reorganizations as well as other items that affect comparability.
Underlying EBITDA margin: Underlying EBITDA in relation to revenue.
Underlying EBITDAaL
Tele2 considers underlying EBITDAaL to be a relevant measure of the business performance since it includes the cost of leased assets (depreciation and interest), which is not included in underlying EBITDA according to IFRS 16.
Underlying EBITDAaL: Underlying EBITDA as well as lease depreciation and lease interest costs according to IFRS 16.
Underlying EBITDA excluding IFRS 16
Tele2 considers underlying EBITDA excluding IFRS 16 to be a relevant measure to present during 2019 for comparability with 2018 and 2017 since IFRS 16 Leases has not been adopted retrospectively.
Underlying EBITDA excluding IFRS 16: Underlying EBITDA applying IAS17 accounting standard for leases for all periods.
Continuing operations SEK million | Apr–Jun 2019 | Apr–Jun 2018 | Jan–Jun 2019 | Jan–Jun 2018 |
| Operating profit | 431 | 835 | 1,478 | 1,709 |
| Reversal: | ||||
| Result from shares in joint ventures and associated companies | 73 | 0 | 63 | –13 |
| Depreciation/amortization/impairment | 1,728 | 496 | 2,974 | 984 |
| EBITDA | 2,231 | 1,332 | 4,515 | 2,680 |
| Reversal, items affecting comparability: | ||||
| Acquisition costs | 42 | 111 | 86 | 160 |
| Integration costs | 227 | 19 | 382 | 39 |
| Disposal of non-current assets | 2 | –1 | 3 | 15 |
| Other items affecting comparability | –1 | – | 61 | – |
| Total items affecting comparability | 271 | 129 | 532 | 214 |
| Underlying EBITDA | 2,502 | 1,460 | 5,048 | 2,894 |
| Lease depreciation (according to IFRS 16) | –296 | – | –570 | – |
| Lease interest costs (according to IFRS 16) | –20 | – | –39 | – |
| Underlying EBITDAaL | 2,187 | 1,460 | 4,438 | 2,894 |
| Underlying EBITDA | 2,502 | 1,460 | 5,048 | 2,894 |
| Adjustment to report lease according to IAS 17 | –276 | – | –566 | – |
| Underlying EBITDA excluding IFRS 16 | 2,227 | 1,460 | 4,482 | 2,894 |
| Revenue | 6,794 | 5,113 | 13,537 | 10,107 |
| Reversal, items affecting comparability | – | – | – | – |
| Revenue excluding items affecting comparability | 6,794 | 5,113 | 13,537 | 10,107 |
| Underlying EBITDA margin | 37% | 29% | 37% | 29% |
37 (40)
TELE2
Interim Report – Second Quarter
Interim Report – Second Quarter
Capex paid and capex
Tele2 considers capex paid relevant to present as it provides an indication of how much the company invests organically on intangible and tangible assets to maintain and expand its business. Tele2 believes that it is relevant to present capex to provide a view on how much Tele2 invests organically in intangible and tangible assets as well as on right-of-use assets (lease) to maintain and grow its business which is not dependent on the timing of cash payments.
Capex paid: Cash paid for the additions to intangible and tangible assets net of cash proceeds from sales of intangible and tangible assets.
Capex: Additions to intangible assets, tangible assets and right-of-use assets (lease) that are capitalized on the balance sheet.
Non-IFRS measures - Capex
| SEK million | Apr–Jun 2019 | Apr–Jun 2018 | Jan–Jun 2019 | Jan–Jun 2018 |
| TOTAL OPERATIONS | ||||
| Additions to intangible and tangible assets | –725 | –686 | –2,396 | –1,534 |
| Sale of intangible and tangible assets | 6 | 10 | 6 | 19 |
| Capex paid | –720 | –675 | –2,391 | –1,515 |
| This period’s unpaid capex and reversal of paid capex from previous period | 15 | –84 | 875 | 166 |
| Reversal received payment of sold intangible and tangible assets | –6 | –10 | –6 | –19 |
| Capex in intangible and tangible assets | –710 | –769 | –1,521 | –1,367 |
| Additions to right-of-use assets | –495 | – | –851 | – |
| Capex | –1,205 | –769 | –2,373 | –1,367 |
| CONTINUING OPERATIONS | ||||
| Additions to intangible and tangible assets | –588 | –393 | –2,169 | –798 |
| Sale of intangible and tangible assets | 5 | 10 | 5 | 18 |
| Capex paid | –583 | –383 | –2,164 | –780 |
| This period’s unpaid capex and reversal of paid capex from previous period | 39 | –45 | 926 | –1 |
| Reversal received payment of sold intangible and tangible assets | –5 | –10 | –5 | –18 |
| Capex in intangible and tangible assets | –550 | –438 | –1,243 | –799 |
| Additions to right-of-use assets | –437 | – | –692 | – |
| Capex | –987 | –438 | –1,934 | –799 |
Equity free cash flow
Tele2 considers equity free cash flow to be relevant to present as it provides a view of funds generated from operating activities which also includes investments in intangible and tangible assets. Management believes that equity free cash flow is meaningful to investors because it is the measure of the Group’s funds available for acquisition related payments, dividends to shareholders, share repurchases and debt repayment.
Equity free cash flow: Cash flow from operating activities less capex paid and amortization of lease liabilities.
Non-IFRS meaures - Cash flow
| SEK million | Apr–Jun 2019 | Apr–Jun 2018 | Jan–Jun 2019 | Jan–Jun 2018 |
| TOTAL OPERATIONS | ||||
| Cash flow from operating activities | 2,112 | 1,186 | 4,602 | 2,094 |
| Capex paid | –720 | –675 | –2,391 | –1,515 |
| Amortization of lease liabilities | –297 | – | –679 | –1 |
| Equity free cash flow (EFCF) | 1,095 | 510 | 1,533 | 578 |
| CONTINUING OPERATIONS | ||||
| Cash flow from operating activities | 1,817 | 793 | 4,085 | 1,630 |
| Capex paid | –583 | –383 | –2,164 | –780 |
| Amortization of lease liabilities | –239 | – | –594 | – |
| Equity free cash flow (EFCF) | 995 | 409 | 1,326 | 850 |
38 (40)
TELE2
Interim Report – Second Quarter
Interim Report – Second Quarter
Operating cash flow
Tele2 considers operating cash flow a relevant measure to present as it gives an indication of the profitability of the underlying business while also taking into account the investments needed to maintain and grow the business.
Operating cash flow: Underlying EBITDAaL less capex paid.
Continuing operations SEK million | Apr–Jun 2019 | Apr–Jun 2018 | Jan–Jun 2019 | Jan–Jun 2018 |
| Underlying EBITDAaL | 2,187 | 1,460 | 4,438 | 2,894 |
| Capex paid | –583 | –383 | –2,164 | –780 |
| Operating cash flow (OCF) | 1,603 | 1,077 | 2,274 | 2,114 |
Net debt and economic net debt
Tele2 believes that net debt is relevant to present as it is useful to illustrate the indebtedness, financial flexibility, and capital structure. Furthermore, economic net debt is considered relevant as it excludes lease liabilities, and thereby consistently can be put in relation to underlying EBITDAaL when measuring financial leverage.
Net debt: Interest-bearing non-current and current liabilities excluding equipment financing, provisions, less cash and cash equivalents, current investments, restricted cash and derivatives.
Economic net debt: Net debt excluding lease liabilities. Prior to the completion of the Kazakhstan divestment, also liabilities to Kazakhtelecom, liability for earn-out obligation in Kazakhstan and loan guaranteed by Kazakhtelecom are excluded.
Non-IFRS measures - Debt
Total operations SEK million | Jun 30 2019 | Dec 31 2018 |
| Interest-bearing non-current liabilities | 29,559 | 23,238 |
| Interest-bearing current liabilities | 2,927 | 6,763 |
| Reversal equipment financing | –136 | – |
| Reversal provisions | –2,363 | –1,695 |
| Cash & cash equivalents, current investments and restricted funds | –3,715 | –406 |
| Derivatives | –180 | –33 |
| Net debt for assets classified as held for sale | 2,000 | 1,013 |
| Net debt | 28,093 | 28,881 |
| Reversal: | ||
| Lease liabilities | –6,041 | –17 |
| Liabilities to Kazakhtelecom | – | –30 |
| Liabilities for earn-out obligation Kazakhstan | – | –764 |
| Loan guaranteed by Kazakhtelecom | – | –221 |
| Economic net debt | 22,051 | 27,849 |
Organic
Tele2 believes that organic growth rates are relevant to present as they exclude effects from currency movements but include effects from divestments and acquisitions as if these occured on the first day of each reporting period, and are therefore providing an indication of the underlying performance.
Organic growth rates: Calculated at constant currency, meaning that comparative figures have been recalculated using the currency rates for the current period, but including effects from divestments and acquisitions as if these occured on the first day of each reporting period.
Reconciliation of pro forma figures are presented in an excel document (Tele2-Q2-2019-financials) on Tele2’s website www.tele2.com.
39 (40)
 |

SECOND QUARTER July 17, 2019
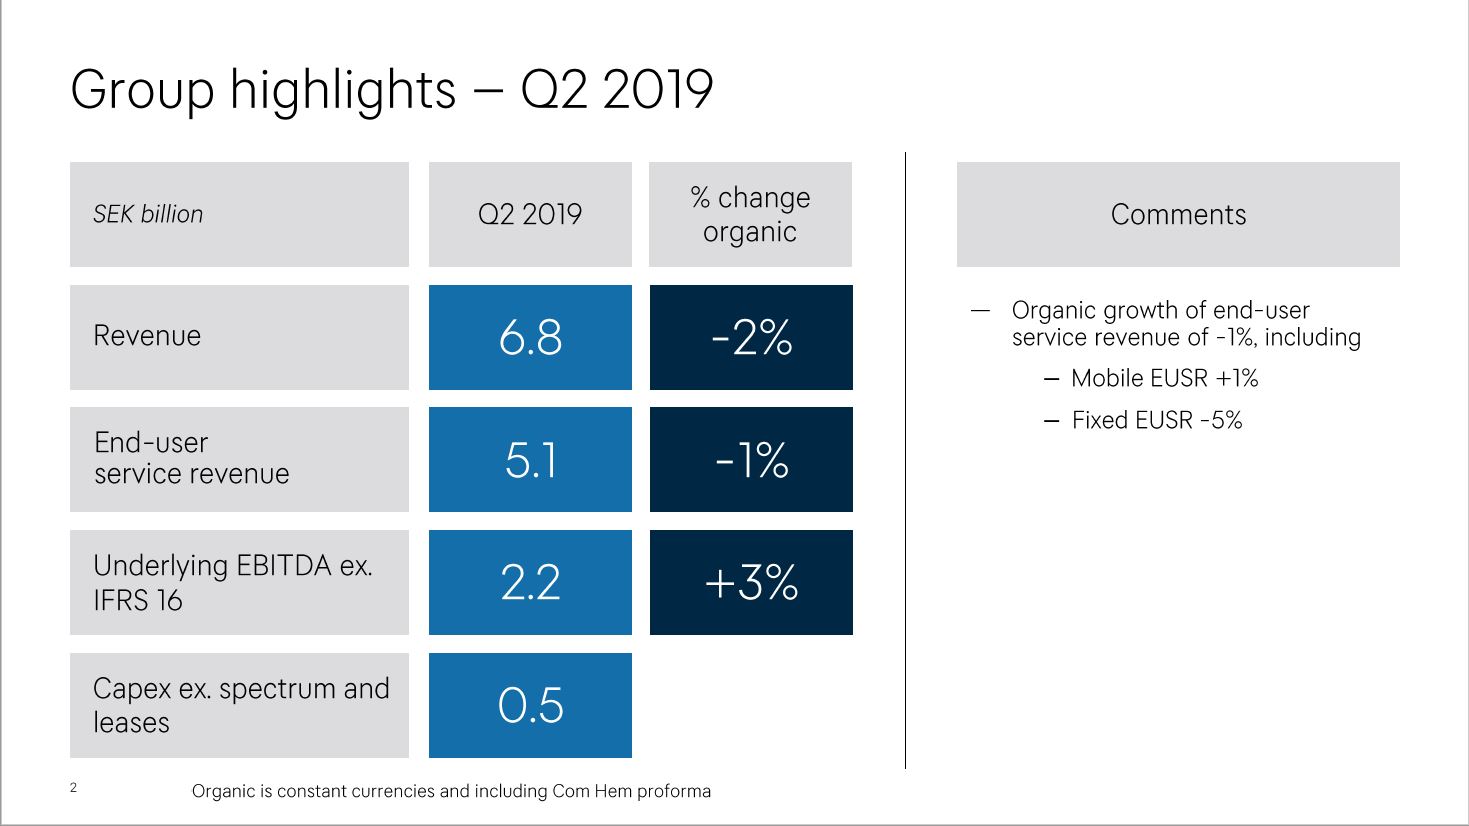
Group highlights -- Q2 2019 % change organic SEK billion Q2 2019 Comments Revenue 6.8 -2% End-user service revenue 5.1 -1% Organic growth of end-user service revenue of -1%, including Mobile EUSR +1% Fixed EUSR -5% Underlying EBITDA ex. IFRS 16 2.2 +3% Capex ex. spectrum and leases 0.5 Organic is constant currencies and including Corn Hem proforma

Tele2 is becoming a true integrated challenger Drive FMC in Sweden B2C -- Increasing penetration of FMC bundle benefits now reaching 93k FMC-customers -- FMC benefits introduced on Boxer brand -- Tele2 rebranding campaign launched Sweden B2B turnaround -- Strong volume growth but continued pressure on ASPU -- Future focus to take market share in SME and further cost reduction Build on the momentum in the Baltics -- Sustained momentum with 6% growth in end-user service revenue and 10% in underlying EBITDA excluding IFRS 16 -- Continued delivery on cost synergies with an impact of SEK 100m in Q2 (SEK 150m in 1H19) Cost transformation -- Annualized run-rate of SEK 450m at the end of Q2 2019 -- Year-end target raised to run-rate of SEK 600m
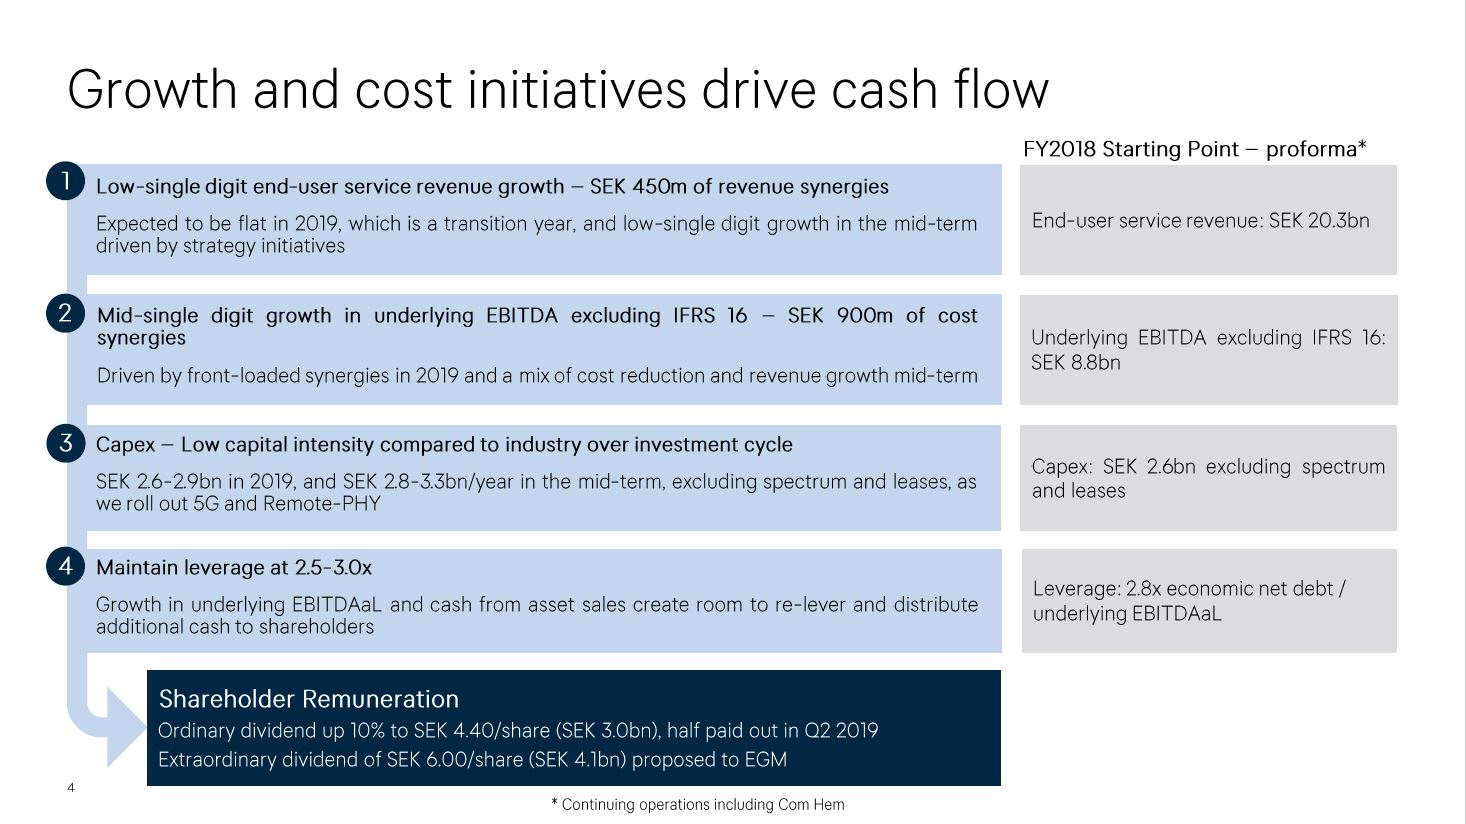
Growth and cost initiatives drive cash flow FY2018 Starting Point -- proforma* 1 Low-single digit end-user service revenue growth -- SEK 450m of revenue synergies Expected to be flat in 2019, which is a transition year, and low-single digit growth in the mid-term driven by strategy initiatives End-user service revenue: SEK 20.3bn 2 Mid-single digit growth in underlying EBITDA excluding IFRS 16 -- SEK 900m of cost synergies Driven by front-loaded synergies in 2019 and a mix of cost reduction and revenue growth mid-term 3 Capex -- Low capital intensity compared to industry over investment cycle SEK 2.6-2.9bn in 2019, and SEK 2.8-3.3bn/year in the mid-term, excluding spectrum and leases, as we roll out 5G and Remote-PHY 4 Maintain leverage at 2.5-3.0x Growth in underlying EBITDAaL and cash from asset sales create room to re-lever and distribute additional cash to shareholders Shareholder Remuneration Ordinary dividend up 10% to SEK 4.40/share (SEK 3.0bn), half paid out in Q2 2019 Extraordinary dividend of SEK 6.00/share (SEK 4.1bn) proposed to EGM Underlying EBITDA excluding IFRS 16: SEK 8.8bn Capex: SEK 2.6bn excluding spectrum and leases Leverage: 2.8x economic net debt / underlying EBITDAaL * Continuing operations including Com Hem
SWEDEN
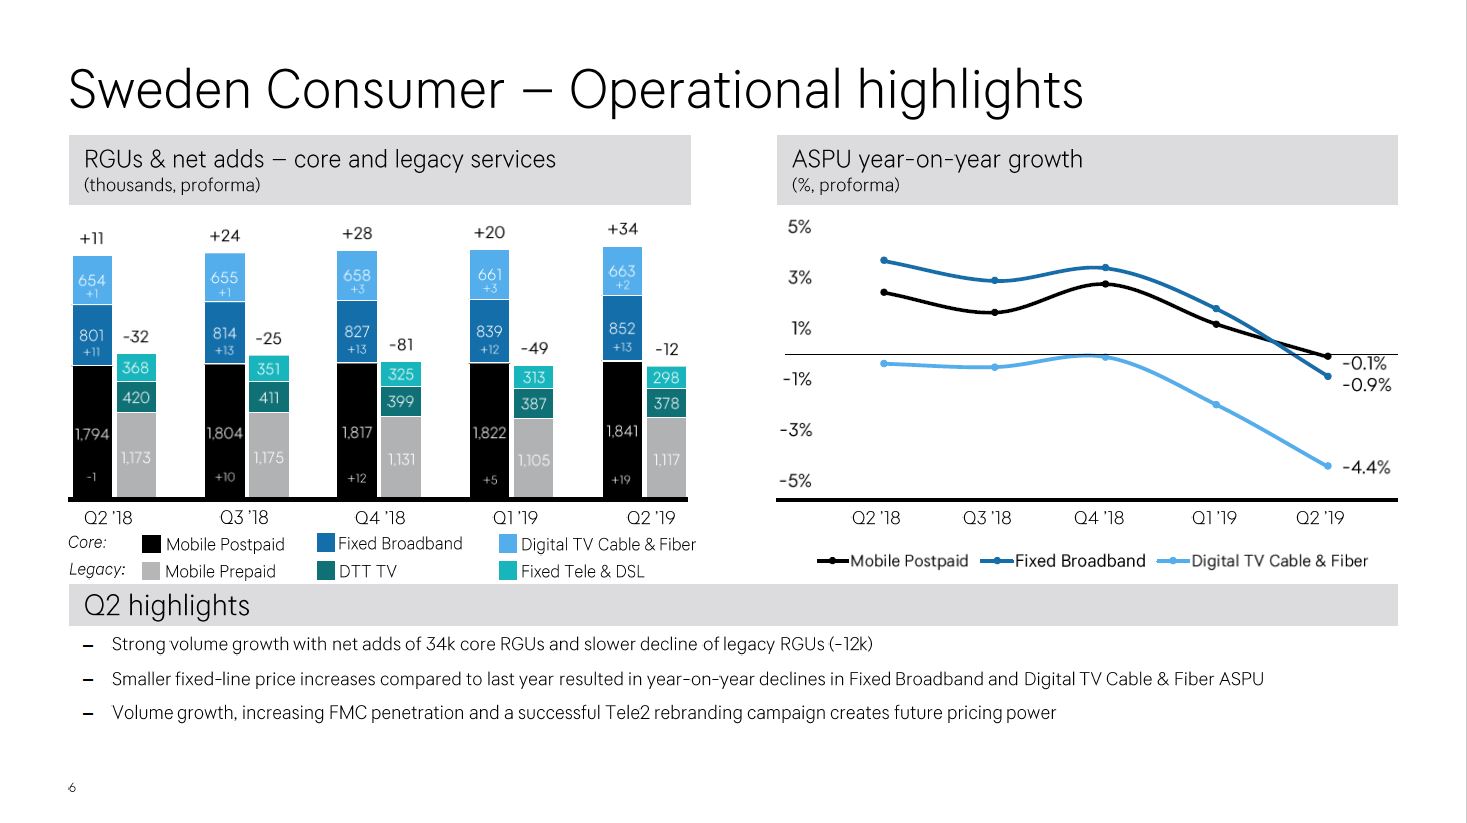
Sweden Consumer -- Operational highlights ASPU year-on-year growth (%, proforma) 5% 3% 1% -1% -3% -5% -0.1% -0.9% -4.4% RGUs & net adds -- core and legacy services (thousands, proforma) +11 +24 +28 +20 +34 -12 654 +1 801 +11 1,794 -1 -32 368 420 1,173 655 +1 814 +13 1,804 +10 -25 351 411 1,175 658 +3 827 +13 1,817 +12 -81 325 399 1,131 661 +3 839 +12 1,822 +5 -49 313 387 1,105 663 +2 852 +13 1,841 +19 298 378 1,117 Q2 '18 Q3 '18 Q4 '18 Q1 '19 Q2 '19 Q2 '18 Q3 '18 Q4 '18 Q1 '19 Q2 '19 Core: Mobile Postpaid Fixed Broadband Digital TV Cable & Fiber Mobile Postpaid Fixed Broadband Digital TV Cable & Fiber Legacy: Mobile Prepaid DTT TV Fixed Tele & DSL Q2 highlights - Strong volume growth with net adds of 34k core RGUs and slower decline of legacy RGUs (-12k) - Smaller fixed-line price increases compared to last year resulted in year-on-year declines in Fixed Broadband and Digital TV Cable & Fiber ASPU - Volume growth, increasing FMC penetration and a successful Tele2 rebranding campaign creates future pricing power
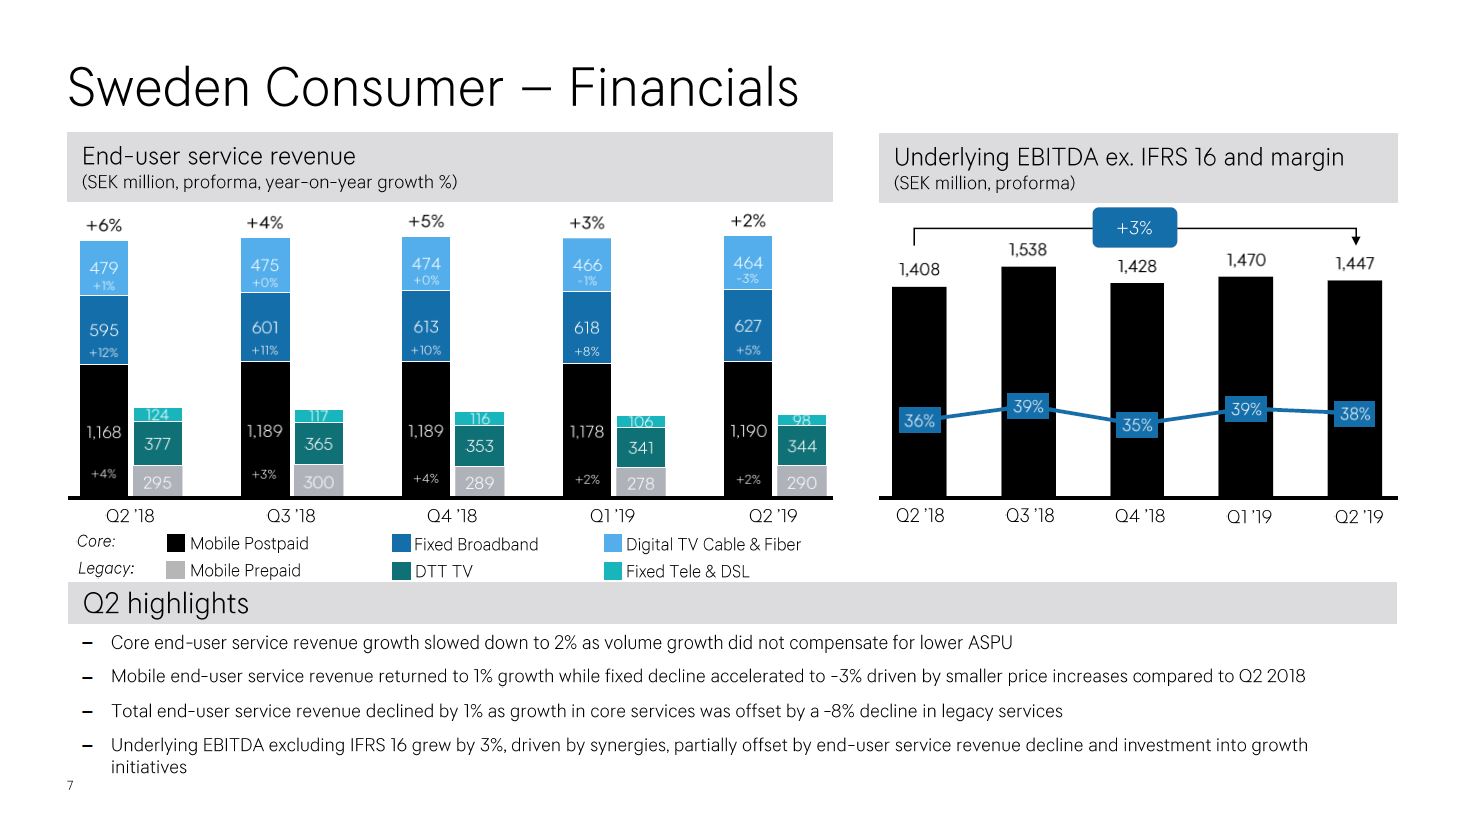
Sweden Consumer -- Financials End-user service revenue (SEK million, proforma, year-on-year growth %) +6% +4% +5% +3% +2% 479 +1% 595 +12% 1,168 +4% 123 377 295 475 +10% 601 +11% 1,189 +3% 117 365 300 474 +0% 613 +10% 1,189 +4% 116 353 289 466 -1% 618 +8% 1,178 +2% 106 341 278 464 -3% 627 +5% 1,190 +2% 98 344 290 Underlying EBITDA ex. IFRS 16 and margin (SEK million, proforma) +3% 1,408 1,538 1,428 1,470 1,447 36% 39% 35% 39% 38% Q2 '18 Q3 '18 Q4 '18 Q1 '19 Q2 '19 Q2 '18 Q3 '18 Q4 '18 Q1 '19 Q2'19 Core: Mobile Postpaid Fixed Broadband Digital TV Cable & Fiber Legacy: 1 Mobile Prepaid DTT TV Fixed Tele & DSL Q2 highlights - Core end-user service revenue growth slowed down to 2% as volume growth did not compensate for lower ASPU - Mobile end-user service revenue returned to 1% growth while fixed decline accelerated to -3% driven by smaller price increases compared to Q2 2018 - Total end-user service revenue declined by 1% as growth in core services was offset by a -8% decline in legacy services - Underlying EBITDA excluding IFRS 16 grew by 3%, driven by synergies, partially offset by end-user service revenue decline and investment into growth initiatives

Sweden Business -- Operational highlights Mobile RGUs (thousands, proforma) +5% 867 881 889 896 913 Mobile ASPU (SEK, proforma) -9% 184 180 183 177 168 End-user service revenue (SEK million, proforma, year-on-year growth %) -5% -2% -1% -2% -4% 264 -0% 309 -14% 475 -1% 246 -3% 307 -10% 473 +3% 280 +4% 296 -12% 486 +4% 264 +1% 295 -9% 475 +1% 276 +5% 276 -11% 456 -4% Q2 '18 Q3 '18 04 '18 Q1 '19 Q2 '19 Q2 '18 Q3 '18 Q4 '18 01 '19 Q2 '19 02 '18 03 '18 Q4 '18 Q1 '19 Q2 '19 Mobile Fixed Solutions Q2 highlights - Strong volume growth with 17k mobile RGUs added in the quarter mainly in the Large Enterprise market - Mobile ASPU pressure continues, mainly due to price competition in key government tenders - Mobile end-user service revenue growth turned negative as volume growth did not compensate for lower market pricing - Strong growth in Solutions end-user service revenue with improving mix of higher-margin revenue

Sweden Business -- Financials Revenue (SEK million, proforma) -3% 139 421 1,047 152 352 1,026 137 504 1,062 168 446 1,033 170 375 1,008 Underlying EBITDA ex. IFRS 16 and margin (SEK million, proforma) +4% 323 286 408 359 346 301 378 306 335 258 Q2 '18 Q3 '18 Q4 '18 Q1 '19 Q2 '19 End-user Equipment Wholesale Operator Q2 '18 Q3 '18 Q4 '18 Q1 '19 Q2 '19 EBITDA EBITDA ex. Wholesale EBITDA margin ex. Wholesale Q2 highlights - Total revenue declined by 3%, driven by accelerated decline in end-user service revenue and equipment revenue - Underlying EBITDA excluding IFRS 16 grew by 4%, driven by cost reduction
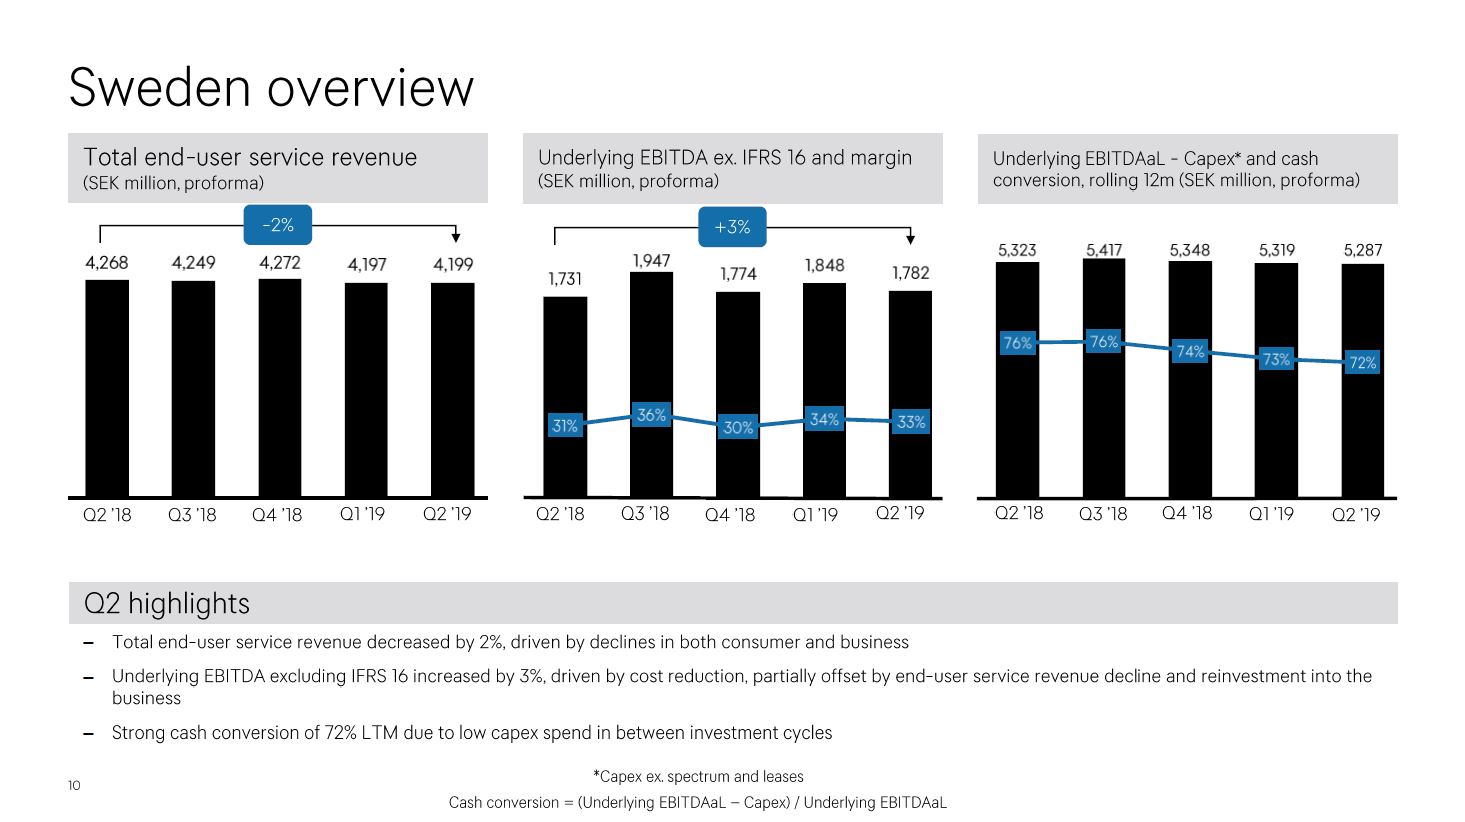
Sweden overview Total end-user service revenue (SEK millions, proforma) -2% 4,268 4,249 4,272 4,197 4,199 Q2'18 Q3'18 Q4'18 Q1'19 Q2'19 Underlying EBITDA ex. IFRS 16 and margin (SEK millions, proforma) +3% 1,731 1,947 1,774 1,848 1,782 31% 36% 30% 34% 33% Q2'18 Q3'18 Q4'18 Q1'19 Q2'19 Underlying EBITDAal - Capex* and cash conversation, rolling 12m (SEK million, proforma) 5,323 5,417 5,348 5,319 5,287 76% 76% 74% 73% 72% Q2'18 Q3'18 Q4'18 Q1'19 Q2'19 Q2 highlights - Total end-user service revenue decreased by 2%, driven by declines in both consumer and business - Underlying EBITDA excluding IFRS 16 increased by 3%, driven by cost reduction, partially offset by end-user service revenue decline and reinvestment into the business - Strong cash conversion of 72% LTM due to low capex spend in between investment cycles *Cash ex. spectrum and leases Cash converstion = (Underlying EBITDAaL - Capex) / Underlying EBITDAaL
INTERNATIONAL
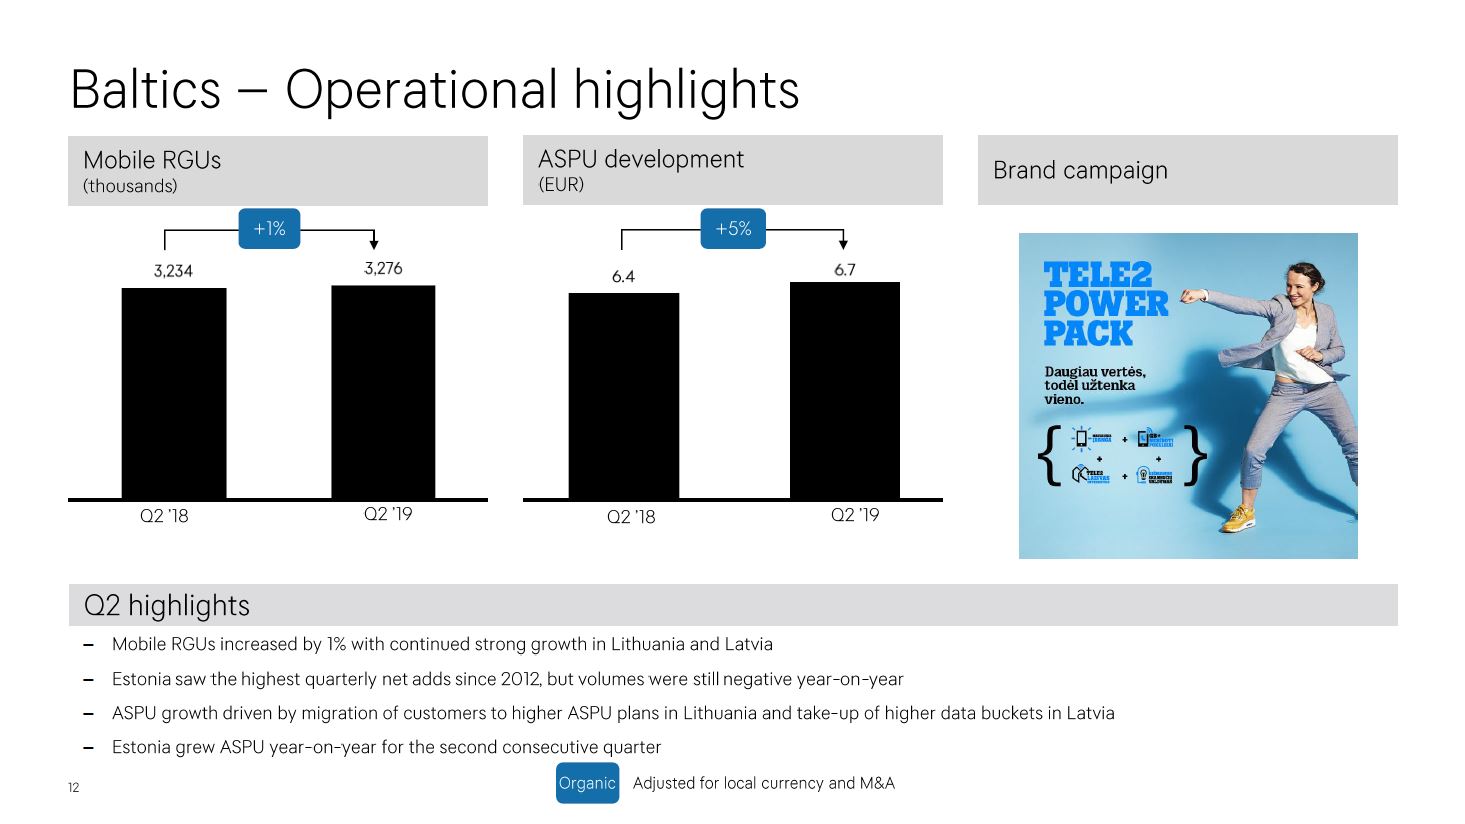
Baltics -- Operational highlights Mobile RGUs (thousands) +1% 3,234 3,276 Q2'18 Q2'19 ASPU development (EUR) +5% 6.4 6.7 Q2'18 Q2'19 Brand campaign Q2 highlights - Mobile RGUs increased by 1% with continued strong growth in Lithuania and Latvia - Estonia saw the highest quarterly net adds since 2012, but volumes were still negative year-on-year - ASPU growth driven by migration of customers to higher ASPU plans in Lithuania and take-up of higher data buckets in Latvia - Estonia grew ASPU year-on-year for the second consecutive quarter Organic Adjusted for local currency and M&A

Baltics -- Financials End-user service revenue (SEK million) +6% 644 654 661 660 704 Q2'18 Q3'18 Q4'18 Q1'19 Q2'19 Underlying EBITDA ex. IFRS 16 and margin (SEK million) +10% 366 402 374 385 413 33% 35% 31% 34% 35% Q2'18 Q3'18 Q4'18 Q1'19 Q2'19 Underlying EBITDAaL - Capex* and cash conversion, rolling 12m (SEK million) 1,045 1,080, 1,115 1,165 1,205 78% 77% 76% 77% 77% Q2'18 Q3'18 Q4'18 Q1'19 Q2'19 Q2 highlights - End-user service revenue increased by 6% driven by Lithuania and Latvia while Estonia remains a drag as decline in volumes offset growth in ASPU - Underlying EBITDA excluding IFRS 16 grew by 10%, driven by revenue growth in Lithuania and Latvia while Estonia continued to decline - Strong cash conversion of 77% LTM due to low capex spend in between investment cycles *Capex ex. spectrum and leases Organic Adjusted for local currency and M&A Cash conversion = (Underlying EBITDAaL -- Capex) / Underlying EBITDAaL
FINANCIAL OVERVIEW
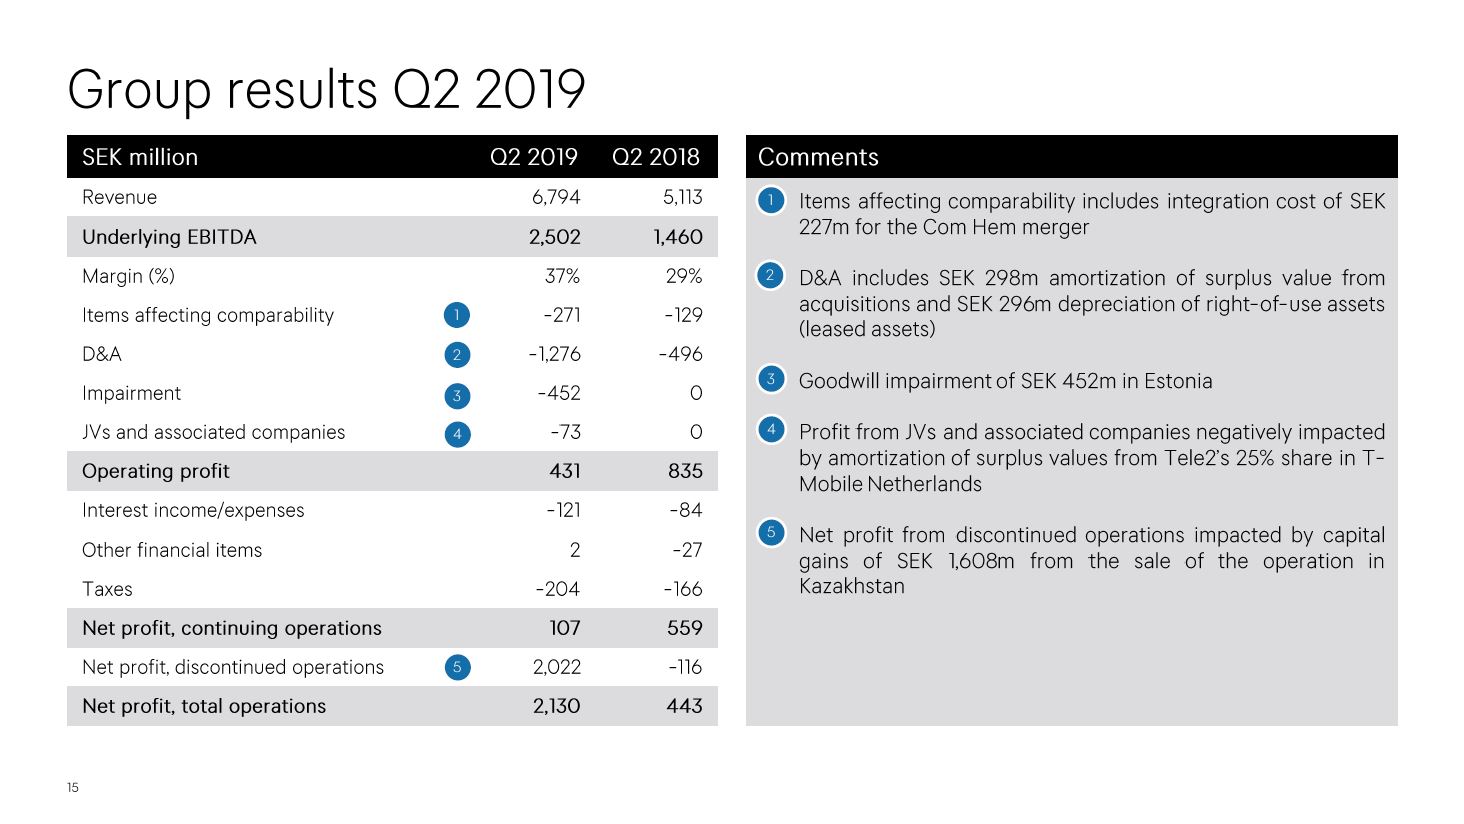
Group results Q2 2019 SEK million Q2 2019 Q2 2018 Revenue 6,794 5,113 Underlying EBITDA 2,502 1,460 Margin (%) 37% 29% Items affecting comparability 1 -271 -129 D&A 2 -1,276 -496 Impairment 3 -452 0 JVs and associated companies 4 -73 0 Operating profit 431 835 Interest income/expenses -121 -84 Other financial items 2 -27 Taxes -204 -166 Net profit, continuing operations 107 559 Net profit, discontinued operations 2,022 -116 Net profit, total operations 2,130 443 Comments 1 Items affecting comparability includes integration cost of SEK 227m for the Com Hem merger 2 D&A includes SEK 298m amortization of surplus value from acquisitions and SEK 296m depreciation of right-of-use assets (leased assets) 3 Goodwill impairment of SEK 452m in Estonia 4 Profit from JVs and associated companies negatively impacted by amortization of surplus values from Tele2's 25% share in T-Mobile Netherlands 5 Net profit from discontinued operations impacted by capital gains of SEK 1,608m from the sale of the operation in Kazakhstan
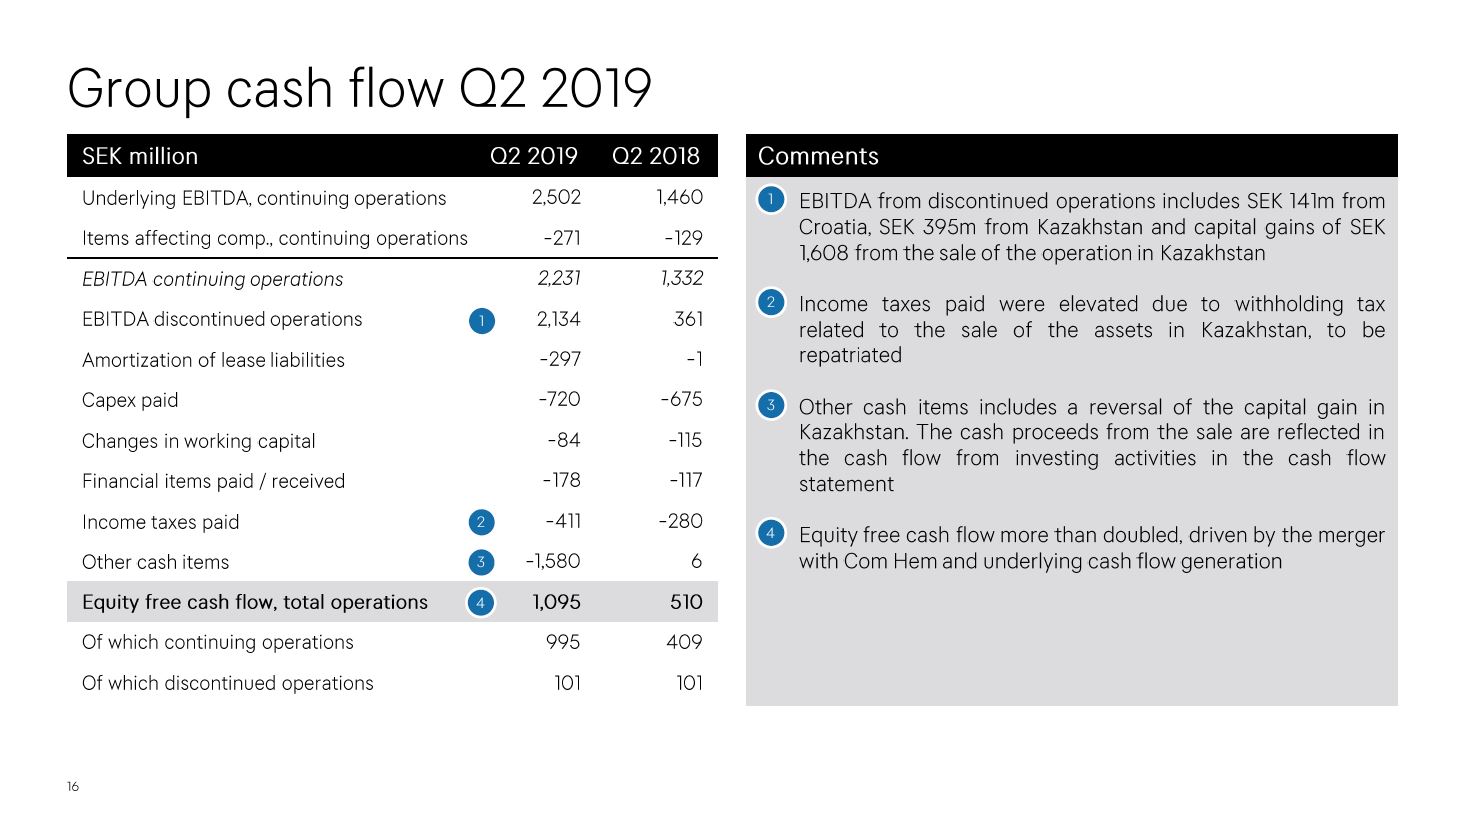
Group cash flow Q2 2019 SEK million Q2 2019 Q2 2018 Underlying EBITDA, continuing operations 2,502 1,460 Items affecting comp., continuing operations -271 -129 EBITDA continuing operations 2,231 1,332 EBITDA discontinued operations 0 2,134 361 Amortization of lease liabilities -297 -1 Capex paid -720 -675 Changes in working capital -84 -115 Financial items paid / received -178 -117 Income taxes paid 2 -411 -280 Other cash items 3 -1,580 6 Equity free cash flow, total operations 4 1,095 510 Of which continuing operations 995 409 Of which discontinued operations 101 101 Comments 1 EBITDA from discontinued operations includes SEK 141m from Croatia, SEK 395m from Kazakhstan and capital gains of SEK 1,608 from the sale of the operation in Kazakhstan 2 Income taxes paid were elevated due to withholding related to the sale of the assets in Kazakhstan, be repatriated 3 Other cash items includes a reversal of the capital gain in Kazakhstan. The cash proceeds from the sale are reflected in the cash flow from investing activities in the cash flow statement 4 Equity free cash flow more than doubled, driven by the merger with Com Hem and underlying cash flow generation

Synergy update Benefit in quarter Run-rate (Annualized at end of quarter) Target (Run-rate at end of year 3) Opex synergies (SEK million) 100 450 900 Revenue synergies Important first steps taken towards target of SEK 450m in 5 years, including FMC benefits for Boxer customers Drivers - We realized additional synergies with an impact of SEK 100m in the quarter leading to a total of SEK 150m in 1H19 - Run-rate of SEK 450m already reached after six months. Upgrading year-end run-rate target to SEK 600m based on faster than expected headcount reduction - Maintaining 3-year target of SEK 900m - Integration costs of SEK 227m incurred in the quarter, with a total of SEK 592m incurred since the start of the integration
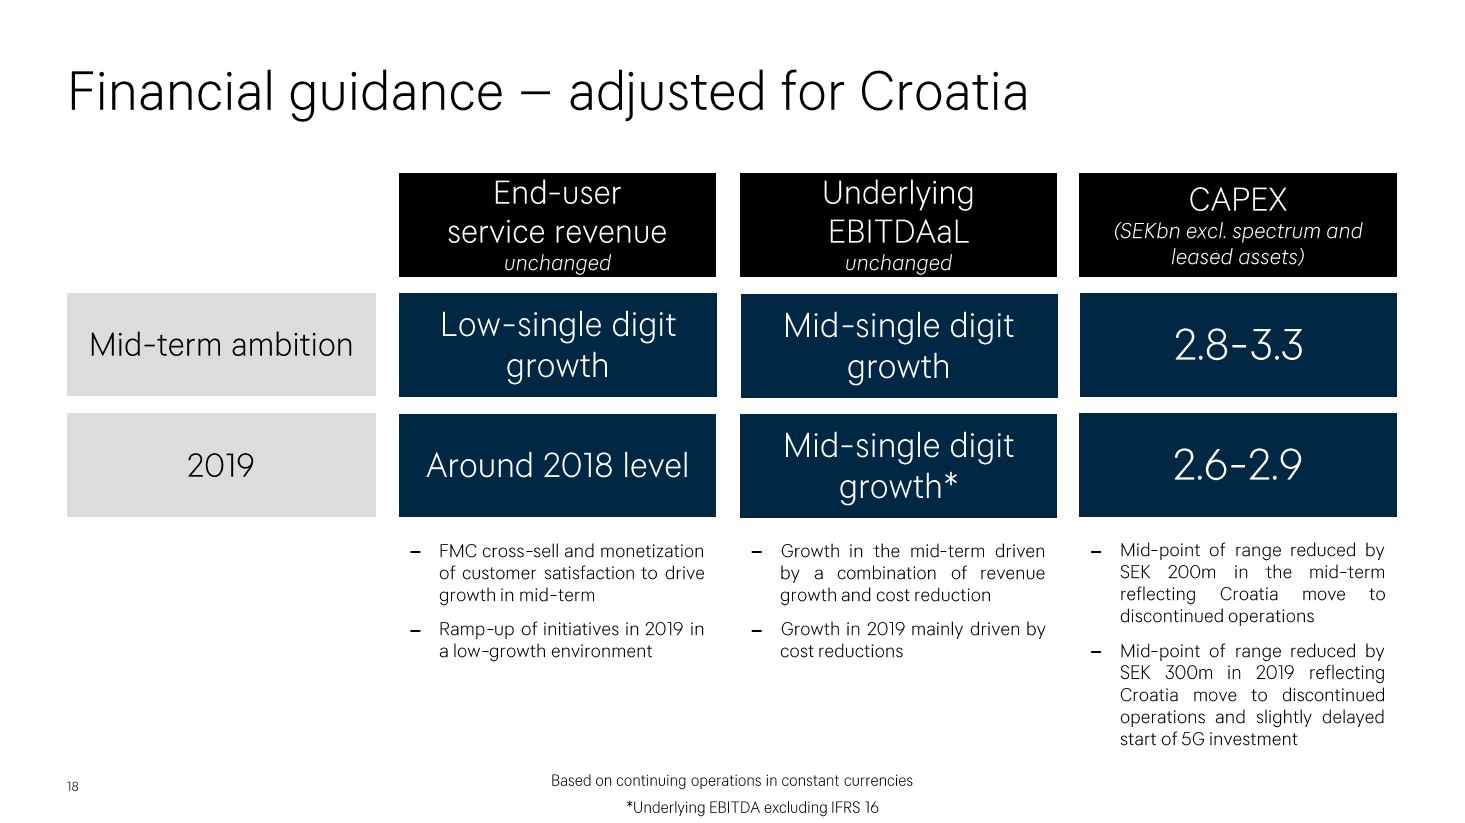
Financial guidance -- adjusted for Croatia End-user service revenue unchanged Underlying EBITDAaL unchanged CAPEX (SEKbn excl. spectrum and leased assets) Mid-term ambition 2019 Low-single digit growth Around 2018 level Mid-single digit growth Mid-single digit growth* 2.8-3.3 2.6-2.9 - FMC cross-sell and monetization of customer satisfaction to drive growth in mid-term - Ramp-up of initiatives in 2019 in a low-growth environment - Growth in the mid-term driven by a combination of revenue growth and cost reduction - Growth in 2019 mainly driven by cost reductions - Mid-point of range reduced by SEK 200m in the mid-term reflecting Croatia move to discontinued operations - Mid-point of range reduced by SEK 300m in 2019 reflecting Croatia move to discontinued operations and slightly delayed start of 5G investment Based on continuing operations in constant currencies *Underlying EBITDA excluding IFRS 16
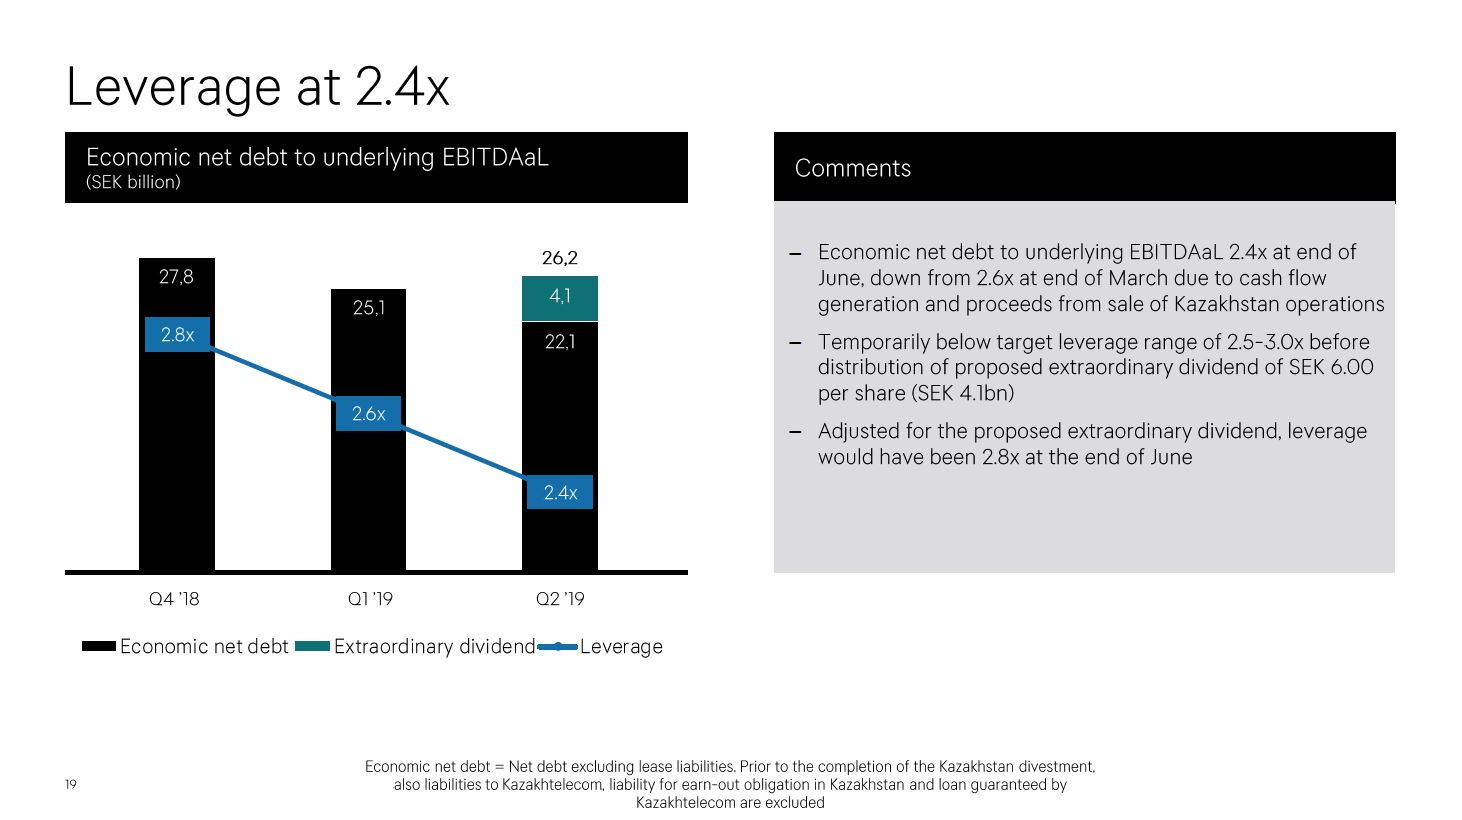
Leverage at 2.4x Economic net debt to underlying EBITDAaL (SEK billion) 27.8 2.8x 25.1 2.6x 26.2 22.1 2.4x Q4'18 Q1'19 Q2'19 Economic net debt Extraordinary dividend Leverage Comments - Economic net debt to underlying EBITDAal 2.4x at end of June, down from 2.6x at end of March due to cash flow generation and proceeds from sale of Kazakhstan operations - Temporarily below target leverage range of 2.5-3.0x before distribution of proposed extraordinary dividend of SEK 6.00 per share (SEK 4.1bn) - Adjusted for the proposed extraordinary dividend, leverage would have been 2.8x at the end of June Economic net debt = Net debt excluding lease liabilities. Prior to the completion of the Kazakhstan divestment, also liabilities to Kazakhtelecom, liability for earn-out obligation in Kazakhstan and loan guaranteed by Kazakhtelecom are excluded

TO CONCLUDE...

Key priorities moving forward Reignite end-user service revenue growth in Sweden -- B2C: FMC penetration in the customer base -- FMC benefits to be extended to all brands -- Capitalize on positive pricing environment -- B2B: Execute on turnaround Structural cost savings -- Cost synergy target raised to SEK 600m run-rate by year-end 2019 -- Cost synergies of SEK 900m within 3 years -- Investigate further initiatives Build on the momentum in the Baltics Close the sale of Croatia Distribute extraordinary dividend to shareholders

THANK YOU!

| Income statement | |||||||||||||||||
| SEK million | Comments | 2017 | 2017 | 2017 | 2017 | 2018 | 2018 | 2018 | 2018 | 2019 | 2019 | 2019 | 2019 | 2017 | 2018 | 2019 | |
| Q1 | Q2 | Q3 | Q4 | Q1 | Q2 | Q3 | Q4 | Q1 | Q2 | Q3 | Q4 | Full-year | Full-year | Full-year | |||
| Revenue | 4,807 | 4,883 | 4,835 | 5,255 | 4,994 | 5,113 | 5,062 | 6,606 | 6,743 | 6,794 | 19,780 | 21,775 | |||||
| Cost of services provided and equipment sold | -2,631 | -2,630 | -2,545 | -2,947 | -2,780 | -2,860 | -2,758 | -3,967 | -3,962 | -4,411 | -10,754 | -12,365 | |||||
| Gross profit | 2,175 | 2,254 | 2,290 | 2,307 | 2,214 | 2,253 | 2,304 | 2,639 | 2,781 | 2,383 | 9,027 | 9,410 | |||||
| Selling expenses | -834 | -895 | -834 | -923 | -843 | -864 | -761 | -1,146 | -1,045 | -1,171 | -3,486 | -3,614 | |||||
| Administrative expenses | -505 | -531 | -483 | -616 | -466 | -471 | -568 | -724 | -676 | -691 | -2,135 | -2,229 | |||||
| Result from shares in joint ventures and associated companies | 0 | 0 | 0 | -1 | 14 | 0 | 0 | -5 | 10 | -73 | 0 | 9 | |||||
| Other operating income | 24 | 21 | 38 | 40 | 47 | 48 | 39 | 52 | 75 | 77 | 124 | 186 | |||||
| Other operating expenses | -13 | -4 | -17 | -24 | -92 | -130 | -88 | -159 | -97 | -94 | -58 | -470 | |||||
| Operating profit | 848 | 845 | 995 | 785 | 874 | 835 | 926 | 656 | 1,047 | 431 | 3,472 | 3,291 | |||||
| Interest income | 2 | 2 | 2 | 3 | 7 | 0 | 4 | 5 | 6 | 8 | 10 | 15 | |||||
| Interest expenses | -81 | -78 | -71 | -81 | -76 | -84 | -65 | -99 | -113 | -129 | -312 | -323 | |||||
| Other financial items | 3 | -6 | 0 | 0 | -13 | -27 | -7 | -17 | 5 | 2 | -2 | -64 | |||||
| Profit after financial items | 772 | 762 | 926 | 707 | 792 | 725 | 858 | 545 | 946 | 311 | 3,168 | 2,919 | |||||
| Income tax | -192 | -192 | -185 | -164 | -196 | -166 | -225 | -1,224 | -222 | -204 | -734 | -1,811 | |||||
| Net profit, continuing operations | 580 | 570 | 741 | 543 | 595 | 559 | 633 | -679 | 723 | 107 | 2,434 | 1,108 | |||||
| Net profit, discontinued operations | -212 | -330 | -177 | -1,495 | -246 | -116 | -105 | 350 | 301 | 2,022 | -2,215 | -116 | |||||
| Net profit, total operations | 368 | 241 | 564 | -953 | 349 | 443 | 528 | -329 | 1,024 | 2,130 | 219 | 992 | |||||
Continuing operations | |||||||||||||||||
| Attributable to: | |||||||||||||||||
| Equity holders of the parent company | 580 | 570 | 741 | 542 | 595 | 559 | 633 | -679 | 723 | 107 | 2,434 | 1,108 | |||||
| Non-controlling interests | 0 | 0 | 0 | 0 | 0 | 0 | 0 | 0 | 0 | 0 | 0 | 0 | |||||
| Net profit, continuing operations | 580 | 570 | 741 | 543 | 595 | 559 | 633 | -679 | 723 | 107 | 2,434 | 1,108 | |||||
| Earnings per share (SEK) | 1.15 | 1.14 | 1.47 | 1.08 | 1.18 | 1.11 | 1.26 | -1.46 | 1.05 | 0.16 | 4.84 | 2.09 | |||||
| Earnings per share, after dilution (SEK) | 1.15 | 1.13 | 1.46 | 1.07 | 1.18 | 1.10 | 1.25 | -1.46 | 1.05 | 0.15 | 4.81 | 2.07 | |||||
Total operations | |||||||||||||||||
| Attributable to: | |||||||||||||||||
| Equity holders of the parent company | 409 | 260 | 566 | -1,044 | 343 | 411 | 504 | -405 | 968 | 2,056 | 191 | 854 | |||||
| Non-controlling interests | -41 | -19 | -2 | 91 | 6 | 32 | 24 | 76 | 56 | 74 | 28 | 138 | |||||
| Net profit, total operations | 368 | 241 | 564 | -953 | 349 | 443 | 528 | -329 | 1,024 | 2,130 | 219 | 992 | |||||
| Earnings per share (SEK) | 0.81 | 0.52 | 1.13 | -2.08 | 0.68 | 0.82 | 1,00 | -0.89 | 1.41 | 2.99 | 0.38 | 1,61 | |||||
| Earnings per share, after dilution (SEK) | 0.81 | 0.51 | 1.12 | -2.06 | 0.68 | 0.81 | 0.99 | -0.88 | 1.40 | 2.98 | 0.38 | 1.60 | |||||
| Balance sheet | |||||||||||||
| Total operations | Comments | 2017 | 2017 | 2017 | 2017 | 2018 | 2018 | 2018 | 2018 | 2019 | 2019 | 2019 | 2019 |
| SEK million | Mar 31 | Jun 30 | Sep 30 | Dec 31 | Mar 31 | Jun 30 | Sep 30 | Dec 31 | Mar 31 | Jun 30 | Sep 30 | Dec 31 | |
| ASSETS | |||||||||||||
| Goodwill | 7,594 | 7,641 | 7,565 | 5,517 | 5,647 | 5,683 | 5,638 | 30,158 | 30,198 | 29,782 | |||
| Other intangible assets | 5,665 | 5,556 | 5,363 | 4,044 | 4,074 | 4,075 | 4,002 | 19,604 | 19,421 | 18,985 | |||
| Intangible assets | 13,259 | 13,197 | 12,928 | 9,561 | 9,721 | 9,758 | 9,640 | 49,763 | 49,619 | 48,767 | |||
| Tangible assets | 14,249 | 14,113 | 13,344 | 8,692 | 8,710 | 8,698 | 8,375 | 9,192 | 9,035 | 8,169 | |||
| Right-of-use assets | 0 | 0 | 0 | 0 | 0 | 0 | 0 | 0 | 6,048 | 5,724 | |||
| Shares in joint ventures and associated companies | 9 | 9 | 9 | 16 | 14 | 11 | 18 | 13 | 7,071 | 7,090 | |||
| Other financial assets | 1,398 | 1,425 | 1,291 | 778 | 723 | 928 | 959 | 1,015 | 798 | 685 | |||
| Capitalized contract costs | 596 | 597 | 563 | 380 | 347 | 327 | 324 | 374 | 396 | 365 | |||
| Deferred tax assets | 1,721 | 1,697 | 1,441 | 1,911 | 1,927 | 1,864 | 1,732 | 367 | 453 | 392 | |||
| Non-current assets | 31,232 | 31,038 | 29,576 | 21,338 | 21,442 | 21,586 | 21,048 | 60,723 | 73,420 | 71,191 | |||
| Inventories | 930 | 869 | 837 | 689 | 852 | 797 | 609 | 670 | 827 | 741 | |||
| Current receivables | 8,471 | 8,204 | 7,899 | 6,726 | 6,754 | 6,766 | 6,742 | 6,824 | 6,731 | 6,154 | |||
| Current investments | 7 | 3 | 3 | 3 | 3 | 70 | 3 | 2 | 2 | 2 | |||
| Cash and cash equivalents | 752 | 318 | 1,068 | 802 | 441 | 248 | 1,212 | 404 | 914 | 3,713 | |||
| Current assets | 10,160 | 9,394 | 9,807 | 8,220 | 8,050 | 7,881 | 8,566 | 7,901 | 8,474 | 10,610 | |||
| Assets classified as held for sale | 0 | 0 | 616 | 10,166 | 10,464 | 10,530 | 10,380 | 14,020 | 4,089 | 2,630 | |||
| TOTAL ASSETS | 41,392 | 40,432 | 39,999 | 39,724 | 39,956 | 39,997 | 39,994 | 82,644 | 85,983 | 84,431 | |||
| EQUITY AND LIABILITIES | |||||||||||||
| Attributable to equity holders of the parent company | 19,284 | 16,968 | 17,206 | 17,246 | 18,187 | 16,782 | 17,037 | 36,334 | 37,405 | 37,039 | |||
| Non-controlling interests | -360 | -349 | -316 | -114 | -117 | -80 | -48 | 28 | 86 | 0 | |||
| Equity | 18,924 | 16,619 | 16,890 | 17,132 | 18,070 | 16,701 | 16,989 | 36,362 | 37,491 | 37,039 | |||
| Interest-bearing liabilities | 10,474 | 11,572 | 11,639 | 11,565 | 9,736 | 11,044 | 11,097 | 23,238 | 29,666 | 29,559 | |||
| Non-interest-bearing liabilities | 891 | 882 | 918 | 998 | 1,006 | 988 | 987 | 4,204 | 4,255 | 4,205 | |||
| Non-current liabilities | 11,365 | 12,454 | 12,557 | 12,563 | 10,742 | 12,032 | 12,084 | 27,443 | 33,921 | 33,765 | |||
| Interest-bearing liabilities | 2,197 | 2,639 | 2,026 | 820 | 2,431 | 2,607 | 2,621 | 6,763 | 4,209 | 2,927 | |||
| Non-interest-bearing liabilities | 8,906 | 8,720 | 8,248 | 7,074 | 6,622 | 6,536 | 6,227 | 8,088 | 7,078 | 8,079 | |||
| Current liabilities | 11,103 | 11,359 | 10,274 | 7,894 | 9,053 | 9,143 | 8,848 | 14,851 | 11,287 | 11,006 | |||
| Liabilities directly associated with assets classified as held for sale | 0 | 0 | 278 | 2,135 | 2,091 | 2,120 | 2,073 | 3,988 | 3,284 | 2,622 | |||
| TOTAL EQUITY AND LIABILITIES | 41,392 | 40,432 | 39,999 | 39,724 | 39,956 | 39,997 | 39,994 | 82,644 | 85,983 | 84,431 | |||
| Net debt | 10,544 | 12,445 | 11,338 | 10,474 | 10,585 | 12,205 | 11,190 | 28,881 | 32,570 | 28,093 | |||
| Economic net debt | 10,266 | 11,980 | 10,659 | 9,753 | 9,775 | 11,341 | 10,205 | 27,849 | 25,058 | 22,051 | |||
| Cash flow statement | |||||||||||||||||
| Total operations | Comments | 2017 | 2017 | 2017 | 2017 | 2018 | 2018 | 2018 | 2018 | 2019 | 2019 | 2019 | 2019 | 2017 | 2018 | 2019 | |
| SEK million | Q1 | Q2 | Q3 | Q4 | Q1 | Q2 | Q3 | Q4 | Q1 | Q2 | Q3 | Q4 | Full-year | Full-year | Full-year | ||
Operating activities | |||||||||||||||||
| Net profit | 368 | 241 | 564 | -953 | 349 | 443 | 528 | -329 | 1,024 | 2,130 | 219 | 992 | |||||
| Adjustments for non-cash items in net profit | 1,134 | 1,018 | 1,188 | 2,237 | 1,026 | 857 | 1,356 | 2,052 | 1,350 | 67 | 5,578 | 5,291 | |||||
| Changes in working capital | -478 | 415 | 207 | -209 | -467 | -115 | -33 | -508 | 116 | -84 | -65 | -1,123 | |||||
| Cash flow from operating activities | 1,024 | 1,674 | 1,959 | 1,075 | 908 | 1,186 | 1,851 | 1,215 | 2,490 | 2,112 | 5,732 | 5,160 | |||||
Investing activities | |||||||||||||||||
| Additions to intangible and tangible assets | -846 | -854 | -669 | -844 | -839 | -675 | -759 | -1,129 | -1,671 | -720 | -3,213 | -3,403 | |||||
| Acquisition and sale of shares and participations | 0 | -8 | 0 | 669 | 1 | 0 | -7 | -6,400 | 2,352 | 2,343 | 661 | -6,406 | |||||
| Other financial assets, lending | 16 | 4 | 0 | 0 | 0 | -66 | 66 | 0 | 0 | -5 | 20 | 0 | |||||
| Cash flow from investing activities | -830 | -858 | -669 | -175 | -838 | -742 | -700 | -7,529 | 681 | 1,619 | -2,532 | -9,809 | |||||
Financing activities | |||||||||||||||||
| Proceeds from loans | 1,500 | 3,020 | -332 | -1,192 | 66 | 1,392 | -168 | 16,336 | 1,756 | 2,132 | 2,996 | 17,627 | |||||
| Repayments of loans | -1,213 | -1,631 | -194 | -4 | -518 | -28 | -15 | -10,828 | -4,637 | -1,729 | -3,042 | -11,389 | |||||
| Dividends paid | 0 | -2,629 | 0 | 0 | 0 | -2,013 | 0 | 0 | 0 | -1,513 | -2,629 | -2,013 | |||||
| Cash flow from financing activities | 287 | -1,240 | -526 | -1,196 | -452 | -648 | -183 | 5,508 | -2,881 | -1,110 | -2,675 | 4,225 | |||||
| Net change in cash and cash equivalents | 481 | -424 | 764 | -296 | -382 | -204 | 968 | -806 | 290 | 2,621 | 525 | -424 | |||||
| Cash and cash equivalents at beginning of period | 257 | 752 | 318 | 1,068 | 802 | 441 | 248 | 1,212 | 404 | 914 | 257 | 802 | |||||
| Exchange rate differences in cash and cash equivalents | 14 | -10 | -14 | 30 | 21 | 11 | -4 | -2 | 220 | 179 | 20 | 26 | |||||
| Cash and cash equivalents at end of the period | 752 | 318 | 1,068 | 802 | 441 | 248 | 1,212 | 404 | 914 | 3,713 | 802 | 404 | |||||
| CASH FLOW RECONCILIATION | |||||||||||||||||
| SEK million | Comments | 2017 | 2017 | 2017 | 2017 | 2018 | 2018 | 2018 | 2018 | 2019 | 2019 | 2019 | 2019 | 2017 | 2018 | 2019 | |
| Q1 | Q2 | Q3 | Q4 | Q1 | Q2 | Q3 | Q4 | Q1 | Q2 | Q3 | Q4 | Full-year | Full-year | Full-year | |||
| Underlying EBITDA, continuing operations | 1,435 | 1,390 | 1,529 | 1,369 | 1,433 | 1,460 | 1,617 | 1,875 | 2,545 | 2,502 | 5,723 | 6,386 | |||||
| Items affecting comparability, continuing operations | -97 | -56 | -39 | -45 | -85 | -129 | -189 | -347 | -262 | -271 | -238 | -750 | |||||
| EBITDA, continuing operations | 1,337 | 1,334 | 1,490 | 1,323 | 1,348 | 1,332 | 1,428 | 1,527 | 2,284 | 2,231 | 5,485 | 5,635 | |||||
| EBITDA, discontinued operations | 255 | 195 | 407 | 573 | 238 | 361 | 587 | 617 | 547 | 2,134 | 1,430 | 1,802 | |||||
| Amortization of lease liabilities | 0 | 0 | 0 | 0 | 0 | -1 | 0 | 0 | -382 | -297 | 0 | 0 | |||||
| Capex paid | -846 | -854 | -669 | -844 | -839 | -675 | -759 | -1,129 | -1,671 | -720 | -3,213 | -3,403 | |||||
| Changes in working capital | -476 | 414 | 206 | -208 | -467 | -115 | -33 | -508 | 116 | -84 | -65 | -1,123 | |||||
| Net financial items paid | -8 | -145 | 1 | -134 | -88 | -117 | -56 | -342 | -130 | -178 | -286 | -603 | |||||
| Taxes paid | -107 | -132 | -120 | -125 | -145 | -280 | -97 | -121 | -293 | -411 | -484 | -643 | |||||
| Other cash items | 23 | 8 | -25 | -354 | 22 | 6 | 22 | 43 | -34 | -1,580 | -348 | 93 | |||||
| Equity free cash flow | 178 | 820 | 1,290 | 231 | 68 | 510 | 1,092 | 86 | 437 | 1,095 | 2,519 | 1,757 | |||||
| Equity free cash flow, continuing operations | 604 | 960 | 1,165 | 385 | 441 | 409 | 976 | 171 | 332 | 995 | 3,113 | 1,998 | |||||
| Equity free cash flow, continuing operations, rolling 12 months | 3,113 | 2,951 | 2,401 | 2,211 | 1,998 | 1,888 | 2,474 | 3,113 | 1,998 | ||||||||
| Tele2 Group | |||||||||||||||||
| SEK million | Comments | 2017 | 2017 | 2017 | 2017 | 2018 | 2018 | 2018 | 2018 | 2019 | 2019 | 2019 | 2019 | 2017 | 2018 | 2019 | |
| Continuing operations | Q1 | Q2 | Q3 | Q4 | Q1 | Q2 | Q3 | Q4 | Q1 | Q2 | Q3 | Q4 | Full-year | Full-year | Full-year | ||
| REVENUE | |||||||||||||||||
| Sweden Consumer | 2,077 | 2,117 | 2,114 | 2,324 | 2,138 | 2,198 | 2,191 | 3,472 | 3,799 | 3,859 | 8,632 | 9,999 | |||||
| Sweden Business | 1,656 | 1,597 | 1,511 | 1,662 | 1,636 | 1,575 | 1,491 | 1,716 | 1,672 | 1,598 | 6,426 | 6,417 | |||||
| Lithuania | 438 | 479 | 510 | 530 | 532 | 603 | 631 | 664 | 613 | 648 | 1,958 | 2,430 | |||||
| Latvia | 257 | 279 | 305 | 336 | 296 | 325 | 339 | 349 | 322 | 347 | 1,177 | 1,309 | |||||
| Estonia | 166 | 194 | 185 | 198 | 189 | 196 | 192 | 209 | 182 | 194 | 744 | 787 | |||||
| Germany | 160 | 154 | 150 | 148 | 139 | 138 | 135 | 127 | 122 | 116 | 611 | 539 | |||||
| IoT | 32 | 39 | 38 | 37 | 43 | 51 | 52 | 53 | 48 | 60 | 147 | 200 | |||||
| Other | 30 | 32 | 36 | 37 | 32 | 42 | 45 | 34 | 0 | 0 | 136 | 152 | |||||
| Internal sales, elimination | -10 | -9 | -13 | -18 | -11 | -15 | -15 | -17 | -16 | -27 | -50 | -58 | |||||
| Total | 4,807 | 4,883 | 4,835 | 5,255 | 4,994 | 5,113 | 5,062 | 6,606 | 6,743 | 6,794 | 19,780 | 21,775 | |||||
| END-USER SERVICE REVENUE | |||||||||||||||||
| Sweden Consumer | 1,547 | 1,563 | 1,586 | 1,564 | 1,536 | 1,543 | 1,564 | 2,578 | 3,164 | 3,191 | 6,260 | 7,220 | |||||
| Sweden Business | 1,073 | 1,038 | 988 | 1,004 | 995 | 982 | 963 | 1,039 | 1,034 | 1,008 | 4,103 | 3,979 | |||||
| Lithuania | 259 | 281 | 287 | 293 | 302 | 335 | 342 | 351 | 351 | 368 | 1,120 | 1,329 | |||||
| Latvia | 151 | 165 | 177 | 177 | 179 | 194 | 198 | 197 | 199 | 219 | 671 | 768 | |||||
| Estonia | 109 | 112 | 118 | 116 | 108 | 115 | 114 | 114 | 110 | 116 | 455 | 451 | |||||
| Germany | 158 | 153 | 149 | 147 | 138 | 137 | 134 | 126 | 121 | 116 | 608 | 536 | |||||
| IoT | 32 | 39 | 38 | 37 | 43 | 51 | 52 | 53 | 48 | 60 | 147 | 200 | |||||
| Other | 0 | 0 | 0 | 0 | 0 | 0 | 0 | 0 | 0 | 0 | 0 | 0 | |||||
| Total | 3,330 | 3,352 | 3,343 | 3,338 | 3,302 | 3,356 | 3,367 | 4,457 | 5,027 | 5,079 | 13,363 | 14,482 | |||||
| END-USER SERVICE REVENUE, MOBILE | |||||||||||||||||
| Sweden Consumer | 1,431 | 1,465 | 1,491 | 1,472 | 1,451 | 1,463 | 1,489 | 1,478 | 1,457 | 1,481 | 5,859 | 5,881 | |||||
| Sweden Business | 516 | 472 | 447 | 459 | 459 | 463 | 461 | 481 | 475 | 456 | 1,894 | 1,864 | |||||
| Lithuania | 259 | 281 | 287 | 293 | 302 | 335 | 342 | 351 | 351 | 368 | 1,120 | 1,329 | |||||
| Latvia | 151 | 165 | 177 | 177 | 179 | 194 | 198 | 197 | 199 | 219 | 671 | 768 | |||||
| Estonia | 108 | 111 | 117 | 115 | 104 | 110 | 109 | 108 | 105 | 111 | 452 | 431 | |||||
| Germany | 87 | 85 | 82 | 83 | 78 | 80 | 77 | 74 | 73 | 72 | 337 | 310 | |||||
| IoT | 32 | 39 | 38 | 37 | 43 | 51 | 52 | 53 | 48 | 60 | 147 | 200 | |||||
| Other | 0 | 0 | 0 | 0 | 0 | 0 | 0 | 0 | 0 | 0 | 0 | 0 | |||||
| Total | 2,584 | 2,618 | 2,639 | 2,637 | 2,617 | 2,695 | 2,728 | 2,742 | 2,707 | 2,766 | 10,479 | 10,783 | |||||
| UNDERLYING EBITDA excluding IFRS 16 | |||||||||||||||||
| Sweden Consumer | 790 | 742 | 743 | 692 | 725 | 737 | 811 | 1,169 | 1,470 | 1,447 | 2,966 | 3,442 | |||||
| Sweden Business | 351 | 301 | 375 | 353 | 357 | 305 | 388 | 341 | 378 | 335 | 1,380 | 1,391 | |||||
| Lithuania | 147 | 171 | 175 | 158 | 178 | 204 | 232 | 204 | 232 | 244 | 651 | 817 | |||||
| Latvia | 87 | 96 | 119 | 115 | 103 | 121 | 125 | 125 | 116 | 132 | 417 | 474 | |||||
| Estonia | 44 | 45 | 47 | 50 | 36 | 40 | 46 | 45 | 38 | 37 | 186 | 167 | |||||
| Germany | 61 | 62 | 66 | 75 | 60 | 67 | 64 | 58 | 56 | 53 | 264 | 248 | |||||
| IoT | -29 | -18 | -21 | -34 | -18 | -31 | -22 | -33 | -6 | 10 | -101 | -104 | |||||
| Other | -17 | -8 | 26 | -41 | -6 | 17 | -27 | -34 | -28 | -32 | -40 | -50 | |||||
| Total | 1,435 | 1,390 | 1,529 | 1,369 | 1,433 | 1,460 | 1,617 | 1,875 | 2,255 | 2,227 | 5,723 | 6,386 | |||||
| UNDERLYING EBITDAaL | |||||||||||||||||
| Sweden | 1,849 | 1,744 | |||||||||||||||
| Lithuania | 230 | 244 | |||||||||||||||
| Latvia | 116 | 132 | |||||||||||||||
| Estonia | 35 | 35 | |||||||||||||||
| Germany | 56 | 53 | |||||||||||||||
| IoT | -6 | 10 | |||||||||||||||
| Other | -28 | -32 | |||||||||||||||
| Total | 2,252 | 2,187 | |||||||||||||||
| <-- IAS 17 | IFRS 16 --> | ||||||||||||||||
| UNDERLYING EBITDA | |||||||||||||||||
| Sweden Consumer | 790 | 742 | 743 | 692 | 725 | 737 | 811 | 1,169 | 1,641 | 1,603 | 2,966 | 3,442 | |||||
| Sweden Business | 351 | 301 | 375 | 353 | 357 | 305 | 388 | 341 | 465 | 419 | 1,380 | 1,391 | |||||
| Lithuania | 147 | 171 | 175 | 158 | 178 | 204 | 232 | 204 | 245 | 259 | 651 | 817 | |||||
| Latvia | 87 | 96 | 119 | 115 | 103 | 121 | 125 | 125 | 124 | 141 | 417 | 474 | |||||
| Estonia | 44 | 45 | 47 | 50 | 36 | 40 | 46 | 45 | 47 | 47 | 186 | 167 | |||||
| Germany | 61 | 62 | 66 | 75 | 60 | 67 | 64 | 58 | 56 | 54 | 264 | 248 | |||||
| IoT | -29 | -18 | -21 | -34 | -18 | -31 | -22 | -33 | -6 | 10 | -101 | -104 | |||||
| Other | -17 | -8 | 26 | -41 | -6 | 17 | -27 | -34 | -27 | -31 | -40 | -50 | |||||
| Total | 1,435 | 1,390 | 1,529 | 1,369 | 1,433 | 1,460 | 1,617 | 1,875 | 2,545 | 2,502 | 5,723 | 6,386 | |||||
| <-- IAS 17 | IFRS 16 --> | ||||||||||||||||
| Reconciling items to reported operating profit | |||||||||||||||||
| Underlying EBITDA | 1,435 | 1,390 | 1,529 | 1,369 | 1,433 | 1,460 | 1,617 | 1,875 | 2,545 | 2,502 | 5,723 | 6,386 | |||||
| Items affecting comparability | -97 | -56 | -39 | -45 | -85 | -129 | -189 | -347 | -262 | -271 | -238 | -750 | |||||
| EBITDA | 1,337 | 1,334 | 1,490 | 1,323 | 1,348 | 1,332 | 1,428 | 1,527 | 2,284 | 2,231 | 5,485 | 5,635 | |||||
| Depreciation/amortization | -490 | -490 | -496 | -538 | -488 | -496 | -501 | -867 | -1,246 | -1,276 | -2,013 | -2,352 | |||||
| - of which amortization of surplus from acquisitions | -36 | -39 | -38 | -38 | -36 | -39 | -40 | -199 | -298 | -298 | -151 | -314 | |||||
| - of which depreciation of right-of-use assets | 0 | 0 | 0 | 0 | 0 | 0 | 0 | 0 | -274 | -296 | 0 | 0 | |||||
| - of which depreciation/amortization other | -453 | -451 | -458 | -500 | -452 | -457 | -461 | -668 | -674 | -682 | -1,861 | -2,038 | |||||
| Impairment | 0 | 0 | 0 | 0 | 0 | 0 | 0 | 0 | 0 | -452 | 0 | 0 | |||||
| Result from shares in joint ventures and associated companies | 0 | 0 | 0 | -1 | 14 | 0 | 0 | -5 | 10 | -73 | 0 | 9 | |||||
| Operating profit | 848 | 845 | 995 | 785 | 874 | 835 | 926 | 656 | 1,047 | 431 | 3,472 | 3,291 | |||||
| CAPEX | |||||||||||||||||
| Sweden | 118 | 196 | 164 | 265 | 192 | 213 | 237 | 1,297 | 784 | 857 | 743 | 1,938 | |||||
| Lithuania | 29 | 23 | 25 | 36 | 22 | 38 | 43 | 41 | 29 | 38 | 114 | 144 | |||||
| Latvia | 17 | 21 | 19 | 27 | 24 | 21 | 24 | 44 | 101 | 60 | 83 | 113 | |||||
| Estonia | 14 | 21 | 22 | 27 | 18 | 23 | 26 | 21 | 29 | 28 | 83 | 87 | |||||
| Germany | 0 | 0 | -1 | 1 | 0 | 0 | 0 | 0 | 0 | 0 | 0 | 0 | |||||
| IoT | 3 | 7 | 8 | 12 | 7 | 8 | 4 | 10 | 6 | 4 | 30 | 29 | |||||
| Other | 64 | 54 | 61 | 111 | 101 | 136 | 49 | 111 | 0 | 0 | 291 | 397 | |||||
| Total | 245 | 321 | 299 | 479 | 361 | 438 | 383 | 1,525 | 947 | 987 | 1,343 | 2,707 | |||||
| of which | |||||||||||||||||
| Network | 106 | 158 | 142 | 285 | 163 | 185 | 180 | 391 | 258 | 283 | 691 | 919 | |||||
| IT | 96 | 108 | 106 | 144 | 150 | 192 | 149 | 295 | 194 | 184 | 454 | 787 | |||||
| Customer equipment, CPE | 32 | 35 | 27 | 37 | 36 | 45 | 30 | 64 | 126 | 18 | 131 | 175 | |||||
| Other | 9 | 20 | 24 | 13 | 12 | 16 | 23 | 54 | 50 | 65 | 66 | 105 | |||||
| Capex excluding spectrum and leases | 244 | 321 | 299 | 479 | 361 | 438 | 382 | 804 | 626 | 549 | 1,342 | 1,985 | |||||
| Spectrum | 1 | 0 | 0 | 0 | 0 | 0 | 1 | 721 | 67 | 1 | 1 | 723 | |||||
| Right-of-use assets (leases) | 0 | 0 | 0 | 0 | 0 | 0 | 0 | 0 | 254 | 437 | 0 | 0 | |||||
| Total | 245 | 321 | 299 | 479 | 361 | 438 | 383 | 1,525 | 947 | 987 | 1,343 | 2,707 | |||||
| CAPEX SPECTRUM | |||||||||||||||||
| Sweden | 0 | 0 | 0 | 0 | 0 | 0 | 0 | 721 | 0 | 0 | 0 | 721 | |||||
| Lithuania | 0 | 0 | 0 | 0 | 0 | 0 | 0 | 0 | 0 | 0 | 0 | 0 | |||||
| Latvia | 0 | 0 | 0 | 0 | 0 | 0 | 1 | 0 | 67 | 1 | 0 | 1 | |||||
| Estonia | 1 | 0 | 0 | 0 | 0 | 0 | 0 | 0 | 0 | 0 | 1 | 0 | |||||
| Germany | 0 | 0 | 0 | 0 | 0 | 0 | 0 | 0 | 0 | 0 | 0 | 0 | |||||
| IoT | 0 | 0 | 0 | 0 | 0 | 0 | 0 | 0 | 0 | 0 | 0 | 0 | |||||
| Other | 0 | 0 | 0 | 0 | 0 | 0 | 0 | 0 | 0 | 0 | 0 | 0 | |||||
| Total | 1 | 0 | 0 | 0 | 0 | 0 | 1 | 721 | 67 | 1 | 1 | 723 | |||||
| CAPEX RIGHT-OF-USE ASSETS (LEASES) | |||||||||||||||||
| Sweden | 0 | 0 | 0 | 0 | 0 | 0 | 0 | 0 | 239 | 398 | 0 | 0 | |||||
| Lithuania | 0 | 0 | 0 | 0 | 0 | 0 | 0 | 0 | 3 | 7 | 0 | 0 | |||||
| Latvia | 0 | 0 | 0 | 0 | 0 | 0 | 0 | 0 | 3 | 22 | 0 | 0 | |||||
| Estonia | 0 | 0 | 0 | 0 | 0 | 0 | 0 | 0 | 9 | 10 | 0 | 0 | |||||
| Germany | 0 | 0 | 0 | 0 | 0 | 0 | 0 | 0 | 0 | 0 | 0 | 0 | |||||
| IoT | 0 | 0 | 0 | 0 | 0 | 0 | 0 | 0 | 0 | 0 | 0 | 0 | |||||
| Other | 0 | 0 | 0 | 0 | 0 | 0 | 0 | 0 | 0 | 0 | 0 | 0 | |||||
| Total | 0 | 0 | 0 | 0 | 0 | 0 | 0 | 0 | 254 | 437 | 0 | 0 | |||||
| Tele2 Group, Pro forma* | |||||||||||||||||
| * including pro forma for Com Hem (pre acquisition) | |||||||||||||||||
| SEK million | Comments | 2017 | 2017 | 2017 | 2017 | 2018 | 2018 | 2018 | 2018 | 2019 | 2019 | 2019 | 2019 | 2017 | 2018 | 2019 | |
| Continuing operations | Q1 | Q2 | Q3 | Q4 | Q1 | Q2 | Q3 | Q4 | Q1 | Q2 | Q3 | Q4 | Full-year | Full-year | Full-year | ||
| REVENUE | |||||||||||||||||
| Sweden Consumer | 3,760 | 3,840 | 3,828 | 4,059 | 3,856 | 3,944 | 3,902 | 4,129 | 3,799 | 3,859 | 15,488 | 15,831 | |||||
| Sweden Business | 1,729 | 1,668 | 1,576 | 1,732 | 1,702 | 1,643 | 1,557 | 1,740 | 1,672 | 1,598 | 6,705 | 6,642 | |||||
| Lithuania | 438 | 479 | 510 | 530 | 532 | 603 | 631 | 664 | 613 | 648 | 1,958 | 2,430 | |||||
| Latvia | 257 | 279 | 305 | 336 | 296 | 325 | 339 | 349 | 322 | 347 | 1,177 | 1,309 | |||||
| Estonia | 166 | 194 | 185 | 198 | 189 | 196 | 192 | 209 | 182 | 194 | 744 | 787 | |||||
| Germany | 160 | 154 | 150 | 148 | 139 | 138 | 135 | 127 | 122 | 116 | 611 | 539 | |||||
| IoT | 32 | 39 | 38 | 37 | 43 | 51 | 52 | 53 | 48 | 60 | 147 | 200 | |||||
| Other | 30 | 32 | 36 | 37 | 32 | 42 | 45 | 34 | 0 | 0 | 136 | 152 | |||||
| Internal sales, elimination | -10 | -9 | -13 | -18 | -11 | -15 | -15 | -17 | -16 | -27 | -50 | -58 | |||||
| Total | 6,564 | 6,678 | 6,616 | 7,060 | 6,778 | 6,928 | 6,838 | 7,287 | 6,743 | 6,794 | 26,916 | 27,832 | |||||
| END-USER SERVICE REVENUE | |||||||||||||||||
| Sweden Consumer | 3,187 | 3,223 | 3,243 | 3,225 | 3,191 | 3,221 | 3,223 | 3,211 | 3,164 | 3,191 | 12,878 | 12,846 | |||||
| Sweden Business | 1,143 | 1,106 | 1,051 | 1,071 | 1,058 | 1,047 | 1,026 | 1,062 | 1,034 | 1,008 | 4,371 | 4,193 | |||||
| Lithuania | 259 | 281 | 287 | 293 | 302 | 335 | 342 | 351 | 351 | 368 | 1,120 | 1,329 | |||||
| Latvia | 151 | 165 | 177 | 177 | 179 | 194 | 198 | 197 | 199 | 219 | 671 | 768 | |||||
| Estonia | 109 | 112 | 118 | 116 | 108 | 115 | 114 | 114 | 110 | 116 | 455 | 451 | |||||
| Germany | 158 | 153 | 149 | 147 | 138 | 137 | 134 | 126 | 121 | 116 | 608 | 536 | |||||
| IoT | 32 | 39 | 38 | 37 | 43 | 51 | 52 | 53 | 48 | 60 | 147 | 200 | |||||
| Other | 0 | 0 | 0 | 0 | 0 | 0 | 0 | 0 | 0 | 0 | 0 | 0 | |||||
| Total | 5,039 | 5,081 | 5,063 | 5,066 | 5,020 | 5,101 | 5,090 | 5,113 | 5,027 | 5,079 | 20,249 | 20,323 | |||||
| END-USER SERVICE REVENUE, MOBILE | |||||||||||||||||
| Sweden Consumer | 1,431 | 1,465 | 1,491 | 1,472 | 1,451 | 1,463 | 1,489 | 1,478 | 1,457 | 1,481 | 5,859 | 5,881 | |||||
| Sweden Business | 526 | 481 | 457 | 468 | 472 | 475 | 473 | 486 | 475 | 456 | 1,932 | 1,905 | |||||
| Lithuania | 259 | 281 | 287 | 293 | 302 | 335 | 342 | 351 | 351 | 368 | 1,120 | 1,329 | |||||
| Latvia | 151 | 165 | 177 | 177 | 179 | 194 | 198 | 197 | 199 | 219 | 671 | 768 | |||||
| Estonia | 108 | 111 | 117 | 115 | 104 | 110 | 109 | 108 | 105 | 111 | 452 | 431 | |||||
| Germany | 87 | 85 | 82 | 83 | 78 | 80 | 77 | 74 | 73 | 72 | 337 | 310 | |||||
| IoT | 32 | 39 | 38 | 37 | 43 | 51 | 52 | 53 | 48 | 60 | 147 | 200 | |||||
| Other | 0 | 0 | 0 | 0 | 0 | 0 | 0 | 0 | 0 | 0 | 0 | 0 | |||||
| Total | 2,594 | 2,628 | 2,649 | 2,646 | 2,630 | 2,707 | 2,740 | 2,746 | 2,707 | 2,766 | 10,516 | 10,824 | |||||
| UNDERLYING EBITDA excluding IFRS 16 | |||||||||||||||||
| Sweden Consumer | 1,448 | 1,410 | 1,449 | 1,330 | 1,389 | 1,408 | 1,538 | 1,428 | 1,470 | 1,447 | 5,637 | 5,764 | |||||
| Sweden Business | 352 | 305 | 394 | 383 | 373 | 323 | 408 | 346 | 378 | 335 | 1,434 | 1,451 | |||||
| Lithuania | 147 | 171 | 175 | 158 | 178 | 204 | 232 | 204 | 232 | 244 | 651 | 817 | |||||
| Latvia | 87 | 96 | 119 | 115 | 103 | 121 | 125 | 125 | 116 | 132 | 417 | 474 | |||||
| Estonia | 44 | 45 | 47 | 50 | 36 | 40 | 46 | 45 | 38 | 37 | 186 | 167 | |||||
| Germany | 61 | 62 | 66 | 75 | 60 | 67 | 64 | 58 | 56 | 53 | 264 | 248 | |||||
| IoT | -29 | -18 | -21 | -34 | -18 | -31 | -22 | -33 | -6 | 10 | -101 | -104 | |||||
| Other | -17 | -8 | 26 | -41 | -6 | 17 | -27 | -34 | -28 | -32 | -40 | -50 | |||||
| Total | 2,095 | 2,062 | 2,255 | 2,036 | 2,114 | 2,150 | 2,364 | 2,139 | 2,255 | 2,227 | 8,448 | 8,768 | |||||
| UNDERLYING EBITDAaL | |||||||||||||||||
| Sweden | 1,849 | 1,744 | |||||||||||||||
| Lithuania | 230 | 244 | |||||||||||||||
| Latvia | 116 | 132 | |||||||||||||||
| Estonia | 35 | 35 | |||||||||||||||
| Germany | 56 | 53 | |||||||||||||||
| IoT | -6 | 10 | |||||||||||||||
| Other | -28 | -32 | |||||||||||||||
| Total | 2,252 | 2,187 | |||||||||||||||
| <-- IAS 17 | IFRS 16 --> | ||||||||||||||||
| UNDERLYING EBITDA | |||||||||||||||||
| Sweden Consumer | 1,448 | 1,410 | 1,449 | 1,330 | 1,389 | 1,408 | 1,538 | 1,428 | 1,641 | 1,603 | 5,637 | 5,764 | |||||
| Sweden Business | 352 | 305 | 394 | 383 | 373 | 323 | 408 | 346 | 465 | 419 | 1,434 | 1,451 | |||||
| Lithuania | 147 | 171 | 175 | 158 | 178 | 204 | 232 | 204 | 245 | 259 | 651 | 817 | |||||
| Latvia | 87 | 96 | 119 | 115 | 103 | 121 | 125 | 125 | 124 | 141 | 417 | 474 | |||||
| Estonia | 44 | 45 | 47 | 50 | 36 | 40 | 46 | 45 | 47 | 47 | 186 | 167 | |||||
| Germany | 61 | 62 | 66 | 75 | 60 | 67 | 64 | 58 | 56 | 54 | 264 | 248 | |||||
| IoT | -29 | -18 | -21 | -34 | -18 | -31 | -22 | -33 | -6 | 10 | -101 | -104 | |||||
| Other | -17 | -8 | 26 | -41 | -6 | 17 | -27 | -34 | -27 | -31 | -40 | -50 | |||||
| Total | 2,095 | 2,062 | 2,255 | 2,036 | 2,114 | 2,150 | 2,364 | 2,139 | 2,545 | 2,502 | 8,448 | 8,768 | |||||
| CAPEX | |||||||||||||||||
| Sweden | 331 | 446 | 362 | 522 | 429 | 413 | 372 | 1,373 | 784 | 857 | 1,661 | 2,588 | |||||
| Lithuania | 29 | 23 | 25 | 36 | 22 | 38 | 43 | 41 | 29 | 38 | 114 | 144 | |||||
| Latvia | 17 | 21 | 19 | 27 | 24 | 21 | 24 | 44 | 101 | 60 | 83 | 113 | |||||
| Estonia | 14 | 21 | 22 | 27 | 18 | 23 | 26 | 21 | 29 | 28 | 83 | 87 | |||||
| Germany | 0 | 0 | -1 | 1 | 0 | 0 | 0 | 0 | 0 | 0 | 0 | 0 | |||||
| IoT | 3 | 7 | 8 | 12 | 7 | 8 | 4 | 10 | 6 | 4 | 30 | 29 | |||||
| Other | 64 | 54 | 61 | 111 | 101 | 136 | 49 | 111 | 0 | 0 | 291 | 397 | |||||
| Total | 457 | 572 | 497 | 736 | 598 | 637 | 519 | 1,602 | 947 | 987 | 2,262 | 3,356 | |||||
| of which | |||||||||||||||||
| Network | 197 | 272 | 229 | 430 | 259 | 270 | 243 | 423 | 258 | 283 | 1,127 | 1,195 | |||||
| IT | 144 | 163 | 148 | 209 | 200 | 237 | 182 | 312 | 194 | 184 | 664 | 932 | |||||
| Customer equipment, CPE | 96 | 104 | 88 | 74 | 121 | 106 | 69 | 84 | 126 | 18 | 362 | 381 | |||||
| Other | 20 | 33 | 32 | 24 | 19 | 25 | 23 | 61 | 50 | 65 | 107 | 128 | |||||
| Capex excluding spectrum and leases | 456 | 572 | 497 | 736 | 598 | 637 | 517 | 881 | 626 | 549 | 2,261 | 2,634 | |||||
| Spectrum | 1 | 0 | 0 | 0 | 0 | 0 | 1 | 721 | 67 | 1 | 1 | 723 | |||||
| Right-of-use assets (leases) | 0 | 0 | 0 | 0 | 0 | 0 | 0 | 0 | 254 | 437 | 0 | 0 | |||||
| Total | 457 | 572 | 497 | 736 | 598 | 637 | 519 | 1,602 | 947 | 987 | 2,262 | 3,356 | |||||
| CAPEX SPECTRUM | |||||||||||||||||
| Sweden | 0 | 0 | 0 | 0 | 0 | 0 | 0 | 721 | 0 | 0 | 0 | 721 | |||||
| Lithuania | 0 | 0 | 0 | 0 | 0 | 0 | 0 | 0 | 0 | 0 | 0 | 0 | |||||
| Latvia | 0 | 0 | 0 | 0 | 0 | 0 | 1 | 0 | 67 | 1 | 0 | 1 | |||||
| Estonia | 1 | 0 | 0 | 0 | 0 | 0 | 0 | 0 | 0 | 0 | 1 | 0 | |||||
| Germany | 0 | 0 | 0 | 0 | 0 | 0 | 0 | 0 | 0 | 0 | 0 | 0 | |||||
| IoT | 0 | 0 | 0 | 0 | 0 | 0 | 0 | 0 | 0 | 0 | 0 | 0 | |||||
| Other | 0 | 0 | 0 | 0 | 0 | 0 | 0 | 0 | 0 | 0 | 0 | 0 | |||||
| Total | 1 | 0 | 0 | 0 | 0 | 0 | 1 | 721 | 67 | 1 | 1 | 723 | |||||
| CAPEX RIGHT-OF-USE ASSETS (LEASES) | |||||||||||||||||
| Sweden | 0 | 0 | 0 | 0 | 0 | 0 | 0 | 0 | 239 | 398 | 0 | 0 | |||||
| Lithuania | 0 | 0 | 0 | 0 | 0 | 0 | 0 | 0 | 3 | 7 | 0 | 0 | |||||
| Latvia | 0 | 0 | 0 | 0 | 0 | 0 | 0 | 0 | 3 | 22 | 0 | 0 | |||||
| Estonia | 0 | 0 | 0 | 0 | 0 | 0 | 0 | 0 | 9 | 10 | 0 | 0 | |||||
| Germany | 0 | 0 | 0 | 0 | 0 | 0 | 0 | 0 | 0 | 0 | 0 | 0 | |||||
| IoT | 0 | 0 | 0 | 0 | 0 | 0 | 0 | 0 | 0 | 0 | 0 | 0 | |||||
| Other | 0 | 0 | 0 | 0 | 0 | 0 | 0 | 0 | 0 | 0 | 0 | 0 | |||||
| Total | 0 | 0 | 0 | 0 | 0 | 0 | 0 | 0 | 254 | 437 | 0 | 0 | |||||
| Sweden | |||||||||||||||||
| SEK million | Comments | 2017 | 2017 | 2017 | 2017 | 2018 | 2018 | 2018 | 2018 | 2019 | 2019 | 2019 | 2019 | 2017 | 2018 | 2019 | |
| Q1 | Q2 | Q3 | Q4 | Q1 | Q2 | Q3 | Q4 | Q1 | Q2 | Q3 | Q4 | Full-year | Full-year | Full-year | |||
| REVENUE | |||||||||||||||||
| Consumer | |||||||||||||||||
| Mobile | 1,431 | 1,465 | 1,491 | 1,472 | 1,451 | 1,463 | 1,489 | 1,478 | 1,457 | 1,481 | 5,859 | 5,881 | |||||
| Postpaid | 1,103 | 1,119 | 1,154 | 1,148 | 1,152 | 1,168 | 1,189 | 1,189 | 1,178 | 1,190 | 4,523 | 4,698 | |||||
| Prepaid | 328 | 346 | 337 | 325 | 299 | 295 | 300 | 289 | 278 | 290 | 1,335 | 1,183 | |||||
| Fixed | 117 | 98 | 95 | 91 | 84 | 80 | 75 | 991 | 1,530 | 1,533 | 401 | 1,230 | |||||
| Fixed broadband | 0 | 0 | 0 | 0 | 0 | 0 | 0 | 381 | 618 | 627 | 0 | 381 | |||||
| Digital TV | 0 | 0 | 0 | 0 | 0 | 0 | 0 | 512 | 807 | 808 | 0 | 512 | |||||
| Cable & Fiber | 0 | 0 | 0 | 0 | 0 | 0 | 0 | 295 | 466 | 464 | 0 | 295 | |||||
| DTT | 0 | 0 | 0 | 0 | 0 | 0 | 0 | 217 | 341 | 344 | 0 | 217 | |||||
| Fixed telephony & DSL | 117 | 98 | 95 | 91 | 84 | 80 | 75 | 99 | 106 | 98 | 401 | 337 | |||||
| Landlord & Other | 0 | 0 | 0 | 0 | 0 | 0 | 0 | 108 | 177 | 178 | 0 | 108 | |||||
| End-user service revenue | 1,547 | 1,563 | 1,586 | 1,564 | 1,536 | 1,543 | 1,564 | 2,578 | 3,164 | 3,191 | 6,260 | 7,220 | |||||
| Operator revenue | 157 | 163 | 152 | 152 | 149 | 163 | 150 | 182 | 190 | 220 | 624 | 643 | |||||
| Equipment revenue | 373 | 390 | 375 | 609 | 453 | 492 | 478 | 713 | 445 | 448 | 1,748 | 2,136 | |||||
| Internal sales | 0 | 0 | 0 | 0 | 0 | 0 | 0 | 0 | 0 | 0 | 0 | 0 | |||||
| Consumer | 2,077 | 2,117 | 2,114 | 2,324 | 2,138 | 2,198 | 2,191 | 3,472 | 3,799 | 3,859 | 8,632 | 9,999 | |||||
| Business | |||||||||||||||||
| Mobile | 516 | 472 | 447 | 459 | 459 | 463 | 461 | 481 | 475 | 456 | 1,894 | 1,864 | |||||
| Fixed | 304 | 308 | 292 | 283 | 277 | 259 | 260 | 278 | 295 | 276 | 1,188 | 1,075 | |||||
| Solutions | 253 | 258 | 249 | 262 | 258 | 260 | 242 | 279 | 264 | 276 | 1,021 | 1,040 | |||||
| End-user service revenue | 1,073 | 1,038 | 988 | 1,004 | 995 | 982 | 963 | 1,039 | 1,033 | 1,008 | 4,103 | 3,979 | |||||
| Operator revenue, excluding Wholesale | 30 | 30 | 34 | 30 | 31 | 35 | 26 | 36 | 24 | 35 | 123 | 127 | |||||
| Equipment revenue | 393 | 363 | 311 | 475 | 464 | 418 | 348 | 503 | 446 | 375 | 1,542 | 1,734 | |||||
| Wholesale revenue | 160 | 166 | 177 | 152 | 145 | 139 | 152 | 137 | 168 | 170 | 655 | 574 | |||||
| Internal sales | 0 | 0 | 1 | 1 | 1 | 1 | 1 | 1 | 1 | 10 | 3 | 4 | |||||
| Business | 1,656 | 1,597 | 1,511 | 1,662 | 1,636 | 1,575 | 1,491 | 1,716 | 1,672 | 1,598 | 6,426 | 6,417 | |||||
| Total | 3,733 | 3,714 | 3,624 | 3,986 | 3,774 | 3,772 | 3,682 | 5,188 | 5,471 | 5,457 | 15,058 | 16,416 | |||||
| UNDERLYING EBITDA excluding IFRS 16 | |||||||||||||||||
| Consumer | 790 | 742 | 743 | 692 | 725 | 737 | 811 | 1,169 | 1,470 | 1,447 | 2,966 | 3,442 | |||||
| Business | 351 | 301 | 375 | 353 | 357 | 305 | 388 | 341 | 378 | 335 | 1,380 | 1,391 | |||||
| of which Wholesale | 26 | 39 | 63 | 75 | 68 | 37 | 53 | 48 | 72 | 77 | 203 | 206 | |||||
| Total | 1,141 | 1,043 | 1,117 | 1,045 | 1,082 | 1,042 | 1,200 | 1,510 | 1,848 | 1,782 | 4,347 | 4,832 | |||||
| <-- IAS 17 | IFRS 16 --> | ||||||||||||||||
| UNDERLYING EBITDA | |||||||||||||||||
| Consumer | 790 | 742 | 743 | 692 | 725 | 737 | 811 | 1,169 | 1,641 | 1,603 | 2,966 | 3,442 | |||||
| Business | 351 | 301 | 375 | 353 | 357 | 305 | 388 | 341 | 465 | 419 | 1,380 | 1,391 | |||||
| of which Wholesale | 26 | 39 | 63 | 75 | 68 | 37 | 53 | 48 | 93 | 97 | 203 | 206 | |||||
| Total | 1,141 | 1,043 | 1,117 | 1,045 | 1,082 | 1,042 | 1,200 | 1,510 | 2,106 | 2,022 | 4,347 | 4,832 | |||||
| Lease depreciation and lease interest | -257 | -278 | |||||||||||||||
| Underlying EBITDAaL | 1,849 | 1,744 | |||||||||||||||
| CAPEX | |||||||||||||||||
| Network | 37 | 82 | 72 | 176 | 86 | 87 | 93 | 259 | 202 | 237 | 366 | 525 | |||||
| IT | 49 | 66 | 50 | 49 | 61 | 74 | 100 | 210 | 177 | 160 | 213 | 445 | |||||
| Customer equipment, CPE | 32 | 35 | 27 | 34 | 36 | 45 | 30 | 63 | 126 | 16 | 129 | 174 | |||||
| Other | 1 | 13 | 14 | 6 | 8 | 7 | 13 | 43 | 40 | 44 | 34 | 72 | |||||
| Capex excluding spectrum and leases | 118 | 196 | 164 | 265 | 192 | 213 | 237 | 575 | 545 | 458 | 743 | 1,217 | |||||
| Spectrum | 0 | 0 | 0 | 0 | 0 | 0 | 0 | 721 | 0 | 0 | 0 | 721 | |||||
| Right-of-use assets (leases) | 0 | 0 | 0 | 0 | 0 | 0 | 0 | 0 | 239 | 398 | 0 | 0 | |||||
| Total | 118 | 196 | 164 | 265 | 192 | 213 | 237 | 1,297 | 784 | 857 | 743 | 1,938 | |||||
| 2017 | 2017 | 2017 | 2017 | 2018 | 2018 | 2018 | 2018 | 2019 | 2019 | 2019 | 2019 | ||||||
| in thousand | Comments | Mar 31 | Jun 30 | Sep 30 | Dec 31 | Mar 31 | Jun 30 | Sep 30 | Dec 31 | Mar 31 | Jun 30 | Sep 30 | Dec 31 | ||||
| OPERATING DATA | |||||||||||||||||
| Consumer - Addressable fixed footprint | |||||||||||||||||
| Households | 0 | 0 | 0 | 0 | 0 | 0 | 0 | 3,114 | 3,178 | 3,249 | |||||||
| Consumer RGUs | |||||||||||||||||
| Mobile | 3,044 | 3,062 | 3,072 | 3,026 | 2,976 | 2,968 | 2,979 | 2,947 | 2,927 | 2,958 | |||||||
| Postpaid | 1,760 | 1,763 | 1,788 | 1,803 | 1,796 | 1,794 | 1,804 | 1,817 | 1,822 | 1,841 | |||||||
| Prepaid | 1,284 | 1,299 | 1,284 | 1,223 | 1,180 | 1,173 | 1,175 | 1,131 | 1,105 | 1,117 | |||||||
| Fixed | 152 | 143 | 135 | 127 | 113 | 108 | 100 | 2,209 | 2,201 | 2,191 | |||||||
| Fixed broadband | 0 | 0 | 0 | 0 | 0 | 0 | 0 | 827 | 839 | 852 | |||||||
| Digital TV | 0 | 0 | 0 | 0 | 0 | 0 | 0 | 1,057 | 1,048 | 1,041 | |||||||
| Cable & Fiber | 0 | 0 | 0 | 0 | 0 | 0 | 0 | 658 | 661 | 663 | |||||||
| DTT | 0 | 0 | 0 | 0 | 0 | 0 | 0 | 399 | 387 | 378 | |||||||
| Fixed telephony & DSL | 152 | 143 | 135 | 127 | 113 | 108 | 100 | 325 | 313 | 298 | |||||||
| Consumer | 3,196 | 3,206 | 3,207 | 3,153 | 3,089 | 3,075 | 3,079 | 5,157 | 5,128 | 5,149 | |||||||
| Business RGUs | |||||||||||||||||
| Mobile | 807 | 799 | 801 | 808 | 844 | 856 | 869 | 889 | 896 | 913 | |||||||
| Sweden, Pro forma* | |||||||||||||||||
| * including pro forma for Com Hem (pre acquisition) | |||||||||||||||||
| SEK million | Comments | 2017 | 2017 | 2017 | 2017 | 2018 | 2018 | 2018 | 2018 | 2019 | 2019 | 2019 | 2019 | 2017 | 2018 | 2019 | |
| Q1 | Q2 | Q3 | Q4 | Q1 | Q2 | Q3 | Q4 | Q1 | Q2 | Q3 | Q4 | Full-year | Full-year | Full-year | |||
| REVENUE | |||||||||||||||||
| Consumer | |||||||||||||||||
| Mobile | 1,431 | 1,465 | 1,491 | 1,472 | 1,451 | 1,463 | 1,489 | 1,478 | 1,457 | 1,481 | 5,859 | 5,881 | |||||
| Postpaid | 1,103 | 1,119 | 1,154 | 1,148 | 1,152 | 1,168 | 1,189 | 1,189 | 1,178 | 1,190 | 4,523 | 4,698 | |||||
| Prepaid | 328 | 346 | 337 | 325 | 299 | 295 | 300 | 289 | 278 | 290 | 1,335 | 1,183 | |||||
| Fixed | 1,560 | 1,566 | 1,562 | 1,560 | 1,555 | 1,575 | 1,557 | 1,556 | 1,530 | 1,533 | 6,248 | 6,243 | |||||
| Fixed broadband | 500 | 530 | 543 | 556 | 571 | 595 | 601 | 613 | 618 | 627 | 2,129 | 2,380 | |||||
| Digital TV | 890 | 887 | 876 | 866 | 856 | 856 | 840 | 827 | 807 | 808 | 3,520 | 3,379 | |||||
| Cable & Fiber | 466 | 475 | 472 | 472 | 472 | 479 | 475 | 474 | 466 | 464 | 1,886 | 1,901 | |||||
| DTT | 424 | 413 | 404 | 393 | 384 | 377 | 365 | 353 | 341 | 344 | 1,634 | 1,479 | |||||
| Fixed telephony & DSL | 170 | 148 | 142 | 139 | 128 | 124 | 117 | 116 | 106 | 98 | 600 | 485 | |||||
| Landlord & Other | 196 | 193 | 190 | 192 | 184 | 184 | 177 | 177 | 177 | 178 | 771 | 721 | |||||
| End-user service revenue | 3,187 | 3,223 | 3,243 | 3,225 | 3,191 | 3,221 | 3,223 | 3,211 | 3,164 | 3,191 | 12,878 | 12,846 | |||||
| Operator revenue | 188 | 199 | 187 | 189 | 188 | 203 | 191 | 198 | 190 | 220 | 763 | 779 | |||||
| Equipment revenue | 386 | 418 | 399 | 645 | 478 | 520 | 488 | 720 | 445 | 448 | 1,848 | 2,206 | |||||
| Internal sales | 0 | 0 | 0 | 0 | 0 | 0 | 0 | 0 | 0 | 0 | 0 | 0 | |||||
| Consumer | 3,760 | 3,840 | 3,828 | 4,059 | 3,856 | 3,944 | 3,902 | 4,129 | 3,799 | 3,859 | 15,488 | 15,831 | |||||
| Business | |||||||||||||||||
| Mobile | 526 | 481 | 457 | 468 | 472 | 475 | 473 | 486 | 475 | 456 | 1,932 | 1,905 | |||||
| Fixed | 359 | 360 | 341 | 335 | 325 | 309 | 307 | 296 | 295 | 276 | 1,395 | 1,237 | |||||
| Solutions | 257 | 265 | 254 | 269 | 261 | 264 | 246 | 280 | 264 | 276 | 1,045 | 1,051 | |||||
| End-user service revenue | 1,143 | 1,106 | 1,051 | 1,071 | 1,058 | 1,047 | 1,026 | 1,062 | 1,033 | 1,008 | 4,371 | 4,193 | |||||
| Operator revenue, excluding Wholesale | 30 | 30 | 34 | 30 | 31 | 35 | 26 | 36 | 24 | 35 | 123 | 127 | |||||
| Equipment revenue | 397 | 366 | 313 | 477 | 467 | 421 | 352 | 504 | 446 | 375 | 1,553 | 1,744 | |||||
| Wholesale revenue | 160 | 166 | 177 | 152 | 145 | 139 | 152 | 137 | 168 | 170 | 655 | 574 | |||||
| Internal sales | 0 | 0 | 1 | 1 | 1 | 1 | 1 | 1 | 1 | 10 | 3 | 4 | |||||
| Business | 1,729 | 1,668 | 1,576 | 1,732 | 1,702 | 1,643 | 1,557 | 1,740 | 1,672 | 1,598 | 6,705 | 6,642 | |||||
| Total | 5,490 | 5,508 | 5,405 | 5,791 | 5,558 | 5,587 | 5,459 | 5,869 | 5,471 | 5,457 | 22,194 | 22,473 | |||||
| UNDERLYING EBITDA excluding IFRS 16 | |||||||||||||||||
| Consumer | 1,448 | 1,410 | 1,449 | 1,330 | 1,389 | 1,408 | 1,538 | 1,428 | 1,470 | 1,447 | 5,637 | 5,764 | |||||
| Business | 352 | 305 | 394 | 383 | 373 | 323 | 408 | 346 | 378 | 335 | 1,434 | 1,451 | |||||
| of which Wholesale | 13 | 30 | 66 | 95 | 66 | 37 | 50 | 44 | 72 | 77 | 203 | 197 | |||||
| Total | 1,801 | 1,715 | 1,843 | 1,712 | 1,762 | 1,731 | 1,947 | 1,774 | 1,848 | 1,782 | 7,071 | 7,214 | |||||
| <-- IAS 17 | IFRS 16 --> | ||||||||||||||||
| UNDERLYING EBITDA | |||||||||||||||||
| Consumer | 1,448 | 1,410 | 1,449 | 1,330 | 1,389 | 1,408 | 1,538 | 1,428 | 1,641 | 1,603 | 5,637 | 5,764 | |||||
| Business | 352 | 305 | 394 | 383 | 373 | 323 | 408 | 346 | 465 | 419 | 1,434 | 1,451 | |||||
| of which Wholesale | 13 | 30 | 66 | 95 | 66 | 37 | 50 | 44 | 93 | 97 | 203 | 197 | |||||
| Total | 1,801 | 1,715 | 1,843 | 1,712 | 1,762 | 1,731 | 1,947 | 1,774 | 2,106 | 2,022 | 7,071 | 7,214 | |||||
| Lease depreciation and lease interest | -257 | -278 | |||||||||||||||
| Underlying EBITDAaL | 1,849 | 1,744 | |||||||||||||||
| CAPEX | |||||||||||||||||
| Network | 127 | 195 | 159 | 321 | 182 | 172 | 156 | 292 | 202 | 237 | 802 | 801 | |||||
| IT | 96 | 121 | 93 | 113 | 111 | 118 | 133 | 227 | 177 | 160 | 423 | 590 | |||||
| Customer equipment, CPE | 96 | 104 | 89 | 72 | 121 | 106 | 69 | 84 | 126 | 16 | 361 | 380 | |||||
| Other | 12 | 26 | 21 | 16 | 15 | 16 | 14 | 50 | 40 | 44 | 75 | 95 | |||||
| Capex excluding spectrum and leases | 331 | 446 | 362 | 522 | 429 | 413 | 372 | 652 | 545 | 458 | 1,661 | 1,866 | |||||
| Spectrum | 0 | 0 | 0 | 0 | 0 | 0 | 0 | 721 | 0 | 0 | 0 | 721 | |||||
| Right-of-use assets (leases) | 0 | 0 | 0 | 0 | 0 | 0 | 0 | 0 | 239 | 398 | 0 | 0 | |||||
| Total | 331 | 446 | 362 | 522 | 429 | 413 | 372 | 1,373 | 784 | 857 | 1,661 | 2,588 | |||||
| 2017 | 2017 | 2017 | 2017 | 2018 | 2018 | 2018 | 2018 | 2019 | 2019 | 2019 | 2019 | ||||||
| in thousand | Comments | Mar 31 | Jun 30 | Sep 30 | Dec 31 | Mar 31 | Jun 30 | Sep 30 | Dec 31 | Mar 31 | Jun 30 | Sep 30 | Dec 31 | ||||
| OPERATING DATA | |||||||||||||||||
| Consumer - Addressable fixed footprint | |||||||||||||||||
| Households | 2,324 | 2,594 | 2,686 | 2,831 | 2,871 | 2,948 | 2,991 | 3,114 | 3,178 | 3,249 | |||||||
| Consumer RGUs | |||||||||||||||||
| Mobile | 3,044 | 3,062 | 3,072 | 3,026 | 2,976 | 2,968 | 2,979 | 2,947 | 2,927 | 2,958 | |||||||
| Postpaid | 1,760 | 1,763 | 1,788 | 1,803 | 1,796 | 1,794 | 1,804 | 1,817 | 1,822 | 1,841 | |||||||
| Prepaid | 1,284 | 1,299 | 1,284 | 1,223 | 1,180 | 1,173 | 1,175 | 1,131 | 1,105 | 1,117 | |||||||
| Fixed | 2,284 | 2,279 | 2,279 | 2,278 | 2,257 | 2,243 | 2,231 | 2,209 | 2,201 | 2,191 | |||||||
| Fixed broadband | 727 | 743 | 759 | 778 | 790 | 801 | 814 | 827 | 839 | 852 | |||||||
| Digital TV | 1,120 | 1,112 | 1,107 | 1,098 | 1,086 | 1,074 | 1,066 | 1,057 | 1,048 | 1,041 | |||||||
| Cable & Fiber | 644 | 645 | 651 | 655 | 653 | 654 | 655 | 658 | 661 | 663 | |||||||
| DTT | 476 | 467 | 456 | 443 | 432 | 420 | 411 | 399 | 387 | 378 | |||||||
| Fixed telephony & DSL | 436 | 424 | 412 | 402 | 381 | 368 | 351 | 325 | 313 | 298 | |||||||
| Consumer | 5,328 | 5,341 | 5,351 | 5,303 | 5,232 | 5,211 | 5,210 | 5,157 | 5,128 | 5,149 | |||||||
| Business RGUs | |||||||||||||||||
| Mobile | 821 | 813 | 815 | 821 | 855 | 867 | 881 | 889 | 896 | 913 | |||||||
| Lithuania | |||||||||||||||||
| SEK million | Comments | 2017 | 2017 | 2017 | 2017 | 2018 | 2018 | 2018 | 2018 | 2019 | 2019 | 2019 | 2019 | 2017 | 2018 | 2019 | |
| Q1 | Q2 | Q3 | Q4 | Q1 | Q2 | Q3 | Q4 | Q1 | Q2 | Q3 | Q4 | Full-year | Full-year | Full-year | |||
| Mobile | 259 | 281 | 287 | 293 | 302 | 335 | 342 | 351 | 351 | 368 | 1,120 | 1,329 | |||||
| Fixed | 0 | 0 | 0 | 0 | 0 | 0 | 0 | 0 | 0 | 0 | 0 | 0 | |||||
| End-user service revenue | 259 | 281 | 287 | 293 | 302 | 335 | 342 | 351 | 351 | 368 | 1,120 | 1,329 | |||||
| Operator revenue | 51 | 56 | 59 | 57 | 56 | 63 | 70 | 60 | 60 | 63 | 223 | 249 | |||||
| Equipment revenue | 123 | 138 | 160 | 175 | 170 | 198 | 211 | 243 | 192 | 206 | 595 | 822 | |||||
| Internal sales | 5 | 4 | 5 | 6 | 5 | 7 | 8 | 10 | 9 | 11 | 20 | 31 | |||||
| Total revenue | 438 | 479 | 510 | 530 | 532 | 603 | 631 | 664 | 613 | 648 | 1,958 | 2,430 | |||||
| Underlying EBITDA excluding IFRS 16 | 147 | 171 | 175 | 158 | 178 | 204 | 232 | 204 | 232 | 244 | 651 | 817 | |||||
| <-- IAS 17 | IFRS 16 --> | ||||||||||||||||
| Underlying EBITDA | 147 | 171 | 175 | 158 | 178 | 204 | 232 | 204 | 245 | 259 | 651 | 817 | |||||
| Lease depreciation and lease interest | -15 | -15 | |||||||||||||||
| Underlying EBITDAaL | 230 | 244 | |||||||||||||||
| Capex excluding spectrum and leases | 29 | 23 | 25 | 36 | 22 | 38 | 43 | 41 | 26 | 30 | 114 | 144 | |||||
| Spectrum | 0 | 0 | 0 | 0 | 0 | 0 | 0 | 0 | 0 | 0 | 0 | 0 | |||||
| Right-of-use assets (leases) | 0 | 0 | 0 | 0 | 0 | 0 | 0 | 0 | 3 | 7 | 0 | 0 | |||||
| Capex | 29 | 23 | 25 | 36 | 22 | 38 | 43 | 41 | 29 | 38 | 114 | 144 | |||||
| 2017 | 2017 | 2017 | 2017 | 2018 | 2018 | 2018 | 2018 | 2019 | 2019 | 2019 | 2019 | ||||||
| in thousand | Comments | Mar 31 | Jun 30 | Sep 30 | Dec 31 | Mar 31 | Jun 30 | Sep 30 | Dec 31 | Mar 31 | Jun 30 | Sep 30 | Dec 31 | ||||
| Mobile RGUs | 1,767 | 1,775 | 1,795 | 1,791 | 1,808 | 1,833 | 1,869 | 1,861 | 1,857 | 1,875 | |||||||
| Latvia | |||||||||||||||||
| SEK million | Comments | 2017 | 2017 | 2017 | 2017 | 2018 | 2018 | 2018 | 2018 | 2019 | 2019 | 2019 | 2019 | 2017 | 2018 | 2019 | |
| Q1 | Q2 | Q3 | Q4 | Q1 | Q2 | Q3 | Q4 | Q1 | Q2 | Q3 | Q4 | Full-year | Full-year | Full-year | |||
| Mobile | 151 | 165 | 177 | 177 | 179 | 194 | 198 | 197 | 199 | 219 | 671 | 768 | |||||
| Fixed | 0 | 0 | 0 | 0 | 0 | 0 | 0 | 0 | 0 | 0 | 0 | 0 | |||||
| End-user service revenue | 151 | 165 | 177 | 177 | 179 | 194 | 198 | 197 | 199 | 219 | 671 | 768 | |||||
| Operator revenue | 49 | 53 | 56 | 55 | 47 | 51 | 53 | 51 | 47 | 47 | 213 | 202 | |||||
| Equipment revenue | 53 | 57 | 66 | 95 | 66 | 75 | 83 | 97 | 72 | 75 | 271 | 321 | |||||
| Internal sales | 4 | 4 | 5 | 9 | 4 | 5 | 4 | 5 | 4 | 5 | 22 | 17 | |||||
| Total revenue | 257 | 279 | 305 | 336 | 296 | 325 | 339 | 349 | 322 | 347 | 1,177 | 1,309 | |||||
| Underlying EBITDA excluding IFRS 16 | 87 | 96 | 119 | 115 | 103 | 121 | 125 | 125 | 116 | 132 | 417 | 474 | |||||
| <-- IAS 17 | IFRS 16 --> | ||||||||||||||||
| Underlying EBITDA | 87 | 96 | 119 | 115 | 103 | 121 | 125 | 125 | 124 | 141 | 417 | 474 | |||||
| Lease depreciation and lease interest | -9 | -10 | |||||||||||||||
| Underlying EBITDAaL | 116 | 132 | |||||||||||||||
| Capex excluding spectrum and leases | 17 | 21 | 19 | 27 | 24 | 21 | 23 | 44 | 31 | 38 | 83 | 112 | |||||
| Spectrum | 0 | 0 | 0 | 0 | 0 | 0 | 1 | 0 | 67 | 1 | 0 | 1 | |||||
| Right-of-use assets (leases) | 0 | 0 | 0 | 0 | 0 | 0 | 0 | 0 | 3 | 22 | 0 | 0 | |||||
| Capex | 17 | 21 | 19 | 27 | 24 | 21 | 24 | 44 | 101 | 60 | 83 | 113 | |||||
| 2017 | 2017 | 2017 | 2017 | 2018 | 2018 | 2018 | 2018 | 2019 | 2019 | 2019 | 2019 | ||||||
| in thousand | Comments | Mar 31 | Jun 30 | Sep 30 | Dec 31 | Mar 31 | Jun 30 | Sep 30 | Dec 31 | Mar 31 | Jun 30 | Sep 30 | Dec 31 | ||||
| Mobile RGUs | 942 | 954 | 968 | 952 | 942 | 942 | 964 | 951 | 946 | 961 | |||||||
| Estonia | |||||||||||||||||
| SEK million | Comments | 2017 | 2017 | 2017 | 2017 | 2018 | 2018 | 2018 | 2018 | 2019 | 2019 | 2019 | 2019 | 2017 | 2018 | 2019 | |
| Q1 | Q2 | Q3 | Q4 | Q1 | Q2 | Q3 | Q4 | Q1 | Q2 | Q3 | Q4 | Full-year | Full-year | Full-year | |||
| Mobile | 108 | 111 | 117 | 115 | 104 | 110 | 109 | 108 | 105 | 111 | 452 | 431 | |||||
| Fixed | 1 | 1 | 1 | 1 | 4 | 5 | 5 | 6 | 5 | 5 | 3 | 20 | |||||
| End-user service revenue | 109 | 112 | 118 | 116 | 108 | 115 | 114 | 114 | 110 | 116 | 455 | 451 | |||||
| Operator revenue | 29 | 31 | 32 | 30 | 30 | 36 | 34 | 32 | 31 | 34 | 122 | 133 | |||||
| Equipment revenue | 28 | 50 | 34 | 50 | 50 | 43 | 43 | 61 | 40 | 42 | 162 | 197 | |||||
| Internal sales | 1 | 1 | 1 | 2 | 1 | 2 | 1 | 1 | 1 | 2 | 5 | 6 | |||||
| Total revenue | 166 | 194 | 185 | 198 | 189 | 196 | 192 | 209 | 182 | 194 | 744 | 787 | |||||
| Underlying EBITDA excluding IFRS 16 | 44 | 45 | 47 | 50 | 36 | 40 | 46 | 45 | 38 | 37 | 186 | 167 | |||||
| <-- IAS 17 | IFRS 16 --> | ||||||||||||||||
| Underlying EBITDA | 44 | 45 | 47 | 50 | 36 | 40 | 46 | 45 | 47 | 47 | 186 | 167 | |||||
| Lease depreciation and lease interest | -12 | -12 | |||||||||||||||
| Underlying EBITDAaL | 35 | 35 | |||||||||||||||
| Capex excluding spectrum and leases | 13 | 21 | 22 | 27 | 18 | 23 | 26 | 21 | 20 | 18 | 82 | 87 | |||||
| Spectrum | 1 | 0 | 0 | 0 | 0 | 0 | 0 | 0 | 0 | 0 | 1 | 0 | |||||
| Right-of-use assets (leases) | 0 | 0 | 0 | 0 | 0 | 0 | 0 | 0 | 9 | 10 | 0 | 0 | |||||
| Capex | 14 | 21 | 22 | 27 | 18 | 23 | 26 | 21 | 29 | 28 | 83 | 87 | |||||
| 2017 | 2017 | 2017 | 2017 | 2018 | 2018 | 2018 | 2018 | 2019 | 2019 | 2019 | 2019 | ||||||
| in thousand | Comments | Mar 31 | Jun 30 | Sep 30 | Dec 31 | Mar 31 | Jun 30 | Sep 30 | Dec 31 | Mar 31 | Jun 30 | Sep 30 | Dec 31 | ||||
| Mobile RGUs | 474 | 474 | 468 | 464 | 459 | 459 | 450 | 437 | 431 | 439 | |||||||
| Germany | |||||||||||||||||
| SEK million | Comments | 2017 | 2017 | 2017 | 2017 | 2018 | 2018 | 2018 | 2018 | 2019 | 2019 | 2019 | 2019 | 2017 | 2018 | 2019 | |
| Q1 | Q2 | Q3 | Q4 | Q1 | Q2 | Q3 | Q4 | Q1 | Q2 | Q3 | Q4 | Full-year | Full-year | Full-year | |||
| Mobile | 87 | 85 | 82 | 83 | 78 | 80 | 77 | 74 | 73 | 72 | 337 | 310 | |||||
| Fixed | 72 | 68 | 67 | 64 | 60 | 57 | 57 | 52 | 49 | 44 | 271 | 226 | |||||
| End-user service revenue | 158 | 153 | 149 | 147 | 138 | 137 | 134 | 126 | 121 | 116 | 608 | 536 | |||||
| Operator revenue | 0 | 0 | 0 | 0 | 0 | 0 | 0 | 0 | 0 | 0 | 1 | 1 | |||||
| Equipment revenue | 1 | 1 | 1 | 1 | 1 | 1 | 1 | 1 | 1 | 0 | 3 | 2 | |||||
| Internal sales | 0 | 0 | 0 | 0 | 0 | 0 | 0 | 0 | 0 | 0 | 0 | 0 | |||||
| Total revenue | 160 | 154 | 150 | 148 | 139 | 138 | 135 | 127 | 122 | 116 | 611 | 539 | |||||
| Underlying EBITDA excluding IFRS 16 | 61 | 62 | 66 | 75 | 60 | 67 | 64 | 58 | 56 | 53 | 264 | 248 | |||||
| <-- IAS 17 | IFRS 16 --> | ||||||||||||||||
| Underlying EBITDA | 61 | 62 | 66 | 75 | 60 | 67 | 64 | 58 | 56 | 54 | 264 | 248 | |||||
| Lease depreciation and lease interest | 0 | 0 | |||||||||||||||
| Underlying EBITDAaL | 56 | 53 | |||||||||||||||
| Capex excluding spectrum and leases | 0 | 0 | -1 | 1 | 0 | 0 | 0 | 0 | 0 | 0 | 0 | 0 | |||||
| Spectrum | 0 | 0 | 0 | 0 | 0 | 0 | 0 | 0 | 0 | 0 | 0 | 0 | |||||
| Right-of-use assets (leases) | 0 | 0 | 0 | 0 | 0 | 0 | 0 | 0 | 0 | 0 | 0 | 0 | |||||
| Capex | 0 | 0 | -1 | 1 | 0 | 0 | 0 | 0 | 0 | 0 | 0 | 0 | |||||
| 2017 | 2017 | 2017 | 2017 | 2018 | 2018 | 2018 | 2018 | 2019 | 2019 | 2019 | 2019 | ||||||
| in thousand | Comments | Mar 31 | Jun 30 | Sep 30 | Dec 31 | Mar 31 | Jun 30 | Sep 30 | Dec 31 | Mar 31 | Jun 30 | Sep 30 | Dec 31 | ||||
| Mobile RGUs | 160 | 153 | 147 | 142 | 138 | 134 | 130 | 127 | 123 | 119 | |||||||
| Croatia | discontinued operation | ||||||||||||||||
| SEK million | Comments | 2017 | 2017 | 2017 | 2017 | 2018 | 2018 | 2018 | 2018 | 2019 | 2019 | 2019 | 2019 | 2017 | 2018 | 2019 | |
| Q1 | Q2 | Q3 | Q4 | Q1 | Q2 | Q3 | Q4 | Q1 | Q2 | Q3 | Q4 | Full-year | Full-year | Full-year | |||
| Mobile | 206 | 224 | 240 | 233 | 259 | 272 | 294 | 285 | 286 | 309 | 903 | 1,111 | |||||
| Fixed | 0 | 0 | 0 | 0 | 0 | 0 | 0 | 0 | 0 | 0 | 0 | 0 | |||||
| End-user service revenue | 206 | 224 | 240 | 233 | 259 | 272 | 294 | 285 | 286 | 309 | 903 | 1,111 | |||||
| Operator revenue | 46 | 59 | 90 | 50 | 44 | 61 | 106 | 59 | 49 | 69 | 245 | 269 | |||||
| Equipment revenue | 105 | 125 | 131 | 177 | 128 | 115 | 135 | 172 | 138 | 137 | 539 | 550 | |||||
| Internal sales | 2 | 2 | 3 | 1 | 2 | 2 | 2 | 2 | 1 | 4 | 7 | 8 | |||||
| Total revenue | 359 | 411 | 463 | 462 | 432 | 450 | 536 | 518 | 475 | 519 | 1,695 | 1,937 | |||||
| Underlying EBITDA excluding IFRS 16 | 19 | 33 | 78 | 27 | 29 | 63 | 107 | 51 | 85 | 111 | 158 | 249 | |||||
| <-- IAS 17 | IFRS 16 --> | ||||||||||||||||
| Underlying EBITDA | 19 | 33 | 78 | 27 | 29 | 63 | 107 | 51 | 114 | 141 | 158 | 249 | |||||
| Lease depreciation and lease interest | -30 | -32 | |||||||||||||||
| Underlying EBITDAaL | 84 | 108 | |||||||||||||||
| Capex excluding spectrum and leases | 7 | 24 | 22 | 36 | 10 | 36 | 22 | 55 | 14 | 37 | 89 | 123 | |||||
| Spectrum | 0 | 0 | 0 | 0 | 0 | 0 | 0 | 0 | 65 | 1 | 0 | 0 | |||||
| Right-of-use assets (leases) | 0 | 0 | 0 | 0 | 0 | 0 | 0 | 0 | 4 | 43 | 0 | 0 | |||||
| Capex | 7 | 24 | 22 | 36 | 10 | 36 | 22 | 55 | 82 | 80 | 89 | 123 | |||||
| 2017 | 2017 | 2017 | 2017 | 2018 | 2018 | 2018 | 2018 | 2019 | 2019 | 2019 | 2019 | ||||||
| in thousand | Comments | Mar 31 | Jun 30 | Sep 30 | Dec 31 | Mar 31 | Jun 30 | Sep 30 | Dec 31 | Mar 31 | Jun 30 | Sep 30 | Dec 31 | ||||
| Mobile RGUs | 788 | 822 | 884 | 840 | 844 | 885 | 945 | 897 | 894 | 948 | |||||||

NOTICE TO ATTEND THE EXTRAORDINARY GENERAL MEETING
The shareholders of Tele2 AB (publ), reg. no. 556410-8917, with its registered office in
Stockholm, Sweden, are hereby invited to the Extraordinary General Meeting
on Thursday 22 August 2019 at 1.00 p.m. CEST at Tele2’s premises on
Torshamnsgatan 17 in Kista, Stockholm.
NOTICE ETC.
Shareholders who wish to attend the Extraordinary General Meeting shall
| • | be entered in the share register maintained by Euroclear Sweden on Friday 16 August 2019, and |
| • | give notice of their intention to attend no later than Friday 16 August 2019. Notice to attend is to be made on the company’s website at www.tele2.com, under the heading “Extraordinary General Meeting 2019”, found under the section “Governance”, by telephone to +46 (0)8 42 00 34 32 or by mail to Computershare AB “EGM Tele2”, P.O. Box 610, SE-182 16 Danderyd, Sweden. |
Shareholders shall in their notice to attend state name, personal identification number or company registration number, address, phone number and number of advisors, if applicable. Shareholders whose shares are registered in the names of nominees must re-register such shares in their own name in order to be entitled to attend the Extraordinary General Meeting. In order for such re-registration, which can be temporary, to be completed on Friday 16 August 2019 the shareholder must inform their nominees well before that day. Shareholders attending by a proxy or a representative should send documents of authorization to the mail address above well before the Extraordinary General Meeting. A template proxy form is available on the company’s website www.tele2.com under the heading “Extraordinary General Meeting 2019”, found under the section “Governance”. Shareholders cannot vote or, in other way, attend the Extraordinary General Meeting by remote access.
PROPOSED AGENDA
| 1. | Opening of the Extraordinary General Meeting. |
| 2. | Election of Chairman of the Extraordinary General Meeting. |
| 3. | Preparation and approval of the voting list. |
| 4. | Approval of the agenda. |
| 5. | Election of one or two persons to check and verify the minutes. |
| 6. | Determination of whether the Extraordinary General Meeting has been duly convened. |
| 7. | Resolution on extraordinary dividend. |
| 8. | Closing of the Extraordinary General Meeting. |
RESOLUTIONS PROPOSED BY THE BOARD
Dividend (item 7)
Following the sale of the company’s equity share in the joint venture between Tele2 and Kazakhtelecom, and the repayment of Tele2’s shareholder loan to the joint venture, and as a consequence of the proceeds received in conjunction with the merger involving Tele2’s operations in the Netherlands, the financial position of the company has been strengthened and the Board therefore proposes, in accordance with the company’s shareholder remuneration framework, that an extraordinary dividend of SEK 6 (six) per share shall be paid. The record date for the dividend payment shall be on 26 August 2019. If the Extraordinary General Meeting resolves in accordance with the proposal, it is estimated that Euroclear Sweden will execute the payments on 29 August 2019.
The extraordinary dividend proposed by the Board will not affect the payment of the ordinary dividend resolved by the AGM on 6 May 2019, and for which the record date for the second installment is set to 2 October 2019.
The Board’s proposed dividend corresponds to a total amount of SEK 4,126,280,856, based on 687,713,476 outstanding shares as of July 17, 2019 (which excludes 2,628,121 shares held by Tele2).
As of 31 December 2018, Tele2’s non-restricted equity amounted to approximately SEK 28,874 million. The Annual General Meeting on 6 May 2019 resolved to pay a cash dividend of SEK 4.40 per share, to be paid in two equal instalments. The first instalment was paid on May 13, 2019 and amounted to SEK 1,512,887,706 in total, and the second instalment is expected to be paid on October 7, 2019 and amount to SEK 1,512,969,647.2 in total, based on 687,713,476 outstanding shares as of July 17, 2019 (which excludes 2,628,121 shares held by Tele2). The total dividend resolved by the Annual General Meeting is thus expected to amount to SEK 3,025,857,353.2 which reduce the available non-restricted equity by the same amount. Hence, the available amount for distribution in accordance with Chapter 17, Section 3, Paragraph 1 of the Swedish Companies Act, amounts to approximately SEK 25,848 million. Following the Extraordinary General Meeting’s resolution regarding the distribution, the available amount in accordance with Chapter 17, Section 3, Paragraph 1 of the Swedish Companies Act is expected to be reduced by SEK 4,126,280,856 to approximately SEK 21,722 million.
MISCELLANEOUS
Shares and votes
There are a total number of 690,341,597 shares in Tele2, whereof 22,606,922 Class A shares, 665,835,675 Class B shares and 1,899,000 Class C shares, corresponding to a total of 893,803,895 votes. As at the date on which this notice is disclosed Tele2 holds 729 121 of its own Class B shares and 1,899,000 of its own Class C shares corresponding to 2,628,121 votes which cannot be represented at the Extraordinary General Meeting.
Authorization
The Board, or the person that the Board will appoint, shall be authorized to make the minor adjustments in the Extraordinary General Meeting’s resolutions as may be required in connection with registration at the Swedish Companies Registration Office and Euroclear Sweden.
Documentation
The reasoned statement of the Board pursuant to Chapter 18 Section 4, and the Board’s report and the Auditor’s statement pursuant to Chapter 18 Section 6, of the Swedish Companies Act (2005:551) are available at the company’s website www.tele2.com under the heading “Extraordinary General Meeting 2019”, found under the section “Governance”. The annual report, including audit report, is available at the company’s website www.tele2.com under the heading “Reports and presentations”, found under the section “Investors”. All documentation are also available at the company’s premises at Torshamnsgatan 17 in Stockholm and will be sent to those shareholders who so request and state their postal address or email address.
2
The documentation can be ordered by telephone at +46 (0)8 42 00 34 32 or at the address Computershare AB “EGM Tele2”, P.O. Box 610, SE-182 16 Danderyd, Sweden.
Shareholders’ right to request information
The Board and the Chief Executive Officer shall, if any shareholder so requests and the Board believes that it can be done without material harm to the company, provide information regarding circumstances that may affect the assessment of an item on the agenda and the company’s relation to other companies within the group.
Processing of personal data
For information on how your personal data is processed, see Tele2’s Privacy notice for General Meetings of Shareholders at www.tele2.com under the heading “Shareholders’ personal data”, found under the heading “The share” under the section “Investors”.
Stockholm, July 2019
TELE2 AB (PUBL)
THE BOARD
TELE2 AB (PUBL)
THE BOARD
Other information
Schedule for the Extraordinary General Meeting:
The doors open for shareholders at 12.00 p.m. CEST.
The Annual General Meeting commences at 1.00 p.m. CEST.
Interpretation
The Extraordinary General Meeting will be held in Swedish. As a service to the shareholders, simultaneous interpretation from Swedish to English will be provided. This service may be requested when attendance to the Extraordinary General Meeting is notified.
3
SIGNATURE
Pursuant to the requirements of the Securities Exchange Act of 1934, the registrant, Tele2 AB (publ), has duly caused this report to be signed on its behalf by the undersigned, thereunto duly authorized.
| Date: July 22, 2019 | Tele2 AB (publ) | ||
| By: | /s/ Stefan Backman | ||
| Name: | Stefan Backman | ||
| Title: | General Counsel | ||
2