|
Exhibit 99.1 
|
Investor Presentation
November 2014
|
|
These slides and the accompanying oral presentation contain forward-looking statements. All statements other than statements of historical fact contained in this presentation, including statements regarding third quarter 2014 financial results and future results of the operations and financial position of Cvent, Inc. (“Cvent” or the “Company”), including financial targets, business strategy, and plans and objectives for future operations, are forward-looking statements. Cvent has based these forward-looking statements on its estimates and assumptions of its financial results and its current expectations and projections about future events and financial trends that it believes may affect its financial condition, results of operations, business strategy, short-term and long-term business operations and objectives, and financial needs as of the date of this presentation. These forward-looking statements are subject to a number of risks, uncertainties and assumptions, including those described under the heading “Risk Factors” in the Annual report on Form 10-K that Cvent filed with the Securities and Exchange Commission on March 21, 2014. Moreover, Cvent operates in a very competitive and rapidly changing environment. New risks emerge from time to time. It is not possible for Cvent management to predict all risks, nor can Cvent assess the impact of all factors on its business or the extent to which any factor, or combination of factors, may cause actual results to differ materially from those contained in any forward-looking statements Cvent may make. In light of these risks, uncertainties and assumptions, the forward-looking events and circumstances discussed in this presentation are inherently uncertain and may not occur, and actual results could differ materially and adversely from those anticipated or implied in the forward-looking statements.
You should not rely upon forward-looking statements as predictions of future events. Although Cvent believes that the expectations reflected in the forward-looking statements are reasonable, Cvent cannot guarantee that the future results, levels of activity, performance or events and circumstances reflected in the forward-looking statements will be achieved or occur. Moreover, neither Cvent nor any other person assumes responsibility for the accuracy and completeness of the forward-looking statements. Cvent undertakes no obligation to update publicly or revise any forward-looking statements for any reason after the date of this presentation, to conform these statements to actual results or to changes in Cvent’s expectations.
In addition to U.S. GAAP financials, this presentation includes certain non-GAAP financial measures, including Adjusted EBITDA and Free Cash Flow among others. These non-GAAP measures are in addition to, not a substitute for or superior to, measures of financial performance prepared in accordance with U.S. GAAP. The non-GAAP financial measures used by Cvent may differ from the non-GAAP financial measures used by other companies. A reconciliation of these measures to the most directly comparable GAAP measure is included in the Appendix to these slides.
2
Update
Quick Highlights
Continued rapid profitable growth and strong customer adoption
Leading the $565B global meetings and events industry shift to technology
Expanding market leadership position
Investing to win disproportionate share of opportunity
4
3Q14 Update
3Q14 revenue and adjusted EBITDA above guided ranges
Larger contract sizes and more multi-product deals
Migrated all customers to Blue Release two months ahead of schedule
Acquired Decision Street to accelerate development of services to hotels and venues
Increased full year revenue and profitability guidance
5
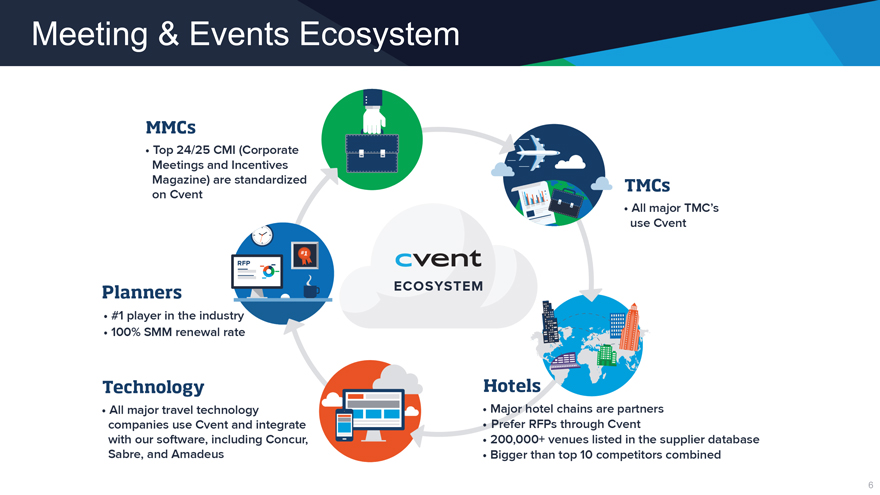
Meeting & Events Ecosystem
6
Agenda
Company Overview Event Management Platform
Supplier Network & Enterprise Hospitality Technology Sales & Marketing Financials Partnership Opportunities
7
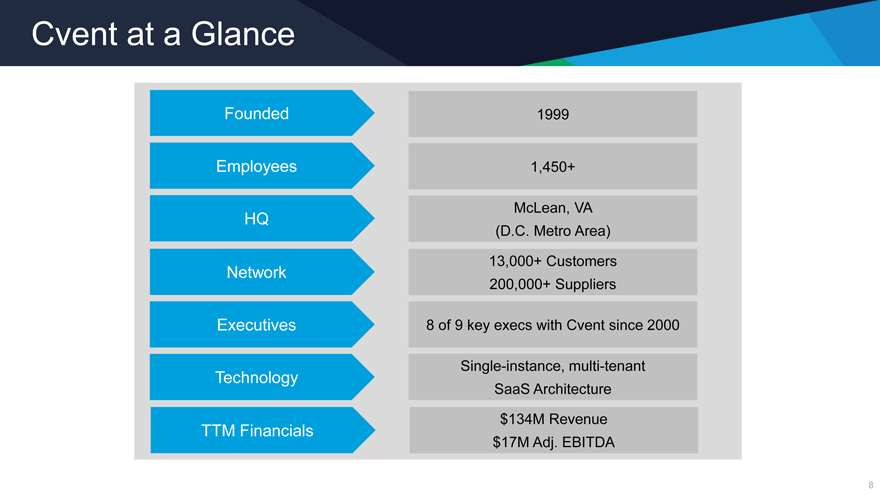
Cvent at a Glance
Founded 1999
Employees 1,450+
HQ McLean, VA
(D.C. Metro Area)
Network 13,000+ Customers
200,000+ Suppliers
Executives 8 of 9 key execs with Cvent since 2000
Technology Single-instance, multi-tenant
SaaS Architecture
TTM Financials $134M Revenue
$17M Adj. EBITDA
8
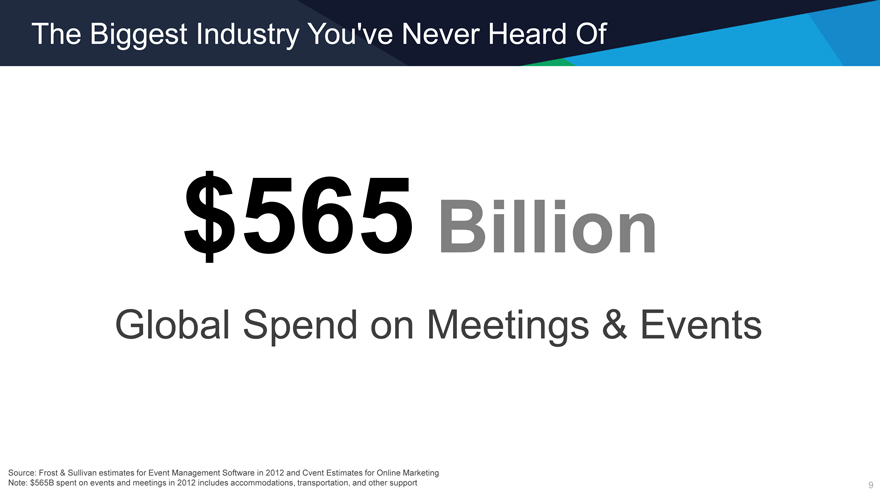
The Biggest Industry You’ve Never Heard Of
$565 Billion
Global Spend on Meetings & Events
Source: Frost & Sullivan estimates for Event Management Software in 2012 and Cvent Estimates for Online Marketing
Note: $565B spent on events and meetings in 2012 includes accommodations, transportation, and other support 9
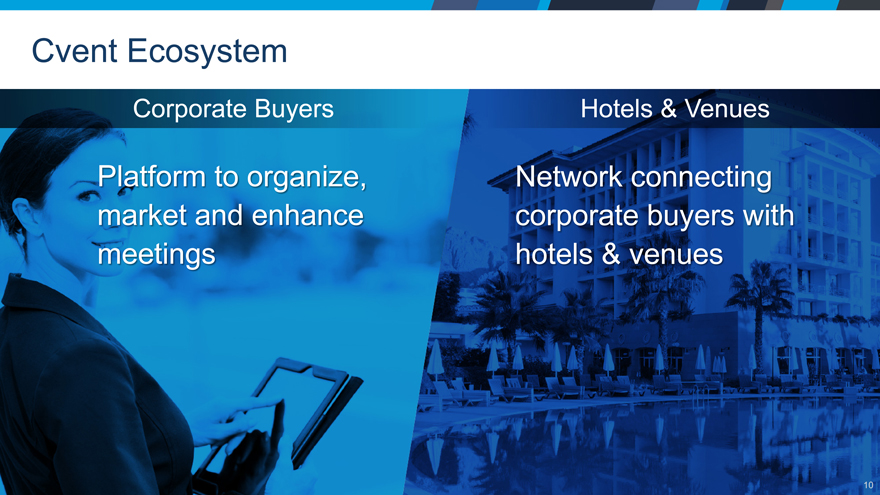
Cvent Ecosystem
Corporate Buyers
Platform t organize, market and enhance meetings
Hotels & Venues
Networ connecting corporate buyer with hotel venues
10
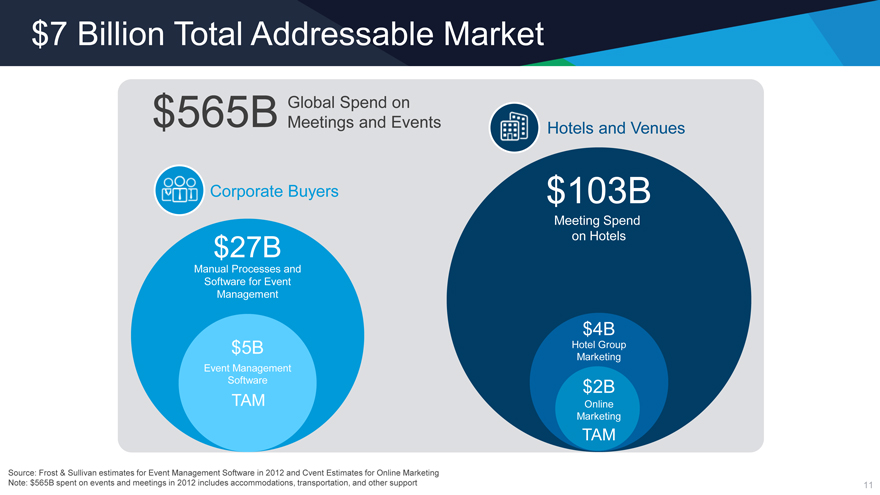
$7 Billion Total Addressable Market
$565B Global Spend on
Meetings and Events Hotels and Venues
Corporate Buyers
$27B
Manual Processes and Software for Event Management
$5B
Event Management Software
TAM
$103B
Meeting Spend on Hotels
$4B
Hotel Group Marketing
$2B
Online Marketing
TAM
Source: Frost & Sullivan estimates for Event Management Software in 2012 and Cvent Estimates for Online Marketing Note: $565B spent on events and meetings in 2012 includes accommodations, transportation, and other support
11
Agenda
Company Overview Event Management Platform
Supplier Network & Enterprise Hospitality Technology Sales & Marketing Financials Partnership Opportunities
12
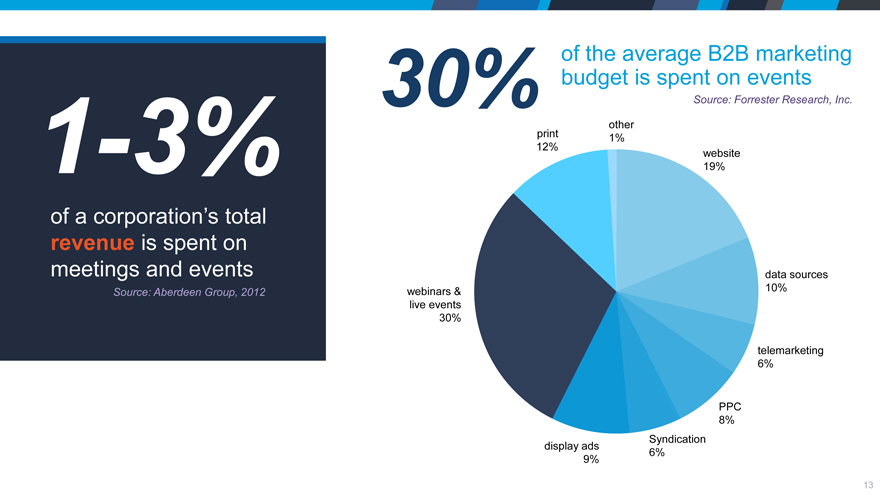
1-3%
of a corporation’s total revenue is spent on meetings and events
Source: Aberdeen Group, 2012
of the average B2B marketing budget is spent on events
30% Source: Forrester Research, Inc.
other
print 1%
12% website
19%
data sources
webinars & 10%
live events
30%
telemarketing
6%
PPC
8%
Syndication
display ads 6%
9%
13
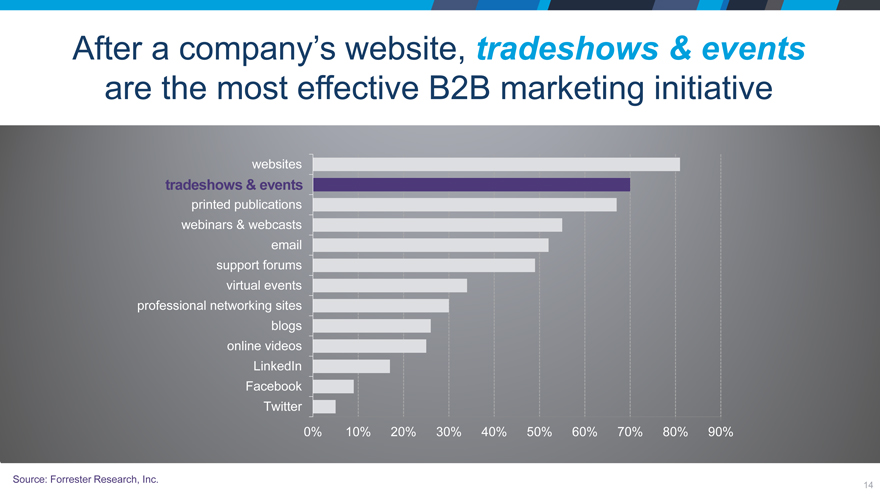
After a company’s website, tradeshows & events are the most effective B2B marketing initiative
websites
tradeshows & events
printed publications
webinars & webcasts
email
support forums
virtual events
professional networking sites
blogs
online videos
LinkedIn
Facebook
Twitter
0% 10% 20% 30% 40% 50% 60% 70% 80% 90%
Source: Forrester Research, Inc.
14
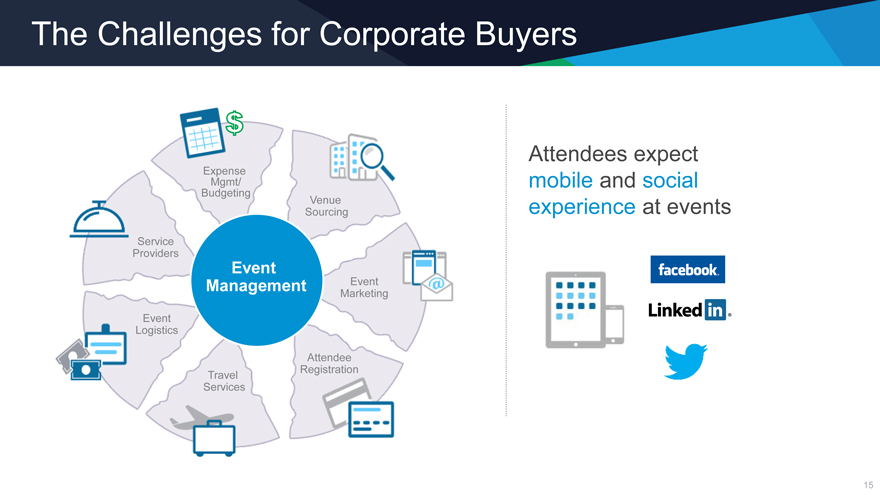
The Challenges for Corporate Buyers
Expense
Mgmt/
Budgeting Venue
Sourcing
Service
Providers
Event
Management Event
Marketing
Event
Logistics
Attendee
Travel Reg
Services
Attendees expect mobile and social experience at events
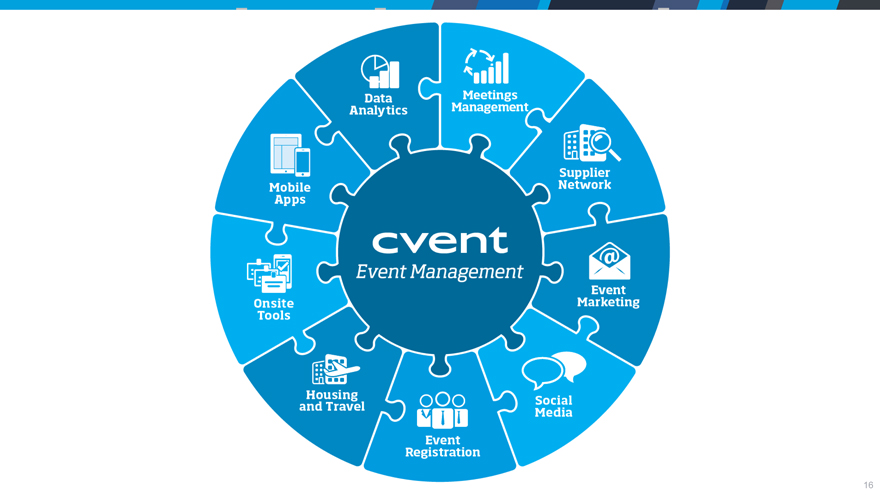
15
Data Analytics
Meetings Management
Supplier Network
Event Marketing
Social Media
Event Registration
Housing and Travel
Onsite Tools
Mobile Apps
16
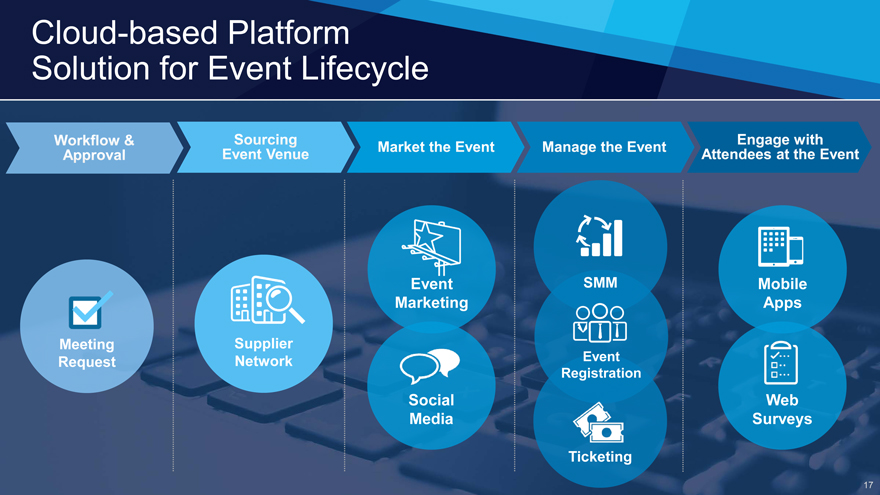
Cloud-based Platform Solution for Event Lifecycle
Event SMM Mobile
Marketing Apps
Meeting
Request Network
Registration
Social Web
Media Surveys
Ticketing
17
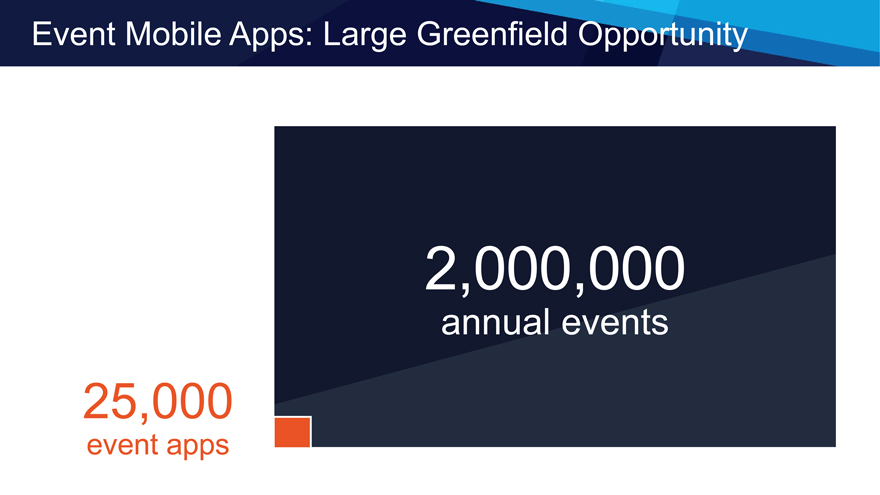
Event Mobile Apps: Large Greenfield Opportunity
2,000,000
annual events
25,000
event apps
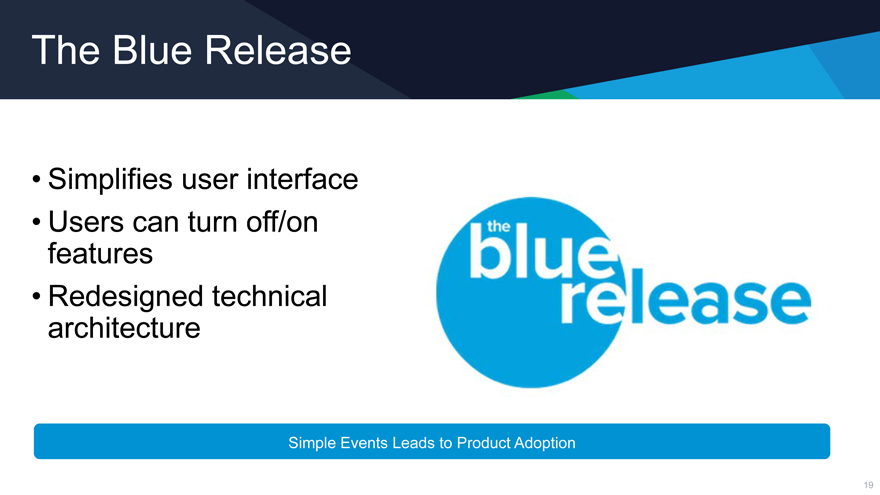
The Blue Release
Simplifies user interface Users can turn off/on features Redesigned technical architecture
Simple Events Leads to Product Adoption
19
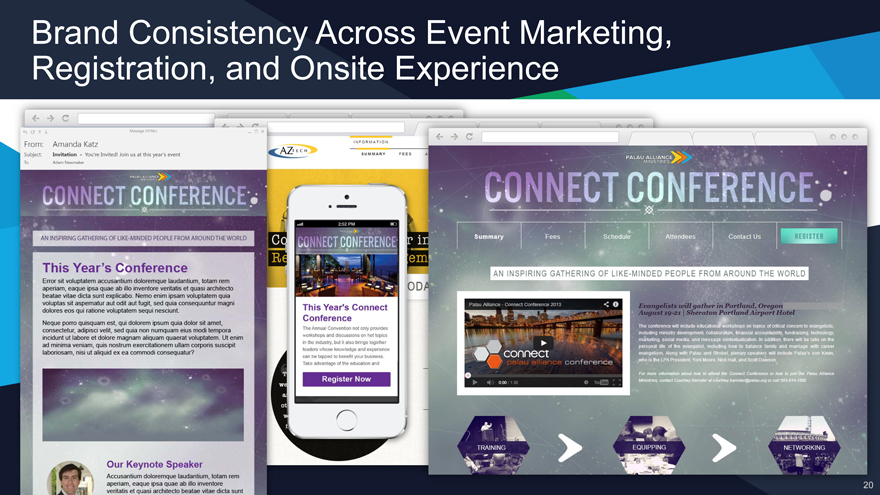
Brand Consistency Across Event Marketing, Registration, and Onsite Experience
20
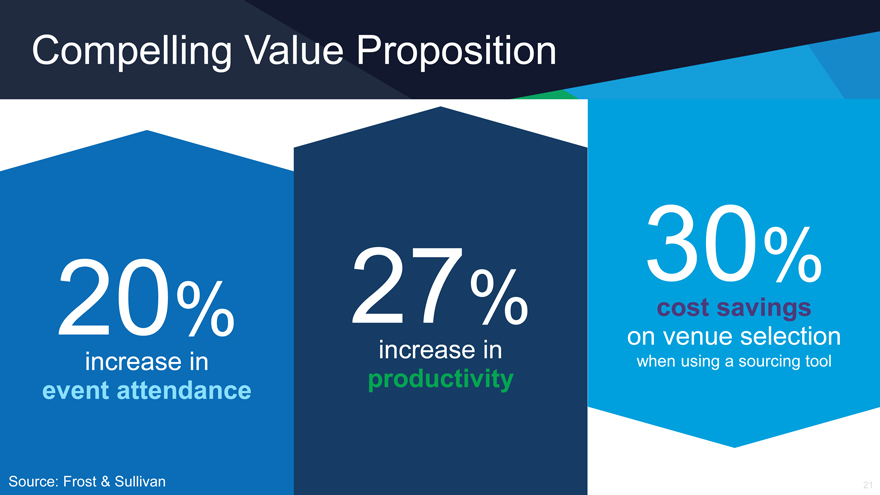
Compelling Value Proposition
20%
increase in event attendance
27%
increase in productivity
30%
cost savings on venue selection
when using a sourcing tool
Source: Frost & Sullivan
21
Enterprise Platform for the Global 5000
22
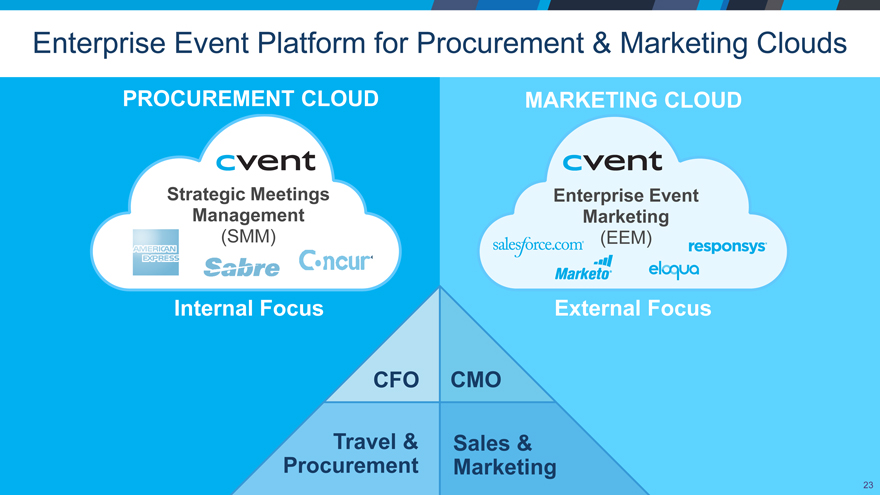
Enterprise Event Platform for Procurement & Marketing Clouds
PROCUREMENT CLOUD
Strategic Meetings Management
(SMM)
Internal Focus
MARKETING CLOUD
Enterprise Event Marketing
(EEM)
External Focus
CFO CMO
Travel & Sales &
Procurement Marketing
23
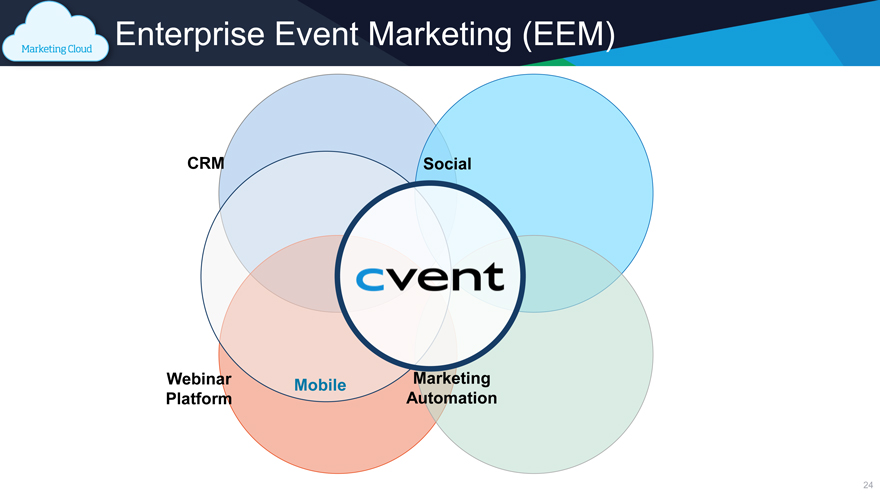
Enterprise Event Marketing (EEM)
CRM Social
Webinar Mobile Marketing
Platform Automation
24
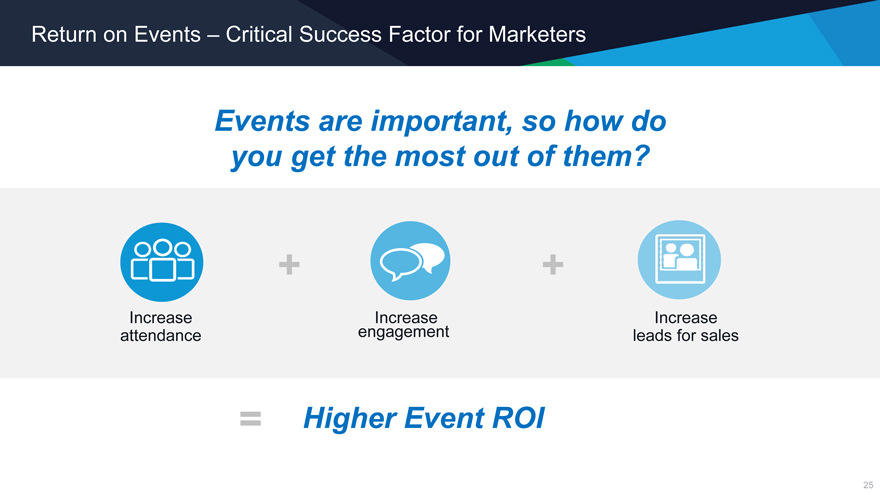
Return on Events – Critical Success Factor for Marketers
Events are important, so how do you get the most out of them
+ +
Increase Increase Increase
attendance engagement leads for sales
= Higher Event ROI
25
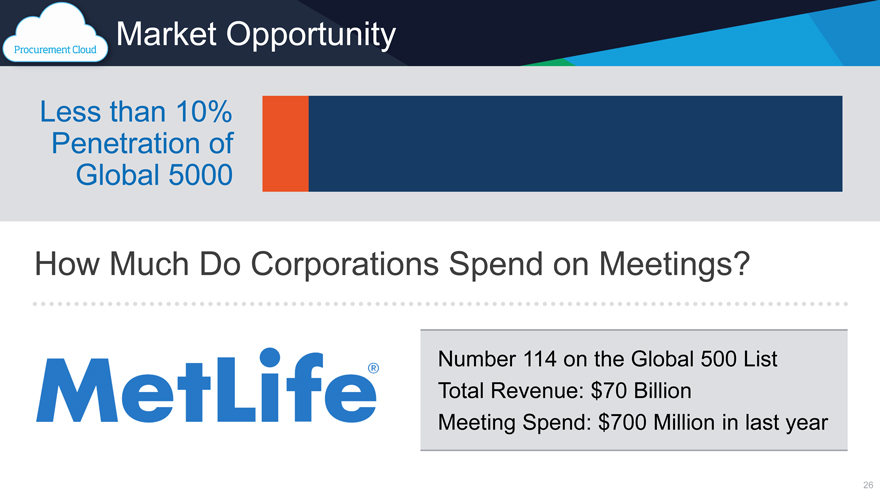
Market Opportunity
Less than 10% Penetration of Global 5000
How Much Do Corporations Spend on Meetings
Number 114 on the Global 500 List Total Revenue: $70 Billion Meeting Spend: $700 Million in last year
26
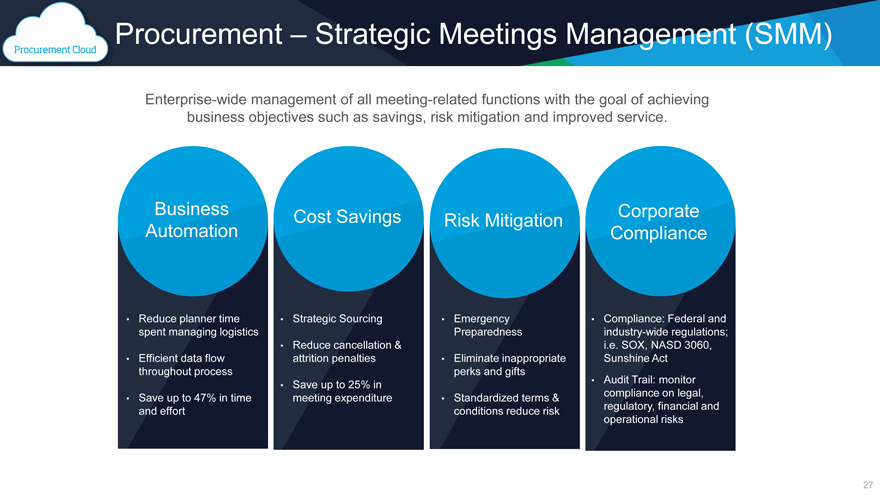
Procurement – Strategic Meetings Management (SMM)
Enterprise-wide management of all meeting-related functions with the goal of achieving business objectives such as savings, risk mitigation and improved service.
Business Automation
Reduce planner time spent managing logistics
Efficient data flow throughout process
Save up to 47% in time and effort
Cost Savings
Strategic Sourcing
Reduce cancellation & attrition penalties
Save up to 25% in meeting expenditure
Risk Mitigation
Emergency Preparedness
Eliminate inappropriate perks and gifts
Standardized terms & conditions reduce risk
Corporate Compliance
Compliance: Federal and industry-wide regulations; i.e. SOX, NASD 3060, Sunshine Act Audit Trail: monitor compliance on legal, regulatory, financial and operational risks
27
Agenda
Company Overview Event Management Platform
Supplier Network & Enterprise Hospitality Technology Sales & Marketing Financials Partnership Opportunities
28
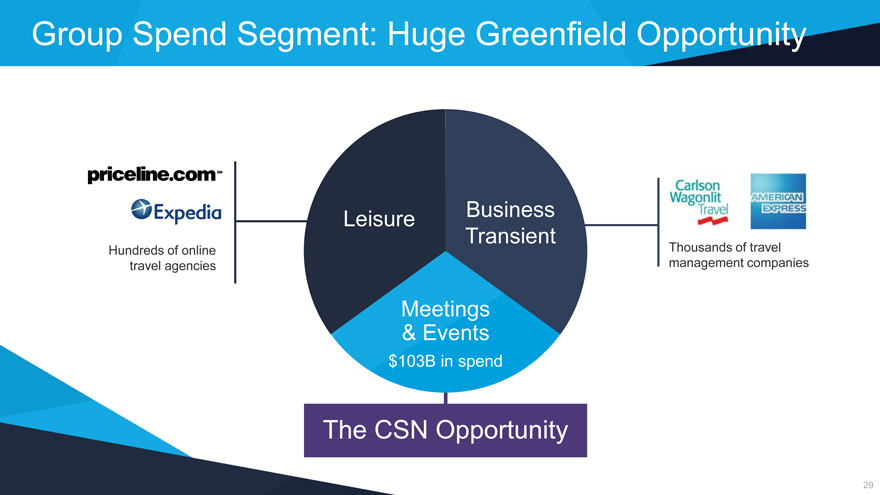
Group Spend Segment: Huge Greenfield Opportunity
Hundreds of online travel agencies
Leisure Business
Transient
Meetings
& Events
$103B in spend
Thousands of travel management companies
The CSN Opportunity
29
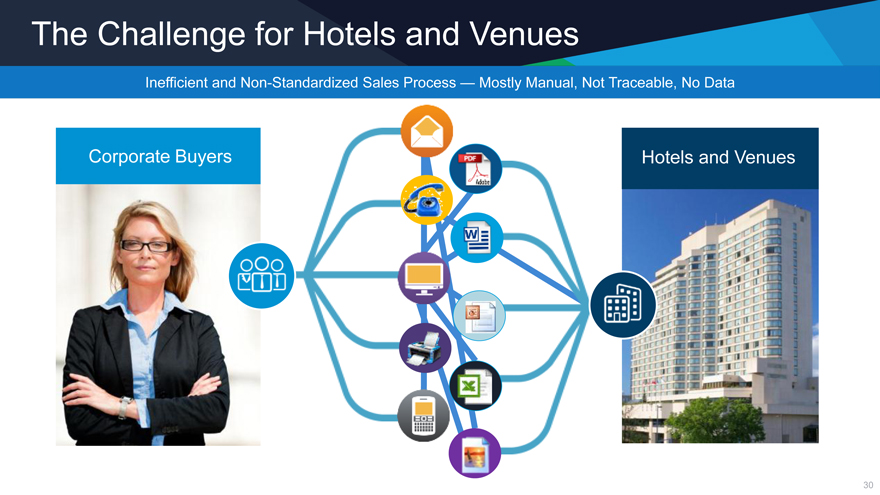
The Challenge for Hotels and Venues
Inefficient and Non-Standardized Sales Process — Mostly Manual, Not Traceable, No Data
Corporate Buyers
Hotels and Venues
30
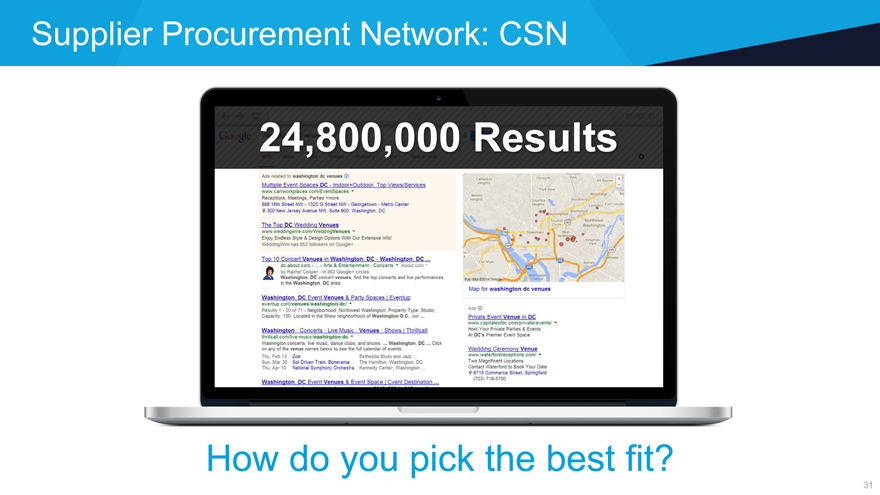
Supplier Procurement Network: CSN
31
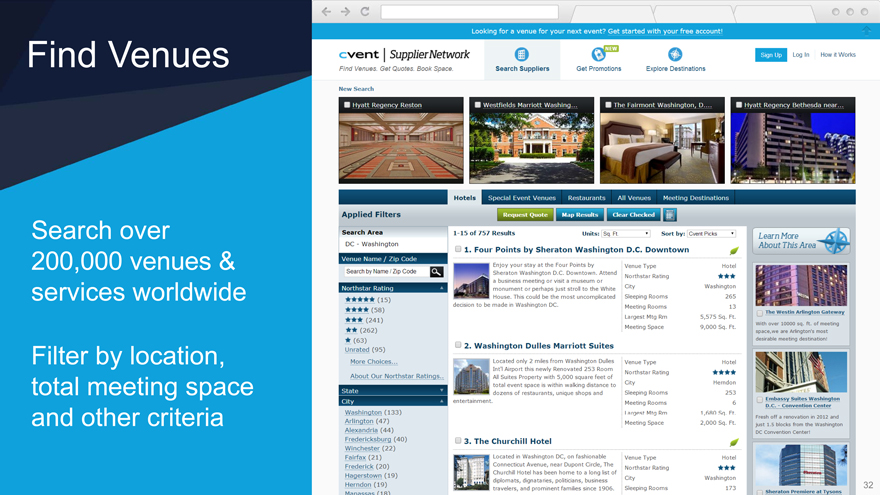
Find Venues
Search over 200,000 venues & services worldwide
Filter by location, total meeting space and other criteria
32
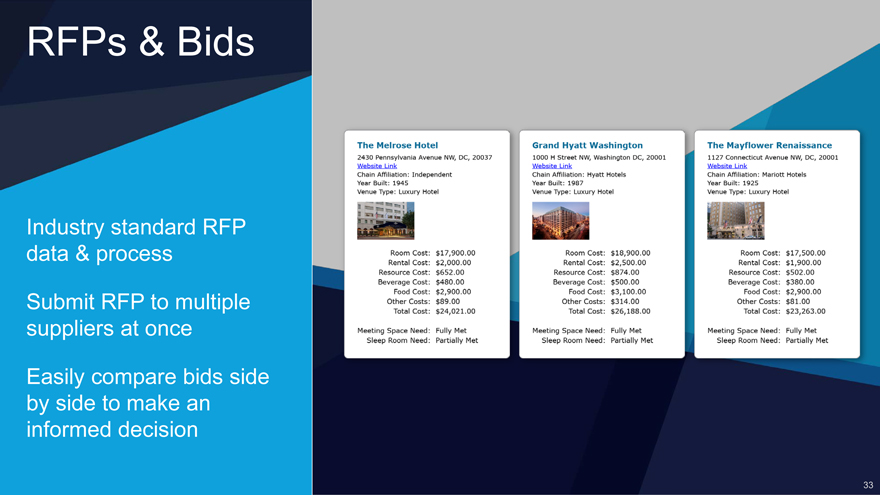
RFPs & Bids
Industry standard RFP data & process Submit RFP to multiple suppliers at once Easily compare bids side by side to make an informed decision
33
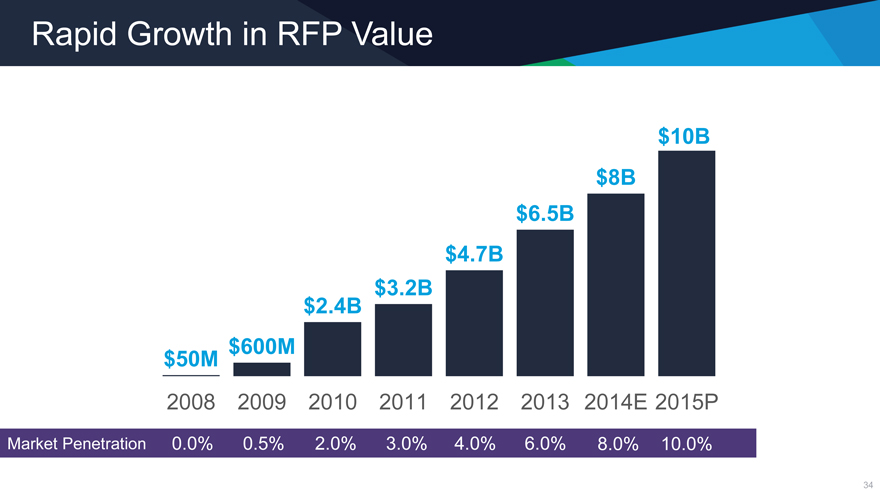
Rapid Growth in RFP Value
$10B
$8B
$6.5B
$4.7B
$3.2B
$2.4B
$50M $600M
2008 2009 2010 2011 2012 2013 2014E 2015P
Market Penetration 0.0% 0.5% 2.0% 3.0% 4.0% 6.0% 8.0% 10.0%
34
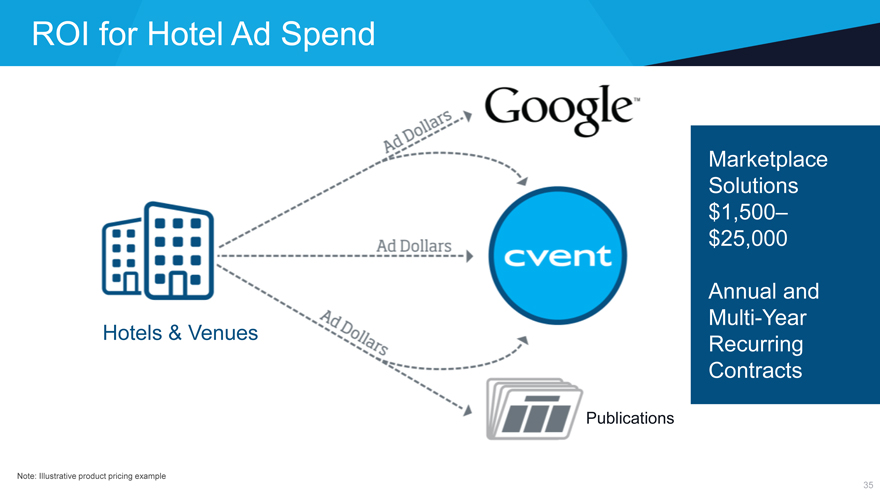
ROI for Hotel Ad Spend
Hotels & Venues
Marketplace Solutions $1,500–$25,000
Annual and Multi-Year Recurring Contracts
Publications
Note: Illustrative product pricing example
35
Global Hotel Customer Base
36
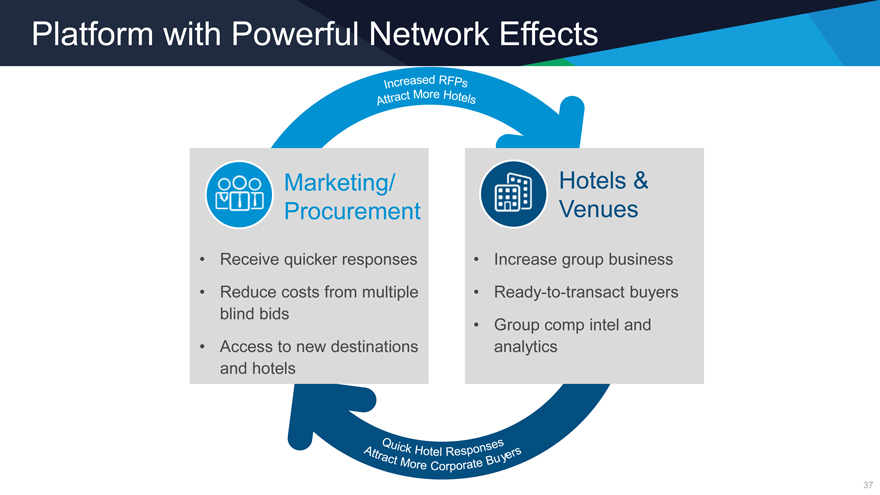
Platform with Powerful Network Effects
Marketing/ Procurement
Receive quicker responses Reduce costs from multiple blind bids Access to new destinations and hotels
Hotels & Venues
Increase group business Ready-to-transact buyers Group comp intel and analytics
37
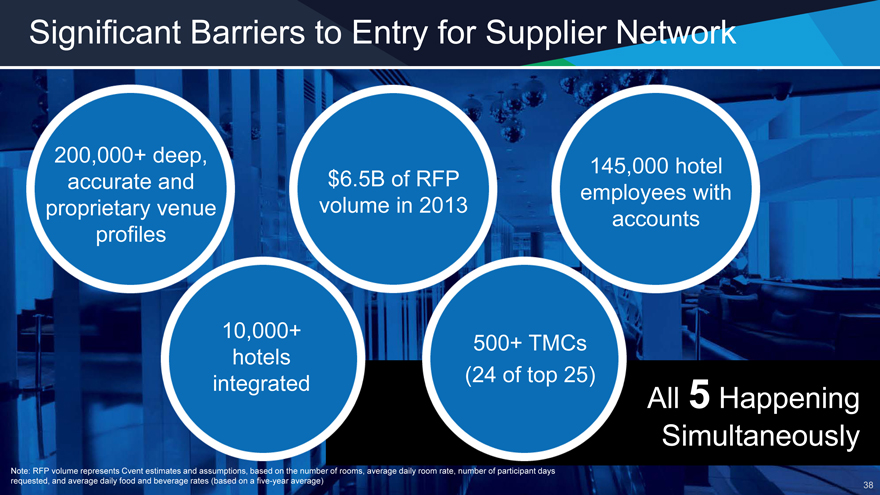
Significant Barriers to Entry for Supplier Network
200,000+ deep, accurate and proprietary venue profiles
$6.5B of RFP volume in 2013
145,000 hotel employees with accounts
10,000+ hotels integrated
500+ TMCs (24 of top 25)
All 5 Happening Simultaneously
Note: RFP volume represents Cvent estimates and assumptions, based on the number of rooms, average daily room rate, number of participant days requested, and average daily food and beverage rates (based on a five-year average)
38
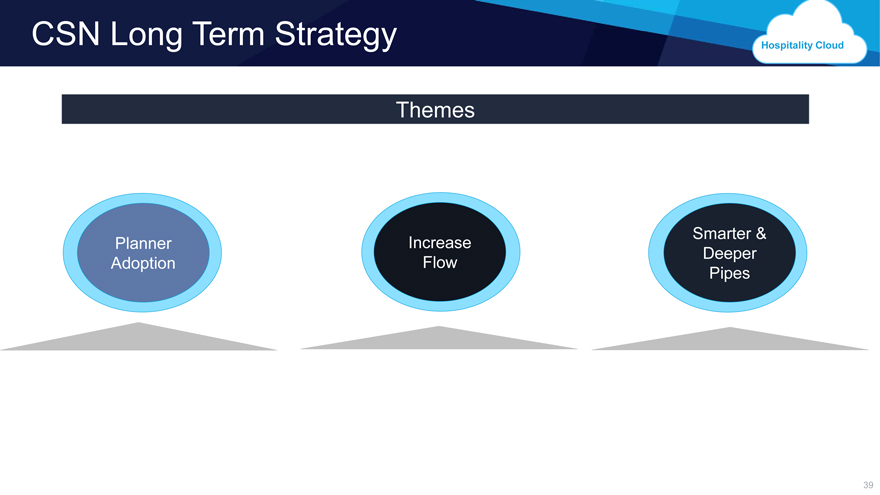
CSN Long Term Strategy
Themes
Planner Adoption
Increase Flow
Smarter & Deeper Pipes
39
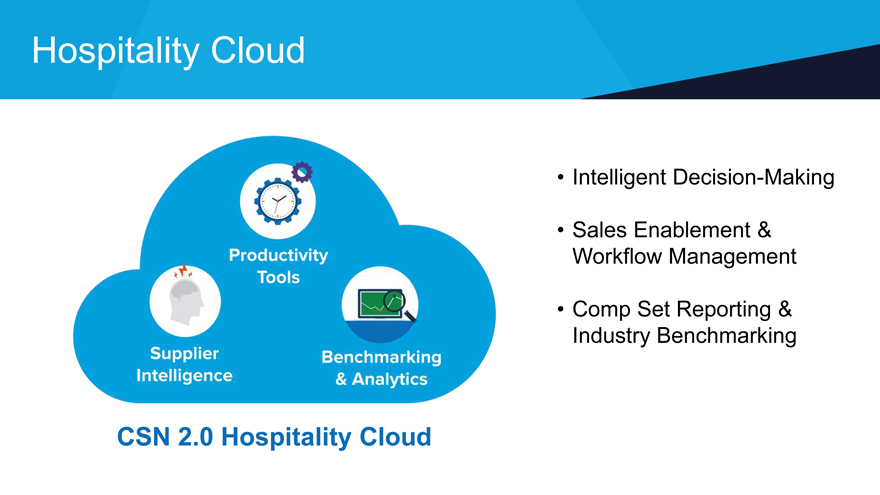
Hospitality Cloud
Intelligent Decision-Making
Sales Enablement & Workflow Management
Comp Set Reporting & Industry Benchmarking
CSN 2.0 Hospitality Cloud
40
Agenda
Company Overview
Event Management Platform
Supplier Network & Enterprise Hospitality
Technology
Sales & Marketing
Financials
Partnership Opportunities
41
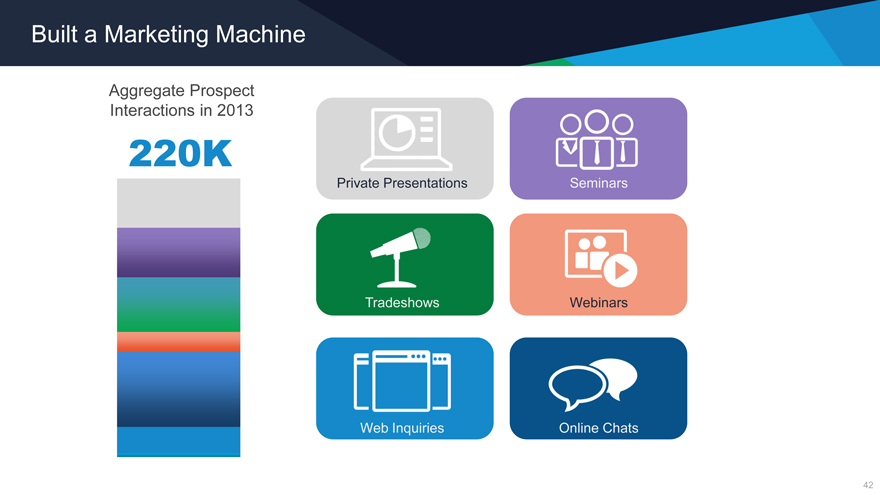
Built a Marketing Machine
Aggregate Prospect Interactions in 2013
220K
Private Presentations
Tradeshows
Online Chats
Seminars
Web Inquires
42
Converting Competitors to Customers
Then Now
Competitive
Product Partner/Customer
Competitive
Product Partner/Customer
Competitors above no longer offer competing products and now use Cvent
43
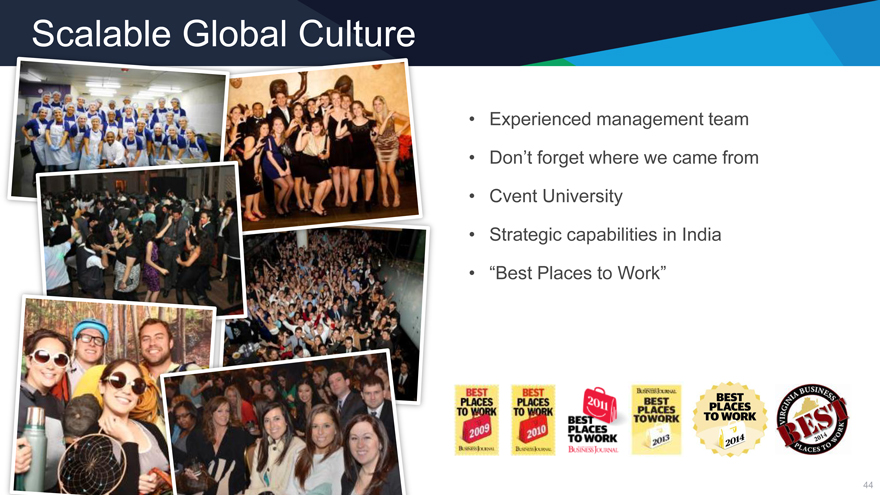
Scalable Global Culture
Experienced management team Don’t forget where we came from Cvent University Strategic capabilities in India “Best Places to Work”
44
Agenda
Company Overview
Event Management Platform
Supplier Network & Enterprise Hospitality
Technology
Sales & Marketing
Financials
Partnership Opportunities
45
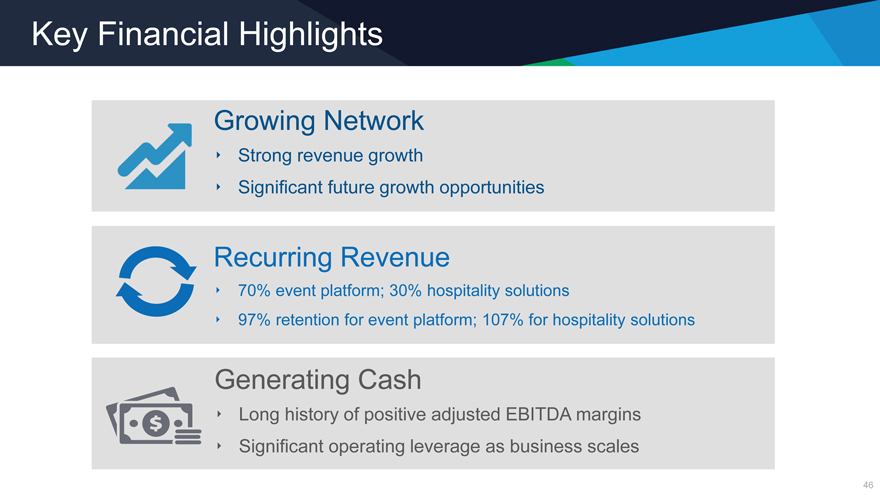
Key Financial Highlights
Growing Network
Strong revenue growth
Significant future growth opportunities
Recurring Revenue
70% event platform; 30% hospitality solutions
97% retention for event platform; 107% for hospitality solutions
Generating Cash
Long history of positive adjusted EBITDA margins
Significant operating leverage as business scales
46
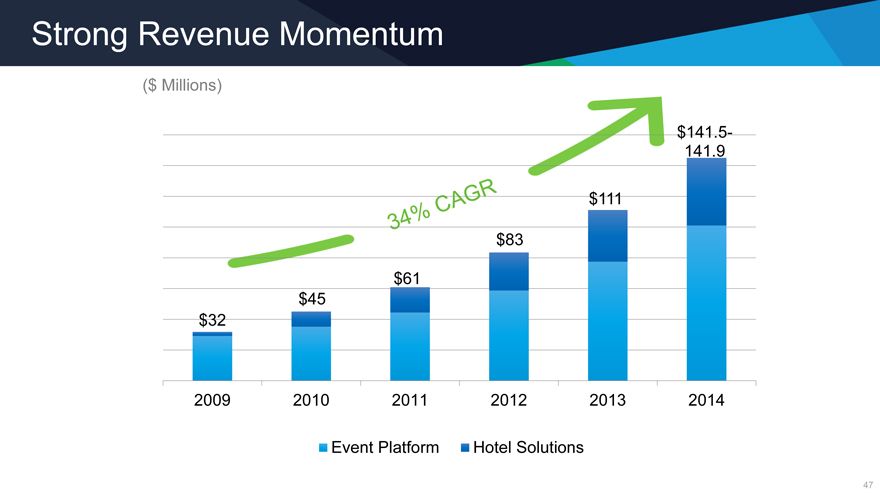
Strong Revenue Momentum
($ Millions)
$141.5-
141.9
$111
$83
$61
$45
$32
2009 2010 2011 2012 2013 2014
Event Platform Hotel Solutions
47
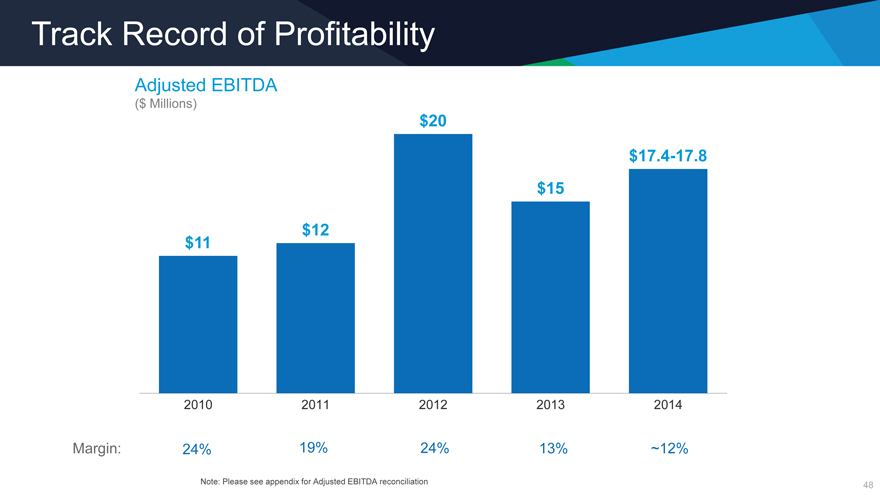
Track Record of Profitability
Adjusted EBITDA
($ Millions)
$20
$17.4-17.8
$15
$12
$11
2010 2011 2012 2013 2014
Margin: 24% 19% 24% 13% ~12%
Note: Please see appendix for Adjusted EBITDA reconciliation
48
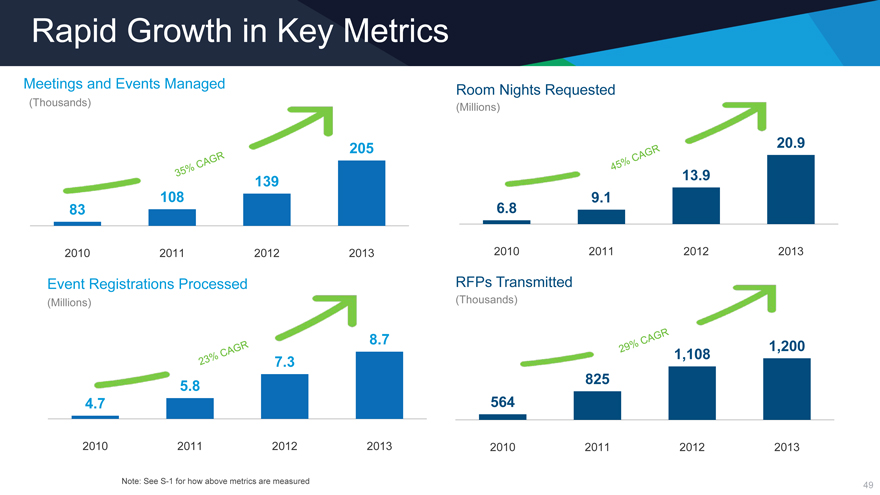
Rapid Growth in Key Metrics
Meetings and Events Managed
(Thousands)
Room Nights Requested
(Millions)
205
83
2010 2011 2012 2013
20.9
6.8 9.1
2010 2011 2012 2013
Event Registrations Processed
(Millions)
8.7
4.7
2010 2011 2012 2013
RFPs T
(Thousands)
825
564
2010 2011 2012 2013
Note: See S-1 for how above metrics are measured
49
Long Term Target Financial Model
Long Term
CY11 CY12 CY13 CY14 Target
Gross Margin 74% 76% 72% ~70% 80%
S&M as % 44% 40% 41% 35–40%
of Revenue
R&D as % 6% 8% 10% 10–12%
of Revenue
G&A as % 10% 10% 15% 8–10%
of Revenue
Adjusted 19% 24% 14% ~12% 25–30%
EBITDA Margin
*Represents guidance provided on November 6, 2014
Note: Presented on Non-GAAP basis excluding stock-based compensation. See Appendix for reconciliation of non-GAAP financial measures
50
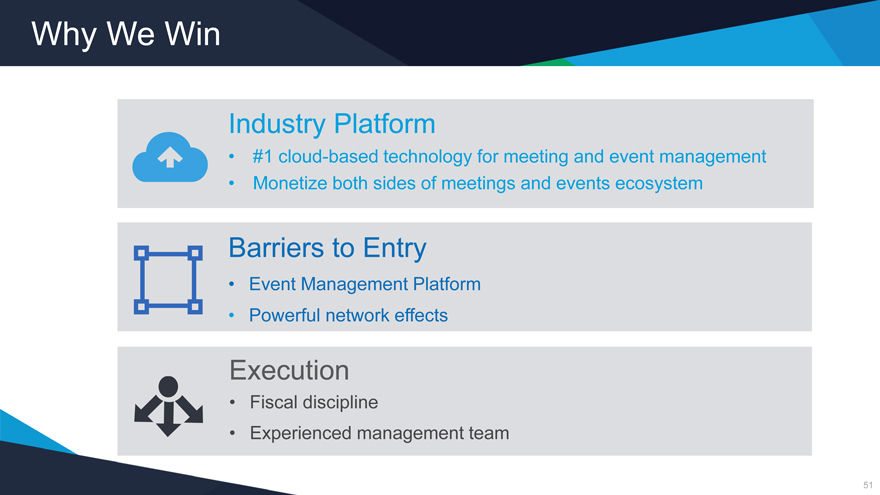
Why We Win
Industry Platform
#1 cloud-based technology for meeting and event management
Monetize both sides of meetings and events ecosystem
Barriers to Entry
Event Management Platform
Powerful network effects
Execution
Fiscal discipline
Experienced management team
51
THANK YOU
Appendix
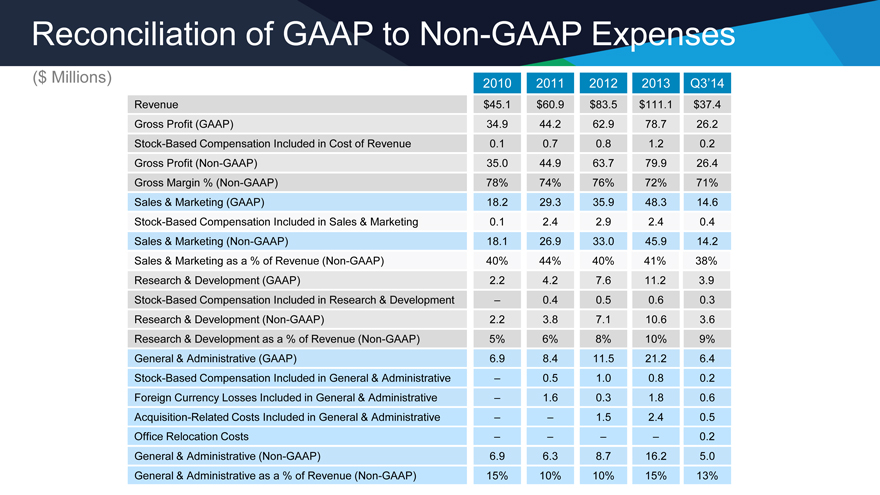
Reconciliation of GAAP to Non-GAAP Expenses
($ Millions) 2010 2011 2012 2013 Q3’14
Revenue $45.1 $60.9 $83.5 $111.1 $37.4
Gross Profit (GAAP) 34.9 44.2 62.9 78.7 26.2
Stock-Based Compensation Included in Cost of Revenue 0.1 0.7 0.8 1.2 0.2
Gross Profit (Non-GAAP) 35.0 44.9 63.7 79.9 26.4
Gross Margin % (Non-GAAP) 78% 74% 76% 72% 71%
Sales & Marketing (GAAP) 18.2 29.3 35.9 48.3 14.6
Stock-Based Compensation Included in Sales & Marketing 0.1 2.4 2.9 2.4 0.4
Sales & Marketing (Non-GAAP) 18.1 26.9 33.0 45.9 14.2
Sales & Marketing as a % of Revenue (Non-GAAP) 40% 44% 40% 41% 38%
Research & Development (GAAP) 2.2 4.2 7.6 11.2 3.9
Stock-Based Compensation Included in Research & Development – 0.4 0.5 0.6 0.3
Research & Development (Non-GAAP) 2.2 3.8 7.1 10.6 3.6
Research & Development as a % of Revenue (Non-GAAP) 5% 6% 8% 10% 9%
General & Administrative (GAAP) 6.9 8.4 11.5 21.2 6.4
Stock-Based Compensation Included in General & Administrative – 0.5 1.0 0.8 0.2
Foreign Currency Losses Included in General & Administrative – 1.6 0.3 1.8 0.6
Acquisition-Related Costs Included in General & Administrative – – 1.5 2.4 0.5
Office Relocation Costs – – – – 0.2
General & Administrative (Non-GAAP) 6.9 6.3 8.7 16.2 5.0
General & Administrative as a % of Revenue (Non-GAAP) 15% 10% 10% 15% 13%
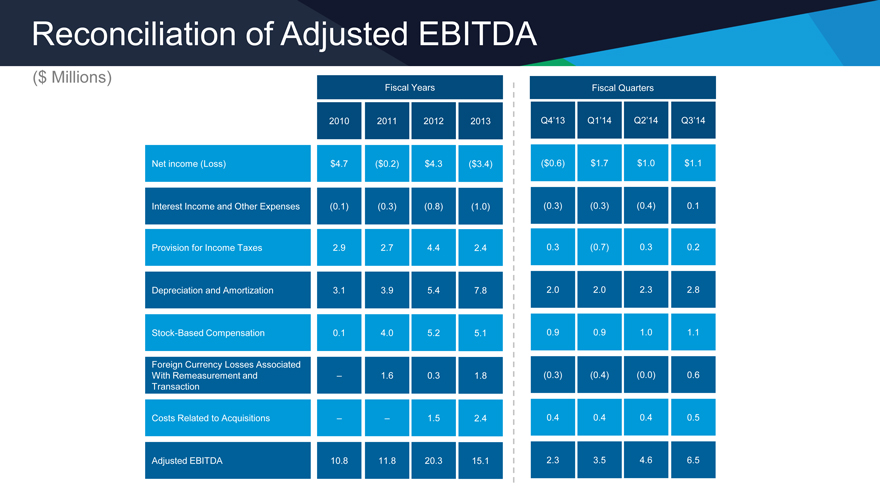
Reconciliation of Adjusted EBITDA
($ Millions)
Fiscal Years Fiscal Quarters
2010 2011 2012 2013 Q4’13 Q1’14 Q2’14 Q3’14
Net income (Loss) $4.7 ($0.2) $4.3 ($3.4) ($0.6) $1.7 $1.0 $1.1
Interest Income and Other Expenses (0.1) (0.3) (0.8) (1.0) (0.3) (0.3) (0.4) 0.1
Provision for Income Taxes 2.9 2.7 4.4 2.4 0.3 (0.7) 0.3 0.2
Depreciation and Amortization 3.1 3.9 5.4 7.8 2.0 2.0 2.3 2.8
Stock-Based Compensation 0.1 4.0 5.2 5.1 0.9 0.9 1.0 1.1
Foreign Currency Losses Associated
With Remeasurement and – 1.6 0.3 1.8 (0.3) (0.4) (0.0) 0.6
Transaction
Costs Related to Acquisitions – – 1.5 2.4 0.4 0.4 0.4 0.5
Adjusted EBITDA 10.8 11.8 20.3 15.1 2.3 3.5 4.6 6.5