UNITED STATES SECURITIES AND EXCHANGE COMMISSION
Washington, D.C. 20549
Form 10-K
| |
☑ | ANNUAL REPORT PURSUANT TO SECTION 13 OR 15(d) OF THE SECURITIES EXCHANGE ACT OF 1934. |
For the fiscal year ended December 31, 2024
or
| |
☐ | TRANSITION REPORT PURSUANT TO SECTION 13 OR 15(d) OF THE SECURITIES EXCHANGE ACT OF 1934. |
For the transition period from to
Commission file number 000-50350
NETGEAR, Inc.
(Exact name of registrant as specified in its charter)
| |
Delaware | 77-0419172 |
(State or other jurisdiction of incorporation or organization) | (I.R.S. Employer Identification No.) |
350 East Plumeria Drive, | 95134 |
San Jose, California | (Zip Code) |
(Address of principal executive offices) | |
Registrant’s telephone number, including area code
(408) 907-8000
Securities registered pursuant to Section 12(b) of the Act:
| | | | |
Title of each class | | Trading symbol(s): | | Name of each exchange on which registered |
Common Stock, $0.001 par value | | NTGR | | The Nasdaq Stock Market LLC |
Securities registered pursuant to section 12(g) of the Act: None
Indicate by check mark if the registrant is a well-known seasoned issuer, as defined in Rule 405 of the Securities Act. Yes ☐ No ☑
Indicate by check mark if the registrant is not required to file reports pursuant to Section 13 or Section 15(d) of the Act. Yes ☐ No ☑
Indicate by check mark whether the registrant (1) has filed all reports required to be filed by Section 13 or 15(d) of the Securities Exchange Act of 1934 during the preceding 12 months (or for such shorter period that the registrant was required to file such reports), and (2) has been subject to such filing requirements for the past 90 days. Yes ☑ No ☐
Indicate by check mark whether the registrant has submitted electronically every Interactive Data File required to be submitted pursuant to Rule 405 of Regulation S-T (§232.405 of this chapter) during the preceding 12 months (or for such shorter period that the registrant was required to submit such files). Yes ☑ No ☐
Indicate by check mark whether the registrant is a large accelerated filer, an accelerated filer, a non-accelerated filer, a smaller reporting company, or an emerging growth company. See definition of “large accelerated filer,” “accelerated filer,” “smaller reporting company”, and "emerging growth company" in Rule 12b-2 of the Exchange Act.
| | | |
Large accelerated filer | ☐ | Accelerated filer | ☑ |
Non-accelerated filer | ☐ | Smaller reporting company | ☐ |
| | Emerging growth company | ☐ |
If an emerging growth company, indicate by check mark if the registrant has elected not to use the extended transition period for complying with any new or revised financial accounting standards provided pursuant to Section 13(a) of the Exchange Act. ☐
Indicate by check mark whether the registrant has filed a report on and attestation to its management’s assessment of the effectiveness of its internal control over financial reporting under Section 404(b) of the Sarbanes-Oxley Act (15 U.S.C. 7262(b)) by the registered public accounting firm that prepared or issued its audit report. ☑
If securities are registered pursuant to Section 12(b) of the Act, indicate by check mark whether the financial statements of the registrant included in the filing reflect the correction of an error to previously issued financial statements. ☐
Indicate by check mark whether any of those error corrections are restatements that required a recovery analysis of incentive-based compensation received by any of the registrant’s executive officers during the relevant recovery period pursuant to §240.10D-1(b). ☐
Indicate by check mark whether the registrant is a shell company (as defined in Rule 12b-2 of the Act.) Yes ☐ No ☑
The aggregate market value of the voting and non-voting common equity held by non-affiliates of the Registrant as of June 28, 2024 (the last business day of the Registrant’s second fiscal quarter) was approximately $432.3 million. Such aggregate market value was computed by reference to the closing price of the common stock as reported on the Nasdaq Global Select Market on June 28, 2024. Shares of common stock held by each executive officer and director have been excluded in that such persons may be deemed to be affiliates. The determination of affiliate status is not necessarily a conclusive determination for other purposes.
The number of outstanding shares of the registrant’s common stock, $0.001 par value, was 28,868,940 shares as of February 7, 2025.
DOCUMENTS INCORPORATED BY REFERENCE
Portions of the Proxy Statement for the Registrant’s 2025 Annual Meeting of Stockholders are incorporated by reference in Part III of this Form 10-K.
TABLE OF CONTENTS
PART I
This Annual Report on Form 10-K (“Form 10-K”), including Management’s Discussion and Analysis of Financial Condition and Results of Operations in Part II, Item 7 below, includes forward-looking statements within the meaning of Section 27A of the Securities Act of 1933, as amended, and Section 21E of the Securities Exchange Act of 1934, as amended (the “Exchange Act”). All statements other than statements of historical facts contained in this Form 10-K, including statements regarding our future financial position, business strategy and plans and objectives of management for future operations, are forward-looking statements. The words “believe,” “may,” “will,” “estimate,” “continue,” “anticipate,” “intend,” “should,” “plan,” “expect” and similar expressions, as they relate to us, are intended to identify forward-looking statements. We have based these forward-looking statements largely on our current expectations and projections about future events and financial trends that we believe may affect our financial condition, results of operations, business strategy and financial needs. These forward-looking statements are subject to a number of risks, uncertainties and assumptions described in “Risk Factors” in Part I, Item 1A below, and elsewhere in this Form 10-K, including, among other things: future demand for our products may be lower than anticipated; consumers may choose not to adopt our new product offerings or adopt competing products; the actual price, performance and ease of use of our products may not meet the price, performance and ease of use requirements of consumers; our dependence on certain significant customers; our reliance on a limited number of third-party suppliers and manufacturers; new cyber threats may challenge the effectiveness or threaten the security of our products; and our business strategies and development plans may not be successful. In light of these risks, uncertainties and assumptions, the forward-looking events and circumstances discussed in this Form 10-K may not occur and actual results could differ materially from those anticipated or implied in the forward-looking statements. All forward-looking statements in this Form 10-K are based on information available to us as of the date hereof, such information may be limited or incomplete, and we assume no obligation to update any such forward-looking statements. These statements are inherently uncertain and investors are cautioned not to unduly rely upon these statements. The following discussion should be read in conjunction with our consolidated financial statements and the accompanying notes contained in this Form 10-K.
Risk Factors Summary
The following is a summary of some of the risks and uncertainties as of the date of the filing of this Annual Report on Form 10-K that could materially adversely affect our business, financial condition and results of operations. You should read this summary together with the more detailed description of each risk factor contained below.
Risks Related to our Business, Industry and Operations
•Optimizing our channel partners' inventory levels and product mix within the current environment is challenging, and we have, and may in the future, incur costs associated with excess inventory, or lose sales from having too few products.
•To remain competitive and stimulate consumer and business demand, we must successfully manage new product introductions and transitions of products and services.
•Investment in new business strategies could disrupt our ongoing business, present risks not originally contemplated and materially adversely affect our business, reputation, results of operations and financial condition.
•We rely on a limited number of traditional and online retailers, wholesale distributors and service provider customers for a substantial portion of our sales, and our net revenue could decline if they refuse to pay our requested prices or reduce their level of purchases, if there are unforeseen disruptions in their businesses, or if there is significant consolidation in our customer base that results in fewer customers for our products.
•We obtain several key components from limited or sole sources.
•Some of our competitors have substantially greater resources than we do, and to be competitive we may be required to lower our prices or increase our sales and marketing expenses, which could result in reduced margins or loss of market share and revenue.
•We depend substantially on our sales channels, and our failure to maintain and expand our sales channels would result in lower sales and reduced net revenue.
•We depend on a limited number of third-party manufacturers for substantially all of our manufacturing needs.
•Our sales and operations in international markets have exposed us to and may in the future expose us to operational, financial and regulatory risks.
•We depend on large, recurring purchases from certain significant customers, and a loss, cancellation or delay in purchases by these customers could negatively affect our revenue.
•The average selling prices of our products typically decrease rapidly over the sales cycle of the product, which may negatively affect our net revenue and gross margins.
•If we fail to overcome the challenges associated with managing our broadband service provider sales channel, our net revenue and gross profit will be negatively impacted.
•We expect our operating results to fluctuate on a quarterly and annual basis, which could cause our stock price to fluctuate or decline.
•Changes in trade policy in the United States and other countries, including the imposition of tariffs and the resulting consequences, may adversely impact our business, results of operations and financial condition.
•If disruptions in our transportation network continue to occur or our shipping costs substantially increase again in the future, we may be unable to sell or timely deliver our products, and our net revenue and gross margin could decrease.
•Expansion of our operations and infrastructure may strain our operations and increase our operating expenses.
•As part of growing our business, we have made and expect to continue to make acquisitions. If we fail to successfully select, execute or integrate our acquisitions, then our business and operating results could be harmed and our stock price could decline.
•We invest in companies primarily for strategic reasons but may not realize a return on our investments.
Risks Related to Our Products, Technology, Intellectual Property and Data
•We rely upon third parties for technology that is critical to our products, and if we are unable to continue to use this technology and future technology, our ability to develop, sell, maintain and support technologically innovative products would be limited.
•Product security vulnerabilities, system security risks, data protection breaches, cyber-attacks, improper use of artificial intelligence (“AI”) tools, and other threats and risks, could disrupt or otherwise compromise our products, services, internal operations or information technology systems, or those of third parties with whom we work. Actual or perceived non-compliance with our privacy and security obligations could lead to regulatory investigations or actions, litigation, fines and penalties, business operation disruption, reputational harm, loss of revenue or profits, loss of customers or sales, and other adverse business consequences.
•If we are unable to successfully leverage AI technology to automate and drive efficiencies in our operations and products and services, our business, reputation, results of operations and financial condition could be harmed.
•We make substantial investments in software research and development and unsuccessful investments could materially adversely affect our business, financial condition and results of operations.
•If our products contain defects or errors, we could incur significant unexpected expenses, experience product returns and lost sales, experience product recalls, suffer damage to our brand and reputation, and be subject to product liability or other claims.
•Our user growth, engagement, and monetization of our subscription services depend upon effective operation with mobile operating systems, networks, technologies, products, and standards that we do not control.
•If we are unable to secure and protect our intellectual property rights, our ability to compete could be harmed.
Financial, Legal, Regulatory and Tax Compliance Risks
•We are currently involved in litigation matters and may in the future become involved in additional litigation.
•We have been exposed to and may in the future be exposed to adverse currency exchange rate fluctuations in jurisdictions where we transact in local currency, which could harm our financial results and cash flows.
•We are exposed to the credit risk of some of our customers and to credit exposures in weakened markets.
•Changes in tax laws or exposure to additional income tax liabilities could affect our future profitability.
•We are subject to, and must remain in compliance with numerous new, existing and changing laws and regulations worldwide.
•We must comply with indirect tax laws in multiple jurisdictions, as well as complex customs duty regimes worldwide. Audits of our compliance with these rules may result in additional liabilities for taxes, duties, interest and penalties related to our international operations which would reduce our profitability.
•We are exposed to credit risk and fluctuations in the market values of our investment portfolio.
•Governmental regulations of imports or exports affecting Internet security could affect our net revenue.
•If our goodwill becomes impaired, as occurred in 2022, we may be required to record a significant charge to earnings.
General Risk Factors
•If we lose the services of our key personnel, we may not be able to execute our business strategy effectively.
•Global economic conditions could materially adversely affect our revenue and results of operations.
•Political events, war, terrorism, public health issues, natural disasters, sudden changes in trade and immigration policies, and other circumstances could materially adversely affect us.
•Our stock price has experienced recent volatility and may be volatile in the future and your investment in our common stock could suffer a decline in value.
•We are required to evaluate our internal controls under Section 404 of the Sarbanes-Oxley Act of 2002 and any adverse results from such evaluation could impact investor confidence in the reliability of our internal controls over financial reporting.
Additional factors that could affect our businesses, results of operations and financial condition are discussed in Forward-Looking Statements in MD&A. However, other factors not discussed below or elsewhere in this Annual Report on Form 10-K could also adversely affect our businesses, results of operations and financial condition. Therefore, the risk factors below should not be considered a complete list of potential risks that we may face.
Any risk factor described in this Annual Report on Form 10-K or in any of our other SEC filings could by itself, or together with other factors, materially adversely affect our liquidity, competitive position, business, reputation, results of operations, capital position or financial condition, including by materially increasing our expenses or decreasing our revenues, which could result in material losses.
Item 1. Business
General
We are a global leader in innovative and advanced networking technologies for businesses, homes, and service providers. We deliver a wide range of intelligent solutions designed to unleash the full potential of connectivity. Through 2024, we operated and reported in two segments: NETGEAR for Business and Connected Home. The NETGEAR for Business segment offers reliable, easy-to-use, high-performance networking solutions, including switches, routers, access points, software, and AV over IP technologies, tailored to meet the diverse needs of organizations of all sizes. The Connected Home segment offers advanced connectivity, powerful performance, and enhanced security features right out of the box, designed to help keep families safe online, whether at home or on the go, including high-performance, dependable and easy-to-use premium WiFi networking solutions such as 4G/5G mobile products, WiFi 7 Tri-band and Quad-band mesh systems and routers, WiFi 6E, WiFi 6, and subscription services that provide consumers a range of value-added services focused on performance, security, privacy and premium support. We conduct business across three geographic territories: Americas; Europe, Middle East and Africa (“EMEA”); and Asia Pacific (“APAC”).
As we announced in February 2025, beginning with the first quarter of 2025, the Connected Home segment will be separated into two segments, consisting of Mobile and Home Networking, in order to further strengthen operational and financial management and enable further focus on growth opportunities while maintaining financial discipline. Following this separation, the Company will operate and report in three segments: NETGEAR for Business, Mobile and Home Networking.
In the years ended December 31, 2024, 2023, and 2022, we generated net revenue of $673.8 million, $740.8 million, and $932.5 million, respectively.
Markets
Our mission is to unleash the full potential of connectivity with intelligent solutions that delight and help protect businesses, consumers and service providers. Factors driving the demand for high-performance products within these markets include the growing need for always on, high speed internet connectivity anywhere and with exceptional security features, the availability of faster internet speeds and new WiFi standards such as WiFi 7 and the growth of bandwidth-hungry applications such as 8K video streaming and gaming, real time streaming of entertainment and cultural events, collaborative platforms that support the transfer of very large data sets and immersive experiences as well as artificial intelligence (“AI”), augmented reality (“AR”) and virtual reality (“VR”) applications.
With the availability of increasingly fast and ubiquitous internet, the proliferation of IoT devices and the rise of generative AI, also comes a steep increase in malware, data theft, intrusion and other cyber threats necessitating comprehensive yet simple to use solutions. Founded and based in the USA since 1996, NETGEAR has had a longstanding commitment to security and privacy. Rigorous security protections are built into our hardware and software, and we make further protections available to consumers via our Armor service, all of which are backed by our ongoing mission to respect and bolster the protection of customer privacy and personal information.
As employees continue to return to the office in various ways, the need for reliable networking, both IT and AV, put pressure on businesses to enhance network availability and create equal and engaging experiences for customers and employees whether they are onsite or not. Business customers are looking for innovative, dependable IT and AV networking solutions to maximize productivity, streamline operations, and provide flawless experience for employees, customers and partners. They find that these critical benefits not only help them to focus on their core business, but also give them a competitive edge in today’s hyper-connected world. To achieve their goals, they seek a trusted partner that delivers customer-centric technologies that are easy to deploy, manage, and scale, backed by expert support for maximum uptime and reliability. Investing in our AV switches and management software and our Total Network Solution for IT networking provides value beyond the products themselves. With included design services, training and dedicated support, NETGEAR business solutions are integral to the success of many of our customers and partners.
Consumers with large numbers of connected devices and fast broadband subscriptions are investing in our broad range of offerings, such as our Orbi WiFi, WiFi 7 Tri-band and Quad-band Mesh products, our lineup of Nighthawk standalone WiFi 7 routers and Nighthawk 5G and WiFi 7 mobile hotspots. While there is always a need for point solutions that enhance or extend the functionality provided by internet service providers (“ISPs”), there is also a growing demand for WiFi networking products that combine the newest WiFi standards with elegant design, excellent security features and a seamless app experience to accommodate the end-to-end networking needs of homes that are becoming increasingly smarter. And, in an environment that makes it possible for people to work or learn from anywhere, digital nomads, road warriors, vacationers, and even those living in rural areas without access to reliable wired broadband, need robust mobile solutions with embedded security features to support their online lives. End users desiring faster WiFi speeds, capacity for more devices and lower latency than ever before also often lack the technical skills or resources to fully realize these capabilities, making “plug and play” setup and ease of use priorities. Consumers and businesses also prefer the convenience of obtaining networking solutions from a single company and a positive customer experience has shown to produce brand loyalty. We recognize that customers see reliability, usability, security and performance as key factors when purchasing products and services. To provide desirable products and services at attractive prices, we focus on the unique requirements of these markets, and exercise strong operational discipline.
Sales Channels
We sell our products through multiple sales channels worldwide, including wholesale distributors, traditional and online retailers, direct market resellers (“DMRs”), value-added resellers (“VARs”), broadband service providers and through our direct online store at www.netgear.com.
Wholesale Distributors. Our distribution channel supplies our products to retailers, e-commerce resellers, DMRs, VARs and broadband service providers. We sell directly to our distributors, the largest of which are Ingram Micro, Inc., TD Synnex, and D&H Distributing Company.
Retailers. Our retail channel primarily supplies products that are sold into the consumer market. However, increasingly we are seeing products designed for businesses move through these channels. We sell directly to, or enter into consignment arrangements with, a number of our traditional retailers, increasingly leveraging their online presence in addition to their in-store space and online retailers. The remaining traditional retailers, as well as our online retailers, are fulfilled through wholesale distributors. We work directly with our retail channels on market development activities, such as co-advertising, online promotions and video demonstrations, instant rebate programs, event sponsorship and sales associate training. Our largest retailers include Amazon.com, Inc, Best Buy Co., Inc., Wal-Mart Stores, Inc. and their respective affiliates.
DMRs and VARs. We sell into the business marketplace through an extensive network of DMRs and VARs. Our DMRs include companies such as CDW Corporation and Insight Corporation. VARs include our network of registered NETGEAR Solution Partners. DMRs and VARs may receive sales incentives, marketing support and other program benefits from us. Our DMRs and VARs generally purchase our products through our wholesale distributors and audio-visual manufacturers that purchase our switches to include in their complete solutions.
Broadband Service Providers. We also supply directly to broadband service providers in the United States and internationally providing DSL, WiFi and 4G/5G mobile broadband products. Service providers supply our products to their business and home subscribers. Our largest broadband service providers include AT&T and Telstra.
Direct Online Store. We sell directly online at www.netgear.com in the United States and internationally to consumers and businesses. Through our direct online store, we provide high-performance and premium networking and internet connected products and subscription services, some of which are only available at www.netgear.com. The direct online store also allows us to deliver curated rich content to supplement the purchase journey of customers, in addition to establishing a direct relationship with our customers. NETGEAR.com is a destination where we deliver to early tech adopters and inexperienced audiences alike a premium and comprehensive product and brand experience. Our largest direct partners include Crestron, Q-Sys, Savant, Biamp, and Sonos.
The largest portion of our net revenues was derived from the Americas, representing approximately 68%, 68% and 66% of net revenue in the years ended December 31, 2024, 2023 and 2022, respectively. We have continuously committed resources to our international operations and sales channels. Accordingly, we are subject to a number of
risks related to international operations such as macroeconomic and microeconomic conditions, geopolitical instability, governmental regulations, preference for locally branded products, exchange rate fluctuations, increased difficulty in managing inventory, challenges of staffing and managing foreign operations, the effect of international sales on our tax structure, and changes in local tax laws. For further information regarding these risks, refer to Item 1A, Risk Factors, of Part I of this Annual Report on Form 10-K.
For information regarding our significant customers, refer to Note 11, Segment Information, in Notes to Consolidated Financial Statements in Item 8 of Part II of this Annual Report on Form 10-K.
Product Offerings
Our goal is to power extraordinary experiences where people collaborate and connect to a world of information and innovation. Our highly differentiated connected solutions range from switching and wireless products to augment business networks and audio and video (“AV”) over Ethernet for Pro AV applications to our good, better, and best WiFi solutions, security and support services to protect and enhance business and home networks. Additionally, we continually invest in research and development to create new technologies and services and to capitalize on technological inflection points and trends, such as audio and video over Ethernet, multi-Gigabit internet service to homes, WiFi 7, eSIM and future technologies. Our product line helps to create and extend wired and wireless networks as well as devices that attach to the network, such as services that complement and enhance our product line offerings. These products are available in multiple configurations to address the changing needs of our customers in each geographic region.
NETGEAR for Business. Includes Pro AV, Total Network Solutions, which offer a complete IT network solution for a small and medium enterprise including WiFi, Switching, Routing and Security through channel partners, and Unmanaged and Plus Ethernet switches, which are comprised of devices that connect IT equipment within a Local Area Network (“LAN”). These products and services are sold into the business marketplace through an extensive network of DMRs and VARs, NETGEAR.com, and through brick-and-mortar retail and e-commerce channels and include:
Pro AV
•Pro AV Solutions: devices that include high-performance, flexible Ethernet switches that are engineered for easy configuration of AV over IP for both commercial and high-end residential installations, and switches that allow connecting network equipment and WiFi access points to the network; and
•NETGEAR Engage Controller: used to provide quick, profile-based configuration for audio and video over an IP network to integrate our products with those from a myriad of AV end point manufacturers for fast, easy deployments that help eliminate cost and complexity.
Total Network Solution
•Pro Routers: devices that provide the internet gateway for businesses and combine with access points, Ethernet switches, and our Insight cloud management software to create a Total Network Solution for businesses;
•Enterprise-grade, Cloud managed or standalone Pro WiFi access points: used to provide wide coverage areas and fast WiFi for businesses of varying sizes, and to provide secure WiFi connections to various devices; and
•NETGEAR Insight remote management software: helps VARs and small businesses remotely deploy, monitor, manage and secure their networks easily and seamlessly.
Unmanaged and Plus Ethernet Switches
•General purpose Ethernet switches (in a wide range of sizes): used to connect equipment, devices, or WiFi access points to the network for exchanging information.
Connected Home. Includes Mobile Broadband Access products, and Customer Premise Equipment, which is comprised of home networking devices that consumers use for high-speed internet connectivity and Wi-Fi in home and small businesses. They are sold primarily via our direct online store as well as traditional retailers, increasingly leveraging their online presence, in addition to their brick-and-mortar stores, and service provider channels and include:
Mobile Broadband Access products
•Mobile Hotspots: portable battery-powered Wi-Fi access points that allow users to connect their devices to the internet using a cellular connection.
Customer Premise Equipment
•WiFi routers: devices that connect to a modem to enable wireless Internet connectivity;
•WiFi Mesh Systems: devices with one main Wi-Fi router and multiple additional Wi-Fi nodes that work together, i.e. a local area network (“LAN”), to provide extensive coverage under a unified network;
•Broadband modems: devices that convert the broadband signals into Ethernet data that feeds internet into homes and small businesses;
•WiFi Gateways: WiFi routers with an integrated broadband modem, for broadband internet access; and
•Network accessories: WiFi range extenders, which extend the range of an existing WiFi network to eliminate WiFi dead spots; Powerline adapters, which extend wired and WiFi internet connections to any AC outlet using existing electrical wiring; and WiFi network adapters, which enable computing devices to be connected to the network via WiFi.
Services
•Value-added service offerings such as security and privacy, technical support, and parental controls for consumers.
Our products and services are designed to meet the specific needs of the business, consumer, and service provider markets. We tailor various elements of the software interface, product design, including component specification, physical characteristics such as casing, design and coloration, and specific user interface features to meet the needs of these markets. We also leverage many of our technological developments, high volume manufacturing, technical support and engineering infrastructure across our markets to maximize business efficiencies.
Our products that target the business market are generally designed with an industrial appearance, including metal cases and, for some product categories, the ability to mount the product within standard data networking racks as well as unique mounting solutions for other uses. These products typically include higher port counts, higher data transfer rates and other performance characteristics designed to meet the needs of a modern business. For example, our business products provide data transfer rates up to 100 gigabits per second to meet the higher capacity requirements. Our newest Power over Ethernet (“PoE”) switches, including cloud managed and unmanaged switches, provide elevated power budgets and uninterrupted PoE power for businesses of all sizes to address the growing need for deployment of multiple PoE devices with more power, due to the widespread adoption of IP communication, security cameras, WiFi access points, proximity sensors, and various other new applications. Some of these products are also designed to support transmission modes such as fiber optic cabling, which is common in more sophisticated business environments. We continue to see a shift from traditional AV applications utilizing HDMI technology to Ethernet switching driven by a transition from the 1080p to 4K to 8K resolution video, and broadcast moving towards multicast streaming. IP provides an economical path to building high performance, scalable AV networks. As a result of the hybrid work model, there continues to be a shift in demand and use cases for NETGEAR for Business products as more small businesses now run out of homes or remote offices. This shift has contributed to growing the market for lower port count switches and our NETGEAR for Business wireless offerings.
Security requirements within our products for business broadband access include firewall and VPN capabilities to aid in securing interactions between remote offices and business headquarter locations over the internet. Our
connectivity product offerings for the business market include enhanced security features and remote configurability often required in a business setting.
Our vision for the business network is to deliver differentiated, reliable, easy to use, high performance and/or customized solutions. We believe that the need for cost efficient and easy-to-use video surveillance by small businesses and corporate offices will continue to grow and fuel the growth of our PoE(+/++) market, with its ability to power 4K cameras. These trends will place a greater demand on business networks. To meet this demand, we are introducing next-generation technology, such as: PoE switches, Multi-gigabit Ethernet switches, small to medium capacity campus wireless LAN, audio and AV over IP for Pro AV applications in both commercial and residential applications. In addition, our Insight line of cloud-connected networking devices can be managed remotely via mobile apps or browser interfaces, providing continuous monitoring and instantaneous fault notification.
Our vision for the home network is to build a NETGEAR mobile product range with “good, better, best” devices to improve the user experience, as well as to deliver a seamless and integrated experience that is built off our foundation of best-in-class in-home connectivity, thus creating a Smart Environment. Our Connected Home business is implementing a long-term execution plan to drive significant valuation creation. Our focus is to position NETGEAR to capture incremental hardware revenue in growing categories, such as mobile hotspots, and grow areas that are the basis of smart homes, as well as subscription and software IP unique to or patented by NETGEAR.
Competition
The business, consumer, and service provider markets are intensely competitive and subject to rapid technological change. We expect competition to continue to intensify. Our principal competitors include:
•within the business markets, companies such as Allied Telesys, Arista, Barracuda, Buffalo, Cisco Systems, Dell, D-Link, Extreme, Fortinet, Hewlett-Packard Enterprise Aruba, Juniper Networks Mist, Mellanox (owned by Nvidia), Palo Alto Networks, QNAP Systems, Ruckus (owned by CommScope), SonicWall, Snap AV, Synology, TP- Link, TRENDnet, Ubiquiti, and WatchGuard;
•within the consumer markets, companies such as ARRIS, ASUS, AVM, Devolo, D-Link, Eero (owned by Amazon), Linksys (owned by Foxconn), Minim (Motorola licensee), Google WiFi, Samsung, and TP- Link; and
•within the service provider markets, companies such as Actiontec, Airties, Arcadyan, ARRIS, ASUS, AVM, Compal Broadband, D-Link, Eero (owned by Amazon), Franklin, Google, Hitron, Huawei, Inseego, Nokia, Orbic, Plume, Sagem, Sercomm, Sonim, SMC Networks, TechniColor, TP-Link, Ubee, ZTE and ZyXEL. Other competitors include numerous local vendors such as Xiaomi in China, AVM in Germany and Buffalo in Japan.
Our potential competitors include other consumer electronics vendors, including Apple, Lifelock, LG Electronics, McAfee, Microsoft, Panasonic, Sony, Toshiba and Vizio, who could integrate networking and streaming capabilities into their line of products, such as televisions, set top boxes and gaming consoles, and our channel customers who may decide to offer self-branded networking products. We also face competition from ISPs who may bundle a free networking device with their broadband service offering, which would reduce our sales if we were not the supplier of choice to those service providers. In the service provider space, we also face significant and increased competition from original design manufacturers (“ODMs”) and contract manufacturers (“CMs”) who are selling and attempting to sell their products directly to service providers around the world.
Many of our existing and potential competitors have longer operating histories, greater name recognition and substantially greater financial, technical, sales, marketing and other resources. As a result, they may have more advanced technology, larger distribution channels, stronger brand names, better customer service and access to more customers than we do. For example, Hewlett-Packard Enterprise has significant brand name recognition and has an advertising presence substantially greater than ours. Similarly, Cisco Systems is well recognized as a leader in providing networking products to businesses, while Amazon competes in the consumer WiFi product market, and has substantially greater financial resources than we do. Several of our competitors, such as TP-Link, offer a range of products that directly compete with most of our product offerings. Several of our other competitors compete in a more limited manner. For example, Dell sells networking products primarily targeted at larger businesses or enterprises while Amazon primarily only sells WiFi mesh systems. The competitive environment in which we operate changes
rapidly due to technological reasons and other factors outside of our control, such as new entrants to the market and the ability of market participants to adapt to changing environments. Other companies with significant resources could also become direct competitors, either through acquiring a competitor or through internal efforts.
We believe that the principal competitive factors in the business, consumer, and service provider markets for networking products include product breadth, price points, brand name, security and privacy, performance, features, functionality and reliability, product availability, timeliness of new product introductions, size and scope of the sales channel, ease-of-installation, maintenance and use, and customer service and support. We believe our products are competitive in these markets based on these factors. To remain competitive, we believe we must continue to aggressively invest resources in highly differentiated, “good, better, best”, high performance reliable and trusted connectivity solutions, complemented by valuable subscription services, expanding our sales channels including our direct-to-consumer capabilities and custom installers, increasing engagement with our customers and manufacturing partners, and maintaining customer satisfaction worldwide. Our investments reflect our enhanced focus on the security of our products and systems, as the threat of cyber-attacks and exploitation of potential security vulnerabilities in our industry is on the rise and is increasingly a significant concern for consumers and governments alike.
Research and Development
Our success depends on our ability to develop products that meet changing user needs and to anticipate and proactively respond to evolving technology in a timely and cost-effective manner. Accordingly, we have made investments in our research and development department in order to effectively evaluate existing and new third-party technologies, develop existing and new in-house technologies, and develop and test new products and services. Our research and development employees work closely with our technology and manufacturing partners to bring high quality new products and services to market in a timely and cost-efficient manner.
We identify, qualify and create new technologies to develop products using one or both of the methodologies described below. Under both ODM and In-House development, we develop portions of the software on some products, including embedded firmware or components of firmware, mobile applications, and cloud software.
ODM. Under the ODM methodology, we define the product concept and specifications and recommend the technology selection. We then coordinate with our technology suppliers as they develop the product, meeting our specifications, while our internal software engineering team typically works with our service partners to develop the software services that run on these devices. On certain new products, one or more subsystems of the design can be done in-house and then integrated with the remaining design pieces from the ODM. Once prototypes are completed, we work with our partners to complete the debugging and systems integration and testing. After completion of the final tests, agency approvals and product documentation, the product is released for production and shipment.
In-House Development. Under the in-house development model, one or more subsystems of the product are designed and developed utilizing the NETGEAR engineering team. Under this model, some of the primary technology is developed in-house. We then work closely with either an ODM or a Joint Development Manufacturer (“JDM”) to complete the development of the entire design, perform the necessary testing, and obtain regulatory approvals before the product is released for production and shipment.
Manufacturing
Our primary manufacturers are Cloud Network Technology (more commonly known as Hon Hai Precision or Foxconn Corporation), Delta Electronics Incorporated, Senao Networks, Inc., and Pegatron Corporation, all of which are headquartered in Taiwan. We also manufacture in Haiphong, Vietnam at a facility owned by Shenzhen Gongjin Electronics Co., Ltd. (more commonly known as T&W), which is headquartered in China. We distribute our manufacturing among a limited number of key suppliers and seek to avoid excessive concentration with any one single supplier. Any disruptions from natural disasters, health epidemics and political, social and economic instability would affect the ability of our manufacturers to manufacture our products. If our manufacturing or warehousing facilities are disrupted or destroyed, we would not have readily available alternatives for manufacturing our products and our business would be significantly impacted. In addition to their responsibility for the manufacturing of our products, our manufacturers typically purchase all necessary parts and materials to produce finished goods. Our own product quality organization based in Singapore and Taiwan is responsible for auditing and inspecting product quality on the premises of our ODMs to maintain quality standards for our suppliers.
We obtain several key components from limited or sole sources. These include many of the semiconductors used in our products, which are designed specifically for the products and obtained from sole source suppliers on a purchase order basis like switching fabric semiconductors used in our Ethernet switches and internet gateway products; wireless local area network chipsets used in our wireless products and mobile network chipsets which are used in our wireless gateways and hotspots. We also have limited sources for components including connector jacks, plastic casings and physical layer transceivers. Our third-party manufacturers generally purchase these components on our behalf on a purchase order basis. If these sources fail to satisfy our supply requirements or component lead times deviate from expectations, our ability to meet scheduled product deliveries would be harmed and we may lose sales and experience increased costs to procure supply.
We currently outsource warehousing and distribution logistics to four main third-party providers who are responsible for warehousing, distribution logistics and order fulfillment. In addition, these parties are also responsible for some configuration and re-packaging of our products including bundling components to form kits, inserting appropriate documentation, disk drive configuration, and adding power adapters. APL Logistics Americas, Ltd. in City of Industry, California serves the Americas region, Kerry Logistics Ltd. in Singapore serves the Asia Pacific region, DSV Solutions B.V. Netherlands serves the EMEA region, and Likewize Logistics Pty Ltd. in Sydney, Australia serves Australia and New Zealand.
Sales and Marketing
We work directly with our retail partners and value-added resellers (VARs) on market development activities, such as co-advertising, online promotions and video demonstrations, live and virtual event sponsorships and sales associate training. We also participate in major industry trade shows and marketing events alone and alongside many of our Pro AV and Broadcast manufacturing partners. Our marketing department is comprised of channel marketing, product marketing and corporate marketing groups.
Our channel marketing team focuses on working with the sales teams to maximize our participation in channel partner marketing activities and merchandise our products both online and in store.
Our product marketing group focuses on product and service messaging and strategy, product and service development roadmaps, new product introductions, product lifecycle management, demand assessment and competitive analysis. The group works closely with our sales and research and development groups to align our product development roadmap to meet customer technology demands from a strategic perspective. The group also ensures that product and services development activities, product and services launches, and ongoing demand and supply planning for our products occur in a well-managed, timely manner in coordination with our development, manufacturing, and sales groups, as well as our ODM and sales channel partners.
Our corporate marketing group is responsible for defining and building our corporate brand, supporting the business units with creative marketing strategies and driving awareness, education and demand for our products by way of our online and in-app platforms. The group focuses on defining our brand promise and marketing messages on a worldwide basis. This group is also responsible for targeted full-funnel marketing, including paid, earned and owned channels; delivering a seamless purchase journey reaching and acquiring new customers as well as leveraging our loyal customers to advocate for the NETGEAR brand. Marketing tactics include driving the social media and online marketing strategy, public relations, installed base marketing programs, community engagement programs, sponsorships and events, and corporate websites worldwide, as well as creative production for all product categories.
We conduct most of our international sales and marketing operations through wholly owned subsidiaries, which operate via sales and marketing subsidiaries and branch offices worldwide.
Customer Support
We design our products with ease-of-use top of mind. We respond globally to customer inquiries through a variety of channels including phone, chat, community, social media, and email. Customers can also get self-help service through the comprehensive knowledge base, AI chatbot and user forums on our website, and apply AI to optimize support searches. Customer support is provided through a combination of a limited number of permanent employees and use of outsourced agents. Our permanent employees design our technical support model and process and are responsible for training and managing our vendors and their agents. They also handle escalations from the
outsourced agents. We utilize the information gained from customer interactions to enhance our product offerings, including further simplifying the installation process.
Intellectual Property
We believe that our continued success will depend primarily on the technical expertise, speed of technology implementation, creative skills and management abilities of our officers and key employees, plus ownership of a limited but important set of copyrights, trademarks, trade secrets and patents. We primarily rely on a combination of copyright, trademark, trade secret, and patent laws, nondisclosure agreements with employees, consultants and suppliers and other contractual provisions to establish, maintain and protect our proprietary rights. We hold approximately 152 issued United States patents that expire between years 2025 and 2040 and 22 foreign patents that expire between 2025 and 2035. No single patent is solely responsible for protecting the Company's products and services. In addition, we currently have approximately 14 pending United States and foreign patent applications related to technology and products offered by us. We also rely on third-party licensors for patented hardware and software license rights in technology that are incorporated into and are necessary for the operation and functionality of our products. Our success will depend in part on our continued ability to have access to these technologies.
We have trade secret rights for our products, consisting mainly of product design, technical product documentation and software. We also own, or have applied for registration of trademarks, in connection with our products in the United States and internationally, including NETGEAR, NETGEAR Armor, NETGEAR Insight, NPG, NPG logo, Orbi, Nighthawk, FASTLANE3, Meural, Trueart, Digital Canvas, and ProSafe.
We have registered a number of internet domain names that we use for electronic interaction with our customers including dissemination of product information, marketing programs, product registration, sales activities, and other commercial uses.
Seasonal Business
We have historically experienced increased net sales in our third and fourth fiscal quarters as compared to the first and second quarters in our fiscal year due to seasonal demand from consumer markets primarily relating to the beginning of the school year and the holiday season. In recent years, we had a flatter trend than we historically observe. The higher net sales in our third and fourth quarters of 2024 was also driven by our work with our channel partners to optimize their inventory carrying levels in the first half of 2024.
Governmental Regulations
Environmental Laws
Our products and manufacturing process are subject to numerous governmental regulations, which cover both the use of various materials as well as environmental concerns. Environmental issues such as pollution and climate change have had significant legislative and regulatory effects on a global basis, and there are expected to be additional changes to the regulations in these areas. These changes could directly increase the cost of energy, which may have an impact on the way we manufacture products or utilize energy to produce our products. In addition, any new regulations or laws in the environmental area might increase the cost of raw materials we use in our products and the cost of compliance. Other regulations in the environmental area may require us to continue to monitor and ensure proper disposal or recycling of our products. To the best of our knowledge, we maintain compliance with all current government regulations concerning our production processes and product disposal in the locations where we operate and sell. Since we operate on a global basis, this is a complex process that requires continual monitoring of regulations and compliance efforts to ensure that we, and our suppliers, are in compliance with all existing regulations.
Other Regulations
As a company with global operations, we are subject to complex foreign and U.S. laws and regulations, including trade regulations, tariffs, import and export regulations, anti-bribery and corruption laws, antitrust or competition laws, data privacy laws, such as the EU General Data Protection Regulation (the “GDPR”), and environmental regulations, among others. We have policies and procedures in place to promote compliance with these laws and regulations. To date, our compliance actions and costs relating to these laws, rules and regulations have not resulted in a material cost
or effect on our capital expenditures, earnings or competitive position. Government regulations are subject to change, and accordingly we are unable to assess the possible effect of compliance with future requirements or whether our compliance with such regulations will materially impact our business in the future. For further discussion of how government regulations may affect our business, see the related discussion in “Risk Factors – Financial, Legal, Regulatory and Tax Compliance Risks, Including Recent Impairment Charges.”
Human Capital
As of December 31, 2024, we had 655 full-time employees, with 223 in sales, marketing and technical support, 235 in research and development, 76 in operations, and 121 in finance, information systems and administration. We also utilize a number of temporary staff to supplement our workforce. At NETGEAR, we believe in the power of open communication up, down and across the organization and consider our relationship with our employees to be good. We have not experienced any labor disputes. Some of our key human capital management programs are summarized below.
Culture and Engagement
At NETGEAR, our talent philosophy provides a guiding framework for the talent management practices that drive the achievement of our business strategy. It is rooted in the belief that our capacity to win is directly linked to the capabilities, experience and ideas that our people bring to bear on behalf of the Company. By fostering an environment where performance and behaviors are of equal importance, we aim to transform our business and achieve exceptional results. Our approach is multi-faceted, with core principles focusing on performance differentiation, values –aligned behaviors, transparency, accountability, capability and development.
A high-performance culture, fueled by sustained impactful performance at every level across the organization is a key focus. We believe that every team member has the potential to contribute significantly to our company's success, and we set exceptionally high standards of performance, making it the baseline expectation. To enable impactful performance, we have established clear performance metrics and objectives that align with our strategic goals. By setting high standards, which increase in line with level in the organization, and providing the necessary support, we empower our employees to excel and drive the business forward.
Our company Values are Dare to Transform, Connect and Delight, Communicate Courageously, and Win It Together. These values form the foundation of our company culture. By embodying these principles, we strive to create an environment that fosters innovation, collaboration, open and transparent communication and a relentless focus on customer satisfaction. We believe that our commitment to these values enables us to navigate the ever-changing landscape of technology and consistently deliver exceptional products and services to our customers.
We expect our employees to embody our core values in their daily actions and decisions. This values alignment ensures employees understand the types of actions that drive our purpose and mission, and that we maintain a cohesive and positive workplace culture which is essential for achieving our long-term objectives. A demonstrated commitment to our Company values has a meaningful impact on employees’ performance ratings, progression and rewards. By recognizing and rewarding values-aligned behaviors, we reinforce their importance within our organization.
In addition, we are focused on creating clarity and opportunities for our employees to grow and develop. With talent programs that include standardized job levels and expectations, regular feedback and coaching, dual career tracks, competency-based career frameworks, leadership development, skill building and training support, we strive to create a high-performance culture and an environment where employees can grow, develop and build a great career.
Compensation and Benefits
Our compensation philosophy is critical to fostering a performance-driven culture and is based on pay for performance. We strive to provide our employees with compensation and rewards that are market-competitive, and incentivize and reward high performance. We offer a wide variety of benefits for employees around the world and invest in tools and resources that are designed to support our employees’ individual growth and development.
Talent Acquisition and Development
Our global Talent Acquisition strategy focuses on attracting top talent through a variety of channels including direct recruiting via our internal team, leveraging technology and tools, employee referral programs and university partnerships. Strategic skill-based hiring based on core competencies as well as culture-add & values alignment assessment are key elements in ensuring that we attract the right people for the right roles at the right time.
In addition to the elements already outlined, our Learning and Development strategy is focused on implementing learning solutions that address key challenges and deliver quantifiable value and impact to help drive our organization strategy and goals.
Safety, Health and Wellbeing
We strive to safeguard the safety, health and well-being of all members of our team. In addition to healthcare benefits, we provide a variety of wellness resources and programs designed to help employees achieve good physical, financial, emotional, intellectual and social well-being.
We monitor our workplace to maintain a clean and safe environment, identify hazards, minimize injury and illness, promote industrial hygiene, provide ergonomic training and equipment, machine safeguarding and more.
Available Information
Our Annual Report on Form 10-K, Quarterly Reports on Form 10-Q, Current Reports on Form 8-K, and amendments to reports filed pursuant to Sections 13(a) and 15(d) of the Securities Exchange Act of 1934, as amended (the “Exchange Act”), are filed with the Securities Exchange Commission (the “SEC”).
Our website address is www.netgear.com. Our website provides a link to our SEC filings, which are available free of charge on the same day such filings are made. The specific location on the website where these reports can be found is http://investor.netgear.com/sec.cfm. Our website also provides a link to Section 16 filings which are available free of charge on the same day as such filings are made. Information contained on these websites is not a part of this Annual Report on Form 10-K.
Information About Our Executive Officers
The following table sets forth the names, ages and positions of our executive officers as of February 7, 2025.
| | | | |
Name | | Age | | Position |
Charles (CJ) Prober | | 53 | | Chief Executive Officer |
Bryan D. Murray | | 50 | | Chief Financial Officer |
Pramod Badjate | | 54 | | President and General Manager, NETGEAR for Business |
Graeme McLindin | | 55 | | Vice President, Mobile |
Charles (CJ) Prober has served as our Chief Executive Officer and a member of the board of directors since January 2024. Prior to joining the Company, Mr. Prober served as President of Life360, Inc. ("Life360"), a technology platform company, from January 2022 to July 2023. He joined Life360 via the acquisition of Tile, Inc. ("Tile"), a technology company, in January 2022 and served as the Chief Executive Officer of Tile from September 2018 to January 2022. Mr. Prober also previously served as a member of Tile’s board of directors from February 2018 to January 2022, including as its Executive Chairman from February 2018 to September 2018. Before then, he served as the Chief Operating Officer of GoPro, Inc. from January 2017 to February 2018 and its Senior Vice President of Software and Services from June 2014 to December 2016. Prior thereto, Mr. Prober held executive leadership roles at Electronic Arts Inc., and prior to his executive leadership roles, Mr. Prober was a consultant with McKinsey & Company and a corporate attorney with Wilson Sonsini Goodrich & Rosati. Mr. Prober currently serves on the boards of directors of Life360 and Glorious Gaming, a private company. Mr. Prober received his Bachelor of Commerce from the University of Manitoba and a Bachelor of Laws from McGill University.
Bryan D. Murray has served as our Chief Financial Officer since August 2018. He has been with NETGEAR since November 2001, serving in various management roles within the finance organization. Prior to assuming the role of CFO, he served as NETGEAR’s Vice President of Finance and Corporate Controller since June 2011. Before joining NETGEAR in 2001, he worked in public accounting at Deloitte and Touche LLP. He holds a B.A. from the University of California, Santa Barbara, and is licensed as a Certified Public Accountant (inactive).
Pramod Badjate has served as our President and General Manager of NETGEAR for Business since July 2024. Before joining NETGEAR, from December 2023 to June 2024, he was an EIR (Entreprneur in Residence) at Storm Ventures, a venture capital firm. From October 2021 to December 2023, he was the Group Vice President and General Manager for the Cognitive Campus business at Arista Networks, a computer networking company. Prior to that, Mr. Badjate served in various engineering and business roles at Ruckus Networks, a networking equipment and software company, from October 2013 to October 2021. Earlier in his career, Pramod held senior engineering roles at Cisco, a leader in enterprise WiFi. He holds a bachelor's degree in engineering from the National Institute of Technology, Karnataka, and a master's in computer science and an MBA from Arizona State University.
Graeme McLindin has served as our Vice President of Mobile since January 2025. He has been with NETGEAR since August 2013, most recently serving as our Vice President of Worldwide Service Provider Sales and Mobile Products from July 2024 to January 2025, Worldwide VP of Service Provider and APAC Sales from October 2023 to July 2024, Worldwide VP of the Service Provider Business Unit from October 2015 to October 2023, and Regional Managing Director, ANZ & SE Asia, Service Provider Business Unit from August 2013 to September 2015. Prior to NETGEAR, Mr. McLindin was the General Manager of Emerging Mobile Devices and General Manager of Wireless Data Products at Telstra for over 5 years and held numerous consultancy roles with SMS (Strategic Management Sciences) Consulting group across Telco, Government and Corporate Enterprises. Mr. McLindin holds a bachelor's degree in applied science from Swinburne University of Technology, Australia and a Post Graduate Diploma in Management from RMIT University, Australia.
Item 1A. Risk Factors
Investing in our common stock involves a high degree of risk. The risks described below are not exhaustive of the risks that might affect our business. Other risks, including those we currently deem immaterial, may also impact our business. Any of the following risks could materially adversely affect our business operations, results of operations and financial condition and could result in a significant decline in our stock price. Before deciding to purchase, hold or sell our common stock, you should carefully consider the risks described in this section. This section should be read in conjunction with the consolidated financial statements and accompanying notes thereto, and Management’s Discussion and Analysis of Financial Condition and Results of Operations included in this Annual Report on Form 10-K.
Risks Related to our Business, Industry and Operations
Optimizing our channel partners' inventory levels and product mix within the current environment is challenging, and we have, and may in the future, incur costs associated with excess inventory, or lose sales from having too few products.
If we are unable to properly monitor and optimize our channel partners' inventory levels and maintain an appropriate level and mix of products with our retail partners and wholesale distributors and within our sales channels, we may incur increased and unexpected costs associated with this inventory. In 2022 and the first half of 2023, many of our retail and service provider partners began significantly reducing their target inventory levels which adversely affected our results of operations. While we see signs of the retail networking market stabilizing, the uncertain macroeconomic environment and high inflation and interest rates are also putting pressure on our NETGEAR for Business channel partners. We have experienced and continue to experience lower revenue as a result of our channel partners lowering their inventory levels and higher cost of carrying excess channel inventory. On the other hand, low channel inventory levels increase the likelihood that our sales channel customers may not be able to fulfill end user demand, leading to delayed or lost sales, unhappy customers and potential impacts to our brand and reputation. Inadequate stock levels could also hinder our ability to fulfill large orders or take advantage of unexpected demand spikes, thereby limiting revenue growth opportunities. Moreover, reductions in target inventory levels put pressure on our ability to accurately forecast customer demand and inventory requirements and increases the likelihood that the accuracy of such forecasts would be lower. We determine production levels based on our forecasts of demand for our products. Actual demand for our products depends on many factors, which makes it difficult to forecast. We have experienced differences between our actual and our forecasted demand in the past and expect differences to arise in the future. If we improperly forecast demand for our products and channel inventory levels, we could end up with too many products and be unable to sell the excess inventory in a timely manner, if at all, or, alternatively we could end up with too few products and not be able to satisfy demand. This problem is exacerbated because we attempt to closely match inventory levels with product demand leaving limited margin for error. Also, during the transition from an existing product to a new replacement product, we must accurately predict the demand for the existing and the new product. If we improperly forecast demand for our products and channel inventory levels, we could incur increased expenses associated with writing off excessive or obsolete inventory, lose sales, incur penalties for late delivery or have to ship products by air freight to meet immediate demand incurring incremental freight costs above the sea freight costs and suffering a corresponding decline in gross margins. For example, when demand for our Connected Home products turns out to be lower than we previously forecasted, it results in our revenue for our Connected Home products to come in lower than expected, as our channel partners in the U.S. replenish inventory slower than they sell through to end users to right size their inventory carrying position based on the lower demand levels than previously expected. In addition, we generally allow wholesale distributors and traditional retailers to return a limited amount of our products in exchange for other products. Under our price protection policy, if we reduce the list price of a product, we are often required to issue a credit in an amount equal to the reduction for each of the products held in inventory by our wholesale distributors and retailers. If our wholesale distributors and retailers are unable to sell their inventory in a timely manner, we might lower the price of the products, or these parties may exchange the products for newer products or decrease their purchases of our products in subsequent periods, which would adversely affect our revenue and results of operations.
To remain competitive and stimulate consumer and business demand, we must successfully manage new product introductions and transitions of products and services.
We operate in a highly competitive, quickly changing environment, and our future success depends on our ability to develop or acquire and introduce new products and services, enhance existing products and services, effectively stimulate customer and business demand for new and upgraded products and services, and successfully manage the transition to these new and upgraded products and services. Our future success will depend in large part upon our ability to identify demand trends in the consumer, business and service provider markets, and to quickly develop or acquire, manufacture and market and sell products and services that satisfy these demands in a cost-effective manner. In order to differentiate our products from our competitors’ products, we must continue to increase our focus and capital investment in research and development and marketing and sales, including software development for our products and complementary services and applications. For example, we previously made a strategic shift to focus on premium, higher margin products and have committed a substantial amount of resources to the development, manufacture, branding, marketing and sale of our Nighthawk mobile hotspot products, Orbi WiFi systems and Pro AV managed switches, and to introducing additional and improved models and services in these lines. In the third quarter of 2023, we launched our first WiFi 7 products, namely the Orbi 97X mesh system and the Nighthawk RS700 router, and will continue to invest in a strong pipeline of WiFi 7 introductions in 2024 across all our major product lines. The success of new products and services depends on a number of factors, including timely and successful development either through rapid innovation or acquisition, market acceptance, our ability to manage the risks and costs, such as investment costs and marketing costs, associated with development and introduction of new products and services, the effective management of purchase commitments and channel inventory levels in line with anticipated product demand, availability of products in appropriate quantities and at expected costs to meet anticipated demand, the risk that new products and services may have delays, quality or other defects or deficiencies and our ability to effectively manage marketing and reviews of our products and services.
In addition, we have acquired companies and technologies in the past and as a result, have introduced new product lines in new markets. We may not be able to successfully manage integration of the new product lines with our existing products. Selling new product lines in new markets will require our management to learn different strategies in order to be successful. We may be unsuccessful in launching a newly acquired product line in new markets which requires management of new suppliers, potential new customers and new business models. Our management may not have the experience of selling in these new markets and we may not be able to grow our business as planned. If we are unable to effectively and successfully further develop these new product lines, we may not be able to increase or maintain our sales and our gross margins may be adversely affected.
Accordingly, if we cannot properly drive customer and business demand, manage future introductions and transitions of products and services, this could result in:
•loss of or delay in revenue and loss of market share;
•negative publicity and damage to our reputation and brand;
•a decline in the average selling price of our products;
•adverse reactions in our sales channels, such as reduced shelf space, reduced channel inventory levels, reduced online product visibility, or loss of sales channels; and
•increased levels of product returns.
In addition, if we are unable to successfully introduce or acquire new products with higher gross margins, or enhance and improve our services and subscription offerings for customer retention or service revenue growth, or if we are unable to improve the margins on our previously introduced and rapidly growing product and services lines, our net revenue and overall gross margin would likely decline.
Investment in new business strategies could disrupt our ongoing business, present risks not originally contemplated and materially adversely affect our business, reputation, results of operations and financial condition.
We have invested, and in the future may invest, in new business strategies and adjust existing business strategies. Such endeavors may involve significant risks and uncertainties, including distraction of management from current operations, greater-than-expected liabilities and expenses, economic, legal and regulatory challenges, inadequate return on capital, potential impairment of tangible and intangible assets, and significant write-offs. Changes in business
strategies are inherently risky and may not be successful. The failure of any significant investment could materially adversely affect our business, reputation, results of operations and financial condition. For example, as mentioned in the risk factor above “To remain competitive and stimulate consumer and business demand, we must successfully manage new product introductions and transitions of products and services”, we previously made a strategic shift to focus on premium, higher margin products and services and we continue to make changes in our business strategies, including pursuing new, adjacent markets. Changes in business strategy would require us to hire in key areas and make certain investments, including marketing; however, such investments may not prove to be successful. Additionally, a significant part of our business strategy and culture is to focus on long-term growth and as a result, our profitability may be lower than it would be if our strategy were to maximize short-term financial results. If we are ultimately unable to improve profitability at the level or during the time frame anticipated by securities or industry analysts and our stockholders, the trading price of our common stock may decline. If we fail to develop and successfully execute on our business strategies, our business, financial condition, results of operations and reputation could be materially adversely affected.
We rely on a limited number of traditional and online retailers, wholesale distributors and service provider customers for a substantial portion of our sales, and our net revenue could decline if they refuse to pay our requested prices or reduce their level of purchases, if there are unforeseen disruptions in their businesses, or if there is significant consolidation in our customer base that results in fewer customers for our products.
We sell a substantial portion of our products through traditional and online retailers, including Best Buy Co., Inc., Amazon.com, Inc. and their affiliates, wholesale distributors, including Ingram Micro, Inc. and TD Synnex, and service providers, such as AT&T. We expect that a significant portion of our net revenue will continue to come from sales to a small number of customers for the foreseeable future. In addition, because our accounts receivable are often concentrated with a small group of purchasers, the failure of any of them to pay on a timely basis, or at all, would reduce our cash flow. We are also exposed to increased credit risk if any one of these limited numbers of customers fails or becomes insolvent. We generally have no minimum purchase commitments or long-term contracts with any of these customers. These purchasers could decide at any time to discontinue, decrease or delay their purchases of our products. If our customers increase the size of their product orders without sufficient lead-time for us to process the order, our ability to fulfill product demands would be compromised. These customers have a variety of suppliers to choose from and therefore can make substantial demands on us, including demands on product pricing and on contractual terms, which often results in the allocation of risk to us as the supplier. Accordingly, the prices that they pay for our products are subject to negotiation and could change at any time. For example, as mentioned below in the risk factors “If disruptions in our transportation network continue to occur or our shipping costs substantially increase again in the future, we may be unable to sell or timely deliver our products, and net revenue and our gross margin could decrease” and “We obtain several key components from limited or sole sources, and if these sources fail to satisfy our supply requirements or we are unable to properly manage our supply requirements with our third-party manufacturers, we may lose sales and experience increased component costs”, we had previously experienced high freight costs and component costs and had issued price increases to our customers. Our ability to maintain strong relationships with our principal customers is essential to our future performance. If any of our major customers reduce their level of purchases or refuse to pay the prices that we set for our products, our net revenue and operating results could be harmed.
Furthermore, some of our customers are also our competitors in certain product categories, which could negatively influence their purchasing decisions. For example, Amazon owns Eero, one of our competitors in the mesh WiFi systems product category. Our traditional retail customers have faced increased and significant competition from online retailers, and some of these traditional retail customers have increasingly become a smaller portion of our business. If key retail customers continue to reduce their level of purchases, our business could be harmed. Similarly, we sell products and services directly to consumers from our own e-commerce platforms and expect these revenues to grow proportionate to overall revenue. Some of our customers, such as Amazon and Best Buy, may consider this to be competitive with their own businesses, which could negatively influence their purchasing decisions with respect to our products. Furthermore, we have experienced a shift towards products being bought and sold online. If we are unable to adjust to this shift and effectively manage our business and inventory requirements amongst our online customers and traditional retail customers, this may lead to lower market share and lower revenues for us, and our net revenue and operating results could be harmed.
In addition, adverse changes in economic conditions or unforeseen disruptions in the businesses of any of our key customers could adversely impact the sale of our products to end users and the quantity of products our customers decide to purchase from us. For example, as mentioned above in the risk factor “Accurately managing our sales channel inventory and product mix within the current environment is challenging, and we have, and may in the future,
incur costs associated with excess inventory, or lose sales from having too few products,” many of our retail and service provider customers have and continue to reduce their target inventory levels. This shift may have a longer-term impact on the inventory levels our customers choose to carry.
Additionally, concentration and consolidation among our customer base may allow certain customers to command increased leverage in negotiating prices and other terms of sale, which could adversely affect our profitability. If, as a result of increased leverage, customer pressures require us to reduce our pricing such that our gross margins are diminished, we could decide not to sell our products to a particular customer, which could result in a decrease in our revenue. Consolidation among our customer base may also lead to reduced demand for our products, elimination of sales opportunities, replacement of our products with those of our competitors and cancellations of orders, each of which would harm our operating results. Consolidation among our service provider customers worldwide may also make it more difficult to grow our service provider business, given the fierce competition for the already limited number of service providers worldwide and the long sales cycles to close deals. If consolidation among our customer base becomes more prevalent, our operating results may be harmed.
We obtain several key components from limited or sole sources, and if these sources fail to satisfy our supply requirements or we are unable to properly manage our supply requirements with our third-party manufacturers, we may lose sales and experience increased component costs.
Any shortage or delay in the supply of key product components, or any sudden, unforeseen price increase for such components, would harm our ability to meet product deliveries as scheduled or as budgeted. Many of the semiconductors used in our products are obtained from sole source suppliers on a purchase order basis. In addition, some components that are used in all our products are obtained from limited sources. We also obtain switching fabric semiconductors, which are used in our Ethernet switches and Internet gateway products, and WiFi chipsets, which are used in all of our wireless products, from a limited number of suppliers. We also use Cable Modem chipsets and Mobile chipsets in our cable and mobile products. Semiconductor suppliers have experienced and continue to experience component shortages themselves, such as with lead-frames and substrates used in manufacturing chipsets, which in turn adversely impact our ability to procure semiconductors from them in sufficient quantities and in a timely manner. For example, we had previously experienced certain chipset shortages for some of our switching products from two of our semiconductor suppliers who did not have enough wafer capacity to satisfy our demand, and this shortage continued for several quarters. Our third-party manufacturers generally purchase these components on our behalf on a purchase order basis, and we do not have any guaranteed supply arrangements with our suppliers. If demand for a specific component increases, we may not be able to obtain an adequate number of that component in a timely manner, and prices to obtain such components may increase. In addition, if worldwide demand for the components increases significantly, the availability of these components could be limited and prices for such components may increase. For example, as the demand for Artificial Intelligence chips increase, semiconductor production capacity may be shifted to these specific components thereby constraining supply of or increasing cost on chips used in our products. Further, dependence on a sole source for certain key components of our products may allow such sole source suppliers to command increased leverage in negotiating prices and other terms of sale, which could adversely affect our profitability. As a result, we may be left with little choice but to accept such higher prices or other fees for key components in order to ensure continuity of supply. This could affect our profitability or if we choose to push back against more onerous terms, could lead to inadequate supply, which could materially adversely affect our business. Our suppliers may also experience financial or other difficulties as a result of uncertain and weak worldwide economic, geopolitical conditions, trade disputes or public health issues. Other factors which may affect our suppliers’ ability or willingness to supply components to us include internal management product allocation decisions or reorganizational issues, such as roll-out of new equipment or disruptions to information infrastructure or power transmission or navigation miscalculations which may delay or disrupt supply of previously forecasted components, or industry consolidation and divestitures, which may result in changed business and product priorities among certain suppliers. Also, many standardized components used broadly in electronic devices are manufactured in significant quantities in concentrated geographic regions, particularly in Greater China. As a result, protracted crises, geopolitical unrest and uncertain economic conditions, could lead to eventual shortages of necessary components sourced from impacted regions or increased component costs. Additionally, government intervention to curb the consumption of electricity in China could have a disruptive impact on component production and supply availability. It could be difficult, costly and time consuming to obtain alternative sources for these components, or to change product designs to make use of alternative components. In addition, difficulties in transitioning from an existing
supplier to a new supplier could create delays in component availability that would have a significant impact on our ability to fulfill orders for our products.
We provide our third-party manufacturers with a rolling forecast of demand and purchase orders, which they use to determine our material and component requirements. Lead times for ordering materials and components vary significantly and depend on various factors, such as the specific supplier, contract terms and demand and supply for a component at a given time. Some of our components have long lead times, such as WiFi chipsets, switching fabric chips, physical layer transceivers, and logic, power, analog and RF chipsets. If our forecasts are not timely provided or are less than our actual requirements, our third-party manufacturers may be unable to manufacture products in a timely manner. If our forecasts are too high, our third-party manufacturers will be unable to use the components they have purchased on our behalf. Historically, the cost of the components used in our products tends to drop rapidly as volumes increase and the technologies mature. Therefore, if our third-party manufacturers are unable to promptly use components purchased on our behalf, our cost of producing products may be higher than our competitors due to an oversupply of higher-priced components. Moreover, if they are unable to use components ordered at our direction, we will need to reimburse them for any losses they incur, which could be material.
If we are unable to obtain a sufficient supply of components, or if we experience any interruption in the supply of components, our product shipments could be reduced or delayed or our cost of obtaining these components may increase. Component shortages and delays affect our ability to meet scheduled product deliveries, damage our brand and reputation in the market, and cause us to lose sales and market share. For example, component shortages and disruptions in supply related to the COVID-19 induced lockdowns in Shenzhen, China and Shanghai, China previously had limited our ability to supply all the worldwide demand for our NETGEAR for Business switch products, and our revenue and profitability was affected. At times we have elected to purchase components on the spot market or to use more expensive transportation methods, such as air freight, to make up for manufacturing delays caused by component shortages, which reduces our margins.
Some of our competitors have substantially greater resources than we do, and to be competitive we may be required to lower our prices or increase our sales and marketing expenses, which could result in reduced margins or loss of market share and revenue.
We compete in a rapidly evolving and fiercely competitive market, and we expect competition to continue to be intense, including price competition. Our principal competitors in the consumer market include ARRIS, ASUS, D-Link, Eero (owned by Amazon), Linksys (owned by Foxconn), Google WiFi, and TP-Link. Our principal competitors in the business market include Arista, Cisco Systems, D-Link, Extreme Networks, Fortinet, Hewlett-Packard Enterprise, Juniper Mist, Ruckus Networks, TP-Link, and Ubiquiti. Our principal competitors in the service provider market include Cradlepoint, Franklin, Huawei, Inseego, Nokia, Orbic, Sonim, TP-Link, WNC, and ZTE. Other competitors include numerous local vendors such as Xiaomi in China, AVM in Germany and Buffalo in Japan. In addition, these local vendors may target markets outside of their local regions and may increasingly compete with us in other regions worldwide. Our potential competitors also include other consumer electronics vendors, including Apple, LG Electronics, Microsoft, Panasonic, Sony, Toshiba and Vizio, who could integrate networking and streaming capabilities into their line of products, such as televisions, set top boxes and gaming consoles, and our channel customers who may decide to offer self-branded networking products. We also face competition from service providers who may bundle a free networking device with their broadband service offering, which would reduce our sales if we were not the supplier of choice to those service providers. In the service provider space, we also face significant and increased competition from original design manufacturers, or ODMs, and contract manufacturers who sell and attempt to sell their products directly to service providers around the world.
Many of our existing and potential competitors have longer operating histories, greater name recognition and substantially greater financial, technical, sales, marketing and other resources. These competitors may, among other things, undertake more extensive marketing campaigns, adopt more aggressive pricing policies, obtain more favorable pricing from suppliers and manufacturers, and exert more influence on sales channels than we can. Certain of our significant competitors also serve as key sales and marketing channels for our products, potentially giving these competitors a marketplace advantage based on their knowledge of our business activities and/or their ability to negatively influence our sales opportunities. For example, Amazon provides an important sales channel for our products, but it also competes with us in the mesh WiFi systems product category through its subsidiary Eero. In addition, certain competitors may have different business models, such as integrated manufacturing capabilities, that may allow them to achieve cost savings and to compete on the basis of price. Other competitors may have fewer resources but may be more nimble in developing new or disruptive technology or in entering new markets. We
anticipate that current and potential competitors will also intensify their efforts to penetrate our target markets. For example, in the past certain network security companies such as Symantec have introduced security routers for the home consumer market to compete with us and we believe that other network security companies may also seek to do the same. Also, due to our recent success in the audio visual over IP market, some of our competitors may seek to enter this market as well. Price competition is intense in our industry in certain geographical regions and product categories. Many of our competitors in the service provider and retail spaces price their products significantly below our product costs in order to gain market share. Certain substantial competitors have business models that are more focused on customer acquisition and access to customer data rather than on financial return from product sales, and these competitors have the ability to provide sustained price competition to many of our products in the market. Average sales prices have declined in the past and may again decline in the future. These competitors may have more advanced technology, more extensive distribution channels, stronger brand names, greater access to shelf space in retail locations, bigger promotional budgets and larger customer bases than we do. In addition, many of these competitors leverage a broader product portfolio and offer lower pricing as part of a more comprehensive end-to-end solution which we may not have. These companies could devote more capital resources to develop, manufacture and market competing products than we could. Our competitors may acquire other companies in the market and leverage combined resources to gain market share. In some instances, our competitors may be acquired by larger companies with additional formidable resources, such as the purchase of ARRIS by CommScope, Eero by Amazon and Linksys by Foxconn. Additionally, in the case of Linksys, Foxconn is one of our main third-party manufacturing partners, which presents an additional risk if Foxconn decides to prioritize its interest in Linksys over its relationship with us. If any of these companies are successful in competing against us, our sales could decline, our margins could be negatively impacted and we could lose market share, any of which could seriously harm our business and results of operations.
We depend substantially on our sales channels, and our failure to maintain and expand our sales channels would result in lower sales and reduced net revenue.
To maintain and grow our market share, net revenue and brand, we must maintain and expand our sales channels. Our sales channels consist of traditional retailers, online retailers, DMRs, VARs, and broadband service providers. Some of these entities purchase our products through our wholesale distributor customers. We generally have no minimum purchase commitments or long-term contracts with any of these third parties.
Traditional retailers have limited shelf space and promotional budgets, and competition is intense for these resources. If the networking sector does not experience sufficient growth, retailers may choose to allocate more shelf space to other consumer product sectors and may choose to reduce their inventory levels. A competitor with more extensive product lines and stronger brand identity may have greater bargaining power with these retailers. Any reduction in available shelf space or inventory levels or increased competition for such shelf space would require us to increase our marketing expenditures simply to maintain current levels of retail shelf space and inventory levels, which would harm our operating margin. In addition, reduction in inventory levels puts pressure on our ability to accurately forecast customer demand. A failure to accurately predict high demand for a product could result in lost sales or higher product costs if we meet demand by paying higher costs for materials, production and delivery. We could also frustrate our customers and lose further shelf space and market share. A failure to predict low demand for a product could result in excess inventory, further reductions in target inventory levels, lower cash flows and lower margins if we are required to reduce product prices in order to reduce inventories.
Our traditional retail customers have faced increased and significant competition from online retailers. Further, we have experienced the shift to a greater percentage of purchases taking place online versus traditional retail customers. If we cannot effectively manage our business and inventory requirements amongst our online customers and traditional retail customers, our business would be harmed. The recent trend in the consolidation of online retailers and DMR channels has resulted in intensified competition for preferred product placement, such as product placement on an online retailer’s Internet home page. Expanding our presence in the VAR channel may be difficult and expensive. We compete with established companies that have longer operating histories and longstanding relationships with VARs that we would find highly desirable as sales channel partners. In addition, our efforts to realign or consolidate our sales channels may cause temporary disruptions in our product sales and revenue, and these changes may not result in the expected longer-term benefits. We also sell products and services directly to consumers from our own e-commerce platforms. This requires material investment in capital, time and resources and carries the risk that it may not achieve the expected return on investment that we are expecting, and that it may adversely affect our relationships with our existing channel partners, which ultimately may materially and adversely affect our results of operations.
We also sell products to broadband service providers. Competition for selling to broadband service providers is fierce and intense. Penetrating service provider accounts typically involves a long sales cycle and the challenge of displacing incumbent suppliers with established relationships and field-deployed products. If we are unable to maintain and expand our sales channels, our growth would be limited and our business would be harmed.
We must also continuously monitor and evaluate emerging sales channels. If we fail to establish a presence in an important developing sales channel, such as sales directly to consumers from our own e-commerce platforms, our business could be harmed.
We depend on a limited number of third-party manufacturers for substantially all of our manufacturing needs. If these third-party manufacturers experience any delay, disruption or quality control problems in their operations, we could lose revenue and our brand may suffer.
All of our products are manufactured, assembled, tested and generally packaged by a limited number of third-party manufacturers, including original design manufacturers, or ODMs, as well as their sub-contract manufacturers. In most cases, we rely on these manufacturers to procure components and, in some cases, subcontract engineering work. Some of our products are manufactured by a single manufacturer. We do not have any long-term contracts with any of our third-party manufacturers. Some of these third-party manufacturers produce products for our competitors or are themselves competitors in certain product categories. Due to uncertain and changing economic and geopolitical conditions, the viability of some of these third-party manufacturers may be at risk. The loss of the services of any of our primary third-party manufacturers could cause a significant disruption in operations and delays in product shipments. Qualifying a new manufacturer and commencing volume production is expensive and time consuming. Ensuring that a manufacturer is qualified to manufacture our products to our standards is time consuming. In addition, there is no assurance that a manufacturer can produce our products at the appropriate volumes and in the quality that we require. In addition, as we recently have transitioned a substantial portion of our manufacturing facilities to different regions, we are subject to additional significant challenges in ensuring that quality, processes and costs, among other issues, are consistent with our expectations. For example, while we expect our manufacturers to be responsible for penalties assessed on us because of excessive failures of the products, there is no assurance that we will be able to collect such reimbursements from these manufacturers, which causes us to take on additional risk for potential failures of our products.
Our reliance on third-party manufacturers also exposes us to the following risks over which we have limited control:
•unexpected increases in manufacturing and repair costs;
•inability to control the quality and reliability of finished products;
•inability to control delivery schedules;
•potential liability for expenses incurred by third-party manufacturers in reliance on our forecasts that later prove to be inaccurate, including the cost of components purchased by third-party manufacturers on our behalf, which may be material;
•potential lack of adequate capacity to manufacture all or a part of the products we require; and
•potential labor unrest affecting the ability of the third-party manufacturers to produce our products.
All of our products must satisfy safety and regulatory standards and some of our products must also receive government certifications. Our third-party manufacturers are primarily responsible for conducting the tests that support our applications for most regulatory approvals for our products. If our third-party manufacturers fail to timely and accurately conduct these tests, we would be unable to obtain the necessary domestic or foreign regulatory approvals or certificates to sell our products in certain jurisdictions. As a result, we would be unable to sell our products and our sales and profitability could be reduced, our relationships with our sales channel could be harmed, and our reputation and brand would suffer.
Specifically, substantially all of our manufacturing and assembly occurs in the Asia Pacific region, and any disruptions due to natural disasters, climate change, health epidemics and political, social and economic instability in the region would affect the ability of our third-party manufacturers to manufacture our products. For example, in late August 2021, heavy rains caused our manufacturer in Thailand to become flooded and created a one-month delay in manufacturing and required us to move some non-U.S. manufacturing back to China. Furthermore, if the cost of
production charged by our third-party manufacturers increases, it may affect our margins and ability to lower prices for our products to stay competitive. Labor unrest in Southeast Asia, China or other locations where components and our products are manufactured may also affect our third-party manufacturers as workers may strike and cause production delays. If our third-party manufacturers fail to maintain good relations with their employees or contractors, and production and manufacturing of our products is affected, then we may be subject to shortages of products and quality of products delivered may be affected. Further, if our manufacturers or warehousing facilities are disrupted or destroyed, we would have no other readily available alternatives for manufacturing and assembling our products and our business would be significantly harmed.
In our typical ODM arrangement, our ODMs are generally responsible for sourcing the components of the products and warranting that the products will work against a product’s specification, including any software specifications. If we needed to move to a contract manufacturing arrangement, we would take on much more, if not all, of the responsibility around these areas, including increased costs and personnel expertise. If we are unable to properly manage these risks, our products may be more susceptible to defects and our business would be harmed.
Our sales and operations in international markets have exposed us to and may in the future expose us to operational, financial and regulatory risks.
International sales comprise a significant amount of our overall net revenue. International sales were approximately 34% of overall net revenue in fiscal 2024 and fiscal 2023. We continue to be committed to growing our international sales, and while we have committed resources to expanding our international operations and sales channels, these efforts may not be successful. For example, in fiscal 2022 we experienced the strengthening of the U.S. dollar, which had a meaningful negative impact on our international revenue and our profitability.
International operations are subject to a number of other risks, including:
•exchange rate fluctuations and inflation;
•geopolitical and economic tensions, such as in the Middle East, between China/Taiwan, and international terrorism and anti-American sentiment, particularly in emerging markets;
•potential for violations of anti-corruption laws and regulations, such as those related to bribery and fraud;
•preference for locally branded products, and laws and business practices favoring local competition;
•changes in local tax and customs duty laws or changes in the enforcement, application or interpretation of such laws (including potential responses to the higher U.S. tariffs on certain imported products implemented by the U.S.);
•increased difficulty in managing inventory and reduced inventory level targets;
•delayed revenue recognition;
•unpredictable judicial systems, which may unfairly favor domestic plaintiffs over foreign corporations, or which may more easily impose harsher penalties such as import injunctions;
•less effective protection of intellectual property;
•stringent consumer protection and product compliance regulations, including but not limited to the Restriction of Hazardous Substances directive, the Waste Electrical and Electronic Equipment directive and the European Ecodesign directive, or EuP, that are costly to comply with and may vary from country to country;
•difficulties and costs of staffing and managing foreign operations; and
•business difficulties, including potential bankruptcy or liquidation, of any of our worldwide third-party logistics providers.
While we believe we generally have good relations with our employees, employees in certain jurisdictions have rights which give them certain collective rights. If management must expend significant resources and effort to address and comply with these rights, our business may be harmed. We are also required to comply with local environmental legislation and our customers rely on this compliance in order to sell our products. If our customers do not agree with
our interpretations and requirements of new legislation, they may cease to order our products and our revenue would be harmed.
We depend on large, recurring purchases from certain significant customers, and a loss, cancellation or delay in purchases by these customers could negatively affect our revenue.
The loss of recurring orders from any of our more significant customers could cause our revenue and profitability to suffer. Our ability to attract new customers will depend on a variety of factors, including the cost-effectiveness, reliability, scalability, breadth and depth of our products. In addition, a change in the mix of our customers, or a change in the mix of direct and indirect sales, could adversely affect our revenue and gross margins.
Although our financial performance may depend on large, recurring orders from certain customers and resellers, we do not generally have binding commitments from them. For example:
•our reseller agreements generally do not require substantial minimum purchases;
•our customers can stop purchasing and our resellers can stop marketing our products at any time; and
•our reseller agreements generally are not exclusive.
Further, our revenue may be impacted by significant one-time purchases which are not contemplated to be repeatable. While such purchases are reflected in our financial statements, we do not rely on and do not forecast for continued significant one-time purchases. As a result, lack of repeatable one-time purchases will adversely affect our revenue.
Because our expenses are based on our revenue forecasts, a substantial reduction or delay in sales of our products to, or unexpected returns from, customers and resellers, or the loss of any significant customer or reseller, could harm or otherwise have a negative impact to our operating results. Although our largest customers may vary from period to period, we anticipate that our operating results for any given period will continue to depend on large orders from a small number of customers. This customer concentration increases the risk of quarterly fluctuations in our operating results and our sensitivity to any material, adverse developments experienced by our customers.
The average selling prices of our products typically decrease rapidly over the sales cycle of the product, which may negatively affect our net revenue and gross margins.
Our products typically experience price erosion, a fairly rapid reduction in the average unit selling prices over their respective sales cycles. In order to sell products that have a falling average unit selling price and maintain margins at the same time, we need to continually reduce product and manufacturing costs. To manage manufacturing costs, we must collaborate with our third-party manufacturers to engineer the most cost-effective design for our products. In addition, we must carefully manage the price paid for components used in our products. We must also successfully manage our freight and inventory costs to reduce overall product costs. We also need to continually introduce new products with higher sales prices and gross margins in order to maintain our overall gross margins. If we are unable to manage the cost of older products or successfully introduce new products with higher gross margins, our net revenue and overall gross margin would likely decline.
If we fail to overcome the challenges associated with managing our broadband service provider sales channel, our net revenue and gross profit will be negatively impacted.
We sell a significant number of products through broadband service providers worldwide. However, the service provider sales channel is challenging and exceptionally competitive. Difficulties and challenges in selling to service providers include a longer sales cycle, more stringent product testing and validation requirements, a higher level of customization demands, requirements that suppliers take on a larger share of the risk with respect to contractual business terms, competition from established suppliers, pricing pressure resulting in lower gross margins, and irregular and unpredictable ordering habits. For example, rigorous service provider certification processes may delay our sale of new products, or our products ultimately may fail these tests. In either event, we may lose some or all of the amounts we expended in trying to obtain business from the service provider, as well as lose the business opportunity altogether. In addition, even if we have a product which a service provider customer may wish to purchase, we may choose not to supply products to the potential service provider customer if the contract requirements, such as service level
requirements, penalties, and liability provisions, are too onerous. Accordingly, our business may be harmed and our revenues may be reduced. We have, in exceptional limited circumstances, while still in contract negotiations, shipped products in advance of and subject to agreement on a definitive contract. We do not record revenue from these shipments until a definitive contract exists. There is risk that we do not ultimately close and sign a definitive contract. If this occurs, the timing of revenue recognition is uncertain and our business would be harmed. In addition, we often commence building custom-made products prior to execution of a contract in order to meet the customer’s contemplated launch dates and requirements. Service provider products are generally custom-made for a specific customer and may not be scalable to other customers or in other channels. If we have pre-built custom-made products but do not come to agreement on a definitive contract, we may be forced to scrap the custom-made products or re-work them at substantial cost and our business would be harmed.
Further, successful engagements with service provider customers requires a constant analysis of technology trends. If we are unable to anticipate technology trends and service provider customer product needs, and to allocate research and development resources to the right projects, we may not be successful in continuing to sell products to service provider customers. In addition, because our service provider customers command significant resources, including for software support, and demand extremely competitive pricing, certain ODMs have declined to develop service provider products on an ODM basis. Accordingly, as our ODMs increasingly limit development of our service provider products, our service provider business will be harmed if we cannot replace this capability with alternative ODMs or in-house development.
Orders from service providers generally tend to be large but sporadic, which causes our revenues from them to fluctuate and challenges our ability to accurately forecast demand from them. In particular, managing inventory, inventory levels and production of our products for our service provider customers is a challenge and may be further exacerbated by current macroeconomic uncertainties and geopolitical instability. Many of our service provider customers have irregular purchasing requirements. These customers may decide to cancel orders for customized products specific to that customer, and we may not be able to reconfigure and sell those products in other channels. These cancellations could lead to substantial write-offs. In addition, these customers may issue unforecasted orders for products which we may not be able to produce in a timely manner and as such, we may not be able to accept and deliver on such unforecasted orders. In certain cases, we may commit to fixed-price, long term purchase orders, with such orders priced in foreign currencies which could lose value over time in the event of adverse changes in foreign exchange rates. Even if we are selected as a supplier, typically a service provider will also designate a second source supplier, which over time will reduce the aggregate orders that we receive from that service provider. Further, as the technology underlying our products deployed by broadband service providers matures and more competitors offer alternative products with similar technology, we anticipate competing in an extremely price sensitive market and our margins may be affected. If we are unable to introduce new products with sufficiently advanced technology to attract service provider interest in a timely manner, our service provider customers may then require us to lower our prices, or they may choose to purchase products from our competitors. If this occurs, our business would be harmed and our revenues would be reduced.
If we were to lose a service provider customer for any reason, we may experience a material and immediate reduction in forecasted revenue that may cause us to be below our net revenue and operating margin expectations for a particular period of time and therefore adversely affect our stock price. For example, many of our competitors in the service provider space aggressively price their products in order to gain market share. We may not be able to match the lower prices offered by our competitors, and we may choose to forgo lower-margin business opportunities. Many of the service provider customers will seek to purchase from the lowest cost provider, notwithstanding that our products may be higher quality or that our products were previously validated for use on their proprietary network. Accordingly, we may lose customers who have lower, more aggressive pricing, and our revenues may be reduced. In addition, service providers may choose to prioritize the implementation of other technologies or the roll out of other services than home networking. Weakness in orders from this industry could have a material adverse effect on our business, operating results, and financial condition. We have seen slowdowns in capital expenditures by certain of our service provider customers in the past and believe there may be potential for similar slowdowns in the future. Any slowdown in the general economy, over supply, consolidation among service providers, regulatory developments and constraint on capital expenditures could result in reduced demand from service providers and therefore adversely affect our sales to them. If we do not successfully overcome these challenges, we will not be able to profitably manage our service provider sales channel and our financial results will be harmed.
We expect our operating results to fluctuate on a quarterly and annual basis, which could cause our stock price to fluctuate or decline.
Our operating results are difficult to predict and may fluctuate substantially from quarter-to-quarter or year-to-year for a variety of reasons, many of which are beyond our control. If our actual results were to fall below our estimates or the expectations of public market analysts or investors, our quarterly and annual results would be negatively impacted and the price of our stock could decline. Other factors that could affect our quarterly and annual operating results include those listed in the risk factors section of this report and others such as:
•operational disruptions, such as transportation delays or failure of our order processing system, particularly if they occur at the end of a fiscal quarter;
•component supply constraints, including specialized WiFi 7 or WiFi 6 chipsets, or sudden, unforeseen price increases from our manufacturers, suppliers and vendors;
•unanticipated increases in costs, including air and ocean freight, associated with shipping and delivery of our products;
•the inability to maintain stable operations by our suppliers, distribution centers and other parties with which we have commercial relationships;
•seasonal shifts in end market demand for our products, particularly in our Connected Home business segment;
•our inability to accurately forecast product demand or optimal product mix such as the proportion of lower-priced products versus premium products resulting in increased inventory exposure and/or lost sales;
•unfavorable or compressed level of inventory and turns;
•changes in or consolidation of our sales channels and wholesale distributor relationships or failure to manage our sales channel inventory and warehousing requirements;
•unanticipated decreases, reduced inventory targets or delays in purchases of our products by our significant traditional and online retail customers;
•shift in overall product mix sales from higher to lower gross margin products, from lower-priced products to premium products, or from one business segment to another, that would adversely impact our revenue and gross margins;
•an increase in price protection claims, redemptions of marketing rebates, product warranty and stock rotation returns or allowance for doubtful accounts;
•delay or failure to fulfill orders for our products on a timely basis;
•changes in the pricing policies of or the introduction of new products by us or our competitors;
•unexpected challenges or delays in our ability to further develop services and applications that complement our products and result in meaningful subscriber growth and future recurring revenue;
•discovery or exploitation of security vulnerabilities in our products, services or systems, leading to negative publicity, decreased demand or potential liability, including potential breach of our customers’ data privacy or disruption of the continuous operation of our cloud infrastructure and our products;
•introductions of new technologies and changes in consumer preferences that result in either unanticipated or unexpectedly rapid product category shifts;
•slow or negative growth in the networking product, personal computer, Internet infrastructure, smart home, home electronics and related technology markets;
•delays in the introduction of new products by us or market acceptance of these products;
•delays in regulatory approvals or consumer adoption of WiFi 7 or WiFi 6E technology in various regions;
•increases in expenses related to the development, introduction and marketing of new products that adversely impact our margins;
•increases in expenses related to the development and marketing related to the Company’s direct online sales channels that adversely impact our margins;
•changes in tax rates or adverse changes in tax laws that expose us to additional income tax liabilities;
•changes in U.S. and international trade policy that adversely affect customs, tax or duty rates;
•foreign currency exchange rate fluctuations in the jurisdictions where we transact sales and expenditures in local currency;
•unanticipated increases in expenses related to periodic restructuring measures undertaken to achieve profitability and other business goals, including the reallocation or relocation of resources;
•delay or failure of our service provider customers to purchase at their historic volumes or at the volumes that they or we forecast;
•litigation involving alleged patent infringement, consumer class actions, securities class actions or other claims that could negatively impact our reputation, brand, business and financial condition;
•disruptions or delays related to our financial and enterprise resource planning systems;
•allowance for doubtful accounts exposure with our existing retailers, distributors and other channel partners and new retailers, distributors and other channel partners, particularly as we expand into new international markets;
•geopolitical disruption, including sudden changes in immigration policies and economic sanctions, leading to disruption in our workforce or delay or even stoppage of our operations in manufacturing, transportation, technical support and research and development;
•terms of our contracts with customers or suppliers that cause us to incur additional expenses or assume additional liabilities;
•epidemic or widespread product and/or component failure, performance problems or unanticipated safety issues in one or more of our products that could negatively impact our reputation, brand and business;
•any changes in accounting rules;
•challenges associated with integrating acquisitions that we make, or with realizing value from our strategic investments in other companies;
•failure to effectively manage our third-party customer support partners, which may result in customer complaints and/or harm to our brand;
•our inability to monitor and ensure compliance with our code of ethics, our anti-corruption compliance program and domestic and international anti-corruption laws and regulations, whether in relation to our employees or with our suppliers or customers;
•labor unrest at facilities managed by our third-party manufacturers;
•workplace or human rights violations in certain countries in which our third-party manufacturers or suppliers operate, which may require quarantine of affected products, affect our brand and negatively affect our products’ acceptance by consumers;
•overall performance of the equity markets and the economy as a whole;
•unanticipated shifts or declines in profit by geographical region that would adversely impact our tax rate; and
•our failure to implement and maintain the appropriate internal controls over financial reporting which may result in restatements of our financial statements.
As a result, period-to-period comparisons of our operating results may not be meaningful, and you should not rely on them as an indication of our future performance.
Changes in trade policy in the United States and other countries, including the imposition of tariffs and the resulting consequences, may adversely impact our business, results of operations and financial condition.
International trade disputes, geopolitical tensions, and military conflicts have led, and continue to lead, to new and increasing export restrictions, trade barriers, tariffs, and other trade measures that can increase our manufacturing and transportation costs, limit our ability to sell to certain customers or markets, limit our ability to procure, or increase our costs for, components or raw materials, impede or slow the movement of our goods across borders, or otherwise restrict our ability to conduct operations. Increasing protectionism, economic nationalism, and national security concerns may also lead to further changes in trade policy. For example, when the U.S. government engaged in extended trade negotiations with China, which resulted in the implementation of tariffs on a significant number of products manufactured in China and imported into the United States, we worked closely with our manufacturing partners to implement ways to mitigate the impact of these tariffs on our supply chain as promptly and reasonably as practicable, including shifting production outside of China. We cannot predict what further actions may be taken with respect to export regulations, tariffs or other trade regulations between the United States and other countries, what products or companies may be subject to such actions, or what actions may be taken by other countries in retaliation. In addition, actions to mitigate the effect of these tariffs are disruptive on our operations, may not be completely successful and may result in higher long-term manufacturing costs. Moreover, there is no certainty that countries to which we have shifted our manufacturing operations will not be subject to similar tariffs in the future. As a result, we may be required to raise our prices on certain products, which could result in the loss of customers and harm to our revenue, market share, competitive position and operating performance.
Additionally, the imposition of tariffs is dependent upon the classification of items under the Harmonized Tariff System (“HTS”) and the country of origin of the item. Determination of the HTS and the origin of the item is a technical matter that can be subjective in nature. Accordingly, although we believe our classifications of both HTS and origin are appropriate, there is no certainty that the U.S. government will agree with us. If the U.S. government does not agree with our determinations, we could be required to pay additional amounts, including potential penalties, and our profitability would be adversely impacted.
If disruptions in our transportation network continue to occur or our shipping costs substantially increase again in the future, we may be unable to sell or timely deliver our products, and our net revenue and gross margin could decrease.
The transportation network is subject to disruption or congestion from a variety of causes, including labor disputes or port strikes, acts of war, terrorism or other geopolitical conflicts, like the Middle East conflict, natural disasters, effects of climate change, pandemics like COVID-19 and congestion resulting from higher shipping volumes. We are highly dependent upon the transportation systems we use to ship our products, including surface and air freight. Our attempts to closely match our inventory levels to our product demand intensify the need for our transportation systems to function effectively and without delay. On a quarterly basis, our shipping volume also tends to steadily increase as the quarter progresses, which means that any disruption in our transportation network in the latter half of a quarter will likely have a more material effect on our business than at the beginning of a quarter. For example, at times during the COVID-19 pandemic, we experienced significant limitations on the availability of key transportation resources and significant increases to the cost of air and ocean freight. When these occur, it has negatively impacted our profitability as we seek to transport an increased number of products from manufacturing locations in Asia to other markets around the world as quickly as possible. Moreover, feeder vessels that move containers to key trans-Pacific terminal locations can be subject to similar impacts due to the timing of container transfers and vessel departure dates. In addition, the global effects of climate change can result in increased frequency and severity of natural disasters that could also disrupt our transportation network. Furthermore, labor disputes among freight carriers and at ports of entry are common. A port worker strike, work slow-down or other transportation disruption in the ports of Singapore, Rotterdam, Los Angeles or Long Beach, California, where we have significant distribution centers, or East coast or Gulf coast of United States due to the volume of imports coming to the U.S. via ports there, could significantly disrupt our business. For example, at times, during the course of the COVID-19 pandemic, we had experienced disruptions at the ports, due to multiple factors, such as supply and demand imbalance, a shortage of warehouse workers, truck drivers, and transport equipment (tractors and trailers), and other causes, and had suffered from heightened congestion, bottleneck and gridlock, leading to abnormally high transportation delays. In addition, as mentioned above in the risk factor "Accurately managing our sales channel inventory and product mix within the current environment is
challenging, and we have, and may in the future, incur costs associated with excess inventory, or lose sales from having too few products," many of our retail and service provider customers have and continue to reduce their target inventory levels to more closely match with product demand. This further intensifies the need for our transportation systems to function effectively and without delay. Significant disruptions to the transportation network could lead to significant disruptions in our business, delays in shipments, increased shipping costs, and revenue and profitability shortfalls which could materially and adversely affect our business and financial results, especially if they were to take place within the last few weeks of any quarter.
Our international freight is regularly subjected to inspection by governmental entities. If our delivery times increase unexpectedly for these or any other reasons, our ability to deliver products on time would be materially adversely affected and would result in delayed or lost revenue as well as customer-imposed penalties. Similarly, transportation network disruptions such as those described in the preceding paragraph, have in the past and may in the future lead to an increase in transportation costs. For example, the cost of shipping our products by ocean freight had previously increased to at least eight times historical levels and had a corresponding impact upon our profitability. Moreover, the cost of shipping our products by air freight is greater than other methods. From time to time in the past, we have shipped products using extensive air freight to meet unexpected spikes in demand, shifts in demand between product categories, to bring new product introductions to market quickly and to timely ship products previously ordered. If we rely more heavily upon air freight to deliver our products, our overall shipping costs will increase. Just as ocean freight costs had previously increased due to the aforementioned supply chain and transportation disruptions, the cost of air freight had previously increased, as well, up to five times historical levels. While transportation costs have recently decreased, if the cost of ocean and air freight were to significantly increase again, it would severely disrupt our business and harm our operating results, and in particular, our profitability.
Expansion of our operations and infrastructure may strain our operations and increase our operating expenses.
We have expanded our operations and are pursuing market opportunities both domestically and internationally in order to grow our sales. This expansion has required enhancements to our existing management information systems, and operational and financial controls. In addition, if we continue to grow, our expenditures would likely be significantly higher than our historical costs. We may not be able to install adequate controls in an efficient and timely manner as our business grows, and our current systems may not be adequate to support our future operations. The difficulties associated with installing and implementing new systems, procedures and controls may place a significant burden on our management, operational and financial resources. In addition, if we grow internationally, we will have to expand and enhance our communications infrastructure. If we fail to continue to improve our management information systems, procedures and financial controls or encounter unexpected difficulties during expansion and reorganization, our business could be harmed.
For example, we have invested, and will continue to invest, significant capital and human resources in the design and enhancement of our financial and enterprise resource planning systems, which may be disruptive to our underlying business. We depend on these systems in order to timely and accurately process and report key components of our results of operations, financial position and cash flows. If the systems fail to operate appropriately or we experience any disruptions or delays in enhancing their functionality to meet current business requirements, our ability to fulfill customer orders, bill and track our customers, fulfill contractual obligations, accurately report our financials and otherwise run our business could be adversely affected. Even if we do not encounter these adverse effects, the enhancement of systems may be much more costly than we anticipated. If we are unable to continue to enhance our information technology systems as planned, our financial position, results of operations and cash flows could be negatively impacted.
As part of growing our business, we have made and expect to continue to make acquisitions. If we fail to successfully select, execute or integrate our acquisitions, then our business and operating results could be harmed and our stock price could decline.
From time to time, we will undertake acquisitions to add new product lines and technologies, gain new sales channels or enter into new sales territories. Acquisitions involve numerous risks and challenges, including but not limited to the following:
•integrating the companies, assets, systems, products, sales channels and personnel that we acquire;
•higher than anticipated acquisition and integration costs and expenses;
•reliance on third parties to provide transition services for a period of time after closing to ensure an orderly transition of the business;
•growing or maintaining revenues to justify the purchase price and the increased expenses associated with acquisitions;
•entering into territories or markets with which we have limited or no prior experience;
•establishing or maintaining business relationships with customers, vendors and suppliers who may be new to us;
•overcoming the employee, customer, vendor and supplier turnover that may occur as a result of the acquisition;
•disruption of, and demands on, our ongoing business as a result of integration activities including diversion of management’s time and attention from running the day-to-day operations of our business;
•inability to implement uniform standards, disclosure controls and procedures, internal controls over financial reporting and other procedures and policies in a timely manner;
•inability to realize the anticipated benefits of or successfully integrate with our existing business the businesses, products, technologies or personnel that we acquire; and
•potential post-closing disputes.
As part of undertaking an acquisition, we may also significantly revise our capital structure or operational budget, such as issuing common stock that would dilute the ownership percentage of our stockholders, assuming liabilities or debt, utilizing a substantial portion of our cash resources to pay for the acquisition or significantly increasing operating expenses. Our acquisitions have resulted and may in the future result in charges being taken in an individual quarter as well as future periods, which results in variability in our quarterly earnings. In addition, our effective tax rate in any particular quarter may also be impacted by acquisitions. Following the closing of an acquisition, we may also have disputes with the seller regarding contractual requirements and covenants. Any such disputes may be time consuming and distract management from other aspects of our business. In addition, if we increase the pace or size of acquisitions, we will have to expend significant management time and effort into the transactions and the integrations and we may not have the proper human resources bandwidth to ensure successful integrations and accordingly, our business could be harmed.
As part of the terms of acquisition, we may commit to pay additional contingent consideration if certain revenue or other performance milestones are met. We are required to evaluate the fair value of such commitments at each reporting date and adjust the amount recorded if there are changes to the fair value. Additionally, future or past business transactions (such as acquisitions or integrations) could also expose us to additional cybersecurity risks and vulnerabilities, as our systems or products could be negatively affected by vulnerabilities present in acquired or integrated entities’ systems and technologies.
We cannot ensure that we will be successful in selecting, executing and integrating acquisitions. Failure to manage and successfully integrate acquisitions could materially harm our business and operating results. In addition, if stock market analysts or our stockholders do not support or believe in the value of the acquisitions that we choose to undertake, our stock price may decline.
We invest in companies primarily for strategic reasons but may not realize a return on our investments.
We have made, and continue to seek to make, investments in companies around the world to further our strategic objectives and support our key business initiatives. These investments may include equity or debt instruments of public or private companies, and may be non-marketable at the time of our initial investment. We do not restrict the types of companies in which we seek to invest. These companies may range from early-stage companies that are often still defining their strategic direction to more mature companies with established revenue streams and business models. If any company in which we invest fails, we could lose all or part of our investment in that company. If we determine that an other-than-temporary decline in the fair value exists for an equity or debt investment in a public or private company in which we have invested, we will have to write down the investment to its fair value and recognize the related write-down as an investment loss. The performance of any of these investments could result in significant impairment charges and gains (losses) on investments. We must also analyze accounting and legal issues when making these investments. If we do not structure these investments properly, we may be subject to certain adverse accounting issues, such as potential consolidation of financial results.
Furthermore, if the strategic objectives of an investment have been achieved, or if the investment or business diverges from our strategic objectives, we may seek to dispose of the investment. Our non-marketable equity investments in private companies are not liquid, and we may not be able to dispose of these investments on favorable terms or at all. The occurrence of any of these events could harm our results. Gains or losses from equity securities could vary from expectations depending on gains or losses realized on the sale or exchange of securities and impairment charges related to debt instruments as well as equity and other investments.
Risks Related to Our Products, Technology, Intellectual Property and Data
We rely upon third parties for technology that is critical to our products, and if we are unable to continue to use this technology and future technology, our ability to develop, sell, maintain and support technologically innovative products would be limited.
We rely on third parties to obtain non-exclusive patented hardware and software license rights in technologies that are incorporated into and necessary for the operation and functionality of most of our products. In these cases, because the intellectual property we license is available from third parties, barriers to entry into certain markets may be lower for potential or existing competitors than if we owned exclusive rights to the technology that we license and use. Moreover, if a competitor or potential competitor enters into an exclusive arrangement with any of our key third-party technology providers, or if any of these providers unilaterally decide not to do business with us for any reason, our ability to develop and sell products containing that technology would be severely limited. If we are shipping products that contain third-party technology that we subsequently lose the right to license, then we will not be able to continue to offer or support those products. In addition, these licenses often require royalty payments or other consideration to the third-party licensor. Our success will depend, in part, on our continued ability to access these technologies, and we do not know whether these third-party technologies will continue to be licensed to us on commercially acceptable terms, if at all. If we are unable to license the necessary technology, we may be forced to acquire or develop alternative technology of lower quality or performance standards, which would limit and delay our ability to offer new or competitive products and increase our costs of production. As a result, our revenue, margins, market share, and operating results could be significantly harmed.
We also utilize third-party software development companies to develop, customize, maintain and support software that is incorporated into our products. For example, we license software from Bitdefender for our NETGEAR Armor cybersecurity services offering and we license software from Circle Media Labs, Inc., a wholly owned subsidiary of Aura, for our parental controls service offering. If these companies fail to timely deliver or continuously maintain and support the software, as we require of them, we may experience delays in releasing new products or difficulties with supporting existing products and customers. In addition, if these third-party licensors fail or experience instability, then we may be unable to continue to sell products that incorporate the licensed technologies in addition to being unable to continue to maintain and support these products. We do require escrow arrangements with respect to certain third-party software which entitle us to certain limited rights to the source code, in the event of certain failures by the third party, in order to maintain and support such software. However, there is no guarantee that we would be able to fully understand and use the source code, as we may not have the expertise to do so. We are increasingly exposed to these risks as we continue to develop and market more products and services containing third-party software, such as our subscription service offerings related to network security and smart parental controls. If we are unable to license the necessary technology, we may be forced to acquire or develop alternative technology, which could be of lower quality or performance standards. The acquisition or development of alternative technology may limit and delay our ability to offer new or competitive products and services and increase our costs of production. As a result, our business, operating results and financial condition could be materially adversely affected.
Product security vulnerabilities, system security risks, data protection breaches, cyber-attacks, improper use of artificial intelligence (“AI”) tools, and other threats and risks, could disrupt or otherwise compromise our products, services, internal operations or information technology systems, or those of third parties with whom we work. Actual or perceived non-compliance with our privacy and security obligations could lead to regulatory investigations or actions, litigation, fines and penalties, business operation disruption, reputational harm, loss of revenue or profits, loss of customers or sales, and other adverse business consequences.
We and the third parties with whom we work process personal data and other sensitive information, and we disclose certain such sensitive information to relevant third parties as reasonably necessary to operate our business while maintaining measures designed to protect such information. Among other products and services, we offer comprehensive online cloud management services paired with a number of our products. Our products and services
could be compromised due to a variety of evolving threats and security vulnerabilities. We have in the past experienced, and expect to continue to be the target of, cyber attacks (including by highly sophisticated nation-state actors) or other sources of compromise, and given the increasingly sophisticated and evolving threat landscape, we could experience a cyber incident that would materially affect our business operations. We devote considerable time and resources to uncovering and remedying these threats and vulnerabilities, using both internal and external resources, but the threats to network and data security are increasingly diverse and sophisticated and we continue to implement additional protections and increase our monitoring and threat intelligence. Despite our efforts and processes to prevent breaches, our systems and products are vulnerable to cybersecurity risks, including cyber-attacks such as viruses and worms, vulnerabilities such as command injection, cross site scripting, credential stuffing attacks, authentication and session management, and stack-based buffer overflow, social-engineering attacks (including through deep fakes, which may be increasingly difficult to identify as fake and phishing attacks), supply-chain attacks, malware (including as a result of advanced persistent threat intrusions), and other sophisticated attacks or exploits. These threats can come from a variety of sources, including traditional computer “hackers,” threat actors, “hacktivists,” organized criminal threat actors, personnel (such as through error or malfeasance), sophisticated nation states, and nation-state-supported actors. Additionally, our systems and products may be disrupted for reasons other than a cyberattack, such as software bugs, server malfunctions, software or hardware failures, loss of data or other information technology assets, adware, telecommunications failures, earthquakes, fires, and floods. It is also possible that an attacker could compromise our internal code repository or those of our partners and insert a ‘backdoor’ that would give them easy access to any of our devices using this code. Severe ransomware attacks are also becoming increasingly prevalent and can lead to significant interruptions in our operations, ability to provide our products or services, loss of sensitive data and income, reputational harm, and diversion of funds. Further, most of our major offices worldwide operate under a hybrid work model, allowing personnel the flexibility to work from home and at the workplace. Work from home arrangements present additional cybersecurity risks, including potential increases in malware and phishing attacks, greater challenges to secure home office data, and potential service degradation or disruption to key internal business applications and third-party services. Although we have taken measures to address these risks, they present challenges that could impact business operations and could cause recovery times to increase.
We have not in the past and may not in the future be able to discover and protect against these threats and vulnerabilities, and our inability to remedy compromises of our products, services or data in a timely manner, or at all, may impact our brand and reputation and otherwise harm our business. For example, with respect to our making available patches or information for vulnerabilities in our products or services, our customers may be unwilling or unable to deploy such patches and use such information effectively and in a timely manner. In the past, we have experienced attempted exploitation of such vulnerabilities and anticipate continuing to experience similar attempts in the future. Such attacks against and other compromises of us, our customers or third parties with whom we work could lead to material interruptions, delays or loss of data, unauthorized access to data, and loss of consumer confidence. Successful attacks or actual compromises could materially adversely affect our business, be expensive to remedy, damage our reputation, result in negative publicity, adversely affect our brand, decrease demand for our products and services, and otherwise materially adversely affect our operating results and financial condition. Applicable data privacy and security obligations may require us, or we may voluntarily choose to, notify relevant stakeholders, including affected individuals, customers, regulators, investors and others of security breaches. Such disclosures and related actions can be costly and the disclosure or the failure to comply with such applicable requirements could lead to adverse consequences. Further, under certain circumstances, we may need to prioritize fixing vulnerabilities or responding to security breaches over new product development, which may impact our revenues and adversely affect our business.
With respect to certain of our products and services, we employ a shared responsibility model where our customers are responsible for using, configuring and otherwise implementing security measures related to our products and services in a manner that addresses their information security risks. As part of this shared responsibility security model, we make certain security features available to our customers that can be implemented at our customers’ discretion or identify security areas or measures for which our customers are responsible. For example, customers may choose not to enable two-factor authentication for their NETGEAR account (which would likely increase the risk of compromise) or they could choose to disable automatic updates (which would likely delay or prevent entirely, important security updates). In certain cases, where our customers choose not to implement or incorrectly implement those features or measures, misuse our products or services, or otherwise experience their own vulnerabilities or other compromises, even if we are not the cause of a resulting customer security issue or incident, our customer relationships, reputation and revenue could be adversely impacted. If our products or services are compromised, a significant number or, in
some instances, all of our customers and their data could be simultaneously affected. The potential liability and associated consequences we could suffer as a result of such a large-scale event could result in irreparable harm.
We rely on third-party providers for a number of critical aspects of our cloud services, e-commerce site, software development, manufacturing and customer support, including web hosting services, billing and payment processing, and consequently we do not maintain direct control over the security or stability of the associated systems. Our reliance on third parties exposes us to cybersecurity risks and vulnerabilities if such third parties or their partners are targeted by cyber attack or other sources of compromise.
Maintaining the security of our information systems, communication systems and data is a critical issue for us and our customers. Malicious actors may develop and deploy malware that is designed to manipulate our products and systems, including our internal network, or those of our vendors or customers. Additionally, outside parties may attempt to fraudulently induce our personnel to disclose sensitive information in order to gain access to our information systems, our data or our customers’ data. We have established a crisis management plan, business continuity program, information security incident response plan and Generative AI policy. While we test and update these plans, policies and programs, there can be no assurance that the plans, policies and programs can withstand an actual or serious disruption in our business, including a data protection breach or cyber-attack. While we have established infrastructure and geographic redundancy for our critical systems, our ability to utilize these redundant systems requires further testing and we cannot be assured that such systems are fully functional. For example, much of our order fulfillment process is automated and the order information is stored on our servers. A significant business interruption could result in losses or damages and harm our business. If our information systems become unavailable, our ability to recognize revenue may be delayed until we are able to utilize back-up systems and continue to process and ship our orders, which could cause our stock price to decline significantly.
We devote considerable internal and external resources to network security, data encryption and other security measures to protect our information systems and customer data, but our efforts cannot provide an absolute guarantee of security. In addition, U.S. and foreign regulators have increased their focus on cybersecurity (including imposing specific security measures related to the products and services we sell) and data protection and many states, countries and jurisdictions have laws and regulations that may impose significant penalties and fines for failure to comply with these requirements. Compliance with laws, regulations, industry standards, contracts, policies and other obligations concerning artificial intelligence, privacy, cybersecurity, data governance and data protection is a rigorous and time-intensive process, that continuously evolves and develops, and we may be required to put in place additional mechanisms ensuring compliance with such obligations and incur substantial expenditures. Many of these laws are new, in the nascent stages of applicability, untested in terms of scope by applicable courts, regulators and/or administrative bodies, and technically complex. As such, their interpretation remains inherently uncertain. If we fail to properly interpret or otherwise comply with any such obligations, we may face significant fines and penalties that could adversely affect our business, financial condition and results of operations. Furthermore, obligations (including laws and regulations) are not consistent and compliance remains costly.
Actual and potential breaches of our security measures as well as the loss, disclosure or dissemination of proprietary information or sensitive or confidential data about us, our personnel or our customers, including the potential loss or disclosure of such information or data as a result of improper use of AI tools, personnel error or other personnel actions, hacking, fraud, social engineering or other forms of deception, could expose us, our customers or the individuals affected to a risk of loss or misuse of this information, result in litigation and potential liability for us, subject us to significant governmental fines and penalties (as well as other enforcement and remediation actions), damage our brand and reputation, or otherwise harm our business. Security incidents and attendant material consequences may prevent or cause customers to stop using our products and services, deter new customers from using our products and services, and otherwise negatively impact our ability to grow and operate our business. In particular, because our product and service offerings involve protecting the information or systems of our customers, a security incident could heighten the impact of these material adverse consequences because of the nature of our business and our customers’ expectations. It may be difficult and/or costly to detect, investigate, mitigate, contain and remediate security breaches and our efforts to do so may not be successful. Actions taken by us or third parties with whom we work to detect, investigate, mitigate, contain and remediate a security breach could result in outages, data losses, disruptions to our business and otherwise harm our business. Unauthorized parties may also gain access to other networks, systems and products after a compromise of our networks, systems, and products. For example, threat actors (including those sponsored by nation states) have, in the past, attacked or otherwise sought to compromise our
products and other hardware nearing end of life and/or running on outdated firmware without the latest security updates.
Limitations of liability in our contracts and our insurance coverage may be inadequate to address losses or other expenditures arising out of or related to non-compliance with our obligations or security incidents. A large claim against our insurance coverage may exceed our coverage and otherwise impact our ability to obtain coverage in the future. Our management has spent increasing amounts of time, effort and expense in this area, and in the event of the discovery of significant product or system security vulnerability, or improper use of AI tools or other cybersecurity incidents, we could incur additional substantial expenses and our business and reputation could be harmed. If we or our third-party providers are unable to successfully prevent breaches of security relating to our products, services, systems or customer private information, including customer personal data, or if these third-party systems failed for other reasons, it could result in litigation and potential liability for us, damage our brand and reputation, or otherwise harm our business.
In the United States, federal, state, and local governments have enacted numerous data privacy and security laws, including data breach notification laws, personal data privacy laws, consumer protection laws and other similar laws (such as wiretapping laws). Certain US states have enacted comprehensive consumer privacy laws that impose significant and costly obligations on covered businesses. Outside the United States, an increasing number of laws, regulations and industry standards govern data privacy and security. For example, the European Union’s General Data Protection Regulation (“EU GDPR”) and the United Kingdom’s GDPR (“UK GDPR”) (collectively, “GDPR”), Australia’s Privacy Act, and Canada's Personal Information Protection and Electronic Documents Act (“PIPEDA”) (as well as various related provincial laws) impose strict requirements for processing personal data. For example, under the GDPR, companies may face temporary or definitive bans on data processing and other corrective actions; fines of up to 20 million Euros under the EU GDPR, 17.5 million pounds sterling under the UK GDPR or, in each case, 4% of annual global revenue, whichever is greater; or private litigation related to processing of personal data brought by classes of data subjects or consumer protection organizations authorized at law to represent their interests. In Europe, the Network and Information Security Directive (“NIS2”) regulates resilience and incident response capabilities of entities operating in a number of sectors. Non-compliance with NIS2 may lead up to administrative fines of a maximum of 10 million Euros or up to 2% of the total worldwide revenue of the preceding fiscal year.
In the ordinary course of business, we transfer personal data from Europe and other jurisdictions to the United States and other countries. Europe and other jurisdictions have enacted laws requiring data to be localized or limiting the transfer of personal data to other countries. These data localization and cross-border data transfer laws could lead to adverse consequences such as interruption of our operations, increased exposure to regulatory actions, and difficulty transferring data to partners, vendors and other third parties with whom we work.
Preparing for and complying with our data privacy and security obligations requires us to devote significant resources which has in the past and may in the future necessitate changes to our products and services, information systems and practices. At times, we have in the past and may in the future fail in our efforts to comply with our data privacy and security obligations. If we or the third parties with whom we work fail (or are perceived to have failed) to comply with applicable data privacy or security obligations, we could face significant consequences including but not limited to: government enforcement actions (e.g., investigations, fines, penalties, audits, inspections, and similar); litigation (including class action claims and mass arbitration demands); additional reporting requirements and/or oversight; bans or restrictions on processing personal data; or orders to destroy or not use personal data. For example, from time to time we have received and may in the future receive inquiries from government officials regarding data protection efforts, our security measures, cyber threats, and the cyber risk environment. Any of these events could have a material adverse effect on our reputation, business or financial condition, including but not limited to: loss of customers; interruptions or stoppages in our business operations; inability to process personal data or operate in certain jurisdictions; limited ability to develop or commercialize our products and services; expenditure of time and resources to defend against claims or inquiries; adverse publicity; or changes to our business model or operations.
If we are unable to successfully leverage AI technology to automate and drive efficiencies in our operations and products and services, our business, reputation, results of operations and financial condition could be harmed.
We have embarked on an AI transformation effort to take full advantage of automation, artificial intelligence, machine learning and other technologies to drive efficiencies and improve productivity within our Company and to
develop and improve our products, services and customer experiences. As we increase our investment in technology, software and systems to support this transformation effort, such investments may not increase productivity, result in more efficient operations or deliver better products, services and customer experiences. In addition, the evolution of these technologies may create unforeseen competitive pressures or cause disruption or delays to our operations, which may harm our business. Our competitors may incorporate AI technologies into their products and services more quickly or more successfully than us and could impair our ability to compete effectively and adversely affect our results of operations. Further, the rapid evolution of AI may require the dedication of significant resources to develop, test and maintain AI technologies. If our incorporation of AI technologies does not increase our operational efficiency in accordance with our expectations, or if competition increases for the technology and services provided by third parties, our business, results of operations and financial condition may be harmed. While we have established an AI transformation leadership team to coordinate and oversee our approach to AI adoption, the legal and regulatory landscape surrounding generative AI technologies is rapidly evolving and uncertain, including in the areas of intellectual property, discrimination, cybersecurity, privacy and data protection. Compliance with existing, new, and changing laws, regulations, and industry standards relating to AI may limit some uses of AI, impose significant operational costs, and limit our ability to develop, deploy, or use AI technologies. Further, the continued integration of any AI technologies into our products and services may result in new or enhanced governmental or regulatory scrutiny. Failure to appropriately respond to this evolving landscape may result in legal liability, regulatory action, or brand and reputational harm.
Any sensitive information (including confidential, competitive, proprietary, or personal data) that we input into a third-party generative AI platform could be leaked or disclosed to others or otherwise result in an information- or cyber-security incident, including if sensitive information is used to train the third parties’ AI model. Additionally, where an AI model ingests personal data and makes connections using such data, those technologies may reveal other personal or sensitive information generated by the model. Moreover, AI models may create flawed, incomplete, or inaccurate outputs, some of which may appear correct. This may happen if the inputs that the model relied on were inaccurate, incomplete or flawed (including if a bad actor “poisons” the AI with bad inputs or logic), or if the logic of the AI is flawed (a so-called “hallucination”). We may use AI outputs to make certain decisions. Due to these potential inaccuracies or flaws, the model could be biased and could lead us to make decisions that could bias certain individuals (or classes of individuals), and adversely impact their rights, employment, and ability to obtain certain pricing, products, services, or benefits.
We make substantial investments in software research and development and unsuccessful investments could materially adversely affect our business, financial condition and results of operations.
We continue to evolve our historically hardware-centric business model towards a model that includes more sophisticated software offerings, including subscription services and applications that complement our products and are intended to drive subscriber growth and future recurring revenue. As such, we have evolved the focus of our organization towards the delivery of more integrated hardware and software solutions for our customers, as well as related services, and we have and will continue to expend additional resources in this area in the future, including key new hires. Such endeavors may involve significant risks and uncertainties, including distraction of management from current operations and insufficient revenue to offset expenses associated with this strategy. Software development is inherently risky for a company such as ours with a historically hardware-centric business model, and accordingly, our efforts in software development may not be successful and could materially adversely affect our financial condition and operating results.
If we cannot proportionately decrease our cost structure in response to competitive price pressures, our gross margin and, therefore, our profitability could be adversely affected. In addition, if our software solutions, services, applications, pricing and other factors are not sufficiently competitive, or if there is an adverse reaction to our product and services decisions, we may lose market share in certain areas, which could adversely affect our revenue, profitability and prospects.
Software research and development is complex. We must make long-term investments, develop or obtain appropriate intellectual property and commit significant resources before knowing whether our output from these investments will successfully result in meaningful customer demand and retention for our products and services. We must accurately forecast mixes of software solutions and configurations that meet customer requirements, and we may not succeed at doing so within a given product’s life cycle or at all. Any delay in the development, production or
marketing of a new software solution could result in us not being among the first to market, which could further harm our competitive position. In addition, our regular testing and quality control efforts may not be effective in controlling or detecting all quality issues and defects. We may be unable to determine the cause, find an appropriate solution or offer a temporary fix to address defects. Finding solutions to quality issues or defects can be expensive and may result in additional warranty, replacement and other costs, adversely affecting our profits. If new or existing customers have difficulty with our software solutions or are dissatisfied with our services, our operating margins could be adversely affected, and we could face possible claims if we fail to meet our customers’ expectations. In addition, quality issues can impair our relationships with new or existing customers and adversely affect our brand and reputation, which could adversely affect our operating results.
If our products contain defects or errors, we could incur significant unexpected expenses, experience product returns and lost sales, experience product recalls, suffer damage to our brand and reputation, and be subject to product liability or other claims.
Our products are complex and may contain defects, errors or failures, particularly when first introduced or when new versions are released. The industry standards upon which many of our products are based are also complex, experience change over time and may be interpreted in different manners. Some errors and defects may be discovered only after a product has been installed and used by the end-user. As also noted in the risk factor “We make substantial investments in software research and development and unsuccessful investments could materially adversely affect our business, financial condition and results of operations” above, we devote considerable time and resources on testing and quality control efforts to detect quality issues and defects, and any reallocation of resources to fix such quality issues and defects could lead to delays in product introductions, which could further harm our competitive position. Additionally, certain software components in our product and corporate systems can be directly updated by our third-party partners. Defects, errors or failures in such updates could impact our customer's experience or cause business interruptions.
In addition, epidemic failure clauses are found in certain of our customer contracts, especially contracts with service providers. If invoked, these clauses may entitle the customer to return for replacement or obtain credits for products and inventory, as well as assess liquidated damage penalties and terminate an existing contract and cancel future or then current purchase orders. In such instances, we may also be obligated to cover significant costs incurred by the customer associated with the consequences of such epidemic failure, including freight and transportation required for product replacement and out-of-pocket costs for truck rolls to end user sites to collect the defective products. Costs or payments we make in connection with an epidemic failure may materially adversely affect our results of operations and financial condition. If our products contain defects or errors, or are found to be noncompliant with industry standards, we could experience decreased sales and increased product returns, loss of customers and market share, and increased service, warranty and insurance costs. In addition, defects in, or misuse of, certain of our products could cause safety concerns, including the risk of property damage or personal injury. If any of these events occurred, our reputation and brand could be damaged, and we could face product liability or other claims regarding our products, resulting in unexpected expenses and adversely impacting our operating results. For instance, if a third party were able to successfully overcome the security measures in our products, such a person or entity could misappropriate customer data, third party data stored by our customers and other information, including intellectual property and personal information. In addition, the operations of our end-user customers may be interrupted. If that happens, affected end-users or others may file actions against us alleging product liability, tort, or breach of warranty claims.
Our user growth, engagement, and monetization of our subscription services on mobile devices depend upon effective operation with mobile operating systems, networks, technologies, products, and standards that we do not control.
The substantial majority of our revenue from our subscription services is generated from use of such services on mobile devices. We are dependent on the interoperability of Armor and our parental controls services and our other products and services with popular mobile operating systems, networks, technologies, products, and standards that we do not control, such as the Android and iOS operating systems and mobile browsers. Any changes, bugs, or technical issues in such systems, or changes in our relationships with mobile operating system partners, handset manufacturers, browser developers, or mobile carriers, or in their terms of service or policies that degrade our products’ functionality, reduce or eliminate our ability to update or distribute our products or services, give preferential treatment to
competitive products, or charge fees related to the distribution of our products could adversely affect the usage of our subscription services products or our other products and services on mobile devices. We may not be successful in maintaining or developing relationships with key participants in the mobile ecosystem or in developing products and services that operate effectively with these technologies, products, systems, networks, or standards. In the event that it is more difficult for our users to access and use our subscription services products or our other products on their mobile devices, or if our users choose not to access or use our subscription services products or our other products on their mobile devices, our user growth and user engagement and our business could be harmed.
If we are unable to secure and protect our intellectual property rights, our ability to compete could be harmed.
We rely upon third parties for a substantial portion of the intellectual property that we use in our products. At the same time, we rely on a combination of copyright, trademark, patent and trade secret laws, nondisclosure agreements with employees, consultants and suppliers and other contractual provisions to establish, maintain and protect our intellectual property rights and technology. Despite efforts to protect our intellectual property, unauthorized third parties may attempt to design around, copy aspects of our product design or obtain and use technology or other intellectual property associated with our products. For example, one of our primary intellectual property assets is the NETGEAR name, trademark and logo. We may be unable to stop third parties from adopting similar names, trademarks and logos, particularly in those international markets where our intellectual property rights may be less protected. Furthermore, our competitors may independently develop similar technology or design around our intellectual property. In addition, we manufacture and sell our products in many international jurisdictions that offer reduced levels of protection and recourse from intellectual property misuse or theft, as compared to the United States. Our inability to secure and protect our intellectual property rights could significantly harm our brand and business, operating results and financial condition.
Financial, Legal, Regulatory and Tax Compliance Risks
We are currently involved in numerous litigation matters in the ordinary course and may in the future become involved in additional litigation, including litigation regarding intellectual property rights, consumer class actions and securities class actions, any of which could be costly and subject us to significant liability.
The networking industry is characterized by the existence of a large number of patents and frequent claims and related litigation regarding infringement of patents, trade secrets and other intellectual property rights. In particular, leading companies in the data communications markets, some of which are our competitors, have extensive patent portfolios with respect to networking technology. From time to time, third parties, including these leading companies, have asserted and may continue to assert exclusive patent, copyright, trademark and other intellectual property rights against us demanding license or royalty payments or seeking payment for damages, injunctive relief and other available legal remedies through litigation. These also include third-party non-practicing entities who claim to own patents or other intellectual property that cover industry standards that our products comply with. If we are unable to resolve these matters or obtain licenses on acceptable or commercially reasonable terms, we could be sued or we may be forced to initiate litigation to protect our rights. The cost of any necessary licenses or cost to defend litigation could significantly harm our business, operating results and financial condition. We may also choose to join defensive patent aggregation services in order to prevent or settle litigation and avoid the associated significant costs and uncertainties of litigation. These patent aggregation services may obtain, or have previously obtained, licenses for the alleged patent infringement claims against us and other patent assets that could be used offensively against us. The costs of such defensive patent aggregation services, while potentially lower than the costs of litigation, may be significant as well. At any time, any of these non-practicing entities, or any other third-party could initiate litigation against us, or we may be forced to initiate litigation against them, which could divert management attention, be costly to defend or prosecute, prevent us from using or selling the challenged technology, require us to design around the challenged technology and cause the price of our stock to decline. For example, in the past, various third parties have initiated litigation against us in Europe, China and the United States that carried the threat of an injunction on the importation of our products into certain European territories, the United States and China, as well as a significant increase in time and resources to defend against. In addition, third parties, some of whom are potential competitors, have initiated and may continue to initiate litigation against us, our manufacturers, suppliers, members of our sales channels or our service provider customers or even end user customers, alleging infringement of their proprietary rights with respect to existing or future products. In the event successful claims of infringement are brought by third parties, and we are unable to obtain licenses or independently develop alternative technology on a timely basis, we may be subject to indemnification obligations, be unable to offer competitive products, or be subject to increased expenses. Consumer class-action lawsuits related to the marketing and performance of our home networking products have been asserted and may in the future be asserted against us. Finally, we have been sued in securities class action lawsuits, and may in the future
be named in other similar lawsuits. For additional information regarding certain of the lawsuits in which we are involved, see the information set forth in Note 8, Commitments and Contingencies, in Notes to Consolidated Financial Statements in Item 8 of Part II of this Annual Report on Form 10-K. If we do not resolve these claims on a favorable basis, our business, operating results and financial condition could be significantly harmed.
We have been exposed to and may in the future be exposed to adverse currency exchange rate fluctuations in jurisdictions where we transact in local currency, which could harm our financial results and cash flows.
Because a significant portion of our business is conducted outside the United States, we face exposure to adverse movements in foreign currency exchange rates. These exposures may change over time as business practices evolve, and they could have a material adverse impact on our results of operations, financial position and cash flows. Although a portion of our international sales are currently invoiced in United States dollars, we have implemented and continue to implement for certain countries and customers both invoicing and payment in foreign currencies. Our primary exposure to movements in foreign currency exchange rates relates to non-U.S. dollar denominated sales in Europe, Japan and Australia as well as our global operations, and non-U.S. dollar denominated operating expenses and certain assets and liabilities. In addition, weaknesses in foreign currencies for U.S. dollar denominated sales could adversely affect demand for our products. For example, the volatility and strengthening of the U.S. dollar in 2022 had a meaningful negative impact on our international revenue and our profitability. Conversely, a strengthening in foreign currencies against the U.S. dollar could increase foreign currency denominated costs. As a result, we may attempt to renegotiate pricing of existing contracts or request payment to be made in U.S. dollars. We cannot be sure that our customers would agree to renegotiate along these lines. This could result in customers eventually terminating contracts with us or in our decision to terminate certain contracts, which would adversely affect our sales.
We hedge our exposure to fluctuations in foreign currency exchange rates as a response to the risk of changes in the value of foreign currency-denominated assets and liabilities. We may enter into foreign currency forward contracts or other instruments, the majority of which mature within approximately five months. Our foreign currency forward contracts reduce, but do not eliminate, the impact of currency exchange rate movements. For example, we do not execute forward contracts in all currencies in which we conduct business. In addition, we hedge to reduce the impact of volatile exchange rates on net revenue, gross profit and operating profit for limited periods of time. However, the use of these hedging activities may only offset a portion of the adverse financial effect resulting from unfavorable movements in foreign exchange rates.
We are exposed to the credit risk of some of our customers and to credit exposures, including bank failures, in weakened markets, which could result in material losses.
A substantial portion of our sales are on an open credit basis, with typical payment terms of 30 to 60 days in the United States and, because of local customs or conditions, longer in some markets outside the United States. We monitor individual customer financial viability in granting such open credit arrangements, seek to limit such open credit to amounts we believe the customers can pay, and maintain reserves we believe are adequate to cover exposure for doubtful accounts.
In the past, there have been bankruptcies amongst our customer base, and certain of our customers’ businesses face financial challenges that put them at risk of future bankruptcies. Although losses resulting from customer bankruptcies have not been material to date, any future bankruptcies could harm our business and have a material adverse effect on our operating results and financial condition. In addition, recent banking sector troubles and liquidity concerns in the financial services industry have impacted certain of our suppliers. Although such impacts have not resulted in material losses to date, any future bank sector disruptions could harm our business and have a material adverse effect on our operating results and financial condition. Furthermore, to the degree that turmoil in the credit markets makes it more difficult for some customers to obtain financing, our customers’ ability to pay could be adversely impacted, which in turn could have a material adverse impact on our business, operating results, and financial condition.
Changes in tax laws or exposure to additional income tax liabilities could affect our future profitability.
Factors that could materially affect our future effective tax rates include but are not limited to:
•changes in tax laws or the regulatory environment;
•changes in accounting and tax standards or practices;
•changes in the composition of operating income by tax jurisdiction; and
•our operating results before taxes.
We are subject to income taxes in the United States and numerous foreign jurisdictions. Our effective tax rate has fluctuated in the past and may fluctuate in the future. Future effective tax rates could be affected by changes in the composition of earnings in countries with differing tax rates, changes in deferred tax assets and liabilities, or changes in tax laws. Foreign jurisdictions have increased the volume of tax audits of multinational corporations. Further, many countries continue to consider changes in their tax laws by implementing new taxes such as the digital service tax and initiatives such as the Organization for Economic Co-operation and Development’s (OECD) Pillar II global minimum tax. More than 140 countries agreed to enact the Pillar II global minimum tax. While the OECD issued a framework model, each country will enact its own laws to incorporate Pillar II. While Pillar II is a global model, the country by country enactment of different laws to incorporate the framework is complex and there is uncertainty as to how the enactment of these laws will impact the Company. These changes could increase our total tax burden in the future. In addition, the acceleration of employee mobility as a result of the pandemic potentially increases the jurisdictional tax risk of our workforce. Changes in tax laws could affect the distribution of our earnings, result in double taxation and adversely affect our results.
The Tax Cuts and Jobs Act of 2017 included provisions effective for the 2022 tax year that eliminate the option to deduct research and development expenditures immediately in the year incurred and requires taxpayers to amortize such expenditures over five years for domestic payments and 15 years for payments to foreign parties. These provisions have not been deferred, modified, or repealed by Congress as was previously anticipated might occur. In years where we are profitable, these provisions have a material impact on our cash taxes which will continue in the future if these provisions are not modified, or repealed by Congress.
We have been audited by the Italy Tax Authority (“ITA”) for the 2004 through 2012 tax years. The ITA examination included an audit of income, gross receipts and value-added taxes. We have been in litigation with the ITA for the 2004 through 2012 years. This litigation was appealed by the ITA to the Italian Supreme Court. Our hearing on all years at the Italian Supreme Court was held on March 6, 2024. Decisions were issued in the Company’s favor for the 2006 through 2012 tax years. Decisions on the 2004 through 2006 tax years were reverted back to the lower court for re-hearing. If we are unsuccessful in defending our tax positions for the remaining years, our profitability will be reduced.
We are also subject to examination by other tax authorities, including state revenue agencies and other foreign governments. While we regularly assess the likelihood of favorable or unfavorable outcomes resulting from examinations by the IRS and other tax authorities to determine the adequacy of our provision for income taxes, there can be no assurance that the actual outcome resulting from these examinations will not materially adversely affect our financial condition and operating results. Additionally, the IRS and several foreign tax authorities have increasingly focused attention on intercompany transfer pricing with respect to sales of products and services and the use of intangibles. Tax authorities could disagree with our intercompany charges, cross-jurisdictional transfer pricing or other matters and assess additional taxes. If we do not prevail in any such disagreements, our profitability may be affected.
Historically the computation of our tax provision assumes that we will have sufficient profitability in the respective jurisdictions to continue to record deferred tax assets without a valuation allowance. As of the period ended October 1, 2023, we determined that it was no longer more likely than not that we would have sufficient profitability to realize the U.S. federal and state deferred tax assets. Accordingly, we recorded a full valuation allowance to impair U.S. federal and state deferred tax assets. Future benefit of these deferred tax assets will be realized in the period they are utilized.
We are subject to, and must remain in compliance with numerous new, existing and changing laws and regulations worldwide concerning the manufacturing, use, distribution and sale of our products. Some of our customers also require that we comply with their own unique requirements relating to these matters. Any failure to comply with such laws, regulations and requirements, and any associated unanticipated costs, may adversely affect our business, financial condition and results of operations.
We are a global company subject to numerous U.S. and foreign laws and regulations. Many of these laws and regulations are continuously evolving and developing, and the interpretations, application or impact of these laws and regulations on us are uncertain and could be interpreted in ways that harm our business. For example, we manufacture and sell products which contain electronic components, and such components may contain materials that are subject
to government regulation in both the locations that we manufacture and assemble our products, as well as the locations where we sell our products. Certain regulations also limit the use of lead in electronic components. To our knowledge, we maintain compliance with all applicable current government regulations concerning the materials utilized in our products, for all the locations in which we operate. Since we operate on a global basis, this is a complex process which requires continual monitoring of regulations and an ongoing compliance process to ensure that we and our suppliers are in compliance with all existing regulations. There are areas where new regulations have been enacted which could increase our cost of the components that we utilize or require us to expend additional resources to ensure compliance. For example, the SEC’s “conflict minerals” rules apply to our business, and we expended significant resources to ensure compliance. The implementation of these requirements by government regulators and our partners and/or customers could adversely affect the sourcing, availability, and pricing of minerals used in the manufacture of certain components used in our products. In addition, the supply-chain due diligence investigation required by the conflict minerals rules require expenditures of resources and management attention regardless of the results of the investigation. If there is an unanticipated new regulation or new interpretations or applications of existing laws and regulations which significantly impacts our use of various components or requires more expensive components, that regulation would have a material adverse impact on our business, financial condition and results of operations.
One area which has a large number of evolving and developing regulations is environmental compliance. Management of environmental pollution, climate change and other ESG considerations has produced significant legislative and regulatory efforts on a global basis, and we believe this will continue both in scope and the number of countries participating. These changes could directly increase the cost of energy which may have an impact on the way we manufacture products or utilize energy to produce our products. In addition, any new regulations or laws in the environmental area might increase the cost of raw materials we use in our products. Environmental regulations require us to reduce product energy usage, monitor and exclude an expanding list of restricted substances and to participate in required recover and recycling of our products. While future changes in regulations are certain, we are currently unable to predict how any such changes will impact us and if such impacts will be material to our business. If there is a new law or regulation, or a new interpretation and application of existing laws, that significantly increases our costs of manufacturing or causes us to significantly alter the way that we manufacture our products, this would have a material adverse effect on our business, financial condition and results of operations.
Our selling and distribution practices are also regulated in large part by U.S. federal and state as well as foreign antitrust and competition laws and regulations. In general, the objective of these laws is to promote and maintain free competition by prohibiting certain forms of conduct that tend to restrict production, raise prices, or otherwise control the market for goods or services to the detriment of consumers of those goods and services. Potentially prohibited activities under these laws may include unilateral conduct, or conduct undertaken as the result of an agreement with one or more of our suppliers, competitors, or customers. The potential for liability under these laws can be difficult to predict as it often depends on a finding that the challenged conduct resulted in harm to competition, such as higher prices, restricted supply, or a reduction in the quality or variety of products available to consumers. We utilize a number of different distribution channels to deliver our products to the end consumer, and regularly enter agreements with resellers of our products at various levels in the distribution chain that could be subject to scrutiny under these laws in the event of private litigation or an investigation by a governmental competition authority. In addition, many of our products are sold to consumers via the Internet. Many of the competition-related laws that govern these Internet sales were adopted prior to the advent of the Internet, and, as a result, do not contemplate or address the unique issues raised by online sales. New interpretations or applications of existing laws and regulations, whether by courts or by the state, federal or foreign governmental authorities charged with the enforcement of those laws and regulations, may also impact our business in ways we are currently unable to predict. Any failure on our part or on the part of our employees, agents, distributors or other business partners to comply with the laws and regulations governing competition can result in negative publicity and diversion of management time and effort and may subject us to significant litigation liabilities and other penalties.
In addition to government regulations, many of our customers require us to comply with their own requirements regarding manufacturing, health and safety matters, corporate social responsibility, employee treatment, anti-corruption, use of materials, environmental concerns and other ESG considerations. Some customers may require us to periodically report on compliance with their unique requirements, and some customers reserve the right to audit our business for compliance. We are increasingly subject to requests for compliance with these customer requirements. For example, there has been significant focus from our customers as well as the press regarding corporate social responsibility policies and other ESG considerations. We regularly audit our manufacturers; however, any deficiencies in compliance by our manufacturers may harm our business and our brand. In addition, we may not have the resources
to maintain compliance with these customer requirements and failure to comply may result in decreased sales to these customers, which may have a material adverse effect on our business, financial condition and results of operations.
We must comply with indirect tax laws in multiple jurisdictions, as well as complex customs duty regimes worldwide. Audits of our compliance with these rules may result in additional liabilities for taxes, duties, interest and penalties related to our international operations which would reduce our profitability.
Our operations are routinely subject to audit by tax authorities in various countries. Many countries have indirect tax systems where the sale and purchase of goods and services are subject to tax based on the transaction value. These taxes are commonly referred to as sales and/or use tax, value-added tax ("VAT") or goods and services tax ("GST"). In addition, the distribution of our products subjects us to numerous complex customs regulations, which frequently change over time. Failure to comply with these systems and regulations can result in the assessment of additional taxes, duties, interest and penalties. While we believe we are in compliance with local laws, we cannot assure that tax and customs authorities would agree with our reporting positions and upon audit may assess us additional taxes, duties, interest and penalties.
Additionally, some of our products are subject to U.S. export controls, including the Export Administration Regulations and economic sanctions administered by the Office of Foreign Assets Control. We also incorporate encryption technology into certain of our solutions. These encryption solutions and underlying technology may be exported outside of the United States only with the required export authorizations or exceptions, including by license, a license exception, appropriate classification notification requirement and encryption authorization.
Furthermore, our activities are subject to U.S. economic sanctions laws and regulations that prohibit the shipment of certain products and services without the required export authorizations, including to countries, governments and persons targeted by U.S. embargoes or sanctions. Additionally, the current U.S. administration has been critical of existing trade agreements and may impose more stringent export and import controls. Obtaining the necessary export license or other authorization for a particular sale may be time consuming and may result in delay or loss of sales opportunities even if the export license ultimately is granted. While we take precautions to prevent our solutions from being exported in violation of these laws, including using authorizations or exceptions for our encryption products and implementing IP address blocking and screenings against U.S. government and international lists of restricted and prohibited persons and countries, we have not been able to guarantee, and cannot guarantee that the precautions we take will prevent all violations of export control and sanctions laws, including if purchasers of our products bring our products and services into sanctioned countries without our knowledge. Violations of U.S. sanctions or export control laws can result in significant fines or penalties and incarceration could be imposed on employees and managers for criminal violations of these laws.
Also, various countries, in addition to the United States, regulate the import and export of certain encryption and other technology, including import and export licensing requirements, and have enacted laws that could limit our ability to distribute our products and services or our end-users’ ability to utilize our solutions in their countries. Changes in our products and services or changes in import and export regulations may create delays in the introduction of our products in international markets.
Adverse action by any government agencies related to indirect tax laws could materially adversely affect our business, operating results and financial condition.
We are exposed to credit risk and fluctuations in the market values of our investment portfolio.
Although we have not recognized any material losses on our cash equivalents and short-term investments, future declines in their market values could have a material adverse effect on our financial condition and operating results. Given the global nature of our business, we have investments with both domestic and international financial institutions. Accordingly, we face exposure to fluctuations in interest rates, which may limit our investment income. If these financial institutions default on their obligations or their credit ratings are negatively impacted by liquidity issues, credit deterioration or losses, financial results, or other factors, the value of our cash equivalents and short-term investments could decline and result in a material impairment, which could have a material adverse effect on our financial condition and operating results.
Governmental regulations of imports or exports affecting Internet security could affect our net revenue.
Any additional governmental regulation of imports or exports or failure to obtain required export approval of our encryption technologies could adversely affect our international and domestic sales. The United States and various foreign governments have imposed controls, export license requirements, and restrictions on the import or export of some technologies, particularly encryption technology. In addition, from time to time, governmental agencies have proposed additional regulation of encryption technology, such as requiring the escrow and governmental recovery of private encryption keys. In response to terrorist activity, governments could enact additional regulation or restriction on the use, import, or export of encryption technology. This additional regulation of encryption technology could delay or prevent the acceptance and use of encryption products and public networks for secure communications, resulting in decreased demand for our products and services. In addition, some foreign competitors are subject to less stringent controls on exporting their encryption technologies. As a result, they may be able to compete more effectively than we can in the United States and the international Internet security market.
If our goodwill becomes impaired, as occurred in 2022, we may be required to record a significant charge to earnings.
Goodwill is required to be tested for impairment at least annually. Factors that may be considered when determining if the carrying value of our goodwill may not be recoverable include a significant decline in our expected future cash flows or a sustained, significant decline in our stock price and market capitalization.
As a result of our acquisitions, we have significant goodwill recorded on our balance sheets. In addition, significant negative industry or economic trends, such as those that have occurred as a result of the recent economic downturn, including reduced estimates of future cash flows or disruptions to our business could indicate that goodwill might be impaired. If, in any period our stock price decreases to the point where our market capitalization is less than our book value, this too could indicate a potential impairment and we may be required to record an impairment charge in that period. Our valuation methodology for assessing impairment requires management to make judgments and assumptions based on projections of future operating performance. The estimates used to calculate the fair value of a reporting unit change from year to year based on operating results and market conditions. Changes in these estimates and assumptions could materially affect the determination of fair value and goodwill impairment for each reporting unit. For example, in 2022, the market price of our common stock and market capitalization declined and the U.S. WiFi market contracted, which had a significant negative impact on our Connected Home business. As a result, we recognized a goodwill impairment charge in the first quarter of 2022. We have not recognized any impairment charge on our NETGEAR for Business reporting unit. However, we operate in highly competitive environments and projections of future operating results and cash flows may vary significantly from actual results. As a result, we may incur substantial impairment charges to earnings in our financial statements should an impairment of our goodwill be determined on our NETGEAR for Business reporting unit, resulting in an adverse impact on our results of operations.
General Risk Factors
If we lose the services of our key personnel, we may not be able to execute our business strategy effectively.
Changes in our management team may disrupt our business, strategic and employee relationships, which may delay or prevent the achievement of our business objectives. During the transition periods, there may be uncertainty among investors, employees and others concerning our future direction and performance. For example, we appointed a new Chief Executive Officer effective January 31, 2024 and have made other leadership changes and hires. The failure to successfully transition could adversely affect our results of operations. We do not maintain any key person life insurance policies. Our business model requires extremely skilled and experienced senior management who are able to withstand the rigorous requirements and expectations of our business. Our success depends on senior management being able to execute at a very high level. The loss of our senior management or other key engineering, research, development, sales or marketing personnel, particularly if lost to competitors, could harm our ability to implement our business strategy and respond to the rapidly changing needs of our business. Our future success also depends on our ability to hire for key functions. The market for talent in the technology industry, especially in the areas of software and subscription services is competitive, and we may not have the resources to compete at the same level as larger companies who are able to offer more compelling compensation packages. Therefore, our ability to recruit new talent and retain existing talent may be adversely affected, and as a result our business as a whole may suffer. While we
believe that we have mitigated some of the business execution and business continuity risk with our organization into two business segments with separate leadership teams, the loss of any key personnel would still be disruptive and harm our business, especially given that our business is leanly staffed and relies on the expertise and high performance of our key personnel.
Global economic conditions could materially adversely affect our revenue and results of operations.
Our business has been and may continue to be affected by a number of factors that are beyond our control, such as general geopolitical, economic and business conditions, conditions in the financial markets, and changes in the overall demand for Pro AV, networking and smart home products. A severe and/or prolonged economic downturn could adversely affect our customers’ financial condition and the levels of business activity of our customers. Weakness in, and uncertainty about, global economic conditions may cause businesses to postpone spending in response to tighter credit, negative financial news and/or declines in income or asset values, which could have a material negative effect on the demand for networking products. Adverse changes in economic conditions, including inflation, slower growth or recession, new or increased tariffs and other barriers to trade, changes to fiscal and monetary policy, tighter credit, higher interest rates, high unemployment and currency fluctuations could adversely impact the demand and sale of our products to end users and the quantity of products our customers decide to purchase from us (or change the mix of products demanded) and make it more challenging to forecast our operating results and make business decisions. For example, during the fourth quarter of 2022, our APAC sales were dampened by a sudden economic downturn in China due to sudden, widespread COVID-19 infections and illnesses.
The uncertainty in global and regional economic conditions have also affected the financial markets and financial institutions on which we rely and have resulted in a number of adverse effects including a low level of liquidity in many financial markets, banking sector disruptions, extreme volatility in credit, equity, currency and fixed income markets, instability in the stock market, high inflation and high unemployment. Macroeconomic weakness and uncertainty also make it more difficult for us to accurately forecast revenue, gross margin and expenses. If we are unable to successfully anticipate changing economic, geopolitical and financial conditions, we may be unable to effectively plan for and respond to those changes which could further disrupt our business or limit our ability to access certain assets and materially adversely affect our business and results of operations.
In addition, availability of our products from third-party manufacturers and our ability to distribute our products into the United States and non-U.S. jurisdictions may be impacted by factors such as an increase in duties, tariffs or other restrictions on trade; raw material shortages or price increases, work stoppages, strikes and political unrest; uncertain economic conditions; economic crises and international disputes or conflicts; changes in leadership and the political climate in countries from which we import products; and failure of the United States to maintain normal trade relations with China and other countries. Any of these occurrences could materially adversely affect our business, operating results and financial condition.
Furthermore, uncertainty about, or worsening of economic conditions could adversely affect consumer sentiment and demand for our products and services. Consumer confidence and spending could be adversely affected by financial market volatility, negative financial news, conditions in the real estate, mortgage and technology markets, declines in income or asset values, changes to fuel and other energy costs, labor reductions, labor and healthcare costs and other economic factors. This could also impact the quantity of products our customers decide to purchase from us and may have a longer-term impact on the inventory levels these customers choose to carry. Lower demands could also impact manufacturing capacity utilization and contribute to further increased component costs. These and other economic factors could materially and adversely affect our revenue and results of operations.
Political events, war, terrorism, public health issues, climate changes, natural disasters, sudden changes in trade and immigration policies, and other circumstances could materially adversely affect us.
Our corporate headquarters are located in Northern California and one of our warehouses is located in Southern California. Substantially all of our critical enterprise-wide information technology systems, including our main servers, are currently housed in colocation facilities in Arizona and different geographic regions in the United States. The majority of our manufacturing occurs in Southeast Asia and mainland China. Each of these regions are known for or susceptible to seismic activity and other natural disasters, such as drought, wildfires, storms, sea-level rise, and flooding. Furthermore, the global effects of climate change have resulted in increased frequency and severity of these
extreme weather events and could cause physical damage or disrupt operations. If our manufacturers or warehousing facilities are disrupted or destroyed, we would be unable to distribute our products on a timely basis, which could harm our business. This could also lead to increased costs and decreased revenues.
In addition, health epidemics, war, terrorism, geopolitical uncertainties, social and economic instability, public health issues, sudden changes in trade and immigration policies (such as the higher tariffs on certain products imported from China, U.S. sanctions against Russia as a result of the Russia-Ukraine dispute, the Israel-Hamas conflict, and Red Sea crisis), and other business interruptions have caused and could cause damage or disruption to international commerce and the global economy, and thus could have a strong negative effect on us, our suppliers, logistics providers, manufacturing vendors and customers. Our business operations are subject to interruption by natural disasters, fire, power shortages, geopolitical disputes or conflicts, terrorist attacks and other hostile acts, labor disputes, public health issues, and other events beyond our control. In addition, in the past, labor disputes at third-party manufacturing facilities have led to workers going on strike, and labor unrest could materially affect our third-party manufacturers’ abilities to manufacture our products.
Such events could decrease demand for our products, make it difficult, more expensive or impossible for us to make and deliver products to our customers or to receive components from our direct or indirect suppliers, and create delays and inefficiencies in our supply chain. Wars or geopolitical conflicts, major public health issues, including pandemics such as COVID-19, could negatively affect us through more stringent employee travel restrictions, additional limitations in freight services or increase in freight costs, governmental actions limiting the movement of products between regions, delays in production ramps of new products, and disruptions in the operations of our manufacturing vendors and component suppliers.
Our stock price has experienced recent volatility and may be volatile in the future and your investment in our common stock could suffer a decline in value.
There has been significant volatility in the market price and trading volume of securities of companies in the technology industry and the stock market as a whole, which may be unrelated to the financial performance of these companies. These broad market fluctuations may negatively affect the market price of our common stock.
Some specific factors that may have a significant effect on our common stock market price include:
•actual or anticipated fluctuations in our operating results or our competitors’ operating results;
•actual or anticipated changes in the growth rate of the general networking sector, our growth rates or our competitors’ growth rates;
•conditions in the financial markets in general or changes in general economic, political and market conditions, including government efforts to mitigate economic downturns or control inflation;
•novel and unforeseen market forces and trading strategies, such as the massive short squeeze rally caused by retail investors on companies such as GameStop;
•actual or anticipated changes in governmental regulation, including taxation and tariff policies;
•interest rate or currency exchange rate fluctuations;
•our ability to forecast or report accurate financial results; and
•changes in stock market analyst recommendations regarding our common stock, other comparable companies or our industry generally.
We are required to evaluate our internal controls under Section 404 of the Sarbanes-Oxley Act of 2002 and any adverse results from such evaluation, including restatements of our issued financial statements, could impact investor confidence in the reliability of our internal controls over financial reporting.
Pursuant to Section 404 of the Sarbanes-Oxley Act of 2002, we are required to furnish a report by our management on our internal control over financial reporting. Such report must contain among other matters, an assessment of the effectiveness of our internal control over financial reporting as of the end of our fiscal year, including a statement as
to whether or not our internal control over financial reporting is effective. This assessment must include disclosure of any material weaknesses in our internal control over financial reporting identified by management. From time to time, we conduct internal investigations as a result of whistleblower complaints. In some instances, the whistleblower complaint may implicate potential areas of weakness in our internal controls. Although all known material weaknesses have been remediated, we cannot be certain that the measures we have taken ensure that restatements will not occur in the future. Execution of restatements create a significant strain on our internal resources and could cause delays in our filing of quarterly or annual financial results, increase our costs and cause management distraction. Restatements may also significantly affect our stock price in an adverse manner.
Continued performance of the system and process documentation and evaluation needed to comply with Section 404 is both costly and challenging. During this process, if our management identifies one or more material weaknesses in our internal control over financial reporting, we will be unable to assert such internal control is effective. If we are unable to assert that our internal control over financial reporting is effective as of the end of a fiscal year or if our independent registered public accounting firm is unable to express an opinion on the effectiveness of our internal control over financial reporting, we could lose investor confidence in the accuracy and completeness of our financial reports, which may have an adverse effect on our stock price.
None.
Item 1C. Cybersecurity
Risk management and strategy
We implement and maintain various information security processes designed to identify, assess and manage material risks from cybersecurity threats to our critical computer networks, third party hosted services, communications systems, hardware and software, and our critical data, including intellectual property and confidential information that is proprietary, strategic or competitive in nature (“Information Systems and Data”).
Our cybersecurity functions include representatives from information technology, engineering, information security, legal, impacted business units or products and other departments as applicable (together, the “Cybersecurity Team”) helps identify, assess and manage the Company’s cybersecurity threats and risks. The Cybersecurity Team is responsible for identifying, assessing and managing cybersecurity risks by monitoring and evaluating our threat environment using various methods including, for example manual and automated tools such as vulnerability scans, penetration tests and a public bug bounty program; subscribing to reports and services that identify cybersecurity threats; conducting risk assessments and internal and external audits; using external intelligence feeds; and conducting tabletop incident response exercises.
Depending on the environment, we implement and maintain various technical, physical, and organizational measures, processes, standards and policies designed to manage and mitigate material risks from cybersecurity threats to our Information Systems and Data, including, for example: (1) having an information security incident response plan for incident detection and response; (2) maintaining a disaster recovery plan, business continuity program, vulnerability management process and vendor risk management process; (3) conducting periodic risk assessments and employee training on cybersecurity; (4) maintaining security controls intended to address certain recognized industry cyber frameworks; (5) encrypting and segregating data, having network security controls, access controls and physical security, monitoring systems, managing assets (tracking and disposal) and conducting penetration testing; and (6) maintaining cybersecurity insurance.
Our assessment and management of material risks from cybersecurity threats are integrated into the Company’s overall risk management processes. For example, (1) cybersecurity risk is addressed as a component of the Company’s enterprise risk management program; (2) our Cybersecurity Team works with our management team in an effort to prioritize our risk management processes and mitigate cybersecurity threats that are more likely to lead to a material impact to our business; (3) our Cybersecurity Team and management team evaluates material risks from cybersecurity threats against our overall business objectives and reports to the cybersecurity committee chairperson of the board of
directors who may then notify the cybersecurity committee and board of directors (as appropriate), to further evaluate our overall enterprise risk.
We use third-party service providers to assist us from time to time in an effort to identify, assess, and manage material risks from cybersecurity threats. For example, these service providers include professional services firms, threat intelligence service providers, managed cybersecurity service providers, penetration testing firms and forensic investigators. We also have a public bug bounty program.
We use third-party service providers to perform a variety of functions throughout our business, such as using application providers for core applications (including finance, HR, CRM, email services, collaboration tools etc.), hosting companies for our websites, contract manufacturing organizations, distributors and supply chain resources for software, hardware, manufacturing and distribution of our products. We have a vendor management process designed to manage cybersecurity risks associated with our use of these providers. This process includes risk assessments, security questionnaires, review of vendor security programs, review of available security assessments, reports, and audits. Depending on the nature of the services provided, the sensitivity of the Information Systems and Data at issue, and the type of provider, our vendor management process may involve different levels of assessment designed to help identify cybersecurity risks associated with a provider and impose contractual obligations related to cybersecurity on the provider.
For a description of the risks from cybersecurity threats that may materially affect the Company and how they may do so, see our risk factors under Part 1. Item 1A. Risk Factors in this Annual Report on Form 10-K, including “Product security vulnerabilities, system security risks, data protection breaches, cyber-attacks, improper use of artificial intelligence (“AI”) tools, and other threats and risks, could disrupt or otherwise compromise our products, services, internal operations or information technology systems, or those of third parties with whom we work. Actual or perceived non-compliance with our privacy and security obligations could lead to regulatory investigations or actions, litigation, fines and penalties, business operation disruption, reputational harm, loss of revenue or profits, loss of customers or sales, and other adverse business consequences.”.
Governance
Our board of directors addresses the Company’s cybersecurity risk management as part of its general oversight function. The board of directors’ cybersecurity committee is responsible for overseeing the Company’s cybersecurity risk management processes, including oversight and mitigation of risks from cybersecurity threats.
Our cybersecurity risk assessment and management processes are implemented and maintained by certain Company management, including our Chief Information Officer, our VP of Corporate Cybersecurity and our Chief Technology Officer of Software, each of whom have over 20 years of industry expertise, including past roles at other public companies and as consultants.
Our Chief Information Officer and Chief Technology Officer of Software are responsible for hiring appropriate personnel, helping to integrate cybersecurity risk considerations into the Company’s overall risk management strategy, and communicating key priorities to relevant personnel. Our Chief Information Officer and Chief Technology Officer of Software are responsible for approving budgets, helping prepare for cybersecurity incidents, approving cybersecurity processes, and reviewing security assessments and other security-related reports.
Our information security incident response plan is designed to escalate certain cybersecurity incidents to members of management depending on the circumstances, including the incident response leadership team. The incident response leadership team works with the Company’s incident response team to help the Company mitigate and remediate cybersecurity incidents of which they are notified. In addition, the Company’s information security incident response plan includes reporting to the cybersecurity committee chairperson of the board of directors for certain cybersecurity incidents and, if appropriate, the cybersecurity committee and the board of directors.
The cybersecurity committee receives periodic notices (written and verbal) from the Cybersecurity Team concerning the Company’s significant cybersecurity threats and risk and the processes the Company has implemented that are intended to address them. The cybersecurity committee also receives quarterly reports, summaries or presentations related to the Company's cybersecurity program as it relates to both our corporate systems and products.
Item 2. Properties
Our principal administrative, sales, marketing, and research and development facilities currently occupy approximately 142,700 square feet in an office complex in San Jose, California, under a lease that expires in September 2025. In September 2024, we entered into a lease agreement to relocate our principal facilities to another office complex that occupies approximately 89,409 square feet in San Jose, California. This new lease will commence in 2025 and expires in September 2036.
Our international headquarters occupy approximately 7,000 square feet in an office complex in Cork, Ireland, under a lease that expires in December 2037. Our international sales personnel are based out of local sales offices or home offices in Australia, Canada, France, Germany, Hong Kong, India, Ireland, Italy, Japan, Korea, Poland, Singapore, Sweden, Switzerland, New Zealand, Spain, the Netherlands, and the United Kingdom. We also have operations personnel using leased facilities in Singapore, and Taipei (Taiwan). We maintain research and development facilities in Richmond B.C. (Canada), Taipei (Taiwan), and Bangalore (India). From time to time, we consider various alternatives related to our long-term facilities’ needs. While we believe our existing facilities provide suitable space for our operations and are adequate to meet our immediate needs, it may be necessary to lease additional space to accommodate future growth or to reduce office space to be in line with our needs to balance the office needs and hybrid work environment. We have invested in internal capacity and strategic relationships with outside manufacturing vendors as needed to meet anticipated demand for our products.
We use third parties to provide warehousing services to us in facilities located in both Northern and Southern California, Netherlands, Singapore and Australia.
Item 3. Legal Proceedings
The information set forth under the heading “Litigation and Other Legal Matters” in Note 8, Commitments and Contingencies, in Notes to Consolidated Financial Statements in Item 8 of Part II of this Annual Report on Form 10-K, is incorporated herein by reference. For additional discussion of certain risks associated with legal proceedings, see Item 1A, Risk Factors.
Item 4. Mine Safety Disclosures
Not applicable.
PART II
Item 5. Market for Registrant’s Common Equity, Related Stockholder Matters and Issuer Purchases of Equity Securities
Market Information
Our common stock is publicly traded on the Nasdaq Global Select Market (“Nasdaq”) under the symbol “NTGR”.
Holders of Common Stock
On February 7, 2025, there were 68 stockholders of record, one of which was Cede & Co., a nominee for Depository Trust Company (“DTC”). All of the shares of our common stock held by brokerage firms, banks and other financial institutions as nominees for beneficial owners are deposited into participant accounts at DTC and are therefore considered to be held of record by Cede & Co. as one stockholder.
Dividend Policy
We have never declared or paid cash dividends on our capital stock. We do not anticipate paying cash dividends in the foreseeable future.
Repurchase of Equity Securities by the Company
| | | | | | | | | | | | | | | | |
Period | | Total Number of Shares Purchased (2) | | | Average Price Paid per Share | | | Total Number of Shares Purchased as Part of Publicly Announced Plans or Programs (1) | | | Maximum Number of Shares that May Yet Be Purchased Under the Plans or Programs
(In millions) | |
September 30, 2024 - October 27, 2024 | | | 957 | | | $ | 20.06 | | | | — | | | | 3.8 | |
October 28, 2024 - November 24, 2024 | | | 223,691 | | | $ | 23.93 | | | | 222,155 | | | | 3.6 | |
November 25, 2024 - December 31, 2024 | | | 202,289 | | | $ | 26.57 | | | | 201,256 | | | | 3.4 | |
Total | | | 426,937 | | | $ | 25.18 | | | | 423,411 | | | | |
(1)From time to time, our Board of Directors has authorized programs under which we may repurchase shares of our common stock, depending on market conditions, in the open market or through privately negotiated transactions.
(2)During the three months ended December 31, 2024, we repurchased and retired, as reported on trade date, approximately 4,000 shares of common stock at a cost of approximately $79,000 to facilitate tax withholding for Restricted Stock Units.
Recent Sales of Unregistered Securities
None.
Stock Performance Graph
Notwithstanding any statement to the contrary in any of our previous or future filings with the SEC, the following information relating to the price performance of our common stock shall not be deemed “filed” with the SEC or “soliciting material” under the Exchange Act and shall not be incorporated by reference into any such filings.
The following graph shows a comparison from December 31, 2019 through December 31, 2024 of cumulative total return for our common stock, the Nasdaq Composite Index and the Nasdaq Computer Index. Such returns are based on historical results and are not intended to suggest future performance. Data for the Nasdaq Composite Index and the Nasdaq Computer Index assume reinvestment of dividends. We have never paid dividends on our common stock and have no present plans to do so.
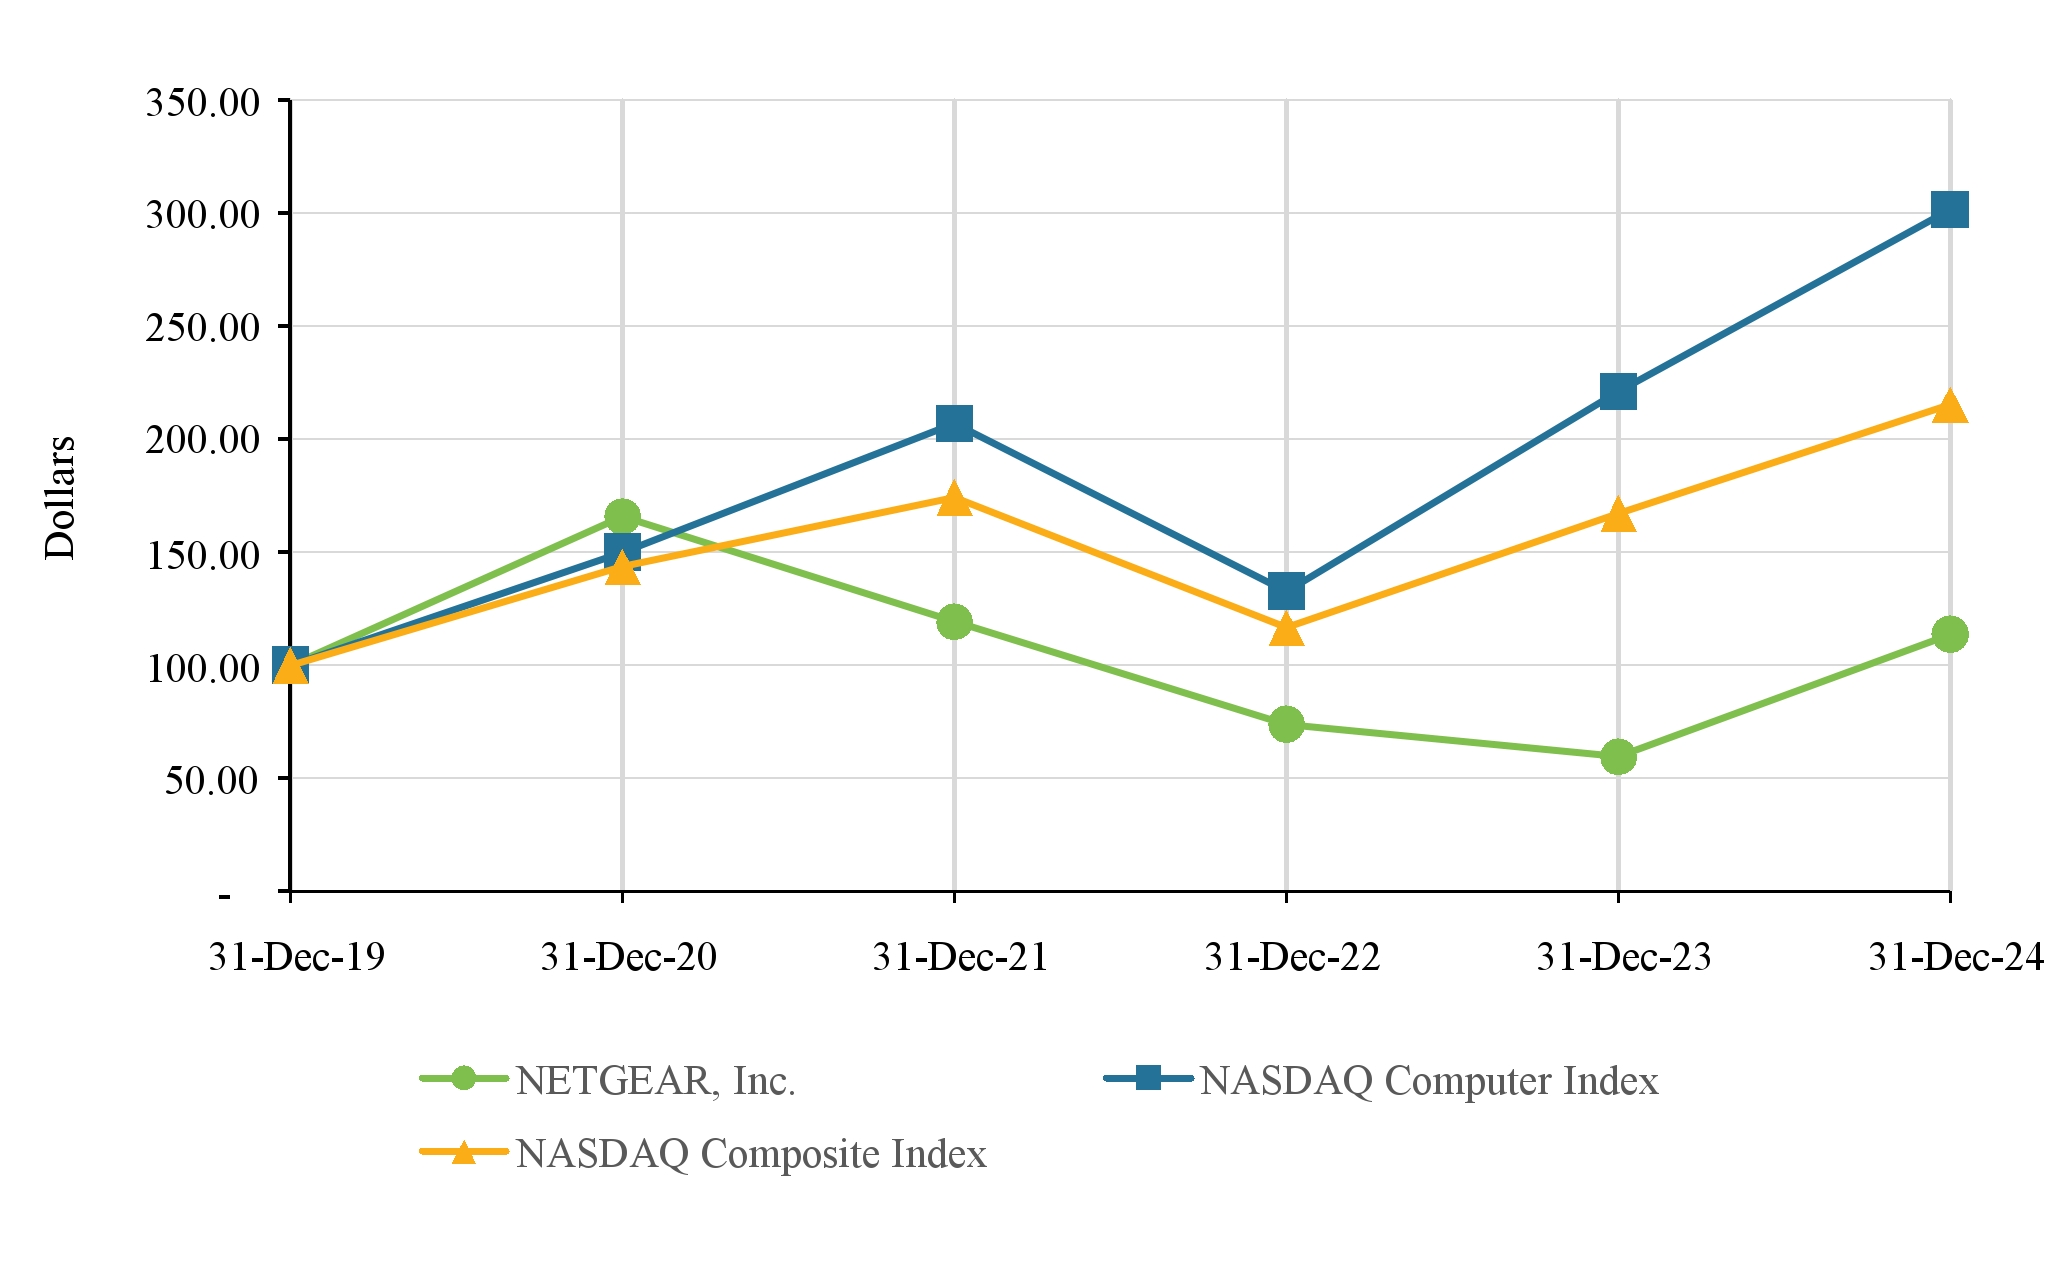
Item 6. [Reserved]
Item 7. Management’s Discussion and Analysis of Financial Condition and Results of Operations
You should read the following discussion of our financial condition and results of operations together with the audited consolidated financial statements and notes to the financial statements included elsewhere in this Form 10-K. This discussion contains forward-looking statements that involve risks and uncertainties. The forward-looking statements are not historical facts, but rather are based on current expectations, estimates, assumptions and projections about our industry, business and future financial results. Our actual results could differ materially from the results contemplated by these forward-looking statements due to a number of factors, including those discussed under “Risk Factors” in Part I, Item 1A above.
This section generally discusses the results of our operations for the year ended December 31, 2024 (“fiscal 2024”) compared to the year ended December 31, 2023 (“fiscal 2023”). For a discussion of the year ended December 31, 2023 compared to the year ended December 31, 2022, please refer to Part II, Item 7, “Management’s Discussion and Analysis of Financial Condition and Results of Operations” in our Annual Report on Form 10-K for the year ended December 31, 2023.
Business and Executive Overview
We are a global leader in innovative and advanced networking technologies for businesses, homes, and service providers. We deliver a wide range of intelligent solutions designed to unleash the full potential of connectivity. Our goal is to power extraordinary experiences where people collaborate and connect to a world of information and innovation. Our highly differentiated connected solutions range from switching and wireless products to augment business networks and audio and video (“AV”) over Ethernet for Pro AV applications to our good, better, and best WiFi solutions, security and support services to protect and enhance business and home networks. Additionally, we continually invest in research and development to create new technologies and services and to capitalize on technological inflection points and trends, such as audio and video over Ethernet, multi-Gigabit internet service to homes, WiFi 7, eSIM and future technologies. Our product line helps to create and extend wired and wireless networks as well as devices that attach to the network, such as services that complement and enhance our product line offerings. These products are available in multiple configurations to address the changing needs of our customers in each geographic region.
Through 2024, we operated and reported in two segments: NETGEAR for Business and Connected Home. We believe that this structure reflected our operational and financial management, and that it enabled us to focus on growth opportunities while maintaining financial discipline. The leadership team of each segment is focused on serving customer needs through product and service development efforts, both from a product marketing and engineering standpoint. The NETGEAR for Business segment offers reliable, easy-to-use, high-performance networking solutions, including switches, routers, access points, software, and AV over IP technologies, tailored to meet the diverse needs of organizations of all sizes. The Connected Home segment offers advanced connectivity, powerful performance, and enhanced security features right out of the box, designed to help keep families safe online, whether at home or on the go, including high-performance, dependable and easy-to-use premium WiFi networking solutions such as 4G/5G mobile products, WiFi 7 Tri-band and Quad-band mesh systems and routers, WiFi 6E, WiFi 6, and subscription services that provide consumers a range of value-added services focused on performance, security, privacy and premium support. We conduct business across three geographic regions: Americas; Europe, Middle East, and Africa (“EMEA”); and Asia Pacific (“APAC”).
As we announced in February 2025, beginning with the first quarter of 2025, the Connected Home segment will be separated into two segments, consisting of Mobile and Home Networking, in order to further strengthen operational and financial management and enable further focus on growth opportunities while maintaining financial discipline. Following this separation, the Company will operate and report in three segments: NETGEAR for Business, Mobile and Home Networking. In mid-January 2025, we conducted a restructuring activity to reduce targeted costs that we are reinvesting into the business to capitalize on our highest priority opportunities to expand revenue and profitability.
Business Overview
The markets in which our segments operate are intensely competitive and subject to rapid technological evolution. We believe that the principal competitive factors in the business, consumer, and service provider markets for networking products include product breadth, price points, brand name, security and privacy, performance, features, functionality and reliability, product availability, timeliness of new product introductions, size and scope of the sales channel, ease-of-installation, maintenance and use, and customer service and support. To remain competitive,
we believe we must continue to aggressively invest resources in highly differentiated, “good, better, best”, high performance reliable and trusted connectivity solutions, complemented by valuable subscription services, expanding our sales channels including our direct-to-consumer capabilities and custom installers, increasing engagement with our customers and manufacturing partners, and maintaining customer satisfaction worldwide. Our investments reflect our enhanced focus on the security of our products and systems, as the threat of cyber-attacks and exploitation of potential security vulnerabilities in our industry is on the rise and is increasingly a significant consumer concern.
We sell our products through multiple sales channels worldwide, including traditional and online retailers, wholesale distributors, direct market resellers (“DMRs”), value-added resellers (“VARs”), broadband service providers, and through our direct online store at www.netgear.com. Our retail channel includes traditional and online retail locations both domestically and internationally, such as Amazon.com (worldwide), Best Buy, Wal-Mart, Staples, Office Depot, Target, Electra (Sweden), Fnac Darty (Europe), JB HiFi (Australia), Elkjop (Norway), and Boulanger (France). Our DMRs include CDW Corporation, Insight Corporation, and PC Connection in domestic markets. Our main wholesale distributors include Ingram Micro, TD Synnex, and D&H Distribution Company. In addition, we also sell our products through broadband service providers, such as multiple system operators, xDSL, mobile, and other broadband technology operators domestically and internationally. Some of these retailers and broadband service providers purchase directly from us, while others are fulfilled through wholesale distributors around the world. A substantial portion of our net revenue is derived from a limited number of wholesale distributors, service providers and retailers. While we expect these channels to continue to be a significant part of our sales strategy, increasingly, customers are choosing to purchase products and services directly from us. We expect revenue through our direct online store or in-app offerings to continue to increase as a percentage of overall revenue for the foreseeable future.
Financial Overview
During the year ended December 31, 2024, our net revenue decreased by $67.1 million, compared to the prior year, mainly driven by decreases of $60.9 million in our Connected Home segment, and $6.2 million in our NETGEAR for Business segment. The decrease in Connected Home net revenue was mainly due to market contraction, leading to a year-over-year decline in the retail channel, and, to a lesser extent, a decline in net revenue in the service provider channel. The year-over-year decrease in NETGEAR for Business net revenue was mainly due to our work with our channel partners to optimize their inventory carrying levels in the first half of 2024. Despite the year-over-year decline in net revenue, we saw continued strong demand for the Pro AV product line of managed switches, which experienced double digit growth in end market sales, and growth in our services revenue. In addition, our premium portfolio of products in Connected Home segment continued to outperform the market. Our gross margin percentage decreased 450 basis points, compared to the prior year, primarily attributable to higher cost of inventory, higher freight costs, and higher excess and obsolete inventory expense as we accelerated the depletion of our slower moving inventory, partially offset by higher mix of NETGEAR for Business products, which generally carry higher gross margin. Income from operations increased by $45.5 million in spite of lower revenue, compared to the prior year, primarily attributable to the payment received from the litigation settlement with TP-Link, leading to a contra-expense of $92.7 million in the litigation reserves, and a reduction of $10.9 million in general and administrative expenses to offset the related legal fees incurred to date.
Geographically, net revenue from NETGEAR for Business decreased in Americas and EMEA but increased in APAC, whereas net revenue from Connected Home decreased in all three regions, during the year ended December 31, 2024, compared to the prior year.
Global Events Affecting our Business and Operations
Macroeconomic and geopolitical trends created uncertainty in the global economic environment in recent years. These include conditions such as the new tariffs by the Trump administration, the potential for a recession, fluctuations in inflation, interest rate changes, and the related negative impact on the global economy, foreign exchange rate fluctuations, particularly changes of the U.S. dollar, and ongoing worldwide tensions, including the Russia-Ukraine conflict, Israel-Hamas conflict, and Red Sea crisis. The extent of impacts from these macroeconomic and geopolitical trends on our ongoing operational and financial performance, including our ability to execute our business strategies in the expected time frame, will depend on future developments. The broader implications of the macroeconomic uncertainty, and any related disruptions to channel partners and freight are unpredictable. Refer to Item 1A, Risk Factors of Part I of this Annual Report on Form 10-K for various risks and uncertainties associated with the macroeconomic trends and uncertainty.
In 2024, we completed efforts to work with our channel partners to optimize their inventory carrying levels for both the NETGEAR for Business and Connected Home businesses and started to see more predictable performance aligned to the market during the second half of the year. The ongoing uncertain macroeconomic environment, elevated interest rates and cost of inventory, and significant destocking of the channel impacted our net revenue and profitability. We believe these factors will improve in 2025 and, combined with our positioning to take advantage of the highest growth market opportunities we are facing, we should expect growth and demonstrably improved profitability in the coming year, when normalized for the TP Link settlement.
Looking forward, we expect to continue to see more predictable performance that is aligned with the market for both of our businesses as now both our destocking and inventory reduction actions are substantially completed. We expect to experience continued net revenue growth in our NETGEAR For Business segment, led by our ProAV line of managed switches, along with a product portfolio that reaches the market more broadly, including our more recently introduced WiFi 7 mesh and router products, and 5G and WiFi 7 mobile hotspots. However, for NETGEAR for Business segment, although end user demand for our ProAV line of managed switches remains strong, we are facing lengthy lead times for supply, which will result in us under shipping in the first fiscal quarter of 2025. For our Connected Home segment, we are seeing signs of market stability and expect to experience normal seasonality in the retail portion of this business. We aim to execute on our strategy of capitalizing on the technological inflection points of audio and video over Ethernet, WiFi 7, WiFi 6E, WiFi 6, and 5G, to develop products that serve a broader segment of the market with a good, better, best product strategy, and to simplify, develop and roll out service offerings that build recurring service revenue streams.
Critical Accounting Estimates
Our consolidated financial statements have been prepared in accordance with accounting principles generally accepted in the United States of America and pursuant to the rules and regulations of the U.S. Securities and Exchange Commission (“SEC”). The preparation of these financial statements requires management to make assumptions, judgments and estimates that can have a significant impact on the reported amounts of assets, liabilities, revenues and expenses. We base our estimates on historical experience and on various other assumptions believed to be applicable and reasonable under the circumstances. Actual results could differ significantly from these estimates. These estimates may change as new events occur, as additional information is obtained and as our operating environment changes. On a regular basis, we evaluate our assumptions, judgments and estimates and make changes accordingly. We also discuss our critical accounting estimates with the Audit Committee of the Board of Directors. Note 1, The Company and Summary of Significant Accounting Policies, in Notes to Consolidated Financial Statements in Item 8 of Part II of this Annual Report on Form 10-K describes the significant accounting policies used in the preparation of the consolidated financial statements.
We have listed below our critical accounting estimates that we believe to have the greatest potential impact on our consolidated financial statements. Historically, our assumptions, judgments and estimates relative to our critical accounting estimates have not differed materially from actual results. We do not expect the estimates and assumptions are likely to change materially.
Revenue Recognition
We enter into contracts with customers to sell products and services, and while some sales agreements contain standard terms and conditions, there are agreements that contain non-standard terms and conditions and include promises to transfer multiple goods or services. As a result, significant interpretation and judgment is sometimes required to determine the appropriate accounting for these transactions including: (1) whether performance obligations are considered distinct and required to be accounted for separately or combined, including allocation of transaction price; (2) combining contracts that may impact the allocation of the transaction price between product and services; and (3) estimating and accounting for variable consideration, including rights of return, sales incentives, and price protection as a reduction of the transaction price.
Our standard obligation to our direct customers generally provides for a full refund if such products are not merchantable or are found to be damaged or defective. In determining estimates for future returns, we estimate variable consideration at the expected value based on management’s analysis of historical data, channel inventory levels, current economic trends and changes in customer demand. Sales incentives and price protection are determined based on a combination of the actual amounts committed and through estimating future expenditure based upon historical customary business practice, historical pricing information, current pricing trends, and channel inventory levels. We
continue to assess variable consideration estimates such that it is probable that a significant reversal of revenue will not occur.
Provisions for Excess and Obsolete Inventory
On a quarterly basis we assess the value of our inventory and write down its value for estimated excess and obsolete inventory based upon assumptions about the future demand by reviewing inventory quantities on hand and on order under non-cancelable purchase commitments in comparison to our estimated forecast of product demand to determine what inventory, if any, is not saleable at or above cost. Our analysis is based on the demand forecast which takes into account market conditions, product development plans, product life expectancy and other factors. Based on this analysis, we write down the affected inventory value for estimated excess and obsolescence charges. At the point of loss recognition, a new, lower cost basis for that inventory is established, and subsequent changes in facts and circumstances do not result in the restoration or increase in that newly established cost basis. As demonstrated during prior years, demand for our products can fluctuate significantly. If actual demand is lower than our forecasted demand and we fail to reduce our manufacturing accordingly, we could be required to write down the value of additional inventory, which would have a negative effect on our gross profit.
Goodwill
Goodwill is not amortized, but instead tested for impairment on an annual basis, or more frequently if certain events or indicators of potential impairment exist, and goodwill is written down when it is determined to be impaired.
We completed our annual impairment test of goodwill as of the first day of the fourth fiscal quarter of 2024, or September 30, 2024. We identified the reporting units for the purpose of goodwill impairment testing as NETGEAR for Business and Connected Home and performed a qualitative test. The results of the quantitative testing indicated that the fair value of the NETGEAR for Business reporting unit substantially exceeded its carrying amount, including goodwill, thus no goodwill impairment was recognized. An interim goodwill impairment test performed in the first fiscal quarter of 2022 resulted in an impairment charge of $44.4 million in respect to our Connected Home reporting unit, which reduced the goodwill of this reporting unit to zero. No goodwill impairment was recognized for our NETGEAR for Business reporting unit in the years ended December 31, 2024, 2023 and 2022. Refer to Note 3, Balance Sheet Components, in Notes to Consolidated Financial Statements in Item 8 of Part II of this Annual Report on Form 10-K for details.
For our NETGEAR for Business reporting unit, we do not believe it is likely that there will be a material change in the estimates or assumptions we use to test for impairment losses on goodwill. However, if the actual results are not consistent with our estimates or assumptions, we may be exposed to a future impairment charge that could be material.
Income Taxes
We account for income taxes under an asset and liability approach. Under this method, income tax expense is recognized for the amount of taxes payable or refundable for the current year. In addition, deferred tax assets and liabilities are recognized for the expected future tax consequences of temporary differences resulting from different treatments for tax versus accounting of certain items, such as accruals and allowances not currently deductible for tax purposes. These differences result in deferred tax assets and liabilities, which are included within the consolidated balance sheets. We must then assess the likelihood that our deferred tax assets will be recovered from future taxable income and to the extent we believe that recovery is not more likely than not, we must establish a valuation allowance. Our assessment considers the recognition of deferred tax assets on a jurisdictional basis. Accordingly, in assessing our future taxable income on a jurisdictional basis, we consider the effect of its transfer pricing policies on that income. We have recorded a full valuation allowance against U.S. federal and state deferred tax assets since the recovery of the assets is considered uncertain. We believe that deferred tax assets recorded for foreign jurisdictions are recoverable; however, if there were a change in our ability to recover these assets, we would be required to take a charge in the period in which we determined that recovery was not more likely than not.
Uncertain tax provisions are recognized under guidance that provides that a company should use a more-likely-than-not recognition threshold based on the technical merits of the income tax position taken. Income tax positions that meet the more-likely-than-not recognition threshold should be measured in order to determine the tax benefit to
be recognized in the financial statements. We include interest expense and penalties related to uncertain tax positions as additional tax expense.
The Company made an accounting policy election related to accounting for the tax effects of Global Intangible Low-Taxed Income (“GILTI”) that was implemented as part of the Tax Cuts and Jobs Act of 2017 (the “Tax Act”), enacted on December 22, 2017. With regard to GILTI, the Company accounts for the tax effects as a period cost, if and when incurred.
Recent Accounting Pronouncements
For a complete description of recent accounting pronouncements, including the expected dates of adoption and estimated effects on financial condition and results of operations, refer to Note 1, The Company and Summary of Significant Accounting Policies, in Notes to Consolidated Financial Statements in Item 8 of Part II of this Annual Report on Form 10-K.
Results of Operations
The following table sets forth, for the periods presented, the consolidated statements of operations data, which is derived from the accompanying consolidated financial statements:
| | | | | | | | | | | | | | | | | | | | | | | | |
| | Year Ended December 31, | |
(In thousands, except percentage data) | | 2024 | | | 2023 | | | 2022 | |
Net revenue | | $ | 673,759 | | | | 100.0 | % | | $ | 740,840 | | | | 100.0 | % | | $ | 932,472 | | | | 100.0 | % |
Cost of revenue | | | 477,832 | | | | 70.9 | % | | | 491,588 | | | | 66.4 | % | | | 681,923 | | | | 73.1 | % |
Gross profit | | | 195,927 | | | | 29.1 | % | | | 249,252 | | | | 33.6 | % | | | 250,549 | | | | 26.9 | % |
Operating expenses: | | | | | | | | | | | | | | | | | | |
Research and development | | | 81,082 | | | | 12.0 | % | | | 83,295 | | | | 11.2 | % | | | 88,443 | | | | 9.5 | % |
Sales and marketing | | | 123,694 | | | | 18.4 | % | | | 127,778 | | | | 17.4 | % | | | 139,675 | | | | 15.0 | % |
General and administrative | | | 63,468 | | | | 9.4 | % | | | 66,243 | | | | 8.9 | % | | | 56,316 | | | | 6.0 | % |
Litigation reserves, net | | | (89,012 | ) | | | (13.2 | )% | | | 178 | | | | 0.0 | % | | | 20 | | | | 0.0 | % |
Restructuring and other charges | | | 4,479 | | | | 0.7 | % | | | 3,962 | | | | 0.5 | % | | | 4,577 | | | | 0.5 | % |
Goodwill impairment | | | — | | | | — | % | | | — | | | | — | % | | | 44,442 | | | | 4.8 | % |
Intangibles impairment | | | — | | | | — | % | | | 1,071 | | | | 0.1 | % | | | — | | | | — | % |
Total operating expenses | | | 183,711 | | | | 27.3 | % | | | 282,527 | | | | 38.1 | % | | | 333,473 | | | | 35.8 | % |
Income (loss) from operations | | | 12,216 | | | | 1.8 | % | | | (33,275 | ) | | | (4.5 | )% | | | (82,924 | ) | | | (8.9 | )% |
Other income, net | | | 12,672 | | | | 1.9 | % | | | 14,139 | | | | 1.9 | % | | | 902 | | | | 0.1 | % |
Income (loss) before income taxes | | | 24,888 | | | | 3.7 | % | | | (19,136 | ) | | | (2.6 | )% | | | (82,022 | ) | | | (8.8 | )% |
Provision for (benefit from) income taxes | | | 12,525 | | | | 1.9 | % | | | 85,631 | | | | 11.5 | % | | | (13,035 | ) | | | (1.4 | )% |
Net income (loss) | | $ | 12,363 | | | | 1.8 | % | | $ | (104,767 | ) | | | (14.1 | )% | | $ | (68,987 | ) | | | (7.4 | )% |
Net Revenue by Geographic Region
Our net revenue consists of gross product shipments and service revenue, less allowances for estimated sales returns, price protection, end-user customer rebates and other channel sales incentives deemed to be a reduction of revenue per the authoritative guidance for revenue recognition, and net changes in deferred revenue.
For reporting purposes, revenue is generally attributed to each geographic region based upon the location of the customer.
| | | | | | | | | | | | | | | | | | | | |
| | Year Ended December 31, | |
(In thousands, except percentage data) | | 2024 | | | % Change | | | 2023 | | | % Change | | | 2022 | |
Americas | | $ | 456,040 | | | | (9.6 | )% | | $ | 504,349 | | | | (18.3 | )% | | $ | 617,211 | |
Percentage of net revenue | | | 67.7 | % | | | | | | 68.1 | % | | | | | | 66.2 | % |
EMEA | | $ | 127,260 | | | | (14.5 | )% | | $ | 148,922 | | | | (17.0 | )% | | $ | 179,358 | |
Percentage of net revenue | | | 18.9 | % | | | | | | 20.1 | % | | | | | | 19.2 | % |
APAC | | $ | 90,459 | | | | 3.3 | % | | $ | 87,569 | | | | (35.6 | )% | | $ | 135,903 | |
Percentage of net revenue | | | 13.4 | % | | | | | | 11.8 | % | | | | | | 14.6 | % |
Total net revenue | | $ | 673,759 | | | | (9.1 | )% | | $ | 740,840 | | | | (20.6 | )% | | $ | 932,472 | |
2024 vs 2023
Americas
Net revenue in Americas decreased in fiscal 2024, primarily attributable to a decline in Connected Home segment's net revenue of 13.0%, compared to the prior year. The decline in Connected Home segment's net revenue was mainly due to market contraction, leading to a year-over-year decline in the retail channel. NETGEAR For Business segment's net revenue slightly decreased, compared to the prior year.
EMEA
Net revenue in EMEA decreased in fiscal 2024, compared to the prior year, attributable to declines in NETGEAR for Business segment's net revenue of 13.7% and in Connected Home segment's net revenue of 16.5%. The net revenue decline in NETGEAR for Business was mainly driven by lower net revenue for our traditional transaction switches and our work with our channel partners to optimize their inventory carrying levels in the first half of 2024. The net revenue decline in Connected Home was mainly due to market contraction, leading to a year-over-year decline in both the retail and service provider channels.
APAC
Net revenue in APAC increased in fiscal 2024, compared to the prior year, mainly attributable to an increase in NETGEAR for Business segment’s net revenue of 21.3%, primarily driven by the higher demand for the Pro AV product line of managed switches. The net revenue increase in APAC in fiscal 2024, compared to the prior year, was partially offset by a decrease in our Connected Home segment’s net revenue of 15.8%, primarily driven by the lower demand for traditional broadband gateways.
For further discussions specific to our NETGEAR for Business and Connected Home, refer to the "Segment Information" section below.
Cost of Revenue and Gross Margin
Cost of revenue consists primarily of the following: the cost of finished products from our third-party manufacturers; overhead costs, including purchasing, product planning, inventory control, warehousing and distribution logistics; third-party software licensing fees; inbound freight; import duties/tariffs; warranty costs associated with returned goods; write-downs for excess and obsolete inventory; amortization of certain acquired intangibles and software development costs; and costs attributable to the provision of service offerings.
We outsource our manufacturing, warehousing and distribution logistics. We believe this outsourcing strategy allows us to better manage our product costs and gross margin. Our gross margin can be affected by a number of factors, including fluctuation in foreign exchange rates, sales returns, changes in average selling prices, end-user customer rebates and other channel sales incentives, changes in our cost of goods sold due to fluctuations and increases in prices paid for components, net of vendor rebates, royalty and licensing fees, warranty and overhead costs, inbound freight and duty/tariffs, conversion costs, charges for excess or obsolete inventory, amortization of acquired intangibles and capitalized software development costs. The following table presents costs of revenue and gross margin for the periods indicated:
| | | | | | | | | | | | | | | | | | | | |
| | Year Ended December 31, | |
(In thousands, except percentage data) | | 2024 | | | % Change | | | 2023 | | | % Change | | | 2022 | |
Cost of revenue | | $ | 477,832 | | | | (2.8 | )% | | $ | 491,588 | | | | (27.9 | )% | | $ | 681,923 | |
Gross margin percentage | | | 29.1 | % | | | | | | 33.6 | % | | | | | | 26.9 | % |
2024 vs 2023
Gross margin percentage decreased for fiscal 2024, compared to the prior year, primarily attributable to higher cost of inventory and freight costs, and higher excess and obsolete inventory expense as we accelerated the depletion of our slower moving inventory, partially offset by higher mix of NETGEAR for Business products, which generally carry higher gross margin.
We expect our gross margin in the first fiscal quarter of 2025 to be higher than the same quarter of 2024 level. Forecasting gross margin percentages is difficult, and there are a number of risks related to our ability to maintain or improve our current gross margin levels. Our cost of revenue as a percentage of net revenue can vary significantly based upon factors such as: uncertainties surrounding revenue levels, broad-based inflationary pressures and the uncertain macroeconomic environment, future pricing and/or potential discounts as a result of the economy or in response to the strengthening of the U.S. dollar in our international markets, competition, the timing of sales, and related production level variances; import customs duties and imposed tariffs; changes in technology; changes in
product mix; expenses associated with writing off excessive or obsolete inventory; variability of stock-based compensation costs; royalties to third parties; fluctuations in freight costs; manufacturing and purchase price variances; changes in prices on commodity components; and warranty costs. We expect that revenue derived from paid subscription service plans will continue to increase in the future, which may have a positive impact on our gross margin. However, we will continue to experience fluctuations in our gross margin due to the factors discussed above.
Operating Expenses
Research and Development
Research and development expenses consist primarily of personnel expenses, payments to suppliers for design services, safety and regulatory testing, product certification expenditures to qualify our products for sale into specific markets, prototypes, IT and facility allocations, and other consulting fees. Research and development expenses are recognized as they are incurred. Our research and development organization is focused on enhancing our ability to introduce innovative and easy-to-use products and services. The following table presents research and development expenses, for the periods indicated:
| | | | | | | | | | | | | | | | | | | | |
| | Year Ended December 31, | |
(In thousands, except percentage data) | | 2024 | | | % Change | | | 2023 | | | % Change | | | 2022 | |
Research and development | | $ | 81,082 | | | | (2.7 | )% | | $ | 83,295 | | | | (5.8 | )% | | $ | 88,443 | |
2024 vs 2023
The decline in research and development expenses in fiscal 2024, compared to the prior year, was primarily driven by a decrease in IT and facility allocation of $1.4 million, and a decrease in engineering projects and outside professional service fees of $1.0 million.
We believe that innovation and technological leadership is critical to our future success, and we are committed to continuing a significant level of research and development to develop new technologies, products and services. We expect research and development expenses as a percentage of net revenue in the first fiscal quarter of 2025 to be in line with or slightly higher than the same quarter of 2024 level. We continue to invest in research and development to grow audio and video over Ethernet, web-managed, AV over IP managed switches, NETGEAR for Business wireless products, our cloud platform capabilities, our recurring services and mobile applications, and to broaden our WiFi 7 offerings for consumers to align to our good-better-best strategy and broaden our 5G mobile products. Our NETGEAR for Business segment will receive most of our incremental investments for 2025 and we will be focused on in-sourcing our software capabilities, expanding our product portfolio that will allow us to grow our share in the sizable AV and enterprise WiFi markets. The research and development expense resulting from the incremental investment is partially offset by efficiencies in the research and development expense on the consumer side as affected by our restructuring in January 2025. Research and development expenses may fluctuate depending on the timing and number of development activities and could vary significantly as a percentage of net revenue, depending on actual revenues achieved in any given quarter.
Sales and Marketing
Sales and marketing expenses consist primarily of advertising, trade shows, corporate communications and other marketing expenses, product marketing expenses, outbound freight costs, amortization of certain intangibles, personnel expenses for sales and marketing staff, technical support expenses, and IT and facility allocations. The following table presents sales and marketing expenses, for the periods indicated:
| | | | | | | | | | | | | | | | | | | | |
| | Year Ended December 31, | |
(In thousands, except percentage data) | | 2024 | | | % Change | | | 2023 | | | % Change | | | 2022 | |
Sales and marketing | | $ | 123,694 | | | | (3.2 | )% | | $ | 127,778 | | | | (8.5 | )% | | $ | 139,675 | |
2024 vs 2023
The decline in sales and marketing expenses for fiscal 2024, compared to the prior year, was primarily attributable to a decrease in brand marketing expenditures of $5.7 million, partially offset by an increase in personnel-related expenditures of $1.2 million, mainly due to higher variable compensation.
We expect sales and marketing expenses as a percentage of net revenue in the first fiscal quarter of 2025 to be in line with the same quarter of 2024 level. Most of our incremental investments in sales and marketing in 2025 will be related to go-to-market capabilities of our product offerings in the NETGEAR for Business segment, partially offset by efficiencies in marketing on the consumer side. Expenses may fluctuate depending on revenue levels achieved as certain expenses, such as commissions, are determined based upon the revenues achieved. Forecasting sales and marketing expenses is highly dependent on expected revenue levels and could vary significantly depending on actual revenue achieved in any given quarter. Marketing expenses may also fluctuate depending upon the timing, extent and nature of marketing programs. Marketing expenditure committed with a customer is generally recorded as a reduction of revenue per authoritative guidance.
General and Administrative
General and administrative expenses consist of salaries and related expenses for executives, finance and accounting, human resources, information technology, professional fees, including legal costs associated with defending claims against us, allowance for doubtful accounts, IT and facility allocations, and other general corporate expenses. The following table presents general and administrative expenses, for the periods indicated:
| | | | | | | | | | | | | | | | | | | | |
| | Year Ended December 31, | |
(In thousands, except percentage data) | | 2024 | | | % Change | | | 2023 | | | % Change | | | 2022 | |
General and administrative | | $ | 63,468 | | | | (4.2 | )% | | $ | 66,243 | | | | 17.6 | % | | $ | 56,316 | |
2024 vs 2023
The decrease in general and administrative expenses for fiscal 2024, compared to the prior year, was primarily due to a decrease in legal and professional services fees of $13.9 million, mainly attributable to a $10.9 million reduction in expenses to offset the legal fees incurred to date associated with the litigation settlement payment from TP-Link. The decrease in general and administrative expenses was partially offset by an increase in personnel-related expenditures of $10.2 million, primarily due to higher compensations, which also included stock-based compensation, associated with executives’ transition, and higher variable compensation.
We expect general and administration expenses as a percentage of net revenue in the first fiscal quarter of 2025 to be below the same quarter of 2024 level. General and administrative expenses could fluctuate depending on a number of factors, including the level and timing of expenditures associated with litigation defense costs in connection with the litigation matters described in Note 8, Commitments and Contingencies, in Notes to Consolidated Financial Statements in Item 8 of Part II of this Annual Report on Form 10-K. Future general and administrative expense increases or decreases in absolute dollars are difficult to predict due to the lack of visibility of certain costs, including legal costs associated with defending claims against us, as well as legal costs associated with asserting and enforcing our intellectual property portfolio and other factors.
Litigation Reserves, Net
The following table presents litigation reserves, net for the periods indicated:
| | | | | | | | | | | | | | | | |
| | Year Ended December 31, | |
(In thousands, except percentage data) | | 2024 | | | % Change | | 2023 | | | % Change | | 2022 | |
Litigation reserves, net | | $ | (89,012 | ) | | ** | | $ | 178 | | | ** | | $ | 20 | |
___________________
** Percentage change not meaningful.
2024 vs 2023
The decrease in litigation reserves, net for fiscal 2024, compared to the prior year, was mainly attributable to a contra-expense of $92.7 million associated with the litigation settlement payment from TP-Link, partially offset by a $3.6 million litigation reserve associated with a liability from a settlement.
Restructuring and Other Charges
The following table presents restructuring and other charge for the periods indicated:
| | | | | | | | | | | | | | | | | | | | |
| | Year Ended December 31, | |
(In thousands, except percentage data) | | 2024 | | | % Change | | | 2023 | | | % Change | | | 2022 | |
Restructuring and other charges | | $ | 4,479 | | | | 13.0 | % | | $ | 3,962 | | | | (13.4 | )% | | $ | 4,577 | |
2024 vs 2023
The restructuring and other charges were slightly higher in fiscal 2024, compared to the prior year. The charges were primarily associated with the reorganization of our business in each year to better align the cost structure of the business with the areas to deliver long-term growth and expanding profitability. For a detailed discussion of restructuring and other charges, refer to Note 13. Restructuring and Other Charges, in Notes to Consolidated Financial Statements in Item 8 of Part II of this Annual Report on Form 10-K.
Other Income, Net
Other income, net consists of interest income, which represents amounts earned and incurred on our cash, cash equivalents and short-term investments, and other income and expenses, which primarily represents gains and losses on transactions denominated in foreign currencies, gains and losses on investments, and other non-operating income and expenses, including gain on litigation settlements. The following table presents other income, net for the periods indicated:
| | | | | | | | | | | | | | | | | | |
| | Year Ended December 31, | |
(In thousands, except percentage data) | | 2024 | | | % Change | | | 2023 | | | % Change | | 2022 | |
Other income, net | | $ | 12,672 | | | | (10.4 | )% | | $ | 14,139 | | | ** | | $ | 902 | |
___________________
** Percentage change not meaningful.
2024 vs 2023
The decrease in other income, net for fiscal 2024 was primarily due to $6.0 million cash received relating to a favorable litigation settlement for false product marketing in the prior year but not in the current year, partially offset by higher interest income resulting from higher interest rates and higher cash and short-term investment balances. For details on the changes in Other income, net, refer to Note 6, Other Income, Net, in Notes to Consolidated Financial Statements in Item 8 of Part II of this Annual Report on Form 10-K.
Provision for (Benefit from) Income Taxes
| | | | | | | | | | | | | | | | | | |
| | Year Ended December 31, | |
(In thousands, except percentage data) | | 2024 | | | % Change | | | 2023 | | | % Change | | 2022 | |
Provision for (benefit from) income taxes | | $ | 12,525 | | | | (85.4 | )% | | $ | 85,631 | | | ** | | $ | (13,035 | ) |
Effective tax rate | | | 50.3 | % | | | | | | (447.5 | )% | | | | | 15.9 | % |
___________________
** Percentage change not meaningful.
2024 vs 2023
The tax expense in 2024 resulted primarily from the increase in profits, plus the change in valuation allowance, partially offset by the benefit from certain changes in estimate upon filing the 2023 U.S. federal tax return and the
recognition of uncertain tax benefits. The tax expense in 2023 resulted primarily from the full valuation allowance recorded against the U.S. federal and state deferred tax assets.
During fiscal 2024, we evaluated the impact of the Global Intangible Low-Tax Income (“GILTI”), Foreign Derived Intangible Income (“FDII”) and Base Erosion and Anti-abuse Tax (“BEAT”) provisions. These provisions resulted in a net reduction of tax of $0.5 million.
We are subject to income taxes in the U.S. and numerous foreign jurisdictions. Our future foreign tax rate could be affected by changes in the composition in earnings in countries with tax rates differing from the U.S. federal rate. We are currently under examination in various U.S. and foreign jurisdictions.
Segment Information
In the first fiscal quarter of 2024, resulting from certain segment structure changes, we revised our allocation method by allocating certain historically unallocated operating expenses to our individual operating segments. The segment financial information from the prior years has been recast to conform to the current year presentation. Additional information on the change, a description of our products and services, as well as segment financial data, for each segment and a reconciliation of segment contribution income (loss) to income (loss) before income taxes can be found in Note 11, Segment Information, in Notes to Consolidated Financial Statements in Item 8 of Part II of this Annual Report on Form 10-K.
NETGEAR for Business Segment
| | | | | | | | | | | | | | | | | | | | |
| | Year Ended December 31, | |
(In thousands, except percentage data) | | 2024 | | | % Change | | | 2023 | | | % Change | | | 2022 | |
Net revenue | | $ | 287,812 | | | | (2.1 | )% | | $ | 293,975 | | | | (21.3 | )% | | $ | 373,649 | |
Percentage of net revenue | | | 42.7 | % | | | | | | 39.7 | % | | | | | | 40.1 | % |
Contribution income | | $ | 44,005 | | | | (22.5 | )% | | $ | 56,765 | | | | (22.8 | )% | | $ | 73,542 | |
Contribution margin | | | 15.3 | % | | | | | | 19.3 | % | | | | | | 19.7 | % |
2024 vs 2023
NETGEAR for Business net revenue decreased in fiscal 2024, compared to the prior year, primarily due to our work with our channel partners to optimize their inventory carrying levels in the first half of 2024. In the second half of fiscal 2024, we started to see more predictable performance aligned to the market, led by continuous strong demand for the Pro AV product line of managed switches, which experienced double digit growth in end market sales. Geographically, NETGEAR for Business net revenue increased in APAC but decreased in EMEA and Americas, compared to the prior year.
NETGEAR for Business contribution income decreased in fiscal 2024, compared to the prior year, primarily due to lower net revenue, and lower gross margin achievement mainly attributable to higher cost of inventory, higher excess and obsolete inventory expense as we accelerated the depletion of our slower moving inventory, and higher freight costs.
Connected Home Segment
| | | | | | | | | | | | | | | | | | | | |
| | Year Ended December 31, | |
(In thousands, except percentage data) | | 2024 | | | % Change | | | 2023 | | | % Change | | | 2022 | |
Net revenue | | $ | 385,947 | | | | (13.6 | )% | | $ | 446,865 | | | | (20.0 | )% | | $ | 558,823 | |
Percentage of net revenue | | | 57.3 | % | | | | | | 60.3 | % | | | | | | 59.9 | % |
Contribution (loss) income | | $ | (26,011 | ) | | ** | | | $ | 9,545 | | | ** | | | $ | (17,531 | ) |
Contribution margin | | | (6.7 | )% | | | | | | 2.1 | % | | | | | | (3.1 | )% |
___________________
** Percentage change not meaningful.
2024 vs 2023
Connected Home net revenue decreased in fiscal 2024, compared to the prior year, primarily due to market contraction, leading to a year-over-year decline in the retail channel, and, to a lesser extent, a decline in net revenue in service provider channel. Despite the decline in the overall consumer networking market in fiscal year 2024, our premium portfolio of products continued to outperform the market, and we saw growth in our service revenue. Geographically, Connected Home net revenue decreased across all three regions, compared to the prior year.
Connected Home contribution income decreased in fiscal 2024, compared to the prior year, primarily due to lower net revenue, and lower gross margin achievements due to higher cost of inventory, and higher freight costs, partially offset by lower warranty expense as a percentage of net revenue, which also represented a lower warranty in absolute dollar amount.
Liquidity and Capital Resources
Our principal sources of liquidity are cash, cash equivalents, short-term investments and cash generated from operations. As of December 31, 2024, we had cash, cash equivalents and short-term investment of $408.7 million, an increase of $125.0 million from December 31, 2023.
As of December 31, 2024, approximately 23% of our cash and cash equivalents and short-term investments were outside of the U.S. The cash and cash equivalents and short-term investments balances outside of the U.S. are subject to fluctuation based on the settlement of intercompany balances. As we repatriate these funds in accordance with our designation of funds not permanently reinvested outside of the U.S., we will be required to pay income taxes in certain U.S. states and applicable foreign withholding taxes during the period when such repatriation occurs. We have recorded deferred taxes for the tax effect of repatriating the funds to the U.S.
Cash Flows
The following table presents our cash flows for the periods presented:
| | | | | | | | | | | | |
| | Year Ended December 31, | |
(In thousands) | | 2024 | | | 2023 | | | 2022 | |
Cash provided by (used in) operating activities | | $ | 164,797 | | | $ | 56,853 | | | $ | (13,732 | ) |
Cash used in investing activities | | | (26,157 | ) | | | (27,433 | ) | | | (79,517 | ) |
Cash provided by (used in) financing activities | | | (28,913 | ) | | | 797 | | | | (24,023 | ) |
Net cash increase (decrease) | | $ | 109,727 | | | $ | 30,217 | | | $ | (117,272 | ) |
2024 vs 2023
Operating activities
Net cash provided by operating activities increased by $107.9 million in fiscal 2024, compared to the prior year, primarily due to a net proceed before tax of $103.6 million resulting from the litigation settlement payment from TP-Link and favorable working capital movements. Our accounts payable (excluding payables related to property and equipment) increased from $46.4 million as of December 31, 2023, to $57.4 million as of December 31, 2024, primarily due to the timing of inventory receipts and supplier payments. Accounts receivable decreased from $185.1 million as of December 31, 2023, to $156.2 million as of December 31, 2024, primarily due to the timing of cash
collections and lower revenue. Inventory decreased from $248.9 million as of December 31, 2023 to $162.5 million as of December 31, 2024, as we made further progress in optimizing our inventory levels.
Investing activities
Net cash used in investing activities decreased by $1.3 million in fiscal 2024, compared to the prior year, mainly driven by lower net purchases of short-term investments, partially offset by higher purchases of property and equipment.
Financing activities
Net cash used in financing activities was $28.9 million in fiscal 2024, compared to net cash provided of $0.8 million in the prior year, primarily due to repurchases of our common stock in the current year, partially offset by proceeds from exercise of stock options.
Based on our current plans and market conditions, we believe that our existing cash, cash equivalents and short-term investments, together with cash generated from operations, will be sufficient to satisfy our anticipated cash requirements, including contractual and other obligations, capital expenditures, and commitments for business operations, for the next twelve months and the foreseeable future. However, we may require or desire additional funds to support our operating expenses and capital requirements or for other purposes, such as acquisitions, and may seek to raise such additional funds through public or private equity financing or from other sources. We cannot assure you that additional financing will be available at all or that, if available, such financing would be obtainable on terms favorable to us and would not be dilutive. Our future liquidity and cash requirements will depend on numerous factors, including the introduction of new products and potential acquisitions of related businesses or technology.
Stock Repurchases
From time to time, our Board of Directors has authorized programs under which we may repurchase shares of our common stock. Under the authorizations, the timing and actual number of shares subject to repurchase are at the discretion of management and are contingent on a number of factors, such as levels of cash generation from operations, cash requirements for acquisitions and the price of our common stock. On July 16, 2024, the Board of Directors authorized management to repurchase up to 3.0 million shares of the Company’s outstanding common stock, incremental to the remaining shares under the Company’s previous repurchase program. As of December 31, 2024, approximately 3.4 million shares remained authorized for repurchase under the repurchase program. During the year ended December 31, 2024, we repurchased and retired, reported based on trade date, approximately 2.1 million shares of common stock, at a cost of approximately $33.6 million under the repurchase authorization. As of December 31, 2024, common stock repurchases at a cost of approximately $0.5 million were pending settlement. We did not repurchase any shares of common stock during the year ended December 31, 2023. Under the Inflation Reduction Act signed into law in 2022, the exercise tax on stock repurchases was approximately $0.2 million for the year ended December 31, 2024.
During the years ended December 31, 2024 and 2023, we repurchased and retired, reported based on trade date, approximately 226,000 and 198,000 shares of common stock at a cost of $3.4 million and $2.8 million, respectively, to administratively facilitate the withholding and subsequent remittance of personal income and payroll taxes for individuals receiving Restricted Stock Units.
For a detailed discussion of our common stock repurchases, refer to Note 9, Stockholders’ Equity, in Notes to Consolidated Financial Statements in Item 8 of Part II of this Annual Report on Form 10-K. We remain confident in our ability to generate meaningful levels of cash, and plan to continue to opportunistically repurchase shares in the future.
Contractual and Other Obligations
The following table summarizes our non-cancelable short-term and long-term contractual and other obligations as of December 31, 2024:
| | | | | | | | | | | | |
(In thousands) | | Short-term | | | Long-term | | | Total | |
Purchase obligations (1) (6) | | $ | 57,430 | | | $ | — | | | $ | 57,430 | |
Operating leases (2) | | | 13,149 | | | | 65,401 | | | | 78,550 | |
Other non-trade purchase commitments (3) (6) | | | 1,914 | | | | 9,368 | | | | 11,282 | |
Tax Act payables (4) (5) | | | 3,756 | | | | — | | | | 3,756 | |
| | $ | 76,249 | | | $ | 74,769 | | | $ | 151,018 | |
(1) Represent non-cancellable inventory-related purchase agreements with suppliers. A further $213.7 million of purchase orders beyond contractual termination periods remained outstanding. Consequently, we may incur expenses for materials and components, such as chipsets purchased by the supplier to fulfill the purchase order if the purchase order is cancelled. Expenses incurred in respect of cancelled purchase orders have historically not been significant relative to the original order value. For a detailed discussion on our purchase obligations, refer to Note 8, Commitments and Contingencies, in Notes to Consolidated Financial Statements in Item 8 of Part II of this Annual Report on Form 10-K.
Our commitments for property and equipment purchases as of December 31, 2024 were not material.
(2) Represent undiscounted non-cancellable remaining lease payments. These balances (excluding the amounts for the office lease described below) are included on our consolidated balance sheets. These lease payments are consistent with contractual terms and are not expected to differ significantly, unless a substantial change in our headcount needs requires us to exit an office facility early or expand our occupied space. For a detailed discussion on our operating leases, refer to Note 14, Leases, in Notes to Consolidated Financial Statements in Item 8 of Part II of this Annual Report on Form 10-K.
As of December 31, 2024, we entered into an office lease that has not yet commenced with short-term and long-term future lease payments of $0.8 million and $42.1 million, respectively, that are not yet recorded on our Consolidated Balance Sheets. This lease will commence in 2025 with a non-cancelable lease term of 11 years.
(3) Represent non-cancellable purchase commitments pertaining to non-trade activities.
(4) Represent estimated liability related to a one-time transaction tax that resulted from the passage of the Tax Act.
(5) Included on our consolidated balance sheets.
(6) For a detailed discussion, refer to Note 8, Commitments and Contingencies, in Notes to Consolidated Financial Statements in Item 8 of Part II of this Annual Report on Form 10-K.
In addition, as of December 31, 2024, we had $7.3 million of total gross unrecognized tax benefits and related interest and penalties. The timing of any payments that could result from these unrecognized tax benefits will depend upon a number of factors. The unrecognized tax benefits have been excluded from the contractual obligations table because reasonable estimates cannot be made of whether, or when, any cash payments for such items might occur. The possible reduction in liabilities for uncertain tax positions in multiple jurisdictions that may impact the statements of operations in the next 12 months was approximately $1.3 million, excluding the interest, penalties and the effect of any related deferred tax assets or liabilities.
Our contractual and other obligations are expected to be funded by our existing cash, cash equivalents and short-term investments, together with cash generated from operations.
Item 7A. Quantitative and Qualitative Disclosures About Market Risk
Interest Rate Risk
We do not use derivative financial instruments in our investment portfolio. We have an investment portfolio of fixed income securities that are classified as available-for-sale securities, which was immaterial as of December 31, 2024 and 2023. These securities, like all fixed income instruments, are subject to interest rate risk and will fall in value if market interest rates increase. We attempt to limit this exposure by investing primarily in highly rated short-term securities. Our investment policy requires investments to be rated triple-A with the objective of minimizing the potential risk of principal loss. Due to the short duration and conservative nature of our investment portfolio, a hypothetical movement of 10% in interest rates would not have a material impact on our operating results and the total value of the portfolio over the next fiscal year. We monitor our interest rate and credit risks, including our credit exposure to specific rating categories and to individual issuers. There were no impairment charges on such investments during fiscal years 2024, 2023 and 2022.
Foreign Currency Exchange Rate Risk
We invoice our international customers primarily in foreign currencies including, but not limited to, the Australian dollar, British pound, Euro, Canadian dollar, and Japanese Yen. As the customers that are currently invoiced in local currency become a larger percentage of our business, or to the extent we begin to bill additional customers in foreign currencies, the impact of fluctuations in foreign currency exchange rates could have a more significant impact on our results of operations. For those customers in our international markets that we continue to sell to in U.S. dollars, an increase in the value of the U.S. dollar relative to foreign currencies could make our products more expensive and therefore reduce the demand for our products. Such a decline in the demand for our products could reduce sales and negatively impact our operating results. Certain operating expenses of our foreign operations require payment in the local currencies.
We are exposed to risks associated with foreign exchange rate fluctuations due to our international sales and operating activities. These exposures may change over time as business practices evolve and could negatively impact our operating results and financial condition. Additionally, we enter into certain foreign currency forward contracts that have been designated as cash flow hedges under the authoritative guidance for derivatives and hedging to partially offset our business exposure to foreign currency exchange rate risk on portions of our anticipated foreign currency net revenue, cost of revenue, and certain operating expenses. The objective of these foreign currency forward contracts is to reduce the impact of currency exchange rate movements on our operating results by offsetting gains and losses on the forward contracts with increases or decreases in foreign currency transactions. The contracts are marked-to-market on a monthly basis with gains and losses included in other income, net in the consolidated statements of operations or in accumulated other comprehensive income (loss) on the consolidated balance sheets which are further reclassified from other comprehensive income (loss) to revenue, cost of revenue, or operating expenses when the underlying hedged items are recognized. We also use foreign currency forward contracts to partially offset our business exposure to foreign currency exchange rate risk associated with our foreign currency denominated assets and liabilities. These non-designated hedges are carried at fair value with adjustments to fair value recorded to other income, net in our consolidated statements of operations.
We do not use foreign currency contracts for speculative or trading purposes. Hedging of our balance sheet and anticipated cash flow exposures may not always be effective to protect us against currency exchange rate fluctuations. In addition, we do not fully hedge our balance sheets and anticipated cash flow exposures, leaving us at risk to foreign exchange gains and losses on the un-hedged exposures. If there were an adverse movement in exchange rates, we might suffer significant losses. For additional disclosure on our foreign currency contracts, refer to Note 4, Derivative Financial Instruments, in Notes to Consolidated Financial Statements in Item 8 of Part II of this Annual Report on Form 10-K.
As of December 31, 2024 and 2023, we had net assets in various local currencies. A hypothetical 10% movement in foreign exchange rates would result in a before-tax positive or negative impact of approximately $0.7 million, $0.7 million and $1.0 million net income (loss), net of our hedged position as of December 31, 2024, 2023 and 2022, respectively. Actual future gains and losses associated with our foreign currency exposures and positions may differ materially from the sensitivity analyses performed as of December 31, 2024 and 2023 due to the inherent limitations associated with predicting the foreign currency exchange rates, and our actual exposures and positions. For the years ended December 31, 2024, 2023, and 2022, 24% of total net revenue was denominated in a currency other than the U.S. dollar.
Item 8. Financial Statements and Supplementary Data
Report of Independent Registered Public Accounting Firm
To the Board of Directors and Stockholders of NETGEAR, Inc.
Opinions on the Financial Statements and Internal Control over Financial Reporting
We have audited the accompanying consolidated balance sheets of NETGEAR, Inc. and its subsidiaries (the "Company") as of December 31, 2024 and 2023, and the related consolidated statements of operations, of comprehensive income (loss), of stockholders’ equity and of cash flows for each of the three years in the period ended December 31, 2024, including the related notes and financial statement schedule listed in the index appearing under Item 15(a)(2) (collectively referred to as the "consolidated financial statements"). We also have audited the Company's internal control over financial reporting as of December 31, 2024, based on criteria established in Internal Control - Integrated Framework (2013) issued by the Committee of Sponsoring Organizations of the Treadway Commission (COSO).
In our opinion, the consolidated financial statements referred to above present fairly, in all material respects, the financial position of the Company as of December 31, 2024 and 2023, and the results of its operations and its cash flows for each of the three years in the period ended December 31, 2024 in conformity with accounting principles generally accepted in the United States of America. Also in our opinion, the Company maintained, in all material respects, effective internal control over financial reporting as of December 31, 2024, based on criteria established in Internal Control - Integrated Framework (2013) issued by the COSO.
Basis for Opinions
The Company's management is responsible for these consolidated financial statements, for maintaining effective internal control over financial reporting, and for its assessment of the effectiveness of internal control over financial reporting, included in Management’s Report on Internal Control over Financial Reporting appearing under Item 9A. Our responsibility is to express opinions on the Company’s consolidated financial statements and on the Company's internal control over financial reporting based on our audits. We are a public accounting firm registered with the Public Company Accounting Oversight Board (United States) (PCAOB) and are required to be independent with respect to the Company in accordance with the U.S. federal securities laws and the applicable rules and regulations of the Securities and Exchange Commission and the PCAOB.
We conducted our audits in accordance with the standards of the PCAOB. Those standards require that we plan and perform the audits to obtain reasonable assurance about whether the consolidated financial statements are free of material misstatement, whether due to error or fraud, and whether effective internal control over financial reporting was maintained in all material respects.
Our audits of the consolidated financial statements included performing procedures to assess the risks of material misstatement of the consolidated financial statements, whether due to error or fraud, and performing procedures that respond to those risks. Such procedures included examining, on a test basis, evidence regarding the amounts and disclosures in the consolidated financial statements. Our audits also included evaluating the accounting principles used and significant estimates made by management, as well as evaluating the overall presentation of the consolidated financial statements. Our audit of internal control over financial reporting included obtaining an understanding of internal control over financial reporting, assessing the risk that a material weakness exists, and testing and evaluating the design and operating effectiveness of internal control based on the assessed risk. Our audits also included performing such other procedures as we considered necessary in the circumstances. We believe that our audits provide a reasonable basis for our opinions.
Definition and Limitations of Internal Control over Financial Reporting
A company’s internal control over financial reporting is a process designed to provide reasonable assurance regarding the reliability of financial reporting and the preparation of financial statements for external purposes in accordance
with generally accepted accounting principles. A company’s internal control over financial reporting includes those policies and procedures that (i) pertain to the maintenance of records that, in reasonable detail, accurately and fairly reflect the transactions and dispositions of the assets of the company; (ii) provide reasonable assurance that transactions are recorded as necessary to permit preparation of financial statements in accordance with generally accepted accounting principles, and that receipts and expenditures of the company are being made only in accordance with authorizations of management and directors of the company; and (iii) provide reasonable assurance regarding prevention or timely detection of unauthorized acquisition, use, or disposition of the company’s assets that could have a material effect on the financial statements.
Because of its inherent limitations, internal control over financial reporting may not prevent or detect misstatements. Also, projections of any evaluation of effectiveness to future periods are subject to the risk that controls may become inadequate because of changes in conditions, or that the degree of compliance with the policies or procedures may deteriorate.
Critical Audit Matters
The critical audit matter communicated below is a matter arising from the current period audit of the consolidated financial statements that was communicated or required to be communicated to the audit committee and that (i) relates to accounts or disclosures that are material to the consolidated financial statements and (ii) involved our especially challenging, subjective, or complex judgments. The communication of critical audit matters does not alter in any way our opinion on the consolidated financial statements, taken as a whole, and we are not, by communicating the critical audit matter below, providing a separate opinion on the critical audit matter or on the accounts or disclosures to which it relates.
Provision for Excess and Obsolete Inventory
As described in Notes 1 and 3 to the consolidated financial statements, on a quarterly basis, management assesses the value of inventory and writes down its value for estimated excess and obsolete inventory based upon assumptions about the future demand by reviewing inventory quantities on hand and on order under non-cancellable purchase commitments in comparison to the estimated forecast of product demand to determine what inventory, if any, is not saleable at or above cost. Management’s excess and obsolete inventory analysis is primarily based on a demand forecast which takes into account market conditions, product development plans, product life expectancy and other factors. The recorded provision for excess and obsolete inventory was $6.1 million for the year ended December 31, 2024.
The principal considerations for our determination that performing procedures relating to the provision for excess and obsolete inventory is a critical audit matter are (i) the significant judgment by management to estimate excess and obsolete inventory and (ii) a high degree of auditor judgment, subjectivity and effort in performing procedures and evaluating audit evidence related to the significant assumption regarding the demand forecast.
Addressing the matter involved performing procedures and evaluating audit evidence in connection with forming our overall opinion on the consolidated financial statements. These procedures included testing the effectiveness of controls relating to the provision for excess and obsolete inventory. These procedures also included, among others, testing management’s process for estimating excess and obsolete inventory, evaluating the appropriateness of the method, testing the completeness, accuracy, and relevance of underlying data used in the estimate, and reasonableness of the significant assumption related to the demand forecast. Evaluating the reasonableness of the significant assumption related to the demand forecast involved considering (i) the accuracy of historical demand forecasting and (ii) historical sales trends.
/s/ PricewaterhouseCoopers LLP
San Jose, California
February 14, 2025
We have served as the Company’s auditor since 2002.
NETGEAR, INC.
CONSOLIDATED BALANCE SHEETS
(In thousands, except share and per share data)
| | | | | | | | |
| | December 31, 2024 | | | December 31, 2023 | |
ASSETS | | | | | | |
Current assets: | | | | | | |
Cash and cash equivalents | | $ | 286,444 | | | $ | 176,717 | |
Short-term investments | | | 122,246 | | | | 106,931 | |
Accounts receivable, net of allowance for doubtful accounts of $507 and $338 as of December 31, 2024 and December 31, 2023, respectively | | | 156,210 | | | | 185,059 | |
Inventories | | | 162,539 | | | | 248,851 | |
Prepaid expenses and other current assets | | | 30,590 | | | | 30,421 | |
Total current assets | | | 758,029 | | | | 747,979 | |
Property and equipment, net | | | 11,288 | | | | 8,273 | |
Operating lease right-of-use assets | | | 28,047 | | | | 37,285 | |
Goodwill | | | 36,279 | | | | 36,279 | |
Other non-current assets | | | 16,587 | | | | 17,326 | |
Total assets | | $ | 850,230 | | | $ | 847,142 | |
LIABILITIES AND STOCKHOLDERS’ EQUITY | | | | | | |
Current liabilities: | | | | | | |
Accounts payable | | $ | 58,481 | | | $ | 46,850 | |
Accrued employee compensation | | | 23,290 | | | | 21,286 | |
Other accrued liabilities | | | 148,078 | | | | 168,084 | |
Deferred revenue | | | 30,261 | | | | 27,091 | |
Income taxes payable | | | 9,973 | | | | 1,037 | |
Total current liabilities | | | 270,083 | | | | 264,348 | |
Non-current income taxes payable | | | 7,583 | | | | 12,695 | |
Non-current operating lease liabilities | | | 19,796 | | | | 29,698 | |
Other non-current liabilities | | | 11,702 | | | | 4,906 | |
Total liabilities | | | 309,164 | | | | 311,647 | |
Commitments and contingencies (Note 8) | | | | | | |
Stockholders’ equity: | | | | | | |
Preferred stock: $0.001 par value; 5,000,000 shares authorized; none issued or outstanding | | | — | | | | — | |
Common stock: $0.001 par value; 200,000,000 shares authorized; shares issued and outstanding: 28,500,118 and 29,615,723 as of December 31, 2024 and 2023, respectively | | | 29 | | | | 30 | |
Additional paid-in capital | | | 997,912 | | | | 967,651 | |
Accumulated other comprehensive income | | | 241 | | | | 136 | |
Accumulated deficit | | | (457,116 | ) | | | (432,322 | ) |
Total stockholders’ equity | | | 541,066 | | | | 535,495 | |
Total liabilities and stockholders’ equity | | $ | 850,230 | | | $ | 847,142 | |
The accompanying notes are an integral part of these consolidated financial statements.
NETGEAR, INC.
CONSOLIDATED STATEMENTS OF OPERATIONS
(In thousands, except per share data)
| | | | | | | | | | | | |
| | Year Ended December 31, | |
| | 2024 | | | 2023 | | | 2022 | |
Net revenue | | $ | 673,759 | | | $ | 740,840 | | | $ | 932,472 | |
Cost of revenue | | | 477,832 | | | | 491,588 | | | | 681,923 | |
Gross profit | | | 195,927 | | | | 249,252 | | | | 250,549 | |
Operating expenses: | | | | | | | | | |
Research and development | | | 81,082 | | | | 83,295 | | | | 88,443 | |
Sales and marketing | | | 123,694 | | | | 127,778 | | | | 139,675 | |
General and administrative | | | 63,468 | | | | 66,243 | | | | 56,316 | |
Litigation reserves, net | | | (89,012 | ) | | | 178 | | | | 20 | |
Restructuring and other charges | | | 4,479 | | | | 3,962 | | | | 4,577 | |
Goodwill impairment | | | — | | | | — | | | | 44,442 | |
Intangibles impairment | | | — | | | | 1,071 | | | | — | |
Total operating expenses | | | 183,711 | | | | 282,527 | | | | 333,473 | |
Income (loss) from operations | | | 12,216 | | | | (33,275 | ) | | | (82,924 | ) |
Other income, net | | | 12,672 | | | | 14,139 | | | | 902 | |
Income (loss) before income taxes | | | 24,888 | | | | (19,136 | ) | | | (82,022 | ) |
Provision for (benefit from) income taxes | | | 12,525 | | | | 85,631 | | | | (13,035 | ) |
Net income (loss) | | $ | 12,363 | | | $ | (104,767 | ) | | $ | (68,987 | ) |
| | | | | | | | | |
Net income (loss) per share | | | | | | | | | |
Basic | | $ | 0.43 | | | $ | (3.57 | ) | | $ | (2.38 | ) |
Diluted | | $ | 0.42 | | | $ | (3.57 | ) | | $ | (2.38 | ) |
Weighted average shares used to compute net income (loss) per share: | | | | | | | | | |
Basic | | | 28,905 | | | | 29,355 | | | | 29,007 | |
Diluted | | | 29,683 | | | | 29,355 | | | | 29,007 | |
The accompanying notes are an integral part of these consolidated financial statements.
NETGEAR, INC.
CONSOLIDATED STATEMENTS OF COMPREHENSIVE INCOME (LOSS)
(In thousands)
| | | | | | | | | | | | |
| | Year Ended December 31, | |
| | 2024 | | | 2023 | | | 2022 | |
Net income (loss) | | $ | 12,363 | | | $ | (104,767 | ) | | $ | (68,987 | ) |
Other comprehensive income (loss), before tax: | | | | | | | | | |
Change in unrealized gains and losses on derivatives | | | 72 | | | | 345 | | | | (511 | ) |
Change in unrealized gains and losses on available-for-sale investments | | | 43 | | | | 448 | | | | (320 | ) |
Other comprehensive income (loss), before tax | | | 115 | | | | 793 | | | | (831 | ) |
Tax benefit (provision) related to derivatives | | | (10 | ) | | | (43 | ) | | | 68 | |
Tax benefit (provision) related to available-for-sale investments | | | — | | | | (79 | ) | | | 79 | |
Other comprehensive income (loss), net of tax | | | 105 | | | | 671 | | | | (684 | ) |
Comprehensive income (loss) | | $ | 12,468 | | | $ | (104,096 | ) | | $ | (69,671 | ) |
The accompanying notes are an integral part of these consolidated financial statements.
NETGEAR, INC.
CONSOLIDATED STATEMENTS OF STOCKHOLDERS’ EQUITY
(In thousands)
| | | | | | | | | | | | | | | | | | | | | | | | |
| | Common Stock | | | | | | | | | | | | | |
| | Shares | | | Amount | | | Additional
Paid-In
Capital | | | Accumulated
Other
Comprehensive
Income (Loss) | | | Accumulated
Deficit | | | Total
Stockholder's
Equity | |
Balance as of December 31, 2021 | | | 29,286 | | | $ | 29 | | | $ | 923,228 | | | $ | 149 | | | $ | (226,591 | ) | | $ | 696,815 | |
Change in unrealized gains and losses on available-for-sale investments, net of tax | | | — | | | | — | | | | — | | | | (241 | ) | | | — | | | | (241 | ) |
Change in unrealized gains and losses on derivatives, net of tax | | | — | | | | — | | | | — | | | | (443 | ) | | | — | | | | (443 | ) |
Net loss | | | — | | | | — | | | | — | | | | — | | | | (68,987 | ) | | | (68,987 | ) |
Stock-based compensation | | | — | | | | — | | | | 17,734 | | | | — | | | | — | | | | 17,734 | |
Repurchase of common stock | | | (1,032 | ) | | | — | | | | — | | | | — | | | | (24,377 | ) | | | (24,377 | ) |
Restricted stock unit withholdings | | | (202 | ) | | | — | | | | — | | | | — | | | | (4,807 | ) | | | (4,807 | ) |
Issuance of common stock under stock-based compensation plans | | | 856 | | | | — | | | | 5,161 | | | | — | | | | — | | | | 5,161 | |
Balance as of December 31, 2022 | | | 28,908 | | | | 29 | | | | 946,123 | | | | (535 | ) | | | (324,762 | ) | | | 620,855 | |
Change in unrealized gains and losses on available-for-sale investments, net of tax | | | — | | | | — | | | | — | | | | 369 | | | | — | | | | 369 | |
Change in unrealized gains and losses on derivatives, net of tax | | | — | | | | — | | | | — | | | | 302 | | | | — | | | | 302 | |
Net loss | | | — | | | | — | | | | — | | | | — | | | | (104,767 | ) | | | (104,767 | ) |
Stock-based compensation | | | — | | | | — | | | | 17,938 | | | | — | | | | — | | | | 17,938 | |
Restricted stock unit withholdings | | | (198 | ) | | | — | | | | — | | | | — | | | | (2,793 | ) | | | (2,793 | ) |
Issuance of common stock under stock-based compensation plans | | | 906 | | | | 1 | | | | 3,590 | | | | — | | | | — | | | | 3,591 | |
Balance as of December 31, 2023 | | | 29,616 | | | | 30 | | | | 967,651 | | | | 136 | | | | (432,322 | ) | | | 535,495 | |
Change in unrealized gains and losses on available-for-sale investments, net of tax | | | — | | | | — | | | | — | | | | 43 | | | | — | | | | 43 | |
Change in unrealized gains and losses on derivatives, net of tax | | | — | | | | — | | | | — | | | | 62 | | | | — | | | | 62 | |
Net income | | | — | | | | — | | | | — | | | | — | | | | 12,363 | | | | 12,363 | |
Stock-based compensation | | | — | | | | — | | | | 22,678 | | | | — | | | | — | | | | 22,678 | |
Repurchase of common stock | | | (2,105 | ) | | | (2 | ) | | | — | | | | — | | | | (33,748 | ) | | | (33,750 | ) |
Restricted stock unit withholdings | | | (226 | ) | | | — | | | | — | | | | — | | | | (3,409 | ) | | | (3,409 | ) |
Issuance of common stock under stock-based compensation plans | | | 1,215 | | | | 1 | | | | 7,583 | | | | — | | | | — | | | | 7,584 | |
Balance as of December 31, 2024 | | | 28,500 | | | $ | 29 | | | $ | 997,912 | | | $ | 241 | | | $ | (457,116 | ) | | $ | 541,066 | |
The accompanying notes are an integral part of these consolidated financial statements.
NETGEAR, INC.
CONSOLIDATED STATEMENTS OF CASH FLOWS
(In thousands)
| | | | | | | | | | | | | |
| | | | |
| | Twelve Months Ended | | |
| | 2024 | | | 2023 | | | 2022 | | |
Cash flows from operating activities: | | | | | | | | | | |
Net income (loss) | | $ | 12,363 | | | $ | (104,767 | ) | | $ | (68,987 | ) | |
Adjustments to reconcile net income (loss) to net cash provided by (used in) operating activities: | | | | | | | | | | |
Depreciation and amortization | | | 6,514 | | | | 7,161 | | | | 10,070 | | |
Stock-based compensation | | | 22,678 | | | | 17,938 | | | | 17,734 | | |
Gain on investments, net | | | (3,552 | ) | | | (3,226 | ) | | | (87 | ) | |
Goodwill impairment | | | — | | | | — | | | | 44,442 | | |
Intangibles impairment | | | — | | | | 1,071 | | | | — | | |
Deferred income taxes | | | 1,001 | | | | 82,319 | | | | (21,842 | ) | |
Provision for excess and obsolete inventory | | | 6,064 | | | | 3,168 | | | | 3,657 | | |
Changes in assets and liabilities: | | | | | | | | | | |
Accounts receivable, net | | | 28,849 | | | | 92,425 | | | | (16,327 | ) | |
Inventories | | | 80,248 | | | | 47,595 | | | | 12,396 | | |
Prepaid expenses and other assets | | | 5,101 | | | | (3,189 | ) | | | 5,696 | | |
Accounts payable | | | 11,486 | | | | (38,947 | ) | | | 11,857 | | |
Accrued employee compensation | | | 2,004 | | | | (2,846 | ) | | | (572 | ) | |
Other accrued liabilities | | | (15,152 | ) | | | (45,893 | ) | | | (13,332 | ) | |
Deferred revenue | | | 3,368 | | | | 6,969 | | | | 5,425 | | |
Income taxes payable | | | 3,825 | | | | (2,925 | ) | | | (3,862 | ) | |
Net cash provided by (used in) operating activities | | | 164,797 | | | | 56,853 | | | | (13,732 | ) | |
Cash flows from investing activities: | | | | | | | | | | |
Purchases of short-term investments | | | (137,228 | ) | | | (135,920 | ) | | | (153,577 | ) | |
Proceeds from maturities of short-term investments | | | 120,290 | | | | 115,006 | | | | 80,417 | | |
Purchases of property and equipment | | | (8,994 | ) | | | (5,799 | ) | | | (5,757 | ) | |
Purchases of long-term investments | | | (225 | ) | | | (720 | ) | | | (600 | ) | |
Net cash used in investing activities | | | (26,157 | ) | | | (27,433 | ) | | | (79,517 | ) | |
Cash flows from financing activities: | | | | | | | | | | |
Repurchases of common stock | | | (33,088 | ) | | | — | | | | (24,377 | ) | |
Restricted stock unit withholdings | | | (3,409 | ) | | | (2,793 | ) | | | (4,807 | ) | |
Proceeds from exercise of stock options | | | 4,019 | | | | — | | | | 743 | | |
Proceeds from issuance of common stock under employee stock purchase plan | | | 3,565 | | | | 3,590 | | | | 4,418 | | |
Net cash provided by (used in) financing activities | | | (28,913 | ) | | | 797 | | | | (24,023 | ) | |
Net increase (decrease) in cash and cash equivalents | | | 109,727 | | | | 30,217 | | | | (117,272 | ) | |
Cash and cash equivalents, at beginning of period | | | 176,717 | | | | 146,500 | | | | 263,772 | | |
Cash and cash equivalents, at end of period | | $ | 286,444 | | | $ | 176,717 | | | $ | 146,500 | | |
Supplemental Cash Flow Information: | | | | | | | | | | |
Cash paid for income taxes, net | | $ | 7,738 | | | $ | 7,194 | | | $ | 9,396 | | |
Non-cash investing and financing activities: | | | | | | | | | | |
Unpaid property and equipment | | $ | 1,041 | | | $ | 476 | | | $ | 203 | | |
The accompanying notes are an integral part of these consolidated financial statements.
NETGEAR, INC.
NOTES TO CONSOLIDATED FINANCIAL STATEMENTS
Note 1. The Company and Summary of Significant Accounting Policies
The Company
NETGEAR, Inc. (“NETGEAR” or the “Company”) was incorporated in Delaware in January 1996. The Company is a global leader in innovative and advanced networking technologies for businesses, homes, and service providers. The Company delivers a wide range of intelligent solutions designed to unleash the full potential of connectivity. Its highly differentiated connected solutions range from switching and wireless products to augment business networks and audio and video (“AV”) over Ethernet for Pro AV applications to the good, better, and best WiFi solutions, security and support services to protect and enhance business and home networks. Additionally, the Company continually invest in research and development to create new technologies and services and to capitalize on technological inflection points and trends, such as audio and video over Ethernet, multi-Gigabit internet service to homes, WiFi 7, eSIM and future technologies. Its product line helps to create and extend wired and wireless networks as well as devices that attach to the network, such as services that complement and enhance its product line offerings. These products are available in multiple configurations to address the changing needs of our customers in each geographic region.
The Company sells networking products through multiple sales channels worldwide, including traditional retailers, online retailers, wholesale distributors, direct market resellers (“DMRs”), value-added resellers (“VARs”), broadband service providers and its direct online store at www.netgear.com.
Basis of presentation
The accompanying consolidated financial statements include the accounts of the Company and its wholly owned subsidiaries. All inter-company accounts and transactions have been eliminated in the consolidation of these subsidiaries.
Fiscal periods
The Company’s fiscal year begins on January 1 of the year stated and ends on December 31 of the same year. The Company reports its results on a fiscal quarter basis rather than on a calendar quarter basis. Under the fiscal quarter basis, each of the first three fiscal quarters ends on the Sunday closest to the calendar quarter end, with the fourth quarter ending on December 31.
Use of estimates
The preparation of financial statements in conformity with U.S. generally accepted accounting principles (“GAAP”) requires management to make estimates and assumptions that affect the reported amounts of assets and liabilities and disclosure of contingent assets and liabilities at the date of the financial statements and the reported amounts of revenues and expenses during the reported period. Actual results could differ from those estimates. As of the date of issuance of these consolidated financial statements, the Company is not aware of any specific event or circumstance that would require it to update its estimates, judgments or revise the carrying value of its assets or liabilities. These estimates may change, as new events occur and additional information is obtained, and are recognized in the consolidated financial statements as soon as they become known.
Significant Accounting Policies
Cash and cash equivalents
The Company considers all highly liquid investments with an original maturity or a remaining maturity at the time of purchase of three months or less to be cash equivalents. The Company deposits cash and cash equivalents with high credit quality financial institutions.
Investments
Short-term investments are partially comprised of marketable and convertible debt securities that consist of government and private company debts with an original maturity or a remaining maturity at the time of purchase, of
greater than three months and no more than 12 months. These debt securities are classified as available-for-sale securities in accordance with the provisions of the authoritative guidance for investments and are carried at fair value with unrealized gains and losses reported as a separate component of stockholders’ equity. Credit losses on available-for-sale debt securities with unrealized losses are recognized as allowances for credit losses limited to the amount by which fair value is below amortized cost.
Short-term investments also include marketable securities related to deferred compensation under the Company’s Deferred Compensation Plan. Mutual funds are the only investments allowed in the Company’s Deferred Compensation Plan and the investments are held in a grantor trust formed by the Company. The Company has classified these investments as trading securities as the grantor trust actively manages the asset allocation to match the participants’ notional fund allocations. These securities are recorded at fair market value with unrealized gains and losses included in Other income, net in the consolidated statements of operations.
Long-term investments are comprised of equity investments without readily determinable fair values, investments in convertible debt securities and investments in limited partnership funds, and are included in Other non-current assets on the consolidated balance sheets. Equity investments without readily determinable fair values are accounted for at cost, less impairment and adjusted for subsequent observable price changes obtained from orderly transactions for identical or similar investments issued by the same investee. Such changes in the basis of the equity investment are recognized in Other income, net in the consolidated statements of operations. The Company does not have a controlling interest or the ability to exercise significant influence over these investees and these investments do not have readily determinable fair values. Investments in convertible debt securities are carried at fair value with unrealized gains and losses reported as a separate component of stockholders’ equity. Investments in limited partnership funds amounted to $2.3 million as of December 31, 2024 and 2023, which are measured at fair value using the net asset value practical expedient. Changes in the fair value of these investments are recognized in Other income, net in the consolidated statements of operations.
Certain risks and uncertainties
The Company’s products are concentrated in the networking and smart connected industries, which are characterized by rapid technological advances, changes in customer requirements and evolving regulatory requirements and industry standards. The success of the Company depends on management’s ability to anticipate and/or to respond quickly and adequately to such changes. Any significant delays in the development or introduction of products could have a material adverse effect on the Company’s business and operating results.
The Company relies on a limited number of third parties to manufacture all of its products. If any of the Company’s third-party manufacturers cannot or will not manufacture its products in required volumes, on a cost-effective basis, in a timely manner, or at all, the Company will have to secure additional manufacturing capacity. Any interruption or delay in manufacturing could have a material adverse effect on the Company’s business and operating results.
Derivative financial instruments
The Company uses foreign currency forward contracts that generally mature within six months of inception to manage the exposures to foreign exchange risk related to expected future cash flows on certain forecasted revenue, cost of revenue, operating expenses, and on certain existing assets and liabilities. Under its foreign currency risk management strategy, the Company utilizes derivative instruments to reduce the impact of currency exchange rate movements on the Company’s operating results by offsetting gains and losses on the forward contracts with increases or decreases in foreign currency transactions. The Company does not use derivative financial instruments for speculative purposes.
The Company accounts for its derivative instruments as either assets or liabilities and records them at fair value. The Company has entered into master netting arrangements which allow net settlements under certain conditions. Although netting is permitted, it is currently the Company’s policy and practice to record all derivative assets and liabilities on a gross basis on the consolidated balance sheets. Derivatives that are not designated as hedges under the authoritative guidance for derivatives are adjusted to fair value through earnings. For derivative instruments that hedge the exposure to variability in expected future cash flows and are designated as cash flow hedges, the gains or losses on the derivative instrument are reported as a component of accumulated other comprehensive income in stockholders’ equity and reclassified into the same line item in the statement of operations as the hedged transaction, and in the same period that the hedged transaction effects earnings. To receive hedge accounting treatment, cash flow hedges must be highly effective in offsetting changes to expected future cash flows on hedged transactions.
Concentration of credit risk
Financial instruments that potentially subject the Company to a concentration of credit risk consist of cash and cash equivalents, short-term investments and accounts receivable. The Company believes that there is minimal credit risk associated with the investment of its cash and cash equivalents and short-term investments, due to the restrictions placed on the type of investment that can be entered into under the Company’s investment policy. The Company’s short-term investments consist of investment-grade securities, and the Company’s cash and investments are held and managed by recognized financial institutions.
The Company’s customers are primarily distributors as well as retailers and broadband service providers who sell or distribute the products to a large group of end-users. The Company maintains an allowance for doubtful accounts for estimated losses resulting from the inability of the Company’s customers to make required payments. The Company regularly performs credit evaluations of the Company’s customers’ financial condition and considers factors such as historical experience, credit quality, age of the accounts receivable balances, geographic or country-specific risks and current economic conditions that may affect customers’ ability to pay. The Company does not require collateral from its customers.
As of December 31, 2024, Best Buy, Inc. and affiliates and Amazon and affiliates each accounted for approximately 19% of the Company’s total accounts receivable. As of December 31, 2023, Best Buy, Inc. and affiliates and Amazon and affiliates accounted for approximately 21% and 11% of the Company’s total accounts receivable, respectively. No other customers accounted for 10% or greater of the Company’s total accounts receivable.
The Company is exposed to credit loss in the event of nonperformance by counterparties to the foreign currency forward contracts used to mitigate the effect of foreign currency exchange rate changes. The Company believes the counterparties for its outstanding contracts are large, financially sound institutions and thus, the Company does not anticipate nonperformance by these counterparties. In the event of turbulence or the onset of a financial crisis in financial markets, the failure of counterparties cannot be ruled out.
Fair value measurements
The carrying amounts of the Company’s financial instruments, including cash equivalents, short-term investments, accounts receivable, and accounts payable approximate their fair values due to their short maturities. Foreign currency forward contracts are recorded at fair value based on observable market data. Refer to Note 12, Fair Value Measurements, in Notes to Consolidated Financial Statements for disclosures regarding fair value measurements in accordance with the authoritative guidance for fair value measurements and disclosures.
Allowance for doubtful accounts
The Company maintains an allowance for doubtful accounts for estimated credit losses resulting from the inability of its customers to make required payments and reviews it quarterly. The Company determines expected credit losses by performing credit evaluations of its customers’ financial condition, establishing specific reserves for customers in an adverse financial condition and adjusting for its expectations of changes in conditions that may impact the collectability of outstanding receivables. The Company considers factors such as historical experience, credit quality, age of the accounts receivable balances, and geographic or country-specific risks. If the financial condition of the Company’s customers should deteriorate or if actual defaults are higher than the Company’s historical experience, additional allowances may be required, which could have an adverse impact on operating expenses.
Inventories
Inventories consist primarily of finished goods which are valued at the lower of cost and net realizable value, with cost being determined using the first-in, first-out method. On a quarterly basis, the Company assesses the value of the inventory and writes down its value for estimated excess and obsolete inventory based upon assumptions about the future demand by reviewing inventory quantities on hand and on order under non-cancelable purchase commitments in comparison to the Company’s estimated forecast of product demand to determine what inventory, if any, is not saleable at or above cost. The Company’s analysis is primarily based on the demand forecast which takes into account market conditions, product development plans, product life expectancy and other factors. At the point of loss recognition, a new, lower cost basis for that inventory is established, and subsequent changes in facts and circumstances do not result in the restoration or increase of the newly established cost basis.
Property and equipment, net
Property and equipment are stated at historical cost, less accumulated depreciation. Depreciation is computed using the straight-line method over the estimated useful lives of the assets as follows:
| |
Computer equipment | 2 years |
Furniture and fixtures | 5 years |
Software | 2-5 years |
Machinery and equipment | 2-3 years |
Leasehold improvements | Shorter of the lease term or 5 years |
Recoverability of assets to be held and used is measured by comparing the carrying amount of an asset to the estimated undiscounted future cash flows expected to be generated by the asset. If the carrying amount of the asset exceeds its estimated undiscounted future cash flows, an impairment charge is recognized in the amount by which the carrying amount of the asset exceeds the fair value of the asset. The carrying value of the asset is reviewed on a regular basis for the existence of facts, both internal and external, that may suggest impairment.
Leases
The Company determines if an arrangement is a lease or contains a lease at inception. Operating leases are included in operating lease right-of-use (“ROU”) assets, other accrued liabilities, and operating lease liabilities on the consolidated balance sheets. Leases with an initial term of 12 months or less are not recorded on the consolidated balance sheets. The Company has lease agreements with lease and non-lease components, which are generally accounted for separately. For certain office leases, the Company accounts for the lease and non-lease components as a single lease component to the extent that the timing and pattern of transfer are similar for the lease and non-lease components and the lease component qualifies as an operating lease. Lease expense is recognized on a straight-line basis over the lease term.
ROU assets represent the Company’s right to use an underlying asset for the lease term and lease liabilities represent the Company’s obligation to make lease payments arising from the lease. Operating lease ROU assets and liabilities are recognized at commencement date based on the present value of lease payments over the lease term. Generally, the implicit rate of interest in arrangements is not readily determinable and the Company utilizes its incremental borrowing rate in determining the present value of lease payments. The Company’s incremental borrowing rate is a hypothetical rate based on a benchmark interest rate adjusted for its specific credit risk. The operating lease ROU asset includes any lease payments made and excludes lease incentives.
Goodwill
Goodwill represents the purchase price over estimated fair value of net assets of businesses acquired in a business combination. Goodwill acquired in a business combination is not amortized, but instead tested for impairment at least annually on the first day of the fourth quarter. Should certain events or indicators of impairment occur between annual impairment tests, the Company performs the impairment test as those events or indicators occur. Examples of such events or circumstances include the following: a significant decline in the Company’s expected future cash flows; a sustained, significant decline in the Company’s stock price and market capitalization; a significant adverse change in the business climate; and slower growth rates.
Goodwill is tested for impairment at the reporting unit level by first performing a qualitative assessment to determine whether it is more likely than not (that is, a likelihood of more than 50%) that the fair value of the reporting unit is less than its carrying value. The qualitative assessment considers the following factors: macroeconomic conditions, industry and market considerations, cost factors, overall company financial performance, events affecting the reporting units, and changes in the Company’s share price. If the reporting unit does not pass the qualitative assessment, the Company estimates its fair value and compares the fair value with the carrying value of its reporting unit, including goodwill. If the fair value is greater than the carrying value of its reporting unit, no impairment is recorded. If the fair value is less than the carrying value, an impairment loss is recognized for the amount that the carrying amount of a reporting unit, including goodwill, exceeds its fair value, limited to the total amount of goodwill allocated to that reporting unit. The impairment charge would be recorded to earnings in the consolidated statements of operations.
Intangibles, net
Purchased intangibles with finite lives are amortized using the straight-line method over the estimated economic lives of the assets, which range from three to ten years. Finite-lived intangibles are reviewed for impairment whenever events or changes in circumstances indicate that the carrying amount of such assets may not be recoverable. Determination of recoverability is based on an estimate of undiscounted future cash flows resulting from the use of the asset and its eventual disposition.
Revenue Recognition
Revenue from contracts with customers is recognized when control of the promised goods or services is transferred to the customers at the amount that reflects the consideration that the Company expects to be entitled to in exchange for those goods or services.
The Company derives its revenue primarily from product sales, consisting of sales of NETGEAR for Business and Connected Home hardware products to its customers - retailers, distributors and service providers. Revenue is recognized at a point in time when control of the goods is transferred to the customer, generally occurring upon shipment or delivery dependent upon the terms of the underlying contract or once the risk of loss has been transferred to the customer. The Company evaluates its customers’ ability to pay based on various factors like historical payment experience, financial metrics and customer credit scores. Payment is collected within a short period of time from the date control over the product is transferred to the customer or after commencement of services.
Revenue for services relates primarily to sales of subscriptions of the Company’s value-added services, including security and privacy, parental controls and remote network management as well as advanced technical support and extended warranty. Service revenue is generally recognized over time ratably over the contract term beginning when the customer is expected to activate their account. Service contracts are generally for 30 days or 12 months in length, billed either monthly or annually and generally in advance. The technical support services consist of telephone and internet access to technical support personnel and extended warranty. All such service or support sales are typically recognized using an input measure of progress by looking at the time elapsed and based on the customer receiving the benefit throughout the contract period. To date, services revenue has not represented a significant percentage of our total revenue.
Revenue from all sale types is recognized at the transaction price and is calculated as selling price net of variable consideration which may include estimates for future returns, sales incentives and price protection. We record estimated variable consideration related to these items as a reduction to revenue at the time of revenue recognition. An allowance for future sales returns is established based on historical trends in product return rates. The Company uses the expected value method to arrive at the amount of variable consideration which is based on management’s analysis of historical and anticipated returns information, sell through and channel inventory levels, current economic trends, and changes in customer demand. The Company’s standard obligation to its direct customers generally provides for a full refund in the event that such product is not merchantable or is found to be damaged or defective. Certain distributors and retailers generally have the right to return product for stock rotation purposes as well. At the time the Company records the reduction to revenue, the Company includes within cost of revenue a write-down to reduce the carrying value of such products to net realizable value.
In addition to channel returns, sales incentive programs offer certain reimbursement rights to qualified distributors and retailers for marketing expenditures. Distinct goods or service received in exchange for payment from a customer are accrued within operating expenses or cost of revenue as appropriate, otherwise expenditures are recorded as a reduction of revenue. The Company provides price protections in limited cases, with variable consideration assessed based on customary business practice such as anticipated price decreases, historical pricing information and customer claims processing.
For products sold with third-party services where the Company obtains control of the products and/or service before transferring it to the customer, the Company recognizes revenue based on the gross amount billed to customers. The Company recognizes revenue on a net basis when the Company is acting as an agent between the customer and the vendor. The Company considers several factors in determining when it obtains control, such as determining the responsible party for fulfillment of the services, whether the Company has inventory risk before the service is transferred or if it has discretion to establish pricing for the third-party services.
Contracts with Multiple Performance Obligations
Some of the Company’s contracts with customers contain multiple promised goods or services. Such contracts may include hardware products with embedded software and other various software subscription services and support. For these contracts, the Company evaluates whether each deliverable is a distinct promise and if so, accounts for the promises separately as individual performance obligations. If a promised good or service is not distinct in accordance with the revenue guidance, the Company combines that good or service with the other promised goods or services in the arrangement and accounts for it as a distinct good. The embedded software on most of the hardware products is not considered distinct and therefore the combined hardware and incidental software are treated as one performance obligation and recognized at the point in time when control of product transfers to the customer. Services included with certain hardware products are considered distinct, as a customer can benefit from the product without these services and, therefore, the hardware and service are treated as separate performance obligations.
Revenue is allocated among the performance obligations based on their relative standalone selling prices. Standalone selling prices are generally determined based on the prices charged to customers or using an adjusted market assessment. The estimated standalone selling price is directly observable from those sales based on a range of prices and may include using information such as prices charged for similar offerings, estimated costs to provide the performance obligation and other observable inputs. Revenues allocated to the hardware and bundled subscription are recognized when control has transferred to the customer, which generally occurs when the product is shipped. Revenue allocated to product-related bundled services are deferred and recognized on a straight-line basis over the estimated period they are expected to be provided.
Deferred Revenue
Deferred revenue consists of service and support fees due in advance of satisfying performance. The majority of the Company’s deferred revenue balance consists of the unrecognized portion of service revenue from its value-added services, including cyber security, parental controls and remote network management services as well as advanced technical support and extended warranty, which is recognized as revenue ratably over the contractual service period. Performance obligations expected to be fulfilled within one year are classified as current liabilities and the remaining are recorded as noncurrent liabilities.
Warranties
Hardware products regularly include warranties to the end customers that consist of bug fixes, minor updates such that the product continues to function according to published specs in a dynamic environment, and phone support. These standard warranties are assurance type warranties and do not offer any services beyond the assurance that the product will continue working as specified. Therefore, warranties are not considered separate performance obligations in the arrangement. Instead, the expected cost of product warranty is accrued as expense at the time we recognize revenue in accordance with authoritative guidance. Extended warranties are sold separately and include additional support services. The transaction price for extended warranties is accounted for as service revenue and recognized over the life of the contract.
Shipping and Handling
Shipping and handling fees billed to customers are included in Net revenue. Shipping and handling costs associated with inbound freight are included in Cost of revenue. In cases where the Company gives a freight allowance to the customer for their own inbound freight costs, such costs are appropriately recorded as a reduction in Net revenue. Shipping and handling costs associated with outbound freight are included in Sales and marketing expenses. The Company has elected to account for shipping and handling activities related to contracts with customers as costs to fulfill the promise to transfer the associated products.
Shipping and handling costs associated with outbound freight totaled $9.5 million, $8.8 million and $16.9 million in the years ended December 31, 2024, 2023 and 2022, respectively.
Research and development
Costs incurred in the research and development of new products are charged to expense as incurred.
Advertising costs
Advertising costs are expensed as incurred. Total advertising and promotional expenses were $23.3 million, $28.9 million, and $27.0 million in the years ended December 31, 2024, 2023 and 2022, respectively.
Income taxes
The Company accounts for income taxes under an asset and liability approach. Under this method, income tax expense is recognized for the amount of taxes payable or refundable for the current year. In addition, deferred tax assets and liabilities are recognized for the expected future tax consequences of temporary differences resulting from different treatment for tax versus accounting for certain items, such as accruals and allowances not currently deductible for tax purposes. These differences result in deferred tax assets and liabilities, which are included within the consolidated balance sheets. The Company must then assess the likelihood that the Company’s deferred tax assets will be recovered from future taxable income and to the extent the Company believes that recovery is not more likely than not, the Company must establish a valuation allowance. The Company’s assessment considers the recognition of deferred tax assets on a jurisdictional basis. Accordingly, in assessing its future taxable income on a jurisdictional basis, the Company considers the effect of its transfer pricing policies on that income. The Tax Act introduced a new tax on Global Intangible Low-Taxed Income (“GILTI”) effective as of January 1, 2018. The Company’s policy is to treat GILTI as a period cost if and when incurred.
In the ordinary course of business there is inherent uncertainty in assessing the Company’s income tax positions. The Company assesses its tax positions and records benefits for all years subject to examination based on management’s evaluation of the facts, circumstances and information available at the reporting date. For those tax positions where it is more likely than not that a tax benefit will be sustained, the Company records the largest amount of tax benefit with a greater than 50 percent likelihood of being realized upon ultimate settlement with a taxing authority that has full knowledge of all relevant information. For those income tax positions where it is not more likely than not that a tax benefit will be sustained, no tax benefit has been recorded in the financial statements. Where applicable, associated interest and penalties have also been recognized as a component of income tax expense.
Net income (loss) per share
Basic net income (loss) per share is computed by dividing the net income (loss) for the period by the weighted average number of common shares outstanding during the period. Diluted net income per share is computed by dividing the net income for the period by the weighted average number of shares of common stock and potentially dilutive common stock outstanding during the period. Potentially dilutive common shares include common shares issuable upon exercise of stock options, vesting of restricted stock awards and performance shares, and issuances of shares under the Employee Stock Purchase Plan, which are reflected in diluted net income per share by application of the treasury stock method. Potentially dilutive common shares are excluded from the computation of diluted net income per share when their effect is anti-dilutive.
Stock-based compensation
The Company measures stock-based compensation at the grant date based on the fair value of the award. The fair value of stock options and the shares offered under the Employee Stock Purchase Plan (“ESPP”) is estimated using the Black-Scholes option pricing model. Estimated compensation cost relating to restricted stock units (“RSUs”) and performance shares is based on the closing fair market value of the Company’s common stock on the date of grant.
The compensation expense for equity awards is recognized over the vesting period of the award under a straight-line vesting method. Forfeitures are accounted for as they occur. In addition, for performance shares, the Company evaluates the probability of achieving the performance conditions at the end of each reporting period and records the related stock-based compensation expense based on performance to date over the service period. All excess tax benefits and tax deficiencies arising from stock awards vesting or settlement are recorded as income tax expense or benefit rather than in equity. Refer to Note 10, Employee Benefit Plans, in Notes to Consolidated Financial Statements for a further discussion on stock-based compensation.
Comprehensive income (loss)
Comprehensive income (loss) consists of net income (loss) and other gains and losses affecting stockholder’s equity that the Company excluded from net income (loss), including gains and losses related to fair value of short-term investments and the effective portion of cash flow hedges that were outstanding as of the end of the year.
Foreign currency translation and re-measurement
The Company’s functional currency is the U.S. dollar for all of its international subsidiaries. Foreign currency transactions of international subsidiaries are re-measured into U.S. dollars at the end-of-period exchange rates for monetary assets and liabilities, and at historical exchange rates for non-monetary assets. Revenue is re-measured at average exchange rates in effect during each period. Expenses are re-measured at average exchange rates in effect during each period, except for expenses related to non-monetary assets, which are re-measured at historical exchange rates. Gains and losses arising from foreign currency transactions are included in Other income, net.
Recent accounting pronouncements
Accounting Pronouncements Recently Adopted
In November 2023, the FASB issued ASU 2023-07, “Segment Reporting (Topic 280): Improvements to Reportable Segment Disclosures”, which improves reportable segment disclosure requirements, primarily through enhanced disclosures about significant segment expenses. ASU 2023-07 is effective for the Company for the year ended December 31, 2024 and early adoption is permitted. The Company adopted the new standard effective December 31, 2024 on a retrospective basis. The adoption did not have any impact on the Company’s financial position, results of operations or cash flows. Refer to Note 11, Segment Information, for details.
Accounting Pronouncements Not Yet Effective
In December 2023, the FASB issued ASU 2023-09, “Income Taxes (Topic 740): Improvements to Income Tax Disclosures”, which will require the Company to disclose specified additional information in its income tax rate reconciliation and provide additional information for reconciling items that meet a quantitative threshold. ASU 2023-09 will also require the Company to disaggregate its income taxes paid disclosure by federal, state and foreign taxes, with further disaggregation required for significant individual jurisdictions. ASU 2023-09 is effective for the Company for the year ending December 31, 2025 and early adoption is permitted. The guidance allows for adoption using either a prospective or retrospective transition method. The Company is evaluating the impact that the updated standard will have on its financial statement disclosures.
In November 2024, the FASB issued ASU 2024-03, “Income Statement - Reporting Comprehensive Income - Expense Disaggregation Disclosures (Subtopic 220-40): Disaggregation of Income Statement Expenses”, which expands the disclosure requirements for specific costs and expenses. ASU 2024-03 is effective for the Company for the year ended December 31, 2027 and early adoption is permitted. Upon adoption, the guidance should be applied retrospectively to all prior periods presented in the financial statements. The Company does not expect that the guidance will have material impacts on its financial position, results of operations or cash flows. The Company is evaluating the impact that the updated standard will have on its financial statement disclosures.
With the exception of the new standards discussed above, there have been no other new accounting pronouncements that have significance, or potential significance, to the Company’s financial position, results of operations and cash flows.
Note 2. Revenue Recognition
Revenue from contracts with customers is recognized when control of the promised goods or services is transferred to the customers, in an amount that reflects the consideration the Company expects to be entitled to in exchange for those goods or services.
Transaction Price Allocated to the Remaining Performance Obligations
Remaining performance obligations represent the transaction price allocated to performance obligations that are unsatisfied or partially unsatisfied as of the end of the reporting period. Unsatisfied and partially unsatisfied
performance obligations consist of contract liabilities, in-transit orders with destination terms, and non-cancellable backlog. Non-cancellable backlog includes goods for which customer purchase orders have been accepted, that are scheduled or in the process of being scheduled for shipment, and that are not yet invoiced.
The following table includes estimated revenue expected to be recognized in the future related to performance obligations that were unsatisfied or partially unsatisfied as of December 31, 2024:
| | | | | | | | | | | | | | | | |
(In thousands) | | Less than 1 year | | | 1 to 2 years | | | Beyond 2 years | | | Total | |
Performance obligations | | $ | 53,939 | | | $ | 3,023 | | | $ | 2,128 | | | $ | 59,090 | |
Contract Costs
Costs to fulfill a contract are capitalized when they relate directly to an existing contract or specific anticipated contract, generate or enhance resources that will be used to fulfill performance obligations and are recoverable. These costs include direct cost incurred at inception of a contract which enables the fulfillment of the performance obligation and totaled $6.3 million and $6.0 million as of December 31, 2024 and 2023, respectively. There was no impairment of capitalized contract costs during the years ended December 31, 2024, 2023 and 2022.
Applying the practical expedient, the Company recognizes the incremental costs of obtaining contracts as an expense when incurred if the amortization period of the assets that otherwise would have been recognized is one year or less. These costs are included in Sales and marketing and General and administrative expenses. If the incremental direct costs of obtaining a contract, which consist of sales commissions, relate to a service recognized over a period longer than one year, costs are deferred and amortized in line with the related services over the period of benefit. Deferred commissions are classified as non-current based on the original amortization period of over one year. As of December 31, 2024 and 2023, deferred commissions were not significant.
Contract Balances
The Company records accounts receivable when it has an unconditional right to consideration. Contract liabilities are recorded when cash payments are received or due in advance of performance, where the Company has unsatisfied performance obligations. Contract liabilities are mainly classified as Deferred revenue on the consolidated balance sheets.
Payment terms vary by customer. The time between invoicing and when payment is due is not significant. For certain products or services and customer types, payment is required before the products or services are delivered to the customer.
The following table reflects the contract balances:
| | | | | | | | | | |
(In thousands) | | Balance Sheet Location | | December 31, 2024 | | | December 31, 2023 | |
Accounts receivable, net | | Accounts receivable, net | | $ | 156,210 | | | $ | 185,059 | |
Contract liabilities – current | | Deferred revenue | | $ | 30,261 | | | $ | 27,091 | |
Contract liabilities – non-current | | Other non-current liabilities | | $ | 5,101 | | | $ | 4,903 | |
The difference in the balances of the Company’s contract assets and liabilities as of December 31, 2024 and 2023 primarily results from the timing difference between the Company’s performance and the customer’s payment.
During the years ended December 31, 2024, 2023 and 2022, $51.1 million, $48.4 million and $38.5 million, respectively, of revenue were deferred due to unsatisfied performance obligations for service contracts and undelivered product commitments, $47.7million, $41.4 million and $33.1 million, respectively, of revenue were recognized for the satisfaction of performance obligations, and $27.4 million, $21.5 million and $16.9 million, respectively, of this recognized revenue were included in the contract liability balance at the beginning of the period, respectively.
There were no significant changes in estimates during the periods that would affect the contract balances.
Disaggregation of Revenue
In the following table, net revenue is disaggregated by geographic region and sales channel. The Company conducts business across three geographic regions: Americas; Europe, Middle East, and Africa (“EMEA”); and Asia Pacific (“APAC”). The table also includes reconciliations of the disaggregated revenue by reportable segment. Through 2024, the Company operated and reported in two segments: NETGEAR for Business, and Connected Home. Sales and usage-based taxes are excluded from net revenue.
| | | | | | | | | | | | | | | | | | | | | | | | | | | | | | | | | | | | |
| | Year Ended December 31, | |
| | 2024 | | | 2023 | | | 2022 | |
(In thousands) | | NETGEAR
for Business | | | Connected
Home | | | Total | | | NETGEAR
for Business | | | Connected
Home | | | Total | | | NETGEAR
for Business | | | Connected
Home | | | Total | |
Geographic regions (1) : | | | | | | | | | | | | | | | | | | | | | | | | | | | |
Americas | | $ | 144,336 | | | $ | 311,704 | | | $ | 456,040 | | | $ | 146,045 | | | $ | 358,304 | | | $ | 504,349 | | | $ | 173,599 | | | $ | 443,612 | | | $ | 617,211 | |
EMEA | | | 88,782 | | | | 38,478 | | | | 127,260 | | | | 102,839 | | | | 46,083 | | | | 148,922 | | | | 129,626 | | | | 49,732 | | | | 179,358 | |
APAC | | | 54,694 | | | | 35,765 | | | | 90,459 | | | | 45,091 | | | | 42,478 | | | | 87,569 | | | | 70,424 | | | | 65,479 | | | | 135,903 | |
Total | | $ | 287,812 | | | $ | 385,947 | | | $ | 673,759 | | | $ | 293,975 | | | $ | 446,865 | | | $ | 740,840 | | | $ | 373,649 | | | $ | 558,823 | | | $ | 932,472 | |
Sales channels: | | | | | | | | | | | | | | | | | | | | | | | | | | | |
Service provider | | $ | 977 | | | $ | 90,035 | | | $ | 91,012 | | | $ | 579 | | | $ | 98,659 | | | $ | 99,238 | | | $ | 4,234 | | | $ | 148,331 | | | $ | 152,565 | |
Non-service provider | | | 286,835 | | | | 295,912 | | | | 582,747 | | | | 293,396 | | | | 348,206 | | | | 641,602 | | | | 369,415 | | | | 410,492 | | | | 779,907 | |
Total | | $ | 287,812 | | | $ | 385,947 | | | $ | 673,759 | | | $ | 293,975 | | | $ | 446,865 | | | $ | 740,840 | | | $ | 373,649 | | | $ | 558,823 | | | $ | 932,472 | |
Note 3. Balance Sheet Components
Available-for-sale investments
Amortized cost and estimated fair market value of investments classified as available-for-sale, excluding cash equivalents, as of December 31, 2024, and December 31, 2023, were as follows:
| | | | | | | | | | | | | | | | |
| | December 31, 2024 | |
(In thousands) | | Amortized Cost | | | Unrealized
Gains | | | Unrealized
Losses | | | Estimated
Fair Value | |
U.S. treasury securities | | $ | 119,199 | | | $ | 171 | | | $ | — | | | $ | 119,370 | |
Total | | $ | 119,199 | | | $ | 171 | | | $ | — | | | $ | 119,370 | |
| | | | | | | | | | | | | | | | |
| | December 31, 2023 | |
(In thousands) | | Amortized Cost | | | Unrealized
Gains | | | Unrealized
Losses | | | Estimated
Fair Value | |
U.S. treasury securities | | $ | 98,326 | | | $ | 128 | | | $ | — | | | $ | 98,454 | |
Convertible debt | | | 173 | | | | — | | | | — | | | | 173 | |
Total | | $ | 98,499 | | | $ | 128 | | | $ | — | | | $ | 98,627 | |
The contractual maturities on the U.S. treasury securities as of December 31, 2024, are all due within one year. Accrued interest receivable as of December 31, 2024, was $0.8 million and was recorded within Prepaid expenses and other current assets on the consolidated balance sheets.
The Company had no investment classified as available-for-sale in a continuous unrealized loss position for which an allowance for credit losses was not recorded as of December 31, 2024.
In the years ended December 31, 2024, 2023 and 2022, no unrealized losses on available-for-sale securities were recognized in income. The Company does not intend to sell, and it is unlikely that it will be required to sell the investments in an unrealized loss position prior to their anticipated recovery. The investments are high quality U.S. treasury securities and the decline in fair value is largely due to changes in interest rates and other market conditions with the fair value expected to recover as they reach maturity. There were no other-than-temporary impairments for these securities during the years ended December 31, 2024, 2023 and 2022. Refer to Note 12, Fair Value Measurements, for detailed disclosures regarding fair value measurements.
Inventories
| | | | | | | | |
(In thousands) | | December 31, 2024 | | | December 31, 2023 | |
Raw materials | | $ | 13,439 | | | $ | 19,955 | |
Finished goods | | | 149,100 | | | | 228,896 | |
Total | | $ | 162,539 | | | $ | 248,851 | |
The Company records provisions for excess and obsolete inventory based on assumptions about future demand and the amounts incurred were $6.1 million, $3.2 million and $3.7 million for the years ended December 31, 2024, 2023 and 2022, respectively. While management believes the estimates and assumptions underlying its current forecasts are reasonable, there is risk that additional charges may be necessary if current forecasts are greater than actual demand.
Property and equipment, net
| | | | | | | | |
(In thousands) | | December 31, 2024 | | | December 31, 2023 | |
Machinery and equipment | | $ | 54,355 | | | $ | 47,826 | |
Furniture, fixtures, and leasehold improvements | | | 20,028 | | | | 18,205 | |
Software | | | 24,610 | | | | 25,760 | |
Computer equipment | | | 5,384 | | | | 5,458 | |
Total property and equipment, gross | | | 104,377 | | | | 97,249 | |
Accumulated depreciation | | | (93,089 | ) | | | (88,976 | ) |
Total | | $ | 11,288 | | | $ | 8,273 | |
Depreciation expense pertaining to property and equipment was $6.5 million, $6.9 million and $9.5 million for the years ended December 31, 2024, 2023 and 2022, respectively.
Intangibles, net
| | | | | | | | | | | | | | | | | | | | | | | | | | | | | | | | |
| | December 31, 2024 | | | December 31, 2023 | |
(In thousands) | | Gross | | | Accumulated
Amortization | | | Accumulated Impairment | | | Net | | | Gross | | | Accumulated
Amortization | | | Accumulated Impairment | | | Net | |
Technology | | $ | 59,799 | | | $ | (58,906 | ) | | $ | (893 | ) | | $ | — | | | $ | 59,799 | | | $ | (58,906 | ) | | $ | (893 | ) | | $ | — | |
Other | | | 10,345 | | | | (10,167 | ) | | | (178 | ) | | | — | | | | 10,345 | | | | (10,167 | ) | | | (178 | ) | | | — | |
Total | | $ | 70,144 | | | $ | (69,073 | ) | | $ | (1,071 | ) | | $ | — | | | $ | 70,144 | | | $ | (69,073 | ) | | $ | (1,071 | ) | | $ | — | |
Amortization of purchased intangibles in the years ended December 31, 2023 and 2022 was $0.3 million and $0.5 million, respectively.
An intangible asset impairment charge of $1.1 million was recognized for the Connected Home reporting unit in the year ended December 31, 2023, which reduced the intangibles, net to zero. No intangibles impairment was recorded in the years ended December 31, 2024 or 2022.
Goodwill
Each year on the first day of fourth fiscal quarter, the Company assesses its goodwill for potential impairment. This impairment testing is applied more frequently than once a year if the Company is aware of changed conditions or circumstances since the last impairment testing that might call into question whether the current balances are fairly recorded.
The Company completed its annual impairment test of goodwill as of the first day of the fourth fiscal quarter of 2024, or September 30, 2024. The Company identified the reporting units for the purpose of goodwill impairment testing as NETGEAR for Business and Connected Home and performed a qualitative test on the NETGEAR for Business reporting unit. Based upon the results of the qualitative testing, the Company believed that it was more-likely-than-not that the fair value of the NETGEAR for Business reporting unit was greater than its carrying value and therefore performing the next step of impairment test for this reporting unit was unnecessary. No goodwill impairment was recognized for the NETGEAR for Business reporting unit in the years ended December 31, 2024, 2023 or 2022. An interim goodwill impairment test performed in the first fiscal quarter of 2022 resulted in an impairment charge of $44.4 million in respect to the Connected Home reporting unit, which reduced the goodwill of this reporting unit to zero. Accumulated goodwill impairment charges as of December 31, 2024 was $44.4 million for the Connected Home reporting unit and zero for the NETGEAR for Business reporting unit.
Other non-current assets
| | | | | | | | |
(In thousands) | | December 31, 2024 | | | December 31, 2023 | |
Non-current deferred income taxes | | $ | 2,332 | | | $ | 3,343 | |
Long-term investments | | | 8,381 | | | | 8,367 | |
Restricted cash | | | 2,107 | | | | — | |
Other | | | 3,767 | | | | 5,616 | |
Total | | $ | 16,587 | | | $ | 17,326 | |
Long-term investments
The Company’s long-term investments are primarily comprised of equity investments without readily determinable fair values and investments in limited partnership funds. The carrying value of the equity investments without readily determinable fair values was $6.1 million as of December 31, 2024 and 2023 respectively. For such equity investments without readily determinable fair value still held at December 31, 2024, there were no cumulative downward adjustments for price changes or impairment, and the cumulative upward adjustments for price changes was $0.3 million. Investments in limited partnership funds amounted to $2.3 million as of December 31, 2024 and 2023, respectively.
Other accrued liabilities
| | | | | | | | |
(In thousands) | | December 31, 2024 | | | December 31, 2023 | |
Current operating lease liabilities | | $ | 10,837 | | | $ | 11,869 | |
Sales and marketing | | | 59,129 | | | | 75,535 | |
Warranty obligations | | | 5,192 | | | | 5,738 | |
Sales returns(1) | | | 31,711 | | | | 34,824 | |
Freight and duty | | | 4,979 | | | | 2,837 | |
Other | | | 36,230 | | | | 37,281 | |
Total | | $ | 148,078 | | | $ | 168,084 | |
_______________________
(1)Inventory expected to be received from future sales returns amounted to $15.1 million and $16.9 million as of December 31, 2024 and 2023, respectively. Provisions to write down expected returned inventory to net realizable value amounted to $9.0 million and $9.7 million as of December 31, 2024 and December 31, 2023, respectively.
Note 4. Derivative Financial Instruments
The Company’s subsidiaries have material future cash flows related to revenue and expenses denominated in currencies other than the U.S. dollar, the Company’s functional currency worldwide. The Company executes currency forward contracts that typically mature in less than 6 months to mitigate its currency risk, in currencies including Australian dollars, British pounds, euros, Canadian dollar and Japanese Yen. The Company does not enter into derivatives transactions for trading or speculative purposes.
The Company’s foreign currency forward contracts do not contain any credit-risk-related contingent features. The Company enters into derivative contracts with high-quality financial institutions and limits the amount of credit exposure to any individual counter-party. The Company continuously evaluates the credit quality of its counter-party financial institutions and does not consider non-performance a material risk.
The Company may choose not to hedge certain foreign exchange exposures for a variety of reasons, including, but not limited to, materiality, accounting considerations or the prohibitive economic cost of hedging particular exposures. There can be no assurance the hedges will offset more than a portion of the financial impact resulting from movements in foreign exchange rates. The Company’s accounting policies for these instruments are based on whether the instruments are designated as hedge or non-hedge instruments in accordance with the authoritative guidance for derivatives and hedging. The Company records all derivatives on the balance sheets at fair value. Cash flow hedge gains and losses are recorded in the other comprehensive income (loss) (“OCI”) until the hedged item is recognized in earnings. Derivatives that are not designated as hedging instruments are adjusted to fair value through earnings in Other income, net in the consolidated statements of operations.
Cash flow hedges
To help manage the exposure of operating margins to fluctuations in foreign currency exchange rates, the Company hedges a portion of its anticipated foreign currency revenue, costs of revenue and certain operating expenses. These hedges are designated at the inception of the hedge relationship as cash flow hedges under the authoritative guidance for derivatives and hedging. Effectiveness of the hedge relationships are tested at least quarterly both prospectively and retrospectively using regression analysis to ensure that the hedge relationship has been effective and is likely to remain effective in the future. The Company typically executes ten forward contracts per quarter with maturities under six months and with an average USD notional amount of approximately $4.9 million that are designated as cash flow hedges.
The Company expects to reclassify to earnings all of the amounts recorded in OCI associated with its cash flow hedges over the next twelve months. OCI associated with cash flow hedges of foreign currency revenue, cost of revenue and operating expenses are recognized in the same period and in the same line item in the statement of operations as hedged item. The Company did not recognize any material net gains or losses related to anticipated transactions that failed to occur during the years ended December 31, 2024, 2023 and 2022.
Non-designated hedges
The Company enters into non-designated hedges under the authoritative guidance for derivatives and hedging to manage the exposure of non-functional currency monetary assets and liabilities not already hedged by de-designated cash flow hedges. The non-designated hedges are generally expected to offset the changes in value of its net non-functional currency asset and liability position resulting from foreign exchange rate fluctuations. The Company adjusts its non-designated hedges monthly and typically executes about nine non-designated forwards per quarter with maturities less than three months and an average USD notional amount of approximately $2.9 million.
Fair Value of Derivative Instruments
The fair values of the Company’s derivative instruments and the line items on the consolidated balance sheets to which they were recorded were summarized as follows:
| | | | | | | | | | | | | | | | | | | | |
| | Balance Sheet | | | | | | | | Balance Sheet | | | | | | |
(In thousands) | | Location | | December 31,
2024 | | | December 31,
2023 | | | Location | | December 31,
2024 | | | December 31,
2023 | |
Derivatives not designated as hedging instruments | | Prepaid expenses and other current assets | | $ | 979 | | | $ | 284 | | | Other accrued liabilities | | $ | 254 | | | $ | 1,672 | |
Derivatives designated as hedging instruments | | Prepaid expenses and other current assets | | | 74 | | | | 7 | | | Other accrued liabilities | | | 19 | | | | 19 | |
Total | | | | $ | 1,053 | | | $ | 291 | | | | | $ | 273 | | | $ | 1,691 | |
Refer to Note 12, Fair Value Measurements, in Notes to Consolidated Financial Statements for detailed disclosures regarding fair value measurements. Refer to Note 9, Stockholders' Equity, for details on the accumulated other comprehensive income (loss) activity related to derivatives and refer to Note 11, Segment Information, for details on gain/(loss), net pertaining to derivatives not designated as hedging instruments that were recognized in Other income, net.
Note 5. Net Income (Loss) Per Share
Basic net income (loss) per share is computed by dividing the net income for the period by the weighted average number of common shares outstanding during the period. Diluted net income per share is computed by dividing the net income for the period by the weighted average number of shares of common stock and potentially dilutive common stock outstanding during the period. Potentially dilutive common shares include common shares issuable upon exercise of stock options, vesting of restricted stock units and performance shares, and issuances of shares under the Employee Stock Purchase Plan (the “ESPP”), which are reflected in diluted net income per share by application of the treasury stock method. Potentially dilutive common shares are excluded from the computation of diluted net income per share when their effect is anti-dilutive.
Net income (loss) per share consisted of the following:
| | | | | | | | | | | | |
| | Year Ended December 31, | |
(In thousands, except per share data) | | 2024 | | | 2023 | | | 2022 | |
Numerator: | | | | | | | | | |
Net income (loss) | | $ | 12,363 | | | $ | (104,767 | ) | | $ | (68,987 | ) |
| | | | | | | | | |
Denominator: | | | | | | | | | |
Weighted average common shares – basic | | | 28,905 | | | | 29,355 | | | | 29,007 | |
Potentially dilutive common share equivalent | | | 778 | | | | — | | | | — | |
Weighted average common shares – dilutive | | | 29,683 | | | | 29,355 | | | | 29,007 | |
| | | | | | | | | |
Basic net income (loss) per share | | $ | 0.43 | | | $ | (3.57 | ) | | $ | (2.38 | ) |
Diluted net income (loss) per share | | $ | 0.42 | | | $ | (3.57 | ) | | $ | (2.38 | ) |
| | | | | | | | | |
Anti-dilutive employee stock-based awards, excluded | | | 1,127 | | | | 2,362 | | | | 1,556 | |
Note 6. Other Income, Net
Other income, net consisted of the following:
| | | | | | | | | | | | |
| | Year Ended December 31, | |
(In thousands) | | 2024 | | | 2023 | | | 2022 | |
Interest income | | $ | 12,152 | | | $ | 6,842 | | | $ | 1,825 | |
Foreign currency transaction gain (loss), net | | | (3,434 | ) | | | (6 | ) | | | (2,335 | ) |
Foreign currency contract gain (loss), net | | | 3,292 | | | | 267 | | | | 2,692 | |
Gain (loss) on investments, net | | | (93 | ) | | | (8 | ) | | | (271 | ) |
Gain on litigation settlement | | | — | | | | 6,000 | | | | — | |
Other | | | 755 | | | | 1,044 | | | | (1,009 | ) |
Total | | $ | 12,672 | | | $ | 14,139 | | | $ | 902 | |
Note 7. Income Taxes
Income before income taxes and the provision for income taxes consisted of the following:
| | | | | | | | | | | | |
| | Year Ended December 31, | |
| | 2024 | | | 2023 | | | 2022 | |
(In thousands) | | | |
United States | | $ | 10,634 | | | $ | (33,944 | ) | | $ | (100,609 | ) |
International | | | 14,254 | | | | 14,808 | | | | 18,587 | |
Total | | $ | 24,888 | | | $ | (19,136 | ) | | $ | (82,022 | ) |
| | | | | | | | | | | | |
| | Year Ended December 31, | |
(In thousands) | | 2024 | | | 2023 | | | 2022 | |
Current: | | | | | | | | | |
U.S. Federal | | $ | 7,641 | | | $ | 358 | | | $ | 3,477 | |
State | | | 1,868 | | | | 599 | | | | 1,329 | |
Foreign | | | 2,286 | | | | 2,423 | | | | 4,236 | |
| | | 11,795 | | | | 3,380 | | | | 9,042 | |
Deferred: | | | | | | | | | |
U.S. Federal | | | — | | | | 65,880 | | | | (18,761 | ) |
State | | | — | | | | 15,629 | | | | (3,017 | ) |
Foreign | | | 730 | | | | 742 | | | | (299 | ) |
| | | 730 | | | | 82,251 | | | | (22,077 | ) |
Total | | $ | 12,525 | | | $ | 85,631 | | | $ | (13,035 | ) |
Net deferred tax assets consisted of the following:
| | | | | | | | |
| | Year Ended December 31, | |
(In thousands) | | 2024 | | | 2023 | |
Deferred Tax Assets: | | | | | | |
Accruals and allowances | | $ | 18,573 | | | $ | 21,324 | |
Net operating loss carryforwards | | | 1,604 | | | | 1,770 | |
Stock-based compensation | | | 1,416 | | | | 2,312 | |
Operating lease liability | | | 5,146 | | | | 7,315 | |
Deferred revenue | | | 1,889 | | | | 2,085 | |
Tax credit carryforwards | | | 1,673 | | | | 935 | |
Acquired intangibles | | | 14,814 | | | | 18,664 | |
Capitalized research and development | | | 61,703 | | | | 50,670 | |
Depreciation and amortization | | | 999 | | | | 1,088 | |
Other | | | 4,161 | | | | 4,392 | |
Total deferred tax assets | | | 111,978 | | | | 110,555 | |
Deferred Tax Liabilities: | | | | | | |
Right of use asset | | | (4,412 | ) | | | (6,179 | ) |
Other | | | (1,414 | ) | | | (1,205 | ) |
Total deferred tax liabilities | | | (5,826 | ) | | | (7,384 | ) |
| | | | | | |
Valuation Allowance(1) | | | (103,820 | ) | | | (99,828 | ) |
Net deferred tax assets | | $ | 2,332 | | | $ | 3,343 | |
(1)Valuation allowance is presented gross. The valuation allowance net of the federal tax effect was $99.6 million and $95.7 million for the years ended December 31, 2024 and 2023, respectively.
Management’s judgment is required in determining the Company’s provision for income taxes, its deferred tax assets and any valuation allowance recorded against its deferred tax assets. As of December 31, 2024, a valuation allowance of $103.8 million was placed against deferred tax assets. During the year ended December 31, 2023, a valuation allowance of $99.8 million was placed against all U.S. federal and state tax attributes since it was determined that recovery of the assets is not more likely than not. Accordingly, the valuation allowance increased $4.0 million during 2024. In management’s judgment it is more likely than not that foreign deferred tax assets will be realized in
the future as of December 31, 2024, and as such no valuation allowance has been recorded against these deferred tax assets.
The effective tax rate differed from the applicable U.S. statutory federal income tax rate as follows:
| | | | | | | | | | | | |
| | Year Ended December 31, | |
| | 2024 | | | 2023 | | | 2022 | |
Tax at federal statutory rate | | | 21.0 | % | | | 21.0 | % | | | 21.0 | % |
State, net of federal benefit | | | 6.0 | % | | | (3.1 | )% | | | 1.7 | % |
Impact of international operations | | | (2.6 | )% | | | 8.3 | % | | | 2.7 | % |
Stock-based compensation | | | 1.0 | % | | | (2.3 | )% | | | (2.7 | )% |
Tax credits | | | (2.5 | )% | | | 5.8 | % | | | 1.7 | % |
Valuation allowance | | | 26.7 | % | | | (474.3 | )% | | | (0.3 | )% |
Goodwill impairment | | | — | % | | | — | % | | | (9.6 | )% |
Recognition of previously unrecognized tax benefits | | | (0.8 | )% | | | (0.3 | )% | | | 1.8 | % |
Non-deductible license fees | | | 1.5 | % | | | (1.7 | )% | | | (0.3 | )% |
Others | | | 0.0 | % | | | (0.9 | )% | | | (0.1 | )% |
Provision for income taxes | | | 50.3 | % | | | (447.5 | )% | | | 15.9 | % |
As a result of changes in fair value of available-for-sale securities and foreign currency hedging, income tax (provision) benefits of $(10,000), $(122,000), and $147,000 were recorded in comprehensive income related to the years ended December 31, 2024, 2023, and 2022, respectively.
As of December 31, 2024, the Company has approximately $0.2 million of acquired federal net operating loss carryforwards as well as $1.7 million of California tax credits carryforwards. All the losses are subject to annual usage limitations under Internal Revenue Code Section 382. The federal losses expire in different years beginning in fiscal year 2035.
The Company files income tax returns in the U.S. federal jurisdiction and various state, local, and foreign jurisdictions. With few exceptions, the Company is no longer subject to U.S. federal, state, or local income tax examinations for years prior to 2020. The Company is no longer subject to foreign income tax examinations before 2004. The Italian Tax Authority (ITA) has audited the Company’s 2004 through 2012 tax years. The Company was in litigation with the ITA with respect to these years and had appellate hearings on all years at the Italian Supreme Court in March 2024. The Company successfully defended its positions for the 2007 through 2012 tax years. The 2004 through 2006 years were remanded back to the lower courts for rehearing and hence, remain in litigation. The Company has limited audit activity in various other states and foreign jurisdictions. Due to the uncertain nature of ongoing tax audits, the Company has recorded its liability for uncertain tax positions as part of its long-term liability as payments cannot be anticipated over the next 12 months. The existing tax positions of the Company continue to generate an increase in the liability for uncertain tax positions. The liability for uncertain tax positions may be reduced for liabilities that are settled with taxing authorities or on which the statute of limitations could expire without assessment from tax authorities. The possible reduction in liabilities for uncertain tax positions resulting from the expiration of statutes of limitation in multiple jurisdictions in the next 12 months is approximately $1.3 million, excluding the interest, penalties and the effect of any related deferred tax assets or liabilities.
A reconciliation of the beginning and ending amount of gross unrecognized tax benefits (“UTB”) is as follows:
| | | | |
(In thousands) | | Federal, State,
and Foreign Tax | |
Balance as of December 31, 2021 | | $ | 9,204 | |
Additions based on tax positions related to the current year | | | 805 | |
Additions for tax positions of prior years | | | 8 | |
Settlements | | | (1,355 | ) |
Reductions due to lapse of applicable statutes | | | (554 | ) |
Adjustments due to foreign exchange rate movement | | | (174 | ) |
Balance as of December 31, 2022 | | | 7,934 | |
Additions based on tax positions related to the current year | | | 426 | |
Additions for tax positions of prior years | | | 533 | |
Reductions due to lapse of applicable statutes | | | (507 | ) |
Adjustments due to foreign exchange rate movement | | | 232 | |
Balance as of December 31, 2023 | | | 8,618 | |
Additions based on tax positions related to the current year | | | 372 | |
Additions for tax positions of prior years | | | 10 | |
Settlements | | | (712 | ) |
Reductions for tax positions of prior years | | | (31 | ) |
Reductions due to lapse of applicable statutes | | | (799 | ) |
Adjustments due to foreign exchange rate movement | | | 72 | |
Balance as of December 31, 2024 | | $ | 7,530 | |
The total amount of net UTB that, if recognized would affect the effective tax rate as of December 31, 2024 is $4.8 million. The ending net UTB results from adjusting the gross balance at December 31, 2024 for items such as U.S. federal and state deferred tax, interest, and deductible taxes. The net UTB is included as a component of non-current income taxes payable within the consolidated balance sheets.
As of December 31, 2024 and 2023, accrued interest and penalties on a gross basis were $2.1 million and $2.6 million, respectively. Included in accrued interest are amounts related to tax positions for which the ultimate deductibility is highly certain but for which there is uncertainty about the timing of such deductibility.
The Company has not provided deferred taxes on earnings of $9.0 million of undistributed earnings of foreign subsidiaries that are indefinitely reinvested outside of the U.S. The Company estimates that if these earnings were repatriated to the U.S., it would result in approximately $1.9 million in associated tax without consideration of foreign tax credits. Determination of foreign tax credit limitations depends on several factors which cannot be estimated.
Note 8. Commitments and Contingencies
Purchase Obligations
The Company has entered into various inventory-related purchase agreements with suppliers. Generally, under these agreements, 50% of orders are cancelable by giving notice 46 to 60 days prior to the expected shipment date and 25% of orders are cancelable by giving notice 31 to 45 days prior to the expected shipment date. As of December 31, 2024, the Company had approximately $57.4 million, as compared to $42.6 million as of December 31, 2023, in short-term non-cancelable purchase commitments with suppliers or where the suppliers had procured unique materials and components upon receipts of the Company’s purchase orders. Due to an elongation of the time from order placement to production that occurred several years ago, the Company issued purchase orders to supply chain partners beyond contractual termination periods. As of December 31, 2024, $213.7 million of purchase orders beyond contractual termination periods remained outstanding. Consequently, the Company may incur expenses for materials and components, such as chipsets purchased by the supplier to fulfill the purchase order if the purchase order is cancelled. Expenses incurred in respect of cancelled purchase orders have historically not been significant relative to the original order value. For those orders not governed by master purchase agreements, the commitments are governed by the commercial terms on the Company’s purchase orders subject to acknowledgment from its suppliers. The Company establishes a loss liability for all products it does not expect to sell or orders it anticipates canceling for which it has committed purchases from suppliers. Such loss liability is included in Other accrued liabilities on the Company’s consolidated balance sheets. Losses incurred in relation to purchase commitments, including unique materials and components, amounted to $4.6 million, $3.5 million and $5.5 million for the years ended December 31, 2024, 2023 and 2022, respectively.
Non-Trade Commitments
As of December 31, 2024, the Company’s non-cancellable purchase commitments pertaining to non-trade activities were as follows (in thousands):
| | | | |
2025 | | $ | 1,914 | |
2026 | | | 2,010 | |
2027 | | | 2,111 | |
2028 | | | 2,216 | |
2029 | | | 3,031 | |
Total | | $ | 11,282 | |
Warranty Obligations
Changes in the Company’s warranty obligations, which is included in Other accrued liabilities on the consolidated balance sheets, were as follows:
| | | | | | | | | | | | | |
| | Year Ended December 31, |
(In thousands) | | 2024 | | | 2023 | | | 2022 | | |
Balance as of beginning of the period | | $ | 5,738 | | | $ | 6,320 | | | $ | 6,861 | | |
Provision for warranty liability made | | | 3,925 | | | | 5,105 | | | | 5,230 | | |
Settlements made | | | (4,471 | ) | | | (5,687 | ) | | | (5,771 | ) | |
Balance as of the end of the period | | $ | 5,192 | | | $ | 5,738 | | | $ | 6,320 | | |
Guarantees and Indemnifications
The Company, as permitted under Delaware law and in accordance with its Bylaws, indemnifies its officers and directors for certain events or occurrences, subject to certain limits, while the officer or director is or was serving at the Company’s request in such capacity. The term of the indemnification period is for the officer’s or director’s lifetime. The maximum amount of potential future indemnification is unlimited; however, the Company has a Director and Officer Insurance Policy that enables it to recover a portion of any future amounts paid. As a result of its insurance policy coverage, the Company believes the fair value of each indemnification agreement is minimal. Accordingly, the Company has no liabilities recorded for these agreements as of December 31, 2024.
In its sales agreements, the Company typically agrees to indemnify its direct customers, distributors and resellers (the “Indemnified Parties”) for any expenses or liability resulting from claimed infringements by the Company’s products of patents, trademarks or copyrights of third parties that are asserted against the Indemnified Parties, subject to customary carve outs. The terms of these indemnification agreements are generally perpetual after execution of the agreement. The maximum amount of potential future indemnification is generally unlimited. From time to time, the Company receives requests for indemnity and may choose to assume the defense of such litigation asserted against the Indemnified Parties. The Company believes the estimated fair value of these agreements is minimal. Accordingly, the Company has no liabilities recorded for these agreements as of December 31, 2024.
Leases
As of December 31, 2024, the Company entered into an office lease that has not yet commenced with short-term and long-term future lease payments of $0.8 million and $42.1 million, respectively, that are not yet recorded on the Consolidated Balance Sheets. This lease will commence in 2025 with a non-cancelable lease term of 11 years.
Litigation and Other Legal Matters
The Company is involved in disputes, litigation, and other legal actions, including, but not limited to, the matters described below. In all cases, at each reporting period, the Company evaluates whether or not a potential loss amount or a potential range of loss is probable and reasonably estimable under the provisions of the authoritative guidance that addresses accounting for contingencies. In such cases, the Company accrues for the amount, or if a range, the Company accrues the low end of the range, only if there is not a better estimate than any other amount within the range, as a component of legal expense within litigation reserves, net. The Company monitors developments in these legal matters that could affect the estimate the Company had previously accrued. In relation to such matters, the Company currently believes that there are no existing claims or proceedings that are likely to have a material adverse effect on its financial position within the next twelve months, or the outcome of these matters is currently not determinable. There are many uncertainties associated with any litigation, and these actions or other third-party claims against the Company may cause the Company to incur costly litigation and/or substantial settlement charges. In addition, the resolution of any intellectual property litigation may require the Company to make royalty payments, which could have an adverse effect in future periods. If any of those events were to occur, the Company’s business, financial condition, results of operations, and cash flows could be adversely affected. The actual liability in any such matters may be materially different from the Company’s estimates, which could result in the need to adjust the liability and record additional expenses.
Huawei v. NETGEAR Inc., NETGEAR Deutschland GmbH, and Exertis-Connect GmbH (at the Dusseldorf District Court, Germany)
On or around March of 2022, Huawei filed two patent infringement lawsuits at the District Court of Dusseldorf, Germany, against NETGEAR Inc., NETGEAR Deutschland GmbH, and Exertis-Connect GmbH, a third-party webstore selling NETGEAR products in Germany. Huawei asserted one EU patent in each suit, EP 3 337 077 B1 (“EP 077”) in case no. 08/22 and EP 3 143 741 B1 (EP 741) in case no. 09/22. In its complaints, Huawei alleged that the Company’s WiFi 6 products infringed the two patents, which Huawei further claimed are standard-essential patents. On or around February 9, 2023, the Federal Patent Court issued preliminary opinions finding both asserted patents invalid. The Company attended an oral hearing for both infringement cases on March 21, 2023 before the Dusseldorf District Court and the Court dismissed case no. 09/22 for the EP 741 and stayed case no. 08/22 for EP 077. On or around May 10, 2022, the Company was served with two suits that Huawei filed before the Jinan Intermediate People’s Court of China asserting Patent Nos. ZL 201811536087.9 (case no. 407) and ZL 201810757332.2 (case no. 408) against the Company’s WiFi 6 products. On or around June 12, 2024, the Jinan Court found that the Company Wi-Fi 6 products infringe Huawei’s two asserted Chinese patents. The Company appealed both cases to the Chinese Supreme Court on June 21, 2024.
On December 31, 2024, the Company entered into a license agreement with Sisvel International S.A., which includes a license to Huawei’s Wi-Fi 6 patent portfolio, resolving all outstanding related litigation between the Company and Huawei. All pending cases worldwide between Huawei and the Company have been dismissed.
Huawei v. NETGEAR Inc., NETGEAR Deutschland GmbH, and NETGEAR International Limited (at the Unified Patent Court - UPC)
On or around July 3, 2023, Huawei filed an infringement suit, asserting patent EP 3 611 989 (the ’989 Patent), against NETGEAR Inc., NETGEAR Deutschland GmbH, and NETGEAR International Limited at the Unified Patent Court (UPC) in Munich, Germany. On or around December 11, 2023, Huawei filed a second UPC suit, asserting EP 3 678 321 (EP 321), against the Company. The Company submitted its Statement of Defense on April 18, 2024.
On December 31, 2024, the Company entered into a license agreement with Sisvel International S.A., which includes a license to Huawei’s Wi-Fi 6 patent portfolio, resolving all outstanding related litigation between the Company and Huawei. All pending cases worldwide between Huawei and the Company have been dismissed.
Huawei v. NETGEAR Inc., NETGEAR Deutschland GmbH, and NETGEAR International Limited (at the Munich District Court, Germany)
On May 17, 2024, Huawei filed a Complaint asserting EP 3 334 112 (EP 112) against the Company’s WiFi-6 products at the Munich District Court. The entities named in the suit are NETGEAR Inc, NETGEAR International, and NETGEAR Germany. The Parties attended an oral hearing on December 19, 2024. On July 10, 2024, Huawei filed a Complaint asserting EP 3 937 445 (EP 445) against the Company’s WiFi-6 products at the Munich District Court. The Company filed a Statement of Defense for NETGEAR Germany on July 10, 2024.
On December 31, 2024, the Company entered into a license agreement with Sisvel International S.A., which includes a license to Huawei’s Wi-Fi 6 patent portfolio, resolving all outstanding related litigation between the Company and Huawei. All pending cases worldwide between Huawei and the Company have been dismissed.
The Company, at this time, is not able to reasonably estimate any financial impact to the Company resulting from any ongoing litigation matters.
The Company does not believe that it is reasonably possible that a material loss has been incurred for any of the matters disclosed above, and consequently has not established any material loss provisions.
For the year ended December 31, 2024, the Company entered into a settlement agreement with TP-Link, resulting in the dismissal of all pending litigation between the parties. As part of the settlement, the Company received a payment from TP-Link, leading to a $92.7 million contra-expense in litigation reserves and a $10.9 million reduction in general and administrative expenses to offset related legal fees incurred to date. The Company included the amounts in the consolidated statements of operations.
Note 9. Stockholders’ Equity
Stock Repurchases
From time to time, the Company’s Board of Directors has authorized programs under which the Company may repurchase shares of its common stock, depending on market conditions, in the open market or through privately negotiated transactions. Under the authorizations, the timing and actual number of shares subject to repurchase are at the discretion of management and are contingent on a number of factors, such as levels of cash generation from operations, cash requirements for acquisitions and the price of the Company’s common stock. On July 16, 2024, the Board of Directors authorized management to repurchase up to 3.0 million shares of the Company’s outstanding common stock, incremental to the remaining shares under the Company’s previous repurchase program. As of December 31, 2024, 3.4 million shares remained authorized for repurchase under the repurchase program. The Company repurchased and retired, reported based on trade date, approximately 2.1 million and 1.0 million shares of common stock, at a cost of approximately $33.6 million and $24.4 million during the year ended December 31, 2024 and 2022, respectively. As of December 31, 2024, common stock repurchases at a cost of approximately $0.5 million were pending settlement. The Company did not repurchase any shares during the year ended December 31, 2023. Under the Inflation Reduction Act signed into law in 2022, the exercise tax on stock repurchases was approximately $0.2 million for the year ended December 31, 2024.
The Company repurchased, reported based on trade date, approximately 226,000, 198,000 and 202,000 shares of common stock at a cost of approximately $3.4 million, $2.8 million and $4.8 million, to administratively facilitate
the withholding and subsequent remittance of personal income and payroll taxes for individuals receiving RSUs during the years ended December 31, 2024, 2023 and 2022, respectively.
These shares were retired upon repurchase. The Company’s policy related to repurchases of its common stock is to charge the excess of cost over par value to retained earnings. All repurchases were made in compliance with Rule 10b-18 under the Securities Exchange Act of 1934, as amended.
Accumulated Other Comprehensive Income (Loss)
The following table sets forth the changes in accumulated other comprehensive income (loss) (“AOCI”) by component:
| | | | | | | | | | | | | | | | |
(In thousands) | | Unrealized gains (losses)
on available
-for-sale
investments | | | Unrealized
gains (losses)
on derivatives | | | Estimated tax benefit (provision) | | | Total | |
Balance as of December 31, 2021 | | $ | (2 | ) | | $ | 173 | | | $ | (22 | ) | | $ | 149 | |
Other comprehensive income (loss) before reclassifications | | | (320 | ) | | | (704 | ) | | | 188 | | | | (836 | ) |
Less: Amount reclassified from accumulated other comprehensive income (loss) | | | — | | | | (193 | ) | | | 41 | | | | (152 | ) |
Net current period other comprehensive income (loss) | | | (320 | ) | | | (511 | ) | | | 147 | | | | (684 | ) |
Balance as of December 31, 2022 | | | (322 | ) | | | (338 | ) | | | 125 | | | | (535 | ) |
Other comprehensive income (loss) before reclassifications | | | 448 | | | | 2,337 | | | | (540 | ) | | | 2,245 | |
Less: Amount reclassified from accumulated other comprehensive income (loss) | | | — | | | | 1,992 | | | | (418 | ) | | | 1,574 | |
Net current period other comprehensive income (loss) | | | 448 | | | | 345 | | | | (122 | ) | | | 671 | |
Balance as of December 31, 2023 | | | 126 | | | | 7 | | | | 3 | | | | 136 | |
Other comprehensive income (loss) before reclassifications | | | 43 | | | | (733 | ) | | | 159 | | | | (531 | ) |
Less: Amount reclassified from accumulated other comprehensive income (loss) | | | — | | | | (805 | ) | | | 169 | | | | (636 | ) |
Net current period other comprehensive income (loss) | | | 43 | | | | 72 | | | | (10 | ) | | | 105 | |
Balance as of December 31, 2024 | | $ | 169 | | | $ | 79 | | | $ | (7 | ) | | $ | 241 | |
The following table provides details about significant amounts reclassified out of each component of AOCI:
| | | | | | | | | | | | |
| | Year Ended December 31, | |
(In thousands) | | 2024 | | | 2023 | | | 2022 | |
Amount Reclassified from AOCI | | | | | | | | | |
Gains (losses) on cash flow hedge: | |
Foreign currency forward contracts | | | | | | | | | |
Affected line item in the statement of operations | | | | | | | | | |
Net revenue | | $ | (897 | ) | | $ | 2,337 | | | $ | (218 | ) |
Cost of revenue | | | — | | | | (4 | ) | | | 3 | |
Research and development | | | 13 | | | | (33 | ) | | | (14 | ) |
Sales and marketing | | | 58 | | | | (246 | ) | | | 40 | |
General and administrative | | | 21 | | | | (62 | ) | | | (4 | ) |
Total before tax | | | (805 | ) | | | 1,992 | | | | (193 | ) |
Tax impact | | | 169 | | | | (418 | ) | | | 41 | |
Total, net of tax | | $ | (636 | ) | | $ | 1,574 | | | $ | (152 | ) |
Note 10. Employee Benefit Plans
2006 Long Term Incentive Plan
In April 2006, the Company adopted the 2006 Long Term Incentive Plan (the “2006 Plan”). The 2006 Plan provides for the granting of stock options, stock appreciation rights, restricted stock, restricted stock units (“RSU”) performance awards and other stock awards, to eligible directors, employees and consultants of the Company. The Company’s 2006 Plan expired on April 13, 2016 by its terms. No further equity awards can be granted under the 2006 Plan. Outstanding awards under the 2006 Stock Plan remain subject to the terms and conditions of the 2006 Plan.
2016 Equity Incentive Plan
In April 2016, the Company’s Board of Directors adopted the 2016 Equity Incentive Plan (the “2016 Plan”) which was approved by the Company’s stockholders at the 2016 Annual Meeting of Stockholders on June 3, 2016. The 2016 Plan provides for the granting of stock options, stock appreciation rights, restricted stock, RSUs, performance shares and performance units to eligible directors, employees and consultants of the Company. The original maximum aggregate number of shares that could be issued under the 2016 Plan was 2.5 million shares, plus (i) any shares that were available for grant under the Company’s 2006 Plan as of immediately prior to the 2006 Plan’s expiration by its terms, which was 699,827 shares, plus (ii) any shares granted under the 2006 Plan that expire, are forfeited to or repurchased by the Company. In May 2018, the Company adopted amendments to the 2016 Plan which increased the number of shares of the Company’s common stock that may be issued under the 2016 Plan by an additional 1.7 million shares. In January 2019, the Company received the approval from its Compensation Committee to increase the number of shares that the Company may be issued under the 2016 Plan to a new total of 3.1 million shares, pursuant to the adjustment provisions of the 2016 Plan. In May 2020, the Company adopted amendments to the 2016 Plan which increased the number of shares of the Company’s common stock that may be issued under the 2016 Plan by an additional 2.0 million shares. In June 2023, the Company's stockholders approved amendments to the 2016 Plan which increased the number of shares of the Company’s common stock that may be issued under the 2016 Plan by an additional 2.0 million shares. As of December 31, 2024, approximately 2.3 million shares remained available for future grants under the 2016 Plan.
Options granted generally vest over four years with the first tranche at the end of twelve months from the date of grant and the remaining shares vesting monthly over the remaining three years. Options granted generally expire in 10 years from the date of grant. RSUs granted generally vest in annual installments over four years or over three years with the first tranche at the end of twelve months from the vest start date and the remaining vesting quarterly over the remaining two years. RSUs do not have an expiration date. Performance shares granted generally vest at the end of a three-year period if performance conditions are met and do not have an expiration date.
Any shares that are tendered by a participant of the 2016 Plan or retained by the Company as full or partial payment to the Company for the purchase of an award or to satisfy tax withholding obligations in connection with an award shall no longer again be made available for issuance under the 2016 Plan.
2024 Inducement Equity Incentive Plan
In February 2024, the Company adopted the 2024 Inducement Equity Incentive Plan (the “2024 Inducement Plan”), which was approved by the Company’s Board of Directors on February 9, 2024. The 2024 Inducement Plan provides for the granting of stock options, stock appreciation rights, restricted stock, RSUs, performance shares and performance units to eligible individuals who are entering into employment with the Company. The original maximum aggregate number of shares that could be issued under the 2024 Inducement Plan was 2.0 million shares. As of December 31, 2024, approximately 0.2 million shares were reserved for future grants under the 2024 Inducement Plan.
Employee Stock Purchase Plan
The Company sponsors an Employee Stock Purchase Plan (the “ESPP”), pursuant to which eligible employees may contribute up to 10% of compensation, subject to certain income limits, to purchase shares of the Company’s common stock. The terms of the plan include a look-back feature that enables employees to purchase stock semi-annually at a price equal to 85% of the lesser of the fair market value at the beginning of the offering period and the purchase date. The duration of each offering period is generally six-months. In April 2022, the Company approved an amendment to the plan to increase the number of shares of common stock authorized for sale under the plan by 1.0
million shares to a total of 3.0 million shares. For the years ended December 31, 2024, 2023, and 2022, the Company recognized ESPP compensation expense of $1.2 million, $1.1 million and $1.3 million, respectively. Approximately 312,000 shares of common stock were purchased at an average exercise price of $11.44 in the year ended December 31, 2024. As of December 31, 2024, approximately 0.5 million shares were reserved for future issuance under the ESPP.
Option Activity
Stock option activity was as follows:
| | | | | | | | | | | | | | | | |
(In thousands, except per share amounts) | | Number of
Shares | | | Weighted Average Exercise Price Per Share | | | Weighted
Average
Remaining
Contractual
Term | | | Aggregate
Intrinsic
Value | |
Outstanding as of December 31, 2023 | | | 866 | | | $ | 30.70 | | | | | | | |
Exercised | | | (163 | ) | | $ | 24.57 | | | | | | | |
Expired | | | (228 | ) | | $ | 31.15 | | | | | | | |
Outstanding as of December 31, 2024 | | | 475 | | | $ | 32.60 | | | | 1.42 | | | $ | 367,881 | |
| | | | | | | | | | | | |
As of December 31, 2024 | | | | | | | | | | | | |
Vested and expected to vest | | | 475 | | | $ | 32.60 | | | | 1.42 | | | $ | 367,881 | |
Exercisable Options | | | 475 | | | $ | 32.60 | | | | 1.42 | | | $ | 367,881 | |
The aggregate intrinsic values in the table above represent the total pre-tax intrinsic values (the difference between the Company’s closing stock price on the last trading day of 2024, or December 31, 2024, and the exercise price, multiplied by the number of shares underlying the in-the-money options) that would have been received by the option holders had all option holders exercised their options on December 31, 2024. This amount changes based on the fair market value of the Company’s stock. Total intrinsic value of options exercised for the years ended December 31, 2024 and 2022 was $0.4 million and $0.2 million, respectively. There were no options exercised for the year ended December 31, 2023.
The total fair value of options vested during the years ended December 31, 2023, and 2022 was $0.7 million and $1.3 million, respectively. There were no options vested during the year ended December 31, 2024.
The following table summarizes significant ranges of outstanding and exercisable stock options as of December 31, 2024:
| | | | | | | | | | | | | | | | | | | | |
| | Options Outstanding | | | Options Exercisable | |
Range of Exercise Prices | | Shares
Outstanding | | | Weighted-
Average
Remaining
Contractual
Life | | | Weighted-
Average
Exercise
Price Per
Share | | | Shares
Exercisable | | | Weighted-
Average
Exercise
Price Per
Share | |
| | (In thousands) | | | (In years) | | | (In dollars) | | | (In thousands) | | | (In dollars) | |
$23.48 - $23.48 | | | 3 | | | | 1.23 | | | $ | 23.48 | | | | 3 | | | $ | 23.48 | |
$25.37 - $25.37 | | | 5 | | | | 2.42 | | | $ | 25.37 | | | | 5 | | | $ | 25.37 | |
$26.61 - $26.61 | | | 271 | | | | 1.42 | | | $ | 26.61 | | | | 271 | | | $ | 26.61 | |
$38.32 - $38.32 | | | 25 | | | | 3.59 | | | $ | 38.32 | | | | 25 | | | $ | 38.32 | |
$41.67 - $41.67 | | | 171 | | | | 1.07 | | | $ | 41.67 | | | | 171 | | | $ | 41.67 | |
$23.48 - $41.67 | | | 475 | | | | 1.42 | | | $ | 32.60 | | | | 475 | | | $ | 32.60 | |
Time-Based RSU Activity
RSU activity was as follows:
| | | | | | | | | | | | | | | | |
(In thousands, except per share amounts) | | Number
of Shares | | | Weighted Average Grant Date Fair Value Per Share | | | Weighted
Average
Remaining
Contractual
Term | | | Average
Intrinsic
Value | |
Outstanding as of December 31, 2023 | | | 1,567 | | | $ | 22.83 | | | | | | | |
Granted | | | 1,939 | | | $ | 15.91 | | | | | | | |
Vested | | | (739 | ) | | $ | 23.50 | | | | | | | |
Cancelled | | | (217 | ) | | $ | 19.66 | | | | | | | |
Outstanding as of December 31, 2024 | | | 2,550 | | | $ | 17.64 | | | | 1.20 | | | $ | 71,060 | |
The total fair value of RSUs vested during the years ended December 31, 2024, 2023 and 2022 was $11.0 million, $9.2 million and $14.6 million, respectively. The grant date fair value of RSUs vested during the years ended December 31, 2024, 2023 and 2022 was $17.4 million, $17.8 million and $21.5 million, respectively.
Performance-Based RSU Activity
Since 2020, the Company’s executive officers were granted performance-based restricted stock units (“PSUs”) under the 2016 Plan with vesting occurring at the end of a three-year period if performance conditions are met. In February 2024, the Company granted PSUs under the 2024 Inducement Plan to its newly-hired Chief Executive Officer with 1/3 of the target PSUs being allocated to each tranche and vesting occurring at the end of each anniversary of the vesting commencement date over a three-year period. In addition, in 2024, the Company granted PSUs under the 2024 Inducement Plan to its newly-hired employees with vesting occurring at the end of a three-year period if performance conditions are met. The number of PSUs earned and eligible to vest are determined based on achievement of the pre-determined performance or market conditions and the recipients’ continued service with the Company. The number of PSUs to vest could range from 0% to 150% of the target shares granted. For PSUs with a performance condition, at the end of each reporting period, the Company evaluates the probability of achieving the performance conditions and records the related stock-based compensation expense based on performance to date over the service period. The stock-based compensation expense relating to PSUs with a market condition is recognized ratably from the service inception date to the vesting date for each tranche.
Performance-based RSU activity was as follows:
| | | | | | | | |
(In thousands, except per share amounts) | | Number
of Shares | | | Weighted Average Grant Date Fair Value Per Share | |
Outstanding as of December 31, 2021 | | | 293 | | | $ | 33.07 | |
Granted | | | 145 | | | $ | 22.37 | |
Vested | | | — | | | $ | — | |
Cancelled | | | (8 | ) | | $ | 27.17 | |
Outstanding as of December 31, 2022 | | | 430 | | | $ | 29.38 | |
Granted | | | 145 | | | $ | 14.44 | |
Vested | | | — | | | $ | — | |
Cancelled | | | (158 | ) | | $ | 27.85 | |
Outstanding as of December 31, 2023 | | | 417 | | | $ | 24.76 | |
Granted | | | 630 | | | $ | 21.00 | |
Vested | | | — | | | $ | — | |
Cancelled | | | (392 | ) | | $ | 25.12 | |
Outstanding as of December 31, 2024 | | | 655 | | | $ | 20.93 | |
Valuation and Expense Information
The Company measures stock-based compensation at the grant date based on the estimated fair value of the award. Estimated compensation cost relating to time-based RSUs and PSUs with a performance condition is based on
the closing fair market value of the Company’s common stock on the date of grant. The grant date fair value for PSUs with a market condition is determined using the Monte Carlo valuation method. The fair value of options granted and the purchase rights granted under the ESPP is estimated on the date of grant using a Black-Scholes-Merton option valuation model that uses the assumptions noted in the following table. The estimated expected term of options granted is derived from historical data on employee exercise and post-vesting employment termination behavior. The risk-free interest rate of options granted and the purchase rights granted under the ESPP is based on the implied yield currently available on U.S. Treasury securities with a remaining term commensurate with the estimated expected term. Expected volatility of options granted under the 2016 Plan and the purchase rights granted under the ESPP is based on historical volatility over the most recent period commensurate with the estimated expected term. The Company has never declared or paid cash dividends on its capital stock and does not anticipate paying cash dividends in the foreseeable future.
No stock options were granted during the years ended December 31, 2024, 2023 and 2022. The following table sets forth the weighted-average assumptions used to estimate the fair value of purchase rights granted under the ESPP:
| | | | | | | | | | | | |
| | Year Ended December 31, | |
| | 2024 | | | 2023 | | | 2022 | |
| | | |
Expected life (in years) | | | 0.5 | | | | 0.5 | | | | 0.5 | |
Risk-free interest rate | | | 5.01 | % | | | 5.19 | % | | | 2.25 | % |
Expected volatility | | | 48.1 | % | | | 35.8 | % | | | 39.6 | % |
Dividend yield | | | — | | | | — | | | | — | |
The following table sets forth the stock-based compensation expense resulting from stock options, time-based and performance-based RSUs and the ESPP included in the Company’s consolidated statements of operations:
| | | | | | | | | | | | |
| | Year Ended December 31, | |
(In thousands) | | 2024 | | | 2023 | | | 2022 | |
Cost of revenue | | $ | 1,613 | | | $ | 1,405 | | | $ | 1,353 | |
Research and development | | | 3,297 | | | | 3,935 | | | | 4,177 | |
Sales and marketing | | | 6,182 | | | | 5,336 | | | | 5,603 | |
General and administrative | | | 11,586 | | | | 7,262 | | | | 6,601 | |
Total | | $ | 22,678 | | | $ | 17,938 | | | $ | 17,734 | |
Total stock-based compensation cost capitalized in inventory was less than $0.9 million as of each of the years ended December 31, 2024, 2023 and 2022, respectively.
As of December 31, 2024, $42.8 million of unrecognized compensation cost related to unvested time-based and performance-based RSUs is expected to be recognized over a weighted-average period of 2.1 years. If there are any modifications or cancellations of the underlying unvested awards, the Company may be required to accelerate, increase or cancel all or a portion of the remaining unearned stock-based compensation expense.
Note 11. Segment Information
Operating segments are components of an enterprise about which separate financial information is available and is evaluated quarterly by management, namely the Chief Operating Decision Maker (“CODM”) of an organization, in order to determine operating and resource allocation decisions. By this definition, the Company has identified its CEO as the CODM. The Company operates and reports in two segments: NETGEAR for Business and Connected Home:
•NETGEAR for Business: offers reliable, easy-to-use, high-performance networking solutions, including switches, routers, access points, software, and AV over IP technologies, tailored to meet the diverse needs of organizations of all sizes; and
•Connected Home: offers advanced connectivity, powerful performance, and enhanced security features right out of the box, designed to help keep families safe online, whether at home or on the go, including high-performance, dependable and easy-to-use premium WiFi networking solutions such as 4G/5G mobile products, WiFi 7 Tri-band and Quad-band mesh systems and routers, WiFi 6E, WiFi 6, and subscription services that provide consumers a range of value-added services focused on performance, security, privacy and premium support.
The Company believes that this structure reflects its current operational and financial management, and that it provides the best structure for the Company to focus on growth opportunities while maintaining financial discipline. The leadership team of each segment is focused on product and service development efforts, both from a product marketing and engineering standpoint, to service the unique needs of their customers.
The results of the reportable segments are derived directly from the Company’s management reporting system. The results are based on the Company’s method of internal reporting and are not necessarily in conformity with accounting principles generally accepted in the United States. Management measures the performance of each segment based on several metrics, including contribution income (loss). Segment contribution income (loss) includes all product line segment revenue less the related cost of sales, research and development and sales and marketing costs. Contribution income (loss) is used, in part, to evaluate the performance of, and allocate resources to, each of the segments. Certain operating expenses are not allocated to segments because they are separately managed at the corporate level. These unallocated indirect costs include corporate costs, such as corporate research and development, corporate marketing expense and general and administrative costs, amortization of intangibles, stock-based compensation expense, goodwill impairment, intangibles impairment, restructuring and other charges, litigation reserves, net, and other income, net.
Effective on January 1, 2024, resulting from certain segment structure changes, the Company revised its allocation method by allocating certain historically unallocated operating expenses to its individual operating segments. Further, the Company adopted ASU 2023-07 “Segment Reporting (Topic 280): Improvements to Reportable Segment Disclosures” effective for the year ended December 31, 2024 on a retrospective basis. The prior-year segment financial information has been recast to conform to the current-year presentation. Financial information for each reportable segment and a reconciliation of total segment contribution income to income (loss) before income taxes is as follows:
| | | | | | | | | | | | | | | | | | | | | | | | | | | | | | | | | | | | | |
| | Year Ended December 31, | | |
| | 2024 | | | 2023 | | | 2022 | | |
(In thousands, except percentage data) | | NETGEAR for Business | | | Connected Home | | | Total | | | NETGEAR for Business | | | Connected Home | | | Total | | | NETGEAR for Business | | | Connected Home | | | Total | | |
Net revenue | | $ | 287,812 | | | $ | 385,947 | | | $ | 673,759 | | | $ | 293,975 | | | $ | 446,865 | | | $ | 740,840 | | | $ | 373,649 | | | $ | 558,823 | | | $ | 932,472 | | |
Cost of revenue | | | 168,399 | | | | 307,820 | | | | 476,219 | | | | 163,083 | | | | 326,843 | | | | 489,926 | | | | 230,525 | | | | 449,531 | | | | 680,056 | | |
Gross profit | | | 119,413 | | | | 78,127 | | | | 197,540 | | | | 130,892 | | | | 120,022 | | | | 250,914 | | | | 143,124 | | | | 109,292 | | | | 252,416 | | |
Gross margin | | | 41.5 | % | | | 20.2 | % | | | 29.3 | % | | | 44.5 | % | | | 26.9 | % | | | 33.9 | % | | | 38.3 | % | | | 19.6 | % | | | 27.1 | % | |
Operating expenses | | | 75,408 | | | | 104,138 | | | | 179,546 | | | | 74,127 | | * | | 110,477 | | * | | 184,604 | | * | | 69,582 | | * | | 126,823 | | * | | 196,405 | | * |
Contribution income (loss) | | | 44,005 | | | | (26,011 | ) | | | 17,994 | | | | 56,765 | | * | | 9,545 | | * | | 66,310 | | * | | 73,542 | | * | | (17,531 | ) | * | | 56,011 | | * |
Contribution margin | | | 15.3 | % | | | (6.7 | )% | | | 2.7 | % | | | 19.3 | % | * | | 2.1 | % | * | | 9.0 | % | * | | 19.7 | % | * | | (3.1 | )% | * | | 6.0 | % | * |
Corporate and unallocated costs | | | | | | | | | (67,633 | ) | | | | | | | | | (76,179 | ) | * | | | | | | | | (71,648 | ) | * |
Amortization of intangibles (1) | | | | | | | | | — | | | | | | | | | | (257 | ) | | | | | | | | | (514 | ) | |
Stock-based compensation expense | | | | | | | | | (22,678 | ) | | | | | | | | | (17,938 | ) | | | | | | | | | (17,734 | ) | |
Goodwill impairment | | | | | | | | | — | | | | | | | | | | — | | | | | | | | | | (44,442 | ) | |
Intangibles impairment | | | | | | | | | — | | | | | | | | | | (1,071 | ) | | | | | | | | | — | | |
Restructuring and other charges | | | | | | | | | (4,479 | ) | | | | | | | | | (3,962 | ) | | | | | | | | | (4,577 | ) | |
Litigation reserves, net | | | | | | | | | 89,012 | | | | | | | | | | (178 | ) | | | | | | | | | (20 | ) | |
Other income, net (2) | | | | | | | | | 12,672 | | | | | | | | | | 14,139 | | | | | | | | | | 902 | | |
Loss before income taxes | | | | | | | | $ | 24,888 | | | | | | | | | $ | (19,136 | ) | | | | | | | | $ | (82,022 | ) | |
_______________________
(1)Amounts excluded amortization expenses related to patents within purchased intangibles in cost of revenue.
(2)Amounts included gain/(loss), net from litigation settlement of $6.0 million for the year ended December 31, 2023, and gain/(loss), net from derivatives not designated as hedging instruments of $3.3 million, 0.3 million and $2.7 million, for the years ended December 31, 2024, 2023 and 2022, respectively.
* Financial information for each reportable segment in the prior year periods were recast to conform to the current reportable segment structure.
The Company does not report total assets by segment for internal or external reporting purposes as the Company’s CODM does not evaluate operating segments, make strategic decisions, or allocate resources using discrete asset information.
Operations by Geographic Region
For reporting purposes, revenue is generally attributed to each geographic region based on the location of the customer. The following table shows net revenue by geography:
| | | | | | | | | | | | |
| | Year Ended December 31, | |
(In thousands) | | 2024 | | | 2023 | | | 2022 | |
United States (U.S.) | | $ | 443,818 | | | $ | 489,968 | | | $ | 598,649 | |
Americas (excluding U.S.) | | | 12,222 | | | | 14,381 | | | | 18,562 | |
EMEA (1) | | | 127,260 | | | | 148,922 | | | | 179,358 | |
APAC (1) | | | 90,459 | | | | 87,569 | | | | 135,903 | |
Total net revenue | | $ | 673,759 | | | $ | 740,840 | | | $ | 932,472 | |
_______________________
(1)No individual country, other than disclosed above, represented more than 10% of the Company’s total net revenue in the periods presented.
Long-lived assets by Geographic Region
The following table represents the Company’s long-lived assets located in geographic areas, which consist of property and equipment, net and operating lease right-of-use assets:
| | | | | | | | |
(In thousands) | | December 31, 2024 | | | December 31, 2023 | |
United States (U.S.) | | $ | 19,057 | | | $ | 25,051 | |
Canada | | | 5,573 | | | | 4,714 | |
Americas (excluding U.S. and Canada) | | | 39 | | | | 68 | |
EMEA | | | 3,127 | | | | 3,739 | |
Singapore | | | 4,841 | | | | 6,218 | |
APAC (excluding Singapore) (1) | | | 6,698 | | | | 5,768 | |
Total | | $ | 39,335 | | | $ | 45,558 | |
_______________________
(1)No individual country, other than disclosed above, represented more than 10% of the Company’s total long-lived assets in the periods presented.
Significant Customers
For the year ended December 31, 2024, the Company had one customer, that accounted for 16% of net revenue. For the year ended December 31, 2023, the Company had two customers, that each individually accounted for 17% and 12% of net revenue, respectively. For the year ended December 31, 2022, the Company had two customers, that each individually accounted for 15% and 11% of net revenue, respectively. All of the customers were primarily within the Connected Home segment.
Note 12. Fair Value Measurements
The Company determines the fair values of its financial instruments based on a fair value hierarchy, which requires an entity to maximize the use of observable inputs and minimize the use of unobservable inputs when measuring fair value. The classification of a financial asset or liability within the hierarchy is based upon the lowest level input that is significant to the fair value measurement. The fair value hierarchy prioritizes the inputs into three levels that may be used to measure fair value:
Level 1: Unadjusted quoted prices in active markets that are accessible at the measurement date for identical, unrestricted assets or liabilities;
Level 2: Quoted prices in markets that are not active, or inputs which are observable, either directly or indirectly, for substantially the full term of the asset or liability;
Level 3: Prices or valuation techniques that require inputs that are both significant to the fair value measurement and unobservable (i.e., supported by little or no market activity).
The following tables summarize assets and liabilities measured at fair value on a recurring basis:
| | | | | | | | | | | | |
| | December 31, 2024 | |
(In thousands) | | Total | | | Quoted market
prices in active
markets
(Level 1) | | | Significant
other
observable
inputs
(Level 2) | |
Assets: | | | | | | | | | |
Cash equivalents: money-market funds | | $ | 111,043 | | | $ | 111,043 | | | $ | — | |
Available-for-sale investments: U.S. treasury securities(1) | | | 119,370 | | | | — | | | | 119,370 | |
Trading securities: mutual funds(1) | | | 2,876 | | | | 2,876 | | | | — | |
Foreign currency forward contracts(2) | | | 1,053 | | | — | | | | 1,053 | |
Total assets measured at fair value | | $ | 234,342 | | | $ | 113,919 | | | $ | 120,423 | |
Liabilities: | | | | | | | | | |
Foreign currency forward contracts(3) | | $ | 273 | | | $ | — | | | $ | 273 | |
Total liabilities measured at fair value | | $ | 273 | | | $ | — | | | $ | 273 | |
| | | | | | | | | | | | |
| | December 31, 2023 | |
(In thousands) | | Total | | | Quoted market
prices in active
markets
(Level 1) | | | Significant
other
observable
inputs
(Level 2) | |
Assets: | | | | | | | | | |
Cash equivalents: money-market funds | | $ | 25,986 | | | $ | 25,986 | | | $ | — | |
Available-for-sale investments: U.S. treasury securities(1) | | | 98,454 | | | | — | | | | 98,454 | |
Trading securities: mutual funds(1) | | | 8,304 | | | | 8,304 | | | | — | |
Available-for-sale investments: convertible debt securities(1) | | | 173 | | | | — | | | | 173 | |
Foreign currency forward contracts(2) | | | 291 | | | — | | | | 291 | |
Total assets measured at fair value | | $ | 133,208 | | | $ | 34,290 | | | $ | 98,918 | |
Liabilities: | | | | | | | | | |
Foreign currency forward contracts(3) | | $ | 1,691 | | | $ | — | | | $ | 1,691 | |
Total liabilities measured at fair value | | $ | 1,691 | | | $ | — | | | $ | 1,691 | |
(1)Included in Short-term investments on the Company’s consolidated balance sheets.
(2)Included in Prepaid expenses and other current assets on the Company’s consolidated balance sheets.
(3)Included in Other accrued liabilities on the Company’s consolidated balance sheets.
The Company’s investments in money-market funds and mutual funds are classified within Level 1 of the fair value hierarchy because they are valued based on quoted market prices in active markets. The Company’s investments in U.S. treasury securities are classified within Level 2 of the fair value hierarchy because they are valued based on readily available pricing sources for comparable or identical instruments in less active markets. The Company’s investments in convertible debt securities issued by a publicly held company and certificates of deposits are classified within Level 2 of the fair value hierarchy as the fair value for the instrument approximates its cost based on the contractual terms of the arrangement. The Company’s foreign currency forward contracts are classified within Level 2 of the fair value hierarchy as they are valued using pricing models that consider the contract terms as well as currency rates and counterparty credit rates. The Company verifies the reasonableness of these pricing models using observable market data for related inputs into such models. The Company enters into foreign currency forward contracts with only those counterparties that have long-term credit ratings of A-/A3 or higher. The carrying value of non-financial assets and liabilities measured at fair value in the financial statements on a recurring basis, including accounts receivable and accounts payable, approximate fair value due to their short maturities.
Note 13. Restructuring and Other Charges
The Company accounts for its restructuring plans under the authoritative guidance for exit or disposal activities. Accrued restructuring and other charges are classified within Accrued employee compensation and Other accrued liabilities on the consolidated balance sheets.
Restructuring and other charges recognized in fiscal years 2024, 2023 and 2022 were primarily for severance, and other costs in relation to the reorganization of our business to better align the cost structure of the business with projected revenue levels. The liabilities as of December 31, 2024 are expected to be settled in 2025.
The following table provides a summary of the activity related to accrued restructuring and other charges:
| | | | | | | | | | | | |
| | Employee
termination
charges | | | Lease contract
termination and
other charges | | | Total | |
(In thousands) | | | |
Balance as of December 31, 2021 | | $ | — | | | $ | 23 | | | $ | 23 | |
Additions | | | 4,600 | | | | — | | | | 4,600 | |
Cash payments | | | (2,714 | ) | | | — | | | | (2,714 | ) |
Adjustments | | | 26 | | | | (23 | ) | | | 3 | |
Balance as of December 31, 2022 | | | 1,912 | | | | — | | | | 1,912 | |
Additions | | | 3,834 | | | | 631 | | | | 4,465 | |
Cash payments | | | (5,384 | ) | | | (579 | ) | | | (5,963 | ) |
Adjustments | | | (105 | ) | | | (22 | ) | | | (127 | ) |
Balance as of December 31, 2023 | | | 257 | | | | 30 | | | | 287 | |
Additions | | | 4,154 | | | | 325 | | | | 4,479 | |
Cash payments | | | (3,722 | ) | | | (86 | ) | | | (3,808 | ) |
Adjustments | | | (25 | ) | | | (269 | ) | | | (294 | ) |
Balance as of December 31, 2024 | | $ | 664 | | | $ | — | | | $ | 664 | |
Note 14. Leases
The Company leases office space, cars, distribution centers and equipment under non-cancellable operating lease arrangements with various expiration dates through December 2037. The leases have remaining lease terms of approximately 1 year to 13 years, some of which include options to extend for up to a further 5 years, and some of which include options to terminate prior to completion of the contractual lease term with or without penalties. The Company determines the duration of the lease arrangement giving thought to whether or not it is reasonably certain that the Company will exercise options to extend or terminate the lease arrangement ahead of its contractual term. The leases do not contain any material residual value guarantees.
The components of lease cost were as follows:
| | | | | | | | | | | | |
| | Year Ended December 31, | |
| | 2024 | | | 2023 | | | 2022 | |
(In Thousands) | | | |
Operating lease cost | | $ | 12,424 | | | $ | 12,586 | | | $ | 11,067 | |
Short-term lease cost | | | 315 | | | | 305 | | | | 297 | |
Total lease cost (1) | | $ | 12,739 | | | $ | 12,891 | | | $ | 11,364 | |
_______________________
(1)Included in cost of revenue, sales and marketing, research and development and general and administration in the Company’s consolidated statement of operations.
Supplemental cash flow information related to leases was as follows:
| | | | | | | | | | | | | |
| | | Year Ended December 31, | |
| | | 2024 | | | 2023 | | | 2022 | |
(In Thousands) | | | |
Cash paid for amounts included in the measurement of lease liabilities: | | | | | | | | | | |
Operating cash flows relating to operating leases | | | $ | 13,733 | | | $ | 12,697 | | | $ | 9,907 | |
| | | | | | | | | | |
Lease liabilities arising from obtaining right-of-use assets: | | | | | | | | | | |
Operating leases | | | $ | 1,273 | | | $ | 6,987 | | | $ | 26,511 | |
Supplemental balance sheet information related to leases was as follows:
| | | | | | | | |
| | As of December 31, | |
| | 2024 | | | 2023 | |
Weighted Average Remaining Lease Term (in years) | | | | | | |
Operating leases | | | 4.1 | | | | 4.6 | |
| | | | | | |
Weighted Average Discount Rate | | | | | | |
Operating leases | | | 6.1 | % | | | 5.8 | % |
As of December 31, 2024, maturities of operating lease liabilities were as follows (in thousands):
| | | | |
| | Operating Lease | |
2025 | | $ | 12,304 | |
2026 | | | 8,839 | |
2027 | | | 7,922 | |
2028 | | | 1,406 | |
2029 | | | 674 | |
Thereafter | | | 4,416 | |
Total lease payments | | | 35,561 | |
Less imputed interest | | | (4,928 | ) |
Total | | $ | 30,633 | |
Item 9. Changes in and Disagreements With Accountants on Accounting and Financial Disclosure
None.
Item 9A. Controls and Procedures
Management’s Report on Internal Control Over Financial Reporting
Our management is responsible for establishing and maintaining adequate internal control over financial reporting (as defined in Rule 13a-15(f) under the Exchange Act). Because of its inherent limitations, internal control over financial reporting may not prevent or detect misstatements. Also, projections of any evaluation of effectiveness to future periods are subject to the risk that controls may become inadequate because of changes in conditions, or that the degree of compliance with the policies or procedures may deteriorate.
Our management, including our Chief Executive Officer and Chief Financial Officer, conducted an evaluation of the effectiveness of our internal control over financial reporting as of December 31, 2024. In making this assessment, our management used the criteria established in Internal Control-Integrated Framework (2013), issued by The Committee of Sponsoring Organizations of the Treadway Commission (COSO). Based on management’s assessment using those criteria, our management concluded that our internal control over financial reporting was effective as of December 31, 2024. The effectiveness of our internal control over financial reporting as of December 31, 2024 has been audited by PricewaterhouseCoopers LLP (PCAOB ID: 238), an independent registered public accounting firm, as stated in their report which is included in this Annual Report on Form 10-K.
Changes in Internal Control Over Financial Reporting
There have been no changes in our internal control over financial reporting that occurred during the fourth fiscal quarter of 2024 that have materially affected, or are reasonably likely to materially affect, our internal control over financial reporting.
Evaluation of Disclosure Controls and Procedures
Based on an evaluation under the supervision and with the participation of our management (including our Chief Executive Officer and Chief Financial Officer), our Chief Executive Officer and Chief Financial Officer have concluded that our disclosure controls and procedures as defined in Rules 13a-15(e) and 15d-15(e) under the Securities Exchange Act of 1934, as amended (the “Exchange Act”) were effective as of the end of the period covered by this Annual Report on Form 10-K. Based on this evaluation, our Chief Executive Officer and Chief Financial Officer have concluded that our disclosure controls and procedures are effective to ensure that information we are required to disclose in reports that we file or submit under the Exchange Act is (i) recorded, processed, summarized and reported within the time periods specified in the Securities and Exchange Commission rules and forms and (ii) accumulated and communicated to our management, including our Chief Executive Officer and our Chief Financial Officer, as appropriate to allow timely decisions regarding required disclosures.
Limitations on the Effectiveness of Controls
It should be noted that any system of controls, however well designed and operated, can provide only reasonable assurance, and not absolute assurance, that the objectives of the system are met. In addition, the design of any control system is based in part upon certain assumptions about the likelihood of future events. Because of these and other inherent limitations of control systems, there can be no assurance that any design will succeed in achieving its stated goals in all future circumstances.
Item 9B. Other Information
Insider Trading Arrangements
During the three months ended December 31, 2024, our Board of Directors and officers (as defined in Rule 16a-1(f)) under the Exchange Act adopted or terminated the contracts, instructions or written plans for the purchase or sale of the Company’s securities set forth in the table below.
| | | | | | | |
| | | Type of Trading Arrangement | | | |
Name and Position | Action | Adoption/Termination Date | Rule 10b5-1* | Non-Rule 10b5-1** | Total Shares of Common Stock to be Sold*** | Total Shares of Common Stock to be Purchased | Expiration Date |
Sarah Butterfass, Director | Adopted | 11/14/2024 | Yes | | 40.0% net shares resulting from the vesting of 14,619 (gross) RSUs | N/A | 10/31/2025 |
Charles J Prober, Chief Executive Officer | Adopted | 11/20/2024 | Yes | | 6.3% of net shares resulting from the vesting of 531,789 (gross) restricted stock and performance shares, 1,707 net shares from a prior ESPP purchase, and net shares to be purchased in Feb 2025 under ESPP | N/A | 11/21/2026 |
Bryan Murray, Chief Financial Officer | Adopted | 12/13/2024 | Yes | | 10.0% of net shares resulting from the vesting of 68,438 (gross) restricted stock and performance shares, 2,199 net shares from prior ESPP purchases, and net shares to be purchased in Feb 2025 under ESPP | N/A | 12/12/2025 |
| | | | | | | |
* Contract, instruction or written plan intended to satisfy the affirmative defense conditions of Rule 10b5-1(c) under the Exchange Act. |
** “Non-Rule 10b5-1 trading arrangement” as defined in Item 408(c) of Regulation S-K under the Exchange Act |
*** Net shares issued with shares withheld to administratively facilitate the withholding and subsequent remittance of personal income and payroll taxes for the vesting of RSUs and PSUs. |
Item 9C. Disclosure Regarding Foreign Jurisdictions that Prevent Inspections
Not applicable.
PART III
Certain information required by Part III is incorporated herein by reference from our proxy statement related to our 2025 Annual Meeting of Stockholders (“Proxy Statement”), which we intend to file no later than 120 days after the end of the fiscal year covered by this Form 10-K.
Item 10. Directors, Executive Officers and Corporate Governance
The information required by this Item concerning our directors, insider trading policy, executive officers, standing committees and procedures by which stockholders may recommend nominees to our Board of Directors, is incorporated by reference to the sections of our Proxy Statement under the headings “Information Concerning the Nominees and Incumbent Directors,” “Other Compensation Policies and Information,” “Board and Committee Meetings,” and “Audit Committee” and to the information contained in the section captioned “Executive Officers of the Registrant” included under Part I of this Annual Report on Form 10-K.
We have adopted a Code of Ethics that applies to our Chief Executive Officer and senior financial officers, as required by the SEC. The current version of our Code of Ethics can be found on our Internet site at http://www.netgear.com. Additional information required by this Item regarding our Code of Ethics is incorporated by reference to the information contained in the section captioned “Corporate Governance Policies and Practices” in our Proxy Statement.
We intend to satisfy the disclosure requirement under Item 5.05 of Form 8-K regarding an amendment to, or waiver from, a provision of our Code of Ethics by posting such information on our website at http://www.netgear.com within four business days following the date of such amendment or waiver.
Item 11. Executive Compensation
The information required by this Item is incorporated by reference to the sections of our Proxy Statement under the headings “Compensation Discussion and Analysis,” “Executive Compensation,” “Director Compensation,” “Fiscal Year 2024 Director Compensation,” “Compensation Committee Interlocks and Insider Participation,” and “Report of the Compensation Committee of the Board of Directors.”
Item 12. Security Ownership of Certain Beneficial Owners and Management and Related Stockholder Matters
The additional information required by this Item is incorporated by reference to the information contained in the section captioned “Equity Compensation Plan Information” in our Proxy Statement.
The additional information required by this Item is incorporated by reference to the information contained in the section captioned “Security Ownership of Certain Beneficial Owners and Management” in our Proxy Statement.
Item 13. Certain Relationships and Related Transactions, and Director Independence
The information required by this Item is incorporated by reference to the information contained in the section captioned “Election of Directors” and “Related Party Transactions” in our Proxy Statement.
Item 14. Principal Accountant Fees and Services
The information required by this Item related to audit fees and services is incorporated by reference to the information contained in the section captioned “Ratification of Appointment of Independent Registered Public Accounting Firm” appearing in our Proxy Statement.
PART IV
Item 15. Exhibits and Financial Statement Schedules
(a)The following documents are filed as part of this report:
The following consolidated financial statements of NETGEAR, Inc. are filed as part of this Annual Report on Form 10-K in Item 8, Financial Statements and Supplementary Data.
| |
| Page |
| |
Report of Independent Registered Public Accounting Firm (PCAOB ID: 238) | 65 |
| |
Consolidated Balance Sheets as of December 31, 2024 and 2023 | 67 |
| |
Consolidated Statements of Operations for the three years ended December 31, 2024, 2023 and 2022 | 68 |
| |
Consolidated Statements of Comprehensive Income (Loss) for the three years ended December 31, 2024, 2023, and 2022 | 69 |
| |
Consolidated Statements of Stockholders’ Equity for the three years ended December 31, 2024, 2023, and 2022 | 70 |
| |
Consolidated Statements of Cash Flows for the three years ended December 31, 2024, 2023, and 2022 | 71 |
| |
Notes to Consolidated Financial Statements | 72 |
| |
(2) Financial Statement Schedule (Valuation and Qualifying Accounts) for the three years ended December 31, 2024.
Schedule II—Valuation and Qualifying Accounts
| | | | | | | | | | | | | | | | | | | | |
| | Balance at
Beginning
of Year | | | Other | | | Additions | | | Deductions | | | Balance at
End of Year | |
| | (In thousands) | |
Allowance for doubtful accounts: | | | | | | | | | | | | | | | |
Year ended December 31, 2024 | | $ | 338 | | | $ | — | | | $ | 169 | | | $ | — | | | $ | 507 | |
Year ended December 31, 2023 | | | 397 | | | | — | | | | — | | | | (59 | ) | | | 338 | |
Year ended December 31, 2022 | | $ | 399 | | | $ | — | | | $ | — | | | $ | (2 | ) | | $ | 397 | |
All other schedules have been omitted because they are not required, not applicable, or the required information is otherwise included.
INDEX TO EXHIBITS
| | | | | | | | | | |
| | | | Incorporated by Reference | | |
Exhibit Number | | Exhibit Description | | Form | | Date | | Number | | Filed Herewith |
| | | | | | | | | | |
3.1 | | Amended and Restated Certificate of Incorporation of the registrant | | 10-Q | | 8/4/2017 | | 3.1 | | |
| | | | | | | | | | |
3.2 | | Amended and Restated Bylaws of the registrant | | 8-K | | 4/20/2018 | | 3.2 | | |
| | | | | | | | | | |
4.1 | | Form of registrant’s common stock certificate | | S-1/A | | 7/14/2003 | | 4.1 | | |
| | | | | | | | | | |
4.2 | | Description of the Registrant’s Securities | | 10-K | | 2/18/2020 | | 4.2 | | |
| | | | | | | | | | |
10.1# | | Form of Indemnification Agreement for directors and officers | | | | | | | | X |
| | | | | | | | | | |
10.2# | | 2016 Equity Incentive Plan, as amended, and forms of agreement thereunder | | 10-K | | 2/16/2024 | | 10.2 | | |
| | | | | | | | | | |
10.3# | | 2024 Inducement Equity Incentive Plan and forms of agreement thereunder | | 8-K | | 2/14/2024 | | 10.1 | | |
| | | | | | | | | | |
10.4# | | 2003 Employee Stock Purchase Plan, as amended | | S-8 | | 8/5/2022 | | 99.1 | | |
| | | | | | | | | | |
10.5# | | Amended and Restated 2006 Long-Term Incentive Plan and forms of agreements thereunder | | S-8 | | 6/6/2014 | | 4.3 | | |
| | | | | | | | | | |
10.6# | | NETGEAR, Inc. Deferred Compensation Plan | | 8-K | | 4/5/2013 | | 10.1 | | |
| | | | | | | | | | |
10.7# | | NETGEAR, Inc. Executive Bonus Plan | | 8-K | | 2/5/2020 | | 99.2 | | |
| | | | | | | | | | |
10.8* | | Warehousing Agreement, dated July 5, 2001, between the registrant and APL Logistics Americas, Ltd. | | S-1/A | | 4/21/2003 | | 10.25 | | |
| | | | | | | | | | |
10.9* | | Distribution Operations Agreement, dated April 27, 2001, between the registrant and DSV Solutions B.V. (formerly Furness Logistics BV) | | S-1/A | | 4/21/2003 | | 10.26 | | |
| | | | | | | | | | |
10.10* | | Distribution Operations Agreement, dated December 1, 2001, between the registrant and Kerry Logistics (Hong Kong) Limited | | S-1/A | | 4/21/2003 | | 10.27 | | |
| | | | | | | | | | |
10.11 | | Office Lease, dated as of September 25, 2007, by and between the registrant and BRE/Plumeria, LLC | | 8-K | | 9/27/2007 | | 10.1 | | |
| | | | | | | | | | |
10.11a | | First Amendment to Office Lease, dated as of April 23, 2008, by and between the registrant and BRE/Plumeria, LLC | | 10-Q | | 5/9/2008 | | 10.1 | | |
| | | | | | | | | | |
10.11b | | Second Amendment to Office Lease, dated June 25, 2015, by and between the registrant and KBSII/Plumeria, LLC | | 10-K | | 2/19/2016 | | 10.11B | | |
| | | | | | | | | | |
10.12# | | Office Lease, dated as of September 26, 2024, by and between the registrant and A&M PEAK FIRST STREET, LLC | | 10-Q | | 11/1/2024 | | 10.1 | | |
| | | | | | | | | | |
10.13# | | Offer Letter, dated December 3, 1999, between the registrant and Patrick C.S. Lo | | S-1 | | 4/10/2003 | | 10.5 | | |
| | | | | | | | | | |
10.14# | | Amendment to Offer Letter, dated December 23, 2008, between the registrant and Patrick C.S. Lo | | 10-K | | 3/4/2009 | | 10.51 | | |
| | | | | | | | | | |
| | | | | | | | | | |
10.15# | | Offer Letter, dated January 30, 2024, between the registrant and Charles (CJ) Prober | | 10-Q | | 5/3/2024 | | 10.4 | | |
| | | | | | | | | | |
10.16# | | Offer Letter, dated November 6, 2001, between the registrant and Bryan D. Murray | | 10-K | | 2/18/2022 | | 10.13 | | |
| | | | | | | | | | |
10.17# | | Offer Letter, dated June 16, 2004, between the registrant and David J. Henry | | 10-K | | 2/18/2022 | | 10.14 | | |
| | | | | | | | | | |
10.18# | | Employment Agreement, dated October 18, 2002, between the registrant and Michael F. Falcon | | S-1 | | 4/10/2003 | | 10.10 | | |
| | | | | | | | | | |
10.19# | | Amendment to Employment Agreement, dated December 29, 2008, between the registrant and Michael F. Falcon | | 10-K | | 3/4/2009 | | 10.49 | | |
| | | | | | | | | | |
10.20# | | Amendment to Employment Agreement, dated December 30, 2008, between the registrant and Michael A. Werdann | | 10-K | | 3/4/2009 | | 10.54 | | |
| | | | | | | | | | |
10.21# | | Second Amendment to Employment Agreement, dated October 1, 2015, between the registrant and Michael A. Werdann | | 10-K | | 2/19/2016 | | 10.21 | | |
| | | | | | | | | | |
10.22# | | Employment Agreement, dated July 12, 2024, between the registrant and Pramod Badjate | | | | | | | | X |
| | | | | | | | | | |
10.23# | | Executive Succession and Advisory Services Agreement, dated January 30, 2024, between the registrant and Patrick C.S. Lo | | 10-Q | | 5/3/2024 | | 10.3 | | |
| | | | | | | | | | |
10.24# | | Separation Agreement and Release, dated as of January 1, 2025, between the Registrant and David J. Henry | | 8-K | | 1/07/2025 | | 10.1 | | |
| | | | | | | | | | |
10.25# | | Form of Change in Control and Severance Agreement (Chief Executive Officer) | | 10-Q | | 5/3/2024 | | 10.5 | | |
| | | | | | | | | | |
10.26# | | Form of Change in Control and Severance Agreement (Other Executive Officers) | | | | | | | | X |
| | | | | | | | | | |
19.1 | | Insider Trading Policy | | | | | | | | X |
| | | | | | | | | | |
21.1 | | List of subsidiaries and affiliates | | 10-K | | 2/16/2024 | | 21.1 | | |
| | | | | | | | | | |
23.1 | | Consent of PricewaterhouseCoopers LLP, Independent Registered Public Accounting Firm | | | | | | | | X |
| | | | | | | | | | |
24.1 | | Power of Attorney (included on signature page) | | | | | | | | X |
| | | | | | | | | | |
31.1 | | Certification of Chief Executive Officer pursuant to Securities Exchange Act Rules 13a-14(a) / 15d-14(a), as adopted pursuant to Section 302 of the Sarbanes-Oxley Act of 2002 | | | | | | | | X |
| | | | | | | | | | |
31.2 | | Certification of Chief Financial Officer pursuant to Securities Exchange Act Rules 13a-14(a) / 15d-14(a), as adopted pursuant to Section 302 of the Sarbanes-Oxley Act of 2002 | | | | | | | | X |
| | | | | | | | | | |
32.1 | | Certification of Chief Executive Officer pursuant to 18 U.S.C. Section 1350, as adopted pursuant to Section 906 of the Sarbanes-Oxley Act of 2002 | | | | | | | | X |
| | | | | | | | | | |
32.2 | | Certification of Chief Financial Officer pursuant to 18 U.S.C. Section 1350, as adopted pursuant to Section 906 of the Sarbanes-Oxley Act of 2002 | | | | | | | | X |
| | | | | | | | | | |
| | | | | | | | | | |
97.1 | | NETGEAR, Inc. Clawback Policy | | 10-K | | 2/16/2024 | | 97.1 | | |
| | | | | | | | | | |
101.INS | | Inline XBRL Instance Document- the instance document does not appear in the Interactive Data File because its XBRL tags are embedded within the Inline XBRL document. | | | | | | | | X |
| | | | | | | | | | |
101.SCH | | Inline XBRL Taxonomy Extension Schema With Embedded Linkbase Documents | | | | | | | | X |
| | | | | | | | | | |
104 | | Cover Page Interactive Data File (formatted as inline XBRL and contained in Exhibits 101) | | | | | | | | X |
| | | | | | | | | | |
# | | Indicates management contract or compensatory plan or arrangement. | | | | | | | | |
| | | | | | | | | | |
* | | Confidential treatment has been granted as to certain portions of this Exhibit. | | | | | | | | |
Item 16. Form 10-K Summary
None.
SIGNATURES
Pursuant to the requirements of Section 13 or 15(d) of the Securities Exchange Act of 1934, the Registrant has duly caused this Annual Report to be signed on its behalf by the undersigned, thereunto duly authorized, in the City of San Jose, State of California, on the 14th day of February 2025.
| | |
| NETGEAR, INC. |
| By: | /s/ CHARLES (CJ) PROBER |
| | Charles (CJ) Prober |
| | Chief Executive Officer and Director |
POWER OF ATTORNEY
KNOW ALL PERSONS BY THESE PRESENTS, that each person whose signature appears below constitutes and appoints Charles (CJ) Prober and Bryan D. Murray, and each of them, his attorneys-in-fact, each with the power of substitution, for him in any and all capacities, to sign any and all amendments to this Report on Form 10-K and to file the same, with exhibits thereto and other documents in connection therewith, with the Securities and Exchange Commission, hereby ratifying and confirming all that each of said attorneys-in-fact, or his substitute or substitutes, may do or cause to be done by virtue hereof.
Pursuant to the requirements of the Securities Exchange Act of 1934, this report has been signed below by the following persons on behalf of the Registrant and in the capacities and on the dates indicated:
| | | | |
Signature | | Title | | Date |
| | | | |
/S/ CHARLES (CJ) PROBER | | Chief Executive Officer and Director | | February 14, 2025 |
Charles (CJ) Prober | | (Principal Executive Officer) | | |
| | | | |
/S/ BRYAN D. MURRAY | | Chief Financial Officer | | February 14, 2025 |
Bryan D. Murray | | (Principal Financial and Accounting Officer) | | |
| | | | |
/S/ SARAH S. BUTTERFASS | | Director | | February 14, 2025 |
Sarah S. Butterfass | | | | |
| | | | |
/S/ LAURA J. DURR | | Director | | February 14, 2025 |
Laura J. Durr | | | | |
/S/ SHRAVAN K. GOLI | | Director | | February 14, 2025 |
Shravan K. Goli | | | | |
| | | | |
/S/ BRADLEY L. MAIORINO | | Director | | February 14, 2025 |
Bradley L. Maiorino | | | | |
| | | | |
/S/ LAURA C. ORVIDAS | | Director | | February 14, 2025 |
Laura C. Orvida | | | | |
| | | | |
/S/ JANICE M. ROBERTS | | Director | | February 14, 2025 |
Janice M. Roberts | | | | |
| | | | |
/S/ THOMAS H. WAECHTER | | Director | | February 14, 2025 |
Thomas H. Waechter | | | | |
| | | | |
| | | | |
| | | | |