Exhibit 99.1
Link to searchable text of slide shown above
Link to searchable text of slide shown above
Link to searchable text of slide shown above
Link to searchable text of slide shown above
Link to searchable text of slide shown above
Link to searchable text of slide shown above
Link to searchable text of slide shown above
Link to searchable text of slide shown above
Link to searchable text of slide shown above
Link to searchable text of slide shown above
Link to searchable text of slide shown above
Link to searchable text of slide shown above
Link to searchable text of slide shown above
Link to searchable text of slide shown above

Link to searchable text of slide shown above
Link to searchable text of slide shown above

Link to searchable text of slide shown above
Link to searchable text of slide shown above
Link to searchable text of slide shown above
Link to searchable text of slide shown above
Link to searchable text of slide shown above
Link to searchable text of slide shown above
Link to searchable text of slide shown above

Link to searchable text of slide shown above
Link to searchable text of slide shown above
Link to searchable text of slide shown above
Link to searchable text of slide shown above
Link to searchable text of slide shown above
Link to searchable text of slide shown above
Link to searchable text of slide shown above
Link to searchable text of slide shown above

Link to searchable text of slide shown above
Link to searchable text of slide shown above

Link to searchable text of slide shown above
Link to searchable text of slide shown above
Link to searchable text of slide shown above
Searchable text section of graphics shown above
[LOGO]
TOOLS TO ACCELERATE DRUG DISCOVERY
Market Leader in Established Markets
Technology Leader in Emerging Markets
NASDAQ HBIO
Copyright © Harvard Bioscience 2005
Safe Harbor Statement
This presentation contains and our conference call may contain forward-looking statements within the meaning of the federal securities laws. You can identify these statements by our use of the words “guidance,” “expects,” “plans,” “estimates,” “projects,” “anticipates,” “intends,” “believes” and similar expressions that do not relate to historical matters. Forward-looking statements in this presentation or that may be made during our conference call may include, but are not limited to, statements or inferences about the Company’s or management’s beliefs or expectations, the Company’s anticipated future revenues and earnings, the strength of the Company’s market position and business model, the impact of acquisitions, the outlook for the life sciences industry, the Company’s business strategy, the positioning of the Company for growth, the market demand and opportunity for the Company’s products, our ability to finance our business plans and the Company’s plans, objectives and intentions that are not historical facts.
These statements involve known and unknown risks, uncertainties and other factors that may cause the Company’s actual results, performance or achievements to be materially different from any future results, performance or achievements expressed or implied by the forward-looking statements. Factors that may cause the Company’s actual results to differ materially from those in the forward-looking statements include the Company’s failure to successfully integrate acquired businesses or technologies, expand its product offerings, introduce new products or commercialize new technologies, unanticipated costs relating to acquisitions, decreased demand for the Company’s products due to changes in its customers’ needs, financial position, general economic outlook, or other circumstances, overall economic trends, the timing of our customers’ capital equipment purchases and the seasonal nature of purchasing in Europe, our potential misinterpretation of trends of our capital equipment product lines due to the cyclical nature of this market, economic, political and other risks associated with international revenues and operations, additional costs of complying recent changes in regulatory rules applicable to public companies, our ability to manage our growth, our ability to retain key personnel, competition from our competitors, technological changes resulting in our products becoming obsolete, our ability to meet the financial covenants contained in our credit facility, our ability to protect our intellectual property and operate without infringing on others’ intellectual property, potential costs of any lawsuits to protect or enforce our intellectual property, economic and political conditions generally and those affecting pharmaceutical and biotechnology industries, impact of any impairment of our goodwill or intangible assets, and our acquisition of Genomic Solutions failing to qualify as a tax-free reorganization for federal tax purposes, plus factors described under the heading “Important Factors That May Affect Future Operating Results” in the Company’s Annual Report on Form 10-K/A for the fiscal year ended December 31, 2004 or described in the Company’s Quarterly Report on Form 10-Q for the quarterly period ended March 31, 2005 or any other public filings. The Company’s results may also be affected by factors of which the Company is not currently aware. Any forward-looking statements represent our estimates as of June 1, 2005 and should not be relied upon as representing our estimates of any subsequent day. The Company may not update these forward-looking statements, even though its situation may change in the future, unless it has obligations under the federal securities laws to update and disclose material developments related to previously disclosed information.
| [LOGO] |
| |
| Tools to Accelerate Drug Discovery |
Use of Non-GAAP Information
In this presentation, we have included non-GAAP financial information including adjusted operating income and adjusted net income per diluted share. We believe that this non-GAAP financial information provides investors with an enhanced understanding of the underlying operations of the business. For the periods presented, these non-GAAP financial measures have excluded certain expenses primarily resulting from purchase accounting or events that we do not believe are related to the underlying operations of the business including, but not limited to, amortization of intangibles related to acquisitions, fair value adjustments of inventory and backlog related to acquisitions, in-process research and development expense, and stock compensation expense. This non-GAAP financial information approximates information used by our management to internally evaluate the operating results of the Company. Tabular reconciliations of our non-GAAP adjusted operating income and adjusted net income per diluted share for the periods presented to the comparable GAAP financial information is included in this presentation in Appendices A and B.
The non-GAAP financial information provided in this presentation should be considered in addition to, not as a substitute for, the financial information provided and presented in accordance with GAAP.
Investment Highlights
• Tools to Accelerate Drug Discovery – two business segments
• Apparatus and Instrumentation Business Segment
• 70% of 2004 revenue
• Market leader in established markets
• Good growth, great profitability
• Capital Equipment Business Segment
• 30% of 2004 revenue
• Technology leader in emerging markets
• High growth potential, but volatile
• Stockholder risk limited by restructuring
• Experienced Management Team
• Commitment to Stockholder Value Creation
Overview
• Financial Performance Overview
• Instrumentation and Apparatus Business Segment
• Capital Equipment Business Segment
• Management Team
• Commitment to Stockholder Value
Financial Performance Overview
Harvard Bioscience - Consolidated
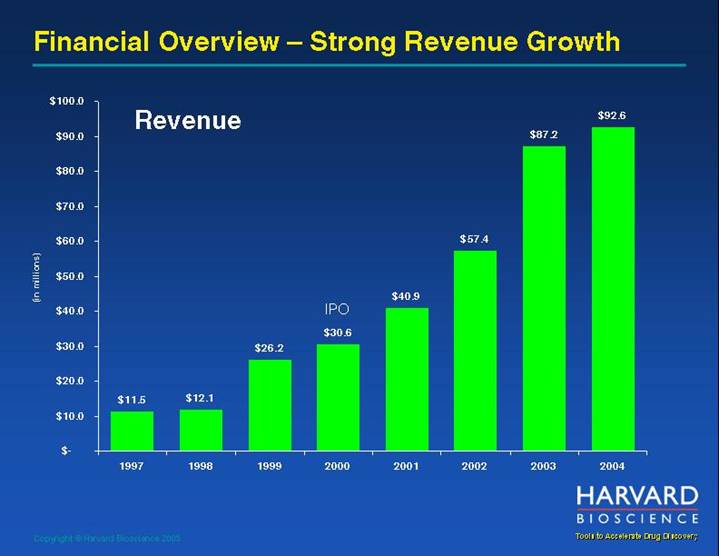
Financial Overview – Strong Revenue Growth
Revenue
[CHART]
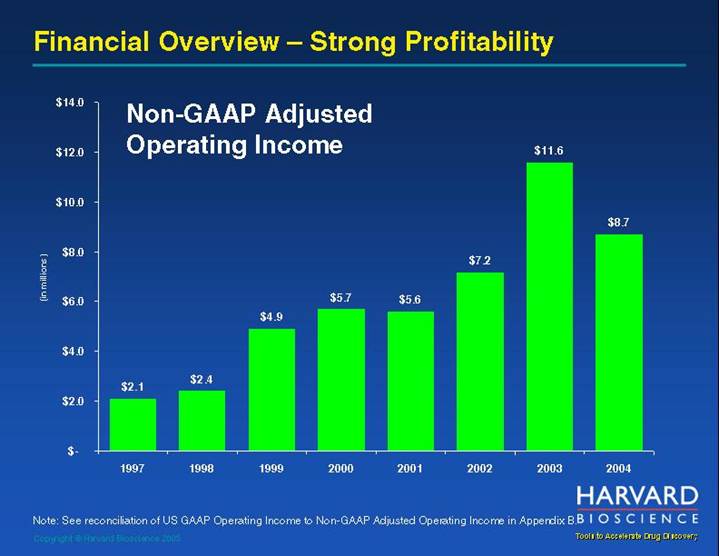
Financial Overview – Strong Profitability
Non-GAAP Adjusted Operating Income
[CHART]
Note: See reconciliation of US GAAP Operating Income to Non-GAAP Adjusted Operating Income in Appendix B.
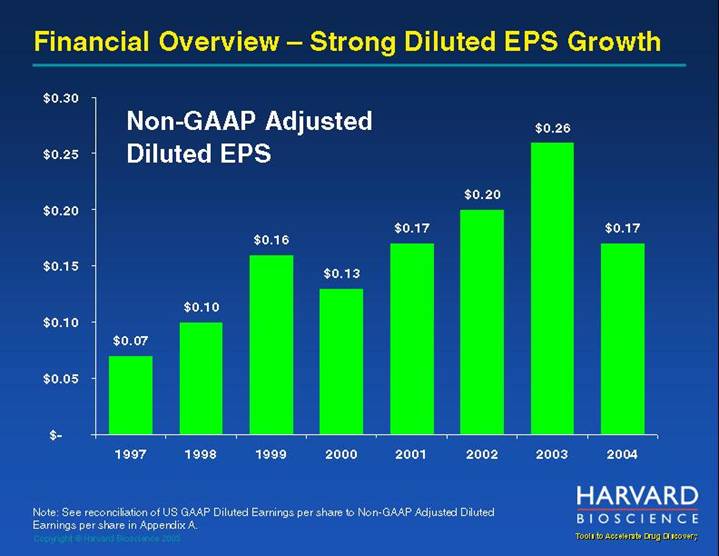
Financial Overview – Strong Diluted EPS Growth
Non-GAAP Adjusted Diluted EPS
[CHART]
Note: See reconciliation of US GAAP Diluted Earnings per share to Non-GAAP Adjusted Diluted Earnings per share in Appendix A.
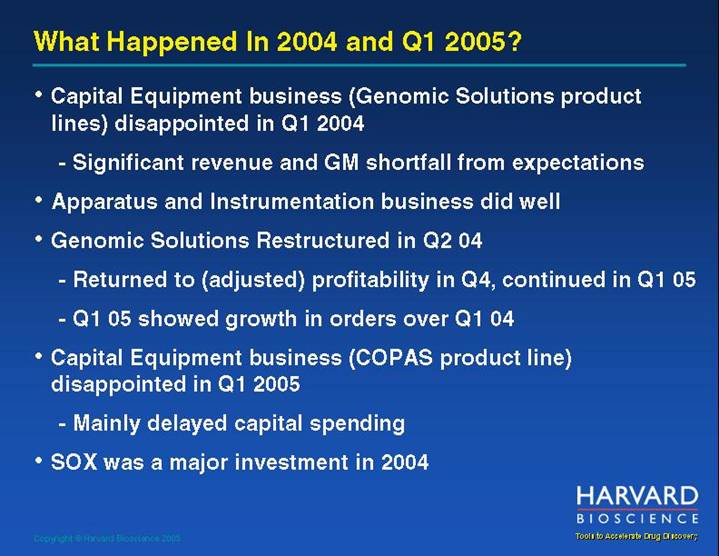
What Happened In 2004 and Q1 2005?
• Capital Equipment business (Genomic Solutions product lines) disappointed in Q1 2004
• Significant revenue and GM shortfall from expectations
• Apparatus and Instrumentation business did well
• Genomic Solutions Restructured in Q2 04
• Returned to (adjusted) profitability in Q4, continued in Q1 05
• Q1 05 showed growth in orders over Q1 04
• Capital Equipment business (COPAS product line) disappointed in Q1 2005
• Mainly delayed capital spending
• SOX was a major investment in 2004
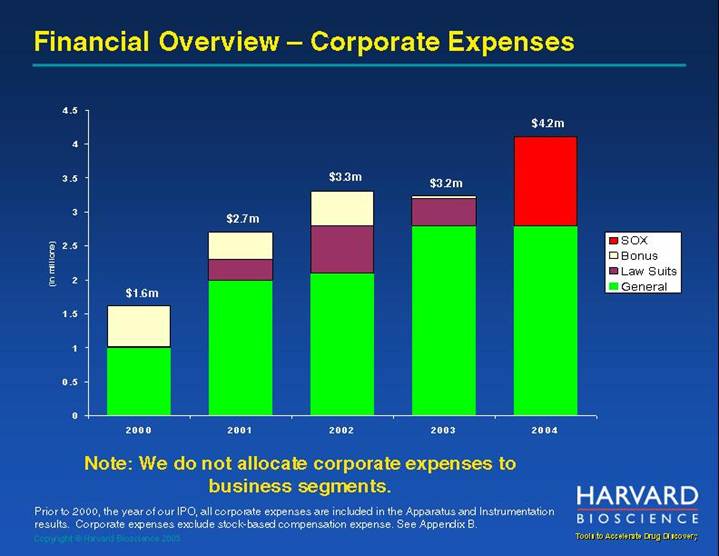
Financial Overview – Corporate Expenses
[CHART]
Note: We do not allocate corporate expenses to business segments. Prior to 2000, the year of our IPO, all corporate expenses are included in the Apparatus and Instrumentation results. Corporate expenses exclude stock-based compensation expense. See Appendix B.
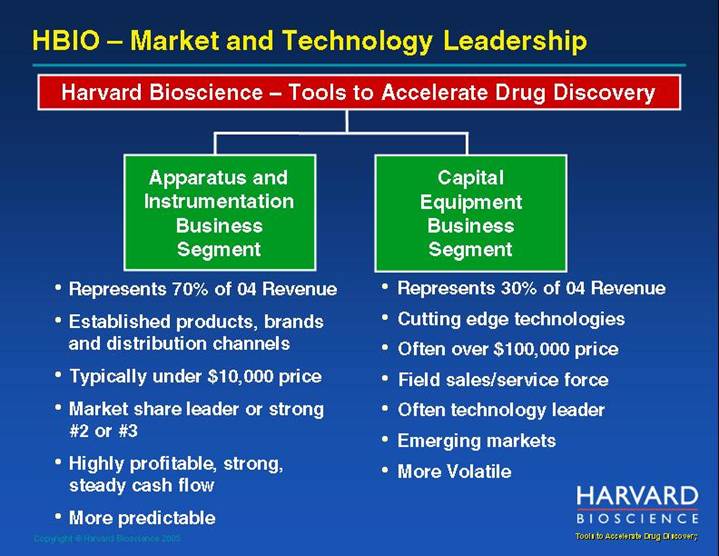
HBIO – Market and Technology Leadership
Harvard Bioscience –Tools to Accelerate Drug Discovery
Apparatus and | | Capital |
Instrumentation | | Equipment |
Business | | Business |
Segment | | Segment |
| | |
• | Represents 70% of 04 Revenue | | • | Represents 30% of 04 Revenue |
| | | | |
• | Established products, brands and distribution channels | | • | Cutting edge technologies |
| | | | |
• | Typically under $10,000 price | | • | Often over $100,000 price |
| | | | |
• | Market share leader or strong #2 or #3 | | • | Field sales/service force |
| | | | |
• | Highly profitable, strong, steady cash flow | | • | Often technology leader |
| | | | |
• | More predictable | | • | Emerging markets |
| | | | |
| | | • | More Volatile |
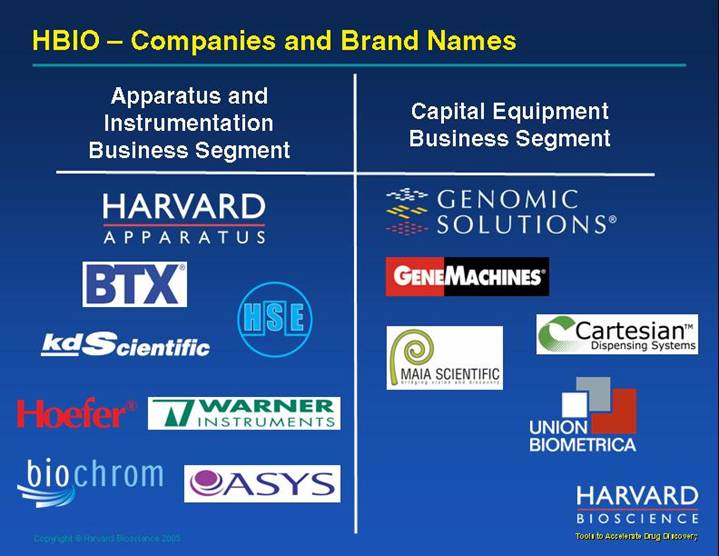
HBIO – Companies and Brand Names
Apparatus and
Instrumentation
Business Segment | | Capital Equipment
Business Segment |
| | |
[LOGO] | | [LOGO] |
Apparatus and Instrumentation
Business Segment
Apparatus and Instrumentation
Organic growth & tuck-under acquisitions have driven revenues
Revenue
[CHART]
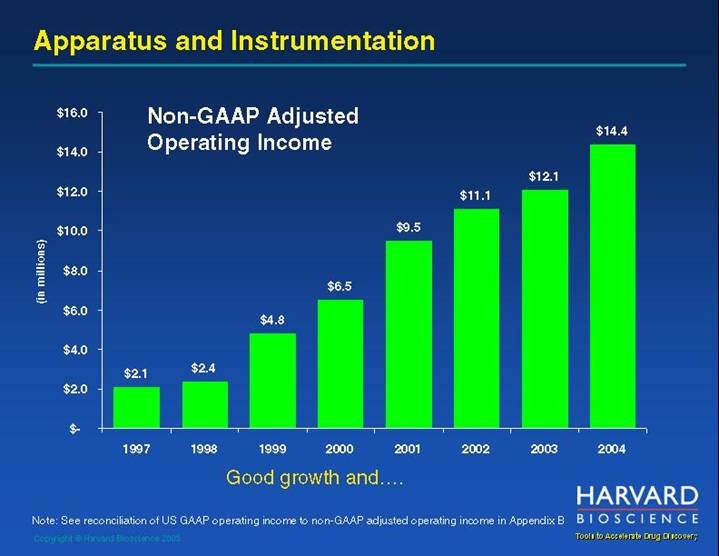
Non-GAAP Adjusted Operating Income
[CHART]
Good growth and….
Note: See reconciliation of US GAAP operating income to non-GAAP adjusted operating income in Appendix B
Non-GAAP Adjusted Operating Income as a % of Revenue
[CHART]
…..great profitability
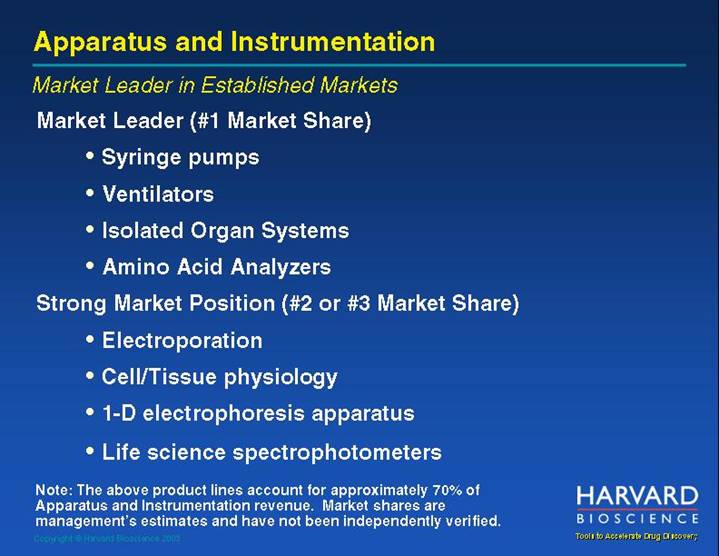
Market Leader in Established Markets
Market Leader (#1 Market Share)
• Syringe pumps
• Ventilators
• Isolated Organ Systems
• Amino Acid Analyzers
Strong Market Position (#2 or #3 Market Share)
• Electroporation
• Cell/Tissue physiology
• 1-D electrophoresis apparatus
• Life science spectrophotometers
Note: The above product lines account for approximately 70% of Apparatus and Instrumentation revenue. Market shares are management’s estimates and have not been independently verified.
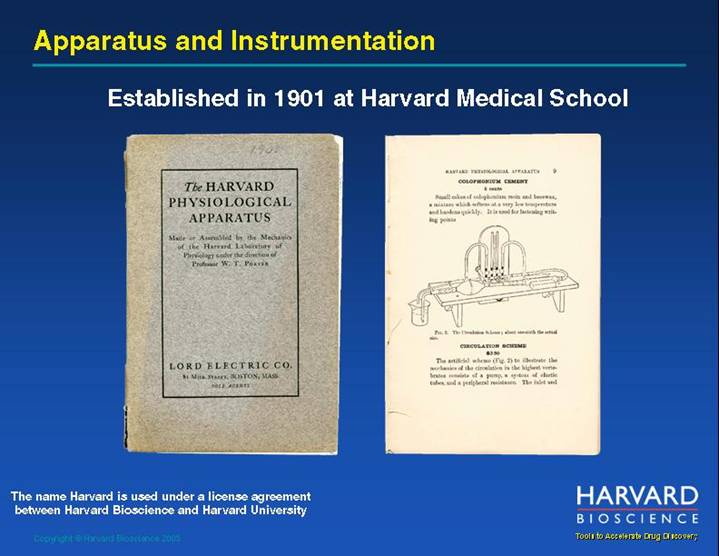
Established in 1901 at Harvard Medical School
[GRAPHIC]
[GRAPHIC]
The name Harvard is used under a license agreement between Harvard Bioscience and Harvard University
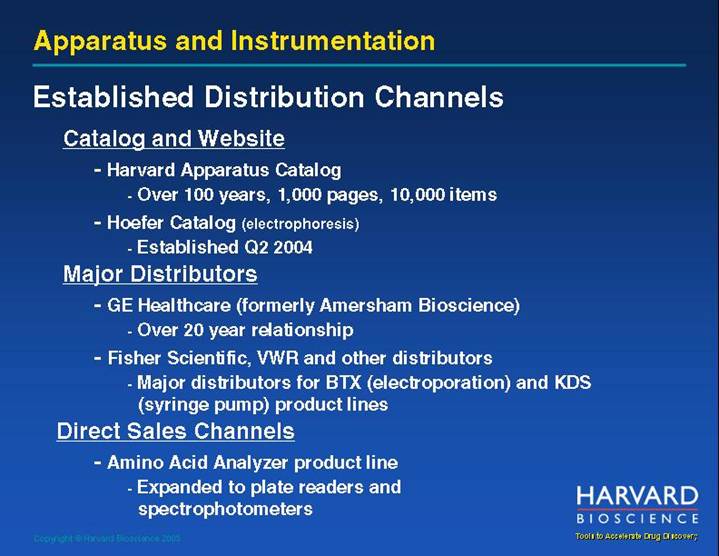
Established Distribution Channels
Catalog and Website
• Harvard Apparatus Catalog
• Over 100 years, 1,000 pages, 10,000 items
• Hoefer Catalog (electrophoresis)
• Established Q2 2004
Major Distributors
• GE Healthcare (formerly Amersham Bioscience)
• Over 20 year relationship
• Fisher Scientific, VWR and other distributors
• Major distributors for BTX (electroporation) and KDS (syringe pump) product lines
Direct Sales Channels
• Amino Acid Analyzer product line
• Expanded to plate readers and spectrophotometers
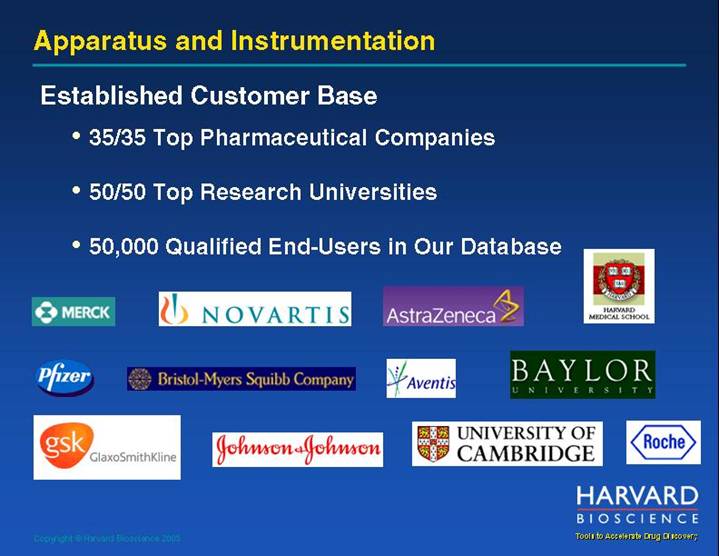
Established Customer Base
• 35/35 Top Pharmaceutical Companies
• 50/50 Top Research Universities
• 50,000 Qualified End-Users in Our Database
[LOGO]
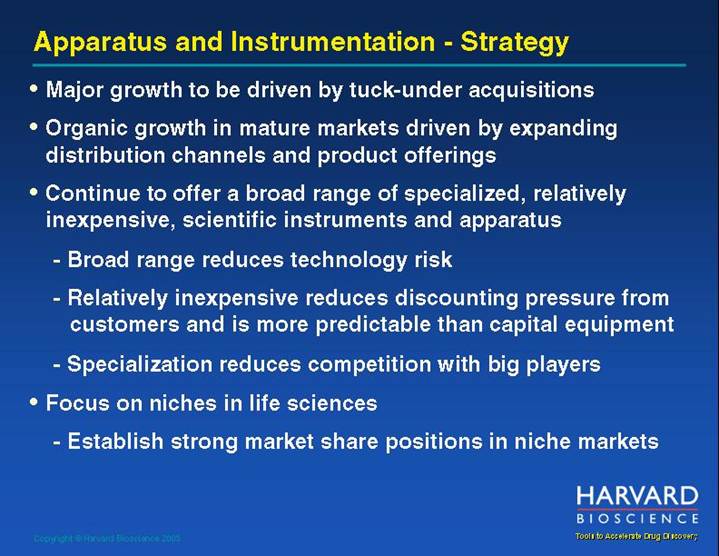
Apparatus and Instrumentation - Strategy
• Major growth to be driven by tuck-under acquisitions
• Organic growth in mature markets driven by expanding distribution channels and product offerings
• Continue to offer a broad range of specialized, relatively inexpensive, scientific instruments and apparatus
• Broad range reduces technology risk
• Relatively inexpensive reduces discounting pressure from customers and is more predictable than capital equipment
• Specialization reduces competition with big players
• Focus on niches in life sciences
• Establish strong market share positions in niche markets
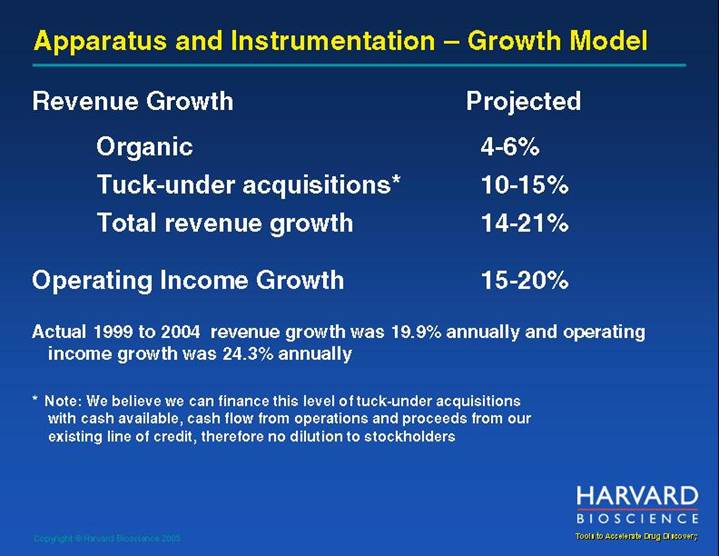
Apparatus and Instrumentation – Growth Model
| | Projected | |
Revenue Growth | | | |
| | | |
Organic | | | 4-6% | |
Tuck-under acquisitions* | | | 10-15% | |
Total revenue growth | | | 14-21% | |
| | | | |
Operating Income Growth | | | 15-20% | |
Actual 1999 to 2004 revenue growth was 19.9% annually and operating income growth was 24.3% annually
* Note: We believe we can finance this level of tuck-under acquisitions with cash available, cash flow from operations and proceeds from our existing line of credit, therefore no dilution to stockholders
Capital Equipment
Business Segment
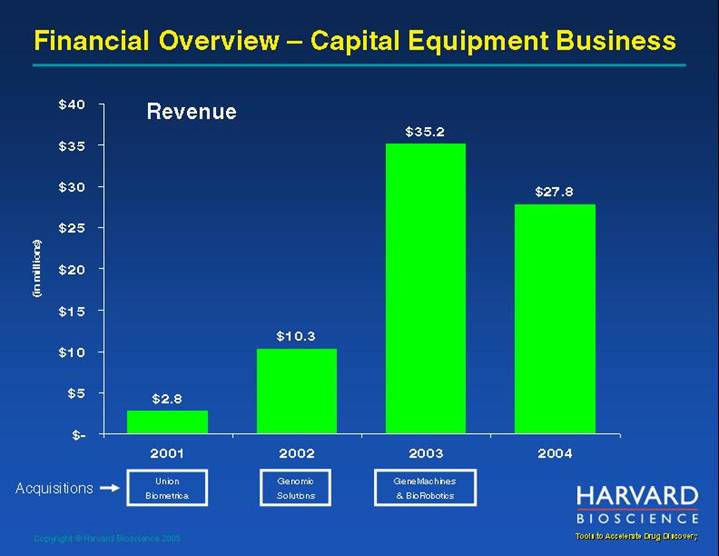
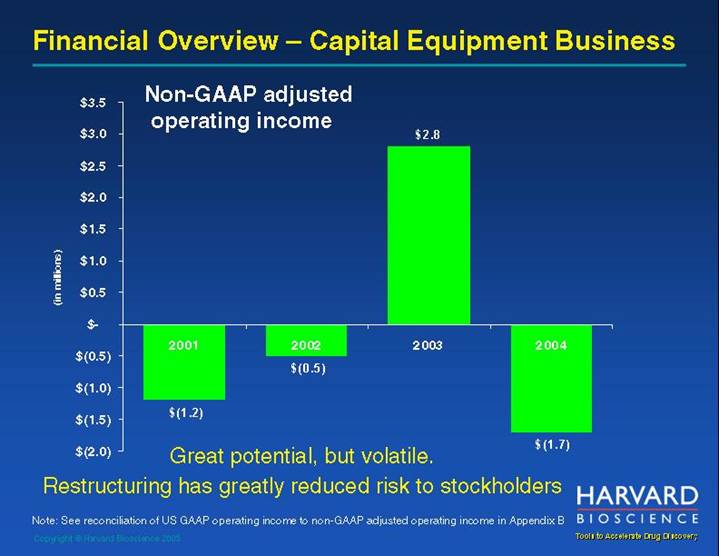
Financial Overview – Capital Equipment Business
Revenue
[CHART]
Non-GAAP adjusted operating income
[CHART]
Great potential, but volatile.
Restructuring has greatly reduced risk to stockholders
Note: See reconciliation of US GAAP operating income to non-GAAP adjusted operating income in Appendix B
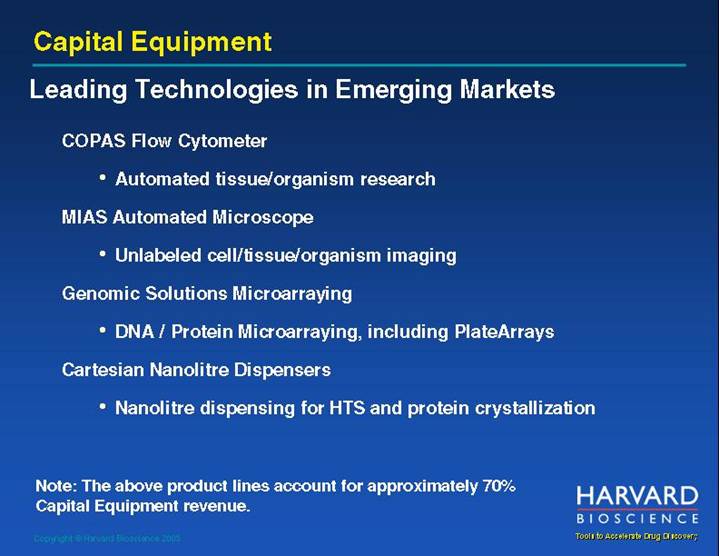
Capital Equipment
Leading Technologies in Emerging Markets
COPAS Flow Cytometer
• Automated tissue/organism research
MIAS Automated Microscope
• Unlabeled cell/tissue/organism imaging
Genomic Solutions Microarraying
• DNA / Protein Microarraying, including PlateArrays
Cartesian Nanolitre Dispensers
• Nanolitre dispensing for HTS and protein crystallization
Note: The above product lines account for approximately 70% Capital Equipment revenue.
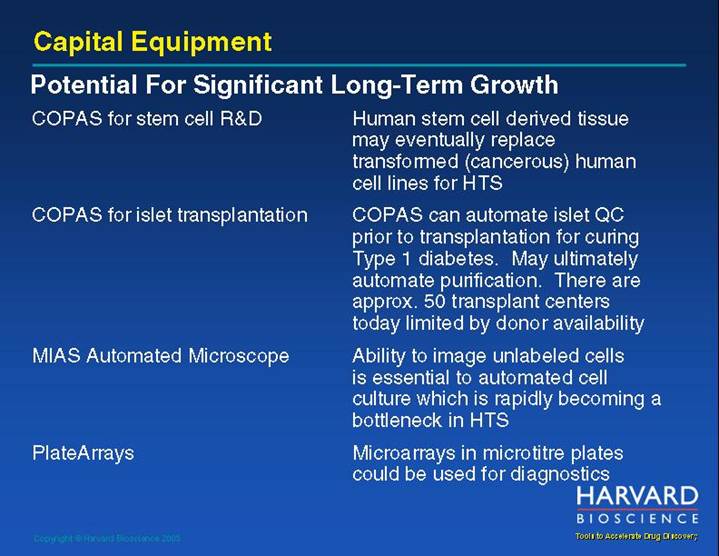
Potential For Significant Long-Term Growth
COPAS for stem cell R&D | | Human stem cell derived tissue may eventually replace transformed (cancerous) human cell lines for HTS |
| | |
COPAS for islet transplantation | | COPAS can automate islet QC prior to transplantation for curing Type 1 diabetes. May ultimately automate purification. There are approx. 50 transplant centers today limited by donor availability |
| | |
MIAS Automated Microscope | | Ability to image unlabeled cells is essential to automated cell culture which is rapidly becoming a bottleneck in HTS |
| | |
PlateArrays | | Microarrays in microtitre plates could be used for diagnostics |
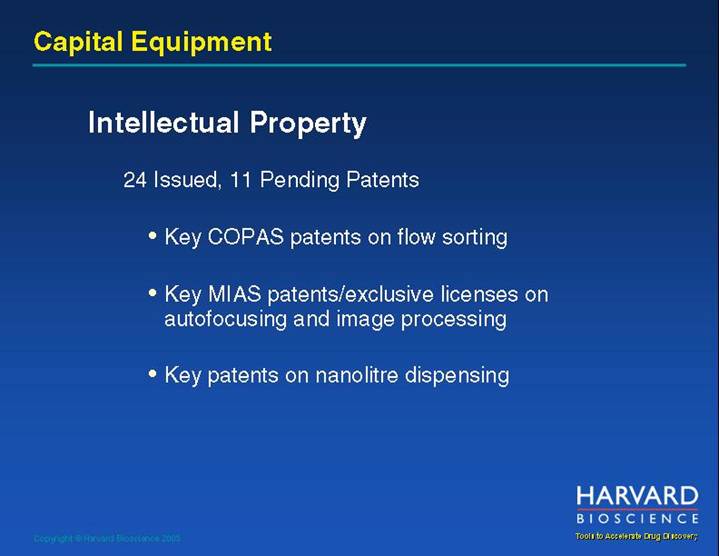
Intellectual Property
24 Issued, 11 Pending Patents
• Key COPAS patents on flow sorting
• Key MIAS patents/exclusive licenses on autofocusing and image processing
• Key patents on nanolitre dispensing
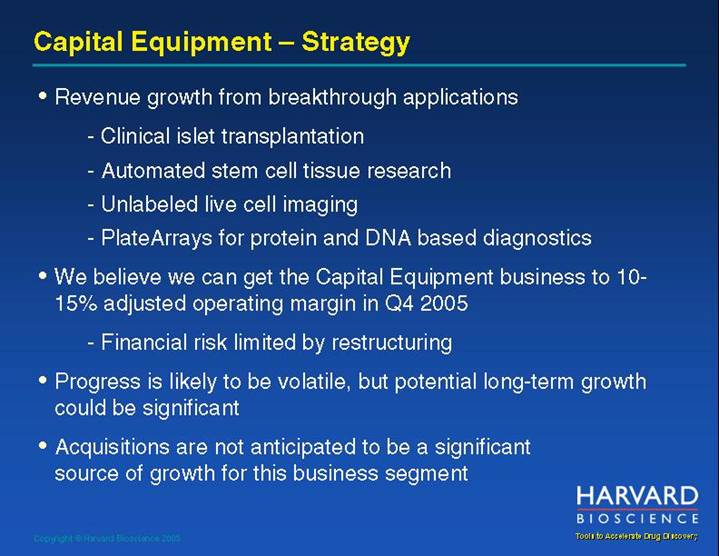
Capital Equipment – Strategy
• Revenue growth from breakthrough applications
• Clinical islet transplantation
• Automated stem cell tissue research
• Unlabeled live cell imaging
• PlateArrays for protein and DNA based diagnostics
• We believe we can get the Capital Equipment business to 10-15% operating margin in Q4 2005
• Financial risk limited by restructuring
• Progress is likely to be volatile, but potential long-term growth could be significant
• Acquisitions are not anticipated to be a significant source of growth for this business segment
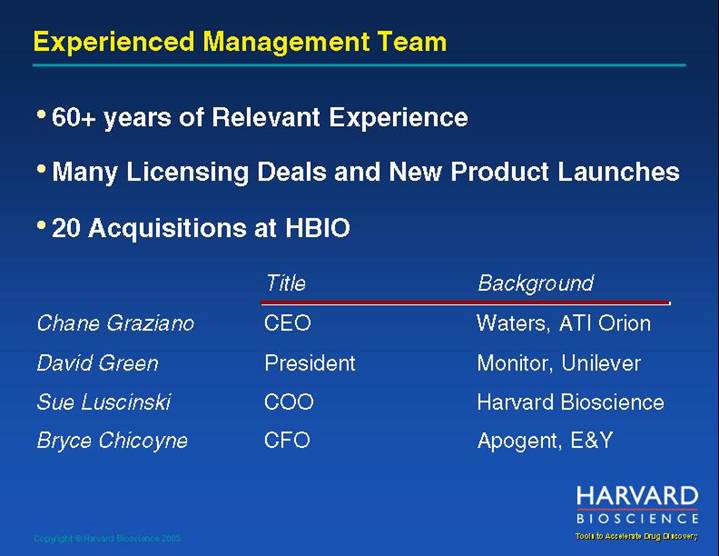
Experienced Management Team
• 60+ years of Relevant Experience
• Many Licensing Deals and New Product Launches
• 20 Acquisitions at HBIO
| | Title | | Background |
| | | | |
Chane Graziano | | CEO | | Waters, ATI Orion |
| | | | |
David Green | | President | | Monitor, Unilever |
| | | | |
Sue Luscinski | | COO | | Harvard Bioscience |
| | | | |
Bryce Chicoyne | | CFO | | Apogent, E&Y |
Commitment to Stockholder Value
• Management team collectively holds approximately 20% of shares
• Owns an additional approximately 5% in options most at $7-8 per share
• We believe our tuck-under growth strategy can be financed with current cash available, cash flow from operations and proceeds from our existing line of credit, therefore no dilution to stockholders
• Modest debt leverage helps drive eps without undue financial risk to stockholders
• Segment reporting allows clear visibility on earnings, value and progress
Investment Highlights
• Tools to Accelerate Drug Discovery – two business segments
• Apparatus and Instrumentation Business Segment
• 70% of 2004 revenue
• Market leader in established markets
• Good growth, great profitability
• Capital Equipment Business Segment
• 30% of 2004 revenue
• Technology leader in emerging markets
• High growth potential, but volatile
• Stockholder risk limited by restructuring
• Experienced Management Team
• Commitment to Stockholder Value Creation
[LOGO]
TOOLS TO ACCELERATE DRUG DISCOVERY
Market Leader in Established Markets
Technology Leader in Emerging Markets
NASDAQ HBIO
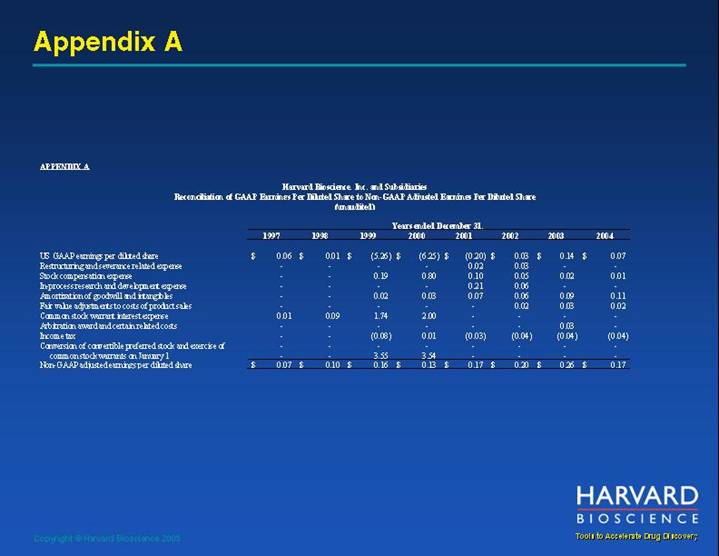
APPENDIX A
Harvard Bioscience, Inc. and Subsidiaries
Reconciliation of GAAP Earnings Per Diluted Share to Non-GAAP Adjusted Earnings Per Diluted Share
(unaudited)
| | Years ended December 31, | |
| | 1997 | | 1998 | | 1999 | | 2000 | | 2001 | | 2002 | | 2003 | | 2004 | |
| | | | | | | | | | | | | | | | | |
US GAAP earnings per diluted share | | $ | 0.06 | | $ | 0.01 | | $ | (5.26 | ) | $ | (6.25 | ) | $ | (0.20 | ) | $ | 0.03 | | $ | 0.14 | | $ | 0.07 | |
Restructuring and severance related expense | | — | | — | | — | | — | | 0.02 | | 0.03 | | — | | — | |
Stock compensation expense | | — | | — | | 0.19 | | 0.80 | | 0.10 | | 0.05 | | 0.02 | | 0.01 | |
In-process research and development expense | | — | | — | | — | | — | | 0.21 | | 0.06 | | — | | — | |
Amortization of goodwill and intangibles | | — | | — | | 0.02 | | 0.03 | | 0.07 | | 0.06 | | 0.09 | | 0.11 | |
Fair value adjustments to costs of product sales | | — | | — | | — | | — | | — | | 0.02 | | 0.03 | | 0.02 | |
Common stock warrant interest expense | | 0.01 | | 0.09 | | 1.74 | | 2.00 | | — | | — | | — | | — | |
Arbitration award and certain related costs | | — | | — | | — | | — | | — | | — | | 0.03 | | — | |
Income tax | | — | | — | | (0.08 | ) | 0.01 | | (0.03 | ) | (0.04 | ) | (0.04 | ) | (0.04 | ) |
Conversion of convertible preferred stock and exercise of common stock warrants on January 1 | | — | | — | | 3.55 | | 3.54 | | — | | — | | — | | — | |
Non-GAAP adjusted earnings per diluted share | | $ | 0.07 | | $ | 0.10 | | $ | 0.16 | | $ | 0.13 | | $ | 0.17 | | $ | 0.20 | | $ | 0.26 | | $ | 0.17 | |
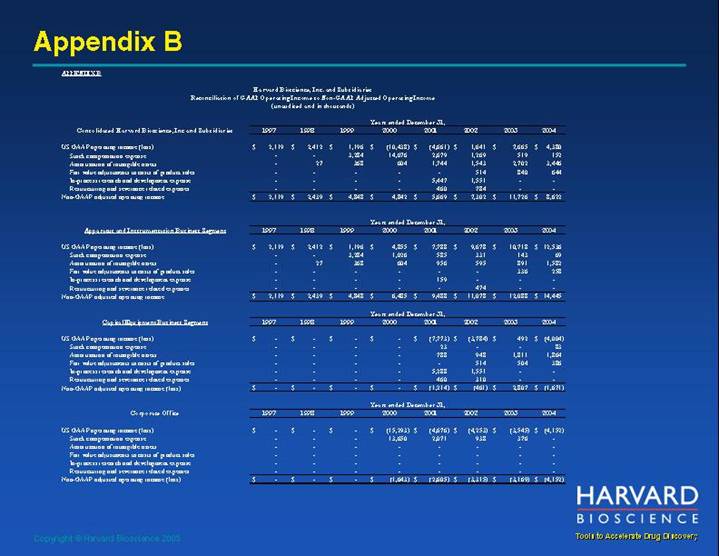
APPENDIX B
Harvard Bioscience, Inc. and Subsidiaries
Reconciliation of GAAP Operating Income to Non-GAAP Adjusted Operating Income
(unaudited and in thousands)
| | Years ended December 31, | |
| | 1997 | | 1998 | | 1999 | | 2000 | | 2001 | | 2002 | | 2003 | | 2004 | |
Consolidated Harvard Bioscience, Inc and Subsidiaries | | | | | | | | | | | | | | | | | |
US GAAP operating income (loss) | | $ | 2,119 | | $ | 2,412 | | $ | 1,196 | | $ | (10,438 | ) | $ | (4,661 | ) | $ | 1,641 | | $ | 7,665 | | $ | 4,380 | |
Stock compensation expense | | — | | — | | 3,284 | | 14,676 | | 2,679 | | 1,269 | | 519 | | 152 | |
Amortization of intangible assets | | — | | 27 | | 368 | | 604 | | 1,744 | | 1,543 | | 2,702 | | 3,446 | |
Fair value adjustments to costs of product sales | | — | | — | | — | | — | | — | | 514 | | 840 | | 644 | |
In-process research and development expense | | — | | — | | — | | — | | 5,447 | | 1,551 | | — | | — | |
Restructuring and severance related expenses | | — | | — | | — | | — | | 460 | | 784 | | — | | — | |
Non-GAAP adjusted operating income | | $ | 2,119 | | $ | 2,439 | | $ | 4,848 | | $ | 4,842 | | $ | 5,669 | | $ | 7,302 | | $ | 11,726 | | $ | 8,622 | |
| | Years ended December 31, | |
| | 1997 | | 1998 | | 1999 | | 2000 | | 2001 | | 2002 | | 2003 | | 2004 | |
Apparatus and Instrumentation Business Segment | | | | | | | | | | | | | | | | | |
US GAAP operating income (loss) | | $ | 2,119 | | $ | 2,412 | | $ | 1,196 | | $ | 4,855 | | $ | 7,788 | | $ | 9,678 | | $ | 10,718 | | $ | 12,536 | |
Stock compensation expense | | — | | — | | 3,284 | | 1,026 | | 585 | | 331 | | 143 | | 69 | |
Amortization of intangible assets | | — | | 27 | | 368 | | 604 | | 956 | | 595 | | 891 | | 1,582 | |
Fair value adjustments to costs of product sales | | — | | — | | — | | — | | — | | — | | 336 | | 258 | |
In-process research and development expense | | — | | — | | — | | — | | 159 | | — | | — | | — | |
Restructuring and severance related expenses | | — | | — | | — | | — | | — | | 474 | | — | | — | |
Non-GAAP adjusted operating income | | $ | 2,119 | | $ | 2,439 | | $ | 4,848 | | $ | 6,485 | | $ | 9,488 | | $ | 11,078 | | $ | 12,088 | | $ | 14,445 | |
| | Years ended December 31, | |
| | 1997 | | 1998 | | 1999 | | 2000 | | 2001 | | 2002 | | 2003 | | 2004 | |
Capital Equipment Business Segment | | | | | | | | | | | | | | | | | |
US GAAP operating income (loss) | | $ | — | | $ | — | | $ | — | | $ | — | | $ | (7,773 | ) | $ | (3,784 | ) | $ | 492 | | $ | (4,004 | ) |
Stock compensation expense | | — | | — | | — | | — | | 23 | | — | | — | | 83 | |
Amortization of intangible assets | | — | | — | | — | | — | | 788 | | 948 | | 1,811 | | 1,864 | |
Fair value adjustments to costs of product sales | | — | | — | | — | | — | | — | | 514 | | 504 | | 386 | |
In-process research and development expense | | — | | — | | — | | — | | 5,288 | | 1,551 | | — | | — | |
Restructuring and severance related expenses | | — | | — | | — | | — | | 460 | | 310 | | — | | — | |
Non-GAAP adjusted operating income (loss) | | $ | — | | $ | — | | $ | — | | $ | — | | $ | (1,214 | ) | $ | (461 | ) | $ | 2,807 | | $ | (1,671 | ) |
| | Years ended December 31, | |
| | 1997 | | 1998 | | 1999 | | 2000 | | 2001 | | 2002 | | 2003 | | 2004 | |
Corporate Office | | | | | | | | | | | | | | | | | |
US GAAP operating income (loss) | | $ | — | | $ | — | | $ | — | | $ | (15,293 | ) | $ | (4,676 | ) | $ | (4,253 | ) | $ | (3,545 | ) | $ | (4,152 | ) |
Stock compensation expense | | — | | — | | — | | 13,650 | | 2,071 | | 938 | | 376 | | — | |
Amortization of intangible assets | | — | | — | | — | | — | | — | | — | | — | | — | |
Fair value adjustments to costs of product sales | | — | | — | | — | | — | | — | | — | | — | | — | |
In-process research and development expense | | — | | — | | — | | — | | — | | — | | — | | — | |
Restructuring and severance related expenses | | — | | — | | — | | — | | — | | — | | — | | — | |
Non-GAAP adjusted operating income (loss) | | $ | — | | $ | — | | $ | — | | $ | (1,643 | ) | $ | (2,605 | ) | $ | (3,315 | ) | $ | (3,169 | ) | $ | (4,152 | ) |