Exhibit 99.(c)

Link to searchable text of slide shown above
Link to searchable text of slide shown above
Link to searchable text of slide shown above
Link to searchable text of slide shown above
Link to searchable text of slide shown above
Link to searchable text of slide shown above

Link to searchable text of slide shown above
Link to searchable text of slide shown above
Link to searchable text of slide shown above

Link to searchable text of slide shown above
Link to searchable text of slide shown above
Link to searchable text of slide shown above
Link to searchable text of slide shown above

Link to searchable text of slide shown above
Link to searchable text of slide shown above

Link to searchable text of slide shown above
Searchable text section of graphics shown above
Strictly Confidential
Preliminary Draft for Internal Discussion
Project Shenzhou
Discussion Materials
December 21, 2004
[LOGO OF CICC] | | [LOGO OF MORGAN STANLEY] |
Strictly Confidential
Preliminary Draft for Internal Discussion
Project Shenzhou
Table of Contents
Strictly Confidential
Preliminary Draft for Internal Discussion
Project Shenzhou
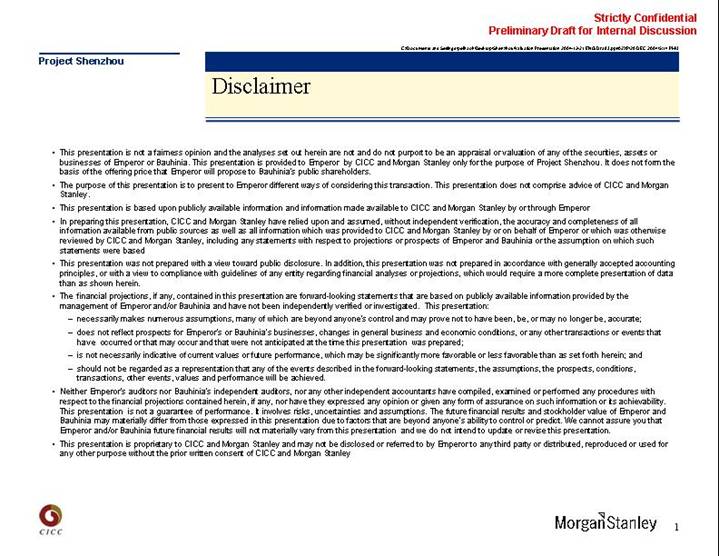
Disclaimer
• This presentation is not a fairness opinion and the analyses set out herein are not and do not purport to be an appraisal or valuation of any of the securities, assets or businesses of Emperor or Bauhinia. This presentation is provided to Emperor by CICC and Morgan Stanley only for the purpose of Project Shenzhou. It does not form the basis of the offering price that Emperor will propose to Bauhinia’s public shareholders.
• The purpose of this presentation is to present to Emperor different ways of considering this transaction. This presentation does not comprise advice of CICC and Morgan Stanley.
• This presentation is based upon publicly available information and information made available to CICC and Morgan Stanley by or through Emperor.
• In preparing this presentation, CICC and Morgan Stanley have relied upon and assumed, without independent verification, the accuracy and completeness of all information available from public sources as well as all information which was provided to CICC and Morgan Stanley by or on behalf of Emperor or which was otherwise reviewed by CICC and Morgan Stanley, including any statements with respect to projections or prospects of Emperor and Bauhinia or the assumption on which such statements were based.
• This presentation was not prepared with a view toward public disclosure. In addition, this presentation was not prepared in accordance with generally accepted accounting principles, or with a view to compliance with guidelines of any entity regarding financial analyses or projections, which would require a more complete presentation of data than as shown herein.
• The financial projections, if any, contained in this presentation are forward-looking statements that are based on publicly available information provided by the management of Emperor and/or Bauhinia and have not been independently verified or investigated. This presentation:
• necessarily makes numerous assumptions, many of which are beyond anyone’s control and may prove not to have been, be, or may no longer be, accurate;
• does not reflect prospects for Emperor’s or Bauhinia’s businesses, changes in general business and economic conditions, or any other transactions or events that have occurred or that may occur and that were not anticipated at the time this presentation was prepared;
• is not necessarily indicative of current values or future performance, which may be significantly more favorable or less favorable than as set forth herein; and
• should not be regarded as a representation that any of the events described in the forward-looking statements, the assumptions, the prospects, conditions, transactions, other events, values and performance will be achieved.
• Neither Emperor’s auditors nor Bauhinia’s independent auditors, nor any other independent accountants have compiled, examined or performed any procedures with respect to the financial projections contained herein, if any, nor have they expressed any opinion or given any form of assurance on such information or its achievability. This presentation is not a guarantee of performance. It involves risks, uncertainties and assumptions. The future financial results and stockholder value of Emperor and Bauhinia may materially differ from those expressed in this presentation due to factors that are beyond anyone’s ability to control or predict. We cannot assure you that Emperor and/or Bauhinia future financial results will not materially vary from this presentation and we do not intend to update or revise this presentation.
• This presentation is proprietary to CICC and Morgan Stanley and may not be disclosed or referred to by Emperor to any third party or distributed, reproduced or used for any other purpose without the prior written consent of CICC and Morgan Stanley.
1
Strictly Confidential
Preliminary Draft for Internal Discussion
Project Shenzhou
Section 1
Executive Summary
Strictly Confidential
Preliminary Draft for Internal Discussion
Project Shenzhou
Executive Summary
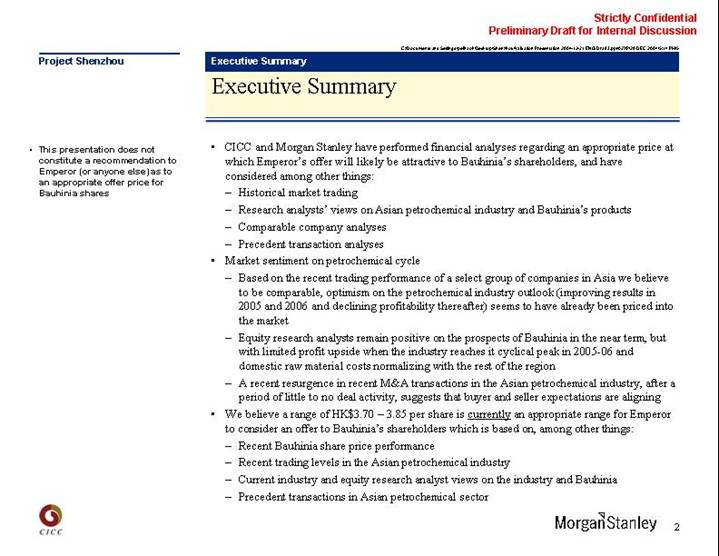
• This presentation does not constitute a recommendation to Emperor (or anyone else) as to an appropriate offer price for Bauhinia shares
• CICC and Morgan Stanley have performed financial analyses regarding an appropriate price at which Emperor’s offer will likely be attractive to Bauhinia’s shareholders, and have considered among other things:
• Historical market trading
• Research analysts’ views on Asian petrochemical industry and Bauhinia’s products
• Comparable company analyses
• Precedent transaction analyses
• Market sentiment on petrochemical cycle
• Based on the recent trading performance of a select group of companies in Asia we believe to be comparable, optimism on the petrochemical industry outlook (improving results in 2005 and 2006 and declining profitability thereafter) seems to have already been priced into the market
• Equity research analysts remain positive on the prospects of Bauhinia in the near term, but with limited profit upside when the industry reaches it cyclical peak in 2005-06 and domestic raw material costs normalizing with the rest of the region
• A recent resurgence in recent M&A transactions in the Asian petrochemical industry, after a period of little to no deal activity, suggests that buyer and seller expectations are aligning
• We believe a range of HK$3.70 – 3.85 per share is currently an appropriate range for Emperor to consider an offer to Bauhinia’s shareholders which is based on, among other things:
• Recent Bauhinia share price performance
• Recent trading levels in the Asian petrochemical industry
• Current industry and equity research analyst views on the industry and Bauhinia
• Precedent transactions in Asian petrochemical sector
2
Strictly Confidential
Preliminary Draft for Internal Discussion
Project Shenzhou
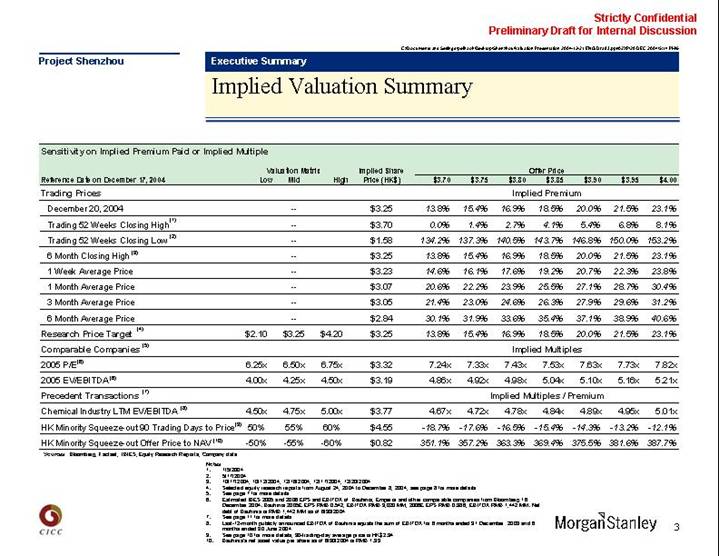
Implied Valuation Summary
Sensitivity on Implied Premium Paid or Implied Multiple
| | Valuation Matrix | | Implied Share | | Offer Price | |
Reference Date on December 17, 2004 | | Low | | Mid | | High | | Price (HK$) | | $3.70 | | $3.75 | | $3.80 | | $3.85 | | $3.90 | | $3.95 | | $4.00 | |
Trading Prices | | | | | | | | | | Implied Premium | |
December 20, 2004 | | | | — | | | | $ | 3.25 | | 13.8 | % | 15.4 | % | 16.9 | % | 18.5 | % | 20.0 | % | 21.5 | % | 23.1 | % |
Trading 52 Weeks Closing High (1) | | | | — | | | | $ | 3.70 | | 0.0 | % | 1.4 | % | 2.7 | % | 4.1 | % | 5.4 | % | 6.8 | % | 8.1 | % |
Trading 52 Weeks Closing Low (2) | | | | — | | | | $ | 1.58 | | 134.2 | % | 137.3 | % | 140.5 | % | 143.7 | % | 146.8 | % | 150.0 | % | 153.2 | % |
6 Month Closing High (3) | | | | — | | | | $ | 3.25 | | 13.8 | % | 15.4 | % | 16.9 | % | 18.5 | % | 20.0 | % | 21.5 | % | 23.1 | % |
1 Week Average Price | | | | — | | | | $ | 3.23 | | 14.6 | % | 16.1 | % | 17.6 | % | 19.2 | % | 20.7 | % | 22.3 | % | 23.8 | % |
1 Month Average Price | | | | — | | | | $ | 3.07 | | 20.6 | % | 22.2 | % | 23.9 | % | 25.5 | % | 27.1 | % | 28.7 | % | 30.4 | % |
3 Month Average Price | | | | — | | | | $ | 3.05 | | 21.4 | % | 23.0 | % | 24.6 | % | 26.3 | % | 27.9 | % | 29.6 | % | 31.2 | % |
6 Month Average Price | | | | — | | | | $ | 2.84 | | 30.1 | % | 31.9 | % | 33.6 | % | 35.4 | % | 37.1 | % | 38.9 | % | 40.6 | % |
Research Price Target (4) | | $ | 2.10 | | $ | 3.25 | | $ | 4.20 | | $ | 3.25 | | 13.8 | % | 15.4 | % | 16.9 | % | 18.5 | % | 20.0 | % | 21.5 | % | 23.1 | % |
Comparable Companies (5) | | | | | | | | | | | | | | Implied Multiples | | | | | |
2005 P/E (6) | | 6.25 | x | 6.50 | x | 6.75 | x | $ | 3.32 | | 7.24 | x | 7.33 | x | 7.43 | x | 7.53 | x | 7.63 | x | 7.73 | x | 7.82 | x |
2005 EV/EBITDA (6) | | 4.00 | x | 4.25 | x | 4.50 | x | $ | 3.19 | | 4.86 | x | 4.92 | x | 4.98 | x | 5.04 | x | 5.10 | x | 5.16 | x | 5.21 | x |
Precedent Transactions (7) | | | | | | | | | | | | | | Implied Multiples / Premium | | | | | |
Chemical Industry LTM EV/EBITDA (8) | | 4.50 | x | 4.75 | x | 5.00 | x | $ | 3.77 | | 4.67 | x | 4.72 | x | 4.78 | x | 4.84 | x | 4.89 | x | 4.95 | x | 5.01 | x |
HK Minority Squeeze-out 90 Trading Days to Price (9) | | 50 | % | 55 | % | 60 | % | $ | 4.55 | | -18.7 | % | -17.6 | % | -16.5 | % | -15.4 | % | -14.3 | % | -13.2 | % | -12.1 | % |
HK Minority Squeeze-out Offer Price to NAV (10) | | -50 | % | -55 | % | -60 | % | $ | 0.82 | | 351.1 | % | 357.2 | % | 363.3 | % | 369.4 | % | 375.5 | % | 381.6 | % | 387.7 | % |
| | | | | | | | | | | | | | | | | | | | | | | | | | | |
Sources Bloomberg, Factset, I/B/ES, Equity Research Reports, Company data
Notes
(1). 1/5/2004
(2). 5/17/2004
(3). 10/17/2004, 10/12/2004, 12/16/2004, 12/17/2004, 12/20/2004
(4). Selected equity research reports from August 24, 2004 to December 8, 2004, see page 8 for more details
(5). See page 7 for more details
(6). Estimated IBES 2005 and 2006 EPS and EBITDA of Bauhinia, Emperor and other comparable companies from Bloomberg 16 December 2004. Bauhinia 2005E EPS RMB 0.542, EBITDA RMB 3,020 MM; 2006E EPS RMB 0.386, EBITDA RMB 1,442 MM. Net debt of Bauhinia is RMB 1,442 MM as of 6/30/2004
(7). See page 11 for more details
(8). Last-12-month publicly announced EBITDA of Bauhinia equals the sum of EBITDA for 6 months ended 31 December 2003 and 6 months ended 30 June 2004
(9). See page 10 for more details, 90-trading-day average price is HK$2.94
(10). Bauhinia’s net asset value per share as of 6/30/2004 is RMB 1.93
3
Strictly Confidential
Preliminary Draft for Internal Discussion
Project Shenzhou
Analysis Overview
Trading Prices
HK$ / Share
| | | | 2005E Multiples(4) | |
| | Related Indicator | | P/E | | P/E | |
| | | | | | | |
Market Trading Prices | | | | | | | |
| | | | | | | |
– 1W Average Price (+10%-30%) (1) | | $3.55 / 4.20 | | 6.95x / 8.21x | | 4.69x / 5.45x | |
– 1 M Average Price (+10%-30%) (1) | | $3.37 / 3.99 | | 6.60x / 8.80x | | 4.47x / 5.20x | |
– 3M Average Price (+10%-30%) (1) | | $3.35 / 3.96 | | 6.56x / 7.75x | | 4.45x / 5.17x | |
– 6M Average Price (+10%-30%) (1) | | $3.13 / 3.70 | | 6.12x / 7.23x | | 4.18x / 4.86x | |
– 6M /12M Closing Price High | | $3.25 / 3.70 | | 6.36x / 7.23x | | 4.33x / 4.86x | |
| | | | | | | |
Research Analyst Target Price(2) | | $2.10 / 4.20 | | 4.11x / 8.21x | | 2.96x / 5.45x | |
| | | | | | | |
Comparable Companies (3) | | | | | | | |
| | | | | | | |
– 2005 P/E (4) | | 6.25x / 6.75x | | 6.25x / 6.75x | | 4.26x / 4.56x | |
– 2005 EV/EBITDA (4) | | 4.00x / 4.50x | | 5.82x / 6.64x | | 4.00x / 4.50x | |
| | | | | | | |
Precedent Transactions(5) | | | | | | | |
| | | | | | | |
Chemical Industry 2004/ LTM EV/EBITDA(6) | | 4.50x / 5.00x | | 6.95x / 7.81x | | 4.69x / 5.21x | |
[CHART]
Sources Bloomberg, Factset, I/B/ES, Research Reports, Company data
Notes
(1). Current price at HK$3.25 (12/20/2004), 1-month average price is HK$3.07, 3-month average price is HK$3.05, 6-month average price is HK$2.84
(2). Selected equity research reports from August 24, 2004 to December 8, 2004, see page 8 for more details
(3). According to the estimate of I/B/E/S to the comparable companies including Shanghai Petrochemical, Yizheng Chemical, Jilin Chemical, LG Petrochemical, National Petrochem, Honam Petrochem, IBES data from Bloomberg 12/16/2004, see page 7 for more details
(4). 2005 and 2006 trading multiples are based on I/B/E/S’s estimate on Bauhinia from Bloomberg 12/16/2004. 2005E EPS RMB 0.542, EBITDA RMB 3,020 MM; 2006E EPS RMB 0.386, EBITDA RMB 1,442 MM. Net debt of Bauhinia is RMB 1,442 MM as of 6/30/2004
(5). See page 11 for more details
(6). Last-12-month publicly announced EBITDA RMB 3,145 MM of Bauhinia equals the sum of EBITDA for 6 months ended 31 December 2003 and 6 months ended 30 June 2004
4
Strictly Confidential
Preliminary Draft for Internal Discussion
Project Shenzhou
Section 2
Market Trading Analysis
Strictly Confidential
Preliminary Draft for Internal Discussion
Project Shenzhou
Market Trading Analysis
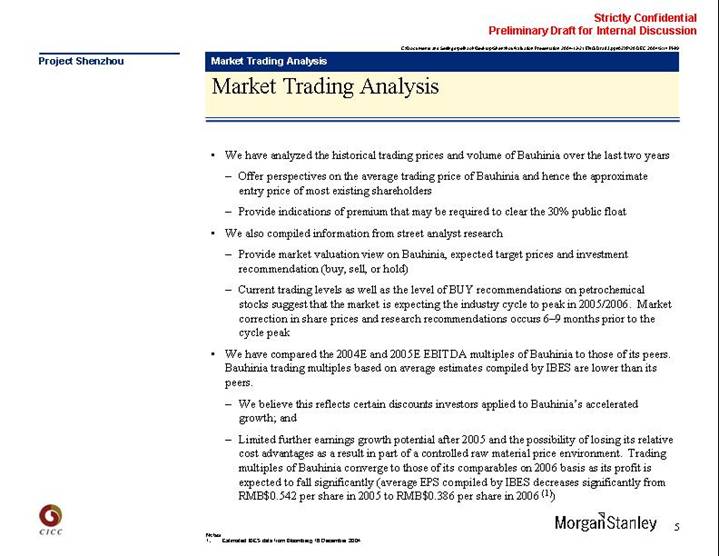
• We have analyzed the historical trading prices and volume of Bauhinia over the last two years
• Offer perspectives on the average trading price of Bauhinia and hence the approximate entry price of most existing shareholders
• Provide indications of premium that may be required to clear the 30% public float
• We also compiled information from street analyst research
• Provide market valuation view on Bauhinia, expected target prices and investment recommendation (buy, sell, or hold)
• Current trading levels as well as the level of BUY recommendations on petrochemical stocks suggest that the market is expecting the industry cycle to peak in 2005/2006. Market correction in share prices and research recommendations occurs 6–9 months prior to the cycle peak
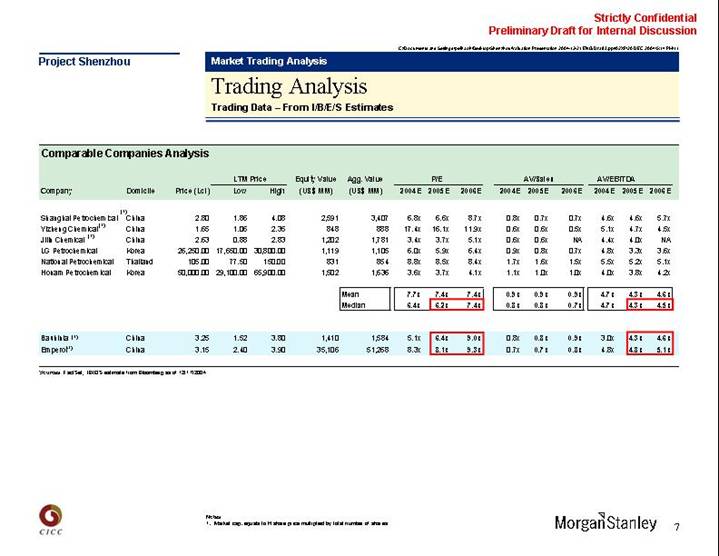
• We have compared the 2004E and 2005E EBITDA multiples of Bauhinia to those of its peers. Bauhinia trading multiples based on average estimates compiled by IBES are lower than its peers.
• We believe this reflects certain discounts investors applied to Bauhinia’s accelerated growth; and
• Limited further earnings growth potential after 2005 and the possibility of losing its relative cost advantages as a result in part of a controlled raw material price environment. Trading multiples of Bauhinia converge to those of its comparables on 2006 basis as its profit is expected to fall significantly (average EPS compiled by IBES decreases significantly from RMB$0.542 per share in 2005 to RMB$0.386 per share in 2006 (1))
Notes
(1). Estimated IBES Data from Bloomberg 16 December 2004
5
Strictly Confidential
Preliminary Draft for Internal Discussion
Project Shenzhou
Stock Price Analysis of Bauhinia
• Some insight into the possible entry cost of the current shareholders analysing the volume and the prices of Bauhinia
Historical Stock Price Analysis
Share Price (HK$)(1)
[CHART]
Trading Volume (MM Shares) | | 1,369 | | 2,647 | | 5,648 | | 11,560 | |
% of TSO (2) | | 41 | % | 78 | % | 167 | % | 343 | % |
% of H Share(%) | | 135 | % | 262 | % | 558 | % | 1,142 | % |
Source FactSet as of 12/17/2004
Statistic (HK$)
12/17/2004
Current | | 3.250 | |
1M average | | 3.068 | |
2M average | | 3.009 | |
3M average | | 3.049 | |
52 Wk High(3) | | 3.700 | |
52 Wk Average | | 2.811 | |
52 Wk Low(4) | | 1.580 | |
Source FactSet
Notes
(1). Based on closing prices
(2). 3,374MM of outstanding share and 1,012MM H shares
(3). 1/5/2004
(4). 5/17/2004
6
Strictly Confidential
Preliminary Draft for Internal Discussion
Project Shenzhou
Trading Analysis
Trading Data – From I/B/E/S Estimates
Comparable Companies Analysis
| | | | | | LTM Price | | Equity Value | | Agg. Value | | P/E | | AV/Sales | | AV/EBITDA | |
Company | | Domicile | | Price (Lcl) | | Low | | High | | (US $MM) | | (US $MM) | | 2004E | | 2005E | | 2006E | | 2004E | | 2005E | | 2006E | | 2004E | | 2005E | | 2006E | |
| | | | | | | | | | | | | | | | | | | | | | | | | | | | | | | |
Shanghai
Petrochemical (1) | | China | | 2.80 | | 1.86 | | 4.08 | | 2,591 | | 3,407 | | 6.8 | x | 6.6 | x | 8.7 | x | 0.8 | x | 0.7 | x | 0.7 | x | 4.6 | x | 4.6 | x | 5.7 | x |
Yizheng Chemical (1) | | China | | 1.65 | | 1.06 | | 2.35 | | 848 | | 888 | | 17.4 | x | 16.1 | x | 11.9 | x | 0.6 | x | 0.6 | x | 0.5 | x | 5.1 | x | 4.7 | x | 4.5 | x |
Jilin Chemical (1) | | China | | 2.63 | | 0.88 | | 2.83 | | 1,202 | | 1,781 | | 3.4 | x | 3.7 | x | 5.1 | x | 0.6 | x | 0.6 | x | NA | | 4.4 | x | 4.0 | x | NA | |
LG Petrochemical | | Korea | | 26,250.00 | | 17,650.00 | | 30,800.00 | | 1,119 | | 1,105 | | 6.0 | x | 5.9 | x | 6.4 | x | 0.9 | x | 0.8 | x | 0.7 | x | 4.8 | x | 3.3 | x | 3.6 | x |
National Petrochemical | | Thailand | | 105.00 | | 77.50 | | 150.00 | | 831 | | 854 | | 8.8 | x | 8.5 | x | 8.4 | x | 1.7 | x | 1.6 | x | 1.5 | x | 5.5 | x | 5.2 | x | 5.1 | x |
Honam Petrochemical | | Korea | | 50,000.00 | | 29,100.00 | | 65,900.00 | | 1,502 | | 1,636 | | 3.6 | x | 3.7 | x | 4.1 | x | 1.1 | x | 1.0 | x | 1.0 | x | 4.0 | x | 3.8 | x | 4.2 | x |
| | | | | | | | | | | | | | | | | | | | | | | | | | | | | | | |
| | | | | | | | | | | | Mean | | 7.7 | x | 7.4 | x | 7.4 | x | 0.9 | x | 0.9 | x | 0.9 | x | 4.7 | x | 4.3 | x | 4.6 | x |
| | | | | | | | | | | | Median | | 6.4 | x | 6.2 | x | 7.4 | x | 0.8 | x | 0.8 | x | 0.7 | x | 4.7 | x | 4.3 | x | 4.5 | x |
| | | | | | | | | | | | | | | | | | | | | | | | | | | | | | | |
Bauhinia (1) | | China | | 3.25 | | 1.52 | | 3.80 | | 1,410 | | 1,584 | | 5.1 | x | 6.4 | x | 9.0 | x | 0.8 | x | 0.8 | x | 0.9 | x | 3.0 | x | 4.3 | x | 4.6 | x |
Emperor (1) | | China | | 3.15 | | 2.40 | | 3.90 | | 35,106 | | 51,268 | | 8.3 | x | 8.1 | x | 9.3 | x | 0.7 | x | 0.7 | x | 0.8 | x | 4.8 | x | 4.8 | x | 5.1 | x |
Sources FactSet, I/B/E/S estimate from Bloomberg as of 12/17/2004
Notes
(1). Market cap. equals to H share price multiplied by total number of shares
7
Strictly Confidential
Preliminary Draft for Internal Discussion
Project Shenzhou
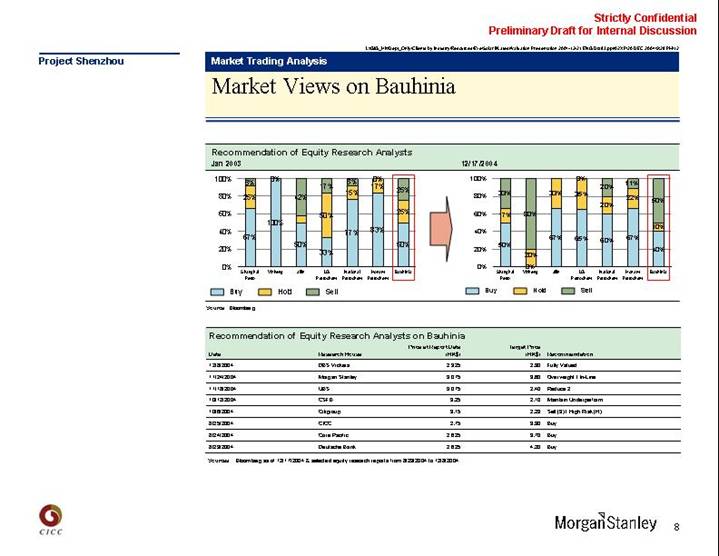
Market Views on Bauhinia
Recommendation of Equity Research Analysts | |
| |
[CHART]
Source Bloomberg
Recommendation of Equity Research Analysts on Bauhinia
Date | | Research House | | Price at Report Date
(HK$) | | Target Price
(HK$) | | Recommendation | |
12/8/2004 | | DBS Vickers | | 2.925 | | 2.90 | | Fully Valued | |
11/24/2004 | | Morgan Stanley | | 3.075 | | 3.60 | | Overweight / In-Line | |
11/18/2004 | | UBS | | 3.075 | | 2.40 | | Reduce 2 | |
10/12/2004 | | CSFB | | 3.25 | | 2.10 | | Maintain Underperform | |
10/6/2004 | | Citigroup | | 3.15 | | 2.23 | | Sell (3) / High Risk (H) | |
8/25/2004 | | CICC | | 2.75 | | 3.90 | | Buy | |
8/24/2004 | | Core Pacific | | 2.625 | | 3.70 | | Buy | |
8/23/2004 | | Deutsche Bank | | 2.625 | | 4.20 | | Buy | |
Sources Bloomberg as of 12/17/2004 & selected equity research reports from 8/23/2004 to 12/8/2004
8
Strictly Confidential
Preliminary Draft for Internal Discussion
Project Shenzhou
Section 3
Precedent Transaction Analysis


