SECURITIES AND EXCHANGE COMMISSION
WASHINGTON, DC 20549
FORM 6-K
Report of Foreign Private Issuer
Pursuant to Rule 13a-16 or 15d-16 of
The Securities Exchange Act of 1934
For the month of August 2023
CHINA PETROLEUM & CHEMICAL CORPORATION
22 Chaoyangmen North Street,
Chaoyang District, Beijing, 100728
People's Republic of China
Tel: (8610) 59960114
(Indicate by check mark whether the registrant files or will file annual reports under cover of Form 20-F or Form 40-F.)
Form 20-F ✔ Form 40-F _____
(Indicate by check mark whether the registrant by furnishing the information contained in this form is also thereby furnishing the information to the Commission pursuant to Rule 12g3-2(b) under the Securities Exchange Act of 1934.)
Yes ____ No ✔
(If "Yes" is marked, indicate below the file number assigned to registrant in connection with Rule 12g3-2(b): 82-__________. )
N/A
This Form 6-K consists of:
A copy of interim report for 2023 of China Petroleum & Chemical Corporation (the “Registrant”), made by the Registrant on August 25, 2023.
CONTENTS
| 2 | Company Profile |
| 4 | Principal Financial Data and Indicators |
| 8 | Business Review and Prospects |
| 12 | Management’s Discussion and Analysis |
| 23 | Corporate Governance |
| 26 | Environment and Social Responsibilities |
| 28 | Significant Events |
| 36 | Changes in Share Capital and Shareholdings of Shareholders |
| 37 | Bond General Information |
| 39 | Financial Statements |
| 148 | Documents for Inspection |
This interim report contains forward-looking statements. All statements, other than statements of historical facts, that address business activities, events or developments that the Company expects or anticipates will or may occur in the future (including, but not limited to projections, targets, reserves and other estimates and business plans) are forward-looking statements. The actual results or developments of the Company may differ materially from those forward-looking statements as a result of various factors and uncertainties. These forward-looking statements do not constitute substantial undertakings made by the Company to investors. The investors and relevant parties should be aware of the risks involved and should understand that plans and projections differ from undertakings. The Company makes the forward-looking statements referred to herein as at 25 August 2023 and, unless otherwise required by the relevant regulatory authorities, undertakes no obligation to update these statements.
COMPANY PROFILE
IMPORTANT NOTICE: THE BOARD OF DIRECTORS (BOARD) AND THE BOARD OF SUPERVISORS OF CHINA PETROLEUM & CHEMICAL CORPORATION AND ITS DIRECTORS, SUPERVISORS AND SENIOR MANAGEMENT WARRANT THAT THERE ARE NO FALSE REPRESENTATIONS, MISLEADING STATEMENTS OR MATERIAL OMISSIONS CONTAINED IN THIS INTERIM REPORT, AND SEVERALLY AND JOINTLY ACCEPT FULL RESPONSIBILITY FOR THE AUTHENTICITY, ACCURACY AND COMPLETENESS OF THE INFORMATION CONTAINED IN THIS INTERIM REPORT. THERE IS NO OCCUPANCY OF NON-OPERATING FUNDS BY THE CONTROLLING SHAREHOLDER OF SINOPEC CORP. OR OTHER RELATED PARTY. MR. MA YONGSHENG, CHAIRMAN OF THE BOARD, MR. YU BAOCAI, DIRECTOR AND PRESIDENT, AND MS. SHOU DONGHUA, CHIEF FINANCIAL OFFICER AND HEAD OF CORPORATE ACCOUNTING DEPARTMENT WARRANT THE AUTHENTICITY, ACCURACY AND COMPLETENESS OF THE INTERIM FINANCIAL STATEMENTS CONTAINED IN THIS INTERIM REPORT. THE AUDIT COMMITTEE OF SINOPEC CORP. HAS REVIEWED THE INTERIM REPORT OF SINOPEC CORP. FOR THE SIX-MONTH PERIOD ENDED 30 JUNE 2023.
THE INTERIM FINANCIAL STATEMENTS FOR THE SIX-MONTH PERIOD ENDED 30 JUNE 2023 OF THE COMPANY, PREPARED IN ACCORDANCE WITH THE ACCOUNTING STANDARDS FOR BUSINESS ENTERPRISES (CASs) OF THE PEOPLES REPUBLIC OF CHINA (PRC), AND INTERNATIONAL FINANCIAL REPORTING STANDARDS (IFRS), HAVE NOT BEEN AUDITED.
COMPANY PROFILE
Sinopec Corp.’s H shares were listed in Hong Kong, New York and London exchanges on 18 and 19 October 2000, respectively, and A shares were listed in the Shanghai Stock Exchange on 8 August 2001.Sinopec Corp. is one of the largest integrated energy and chemical companies in China. Its principal operations include the exploration and production, pipeline transportation and sale of petroleum and natural gas; the production, sale, storage and transportation of refinery products, petrochemical products, coal chemical products, synthetic fibre, and other chemical products; the import and export, including an import and export agency business, of petroleum, natural gas, petroleum products, petrochemical and chemical products, and other commodities and technologies; and research, development and application of technologies and information; hydrogen energy business and related services such as hydrogen production, storage, transportation and sales; battery charging and swapping for new energy vehicles, solar energy, wind energy and other new energy business and related services.
DEFINITIONS
In this interim report, unless the context otherwise requires, the following terms shall have the meanings set out below:
Sinopec Corp.: China Petroleum & Chemical Corporation;
Company: Sinopec Corp. and its subsidiaries;
China Petrochemical Corporation: The controlling shareholder of Sinopec Corp., China Petrochemical Corporation;
Sinopec Group: China Petrochemical Corporation and its subsidiaries;
Sinopec Finance Co.: Sinopec Finance Co., Ltd.;
Century Bright: Sinopec Century Bright Capital Investment Ltd.;
CSRC: China Securities Regulatory Commission;
Hong Kong Stock Exchange: The Stock Exchange of Hong Kong Limited;
Hong Kong Listing Rules: Rules Governing the Listing of Securities on The Stock Exchange of Hong Kong Limited.
CONVERSIONS
For domestic production of crude oil: 1 tonne = 7.1 barrels;
For overseas production of crude oil: 1 tonne = 7.26 barrels;
For production of natural gas: 1 cubic meter = 35.31 cubic feet;
Refinery throughput: 1 tonne = 7.35 barrels.
2
BASIC INFORMATION
LEGAL NAME
中國石油化工股份有限公司
CHINESE ABBREVIATION
中國石化
ENGLISH NAME
China Petroleum & Chemical Corporation
ENGLISH ABBREVIATION
Sinopec Corp.
LEGAL REPRESENTATIVE
Mr. Ma Yongsheng
AUTHORISED REPRESENTATIVES UNDER THE HONG KONG LISTING RULES
Mr. Yu Baocai
Mr. Huang Wensheng
SECRETARY TO THE BOARD
Mr. Huang Wensheng
REPRESENTATIVE ON SECURITIES MATTERS
Mr. Zhang Zheng
REGISTERED ADDRESS, PLACE OF BUSINESS AND CORRESPONDENCE ADDRESS
22 Chaoyangmen North Street,
Chaoyang District, Beijing, China
Postcode: 100728
Tel: 86-10-59960028
Fax: 86-10-59960386
Website: http://www.sinopec.com
E-mail: ir@sinopec.com
CHANGE OF INFORMATION DISCLOSURE MEDIA AND ACCESS PLACES
During the reporting period, there was no change to Sinopec Corp.’s information disclosure media and access place.
PLACES OF LISTING OF SHARES, STOCK NAMES AND STOCK CODES
| A Shares: | Shanghai Stock Exchange |
Stock name: 中國石化
Stock code: 600028
| H Shares: | Hong Kong Stock Exchange |
Stock name: SINOPEC CORP
Stock code: 00386
CHANGE OF REGISTERED ADDRESS IN THE REPORTING PERIOD
There was no change to the registered address in the reporting period.
3
PRINCIPAL FINANCIAL DATA AND INDICATORS
1. FINANCIAL DATA AND INDICATORS PREPARED IN ACCORDANCE WITH CASs
| (1) | Principal financial data |
| Items | Six-month period ended 30 June | Changes over the same period of the preceding year (%) | ||
| 2023 RMB million | 2022 RMB million (adjusted) | 2022 RMB million (before adjustment) | ||
| Operating income | 1,593,682 | 1,612,126 | 1,612,126 | (1.1) |
| Net profit attributable to shareholders of the Company | 35,111 | 43,920 | 43,530 | (20.1) |
| Net profit attributable to shareholders of the Company excluding extraordinary gains and losses | 33,655 | 43,350 | 42,960 | (22.4) |
| Net cash flow from operating activities | 27,562 | 4,947 | 4,947 | 457.1 |
| As of 30 June 2023 RMB million | As of 31 December 2022 RMB million (adjusted) | As of 31 December 2022 RMB million (before adjustment) | Changes from the end of last year (%) | |
| Total equity attributable to shareholders of the Company | 796,562 | 788,471 | 785,577 | 1.0 |
| Total assets | 2,026,902 | 1,951,121 | 1,948,640 | 3.9 |
| Note: | In 2023, the Company adopted the requirement of the Interpretation of Accounting Standards for Business Enterprises No.16 that “the accounting treatment of exemption from initial recognition does not apply to the deferred tax related to the assets and liabilities arising from a single transaction”, and retrospectively adjusted the accounting treatments of applicable transactions which happened from 1 January 2022 to the first effective date. |
| (2) | Principal financial indicators |
| Items | Six-month period ended 30 June | Changes over the same period of the preceding year (%) | ||
| 2023 RMB | 2022 RMB (adjusted) | 2022 RMB (before adjustment) | ||
| Basic earnings per share | 0.293 | 0.363 | 0.360 | (19.3) |
| Diluted earnings per share | 0.293 | 0.363 | 0.360 | (19.3) |
| Basic earnings per share (excluding extraordinary gains and losses) | 0.281 | 0.358 | 0.355 | (21.5) |
| Weighted average return on net assets (%) | 4.43 | 5.61 | 5.57 | (1.18) percentage points |
| Weighted average return (excluding extraordinary gains and losses) on net assets (%) | 4.25 | 5.53 | 5.50 | (1.28) percentage points |
| (3) | Non-recurring profit/loss items and corresponding amounts |
| Items | Six-month period ended 30 June 2023 (profit)/loss RMB million |
| Net profit on disposal of non-current assets | (869) |
| Donations | 15 |
| Government grants | (1,647) |
| Gains on holding and disposal of various investments | (319) |
| Other non-operating expenses, net | 267 |
| Subtotal | (2,553) |
| Tax effect | 782 |
| Total | (1,771) |
Attributable to: | |
| Shareholders of the Company | (1,456) |
| Non-controlling interests | (315) |
4
| (4) | Significant changes of items in the financial statements |
The table below sets forth reasons for those changes where the fluctuation was more than 30% during the reporting period:
| Items of Consolidated Balance Sheet | As of 30 June 2023 RMB million | As of 31 December 2022 RMB million | Increase/(Decrease) | Main reasons for changes | |
| Amount RMB million | Percentage (%) | ||||
| Financial assets held fortrading | 3 | 2 | 1 | 50.0 | Impact of changes in fair value of funds held by the Company. |
| Derivative financial assets | 8,500 | 19,335 | (10,835) | (56.0) | Impact of changes in fair value of hedging business. |
| Accounts receivable | 73,399 | 46,364 | 27,035 | 58.3 | Increase in the account receivables due to the rising sales volume of the Company’s refined oil and other products. |
| Short-term loans | 99,132 | 21,313 | 77,819 | 365.1 | Increase in low-interest short-term loans to meet the capital needs of production and operation activities during the reporting period. |
| Employee benefits payable | 22,181 | 13,617 | 8,564 | 62.9 | The impact of increase in payable performance-based salary. |
| Non-current liabilities duewithin one year | 27,924 | 62,844 | (34,920) | (55.6) | Decrease in long-term loans and debentures payable due within one year. |
| Long-term loans | 160,017 | 94,964 | 65,053 | 68.5 | Increase in low-interest long-term loans to meet the capital needs of investment, production and operation activities. |
| Other comprehensive income | (1,405) | 3,072 | (4,477) | – | Impact of foreign currency translation difference. |
| Specific reserve | 3,797 | 2,813 | 984 | 35.0 | Increase in accrued safety production expenses during the reporting period. |
5
| Items of Consolidated Income Statement | For six-month period ended 30 June 2023 RMB Million | For six-month period ended 30 June 2022 RMB Million | Increase/(Decrease) | Main reasons for changes | |
Amount RMB Million | Percentage (%) | ||||
| Other income | 4,896 | 2,121 | 2,775 | 130.8 | Year-on-year increase in VAT refunds on imported LNG during the reporting period. |
| Investment income/(loss) | 3,291 | (10,307) | 13,598 | – | Impact of changes in profit and loss of hedging business. |
| Gains/(losses) from changes in fair value | 1,475 | (1,558) | 3,033 | – | Impact of increase in floating profit of hedging business. |
| Credit impairment(losses)/reversals | (35) | 72 | (107) | – | Increase in bad debt losses on certain account receivables. |
| Impairment losses | (2,365) | (1,456) | (909) | 62.4 | The provision for diminution in value of inventories such as crude oil and LNG increased due to the decrease in crude oil prices. |
| Asset disposal gains | 869 | 135 | 734 | 543.7 | The disposal of some pipelineassets. |
| Items of Consolidated Cash Flow Statement | For six-month period ended 30 June 2023 RMB Million | For six-month period ended 30 June 2022 RMB Million | Increase/(Decrease) | Main reasons for changes | |
Amount RMB Million | Percentage (%) | ||||
| Refund of taxes and levies | 5,978 | 3,442 | 2,536 | 73.7 | Increase in VAT refunds on imported LNG during the reporting period. |
| Other cash received relatingto operating activities | 84,423 | 128,034 | (43,611) | (34.1) | Decrease in margins of derivative business. |
| Cash received from returns oninvestments | 2,969 | 4,345 | (1,376) | (31.7) | Decrease in dividends received from associates and joint ventures. |
| Net cash received from disposal of fixed assets, intangible assets andother long-term assets | 3,584 | 107 | 3,477 | 3,249.5 | Disposal of fixed assets increased year-on-year. |
| Cash paid for acquisition of fixed assets, intangible assets and other long-term assets | (87,581) | (63,023) | (24,558) | 39.0 | Increase in cash payment for investments and construction project. |
| Cash paid for acquisition of investments | (2,741) | (6,027) | 3,286 | (54.5) | Capital injection of some projects decreased year-on-year. |
| Net cash paid for the acquisition of subsidiaries and other business entities | – | (7,628) | 7,628 | – | No this type of payment during the reporting period. |
| Other cash paid relatingto investing activities | (51,506) | (16,544) | (34,962) | 211.3 | Increase in time deposits with maturities over three months year-on-year. |
| Cash received from capital contributions | 279 | 987 | (708) | (71.7) | Decreased capital injection of projects received from minority shareholders year-on-year. |
| Subsidiaries’ cash payments for distribution of dividends or profits to non-controlling shareholders | (2,830) | (1,088) | (1,742) | 160.1 | Increased subsidiaries’ dividends year-on-year. |
6
| 2 | FINANCIAL DATA AND INDICATORS PREPARED IN ACCORDANCE WITH IFRS |
| (1) | Principal financial data |
| Items | Six-month period ended 30 June | Changes over the same period of the preceding year (%) | ||
2023 RMB million | 2022 RMB million (adjusted) | 2022 RMB million (before adjustment) | ||
| Operating Profit | 53,696 | 62,924 | 62,924 | (14.7) |
| Profit attributable to shareholders of the Company | 36,122 | 44,841 | 44,451 | (19.4) |
| Net cash generated from operating activities | 27,562 | 4,947 | 4,947 | 457.1 |
As of 30 June 2023 RMB million | As of 31 December 2022 RMB million (adjusted) | As of 31 December 2022 RMB million (before adjustment) | Changes from the end of last year (%) | |
| Total equity attributable to shareholders of the Company | 795,720 | 787,600 | 784,706 | 1.0 |
| Total assets | 2,026,902 | 1,951,121 | 1,948,640 | 3.9 |
| Note: | In 2023, the Company adopted the requirement of the International Accounting Standard No.12, deferred tax related to assets and liabilities arising from a single transaction, that “accounting treatment of deferred tax related to assets and liabilities arising from a single transaction for which initial recognition exemption does not apply”, and has retrospectively adjusted the accounting treatments of applicable transactions which happened from the earliest comparative period. |
| (2) | Principal financial indicators |
| Items | Six-month period ended 30 June | Changes over the same period of the preceding year (%) | ||
2023 RMB | 2022 RMB (adjusted) | 2022 RMB (before adjustment) | ||
| Basic earnings per share | 0.301 | 0.370 | 0.367 | (18.6) |
| Diluted earnings per share | 0.301 | 0.370 | 0.367 | (18.6) |
| Return on capital employed (%) | 4.22 | 5.78 | 5.75 | (1.56) percentage points |
7
BUSINESS REVIEW AND PROSPECTS
BUSINESS REVIEW
In the first half of 2023, China’ economy continued to recover and showed a good momentum, recording a GDP growth of 5.5% year-on-year. Domestic natural gas demand picked up with apparent consumption up by 6.7% year-on-year. Domestic demand for refined oil products rebounded with apparent consumption up by 16.2% year-on-year, among which, gasoline, diesel and kerosene consumption increased by 9.8%, 15.1% and 78.1% respectively. Domestic demand for chemicals was weak with ethylene equivalent consumption up by 2.4% year-on-year.
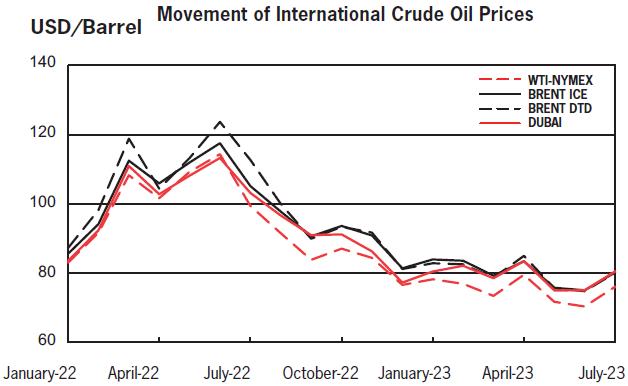
In the first half of 2023, international oil prices fluctuated with a downward trend. The average spot price of Platts Brent was USD79.8 per barrel, down by 25.8% year-on-year.
8
| 1 | PRODUCTION & OPERATIONS REVIEW |
| (1) | Exploration and Production |
In the first half of 2023, the Company intensified efforts in high quality exploration and profitable development with new achievements made in increasing reserves, stabilizing oil production, boosting gas output and cutting cost. In terms of exploration, we strengthened risk exploration, trap pre-exploration and integrated evaluation exploration, and achieved a number of oil and gas discoveries and breakthroughs in Tarim Basin, Sichuan Basin, Jianghan Basin and Erdos Basin. The construction of Shengli Jiyang Shale Oil National Demonstration Zone was promoted efficiently. In terms of development, we continued to scale up profitable production, carried forward the capacity building of Jiyang, Tahe and West Junggar, and strengthened fine-tuned development to lay a solid foundation for the stable production in mature fields. Efforts were made to bring up reserve and production of natural gas and accelerate capacity building in Shunbei Zone II and West Sichuan marine facies gas field. We strengthened integrated operation of natural gas production, supply, storage and sales and improved the profitability of the whole natural gas business chain. The Company’s production of oil and gas in the first half of 2023 was 250 million barrels of oil equivalent, up by 3.3% year-on-year, among which natural gas production reached 660.9 billion cubic feet, up by 7.6% year-on-year.
Exploration and Production: Summary of Operations
| Six-month period ended 30 June | Changes | ||
| 2023 | 2022 | (%) | |
| Oil and gas production (mmboe) | 249.88 | 242.01 | 3.3 |
| Crude oil production (mmbbls) | 139.68 | 139.65 | 0.02 |
| China | 124.68 | 124.63 | 0.04 |
| Overseas | 15.00 | 15.02 | (0.1) |
| Natural gas production (bcf) | 660.88 | 613.92 | 7.6 |
| (2) | Refining |
In the first half of 2023, the Company actively addressed the challenges brought by the decline of crude oil prices and narrowed profit margin of certain refined oil products, adhered to the integration and optimization of production and marketing, increased utilization rate and maximized the efficiency of the business chain. We dynamically enhanced resources allocation and lowered procurement cost. We closely followed market demand, effectively optimised the rhythm of converting refined oil products to chemical feedstock and refining specialties, and increased production of marketable products such as high grade lubricating oil and grease. We scaled up export volume and optimized export scheduling and structure. We accelerated construction of world-class bases and promoted structural adjustment projects in an orderly manner. In the first half of 2023, the Company processed 126.54 million tonnes of crude oil, up by 4.8% year-on-year and produced 76.07 million tonnes of refined oil products, up by 10.3% with kerosene output up by 63.5% year-on-year.
Refining: Summary of Operations Unit: million tonnes
| Six-month period ended 30 June | Changes | ||
| 2023 | 2022 | (%) | |
| Refinery throughput (million tonnes) | 126.54 | 120.76 | 4.8 |
| Gasoline, diesel and kerosene production (million tonnes) | 76.07 | 68.99 | 10.3 |
| Gasoline (million tonnes) | 30.33 | 30.03 | 1.0 |
| Diesel (million tonnes) | 32.15 | 30.65 | 4.9 |
| Kerosene (million tonnes) | 13.59 | 8.31 | 63.5 |
| Light chemical feedstock production (million tonnes) | 21.36 | 22.01 | (3.0) |
Note: Includes 100% of production of domestic joint ventures.
| (3) | Marketing and Distribution |
In the first half of 2023, the Company seized the favorable opportunity of rebounded market demand, brought our advantages of integrated business into full play and expanded the market through further enhancement in operating quality and scale. We focused on client demand and carried out targeted and differentiation marketing strategy. Measures were taken to effectively consolidate marketing network, actively develop overseas business, promote the expansion of charging and battery swapping business, and expand application scenario of hydrogen business, further paving the way to transform into an integrated energy service provider of petrol, gas, hydrogen, power and services. At the same time, we reinforced efforts in upgrading Sinopec-branded products and explored new business models to improve the quality and profitability of non-fuel business. Total sales volume of refined oil products for the first half of the year was 116.6 million tonnes, up by 18.5% year-on-year, of which total domestic sales volume accounted for 92.47 million tonnes, up by 17.9% year-on-year.
9
Marketing and Distribution: Summary of Operations
| Six-month period ended 30 June | Change | ||
| 2023 | 2022 | (%) | |
| Total sales volume of refined oil products (million tonnes) | 116.60 | 98.42 | 18.5 |
| Total domestic sales volume of refined oil products (million tonnes) | 92.47 | 78.46 | 17.9 |
| Retail (million tonnes) | 59.76 | 51.23 | 16.7 |
| Direct sales and Distribution (million tonnes) | 32.71 | 27.23 | 20.1 |
| Annualised average throughput per station (tonne/station) | 3,866 | 3,333 | 16.0 |
Note: The total sales volume of refined oil products includes the amount of refined oil marketing and trading sales volume.
As of 30 June 2023 | As of 31 December 2022 | Change from the end of last year (%) | |
| Total number of Sinopec-branded service stations | 30,918 | 30,808 | 0.4 |
| Number of convenience stores | 28,364 | 28,172 | 0.7 |
| (4) | Chemicals |
In the first half of 2023, chemical industry situated cyclical trough, new capacities rapidly released combined with weak demand. Facing severe market situations, the Company coordinated long-term development and efforts in reducing loss and increasing profit, and strengthened cost control to maximize the overall value of the business chain. We enhanced analysis of product marginal profit, increased output of profitable products, and reduced utilisation rate of marginal loss units or even shut them down for operational consideration. Integration of production, marketing, research and application was further cemented to increase portion of high value-added products. We pushed forward the scale capacity building of Zhenhai and Tianjin Nangang. In the first half of the year, ethylene production was 6.875 million tonnes. The Company expanded domestic and overseas markets, increased market sales volume and profit, the total chemical sales volume in the first half reached 41.63 million tonnes, up by 3.1% year-on-year.
Major Chemical Products: Summary of Operations Unit: thousand tonnes
| Six-month period ended 30 June | Changes | ||
| 2023 | 2022 | (%) | |
| Ethylene | 6,875 | 6,846 | 0.4 |
| Synthetic resin | 9,793 | 9,275 | 5.6 |
| Synthetic fiber monomer and polymer | 3,903 | 4,656 | (16.2) |
| Synthetic fiber | 519 | 555 | (6.5) |
| Synthetic rubber | 670 | 646 | 3.7 |
Note: Includes 100% of production of domestic joint ventures.
| 2 | HEALTH AND SAFETY |
In the first half of 2023, the Company improved HSE management system and ensured the implementation of safety responsibilities. We carried out special campaign for enhancing hazardous chemical substance safety, and strengthened safety control over key areas and procedures, so as to maintain the overall stability of safety production. We promoted training in occupational health, further optimized the management mechanism for the physical and psychological health of overseas employees. We improved the management model of employees’ health and reinforced the foundation for the health management of employees.
| 3 | SCIENCE AND TECHNOLOGY INNOVATION |
In the first half of 2023, the Company accelerated seeking breakthrough in key and core technologies and further promoted the reform of the science and technology system and mechanism with positive progress made in science and technology innovation. In upstream, we obtained in-depth cognition in the shale gas enrichment mechanism of the deep layer in Sichuan and Chongqing, which led to major breakthrough in the marine facies deep formation shale gas exploration in Sichuan Basin. In refining, we achieved large-scale industrialization of highly-efficient catalytic cracking of resid (resid to chemicals, RTC). We made progress in synthesizing lubricant for aviation engine and developing a residue hydrotreating catalyst on fluidized bed all by ourselves. We also industrialized the production technology for aerospace kerosene. In chemicals, we started the pilot unit successfully of syngas coupling conversion to olefin (STO), commercialized the new loop process polypropylene technology, and successfully operated the thousand-tonne POE pilot unit. In addition, the CO2 transportation pipeline of the million-ton CCUS demonstration project was put into operation, and national pilot demonstration projects such as “Industrial Internet +” and “Artificial intelligence Infrastructure Project” were smoothly promoted.
10
| 4 | CAPITAL EXPENDITURES |
The Company focuses on the quality and profitability of investment and continues to optimize its investment projects. In the first half of 2023, total capital expenditures were RMB74.667 billion. Capital expenditure for the exploration and production segment was RMB33.421 billion, mainly for oil and gas production capacity construction of Jiyang and West Sichuan and storage and transportation facilities etc. Capital expenditure for the refining segment was RMB7.063 billion, mainly for refining structural adjustment in Yangzi and Tianjin. RMB3.320 billion was spent in the marketing and distribution segment, mainly for the development of integrated energy station network, renovation of the existing end-market network and non-fuel business. Capital expenditure for the chemical segment was RMB30.036 billion, mainly for ethylene projects in Luoyang and Tianjin Nangang as well as coal chemical projects. Capital expenditure for the corporate and other segments were 827 million, mainly for R&D facilities and information technology application projects.
BUSINESS OUTLOOK
In the second half of 2023, China’s economy is anticipated to improve with good momentum. Domestic demand for refined oil products is expected to improve, demand for natural gas will grow and the demand for chemical products will gradually recover. Given the comprehensive impact of geopolitics, changes in global supply, demand and inventory, international crude oil prices are expected to fluctuate at medium and high price level. The Company will focus on operation optimization, market expansion, innovative development and safe operation. We will stress on the following aspects:
In E&P, the Company will continue to enhance exploration and development efforts, keep improving reserves and production of oil and gas, and strive to make greater progress in stabilizing oil production, increasing gas production, and cutting costs. We will accelerate the oil and gas production capacity building in Jiyang, Shengli offshore, Shunbei Phase II and western Sichuan marine facies, promote the construction of the national demonstration area for continental facies shale oil in Jiyang, make every effort to raise capacity, control the decline of oil and gas output, and lower costs, diversify supply sources of natural gas, and continue to integrate the production, supply, storage and marketing system of natural gas. In the second half of the year, we plan to produce 141 million barrels of crude oil and 630.9 billion cubic feet of natural gas.
In refining, the Company will integrate and coordinate production and marketing, flexibly adjust the product slate and facilities utilization in line with market needs, and improve the efficiency of business chain. We will dynamically optimize the procurement scale and rhythm and strive to reduce procurement cost. We will fine-tune export rhythm, and optimize export structure. We will shift from refined oil products to chemical feedstock in an orderly manner with low cost, enhance the effort in shifting from refined oil products to refining specialties and increase production of high value-added products and specialties, and expand the markets for lubricants, asphalt and petroleum coke. In the second half of the year, we plan to process 127 million tonnes of crude oil.
In marketing and distribution, the Company will seize the opportunity of rebounding market demand, leverage our integration advantages to improve profitability and market share. We will build incremental marketing network precisely and expand overseas market, expedite the construction of power charging and battery swapping stations, continuously push forward the construction of “hydrogen corridor” and the demonstrated application of hydrogen refuelling for heavy trucks, and intensify the integrity and reliability of the network. We will further tap into digital empowerment, improve the comprehensive service ecology for non-fuel business, and raise profitability through synergy. In the second half of the year, we plan to sell 94 million tonnes of refined oil products in domestic market.
In chemicals, the Company will adhere to the strategy of “basic + high-end”, closely follow marginal profit to enhance structure adjustment, strengthen optimisation of feedstock and reduce costs. Based on market need, we will dynamically monitor the changes in marginal contribution of the products, and keep high utilization of the profitable units. We will integrate production, marketing, research and application, strengthen the research and development of new materials and high value-added products, and increase profits. We will promote the layout of large-scale ethylene projects and the transformation and upgrading of aromatics. We will also push ahead with domestic and overseas market expansion, and strengthen strategic customers cooperation and tailor-made product service. In the second half of the year, we plan to produce 7.15 million tonnes of ethylene.
In Capex, the Company plans to spend RMB104.0 billion in the second half of the year. RMB41 billion will be spent in the E&P segment, mainly for oil and gas capacity building in Jiyang, Tahe, west Sichuan, and Weirong and the construction of storage and transportation facility. RMB15.6 billion will be spent in the refining segment, mainly for the expansion of Zhenhai refining and chemical project and the technical revamping project of Guangzhou for safer, environmental friendly, and high quality development. RMB13.3 billion will be spent in the marketing and distribution segment, mainly for developing the network for the integrated energy stations, the revamping of the existing marketing network for end-users, and non-fuel business. RMB29.4 billion will be spent in the chemicals segment, mainly for the construction of ethylene projects in Tianjin Nangang and Maoming and expansion of Zhengai refining and chemical project. RMB4.7 billion will be spent for corporate and others, mainly for R&D and IT.
11
MANAGEMENT’S DISCUSSION AND ANALYSIS
THE FOLLOWING DISCUSSION AND ANALYSIS SHOULD BE READ IN CONJUNCTION WITH THE COMPANY’S INTERIM FINANCIAL STATEMENTS AND THE ACCOMPANYING NOTES. PARTS OF THE FOLLOWING FINANCIAL DATA, UNLESS OTHERWISE STATED, WERE CONSISTENT WITH THE COMPANY’S INTERIM FINANCIAL STATEMENTS THAT HAVE BEEN PREPARED ACCORDING TO THE IFRS. THE PRICES IN THE FOLLOWING DISCUSSION DO NOT INCLUDE VALUE-ADDED TAX.
| 1 | CONSOLIDATED RESULTS OF OPERATIONS |
In the first half of 2023, facing the conditions that international crude oil price fluctuated with a downward trend, refined oil products demand rebounded, and chemical demand remained weak, the Company fully leveraged the integration advantage, actively deepened optimisation of production and operation, expanded market and sales, and realised revenue and operating profit of RMB1,593.7 billion and RMB53.7 billion, decreased by 1.1% and 14.7% year-on-year respectively.
The following table sets forth the principal revenue and expense items from the Company’s consolidated financial statements for the first half of 2023 and the corresponding period in 2022:
| Six-month period ended 30 June | |||
| 2023 | 2022 | Change | |
| RMB million | RMB million | (%) | |
| Revenue | 1,593,682 | 1,612,126 | (1.1) |
| Revenue from primary business | 1,561,502 | 1,582,236 | (1.3) |
| Other operating revenues | 32,180 | 29,890 | 7.7 |
| Operating expenses | (1,539,986) | (1,549,202) | (0.6) |
| Purchased crude oil, products and operating supplies and expenses | (1,282,882) | (1,262,183) | 1.6 |
| Selling, general and administrative expenses | (27,381) | (26,797) | 2.2 |
| Depreciation, depletion and amortisation | (55,239) | (53,638) | 3.0 |
| Exploration expenses, including dry holes | (4,882) | (5,738) | (14.9) |
| Personnel expenses | (49,949) | (49,223) | 1.5 |
| Taxes other than income tax | (127,261) | (134,409) | (5.3) |
| Impairment (losses)/reversal on trade and other receivables | (35) | 72 | — |
| Other operating income/(expenses), net | 7,643 | (17,286) | — |
| Operating profit | 53,696 | 62,924 | (14.7) |
| Net finance costs | (4,790) | (5,337) | (10.2) |
| Investment income and share of profits less losses from associates and joint ventures | 2,860 | 7,453 | (61.6) |
| Profit before taxation | 51,766 | 65,040 | (20.4) |
| Income tax expense | (10,170) | (14,033) | (27.5) |
| Profit for the period | 41,596 | 51,007 | (18.5) |
| Attributable to: | |||
| Shareholders of the Company | 36,122 | 44,841 | (19.4) |
| Non-controlling interests | 5,474 | 6,166 | (11.2) |
| (1) | Revenue |
In the first half of 2023, the Company’s revenue from primary business was RMB1,561.5 billion, representing a decrease of 1.3% year-on-year. This was mainly due to the decreased prices in crude oil, refined oil products and chemical products, and decreased sales volume of petrochemical products. The significant increase in sales volumes of refined oil products and natural gas partially offset the aforementioned negative impact.
12
The following table sets forth the external sales volume, average realised prices and respective change rates of the Company’s major products in the first half of 2023 as compared with the first half of 2022.
| Sales Volume (thousand tonnes) | Average realised price (VAT excluded) (RMB/tonne, RMB/thousand cubic meters) | |||||
| Six-month period ended 30 June | Change | Six-month period ended 30 June | Change | |||
| 2023 | 2022 | (%) | 2023 | 2022 | (%) | |
| Crude oil | 3,676 | 4,280 | (14.1) | 3,754 | 4,513 | (16.8) |
| Natural gas (million cubic meters) | 15,897 | 14,824 | 7.2 | 1,949 | 1,736 | 12.3 |
| Gasoline | 46,424 | 39,525 | 17.5 | 8,730 | 9,272 | (5.8) |
| Diesel | 41,470 | 36,668 | 13.1 | 7,074 | 7,558 | (6.4) |
| Kerosene | 12,282 | 8,575 | 43.2 | 5,704 | 5,771 | (1.2) |
| Basic chemical feedstock | 17,675 | 18,063 | (2.1) | 5,633 | 6,475 | (13.0) |
| Synthetic fibre monomer and polymer | 2,944 | 3,812 | (22.8) | 5,574 | 6,607 | (15.6) |
| Synthetic resin | 8,503 | 8,595 | (1.1) | 7,420 | 8,662 | (14.3) |
| Synthetic fibre | 536 | 588 | (8.8) | 7,900 | 8,347 | (5.4) |
| Synthetic rubber | 690 | 663 | 4.1 | 10,433 | 11,720 | (11.0) |
Most of the crude oil and a small portion of natural gas produced by the Company were internally used for refining and chemical production with the remaining sold to other customers. In the first half of 2023, the revenue from crude oil, natural gas and other upstream products sold externally amounted to RMB89.7 billion, down by 6.4% year-on-year, accounting for 5.6% of the Company’s revenue. This change was mainly due to the decrease of crude oil prices.
Petroleum products (mainly consisting of refined oil products and other refined petroleum products) sold externally by the refining segment and the marketing and distribution segment achieved external sales revenues of RMB926.1 billion, representing an increase of 6.9% year-on-year and accounting for 58.1% of the Company’s revenue. This change was mainly due to the increased volumes of refined oil products including gasoline, diesel and kerosene. The sales revenue of gasoline, diesel and kerosene was RMB768.7 billion, representing an increase of 10.9% year-on-year, accounting for 83.0% of the total sales revenue of petroleum products. The sales revenue of other refined petroleum products was RMB157.4 billion, accounting for 17.0% of the sales revenue of petroleum products, down by 9.0% year-on-year.
The Company’s external sales revenue of chemical products was RMB196.8 billion, accounting for 12.3% of its revenue, down by 16.0% year-on-year. The change was mainly due to the decrease of prices and sales volume of majority chemical products.
13
| (2) | Operating expenses |
In the first half of 2023, the Company’s operating expenses was RMB1,540.0 billion, down by 0.6% year-on-year. The operating expenses mainly consisted of the following:
Purchased crude oil, products and operating supplies and expenses were RMB1,282.9 billion, representing an increase of 1.6% year-on-year, accounting for 83.3% of total operating expenses, of which:
| • | Crude oil purchasing expense was RMB445.7 billion, representing a decrease of 5.5% year-on-year. Throughput of crude oil purchased externally in the first half of 2023 was 118.26 million tonnes (excluding the volume processed for third parties), up by 4.9% year-on-year. The average processing cost of crude oil purchased externally was RMB4,181 per tonne, down by 10.1% year-on-year. |
| • | The Company’s purchasing expense of refined oil products was RMB226.1 billion, up by 63.6% year-on-year, mainly attributable to the increased volumes of outsourced refined oil products resulting from improved refined oil products demand and increased refined oil products operating scale of the Company. |
| • | The Company’s purchasing expense related to trading activities was RMB326.4 billion, down by 8.0% year-on-year, mainly due to the decreased prices of crude oil and refined oil products. |
| • | Other purchasing expenses were RMB284.7 billion, down by 4.4% year-on-year, mainly due to the decreased price of outsourced chemical raw materials. |
Selling, general and administrative expenses of the Company totalled RMB27.4 billion, representing an increase of 2.2% year-on-year, mainly due to the increased marketing expenses resulting from the increased sales volume of refined oil products.
Depreciation, depletion and amortisation of the Company were RMB55.2 billion, representing an increase of 3.0% year-on-year. This was mainly due to the increased scale of assets resulting from increased investment.
Exploration expense was RMB4.9 billion, representing a decrease of 14.9% year-on-year. This was mainly because the Company optimized the deployment of exploration wells, and continuously improved the success rate of exploration wells, which effectively reduced relevant expenses.
Personnel expense was RMB49.9 billion, representing an increase of 1.5% year-on-year.
Taxes other than income tax were RMB127.3 billion, representing a decrease of 5.3% year-on-year, mainly due to the decrease in international crude oil price year-on-year, which led to the decreased crude oil special gain levy, as well as the decreased resource tax.
Other operating income/(expenses), net was RMB7.6 billion, representing an increase of RMB24.9 billion over the same period of 2022, mainly due to the increased profit on hedging business of commodity derivative, and related revenue increased by RMB20.4 billion resulting from decreased international crude oil price year-on-year, and a year-on-year increase of RMB2.6 billion in value-added tax refunds on imported LNG.
| (3) | Operating profit |
In the first half of 2023, the Company’s operating profit was RMB53.7 billion, representing a decrease of 14.7% year-on-year. This was mainly due to the significant decrease in chemical margin year-on-year resulting from weak market demand, the significant decreased margin of certain refinery products including naphtha, petroleum coke and LPG, and the inventory loss of crude oil and refined oil products resulting from decreased international crude oil price.
| (4) | Net finance costs |
In the first half of 2023, the Company’s net finance costs was RMB4.8 billion, down by 10.2% over the same period of last year, mainly due to the increase in exchange gains.
| (5) | Profit before taxation |
In the first half of 2023, the Company’s profit before taxation amounted to RMB51.8 billion, representing a decrease of 20.4% year-on-year.
| (6) | Income tax expense |
In the first half of 2023, the Company’s income tax expense totalled RMB10.2 billion, representing a decrease of 27.5% year-on-year.
| (7) | Profit attributable to non-controlling interests of the Company |
In the first half of 2023, profit attributable to non-controlling interests was RMB5.5 billion, representing a decrease of 11.2% year-on-year.
| (8) | Profit attributable to shareholders of the Company |
In the first half of 2023, profit attributable to shareholders of the Company was RMB36.1 billion, representing a decrease of 19.4% year-on-year.
14
| 2 | RESULTS OF SEGMENT OPERATIONS |
The Company manages its operations by four business segments, namely exploration and production segment, refining segment, marketing and distribution segment and chemicals segment, as well as corporate and others. Unless otherwise specified, the inter-segment transactions have not been eliminated from financial data discussed in this section. In addition, the operating revenue data of each segment includes other operating revenues.
The following table shows the operating revenues by each segment, the contribution of external sales and inter-segment sales as a percentage of operating revenues before elimination of inter-segment sales, and the contribution of external sales as a percentage of consolidated operating revenues (i.e. after elimination of inter-segment sales) for the periods indicated.
| Operating revenues | As a percentage of consolidated operating revenues before elimination of inter-segment sales | As a percentage of consolidated operating revenues after elimination of inter-segment sales | ||||
Six-month period ended 30 June | Six-month period ended 30 June | Six-month period ended 30 June | ||||
| 2023 | 2022 | 2023 | 2022 | 2023 | 2022 | |
| RMB million | (%) | (%) | ||||
| Exploration and Production Segment | ||||||
| External sales* | 91,864 | 97,854 | 3.3 | 3.4 | 5.8 | 6.1 |
| Inter-segment sales | 52,999 | 60,314 | 1.9 | 2.1 | ||
| Operating revenues | 144,863 | 158,168 | 5.2 | 5.5 | ||
| Refining Segment | ||||||
| External sales* | 88,558 | 100,845 | 3.2 | 3.5 | 5.6 | 6.3 |
| Inter-segment sales | 640,999 | 674,791 | 22.9 | 23.0 | ||
| Operating revenues | 729,557 | 775,636 | 26.1 | 26.5 | ||
| Marketing and Distribution Segment | ||||||
| External sales* | 861,757 | 787,077 | 30.8 | 27.0 | 54.1 | 48.8 |
| Inter-segment sales | 9,591 | 4,916 | 0.3 | 0.2 | ||
| Operating revenues | 871,348 | 791,993 | 31.1 | 27.2 | ||
| Chemicals Segment | ||||||
| External sales* | 201,390 | 239,121 | 7.2 | 8.2 | 12.5 | 14.8 |
| Inter-segment sales | 42,910 | 39,089 | 1.5 | 1.3 | ||
| Operating revenues | 244,300 | 278,210 | 8.7 | 9.5 | ||
| Corporate and Others | ||||||
| External sales* | 350,113 | 387,229 | 12.5 | 13.3 | 22.0 | 24.0 |
| Inter-segment sales | 460,405 | 525,043 | 16.4 | 18.0 | ||
| Operating revenues | 810,518 | 912,272 | 28.9 | 31.3 | ||
| Operating revenue before eliminationof inter-segment sales | 2,800,586 | 2,916,279 | 100.0 | 100.0 | ||
| Elimination of inter-segment sales | (1,206,904) | (1,304,153) | ||||
| Consolidated operating revenues | 1,593,682 | 1,612,126 | 100.0 | 100.0 | ||
| * | Other operating revenues are included. |
15
The following table sets forth the operating revenues, operating expenses and operating profit/(loss) by each segment before elimination of the inter-segment transactions for the periods indicated, and the percentage change between the first half of 2023 and the first half of 2022.
| Six-month period ended 30 June | |||
| 2023 | 2022 | Change | |
| RMB million | RMB million | (%) | |
| Exploration and Production Segment | |||
| Operating revenues | 144,863 | 158,168 | (8.4) |
| Operating expenses | 119,455 | 131,866 | (9.4) |
| Operating profit | 25,408 | 26,302 | (3.4) |
| Refining Segment | |||
| Operating revenues | 729,557 | 775,636 | (5.9) |
| Operating expenses | 718,147 | 745,868 | (3.7) |
| Operating profit | 11,410 | 29,768 | (61.7) |
| Marketing and Distribution Segment | |||
| Operating revenues | 871,348 | 791,993 | 10.0 |
| Operating expenses | 854,379 | 775,138 | 10.2 |
| Operating profit | 16,969 | 16,855 | 0.7 |
| Chemicals Segment | |||
| Operating revenues | 244,300 | 278,210 | (12.2) |
| Operating expenses | 247,658 | 277,400 | (10.7) |
| Operating (loss)/profit | (3,358) | 810 | —-- |
| Corporate and Others | |||
| Operating revenues | 810,518 | 912,272 | (11.2) |
| Operating expenses | 806,961 | 911,873 | (11.5) |
| Operating profit | 3,557 | 399 | 791.5 |
| Elimination | (290) | (11,210) | (97.4) |
| (1) | Exploration and Production Segment |
Most of the crude oil and a small portion of the natural gas produced by the exploration and production segment were used for the Company’s refining and chemical operations. Most of the natural gas and a small portion of the crude oil produced by the Company were sold to external customers.
In the first half of 2023, operating revenue of the segment was RMB144.9 billion, representing a decrease of 8.4% year-on-year. This was mainly due to the decrease in crude oil price.
In the first half of 2023, the segment sold 17.17 million tonnes of crude oil, representing an increase of 1.2% year-on-year. Natural gas sales volume was 16.5 bcm, representing an increase of 7.8% year-on-year. Regasified LNG sales volume was 8.56 bcm, representing a decrease of 23.6% year-on-year. LNG sales volume was 0.531 million tonnes, representing a decrease of 41.5% year-on-year. Average realised prices of crude oil, natural gas, regasified LNG, and LNG were RMB3,627 per tonne, RMB1,954 per thousand cubic meters, RMB3,863 per thousand cubic meters, and RMB4,344 per tonne respectively, representing a decrease of 17.4%, an increase of 12.1%, an increase of 27.2% and a decrease of 23.7% year-on-year respectively.
In the first half of 2023, the operating expenses of the segment were RMB119.5 billion, representing a decrease of 9.4% year-on-year. This was mainly due to imported LNG procurement cost decreased by RMB7.0 billion year-on-year. Crude oil special gain levy and resource tax decreased by RMB6.5 billion year-on-year. Exploration expenses decreased by RMB900 million year-on-year. Depreciation, depletion and amortization increased by RMB700 million year-on-year.
In the first half of 2023, the oil and gas lifting cost was RMB756.3 per tonne, representing a decrease of 1.4% year-on-year.
In the first half of 2023, the segment adhered to the strategy of stabilizing oil output, boosting gas production, reducing costs, and promoting profitability, intensified efforts in high quality exploration and profitable development, enhanced cost control, strengthened the optimization of the whole natural gas industry chain. In the first half, the segment realised an operating profit of RMB25.4 billion, representing a decrease of RMB900 million or 3.4% year-on-year.
| (2) | Refining Segment |
Business activities of the refining segment include purchasing crude oil from third parties and the exploration and production segment of the Company as well as processing crude oil into refined petroleum products. Gasoline, diesel and kerosene are sold internally to the marketing and distribution segment of the Company; part of the chemical feedstock is sold to the chemicals segment of the Company; and other refined petroleum products are sold to both domestic and overseas customers through the refining segment.
In the first half of 2023, operating revenues of the segment was RMB729.6 billion, representing a decrease of 5.9% year-on-year. This was mainly due to the decreased price of refined oil products, chemical feedstock and other refined petroleum products year-on-year resulting from sharp decrease of international crude oil price.
16
The following table sets forth the sales volumes, average realised prices and the respective changes of the Company’s major refined oil products of the segment in the first half of 2023 and that of the same period of 2022.
| Sales Volume (thousand tonnes) | Average realised price (VAT excluded) (RMB/tonne) | |||||
Six-month period ended 30 June | Change | Six-month period ended 30 June | Change | |||
| 2023 | 2022 | (%) | 2023 | 2022 | (%) | |
| Gasoline | 29,444 | 28,945 | 1.7 | 8,256 | 8,919 | (7.4) |
| Diesel | 30,833 | 29,388 | 4.9 | 6,639 | 7,317 | (9.3) |
| Kerosene | 11,208 | 6,629 | 69.1 | 5,623 | 5,662 | (0.7) |
| Chemical feedstock | 20,743 | 20,902 | (0.8) | 4,401 | 5,311 | (17.1) |
| Other refined petroleum products | 32,583 | 32,785 | (0.6) | 3,856 | 4,637 | (16.8) |
In the first half of 2023, the sales revenue of gasoline was RMB243.1 billion, representing a decrease of 5.8% year-on-year, accounting for 33.3% of the segment’s operating revenues. The sales revenue of diesel was RMB204.7 billion, representing a decrease of 4.8% year-on-year, accounting for 28.1% of the segment’s operating revenues. The sales revenue of kerosene was RMB63.0 billion, representing an increase of 67.9% year-on-year, accounting for 8.6% of the segment’s operating revenues. The sales revenue of chemical feedstock was RMB91.3 billion, representing a decrease of 17.8% year-on-year, accounting for 12.5% of the segment’s operating revenues.
The sales revenue of refined petroleum products other than gasoline, diesel, kerosene and chemical feedstock was RMB125.6 billion, representing a decrease of 17.4% year-on-year, accounting for 17.2% of the segment’s operating revenues.
In the first half of 2023, the segment’s operating expenses were RMB718.1 billion, representing a decrease of 3.7% year-on-year, which was mainly attributable to a decrease in the crude oil and refining feedstock procurement cost.
In the first half of 2023, the average processing cost of refining feedstock was RMB4,293 per tonne, representing a decrease of 9.7% year-on-year. Total refining feedstock throughput was 129.11 million tonnes (excluding volume processed for third parties), representing an increase of 4.9% year-on-year. In the first half of 2023, the total processing cost for refining feedstock was RMB554.3 billion, representing a decrease of 5.3% year-on-year, accounting for 77.2% of the segment’s operating expenses, representing a decrease of 1.2% year-on-year.
In the first half of 2023, the refining margin was RMB354 per tonne, decreased by RMB179 per tonne year-on-year, representing a decrease of 33.6% year-on-year. This was mainly due to the inventory loss resulting from the decrease of international crude oil price this year, while there was an inventory gain in the same period last year, and year-on-year decreased margins of refinery products including naphtha, petroleum coke and LPG.
In the first half of 2023, the unit refining cash operating cost (defined as operating expenses less cost of crude oil and refining feedstock, depreciation and amortisation, taxes other than income tax and other operating expenses, divided by the throughput of crude oil and refining feedstock) was RMB204.5 per tonne, representing a decrease of 8.2% year-on-year, which was mainly due to the effort in cost control and the decrease in cost of auxiliary material and fuels, such as coal.
In the first half of 2023, the segment focused on optimisation and integration of production and marketing, intensified efforts in promoting the utilisation rate, but impacted by the shrunk margin of part of the refinery products and inventory loss resulting from a decrease in international crude oil price, operating profit was RMB11.4 billion, decreased by RMB18.4 billion or 61.7% year-on-year.
| (3) | Marketing and Distribution Segment |
The business activities of the marketing and distribution segment include purchasing refined oil products from the refining segment and the third parties, conducting wholesale and direct sales to domestic customers and retailing, distributing oil products through the segment’s retail and distribution network, as well as providing related services.
17
In the first half of 2023, the operating revenues of this segment were RMB871.3 billion, increased by 10.0% year-on-year. This was mainly attributable to an increased demand for refined oil products and a year-on-year increase in the Company’s sales volume of refined oil products. Among them, the sales revenues of gasoline was RMB405.9 billion, increased by 10.7% year-on-year, the sales revenues of diesel was RMB294.2 billion, increased by 5.8% year-on-year and the sales revenues of kerosene was RMB70.8 billion, increased by 43.1% year-on-year.
The following table sets forth the sales volume, average realised prices and respective changes of the segment’s four major refined oil products in the first half of 2023 and 2022, including the detailed information about the retail, direct sales and distribution of gasoline and diesel.
Sales volume (thousand tonnes) | Average realised price (VAT excluded, RMB/tonne) | |||||
Six-month period ended 30 June | Change | Six-month period ended 30 June | Change | |||
| 2023 | 2022 | (%) | 2023 | 2022 | (%) | |
| Gasoline | 46,506 | 39,554 | 17.6 | 8,727 | 9,271 | (5.9) |
| Retail | 32,915 | 28,669 | 14.8 | 9,184 | 9,783 | (6.1) |
| Direct sales and distribution | 13,591 | 10,885 | 24.9 | 7,620 | 7,925 | (3.8) |
| Diesel | 41,588 | 36,792 | 13.0 | 7,073 | 7,556 | (6.4) |
| Retail | 18,014 | 15,212 | 18.4 | 7,528 | 8,072 | (6.7) |
| Direct sales and distribution | 23,574 | 21,580 | 9.2 | 6,726 | 7,192 | (6.5) |
| Kerosene | 12,433 | 8,575 | 45.0 | 5,696 | 5,771 | (1.3) |
| Fuel oil | 16,143 | 11,159 | 44.7 | 3,780 | 5,122 | (26.2) |
In the first half of 2023, the operating expense of this segment was RMB854.3 billion, representing an increase of 10.2% year-on-year. This was mainly due to a year-on-year increased procurement cost of refined oil products resulting from increased operating volume.
In the first half of 2023, the segment’s marketing cash operating cost (defined as the operating expenses less the purchase costs, taxes other than income tax, depreciation and amortization, divided by sales volume) was RMB182.9 per tonne, down by 8.0% year-on-year. This was mainly because the Company focused on improving cost competitiveness and effectively reduced all the circulation expenses.
In the first half of 2023, the operating revenues of non-fuel business of this segment were RMB21.6 billion, representing an increase of RMB2.3 billion year-on-year, and the profit of non-fuel business was RMB2.7 billion, representing an increase of RMB100 million year-on-year. This was mainly because the Company proactively promoted the sales volume of Sinopec-branded products and expanded new business models.
In the first half of 2023, the segment seized opportunities of improved refined oil products demand and market environment, made every effort in expanding market and promoting profitability, and realised an operating profit of RMB17.0 billion, representing an increase of RMB100 million year-on-year, up by 0.7% year-on-year.
| (4) | Chemicals segment |
The business activities of the chemicals segment include purchasing chemical feedstock from the refining segment and third parties and producing, marketing and distributing petrochemical and inorganic chemical products.
In the first half of 2023, the operating revenues of this segment were RMB244.3 billion, decreased by 12.2% year-on-year. This was mainly due to weak demand for chemical products and decrease by 13.4% in terms of averaged products prices year-on-year.
In the first half of 2023, the operating revenue generated by the segment’s six major categories of chemical products (namely basic organic chemicals, synthetic resin, synthetic fiber monomer and polymer, synthetics fibre, synthetic rubber and chemical fertiliser) was RMB225.9 billion, decreased by 13.9% year-on-year, accounting for 92.5% of the operating revenues of the segment.
18
The following table sets forth the sales volume, average realised prices and respective changes of each of the segment’s six categories of chemical products in the first half of 2023 and 2022.
Sales volume (thousand tonnes) | Average realised price (VAT excluded, RMB/tonne) | |||||
Six-month period ended 30 June | Change | Six-month period ended 30 June | Change | |||
| 2023 | 2022 | (%) | 2023 | 2022 | (%) | |
| Basic organic chemicals | 23,589 | 23,105 | 2.1 | 5,669 | 6,423 | (11.7) |
| Synthetic fibre monomer and polymer | 2,967 | 3,843 | (22.8) | 5,581 | 6,633 | (15.9) |
| Synthetic resin | 8,504 | 8,596 | (1.1) | 7,420 | 8,662 | (14.3) |
| Synthetics fibre | 536 | 588 | (8.8) | 7,901 | 8,350 | (5.4) |
| Synthetic rubber | 691 | 664 | 4.1 | 10,443 | 11,728 | (11.0) |
| Chemical fertiliser | 401 | 408 | (1.8) | 2,608 | 3,329 | (21.6) |
In the first half of 2023, the operating expense of this segment was RMB247.7 billion, decreased by 10.7% year-on-year, mainly due to decreased procurement cost of chemical feedstock including naphtha, etc.
In the first half of 2023, the segment enhanced cost control and optimised slate of products. However, due to weak demand and concentrated release of production capacities, the margin of chemical products decreased by 57% year-on-year, with an operating loss of RMB3.4 billion and a year-on-year decrease of RMB4.2 billion.
| (5) | Corporate and others |
The business activities of corporate and others mainly consist of import and export business activities of Sinopec Corp.’s subsidiaries, research and development activities of the Company, and managerial activities of the headquarters.
In the first half of 2023, the operating revenue generated from the corporate and others was RMB810.5 billion, decreased by 11.2% year-on-year, mainly due to a decrease in the trading prices of crude oil and refined oil products.
In the first half of 2023, the operating expense for corporate and others were RMB806.9 billion, decreased by 11.5% year-on-year.
In the first half of 2023, the operating profit for corporate and others was RMB3.6 billion, up by RMB3.2 billion year-on-year.
| 3 | ASSETS, LIABILITIES, EQUITY AND CASH FLOWS |
The major funding resources of the Company are its operating activities, short-term and long-term loans. The major use of funds includes operating expenses, capital expenditures, and repayment of short-term and long-term debts.
| (1) | Assets, Liabilities and Equity | Unit:RMB million |
As of 30 June 2023 | As of 31 December 2022 | Change | |
| Total assets | 2,026,902 | 1,951,121 | 75,781 |
| Current assets | 573,991 | 523,140 | 50,851 |
| Non-current assets | 1,452,911 | 1,427,981 | 24,930 |
| Total liabilities | 1,078,305 | 1,011,579 | 66,726 |
| Current liabilities | 668,559 | 667,385 | 1,174 |
| Non-current liabilities | 409,746 | 344,194 | 65,552 |
| Total equity attributable to the shareholders of the Company | 795,720 | 787,600 | 8,120 |
| Share capital | 119,896 | 119,896 | 0 |
| Reserves | 675,824 | 667,704 | 8,120 |
| Non-controlling interests | 152,877 | 151,942 | 935 |
| Total equity | 948,597 | 939,542 | 9,055 |
19
As of 30 June 2023, the Company’s total assets were RMB2,026.9 billion, representing an increase of RMB75.8 billion compared with the 2022 year-end balance, of which:
Current assets were RMB574.0 billion, representing an increase of RMB50.9 billion compared with the 2022 year-end balance, mainly because inventories and accounts receivable increased by RMB37.5 billion and RMB27.0 billion respectively resulting from the increase in sales volumes of the Company’s products along with the recovery of market.
Non-current assets were RMB1,452.9 billion, representing an increase of RMB24.9 billion compared with the 2022 year-end balance, mainly because of the construction of refining and chemical bases, increased investments in converting refined oil products to chemical feedstock and speciality refinery products, and new chemical materials business, as well as construction in progress increased by RMB19.4 billion and net value of property, plant and equipment increased by RMB3.8 billion.
As of 30 June 2023, the Company’s total liabilities were RMB1,078.3 billion, representing an increase of RMB66.7 billion compared with the end of last year, of which:
Current liabilities were RMB668.6 billion, representing an increase of RMB1.2 billion compared with the 2022 year-end balance, mainly because short-term loans increased to meet the capital needs of operation activities.
Non-current liabilities were RMB409.7 billion, representing an increase of RMB65.6 billion compared with the 2022 year-end balance, mainly because the low-interest long-term domestic loans increased.
As of 30 June 2023, total equity attributable to shareholders of Sinopec Corp. was RMB795.7 billion, representing an increase of RMB8.1 billion compared with the 2022 year-end balance.
| (2) | Cash Flows |
The following table sets forth the major items in the consolidated cash flow statements for the first half of 2023 and of 2022:
Unit: RMB million
| Major items of cash flows | Six-month period ended 30 June | Change | |
| 2023 | 2022 | ||
| Net cash generated from operating activities | 27,562 | 4,947 | 22,615 |
| Net cash used in investing activities | (93,430) | (51,138) | (42,292) |
| Net cash generated from financing activities | 66,861 | 75,212 | (8,351) |
| Net increase in cash and cash equivalents | 993 | 29,021 | (28,028) |
In the first half of 2023, net cash generated from operating activities was RMB27.6 billion, representing an increase of cash inflow of RMB22.6 billion year-on-year, mainly due to the decrease of occupation in working capital.
In the first half of 2023, the Company’s net cash used in investing activities was RMB93.4 billion, representing an increase of cash outflow of RMB42.3 billion year-on-year, mainly due to a year-on-year increase of cash outflow RMB25.0 billion in capital expenditures, and an increase of net cash outflow of RMB32.5 billion in time deposits with maturities over three months.
In the first half of 2023, the Company’s net cash generated from financing activities was RMB66.9 billion, representing a decrease of cash inflow of RMB8.4 billion year-on-year, mainly due to a year-on-year decrease of cash inflow of RMB18.5 billion in net debts and loans, and a decrease of cash outflow of RMB12.4 billion resulting from the decrease in cash dividends payment.
As of 30 June 2023, the Company’s cash and cash equivalents were RMB94.9 billion.
| (3) | Contingent Liabilities |
Please refer to “Material Guarantee Contracts and Their Performance” in the “Significant Events” section of this report.
| (4) | Capital Expenditure |
Please refer to “Capital Expenditures” in the “Business Review and Prospects” section of this report.
| (5) | Research & Development and Environmental Expenditures |
Research and Development expenditures referred to fees incurred in the period and recognised as expenses. In the first half of 2023, the Company’s research and development expenditure amounted to RMB9.6 billion, of which expensed expenditure was RMB6.0 billion and capitalised expenditure was RMB3.6 billion.
Environmental expenditures refer to the routine pollutant cleaning fees paid by the Company, excluding capitalised cost of pollutant treatment facilities. In the first half of 2023, the environmental expenditures of the Company amounted to RMB7.2 billion.
20
| (6) | Measurement of Fair Values of Derivatives and Relevant System |
The Company has established sound decision-making mechanism, business process and internal control systems relevant to financial instrument accounting and information disclosure. The following table sets forth items relevant to measurement of fair values.
Items relevant to measurement of main fair values Unit: RMB million
| Items | Beginning of the period | End of the period | Profits and losses from variation of fair values in the current period | Accumulated variation of fair values recorded as equity | Impairment loss provision of the current period | Funding source | Purchase amount in the current period | Sell and redemption amount in the current period | Other changes |
| Financial assets held for trading | 2 | 3 | 1 | — | — | — | — | — | — |
| Fund | 2 | 3 | 1 | — | — | — | — | — | — |
| Derivative financial instruments | (1,838) | (1,285) | 598 | — | — | — | — | (45) | — |
| Cash flow hedges | 13,860 | 3,327 | 1,307 | (1,399) | — | — | — | (2,409) | (8,032) |
| Receivables financing | 3,507 | 4,294 | — | — | — | — | 35,557 | (34,770) | — |
| Other equity instrument investments | 730 | 682 | — | (1) | — | — | 26 | (80) | 7 |
| Total | 16,261 | 7,021 | 1,906 | (1,400) | — | — | 35,583 | (37,304) | (8,025) |
Derivatives investment:
In the first half of 2023, the Company traded in commodity and currency derivatives according to the Annual Business Plan for Financial Derivatives approved by the Board. Such business complied with the regulatory requirements of financial derivatives, operated in a standardized manner, and achieved the goals of suppressing price fluctuation and preventing market risks.
| 4 | ANALYSIS OF FINANCIAL STATEMENTS PREPARED UNDER CASs |
The major differences between the Company’s financial statements prepared under CASs and IFRS are set out in Section C of the financial statements of the Company on page 147 of this report.
| (1) | Under CASs, the operating income and operating profit or loss by reportable segments were as follows: |
| Six-month period ended 30 June | ||
| 2023 | 2022 | |
| RMB million | RMB million | |
| Operating income | ||
| Exploration and Production Segment | 144,863 | 158,168 |
| Refining Segment | 729,557 | 775,636 |
| Marketing and Distribution Segment | 871,348 | 791,993 |
| Chemicals Segment | 244,300 | 278,210 |
| Corporate and Others | 810,518 | 912,272 |
| Elimination of inter-segment sales | (1,206,904) | (1,304,153) |
| Consolidated operating income | 1,593,682 | 1,612,126 |
| Operating profit/(loss) | ||
| Exploration and Production Segment | 21,828 | 25,358 |
| Refining Segment | 9,885 | 28,751 |
| Marketing and Distribution Segment | 16,751 | 17,964 |
| Chemicals Segment | (4,181) | 120 |
| Corporate and Others | 932 | 18,164 |
| Elimination | (290) | (11,210) |
| Financial expenses, gains from changes in fair value,investment income and disposal income | 845 | (17,067) |
| Other income | 4,896 | 2,121 |
| Consolidated operating profit | 50,666 | 64,201 |
| Net profit attributable to equity shareholders of the Company | 35,111 | 43,920 |
Operating profit: In the first half of 2023, the operating profit of the Company was RMB50.7 billion, representing a decrease of 21.1% year-on-year.
Net profit attributable to equity shareholders of the Company: In the first half of 2023, net profit attributable to the equity shareholders of the Company was RMB35.1 billion, representing a decrease of 20.1% year-on-year.
21
| (2) | Financial data prepared under CASs: |
| At 30 June | At 31 December | ||
| 2023 | 2022 | Change | |
| RMB million | RMB million | RMB million | |
| Total assets | 2,026,902 | 1,951,121 | 75,781 |
| Non-current liabilities | 408,862 | 343,279 | 65,583 |
| Shareholders’ equity | 949,481 | 940,457 | 9,024 |
Changes analysis:
Total assets: As of 30 June 2023, the Company’s total assets were RMB2,026.9 billion, representing an increase of RMB75.8 billion compared with the 2022 year-end balance. This was mainly because inventories and accounts receivables increased by RMB37.5 billion and RMB27.0 billion respectively resulting from the increase in sales volumes of the Company’s products along with the recovery of market, as well as construction in progress increased by RMB19.4 billion and fixed assets increased by RMB3.8 billion.
Non-current liabilities: As of 30 June 2023, the Company’s non-current liabilities were RMB408.9 billion, representing an increase of RMB65.6 billion compared with the 2022 year-end balance. This was mainly because the low-interest long-term domestic loans increased RMB65.1 billion to meet the capital needs of investment, production and operation activities.
Shareholders’ equity: As of 30 June 2023, total shareholders’ equity of the Company was RMB949.5 billion, representing an increase of RMB9.0 billion compared with the 2022 year-end balance.
| (3) | The results of the principal operations by segments |
| Segments | Operating income (RMB million) | Operating cost (RMB million) | Gross profit margin* (%) | Increase of operating income on a year-on-year basis (%) | Increase of operating cost on a year-on-year basis (%) | Decrease of gross profit margin on a year-on-year basis (percentage points) |
| Exploration and Production | 144,863 | 102,302 | 23.8 | (8.4) | (3.4) | (0.1) |
| Refining | 729,557 | 596,390 | 2.4 | (5.9) | (4.3) | (2.3) |
| Marketing and Distribution | 871,348 | 820,546 | 5.7 | 10.0 | 10.5 | (0.5) |
| Chemicals | 244,300 | 238,841 | 1.6 | (12.2) | (10.9) | (1.5) |
| Corporate and Others | 810,518 | 800,096 | 1.3 | (11.2) | (9.6) | (1.8) |
| Elimination of Inter-segment Sales | (1,206,904) | (1,206,614) | — | — | — | — |
| Total | 1,593,682 | 1,351,561 | 7.2 | (1.1) | 1.6 | (1.9) |
* Gross profit margin = (Operating income – Operating cost – taxes and surcharges)/Operating income
| 5. | THE CAUSE AND IMPACT OF THE CHANGE IN THE COMPANY’S ACCOUNTING POLICY, ACCOUNTING ESTIMATES AND ACCOUNTING METHODS |
For details, please refer to Note 3(26) to the financial statements prepared in accordance with CASs and Note 2 to the financial statement prepared in accordance with IFRS.
22
CORPORATE GOVERNANCE
| 1 | IMPROVEMENTS IN CORPORATE GOVERNANCE |
During the reporting period, Sinopec Corp. complied with the articles of association of Sinopec Corp. (Articles of Association) as well as domestic and overseas laws and regulations on securities, adhered to the standard operation, improved corporate governance, and continuously improved the quality of listed company. The Board and special committees of the Board performed their duties diligently, reviewed all resolutions with diligence, and reinforced the strategic planning. Independent directors played an active role, communicated with the Chairman, and offered valuable suggestions for the high-quality development. The Company further promoted the effectiveness of the execution of the internal control policy, strengthened compliance management and risk control, so as to improve compliance management to a higher level. The Company attached great importance to management of investor relations, adhered to investor-oriented approach, conducted information disclosure with high quality, strengthened daily communication with investors, and organized investor reverse roadshow and independent director surveys covering the whole industry chain business and received positive market feedback. The Company continuously strengthened ESG management, carried out the annual safety management strengthen campaign, strengthened the prevention and control of environmental pollution, and steadily advanced the Action Plan for Carbon Dioxide Peaking, actively fulfilled corporate social responsibility and contributed to rural revitalization.
| 2 | GENERAL MEETINGS |
During the reporting period, Sinopec Corp. convened annual general meeting for 2022 (AGM), the first A shareholders class meeting for 2023 and the first H shareholders class meeting for 2023 on 30 May 2023 in Beijing, China, in strict compliance with the relevant laws, regulations, and the notice, convening and holding procedures under the Articles of Association, whereby the proposals in relation to the following matters were reviewed and approved: (i) Report of the Board of Directors for 2022 of Sinopec Corp.; (ii) Report of the Board of Supervisors for 2022 of Sinopec Corp.; (iii) The audited financial reports of Sinopec Corp. for the year ended 31 December 2022 prepared by KPMG Huazhen LLP and KPMG; (iv) The profit distribution plan for 2022 of Sinopec Corp.; (v) To authorise the Board to determine the interim profit distribution plan for 2023; (vi) To re-appoint KPMG Huazhen LLP and KPMG as the external auditors of Sinopec Corp. for the year 2023, and to authorise the Board to determine their remunerations; (vii) To elect Mr. Lv Lianggong as an executive director of the eighth session of the Board of Sinopec Corp.; (viii) The resolution in relation to reduction of the registered capital and amendments to the Articles of Association; (ix) To authorise the Board to determine the issuance of debt financing instrument(s); (x) To grant to the Board a general mandate to issue new domestic shares and/or overseas-listed foreign shares of Sinopec Corp.; (xi) To grant to the Board a mandate to buy back domestic shares and/or overseas-listed foreign shares of Sinopec Corp.; (xii) The resolution regarding the satisfaction of the conditions of the issuance of A Shares to target subscribers by Sinopec Corp.; (xiii) The resolutions regarding the Plan of the Proposed Issuance of A Shares; (xiii.i) Type and par value of shares to be issued; (xiii.ii) Manner and timing of issuance; (xiii.iii) Subscriber and manner of subscription; (xiii.iv) Pricing benchmark date, Issue Price and pricing principles; (xiii.v) Number of shares to be issued; (xiii.vi) Lock-up period; (xiii.vii) Amount and use of proceeds; (xiii.viii) Place of listing; (xiii.ix) Arrangement of accumulated undistributed profits; (xiii.x) Validity period; (xiv) The Proposal of the Proposed Issuance of A Shares; (xv) The Demonstration and Analysis Report on the Plan of the Proposed Issuance of A Shares; (xvi) The resolution regarding the connected transaction involved in the Proposed Issuance of A Shares; (xvii) The conditional Subscription Agreement entered into between Sinopec Corp. and China Petrochemical Corporation; (xviii) The Feasibility Report on the Use of Proceeds Raised from the Proposed Issuance of A Shares; (xix) The dilution of current returns by the Proposed Issuance of A Shares, remedial measures and the commitments of related entities; (xx) The Dividend Distribution and Return Plan for Shareholders for the Next Three Years (2023-2025); (xxi) The resolution regarding the authorisation to the Board at the AGM with full power to deal with all matters relating to the Proposed Issuance of A Shares; (xxii) The resolution regarding the authorisation to the Board at the AGM to amend the Articles of Association in accordance with the situation of the Proposed Issuance of A Shares. For details of the meetings, please refer to the poll results announcements published on China Securities Journal, Shanghai Securities News, and Securities Times and on the websites of Shanghai Stock Exchange and Hong Kong Stock Exchange after the meetings.
| 3 | DIRECTORS, SUPERVISORS AND OTHER SENIOR MANAGEMENT |
| (1) | Information on Appointment or Resignation |
On 6 January 2023, Mr. Ng, Kar Ling Johnny served as the Independent Non-Executive Director of China Telecom Corporation Limited.
On 9 March 2023, Mr. Yu Xizhi resigned as Vice President of Sinopec Corp. due to his age.
On 6 April 2023, Mr. Ling Yiqun resigned as Executive Director, member of the Strategy Committee of the Board and Senior Vice President of Sinopec Corp. due to his age.
On 16 May 2023, Mr. Liu Hongbin resigned as Executive Director and member of the Strategy Committee of the Board and Senior Vice President of Sinopec Corp. due to his age.
On 16 May 2023, Mr. Zhao Rifeng resigned as Vice President of Sinopec Corp. due to his age.
On 19 May 2023, Mr. Zhang Zhiguo resigned as Supervisor of Sinopec Corp. due to his age.
On 30 May 2023, Mr. Lv Lianggong was elected as Executive Director of the eighth session of the Board of Sinopec Corp.
On 30 June 2023, Mr. Ng, Kar Ling Johnny ceased to be the Independent Non-Executive Director of China Vanke Co., Ltd.
On 25 July 2023, Mr. Niu Shuanwen was appointed as Senior Vice President of Sinopec Corp.
23
| (2) | Equity Interests of Directors, Supervisors, and Other Senior Management |
As of 30 June 2023, Mr. Ling Yiqun, the former Executive Director, Senior Vice President, held 13,000 A shares of Sinopec Corp.
Save as disclosed above, as of 30 June 2023, none of the Directors, Supervisors and senior management of Sinopec Corp. and their respective associates had any interests or short positions (including any interests or short positions that are regarded or treated as being held in accordance with the Securities and Futures Ordinance (SFO) in any shares, underlying shares or debentures of Sinopec Corp. or any associated corporations (as defined in Part XV of the SFO), as recorded in the registry pursuant to Section 352 of the SFO or as otherwise notified to Sinopec Corp. and the Hong Kong Stock Exchange pursuant to the Model Code for Securities Transactions by Directors of Listed Companies (Model Code) contained in the Hong Kong Listing Rules.
As required under the Hong Kong Listing Rules, Sinopec Corp. has formulated Rules Governing Shares and Changes in Shares Held by Company Directors, Supervisors and Senior Management and Rules on Insider Registration and Management (collectively, Rules) to regulate securities transactions by relevant personnel. The standards of these two rules above-mentioned are no less strict than those set out in the Model Code. Upon the specific inquiries made by Sinopec Corp., all the directors confirmed that they had complied with the required standards in the Model Code as well as those set out in the Rules during the reporting period.
| 4 | DIVIDEND |
| (1) | Dividend distribution for the year ended 31 December 2022 |
Upon the approval at its annual general meeting for 2022, Sinopec Corp. distributed the final cash dividend of RMB0.195 per share (tax inclusive) for 2022. The final dividend for 2022 has been distributed on or before 30 June 2023 to shareholders whose names appeared on the register of members of Sinopec Corp. on 20 June 2023. Combined with the interim cash dividend of RMB0.16 per share (tax inclusive) for 2022, the total cash dividend for the whole year of 2022 amounted to RMB0.355 per share (tax inclusive).
| (2) | Interim dividend distribution plan for the six months ended 30 June 2023 |
As approved at the 18th meeting of the eighth session of the Board, the interim dividend of RMB0.145 per share (tax inclusive) for the six months ended 30 June 2023 will be distributed based on the total number of shares as of 14 September 2023 (record date) in cash.
The 2023 interim dividend distribution plan of Sinopec Corp., having comprehensively considered the interests of shareholders and development of the Company, is in compliance with the Articles of Association and consideration procedures. The independent non-executive directors have issued independent opinions. The interim dividend will be distributed on or before 28 September 2023 to all shareholders whose names appear on the register of members of Sinopec Corp. on 14 September 2023. In order to be qualified for the interim dividend, holders of H shares shall lodge their share certificates and transfer documents with Hong Kong Registrars Limited at 1712-1716, 17th floor, Hopewell Centre, No. 183 Queen’s Road East, Wanchai, Hong Kong, for registration, no later than 4:30 p.m. on 8 September 2023. The register of members of H shares of Sinopec Corp. will be closed from 9 September 2023 to 14 September 2023 (both days inclusive). The dividend will be denominated and declared in RMB and distributed to domestic shareholders and shareholders under Shanghai-Hong Kong and Shenzhen-Hong Kong Stock Connect Program in RMB and to the overseas shareholders in Hong Kong Dollars. The exchange rate for dividend to be paid in Hong Kong Dollars is based on the average benchmark exchange rate of Hong Kong Dollar against RMB as published by the People’s Bank of China one week ahead of the date of declaration of the interim dividend (1 Hong Kong Dollar=RMB0.918998).
In accordance with the Enterprise Income Tax Law of the People’s Republic of China and its implementation regulations which came into effect on 1 January 2008, Sinopec Corp. is required to withhold and pay enterprise income tax at the rate of 10% on behalf of the non-resident enterprise shareholders whose names appear on the register of members for H shares of Sinopec Corp. when distributing the cash dividends or issuing bonus shares by way of capitalisation from retained earnings. Any H shares which are not registered under the name of an individual shareholder, including those registered under HKSCC Nominees Limited, other agents or trustees, or other organisations or groups, shall be deemed as shares held by non-resident enterprise shareholders. On such basis, enterprise income tax shall be withheld from dividends payable to such shareholders. If holders of H shares intend to change their shareholder status, please enquire about the relevant procedures with their agents or trustees. Sinopec Corp. will strictly comply with the law or the requirements of the relevant government authorities to withhold and pay enterprise income tax on behalf of the relevant shareholders based on the register of members for H shares of Sinopec Corp. as at the record date. If the individual holders of H shares are residents of Hong Kong, Macau or other countries which had an agreed tax rate of 10% for cash dividends or bonus shares by way of capitalisation from retained earnings with China under the relevant tax agreement, Sinopec Corp. should
24
withhold and pay individual income tax on behalf of the relevant shareholders at a rate of 10%. If the individual holders of H shares are residents of countries which had an agreed tax rate of less than 10% with China under relevant tax agreement, Sinopec Corp. shall withhold and pay individual income tax on behalf of the relevant shareholders at a rate of 10%. In that case, if the relevant individual holders of H shares wish to reclaim the extra amount withheld, Sinopec Corp. would apply for the relevant agreed tax treatment pursuant to the relevant tax agreement provided that the shareholders submit the evidence required by the notice of the tax agreement to the share registrar of H shares of Sinopec Corp. Sinopec Corp. will assist with the tax refund after the approval of the competent tax authority. If the individual holders of H shares are residents of countries which had an agreed tax rate of over 10% but less than 20% with China under the tax agreement, Sinopec Corp. shall withhold and pay the individual income tax on behalf of the relevant shareholders at the agreed actual tax rate in accordance with the relevant tax agreements. If the individual holders of H shares are residents of countries which had an agreed tax rate of 20% with China under the tax agreement, or which had not entered into any tax agreement with China, or otherwise, Sinopec Corp. shall withhold and pay the individual income tax on behalf of the relevant shareholders at a rate of 20%. Pursuant to the Notice on the Tax Policies related to the Pilot Program of the Shanghai-Hong Kong Stock Connect(關於滬港股票市場交易互聯互通機制試點有關稅收政策的通知)(Caishui[2014]No. 81) and the Notice on the Tax Policies related to the Pilot Program of the Shenzhen-Hong Kong Stock Connect (《關於深港股票市場交易互聯互通機制 試點有關稅收政策的通知》) (Caishui[2016]No.127): For dividends of domestic investors investing in the H shares of Sinopec Corp. through Shanghai-Hong Kong and Shenzhen-Hong Kong Stock Connect Program, Sinopec Corp. shall withhold and pay income tax at the rate of 20% on behalf of individual investors and securities investment funds. The Company will not withhold or pay the income tax of dividends for domestic enterprise investors and those domestic enterprise investors shall report and pay the relevant tax by themselves. For dividends of investors of the Hong Kong market (including enterprises and individuals) investing in the A shares of Sinopec Corp. through Shanghai-Hong Kong Stock Connect Program, Sinopec Corp. will withhold and pay income taxes at the rate of 10% on behalf of those investors and will report to the competent tax authorities for the withholding. For investors who are tax residents of other countries which have entered into tax treaties with China stipulating a dividend tax rate of lower than 10%, the enterprises and individuals may apply to the competent tax authorities for the entitlement of the rate under such tax treaties either by themselves or by entrusting a withholding agent. Upon approval by the tax authorities, the amount paid in excess of the tax payable based on the tax rate according to such tax treaties will be refunded.
| 5 | THE COMPANY’S EMPLOYEES |
As of 30 June 2023, the Company has a total of 368,450 employees and employee remuneration cost totalled approximately RMB49.949 billion. Each of Sinopec Marketing Co. Limited and China International United Petroleum and Chemical Company Limited, the principal subsidiaries of Sinopec Corp., has 119,652 and 446 employees respectively.
| 6 | REMUNERATION POLICY |
Based on a relatively unified basic remuneration system, Sinopec Corp. has established its remuneration distribution system based on the value of positions, performance & contribution, with an aim at improving employee capabilities, and has constantly improved employee performance evaluation and incentive & discipline mechanisms.
| 7 | TRAINING PROGRAMS |
During the reporting period, the Company improved its cadre training system, completed 29 key talent training projects, organized 52 sessions, and trained 3,100 talents. The Company organized various training courses for leadership improvement, middle-aged and young cadres, technology leading talents, and international talents, making the training for management and professional technical personnel more practical and effective.
| 8 | DETAILED IMPLEMENTATION OF THE SHARE INCENTIVE SCHEME |
Sinopec Corp. and its subsidiaries did not implement any share incentive scheme during the reporting period.
| 9 | COMPLIANCE WITH THE CORPORATE GOVERNANCE CODE |
During the reporting period, Sinopec Corp. complied with all the code provisions of the Corporate Governance Code set out in Appendix 14 of the Hong Kong Listing Rules.
| 10 | REVIEW OF THE INTERIM REPORT |
The Audit Committee of the Board of Sinopec Corp. has reviewed and confirmed the Interim Report.
25
ENVIRONMENTAL AND SOCIAL RESPONSIBILITIES
| 1 | WORK CONDUCTED IN ECOLOGICAL PROTECTION, POLLUTION PREVENTION AND ENVIRONMENTAL RESPONSIBILITIES PERFORMANCE |
In the reporting period, the Company deepened the campaign of pollution prevention and the special action on ozone pollution prevention, focused on ecological and environmental protection in the Yangtze and Yellow River basins, promoted energy conservation and carbon reduction actions, persistently carried out Green Enterprise Action. The COD and sulphur dioxide emissions decreased by 13% and 2% period-on-period respectively, and the solid waste was 100% properly disposed.
| 2 | MEASURES TAKEN TO MITIGATE CARBON EMISSION AND ITS EFFECT |
During the reporting period, the Company has actively implemented the carbon peaking plan of Sinopec Corp. and invested in the new energy industry, orderly promoted the adjustment and optimization of energy consumption structure, strengthened the development and application of key low-carbon technologies, and achieved good results in carbon emission reduction. The Company persistently promoted energy conservation and consumption reduction, decreased GHG emissions by 2.26 million tonnes of CO2 equivalent, recycled 0.843 million tonnes of CO2, used 0.422 million tonnes of carbon dioxide for EOR, recovered 434 million cubic meters of methane which was equivalent to reducing 6.51 million tonnes of CO2 emissions.
| 3 | ENVIRONMENTAL PROTECTION SOLUTIONS OF COMPANIES AND THEIR SUBSIDIARIES AS MAJOR POLLUTANT DISCHARGE UNITS IDENTIFIED BY ENVIRONMENTAL PROTECTION DEPARTMENTS |
| (1) | Pollutant discharge information |
In the reporting period, certain subsidiaries of Sinopec Corp. listed as major pollutant discharge units announced by national or local ecological and environmental authorities have obtained their pollutant discharge license in accordance with the requirements of the national list of fixed pollution source emission permit classification management and disclosed environmental information as required by the relevant authorities and local government. The details of such information were published on national pollutant discharge license management information platform and the local government website.
Discharge information summarized by category is as follows:
| (a) | Discharge of air pollutants1 |
| No. | Pollutant type | Number of vents involved2 | Ways of discharge3 | Discharge standards implemented4 | Permitted concentration limit5 | Actual average concentration in the first half of the year6 | Approved actual discharge amount | Discharge compliance |
| 1 | SO2 | 1,251 | continuous | Discharge Standards for Air Pollutants from Thermal Power Plants (GB 13223-2011) Discharge Standards for Air Pollutants from Boilers (GB13271-2014) Discharge Standards for Pollutants in the Petroleum Refining Industry (GB31570-2015) Discharge Standards for Pollutants in the Petrochemical Industry (GB31571-2015) Discharge Standards for Pollutants in the Synthetic Resin Industry (GB31572-2015) | 10-200 mg/m3 | 0.05-50 mg/m3 | 2,409 tonnes | The compliance rate is 99.99%, the details of which are subject to the announcement by the ecological authorities. |
| 2 | NOX | 1,243 | continuous | Discharge Standards for Air Pollutants from Thermal Power Plants (GB 13223-2011) Discharge Standards for Air Pollutants from Boilers (GB13271-2014) Discharge Standards for Pollutants in the Petroleum Refining Industry (GB31570-2015) Discharge Standards for Pollutants in the Petrochemical Industry (GB31571-2015) Discharge Standards for Pollutants in the Synthetic Resin Industry (GB31572-2015) | 20-240 mg/m3 | 10-100 mg/m3 | 9,254 tonnes | The compliance rate is 99.99%, the details of which are subject to the announcement by the ecological authorities. |
| Note 1: | This report discloses the discharge of the Company’s oilfield, refining and chemical companies and specialized companies that are included in the key management of emission permits. The data is calculated by self-monitoring data and the data published by the local ecological authorities shall prevail. |
| Note 2: | Count the number of organized vents involved for this pollutant. |
| Note 3: | Intermittent discharge from some vents.s |
| Note 4: | The discharge standards implemented are the major industrial discharge standards. Other standards such as local emission standards implemented by each company can be found in the public information of the ecological authorities. |
| Note 5: | The permitted concentration limit are major industrial discharge standard limit. The limit of other standards implemented by each company can be found in the public information of the ecological authorities. |
| Note 6: | The actual average concentration of the main discharge outlets in the first half of the year is within the corresponding disclosure range and the public information of the ecological and environmental department can be consulted for details. |
26
| (b) | Discharge of water pollutants1 |
| No. | Pollutant type | Number of vents involved | Ways of discharge2 | Discharge standards implemented3 | Permitted concentration limit4 | Actual average concentration in the first half of the year5 | Approved actual discharge amount | Discharge compliance |
| 1 | COD | 76 | continuous | Discharge Standards for Pollutants in the Petroleum Refining Industry (GB31570-2015) Discharge Standards for Pollutants in the Petrochemical Industry (GB31571-2015) Discharge Standards for Pollutants in the Synthetic Resin Industry (GB31572-2015) | 40-60 mg/L | 10-50 mg/L | 1,907 tonnes | Daily average data has 100% compliance rate. |
| 2 | Ammonia and nitrogen | 75 | continuous | Discharge Standards for Pollutants in the Petroleum Refining Industry (GB31570-2015) Discharge Standards for Pollutants in the Petrochemical Industry (GB31571-2015) Discharge Standards for Pollutants in the Synthetic Resin Industry (GB31572-2015) | 5-8 mg/L | 0.05-4 mg/L | 25 tonnes | Daily average data has 100% compliance rate. |
| Note 1: | This report discloses the discharge of the Company’s oilfield, refining and chemical companies and specialized companies that are included in the key management of discharge permits. The data is calculated by self-monitoring data and data published by the local ecological authorities shall prevail. |
| Note 2: | Intermittent discharge from some vents. |
| Note 3: | The discharge standards implemented are the major industrial discharge standard. Other standards such as local emission standards implemented by each company can be found in the public information of the ecological authorities. |
| Note 4: | The permitted concentration limit is major industrial discharge standard limit. The limit of other standards implemented by each company can be found in the public information of the ecological authorities. |
| Note 5: | The actual average concentration of the main discharge outlets in the first half of the year is within the corresponding disclosure range, and the public information of the ecological and environmental department can be consulted for details. |
| (2) | Construction and operation of pollution prevention facilities |
In the reporting period, the Company built prevention and control facilities for sewage, flue gas, solid waste and noise in accordance with the requirements of the national and local pollution prevention and environmental protection standards, maintained effective and stable operation of pollution prevention and control facilities.
| (3) | Environmental influence evaluation for construction projects and other administrative permit for environmental protection |
In the reporting period, the Company standardized environmental protection management for construction projects, enforced whole process environmental management on construction and operation. With measures of the “simultaneous three” implemented, all new projects have acquired approval for environmental evaluation from government authorities.
| (4) | Contingent plan for environmental incident emergency |
In the reporting period, the Company complied with the requirements for environmental incident contingent plan by the State and persistently improved its contingent scheme against environmental incident emergency of enterprises and weather with severe pollution.
| (5) | Plan for environmental self-monitoring |
In the reporting period, the Company continuously improved its self-monitoring plan in accordance with the industry guideline, enforced the new requirements for sewage, flue gas and noise monitoring, and disclosed the monitor information as required.
| (6) | Administrative penalties due to environmental issues in the reporting period |
In the reporting period, to the knowledge of the Company, Sinopec Corp. and its subsidiaries were subject to the environmental administrative penalty of RMB0.49 million. The details of such information have been disclosed on the websites of local ecological environment department and other relevant departments.
| (7) | Other environmental information to be disclosed |
In the reporting period, for subsidiaries not listed as major pollution units, the Company has acquired related permissions from national and local government, and enforced environmental protection measures. Those subsidiaries are not obliged to make disclosure in accordance with the requirements of national and local ecological environment authorities.
| 4 | EXPANDING THE ACHIEVEMENTS IN POVERTY-ALLEVIATION AND RURAL REVITALIZATION |
During the reporting period, the Company earnestly implemented national decisions and plans of rural revitalization, improved assistance working mechanism, deepened education assistance and increased supported schools from 37 to 59. The Company strengthened support of industry, continued to promote key projects of the expansion of Dongxiang County quinoa planting area and etc., increased support of consumption and achieved support of consumption of RMB400 million.
27
SIGNIFICANT EVENTS
| 1. | MAJOR PROJECTS IN THE REPORTING PERIOD |
| (1) | Zhenhai Refining & Chemical Expansion project (phase 2) |
The project consists of building a 11 million tpa refinery unit and a 600,000 tpa propane dehydrogenatin and downstream units. The project began construction in June 2022 and is expected to achieve mechanical completion by December 2024. The project investment consists of the Company’s self-owned fund and bank loan. As of 30 June 2023, the aggregate investment was RMB11.25 billion.
| (2) | Tianjin Nanggang ethylene and downstream High-End New Material Industry Cluster project |
The project consists of 1.2 million tpa ethylene units and downstream units. The project began in May 2021 and is expected to achieve mechanical completion by the end of 2023. The project investment consists of the Company’s self-owned fund and bank loan. As of 30 June 2023, the aggregate investment was RMB17.02 billion.
| (3) | Yizheng Chemical Fiber PTA project |
Yizheng Chemical Fiber 3 million tpa PTA project mainly consists of oxidation units, purification units and auxiliary facilities. The project started in July 2021 and is expected to achieve mechanical completion in August 2023. The project investment consists of the Company’s self-owned fund and bank loan. As of 30 June 2023, the aggregate investment was RMB3.84 billion.
| (4) | Tianjin LNG project (phase 2) |
The project mainly consists of a new wharf, five new 220,000-cubic-meter storage tanks etc. LNG processing capacity will reach 11 million tpa after phase 2 expansion project is completed. The project started in January 2019 and is expected to be put into operation at the end of 2024. The project investment consists of the Company’s self-owned fund and bank loan. As of 30 June 2023, the aggregate investment was RMB4.2 billion.
| (5) | Longkou LNG project |
The project mainly consists of a wharf, terminal and power plant warm drainage and water Intake. The first phase designed LNG capacity is 6 million tons per year. One LNG berth with 0.266 million cubic meter capacity will be modified and four 0.22 million cubic meter capacity storage tanks will be newly built up. The project started in November 2021 and is expected to put into operation in October 2025. The project investment consists of the Company’s self-owned fund and bank loan. As of 30 June 2023, the aggregate investment was RMB3.72 billion.
| (6) | Chuanxi natural gas project (phase 1) |
The project mainly consists of 1.7 billion cubic meter per year purified gas capacity and 16 wells. The construction of phase 1 project started in 2019 and is expected to put into operation by the end of 2023. The project investment consists of the Company’s self-owned fund, joint venture’s fund and bank loan. As of 30 June 2023, the aggregate investment was RMB4.67 billion.
| (7) | Shengli Shale Oil project |
The project mainly launches shale oil exploration and development in Jiyang depression, planning to build new production capacity of 1 million tonnes per year in The 14th Five Year Plan. The project started in 2019, has built 75 wells and generated production capacity of 423 thousand tonnes. The project investment consists of the Company’s self-owned fund and bank loan. As of 30 June 2023, the aggregate investment was RMB6.06 billion.
| 2. | CORE COMPETITIVENESS ANALYSIS |
The Company is a large-scale integrated energy and petrochemical company with upstream, mid-stream and downstream operations, and has overall strong strength of scale. The Company is a large oil and gas producer in China and ranks first globally in terms of refining capacity. The Company ranks domestically first and globally second in terms of ethylene production. The Company is equipped with a well-developed refined oil products sales network, being the largest supplier of refined oil and chemical products in China.
The integrated business structure of the Company carries strong advantages in synergy among its various business segments, contributing to the Company by tapping onto potentials in attaining an efficient and comprehensive utilisation of its resources, and endows the Company with strong capabilities in risk resistance and sustaining profitability.
The Company enjoys a favourable positioning with its operations located close to the consumer markets. The steady growth in the Chinese economy is helpful to the development of both refined oil business and chemical business of the Company; through continuous and specialised marketing efforts, the Company’s capability in international operations and market expansion has been further enhanced.
28
The Company owns a team of professionals with expertise in the production of oil and gas, operation of refineries and chemical plants, as well as marketing activities. The Company applies outstanding fine management measures with its remarkable capabilities in management of operations and enjoys an operational cost advantage in its downstream businesses.
The Company has formulated a well-established technology system and mechanism, and owns competent teams specialised in R&D covering a wide range of subjects; the five platforms for technology advancement are taking shape, which includes exploration and development of oil and gas, refining, petrochemicals, utility and strategic emerging technology. With its overall technologies reaching state of the art level in the global arena, and certain technologies taking the lead globally, the Company enjoys a strong technical strength.
The Company always attaches great importance to the fulfilment of corporate social responsibilities and carries out the green and clean development strategy to pursue a sustainable development. Moreover, the Company enjoys an outstanding “Sinopec” brand name, plays an important role in the national economy and is a renowned and reputable company in China.
The Company formulated a strategy and plan for future green transformation and development, accelerating the development of new energy with hydrogen energy as the core and high-end chemical materials, and focusing on building a globally leading clean energy and chemical company.
| 3. | ACTUAL CONTINUING CONNECTED TRANSACTIONS ENTERED INTO BY THE COMPANY DURING THE REPORTING PERIOD |
The Company and Sinopec Group entered into a number of continuing connected transactions agreements, including the mutual supply agreement, the land use rights leasing agreement, the properties leasing agreement, the intellectual property license agreement and safety production insurance fund document.
In the reporting period, purchases expenses of the actual continuing connected transactions of the Company were RMB111.022 billion, representing 6.99% of the total amount of this type of transactions, including purchases of products and services (procurement, storage, transportation, exploration and development services, and production-related services) of RMB104.460 billion, payment of property rent of RMB517 million (the annual value of right-of-use assets relating to property lease of RMB1.928 billion), payment of land rent of RMB5.464 billion (the annual value of right-of-use assets relating to land lease of RMB20.394 billion), and interest expenses of RMB581 million. The sales income amounted to RMB62.358 billion, representing 3.82% of the total amount of this type of transactions, including sales of products of RMB61.260 billion, agency commission income of RMB43 million, and interest income of RMB1.055 billion. In addition, entrusted loan provided by the Company to the connected subsidiaries was RMB1 million. For definitions, please refer to the announcements published by Sinopec Corp. on China Securities Journal, Shanghai Securities News, Securities Times and on the website of Shanghai Stock Exchange on 30 August 2021 and on the website of Hong Kong Stock Exchange on 29 August 2021 and 3 September 2021.
The amounts of continuing connected transactions between the Company and Sinopec Group did not exceed the caps for the continuing connected transactions as approved by the general meeting of shareholders and the Board.
29
| 4. | FUNDS PROVIDED BETWEEN RELATED PARTIES |
Unit: RMB million
| Funds to related parties | Funds from related parties | ||||||
| Related Parties | Relations | Balance at the beginning of the reporting period | Amount incurred | Balance at the end of the reporting period | Balance at the beginning of the reporting period | Amount incurred | Balance at the end of the reporting period |
| Sinopec Group | Parent company and affiliated companies* | 9,114 | 648 | 9,762 | 32,776 | (14,967) | 17,809 |
| Other related parties | Associates and joint ventures | 7,595 | (336) | 7,259 | 5,963 | (74) | 5,889 |
| Total | 16,709 | 312 | 17,021 | 38,739 | (15,041) | 23,698 | |
| Reason for provision of funds between related parties | Other accounts receivable and payable | ||||||
| Impacts of the provision of funds on the Company | No material negative impact | ||||||
| * : | Affiliated companies include subsidiaries, associates and joint ventures. |
| 5. | ACTUAL DAILY RELATED TRANSACTIONS ENTERED INTO BETWEEN THE COMPANY AND CHINA OIL & GAS PIPELINE NETWORK CORPORATION (PIPECHINA) DURING THE REPORTING PERIOD |
On 13 January 2023, the Board of Sinopec Corp. approved the daily related transaction cap in relation to refined oil pipeline transportation services between Sinopec Marketing Co. Limited and PipeChina for the period from 1 January 2023 to 31 December 2023. The actual executed amount of the daily related transaction between Sinopec Marketing Co. Limited and PipeChina regarding refined oil pipeline transportation services from 1 January 2023 to 30 June 2023 was RMB2.586 billion.
| 6. | THE ISSUANCE OF A SHARES BY SINOPEC CORP. TO THE TARGET SUBSCRIBER |
On 24 March 2023, the Board of Sinopec Corp. considered and approved resolutions regarding the issuance of A Shares to the target subscriber, pursuant to which Sinopec Corp. will issue A Shares to China Petrochemical Corporation with gross proceeds of not more than RMB12 billion (inclusive). On 4 April 2023, Sinopec Corp. received the approval from China Petrochemical Corporation, agreeing the issuance of A Shares with gross proceeds of not more than RMB12 billion (inclusive) from Sinopec Corp. to China Petrochemical Corporation. On 30 May 2023, the annual general meeting of Sinopec Corp. for 2022 approved resolutions regarding the issuance of A Shares to the target subscriber. As at 30 June 2023, the issuance of A shares is subject to review and approval by the Shanghai Stock Exchange and consent for registration by CSRC. For details and definitions, please refer to the announcements published by Sinopec Corp. on China Securities Journal, Shanghai Securities News, Securities Times and on the website of Shanghai Stock Exchange on 27 March 2023, 5 April 2023 and 31 May 2023 and on the website of Hong Kong Stock Exchange on 26 March 2023, 4 April 2023 and 30 May 2023.
| 7. | SIGNIFICANT LITIGATION AND ARBITRATION RELATING TO THE COMPANY |
No significant litigation, arbitration relating to the Company occurred during the reporting period.
| 8. | CREDIBILITY OF THE COMPANY, CONTROLLING SHAREHOLDERS AND DE FACTO CONTROLLER |
During the reporting period, the Company and its controlling shareholder did not have any unperformed court’s effective judgments which should be performed or any large amount of debt which should be repaid.
| 9. | MATERIAL CONTRACTS AND THEIR PERFORMANCE |
During the reporting period, the Company did not enter into any material contracts subject to disclosure obligations.
| 10. | SIGNIFICANT EQUITY INVESTMENT |
In the reporting period, no significant equity investment occurred by the Company.
| 11. | SIGNIFICANT SALE OF ASSETS OR EQUITY |
In the reporting period, no significant sale of assets or equity occurred by the Company.
30
| 12. | BUSINESS WITH SINOPEC FINANCE CO. AND CENTURY BRIGHT |
| (1) | DEPOSIT BUSINESS |
Unit: RMB million
| Related party | Related party relationship | Daily Cap | Interest rate range | Balance at beginning | Transaction amount | Balance in the end | ||
| Total deposit | Total withdrawn | Net changes in demand deposits | ||||||
| Sinopec Finance Co. | China Petrochemical Corporation 51%; Sinopec Corp. 49% | RMB80 billion by Sinopec Finance and Century Bright | current:0.35%-1.725%; time deposit: 0.8%-7.4% | 12,599 | 4,863 | 4,537 | (2,113) | 10,812 |
| Century Bright | Sinopec Group 100% | current:0%-0.5%; time deposit: 0.5%-6.39% | 52,465 | 275,980 | 279,429 | 3,451 | 52,467 | |
| Note: | Generally, the deposit interest rate at Sinopec Finance Co. and Century Bright is no lower than that of the same type of deposits for the same period from major commercial banks. |
| (2) | LOAN BUSINESS |
Unit: RMB million
| Transaction amount | |||||||
| Related party | Related party relationship | Loan Cap | Interest rate range | Balance at beginning | Total loan | Total withdrawn | Balance in the end |
| Century Bright | China Petrochemical Corporation 100% | 121,901 | 2.20%-6.19% | 1,498 | 129,835 | 125,690 | 5,643 |
| Sinopec Finance Co. | China Petrochemical Corporation 51%; Sinopec Corp. 49% | 64,881 | 1.08%-4.9875% | 28,049 | 48,640 | 45,508 | 31,181 |
| Note: | Generally, the loan interest rate at Sinopec Finance Co. and Century Bright is no higher than that of the same type of loan for the same period from major commercial banks. |
| (3) | CREDIT BUSINESS AND OTHER FINANCE BUSINESS |
Unit: RMB million
| Related party | Related party relationship | Business nature | Balance in the end | Transaction amount |
| Sinopec Finance Co. | China Petrochemical Corporation 51%; Sinopec Corp. 49% | Issued the acceptance bills | 11,007 | 10,903 |
| Discounted bills | ╱ | 4,600 |
| Note: | The occurred amount includes the newly issued bills and discounts for the six-month period ended 30 June 2023. |
31
| 13. | MATERIAL GUARANTEE CONTRACTS AND THEIR PERFORMANCE |
Unit: RMB million
| Major external guarantees (excluding guarantees for controlled subsidiaries) | |||||||||||||
| Guarantor | Relationship with the Company | Name of guaranteed company | Amount*1 | Transaction date (date of signing) | Period of guarantee | Type | Principal debt condition | Guaranty | Whether completed or not | Whether overdue or not | Amount of overdue guarantee | Counter- guaranteed | Whether guaranteed for connected parties (yes or no)*2 |
| Sinopec Corp. | The listed company itself | Zhong An United Coal Chemical Co., Ltd. | 5,041 | Apr-18 | April 2018-December 2031 | Joint and several liability guarantee | Normal performance | – | No | No | – | No | No |
| Sinopec Corp. | The listed company itself | Russian Amur Natural Gas Chemical Integrated LLC | 3,811*3 | Dec-21 | December 2021-December 2035 (the mature date is estimated) | Joint and several liability guarantee | Normal performance | – | No | No | – | No | No |
Total amount of guarantees provided during the reporting period*4 | 138 | ||||||||||||
Total amount of guarantees outstanding at the end of reporting period*4 (A) | 8,852 | ||||||||||||
| Guarantees by the Company to the controlled subsidiaries | |||||||||||||
| Total amount of guarantee provided to controlled subsidiaries during the reporting period | 0 | ||||||||||||
| Total amount of guarantee for controlled subsidiaries outstanding at the end of the reporting period (B) | 3,613 | ||||||||||||
| Total amount of guarantees for the Company (including those provided for controlled subsidiaries) | |||||||||||||
| Total amount of guarantees (A+B) | 12,465 | ||||||||||||
| The proportion of the total amount of guarantees to the Sinopec Corp.’s net assets (%) | 1.56% | ||||||||||||
| Among which: | |||||||||||||
| Guarantees provided for shareholder, de facto controller and its related parties (C) | 0 | ||||||||||||
| Amount of debt guarantees provided directly or indirectly to the companies with liabilities to assets ratio over 70% (D) | 8,852 | ||||||||||||
| The amount of guarantees in excess of 50% of the net assets (E) | 0 | ||||||||||||
| Total amount of the above three guarantee items (C+D+E) | 8,852 | ||||||||||||
| Statement of guarantee undue that might be involved in any joint and several liabilities | None | ||||||||||||
| Statement of guarantee status | None | ||||||||||||
| *1: | Guarantee amount refers to the actual amount of guarantee liability that the company may undertake during the reporting period within the approved guarantee limit. |
| *2: | As defined in the Rules Governing the Listing of Stocks on Shanghai Stock Exchange. |
| *3: | Excluding the interest corresponding to the loan principal agreed in the guarantee contract, export credit premium and other expenses. |
| *4: | The amount of guarantees provided during the reporting period and the outstanding balance of guarantees amount at the end of the reporting period include the guarantees provided by the controlled subsidiaries to external parties. The amount of the guarantees provided by these subsidiaries is derived from multiplying the guarantees provided by Sinopec Corp.’s subsidiaries by the percentage of shareholding of Sinopec Corp. in such subsidiaries. |
32
| 14. | PERFORMANCE OF THE UNDERTAKINGS BY RELEVANT ENTITIES |
| Background | Type of Undertaking | Party | Contents | Term for performance | Whether bears deadline or not | Whether strictly performed or not |
| Undertakings related to Initial Public Offerings (IPOs) | IPOs | China PetrochemicalCorporation | 1. Compliance with the connected transaction agreements; 2. Solving the issues regarding the legality of land-use rights certificates and property ownership rights certificates within a specified period of time; 3. Implementation of the Reorganisation Agreement (please refer to the definition of Reorganisation Agreement in the H share prospectus of Sinopec Corp.); 4. Granting licenses for intellectual property rights; 5. Avoiding competition within the same industry; 6. Abandonment of business competition and conflicts of interest with Sinopec Corp. | From 22 June 2001 | No | Yes |
| Other undertakings | Other | China PetrochemicalCorporation | Given that China Petrochemical Corporation engages in the same or similar businesses as Sinopec Corp. with regard to the exploration and production of overseas petroleum and natural gas, China Petrochemical Corporation hereby grants a 10-year option to Sinopec Corp. with the following provisions:(1) within 10 years from the date of the undertaking, after a thorough analysis from political, economic and other perspectives, Sinopec Corp. is entitled to require China Petrochemical Corporation to sell its overseas oil and gas assets owned as of the date of the undertaking and still in its possession upon Sinopec Corp.’s exercise of the option to Sinopec Corp.; (2) in relation to the overseas oil and gas assets acquired by China Petrochemical Corporation after the issuance of the undertaking, within 10 years of the completion of such acquisition, after a thorough analysis from political, economic and other perspectives, Sinopec Corp. is entitled to require China Petrochemical Corporation to sell these assets to Sinopec Corp. China Petrochemical Corporation undertakes to transfer the assets as required by Sinopec Corp. under aforesaid items (1) and (2) to Sinopec Corp., provided that the exercise of such option complies with applicable laws and regulations, contractual obligations and other procedural requirements. | Within 10 years after 29 April 2014 or the date when China Petrochemical Corporation acquires the assets | Yes | Yes |
As of the date of this report, Sinopec Corp. had no undertakings in respect of financial performance, asset injections or asset restructuring that had not been fulfilled, nor did Sinopec Corp. make any profit forecast in relation to any asset or project.
| 15. | STRUCTURED ENTITY CONTROLLED BY THE COMPANY |
None.
| 16. | REPURCHASE, SALES AND REDEMPTION OF SHARES |
During this reporting period, neither Sinopec Corp. nor any of its subsidiaries repurchased, sold or redeemed any listed securities of Sinopec Corp.
33
| 17. | INFORMATION ON MAJOR SUBSIDIARIES OR THE ASSOCIATES OR JOINT VENTURES |
During the reporting period, the net profit from the following subsidiary or investment income from the following associate or joint venture accounts for more than 10% of the Company’s net profit:
Unit: RMB million
| Company name | Registered capital | Percentage of share held by Sinopec Corp. | Total Assets | Net Assets | Net Profit | Revenue | Operating Profit | Primary Activities |
| (%) | ||||||||
| Sinopec Marketing Co., Ltd. | 28,403 | 70 | 523,581 | 257,963 | 13,874 | 869,605 | 17,127 | Sales of refined oil products |
| China International United Petroleum and Chemical Company Limited | 5,000 | 100 | 227,790 | 56,961 | 6,835 | 796,058 | 8,261 | Trading of crude oil and petrochemical products |
| 18. | RISK FACTORS |
In the course of its production and operations, Sinopec Corp. will actively take various measures to circumvent operational risks. However, in practice, it may not be possible to prevent the occurrence of all risks and uncertainties described below.
Risks with regard to the variations from macroeconomic situation: The business results of the Company are closely related to macroeconomic situation. The global economy experienced insufficient driving force and uncertainty. The development of economy is increasingly constrained by climate change and environmental issues. The Company’s business could also be adversely affected by other factors such as the impact on export due to carbon tariffs and trade protectionism from certain countries, and negative impact on the return of the investment of domestic and overseas upstream project and refining and storage projects which results from the uncertainty of geopolitics, international crude oil price and etc.
Risks with regard to the cyclical effects from the industry: The majority of the Company’s operating income comes from the sales of refined oil products and petrochemical products, and part of those businesses and their related products are cyclic and are sensitive to macro-economy, cyclic changes of regional and global economy, industry polices, the changes of the production capacity and output, demand of consumers, prices and supply of the raw materials, as well as prices and supply of the alternative products etc. Although the Company is an integrated company with upstream, midstream and downstream operations, it can only counteract the adverse influences of industry cycle to a certain extent.
Risks from the macroeconomic policies and government regulation: Although the Chinese government is gradually liberalizing the market entry regulations on petroleum and petrochemicals sector, the petroleum and petrochemical industries in China are still subject to entry regulations to a certain degree, which include: issuing exploration and mining permits in relation to crude oil and natural gas, issuing licenses in relation to exploration and development of crude oil and natural gas, issuing business licenses for trading crude oil and refined oil, setting caps for retail prices of gasoline, diesel and other oil products, the imposition of the special oil income levy; the formulation of refined oil import and export quotas and procedures, the formulation of safety, environmental protection and quality standards and the formulation of energy conservation policies, restrictions on high energy consumption and high pollution projects. In addition, the changes which have occurred or might occur in macroeconomic and industry policies such as further opening up of crude oil import licenses and the right of tenure and the continuous control of export quota of refined oil; deepening the reform and improvement in pricing mechanism of natural gas, accelerating the exploration of upstream and downstream price linkage mechanisms, cost supervision of gas pipeline and equal access to third party and accelerating the establishment of a uniform gas energy metering and pricing system; cancellation of qualification approval of the wholesale and storage of refined oil business, decentralisation of retail business authorisation of refined oil products to regional and city level government, further improvement in pricing mechanism of refined oil products, gas stations investment being fully opened to foreign investment; reforming in resource tax and environmental tax; and the introduction of measures for energy conservation and carbon reduction in key areas to improve energy efficiency; and the introduction of transforming policy from “double control” of energy consumption to “double control” of carbon emissions and intensity, etc. Such changes might have certain effects on the industry development and market environment and the operations and profitability of the Company.
Risks with regard to the changes from environmental legislation requirements: The Company’s production activities generate waste water, gases, solids and noise. The Company has built up the corresponding pollution prevention and risk control facilities to prevent and reduce the pollution to the environment. However, the relevant government authorities may issue and implement much stricter environmental protection laws and regulations, adopt much stricter environment protection standards. Under such situations, the Company may increase expenses in relation to the environment protection accordingly.
Risks from the uncertainties of obtaining additional oil and gas resources: The future sustainable development of the Company is dependent on our abilities in continuously discovering or acquiring additional oil and natural gas resources to a certain extent. To obtain additional oil and natural gas resources, the Company faces some inherent risks associated with exploration and development and/or with acquisition activities of oil and gas resources, and the Company has to invest a
34
large amount of money with no guarantee of certainty. If the Company fails to acquire additional resources through further exploration, development and acquisition to increase the reserves of crude oil and natural gas, the oil and natural gas reserves and production of the Company may decline over time which may adversely affect the Company’s financial situation and operation performance.
Risks with regard to the external purchase of crude oil: A significant amount of crude oil as needed by the Company is satisfied through external purchases. In recent years, especially influenced by mismatch between supply and demand of crude oil, geopolitics, global economic growth and other factors, the prices of crude oil fluctuate sharply. Additionally, the supply of crude oil may even be interrupted due to some extreme major incidents in certain regions. Although the Company has taken flexible countermeasures, it may not fully avoid risks associated with any significant fluctuation of international crude oil prices and sudden disruption of supply of crude oil from certain regions.
Risks with regard to the operation and natural disasters: The process of petroleum chemical production is exposed to the high risks of inflammation, explosion, toxicity, harm and environmental pollution and is vulnerable to extreme natural disasters. Such emergencies may cause serious impacts to the society, financial losses to the Company and grievous injuries to people. The Company has always been laying great emphasis on the safety production, and has implemented a strict HSE management system as an effort to avoid such risks as far as possible. Meanwhile, the main assets and inventories of the Company as well as the possibility of damage to a third party have been insured. However, such measures may not shield the Company from financial losses or adverse impact resulting from such emergencies.
Investment risks: Petroleum and chemical sector is a capital-intensive industry. Although the Company has adopted a prudent investment strategy, refined the investment management rules, developed negative investment lists, conducted rigorous feasibility study and risk evaluation on each investment project, and organized special verifications in raw material market, technical scheme, profitability, safety and environmental protection, legal compliance,etc on major structural adjustment and layout projects to ensure making decision rigorously and scientifically, certain investment risks will still exist due to major changes in factors such as market environment, industrial policies, prices of commodities, and others during the implementation of the projects.
Risks with regard to overseas business development and management: The Company engages in oil and gas exploration, refining and chemical, warehouse logistics and international trading businesses in some regions and countries overseas. The Company’s overseas businesses and assets are subject to the jurisdiction of the host country’s laws and regulations. In light of the complicated factors such as changes in international geopolitics, uncertainty of economic recovery, imbalance of global economy, competitiveness of industry and trade structure, exclusiveness of regional trading blocs, polarisation of benefits distribution in trade, and politicisation of economic and trade issues, and political, economic, social, safety, legal, environmental and other risks in the country where overseas business and other assets are located, including sanctions, barriers to entry, instability in the financial and taxation policies, contract defaults, tax dispute, the Company’s risks with regard to overseas business development and management could be increased.
Currency risks: At present, China implements an administered floating exchange rate regime based on market supply and demand which is regulated with reference to a basket of currencies in terms of the exchange rate of Renminbi. As the Company purchases a significant portion of crude oil in foreign currency which is based on US dollar-denominated prices, the realized price of crude oil is based on international crude oil price. Despite the fact that the price of the domestic refined oil products will change as the exchange rate of the Renminbi changes according to the pricing mechanism for the domestic refined oil products, and the price of other domestic petrochemical products will also be influenced by the price of the imported products, which to a large extent, smooths the impact of the Renminbi exchange rate on the processing and sales of the Company’s crude oil refined products., the fluctuation of the Renminbi exchange rate will still have an effect on the income of the upstream sector.
Cyber-security risks: The Company has a well-established network safety system. The Company establishes an emergency response mechanism in relation to network security operation and information system, builds an information platform of network security risk management and control, operated by a professional network security team, and devotes significant resources to protecting the digital infrastructure and data of the Company against cyber-attacks. However, continuous attention should be paid to the coverage and efficiency of these protection measures. If our systems against cyber-security risk are proved to be insufficient or ineffective, the Company could be adversely affected by, among other things, disruptions to our business operations, and loss of key information, thus causing harm to our personnel, property, environment and reputation. As cyber-security attacks continue to evolve, the Company may be required to expend additional resources to enhance our protective measures against cyber-security breaches, in particular increase investment in new solutions and technologies such as data security solution, business security solution, cloud computing, and Internet of Things devices to improve the cyber-security protection level.
35
CHANGES IN SHARE CAPITAL AND SHAREHOLDINGS OF SHAREHOLDERS
| 1 | CHANGES IN THE SHARE CAPITAL |
During the reporting period, there was no change in the number and nature of issued shares of Sinopec Corp.
| 2 | NUMBER OF SHAREHOLDERS AND THEIR SHAREHOLDINGS |
As at 30 June 2023, there were a total of 390,997 shareholders of Sinopec Corp., of which 385,501 were holders of A shares and 5,496 were holders of H shares. Sinopec Corp. has complied with requirement for minimum public float under the Hong Kong Listing Rules.
| (1) | Top ten shareholders as of 30 June 2023 |
Unit: share
| Name of Shareholders | Nature of shareholders | Percentage of shareholdings % | Total number of shares held | Changes of shareholding1 | Number of shares subject to pledges or lock up |
| China Petrochemical Corporation | State-owned share | 67.20 | 80,572,167,393 | 0 | 0 |
HKSCC (Nominees) Limited2 | H share | 20.55 | 24,633,035,260 | (1,864,038) | unknown |
| 中國證券金融股份有限公司 | A share | 1.94 | 2,325,374,407 | 0 | 0 |
| 中國石油天然氣集團有限公司 | A share | 1.81 | 2,165,749,530 | 0 | 0 |
| 香港中央結算有限公司 | A share | 1.28 | 1,538,928,622 | 393,128,596 | 0 |
中國人壽保險股份有限公司-傳統-普通保險產品-005L-CT001滬 | A share | 0.31 | 376,757,357 | (68,862,585) | 0 |
| 中央匯金資產管理有限責任公司 | A share | 0.26 | 315,223,600 | 0 | 0 |
| 國信證券股份有限公司 | A share | 0.20 | 235,735,354 | 583,430 | 0 |
中國工商銀行-上證50交易型開放式指數證券投資基金 | A share | 0.14 | 163,324,476 | 48,764,600 | 0 |
| 招商銀行股份有限公司-上證紅利交易型開放式指數證券投資基金 | A share | 0.11 | 128,251,942 | 41,861,939 | 0 |
| Note 1: | As compared with the number of shares as at 31 December 2022. |
| Note 2: | Century Bright, a wholly-owned overseas subsidiary of China Petrochemical Corporation, holds 767,916,000 H shares, accounting for 0.64% of the total share capital of Sinopec Corp. Such shareholdings are included in the total number of shares held by HKSCC (Nominees) Limited. |
Statement on the connected relationship or acting in concert among the aforementioned shareholders:
Sinopec Corp. is not aware of any connected relationship or acting in concert among or between the above-mentioned top ten shareholders.
| (2) | Information disclosed by the holders of H shares in accordance with the SFO as of 30 June 2023 |
| Name of shareholders | Status of shareholders | Number of shares interests held or regarded as held | Approximate percentage of Sinopec Corp.’s issued share capital (H share) (%) |
| BlackRock, Inc. | Interests of corporation controlled by the substantial shareholder | 1,474,106,062(L) | 5.95(L) |
| Citigroup Inc. | Interests of corporation controlled by the substantial shareholder | 122,185,396 (L) 72,079,165 (S) | 0.49(L) 0.29(S) |
| Approved lending agent | 1,170,429,112 (L) | 4.72(L) | |
| Brown Brothers Harriman & Co. | Approved lending agent | 1,243,017,907(L) | 5.02(L) |
Note: (L) Long position, (S) Short position
| 3 | CHANGES IN THE CONTROLLING SHAREHOLDERS AND THE DE FACTO CONTROLLER |
There was no change in the controlling shareholder or the de facto controller of Sinopec Corp. during the reporting period.
36
BOND GENERAL INFORMATION
NON-FINANCIAL ENTERPRISE DEBT FINANCING INSTRUMENTS IN INTER-BANK BOND MARKET
| Bond name | The first medium-term notes in 2021 | The second medium-term notes in 2021 | The first green medium-term notes in 2021 |
| Abbreviation | 21中石化MTN001 | 21中石化MTN002 | 21中石化GN001 |
| Code | 102101386 | 102101480 | 132100172 |
| Issuance date | 2021/7/23 | 2021/8/5 | 2021/12/27 |
| Interest commencement date | 2021/7/27 | 2021/8/6 | 2021/12/28 |
| Maturity date | 2026/7/27 | 2024/8/6 | 2024/12/28 |
| Amount issued (RMB billion) | 5 | 2 | 2.55 |
| Outstanding balance (RMB billion) | 5 | 2 | 2.55 |
| Interest rate (%) | 3.2 | 2.95 | 2.5 |
| Principal and interest repayment | Interest shall be paid once a year. The principal shall be paid at maturity with last instalment of interest. | ||
| Investor qualification arrangement | Nationwide inter-bank bond market institutional investors. | ||
| Applicable trading mechanism | Circulated and transferred in nationwide inter-bank bond market. | ||
| Risk of suspension for listed trading(if any), and countermeasures | Not applicable | ||
| Trading market | Nationwide inter-bank bond market. | ||
| Use of proceeds | Proceeds from the above-mentioned corporate bonds have been used for their designated purpose as disclosed in the corporate bond prospectus. All the proceeds have been completely used. | ||
| Credit rating | — | ||
| Special terms for Issuer or investoroption or investor protection,whether triggered or executed | Not applicable | ||
| Guarantee, repayment scheme andother related events during the reporting period | No guarantee. Interest was paid as usual during the reporting period without triggering any guarantee. | ||
| Convening of corporate bondholders’ meeting | Not applicable | ||
| Performance of corporate bonds trustee | Corporate bonds trustee has performed its duties in accordance with regulatory requirements. | ||
37
Principal financial data and financial indicators at the end of reporting period
| Principal data | At the end of the reporting period | At the end of last year | Change | Reason for change |
| Current ratio | 0.86 | 0.78 | 0.08 | Increase in inventories. |
| Quick ratio | 0.44 | 0.42 | 0.02 | Increase in quick assets. |
| Liability-to-asset ratio | 53.16% | 51.80% | 1.36 percentage points | Increase in loans. |
| Loan repayment rate | 100% | 100% | - | - |
The reporting period for 2023 (January-June) | The reporting period for 2022 (January-June) | Change | Reason for change | |
| Net profit attributable to equityshareholders of the Companyexcluding extraordinary gains andlosses (RMB Million) | 33,655 | 43,350 | (9,695) | Decrease in profit of refining and chemical businesses because of the drop in crude oil price and weak demand for refined and chemical products. |
| Net profit excluding extraordinarygains and losses (RMB Million) | 38,705 | 49,208 | (10,503) | Decrease in profit of refining and chemical businesses because of the drop in crude oil price and weak demand for refined and chemical products. |
| EBITDA-to-total debt ratio | 0.34 | 0.56 | (0.22) | Decrease in profit before taxation. |
| EBITDA-to-interest coverage ratio | 11.63 | 14.47 | (2.84) | Decrease in profit before taxation. |
| Interest coverage ratio | 6.48 | 8.80 | (2.32) | Decrease in profit before taxation. |
| Cash interest coverage ratio | 9.81 | 5.84 | 3.97 | Net cash flow from operating activities increased year-on-year. |
| Interest payment rate | 100% | 100% | - | - |
Note: Liability-to-asset ratio = total liability/total assets
During the reporting period, the Company paid in full the interests accrued for other bonds and debt financing instruments. As of 30 June 2023, the standby credit line provided by several domestic financial institutions to the Company was RMB488.209 billion in total, facilitating the Company to get such amount of unsecured loans. The Company has fulfilled all the relevant undertakings in the offering circular of corporate bonds and had no significant matters which could affect the Company’s operation and solvency.
On 18 April 2013, Sinopec Capital (2013) Limited, a wholly-owned overseas subsidiary of Sinopec Corp., issued senior notes guaranteed by the Company with four different maturities, namely 3 years, 5 years, 10 years and 30 years. The 3-year notes principal totalled USD750 million, with an annual interest rate of 1.250% and had been repaid and delisted; the 5-year notes principal totalled USD1.0 billion, with an annual interest rate of 1.875% and had been repaid and delisted; the 10-year notes principal totalled USD1.25 billion, with an annual interest rate of 3.125% and had been repaid and delisted; and the 30-year notes principal totalled USD500 million, with an annual interest rate of 4.250%. These notes were listed on the Hong Kong Stock Exchange on 25 April 2013, with interest payable semi-annually. The first payment of interest was made on 24 October 2013. During the reporting period, the Company has paid in full the current-period interests of 30-year notes, and has repaid the principal and interests of 10-year notes.
38
REVIEW REPORT
To the Shareholders of China Petroleum & Chemical Corporation,
We have reviewed the accompanying interim financial statements of China Petroleum & Chemical Corporation (“Sinopec Corp.”), which comprise the consolidated and company balance sheets as of 30 June 2023, and the consolidated and company income statements, the consolidated and company cash flow statements and the consolidated and company statements of changes in shareholders’ equity for the period from 1 January 2023 to 30 June 2023, and the notes to the financial statements. Management of Sinopec Corp. is responsible for the preparation of these interim financial statements. Our responsibility is to issue a report on these interim financial statements based on our review.
We conducted our review in accordance with China Standard on Review No. 2101—Engagements to Review Financial Statements. This standard requires that we plan and perform the review to obtain limited assurance as to whether the financial statements are free of material misstatement. A review is limited primarily to inquiries of company personnel and analytical procedures applied to financial data and thus provides less assurance than an audit. We have not performed an audit and, accordingly, we do not express an audit opinion.
Based on our review, nothing has come to our attention that causes us to believe that the interim financial statements of Sinopec Corp. are not prepared in accordance with the requirements of Accounting Standards for Business Enterprises (“CASs”), and do not present fairly, in all material respects, the consolidated and the company’s financial position of Sinopec Corp. as at 30 June 2023, and the consolidated and the company’s financial performance and cash flows for the period from 1 January 2023 to 30 June 2023.
| KPMG Huazhen LLP | Certified Public Accountants |
| Registered in the People’s Republic of China | |
Yang Jie (Engagement Partner) | |
| Beijing, China | He Shu |
| 25 August 2023 |
39
| (A) | FINANCIAL STATEMENTS PREPARED UNDER CHINA ACCOUNTING STANDARDS FOR BUSINESS ENTERPRISES |
UNAUDITED CONSOLIDATED BALANCE SHEET
As at 30 June 2023
| Note | At 30 June | At 31 December | |
| 2023 | 2022 | ||
| RMB million | RMB million | ||
| Assets | |||
| Current assets | |||
| Cash at bank and on hand | 5 | 151,348 | 145,052 |
| Financial assets held for trading | 3 | 2 | |
| Derivative financial assets | 6 | 8,500 | 19,335 |
| Accounts receivable | 7 | 73,399 | 46,364 |
| Receivables financing | 8 | 4,294 | 3,507 |
| Prepayments | 9 | 9,484 | 7,956 |
| Other receivables | 10 | 22,485 | 27,009 |
| Inventories | 11 | 281,696 | 244,241 |
| Other current assets | 22,782 | 29,674 | |
| Total current assets | 573,991 | 523,140 | |
| Non-current assets | |||
| Long-term equity investments | 12 | 231,561 | 233,941 |
| Other equity instrument investments | 682 | 730 | |
| Fixed assets | 13 | 634,590 | 630,758 |
| Construction in progress | 14 | 215,484 | 196,045 |
| Right-of-use assets | 15 | 177,082 | 178,359 |
| Intangible assets | 16 | 121,236 | 120,694 |
| Goodwill | 17 | 6,495 | 6,464 |
| Long-term deferred expenses | 18 | 11,910 | 12,034 |
| Deferred tax assets | 19 | 19,867 | 22,433 |
| Other non-current assets | 20 | 34,004 | 26,523 |
| Total non-current assets | 1,452,911 | 1,427,981 | |
| Total assets | 2,026,902 | 1,951,121 | |
| Liabilities and shareholders’ equity | |||
| Current liabilities | |||
| Short-term loans | 22 | 99,132 | 21,313 |
| Derivative financial liabilities | 6 | 6,458 | 7,313 |
| Bills payable | 23 | 13,342 | 10,782 |
| Accounts payable | 24 | 244,915 | 258,642 |
| Contract liabilities | 25 | 124,359 | 125,444 |
| Employee benefits payable | 26 | 22,181 | 13,617 |
| Taxes payable | 27 | 31,060 | 28,379 |
| Other payables | 28 | 84,435 | 119,892 |
| Non-current liabilities due within one year | 29 | 27,924 | 62,844 |
| Other current liabilities | 30 | 14,753 | 19,159 |
| Total current liabilities | 668,559 | 667,385 | |
| Non-current liabilities | |||
| Long-term loans | 31 | 160,017 | 94,964 |
| Debentures payable | 32 | 13,130 | 12,997 |
| Lease liabilities | 33 | 165,367 | 166,407 |
| Provisions | 34 | 48,640 | 47,587 |
| Deferred tax liabilities | 19 | 7,786 | 7,256 |
| Other non-current liabilities | 35 | 13,922 | 14,068 |
| Total non-current liabilities | 408,862 | 343,279 | |
| Total liabilities | 1,077,421 | 1,010,664 | |
| Shareholders’ equity | |||
| Share capital | 36 | 119,896 | 119,896 |
| Capital reserve | 37 | 118,730 | 118,875 |
| Other comprehensive income | 38 | (1,405) | 3,072 |
| Specific reserve | 3,797 | 2,813 | |
| Surplus reserves | 39 | 218,009 | 218,009 |
| Retained earnings | 337,535 | 325,806 | |
| Total equity attributable to shareholders of the Company | 796,562 | 788,471 | |
| Non-controlling interests | 152,919 | 151,986 | |
| Total shareholders’ equity | 949,481 | 940,457 | |
| Total liabilities and shareholders’ equity | 2,026,902 | 1,951,121 |
These financial statements have been approved for issue by the board of directors on 25 August 2023.
| Ma Yongsheng | Yu Baocai | Shou Donghua |
| Chairman | President | Chief Financial Officer |
| (Legal representative) |
The accompanying notes form part of these financial statements.
40
UNAUDITED BALANCE SHEET
As at 30 June 2023
| Note | At 30 June | At 31 December | |
| 2023 | 2022 | ||
| RMB million | RMB million | ||
| Assets | |||
| Current assets | |||
| Cash at bank and on hand | 55,954 | 54,578 | |
| Financial assets held for trading | 3 | 2 | |
| Derivative financial assets | 466 | 3,892 | |
| Accounts receivable | 7 | 27,450 | 33,841 |
| Receivables financing | 1,226 | 703 | |
| Prepayments | 9 | 3,255 | 4,461 |
| Other receivables | 10 | 47,709 | 38,517 |
| Inventories | 87,430 | 70,376 | |
| Other current assets | 29,552 | 21,260 | |
| Total current assets | 253,045 | 227,630 | |
| Non-current assets | |||
| Long-term equity investments | 12 | 391,040 | 382,879 |
| Other equity instrument investments | 201 | 201 | |
| Fixed assets | 13 | 292,791 | 296,530 |
| Construction in progress | 14 | 89,920 | 81,501 |
| Right-of-use assets | 15 | 90,245 | 91,549 |
| Intangible assets | 8,381 | 8,095 | |
| Long-term deferred expenses | 4,053 | 4,183 | |
| Deferred tax assets | 6,703 | 9,487 | |
| Other non-current assets | 47,540 | 41,365 | |
| Total non-current assets | 930,874 | 915,790 | |
| Total assets | 1,183,919 | 1,143,420 | |
| Liabilities and shareholders’ equity | |||
| Current liabilities | |||
| Short-term loans | 68,900 | 4,010 | |
| Derivative financial liabilities | 2,296 | 4,299 | |
| Bills payable | 4,701 | 4,038 | |
| Accounts payable | 103,050 | 107,105 | |
| Contract liabilities | 8,131 | 9,769 | |
| Employee benefits payable | 13,569 | 8,467 | |
| Taxes payable | 15,342 | 12,044 | |
| Other payables | 195,993 | 247,480 | |
| Non-current liabilities due within one year | 10,999 | 39,990 | |
| Other current liabilities | 1,375 | 1,002 | |
| Total current liabilities | 424,356 | 438,204 | |
| Non-current liabilities | |||
| Long-term loans | 107,611 | 56,755 | |
| Debentures payable | 9,539 | 9,537 | |
| Lease liabilities | 91,007 | 91,878 | |
| Provisions | 39,211 | 38,298 | |
| Other non-current liabilities | 2,012 | 2,121 | |
| Total non-current liabilities | 249,380 | 198,589 | |
| Total liabilities | 673,736 | 636,793 | |
| Shareholders’ equity | |||
| Share capital | 119,896 | 119,896 | |
| Capital reserve | 63,447 | 63,628 | |
| Other comprehensive income | (1,643) | 827 | |
| Specific reserve | 2,287 | 1,745 | |
| Surplus reserves | 218,009 | 218,009 | |
| Retained earnings | 108,187 | 102,522 | |
| Total shareholders’ equity | 510,183 | 506,627 | |
| Total liabilities and shareholders’ equity | 1,183,919 | 1,143,420 |
These financial statements have been approved for issue by the board of directors on 25 August 2023.
| Ma Yongsheng | Yu Baocai | Shou Donghua |
| Chairman | President | Chief Financial Officer |
| (Legal representative) |
The accompanying notes form part of these financial statements.
41
UNAUDITED CONSOLIDATED INCOME STATEMENT
For the six-month period ended 30 June 2023
| Note | Six-month period ended 30 June | ||
| 2023 | 2022 | ||
| RMB million | RMB million | ||
| Operating income | 40 | 1,593,682 | 1,612,126 |
| Less: Operating costs | 40 | 1,351,561 | 1,330,825 |
| Taxes and surcharges | 41 | 127,261 | 134,409 |
| Selling and distribution expenses | 44 | 29,174 | 28,130 |
| General and administrative expenses | 45 | 27,487 | 26,183 |
| Research and development expenses | 46 | 5,992 | 6,310 |
| Financial expenses | 42 | 4,790 | 5,337 |
| Including: Interest expenses | 9,049 | 8,124 | |
| Interest income | 3,239 | 3,012 | |
| Exploration expenses, including dry holes | 47 | 4,882 | 5,738 |
| Add: Other income | 48 | 4,896 | 2,121 |
| Investment income/(loss) | 49 | 3,291 | (10,307) |
| Including: Income from investment in associates and joint ventures | 2,611 | 7,327 | |
| Gains/(losses) from changes in fair value | 50 | 1,475 | (1,558) |
| Credit impairment (losses)/reversals | (35) | 72 | |
| Impairment losses | 51 | (2,365) | (1,456) |
| Asset disposal gains | 869 | 135 | |
| Operating profit | 50,666 | 64,201 | |
| Add: Non-operating income | 52 | 940 | 855 |
| Less: Non-operating expenses | 53 | 960 | 1,079 |
| Profit before taxation | 50,646 | 63,977 | |
| Less: Income tax expense | 54 | 10,170 | 14,033 |
| Net profit | 40,476 | 49,944 | |
| Classification by continuity of operations: | |||
| Net profit from continuing operations | 40,476 | 49,944 | |
| Net profit from discontinued operations | – | – | |
| Classification by ownership: | |||
| Shareholders of the Company | 35,111 | 43,920 | |
| Non-controlling interests | 5,365 | 6,024 | |
| Basic earnings per share (RMB/share) | 64 | 0.293 | 0.363 |
| Diluted earnings per share (RMB/share) | 64 | 0.293 | 0.363 |
| Other comprehensive income | 38 | ||
| (1) Other comprehensive income (net of tax) attributable to shareholders of the Company | (3,454) | 16,033 | |
| Items that will not be reclassified to profit or loss | |||
| Changes in fair value of other equity instrument investments | (1) | (13) | |
| Items that may be reclassified subsequently to profit or loss | |||
| Other comprehensive income that can be reclassified to profit or loss under the equity method | (4,210) | 3,514 | |
| Cost of hedging reserve | – | (422) | |
| Cash flow hedges | (2,688) | 9,671 | |
| Foreign currency translation differences | 3,445 | 3,283 | |
| (2) Other comprehensive income (net of tax) attributable to non-controlling interests | (1,640) | 674 | |
| Total other comprehensive income net of tax | (5,094) | 16,707 | |
| Total comprehensive income | 35,382 | 66,651 | |
| Attributable to: | |||
| Shareholders of the Company | 31,657 | 59,953 | |
| Non-controlling interests | 3,725 | 6,698 | |
These financial statements have been approved for issue by the board of directors on 25 August 2023.
| Ma Yongsheng | Yu Baocai | Shou Donghua |
| Chairman | President | Chief Financial Officer |
| (Legal representative) |
The accompanying notes form part of these financial statements.
42
UNAUDITED INCOME STATEMENT
For the six-month period ended 30 June 2023
| Note | Six-month period ended 30 June | ||
| 2023 | 2022 | ||
| RMB million | RMB million | ||
| Operating income | 40 | 587,285 | 650,430 |
| Less: Operating costs | 40 | 473,949 | 521,323 |
| Taxes and surcharges | 77,502 | 86,457 | |
| Selling and distribution expenses | 773 | 1,215 | |
| General and administrative expenses | 11,691 | 11,665 | |
| Research and development expenses | 5,117 | 5,843 | |
| Financial expenses | 5,666 | 4,995 | |
| Including: Interest expenses | 18,986 | 6,793 | |
| Interest income | 8,662 | 1,736 | |
| Exploration expenses, including dry holes | 4,091 | 4,794 | |
| Add: Other income | 3,908 | 1,445 | |
| Investment income | 49 | 19,381 | 17,300 |
| Including: Income from investment in associates and joint ventures | 2,531 | 3,014 | |
| Gains from changes in fair value | 182 | 241 | |
| Credit impairment losses | (8) | (1) | |
| Impairment losses | (1,389) | (736) | |
| Asset disposal gains | 713 | 121 | |
| Operating profit | 31,283 | 32,508 | |
| Add: Non-operating income | 277 | 181 | |
| Less: Non-operating expenses | 482 | 671 | |
| Profit before taxation | 31,078 | 32,018 | |
| Less: Income tax expense | 2,033 | 4,249 | |
| Net profit | 29,045 | 27,769 | |
| Classification by continuity of operations: | |||
| Net profit from continuing operations | 29,045 | 27,769 | |
| Net profit from discontinued operations | – | – | |
| Other comprehensive income | |||
| Items that will not be reclassified subsequently to profit or loss | |||
| Changes in fair value of other equity instrument investments | – | (5) | |
| Items that may be reclassified subsequently to profit or loss | |||
| Other comprehensive income that can be reclassified to profit or loss under the equity method | (50) | 139 | |
| Cash flow hedges | (1,870) | 4,622 | |
| Total other comprehensive income net of tax | (1,920) | 4,756 | |
| Total comprehensive income | 27,125 | 32,525 | |
These financial statements have been approved for issue by the board of directors on 25 August 2023.
| Ma Yongsheng | Yu Baocai | Shou Donghua |
| Chairman | President | Chief Financial Officer |
| (Legal representative) |
The accompanying notes form part of these financial statements.
43
UNAUDITED CONSOLIDATED CASH FLOW STATEMENT
For the six-month period ended 30 June 2023
| Note | Six-month period ended 30 June | ||
| 2023 | 2022 | ||
| RMB million | RMB million | ||
| Cash flows from operating activities: | |||
| Cash received from sale of goods and rendering of services | 1,683,597 | 1,704,813 | |
| Refund of taxes and levies | 5,978 | 3,442 | |
| Other cash received relating to operating activities | 84,423 | 128,034 | |
| Sub-total of cash inflows | 1,773,998 | 1,836,289 | |
| Cash paid for goods and services | (1,430,242) | (1,420,335) | |
| Cash paid to and for employees | (42,437) | (40,058) | |
| Payments of taxes and levies | (150,683) | (211,115) | |
| Other cash paid relating to operating activities | (123,074) | (159,834) | |
| Sub-total of cash outflows | (1,746,436) | (1,831,342) | |
| Net cash flow from operating activities | 56(a) | 27,562 | 4,947 |
| Cash flows from investing activities: | |||
| Cash received from disposal of investments | 391 | 442 | |
| Cash received from returns on investments | 2,969 | 4,345 | |
| Net cash received from disposal of fixed assets, intangible assets and other long-term assets | 3,584 | 107 | |
| Net cash received from disposal of subsidiaries and other business entities | – | 1 | |
| Other cash received relating to investing activities | 41,454 | 37,189 | |
| Sub-total of cash inflows | 48,398 | 42,084 | |
| Cash paid for acquisition of fixed assets, intangible assets and other long-term assets | (87,581) | (63,023) | |
| Cash paid for acquisition of investments | (2,741) | (6,027) | |
| Net cash paid for the acquisition of subsidiaries and other business entities | – | (7,628) | |
| Other cash paid relating to investing activities | (51,506) | (16,544) | |
| Sub-total of cash outflows | (141,828) | (93,222) | |
| Net cash flow from investing activities | (93,430) | (51,138) | |
| Cash flows from financing activities: | |||
| Cash received from capital contributions | 279 | 987 | |
| Including: Cash received from non-controlling shareholders’ capital contributions to subsidiaries | 279 | 987 | |
| Cash received from borrowings | 365,988 | 348,900 | |
| Other cash received relating to financing activities | 56 | 32 | |
| Sub-total of cash inflows | 366,323 | 349,919 | |
| Cash repayments of borrowings | (259,716) | (224,161) | |
| Cash paid for dividends, profits distribution or interest | (29,860) | (41,606) | |
| Including: Subsidiaries’ cash payments for distribution of dividends or profits to non-controlling shareholders | (2,830) | (1,088) | |
| Other cash paid relating to financing activities | 56(d) | (9,886) | (8,940) |
| Sub-total of cash outflows | (299,462) | (274,707) | |
| Net cash flow from financing activities | 66,861 | 75,212 | |
| Effects of changes in foreign exchange rate | 443 | 1,567 | |
| Net increase in cash and cash equivalents | 56(b) | 1,436 | 30,588 |
| Add: Cash and cash equivalents at the beginning of the year | 93,438 | 108,590 | |
| Cash and cash equivalents at the end of the period | 56(c) | 94,874 | 139,178 |
These financial statements have been approved for issue by the board of directors on 25 August 2023.
| Ma Yongsheng | Yu Baocai | Shou Donghua |
| Chairman | President | Chief Financial Officer |
| (Legal representative) |
The accompanying notes form part of these financial statements.
44
UNAUDITED CASH FLOW STATEMENT
For the six-month period ended 30 June 2023
| Note | Six-month period ended 30 June | ||
| 2023 | 2022 | ||
| RMB million | RMB million | ||
| Cash flows from operating activities: | |||
| Cash received from sale of goods and rendering of services | 650,715 | 719,791 | |
| Refund of taxes and levies | 4,464 | 2,374 | |
| Other cash received relating to operating activities | 22,012 | 9,561 | |
| Sub-total of cash inflows | 677,191 | 731,726 | |
| Cash paid for goods and services | (495,163) | (541,234) | |
| Cash paid to and for employees | (20,978) | (20,623) | |
| Payments of taxes and levies | (77,260) | (122,524) | |
| Other cash paid relating to operating activities | (38,805) | (34,763) | |
| Sub-total of cash outflows | (632,206) | (719,144) | |
| Net cash flow from operating activities | 44,985 | 12,582 | |
| Cash flows from investing activities: | |||
| Cash received from disposal of investments | 4,123 | 3,334 | |
| Cash received from returns on investments | 9,490 | 15,739 | |
| Net cash received from disposal of fixed assets, intangible assets and other long-term assets | 139 | 25 | |
| Other cash received relating to investing activities | 33,819 | 85,079 | |
| Sub-total of cash inflows | 47,571 | 104,177 | |
| Cash paid for acquisition of fixed assets, intangible assets and other long-term assets | (37,344) | (27,989) | |
| Cash paid for acquisition of investments | (17,139) | (10,920) | |
| Net cash paid for the acquisition of subsidiaries and other business entities | – | (4,221) | |
| Other cash paid relating to investing activities | (42,270) | (98,036) | |
| Sub-total of cash outflows | (96,753) | (141,166) | |
| Net cash flow from investing activities | (49,182) | (36,989) | |
| Cash flows from financing activities: | |||
| Cash received from borrowings | 137,604 | 184,910 | |
| Other cash received relating to financing activities | 100,198 | 186,614 | |
| Sub-total of cash inflows | 237,802 | 371,524 | |
| Cash repayments of borrowings | (51,254) | (87,141) | |
| Cash paid for dividends or interest | (27,029) | (41,593) | |
| Other cash paid relating to financing activities | (133,014) | (196,723) | |
| Sub-total of cash outflows | (211,297) | (325,457) | |
| Net cash flow from financing activities | 26,505 | 46,067 | |
| Effects of changes in foreign exchange rate | 68 | 4 | |
| Net increase in cash and cash equivalents | 22,376 | 21,664 | |
| Add: Cash and cash equivalents at the beginning of the year | 23,228 | 34,575 | |
| Cash and cash equivalents at the end of the period | 45,604 | 56,239 | |
These financial statements have been approved for issue by the board of directors on 25 August 2023.
| Ma Yongsheng | Yu Baocai | Shou Donghua |
| Chairman | President | Chief Financial Officer |
| (Legal representative) |
The accompanying notes form part of these financial statements.
45
UNAUDITED CONSOLIDATED STATEMENT OF CHANGES IN EQUITY
For the six-month period ended 30 June 2023
| Share capital | Capital reserve | Other comprehensive income | Specific reserve | Surplus reserves | Retained earnings | Total shareholders’ equity attributable to equity shareholders of the Company | Non- controlling interests | Total shareholders’ equity | |
| RMB million | RMB million | RMB million | RMB million | RMB million | RMB million | RMB million | RMB million | RMB million | |
| Balance at 31 December 2021 | 121,071 | 120,188 | (690) | 2,664 | 213,224 | 318,645 | 775,102 | 140,939 | 916,041 |
| Add: Changes in accounting policies (Note 3(26)) | – | – | – | – | 122 | 1,992 | 2,114 | 334 | 2,448 |
| Balance at 1 January 2022 | 121,071 | 120,188 | (690) | 2,664 | 213,346 | 320,637 | 777,216 | 141,273 | 918,489 |
| Change for the period | |||||||||
| 1. Net profit | – | – | – | – | – | 43,920 | 43,920 | 6,024 | 49,944 |
| 2. Other comprehensive income (Note 38) | – | – | 16,033 | – | – | – | 16,033 | 674 | 16,707 |
| Total comprehensive income | – | – | 16,033 | – | – | 43,920 | 59,953 | 6,698 | 66,651 |
| Amounts transferred to initial carrying amount of hedged items | – | – | (8,786) | – | – | – | (8,786) | (430) | (9,216) |
| Transactions with owners, recorded directly in shareholders’ equity: | |||||||||
| 3. Appropriations of profits: | |||||||||
| – Distributions to shareholders (Note 55) | – | – | – | – | – | (37,532) | (37,532) | – | (37,532) |
| 4. Contributions to subsidiaries from non-controlling interests | – | – | – | – | – | – | – | 1,420 | 1,420 |
| 5. Return of capital to non-controlling interests | – | – | – | – | – | – | – | (1,713) | (1,713) |
| 6. Distributions to non-controlling interests | – | – | – | – | – | – | – | (2,337) | (2,337) |
| Total transactions with owners, recorded directly in shareholders’ equity | – | – | – | – | – | (37,532) | (37,532) | (2,630) | (40,162) |
| 7. Net increase in specific reserve for the period | – | – | – | 902 | – | – | 902 | 141 | 1,043 |
| 8. Other equity movements under the equity method | – | (2,102) | – | – | – | – | (2,102) | – | (2,102) |
| 9. Others | – | 3 | – | – | – | (16) | (13) | (142) | (155) |
| Balance at 30 June 2022 | 121,071 | 118,089 | 6,557 | 3,566 | 213,346 | 327,009 | 789,638 | 144,910 | 934,548 |
| Balance at 31 December 2022 | 119,896 | 118,875 | 3,072 | 2,813 | 217,834 | 323,087 | 785,577 | 151,576 | 937,153 |
| Add: Changes in accounting policies (Note 3(26)) | – | – | – | – | 175 | 2,719 | 2,894 | 410 | 3,304 |
| Balance at 1 January 2023 | 119,896 | 118,875 | 3,072 | 2,813 | 218,009 | 325,806 | 788,471 | 151,986 | 940,457 |
| Change for the period | |||||||||
| 1. Net profit | – | – | – | – | – | 35,111 | 35,111 | 5,365 | 40,476 |
| 2. Other comprehensive income (Note 38) | – | – | (3,454) | – | – | – | (3,454) | (1,640) | (5,094) |
| Total comprehensive income | – | – | (3,454) | – | – | 35,111 | 31,657 | 3,725 | 35,382 |
| Amounts transferred to initial carrying amount of hedged items | – | – | (1,023) | – | – | – | (1,023) | (13) | (1,036) |
| Transactions with owners, recorded directly in shareholders’ equity: | |||||||||
| 3. Appropriations of profits: | |||||||||
| – Distributions to shareholders (Note 55) | – | – | – | – | – | (23,380) | (23,380) | – | (23,380) |
| 4. Contributions to subsidiaries from non-controlling interests | – | – | – | – | – | – | – | 472 | 472 |
| 5. Transactions with non-controlling interests | – | (5) | – | – | – | – | (5) | (158) | (163) |
| 6. Distributions to non-controlling interests | – | – | – | – | – | – | – | (3,185) | (3,185) |
| Total transactions with owners, recorded directly in shareholders’ equity | – | (5) | – | – | – | (23,380) | (23,385) | (2,871) | (26,256) |
| 7. Net increase in specific reserve for the period | – | – | – | 984 | – | – | 984 | 107 | 1,091 |
| 8. Other equity movements under the equity method | – | (171) | – | – | – | – | (171) | – | (171) |
| 9. Others | – | 31 | – | – | – | (2) | 29 | (15) | 14 |
| Balance at 30 June 2023 | 119,896 | 118,730 | (1,405) | 3,797 | 218,009 | 337,535 | 796,562 | 152,919 | 949,481 |
These financial statements have been approved for issue by the board of directors on 25 August 2023.
| Ma Yongsheng | Yu Baocai | Shou Donghua |
| Chairman | President | Chief Financial Officer |
| (Legal representative) |
The accompanying notes form part of these financial statements.
46
UNAUDITED STATEMENT OF CHANGES IN EQUITY
For the six-month period ended 30 June 2023
| Share capital | Capital reserve | Other comprehensive income | Specific reserve | Surplus reserves | Retained earnings | Total shareholders’ equity | |
| RMB million | RMB million | RMB million | RMB million | RMB million | RMB million | RMB million | |
| Balance at 31 December 2021 | 121,071 | 67,897 | 6,024 | 1,658 | 213,224 | 116,440 | 526,314 |
| Add: Changes in accounting policies (Note 3(26)) | – | – | – | – | 122 | 1,095 | 1,217 |
| Balance at 1 January 2022 | 121,071 | 67,897 | 6,024 | 1,658 | 213,346 | 117,535 | 527,531 |
| Change for the period | |||||||
| 1. Net profit | – | – | – | – | – | 27,769 | 27,769 |
| 2. Other comprehensive income | – | – | 4,756 | – | – | – | 4,756 |
| Total comprehensive income | – | – | 4,756 | – | – | 27,769 | 32,525 |
| Amounts transferred to initial carrying amount of hedged items | – | – | (4,511) | – | – | – | (4,511) |
| Transactions with owners, recorded directly in shareholders’ equity: | |||||||
| 3. Appropriations of profits: | |||||||
| – Distributions to shareholders (Note 55) | – | – | – | – | – | (37,532) | (37,532) |
| Total transactions with owners, recorded directly in shareholders’ equity | – | – | – | – | – | (37,532) | (37,532) |
| 4. Net increase in specific reserve for the period | – | – | – | 376 | – | – | 376 |
| 5. Other equity movements under the equity method | – | (1,437) | – | – | – | – | (1,437) |
| 6. Others | – | (5) | – | – | – | (11) | (16) |
| Balance at 30 June 2022 | 121,071 | 66,455 | 6,269 | 2,034 | 213,346 | 107,761 | 516,936 |
| Balance at 31 December 2022 | 119,896 | 63,628 | 827 | 1,745 | 217,834 | 100,947 | 504,877 |
| Add: Changes in accounting policies (Note 3(26)) | – | – | – | – | 175 | 1,575 | 1,750 |
| Balance at 1 January 2023 | 119,896 | 63,628 | 827 | 1,745 | 218,009 | 102,522 | 506,627 |
| Change for the period | |||||||
| 1. Net profit | – | – | – | – | – | 29,045 | 29,045 |
| 2. Other comprehensive income | – | – | (1,920) | – | – | – | (1,920) |
| Total comprehensive income | – | – | (1,920) | – | – | 29,045 | 27,125 |
| Amounts transferred to initial carrying amount of hedged items | – | – | (550) | – | – | – | (550) |
| Transactions with owners, recorded directly in shareholders’ equity: | |||||||
| 3. Appropriations of profits: | |||||||
| – Distributions to shareholders (Note 55) | – | – | – | – | – | (23,380) | (23,380) |
| Total transactions with owners, recorded directly in shareholders’ equity | – | – | – | – | – | (23,380) | (23,380) |
| 4. Net increase in specific reserve for the period | – | – | – | 542 | – | – | 542 |
| 5. Other equity movements under the equity method | – | (181) | – | – | – | – | (181) |
| Balance at 30 June 2023 | 119,896 | 63,447 | (1,643) | 2,287 | 218,009 | 108,187 | 510,183 |
These financial statements have been approved for issue by the board of directors on 25 August 2023.
| Ma Yongsheng | Yu Baocai | Shou Donghua |
| Chairman | President | Chief Financial Officer |
| (Legal representative) |
The accompanying notes form part of these financial statements.
47
UNAUDITED NOTES TO THE FINANCIAL STATEMENTS
For the six-month period ended 30 June 2023
| 1 | STATUS OF THE COMPANY |
China Petroleum & Chemical Corporation (the “Company”) was established on 25 February 2000 as a joint stock limited company. The company is registered in Beijing, the People’s Republic of China, and the headquarter is located in Beijing, the People’s Republic of China. The approval date of the financial report is 25 August 2023.
According to the State Council’s approval to the “Preliminary Plan for the Reorganisation of China Petrochemical Corporation” (the “Reorganisation”), the Company was established by China Petrochemical Corporation, which transferred its core businesses together with the related assets and liabilities at 30 September 1999 to the Company. Such assets and liabilities had been valued jointly by China United Assets Appraisal Corporation, Beijing Zhong Zheng Appraisal Company, CIECC Assets Appraisal Corporation and Zhong Fa International Properties Valuation Corporation. The net asset value was determined at RMB98,249,084,000. The valuation was reviewed and approved by the Ministry of Finance (the “MOF”) (Cai Ping Zi [2000] No. 20 “Comments on the Review of the Valuation Regarding the Formation of a Joint Stock Limited Company by China Petrochemical Corporation”).
In addition, pursuant to the notice Cai Guan Zi [2000] No. 34 “Reply to the Issue Regarding Management of State-Owned Equity by China Petroleum and Chemical Corporation” issued by the MOF, 68.8 billion domestic state-owned shares with a par value of RMB1.00 each were issued to Sinopec Group Company, the amount of which is equivalent to 70% of the above net asset value transferred from Sinopec Group Company to the Company in connection with the Reorganisation.
Pursuant to the notice Guo Jing Mao Qi Gai 2000 No. 154 “Reply on the Formation of China Petroleum and Chemical Corporation”, the Company obtained the approval from the State Economic and Trade Commission on 21 February 2000 for the formation of a joint stock limited company.
The Company took over the exploration, development and production of crude oil and natural gas, refining, chemicals and related sales and marketing business of Sinopec Group Company after the establishment of the Company.
The Company and its subsidiaries (the “Group”) engage in the oil and gas and chemical operations and businesses, including:
| (1) | the exploration, development and production of crude oil and natural gas; |
| (2) | the refining, transportation, storage and marketing of crude oil and petroleum product; and |
| (3) | the production and sale of chemical. |
Details of the Company’s principal subsidiaries are set out in Note 59.
| 2 | BASIS OF PREPARATION |
| (1) | Statement of compliance of China Accounting Standards for Business Enterprises (“CASs”) |
The financial statements have been prepared in accordance with the requirements of Accounting Standards for Business Enterprises – Basic Standards, specific standards and relevant regulations (hereafter referred as CASs collectively) issued by the MOF on or after 15 February 2006. These financial statements also comply with the disclosure requirements of “Regulation on the Preparation of Information Disclosures of Companies Issuing Public Shares, No.15: General Requirements for Financial Reports” issued by the China Securities Regulatory Commission (“CSRC”). These financial statements present truly and completely the consolidated and company financial position as at 30 June 2023, and the consolidated and company financial performance and the consolidated and company cash flows for the six-month period ended 30 June 2023.
These financial statements are prepared on a basis of going concern.
| (2) | Accounting period |
The accounting year of the Group is from 1 January to 31 December.
| (3) | Measurement basis |
The financial statements of the Group have been prepared under the historical cost convention, except for the assets and liabilities set out below:
| – | Financial assets held for trading (see Note 3(11)) |
| – | Other equity instrument investments (see Note 3(11)) |
| – | Derivative financial instruments (see Note 3(11)) |
| – | Receivables financing (see Note 3(11)) |
| (4) | Functional currency and presentation currency |
The functional currency of the Company’s and most of its subsidiaries are Renminbi. The Company and its subsidiaries determine their functional currency according to the main economic environment in where they operate. The Group’s consolidated financial statements are presented in Renminbi. Some of subsidiaries use other currency as the functional currency. The Company translates the financial statements of subsidiaries from their respective functional currencies into Renminbi (see Note 3(2)) if the subsidiaries’ functional currencies are not Renminbi.
48
| 3 | SIGNIFICANT ACCOUNTING POLICIES |
The Group determines specific accounting policies and accounting estimates based on the characteristics of production and operational activities, mainly reflected in the accounting for allowance for financial assets (Note 3(11)), valuation of inventories (Note 3(4)), depreciation of fixed assets and depletion of oil and gas properties (Notes 3(7), (8)), measurement of provisions (Note 3(16)), etc.
Principal accounting estimates and judgements of the Group are set out in Note 58.
| (1) | Accounting treatment of business combination involving entities under common control and not under common control |
| (a) | Business combination involving entities under common control |
A business combination involving entities or businesses under common control is a business combination in which all of the combining entities or businesses are ultimately controlled by the same party or parties both before and after the business combination, and that control is not transitory. The assets and liabilities that the acquirer receives in the acquisition are accounted for at the acquiree’s carrying amount on the acquisition date. The difference between the carrying amount of the acquired net assets and the carrying amount of the consideration paid for the acquisition (or the total nominal value of shares issued) is recognised in the share premium of capital reserve, or the retained earnings in case of any shortfall in the share premium of capital reserve. Any costs directly attributable to the combination shall be recognised in profit or loss for the current period when occurred. The expense incurred for equity securities and debt securities issued as the consideration of the combination is recognised in the initial cost of the securities. The combination date is the date on which the acquirer effectively obtains control of the acquiree.
| (b) | Business combination involving entities not under common control |
A business combination involving entities or businesses not under common control is a business combination in which all of the combining entities or businesses are not ultimately controlled by the same party or parties both before and after the business combination. Difference between the consideration paid by the Group as the acquirer, comprises of the aggregate of the fair value at the acquisition date of assets given, liabilities incurred or assumed, and equity securities issued by the acquirer in exchange for control of the acquiree, and the Group’s interest in the fair value of the identifiable net assets of the acquiree, is recognised as goodwill (Note 3(10)) if it is an excess, otherwise in the profit or loss. The expense incurred for equity securities and debt securities issued as the consideration of the combination is recognised in the initial cost of the securities. Any other expense directly attributable to the business combination is recognised in the profit or loss for the year. The difference between the fair value and the book value of the assets given is recognised in profit or loss. The acquiree’s identifiable assets, liabilities and contingent liabilities, if satisfying the recognition criteria, are recognised by the Group at their fair value at the acquisition date. The acquisition date is the date on which the acquirer effectively obtains control of the acquiree.
| (c) | Method for preparation of consolidated financial statements |
The scope of consolidated financial statements is based on control and the consolidated financial statements comprise the Company and its subsidiaries. Control means an entity is exposed to, or has rights to, variable returns from its involvement with the entity and has the ability to affect those returns through its power over the entity. The financial statements of subsidiaries are included in the consolidated financial statements from the date that control commences until the date that control ceases.
Where the Company combines a subsidiary during the reporting period through a business combination involving entities under common control, the financial statements of the subsidiary are included in the consolidated financial statements as if the combination had occurred at the beginning of the earliest comparative year presented or, if later, at the date that common control was established. Therefore the opening balances and the comparative figures of the consolidated financial statements are restated. In the preparation of the consolidated financial statements, the subsidiary’s assets, liabilities and results of operations are included in the consolidated balance sheet and the consolidated income statement, respectively, based on their carrying amounts in the subsidiary’s financial statements, from the date that common control was established.
Where the Company acquires a subsidiary during the reporting year through a business combination involving entities not under common control, the identifiable assets, liabilities and results of operations of the subsidiaries are consolidated into consolidated financial statements from the date that control commences, based on the fair value of those identifiable assets and liabilities at the acquisition date.
Where the Company acquired a non-controlling interest from a subsidiary’s non-controlling shareholders, the difference between the investment cost and the newly acquired interest into the subsidiary’s identifiable net assets at the acquisition date is adjusted to the capital reserve (capital surplus) in the consolidated balance sheet. Where the Company partially disposed an investment of a subsidiary that do not result in a loss of control, the difference between the proceeds and the corresponding share of the interest into the subsidiary is adjusted to the capital reserve (capital surplus) in the consolidated balance sheet. If the credit balance of capital reserve (capital surplus) is insufficient, any excess is adjusted to retained profits.
In a business combination involving entities not under common control achieved in stages, the Group remeasures its previously held equity interest in the acquiree on the acquisition date. The difference between the fair value and the net book value is recognised as investment income for the year. If other comprehensive income was recognised regarding the equity interest previously held in the acquiree before the acquisition date, the relevant other comprehensive income is transferred to investment income in the period in which the acquisition occurs.
49
| 3 | SIGNIFICANT ACCOUNTING POLICIES (Continued) |
| (1) | Accounting treatment of business combination involving entities under common control and not under common control (Continued) |
| (c) | Method for preparation of consolidated financial statements (Continued) |
Where control of a subsidiary is lost due to partial disposal of the equity investment held in a subsidiary, or any other reasons, the Group derecognises assets, liabilities, non-controlling interests and other equity items related to the subsidiary. The remaining equity investment is remeasured to fair value at the date in which control is lost. The sum of consideration received from disposal of equity investment and the fair value of the remaining equity investment, net of the fair value of the Group’s previous share of the subsidiary’s identifiable net assets recorded from the acquisition date, is recognised in investment income in the period in which control is lost. Other comprehensive income related to the previous equity investment in the subsidiary, is transferred to investment income when control is lost. Other comprehensive income related to the equity investment of the original subsidiary shall be reclassified to the current investment income in the event of loss of control.
Non-controlling interest is presented separately in the consolidated balance sheet within shareholders’ equity. Net profit or loss attributable to non-controlling shareholders is presented separately in the consolidated income statement below the net profit line item.
The excess of the loss attributable to the non-controlling interests during the period over the non-controlling interests’ share of the equity at the beginning of the reporting period is deducted from non-controlling interests.
Where the accounting policies and accounting period adopted by the subsidiaries are different from those adopted by the Company, adjustments are made to the subsidiaries’ financial statements according to the Company’s accounting policies and accounting period. Intra-group balances and transactions, and any unrealised profit or loss arising from intra-group transactions, are eliminated in preparing the consolidated financial statements. Unrealised losses resulting from intra-group transactions are eliminated in the same way as unrealised gains but only to the extent that there is no evidence of impairment.
The unrealised profit or loss arising from the sale of assets by the Company to its subsidiaries is eliminated in full against the net profit attributed to shareholders; the unrealised profit or loss from the sale of assets by subsidiaries to the Company is eliminated according to the distribution ratio between shareholders of the parent company and non-controlling interests. For sale of assets that occurred between subsidiaries, the unrealised gains and losses is eliminated according to the distribution ratio for its subsidiaries seller between net profit attributable to shareholders of the parent company and non-controlling interests.
| (2) | Transactions in foreign currencies and translation of financial statements in foreign currencies |
Foreign currency transactions are, on initial recognition, translated into Renminbi at the spot exchange rates quoted by the People’s Bank of China (‘’PBOC rates’’) at the transaction dates.
Foreign currency monetary items are translated at the PBOC rates at the balance sheet date. Exchange differences, except for those directly related to the acquisition, construction or production of qualified assets, are recognised as income or expenses in the income statement. Non-monetary items denominated in foreign currency measured at historical cost are not translated. Non-monetary items denominated in foreign currency that are measured at fair value are translated using the exchange rates at the date when the fair value was determined. The difference between the translated amount and the original currency amount is recognised as other comprehensive income, if it is classified as other equity instrument investments; or charged to the income statement if it is measured at fair value through profit or loss.
The assets and liabilities of foreign operation are translated into Renminbi at the spot exchange rates at the balance sheet date. The equity items, excluding “Retained earnings”, are translated into Renminbi at the spot exchange rates at the transaction dates. The income and expenses of foreign operation are translated into Renminbi at the spot exchange rates or an exchange rate that approximates the spot exchange rates on the transaction dates. The resulting exchange differences are separately presented as other comprehensive income in the balance sheet within equity. Upon disposal of a foreign operation, the cumulative amount of the exchange differences recognised in which relate to that foreign operation is transferred to profit or loss in the year in which the disposal occurs.
| (3) | Cash and cash equivalents |
Cash and cash equivalents comprise cash on hand, demand deposits, short-term and highly liquid investments which are readily convertible into known amounts of cash and are subject to an insignificant risk of change in value.
50
| 3 | SIGNIFICANT ACCOUNTING POLICIES (Continued) |
| (4) | Inventories |
Inventories are initially measured at cost. Cost includes the cost of purchase and processing, and other expenditures incurred in bringing the inventories to their present location and condition. The cost of inventories is mainly calculated using the weighted average method. In addition to the cost of purchase of raw material, work in progress and finished goods include direct labour and an appropriate allocation of manufacturing overhead costs.
At the balance sheet date, inventories are stated at the lower of cost and net realisable value.
Any excess of the cost over the net realisable value of each item of inventories is recognised as a provision for diminution in the value of inventories and included in the current period profit and loss. Net realisable value is the estimated selling price in the normal course of business less the estimated costs of completion and the estimated costs necessary to make the sale and relevant taxes. The net realisable value of materials held for use in the production is measured based on the net realisable value of the finished goods in which they will be incorporated. The net realisable value of the quantity of inventory held to satisfy sales or service contracts is measured based on the contract price. If the quantities held by the Group are more than the quantities of inventories specified in sales contracts, the net realisable value of the excess portion of inventories is measured based on general selling prices.
Inventories include raw materials, work in progress, semi-finished goods, finished goods and reusable materials. Reusable materials include low-value consumables, packaging materials and other materials, which can be used repeatedly but do not meet the definition of fixed assets. Reusable materials are amortised in full when received for use. The amounts of the amortisation are included in the cost of the related assets or profit or loss.
Inventories are recorded by perpetual method.
| (5) | Long-term equity investments |
| (a) | Investment in subsidiaries |
In the Company’s separate financial statements, long-term equity investments in subsidiaries are accounted for using the cost method. Except for cash dividends or profits distributions declared but not yet distributed that have been included in the price or consideration paid in obtaining the investments, the Company recognises its share of the cash dividends or profit distributions declared by the investee as investment income irrespective of whether these represent the net profit realised by the investee before or after the investment. Investments in subsidiaries are stated at cost less impairment losses (see Note 3(12)) in the balance sheet. At initial recognition, such investments are measured as follows:
The initial investment cost of a long-term equity investment obtained through a business combination involving entities under common control is the Company’s share of the carrying amount of the subsidiary’s equity at the combination date. The difference between the initial investment cost and the carrying amounts of the consideration given is adjusted to share premium in capital reserve. If the balance of the share premium is insufficient, any excess is adjusted to retained earnings.
For a long-term equity investment obtained through a business combination not involving enterprises under common control, the initial investment cost comprises the aggregate of the fair values of assets transferred, liabilities incurred or assumed, and equity securities issued by the Company, in exchange for control of the acquiree. For a long-term equity investment obtained through a business combination not involving enterprises under common control, if it is achieved in stages, the initial cost comprises the carrying value of previously-held equity investment in the acquiree immediately before the acquisition date, and the additional investment cost at the acquisition date.
An investment in a subsidiary acquired otherwise than through a business combination is initially recognised at actual purchase cost if the Group acquires the investment by cash, or at the fair value of the equity securities issued if an investment is acquired by issuing equity securities, or at the value stipulated in the investment contract or agreement if an investment is contributed by investors.
51
| 3 | SIGNIFICANT ACCOUNTING POLICIES (Continued) |
| (5) | Long-term equity investments (Continued) |
| (b) | Investment in joint ventures and associates |
A joint venture is an incorporated entity over which the Group, based on legal form, contractual terms and other facts and circumstances, has joint control with the other parties to the joint venture and rights to the net assets of the joint venture. Joint control is the contractually agreed sharing of control of an arrangement, which exists only when decisions about the relevant activities require the unanimous consent of the Group and the parties sharing control.
An associate is the investee that the Group has significant influence on their financial and operating policies. Significant influence represents the right to participate in the financial and operating policy decisions of the investee but is not control or joint control over the establishment of these policies. The Group generally considers the following circumstances in determining whether it can exercise significant influence over the investee: whether there is representative appointed to the board of directors or equivalent governing body of the investee; whether to participate in the investee’s policy-making process; whether there are significant transactions with the investees; whether there is management personnel sent to the investee; whether to provide critical technical information to the investee.
An investment in a joint ventures or an associate is accounted for using the equity method, unless the investment is classified as held for sale.
The initial cost of investment in joint ventures and associates is stated at the consideration paid except for cash dividends or profits distributions declared but unpaid at the time of acquisition and therefore included in the consideration paid should be deducted if the investment is made in cash. Under the circumstances that the long-term investment is obtained through non-monetary asset exchange, the initial cost of the investment is stated at the fair value of the assets exchanged if the transaction has commercial substance, the difference between the fair value of the assets exchanged and its carrying amount is charged to profit or loss; or stated at the carrying amount of the assets exchanged if the transaction lacks commercial substance.
The Group’s accounting treatments when adopting the equity method include:
Where the initial investment cost of a long-term equity investment exceeds the Group’s interest in the fair value of the investee’s identifiable net assets at the date of acquisition, the investment is initially recognised at the initial investment cost. Where the initial investment cost is less than the Group’s interest in the fair value of the investee’s identifiable net assets at the time of acquisition, the investment is initially recognised at the investor’s share of the fair value of the investee’s identifiable net assets, and the difference is charged to profit or loss.
After the acquisition of the investment, the Group recognises its share of the investee’s net profits or losses and other comprehensive income as investment income or losses and other comprehensive income, and adjusts the carrying amount of the investment accordingly. Once the investee declares any cash dividends or profits distributions, the carrying amount of the investment is reduced by that attributable to the Group.
The Group recognises its share of the investee’s net profits or losses after making appropriate adjustments to align the accounting policies or accounting periods with those of the Group based on the fair values of the investee’s net identifiable assets at the time of acquisition. Under the equity accounting method, unrealised profits and losses resulting from transactions between the Group and its associates or joint ventures are eliminated to the extent of the Group’s interest in the associates or joint ventures. Unrealised losses resulting from transactions between the Group and its associates or joint ventures are fully recognised in the event that there is an evidence of impairment.
The Group discontinues recognising its share of net losses of the investee after the carrying amount of the long-term equity investment and any long-term interest that is in substance forms part of the Group’s net investment in the associate or the joint venture is reduced to zero, except to the extent that the Group has an obligation to assume additional losses. However, if the Group has incurred obligations for additional losses and the conditions on recognition of provision are satisfied in accordance with the accounting standard on contingencies, the Group continues recognising the investment losses and the provision. Where net profits are subsequently made by the associate or joint venture, the Group resumes recognising its share of those profits only after its share of the profits equals the share of losses not recognised.
The Group adjusts the carrying amount of the long-term equity investment for changes in owners’ equity of the investee other than those arising from net profits or losses and other comprehensive income, and recognises the corresponding adjustment in capital reserve.
| (c) | The impairment assessment method and provision accrual on investment |
The impairment assessment and provision accrual on investments in subsidiaries, associates and joint ventures are stated in Note 3(12).
52
| 3 | SIGNIFICANT ACCOUNTING POLICIES (Continued) |
| (6) | Leases |
A lease is a contract that a lessor transfers the right to use an identified asset for a period of time to a lessee in exchange for consideration.
| (a) | As Lessee |
The Group recognises a right-of-use asset at the commencement date, and recognises the lease liability at the present value of the lease payments that are not paid at that date. The lease payments include fixed payments, the exercise price of a purchase option if the Group is reasonably certain to exercise that option, and payments of penalties for terminating the lease if the lease term reflects the Group exercising that option, etc. Variable payments that are based on a percentage of sales are not included in the lease payments, and should be recognised in profit or loss when incurred. Lease liabilities to be paid within one year (including one year) from balance sheet date is presented in non-current liabilities due within one year.
Right-of-use assets of the Group mainly comprise land. Right-of-use assets are measured at cost which comprises the amount of the initial measurement of the lease liability, any lease payments made at or before the commencement date, any initial direct costs incurred by the lessee, less any lease incentives received. The Group depreciates the right-of-use assets over the shorter of the asset’s useful life and the lease term on a straight-line basis. When the recoverable amount of a right-of-use asset is less than its carrying amount, the carrying amount is reduced to the recoverable amount.
Payments associated with short-term leases with lease terms within 12 months and leases for which the underlying assets are individually of low value when it is new are recognised on a straight-line basis over the lease term as an expense in profit or loss or as cost of relevant assets, instead of recognising right-of-use assets and lease liabilities.
| (b) | As Lessor |
A lease that transfers substantially all the risks and rewards incidental to ownership of an asset is a finance lease. An operating lease is a lease other than a finance lease.
When the Group leases self-owned plants and buildings, equipment and machinery, lease income from an operating lease is recognised on a straight-line basis over the period of the lease. The Group recognises variable lease income which is based on a certain percentage of sales as rental income when occurred.
| (7) | Fixed assets and construction in progress |
Fixed assets represent the tangible assets held by the Group using in the production of goods, rendering of services and for operation and administrative purposes with useful life over one year.
Fixed assets are stated in the balance sheet at cost less accumulated depreciation and impairment losses (see Note 3(12)). Construction in progress is stated in the balance sheet at cost less impairment losses (see Note 3(12)).
The cost of a purchased fixed asset comprises the purchase price, related taxes, and any directly attributable expenditure for bringing the asset to working condition for its intended use. The cost of self-constructed assets includes the cost of materials, direct labour, capitalised borrowing costs (see Note 3(19)), and any other costs directly attributable to bringing the asset to working condition for its intended use. According to legal or contractual obligations, costs of dismantling and removing the items and restoring the site on which the related assets located are included in the initial cost.
Construction in progress is transferred to fixed assets when the asset is ready for its intended use. No depreciation is provided against construction in progress.
When an enterprise sells products or by-products produced before a fixed asset is available for its intended use, the proceeds and related cost are accounted for in accordance with CAS 14 – Revenue and CAS 1 – Inventories respectively, and recognised in profit or loss for the current period.
Where the individual component parts of an item of fixed asset have different useful lives or provide benefits to the Group in different patterns thus necessitating use of different depreciation rates or methods, each part is recognised as a separate fixed asset.
The subsequent costs including the cost of replacing part of an item of fixed assets are recognised in the carrying amount of the item if the recognition criteria are satisfied, and the carrying amount of the replaced part is derecognised. The costs of the day-to-day servicing of fixed assets are recognised in profit or loss as incurred.
The Group terminates the recognition of an item of fixed asset when it is in a state of disposal or it is estimated that it is unable to generate any economic benefits through use or disposal. Gains or losses arising from the retirement or disposal of an item of fixed asset are determined as the difference between the net disposal proceeds and the carrying amount of the item and are recognised in profit or loss on the date of retirement or disposal.
53
| 3 | SIGNIFICANT ACCOUNTING POLICIES (Continued) |
| (7) | Fixed assets and construction in progress (Continued) |
Other than oil and gas properties, the cost of fixed assets less residual value and accumulated impairment losses is depreciated using the straight-line method over their estimated useful lives, unless the fixed asset is classified as held for sale. The estimated useful lives and the estimated rate of residual values adopted for respective classes of fixed assets are as follows:
| Estimated useful life | Estimated rate of residual value | |
| Plants and buildings | 12-50 years | 3% |
| Equipment, machinery and others | 4-30 years | 3% |
Useful lives, residual values and depreciation methods are reviewed at least each year end.
| (8) | Oil and gas properties |
Oil and gas properties include the mineral interests in properties, wells and related support equipment arising from oil and gas exploration and production activities.
The acquisition cost of mineral interest is capitalised as oil and gas properties. Costs of development wells and related support equipment are capitalised. The cost of exploratory wells is initially capitalised as construction in progress pending determination of whether the well has found proved reserves. Exploratory well costs are charged to expenses upon the determination that the well has not found proved reserves. However, in the absence of a determination of the discovery of proved reserves, exploratory well costs are not carried as an asset for more than one year following completion of drilling. If, after one year has passed, a determination of the discovery of proved reserves cannot be made, the exploratory well costs are impaired and charged to expense. All other exploration costs, including geological and geophysical costs, are charged to profit or loss in the year as incurred.
The Group estimates future dismantlement costs for oil and gas properties with reference to engineering estimates after taking into consideration the anticipated method of dismantlement required in accordance with the industry practices. These estimated future dismantlement costs are discounted at credit-adjusted risk-free rate and are capitalised as oil and gas properties, which are subsequently amortised as part of the costs of the oil and gas properties.
Capitalised costs of proved oil and gas properties are amortised on a unit-of-production method based on volumes produced and reserves.
| (9) | Intangible assets |
Intangible assets, where the estimated useful life is finite, are stated in the balance sheet at cost less accumulated amortisation and provision for impairment losses (see Note 3(12)). For an intangible asset with finite useful life, its cost less estimated residual value and accumulated impairment losses is amortised on a straight-line basis over the expected useful lives, unless the intangible assets are classified as held for sale.
An intangible asset is regarded as having an indefinite useful life and is not amortised when there is no foreseeable limit to the year over which the asset is expected to generate economic benefits for the Group.
Useful lives and amortisation methods are reviewed at least each year end.
When an enterprise sells products or by-products produced in the course of research and development, the proceeds and related cost are accounted for in accordance with CAS 14 – Revenue and CAS 1 – Inventories respectively, and recognised in profit or loss for the current period.
54
| 3 | SIGNIFICANT ACCOUNTING POLICIES (Continued) |
| (10) | Goodwill |
The initial cost of goodwill represents the excess of cost of acquisition over the acquirer’s interest in the fair value of the identifiable net assets of the acquiree under the business combination involving entities not under common control.
Goodwill is not amortised and is stated at cost less accumulated impairment losses (see Note 3(12)). On disposal of an asset group or a set of asset groups, any attributable amount of purchased goodwill is written off and included in the calculation of the profit or loss on disposal.
| (11) | Financial Instruments |
Financial instruments, refer to the contracts that form one party’s financial assets and form the financial liabilities or equity instruments of the other party. The Group recognises a financial asset or a financial liability when the Group enters into and becomes a party to the underlining contract of the financial instrument.
| (a) | Financial assets |
| (i) | Classification and measurement |
The Group classifies financial assets into different categories depending on the business model for managing the financial assets and the contractual terms of cash flows of the financial assets: (1) financial assets measured at amortised cost, (2) financial assets measured at fair value through other comprehensive income, (3) financial assets measured at fair value through profit or loss. A contractual cash flow characteristic which could have only a de minimis effect, or could have an effect that is more than de minimis but is not genuine, does not affect the classification of the financial asset.
Financial assets are initially recognised at fair value. For financial assets measured at fair value through profit or loss, the relevant transaction costs are recognised in profit or loss. The transaction costs for other financial assets are included in the initially recognised amount. However, accounts receivable arising from sales of goods or rendering services, without significant financing component, are initially recognised based on the transaction price expected to be entitled by the Group.
Debt instruments
The debt instruments held by the Group refer to the instruments that meet the definition of financial liabilities from the perspective of the issuer, and are measured in the following ways:
| – | Measured at amortised cost: |
The business model for managing such financial assets by the Group are held for collection of contractual cash flows. The contractual cash flow characteristics are to give rise on specified dates to cash flows that are solely payments of principal and interest on the principal amount outstanding. Interest income from these financial assets is recognised using the effective interest rate method. The financial assets include cash at bank and on hand and receivables.
| – | Measured at fair value through other comprehensive income: |
The business model for managing such financial assets by the Group are held for collection of contractual cash flows and for selling the financial assets, the contractual cash flow characteristics of such financial assets are consistent with the basic lending arrangements. Movements in the carrying amount are taken through other comprehensive income, except for the recognition of impairment gains or losses, foreign exchange gains and losses and interest income calculated using the effective interest rate method, which are recognised in profit or loss. The financial assets include receivables financing.
Equity instruments
Equity instruments that the Group has no power to control, jointly control or exercise significant influence over, are measured at fair value through profit or loss and presented as financial assets held for trading.
In addition, the Group designates some equity instruments that are not held for trading as financial assets at fair value through other comprehensive income, and presented in other equity instrument investments. The relevant dividends of these financial assets are recognised in profit or loss. When derecognised, the cumulative gain or loss previously recognised in other comprehensive income is transferred to retained earnings.
55
| 3 | SIGNIFICANT ACCOUNTING POLICIES (Continued) |
| (11) | Financial Instruments (Continued) |
| (a) | Financial assets (Continued) |
| (ii) | Impairment |
The Group recognises a loss allowance for expected credit losses on financial assets measured at amortised cost and receivables financing measured at fair value through other comprehensive income.
The Group measures and recognises expected credit losses, considering reasonable and supportable information about the relevant past events, current conditions and forecasts of future economic conditions.
The Group measures the expected credit losses of financial instruments on different stages at each balance sheet date. For financial instruments that have no significant increase in credit risk since the initial recognition, on first stage, the Group measures the loss allowance at an amount equal to 12-month expected credit losses. If there has been a significant increase in credit risk since the initial recognition of a financial instrument but credit impairment has not occurred, on second stage, the Group recognises a loss allowance at an amount equal to lifetime expected credit losses. If credit impairment has occurred since the initial recognition of a financial instrument, on third stage, the Group recognises a loss allowance at an amount equal to lifetime expected credit losses.
For financial instruments that have low credit risk at the balance sheet date, the Group assumes that there is no significant increase in credit risk since the initial recognition, and measures the loss allowance at an amount equal to 12-month expected credit losses.
For financial instruments on the first stage and the second stage, and that have low credit risk, the Group calculates interest income according to carrying amount without deducting the impairment allowance and effective interest rate. For financial instruments on the third stage, interest income is calculated according to the carrying amount minus amortised cost after the provision of impairment allowance and effective interest rate.
For accounts receivable and receivables financing related to revenue, the Group measures the loss allowance at an amount equal to lifetime expected credit losses.
The Group recognises the loss allowance accrued or written back in profit or loss.
| (iii) | Derecognition |
The Group derecognises a financial asset when (1) the contractual right to receive cash flows from the financial asset expires; (2) the Group transfers the financial asset and substantially all the risks and rewards of ownership of the financial asset; (3) the financial assets have been transferred and the Group neither transfers nor retains substantially all the risks and rewards of ownership of the financial asset, but the Group has not retained control.
On derecognition of other equity instrument investments, the difference between the carrying amounts and the sum of the consideration received and any cumulative gain or loss previously recognised in other comprehensive income, is recognised in retained earnings. While on derecognition of other financial assets, this difference is recognised in profit or loss.
| (b) | Financial liabilities |
The Group, at initial recognition, classifies financial liabilities as either financial liabilities subsequently measured at amortised cost or financial liabilities at fair value through profit or loss.
The Group’s financial liabilities are mainly financial liabilities measured at amortised cost, including bills payable, accounts payable, other payables, loans and debentures payable, etc. These financial liabilities are initially measured at the amount of their fair value after deducting transaction costs and use the effective interest rate method for subsequent measurement.
Where the present obligations of financial liabilities are completely or partially discharged, the Group derecognises these financial liabilities or discharged parts of obligations. The differences between the carrying amounts and the consideration received are recognised in profit or loss.
Financial guarantee liabilities
Financial guarantees are contracts that requires the Group to make specified payments to reimburse the holder for a loss it incurs because a specified debtor fails to make payment when due in accordance with the original or modified terms of a debt instrument.
Financial guarantees issued are initially recognised at fair value, which is determined by reference to fees charged in an arm’s length transaction for similar services, when such information is obtainable, or to interest rate differentials, by comparing the actual rates charged by lenders when the guarantee is made available with the estimated rates that lenders would have charged, had the guarantees not been available, where reliable estimates of such information can be made. Where consideration is received or receivable for the issuance of the guarantee, the consideration is recognised in accordance with the Group’s policies applicable to that category of asset. Where no such consideration is received or receivable, an immediate expense is recognised in profit or loss.
56
| 3 | SIGNIFICANT ACCOUNTING POLICIES (Continued) |
| (11) | Financial Instruments (Continued) |
| (b) | Financial liabilities (Continued) |
Subsequent to initial recognition, the amount initially recognised as deferred income is amortised in profit or loss over the term of the guarantee as income from financial guarantees issued. A financial guarantee liability is measured at the higher of:
| • | the amount of the loss allowance determined in accordance with the impairment policies for financial instruments; and |
| • | the amount initially recognised less the cumulative amount of income. |
| (c) | Determination of fair value |
If there is an active market for financial instruments, the quoted price in the active market is used to measure fair values of the financial instruments. If no active market exists for financial instruments, valuation techniques are used to measure fair values. In valuation, the Group adopts valuation techniques that are applicable in the current situation and have sufficient available data and other information to support it, and selects input values that are consistent with the asset or liability characteristics considered by market participants in the transaction of relevant assets or liabilities, and gives priority to relevant observable input values. Use of unobservable input values where relevant observable input values cannot be obtained or are not practicable.
| (d) | Derivative financial instruments and hedge accounting |
Derivative financial instruments are recognised initially at fair value. At each balance sheet date, the fair value is remeasured. The gain or loss on remeasurement to fair value is recognised immediately in profit or loss, except where the derivatives qualify for hedge accounting.
Hedge accounting is a method which recognises the offsetting effects on profit or loss of changes in the fair values of the hedging instrument and the hedged item in the same accounting period, to represent the effect of risk management activities.
Hedged items are the items that expose the Group to risks of changes in future cash flows and that are designated as being hedged and that must be reliably measurable. The Group’s hedged items include a forecast transaction that is settled with an undetermined future market price and exposes the Group to risk of variability in cash flows, etc.
A hedging instrument is a designated derivative whose changes in fair value or cash flows are expected to offset changes in the fair value or cash flows of the hedged item.
The hedging relationship meets all of the following hedge effectiveness requirements:
| (1) | There is an economic relationship between the hedged item and the hedging instrument, which share a risk and that gives rise to opposite changes in fair value that tend to offset each other. |
| (2) | The effect of credit risk does not dominate the value changes that result from that economic relationship. |
| (3) | The hedge ratio of the hedging relationship is the same as that resulting from the quantity of the hedged item that the entity actually hedges and the quantity of the hedging instrument that the entity actually uses to hedge that quantity of hedged item. However, that designation shall not reflect an imbalance between the weightings of the hedged item and the hedging instrument. |
| – | Cash flow hedges |
Cash flow hedge is a hedge of the exposure to variability in cash flows that is attributable to a particular risk associated with all, or a component of, a recognised asset or liability (such as all or some future interest payments on variable-rate debt) or a highly probable forecast transaction, and could affect profit or loss. As long as a cash flow hedge meets the qualifying criteria for hedge accounting, the hedging relationship shall be accounted for as follows. The amount of the cash flow hedge reserve is adjusted to the lower of the following (in absolute amounts):
| – | The cumulative gain or loss on the hedging instrument from inception of the hedge; |
| – | The cumulative change in present value of the expected future cash flows on the hedged item from inception of the hedge. |
The gain or loss on the hedging instrument that is determined to be an effective hedge is recognised in other comprehensive income.
The portion of the gain or loss on the hedging instrument that is determined to be an ineffective hedge is recognised in profit or loss.
If a hedged forecast transaction subsequently results in the recognition of a non-financial asset or non-financial liability, or a hedged forecast transaction for a non-financial asset or a non-financial liability becomes a firm commitment for which fair value hedge accounting is applied, the entity shall remove that amount from the cash flow hedge reserve and include it directly in the initial cost or other carrying amount of the asset or the liability. This is not a reclassification adjustment and hence it does not affect other comprehensive income.
57
| 3 | SIGNIFICANT ACCOUNTING POLICIES (Continued) |
| (11) | Financial Instruments (Continued) |
| (d) | Derivative financial instruments and hedge accounting (Continued) |
| – | Cash flow hedges (Continued) |
For cash flow hedges, other than those covered by the preceding two policy statements, that amount shall be reclassified from the cash flow hedge reserve to profit or loss as a reclassification adjustment in the same period or periods during which the hedged expected future cash flows affect profit or loss.
If the amount that has been accumulated in the cash flow hedge reserve is a loss and the Group expects that all or a portion of that loss will not be recovered in one or more future periods, the Group immediately reclassify the amount that is not expected to be recovered into profit or loss.
When the hedging relationship no longer meets the risk management objective on the basis of which it qualified for hedge accounting (i.e. the entity no longer pursues that risk management objective), or when a hedging instrument expires or is sold, terminated, exercised, or there is no longer an economic relationship between the hedged item and the hedging instrument or the effect of credit risk starts to dominate the value changes that result from that economic relationship or no longer meets the criteria for hedge accounting, the Group discontinues prospectively the hedge accounting treatments. If the hedged future cash flows are still expected to occur, that amount shall remain in the cash flow hedge reserve and shall be accounted for as cash flow hedges. If the hedged future cash flows are no longer expected to occur, that amount shall be immediately reclassified from the cash flow hedge reserve to profit or loss as a reclassification adjustment. A hedged future cash flow that is no longer highly probable to occur may still be expected to occur, if the hedged future cash flows are still expected to occur, that amount shall remain in the cash flow hedge reserve and shall be accounted for as cash flow hedges.
| – | Fair value hedges |
A fair value hedge is a hedge of the exposure to changes in the fair value of a recognised asset or liability or an unrecognised firm commitment, or a portion of such an asset, liability or firm commitment.
The gain or loss from remeasuring the hedging instrument is recognised in profit or loss. The gain or loss on the hedged item attributable to the hedged risk adjusts the carrying amount of the recognised hedged item not measured at fair value and is recognised in profit or loss.
Any adjustment to the carrying amount of a hedged item is amortised to profit or loss if the hedged item is a financial instrument (or a component thereof) measured at amortised cost. The amortisation is based on a recalculated effective interest rate at the date that amortisation begins.
| (12) | Impairment of other non-financial long-term assets |
Internal and external sources of information are reviewed at each balance sheet date for indications that the following assets, including fixed assets, construction in progress, right-of-use assets, goodwill, intangible assets, long-term deferred expenses and investments in subsidiaries, associates and joint ventures may be impaired.
Assets are tested for impairment whenever events or changes in circumstances indicate that their carrying amounts may not be recoverable. The recoverable amounts of goodwill and intangible assets with uncertain useful lives are estimated annually no matter there are any indications of impairment. Goodwill is tested for impairment together with related asset units or groups of asset units.
An asset unit is the smallest identifiable group of assets that generates cash inflows largely independent of the cash inflows from other assets or groups of assets. An asset unit comprises related assets that generate associated cash inflows. In identifying an asset unit, the Group primarily considers whether the asset unit is able to generate cash inflows independently as well as the management style of production and operational activities, and the decision for the use or disposal of asset.
The recoverable amount is the greater of the fair value less costs to sell and the present value of expected future cash flows generated by the asset (or asset unit, set of asset units).
Fair value less costs to sell of an asset is based on its selling price in an arm’s length transaction less any direct costs attributable to the disposal. Present value of expected future cash flows is the estimation of future cash flows to be generated from the use of and upon disposal of the asset, discounted at an appropriate pre-tax discount rate over the asset’s remaining useful life.
If the recoverable amount of an asset is less than its carrying amount, the carrying amount is reduced to the recoverable amount. The amount by which the carrying amount is reduced is recognised as an impairment loss in profit or loss. A provision for impairment loss of the asset is recognised accordingly. Impairment losses related to an asset unit or a set of asset units first reduce the carrying amount of any goodwill allocated to the asset unit or set of asset units, and then reduce the carrying amount of the other assets in the asset unit or set of asset units on a pro rata basis. However, the carrying amount of an impaired asset will not be reduced below the highest of its individual fair value less costs to sell (if determinable), the present value of expected future cash flows (if determinable) and zero.
Once an impairment loss is recognised, it is not reversed in a subsequent period.
58
| 3 | SIGNIFICANT ACCOUNTING POLICIES (Continued) |
| (13) | Long-term deferred expenses |
Long-term deferred expenses are amortised on a straight-line basis over their beneficial periods.
| (14) | Employee benefits |
Employee benefits are all forms of considerations and compensation given in exchange for services rendered by employees, including short- term compensation, post-employment benefits, termination benefits and other long-term employee benefits.
| (a) | Short-term compensation |
Short-term compensation includes salaries, bonuses, allowances and subsidies, employee benefits, medical insurance premiums, work-related injury insurance premium, maternity insurance premium, contributions to housing fund, unions and education fund and short-term absence with payment etc. When an employee has rendered service to the Group during an accounting period, the Group shall recognise the short-term compensation actually incurred as a liability and charge to the cost of an asset or to profit or loss in the same period, and non-monetary benefits are valued with the fair value.
| (b) | Post-employment benefits |
The Group classifies post-employment benefits into either Defined Contribution Plan (DC plan) or Defined Benefit Plan (DB plan). DC plan means the Group only contributes a fixed amount to an independent fund and no longer bears other payment obligation; DB plan is post-employment benefits other than DC plan. In this reporting period, the post-employment benefits of the Group primarily comprise basic pension insurance and unemployment insurance and both of them are DC plans.
Basic pension insurance
Employees of the Group participate in the social insurance system established and managed by local labor and social security department. The Group makes basic pension insurance to the local social insurance agencies every month, at the applicable benchmarks and rates stipulated by the government for the benefits of its employees. After the employees retire, the local labor and social security department has obligations to pay them the basic pension. When an employee has rendered service to the Group during an accounting period, the Group shall recognise the accrued amount according to the above social security provisions as a liability and charge to the cost of an asset or to profit or loss in the same period.
| (c) | Termination benefits |
When the Group terminates the employment relationship with employees before the employment contracts expire, or provides compensation as an offer to encourage employees to accept voluntary redundancy, a provision for the termination benefits provided is recognised in profit or loss under the conditions of both the Group has a formal plan for the termination of employment or has made an offer to employees for voluntary redundancy, which will be implemented shortly; and the Group is not allowed to withdraw from termination plan or redundancy offer unilaterally.
| (15) | Income tax |
Current tax and deferred tax are recognised in profit or loss except to the extent that they relate to business combinations and items recognised directly in equity (including other comprehensive income).
Current tax is the expected tax payable calculated at the applicable tax rate on taxable income for the year, plus any adjustment to tax payable in respect of previous years.
At the balance sheet date, current tax assets and liabilities are offset if the Group has a legally enforceable right to set them off and also intends either to settle on a net basis or to realise the asset and settle the liability simultaneously.
Deferred tax assets and liabilities are recognised based on deductible temporary differences and taxable temporary differences respectively. Temporary difference is the difference between the carrying amounts of assets and liabilities and their tax bases, including unused tax losses and unused tax credits able to be utilised in subsequent years. Deferred tax assets are recognised to the extent that it is probable that future taxable income will be available to offset the deductible temporary differences.
Temporary differences arise in a transaction, which is not a business combination, and at the time of transaction, does not affect accounting profit or taxable profit (or unused tax losses), and also at the initial recognition of deferred tax liabilities and deferred tax assets, does not result in equal amount of taxable temporary differences and deductible temporary differences, will not result in deferred tax. Temporary differences arising from the initial recognition of goodwill will not result in deferred tax.
At the balance sheet date, the amounts of deferred tax recognised is measured based on the expected manner of recovery or settlement of the carrying amount of the assets and liabilities, using tax rates that are expected to be applied in the period when the asset is recovered or the liability is settled in accordance with tax laws.
The carrying amount of deferred tax assets is reviewed at each balance sheet date. If it is unlikely to obtain sufficient taxable income to offset against the benefit of deferred tax asset, the carrying amount of the deferred tax assets is written down. Any such write-down should be subsequently reversed where it becomes probable that sufficient taxable income will be available.
59
| 3 | SIGNIFICANT ACCOUNTING POLICIES (Continued) |
| (15) | Income tax (Continued) |
At the balance sheet date, deferred tax assets and liabilities are offset if all the following conditions are met:
| – | the taxable entity has a legally enforceable right to offset current tax assets and current tax liabilities; and |
| – | they relate to income taxes levied by the same tax authority on either: |
| – | the same taxable entity; or |
| – | different taxable entities which either to intend to settle the current tax liabilities and assets on a net basis, or to realise the assets and settle the liabilities simultaneously, in each future period in which significant amounts of deferred tax liabilities or assets are expected to be settled or recovered. |
| (16) | Provisions |
Provisions are recognised when the Group has a present obligation as a result of a contingent event, it is probable that an outflow of economic benefits will be required to settle the obligations and a reliable estimate can be made. Where the effect of time value of money is material, provisions are determined by discounting the expected future cash flows.
Provisions for future dismantlement costs are initially recognised based on the present value of the future costs expected to be incurred in respect of the Group’s expected dismantlement and abandonment costs at the end of related oil and gas exploration and development activities. Any subsequent change in the present value of the estimated costs, other than the change due to passage of time which is regarded as interest costs, is reflected as an adjustment to the provision of oil and gas properties.
An onerous contract exists when the Group has a contract under which the unavoidable costs of meeting the obligations under the contract exceed the economic benefits expected to be received from the contract. Provisions for onerous contracts are measured at the present value of the lower of the expected cost of terminating the contract and the net cost of continuing with the fulfilling the contract. The cost of fulfilling the contract includes both the incremental costs of fulfilling that contract and an allocation of other costs that relate directly to fulfilling that contract.
| (17) | Revenue recognition |
Revenue arises in the course of the Group’s ordinary activities, and increases in economic benefits in the form of inflows that result in an increase in equity, other than those relating to contributions from equity participants.
The Group sells crude oil, natural gas, petroleum and chemical products, etc. Revenue is recognised according to the expected consideration amount, when a customer obtains control over the relevant goods or services. To determine whether a customer obtains control of a promised asset, the Group shall consider indicators of the transfer of control, which include, but are not limited to, the Group has a present right to payment for the asset; the Group has transferred physical possession of the asset to the customer; the customer has the significant risks and rewards of ownership of the asset; the customer has accepted the asset.
Sales of goods
Sales are recognised when control of the goods have transferred. Advance from customers but goods not yet delivered is recorded as contract liabilities and is recognised as revenues when a customer obtains control over the relevant goods.
| (18) | Government grants |
Government grants are non-reciprocal transfers of monetary or non-monetary assets from the government to the Group except for capital contributions from the government in the capacity as an investor in the Group.
Government grants are recognised when there is reasonable assurance that the grants will be received and the Group is able to comply with the conditions attaching to them. Government grants in the form of monetary assets are recorded based on the amount received or receivable, whereas non-monetary assets are measured at fair value.
Government grants received in relation to assets are recorded as deferred income, and recognised evenly in profit or loss over the assets’ useful lives. Government grants received in relation to revenue are recorded as deferred income, and recognised as income in future periods as compensation when the associated future expenses or losses arise; or directly recognised as income in the current period as compensation for past expenses or losses.
| (19) | Borrowing costs |
Borrowing costs incurred on borrowings for the acquisition, construction or production of qualified assets are capitalised into the cost of the related assets in the capitalisable period.
Except for the above, other borrowing costs are recognised as financial expenses in the income statement when incurred.
| (20) | Repairs and maintenance expenses |
Repairs and maintenance (including overhauling expenses) expenses are recognised in profit or loss when incurred.
60
| 3 | SIGNIFICANT ACCOUNTING POLICIES (Continued) |
| (21) | Environmental expenditures |
Environmental expenditures that relate to current ongoing operations or to conditions caused by past operations is expensed as incurred. Liabilities related to future remediation costs are recorded when environmental assessments and/or cleanups are probable and the costs can be reliably estimated. As facts concerning environmental contingencies become known to the Group, the Group reassesses its position both with respect to accrued liabilities and other potential exposures.
| (22) | Research and development costs |
Research costs and development costs that cannot meet the capitalisation criteria are recognised in profit or loss when incurred.
| (23) | Dividends |
Dividends and distributions of profits proposed in the profit appropriation plan which will be authorised and declared after the balance sheet date, are not recognised as a liability at the balance sheet date and are separately disclosed in the notes to the financial statements. Dividends are recognised as a liability in the period in which they are declared.
| (24) | Related parties |
If a party has the power to control, jointly control or exercise significant influence over another party, or vice versa, or where two or more parties are subject to common control, joint control from another party, they are considered to be related parties, except for the two parties significantly influenced by a party. Related parties may be individuals or enterprises. Where enterprises are subject to state control but are otherwise unrelated, they are not related parties.
In addition to the related parties stated above, the Company determines related parties based on the disclosure requirements of Administrative Procedures on the Information Disclosures of Listed Companies issued by the CSRC.
| (25) | Segment reporting |
Reportable segments are identified based on operating segments which are determined based on the structure of the Group’s internal organisation, management requirements and internal reporting system. An operating segment is a component of the Group that meets the following respective conditions:
| • | engage in business activities from which it may earn revenues and incur expenses; |
| • | whose operating results are regularly reviewed by the Group’s management to make decisions about resource to be allocated to the segment and assess its performance; and |
| • | for which financial information regarding financial position, results of operations and cash flows are available. |
Inter-segment revenues are measured on the basis of actual transaction price for such transactions for segment reporting, and segment accounting policies are consistent with those for the consolidated financial statements.
| (26) | Changes in significant accounting policies |
In 2023, the Group has adopted the accounting requirements and guidance under CAS newly issued by the Ministry of Finance:
Accounting treatment of deferred tax related to assets and liabilities arising from a single transaction for which initial recognition exemption does not apply:
In accordance with CAS Bulletin No.16, the provisions of the Accounting Standards for Business Enterprises No. 18 – Income Taxes on exemption from initial recognition of deferred tax liabilities and deferred tax assets shall not apply to single transactions that are not business combinations, that do not affect accounting profits or taxable income (or deductible losses) upon transaction’s occurrence, and result in equal amount of taxable temporary differences and deductible temporary differences caused by initially recognised assets and liabilities.
The Group has made retrospective adjustments in accordance with these provisions for applicable single transactions occurring between 1 January 2022 and the date of initial implementation. With regard to deductible temporary differences and taxable temporary differences arising from lease liabilities and right-of-use assets recognised as at 1 January 2022 as a result of single transactions to which these provisions apply, the Group shall, in accordance with CAS Bulletin No.16 and Accounting Standards for Business Enterprises No. 18 – Income Taxes, adjust the cumulative effect amount with the retained earnings at the beginning of the earliest period presented in the financial statements and other relevant items of the financial statements.
61
| 3 | SIGNIFICANT ACCOUNTING POLICIES (Continued) |
| (26) | Changes in significant accounting policies (Continued) |
| (i) | The effects on the comparative financial statements |
The effects of these changes in accounting policies on net profit for the six months ended 30 June 2022, and opening and closing balances of shareholders’ equity as at 1 January and 31 December 2022 are summarised as follows:
| The Group | |||
| Net profit for the six months ended 30 June 2022 | 2022 Closing balance of shareholders’ equity | 2022 Opening balance of shareholders’ equity | |
| RMB million | RMB million | RMB million | |
| Net profit and shareholders’ equity before adjustments | 49,516 | 937,153 | 916,041 |
| The effects of the exemption of initial recognition not applicable to the deferred tax relating to assets and liabilities arising from a single transaction | 428 | 3,304 | 2,448 |
| Net profit and shareholders’ equity after adjustments | 49,944 | 940,457 | 918,489 |
| The Company | |||
| Net profit for the six months ended 30 June 2022 | 2022 Closing balance of shareholders’ equity | 2022 Opening balance of shareholders’ equity | |
| RMB million | RMB million | RMB million | |
| Net profit and shareholders’ equity before adjustments | 27,503 | 504,877 | 526,314 |
| The effects of the exemption of initial recognition not applicable to the deferred tax relating to assets and liabilities arising from a single transaction | 266 | 1,750 | 1,217 |
| Net profit and shareholders’ equity after adjustments | 27,769 | 506,627 | 527,531 |
The effects of the above changes in accounting policies on each item of the consolidated balance sheet and company balance sheet as at 31 December 2022 are summarised as follows:
| The Group | |||
| Before adjustments | The amounts of adjustments | After adjustments | |
| RMB million | RMB million | RMB million | |
| Non-current assets | |||
| Deferred tax assets | 19,952 | 2,481 | 22,433 |
| Total non-current assets | 1,425,500 | 2,481 | 1,427,981 |
| Total assets | 1,948,640 | 2,481 | 1,951,121 |
| Non-current liabilities | |||
| Deferred tax liabilities | 8,079 | (823) | 7,256 |
| Total non-current liabilities | 344,102 | (823) | 343,279 |
| Total liabilities | 1,011,487 | (823) | 1,010,664 |
| Shareholders’ equity | |||
| Surplus reserves | 217,834 | 175 | 218,009 |
| Retained earnings | 323,087 | 2,719 | 325,806 |
| Total equity attributable to shareholders of the Company | 785,577 | 2,894 | 788,471 |
| Non-controlling interests | 151,576 | 410 | 151,986 |
| Total shareholders’ equity | 937,153 | 3,304 | 940,457 |
| Total liabilities and shareholders’ equity | 1,948,640 | 2,481 | 1,951,121 |
| The Company | |||
| Before adjustments | The amounts of adjustments | After adjustments | |
| RMB million | RMB million | RMB million | |
| Non-current assets | |||
| Deferred tax assets | 7,737 | 1,750 | 9,487 |
| Total non-current assets | 914,040 | 1,750 | 915,790 |
| Total assets | 1,141,670 | 1,750 | 1,143,420 |
| Shareholders’ equity | |||
| Surplus reserves | 217,834 | 175 | 218,009 |
| Retained earnings | 100,947 | 1,575 | 102,522 |
| Total shareholders’ equity | 504,877 | 1,750 | 506,627 |
| Total liabilities and shareholders’ equity | 1,141,670 | 1,750 | 1,143,420 |
62
| 3 | SIGNIFICANT ACCOUNTING POLICIES (Continued) |
| (26) | Changes in significant accounting policies (Continued) |
| (i) | The effects on the comparative financial statements (Continued) |
The effects of the above changes in accounting policies on each item of the consolidated income statement and company income statement for the six-month period ended 30 June 2022 are summarised as follows:
| The Group | |||
| Before adjustments | The amounts of adjustments | After adjustments | |
| RMB million | RMB million | RMB million | |
| Income tax expense | 14,461 | (428) | 14,033 |
| Net profit | 49,516 | 428 | 49,944 |
| Classification by continuity of operations | |||
| Net profit from continuing operations | 49,516 | 428 | 49,944 |
| Classification by ownership | |||
| Shareholders of the Company | 43,530 | 390 | 43,920 |
| Non-controlling interests | 5,986 | 38 | 6,024 |
| Basic earnings per share (RMB/Share) | 0.360 | 0.003 | 0.363 |
| Diluted earnings per share (RMB/Share) | 0.360 | 0.003 | 0.363 |
| Total comprehensive income | 66,223 | 428 | 66,651 |
| Shareholders of the Company | 59,563 | 390 | 59,953 |
| Non-controlling interests | 6,660 | 38 | 6,698 |
| The Company | |||
| Before adjustments | The amounts of adjustments | After adjustments | |
| RMB million | RMB million | RMB million | |
| Income tax expense | 4,515 | (266) | 4,249 |
| Net profit | 27,503 | 266 | 27,769 |
| Classification by continuity of operations | |||
| Net profit from continuing operations | 27,503 | 266 | 27,769 |
| Total comprehensive income | 32,259 | 266 | 32,525 |
63
| 3 | SIGNIFICANT ACCOUNTING POLICIES (Continued) |
| (26) | Changes in significant accounting policies (Continued) |
| (ii) | After retrospective adjustments of the above accounting policy changes, the consolidated balance sheet and company balance sheet as at 1 January 2022 are as follows: |
| The Group | The Company | |
| RMB million | RMB million | |
| Assets | ||
| Current assets | ||
| Cash at bank and on hand | 221,989 | 110,691 |
| Derivative financial assets | 18,371 | 4,503 |
| Accounts receivable | 34,861 | 21,146 |
| Receivables financing | 5,939 | 227 |
| Prepayments | 9,267 | 4,540 |
| Other receivables | 35,664 | 46,929 |
| Inventories | 207,433 | 63,661 |
| Other current assets | 24,500 | 23,408 |
| Total current assets | 558,024 | 275,105 |
| Non-current assets | ||
| Long-term equity investments | 209,179 | 360,847 |
| Other equity instrument investments | 767 | 201 |
| Fixed assets | 598,932 | 284,622 |
| Construction in progress | 155,939 | 66,146 |
| Right-of-use assets | 184,974 | 105,712 |
| Intangible assets | 119,210 | 9,334 |
| Goodwill | 8,594 | – |
| Long-term deferred expenses | 10,007 | 2,875 |
| Deferred tax assets | 21,098 | 9,932 |
| Other non-current assets | 24,240 | 34,227 |
| Total non-current assets | 1,332,940 | 873,896 |
| Total assets | 1,890,964 | 1,149,001 |
| Liabilities and shareholders’ equity | ||
| Current liabilities | ||
| Short-term loans | 27,366 | 16,550 |
| Derivative financial liabilities | 3,223 | 1,121 |
| Bills payable | 11,721 | 6,058 |
| Accounts payable | 203,919 | 85,307 |
| Contract liabilities | 124,622 | 7,505 |
| Employee benefits payable | 14,048 | 8,398 |
| Taxes payable | 81,267 | 46,333 |
| Other payables | 114,701 | 211,179 |
| Non-current liabilities due within one year | 28,651 | 16,737 |
| Other current liabilities | 31,762 | 13,702 |
| Total current liabilities | 641,280 | 412,890 |
| Non-current liabilities | ||
| Long-term loans | 49,341 | 34,258 |
| Debentures payable | 42,649 | 31,522 |
| Lease liabilities | 170,233 | 104,426 |
| Provisions | 43,525 | 35,271 |
| Deferred tax liabilities | 7,171 | – |
| Other non-current liabilities | 18,276 | 3,103 |
| Total non-current liabilities | 331,195 | 208,580 |
| Total liabilities | 972,475 | 621,470 |
| Shareholders’ equity | ||
| Share capital | 121,071 | 121,071 |
| Capital reserve | 120,188 | 67,897 |
| Other comprehensive income | (690) | 6,024 |
| Specific reserve | 2,664 | 1,658 |
| Surplus reserves | 213,346 | 213,346 |
| Retained earnings | 320,637 | 117,535 |
| Total equity attributable to shareholders of the Company | 777,216 | 527,531 |
| Non-controlling interests | 141,273 | – |
| Total shareholders’ equity | 918,489 | 527,531 |
| Total liabilities and shareholders’ equity | 1,890,964 | 1,149,001 |
64
| 4 | TAXATION |
Major types of tax applicable to the Group are value-added tax, resources tax, consumption tax, income tax, special oil income levy, city maintenance and construction tax, education surcharge and local education surcharge.
Tax rates of products are presented as below:
| Type of taxes | Tax rate | Tax basis and method |
| Value Added Tax (the “VAT”) | 13%, 9%, 6% | Based on taxable value added amount. Tax payable is calculated using the taxable sales amount multiplied by the applicable tax rate less current period’s deductible VAT input. |
| Resource Tax | 6% | Based on the revenue from sales of crude oil and natural gas. |
| Consumption Tax | RMB2,109.76 per tonnage for Gasoline, RMB1,411.20 per tonnage for Diesel, RMB2,105.20 per tonnage for Naphtha, RMB1,948.64 per tonnage for Solvent oil, RMB1,711.52 per tonnage for Lubricant oil, RMB1,218.00 per tonnage for Fuel oil, and RMB1,495.20 per tonnage for Jet fuel oil. | Based on quantities |
| Corporate Income Tax | 5% to 50% | Based on taxable income. |
| Special Oil Income Levy | 20% to 40% | Based on the sales of domestic crude oil at prices higher than a specific level. |
| City Maintenance and Construction Tax | 1%, 5% or 7% | Based on the actual paid VAT and consumption tax. |
| Education surcharges | 3% | Based on the actual paid VAT and consumption tax. |
| Local Education surcharges | 2% | Based on the actual paid VAT and consumption tax. |
| 5 | CASH AT BANK AND ON HAND |
The Group
| At 30 June 2023 | At 31 December 2022 | |||||
| Original | Original | |||||
| currency | Exchange | RMB | currency | Exchange | RMB | |
| million | rates | million | million | rates | million | |
| Cash on hand | ||||||
| Renminbi | 2 | 2 | ||||
| Cash at bank | ||||||
| Renminbi | 79,569 | 69,282 | ||||
| US Dollar | 645 | 7.2258 | 4,655 | 690 | 6.9646 | 4,809 |
| Hong Kong Dollar | 4,053 | 0.9220 | 3,736 | 5,162 | 0.8933 | 4,611 |
| EUR | – | 7.8771 | 3 | 1 | 7.4229 | 7 |
| Others | 104 | 1,277 | ||||
| 88,069 | 79,988 | |||||
| Deposits at related parities | ||||||
| Renminbi | 11,122 | 12,690 | ||||
| US Dollar | 7,141 | 7.2258 | 51,582 | 7,433 | 6.9646 | 51,774 |
| EUR | 53 | 7.8771 | 416 | 56 | 7.4229 | 413 |
| Others | 159 | 187 | ||||
| 63,279 | 65,064 | |||||
| Total | 151,348 | 145,052 | ||||
Deposits at related parties represent deposits placed at Sinopec Finance Company Limited and Sinopec Century Bright Capital Investment Limited. Deposits interest is calculated based on market rate.
At 30 June 2023, time deposits with maturities over three months in financial institutions of the Group amounted to RMB56,474 million (31 December 2022: RMB51,614 million).
| 6 | DERIVATIVE FINANCIAL ASSETS AND DERIVATIVE FINANCIAL LIABILITIES |
Derivative financial assets and derivative financial liabilities of the Group are primarily commodity futures and swaps contracts. See Note 63 for commodity price risk.
65
| 7 | ACCOUNTS RECEIVABLE |
| The Group | The Company | |||
| At 30 June | At 31 December | At 30 June | At 31 December | |
| 2023 | 2022 | 2023 | 2022 | |
| RMB million | RMB million | RMB million | RMB million | |
| Accounts receivable | 77,611 | 50,443 | 27,526 | 33,919 |
| Less: Allowance for doubtful accounts | 4,212 | 4,079 | 76 | 78 |
| Total | 73,399 | 46,364 | 27,450 | 33,841 |
Ageing analysis on accounts receivable is as follows:
| The Group | ||||||||
| At 30 June 2023 | At 31 December 2022 | |||||||
| Amount RMB | Percentage to total accounts receivable | Allowance RMB | Percentage of allowance to accounts receivable balance | Amount RMB | Percentage to total accounts receivable | Allowance RMB | Percentage of allowance to accounts receivable balance | |
| million | % | million | % | million | % | million | % | |
| Within one year | 73,091 | 94.2 | 76 | 0.1 | 46,097 | 91.4 | 58 | 0.1 |
| Between one and two years | 288 | 0.4 | 78 | 27.1 | 216 | 0.4 | 64 | 29.6 |
| Between two and three years | 116 | 0.1 | 73 | 62.9 | 269 | 0.5 | 181 | 67.3 |
| Over three years | 4,116 | 5.3 | 3,985 | 96.8 | 3,861 | 7.7 | 3,776 | 97.8 |
| Total | 77,611 | 100.0 | 4,212 | 50,443 | 100.0 | 4,079 | ||
| The Company | ||||||||
| At 30 June 2023 | At 31 December 2022 | |||||||
| Amount RMB | Percentage to total accounts receivable | Allowance RMB | Percentage of allowance to accounts receivable balance | Amount RMB | Percentage to total accounts receivable | Allowance RMB | Percentage of allowance to accounts receivable balance | |
| million | % | million | % | million | % | million | % | |
| Within one year | 27,063 | 98.3 | 4 | 0.0 | 33,555 | 98.9 | 1 | 0.0 |
| Between one and two years | 208 | 0.8 | 6 | 2.9 | 108 | 0.3 | 11 | 10.2 |
| Between two and three years | 190 | 0.7 | 2 | 1.1 | 191 | 0.6 | 1 | 0.5 |
| Over three years | 65 | 0.2 | 64 | 98.5 | 65 | 0.2 | 65 | 100.0 |
| Total | 27,526 | 100.0 | 76 | 33,919 | 100.0 | 78 | ||
At 30 June 2023 and 31 December 2022, the total amounts of the top five accounts receivable of the Group are set out below:
| At 30 June | At 31 December | |
| 2023 | 2022 | |
| Total amount (RMB million) | 24,259 | 15,846 |
| Percentage to the total balance of accounts receivable | 31.3% | 31.4% |
| Allowance for doubtful accounts | 2,241 | 2,187 |
Sales are generally on cash term. Credit is generally only available for major customers with well-established trading records. Amounts due from China Petrochemical Corporation (“Sinopec Group Company”) and fellow subsidiaries are repayable under the same terms.
Accounts receivable (net of allowance for doubtful accounts) primarily represent receivables that are neither past due nor impaired. These receivables relate to a wide range of customers for whom there is no recent history of default. Information about the impairment of accounts receivable and the Group exposure to credit risk can be found in Note 63.
During for the six-month periods ended 30 June 2023 and 2022, the Group and the Company had no individually significant accounts receivable been fully or substantially provided allowance for doubtful accounts.
During for the six-month periods ended 30 June 2023 and 2022, the Group and the Company had no individually significant write-off or recovery of doubtful debts which had been fully or substantially provided for in prior years.
66
| 7 | ACCOUNTS RECEIVABLE (Continued) |
Ageing started from the overdue date of accounts receivable. The Group always measured the provision for impairment of accounts receivable based on the amount equivalent to the expected credit loss during the entire duration. The ECLs were calculated based on historical actual credit loss experience. The rates were considered the differences between economic conditions during the period over which the historical data has been collected, current conditions and the Group’s view of economic conditions over the expected lives of the receivables. The Group performed the calculation of ECL rates by the operating segment and geographical location.
| 30 June 2023 | Impairment provision on individual basis | Impairment provision on provision matrix basis | ||||
| Gross carrying amount | Carrying amount | Impairment provision on individual basis | Weighted- average loss rate | Impairment provision | Loss allowance | |
| RMB million | RMB million | RMB million | RMB million | RMB million | ||
| Current and within 1 year past due | 73,091 | 12,851 | 1 | 0.1% | 75 | 76 |
| 1 to 2 years past due | 288 | 15 | 1 | 28.2% | 77 | 78 |
| 2 to 3 years past due | 116 | 51 | 49 | 36.9% | 24 | 73 |
| Over 3 years past due | 4,116 | 3,751 | 3,624 | 98.9% | 361 | 3,985 |
| Total | 77,611 | 16,668 | 3,675 | 537 | 4,212 | |
| 31 December 2022 | Impairment provision on individual basis | Impairment provision on provision matrix basis | ||||
| Gross carrying amount | Carrying amount | Impairment provision on individual basis | Weighted- average loss rate | Impairment provision | Loss allowance | |
| RMB million | RMB million | RMB million | RMB million | RMB million | ||
| Current and within 1 year past due | 46,097 | 7,014 | 2 | 0.1% | 56 | 58 |
| 1 to 2 years past due | 216 | 29 | 25 | 20.9% | 39 | 64 |
| 2 to 3 years past due | 269 | 193 | 148 | 43.4% | 33 | 181 |
| Over 3 years past due | 3,861 | 3,487 | 3,405 | 99.2% | 371 | 3,776 |
| Total | 50,443 | 10,723 | 3,580 | 499 | 4,079 | |
| 8 | RECEIVABLES FINANCING |
Receivables financing represents mainly the bills of acceptance issued by banks for sales of goods and products. The business model of receivables financing is to collect contract cash flow and sell it.
At 30 June 2023, the Group’s derecognised but outstanding bills due to endorsement or discount amounted to RMB34,770 million (31 December 2022: RMB34,978 million).
At 30 June 2023, the Group considers that its bills of acceptance issued by banks do not pose a significant credit risk and will not cause any significant loss due to the default of drawers.
67
| 9 | PREPAYMENTS |
| The Group | The Company | |||
| At 30 June | At 31 December | At 30 June | At 31 December | |
| 2023 | 2022 | 2023 | 2022 | |
| RMB million | RMB million | RMB million | RMB million | |
| Prepayments | 9,606 | 8,067 | 3,265 | 4,473 |
| Less: Allowance for doubtful accounts | 122 | 111 | 10 | 12 |
| Total | 9,484 | 7,956 | 3,255 | 4,461 |
Ageing analysis of prepayments is as follows:
| The Group | ||||||||
| At 30 June 2023 | At 31 December 2022 | |||||||
| Amount RMB million | Percentage to total prepayments % | Allowance RMB million | Percentage of allowance to prepayments balance % | Amount RMB million | Percentage to total prepayments % | Allowance RMB million | Percentage of allowance to prepayments balance % | |
| Within one year | 9,080 | 94.5 | – | – | 7,608 | 94.3 | – | – |
| Between one and two years | 307 | 3.2 | 38 | 12.4 | 249 | 3.1 | 32 | 12.9 |
| Between two and three years | 80 | 0.8 | 14 | 17.5 | 67 | 0.8 | 10 | 14.9 |
| Over three years | 139 | 1.5 | 70 | 50.4 | 143 | 1.8 | 69 | 48.3 |
| Total | 9,606 | 100.0 | 122 | 8,067 | 100.0 | 111 | ||
| The Company | ||||||||
| At 30 June 2023 | At 31 December 2022 | |||||||
| Amount RMB million | Percentage to total prepayments % | Allowance RMB million | Percentage of allowance to prepayments balance | Amount RMB million | Percentage to total prepayments % | Allowance RMB million | Percentage of allowance to prepayments balance % | |
| Within one year | 3,103 | 95.1 | – | – | 4,331 | 96.8 | – | – |
| Between one and two years | 70 | 2.1 | – | – | 39 | 0.9 | 1 | 2.6 |
| Between two and three years | 4 | 0.1 | 2 | 50.0 | 13 | 0.3 | 3 | 23.1 |
| Over three years | 88 | 2.7 | 8 | 9.1 | 90 | 2.0 | 8 | 8.9 |
| Total | 3,265 | 100.0 | 10 | 4,473 | 100.0 | 12 | ||
At 30 June 2023 and 31 December 2022, the total amounts of the top five prepayments of the Group are set out below:
| At 30 June | At 31 December | |
| 2023 | 2022 | |
| Total amount (RMB million) | 2,357 | 2,565 |
| Percentage to the total balance of prepayments | 24.5% | 31.8% |
68
| 10 | OTHER RECEIVABLES |
| The Group | The Company | |||
| At 30 June | At 31 December | At 30 June | At 31 December | |
| 2023 | 2022 | 2023 | 2022 | |
| RMB million | RMB million | RMB million | RMB million | |
| Other receivables | 24,047 | 28,562 | 48,622 | 39,416 |
| Less: Allowance for doubtful accounts | 1,562 | 1,553 | 913 | 899 |
| Total | 22,485 | 27,009 | 47,709 | 38,517 |
Ageing analysis of other receivables is as follows:
| The Group | ||||||||
| At 30 June 2023 | At 31 December 2022 | |||||||
| Amount RMB million | Percentage to total other receivables % | Allowance RMB million | Percentage of allowance to other receivables balance % | Amount RMB million | Percentage to total other receivables % | Allowance RMB million | Percentage of allowance to other receivables balance % | |
| Within one year | 13,350 | 55.5 | 11 | 0.1 | 17,846 | 62.6 | 25 | 0.1 |
| Between one and two years | 409 | 1.7 | 57 | 13.9 | 496 | 1.7 | 44 | 8.9 |
| Between two and three years | 352 | 1.5 | 101 | 28.7 | 353 | 1.2 | 139 | 39.4 |
| Over three years | 9,936 | 41.3 | 1,393 | 14.0 | 9,867 | 34.5 | 1,345 | 13.6 |
| Total | 24,047 | 100.0 | 1,562 | 28,562 | 100.0 | 1,553 | ||
| The Company | ||||||||
| At 30 June 2023 | At 31 December 2022 | |||||||
| Amount RMB million | Percentage to total other receivables % | Allowance RMB million | Percentage of allowance to other receivables balance % | Amount RMB million | Percentage to total other receivables % | Allowance RMB million | Percentage of allowance to other receivables balance % | |
| Within one year | 35,918 | 73.9 | – | – | 25,945 | 65.8 | – | – |
| Between one and two years | 6,027 | 12.4 | 11 | 0.2 | 2,847 | 7.2 | 5 | 0.2 |
| Between two and three years | 3,548 | 7.3 | 5 | 0.1 | 3,929 | 10.0 | 2 | 0.1 |
| Over three years | 3,129 | 6.4 | 897 | 28.7 | 6,695 | 17.0 | 892 | 13.3 |
| Total | 48,622 | 100.0 | 913 | 39,416 | 100.0 | 899 | ||
At 30 June 2023 and at 31 December 2022, the total amounts of the top five other receivables of the Group are set out below:
| At 30 June | At 31 December | |
| 2023 | 2022 | |
| Total amount (RMB million) | 12,649 | 13,936 |
| Ageing | Within one year, between one and two years, between two and three years and over three years | Within one year, between one and two years, between two and three years and over three years |
| Percentage to the total balance of other receivables | 52.6% | 48.8% |
| Allowance for doubtful accounts | 72.0 | 72.0 |
During the six-month periods ended 30 June 2023 and 2022, the Group and the Company had no individually significant other receivables been fully or substantially provided allowance for doubtful accounts.
During the six-month periods ended 30 June 2023 and 2022, the Group and the Company had no individually significant write-off or recovery of doubtful debts which had been fully or substantially provided for in prior years.
69
| 11 | INVENTORIES |
The Group
| At 30 June | At 31 December | |
| 2023 | 2022 | |
| RMB million | RMB million | |
| Raw materials | 153,710 | 139,307 |
| Work in progress | 15,311 | 14,536 |
| Finished goods | 114,194 | 93,994 |
| Spare parts and consumables | 3,816 | 2,987 |
| 287,031 | 250,824 | |
| Less: Provision for diminution in value of inventories | 5,335 | 6,583 |
| Total | 281,696 | 244,241 |
During the six-month period ended 30 June 2023, the provision for diminution in value of inventories of the Group was primarily due to the costs of finished products and raw materials were higher than net realisable value.
| 12 | LONG-TERM EQUITY INVESTMENTS |
The Group
| Investments in joint ventures | Investments in associates | Provision for impairment losses | Total | |
| RMB million | RMB million | RMB million | RMB million | |
| Balance at 1 January 2023 | 77,846 | 159,985 | (3,890) | 233,941 |
| Additions for the period | 1,869 | 1,550 | – | 3,419 |
| Share of profits less losses under the equity method | (3,690) | 6,301 | – | 2,611 |
| Change of other comprehensive income under the equity method | (4,992) | (1,532) | – | (6,524) |
| Other equity movements under the equity method | 10 | (181) | – | (171) |
| Dividends declared | (1,319) | (1,874) | – | (3,193) |
| Disposals for the period | (37) | (50) | – | (87) |
| Foreign currency translation differences | 829 | 751 | (80) | 1,500 |
| Other movements | – | 65 | – | 65 |
| Balance at 30 June 2023 | 70,516 | 165,015 | (3,970) | 231,561 |
The Company
| Investments in subsidiaries | Investments in joint ventures | Investments in associates | Provision for impairment losses | Total | |
| RMB million | RMB million | RMB million | RMB million | RMB million | |
| Balance at 1 January 2023 | 298,045 | 17,239 | 75,524 | (7,929) | 382,879 |
| Additions for the period | 7,202 | 234 | – | – | 7,436 |
| Share of profits less losses under the equity method | – | (223) | 2,754 | – | 2,531 |
| Change of other comprehensive income under the equity method | – | – | (50) | – | (50) |
| Other equity movements under the equity method | – | – | (181) | – | (181) |
| Dividends declared | – | (669) | (722) | – | (1,391) |
| Disposals for the period | (184) | – | – | – | (184) |
| Balance at 30 June 2023 | 305,063 | 16,581 | 77,325 | (7,929) | 391,040 |
For the six-month period ended 30 June 2023, the Group and the Company had no individually significant long-term investment impairment.
Details of the Company’s principal subsidiaries are set out in Note 59.
70
| 12 | LONG-TERM EQUITY INVESTMENTS (Continued) |
Principal joint ventures and associates of the Group are as follows:
| (a) | Principal joint ventures and associates |
| Name of investees | Principal place of business | Register location | Legal representative | Principal activities | Registered Capital RMB million | Percentage of equity/voting right directly or indirectly held by the Company |
| 1. Joint ventures | ||||||
| Fujian Refining & Petrochemical Company Limited (“FREP”) | PRC | PRC | Zhang Xiguo | Manufacturing refining oil products | 14,758 | 50.00% |
| BASF-YPC Company Limited (“BASF-YPC”) | PRC | PRC | Gu Yuefeng | Manufacturing and distribution of petrochemical products | 13,141 | 40.00% |
| Taihu Limited (“Taihu”) | Russia | Cyprus | NA | Crude oil and natural gas extraction | 25,000 USD | 49.00% |
| Sinopec SABIC Tianjin Petrochemical Company Limited (“Sinopec SABIC Tianjin”) | PRC | PRC | SAMI ALOSAIMI | Manufacturing and distribution of petrochemical products | 10,520 | 50.00% |
| Shanghai SECCO Petrochemical Co., Ltd. (“Shanghai SECCO”) | PRC | PRC | Wang Jingyi | Manufacturing and distribution of petrochemical products | 3,115 | 50.00% |
| 2. Associates | ||||||
| National Petroleum Pipe Network Group Co., Ltd. (“National Pipe Network Group”) (i) | PRC | PRC | Zhang Wei | Operation of natural gas pipelines and auxiliary facilities | 500,000 | 14.00% |
| Sinopec Finance Company Limited (“Sinopec Finance”) | PRC | PRC | Jiang Yongfu | Provision of non-banking financial services | 18,000 | 49.00% |
| Sinopec Capital Co.,Ltd. (“Sinopec Capital”) | PRC | PRC | Sun Mingrong | Project management, equity invest-ment management, investment consulting, self-owned equity management | 10,000 | 49.00% |
| Zhongtian Synergetic Energy Company Limited (“Zhongtian Synergetic Energy”) | PRC | PRC | Yang Dong | Mining coal and manufacturing of coal-chemical products | 17,516 | 38.75% |
| Caspian Investments Resources Ltd. (“CIR”) | The Republic of Kazakhstan | British Virgin Islands | NA | Crude oil and natural gas extraction | 10,002 USD | 50.00% |
Joint ventures and associates above are limited companies.
| (b) | Major financial information of principal joint ventures |
Summarised balance sheet and reconciliation to their carrying amounts in respect of the Group’s principal joint ventures:
| FREP | BASF-YPC | Taihu | Sinopec SABIC Tianjin | Shanghai SECCO* | ||||||
| At 30 | At 31 | At 30 | At 31 | At 30 | At 31 | At 30 | At 31 | At 30 | At 31 | |
| June | December | June | December | June | December | June | December | June | December | |
| 2023 | 2022 | 2023 | 2022 | 2023 | 2022 | 2023 | 2022 | 2023 | 2022 | |
| RMB million | RMB million | RMB million | RMB million | RMB million | RMB million | RMB million | RMB million | RMB million | RMB million | |
| Current assets | ||||||||||
| Cash and cash equivalents | 3,801 | 3,733 | 2,869 | 3,061 | 587 | 1,625 | 3,302 | 4,506 | 1,913 | 1,323 |
| Other current assets | 12,866 | 11,311 | 4,838 | 5,993 | 1,146 | 15,269 | 2,285 | 2,554 | 2,187 | 3,647 |
| Total current assets | 16,667 | 15,044 | 7,707 | 9,054 | 1,733 | 16,894 | 5,587 | 7,060 | 4,100 | 4,970 |
| Non-current assets | 12,057 | 12,708 | 9,173 | 9,244 | 18,533 | 10,488 | 17,633 | 18,466 | 25,960 | 26,677 |
| Current liabilities | ||||||||||
| Current financial liabilities | (724) | (829) | (68) | (63) | (45) | (55) | (2,289) | (2,950) | (4,685) | (6,609) |
| Other current liabilities | (12,206) | (9,951) | (1,922) | (2,245) | (3,360) | (2,727) | (3,229) | (3,282) | (1,008) | (2,368) |
| Total current liabilities | (12,930) | (10,780) | (1,990) | (2,308) | (3,405) | (2,782) | (5,518) | (6,232) | (5,693) | (8,977) |
| Non-current liabilities | ||||||||||
| Non-current financial liabilities | (2,840) | (3,742) | – | – | (160) | (157) | (5,773) | (6,393) | (2,676) | – |
| Other non-current liabilities | (222) | (237) | (117) | (107) | (2,715) | (1,852) | (614) | (635) | (1,065) | (944) |
| Total non-current liabilities | (3,062) | (3,979) | (117) | (107) | (2,875) | (2,009) | (6,387) | (7,028) | (3,741) | (944) |
| Net assets | 12,732 | 12,993 | 14,773 | 15,883 | 13,986 | 22,591 | 11,315 | 12,266 | 20,626 | 21,726 |
| Net assets attributable to shareholders of the Company | 12,732 | 12,993 | 14,773 | 15,883 | 13,466 | 21,941 | 11,315 | 12,266 | 20,626 | 21,726 |
| Net assets attributable to non-controlling interests | – | – | – | – | 520 | 650 | – | – | – | – |
| Share of net assets from joint ventures | 6,366 | 6,497 | 5,909 | 6,353 | 6,598 | 10,751 | 5,658 | 6,133 | 10,313 | 10,863 |
| Carrying Amounts | 6,366 | 6,497 | 5,909 | 6,353 | 6,598 | 10,751 | 5,658 | 6,133 | 10,313 | 10,863 |
71
| 12 | LONG-TERM EQUITY INVESTMENTS (Continued) |
| (b) | Major financial information of principal joint ventures (Continued) |
Summarised income statement
| Six-month period ended 30 June | FREP | BASF-YPC | Taihu | Sinopec SABIC Tianjin | Shanghai SECCO* | ||||
| 2023 | 2022 | 2023 | 2022 | 2023 | 2022 | 2023 | 2022 | 2023 | |
| RMB million | RMB million | RMB million | RMB million | RMB million | RMB million | RMB million | RMB million | RMB million | |
| Turnover | 28,443 | 29,042 | 9,775 | 13,430 | 5,469 | 9,675 | 11,064 | 12,670 | 8,352 |
| Interest income | 72 | 61 | 32 | 59 | 21 | 269 | 65 | 71 | 37 |
| Interest expense | (160) | (181) | (3) | (6) | (104) | (58) | (104) | (34) | (97) |
| (Loss)/profit before taxation | (356) | 653 | 294 | 2,666 | 17 | 1,707 | (935) | (858) | (1,466) |
| Tax expense | 95 | (158) | (74) | (666) | (3) | (341) | (15) | 290 | 366 |
| (Loss)/profit for the period | (261) | 495 | 220 | 2,000 | 14 | 1,366 | (950) | (568) | (1,100) |
| Other comprehensive income | – | – | – | – | (8,619) | 842 | – | – | – |
| Total comprehensive income | (261) | 495 | 220 | 2,000 | (8,605) | 2,208 | (950) | (568) | (1,100) |
| Dividends from joint ventures | – | 910 | 532 | 1,374 | – | – | – | 454 | – |
| Share of net (loss)/profit from joint ventures | (131) | 248 | 88 | 800 | 6 | 651 | (475) | (284) | (550) |
| Share of other comprehensive income from joint ventures (ii) | – | – | – | – | (4,159) | 413 | – | – | – |
| * | The Company and Sinopec Shanghai Gaoqiao Petrochemical Co., Ltd. (“Gaoqiao Petrochemical”) and INEOS Investment (Shanghai) Company Limited (“INEOS Shanghai”) entered into an equity transfer agreement on 28 July 2022. According to the agreement, the Company and Gaoqiao Petrochemical transferred 15% and 35% equity interests in Shanghai SECCO to INEOS Shanghai respectively. The transactions were completed on 28 December 2022, and Shanghai SECCO was changed from a subsidiary to a joint venture after the completion of the transaction. |
The share of loss and other comprehensive income for the six-month period ended 30 June 2023 in all individually immaterial joint ventures accounted for using equity method in aggregate was RMB2,628 million (six-month period ended 30 June 2022: loss RMB43 million) and RMB(833) million (six-month period ended 30 June 2022: loss RMB612 million) respectively. As at 30 June 2023, the carrying amount of all individually immaterial joint ventures accounted for using equity method in aggregate was RMB32,565 million (31 December 2022: RMB34,194 million).
| (c) | Major financial information of principal associates |
Summarised balance sheet and reconciliation to their carrying amounts in respect of the Group’s principal associates:
| PipeChina | Sinopec Finance | Sinopec Capital | Zhongtian Synergetic Energy | CIR | ||||||
| At 30 | At 31 | At 30 | At 31 | At 30 | At 31 | At 30 | At 31 | At 30 | At 31 | |
| June | December | June | December | June | December | June | December | June | December | |
| 2023 | 2022 | 2023 | 2022 | 2023 | 2022 | 2023 | 2022 | 2023 | 2022 | |
| RMB million | RMB million | RMB million | RMB million | RMB million | RMB million | RMB million | RMB million | RMB million | RMB million | |
| Current assets | 126,915 | 104,889 | 157,601 | 212,850 | 14,985 | 14,444 | 3,733 | 3,212 | 1,163 | 885 |
| Non-current assets | 820,785 | 816,301 | 60,642 | 57,394 | 338 | 249 | 49,227 | 51,035 | 1,201 | 1,106 |
| Current liabilities | (115,790) | (132,266) | (184,728) | (236,840) | (102) | (101) | (3,671) | (3,811) | (255) | (714) |
| Non-current liabilities | (243,221) | (199,675) | (743) | (673) | (1,197) | (990) | (20,971) | (23,435) | (149) | (138) |
| Net assets | 588,689 | 589,249 | 32,772 | 32,731 | 14,024 | 13,602 | 28,318 | 27,001 | 1,960 | 1,139 |
| Net assets attributable to shareholders of the Company | 541,215 | 525,235 | 32,772 | 32,731 | 14,024 | 13,602 | 28,318 | 27,001 | 1,960 | 1,139 |
| Net assets attributable to non-controlling interests | 47,474 | 64,014 | – | – | – | – | – | – | – | – |
| Share of net assets from associates | 75,770 | 73,533 | 16,058 | 16,038 | 6,872 | 6,665 | 10,973 | 10,463 | 980 | 570 |
| Carrying Amounts | 75,770 | 73,533 | 16,058 | 16,038 | 6,872 | 6,665 | 10,973 | 10,463 | 980 | 570 |
Summarised income statement
| Six-month period ended 30 June | PipeChina | Sinopec Finance | Sinopec Capital | Zhongtian Synergetic Energy | CIR | |||||
| 2023 | 2022 | 2023 | 2022 | 2023 | 2022 | 2023 | 2022 | 2023 | 2022 | |
| RMB million | RMB million | RMB million | RMB million | RMB million | RMB million | RMB million | RMB million | RMB million | RMB million | |
| Turnover | 60,583 | 55,516 | 2,883 | 2,775 | 2 | 2 | 7,884 | 9,238 | 1,147 | 1,122 |
| Profit for the period | 20,393 | 18,080 | 1,145 | 1,195 | 789 | 624 | 1,317 | 2,722 | 907 | 333 |
| Other comprehensive income | – | – | (104) | 282 | – | – | – | – | 56 | 33 |
| Total comprehensive income | 20,393 | 18,080 | 1,041 | 1,477 | 789 | 624 | 1,317 | 2,722 | 963 | 366 |
| Dividends declared by associates | – | – | 490 | 319 | 188 | 73 | – | – | 71 | – |
| Share of net profit from associates | 2,489 | 2,064 | 561 | 586 | 387 | 306 | 510 | 1,055 | 453 | 167 |
| Share of other comprehensiveincome from associates (ii) | – | – | (51) | 138 | – | – | – | – | 28 | 17 |
72
| 12 | LONG-TERM EQUITY INVESTMENTS (Continued) |
| (c) | Major financial information of principal associates (Continued) |
Summarised income statement (Continued)
The share of profit and other comprehensive loss for the six-month period ended 30 June 2023 in all individually immaterial associates accounted for using equity method in aggregate was RMB1,901 million (six-month period ended 30 June 2022: RMB1,777 million) and RMB1,509 million (six-month period ended 30 June 2022: RMB3,441 million) respectively. As at 30 June 2023, the carrying amount of all individually immaterial associates accounted for using equity method in aggregate was RMB53,499 million (31 December 2022: RMB51,881 million).
Notes:
| (i) | Sinopec is able to exercise significant influence in National Pipe Network Group since Sinopec has a member in National Pipe Network Group’s Board of Director. |
| (ii) | Including foreign currency translation differences. |
| 13 | FIXED ASSETS |
The Group
| At 30 June | At 31 December | |
| 2023 | 2022 | |
| RMB million | RMB million | |
| Fixed assets (a) | 634,468 | 630,700 |
| Fixed assets pending for disposal | 122 | 58 |
| Total | 634,590 | 630,758 |
| (a) | Fixed assets |
| Plants and buildings | Oil and gas properties | Equipment, machinery and others | Total | |
| RMB million | RMB million | RMB million | RMB million | |
| Cost: | ||||
| Balance at 1 January 2023 | 152,432 | 840,719 | 1,105,325 | 2,098,476 |
| Additions for the period | 13 | 764 | 752 | 1,529 |
| Transferred from construction in progress | 2,207 | 18,651 | 25,779 | 46,637 |
| Reclassifications | (433) | (399) | 832 | – |
| Decreases for the period | (474) | (44) | (6,524) | (7,042) |
| Exchange adjustments | 91 | 1,664 | 131 | 1,886 |
| Balance at 30 June 2023 | 153,836 | 861,355 | 1,126,295 | 2,141,486 |
| Less: Accumulated depreciation: | ||||
| Balance at 1 January 2023 | 67,898 | 644,802 | 652,817 | 1,365,517 |
| Additions for the period | 2,478 | 14,983 | 25,528 | 42,989 |
| Reclassifications | (13) | (374) | 387 | – |
| Decreases for the period | (245) | (31) | (4,865) | (5,141) |
| Exchange adjustments | 43 | 1,514 | 84 | 1,641 |
| Balance at 30 June 2023 | 70,161 | 660,894 | 673,951 | 1,405,006 |
| Less: Provision for impairment losses: | ||||
| Balance at 1 January 2023 | 4,897 | 52,810 | 44,552 | 102,259 |
| Additions for the period | 3 | – | 31 | 34 |
| Reclassifications | 31 | (24) | (7) | – |
| Decreases for the period | (9) | (3) | (376) | (388) |
| Exchange adjustments | – | 106 | 1 | 107 |
| Balance at 30 June 2023 | 4,922 | 52,889 | 44,201 | 102,012 |
| Net book value: | ||||
| Balance at 30 June 2023 | 78,753 | 147,572 | 408,143 | 634,468 |
| Balance at 31 December 2022 | 79,637 | 143,107 | 407,956 | 630,700 |
73
| 13 | FIXED ASSETS (Continued) |
The Company
| At 30 June | At 31 December | |
| 2023 | 2022 | |
| RMB million | RMB million | |
| Fixed assets (b) | 292,718 | 296,480 |
| Fixed assets pending for disposal | 73 | 50 |
| Total | 292,791 | 296,530 |
| (b) | Fixed assets |
| Plants and buildings | Oil and gas properties | Equipment, machinery and others | Total | |
| RMB million | RMB million | RMB million | RMB million | |
| Cost: | ||||
| Balance at 1 January 2023 | 51,042 | 681,940 | 529,391 | 1,262,373 |
| Additions for the period | 5 | 593 | 92 | 690 |
| Transferred from construction in progress | 1,202 | 14,621 | 5,868 | 21,691 |
| Reclassifications | 135 | (378) | 243 | – |
| Decreases for the period | (603) | (3,173) | (5,347) | (9,123) |
| Balance at 30 June 2023 | 51,781 | 693,603 | 530,247 | 1,275,631 |
| Less: Accumulated depreciation: | ||||
| Balance at 1 January 2023 | 28,099 | 523,939 | 340,180 | 892,218 |
| Additions for the period | 751 | 11,352 | 10,746 | 22,849 |
| Reclassifications | 38 | (356) | 318 | – |
| Decreases for the period | (281) | (1,967) | (2,911) | (5,159) |
| Balance at 30 June 2023 | 28,607 | 532,968 | 348,333 | 909,908 |
| Less: Provision for impairment losses: | ||||
| Balance at 1 January 2023 | 2,501 | 45,816 | 25,358 | 73,675 |
| Reclassifications | 8 | (24) | 16 | – |
| Decreases for the period | (4) | (616) | (50) | (670) |
| Balance at 30 June 2023 | 2,505 | 45,176 | 25,324 | 73,005 |
| Net book value: | ||||
| Balance at 30 June 2023 | 20,669 | 115,459 | 156,590 | 292,718 |
| Balance at 31 December 2022 | 20,442 | 112,185 | 163,853 | 296,480 |
The additions to oil and gas properties of the Group and the Company for the six-month period ended 30 June 2023 included RMB750 million (six-month period ended 30 June 2022: RMB867 million) (Note 34) and RMB593 million (six-month period ended 30 June 2022: RMB549 million), respectively of the estimated dismantlement costs for site restoration.
At 30 June 2023 and 31 December 2022, the Group and the Company had no individually significant fixed assets which were pledged.
At 30 June 2023 and 31 December 2022, the Group and the Company had no individually significant fixed assets which were temporarily idle or pending for disposal.
At 30 June 2023 and 31 December 2022, the Group and the Company had no individually significant fully depreciated fixed assets which were still in use.
74
| 14 | CONSTRUCTION IN PROGRESS |
| The Group | The Company | |
| RMB million | RMB million | |
| Cost: | ||
| Balance at 1 January 2023 | 198,692 | 81,803 |
| Additions for the period | 73,414 | 33,646 |
| Disposals for the period | (72) | (192) |
| Dry hole costs written off | (3,094) | (2,662) |
| Transferred to fixed assets | (46,637) | (21,691) |
| Reclassification to other assets | (4,185) | (682) |
| Exchange adjustments | 61 | – |
| Balance at 30 June 2023 | 218,179 | 90,222 |
| Less: Provision for impairment losses: | ||
| Balance at 1 January 2023 | 2,647 | 302 |
| Decreases for the period | (9) | – |
| Exchange adjustments | 57 | – |
| Balance at 30 June 2023 | 2,695 | 302 |
| Net book value: | ||
| Balance at 30 June 2023 | 215,484 | 89,920 |
| Balance at 31 December 2022 | 196,045 | 81,501 |
At 30 June 2023, major construction projects of the Group are as follows:
| Project name | Budgeted amount | Balance at 1 January 2023 | Net change for the period | Balance at 30 June 2023 | Percentage of project investment to budgeted amount | Source of funding | Accumulated Interest Capitalised at 30 June 2023 |
| RMB million | RMB million | RMB million | RMB million | RMB million | |||
| Tianjin Nangang Ethylene and Downstream High-end New Material Industry Cluster Project | 29,052 | 12,854 | 2,714 | 15,568 | 54% | Bank loans & self-financing | 298 |
| Caprolactam Industry Chain Relocation and Upgrading Transformation Development Project | 13,939 | 11,000 | 1,071 | 12,071 | 87% | Bank loans & self-financing | 220 |
| Zhenhai Refining and Chemical Refining and High-end Synthetic New Material Project | 41,639 | 6,332 | 4,464 | 10,796 | 26% | Self-financing | – |
| Western Sichuan Gas Field Leikoupo Formation Gas Reservoir Development and Construction Project | 8,591 | 3,694 | 1,188 | 4,882 | 57% | Bank loans & self-financing | 62 |
| Shandong pipe network east trunk line of natural gas pipeline project | 8,546 | 3,466 | 925 | 4,391 | 51% | Bank loans & self-financing | 50 |
| 15 | RIGHT-OF-USE ASSETS |
The Group
| Land | Others | Total | |
| RMB million | RMB million | RMB million | |
Cost: | |||
| Balance at 1 January 2023 | 171,550 | 51,800 | 223,350 |
| Additions for the period | 2,336 | 4,740 | 7,076 |
| Decreases for the period | (1,972) | (1,649) | (3,621) |
| Balance at 30 June 2023 | 171,914 | 54,891 | 226,805 |
| Less: Accumulated depreciation: | |||
| Balance at 1 January 2023 | 24,184 | 20,807 | 44,991 |
| Additions for the period | 3,317 | 3,850 | 7,167 |
| Decreases for the period | (1,003) | (1,432) | (2,435) |
| Balance at 30 June 2023 | 26,498 | 23,225 | 49,723 |
| Net book value: | |||
| Balance at 30 June 2023 | 145,416 | 31,666 | 177,082 |
| Balance at 31 December 2022 | 147,366 | 30,993 | 178,359 |
75
| 15 | RIGHT-OF-USE ASSETS (Continued) |
The Company
| Land | Others | Total | |
| RMB million | RMB million | RMB million | |
Cost: | |||
| Balance at 1 January 2023 | 102,949 | 4,326 | 107,275 |
| Additions for the period | 458 | 907 | 1,365 |
| Decreases for the period | (1,226) | (471) | (1,697) |
| Balance at 30 June 2023 | 102,181 | 4,762 | 106,943 |
| Less: Accumulated depreciation: | |||
| Balance at 1 January 2023 | 13,408 | 2,318 | 15,726 |
| Additions for the period | 1,686 | 610 | 2,296 |
| Decreases for the period | (887) | (437) | (1,324) |
| Balance at 30 June 2023 | 14,207 | 2,491 | 16,698 |
| Net book value: | |||
| Balance at 30 June 2023 | 87,974 | 2,271 | 90,245 |
| Balance at 31 December 2022 | 89,541 | 2,008 | 91,549 |
| 16 | INTANGIBLE ASSETS |
The Group
| Land use rights | Patents | Non-patent technology | Operation rights | Others | Total | |
| RMB million | RMB million | RMB million | RMB million | RMB million | RMB million | |
| Cost: | ||||||
| Balance at 1 January 2023 | 117,788 | 4,740 | 5,407 | 54,130 | 9,252 | 191,317 |
| Additions for the period | 2,461 | 30 | 417 | 461 | 1,398 | 4,767 |
| Decreases for the period | (211) | (6) | (7) | (224) | (415) | (863) |
| Balance at 30 June 2023 | 120,038 | 4,764 | 5,817 | 54,367 | 10,235 | 195,221 |
| Less: Accumulated amortisation: | ||||||
| Balance at 1 January 2023 | 31,054 | 3,669 | 4,032 | 25,724 | 4,878 | 69,357 |
| Additions for the period | 1,906 | 66 | 128 | 1,112 | 540 | 3,752 |
| Decreases for the period | (38) | (6) | (7) | (125) | (206) | (382) |
| Balance at 30 June 2023 | 32,922 | 3,729 | 4,153 | 26,711 | 5,212 | 72,727 |
| Less: Provision for impairment losses: | ||||||
| Balance at 1 January 2023 | 237 | 482 | 130 | 397 | 20 | 1,266 |
| Additions for the period | 16 | – | – | – | – | 16 |
| Decreases for the period | (3) | – | – | (21) | – | (24) |
| Balance at 30 June 2023 | 250 | 482 | 130 | 376 | 20 | 1,258 |
| Net book value: | ||||||
| Balance at 30 June 2023 | 86,866 | 553 | 1,534 | 27,280 | 5,003 | 121,236 |
| Balance at 31 December 2022 | 86,497 | 589 | 1,245 | 28,009 | 4,354 | 120,694 |
Amortisation of the intangible assets of the Group charged for the six-month period ended 30 June 2023 is RMB3,370 million (six-month period ended 30 June 2022: RMB3,212 million).
| 17 | GOODWILL |
Goodwill is allocated to the following Group’s cash-generating units:
| Name of investees | Principal activities | At 30 June | At 31 December |
| 2023 | 2022 | ||
| RMB million | RMB million | ||
| Sinopec Zhenhai Refining and Chemical Branch (“Zhenhai R&C”) | Manufacturing of intermediate petrochemical products and petroleum products | 4,043 | 4,043 |
| Sinopec Beijing Yanshan Petrochemical Branch (“Sinopec Yanshan”) | Manufacturing of intermediate petrochemical products and petroleum products | 1,004 | 1,004 |
| Other units without individual significant goodwill | 1,448 | 1,417 | |
| Total | 6,495 | 6,464 |
Goodwill represents the excess of the cost of purchase over the fair value of the underlying assets and liabilities.
76
| 18 | LONG-TERM DEFERRED EXPENSES |
Long-term deferred expenses primarily represent catalysts expenditures and improvement expenditures of leased fixed assets.
| 19 | DEFERRED TAX ASSETS AND LIABILITIES |
Deferred tax assets and liabilities before the consolidated elimination adjustments are as follows:
| Deferred tax assets | Deferred tax liabilities | |||
| At 30 June | At 31 December | At 30 June | At 31 December | |
| 2023 | 2022 | 2023 | 2022 | |
| RMB million | RMB million | RMB million | RMB million | |
| Receivables and inventories | 4,234 | 4,271 | – | (17) |
| Payables | 3,478 | 3,091 | – | – |
| Cash flow hedges | 662 | 85 | (306) | (736) |
| Fixed assets | 17,290 | 21,536 | (24,016) | (22,341) |
| Tax value of losses carried forward | 5,934 | 4,643 | – | – |
| Other equity instrument investments | 131 | 131 | (6) | (6) |
| Intangible assets | 1,033 | 1,067 | (220) | (85) |
| Right of use assets and lease liabilities | 44,559 | 45,568 | (41,023) | (42,264) |
| Others | 1,533 | 1,395 | (1,202) | (1,161) |
| Deferred tax assets/(liabilities) | 78,854 | 81,787 | (66,773) | (66,610) |
The offsetting amount between deferred tax assets and liabilities are as follows:
| At 30 June | At 31 December | |
| 2023 | 2022 | |
| RMB million | RMB million | |
| Deferred tax assets | 58,987 | 59,354 |
| Deferred tax liabilities | 58,987 | 59,354 |
Deferred tax assets and liabilities after the offsetting adjustments are as follows:
| At 30 June | At 31 December | |
| 2023 | 2022 | |
| RMB million | RMB million | |
| Deferred tax assets | 19,867 | 22,433 |
| Deferred tax liabilities | 7,786 | 7,256 |
At 30 June 2023, certain subsidiaries of the Company did not recognise deferred tax of deductible loss carried forward of RMB24,282 million (at 31 December 2022: RMB21,268 million), of which RMB3,050 million (during the six-month period ended 30 June 2022: RMB588 million) was incurred for the six-month period ended 30 June 2023, because it was not probable that the related tax benefit will be realised. These deductible losses carried forward of RMB1,869 million, RMB1,669 million, RMB3,412 million, RMB5,310 million, RMB8,972 million and RMB3,050 million will expire in 2023, 2024, 2025, 2026, 2027, 2028 and after, respectively.
Periodically, management performed assessment on the probability that future taxable profit will be available over the period which the deferred tax assets can be realised or utilised. In assessing the probability, both positive and negative evidence was considered, including whether it is probable that the operations will have sufficient future taxable profits over the periods which the deferred tax assets are deductible or utilised and whether the tax losses result from identifiable causes which are unlikely to recur.
77
| 20 | OTHER NON-CURRENT ASSETS |
Other non-current assets mainly represent long-term receivables, prepayments for construction projects, purchases of equipment and time deposits with maturities over one year.
| 21 | DETAILS OF IMPAIRMENT LOSSES |
At 30 June 2023, impairment losses of the Group are analysed as follows:
| Note | Balance at 31 December 2022 | Provision for the period | Written back for the period | Written off for the period | Other increase/ (decrease) | Balance at 30 June 2023 | ||
| RMB million | RMB million | RMB million | RMB million | RMB million | RMB million | |||
| Allowance for doubtful accounts | ||||||||
| Included: Accounts receivable | 7 | 4,079 | 195 | (168) | (3) | 109 | 4,212 | |
| Prepayments | 9 | 111 | 7 | – | – | 4 | 122 | |
| Other receivables | 10 | 1,553 | 59 | (51) | (1) | 2 | 1,562 | |
| Other non-current assets | 1,185 | – | – | – | 50 | 1,235 | ||
| 6,928 | 261 | (219) | (4) | 165 | 7,131 | |||
| Inventories | 11 | 6,583 | 2,421 | (92) | (3,646) | 69 | 5,335 | |
| Long-term equity investments | 12 | 3,890 | – | – | – | 80 | 3,970 | |
| Fixed assets | 13 | 102,259 | 34 | – | (361) | 80 | 102,012 | |
| Construction in progress | 14 | 2,647 | – | – | (9) | 57 | 2,695 | |
| Intangible assets | 16 | 1,266 | – | – | (3) | (5) | 1,258 | |
| Goodwill | 7,861 | – | – | – | – | 7,861 | ||
| Others | 57 | – | (5) | – | – | 52 | ||
| Total | 131,491 | 2,716 | (316) | (4,023) | 446 | 130,314 | ||
The reasons for recognising impairment losses are set out in the respective notes of respective assets.
| 22 | SHORT-TERM LOANS |
The Group’s short-term loans represent:
| At 30 June 2023 | At 31 December 2022 | ||||||
| Original currency million | Exchange rates | RMB million | Original currency million | Exchange rates | RMB million | ||
| Short-term bank loans | 86,318 | 14,461 | |||||
| – Renminbi loans | 86,318 | 14,325 | |||||
| – US Dollar loans | – | 7.2258 | – | 20 | 6.9646 | 136 | |
| Short-term loans from Sinopec Group Company and fellow subsidiaries | 12,814 | 6,852 | |||||
| – Renminbi loans | 8,082 | 5,911 | |||||
| – US Dollar loans | 655 | 7.2258 | 4,732 | 130 | 6.9646 | 906 | |
| – Euro loans | – | 7.8771 | – | 5 | 7.4229 | 35 | |
| Total | 99,132 | 21,313 | |||||
At 30 June 2023, the Group’s interest rates on short-term loans were from interest 1.31% to 6.20% (At 31 December 2022: from interest 1.65% to 5.51%) per annum. The majority of the above loans are by credit.
At 30 June 2023 and 31 December 2022, the Group had no significant overdue short-term loans.
| 23 | BILLS PAYABLE |
Bills payable primarily represented bank accepted bills for the purchase of material, goods and products. Bills payable were due within one year.
At 30 June 2023 and 31 December 2022 the Group had no overdue unpaid bills.
| 24 | ACCOUNTS PAYABLE |
At 30 June 2023 and 31 December 2022, the Group had no individually significant accounts payable aged over one year.
78
| 25 | CONTRACT LIABILITIES |
As at 30 June 2023 and 31 December 2022, the Group’s contract liabilities primarily represent advances from customers. Related performance obligations are satisfied and revenue is recognised within one year.
| 26 | EMPLOYEE BENEFITS PAYABLE |
| (1) | Employee benefits payable: |
| At 31 December 2022 | Accrued during the period | Decreased during the period | At 30 June 2023 | |
| RMB million | RMB million | RMB million | RMB million | |
| Short-term employee benefits | 13,536 | 45,405 | (37,221) | 21,720 |
| Post-employment benefits- defined contribution plans | 73 | 7,431 | (7,051) | 453 |
| Termination benefits | 8 | 71 | (71) | 8 |
| 13,617 | 52,907 | (44,343) | 22,181 |
| (2) | Short-term employee benefits |
| At 31 December 2022 | Accrued during the period | Decreased during the period | At 30 June 2023 | ||
| RMB million | RMB million | RMB million | RMB million | ||
| Salaries, bonuses, allowances | 11,241 | 32,860 | (25,037) | 19,064 | |
| Staff welfare | 1,635 | 3,323 | (3,328) | 1,630 | |
| Social insurance | 308 | 3,469 | (3,288) | 489 | |
| Included: Medical insurance | 304 | 3,178 | (2,997) | 485 | |
| Work-related injury insurance | 3 | 230 | (230) | 3 | |
| Maternity insurance | 1 | 61 | (61) | 1 | |
| Housing fund | 47 | 3,717 | (3,541) | 223 | |
| Labour union fee, staff and workers’ education fee | 265 | 874 | (960) | 179 | |
| Other short-term employee benefits | 40 | 1,162 | (1,067) | 135 | |
| 13,536 | 45,405 | (37,221) | 21,720 | ||
| (3) | Post-employment benefits – defined contribution plans |
| At 31 December 2022 | Accrued during the period | Decreased during the period | At 30 June 2023 | |
| RMB million | RMB million | RMB million | RMB million | |
| Basic pension insurance | 63 | 5,025 | (4,647) | 441 |
| Unemployment insurance | 2 | 175 | (175) | 2 |
| Annuity | 8 | 2,231 | (2,229) | 10 |
| 73 | 7,431 | (7,051) | 453 |
| 27 | TAXES PAYABLE |
The Group
| At 30 June | At 31 December | |
| 2023 | 2022 | |
| RMB million | RMB million | |
| Value-added tax payable | 1,916 | 934 |
| Consumption tax payable | 17,481 | 13,038 |
| Income tax payable | 3,802 | 4,725 |
| Mineral resources compensation fee payable | 6 | 6 |
| Other taxes | 7,855 | 9,676 |
| Total | 31,060 | 28,379 |
79
| 28 | OTHER PAYABLES |
At 30 June 2023 and 31 December 2022, other payables of the Group over one year primarily represented payables for constructions.
| 29 | NON-CURRENT LIABILITIES DUE WITHIN ONE YEAR |
The Group’s non-current liabilities due within one year represent:
| At 30 June 2023 | At 31 December 2022 | ||||||
| Original currency million | Exchange rates | RMB million | Original currency million | Exchange rates | RMB million | ||
| Long-term bank loans | |||||||
| – Renminbi loans | 4,631 | 13,875 | |||||
| – US Dollar loans | – | 7.2258 | – | – | 6.9646 | 1 | |
| Long-term loans from Sinopec Group Company and fellow subsidiaries | |||||||
| – Renminbi loans | 362 | 440 | |||||
| Long term loans due within one year | 4,993 | 14,316 | |||||
| Debentures payable due within one year | |||||||
| – Renminbi debentures | 2,000 | 30,700 | |||||
| Lease liabilities due within one year | 17,318 | 16,004 | |||||
| Others | 3,613 | 1,824 | |||||
| Non-current liabilities due within one year | 27,924 | 62,844 | |||||
At 30 June 2023 and 31 December 2022, the Group had no significant overdue long-term loans.
| 30 | OTHER CURRENT LIABILITIES |
As at 30 June 2023, other current liabilities mainly represent RMB12,700 million (31 December 2022: RMB14,300 million) output VAT to be transferred.
| 31 | LONG-TERM LOANS |
Long-term loans are primarily unsecured, and carried at amortised costs. The Group’s long-term loans represent:
| At 30 June 2023 | At 31 December 2022 | |||||||
| Interest rate and final maturity | Original currency million | Exchange rates | RMB million | Original currency million | Exchange rates | RMB million | ||
| Long-term bank loans | ||||||||
| – Renminbi loans | Interest rates ranging from interest 1.00% to 4.80% per annum at 30 June 2023 (2022:1.00% to 4.66%) with maturities through 2040 | 140,947 | 86,532 | |||||
| – US Dollar loans | Interest rates at 0.00% per annum at 30 June 2023 (2022: 0.00%) with maturities through 2038 | 7 | 7.2258 | 53 | 8 | 6.9646 | 53 | |
| Less: Portion with one year (note 29) | (4,631) | (13,876) | ||||||
| Long-term bank loans | 136,369 | 72,709 | ||||||
| Long-term loans from Sinopec Group Company and fellow subsidiaries | ||||||||
| – Renminbi loans | Interest rates ranging from interest 1.08% to 5.23% per annum at 30 June 2023 (2022: 1.08% to 5.23%)with maturities through 2037 | 24,010 | 22,695 | |||||
| Less: Portion with one year (note 29) | (362) | (440) | ||||||
| Long-term loans from Sinopec Group | 23,648 | 22,255 | ||||||
| Company and fellow subsidiaries | ||||||||
| Total | 160,017 | 94,964 | ||||||
80
| 31 | LONG-TERM LOANS (Continued) |
The maturity analysis of the Group’s long-term loans is as follows:
| At 30 June | At 31 December | |
| 2023 | 2022 | |
| RMB million | RMB million | |
| Between one and two years | 52,387 | 10,852 |
| Between two and five years | 87,758 | 73,387 |
| After five years | 19,872 | 10,725 |
| Total | 160,017 | 94,964 |
| 32 | DEBENTURES PAYABLE |
The Group
| At 30 June | At 31 December | |
| 2023 | 2022 | |
| RMB million | RMB million | |
| Debentures payable: | ||
| – Corporate Bonds (i) | 15,130 | 43,697 |
| Less: Portion with one year (note 29) | 2,000 | 30,700 |
| Total | 13,130 | 12,997 |
Note:
| (i) | These corporate bonds are carried at amortised cost. At 30 June 2023, USD denominated corporate bonds were equivalent to RMB3,591 million, and RMB denominated corporate bonds were RMB11,539 million (31 December 2022: USD denominated corporate bonds of RMB12,164 million, and RMB denominated corporate bonds of RMB31,533 million). |
| 33 | LEASE LIABILITY |
The Group
| At 30 June | At 31 December | |
| 2023 | 2022 | |
| RMB million | RMB million | |
| Lease liabilities | 182,685 | 182,411 |
| Deduct: Portion of lease liabilities with one year (note 29) | 17,318 | 16,004 |
| Total | 165,367 | 166,407 |
| 34 | PROVISIONS |
Provisions primarily represent provision for future dismantlement costs of oil and gas properties. The Group has established certain standardised measures for the dismantlement of its retired oil and gas properties by making reference to the industry practices and is thereafter constructively obligated to take dismantlement measures of its retired oil and gas properties. Movement of provision of the Group’s obligations for the dismantlement of its retired oil and gas properties is as follows:
| The Group | |
| RMB million | |
| Balance at 1 January 2023 | 43,599 |
| Provision for the period | 750 |
| Accretion expenses | 564 |
| Decrease for the period | (327) |
| Exchange adjustments | 87 |
| Balance at 30 June 2023 | 44,673 |
81
| 35 | OTHER NON-CURRENT LIABILITIES |
Other non-current liabilities primarily represent long-term payables, special payables and deferred income.
| 36 | SHARE CAPITAL |
The Group
| At 30 June | At 31 December | |
| 2023 | 2022 | |
| RMB million | RMB million | |
| Registered, issued and fully paid: | ||
| 95,115,471,046 listed A shares (31 December 2022: 95,115,471,046) of RMB1.00 each | 95,115 | 95,115 |
| 24,780,936,600 listed H shares (31 December 2022: 24,780,936,600) of RMB1.00 each | 24,781 | 24,781 |
| Total | 119,896 | 119,896 |
The Company was established on 25 February 2000 with a registered capital of 68.8 billion domestic state-owned shares with a par value of RMB1.00 each. Such shares were issued to Sinopec Group Company in consideration for the assets and liabilities transferred to the Company (Note 1).
Pursuant to the resolutions passed at an Extraordinary General Meeting held on 25 July 2000 and approvals from relevant government authorities, the Company is authorised to increase its share capital to a maximum of 88.3 billion shares with a par value of RMB1.00 each and offer not more than 19.5 billion shares with a par value of RMB1.00 each to investors outside the PRC. Sinopec Group Company is authorised to offer not more than 3.5 billion shares of its shareholdings in the Company to investors outside the PRC. The shares sold by Sinopec Group Company to investors outside the PRC would be converted into H shares.
In October 2000, the Company issued 15,102,439,000 H shares with a par value of RMB1.00 each, representing 12,521,864,000 H shares and 25,805,750 American Depositary Shares (“ADSs”, each representing 100 H shares), at prices of HKD1.59 per H share and USD20.645 per ADS, respectively, by way of a global initial public offering to Hong Kong SAR and overseas investors. As part of the global initial public offering, 1,678,049,000 state-owned ordinary shares of RMB1.00 each owned by Sinopec Group Company were converted into H shares and sold to Hong Kong SAR and overseas investors.
In July 2001, the Company issued 2.8 billion listed A shares with a par value of RMB1.00 each at RMB4.22 by way of a public offering to natural persons and institutional investors in the PRC.
During the year ended 31 December 2010, the Company issued 88,774 listed A shares with a par value of RMB1.00 each, as a result of exercise of 188,292 warrants entitled to the Bonds with Warrants.
During the year ended 31 December 2011, the Company issued 34,662 listed A shares with a par value of RMB1.00 each, as a result of conversion by the holders of the 2011 Convertible Bonds.
During the year ended 31 December 2012, the Company issued 117,724,450 listed A shares with a par value of RMB1.00 each, as a result of conversion by the holders of the 2011 Convertible Bonds.
On 14 February 2013, the Company issued 2,845,234,000 listed H shares (“the Placing”) with a par value of RMB1.00 each at the Placing Price of HKD8.45 per share. The aggregate gross proceeds from the Placing amounted to approximately HKD24,042,227,300.00 and the aggregate net proceeds (after deduction of the commissions and estimated expenses) amounted to approximately HKD23,970,100,618.00.
In June 2013, the Company issued 21,011,962,225 listed A shares and 5,887,716,600 listed H shares as a result of bonus issues of 2 shares converted from the retained earnings, and 1 share transferred from capital reserve for every 10 existing shares.
During the year ended 31 December 2013, the Company issued 114,076 listed A shares with a par value of RMB1.00 each, as a result of exercise of conversion by the holders of the 2011 Convertible Bonds.
During the year ended 31 December 2014, the Company issued 1,715,081,853 listed A shares with a par value of RMB1.00 each, as a result of exercise of conversion by the holders of the 2011 Convertible Bonds.
During the year ended 31 December 2015, the Company issued 2,790,814,006 listed A shares with a par value of RMB1.00 each, as a result of conversion by the holders of the 2011 Convertible Bonds.
During the year ended 31 December 2022, the Company repurchased 442,300,000 listed A shares and 732,502,000 listed H shares respectively, which had been cancelled in the year ended 31 December 2022.
All A shares and H shares rank pari passu in all material aspects.
82
| 36 | SHARE CAPITAL (Continued) |
Capital management
Management optimises the structure of the Group’s capital, which comprises of equity and debts and bonds. In order to maintain or adjust the capital structure of the Group, management may cause the Group to issue new shares, adjust the capital expenditure plan, sell assets to reduce debt, or adjust the proportion of short-term and long-term loans and bonds. Management monitors capital on the basis of the debt-to-capital ratio, which is calculated by dividing long-term loans (excluding current portion) and debentures payable, by the total of equity attributable to shareholders of the Company and long-term loans (excluding current portion) and debentures payable, and liability-to-asset ratio, which is calculated by dividing total liabilities by total assets. Management’s strategy is to make appropriate adjustments according to the Group’s operating and investment needs and the changes of market conditions, and to maintain the debt-to-capital ratio and the liability-to-asset ratio of the Group at a range considered reasonable. As at 30 June 2023, the debt-to-capital ratio and the liability-to-asset ratio of the Group were 17.9% (31 December 2022: 12.0%) and 53.2% (31 December 2022: 51.8%), respectively.
The schedule of the contractual maturities of loans, debentures payable and commitments are disclosed in Notes 31, 32 and 60, respectively.
There were no changes in the management’s approach to capital management of the Group during the period. Neither the Company nor any of its subsidiaries is subject to externally imposed capital requirements.
83
| 37 | CAPITAL RESERVE |
The movements in capital reserve of the Group are as follows:
| RMB million | |
| Balance at 1 January 2023 | 118,875 |
| Other equity movements under the equity method | (171) |
| Transactions with non-controlling interests | (5) |
| Others | 31 |
| Balance at 30 June 2023 | 118,730 |
Capital reserve represents mainly: (a) the difference between the total amount of the par value of shares issued and the amount of the net assets transferred from Sinopec Group Company in connection with the Reorganisation; (b) share premiums derived from issuances of H shares and A shares by the Company and excess of cash paid by investors over their proportionate shares in share capital, the proportionate shares of unexercised portion of the Bond with Warrants at the expiration date, and the amount transferred from the proportionate liability component and the derivative component of the converted portion of the 2011 Convertible Bonds; (c) difference between consideration paid for the combination of entities under common control and the transactions with non-controlling interests over the carrying amount of the net assets acquired.
| 38 | OTHER COMPREHENSIVE INCOME |
The Group
| (a) | The changes of other comprehensive income in consolidated income statement |
| Six-month period ended 30 June 2023 | ||||
| Before-tax amount | Tax effect | Net-of-tax amount | ||
| RMB million | RMB million | RMB million | ||
Cash flow hedges: | ||||
| Effective portion of changes in fair value of hedging instruments recognised during the period | (1,399) | 489 | (910) | |
Less: Reclassification adjustments for amounts transferred to the consolidated income statement | 2,017 | (289) | 1,728 | |
| Subtotal | (3,416) | 778 | (2,638) | |
| Changes in fair value of other equity instrument investments | (1) | – | (1) | |
| Other comprehensive loss that can be reclassified to profit or loss under the equity method | (6,524) | – | (6,524) | |
| Foreign currency translation differences | 4,069 | – | 4,069 | |
| Other comprehensive income | (5,872) | 778 | (5,094) | |
| Six-month period ended 30 June 2022 | ||||
| Before-tax amount | Tax effect | Net-of-tax amount | ||
| RMB million | RMB million | RMB million | ||
| Cash flow hedges: | ||||
| Effective portion of changes in fair value of hedging instruments recognised during the period | 2,330 | (888) | 1,442 | |
| Less: Reclassification adjustments for amounts transferred to the consolidated income statement | (10,637) | 1,821 | (8,816) | |
| Subtotal | 12,967 | (2,709) | 10,258 | |
| Cost of hedging reserve | (844) | – | (844) | |
| Changes in fair value of other equity instrument investments | (14) | (3) | (17) | |
| Other comprehensive income that can be reclassified to profit or loss under the equity method | 3,397 | – | 3,397 | |
| Foreign currency translation differences | 3,913 | – | 3,913 | |
| Other comprehensive income | 19,419 | (2,712) | 16,707 | |
84
| 38 | OTHER COMPREHENSIVE INCOME (Continued) |
The Group (Continued)
| (b) | The change of each item in other comprehensive income |
| Equity attributable to shareholders of the company | Non-controlling interests | Total other comprehensive income | ||||||
| Other comprehensive income that can be reclassified to profit or loss under the equity method | Changes in fair value of other equity instrument investments | Cost of hedging reserve | Cash flow hedges | Foreign currency translation differences | Subtotal | |||
| RMB million | RMB million | RMB million | RMB million | RMB million | RMB million | RMB million | RMB million | |
| 1 January 2022 | (5,765) | (18) | (29) | 7,214 | (2,092) | (690) | (3,315) | (4,005) |
| Change for the period | 3,514 | (13) | (422) | 885 | 3,283 | 7,247 | 244 | 7,491 |
| 30 June 2022 | (2,251) | (31) | (451) | 8,099 | 1,191 | 6,557 | (3,071) | 3,486 |
| 1 January 2023 | (4,155) | (83) | 294 | 3,024 | 3,992 | 3,072 | (1,051) | 2,021 |
| Change for the period | (4,210) | (1) | – | (3,711) | 3,445 | (4,477) | (1,653) | (6,130) |
| 30 June 2023 | (8,365) | (84) | 294 | (687) | 7,437 | (1,405) | (2,704) | (4,109) |
As at 30 June 2023, cash flow hedge reserve amounted to a loss of RMB595 million (31 December 2022: a gain of RMB3,079 million), of which a loss of RMB687 million was attribute to shareholders of the Company (31 December 2022: a gain of RMB3,024 million).
| 39 | SURPLUS RESERVES |
Movements in surplus reserves are as follows:
| The Group | |||
| Statutory | Discretionary | ||
| surplus reserve | surplus reserves | Total | |
| RMB million | RMB million | RMB million | |
| Balance at 1 January 2023 | 101,009 | 117,000 | 218,009 |
| Appropriation | – | – | – |
| Balance at 30 June 2023 | 101,009 | 117,000 | 218,009 |
The PRC Company Law and Articles of Association of the Company have set out the following profit appropriation plans:
| (a) | 10% of the net profit is transferred to the statutory surplus reserve. In the event that the reserve balance reaches 50% of the registered capital, no transfer is needed; |
| (b) | After the transfer to the statutory surplus reserve, a transfer to discretionary surplus reserve can be made upon the passing of a resolution at the shareholders’ meeting. |
| 40 | OPERATING INCOME AND OPERATING COSTS |
| Six-month period ended 30 June | ||||
| The Group | The Company | |||
| 2023 | 2022 | 2023 | 2022 | |
| RMB million | RMB million | RMB million | RMB million | |
| Income from principal operations | 1,561,502 | 1,582,236 | 572,545 | 636,090 |
| Income from other operations | 32,180 | 29,890 | 14,740 | 14,340 |
| Total | 1,593,682 | 1,612,126 | 587,285 | 650,430 |
| Operating costs | 1,351,561 | 1,330,825 | 473,949 | 521,323 |
The income from principal operations mainly represents revenue from the sales of refined petroleum products, chemical products, crude oil and natural gas. The income from other operations mainly represents revenue from sale of materials, service, rental income and others. Operating costs primarily represent the products cost related to the principal operations. The Group’s segmental information is set out in Note 62.
85
| 40 | OPERATING INCOME AND OPERATING COSTS (Continued) |
The detailed information about the Group’s operating income is as follows:
| Six-month period ended 30 June | |||
| 2023 | 2022 | ||
| RMB million | RMB million | ||
| Income from principal operations | 1,561,502 | 1,582,236 | |
| Included: Gasoline | 422,630 | 389,830 | |
| Diesel | 341,682 | 327,767 | |
| Crude oil | 248,764 | 278,099 | |
| Chemical feedstock | 20,448 | 23,059 | |
| Basic organic chemicals | 99,556 | 116,963 | |
| Synthetic resin | 63,087 | 74,451 | |
| Kerosene | 95,860 | 71,419 | |
| Natural gas | 41,690 | 38,017 | |
| Synthetic fiber monomers and polymers | 16,413 | 25,186 | |
| Others (i) | 211,372 | 237,445 | |
| Income from other operations | 32,180 | 29,890 | |
| Included: Sale of materials and others | 31,563 | 29,329 | |
| Rental income | 617 | 561 | |
| Total | 1,593,682 | 1,612,126 | |
Notes:
| (i) | Others are primarily liquefied petroleum gas and other refinery and chemical byproducts and joint products and so on. |
| (ii) | The above operating incomes, except rental income, are all income from contracts. |
| 41 | TAXES AND SURCHARGES |
The Group
| Six-month period ended 30 June | ||
| 2023 | 2022 | |
| RMB million | RMB million | |
| Consumption tax | 104,049 | 103,510 |
| City construction tax | 8,302 | 9,011 |
| Special oil income levy | 2,321 | 8,095 |
| Education surcharge | 6,096 | 6,486 |
| Resources tax | 3,936 | 4,404 |
| Others | 2,557 | 2,903 |
| Total | 127,261 | 134,409 |
The applicable tax rate of the taxes and surcharges are set out in Note 4.
| 42 | FINANCIAL EXPENSES |
The Group
| Six-month period ended 30 June | ||
| 2023 | 2022 | |
| RMB million | RMB million | |
| Interest expenses incurred | 4,745 | 3,605 |
| Less: Capitalised interest expenses | 752 | 597 |
| Add: Interest expense on lease liabilities | 4,492 | 4,595 |
| Net interest expenses | 8,485 | 7,603 |
| Accretion expenses (Note 34) | 564 | 521 |
| Interest income | (3,239) | (3,012) |
| Net foreign exchange (gain)/loss | (1,020) | 225 |
| Total | 4,790 | 5,337 |
The interest rates per annum at which borrowing costs were capitalised during the six-month period ended 30 June 2023 by the Group ranged from 1.66% to 3.35% (six-month period ended 30 June 2022: 2.70% to 4.50%).
86
| 43 | CLASSIFICATION OF EXPENSES BY NATURE |
The operating costs, selling and distribution expenses, general and administrative expenses, research and development expenses and exploration expenses (including dry holes) in consolidated income statement classified by nature are as follows:
| Six-month period ended 30 June | ||
| 2023 | 2022 | |
| RMB million | RMB million | |
| Purchased crude oil, products and operating supplies and expenses | 1,282,882 | 1,262,183 |
| Personnel expenses | 49,949 | 49,223 |
| Depreciation, depletion and amortisation | 55,239 | 53,638 |
| Exploration expenses (including dry holes) | 4,882 | 5,738 |
| Other expenses | 26,144 | 26,404 |
| Total | 1,419,096 | 1,397,186 |
| 44 | SELLING AND DISTRIBUTION EXPENSES |
Selling expenses mainly include wages and salaries of sales staff, depreciation and amortization of sales equipment and related systems, etc.
| 45 | GENERAL AND ADMINISTRATIVE EXPENSES |
Administrative expenses mainly include wages and salaries of administrative personnel, depreciation and amortization of office facilities, office systems and software, and repair costs.
| 46 | RESEARCH AND DEVELOPMENT EXPENSES |
The research and development expenditures are mainly used for the replacement of resources in upstream, optimising structure and operation upgrades in refining segment, structured adjustment of materials and products in chemical segment.
| 47 | EXPLORATION EXPENSES |
Exploration expenses include geological and geophysical expenses and written-off of unsuccessful dry hole costs.
| 48 | OTHER INCOME |
Other income are mainly the government grants related to the business activities.
| 49 | INVESTMENT INCOME/(LOSS) |
| Six-month period ended 30 June | ||||
| The Group | The Company | |||
| 2023 | 2022 | 2023 | 2022 | |
| RMB million | RMB million | RMB million | RMB million | |
| Income from investment of subsidiaries accounted for under cost method | – | – | 16,447 | 13,431 |
| Income from investment accounted for under equity method | 2,611 | 7,327 | 2,531 | 3,014 |
| Investment income from disposal of long-term equity investments | 21 | 69 | 1 | 2 |
| Dividend income from holding of other equity instrument investments | 3 | 14 | – | – |
| Investment (loss)/gain from disposal/holding of financial assets and liabilities and derivative financial instruments at fair value through profit or loss | (205) | (17,331) | 236 | – |
| Gain/(loss) from ineffective portion of cash flow hedges | 636 | (430) | (447) | 175 |
| Others | 225 | 44 | 613 | 678 |
| Total | 3,291 | (10,307) | 19,381 | 17,300 |
87
| 50 | GAINS/(LOSSES) FROM CHANGES IN FAIR VALUE |
The Group
| Six-month period ended 30 June | ||
| 2023 | 2022 | |
| RMB million | RMB million | |
| Net fair value gains/(losses) on financial assets and financial liabilities at fair value through profit or loss | 804 | (1,972) |
| Unrealised gains from ineffective portion cash flow hedges, net | 671 | 414 |
| Total | 1,475 | (1,558) |
| 51 | IMPAIRMENT LOSSES |
The Group
| Six-month period ended 30 June | ||
| 2023 | 2022 | |
| RMB million | RMB million | |
| Prepayments | 7 | 22 |
| Inventories | 2,329 | 1,436 |
| Fixed assets | 34 | 2 |
| Others | (5) | (4) |
| Total | 2,365 | 1,456 |
| 52 | NON-OPERATING INCOME |
The Group
| Six-month period ended 30 June | ||
| 2023 | 2022 | |
| RMB million | RMB million | |
| Government grants | 275 | 156 |
| Others | 665 | 699 |
| Total | 940 | 855 |
| 53 | NON-OPERATING EXPENSES |
The Group
| Six-month period ended 30 June | ||
| 2023 | 2022 | |
| RMB million | RMB million | |
| Fines, penalties and compensation | 22 | 14 |
| Donations | 15 | 101 |
| Asset scrap, damage loss | 264 | 171 |
| Others | 659 | 793 |
| Total | 960 | 1,079 |
88
| 54 | INCOME TAX EXPENSE |
The Group
| Six-month period ended 30 June | ||
| 2023 | 2022 | |
| RMB million | RMB million | |
| Provision for income tax for the period | 7,474 | 14,135 |
| Deferred taxation | 4,065 | (472) |
| Under-provision for income tax in respect of preceding year | (1,369) | 370 |
| Total | 10,170 | 14,033 |
Reconciliation between actual income tax expense and accounting profit at applicable tax rates is as follows:
| Six-month period ended 30 June | ||
| 2023 | 2022 | |
| RMB million | RMB million | |
| Profit before taxation | 50,646 | 63,977 |
| Expected income tax expense at a tax rate of 25% | 12,662 | 15,994 |
| Tax effect of non-deductible expenses | 1,589 | 1,552 |
| Tax effect of non-taxable income | (1,162) | (1,843) |
| Tax effect of preferential tax rate (i) | (1,572) | (1,539) |
| Effect of income taxes at foreign operations | (754) | 54 |
| Tax effect of utilisation of previously unrecognised tax losses and temporary differences | (29) | (732) |
| Tax effect of tax losses not recognised | 763 | 147 |
| Write-down of deferred tax assets | 42 | 30 |
| Adjustment for under provision for income tax in respect of preceding years | (1,369) | 370 |
| Actual income tax expense | 10,170 | 14,033 |
Note:
| (i) | The provision for PRC current income tax is based on a statutory income tax rate of 25% of the assessable income of the Group as determined in accordance with the relevant income tax rules and regulations of the PRC, except for certain entities of the Group in western regions in the PRC are taxed at preferential income tax rate of 15%. According to Announcement [2020] No.23 of the MOF “Announcement of the MOF, the State Taxation Administration and the National Development and Reform Commission on continuation of the income tax policy of western development enterprises”, the preferential income tax rate extends from 1 January 2021 to 31 December 2030. |
| 55 | DIVIDENDS |
| (a) | Dividends of ordinary shares declared after the balance sheet date |
Pursuant to the Company’s Articles of Association and a resolution passed at the Directors’ meeting on 25 August 2023, the directors authorised to declare the interim dividends for the year ended 31 December 2023 of RMB0.145 (2022: RMB0.16) per share totalling RMB17,385 million (2022: RMB19,371 million). Dividends declared after the date of the statement of financial position are not recognised as a liability at the date of the statement of financial position.
| (b) | Dividends of ordinary shares declared during the period |
Pursuant to the shareholders’ approval at the Annual General Meeting on 30 May 2023, a final dividend of RMB0.195 per share totaling RMB23,380 million according to total shares of 20 June 2023 was approved. All dividends have been paid in June 2023.
Pursuant to the shareholders’ approval at the Annual General Meeting on 18 May 2022, a final dividend of RMB0.31 per share totaling RMB37,532 million according to total shares on 9 June 2022 was approved. All dividends have been paid in June 2022.
89
| 56 | SUPPLEMENTAL INFORMATION TO THE CASH FLOW STATEMENT |
The Group
| (a) | Reconciliation of net profit to cash flows from operating activities: |
| Six-month period ended 30 June | |||
| 2023 | 2022 | ||
| RMB million | RMB million | ||
| Net profit | 40,476 | 49,944 | |
| Add: Impairment losses on assets | 2,365 | 1,456 | |
| Credit impairment losses/(reversals) | 35 | (72) | |
| Depreciation of right-of-use assets | 6,902 | 6,544 | |
| Depreciation of fixed assets | 42,989 | 42,020 | |
| Amortisation of intangible assets and long-term deferred expenses | 5,348 | 5,074 | |
| Dry hole costs written off | 3,094 | 3,725 | |
| Net (gain)/loss on disposal of non-current assets | (605) | 36 | |
| Fair value (gain)/loss | (1,475) | 1,558 | |
| Financial expenses | 5,810 | 5,112 | |
| Investment (income)/loss | (3,291) | 10,307 | |
| Decrease in deferred tax assets | 3,581 | 378 | |
| Increase/(decrease) in deferred tax liabilities | 484 | (850) | |
| Increase in inventories | (40,263) | (79,034) | |
| Safety fund reserve | 1,091 | 1,043 | |
| Increase in operating receivables | (15,937) | (49,228) | |
| (Decrease)/Increase in operating payables | (23,042) | 6,934 | |
| Net cash flow from operating activities | 27,562 | 4,947 | |
| (b) | Net change in cash: |
| Six-month period ended 30 June | ||
| 2023 | 2022 | |
| RMB million | RMB million | |
| Cash balance at the end of the period | 94,874 | 139,178 |
| Less: Cash at the beginning of the period | 93,438 | 108,590 |
| Net increase of cash | 1,436 | 30,588 |
| (c) | The analysis of cash held by the Group is as follows: |
| Six-month period ended 30 June | |||
| 2023 | 2022 | ||
| RMB million | RMB million | ||
| Cash at bank and on hand | |||
| – Cash on hand | 2 | – | |
| – Demand deposits | 94,872 | 139,178 | |
| Cash at the end of the period | 94,874 | 139,178 | |
| (d) | Other cash paid relating to financing activities: |
| Six-month period ended 30 June | ||
| 2023 | 2022 | |
| RMB million | RMB million | |
| Repayments of lease liabilities | 9,703 | 7,166 |
| Others | 183 | 1,774 |
| Total | 9,886 | 8,940 |
90
| 57 | RELATED PARTIES AND RELATED PARTY TRANSACTIONS |
| (1) | Related parties having the ability to exercise control over the Group |
| The name of the company | : | China Petrochemical Corporation |
| Unified social credit identifier | : | 9111000010169286X1 |
| Registered address | : | No. 22, Chaoyangmen North Street, Chaoyang District, Beijing |
| Principal activities | : | Exploration, production, storage and transportation (including pipeline transportation), sales and utilisation of crude oil and natural gas; refining; wholesale and retail of gasoline, kerosene and diesel; production, sales, storage and transportation of petrochemical and other chemical products; industrial investment and investment management; exploration, construction, installation and maintenance of petroleum and petrochemical constructions and equipments; manufacturing electrical equipment; research, development, application and consulting services of information technology and alternative energy products; import & export of goods and technology. |
| Relationship with the Group | : | Ultimate holding company |
| Types of legal entity | : | State-owned |
| Authorised representative | : | Ma Yongsheng |
| Registered capital | : | RMB326,547 million |
Sinopec Group Company is an enterprise controlled by the PRC government. Sinopec Group Company directly and indirectly holds 67.84% shareholding of the Company.
| (2) | Related parties not having the ability to exercise control over the Group |
Related parties under common control of a parent company with the Company:
Sinopec Finance (Note)
Sinopec Shengli Petroleum Administration Bureau
Sinopec Zhongyuan Petroleum Exploration Bureau
Sinopec Assets Management Corporation
Sinopec Engineering Incorporation
Sinopec Century Bright Capital Investment Limited
Sinopec Petroleum Storage and Reserve Limited
Associates of the Group:
PipeChina
Sinopec Finance
Sinopec Capital
Zhongtian Synergetic Energy
CIR
Joint ventures of the Group:
FREP
BASF-YPC
Taihu
Sinopec SABIC Tianjin
Shanghai SECCO
| Note: | Sinopec Finance is under common control of a parent company with the Company and is also the associate of the Group. |
91
| 57 | RELATED PARTIES AND RELATED PARTY TRANSACTIONS (Continued) |
| (3) | The principal related party transactions with Sinopec Group Company and fellow subsidiaries, associates and joint ventures, which were carried out in the ordinary course of business, are as follows: |
| The Group | |||
| Note | Six-month period ended 30 June | ||
| 2023 | 2022 | ||
| RMB million | RMB million | ||
| Sales of goods | (i) | 193,947 | 169,483 |
| Purchases | (ii) | 96,702 | 80,755 |
| Transportation and storage | (iii) | 14,582 | 9,474 |
| Exploration and development services | (iv) | 16,331 | 15,512 |
| Production related services | (v) | 17,064 | 19,092 |
| Agency commission income | (vi) | 93 | 91 |
| Interest income | (vii) | 1,053 | 382 |
| Interest expense | (viii) | 571 | 216 |
| Net deposits (withdraw from)/placed with related parties | (vii) | (1,785) | 17,410 |
| Net funds obtained from related parties | (ix) | 22,779 | 29,695 |
The amounts set out in the table above in respect of the six-month periods ended 30 June 2023 and 2022 represent the relevant costs and income as determined by the corresponding contracts with the related parties.
Included in the transactions disclosed above, for the six-month period ended 30 June 2023 are: a) purchases by the Group from Sinopec Group Company and fellow subsidiaries amounting to RMB79,655 million (six-month period ended 30 June 2022: RMB68,143 million) comprising purchases of products and services (i.e. procurement, transportation and storage, exploration and development services and production related services) of RMB72,989 million (six-month period ended 30 June 2022: RMB61,818 million), lease charges for land, buildings and others paid by the Group of RMB5,464 million, RMB517 million and RMB114 million (six-month period ended 30 June 2022: RMB5,568 million, RMB470 million and RMB71 million), respectively and interest expenses of RMB571 million (six-month period ended 30 June 2022: RMB216 million); and b) sales by the Group to Sinopec Group Company and fellow subsidiaries amounting to RMB38,565 million (six-month period ended 30 June 2022: RMB31,238 million), comprising RMB37,470 million (six-month period ended 30 June 2022: RMB30,832 million) for sales of goods, RMB1,053 million (six-month period ended 30 June 2022: RMB382 million) for interest income and RMB42 million (six-month period ended 30 June 2022: RMB24 million) for agency commission income.
For the six-month period ended 30 June 2023, no individually significant right-of-use assets were leased from Sinopec Group Company and fellow subsidiaries, associates and joint ventures by the Group. The interest expense recognised for the six-month period ended 30 June 2023 on lease liabilities in respect of amounts due to Sinopec Group Company and fellow subsidiaries, associates and joint ventures was RMB3,843 million (six-month period ended 30 June 2022: RMB3,953 million).
For the six-month period ended 30 June 2023, the amount of rental the Group paid to Sinopec Group Company and fellow subsidiaries, associates and joint ventures for land, buildings and others are RMB5,468 million, RMB518 million and RMB140 million (six-month period ended 30 June 2022: RMB5,571 million, RMB471 million and RMB133 million).
As at 30 June 2023 and 31 December 2022, there was no guarantee given to banks by the Group in respect of banking facilities to Sinopec Group Company and fellow subsidiaries, associates and joint ventures, except for the guarantees disclosed in Note 61(b). Guarantees given to banks by the Group in respect of banking facilities to associates and joint ventures are disclosed in Note 61(b).
Notes:
| (i) | Sales of goods represent the sale of crude oil, intermediate petrochemical products, petroleum products and ancillary materials. |
| (ii) | Purchases represent the purchase of materials and utility supplies directly related to the Group’s operations such as the procurement of raw and ancillary materials and related services, supply of water, electricity and gas. |
| (iii) | Transportation and storage represent the cost for the use of railway, road and marine transportation services, pipelines, loading, unloading and storage facilities. |
| (iv) | Exploration and development services comprise direct costs incurred in the exploration and development such as geophysical, drilling, well testing and well measurement services. |
| (v) | Production related services represent ancillary services rendered in relation to the Group’s operations such as equipment repair and general maintenance, insurance premium, technical research, communications, firefighting, security, product quality testing and analysis, information technology, design and engineering, construction of oilfield ground facilities, refineries and chemical plants, manufacture of replacement parts and machinery, installation, project management and environmental protection, and management services. |
92
| 57 | RELATED PARTIES AND RELATED PARTY TRANSACTIONS (Continued) |
| (3) | The principal related party transactions with Sinopec Group Company and fellow subsidiaries, associates and joint ventures, which were carried out in the ordinary course of business, are as follows: (Continued) |
Notes: (Continued)
| (vi) | Agency commission income represents commission earned for acting as an agent in respect of sales of products and purchase of materials for certain entities owned by Sinopec Group Company. |
| (vii) | Interest income represents interest received from deposits placed with Sinopec Finance and Sinopec Century Bright Capital Investment Limited, finance companies controlled by Sinopec Group Company. The applicable interest rate is determined in accordance with the prevailing saving deposit rate. |
| (viii) | Interest expense represents interest charges on the loans obtained from Sinopec Group Company and fellow subsidiaries. |
| (ix) | The Group obtained loans, discounted bills and issued the acceptance bills from Sinopec Group Company and fellow subsidiaries. |
In connection with the Reorganisation, the Company and Sinopec Group Company entered into a number of agreements under which 1) Sinopec Group Company will provide goods and products and a range of ancillary, social and supporting services to the Group and 2) the Group will sell certain goods to Sinopec Group Company. These agreements impacted the operating results of the Group for the six-month period ended 30 June 2023. The terms of these agreements are summarised as follows:
| (a) | The Company has entered into a non-exclusive “Agreement for Mutual Provision of Products and Ancillary Services” (“Mutual Provision Agreement”) with Sinopec Group Company effective from 1 January 2000 in which Sinopec Group Company has agreed to provide the Group with certain ancillary production services, construction services, information advisory services, supply services and other services and products. While each of Sinopec Group Company and the Company is permitted to terminate the Mutual Provision Agreement upon at least six months’ notice, Sinopec Group Company has agreed not to terminate the agreement if the Group is unable to obtain comparable services from a third party. The pricing policy for these services and products provided by Sinopec Group Company to the Group is as follows: |
| ‧ | the government-prescribed price; |
| ‧ | where there is no government-prescribed price, the government-guidance price; |
| ‧ | where there is neither a government-prescribed price nor a government-guidance price, the market price; or |
| ‧ | where none of the above is applicable, the price to be agreed between the parties, which shall be based on a reasonable cost incurred in providing such services plus a profit margin not exceeding 6%. |
| (b) | The Company has entered into a non-exclusive “Agreement for Provision of Cultural and Educational, Health Care and Community Services” with Sinopec Group Company effective from 1 January 2000 in which Sinopec Group Company has agreed to provide the Group with certain cultural, educational, health care and community services on the same pricing terms and termination conditions as agreed to in the above Mutual Provision Agreement. The term of the Cultural, Educational, Hygiene and Auxiliary Service Agreement expired on 31 December 2021, and is not renewed due to the significant decrease in the service scale after the separation and transfer of assets and business such as the Three Supplies and One Industry Assets etc. Cultural and educational services related or similar to training and auxiliary services thereunder have been incorporated into the Mutual Supply Agreement. |
| (c) | The Company has entered into a number of lease agreements with Sinopec Group Company to lease certain lands and buildings effective on 1 January 2000. The lease term is 40 or 50 years for lands and 20 years for buildings, respectively. The Company and Sinopec Group Company can renegotiate the rental amount every three years for land. The Company and Sinopec Group Company can renegotiate the rental amount for buildings every year. However such amount cannot exceed the market price as determined by an independent third party. |
| (d) | The Company has entered into agreements with Sinopec Group Company effective from 1 January 2000 under which the Group has been granted the right to use certain trademarks, patents, technology and computer software developed by Sinopec Group Company. |
| (e) | The Company has entered into a service station franchise agreement with Sinopec Group Company effective from 1 January 2000 under which its service stations and retail stores would exclusively sell the refined products supplied by the Group. |
| (f) | On the basis of a series of continuing connected transaction agreements signed in 2000, the Company and Sinopec Group Company have signed the Sixth Supplementary Agreement on 27 August 2021, which took effect on 1 January 2022 and made adjustment to “Mutual Supply Agreement” and “Buildings Leasing Contract”. |
93
| 57 | RELATED PARTIES AND RELATED PARTY TRANSACTIONS (Continued) |
| (4) | Balances with Sinopec Group Company and fellow subsidiaries, associates and joint ventures |
The balances with Sinopec Group Company and fellow subsidiaries, associates and joint ventures at 30 June 2023 and 31 December 2022 are as follows:
| The ultimate holding company | Other related companies | |||
| At 30 June | At 31 December | At 30 June | At 31 December | |
| 2023 | 2022 | 2023 | 2022 | |
| RMB million | RMB million | RMB million | RMB million | |
| Cash at bank and on hand | – | – | 63,279 | 65,064 |
| Accounts receivable | 7 | 20 | 13,646 | 11,460 |
| Receivables financing | – | – | 194 | 596 |
| Other receivables | 32 | 32 | 11,033 | 10,017 |
| Prepayments and other current assets | 101 | 4 | 653 | 322 |
| Other non-current assets | – | – | 8,911 | 8,633 |
| Bills payable | – | – | 3,637 | 4,689 |
| Accounts payable | 24 | 299 | 13,094 | 33,349 |
| Contract liabilities | 28 | 15 | 3,801 | 4,721 |
| Other payables and other current liabilities | 247 | 46 | 18,179 | 38,266 |
| Other non-current liabilities | – | – | 5,179 | 5,180 |
| Short-term loans | – | – | 12,814 | 6,852 |
| Long-term loans (including current portion) | – | – | 24,010 | 22,695 |
| Lease liabilities (including current portion) | 70,387 | 70,860 | 85,722 | 85,677 |
Amounts due from/to Sinopec Group Company and fellow subsidiaries, associates and joint ventures, other than short-term loans and long-term loans, bear no interest, are unsecured and are repayable in accordance with normal commercial terms. The terms and conditions associated with short-term loans and long-term loans payable to Sinopec Group Company and fellow subsidiaries are set out in Note 22 and Note 31.
As at and for the six-month period ended 30 June 2023, and as at and for the year ended 31 December 2022, no individually significant impairment losses for bad and doubtful debts were recorded in respect of amounts due from Sinopec Group Company and fellow subsidiaries, associates and joint ventures.
| (5) | Key management personnel emoluments |
Key management personnel are those persons having authority and responsibility for planning, directing and controlling the activities of the Group, directly or indirectly, including directors and supervisors of the Group. The key management personnel compensations are as follows:
| Six-month period ended 30 June | ||
| 2023 | 2022 | |
| RMB thousand | RMB thousand | |
| Short-term employee benefits | 4,141 | 5,075 |
| Retirement scheme contributions | 274 | 270 |
| Total | 4,415 | 5,345 |
| 58 | PRINCIPAL ACCOUNTING ESTIMATES AND JUDGEMENTS |
The Group’s financial condition and results of operations are sensitive to accounting methods, assumptions and estimates that underlie the preparation of the financial statements. The Group bases the assumptions and estimates on historical experience and on various other assumptions that it believes to be reasonable and which form the basis for making judgements about matters that are not readily apparent from other sources. On an on-going basis, management evaluates its estimates. Actual results may differ from those estimates as facts, circumstances and conditions change.
The selection of critical accounting policies, the judgements and other uncertainties affecting application of those policies and the sensitivity of reported results to changes in conditions and assumptions are factors to be considered when reviewing the financial statements. The significant accounting policies are set forth in Note 3. The Group believes the following critical accounting policies involve the most significant judgements and estimates used in the preparation of the financial statements.
94
| 58 | PRINCIPAL ACCOUNTING ESTIMATES AND JUDGEMENTS (Continued) |
| (a) | Oil and gas properties and reserves |
The accounting for the exploration and production segment’s oil and gas activities is subject to accounting rules that are unique to the oil and gas industry. The Group has used the successful efforts method to account for oil and gas business activities. The successful efforts method reflects the volatility that is inherent in exploring for mineral resources in that costs of unsuccessful exploratory efforts are charged to expense. These costs primarily include dry hole costs, seismic costs and other exploratory costs.
Engineering estimates of the Group’s oil and gas reserves are inherently imprecise and represent only approximate amounts because of the subjective judgements involved in developing such information. There are authoritative guidelines regarding the engineering criteria that have to be met before estimated oil and gas reserves can be designated as “proved”. Proved and proved developed reserves estimates are updated at least annually and take into account recent production and technical information about each field. In addition, as prices and cost levels change from year to year, the estimate of proved and proved developed reserves also changes. This change is considered a change in estimate for accounting purposes and is reflected on a prospective basis in related depreciation rates. Oil and gas reserves have a direct impact on the assessment of the recoverability of the carrying amounts of oil and gas properties reported in the financial statements. If proved reserves estimates are revised downwards, the Group’s earnings could be affected by changes in depreciation expense or an immediate write-down of the carrying amount of oil and properties.
Future dismantlement costs for oil and gas properties are estimated with reference to engineering estimates after taking into consideration the anticipated method of dismantlement required in accordance with industry practices in the similar geographic area, with reference to the standard procedures and cost estimates of dismantlement of oil and gas properties and taking into consideration the estimation of economic life of oil and gas properties, technology and price level. The present values of these estimated future dismantlement costs are capitalised as oil and gas properties with equivalent amounts recognised as provisions for dismantlement costs.
Despite the inherent imprecision in these engineering estimates, these estimates are used in determining depreciation expense, impairment expense and future dismantlement costs. Capitalised costs of proved oil and gas properties are amortised on a unit-of-production method based on volumes produced and reserves.
| (b) | Impairment for assets |
If circumstances indicate that the net book value of a long-lived asset may not be recoverable, the asset may be considered “impaired”, and an impairment loss may be recognised in accordance with “CASs 8 – Impairment of Assets”. The carrying amounts of long-lived assets are reviewed periodically in order to assess whether the recoverable amounts have declined below the carrying amounts. These assets are tested for impairment whenever events or changes in circumstances indicate that their recorded carrying amounts may not be recoverable. When such a decline has occurred, the carrying amount is reduced to recoverable amount. For goodwill, the recoverable amount is estimated annually. The recoverable amount is the greater of the fair value less costs to sell and the present value of expected future cash flows. It is difficult to precisely estimate the fair value because quoted market prices for the Group’s assets or cash-generating units are not readily available. In determining the value in use, expected cash flows generated by the asset or the cash-generating units are discounted to their present value, which requires significant judgement relating to future selling prices of crude oil, natural gas, refined and chemical products, the production costs, the product mix, production volumes, production profiles, the oil and gas reserves and discount rate. Management uses all readily available information in determining an amount that is a reasonable approximation of recoverable amount, including estimates based on reasonable and supportable assumptions and projections of sales volume, selling price, amount of operating costs and discount rate.
| (c) | Depreciation |
Fixed assets other than oil and gas properties, are depreciated on a straight-line basis over the estimated useful lives of the assets, after taking into account the estimated residual value. Management reviews the estimated useful lives of the assets at least annually in order to determine the amount of depreciation expense to be recorded during any reporting period. The useful lives are based on the Group’s historical experience with similar assets and taking into account anticipated technological changes. The depreciation expense for future periods is adjusted if there are significant changes from previous estimates.
| (d) | Measurement of expected credit losses |
ECLs are a probability-weighted estimate of credit losses. Credit losses are measured as the present value of all cash shortfalls (i.e. the difference between the cash flows due to the entity in accordance with the contract and the cash flows that the Group expects to receive).
The Group measures and recognises expected credit losses, considering reasonable and supportable information about the relevant past events, current conditions and forecasts of future economic conditions. The Group regularly monitors and reviews the assumptions used for estimating expected credit losses.
| (e) | Allowance for diminution in value of inventories |
If the costs of inventories become higher than their net realisable values, an allowance for diminution in value of inventories is recognised. Net realisable value represents the estimated selling price in the ordinary course of business, less the estimated costs of completion and the estimated costs necessary to make the sale. Management bases the estimates on all available information, including the current market prices of the finished goods, and historical operating costs. If the actual selling prices were to be lower or the costs of completion were to be higher than estimated, the actual allowance for diminution in value of inventories would be higher than estimated.
95
| 59 | PRINCIPAL SUBSIDIARIES |
The Company’s principal subsidiaries have been consolidated into the Group’s financial statements for the six-month period ended 30 June 2023. The following list contains the particulars of subsidiaries which principally affected the results, assets and liabilities of the Group:
| Full name of enterprise | Principal activities | Registered capital/ paid-up capital | Actual investment at 30 June 2023 | Percentage of equity interest/ voting right held by the Group | Non-controlling Interests at 30 June 2023 |
| million | million | % | RMB million | ||
| (a) Subsidiaries acquired through group restructuring: | |||||
| China Petrochemical International Company Limited | Trading of petrochemical products | RMB1,400 | RMB1,856 | 100.00 | 12 |
| China International United Petroleum and Chemical Company Limited | Trading of crude oil and petrochemical products | RMB5,000 | RMB6,585 | 100.00 | 5,761 |
| Sinopec Catalyst Company Limited | Production and sale of catalyst products | RMB1,500 | RMB2,424 | 100.00 | 271 |
| Sinopec Yangzi Petrochemical Company Limited | Manufacturing of intermediate petrochemical products and petroleum products | RMB15,651 | RMB15,651 | 100.00 | – |
| Sinopec Lubricant Company Limited | Production and sale of refined petroleum products, lubricant base oil, and petrochemical materials | RMB3,374 | RMB3,374 | 100.00 | 63 |
| Sinopec Yizheng Chemical Fibre Limited Liability Company | Production and sale of polyester chips and polyester fibres | RMB4,000 | RMB7,348 | 100.00 | – |
| Sinopec Marketing Co. Limited (“Marketing Company”) | Marketing and distribution of refined petroleum products | RMB28,403 | RMB20,000 | 70.42 | 83,836 |
| Sinopec Kantons Holdings Limited (“Sinopec Kantons”) | Provision of crude oil jetty services and natural gas pipeline transmission services | HKD248 | HKD3,952 | 60.33 | 5,352 |
| Sinopec Shanghai Petrochemical Company Limited (“Shanghai Petrochemical”) | Manufacturing of synthetic fibres, resin and plastics, intermediate petrochemical products and petroleum products | RMB10,799 | RMB5,820 | 50.55 | 12,629 |
| Fujian Petrochemical Company Limited (“Fujian Petrochemical”) (i) | Manufacturing of plastics, intermediate petrochemical products and petroleum products | RMB10,492 | RMB5,246 | 50.00 | 5,330 |
| (b) Subsidiaries established by the Group: | |||||
| Sinopec International Petroleum Exploration and Production Limited (“SIPL”) | Investment in exploration, production and sale of petroleum and natural gas | RMB8,250 | RMB8,250 | 100.00 | 5,921 |
| Sinopec Overseas Investment Holding Limited (“SOIH”) | Investment holding of overseas business | USD3,598 | USD3,598 | 100.00 | – |
| Sinopec Chemical Sales Company Limited | Marketing and distribution of petrochemical products | RMB1,000 | RMB1,165 | 100.00 | 173 |
| Sinopec Great Wall Energy & Chemical Company Limited | Coal chemical industry investment management, production and sale of coal chemical products | RMB22,761 | RMB22,890 | 100.00 | 23 |
| Sinopec Beihai Refining and Chemical Limited Liability Company | Import and processing of crude oil, production, storage and sale of petroleum products and petrochemical products | RMB5,294 | RMB5,240 | 98.98 | 134 |
| ZhongKe (Guangdong) Refinery & Petrochemical Company Limited | Crude oil processing and petroleum products manufacturing | RMB6,397 | RMB5,776 | 90.30 | 2,344 |
| Sinopec Qingdao Refining and Chemical Company Limited | Manufacturing of intermediate petrochemical products and petroleum products | RMB5,000 | RMB4,250 | 85.00 | 1,969 |
| Sinopec-SK (Wuhan) Petrochemical Company Limited (“Sinopec-SK”) | Production, sale, research and development of ethylene and downstream byproducts | RMB7,193 | RMB7,193 | 59.00 | 3,901 |
| (c) Subsidiaries acquired through business combination under common control: | |||||
| Sinopec Hainan Refining and Chemical Company Limited | Manufacturing of intermediate petrochemical products and petroleum products | RMB9,606 | RMB12,615 | 100.00 | 75 |
| Sinopec Qingdao Petrochemical Company Limited | Manufacturing of intermediate petrochemical products and petroleum products | RMB1,595 | RMB7,233 | 100.00 | – |
| Gaoqiao Petrochemical Company Limited (“Gaoqiao Petrochemical”) | Manufacturing of intermediate petrochemical products and petroleum products | RMB10,000 | RMB4,804 | 55.00 | 9,914 |
| Sinopec Hunan Petrochemical Co. Ltd. (Formerly “Baling Petrochemical”) | Crude oil processing and petroleum products manufacturing | RMB3,000 | RMB3,340 | 55.00 | 2,521 |
| * | The non-controlling interests of subsidiaries which the Group holds 100% of equity interests at the end of the period are the non-controlling interests of their subsidiaries. |
Except for Sinopec Kantons and SOIH, which are incorporated in Bermuda and Hong Kong SAR, respectively, all of the above principal subsidiaries are incorporated and operate their businesses principally in the PRC.
Note:
| (i) | The Group consolidated the financial statements of the entity because it is exposed to, or has rights to, variable returns from its involvement with the entity and has the ability to affect those return through its power over the entity. |
96
| 59 | PRINCIPAL SUBSIDIARIES (Continued) |
Summarised financial information on subsidiaries with material non-controlling interests
Set out below are the summarised financial information which the amount before inter-company eliminations for each subsidiary whose non-controlling interests that are material to the Group.
Summarised consolidated balance sheet
| Marketing Company | SIPL | Shanghai Petrochemical | Fujian Petrochemical | Sinopec Kantons | Gaoqiao Petrochemical | Sinopec-SK | ||||||||
| At 30 | At 31 | At 30 | At 31 | At 30 | At 31 | At 30 | At 31 | At 30 | At 31 | At 30 | At 31 | At 30 | At 31 | |
| June | December | June | December | June | December | June | December | June | December | June | December | June | December | |
| 2023 | 2022 | 2023 | 2022 | 2023 | 2022 | 2023 | 2022 | 2023 | 2022 | 2023 | 2022 | 2023 | 2022 | |
| RMB | RMB | RMB | RMB | RMB | RMB | RMB | RMB | RMB | RMB | RMB | RMB | RMB | RMB | |
| million | million | million | million | million | million | million | million | million | million | million | million | million | million | |
| Current assets | 199,977 | 190,697 | 19,089 | 25,677 | 17,001 | 15,766 | 3,010 | 1,901 | 6,064 | 5,436 | 18,987 | 23,991 | 5,009 | 5,781 |
| Current liabilities | (208,731) | (212,593) | (750) | (9,468) | (15,428) | (13,998) | (1,158) | (169) | (430) | (209) | (7,638) | (10,162) | (5,753) | (8,488) |
| Net current (liabilities)/assets | (8,754) | (21,896) | 18,339 | 16,209 | 1,573 | 1,768 | 1,852 | 1,732 | 5,634 | 5,227 | 11,349 | 13,829 | (744) | (2,707) |
| Non-current assets | 323,604 | 326,170 | 9,014 | 12,869 | 24,701 | 25,477 | 9,519 | 10,215 | 8,057 | 7,902 | 14,775 | 15,681 | 19,449 | 20,252 |
| Non-current liabilities | (56,887) | (56,147) | (11,996) | (11,892) | (867) | (873) | (710) | (707) | (239) | (232) | (4,094) | (5,385) | (9,191) | (7,806) |
| Net non-current assets/(liabilities) | 266,717 | 270,023 | (2,982) | 977 | 23,834 | 24,604 | 8,809 | 9,508 | 7,818 | 7,670 | 10,681 | 10,296 | 10,258 | 12,446 |
Summarised consolidated statement of comprehensive income and cash flow
| Six-month period | Marketing Company | SIPL | Shanghai Petrochemical | Fujian Petrochemical | Sinopec Kantons | Gaoqiao Petrochemical | Sinopec-SK | |||||||
| ended 30 June | 2023 | 2022 | 2023 | 2022 | 2023 | 2022 | 2023 | 2022 | 2023 | 2022 | 2023 | 2022 | 2023 | 2022 |
| RMB million | RMB million | RMB million | RMB million | RMB million | RMB million | RMB million | RMB million | RMB million | RMB million | RMB million | RMB million | RMB million | RMB million | |
| Turnover | 869,605 | 790,246 | 1,682 | 2,053 | 44,937 | 45,900 | 2,280 | 2,639 | 273 | 268 | 27,749 | 34,904 | 28,100 | 27,988 |
| Net profit/(loss) for the period | 13,874 | 12,885 | 2,029 | 1,117 | (986) | (431) | (589) | (275) | 658 | 295 | (163) | 886 | (331) | 119 |
| Total comprehensive income | 14,744 | 15,065 | (1,829) | 830 | (986) | (157) | (589) | (275) | 820 | 447 | (163) | 892 | (331) | 119 |
| Comprehensive income attributable to non-controlling interests | 5,084 | 5,194 | (1,144) | 247 | (486) | (75) | (295) | (137) | 325 | 177 | (73) | 401 | (136) | 49 |
| Dividends paid to non-controlling interests | 1,913 | 622 | – | – | – | 547 | – | – | 105 | 98 | 895 | 541 | – | 397 |
| Net cash flow (used in)/generatedfrom operating activities | (744) | 7,603 | 980 | 1,370 | (227) | (6,405) | 992 | 1,257 | (91) | 58 | (3,314) | 685 | 1,376 | (664) |
| 60 | COMMITMENTS |
Capital commitments
At 30 June 2023 and 31 December 2022, the capital commitments of the Group are as follows:
| At 30 June | At 31 December | |
| 2023 | 2022 | |
| RMB million | RMB million | |
| Authorised and contracted for (i) | 119,228 | 167,507 |
| Authorised but not contracted for | 91,540 | 94,407 |
| Total | 210,768 | 261,914 |
These capital commitments relate to oil and gas exploration and development, refining and petrochemical production capacity expansion projects, the construction of service stations and oil depots and investment commitments.
Note:
| (i) | The investment commitments of the Group is RMB11,409 million (31 December 2022: RMB1,751 million). |
97
| 60 | COMMITMENTS (Continued) |
Commitments to joint ventures
Pursuant to certain of the joint venture agreements entered into by the Group, the Group is obliged to purchase products from the joint ventures based on market prices.
Exploration and production licenses
Exploration licenses for exploration activities are registered with the Ministry of Natural Resources. The maximum term of the Group’s exploration licenses is 7 years, and may be renewed twice within 30 days prior to expiration of the original term with each renewal being for a two-year term. The Group is obligated to make progressive annual minimum exploration investment relating to the exploration blocks in respect of which the license is issued. The Ministry of Natural Resources also issues production licenses to the Group on the basis of the reserve reports approved by relevant authorities. The maximum term of a full production license is 30 years unless a special dispensation is given by the State Council. The maximum term of the production licenses issued to the Group is 80 years as a special dispensation was given to the Group by the State Council. The Group’s production license is renewable upon application by the Group 30 days prior to expiration.
The Group is required to make payments of exploration license fees and production right usage fees to the Ministry of Natural Resources annually which are expensed.
Estimated future annual payments are as follows:
| At 30 June | At 31 December | |
| 2023 | 2022 | |
| RMB million | RMB million | |
| Within one year | 642 | 369 |
| Between one and two years | 178 | 152 |
| Between two and three years | 144 | 146 |
| Between three and four years | 97 | 115 |
| Between four and five years | 37 | 62 |
| Thereafter | 872 | 857 |
| Total | 1,970 | 1,701 |
The implementation of commitments in previous year and the Group’s commitments did not have material discrepancy.
| 61 | CONTINGENT LIABILITIES |
| (a) | The Company has been advised by its PRC lawyers that, except for liabilities constituting or arising from or relating to the business assumed by the Company in the Reorganisation, no other liabilities were assumed by the Company, and the Company is not jointly and severally liable for other debts and obligations incurred by Sinopec Group Company prior to the Reorganisation. |
| (b) | At 30 June 2023 and 31 December 2022, the guarantees by the Group in respect of facilities granted to the parties below are as follows: |
| At 30 June | At 31 December | |
| 2023 | 2022 | |
| RMB million | RMB million | |
| Joint ventures (i) | 8,852 | 8,927 |
Note:
| (i) | The Group provided a guarantee in respect to standby credit facilities granted to Zhongan United Coal Chemical Co., Ltd. (“Zhongan United”) by banks amounting to RMB7,100 million (31 December 2022: RMB7,100 million). As at 30 June 2023, the amount withdrawn (the portion corresponding to the shareholding ratio of the Group) by Zhongan United from banks and guaranteed by the Group was RMB5,041 million (31 December 2022: RMB5,254 million). |
The Group provided a guarantee in respect to standby credit facilities granted to Amur Gas Chemical Complex Limited Liability Company (“Amur Gas”) by banks amounting to RMB26,302 million (31 December 2022: RMB25,351 million), and secured by a pledge of its 40% equity interest in Amur Gas. As at 30 June 2023, the amount withdrawn (the portion corresponding to the shareholding ratio of the Group) by Amur Gas from banks and guaranteed by the Group was RMB3,811 million (31 December 2022: RMB3,673 million).
The Group provided a guarantee in respect to payment obligation under the raw material supply agreement of Amur Gas amounting to RMB17,559 million (31 December 2022: RMB16,924 million). As at 30 June 2023, Amur Gas has not yet incurred the relevant payment obligations and therefore the Group has no guarantee amount (31 December 2022: Nil).
Management monitors the risk that the specified debtor will default on the contract and recognises a provision when ECLs on the financial guarantees are determined to be higher than the carrying amount in respect of the guarantees. At 30 June 2023 and 31 December 2022, the Group estimates that there is no material liability has been accrued for ECLs related to the Group’s obligation under these guarantee arrangements.
98
| 61 | CONTINGENT LIABILITIES (Continued) |
Environmental contingencies
Under existing legislation, management believes that there are no probable liabilities that will have a material adverse effect on the financial position or operating results of the Group. The PRC government, however, has moved, and may move further towards more rigorous enforcement of applicable laws, and towards the adoption of more stringent environmental standards. Environmental liabilities are subject to considerable uncertainties which affect the Group’s ability to estimate the ultimate cost of remediation efforts. These uncertainties include (i) the exact nature and extent of the contamination at various sites including, but not limited to refineries, oil fields, service stations, terminals and land development areas, whether operating, closed or sold, (ii) the extent of required cleanup efforts, (iii) varying costs of alternative remediation strategies, (iv) changes in environmental remediation requirements, and (v) the identification of new remediation sites. The amount of such future cost is indeterminable due to such factors as the unknown magnitude of possible contamination and the unknown timing and extent of the corrective actions that may be required. Accordingly, the outcome of environmental liabilities under proposed or future environmental legislation cannot reasonably be estimated at present, and could be material.
The Group recognised normal routine pollutant discharge fees of approximately RMB7,195 million in the consolidated financial statements for the six-month period ended 30 June 2023 (six-month period ended 30 June 2022: RMB4,355 million).
Legal contingencies
The Group is a defendant in certain lawsuits as well as the named party in other proceedings arising in the ordinary course of business. Management has assessed the likelihood of an unfavourable outcome of such contingencies, lawsuits or other proceedings and believes that any resulting liabilities will not have a material adverse effect on the financial position, operating results or cash flows of the Group.
| 62 | SEGMENT REPORTING |
Segment information is presented in respect of the Group’s operating segments. The format is based on the Group’s management and internal reporting structure.
In a manner consistent with the way in which information is reported internally to the Group’s chief operating decision maker for the purposes of resource allocation and performance assessment, the Group has identified the following five reportable segments. No operating segments have been aggregated to form the following reportable segments.
| (i) | Exploration and production – which explores and develops oil fields, produces crude oil and natural gas and sells such products to the refining segment of the Group and external customers. |
| (ii) | Refining – which processes and purifies crude oil, which is sourced from the exploration and production segment of the Group and external suppliers, and manufactures and sells petroleum products to the chemicals and marketing and distribution segments of the Group and external customers. |
| (iii) | Marketing and distribution – which owns and operates oil depots and service stations in the PRC, and distributes and sells refined petroleum products (mainly gasoline and diesel) in the PRC through wholesale and retail sales networks. |
| (iv) | Chemicals – which manufactures and sells petrochemical products, derivative petrochemical products and other chemical products to external customers. |
| (v) | Corporate and others – which largely comprise the trading activities of the import and export companies of the Group and research and development undertaken by other subsidiaries. |
The segments were determined primarily because the Group manages its exploration and production, refining, marketing and distribution, chemicals, and corporate and others businesses separately. The reportable segments are each managed separately because they manufacture and/or distribute distinct products with different production processes and due to their distinct operating and gross margin characteristics.
| (1) | Information of reportable segmental revenues, profits or losses, assets and liabilities |
The Group’s chief operating decision maker evaluates the performance and allocates resources to its operating segments on an operating profit basis, without considering the effects of finance costs or investment income. Inter-segment transfer pricing is based on the market price or cost plus an appropriate margin, as specified by the Group’s policy.
Assets and liabilities dedicated to a particular segment’s operations are included in that segment’s total assets and liabilities. Segment assets include all tangible and intangible assets, except for cash at bank and on hand, long-term equity investments, deferred tax assets and other unallocated assets. Segment liabilities exclude short-term loans, non-current liabilities due within one year, long-term loans, debentures payable, deferred tax liabilities, other non-current liabilities and other unallocated liabilities.
99
| 62 | SEGMENT REPORTING (Continued) |
| (1) | Information of reportable segmental revenues, profits or losses, assets and liabilities (Continued) |
Reportable information on the Group’s operating segments is as follows:
| Six-month period ended 30 June | ||
| 2023 | 2022 | |
| RMB million | RMB million | |
| Income from principal operations | ||
| Exploration and production | ||
| External sales | 89,699 | 95,825 |
| Inter-segment sales | 52,999 | 60,314 |
| 142,698 | 156,139 | |
| Refining | ||
| External sales | 86,748 | 98,941 |
| Inter-segment sales | 640,999 | 674,791 |
| 727,747 | 773,732 | |
| Marketing and distribution | ||
| External sales | 839,360 | 767,183 |
| Inter-segment sales | 9,591 | 4,916 |
| 848,951 | 772,099 | |
| Chemicals | ||
| External sales | 196,777 | 234,168 |
| Inter-segment sales | 42,910 | 39,089 |
| 239,687 | 273,257 | |
| Corporate and others | ||
| External sales | 348,918 | 386,119 |
| Inter-segment sales | 460,405 | 525,043 |
| 809,323 | 911,162 | |
| Elimination of inter-segment sales | (1,206,904) | (1,304,153) |
| Consolidated income from principal operations | 1,561,502 | 1,582,236 |
| Income from other operations | ||
| Exploration and production | 2,165 | 2,029 |
| Refining | 1,810 | 1,904 |
| Marketing and distribution | 22,397 | 19,894 |
| Chemicals | 4,613 | 4,953 |
| Corporate and others | 1,195 | 1,110 |
| Consolidated income from other operations | 32,180 | 29,890 |
| Consolidated operating income | 1,593,682 | 1,612,126 |
| Six-month period ended 30 June | ||
| 2023 | 2022 | |
| RMB million | RMB million | |
| Operating profit/(loss) | ||
| By segment | ||
| Exploration and production | 21,828 | 25,358 |
| Refining | 9,885 | 28,751 |
| Marketing and distribution | 16,751 | 17,964 |
| Chemicals | (4,181) | 120 |
| Corporate and others | 932 | 18,164 |
| Elimination | (290) | (11,210) |
| Total segment operating profit | 44,925 | 79,147 |
| Investment income | ||
| Exploration and production | 1,065 | 2,087 |
| Refining | 17 | 404 |
| Marketing and distribution | 1,213 | (793) |
| Chemicals | (3,403) | 1,524 |
| Corporate and others | 4,399 | (13,529) |
| Total segment investment income/(loss) | 3,291 | (10,307) |
| Less: Financial expenses | 4,790 | 5,337 |
| Add: Other income | 4,896 | 2,121 |
| Gains/(losses) from changes in fair value | 1,475 | (1,558) |
| Asset disposal gains | 869 | 135 |
| Operating profit | 50,666 | 64,201 |
| Add: Non-operating income | 940 | 855 |
| Less: Non-operating expenses | 960 | 1,079 |
| Profit before taxation | 50,646 | 63,977 |
100
| 62 | SEGMENT REPORTING (Continued) |
| (1) | Information of reportable segmental revenues, profits or losses, assets and liabilities (Continued) |
| At 30 June | At 31 December | |
| 2023 | 2022 | |
| RMB million | RMB million | |
| Assets | ||
| Segment assets | ||
| Exploration and production | 428,632 | 412,543 |
| Refining | 344,003 | 327,706 |
| Marketing and distribution | 408,244 | 388,961 |
| Chemicals | 273,201 | 242,794 |
| Corporate and others | 134,305 | 148,014 |
| Total segment assets | 1,588,385 | 1,520,018 |
| Cash at bank and on hand | 151,348 | 145,052 |
| Long-term equity investments | 231,561 | 233,941 |
| Deferred tax assets | 19,867 | 22,433 |
| Other unallocated assets | 35,741 | 29,677 |
| Total assets | 2,026,902 | 1,951,121 |
| Liabilities | ||
| Segment liabilities | ||
| Exploration and production | 180,819 | 172,875 |
| Refining | 62,449 | 84,220 |
| Marketing and distribution | 216,901 | 217,177 |
| Chemicals | 76,820 | 82,826 |
| Corporate and others | 199,035 | 215,386 |
| Total segment liabilities | 736,024 | 772,484 |
| Short-term loans | 99,132 | 21,313 |
| Non-current liabilities due within one year | 27,924 | 62,844 |
| Long-term loans | 160,017 | 94,964 |
| Debentures payable | 13,130 | 12,997 |
| Deferred tax liabilities | 7,786 | 7,256 |
| Other non-current liabilities | 13,922 | 14,068 |
| Other unallocated liabilities | 19,486 | 24,738 |
| Total liabilities | 1,077,421 | 1,010,664 |
| Six-month period ended 30 June | ||
| 2023 | 2022 | |
| RMB million | RMB million | |
| Capital expenditure | ||
| Exploration and production | 33,421 | 33,337 |
| Refining | 7,063 | 8,929 |
| Marketing and distribution | 3,320 | 3,072 |
| Chemicals | 30,036 | 18,214 |
| Corporate and others | 827 | 1,102 |
| 74,667 | 64,654 | |
| Depreciation, depletion and amortisation | ||
| Exploration and production | 22,340 | 21,604 |
| Refining | 10,148 | 10,273 |
| Marketing and distribution | 11,890 | 11,645 |
| Chemicals | 9,138 | 8,639 |
| Corporate and others | 1,723 | 1,477 |
| 55,239 | 53,638 | |
| Impairment losses on long-lived assets | ||
| Exploration and production | – | – |
| Refining | – | 2 |
| Marketing and distribution | 34 | – |
| Chemicals | – | – |
| Corporate and others | – | – |
| 34 | 2 | |
101
| 62 | SEGMENT REPORTING (Continued) |
| (2) | Geographical information |
The following tables set out information about the geographical information of the Group’s external sales and the Group’s non-current assets, excluding financial assets and deferred tax assets. In presenting information on the basis of geographical segments, segment revenue is based on the geographical location of customers, and segment assets are based on the geographical location of the assets.
| Six-month period ended 30 June | ||
| 2023 | 2022 | |
| RMB million | RMB million | |
| External sales | ||
| Mainland China | 1,251,863 | 1,243,368 |
| Singapore | 174,860 | 193,966 |
| Others | 166,959 | 174,792 |
| 1,593,682 | 1,612,126 | |
| At 30 June | At 31 December | |
| 2023 | 2022 | |
| RMB million | RMB million | |
| Non-current assets | ||
| Mainland China | 1,387,037 | 1,353,771 |
| Others | 38,928 | 44,739 |
| 1,425,965 | 1,398,510 |
| 63 | FINANCIAL INSTRUMENTS |
Overview
Financial assets of the Group include cash at bank and on hand, financial assets held for trading, derivative financial assets, accounts receivable, receivables financing, other receivables and other equity instrument investments. Financial liabilities of the Group include short-term loans, derivative financial liabilities, bills payable, accounts payable, employee benefits payable, other payables, long-term loans, debentures payable and lease liabilities.
The Group has exposure to the following risks from its uses of financial instruments:
| • | credit risk; |
| • | liquidity risk; and |
| • | market risk. |
The Board of Directors has overall responsibility for the establishment and oversight of the Group’s risk management framework, and developing and monitoring the Group’s risk management policies.
The Group’s risk management policies are established to identify and analyse the risks faced by the Group, and set appropriate risk limits and controls and to monitor risks and adherence to limits. Risk management policies and systems are reviewed regularly to reflect changes in market conditions and the Group’s activities. The Group, through its training and management standards and procedures, aims to develop a disciplined and constructive control environment in which all employees understand their roles and obligations. Internal audit department undertakes both regular and ad hoc reviews of risk management controls and procedures, the results of which are reported to the Group’s audit committee.
Credit risk
| (i) | Risk management |
Credit risk is the risk of financial loss to the Group if a customer or counterparty to a financial instrument fails to meet its contractual obligations, and arises principally from the Group’s deposits placed with financial institutions (including structured deposits) and receivables from customers. To limit exposure to credit risk relating to deposits, the Group primarily places cash deposits only with large financial institutions in the PRC with acceptable credit ratings. The majority of the Group’s accounts receivable relates to sales of petroleum and chemical products to related parties and third parties operating in the petroleum and chemical industries. No single customer accounted for greater than 10% of total accounts receivable at 30 June 2023, except for the amounts due from Sinopec Group Company and fellow subsidiaries. The Group performs ongoing credit evaluations of its customers’ financial condition and generally does not require collateral on accounts receivable. The Group maintains an impairment loss for doubtful accounts and actual losses have been within management’s expectations.
The carrying amounts of cash at bank and on hand, financial assets held for trading, derivative financial assets, accounts receivable, receivables financing, other receivables and long-term receivables, represent the Group’s maximum exposure to credit risk in relation to financial assets.
102
| 63 | FINANCIAL INSTRUMENTS (Continued) |
Credit risk (Continued)
| (ii) | Impairment of financial assets |
The Group’s primary type of financial assets that are subject to the expected credit loss model is accounts receivable, receivables financing and other receivables.
The Group’s cash deposits are placed only with large financial institutions with acceptable credit ratings, and there is no material impairment loss identified.
For accounts receivable, and receivables financing, the Group applies the “No.22 Accounting Standards for Business Enterprises – Financial instruments: recognition and measurement” simplified approach to measuring expected credit losses which uses a lifetime expected loss allowance for all accounts receivable, and receivables financing.
To measure the expected credit losses, accounts receivable, and receivables financing have been grouped based on shared credit risk characteristics and the days past due.
The expected loss rates are based on the payment profiles of sales over a period of 36 months before 30 June 2023 or 31 December 2022, respectively, and the corresponding historical credit losses experienced within this period. The historical loss rates are adjusted to reflect current and forward-looking information on macroeconomic factors affecting the ability of the customers to settle the accounts receivable, and receivables financing.
The detailed analysis of accounts receivable and receivables financing is listed in Note 7 and Note 8.
The Group’s other receivables are considered to have low credit risk, and the loss allowance recognised during the period was therefore limited to 12 months expected credit losses. The Group considers “low credit risk” for other receivables when they have a low risk of default and the issuer has a strong capacity to meet its contractual cash flow obligations in the near term.
Liquidity risk
Liquidity risk is the risk that the Group encounters short fall of capital when meeting its obligation of financial liabilities. The Group’s approach to managing liquidity is to ensure, as far as possible, that it will always have sufficient liquidity to meet its liabilities when due, under both normal and stressed capital conditions, without incurring unacceptable losses or risking damage to the Group’s reputation. The Group prepares monthly cash flow budget to ensure that they will always have sufficient liquidity to meet its financial obligations as they fall due. The Group arranges and negotiates financing with financial institutions and maintains a certain level of standby credit facilities to reduce the liquidity risk.
At 30 June 2023, the Group has standby credit facilities with several PRC financial institutions which provide the Group to borrow up to RMB488,209 million (31 December 2022: RMB454,857 million) on an unsecured basis, at a weighted average interest rate of 2.34% per annum (2022: 2.38%). At 30 June 2023, the Group’s outstanding borrowings under these facilities were RMB99,132 million (31 December 2022: RMB21,313 million) and were included in loans.
The following table sets out the remaining contractual maturities at the balance sheet date of the Group’s financial liabilities, which are based on contractual undiscounted cash flows (including interest payments computed using contractual rates or, if floating, based on prevailing rates at the balance sheet date) and the earliest date the Group would be required to repay:
| At 30 June 2023 | ||||||
| Carrying amount | Total contractual undiscounted cash flow | Within one year or on demand | More than one year but less than two years | More than two years but less than five years | More than five years | |
| RMB million | RMB million | RMB million | RMB million | RMB million | RMB million | |
| Short-term loans | 99,132 | 100,649 | 100,649 | – | – | – |
| Derivative financial liabilities | 6,458 | 6,458 | 6,458 | – | – | – |
| Bills payable | 13,342 | 13,342 | 13,342 | – | – | – |
| Accounts payable | 244,915 | 244,915 | 244,915 | – | – | – |
| Other payables | 84,435 | 84,435 | 84,435 | – | – | – |
| Non-current liabilities due within one year | 27,924 | 28,834 | 28,834 | – | – | – |
| Long-term loans | 160,017 | 173,591 | 4,164 | 56,028 | 93,263 | 20,136 |
| Debentures payable | 13,130 | 16,658 | 427 | 4,893 | 5,606 | 5,732 |
| Lease liabilities | 165,367 | 272,894 | – | 12,512 | 35,821 | 224,561 |
| Total | 814,720 | 941,776 | 483,224 | 73,433 | 134,690 | 250,429 |
103
| 63 | FINANCIAL INSTRUMENTS (Continued) |
Liquidity risk (Continued)
| At 31 December 2022 | ||||||
| Carrying amount | Total contractual undiscounted cash flow | Within one year or on demand | More than one year but less than two years | More than two years but less than five years | More than five years | |
| RMB million | RMB million | RMB million | RMB million | RMB million | RMB million | |
| Short-term loans | 21,313 | 21,635 | 21,635 | – | – | – |
| Derivative financial liabilities | 7,313 | 7,313 | 7,313 | – | – | – |
| Bills payable | 10,782 | 10,782 | 10,782 | – | – | – |
| Accounts payable | 258,642 | 258,642 | 258,642 | – | – | – |
| Other payables | 119,892 | 119,892 | 119,892 | – | – | – |
| Non-current liabilities due within one year | 62,844 | 64,111 | 64,111 | – | – | – |
| Long-term loans | 94,964 | 102,939 | 2,149 | 12,960 | 76,473 | 11,357 |
| Debentures payable | 12,997 | 16,657 | 422 | 4,948 | 5,669 | 5,618 |
| Lease liabilities | 166,407 | 282,477 | – | 12,905 | 36,984 | 232,588 |
| Total | 755,154 | 884,448 | 484,946 | 30,813 | 119,126 | 249,563 |
Management believes that the Group’s current cash on hand, expected cash flows from operations and available standby credit facilities from financial institutions will be sufficient to meet the Group’s short-term and long-term capital requirements.
Market risk
Market risk is the risk that changes in market prices, such as foreign exchange rates and interest rates. The objective of market risk management is to manage and control market risk exposures within acceptable parameters, while optimising the return on risk.
| (a) | Currency risk |
Currency risk arises on financial instruments that are denominated in a currency other than the functional currency in which they are measured.
The Group does not have significant financial instruments that are denominated in foreign currencies other than the functional currencies of respective entities as at 30 June, and consequently does not have significant exposure to foreign currency risk.
| (b) | Interest rate risk |
The Group’s interest rate risk exposure arises primarily from its short-term and long-term loans. Loans carrying interest at variable interest rates and at fixed interest rates expose the Group to cash flow interest rate risk and fair value interest rate risk respectively. The interest rates and terms of repayment of short-term and long-term loans of the Group are disclosed in Note 22 and Note 31, respectively.
At 30 June 2023, it is estimated that a general increase/decrease of 100 basis points in variable interest rates, with all other variables held constant, would decrease/increase the Group’s net profit for the period by approximately RMB1,518 million (31 December 2022: decrease/increase RMB524 million). This sensitivity analysis has been determined assuming that the change of interest rates was applied to the Group’s debts outstanding at the balance sheet date with exposure to cash flow interest rate risk. The analysis is performed on the same basis for 2022.
| (c) | Commodity price risk |
The Group engages in oil and gas operations and is exposed to commodity price risk related to price volatility of crude oil, refined oil products and chemical products. The fluctuations in prices of crude oil, refined oil products and chemical products could have significant impact on the Group. The Group uses derivative financial instruments, including commodity futures and swaps contracts, to manage a portion of such risk.
Evaluate and monitor market risk exposure arising from trading positions based on dynamic market research and judgment, combined with resource demand and production and management plans, to continuously manage and hedge the risk of commodity price fluctuations arising from market changes.
At 30 June 2023, the Group had certain commodity contracts of crude oil, refined oil products and chemical products designated as qualified cash flow hedges and economic hedges. At 30 June 2023, the fair value of such derivative hedging financial instruments is derivative financial assets of RMB8,418 million (31 December 2022: RMB19,328 million) and derivative financial liabilities of RMB6,411 million (31 December 2022: RMB7,235 million).
104
| 63 | FINANCIAL INSTRUMENTS (Continued) |
Market risk (Continued)
| (c) | Commodity price risk (Continued) |
At 30 June 2023, it is estimated that a general increase/decrease of USD10 per barrel in basic price of derivative financial instruments, with all other variables held constant, would impact the fair value of derivative financial instruments, which would decrease/increase the Group’s net profit for the period by approximately RMB1,248 million (31 December 2022: decrease/increase RMB5,104 million), and increase/decrease the Group’s other comprehensive income by approximately RMB2,138 million (31 December 2022: increase/decrease RMB192 million). This sensitivity analysis has been determined assuming that the change in prices had occurred at the balance sheet date and the change was applied to the Group’s derivative financial instruments at that date with exposure to commodity price risk. The analysis is performed on the same basis for 2022.
Fair values
| (i) | Financial instruments carried at fair value |
The following table presents the carrying value of financial instruments measured at fair value at the balance sheet date across the three levels of the fair value hierarchy. With the fair value of each financial instrument categorised in its entirely based on the lowest level of input that is significant to that fair value measurement. The levels are defined as follows:
Level 1 (highest level): fair values measured using quoted prices (unadjusted) in active markets for identical financial instruments.
Level 2: fair values measured using quoted prices in active markets for similar financial instruments, or using valuation techniques in which all significant inputs are directly or indirectly based on observable market data.
Level 3 (lowest level): fair values measured using valuation techniques in which any significant input is not based on observable market data.
At 30 June 2023
The Group
| Level 1 | Level 2 | Level 3 | Total | |
| RMB million | RMB million | RMB million | RMB million | |
| Assets | ||||
| Financial assets held for trading: | ||||
| – Exchange traded fund | 3 | – | – | 3 |
| Derivative financial assets: | ||||
| – Derivative financial assets | 2,723 | 5,777 | – | 8,500 |
| Receivables financing: | ||||
| – Receivables financing | – | – | 4,294 | 4,294 |
| Other equity instrument investments: | ||||
| – Other Investments | 115 | – | 567 | 682 |
| 2,841 | 5,777 | 4,861 | 13,479 | |
| Liabilities | ||||
| Derivative financial liabilities: | ||||
| – Derivative financial liabilities | 705 | 5,753 | – | 6,458 |
| 705 | 5,753 | – | 6,458 |
105
| 63 | FINANCIAL INSTRUMENTS (Continued) |
Fair values (Continued)
| (i) | Financial instruments carried at fair value (Continued) |
At 31 December 2022
The Group
| Level 1 | Level 2 | Level 3 | Total | |
| RMB million | RMB million | RMB million | RMB million | |
| Assets | ||||
| Financial assets held for trading: | ||||
| – Exchange traded fund | 2 | – | – | 2 |
| Derivative financial assets: | ||||
| – Derivative financial assets | 7,857 | 11,478 | – | 19,335 |
| Receivables financing: | ||||
| – Receivables financing | – | – | 3,507 | 3,507 |
| Other equity instrument investments: | ||||
| – Other Investments | 114 | – | 616 | 730 |
| 7,973 | 11,478 | 4,123 | 23,574 | |
| Liabilities | ||||
| Derivative financial liabilities: | ||||
| – Derivative financial liabilities | 1,293 | 6,020 | – | 7,313 |
| 1,293 | 6,020 | – | 7,313 |
During the six-month period ended 30 June 2023, there was no transfer between instruments in Level 1 and Level 2.
Management of the Group uses discounted cash flow model with inputted interest rate and commodity index, which were influenced by historical fluctuation and the probability of market fluctuation, to evaluate the fair value of the receivables financing classified as Level 3 financial assets.
| (ii) | Fair values of financial instruments carried at other than fair value |
The fair values of the Group’s financial instruments carried at other than fair value (other than long-term indebtedness and investments in unquoted equity securities) approximate their carrying amounts due to the short-term maturity of these instruments. The fair values of long-term indebtedness are estimated by discounting future cash flows using current market interest rates offered to the Group for debt with substantially the same characteristic and maturities range from 2.63% to 4.69% (31 December 2022: from 2.66% to 4.35%). The following table presents the carrying amount and fair value of the Group’s long-term indebtedness other than loans from Sinopec Group Company and fellow subsidiaries at 30 June 2023 and 31 December 2022:
| At 30 June | At 31 December | |
| 2023 | 2022 | |
| RMB million | RMB million | |
| Carrying amount | 156,130 | 130,282 |
| Fair value | 151,329 | 125,866 |
The Group has not developed an internal valuation model necessary to estimate the fair value of loans from Sinopec Group Company and fellow subsidiaries as it is not considered practicable to estimate their fair value because the cost of obtaining discount and borrowing rates for comparable borrowings would be excessive based on Group’s existing capital structure and the terms of the borrowings.
Except for the above items, the financial assets and liabilities of the Group are carried at amounts not materially different from their fair values at 30 June 2023 and 31 December 2022.
106
| 64 | BASIC AND DILUTED EARNINGS PER SHARE |
| (i) | Basic earnings per share |
Basic earnings per share is calculated by the net profit attributable to shareholders of the Company and the weighted average number of outstanding ordinary shares of the Company:
| Six-month period ended 30 June | ||
| 2023 | 2022 | |
| Net profit attributable to shareholders of the Company (RMB million) | 35,111 | 43,920 |
| Weighted average number of outstanding ordinary shares of the Company (million) | 119,896 | 121,071 |
| Basic earnings per share (RMB/share) | 0.293 | 0.363 |
The calculation of the weighted average number of ordinary shares is as follows:
| Six-month period ended 30 June | ||
| 2023 | 2022 | |
| Number of outstanding ordinary shares of the Company at 1 January (million) | 119,896 | 121,071 |
| Weighted average number of outstanding ordinary shares of the Company at 30 June (million) | 119,896 | 121,071 |
| (ii) | Diluted earnings per share |
There are no potential dilutive ordinary shares, and the diluted earnings per share are equal to the basic earnings per share.
| 65 | RETURN ON NET ASSETS AND EARNINGS PER SHARE |
In accordance with “Regulation on the Preparation of Information Disclosures of Companies Issuing Public Shares No.9 – Calculation and Disclosure of the Return on Net Assets and Earnings Per Share” (2010 revised) issued by the CSRC and relevant accounting standards, the Group’s return on net assets and earnings per share are calculated as follows:
| Six-month period ended 30 June | 2023 | 2022 | ||||
Weighted average return on net assets | Basic earnings per share | Diluted earnings per share | Weighted average return on net assets | Basic earnings per share | Diluted earnings per share | |
| (%) | (RMB/Share) | (RMB/Share) | (%) | (RMB/Share) | (RMB/Share) | |
| Net profit attributable to the Company’s ordinary equity shareholders | 4.43 | 0.293 | 0.293 | 5.61 | 0.363 | 0.363 |
| Net profit deducted extraordinary gains attributable to the Company’s ordinary equity shareholders | 4.25 | 0.281 | 0.281 | 5.53 | 0.358 | 0.358 |
| 66 | NON-RECURRING PROFIT/LOSS ITEMS |
| Non-recurring profit/loss items | Six-month period ended 30 June 2023 | Six-month period ended 30 June 2022 |
| (Profit)/loss (RMB Million) | (Profit)/loss (RMB Million) | |
| Net profit on disposal of non-current assets | (869) | (135) |
| Donations | 15 | 101 |
| Government grants | (1,647) | (1,340) |
| Gains on holding and disposal of business and various investments | (319) | (125) |
| Other non-operating income and expenses, net | 267 | 288 |
| Subtotal | (2,553) | (1,211) |
| Tax effect | 782 | 475 |
| Total | (1,771) | (736) |
| Attributable to: | ||
| Shareholders of the Company | (1,456) | (570) |
| Non-controlling interests | (315) | (166) |
107
REPORT OF THE INTERNATIONAL AUDITOR
REVIEW REPORT TO THE BOARD OF DIRECTORS OF CHINA PETROLEUM & CHEMICAL CORPORATION
(Incorporated in the People’s Republic of China with limited liability)
INTRODUCTION
We have reviewed the interim financial report set out on page 109 to 146 which comprises the consolidated statement of financial position of China Petroleum & Chemical Corporation (the “Company”) as of 30 June 2023 and the related consolidated income statement, statement of comprehensive income, statement of changes in equity and statement of cash flow for the six-month period then ended and explanatory notes. The Rules Governing the Listing of Securities on The Stock Exchange of Hong Kong Limited require the preparation of an interim financial report to be in compliance with the relevant provisions thereof and International Accounting Standard 34, Interim Financial Reporting, issued by the International Accounting Standards Board. The directors are responsible for the preparation and presentation of the interim financial report in accordance with International Accounting Standard 34.
Our responsibility is to form a conclusion, based on our review, on the interim financial report and to report our conclusion solely to you, as a body, in accordance with our agreed terms of engagement, and for no other purpose. We do not assume responsibility towards or accept liability to any other person for the contents of this report.
SCOPE OF REVIEW
We conducted our review in accordance with Hong Kong Standard on Review Engagements 2410, Review of Interim Financial Information Performed by the Independent Auditor of the Entity, issued by the Hong Kong Institute of Certified Public Accountants. A review of the interim financial report consists of making enquiries, primarily of persons responsible for financial and accounting matters, and applying analytical and other review procedures. A review is substantially less in scope than an audit conducted in accordance with Hong Kong Standards on Auditing and consequently does not enable us to obtain assurance that we would become aware of all significant matters that might be identified in an audit. Accordingly we do not express an audit opinion.
CONCLUSION
Based on our review, nothing has come to our attention that causes us to believe that the interim financial report as at 30 June 2023 is not prepared, in all material respects, in accordance with International Accounting Standard 34, Interim Financial Reporting.
KPMG
Certified Public Accountants
8th Floor, Prince’s Building
10 Chater Road
Central, Hong Kong
25 August 2023
108
| (B) | FINANCIAL STATEMENTS PREPARED UNDER INTERNATIONAL FINANCIAL REPORTING STANDARDS (“IFRS”) |
UNAUDITED INTERIM CONDENSED CONSOLIDATED INCOME STATEMENT
For the six-month period ended 30 June 2023
(Amounts in million, except per share data)
| Note | Six-month period ended 30 June | ||
| 2023 | 2022 | ||
| RMB | RMB | ||
| Revenue | |||
| Revenue from primary business | 3 | 1,561,502 | 1,582,236 |
| Other operating revenues | 32,180 | 29,890 | |
| 1,593,682 | 1,612,126 | ||
| Operating expenses | |||
| Purchased crude oil, products and operating supplies and expenses | (1,282,882) | (1,262,183) | |
| Selling, general and administrative expenses | (27,381) | (26,797) | |
| Depreciation, depletion and amortisation | (55,239) | (53,638) | |
| Exploration expenses, including dry holes | (4,882) | (5,738) | |
| Personnel expenses | (49,949) | (49,223) | |
| Taxes other than income tax | 4 | (127,261) | (134,409) |
| Impairment (losses)/reversal on trade and other receivables | (35) | 72 | |
| Other operating income/(expenses), net | 7,643 | (17,286) | |
| Total operating expenses | (1,539,986) | (1,549,202) | |
| Operating profit | 53,696 | 62,924 | |
| Finance costs | |||
| Interest expense | (9,049) | (8,124) | |
| Interest income | 3,239 | 3,012 | |
| Foreign currency exchange gains/(losses), net | 1,020 | (225) | |
| Net finance costs | (4,790) | (5,337) | |
| Investment income | 249 | 126 | |
| Share of profits less losses from associates and joint ventures | 2,611 | 7,327 | |
| Profit before taxation | 51,766 | 65,040 | |
| Income tax expense | 5 | (10,170) | (14,033) |
| Profit for the period | 41,596 | 51,007 | |
| Attributable to: | |||
| Shareholders of the Company | 36,122 | 44,841 | |
| Non-controlling interests | 5,474 | 6,166 | |
| Profit for the period | 41,596 | 51,007 | |
| Earnings per share: | |||
| Basic | 7 | 0.301 | 0.370 |
| Diluted | 7 | 0.301 | 0.370 |
Notes to the financial statements on pages 116 to 146 are parts of the interim condensed consolidated financial statements. Details of dividends payable to shareholders of the Company attributable to the profit for the period are set out in Note 6.
109
UNAUDITED INTERIM CONDENSED CONSOLIDATED STATEMENT OF COMPREHENSIVE INCOME
For the six-month period ended 30 June 2023
(Amounts in million)
| Note | Six-month period ended 30 June | ||
| 2023 | 2022 | ||
| RMB | RMB | ||
| Profit for the period | 41,596 | 51,007 | |
| Other comprehensive income: | |||
| Other comprehensive income (net of tax) attributable to shareholders of the Company | (3,454) | 16,033 | |
| Items that will not be reclassified to profit or loss | |||
| Changes in fair value of investments in other equity instruments | (1) | (13) | |
| Items that may be reclassified subsequently to profit or loss | |||
| Share of other comprehensive income of associates and joint ventures | (4,210) | 3,514 | |
| Cash flow hedges | (2,688) | 9,671 | |
| Cost of hedging reserve | – | (422) | |
| Foreign currency translation differences | 3,445 | 3,283 | |
| Other comprehensive income (net of tax) attributable to non-controlling interests | (1,640) | 674 | |
| Total other comprehensive income net of tax | (5,094) | 16,707 | |
| Total comprehensive income for the period | 36,502 | 67,714 | |
| Attributable to: | |||
| Shareholders of the Company | 32,668 | 60,874 | |
| Non-controlling interests | 3,834 | 6,840 | |
Notes to the financial statements on pages 116 to 146 are parts of the interim condensed consolidated financial statements.
110
UNAUDITED INTERIM CONDENSED CONSOLIDATED STATEMENT OF FINANCIAL POSITION
As at 30 June 2023
(Amounts in million)
| Note | 30 June | 31 December | |
| 2023 | 2022 | ||
| RMB | RMB | ||
| Non-current assets | |||
| Property, plant and equipment, net | 8 | 634,468 | 630,700 |
| Construction in progress | 9 | 215,484 | 196,045 |
| Right-of-use assets | 10 | 263,948 | 264,856 |
| Goodwill | 6,495 | 6,464 | |
| Interest in associates | 164,152 | 159,150 | |
| Interest in joint ventures | 67,409 | 74,791 | |
| Financial assets at fair value through other comprehensive income | 13 | 682 | 730 |
| Deferred tax assets | 19,867 | 22,433 | |
| Long-term prepayments and other assets | 11 | 80,406 | 72,812 |
| Total non-current assets | 1,452,911 | 1,427,981 | |
| Current assets | |||
| Cash and cash equivalents | 94,874 | 93,438 | |
| Time deposits with financial institutions | 56,474 | 51,614 | |
| Financial assets at fair value through profit or loss | 3 | 2 | |
| Derivative financial assets | 8,500 | 19,335 | |
| Trade accounts receivable | 12 | 73,399 | 46,364 |
| Financial assets at fair value through other comprehensive income | 13 | 4,294 | 3,507 |
| Inventories | 281,696 | 244,241 | |
| Prepaid expenses and other current assets | 54,751 | 64,639 | |
| Total current assets | 573,991 | 523,140 | |
| Current liabilities | |||
| Short-term debts | 14 | 92,949 | 59,037 |
| Loans from Sinopec Group Company and fellow subsidiaries | 14 | 13,176 | 7,292 |
| Lease liabilities | 15 | 17,318 | 16,004 |
| Derivative financial liabilities | 6,458 | 7,313 | |
| Trade accounts payable and bills payable | 16 | 258,257 | 269,424 |
| Contract liabilities | 124,359 | 125,444 | |
| Other payables | 152,240 | 178,146 | |
| Income tax payable | 3,802 | 4,725 | |
| Total current liabilities | 668,559 | 667,385 | |
| Net current liabilities | 94,568 | 144,245 | |
| Total assets less current liabilities | 1,358,343 | 1,283,736 | |
| Non-current liabilities | |||
| Long-term debts | 14 | 149,499 | 85,706 |
| Loans from Sinopec Group Company and fellow subsidiaries | 14 | 23,648 | 22,255 |
| Lease liabilities | 15 | 165,367 | 166,407 |
| Deferred tax liabilities | 7,786 | 7,256 | |
| Provisions | 48,640 | 47,587 | |
| Other long-term liabilities | 14,806 | 14,983 | |
| Total non-current liabilities | 409,746 | 344,194 | |
| 948,597 | 939,542 | ||
| Equity | |||
| Share capital | 17 | 119,896 | 119,896 |
| Reserves | 675,824 | 667,704 | |
| Total equity attributable to shareholders of the Company | 795,720 | 787,600 | |
| Non-controlling interests | 152,877 | 151,942 | |
| Total equity | 948,597 | 939,542 |
These financial statements have been approved and authorised for issue by the board of directors on 25 August 2023.
| Ma Yongsheng | Yu Baocai | Shou Donghua |
| Chairman | President | Chief Financial Officer |
| (Legal representative) |
Notes to the financial statements on pages 116 to 146 are parts of the interim condensed consolidated financial statements.
111
UNAUDITED INTERIM CONDENSED CONSOLIDATED STATEMENT OF CHANGES IN EQUITY
For the six-month period ended 30 June 2022
(Amounts in million)
| Share capital | Capital reserve | Share premium | Statutory surplus reserve | Discretionary surplus reserve | Other reserves | Retained earnings | Total equity attributable to shareholders of the Company | Non- controlling interests | Total equity | |
| RMB | RMB | RMB | RMB | RMB | RMB | RMB | RMB | RMB | RMB | |
| Balance at 31 December 2021 | 121,071 | 27,062 | 55,850 | 96,224 | 117,000 | 2,495 | 354,480 | 774,182 | 140,892 | 915,074 |
| Adjustment for accounting policy changes (Note 2) | – | – | – | 122 | – | – | 1,992 | 2,114 | 334 | 2,448 |
| Balance at 1 January 2022 | 121,071 | 27,062 | 55,850 | 96,346 | 117,000 | 2,495 | 356,472 | 776,296 | 141,226 | 917,522 |
| Profit for the period | – | – | – | – | – | – | 44,841 | 44,841 | 6,166 | 51,007 |
| Other comprehensive income | – | – | – | – | – | 16,033 | – | 16,033 | 674 | 16,707 |
| Total comprehensive income for the period | – | – | – | – | – | 16,033 | 44,841 | 60,874 | 6,840 | 67,714 |
| Amounts transferred to initial carrying amount of hedged items | – | – | – | – | – | (8,786) | – | (8,786) | (430) | (9,216) |
| Transactions with owners, recorded directly in equity: | ||||||||||
| Contributions by and distributions to owners: | ||||||||||
| Final dividend for 2021 (Note 6) | – | – | – | – | – | – | (37,532) | (37,532) | – | (37,532) |
| Distributions to non-controlling interests | – | – | – | – | – | – | – | – | (2,337) | (2,337) |
| Contributions to subsidiariesfrom non-controlling interests | – | – | – | – | – | – | – | – | 1,420 | 1,420 |
| Total contributions by and distributions to owners | – | – | – | – | – | – | (37,532) | (37,532) | (917) | (38,449) |
| Return of capital to non-controlling interests | – | – | – | – | – | – | – | – | (1,713) | (1,713) |
| Total transactions with owners | – | – | – | – | – | – | (37,532) | (37,532) | (2,630) | (40,162) |
| Other equity movements under the equity method | – | (2,102) | – | – | – | – | – | (2,102) | – | (2,102) |
| Others | – | 3 | – | – | – | 902 | (902) | 3 | (142) | (139) |
| Balance at 30 June 2022 | 121,071 | 24,963 | 55,850 | 96,346 | 117,000 | 10,644 | 362,879 | 788,753 | 144,864 | 933,617 |
Notes to the financial statements on pages 116 to 146 are parts of the interim condensed consolidated financial statements.
112
| Share capital | Capital reserve | Share premium | Statutory surplus reserve | Discretionary surplus reserve | Other reserves | Retained earnings | Total equity attributable to shareholders of the Company | Non- controlling interests | Total equity | |
| RMB | RMB | RMB | RMB | RMB | RMB | RMB | RMB | RMB | RMB | |
| Balance at 31 December 2022 | 119,896 | 28,753 | 52,846 | 100,834 | 117,000 | 6,407 | 358,970 | 784,706 | 151,532 | 936,238 |
| Adjustment for accounting policy changes (Note 2) | – | – | – | 175 | – | – | 2,719 | 2,894 | 410 | 3,304 |
| Balance at 1 January 2023 | 119,896 | 28,753 | 52,846 | 101,009 | 117,000 | 6,407 | 361,689 | 787,600 | 151,942 | 939,542 |
| Profit for the period | – | – | – | – | – | – | 36,122 | 36,122 | 5,474 | 41,596 |
| Other comprehensive income | – | – | – | – | – | (3,454) | – | (3,454) | (1,640) | (5,094) |
| Total comprehensive income for the period | – | – | – | – | – | (3,454) | 36,122 | 32,668 | 3,834 | 36,502 |
| Amounts transferred to initial carrying amount of hedged items | – | – | – | – | – | (1,023) | – | (1,023) | (13) | (1,036) |
| Transactions with owners, recorded directly in equity: | ||||||||||
| Contributions by and distributions to owners: | ||||||||||
| Final dividend for 2022 (Note 6) | – | – | – | – | – | – | (23,380) | (23,380) | – | (23,380) |
| Distributions to non-controlling interests | – | – | – | – | – | – | – | – | (3,185) | (3,185) |
| Contributions to subsidiaries from non-controlling interests | – | – | – | – | – | – | – | – | 472 | 472 |
| Total contributions by and distributions to owners | – | – | – | – | – | – | (23,380) | (23,380) | (2,713) | (26,093) |
| Transaction with non-controlling interests | – | (5) | – | – | – | – | – | (5) | (158) | (163) |
| Total transactions with owners | – | (5) | – | – | – | – | (23,380) | (23,385) | (2,871) | (26,256) |
| Other equity movements under the equity method | – | (171) | – | – | – | – | – | (171) | – | (171) |
| Others | – | 31 | – | – | – | 984 | (984) | 31 | (15) | 16 |
| Balance at 30 June 2023 | 119,896 | 28,608 | 52,846 | 101,009 | 117,000 | 2,914 | 373,447 | 795,720 | 152,877 | 948,597 |
Notes:
| (a) | The usage of the discretionary surplus reserve is similar to that of statutory surplus reserve. |
| (b) | As at 30 June 2023, the amount of retained earnings available for distribution was RMB108,187 million (30 June 2022: RMB107,761 million), being the amount determined in accordance with CASs. According to the Articles of Association of the Company, the amount of retained earnings available for distribution to shareholders of the Company is lower of the amount determined in accordance with the accounting policies complying with CASs and the amount determined in accordance with the accounting policies complying with International Financial Reporting Standards (“IFRS”). |
| (c) | The capital reserve primarily represents (i) the difference between the total amount of the par value of shares issued and the amount of the net assets transferred from Sinopec Group Company in connection with the Reorganisation (Note 1); and (ii) the difference between the considerations paid over or received the amount of the net assets of entities and related operations acquired from or sold to Sinopec Group Company and non-controlling interests. |
| (d) | The application of the share premium account is governed by Sections 167 and 168 of the PRC Company Law. |
Notes to the financial statements on pages 116 to 146 are parts of the interim condensed consolidated financial statements.
113
UNAUDITED INTERIM CONDENSED CONSOLIDATED STATEMENT OF CASH FLOWS
For the six-month period ended 30 June 2023
(Amounts in million)
| Note | Six-month period ended 30 June | ||
| 2023 | 2022 | ||
| RMB | RMB | ||
| Net cash generated from operating activities | (a) | 27,562 | 4,947 |
| Investing activities | |||
| Capital expenditure | (79,678) | (54,711) | |
| Exploratory wells expenditure | (7,903) | (8,312) | |
| Purchase of investments | (2,741) | (5,019) | |
| Payments for financial assets at fair value through profit or loss | – | (1,008) | |
| Proceeds from settlement of financial assets at fair value through profit or loss | – | 6 | |
| Payment for acquisition of subsidiary, net of cash acquired | – | (7,628) | |
| Proceeds from disposal of investments | 391 | 437 | |
| Proceeds from disposal of property, plant, equipment and other non-current assets | 3,584 | 107 | |
| Increase in time deposits with maturities over three months | (49,975) | (15,928) | |
| Decrease in time deposits with maturities over three months | 36,115 | 34,568 | |
| Interest received | 4,700 | 2,387 | |
| Investment and dividend income received | 2,969 | 4,345 | |
| Payments of other investing activities | (892) | (382) | |
| Net cash used in investing activities | (93,430) | (51,138) | |
| Financing activities | |||
| Proceeds from bank and other loans | 365,988 | 348,900 | |
| Repayments of bank and other loans | (259,716) | (224,161) | |
| Contributions to subsidiaries from non-controlling interests | 279 | 987 | |
| Dividends paid by the Company | (23,380) | (37,532) | |
| Distributions by subsidiaries to non-controlling interests | (2,830) | (1,088) | |
| Interest paid | (3,650) | (2,986) | |
| Repayments of lease liabilities | (9,703) | (7,166) | |
| Proceeds from other financing activities | 56 | 32 | |
| Payments of other financing activities | (183) | (1,774) | |
| Net cash generated from financing activities | 66,861 | 75,212 | |
| Net increase in cash and cash equivalents | 993 | 29,021 | |
| Cash and cash equivalents at 1 January | 93,438 | 108,590 | |
| Effect of foreign currency exchange rate changes | 443 | 1,567 | |
| Cash and cash equivalents at 30 June | 94,874 | 139,178 | |
Notes to the financial statements on pages 116 to 146 are parts of the interim condensed consolidated financial statements.
114
NOTES TO UNAUDITED INTERIM CONDENSED CONSOLIDATED STATEMENT OF CASH FLOWS
For the six-month period ended 30 June 2023
(Amounts in million)
(a) Reconciliation from profit before taxation to net cash generated from operating activities
| Six-month period ended 30 June | ||
| 2023 | 2022 | |
| RMB | RMB | |
| Operating activities | ||
| Profit before taxation | 51,766 | 65,040 |
| Adjustments for: | ||
| Depreciation, depletion and amortisation | 55,239 | 53,638 |
| Dry hole costs written off | 3,094 | 3,725 |
| Share of profits less losses from associates and joint ventures | (2,611) | (7,327) |
| Investment income | (249) | (126) |
| Interest income | (3,239) | (3,012) |
| Interest expense | 9,049 | 8,124 |
| (Gain)/loss on foreign currency exchange rate changes and derivative financial instruments | (1,185) | 2,405 |
| (Gain)/loss on disposal of property, plant, equipment and other non-current assets, net | (605) | 36 |
| Impairment losses on assets | 2,365 | 1,456 |
| Impairment losses/(reversal) on trade and other receivables | 35 | (72) |
| 113,659 | 123,887 | |
| Net changes from: | ||
| Accounts receivable and other current assets | (15,937) | (49,228) |
| Inventories | (40,263) | (79,034) |
| Accounts payable and other current liabilities | (25,317) | 18,842 |
| 32,142 | 14,467 | |
| Income tax paid | (4,580) | (9,520) |
| Net cash generated from operating activities | 27,562 | 4,947 |
Notes to the financial statements on pages 116 to 146 are parts of the interim condensed consolidated financial statements
115
NOTES TO THE UNAUDITED INTERIM CONDENSED CONSOLIDATED FINANCIAL STATEMENTS
For the six-month period ended 30 June 2023
| 1 | PRINCIPAL ACTIVITIES AND ORGANISATION |
Principal activities
China Petroleum & Chemical Corporation (the “Company”) is an energy and chemical company incorporated in the People’s Republic of China (the “PRC”) that, through its subsidiaries (hereinafter collectively referred to as the “Group”), engages in oil and gas and chemical operations. Oil and gas operations consist of exploring for, developing and producing crude oil and natural gas; transporting crude oil and natural gas by pipelines; refining crude oil into finished petroleum products; and marketing crude oil, natural gas and refined petroleum products. Chemical operations include the manufacture and marketing of a wide range of chemicals for industrial uses.
Organisation
The Company was established in the PRC on 25 February 2000 as a joint stock limited company as part of the reorganisation (the “Reorganisation”) of China Petrochemical Corporation (“Sinopec Group Company”), the ultimate holding company of the Group and a ministry-level enterprise under the direct supervision of the State Council of the PRC. Prior to the incorporation of the Company, the oil and gas and chemical operations of the Group were carried on by oil administration bureaux, petrochemical and refining production enterprises and sales and marketing companies of Sinopec Group Company.
As part of the Reorganisation, certain of Sinopec Group Company’s core oil and gas and chemical operations and businesses together with the related assets and liabilities were transferred to the Company. On 25 February 2000, in consideration for Sinopec Group Company transferring such oil and gas and chemical operations and businesses and the related assets and liabilities to the Company, the Company issued 68.8 billion domestic state-owned ordinary shares with a par value of RMB1.00 each to Sinopec Group Company. The shares issued to Sinopec Group Company on 25 February 2000 represented the entire registered and issued share capital of the Company on that date. The oil and gas and chemical operations and businesses transferred to the Company were related to (i) the exploration, development and production of crude oil and natural gas, (ii) the refining, transportation, storage and marketing of crude oil and petroleum products, and (iii) the production and sales of chemicals.
| 2 | BASIS OF PREPARATION |
This interim condensed consolidated financial report for the half-year reporting period ended 30 June 2023 has been prepared in accordance with International Accounting Standard (“IAS”) 34, Interim Financial Reporting.
The interim report does not include all the notes of the type normally included in an annual financial report. Accordingly, this report is to be read in conjunction with the annual report for the year ended 31 December 2022 and any public announcements made by the Group during the interim reporting period.
New and amended standards and interpretations adopted by the Group:
The International Accounting Standard Board (“IASB”) has issued the following amendments to IFRSs that are first effective for the current accounting period of the Group:
| • | Amendment to IAS 8, Accounting policies changes in accounting estimates and errors: Definition of accounting estimates |
| • | Amendment to IAS 12, Deferred tax related to assets and liabilities arising from a single transaction |
The Group has not applied any new standard or interpretation that is not yet effective for the current accounting period. Impacts of the adoption of the new and amended IFRSs are discussed below:
Amendment to IAS 8, Accounting policies changes in accounting estimates and errors: Definition of accounting estimates
The amendments provide further guidance on the distinction between changes in accounting policies and changes in accounting estimates. The amendments do not have a material impact on these financial statements as the Group’s approach in distinguishing changes in accounting policies and changes in accounting estimates is consistent with the amendments.
Amendment to IAS 12, Deferred tax related to assets and liabilities arising from a single transaction:
116
| 2 | BASIS OF PREPARATION (Continued) |
| (i) | Accounting treatment of deferred tax related to assets and liabilities arising from a single transaction for which initial recognition exemption does not apply. |
The International Accounting Standards Board has amended IAS 12 and the scope of the exemption in paragraphs 15 and 24 of the previous standard is amended to “accounting treatment of deferred tax related to assets and liabilities arising from a single transaction for which initial recognition exemption does not apply”, therefore, the Group needs to recognise deferred tax assets and deferred tax liabilities for temporary differences arising from these transactions. The amendment is effective for annual reporting periods beginning on or after 1 January 2023, with earlier application permitted. The Group applies the amendments to transactions occurring on or after the beginning of the earliest comparative period listed, with any cumulative effect recognised as an adjustment to retained earnings and other related financial statement items at that date.
| (ii) | The effects on the comparative financial statements |
The effects of the above changes in accounting policies on the profit for the six-month period ended 30 June 2022 and equity at the beginning and the end of 2022 are summarised as follows:
| Profit for the six-month period ended 30 June 2022 | Equity as of 31 December 2022 | Equity as of 1 January 2022 | |
| RMB million | RMB million | RMB million | |
| Profit for the period or equity before adjustments | 50,579 | 936,238 | 915,074 |
| The effects of the exemption of initial recognition not applicable to the deferred tax relating to assets and liabilities arising out of a single transaction | 428 | 3,304 | 2,448 |
| Profit for the period or equity after adjustments | 51,007 | 939,542 | 917,522 |
The effects of the above changes in accounting policies on each item of the consolidated income statement for the six-month period ended 30 June 2022 are summarised as follows:
| Six-month period ended 30 June 2022 before adjustment | Adjusted amount | Six -month period ended 30 June 2022 after adjustment | |
| RMB million | RMB million | RMB million | |
| Profit before taxation | 65,040 | – | 65,040 |
| Income tax expense | (14,461) | 428 | (14,033) |
| Profit for the period | 50,579 | 428 | 51,007 |
Attributable to: | |||
| Owners of the Company | 44,451 | 390 | 44,841 |
| Non-controlling interests | 6,128 | 38 | 6,166 |
| Profit for the period | 50,579 | 428 | 51,007 |
| Earnings per share: | |||
| Basic earnings per share (RMB/Share) | 0.367 | 0.003 | 0.370 |
| Diluted earnings per share (RMB/Share) | 0.367 | 0.003 | 0.370 |
117
| 2 | BASIS OF PREPARATION (Continued) |
| (ii) | The effects on the comparative financial statements (Continued) |
The effects of the above changes in accounting policies on each item of the consolidated statement of comprehensive income for the six-month period ended 30 June 2022 are summarised as follows:
| Six-month period ended 30 June 2022 before adjustment | Adjusted amount | Six-month period ended 30 June 2022 after adjustment | |
| RMB million | RMB million | RMB million | |
| Total comprehensive income for the period | 67,286 | 428 | 67,714 |
| Attributable to: | |||
| Shareholders of the Company | 60,484 | 390 | 60,874 |
| Non-controlling interests | 6,802 | 38 | 6,840 |
The effects of the above changes in accounting policies on each item of the consolidated statement of financial position as at 31 December 2022 are summarised as follows:
| As of 31 December 2022 before adjustment | Adjusted amount | As of 31 December 2022 after adjustment | |
| RMB million | RMB million | RMB million | |
| Non-current assets: | |||
| Deferred tax assets | 19,952 | 2,481 | 22,433 |
| Total non-current assets | 1,425,500 | 2,481 | 1,427,981 |
| Total current assets | 523,140 | – | 523,140 |
| Total current liabilities | 667,385 | – | 667,385 |
| Net current liabilities | 144,245 | – | 144,245 |
| Total assets less current liabilities | 1,281,255 | 2,481 | 1,283,736 |
| Non-current liabilities: | |||
| Deferred tax liabilities | 8,079 | (823) | 7,256 |
| Total non-current liabilities | 345,017 | (823) | 344,194 |
| Equity | |||
| Reserves | 664,810 | 2,894 | 667,704 |
| Total equity attributable to shareholders of the Company | 784,706 | 2,894 | 787,600 |
| Non-controlling interests | 151,532 | 410 | 151,942 |
| Total equity | 936,238 | 3,304 | 939,542 |
118
| 2 | BASIS OF PREPARATION (Continued) |
| (iii) | After retrospective adjustment of the above accounting policy changes, the consolidated statement of financial position as at 1 January 2022 is as follows: |
| 1 January 2022 | |
| RMB million | |
| Non-current assets | |
| Property, plant and equipment, net | 598,925 |
| Construction in progress | 155,939 |
| Right-of-use assets | 268,408 |
| Goodwill | 8,594 |
| Interest in associates | 148,729 |
| Interest in joint ventures | 60,450 |
| Financial assets at fair value through other comprehensive income | 767 |
| Deferred tax assets | 21,098 |
| Long-term prepayments and other assets | 70,030 |
| Total non-current assets | 1,332,940 |
| Current assets | |
| Cash and cash equivalents | 108,590 |
| Time deposits with financial institutions | 113,399 |
| Derivative financial assets | 18,371 |
| Trade accounts receivable | 34,861 |
| Financial assets at fair value through other comprehensive income | 5,939 |
| Inventories | 207,433 |
| Prepaid expenses and other current assets | 69,431 |
| Total current assets | 558,024 |
| Current liabilities | |
| Short-term debts | 35,252 |
| Loans from Sinopec Group Company and fellow subsidiaries | 2,873 |
| Lease liabilities | 15,173 |
| Derivative financial liabilities | 3,223 |
| Trade accounts payable and bills payable | 215,640 |
| Contract liabilities | 124,622 |
| Other payables | 239,688 |
| Income tax payable | 4,809 |
| Total current liabilities | 641,280 |
| Net current liabilities | 83,256 |
| Total assets less current liabilities | 1,249,684 |
| Non-current liabilities | |
| Long-term debts | 78,300 |
| Loans from Sinopec Group Company and fellow subsidiaries | 13,690 |
| Lease liabilities | 170,233 |
| Deferred tax liabilities | 7,171 |
| Provisions | 43,525 |
| Other long-term liabilities | 19,243 |
| Total non-current liabilities | 332,162 |
| 917,522 | |
| Equity | |
| Share capital | 121,071 |
| Reserves | 655,225 |
| Total equity attributable to shareholders of the Company | 776,296 |
| Non-controlling interests | 141,226 |
| Total equity | 917,522 |
119
| 3 | REVENUE FROM PRIMARY BUSINESS |
Revenue from primary business mainly represents revenue from the sales of refined petroleum products, chemical products, crude oil and natural gas, which are recognised at a point in time.
| Six-month period ended 30 June | ||
| 2023 | 2022 | |
| RMB million | RMB million | |
| Gasoline | 422,630 | 389,830 |
| Diesel | 341,682 | 327,767 |
| Crude oil | 248,764 | 278,099 |
| Chemical feedstock | 20,448 | 23,059 |
| Basic organic chemicals | 99,556 | 116,963 |
| Synthetic resin | 63,087 | 74,451 |
| Kerosene | 95,860 | 71,419 |
| Natural gas | 41,690 | 38,017 |
| Synthetic fiber monomers and polymers | 16,413 | 25,186 |
| Others (i) | 211,372 | 237,445 |
| 1,561,502 | 1,582,236 | |
Note:
| (i) | Others are primarily liquefied petroleum gas and other refinery and chemical by-products and joint products. |
| 4 | TAXES OTHER THAN INCOME TAX |
| Six-month period ended 30 June | ||
| 2023 | 2022 | |
| RMB million | RMB million | |
| Consumption tax (i) | 104,049 | 103,510 |
| City construction tax (ii) | 8,302 | 9,011 |
| Special oil income levy | 2,321 | 8,095 |
| Education surcharge (ii) | 6,096 | 6,486 |
| Resources tax | 3,936 | 4,404 |
| Others | 2,557 | 2,903 |
| 127,261 | 134,409 | |
Notes:
| (i) | Consumption tax was levied based on sales quantities of taxable products, tax rates of respective products are presented as below: |
| Products | RMB/Ton | |
| Gasoline | 2,109.76 | |
| Diesel | 1,411.20 | |
| Naphtha | 2,105.20 | |
| Solvent oil | 1,948.64 | |
| Lubricant oil | 1,711.52 | |
| Fuel oil | 1,218.00 | |
| Jet fuel oil | 1,495.20 |
| (ii) | City construction tax and education surcharge are levied on an entity based on its paid amount of value-added tax and consumption tax. |
120
| 5 | INCOME TAX EXPENSE |
Income tax expense in the consolidated income statement represents:
| Six-month period ended 30 June | ||
| 2023 | 2022 | |
| RMB million | RMB million | |
| Current tax | ||
| – Provision for the period | 7,474 | 14,135 |
| – Adjustment of prior years | (1,369) | 370 |
| Deferred taxation | 4,065 | (472) |
| 10,170 | 14,033 | |
| 6 | DIVIDENDS |
Dividends payable to shareholders of the Company attributable to the period represent:
| Six-month period ended 30 June | ||
| 2023 | 2022 | |
| RMB million | RMB million | |
| Interim dividends declared after the date of the statement of financial position of RMB0.145 per share (2022: RMB0.16 per share) | 17,385 | 19,371 |
Pursuant to the Company’s Articles of Association and a resolution passed at the Directors’ meeting on 25 August 2023, the directors authorised to declare the interim dividends for the year ending 31 December 2023 of RMB0.145 (2022: RMB0.16) per share totalling RMB17,385 million (2022: RMB19,371 million). Dividends declared after the date of the statement of financial position are not recognised as a liability at the date of the statement of financial position.
Dividends payable to shareholders of the Company attributable to the previous financial year, approved during the period represent:
| Six-month period ended 30 June | ||
| 2023 | 2022 | |
| RMB million | RMB million | |
| Final cash dividends in respect of the previous financial year, approved during the period of RMB0.195 per share (2022: RMB0.31 per share) | 23,380 | 37,532 |
Pursuant to the shareholders’ approval at the Annual General Meeting on 30 May 2023, a final dividend for the year ended 31 December 2022 of RMB0.195 per share totalling RMB23,380 million according to total shares on 20 June 2023 was approved. All dividends have been paid in June 2023.
Pursuant to the shareholders’ approval at the Annual General Meeting on 18 May 2022, a final dividend for the year ended 31 December 2021 of RMB0.31 per share totalling RMB37,532 million according to total shares on 9 June 2022 was approved. All dividends have been paid in June 2022.
| 7 | BASIC AND DILUTED EARNINGS PER SHARE |
The calculation of basic earnings per share for the six-month period ended 30 June 2023 is based on profit attributable to ordinary shareholders of the Company of RMB36,122 million (six-month period ended 30 June 2022: profit of RMB44,841 million) and the weighted average number of shares of 119,896,407,646 (six-month period ended 30 June 2022: 121,071,209,646) during the period.
There are no potential dilutive ordinary shares, and the diluted earnings per share are equal to the basic earnings per share.
121
| 8 | PROPERTY, PLANT AND EQUIPMENT |
| Plants and buildings | Oil and gas properties | Equipment, machinery and others | Total | |
| RMB million | RMB million | RMB million | RMB million | |
| Cost: | ||||
| Balance at 1 January 2022 | 143,165 | 793,045 | 1,048,227 | 1,984,437 |
| Additions | 265 | 867 | 2,756 | 3,888 |
| Transferred from construction in progress | 1,611 | 14,221 | 23,179 | 39,011 |
| Reclassifications | 395 | (13) | (382) | – |
| Invested into joint ventures and associates | (6) | – | (75) | (81) |
| Transferred to other long-term assets | (15) | (5) | (441) | (461) |
| Disposals | (147) | (265) | (1,869) | (2,281) |
| Exchange adjustments | 109 | 2,146 | 165 | 2,420 |
| Balance at 30 June 2022 | 145,377 | 809,996 | 1,071,560 | 2,026,933 |
| Balance at 1 January 2023 | 152,432 | 840,719 | 1,105,325 | 2,098,476 |
| Additions | 13 | 764 | 752 | 1,529 |
| Transferred from construction in progress | 2,207 | 18,651 | 25,779 | 46,637 |
| Reclassifications | (433) | (399) | 832 | – |
| Invested into joint ventures and associates | – | – | (3) | (3) |
| Transferred to other long-term assets | – | (12) | (1,044) | (1,056) |
| Disposals | (474) | (32) | (5,477) | (5,983) |
| Exchange adjustments | 91 | 1,664 | 131 | 1,886 |
| Balance at 30 June 2023 | 153,836 | 861,355 | 1,126,295 | 2,141,486 |
| Accumulated depreciation and impairment losses: | ||||
| Balance at 1 January 2022 | 68,166 | 660,838 | 656,508 | 1,385,512 |
| Depreciation for the period | 2,153 | 14,865 | 25,002 | 42,020 |
| Impairment losses for the period | – | – | 2 | 2 |
| Reclassifications | 240 | (12) | (228) | – |
| Invested into joint ventures and associates | (1) | – | (22) | (23) |
| Transferred to other long-term assets | (6) | (3) | (33) | (42) |
| Disposals | (117) | (249) | (1,633) | (1,999) |
| Exchange adjustments | 52 | 2,057 | 100 | 2,209 |
| Balance at 30 June 2022 | 70,487 | 677,496 | 679,696 | 1,427,679 |
| Balance at 1 January 2023 | 72,795 | 697,612 | 697,369 | 1,467,776 |
| Depreciation for the period | 2,478 | 14,983 | 25,528 | 42,989 |
| Impairment losses for the period | 3 | – | 31 | 34 |
| Reclassifications | 18 | (398) | 380 | – |
| Invested into joint ventures and associates | – | – | (3) | (3) |
| Transferred to other long-term assets | (12) | (9) | (579) | (600) |
| Disposals | (242) | (25) | (4,659) | (4,926) |
| Exchange adjustments | 43 | 1,620 | 85 | 1,748 |
| Balance at 30 June 2023 | 75,083 | 713,783 | 718,152 | 1,507,018 |
| Net book value: | ||||
| Balance at 1 January 2022 | 74,999 | 132,207 | 391,719 | 598,925 |
| Balance at 30 June 2022 | 74,890 | 132,500 | 391,864 | 599,254 |
| Balance at 1 January 2023 | 79,637 | 143,107 | 407,956 | 630,700 |
| Balance at 30 June 2023 | 78,753 | 147,572 | 408,143 | 634,468 |
The additions to oil and gas properties of the Group for the six-month period ended 30 June 2023 included RMB750 million (six-month period ended 30 June 2022: RMB867 million) of estimated dismantlement costs for site restoration.
At 30 June 2023 and 31 December 2022, the Group had no individual significant property, plant and equipment which have been pledged.
At 30 June 2023 and 31 December 2022, the Group had no individual significant property, plant and equipment which were temporarily idle or pending for disposal.
At 30 June 2023 and 31 December 2022, the Group had no individual significant fully depreciated property, plant and equipment which were still in use.
122
| 9 | CONSTRUCTION IN PROGRESS |
| Six-month period ended 30 June | ||
| 2023 | 2022 | |
| RMB million | RMB million | |
| Balance at 1 January | 196,045 | 155,939 |
| Additions | 73,414 | 59,688 |
| Dry hole costs written off | (3,094) | (3,725) |
| Transferred to property, plant and equipment | (46,637) | (39,011) |
| Reclassification to other long-term assets | (4,185) | (3,872) |
| Disposals and others | (63) | 5 |
| Exchange adjustments | 4 | 32 |
| Balance at 30 June | 215,484 | 169,056 |
As at 30 June 2023, the amount of capitalised cost of exploratory wells included in construction in progress related to the exploration and production segment was RMB17,858 million (31 December 2022: RMB17,062 million). The geological and geophysical exploration costs paid during the period ended 30 June 2023 were RMB1,880 million (six-month period ended 30 June 2022: RMB1,943 million).
| 10 | RIGHT-OF-USE ASSETS |
| Land | Others | Total | |
| RMB million | RMB million | RMB million | |
| Cost: | |||
| Balance at 1 January 2023 | 269,127 | 51,800 | 320,927 |
| Additions | 4,797 | 4,740 | 9,537 |
| Decreases | (2,183) | (1,649) | (3,832) |
| Balance at 30 June 2023 | 271,741 | 54,891 | 326,632 |
| Accumulated depreciation: | |||
| Balance at 1 January 2023 | 35,264 | 20,807 | 56,071 |
| Additions | 5,239 | 3,850 | 9,089 |
| Decreases | (1,044) | (1,432) | (2,476) |
| Balance at 30 June 2023 | 39,459 | 23,225 | 62,684 |
| Net book value: | |||
| Balance at 1 January 2023 | 233,863 | 30,993 | 264,856 |
| Balance at 30 June 2023 | 232,282 | 31,666 | 263,948 |
123
| 11 | LONG-TERM PREPAYMENTS AND OTHER ASSETS |
| 30 June | 31 December | |
| 2023 | 2022 | |
| RMB million | RMB million | |
| Operating rights of service stations | 27,280 | 28,009 |
| Long-term receivables due from and prepayment to Sinopec Group Company and fellow subsidiaries | 2,514 | 3,235 |
| Prepayments for construction projects to third parties | 6,997 | 7,505 |
| Others (i) | 43,615 | 34,063 |
| 80,406 | 72,812 |
Note:
| (i) | Others mainly comprise catalyst expenditures, improvement expenditures of property, plant and equipment and time deposits with maturities over one year. |
The cost of operating rights of service stations is charged to expense on a straight-line basis over the respective periods of the rights. The movement of operating rights of service stations is as follows:
| Six-month period ended 30 June | ||
| 2023 | 2022 | |
| RMB million | RMB million | |
| Operating rights of service stations | ||
| Cost: | ||
| Balance at 1 January | 54,130 | 53,791 |
| Additions | 461 | 377 |
| Decreases | (224) | (221) |
| Balance at 30 June | 54,367 | 53,947 |
| Accumulated amortisation: | ||
| Balance at 1 January | 26,121 | 24,077 |
| Additions | 1,112 | 1,181 |
| Decreases | (146) | (85) |
| Balance at 30 June | 27,087 | 25,173 |
| Net book value at 30 June | 27,280 | 28,774 |
124
| 12 | TRADE ACCOUNTS RECEIVABLE |
| 30 June | 31 December | |
| 2023 | 2022 | |
| RMB million | RMB million | |
| Amounts due from third parties | 63,930 | 38,942 |
| Amounts due from Sinopec Group Company and fellow subsidiaries | 5,710 | 7,261 |
| Amounts due from associates and joint ventures | 7,971 | 4,240 |
| 77,611 | 50,443 | |
| Less: Loss allowance for expected credit losses | (4,212) | (4,079) |
| 73,399 | 46,364 |
The ageing analysis of trade accounts receivable (net of loss allowance for expected credit losses) is as follows:
| 30 June | 31 December | |
| 2023 | 2022 | |
| RMB million | RMB million | |
| Within one year | 73,015 | 46,039 |
| Between one and two years | 210 | 152 |
| Between two and three years | 43 | 88 |
| Over three years | 131 | 85 |
| 73,399 | 46,364 |
Loss allowance for expected credit losses are analysed as follows:
| Six-month period ended 30 June | ||
| 2023 | 2022 | |
| RMB million | RMB million | |
| Balance at 1 January | 4,079 | 4,033 |
| Provision for the period | 195 | 156 |
| Written back for the period | (168) | (217) |
| Written off for the period | (3) | (33) |
| Others | 109 | 141 |
| Balance at 30 June | 4,212 | 4,080 |
Sales are generally on cash term. Credit is generally only available for major customers with well-established trading records. Amounts due from Sinopec Group Company and fellow subsidiaries are repayable under the same terms.
These receivables relate to a wide range of customers for whom there is no recent history of default.
Information about the impairment of trade accounts receivable and the Group’s exposure to credit risk can be found in Note 21.
125
| 13 | FINANCIAL ASSETS AT FAIR VALUE THROUGH OTHER COMPREHENSIVE INCOME |
| 30 June | 31 December | |
| 2023 | 2022 | |
| RMB million | RMB million | |
| Non-current assets | ||
| Unlisted equity instruments | 567 | 616 |
| Listed equity instruments | 115 | 114 |
| Current assets | ||
| Trade accounts receivable and bills receivable (i) | 4,294 | 3,507 |
| 4,976 | 4,237 |
Note:
| (i) | As at 30 June 2023, bills receivable and certain trade accounts receivable were classified as financial assets at fair value through other comprehensive income (“FVOCI”), as relevant business model is achieved both by collecting contractual cash flows and selling of these assets. |
| 14 | SHORT-TERM AND LONG-TERM DEBTS AND LOANS FROM SINOPEC GROUP COMPANY AND FELLOW SUBSIDIARIES |
Short-term and long-term bank loans, short-term other loans and loans from Sinopec Group Company and fellow subsidiaries are primarily unsecured and carried at amortised cost.
Short-term debts represent:
| 30 June | 31 December | |
| 2023 | 2022 | |
| RMB million | RMB million | |
| Third parties’ debts | ||
| Short-term bank loans | 86,318 | 14,461 |
| RMB denominated | 86,318 | 14,325 |
| USD denominated | – | 136 |
| Current portion of long-term bank loans | 4,631 | 13,876 |
| RMB denominated | 4,631 | 13,875 |
| USD denominated | – | 1 |
| Current portion of long-term corporate bonds | 2,000 | 30,700 |
| RMB denominated | 2,000 | 30,700 |
| 92,949 | 59,037 | |
| Loans from Sinopec Group Company and fellow subsidiaries | ||
| Short-term loans | 12,814 | 6,852 |
| RMB denominated | 8,082 | 5,911 |
| USD denominated | 4,732 | 906 |
| Euro denominated | – | 35 |
| Current portion of long-term loans | 362 | 440 |
| RMB denominated | 362 | 440 |
| 13,176 | 7,292 | |
| 106,125 | 66,329 |
The Group’s weighted average interest rate on short-term loans was 2.34% (31 December 2022: 2.63%) per annum at 30 June 2023. The above borrowings are unsecured.
126
| 14 | SHORT-TERM AND LONG-TERM DEBTS AND LOANS FROM SINOPEC GROUP COMPANY AND FELLOW SUBSIDIARIES (Continued) |
Long-term debts represent:
| Interest rate and final maturity | 30 June | 31 December | |
| 2023 | 2022 | ||
| RMB million | RMB million | ||
| Third parties’ debts | |||
| Long-term bank loans | |||
| RMB denominated | Interest rates ranging from 1.00% to 4.80% per annum at 30 June 2023 with maturities through 2040 | 140,947 | 86,532 |
| USD denominated | Interest rates at 0.00% per annum at 30 June 2023 with maturities through 2038 | 53 | 53 |
| 141,000 | 86,585 | ||
| Corporate bonds | |||
| RMB denominated | Fixed interest rates ranging from 2.20% to 3.20% per annum at 30 June 2023 with maturities through 2026 | 11,539 | 31,534 |
| USD denominated | Fixed interest rates ranging 4.25% per annum at 30 June 2023 with maturities through 2043 | 3,591 | 12,163 |
| 15,130 | 43,697 | ||
| Total third parties’ long-term debts | 156,130 | 130,282 | |
| Less: Current portion | (6,631) | (44,576) | |
| 149,499 | 85,706 | ||
| Long-term loans from Sinopec Group Company and fellow subsidiaries | |||
| RMB denominated | Interest rates ranging from 1.08% to 5.23% per annum at 30 June 2023 with maturities through 2037 | 24,010 | 22,695 |
| Less: Current portion | (362) | (440) | |
| 23,648 | 22,255 | ||
| 173,147 | 107,961 | ||
These corporate bonds are carried at amortised cost.
| 15 | LEASE LIABILITIES |
| 30 June | 31 December | |
| 2023 | 2022 | |
| RMB million | RMB million | |
| Lease liabilities | ||
| Current | 17,318 | 16,004 |
| Non-current | 165,367 | 166,407 |
| 182,685 | 182,411 |
127
| 16 | TRADE ACCOUNTS PAYABLE AND BILLS PAYABLE |
| 30 June | 31 December | |
| 2023 | 2022 | |
| RMB million | RMB million | |
| Amounts due to third parties | 231,797 | 224,994 |
| Amounts due to Sinopec Group Company and fellow subsidiaries | 4,006 | 25,358 |
| Amounts due to associates and joint ventures | 9,112 | 8,290 |
| 244,915 | 258,642 | |
| Bills payable | 13,342 | 10,782 |
| Trade accounts payable and bills payable measured at amortised cost | 258,257 | 269,424 |
The ageing analysis of trade accounts payable and bills payable is as follows:
| 30 June | 31 December | |
| 2023 | 2022 | |
| RMB million | RMB million | |
| Within 1 month or on demand | 167,851 | 206,325 |
| Between 1 month and 6 months | 46,013 | 43,310 |
| Over 6 months | 44,393 | 19,789 |
| 258,257 | 269,424 |
| 17 | SHARE CAPITAL |
| 30 June | 31 December | |
| 2023 | 2022 | |
| RMB million | RMB million | |
| Registered, issued and fully paid | ||
| 95,115,471,046 listed A shares (31 December 2022: 95,115,471,046) of RMB1.00 each | 95,115 | 95,115 |
| 24,780,936,600 listed H shares (31 December 2022: 24,780,936,600) of RMB1.00 each | 24,781 | 24,781 |
| 119,896 | 119,896 |
The Company was established on 25 February 2000 with a registered capital of 68.8 billion domestic state-owned shares with a par value of RMB1.00 each. Such shares were issued to Sinopec Group Company in consideration for the assets and liabilities transferred to the Company (Note 1).
Pursuant to the resolutions passed at an Extraordinary General Meeting held on 25 July 2000 and approvals from relevant government authorities, the Company is authorised to increase its share capital to a maximum of 88.3 billion shares with a par value of RMB1.00 each and offer not more than 19.5 billion shares with a par value of RMB1.00 each to investors outside the PRC. Sinopec Group Company is authorised to offer not more than 3.5 billion shares of its shareholdings in the Company to investors outside the PRC. The shares sold by Sinopec Group Company to investors outside the PRC would be converted into H shares.
In October 2000, the Company issued 15,102,439,000 H shares with a par value of RMB1.00 each, representing 12,521,864,000 H shares and 25,805,750 American Depositary Shares (“ADSs”, each representing 100 H shares), at prices of Hong Kong Dollar (“HKD”)1.59 per H share and USD20.645 per ADS, respectively, by way of a global initial public offering to Hong Kong and overseas investors. As part of the global initial public offering, 1,678,049,000 state-owned ordinary shares of RMB1.00 each owned by Sinopec Group Company were converted into H shares and sold to Hong Kong and overseas investors.
In July 2001, the Company issued 2.8 billion listed A shares with a par value of RMB1.00 each at RMB4.22 by way of a public offering to natural persons and institutional investors in the PRC.
During the year ended 31 December 2010, the Company issued 88,774 listed A shares with a par value of RMB1.00 each, as a result of exercise of 188,292 warrants entitled to the Bonds with Warrants.
During the year ended 31 December 2011, the Company issued 34,662 listed A shares with a par value of RMB1.00 each, as a result of conversion by the holders of the 2011 Convertible Bonds.
During the year ended 31 December 2012, the Company issued 117,724,450 listed A shares with a par value of RMB1.00 each, as a result of conversion by the holders of the 2011 Convertible Bonds.
On 14 February 2013, the Company issued 2,845,234,000 listed H shares (“the Placing”) with a par value of RMB1.00 each at the Placing Price of HKD8.45 per share. The aggregate gross proceeds from the Placing amounted to approximately HKD24,042,227,300.00 and the aggregate net proceeds (after deduction of the commissions and estimated expenses) amounted to approximately HKD23,970,100,618.00.
128
| 17 | SHARE CAPITAL (Continued) |
In June 2013, the Company issued 21,011,962,225 listed A shares and 5,887,716,600 listed H shares as a result of bonus issues of 2 shares converted from the retained earnings, and 1 share transferred from the share premium for every 10 existing shares.
During the year ended 31 December 2013, the Company issued 114,076 listed A shares with a par value of RMB1.00 each, as a result of exercise of conversion by the holders of the 2011 Convertible Bonds.
During the year ended 31 December 2014, the Company issued 1,715,081,853 listed A shares with a par value of RMB1.00 each, as a result of exercise of conversion by the holders of the 2011 Convertible Bonds.
During the year ended 31 December 2015, the Company issued 2,790,814,006 listed A shares with a par value of RMB1.00 each, as a result of exercise of conversion by the holders of the 2011 Convertible Bonds.
During the year ended 31 December 2022, the Company repurchased 442,300,000 listed A shares and 732,502,000 listed H shares respectively, which had been cancelled in the year ended 31 December 2022.
All A shares and H shares rank pari passu in all material aspects.
Capital management
Management optimises the structure of the Group’s capital, which comprises of equity and debts. In order to maintain or adjust the capital structure of the Group, management may cause the Group to issue new shares, adjust the capital expenditure plan, sell assets to reduce debt, or adjust the proportion of short-term and long-term loans. Management monitors capital on the basis of the debt-to-capital ratio, which is calculated by dividing long-term loans (excluding current portion), including long-term debts and loans from Sinopec Group Company and fellow subsidiaries, by the total of equity attributable to shareholders of the Company and long-term loans (excluding current portion), and liability-to-asset ratio, which is calculated by dividing total liabilities by total assets. Management’s strategy is to make appropriate adjustments according to the Group’s operating and investment needs and the changes of market conditions, and to maintain the debt-to-capital ratio and the liability-to-asset ratio of the Group at a range considered reasonable. As at 30 June 2023, the debt-to-capital ratio and the liability-to-asset ratio of the Group were 17.9% (31 December 2022: 12.1%) and 53.2% (31 December 2022: 51.8%), respectively.
The schedule of the contractual maturities of loans and commitments are disclosed in Notes 14 and 18, respectively.
There were no changes in the management’s approach to capital management of the Group during the period. Neither the Company nor any of its subsidiaries is subject to externally imposed capital requirements.
| 18 | COMMITMENTS AND CONTINGENT LIABILITIES |
Capital commitments
At 30 June 2023 and 31 December 2022, capital commitments of the Group are as follows:
| 30 June | 31 December | |
| 2023 | 2022 | |
| RMB million | RMB million | |
| Authorised and contracted for (i) | 119,228 | 167,507 |
| Authorised but not contracted for | 91,540 | 94,407 |
| 210,768 | 261,914 |
These capital commitments relate to oil and gas exploration and development, refining and petrochemical production capacity expansion projects, the construction of service stations and oil depots and investment commitments.
Note:
| (i) | The investment commitments of the Group is RMB11,409 million (31 December 2022: RMB1,751 million). |
129
| 18 | COMMITMENTS AND CONTINGENT LIABILITIES (Continued) |
Commitments to joint ventures
Pursuant to certain of the joint venture agreements entered into by the Group, the Group is obliged to purchase products from the joint ventures based on market prices.
Exploration and production licenses
Exploration licenses for exploration activities are registered with the Ministry of Natural Resources. The maximum term of the Group’s exploration licenses is 7 years, and may be renewed twice within 30 days prior to expiration of the original term with each renewal being for a two-year term. The Group is obligated to make progressive annual minimum exploration investment relating to the exploration blocks in respect of which the license is issued. The Ministry of Natural Resources also issues production licenses to the Group on the basis of the reserve reports approved by relevant authorities. The maximum term of a full production license is 30 years unless a special dispensation is given by the State Council. The maximum term of production licenses issued to the Group is 80 years as a special dispensation was given to the Group by the State Council. The Group’s production license is renewable upon application by the Group 30 days prior to expiration.
The Group is required to make payments of exploration license fees and production right usage fees to the Ministry of Natural Resources annually which are expensed.
Estimated future annual payments are as follows:
| 30 June | 31 December | |
| 2023 | 2022 | |
| RMB million | RMB million | |
| Within one year | 642 | 369 |
| Between one and two years | 178 | 152 |
| Between two and three years | 144 | 146 |
| Between three and four years | 97 | 115 |
| Between four and five years | 37 | 62 |
| Thereafter | 872 | 857 |
| 1,970 | 1,701 |
Contingent liabilities
At 30 June 2023 and 31 December 2022, the guarantees by the Group in respect of facilities granted to the parties below are as follows:
| 30 June | 31 December | |
| 2023 | 2022 | |
| RMB million | RMB million | |
| Joint ventures (ii) | 8,852 | 8,927 |
Management monitors the risk that the specified debtor will default on the contract and recognises a provision when expected credit losses on the financial guarantees are determined to be higher than the carrying amount in respect of the guarantees. At 30 June 2023 and 31 December 2022, the Group estimates that there is no material liability has been accrued for expected credit losses related to the Group’s obligation under these guarantee arrangements.
Note:
| (ii) | The Group provided a guarantee in respect to standby credit facilities granted to Zhongan United Coal Chemical Co., Ltd. (“Zhongan United”) by banks amount to RMB7,100 million (31 December 2022: RMB7,100 million). As at 30 June 2023, the amount withdrawn (the portion corresponding to the shareholding ratio of the Group) by Zhongan United from banks and guaranteed by the Group was RMB5,041 million (31 December 2022: RMB5,254 million). |
The Group provided a guarantee in respect to standby credit facilities granted to Amur Gas Chemical Complex Limited Liability Company (“Amur Gas”) by banks amount to RMB26,302 million (31 December 2022: RMB25,351 million). As at 30 June 2023, the amount withdrawn (the portion corresponding to the shareholding ratio of the Group) by Amur Gas from banks and guaranteed by the Group was RMB3,811 million (31 December 2022: RMB3,673 million).
The Group provided a guarantee in respect to payment obligation under the raw material supply agreement of Amur Gas amount to RMB17,559 million (31 December 2022: RMB16,924 million). As at 30 June 2023, Amur Gas has not yet incurred the relevant payment obligations and therefore the Group has no guarantee amount (31 December 2022: Nil).
130
| 18 | COMMITMENTS AND CONTINGENT LIABILITIES (Continued) |
Environmental contingencies
Under existing legislation, management believes that there are no probable liabilities that will have a material adverse effect on the financial position or operating results of the Group. The PRC government, however, has moved, and may move further towards more rigorous enforcement of applicable laws, and towards the adoption of more stringent environmental standards. Environmental liabilities are subject to considerable uncertainties which affect management’s ability to estimate the ultimate cost of remediation efforts. These uncertainties include (i) the exact nature and extent of the contamination at various sites including, but not limited to refineries, oil fields, service stations, terminals and land development areas, whether operating, closed or sold, (ii) the extent of required cleanup efforts, (iii) varying costs of alternative remediation strategies, (iv) changes in environmental remediation requirements, and (v) the identification of new remediation sites. The amount of such future cost is indeterminable due to such factors as the unknown magnitude of possible contamination and the unknown timing and extent of the corrective actions that may be required. Accordingly, the outcome of environmental liabilities under proposed or future environmental legislation cannot reasonably be estimated at present, and could be material.
The Group paid normal routine pollutant discharge fees of approximately RMB7,195 million for the six-month period ended 30 June 2023 (six-month period ended 30 June 2022: RMB4,355 million).
Legal contingencies
The Group is defendant in certain lawsuits as well as the named party in other proceedings arising in the ordinary course of business. Management has assessed the likelihood of an unfavourable outcome of such contingencies, lawsuits or other proceedings and believes that any resulting liabilities will not have a material adverse effect on the financial position, operating results or cash flows of the Group.
| 19 | RELATED PARTY TRANSACTIONS |
Parties are considered to be related to the Group if the Group has the ability, directly or indirectly, to control or jointly control the party or exercise significant influence over the party in making financial and operating decisions, or vice versa, or where the Group and the party are subject to control or common control. Related parties may be individuals (being members of key management personnel, significant shareholders and/or their close family members) or other entities and include entities which are under the significant influence of related parties of the Group where those parties are individuals, and post-employment benefit plans which are for the benefit of employees of the Group or of any entity that is a related party of the Group.
| (a) | Transactions with Sinopec Group Company and fellow subsidiaries, associates and joint ventures |
The Group is part of a larger group of companies under Sinopec Group Company, which is controlled by the PRC government, and has significant transactions and relationships with Sinopec Group Company and fellow subsidiaries. Because of these relationships, it is possible that the terms of these transactions are not the same as those that would result from transactions among wholly unrelated parties.
The principal related party transactions with Sinopec Group Company and fellow subsidiaries, associates and joint ventures, which were carried out in the ordinary course of business are as follows:
| Note | Six-month period ended 30 June | ||
| 2023 | 2022 | ||
| RMB million | RMB million | ||
| Sales of goods | (i) | 193,947 | 169,483 |
| Purchases | (ii) | 96,702 | 80,755 |
| Transportation and storage | (iii) | 14,582 | 9,474 |
| Exploration and development services | (iv) | 16,331 | 15,512 |
| Production related services | (v) | 17,064 | 19,092 |
| Agency commission income | (vi) | 93 | 91 |
| Interest income | (vii) | 1,053 | 382 |
| Interest expense | (viii) | 571 | 216 |
| Net deposits (withdrew from)/placed with related parties | (vii) | (1,785) | 17,410 |
| Net funds obtained from related parties | (ix) | 22,779 | 29,695 |
The amounts set out in the table above in respect of the six-month periods ended 30 June 2023 and 2022 represent the relevant costs and income as determined by the corresponding contracts with the related parties.
131
| 19 | RELATED PARTY TRANSACTIONS (Continued) |
| (a) | Transactions with Sinopec Group Company and fellow subsidiaries, associates and joint ventures (Continued) |
Included in the transactions disclosed above, for the six-month period ended 30 June 2023 are: a) purchases by the Group from Sinopec Group Company and fellow subsidiaries amounting to RMB79,655 million (six-month period ended 30 June 2022: RMB68,143 million) comprising purchases of products and services (i.e. procurement, transportation and storage, exploration and development services and production related services) of RMB72,989 million (six-month period ended 30 June 2022: RMB61,818 million), lease charges for land, buildings and others paid by the Group of RMB5,464 million, RMB517 million and RMB114 million (six-month period ended 30 June 2022: RMB5,568 million, RMB470 million and RMB71 million), respectively and interest expenses of RMB571 million (six-month period ended 30 June 2022: RMB216 million); and b) sales by the Group to Sinopec Group Company and fellow subsidiaries amounting to RMB38,565 million (six-month period ended 30 June 2022: RMB31,238 million), comprising RMB37,470 million (six-month period ended 30 June 2022: RMB30,832 million) for sales of goods, RMB1,053 million (six-month period ended 30 June 2022: RMB382 million) for interest income and RMB42 million (six-month period ended 30 June 2022: RMB24 million) for agency commission income.
For the six-month period ended 30 June 2023, no individually significant right-of-use assets were leased from Sinopec Group Company and fellow subsidiaries, associates and joint ventures by the Group. The interest expense recognised for the six-month period ended 30 June 2023 on lease liabilities in respect of amounts due to Sinopec Group Company and fellow subsidiaries, associates and joint ventures was RMB3,843 million (six-month period ended 30 June 2022: RMB3,953 million).
For the six-month period ended 30 June 2023, the amount of rental the Group paid to Sinopec Group Company and fellow subsidiaries, associates and joint ventures for land, buildings and others are RMB5,468 million, RMB518 million and RMB140 million (six-month period ended 30 June 2022: RMB5,571 million, RMB471 million and RMB133 million).
As at 30 June 2023 and 31 December 2022, there was no guarantee given to banks by the Group in respect of banking facilities to Sinopec Group Company and fellow subsidiaries, associates and joint ventures, except for the guarantees disclosed in Note 18. Guarantees given to banks by the Group in respect of banking facilities to associates and joint ventures are disclosed in Note 18.
Note:
| (i) | Sales of goods represent the sale of crude oil, intermediate petrochemical products, petroleum products and ancillary materials. |
| (ii) | Purchases represent the purchase of materials and utility supplies directly related to the Group’s operations such as the procurement of raw and ancillary materials and related services, supply of water, electricity and gas. |
| (iii) | Transportation and storage represent the cost for the use of railway, road and marine transportation services, pipelines, loading, unloading and storage facilities. |
| (iv) | Exploration and development services comprise direct costs incurred in the exploration and development such as geophysical, drilling, well testing and well measurement services. |
| (v) | Production related services represent ancillary services rendered in relation to the Group’s operations such as equipment repair and general maintenance, insurance premium, technical research, communications, firefighting, security, product quality testing and analysis, information technology, design and engineering, construction of oilfield ground facilities, refineries and chemical plants, manufacture of replacement parts and machinery, installation, project management, environmental protection and management services. |
| (vi) | Agency commission income represents commission earned for acting as an agent in respect of sales of products and purchase of materials for certain entities owned by Sinopec Group Company. |
| (vii) | Interest income represents interest received from deposits placed with Sinopec Finance Company Limited (“Sinopec Finance”) and Sinopec Century Bright Capital Investment Limited, finance companies controlled by Sinopec Group Company. The applicable interest rate is determined in accordance with the prevailing saving deposit rate. The balance of deposits at 30 June 2023 was RMB63,279 million (31 December 2022: RMB65,064 million). |
| (viii) | Interest expense represents interest charges on the loans obtained from Sinopec Group Company and fellow subsidiaries. |
| (ix) | The Group obtained loans, discounted bills and issued the acceptance bills from Sinopec Group Company and fellow subsidiaries. |
132
| 19 | RELATED PARTY TRANSACTIONS (Continued) |
| (a) | Transactions with Sinopec Group Company and fellow subsidiaries, associates and joint ventures (Continued) |
In connection with the Reorganisation, the Company and Sinopec Group Company entered into a number of agreements under which 1) Sinopec Group Company will provide goods and products and a range of ancillary, social and supporting services to the Group and 2) the Group will sell certain goods to Sinopec Group Company. These agreements impacted the operating results of the Group for the six-month period ended 30 June 2023. The terms of these agreements are summarised as follows:
| • | The Company has entered into a non-exclusive “Agreement for Mutual Provision of Products and Ancillary Services” (“Mutual Provision Agreement”) with Sinopec Group Company effective from 1 January 2000 in which Sinopec Group Company has agreed to provide the Group with certain ancillary production services, construction services, information advisory services, supply services and other services and products. While each of Sinopec Group Company and the Company is permitted to terminate the Mutual Provision Agreement upon at least six-months notice, Sinopec Group Company has agreed not to terminate the agreement if the Group is unable to obtain comparable services from a third party. The pricing policy for these services and products provided by Sinopec Group Company to the Group is as follows: |
| (1) | the government-prescribed price; |
| (2) | where there is no government-prescribed price, the government-guidance price; |
| (3) | where there is neither a government-prescribed price nor a government-guidance price, the market price; or |
| (4) | where none of the above is applicable, the price to be agreed between the parties, which shall be based on a reasonable cost incurred in providing such services plus a profit margin not exceeding 6%. |
| • | The Company has entered into a non-exclusive “Agreement for Provision of Cultural and Educational, Health Care and Community Services” with Sinopec Group Company effective from 1 January 2000 in which Sinopec Group Company has agreed to provide the Group with certain cultural, educational, health care and community services on the same pricing terms and termination conditions as described in the above Mutual Provision Agreement. The term of the Cultural, Educational, Hygiene and Auxiliary Service Agreement expired on 31 December 2021, and is not renewed due to the significant decrease in the service scale after the separation and transfer of assets and business such as the Three Supplies and One Industry Assets etc. Cultural and educational services related or similar to training and auxiliary services thereunder have been incorporated into the Mutual Supply Agreement. |
| • | The Company has entered into a series of lease agreements with Sinopec Group Company to lease certain lands and buildings effective on 1 January 2000. The lease term is 40 or 50 years for lands and 20 years for buildings, respectively. The Company and Sinopec Group Company can renegotiate the rental amount every three years for land. The Company and Sinopec Group Company can renegotiate the rental amount for buildings every year. However such amount cannot exceed the market price as determined by an independent third party. |
| • | The Company has entered into agreements with Sinopec Group Company effective from 1 January 2000 under which the Group has been granted the right to use certain trademarks, patents, technology and computer software developed by Sinopec Group Company. |
| • | The Company has entered into a service stations franchise agreement with Sinopec Group Company effective from 1 January 2000 under which its service stations and retail stores would exclusively sell the refined products supplied by the Group. |
| • | On the basis of a series of continuing connected transaction agreements signed in 2000, the Company and Sinopec Group Company have signed the Sixth Supplementary Agreement on 27 August 2021, which took effect on 1 January 2022 and made adjustment to “Mutual Supply Agreement” and “Buildings Leasing Contract”, etc. |
133
| 19 | RELATED PARTY TRANSACTIONS (Continued) |
| (a) | Transactions with Sinopec Group Company and fellow subsidiaries, associates and joint ventures (Continued) |
Amounts due from/to Sinopec Group Company and fellow subsidiaries, associates and joint ventures included in the following accounts captions are summarised as follows:
| 30 June | 31 December | |
| 2023 | 2022 | |
| RMB million | RMB million | |
| Trade accounts receivable | 13,653 | 11,480 |
| Financial assets at fair value through other comprehensive income | 194 | 596 |
| Prepaid expenses and other current assets | 11,819 | 10,375 |
| Long-term prepayments and other assets | 8,911 | 8,633 |
| Total | 34,577 | 31,084 |
| Trade accounts payable and bills payable | 16,755 | 38,337 |
| Contract liabilities | 3,829 | 4,736 |
| Other payables | 18,426 | 38,312 |
| Other long-term liabilities | 5,179 | 5,180 |
| Short-term loans and current portion of long-term loans from Sinopec Group Company and fellow subsidiaries | 13,176 | 7,292 |
| Long-term loans excluding current portion from Sinopec Group Company and fellow subsidiaries | 23,648 | 22,255 |
| Lease liabilities (including to be paid within one year) | 156,109 | 156,537 |
| Total | 237,122 | 272,649 |
Amounts due from/to Sinopec Group Company and fellow subsidiaries, associates and joint ventures, other than short-term loans and long-term loans, bear no interest, are unsecured and are repayable in accordance with normal commercial terms. The terms and conditions associated with short-term loans and long-term loans payable to Sinopec Group Company and fellow subsidiaries are set out in Note 14.
As at and for the six-month period ended 30 June 2023, and as at and for the year ended 31 December 2022, no individually significant loss allowance for expected credit losses were recognised in respect of amounts due from Sinopec Group Company and fellow subsidiaries, associates and joint ventures.
| (b) | Key management personnel emoluments |
Key management personnel are those persons having authority and responsibility for planning, directing and controlling the activities of the Group, directly or indirectly, including directors and supervisors of the Group. The key management personnel compensation is as follows:
| Six-month period ended 30 June | ||
| 2023 | 2022 | |
| RMB’000 | RMB’000 | |
| Short-term employee benefits | 4,141 | 5,075 |
| Retirement scheme contributions | 274 | 270 |
| 4,415 | 5,345 | |
| (c) | Contributions to defined contribution retirement plans |
The Group participates in various defined contribution retirement plans organised by municipal and provincial governments for its staff. As at 30 June 2023 and 31 December 2022, the accrual for the contribution to post-employment benefit plans was not material.
134
| 19 | RELATED PARTY TRANSACTIONS (Continued) |
| (d) | Transactions with other state-controlled entities in the PRC |
The Group is a state-controlled energy and chemical enterprise and operates in an economic regime currently dominated by entities directly or indirectly controlled by the PRC government through its government authorities, agencies, affiliations and other organisations (collectively referred as “state-controlled entities”).
Apart from transactions with Sinopec Group Company and fellow subsidiaries, the Group has transactions with other state-controlled entities, include but not limited to the followings:
| • | sales and purchases of goods and ancillary materials; |
| • | rendering and receiving services; |
| • | lease of assets; |
| • | depositing and borrowing money; and |
| • | uses of public utilities. |
These transactions are conducted in the ordinary course of the Group’s business on terms comparable to those with other entities that are not state-controlled.
| 20 | SEGMENT REPORTING |
Segment information is presented in respect of the Group’s business segments. The format is based on the Group’s management and internal reporting structure.
In a manner consistent with the way in which information is reported internally to the Group’s chief operating decision maker for the purposes of resource allocation and performance assessment, the Group has identified the following five reportable segments. No operating segments have been aggregated to form the following reportable segments.
| (i) | Exploration and production, which explores and develops oil fields, produces crude oil and natural gas and sells such products to the refining segment of the Group and external customers. |
| (ii) | Refining, which processes and purifies crude oil, that is sourced from the exploration and production segment of the Group and external suppliers, and manufactures and sells petroleum products to the chemicals and marketing and distribution segments of the Group and external customers. |
| (iii) | Marketing and distribution, which owns and operates oil depots and service stations in the PRC, and distributes and sells refined petroleum products (mainly gasoline and diesel) in the PRC through wholesale and retail sales networks. |
| (iv) | Chemicals, which manufactures and sells petrochemical products, derivative petrochemical products and other chemical products mainly to external customers. |
| (v) | Corporate and others, which largely comprise the trading activities of the import and export companies of the Group and research and development undertaken by other subsidiaries. |
The segments were determined primarily because the Group manages its exploration and production, refining, marketing and distribution, chemicals, and corporate and others businesses separately. The reportable segments are each managed separately because they manufacture and/or distribute distinct products with different production processes and due to their distinct operating and gross margin characteristics.
135
| 20 | SEGMENT REPORTING (Continued) |
| (1) | Information of reportable segmental revenues, profits or losses, assets and liabilities |
The Group’s chief operating decision maker evaluates the performance and allocates resources to its operating segments on an operating profit basis, without considering the effects of finance costs or investment income. Inter-segment transfer pricing is based on the market price or cost plus an appropriate margin, as specified by the Group’s policy.
Assets and liabilities dedicated to a particular segment’s operations are included in that segment’s total assets and liabilities. Segment assets include all tangible and intangible assets, except for interest in associates and joint ventures, non-current financial assets at fair value through other comprehensive income, deferred tax assets, cash and cash equivalents, time deposits with financial institutions and other unallocated assets. Segment liabilities exclude short-term debts, income tax payable, long-term debts, loans from Sinopec Group Company and fellow subsidiaries, deferred tax liabilities and other unallocated liabilities.
Information of the Group’s reportable segments is as follows:
| Six-month period ended 30 June | ||
| 2023 | 2022 | |
| RMB million | RMB million | |
| Revenue from primary business | ||
| Exploration and production | ||
| External sales | 89,699 | 95,825 |
| Inter-segment sales | 52,999 | 60,314 |
| 142,698 | 156,139 | |
| Refining | ||
| External sales | 86,748 | 98,941 |
| Inter-segment sales | 640,999 | 674,791 |
| 727,747 | 773,732 | |
| Marketing and distribution | ||
| External sales | 839,360 | 767,183 |
| Inter-segment sales | 9,591 | 4,916 |
| 848,951 | 772,099 | |
| Chemicals | ||
| External sales | 196,777 | 234,168 |
| Inter-segment sales | 42,910 | 39,089 |
| 239,687 | 273,257 | |
| Corporate and others | ||
| External sales | 348,918 | 386,119 |
| Inter-segment sales | 460,405 | 525,043 |
| 809,323 | 911,162 | |
| Elimination of inter-segment sales | (1,206,904) | (1,304,153) |
| Revenue from primary business | 1,561,502 | 1,582,236 |
| Other operating revenues | ||
| Exploration and production | 2,165 | 2,029 |
| Refining | 1,810 | 1,904 |
| Marketing and distribution | 22,397 | 19,894 |
| Chemicals | 4,613 | 4,953 |
| Corporate and others | 1,195 | 1,110 |
| Other operating revenues | 32,180 | 29,890 |
| Revenue | 1,593,682 | 1,612,126 |
136
| 20 | SEGMENT REPORTING (Continued) |
| (1) | Information of reportable segmental revenues, profits or losses, assets and liabilities (Continued) |
| Six-month period ended 30 June | ||
| 2023 | 2022 | |
| RMB million | RMB million | |
| Result | ||
| Operating profit/(loss) | ||
| By segment | ||
| – Exploration and production | 25,408 | 26,302 |
| – Refining | 11,410 | 29,768 |
| – Marketing and distribution | 16,969 | 16,855 |
| – Chemicals | (3,358) | 810 |
| – Corporate and others | 3,557 | 399 |
| – Elimination | (290) | (11,210) |
| Total segment operating profit | 53,696 | 62,924 |
| Share of profits from associates and joint ventures | ||
| – Exploration and production | 1,512 | 1,936 |
| – Refining | (235) | 380 |
| – Marketing and distribution | 1,433 | 831 |
| – Chemicals | (3,231) | 1,620 |
| – Corporate and others | 3,132 | 2,560 |
| Aggregate share of profits from associates and joint ventures | 2,611 | 7,327 |
| Investment income/(loss) | ||
| – Exploration and production | – | – |
| – Refining | 16 | 32 |
| – Marketing and distribution | – | 39 |
| – Chemicals | (177) | (108) |
| – Corporate and others | 410 | 163 |
| Aggregate investment income | 249 | 126 |
| Net finance costs | (4,790) | (5,337) |
| Profit before taxation | 51,766 | 65,040 |
| 30 June | 31 December | |
| 2023 | 2022 | |
| RMB million | RMB million | |
| Assets | ||
| Segment assets | ||
| – Exploration and production | 428,632 | 412,543 |
| – Refining | 344,003 | 327,706 |
| – Marketing and distribution | 408,244 | 388,961 |
| – Chemicals | 273,201 | 242,794 |
| – Corporate and others | 134,305 | 148,014 |
| Total segment assets | 1,588,385 | 1,520,018 |
| Interest in associates and joint ventures | 231,561 | 233,941 |
| Financial assets at fair value through other comprehensive income | 682 | 730 |
| Deferred tax assets | 19,867 | 22,433 |
| Cash and cash equivalents, time deposits with financial institutions | 151,348 | 145,052 |
| Other unallocated assets | 35,059 | 28,947 |
| Total assets | 2,026,902 | 1,951,121 |
| Liabilities | ||
| Segment liabilities | ||
| – Exploration and production | 187,362 | 179,151 |
| – Refining | 64,600 | 86,428 |
| – Marketing and distribution | 236,337 | 237,534 |
| – Chemicals | 80,460 | 84,472 |
| – Corporate and others | 202,949 | 221,885 |
| Total segment liabilities | 771,708 | 809,470 |
| Short-term debts | 92,949 | 59,037 |
| Income tax payable | 3,802 | 4,725 |
| Long-term debts | 149,499 | 85,706 |
| Loans from Sinopec Group Company and fellow subsidiaries | 36,824 | 29,547 |
| Deferred tax liabilities | 7,786 | 7,256 |
| Other unallocated liabilities | 15,737 | 15,838 |
| Total liabilities | 1,078,305 | 1,011,579 |
137
| 20 | SEGMENT REPORTING (Continued) |
| (1) | Information of reportable segmental revenues, profits or losses, assets and liabilities (Continued) |
| Six-month period ended 30 June | ||
| 2023 | 2022 | |
| RMB million | RMB million | |
| Capital expenditure | ||
| Exploration and production | 33,421 | 33,337 |
| Refining | 7,063 | 8,929 |
| Marketing and distribution | 3,320 | 3,072 |
| Chemicals | 30,036 | 18,214 |
| Corporate and others | 827 | 1,102 |
| 74,667 | 64,654 | |
| Depreciation, depletion and amortisation | ||
| Exploration and production | 22,340 | 21,604 |
| Refining | 10,148 | 10,273 |
| Marketing and distribution | 11,890 | 11,645 |
| Chemicals | 9,138 | 8,639 |
| Corporate and others | 1,723 | 1,477 |
| 55,239 | 53,638 | |
| Impairment losses on long-lived assets | ||
| Exploration and production | – | – |
| Refining | – | 2 |
| Marketing and distribution | 34 | – |
| Chemicals | – | – |
| Corporate and others | – | – |
| 34 | 2 | |
| (2) | Geographical information |
The following tables set out information about the geographical information of the Group’s external sales and the Group’s non-current assets, excluding financial instruments and deferred tax assets. In presenting information on the basis of geographical segments, segment revenue is based on the geographical location of customers, and segment assets are based on the geographical location of the assets.
| Six-month period ended 30 June | ||
| 2023 | 2022 | |
| RMB million | RMB million | |
| External sales | ||
| Mainland China | 1,251,863 | 1,243,368 |
| Singapore | 174,860 | 193,966 |
| Others | 166,959 | 174,792 |
| 1,593,682 | 1,612,126 | |
| 30 June | 31 December | |
| 2023 | 2022 | |
| RMB million | RMB million | |
| Non-current assets | ||
| Mainland China | 1,387,037 | 1,353,771 |
| Others | 38,928 | 44,739 |
| 1,425,965 | 1,398,510 |
138
| 21 | FINANCIAL RISK MANAGEMENT AND FAIR VALUES |
Overview
Financial assets of the Group include cash and cash equivalents, time deposits with financial institutions, financial assets at fair value through profit or loss, derivative financial assets, trade accounts receivable, amounts due from Sinopec Group Company and fellow subsidiaries, amounts due from associates and joint ventures, financial assets at FVOCI and other receivables. Financial liabilities of the Group include short-term debts, loans from Sinopec Group Company and fellow subsidiaries, derivative financial liabilities, trade accounts payable and bills payable, amounts due to Sinopec Group Company and fellow subsidiaries, amounts due to associates and joint ventures, other payables, long-term debts and lease liabilities.
The Group has exposure to the following risks from its uses of financial instruments:
| • | credit risk; |
| • | liquidity risk; and |
| • | market risk. |
The Board of Directors has overall responsibility for the establishment, oversight of the Group’s risk management framework, and developing and monitoring the Group’s risk management policies.
The Group’s risk management policies are established to identify and analyse the risks faced by the Group, and set appropriate risk limits and controls to monitor risks and adherence to limits. Risk management policies and systems are reviewed regularly to reflect changes in market conditions and the Group’s activities. The Group, through its training and management controls and procedures, aims to develop a disciplined and constructive control environment in which all employees understand their roles and obligations. Internal audit department undertakes both regular and ad hoc reviews of risk management controls and procedures, the results of which are reported to the Group’s audit committee.
Credit risk
| (i) | Risk management |
Credit risk is the risk of financial loss to the Group if a customer or counterparty to a financial instrument fails to meet its contractual obligations, and arises principally from the Group’s deposits placed with financial institutions (including structured deposits) and receivables from customers. To limit exposure to credit risk relating to deposits, the Group primarily places cash deposits only with large financial institutions in the PRC with acceptable credit ratings. The majority of the Group’s trade accounts receivable relate to sales of petroleum and chemical products to related parties and third parties operating in the petroleum and chemical industries. No single customer accounted for greater than 10% of total trade accounts receivable at 30 June 2023, except the amounts due from Sinopec Group Company and fellow subsidiaries. Management performs ongoing credit evaluations of the Group’s customers’ financial condition and generally does not require collateral on trade accounts receivable. The Group maintains a loss allowance for expected credit losses and actual losses have been within management’s expectations.
The carrying amounts of cash and cash equivalents, time deposits with financial institutions, financial assets at fair value through profit or loss, derivative financial assets, trade accounts receivable, financial assets at FVOCI and other receivables, represent the Group’s maximum exposure to credit risk in relation to financial assets.
| (ii) | Impairment of financial assets |
The Group’s primary type of financial assets that are subject to the expected credit loss model is cash deposits, trade accounts receivable and bills receivable and other receivables.
The Group’s cash deposits are placed only with large financial institutions with acceptable credit ratings, and there is no material impairment loss identified.
For trade accounts receivable and financial assets at FVOCI, the Group applies the IFRS 9 simplified approach to measuring expected credit losses which uses a lifetime expected loss allowance for all trade accounts receivable and financial assets at FVOCI.
To measure the expected credit losses, trade accounts receivable and financial assets at FVOCI have been grouped based on shared credit risk characteristics and the days past due.
The expected credit losses were calculated based on historical actual credit loss experience. The rates were considered the differences between economic conditions during the period over which the historical data has been collected, current conditions and the Group’s view of economic conditions over the expected lives of the receivables. The Group performed the calculation of expected credit loss rates by the operating segment.
139
| 21 | FINANCIAL RISK MANAGEMENT AND FAIR VALUES (Continued) |
Credit risk (Continued)
| (ii) | Impairment of financial assets (Continued) |
The following table provides information about the exposure to credit risk and expected credit losses for accounts receivable as at 30 June 2023 and 31 December 2022.
Impairment provision on individual basis | Impairment provision on provision matrix basis | |||||
| Gross carrying amount | Carrying amount | Impairment provision on individual basis | Weighted- average loss rate | Impairment provision | Loss allowance | |
| 30 June 2023 | RMB million | RMB million | RMB million | % | RMB million | RMB million |
| Current and within 1 year past due | 73,091 | 12,851 | 1 | 0.1% | 75 | 76 |
| 1 to 2 years past due | 288 | 15 | 1 | 28.2% | 77 | 78 |
| 2 to 3 years past due | 116 | 51 | 49 | 36.9% | 24 | 73 |
| Over 3 years past due | 4,116 | 3,751 | 3,624 | 98.9% | 361 | 3,985 |
| Total | 77,611 | 16,668 | 3,675 | 537 | 4,212 | |
Impairment provision on individual basis | Impairment provision on provision matrix basis | |||||
| Gross carrying amount | Carrying amount | Impairment provision on individual basis | Weighted- average loss rate | Impairment provision | Loss allowance | |
| 31 December 2022 | RMB million | RMB million | RMB million | % | RMB million | RMB million |
| Current and within 1 year past due | 46,097 | 7,014 | 2 | 0.1% | 56 | 58 |
| 1 to 2 years past due | 216 | 29 | 25 | 20.9% | 39 | 64 |
| 2 to 3 years past due | 269 | 193 | 148 | 43.4% | 33 | 181 |
| Over 3 years past due | 3,861 | 3,487 | 3,405 | 99.2% | 371 | 3,776 |
| Total | 50,443 | 10,723 | 3,580 | 499 | 4,079 | |
All of the entity’s other receivables are considered to have low credit risk, and the loss allowance recognised during the period was therefore limited to 12 months expected losses. The Group considers there was no significant increase in credit risk for other receivables by taking into account of their past history of making payments when due and current ability to pay, and thus the impairment provision recognised during the period was limited to 12 months expected losses.
Liquidity risk
Liquidity risk is the risk that the Group will not be able to meet its financial obligations as they fall due. The Group’s approach to managing liquidity is to ensure, as far as possible, that it will always have sufficient liquidity to meet its liabilities when due, under both normal and stressed conditions, without incurring unacceptable losses or risking damage to the Group’s reputation. Management prepares monthly cash flow budget to ensure that the Group will always have sufficient liquidity to meet its financial obligations as they fall due. The Group arranges and negotiates financing with financial institutions and maintains a certain level of standby credit facilities to reduce the Group’s liquidity risk.
As at 30 June 2023, the Group has standby credit facilities with several PRC financial institutions which provide borrowings up to RMB488,209 million (31 December 2022: RMB454,857 million) on an unsecured basis, at a weighted average interest rate of 2.34% per annum (2022: 2.38%). As at 30 June 2023, the Group’s outstanding borrowings under these facilities were RMB99,132 million (31 December 2022: RMB21,313 million) and were included in debts.
140
| 21 | FINANCIAL RISK MANAGEMENT AND FAIR VALUES (Continued) |
Liquidity risk (Continued)
The following table sets out the remaining contractual maturities at the date of the statement of financial position of the Group’s financial liabilities, which are based on contractual undiscounted cash flows (including interest payments computed using contractual rates or, if floating, based on prevailing rates current at the date of the statement of financial position) and the earliest date the Group would be required to repay:
| 30 June 2023 | ||||||
| Carrying amount | Total contractual undiscounted cash flow | Within 1 year or on demand | More than 1 year but less than 2 years | More than 2 years but less than 5 years | More than 5 years | |
| RMB million | RMB million | RMB million | RMB million | RMB million | RMB million | |
| Short-term debts | 92,949 | 94,357 | 94,357 | – | – | – |
| Long-term debts | 149,499 | 163,085 | 3,908 | 56,261 | 85,196 | 17,720 |
| Loans from Sinopec Group Company and fellow subsidiaries | 36,824 | 40,606 | 14,125 | 4,660 | 13,673 | 8,148 |
| Lease liabilities | 182,685 | 290,965 | 18,071 | 12,512 | 35,821 | 224,561 |
| Derivative financial liabilities | 6,458 | 6,458 | 6,458 | – | – | – |
| Trade accounts payable and bills payable | 258,257 | 258,257 | 258,257 | – | – | – |
| Other payables | 88,048 | 88,048 | 88,048 | – | – | – |
| 814,720 | 941,776 | 483,224 | 73,433 | 134,690 | 250,429 | |
| 31 December 2022 | ||||||
| Carrying amount | Total contractual undiscounted cash flow | Within 1 year or on demand | More than 1 year but less than 2 years | More than 2 years but less than 5 years | More than 5 years | |
| RMB million | RMB million | RMB million | RMB million | RMB million | RMB million | |
| Short-term debts | 59,037 | 59,774 | 59,774 | – | – | – |
| Long-term debts | 85,706 | 94,823 | 2,207 | 13,620 | 68,180 | 10,816 |
| Loans from Sinopec Group Company and fellow subsidiaries | 29,547 | 32,222 | 7,813 | 4,288 | 13,962 | 6,159 |
| Lease liabilities | 182,411 | 299,176 | 16,699 | 12,905 | 36,984 | 232,588 |
| Derivative financial liabilities | 7,313 | 7,313 | 7,313 | – | – | – |
| Trade accounts payable and bills payable | 269,424 | 269,424 | 269,424 | – | – | – |
| Other payables | 121,716 | 121,716 | 121,716 | – | – | – |
| 755,154 | 884,448 | 484,946 | 30,813 | 119,126 | 249,563 | |
Management believes that the Group’s current cash on hand, expected cash flows from operations and available standby credit facilities from financial institutions will be sufficient to meet the Group’s short-term and long-term capital requirements.
Market risk
Market risk is the risk that changes in market prices, such as foreign exchange rates and interest rates. The objective of market risk management is to manage and control market risk exposures within acceptable parameters, while optimising the return on risk.
141
| 21 | FINANCIAL RISK MANAGEMENT AND FAIR VALUES (Continued) |
Market risk (Continued)
| (a) | Currency risk |
Currency risk arises on financial instruments that are denominated in a currency other than the functional currency in which they are measured.
The Group does not have significant financial instruments that are denominated in foreign currencies other than the functional currencies of respective entities as at 30 June 2023, and consequently does not have significant exposure to foreign currency risk.
| (b) | Interest rate risk |
The Group’s interest rate risk exposure arises primarily from its short-term and long-term debts and loans from Sinopec Group Company and fellow subsidiaries. Debts bearing interest at variable rates and at fixed rates expose the Group to cash flow interest rate risk and fair value interest rate risk respectively. The interest rates and terms of repayment of short-term and long-term debts, and loans from Sinopec Group Company and fellow subsidiaries of the Group are disclosed in Note 14.
As at 30 June 2023, it is estimated that a general increase/decrease of 100 basis points in variable interest rates, with all other variables held constant, would decrease/increase the Group’s profit for the period by approximately RMB1,518 million (31 December 2022: decrease/increase by approximately RMB524 million). This sensitivity analysis has been determined assuming that the change of interest rates was applied to the Group’s debts outstanding at the date of the statement of financial position with exposure to cash flow interest rate risk. The analysis is performed on the same basis for 2022.
| (c) | Commodity price risk |
The Group engages in oil and gas operations and is exposed to commodity price risk related to price volatility of crude oil, refined petroleum products and chemical products. The fluctuations in prices of crude oil, refined petroleum products and chemical products could have significant impact on the Group. The Group uses derivative financial instruments, including commodity futures and swaps contracts, to manage a portion of this risk.
Based on the dynamic study and judging of the market, combined with the resource demand and production and operation plan, the Group evaluate and monitor the market risk exposure caused by transaction positions, and continuously manage and hedge the risk of commodity price fluctuation caused by market changes.
As at 30 June 2023, the Group had certain commodity contracts of crude oil, refined petroleum products and chemical products designated as qualified cash flow hedges and economic hedges. As at 30 June 2023, the fair value of such derivative hedging financial instruments is derivative financial assets of RMB8,418 million (31 December 2022: RMB19,328 million) and derivative financial liabilities of RMB6,411 million (31 December 2022: RMB7,235 million).
As at 30 June 2023, it is estimated that a general increase/decrease of USD10 per barrel in basic price of derivative financial instruments, with all other variables held constant, would impact the fair value of derivative financial instruments, which would decrease/increase the Group’s profit for the period by approximately RMB1,248 million (31 December 2022: decrease/increase RMB5,104 million), and increase/decrease the Group’s other reserves by approximately RMB2,138 million (31 December 2022: increase/decrease RMB192 million). This sensitivity analysis has been determined assuming that the change in prices had occurred at the date of the statement of financial position and the change was applied to the Group’s derivative financial instruments at that date with exposure to commodity price risk. The analysis is performed on the same basis for 2022.
142
| 21 | FINANCIAL RISK MANAGEMENT AND FAIR VALUES (Continued) |
Fair values
| (i) | Financial instruments carried at fair value |
The following table presents the carrying value of financial instruments measured at fair value at the date of the statement of financial position across the three levels of the fair value hierarchy defined in IFRS 7, Financial Instruments: Disclosures, with the fair value of each financial instrument categorised in its entirety based on the lowest level of input that is significant to that fair value measurement. The levels are defined as follows:
| • | Level 1 (highest level): fair values measured using quoted prices (unadjusted) in active markets for identical financial instruments. |
| • | Level 2: fair values measured using quoted prices in active markets for similar financial instruments, or using valuation techniques in which all significant inputs are directly or indirectly based on observable market data. |
| • | Level 3 (lowest level): fair values measured using valuation techniques in which any significant input is not based on observable market data. |
At 30 June 2023
| Level 1 | Level 2 | Level 3 | Total | |
| RMB million | RMB million | RMB million | RMB million | |
| Assets | ||||
| Financial assets at fair value through profit or loss: | ||||
| – Exchange traded fund | 3 | – | – | 3 |
| Derivative financial assets: | ||||
| – Derivative financial assets | 2,723 | 5,777 | – | 8,500 |
| Financial assets at fair value through other comprehensive income: | ||||
| – Equity instruments | 115 | – | 567 | 682 |
| – Trade accounts receivable and bills receivable | – | – | 4,294 | 4,294 |
| 2,841 | 5,777 | 4,861 | 13,479 | |
| Liabilities | ||||
| Derivative financial liabilities | ||||
| – Derivative financial liabilities | 705 | 5,753 | – | 6,458 |
| 705 | 5,753 | – | 6,458 |
At 31 December 2022
| Level 1 | Level 2 | Level 3 | Total | |
| RMB million | RMB million | RMB million | RMB million | |
| Assets | ||||
| Financial assets at fair value through profit or loss: | ||||
| – Exchange traded fund | 2 | – | – | 2 |
| Derivative financial assets: | ||||
| – Derivative financial assets | 7,857 | 11,478 | – | 19,335 |
| Financial assets at fair value through other comprehensive income: | ||||
| – Equity instruments | 114 | – | 616 | 730 |
| – Trade accounts receivable and bills receivable | – | – | 3,507 | 3,507 |
| 7,973 | 11,478 | 4,123 | 23,574 | |
| Liabilities | ||||
| Derivative financial liabilities | ||||
| – Derivative financial liabilities | 1,293 | 6,020 | – | 7,313 |
| 1,293 | 6,020 | – | 7,313 |
During the six-month period ended 30 June 2023, there was no transfer between instruments in Level 1 and Level 2.
Management of the Group uses discounted cash flow model with inputted interest rate and commodity index, which were influenced by historical fluctuation and the probability of market fluctuation, to evaluate the fair value of the structured deposits and trade accounts receivable and bills receivable classified as Level 3 financial assets.
143
| 21 | FINANCIAL RISK MANAGEMENT AND FAIR VALUES (Continued) |
Fair values (Continued)
| (ii) | Fair values of financial instruments carried at other than fair value |
The disclosures of the fair value estimates, and their methods and assumptions of the Group’s financial instruments, are made to comply with the requirements of IFRS 7 and IFRS 9 and should be read in conjunction with the Group’s consolidated financial statements and related notes. The estimated fair value amounts have been determined by the Group using market information and valuation methodologies considered appropriate. However, considerable judgement is required to interpret market data to develop the estimates of fair value. Accordingly, the estimates presented herein are not necessarily indicative of the amounts the Group could realise in a current market exchange. The use of different market assumptions and/or estimation methodologies may have a material effect on the estimated fair value amounts.
The fair values of the Group’s financial instruments carried at other than fair value (other than long-term indebtedness and investments in unquoted equity securities) approximate their carrying amounts due to the short-term maturity of these instruments. The fair values of long-term indebtedness are estimated by discounting future cash flows using current market interest rates offered to the Group for debt with substantially the same characteristic and maturities range from 2.63% to 4.69% (31 December 2022: 2.66% to 4.35%). The following table presents the carrying amount and fair value of the Group’s long-term indebtedness other than loans from Sinopec Group Company and fellow subsidiaries at 30 June 2023 and 31 December 2022:
| 30 June | 31 December | |
| 2023 | 2022 | |
| RMB million | RMB million | |
| Carrying amount | 156,130 | 130,282 |
| Fair value | 151,329 | 125,866 |
The Group has not developed an internal valuation model necessary to estimate the fair values of loans from Sinopec Group Company and fellow subsidiaries as it is not considered practicable to estimate their fair values because the cost of obtaining discount and borrowing rates for comparable borrowings would be excessive based on the Reorganisation of the Group, the Group’s existing capital structure and the terms of the borrowings.
Except for the above items, the financial assets and liabilities of the Group are carried at amounts not materially different from their carrying amounts and fair values at 30 June 2023 and 31 December 2022.
| 22 | ACCOUNTING ESTIMATES AND JUDGEMENTS |
The Group’s financial condition and results of operations are sensitive to accounting methods, assumptions and estimates that underlie the preparation of the interim consolidated financial statements. Management bases the assumptions and estimates on historical experience and on various other assumptions that it believes to be reasonable and which form the basis for making judgements about matters that are not readily apparent from other sources. On an ongoing basis, management evaluates its estimates. Actual results may differ from those estimates as facts, circumstances and conditions change.
The selection of critical accounting policies, the judgements and other uncertainties affecting application of such policies and the sensitivity of reported results to changes in conditions and assumptions are factors to be considered when reviewing the interim consolidated financial statements. Management believes the following critical accounting policies involve the most significant judgements and estimates used in the preparation of the interim consolidated financial statements.
144
| 22 | ACCOUNTING ESTIMATES AND JUDGEMENTS (Continued) |
Oil and gas properties and reserves
The accounting for the exploration and production’s oil and gas activities is subject to accounting rules that are unique to the oil and gas industry. There are two methods to account for oil and gas business activities, the successful efforts method and the full cost method. The Group has elected to use the successful efforts method. The successful efforts method reflects the volatility that is inherent in exploring for mineral resources in that costs of unsuccessful exploratory efforts are charged to expense as they are incurred. These costs primarily include dry hole costs, seismic costs and other exploratory costs. Under the full cost method, these costs are capitalised and written-off or depreciated over time.
Engineering estimates of the Group’s oil and gas reserves are inherently imprecise and represent only approximate amounts because of the subjective judgements involved in developing such information. There are authoritative guidelines regarding the engineering criteria that have to be met before estimated oil and gas reserves can be designated as “proved”. Proved and proved developed reserves estimates are updated at least annually and take into account recent production and technical information about each field. In addition, as prices and cost levels change from year to year, the estimates of proved and proved developed reserves also change. This change is considered a change in estimate for accounting purposes and is reflected on a prospective basis in relation to depreciation rates. Oil and gas reserves have a direct impact on the assessment of the recoverability of the carrying amounts of oil and gas properties reported in the financial statements. If proved reserves estimates are revised downwards, earnings could be affected by changes in depreciation expense or an immediate write-down of the property’s carrying amount.
Future dismantlement costs for oil and gas properties are estimated with reference to engineering estimates after taking into consideration the anticipated method of dismantlement required in accordance with industry practices in similar geographic area, including estimation of economic life of oil and gas properties, technology and price level. The present values of these estimated future dismantlement costs are capitalised as oil and gas properties with equivalent amounts recognised as provisions for dismantlement costs.
Despite the inherent imprecision in these engineering estimates, these estimates are used in determining depreciation expense, impairment loss and future dismantlement costs. Capitalised costs of proved oil and gas properties are amortised on a unit-of-production method based on volumes produced and reserves.
Impairment for long-lived assets
If circumstances indicate that the net book value of a long-lived asset may not be recoverable, the asset may be considered “impaired”, and an impairment loss may be recognised in accordance with IAS 36, Impairment of Assets. The carrying amounts of long-lived assets are reviewed periodically in order to assess whether the recoverable amounts have declined below the carrying amounts. These assets are tested for impairment whenever events or changes in circumstances, including environmental protection and energy structure transition variables, indicate that their recorded carrying amounts may not be recoverable. When such a decline has occurred, the carrying amount is reduced to recoverable amount. For goodwill, the recoverable amount is estimated annually. The recoverable amount is the greater of the net selling price and the value in use. It is difficult to precisely estimate selling price because quoted market prices for the Group’s assets or cash-generating units are not readily available. In determining the value in use, expected cash flows generated by the asset or the cash-generating units are discounted to their present value, which requires significant judgement relating, selling prices of crude oil, natural gas, refined and chemical products, the production costs, the product mix, production volumes, production profiles, the oil and gas reserves and discount rate. Management uses all readily available information in determining an amount that is a reasonable approximation of recoverable amount, including estimates based on reasonable and supportable assumptions and projections of sale volume, selling price, amount of operating costs and discount rate.
Depreciation
Property, plant and equipment, other than oil and gas properties, are depreciated on a straight-line basis over the estimated useful lives of the assets, after taking into account the estimated residual value. Management reviews the estimated useful lives of the assets at least annually in order to determine the amount of depreciation expense to be recorded during any reporting period. The useful lives are based on the Group’s historical experience with similar assets and take into account anticipated technological changes. The depreciation expense for future periods is adjusted if there are significant changes from previous estimates.
145
| 22 | ACCOUNTING ESTIMATES AND JUDGEMENTS (Continued) |
Measurement of expected credit losses
The Group measures and recognises expected credit losses using readiness matrix considering reasonable and supportable information about the relevant past events, current conditions and forecasts of future economic conditions. The Group regularly monitors and reviews the assumptions used for estimating expected credit losses.
Allowance for diminution in value of inventories
If the costs of inventories become higher than their net realisable values, an allowance for diminution in value of inventories is recognised. Net realisable value represents the estimated selling price in the ordinary course of business, less the estimated costs of completion and the estimated costs necessary to make the sale. Management bases the estimates on all available information, including the current market prices of the finished goods and raw materials, and historical operating costs. If the actual selling prices were to be lower or the costs of completion were to be higher than estimated, the actual allowance for diminution in value of inventories could be higher than estimated.
| 23 | STANDARDS ISSUED BUT NOT YET EFFECTIVE |
A number of new standards and amendments to standards are effective for annual periods beginning after 1 January 2023 and earlier application is permitted. The Group has not early adopted any of the forthcoming new or amended standards in preparing these condensed consolidated interim financial statements.
146
| (C) | DIFFERENCES BETWEEN CONSOLIDATED FINANCIAL STATEMENTS PREPARED IN ACCORDANCE WITH THE ACCOUNTING POLICIES COMPLYING WITH CASs AND IFRS (UNAUDITED) |
Other than the differences in the classifications of certain financial statements captions and the accounting for the items described below, there are no material differences between the Group’s consolidated financial statements prepared in accordance with the accounting policies complying with CASs and IFRS. The reconciliation presented below is included as supplemental information, is not required as part of the basic financial statements and does not include differences related to classification, presentation or disclosures. Such information has not been subject to independent audit or review. The major differences are:
| (i) | GOVERNMENT GRANTS |
Under CASs, grants from the government are credited to capital reserve if required by relevant governmental regulations. Under IFRS, government grants relating to the purchase of fixed assets are recognised as deferred income and are transferred to the income statement over the useful life of these assets.
| (ii) | SAFETY PRODUCTION FUND |
Under CASs, safety production fund should be recognised in profit or loss with a corresponding increase in reserve according to PRC regulations. Such reserve is reduced for expenses incurred for safety production purposes or, when safety production related fixed assets are purchased, is reduced by the purchased cost with a corresponding increase in the accumulated depreciation. Such fixed assets are not depreciated thereafter. Under IFRS, payments are expensed as incurred, or capitalised as fixed assets and depreciated according to applicable depreciation methods.
Effects of major differences between the shareholders’ equity under CASs and the total equity under IFRS are analysed as follows:
| Note | 30 June 2023 | 31 December 2022 | |
| RMB million | RMB million | ||
| Shareholders’ equity under CASs | 949,481 | 940,457 | |
| Adjustments: | |||
| Government grants | (i) | (884) | (915) |
| Total equity under IFRS* | 948,597 | 939,542 |
Effects of major differences between the net profit under CASs and the profit for the period under IFRS are analysed as follows:
| Note | Six-month period ended 30 June | ||
| 2023 | 2022 | ||
| RMB million | RMB million | ||
| Net profit under CASs | 40,476 | 49,944 | |
| Adjustments: | |||
| Government grants | (i) | 31 | 36 |
| Safety production fund | (ii) | 1,091 | 1,043 |
| Others | (2) | (16) | |
| Profit for the period under IFRS* | 41,596 | 51,007 | |
| * | The figures are extracted from the consolidated financial statements prepared in accordance with the accounting policies complying with IFRS. |
147
DOCUMENTS FOR INSPECTION
The following documents will be available for inspections during the normal business hours after Friday, 25 August 2023 at the registered address of Sinopec Corp. upon the requests by the relevant regulatory authorities or shareholders in accordance with the Articles of Association of Sinopec Corp. or relevant laws or regulations:
| 1 | The original interim report for the first half of 2023 signed by Mr. Ma Yongsheng, the Chairman; |
| 2 | The original financial statements and consolidated financial statements of Sinopec Corp. for the six-month period ended 30 June 2023 prepared in accordance with the CASs and IFRS, signed by Mr. Ma Yongsheng, the Chairman, Mr. Yu Baocai, the President and Ms. Shou Donghua, the Chief Financial Officer and head of the accounting department of Sinopec Corp.; |
| 3 | The original review report of the above financial statements signed by the auditors; and |
| 4 | Copies of disclosure documents published by Sinopec Corp. in the newspapers designated by the CSRC during the reporting period. |
By Order of the Board
Ma Yongsheng
Chairman
Beijing, PRC, 25 August 2023
If there is any inconsistency between the Chinese and English version of this interim report, the Chinese version shall prevail.
148
SIGNATURE
Pursuant to the requirements of the Securities Exchange Act of 1934, the Registrant has duly caused this report to be signed on its behalf by the undersigned, thereunto duly authorized.
China Petroleum & Chemical Corporation
By: /s/ Huang Wensheng
Name: Huang Wensheng
Title: Vice President and Secretary to the Board of Directors
Date: August 30, 2023