Table of Contents
UNITED STATES
SECURITIES AND EXCHANGE COMMISSION
Washington, D.C. 20549
FORM 6-K
REPORT OF FOREIGN ISSUER
Pursuant to Rule 13a-16 or 15d-16 of the Securities Exchange Act of 1934
For the year ended March 31, 2004
Commission File Number: 001-16139
WIPRO LIMITED
(Exact name of Registrant as specified in its charter)
Not Applicable
(Translation of Registrant’s name into
English)
Karnataka, India
(Jurisdiction of incorporation or
organization)
Doddakannelli
Sarjapur Road
Bangalore, Karnataka 560035, India
+91-80-2844-0011
(Address of principal executive offices)
Indicate by check mark if registrant files or will file annual reports under cover Form 20-F or Form 40-F.
| Form 20-F | x | Form 40-F | o |
Indicate by check mark whether the registrant by furnishing the information contained in this Form is also thereby furnishing the information to the Commission pursuant to Rule 12g- 3-2(b) under the Securities Exchange Act of 1934.
| Yes | o | No | x |
If “Yes” is marked, indicate below the file number assigned to registrant in connection with Rule 12g 3-2(b)
Not applicable.
Table of Contents
This Form 6-K contains our Annual Report for the fiscal year ended March 31, 2004 that we mailed to holders of our Equity Shares and our American Depository Share, or ADSs, on or about May 17, 2004. We have attached the forms of Proxy Information Statement and related Proxy Forms that we mailed to holders of our Equity Shares and holders of our ADSs as Exhibits 99.1 through 99.3 to this Form 6-K. In addition, we have also attached the Salary Statement that is required by Indian law to be mailed to holders of our Equity Shares and holders of our ADSs as Exhibit 99.4 to this Form 6K. In addition, we have incorporated by reference on Exhibit 99.5 our Annual Report on Form 20-F filed with the SEC on May 17, 2004, which report was attached as an annexure to our Annual Report distributed to our shareholders. The information contained in this Form 6-K shall not be deemed “filed” for purposes of Section 18 of the Securities Exchange Act of 1934, as amended (the “Exchange Act”), or incorporated by reference in any filing under the Securities Act of 1933, as amended, or the Exchange Act, except as shall be expressly set forth by specific reference in such a filing.
Table of Contents

2
6
The Results at a glance
4
6
Letter to Stakeholders
10
6
Value Creation
32
6
Wipro Businesses
33
6
Director’s Report
36
6
Report on Corporate Governance
56
6
Financial Statements
Inside Back Cover
6
Board of Directors
Table of Contents
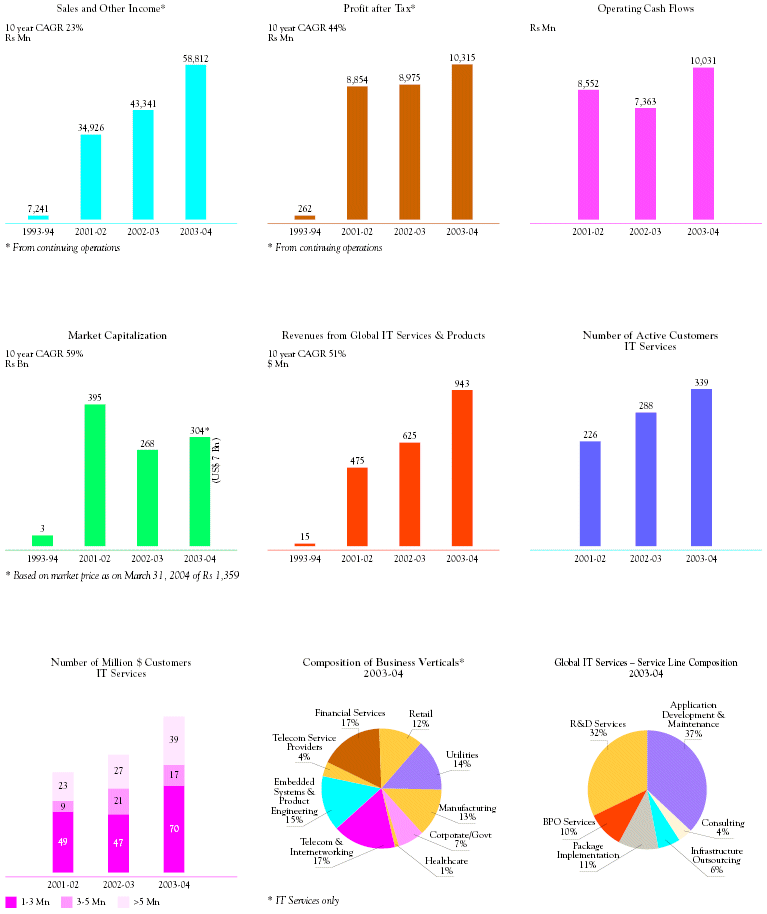
Table of Contents
WIPRO LIMITED — CONSOLIDATED
AUDITED SEGMENT WISE BUSINESS PERFORMANCE FOR THE YEAR ENDED MARCH 31, 2004 (Rs. in Million)
| Particulars | Year ended March 31 | |||||||||||
| 2004 | 2003 | Growth % | ||||||||||
Segment Revenue | ||||||||||||
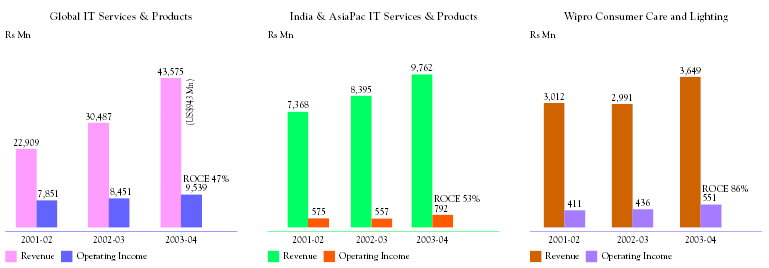
| Global IT Services & Products | 43,575 | 30,487 | 43 | % | ||||||||
| India & AsiaPac IT Services & Products | 9,762 | 8,395 | 16 | % | ||||||||
| Consumer Care & Lighting | 3,649 | 2,991 | 22 | % | ||||||||
| Others | 1,826 | 1,468 | ||||||||||
Continuing Operations | 58,812 | 43,341 | 36 | % | ||||||||
| Discontinued ISP Business | — | 42 | ||||||||||
TOTAL | 58,812 | 43,383 | 36 | % | ||||||||
Profit Before Interest and Tax (PBIT) | ||||||||||||
| Global IT Services & Products | 9,539 | 8,451 | 13 | % | ||||||||
| India & AsiaPac IT Services & Products | 792 | 557 | 42 | % | ||||||||
| Consumer Care & Lighting | 551 | 436 | 26 | % | ||||||||
| Others | 277 | 240 | ||||||||||
Continuing Operations | 11,159 | 9,684 | 15 | % | ||||||||
| Discontinued ISP Business | — | (182 | ) | |||||||||
TOTAL | 11,159 | 9,502 | 17 | % | ||||||||
| Interest / Other income* | 873 | 634 | ||||||||||
Profit Before Tax | 12,032 | 10,136 | 19 | % | ||||||||
| Income tax expense | (1,681 | ) | (1,276 | ) | ||||||||
Profit before extraordinary items | 10,351 | 8,860 | 17 | % | ||||||||
| Discontinuance of ISP business | — | (263 | ) | |||||||||
Profit before equity in earnings/(losses) of Affiliates and minority interest | 10,351 | 8,597 | 20 | % | ||||||||
| Equity in earnings of affiliates | 23 | (355 | ) | |||||||||
| Minority interest | (59 | ) | (37 | ) | ||||||||
Profit After Tax | 10,315 | 8,205 | 26 | % | ||||||||
Operating Margin | ||||||||||||
| Global IT Services & Products | 22 | % | 28 | % | ||||||||
| India & AsiaPac IT Services & Products | 8 | % | 7 | % | ||||||||
| Consumer Care & Lighting | 15 | % | 15 | % | ||||||||
Continuing Operations | 19 | % | 22 | % | ||||||||
TOTAL | 19 | % | 22 | % | ||||||||
Capital Employed | ||||||||||||
| Global IT Services & Products | 21,732 | 18,536 | ||||||||||
| India & AsiaPac IT Services & Products | 1,941 | 1,075 | ||||||||||
| Consumer Care & Lighting | 596 | 682 | ||||||||||
| Others | 14,498 | 15,082 | ||||||||||
Continuing Operations | 38,767 | 35,375 | ||||||||||
| Discontinued ISP Business | — | (7 | ) | |||||||||
TOTAL | 38,767 | 35,368 | ||||||||||
Capital Employed Composition | ||||||||||||
| Global IT Services & Products | 56 | % | 52 | % | ||||||||
| India & AsiaPac IT Services & Products | 5 | % | 3 | % | ||||||||
| Consumer Care & Lighting | 1 | % | 2 | % | ||||||||
| Others | 38 | % | 43 | % | ||||||||
TOTAL | 100 | % | 100 | % | ||||||||
Return on average capital employed | ||||||||||||
| Global IT Services & Products | 47 | % | 62 | % | ||||||||
| India & AsiaPac IT Services & Products | 53 | % | 54 | % | ||||||||
| Consumer Care & Lighting | 86 | % | 60 | % | ||||||||
Continuing Operations | 30 | % | 31 | % | ||||||||
TOTAL | 30 | % | 31 | % | ||||||||
* Other Income for the year ended 31st March 2004 includes profit on sale of land — Rs. 107 Mn
Note to segment report:
| 1. | The segment report of Wipro Limited and its consolidated subsidiaries and associates has been prepared in accordance with the Accounting Standard 17 Segment Reporting issued by the Institute of Chartered Accountants of India. | |||
| 2. | The Company has three geographic segments: India, USA and Rest of the World. Significant portion of the segment assets are in India. Revenue from geographic segments based on domicile of the customers is outlined below: | |||
| (Rs. in Million) | ||||||||||||||||
| Geography | March 31, 2004 | % | March 31, 2003 | % | ||||||||||||
| India | 15,205 | 26 | % | 12,629 | 29 | % | ||||||||||
| USA | 30,868 | 52 | % | 19,637 | 45 | % | ||||||||||
| Rest of the World | 12,739 | 22 | % | 11,117 | 26 | % | ||||||||||
| Total | 58,812 | 100 | % | 43,383 | 100 | % | ||||||||||
| 3. | For the purpose of reporting, business segments are considered as primary segment and geographic segments are considered as secondary segment. | |||
| 4. | Effective April 1, 2003, Wipro Spectramind is included in the Global IT Services & Products segment. Wipro Nervewire, the business acquired in May 2003, is included in Global IT Services & Products segment. | |||
| In April 2003, the Company restructured the HealthScience business segment. The HealthScience business which addresses the IT requirement of clients in healthcare and life sciences sector and Wipro Healthcare IT, the Company acquired in August 2002, is a part of the Global IT Services & Products segment. Wipro Biomed, a business segment that was reported as part of the HealthScience segment has now been reported as part of Others. Segment data for previous periods has been reclassified to make it comparable. | ||||
| 5. | Refer Accounting convention in schedule 19 — Significant Accounting Policies and note no 6 in notes to accounts of Wipro Limited Consolidated on page numbers 96 and 98. | |||
Table of Contents

LETTER TO STAKEHOLDERS
Dear Stakeholder,
All through the 58 years of our existence, Wipro has believed that we must build an organization that wins — wins for our customer, wins for our employees, wins for our shareholder and wins for society. More importantly, we have believed that the organization we build must be able to win not just in today’s environment but be prepared to face the challenges of tomorrow as well — for tomorrow is, but a couple of days away from yesterday. In this process there would be times when the short term sacrifices would have to be made for long term gains. Skeptics, who tend to view the future as an interminable extension of the present, see a secular decline in the fortunes of the company. The wise keep their faith.
“Keep the faith” is one of the most important lessons I have learnt in life.
It is just another way of saying “have confidence”, but the words “keep the faith” resonate far deeper, as they must when one refers to some absolutely fundamental issues. The most direct demonstration of the value of keeping the faith in an organization is in the context of people. As long as your business model is aligned with the interest of your customers and you have a team of people that is committed, you just have to keep the faith in them, empower them through thick and thin, and with full confidence that they will grow and deliver tangible business and financial results.
2003-04 was a year which demonstrated the value of keeping the faith for Wipro and all its stakeholders. Benefits of a focused strategy coupled with continuously improving execution began to reflect in our business results, which is why I think it was a defining year for Wipro.
| • | It was a year in which we surpassed the billion dollar mark in our IT business as well as at a |
4
Table of Contents
| Corporation level |
| • | Quarterly Revenues in our Global IT business grew at a compounded quarterly growth rate of 11% |
| • | Our quarterly Net Income grew at a compounded quarterly growth rate of 12% |
| • | We made one new acquisition in our Global IT business, and successfully drove synergies in all the acquisitions we have made so far |
We ran the marathon, but kept winning the 400 meters dash too in the process. And we did that by keeping the faith.
We kept faith in our R&D business
Through the global technology down turn where some saw the R&D Services business as a drag on growth, we knew that this was one of our great strengths. We continued to invest in those businesses through the downturn.
The past year has demonstrated that the R&D Services business is an outstanding growth driver for Wipro. It was particularly satisfying to see that our Telecom OEM practice, which bore the brunt of criticism during the slowdown, led our growth with a 53% year on year Revenue growth. Look beyond that and one sees that our faith in the mix of our business, as in the case of R&D Services, has been vindicated by robust growth in every business line, every geography and every service line. This mix of our businesses is indeed an inherent strength that we will continue to nurture.
We kept faith in our inorganic strategy
We have always believed that inorganic growth must be an integral part of our strategy. We have put our money where our mouths are; and the result is that we are the largest third party BPO and ITES provider in India. The cultural benefits of working with a multi-cultural team from an organization standpoint have matched the synergy benefits
5
Table of Contents

of our acquisitions from a customer standpoint. We continue to look for suitable acquisition opportunities that meet our norms of strategic, cultural and financial fit.
We kept faith in our Vision
This brings us to our belief in the Vision and strategy that we have pursued. A cornerstone of our Vision is to be amongst the Top 10 IT services companies in the world. To achieve this vision, we have pursued the strategy of becoming a comprehensive solutions provider to all the IT needs of our customers.
We have invested in this strategy aggressively; the last year saw us moving significantly on this path. In our own small way we have driven a fundamental change in the competitive landscape in the world of Global IT services. On one hand we feel proud that we have been the arrowhead of this change, and on the other we are acutely aware that the competitive intensity is only increasing as all the incumbent global majors are moving towards acquiring world-sourcing advantages.
Our continuous pursuit of creating higher customer value, combined with the ground level, nuts-and-bolts ability to execute our strategy gives us the confidence that we will achieve our Vision and continue to participate in driving a fundamental change in the competitive landscape.
We kept faith in our domestic businesses
The success of our India focused businesses and their significant
6
Table of Contents
contribution to our growth during the year was a direct result of the inherent strengths of these businesses and our belief in them. The smart growth in Revenues in these businesses was accompanied by an improvement in the Operating Margins. What is happening in India today, happens rarely in the life of a nation. India is at a tipping point. With our leadership status in IT products and services in India, and successful consumer and industrial brands, we are positioned to leverage on this transformation and create substantial value. Our continuing investments will serve to increase this positive leverage.
We are certainly going through a period of very rapid change — across the world. This environment challenges us and simultaneously presents unprecedented opportunities. Wipro has to be different and change every day to meet these challenges and seize these opportunities. “Keeping the faith” must be in tandem with these continuous changes in our organization.
For change and “keeping the faith” to work in tandem, we must ensure that both remain true to our Values and both create higher value for the customer. Experience tells us that it is not enough to pass these two tests initially and then rest on the results...one must measure and assess each action constantly against these criteria — that is the only possible insurance against getting lost.
As we prepare to build the next generation Wipro in the vast opportunities presented to us by this environment of rapid change, we are guided by four simple but powerful trends in the markets that we operate in.
1. No one is seduced by technology.
It is by now common wisdom that the fundamental structure of the Global IT business is changing. Customers are prioritizing IT as a business investment, and therefore looking at each dollar of spend through the ruthless lens of return-on-investment. The challenge this throws to us is to partner our customers so that we help them succeed. Success means lower costs, higher revenues and end customers feeling happier. It is our constant endeavour to align our contribution to our customers on these parameters.
Our domain consultants with their broad experience, innate knowledge of business rhythms of customers and the technological possibilities, help customers make the right choices. Closer home,

7
Table of Contents
within Wipro, every “new” idea that we invest in has to pass the filter of customer need. If it isn’t going to add to the success of our customers, we aren’t going to invest in it. As a corollary, where we believe that a technology will add value to our customers, we will invest — ahead of time.
2. Compression is real — in geography, in technology and in time.
The penetration of technology into the consumer market is exploding. The mobile phone in your hand is likely to be as powerful, sophisticated and more functional than a computer a few years ago. The so called “rural hinterland” of India or any of the other developing countries is becoming more “urban” every day...this socio-geographic compression is only accelerating. This very real compression is changing society and demands across the world. For us as service providers to our customers, this compression and ensuing social trends are like a silent tsunami for business.
We are not waiting for this tsunami to devour our house. We have deliberately and systematically positioned ourselves to seize the opportunities that appear every day. Our strength of R&D Services takes us right inside the cell phone that you use, and the fully digital networked home that you will live in tomorrow. Our understanding of enterprise wide solutions helps our customers in dealing with their compressed time horizons. And our geographical footprint places us right in the heart of opportunity.
3. Global integration is not rhetoric.
It has happened. World Delivery Model — aided by dramatic improvements in communications technology — has made geography irrelevant. As pioneers of the Offshore Development Center concept, Wipro, in its own small way, has been at the centre of this historic reshaping of the world. And we are proud of it.
And with the significant progress we have made in Remote Management in our Technology Infrastructure Services business, we are yet again on the threshold of a disruptive innovation that, we believe, is the next phase.
As everyone faces the reality of global integration in their own way, our confidence comes from more than 15 years of operating and delivering to customers on the World Delivery Model. This record is built on the platform of robust and highly scalable processes.
The true test of processes is in their practice, not in the certifications that they may generate. The strength of our Quality Initiatives is sustained at the level of organizational and individual practice — for that is what matters. The sustainability of Quality at every scale is driven by a rigor which
8
Table of Contents
combines flexibility with consistency. Our new Six Sigma methodologies have driven this rigor to the level of practice.
4. Innovation is a necessity.
Innovation is necessary to satisfy new customer needs and create new Revenue streams. Innovation is necessary to stay ahead of competition - - consistently. Innovation is necessary to create higher value for customers. Innovation is the basis of both survival and success.
This year’s Annual Report takes you through a journey of Innovation at Wipro. To my mind the most important principle in this journey is that the only thing that can limit Wipro is its ability to create value for customers. The only way to eliminate this limitation is to continuously run the engine of Innovation. To keep this engine cranking at the highest speed, one has to have a mindset that one has not innovated enough. In Wipro, Innovation is always work-in-progress.
In 2003-04 Wipro was clearly a winner. The team that made this winning year possible was Team Wipro. This 32,000 strong team is spread across the world and across multiple businesses, yet bound deeply together by a common culture — at the core of which are our Values.
This team has also benefited from our thoroughly professional Board of Directors, consisting of leaders whose wealth of wisdom guides us in our journey constantly. Their contribution is substantial in this winning year, as always.
As the IT industry adjusts to the global new realities in 2004-05, the prospects for us are exciting but challenging as well. But challenge is something that Wiproites relish — for it kindles their passion to do what they are best at — building a Wipro that wins for its stakeholders. We will strive to live up to the faith that you have kept in us. I thank you all for the confidence and trust you have in Wipro. I along with Team Wipro will endeavor to work to achieve the position of leadership that we desire, and you as stakeholders deserve.
Very sincerely,

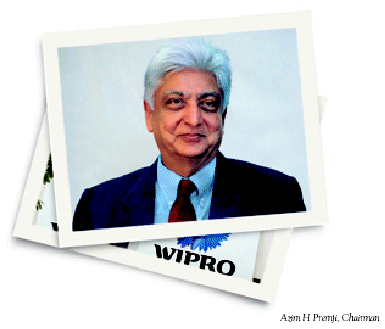
Azim H Premji Chairman
April 30, 2004

9
Table of Contents
VALUE CREATION
Innovation is the engine that creates value. Execution excellence is the engine that delivers value. To us these are two fundamental tenets. Equally, we believe that both these tenets have meaning only when seen as continuous pursuits. Every moment you have to strive to be innovative and every moment you have to execute to deliver.
It’s this hot pursuit psyche that keeps the individual and the organization alive and growing. Having executed something to perfection yesterday has no meaning today as benchmarks keep moving upwards dramatically. Likewise, yesterday’s innovation is today’s commodity.
Our Six Sigma process architecture helps us deliver excellence consistently. We had touched on this in our earlier Annual Reports. This year we focus on the Innovation engine at Wipro.
“Innovation is Wipro; Wipro is Innovation”
“Innovation is Wipro; Wipro is Innovation” is our statement of purpose. The challenge this pursuit presents to us every day is — how does one make Innovation “Purposeful”, “Ingrained” and “Deliberate” in our organization.
We recognize and nurture “Innovative Solutions” as one of the
10
Table of Contents
four Wipro Values. We prioritize focus and resources guided by this Value. It is the basis of making Innovation deliberate in the organization by emphasizing it at every level — in objectives of individuals and businesses, in communication, in planning and in almost every operating mechanism. This is because you cannot leave Innovation to chance.
Duality
Every thing about Innovation in an organization — including its successes and failures — is about managing the duality of organizational Innovation.
The duality is seemingly contradictory. The heart of

11
Table of Contents

Innovation lies in the individual and in her sparks of creativity; but creativity without discipline does not “create”.
Freedom to act differently is the first manifestation of Innovation; but without robust processes nothing can be scaled to a meaningful level in an organization. To make Innovation ingrained, the challenge is to continuously harness the power of this duality; to make it a duality of strength, not of contradictions.
Innovation for its own sake leads to the wasteland of purposeless Innovation. At Wipro, we prevent any drifting by asking every step of the way if an Innovation is creating Higher Value for our stakeholders.
This clarity of purpose is our beacon.
Innovation — the Wipro way
We have come to believe that while “Disruptive Innovation”, in the nature of “Invention” will happen infrequently, “Incremental Innovation” can happen, and be made to happen, continuously.
12
Table of Contents
The Wipro way of innovation is really about this deliberate sustained innovation.
A glimpse into some questions and exemplifiers.
If the purpose of innovation is to create higher value for our stakeholders, the challenge then is to be consistent and prolific till it becomes ingrained and remains ingrained. We conducted an internal research to study Wipro’s Innovation dynamics, and to understand what is required to take this to a higher order of value creation. This has thrown up an interesting conclusion.
We concluded that to keep the spirit of innovation alive, and to move to a higher innovation plane, it is critical to keep asking ourselves some key questions repeatedly, and at all levels of the organization. This helps us sustain and brighten this force that flows through every nook and corner of Wipro.
We now present to you a glimpse into some of these questions-of-innovation and some of these exemplifiers.
Are we attracting the best talent and keeping the talent challenged and contemporary?
That we can only be as good as the talent that taps our keyboards is stating the obvious. This has spawned a series of innovations in compensation, development and bonding with the organisation.
Way back in 1983, the Wipro Equity Rewards Trust plan gave Wiproites the benefit of participating in wealth creation. The shadow stock option, along with the Quarterly Performance Linked Compensation (QPLC), a variable pay program, was the other innovative idea to align company performance with employee compensation.
However, the idea which really made us proud was Channel W, an intranet which binds all the Wiproites together(See highlighted section on following page). One of the reasons for the pride is the fact that we have taken this idea to several of our customers and have helped them implement it.
13
Table of Contents

Channel W — creating one world
Connecting and listening to people plays a major role in employee bonding. It ensures that the organizational culture is not diluted even while growing at a phenomenal speed.
A virtual campus knitting the global locations, Channel W provides information, education and entertainment. It allows regular interactions with Senior Management and has grown into a pulsating intranet community.
Channel W also provides value to employees by facilitating E-training. It enables employees to catch up with their learning and development needs at their own pace.
Keeping the talent contemporary is a large on-going process in Wipro. Our annual person-days of training effort exceeds 100,000. This includes the leadership development programs at all levels. However, we also realize the importance of continuously developing the talent from a relatively raw level. This led us to launch Wipro Academy for Software Excellence (WASE) in 1995(See highlighted section).
Wipro Academy for Software Excellence (WASE)
The realization of the importance of acquiring and developing talent saw us launch Wipro Academy for Software Excellence (WASE), a successful initiative in talent development.
14
Table of Contents
I N I T I A T I V E S I N P E O P L E P R A C T I C E S
| 1970-1975 | 1980-1985 | 1985-1990 | 1990-1995 | 1995-2000 | 2000-2005 | |||||||||||||||||
• | Recruitment from | • | Employee Stock | • | Initiated in-house | • | Wipro Leaders' | • | Talent development | • | Career Grouping | |||||||||||
| premier campuses | Award Program | Leadership | qualities | initiatives launched: | introduced | |||||||||||||||||
| (WERT) | Development | (Competencies) | WASE, | |||||||||||||||||||
• | Beliefs articulated | launched | Program, leading | articulated | Wipro University | • | Assessed at World’s | |||||||||||||||
| to lifecycle | First PCMM | |||||||||||||||||||||
• | Performance | development | • | Comprehensive | • | Launch of several | Level 5 Company | |||||||||||||||
| Management | program | Employee | processes such as Skip | |||||||||||||||||||
| process and | Satisfaction Survey | Level | • | Channel W-Virtual | ||||||||||||||||||
| performance linked | • | Launch of | launched | Campus | ||||||||||||||||||
| compensation | Economic Value | • | Competency | |||||||||||||||||||
| Add based Program (WERLP) | • | 360 degree feedback process introduced | dictionary introduced for the entire organization | |||||||||||||||||||
| • | QPLC - Gain | |||||||||||||||||||||
| Sharing scheme | ||||||||||||||||||||||
| launched | ||||||||||||||||||||||
Launched in 1995, it has evolved with the changing needs of our business and today successfully creates software engineers out of bright science graduates. The M Tech degree conferred on them by BITS, Pilani, India’s leading deemed university, effectively expands India’s people power in technology.
The need for a programme like WASE was felt in early 1994 when UNIX was becoming popular. Every engineer wanted to work on the new technology and Cobol, the old favourite, was fast losing sheen. This shift created a shortage of mainframe software professionals.
For us at Wipro, the only way to bridge the gap was to think innovatively. The first WASE batch saw 600 applicants, out of which 29 were selected. After two years of intensive training in software development, this batch of newly-minted post-graduate employees came out in 1997.
Today, we have 977 WASEians, who have come out of seven batches since 1995. In 2003-2004 we launched two batches of WASE with an intake of 391.
15
Table of Contents
Are we creating higher value for our customers?
And are we creating relatively higher value?
This, perhaps, is the most powerful question for sustained Innovation. This is also the question which is asked most often within Wipro and in interaction with customers. The majority of the innovations get triggered by this one powerful question.
Right from the beginning we could foresee the benefit of partnering with technology companies to bring value to our customers. Combining these relationships with our strong R&D talent led to the idea of “Lab on Hire”, and subsequently to Offshore Development Centers, which made offshore outsourcing truly mainstream.
Pushing the idea a little further helped us conceptualise the Remote Infrastructure Service model, branded as Global Command Center, or GCC, to manage the customer’s IT infrastructure. The services are delivered from an offsite location, using high availability and secure infrastructure, and industry certified expert skills
(See highlighted section).

16
Table of Contents
Value from remote location: Comfort from local NOCs.
Wipro was one of the pioneers to successfully implement offshore-based service delivery for application development and management. Remote Infrastructure Service was to repeat this success in Infrastructure Services.
Remote Infrastructure Service is delivered through Global Command Center (GCC) to our global clients at much higher levels of competency, responsiveness and accountability, from an offsite or offshore location, using industry certified expert skills and backed by principals.
Unlike application development and maintenance, administration of the production infrastructure is very critical and does not allow for downtime and

failures. And there is no scope for quality check. Security was yet another imperative. The GCC was designed in-house, ensuring that the above needs are taken care of.
The first requirement was to have a high availability, fault tolerant 3-tier architecture. Three Point of Presence (POP) locations are based in USA, UK and Japan and two Network Operations Centers (NOC) are in USA and UK. The POPs and NOCs are interconnected to the GCC in Bangalore, India using high availability links through fiber optic cables and satellites across the Pacific and the
17
Table of Contents

Atlantic through multiple service providers at different ports of landing. Customers can connect to either one of the POP locations or one of the NOCs or directly to the GCC.
The architecture has been implemented in such a way that if India or GCC is cut-off, the alerts are trapped online and the NOCs can still continue to deliver high priority services to the customer using the onsite team. If the NOC gets cut-off, the alerts are passed on directly to the GCC. The NOCs have been simulated to take over from each other. This high availability architecture undergoes periodic Disaster Recovery (DR) drills.
The second focus was in automating root cause analysis. Automatic root cause analysis (diagnosis), achieved using a high degree of event correlation and event suppression ensures faster resolution of problem and improved productivity. The fault patterns are mapped to find the root cause and this mapping is kept current. This innovation has brought down the number of alerts from about 20,000 per day to a manageable number of 50 to 60 incidents per day for a customer where we support their production heterogeneous IT infrastructure through the GCC.
The third Innovation is in the area of business scalability which allows customers to share the same platform, thus reducing the cost to customer. Today, the client comfort has reached a level where most of the Infrastructure Services are being delivered from
18
Table of Contents

remote locations.
The NOC in USA and UK are equipped with Enterprise Management Framework ensuring that the core management setup remains close to customers and also in providing Intercontinental Global Disaster Recovery capability to Wipro’s GCC. It is equipped with several security features, including temperature and water sensors, dry gas fire suppression with smoke alarms positioned at key locations throughout the facility and bio metric access.
The practice is backed by the Center of Excellence which provides the industry standard best practices. Wipro also adopted best in class processes and was one of the first in the world to achieve BS15000/ITIL (Information Technology Infrastructure Library) certification.

19
Table of Contents
Our relentless quest to create value for our customers has moved both vertically and horizontally. While we developed IT solutions for specific customer verticals, we also expanded our offerings horizontally. For instance, we decided to grow inorganically in Business Process Outsourcing when we saw the value it can bring to our customers. We acquired Spectramind in 2002 when it was less than a 3000 people operation. Today Wipro Spectramind e Services is the largest third party BPO service provider in India, with over a dozen Fortune 500 customers(See highlighted section).
Business Process Outsourcing - creating synergies with IT Services business.
Wipro Spectramind, acquired in the early part of 2002-2003, has grown into the largest third party BPO service provider from India, enabling Wipro to offer the BPO services along with the end-to-end IT Services to customers.

20
Table of Contents
After integrating into Wipro, Wipro Spectramind has grown in employee strength, number of processes offered, and in the number of customers. It has grown from an employee strength of 2,700 to 10,000 today and from handling 29 processes to 76 processes. Today it offers services from five locations.
Its customer base has increased from 5 to 23, after we acquired it. One fourth of these customers are common to Wipro Technologies offering IT Services and Wipro Spectramind. It handles 4 million calls and 500,000 e-mails a month, apart from back office transactions.
Wipro Spectramind offers the most comprehensive set of service lines including inbound/outbound customer service, technical support, telemarketing, internal helpdesk, finance and accounting services, HR services as well as industry specific processes in airlines, healthcare, banking, retailing and knowledge services. Working closely with allied verticals in Wipro Technologies, Wipro Spectramind spans across financial services, travel industry and telecom & ISP areas.
Its two-pronged approach involves execution excellence and thought leadership in service delivery. Catering mainly to the North American geography, clients come from other English speaking countries such as UK, Australia and New Zealand as well.
It utilizes Six Sigma and Kaizen principles to ensure the quality of service delivery. It has also achieved the industry standard COPC certification .
Is creating value for customers sufficient to create value for other stakeholders and the larger community?
Create value for customers, and you are creating value for stakeholders. However, we have found it useful to pose this question in the context of investors and the society at large.
21
Table of Contents

For instance, we created value for our investors with the decision to merge our two IT subsidiaries into Wipro Limited. While merging the subsidiaries with the parent company, we chose to retain the management structure of the different businesses - - this communicated the full strength of the Wipro business model in terms of growth engines as well as width of the business. This was applauded by the investors, and led to us being conferred with the Alexander Hamilton Gold Award for Excellence in Investor Relations.
The economist Milton Friedman argued in 1970 that the only “social responsibility of business” is to “increase its profits”. At Wipro, we think today’s business context reduces the strength of this argument for two reasons. One, corporations today are a powerful social force. With this power comes the onus of being a progressive social entity. Mahatma Gandhi set the gauntlet when he said, “You must be the change you wish to see in the world.” Two, Wipro is an element in the social fabric, and unless we expand possibilities for the larger community, we will not create significant growth opportunities for Wipro.
Our quest for creating value for the larger community has had an interesting outcome. We initiated “Wipro Applying Thought in Schools” to help bring about a
22
Table of Contents

fundamental transformation in the Indian school education system — to prepare our children with life-skills, and to help them realize their potential(See highlighted section).
Wipro is widely recognised as being among the top socially responsible Indian corporates.
Wipro Applying Thought in Schools
Wipro’s community initiative, “Wipro Applying Thought in Schools”, contributes towards improving quality of education in India. Active in 14 cities, the initiative has imparted close to 200,000 hours of training to over 2800 teachers, principals and parents from 120 schools nationally. Wipro’s work prompted Businessworld FICCI-SEDF Corporate Social Responsibility Award 2003 to rate Wipro as one of the top Indian corporates championing the cause of Corporate Social Responsibility and sustainable development.
The initiative was triggered when Wipro realized that even the best people leaving our education system do not bring basic life-skills to the workplace.
23
Table of Contents

Education, with its focus on memorization and “doing well in exams” is strongly disconnected from the needs of the student and society. Over the past 3 years, the initiative has engaged with various stakeholders to enable change. Wipro has partnered with experts in education to incorporate contemporary international research and the best teaching practices from across the country to each of the enrolled schools.
Spread over 2 years, the Teacher Program aims to transform the teacher into a “reflective practitioner” through workshops and school based support. It helps teachers appreciate that knowledge is built through an evolving process of interpreting experience.

24
Table of Contents

The role of a teacher is to create right experiences and to guide the learner in building knowledge. The Leadership Program works with school leaders to prepare them for their role in leading this transformation. The Parent Program helps parents appreciate the purpose of education and the process of learning. It also gets them to reflect on their part in their child’s education and development. Current research includes developing internationally benchmarked Learning Standards and curricular support material.
Today, Wipro runs the largest comprehensive in-service training for educators in India outside the Government. To read more, visit www.WiproApplyingThoughtIn Schools.com
How do we leverage our learnings within and without the organization?
The learnings are in the nature of successful business practices and customer solutions, which can be transferred across the organization and outside. The power of a large corporation with diverse businesses is the richness of learnings.
25
Table of Contents
For instance, our personal products business runs on a deep and wide dealer network. We adapted the dealer model initially to sell IT products, and then extended it to deliver IT maintenance services through franchisees, to bring the value of proximity to our customers.
We were the first few globally to embrace Six Sigma to drive excellence across our businesses. As we developed expertise in using Six Sigma through rich diversity of experiences within the organization, we saw value in taking this competency to our customers. Today our Business Transformation Practice provides consultancy in Six Sigma, and other quality models like PCMM and CMMi.
Are we doing low risk experimenting to filter out “good” ideas from the truly outstanding ones?
This question led us to launch a specific Initiative in 2001, with the objective of developing IPs and components in IT Services. The process works on the concept of successive gates to filter out ideas as they get more and more fleshed out, so that large bets are made only on a few outstanding ideas.
This Initiative has generated several products. For instance, we have developed IPs in the area of 1394, USB, Ethernet, Wireless LAN, etc. One specific product that has provided impetus to the initiative has been Flow-briX, a workflow management framework(See highlighted section).
26
Table of Contents
Flow-briX, a BPM Workflow Framework.
Content Commerce was identified as a thrust area under the initiative launched with the objective of developing IPs and components in IT Services, as it presented a value proposition.
The first framework launched, under Content Commerce, was Flow-briX, a comprehensive Business Process Management and Workflow framework, in 2002. Flow-briX has been implemented at over 8 global customer sites.
Constant innovations made Flow-briX adaptable and user friendly. Designed to provide an end-to-end workflow solution by automating complex processes in organizations, it integrates seamlessly with existing applications.
Flow-briX is available on both J2EE and Microsoft.Net platforms. It was chosen by Microsoft as a partner solution in the official launch of MS-Office 11 suite of products.
With the deep expertise gained in developing applications and solutions in the BPM / Workflow space, the team is looking forward to explore the challenging world of business process management consulting.

27
Table of Contents
Are we taking positions on technology developments and building skills to anticipate tomorrow?
Technology, in our business, continues to be a major source for innovation. This is equally true for our personal products, engineering and IT businesses.
We continuously map new technologies coming into the market and proactively invest in technology and skills. For instance, we successfully identified the opportunity which digital technology would offer in television broadcasting. Even as the governments were contemplating mandating the usage of digital technology, we invested in developing the technology and skills needed to address this market. And were ready to go to market when the mandate came into force.
Yet another instance has been the area of mobile telephony. Our close interaction with telecom equipment manufacturers and service providers helped us zero-in on mobile telephony as a major business opportunity. We have also hedged our bets on Linux based mobile telephony, as a response to this question.
In the process of work within the organization, are we continuously eliminating redundancy and non-value-adds?
A significant proportion of our process related innovations have happened by continuously posing this question. Six Sigma has given us the tool and the culture to constantly chip away the non-value-add from the operations and pass on the benefit of shorter time cycles and more value for money to our customers.
The scale of this effort can be gauged from the fact that there are more than 700 Six Sigma projects being assisted by more than 150 Black Belts. An example from our global IT Services business brings

28
Table of Contents

home the power of this question
(See highlighted section).
Productivity improvements by applying Six Sigma
We applied Six Sigma methodology in a project for a leading global retailer, reducing the test case execution time and bringing down the number of test cases from 848 to 167. The 100% functionality coverage translated the reduction rate to around 80% of test cases, giving benefits to the Wipro team and in turn, the customer, in terms of reduced execution time and reduced test result analysis time.
Similarily, in a project in embedded space, the number of test cases was reduced from 117 to 38 and execution time was brought down from 8 hours to 25 minutes by using the Six Sigma
29
Table of Contents

methodology. The LOC for test cases was reduced to 1,367 from 28,122. Application of Six Sigma by the Wipro team benefited the customer in reduced implementation time, reduced execution time and reduced time for result analysis, with an increase in overall productivity by 40%-50%.
Are we continuing to capture the benefits of small companies even as we grow rapidly?
The rapid growth of our businesses, and therefore of the organization, has all the danger of turning the corporation into a large bureaucracy. Posing this question has ensured that we do not fall into this rut. We have multiplied the “cells” within a business, each headed by an entrepreneurial leader who has the complete P & L responsibility. The benefits have been numerous — we have had a constant supply of leaders, every “cell” has grown and the organization
30
Table of Contents
continues to be agile.
Very early in our Global IT Services business we identified at a granular level vertical industry segments to deliver customer specific solutions. Our Enterprise application business was divided into several industry-focused verticals. As the markets grew, we identified new segments and further subdivided the verticals. The result is that each of these verticals works as independent units, with an entrepreneurial leader at the helm.
This then is Innovation — The Wipro Way. Would these eight questions continue to make Wipro habitually innovative? We do not think so. Our quest for making Innovation deliberate and ingrained would continue. Do we live up to the descriptor: “Innovation is Wipro: Wipro is Innovation”? Clearly we do not. This really is our statement of purpose.
At Wipro, innovation is always a work-in-progress.

31
Table of Contents
WIPRO BUSINESSES
Wipro Technologies- Global IT Services and Products business delivers high value services such as IT consulting, architecture and integration. Along with a complete and end-to-end array of IT solutions and services offered across industry verticals.
We partner with our clients to provide a full spectrum of BPO services from high end customer interaction to transaction processing and knowledge based services, throughWipro Spectramind, India’s largest third party offshore BPO and IT enabled services provider. We further club our vast IT solutions experience and a diverse domain expertise to offer these services to customers across industry verticals.
Wipro Infotech —Our India, AsiaPac and Middle East IT Services and Products Business delivers comprehensive solutions ranging from architecting to managing IT infrastructure. Our success in India has strengthened our offering in the global market with the depth and width of our services portfolio ever increasing.
Wipro Consumer Care & Lighting —The business offers established brands addressing consumer needs in personal care, toiletries, health and well-being, baby care and lighting categories. The product range includes: Santoor brand of Soap and Talc, Wipro Shikakai Soap, Milk and Roses Soap, Wipro Active Talc, Glucovita, Wipro Baby Soft range, Wipro Domestic Lighting, Commercial and Institutional Lighting.
32
Table of Contents
WIPRO LIMITED
DIRECTORS’ REPORT
Dear Shareholders,
The Directors present the Annual Report together with the audited Balance Sheet and Profit and Loss Account of Wipro Limited for the year ended March 31, 2004.
FINANCIAL RESULTS
(Rs. in Million)
| 2004 | 2003 | |||||||
Sales and other income (net of excise duty) | 52,597 | 41,032 | ||||||
| Profit before tax | 10,823 | 9,606 | ||||||
| Provision for tax | 1,674 | 1,211 | ||||||
Profit after tax before extraordinary items | 9,149 | 8,395 | ||||||
| Extraordinary gains (Loss) | — | (263 | ) | |||||
| Profit for the year | 9,149 | 8,132 | ||||||
| Appropriations : | ||||||||
| Proposed dividend on equity shares | 6,750 | 233 | ||||||
| Corporate Tax on distributed dividend | 865 | 30 | ||||||
| Transfer to General Reserve | 1,534 | 7,870 | ||||||
Sales of the Company for the year ended March 31, 2004 were Rs. 52,597 millions up by 28% and Profit after Tax before extraordinary items was Rs. 9,149 millions increased by 9% over the previous year. Over the last 10 years, the sales have grown at an average annual rate of 23% and Profit after Tax at 52%. The Company’s earnings in Foreign Exchange at Rs. 38,357 millions have registered a growth of 33% compared to the previous year.
FINANCIAL RESULTS — CONSOLIDATED
(Rs. in Million)
| 2004 | 2003 | |||||||
Sales and other income (net of excise duty) | 59,716 | 44,047 | ||||||
| Profit before tax | 12,032 | 10,137 | ||||||
| Provision for tax | 1,681 | 1,276 | ||||||
Profit after tax before extraordinary items | 10,351 | 8,860 | ||||||
| Extraordinary gains (Loss) | — | (263 | ) | |||||
| Profit for the year before minority interest/equity in losses of affiliates | 10,351 | 8,597 | ||||||
| Minority interest and equity in earnings/(losses) of affiliates | (37 | ) | (392 | ) | ||||
| Profit for the period | 10,315 | 8,205 | ||||||
Dividend
The Directors recommend a final dividend of Rs. 4/- per equity share and a one time dividend of Rs.25/- per equity share subject to the approval by the shareholders at the ensuing Annual General Meeting. After the approval of the shareholders at the ensuing Annual General Meeting, the dividend will be paid in line with the applicable regulations.
Directors
Mr. B. C. Prabhakar and Mr. N. Vaghul, retire by rotation and being eligible offer themselves for re-appointment.
Bonus shares
The Directors have at their meeting held on April 16, 2004 approved the issue of Bonus in the ratio of two equity share for every one share held on the record date, by capitalizing the amount from the General Reserve. The members’ approval is required at the ensuing Annual General Meeting to give effect to the above.
Auditors
The auditors M/s. N. M. Raiji & Co., retire at the conclusion of ensuing Annual General Meeting and are eligible for re-appointment. The Audit Committee of the Board recommends the re-appointment of M/s. N. M. Raiji & Co. as Auditors for a further period of one year.
Personnel
Information as per Section 217 (2A) of the Companies Act, 1956, read with the Companies (Particulars of Employees) Rules, 1975 is given in the Annexure forming part of this report.
Wipro Employee Stock Option Plan (WESOP)
Pursuant to Clause 12.1 of SEBI (Employee Stock Option Scheme and Employee Stock Purchase Scheme) Guidelines, 1999, the details of options granted under WESOP 1999 and 2000 for the year ended March 31, 2004 are given below :
33
Table of Contents
WIPRO LIMITED
| Sl. No. | Description | WESOP 1999 | WESOP 2000 | |||||||||
| 1. | Total number of options under the Plan | 5,000,000 | 25,000,000 | |||||||||
| 2. | Options granted during the year | — | — | |||||||||
| 3. | Pricing formula | Fair Market Value i.e., the market price as defined by Securities and Exchange Board of India from time to time. | Fair Market Value i.e., the market price as defined by Securities and Exchange Board of India from time to time. | |||||||||
| 4. | Options vested (as of March 31, 2004) | 1,775,063 | 3,104,042 | |||||||||
| 5. | Options exercised during the year | 145,752 | 3,445 | |||||||||
| 6. | Total number of shares arising as a result of exercise of option (as of March 31, 2004) | 390,494 | 3,845 | |||||||||
| 7. | Options lapsed * | — | — | |||||||||
| 8. | Variation of terms of options | NIL | NIL | |||||||||
| 9. | Money realized by exercise of options during the year (Rs.) | 158,286,672 | 5,214,520 | |||||||||
| i. | Total number of options in force at the end of the year | 3,285,222 | 7,548,704 | |||||||||
| ii. | Employee wise details of options granted to Senior Management during the year | NIL | NIL | |||||||||
| iii. | Employees holding 5% or more of the total number of options granted during the year | NIL | NIL | |||||||||
| iv. | Identified employees who were granted option, during any one year, equal to or exceeding 1% of the issued capital (excluding outstanding warrants and conversions) of the company at the time of grant | NIL | NIL | |||||||||
| 10. | Diluted Earnings Per Share pursuant to issue of shares on exercise of option calculated in accordance with International Accounting Standard (IAS) 33. (Rs.) | 39.52 | ||||||||||
* As per the Plan, options lapse only on termination of the Plan. If an Option expires or becomes unexercisable without having been exercised in full, the un-purchased shares, which were subject thereto, shall become available for future grant or sale under the Plan.
ADS 2000 Stock Option Plan
Pursuant to Clause 12.1 of SEBI (Employee Stock Option Scheme and Employee Stock Purchase Scheme) Guidelines, 1999, the details of options granted under the ADS 2000 Stock Option Plan for the year ended March 31, 2004 are given below :
| Sl. No. | Description | ADS 2000 Stock Option Plan | ||||
| 1. | Total number of options under the Plan | 15,00,000 ADS representing 15,00,000 underlying equity shares | ||||
| 2. | Options granted during the year | — | ||||
| 3. | Pricing formula | Exercise price being not less than 90% of the fair market value on the date of grant. | ||||
| 4. | Options vested (as of March 31, 2004) | 157,250 | ||||
| 5. | Options exercised during the year | 45,963 | ||||
| 6. | Total number of shares arising as a result of exercise of options | 45,963 | ||||
| 7. | Options lapsed* | 72,901,166 | ||||
| 8. | Variation of terms of options | NIL | ||||
34
Table of Contents
WIPRO LIMITED
| 9. | Money realised by exercise of options (Rs.) | 72,901,166 | ||||||||
| i. | Total number of options in force | 636,887 | ||||||||
| ii. | Employee wise details of options granted to Senior Management during the year | NIL | ||||||||
| iii. | Employees holding 5% or more of the total number of options granted during the year | NIL | ||||||||
| iv. | Identified employees who were granted option, during any one year, equal to or exceeding 1% of the issued capital (excluding outstanding warrants and conversions) of the Company at the time of grant | NIL | ||||||||
* As per the Plan, Options lapse only on termination of the Plan. If an Option expires or becomes unexercisable without having been exercised in full, the un-purchased shares, which were subject thereto, shall become available for future grant or sale under the Plan.
Research and Development
Following are some of the important Research and Development activity carried out by us in your Company.
Developed solutions to address Industry specific problems like Customer Analytics (Utilities), Global Data Synchronization (Retail), Customer Service (Manufacturing) etc. which provides excellent traction with customers and prospects. To enable your Company to get large design service wins, your Company built a high level of competency in areas like Broad Band Technology.
Your Company had invested in new areas of technology like Wireless. Apart from the Wireless LAN IPs (covered later), your Company developed high level of competency in popular mobile platforms like Symbian and Linux . This resulted in large design wins with our partners.
Your Company continued to invest in developing our intellectual properties like Residential Gateway, Wireless LAN (802.11 a/b/g), Wireline IPs like IEE1394, Ethernet and Set Top Box solutions which have resulted in large design wins.
Your Company also continued to invest in employee self service solution, i-Desk which has now a number of successful implementations, FlowbriX which has evolved as a Business Process Management solution.
Another area of investment was the development of Globrad, an innovative platform to enable the outsourcing of Radiology business. The platform makes the process simple to operate, tracks the workflow, ensures security and improves the overall productivity.
The total expenditure for R&D last year has been Rs. 167.97 million including capital expenditure of Rs. 6.57million.
Foreign Exchange Earnings and Outgoings
The foreign exchange earnings of the Company during the year were Rs. 38,357 million while the outgoings were Rs. 13,784 million (including materials imported).
Report on Corporate Governance
A detailed report on Corporate Governance has been included separately in the Annual Report.
Directors Responsibility Statement
As required under Section 217 (2AA) of the Companies Act, 1956, it is hereby stated that :
| a) | in the preparation of the annual accounts, the applicable accounting standards had been followed along with proper explanation relating to material departures; | |||
| b) | we have selected such accounting policies and applied them consistently and made judgements and estimates that are reasonable and prudent so as to give true and fair view of the state of affairs of the Company at the end of the financial year and of the profit or loss of the Company for that period; | |||
| c) | we have taken proper and sufficient care for the maintenance of adequate accounting records in accordance with the provisions of this Act for safeguarding the assets of the Company and for preventing and detecting fraud and other irregularities; and | |||
| d) | we have prepared the annual accounts on a going concern basis. | |||
Acknowledgements
The Directors thank the Company’s Customers, Shareholders, Suppliers, Bankers, Financial Institutions and Central & State Governments for their consistent support to the Company. The Directors also sincerely acknowledge the significant contributions made by all the employees for their dedicated services to the Company.
On behalf of the Board
Azim H. Premji
Chairman & Managing Director
Bangalore, April 16, 2004
35
Table of Contents
WIPRO LIMITED
CORPORATE GOVERNANCE REPORT 2003-04
I | CORPORATE GOVERNANCE AT WIPRO | |
| In India, the Confederation of the Indian Industry took up an initiative on Corporate Governance in 1997-98. Subsequently, this was followed by a Committee set up in this regard by the Securities and Exchange Board of India. Based on the Committee’s recommendation, the Listing Agreement of all the Stock Exchanges in the country was amended by insertion of Clause 49 which specified the standards that listed Indian companies would have to meet as well as their disclosure requirements for effective Corporate Governance. | ||
| Your Company, being a listed Company on the New York Stock Exchange also has a set of U.S. Corporate Governance standards to follow which have recently being made more stringent with the passage of the Sarbanes-Oxley Act of 2002. | ||
| Your Company believes that efficient Corporate Governance requires a clear understanding of the respective roles of the Board and of Senior Management and their relationships with others in the corporate structure. The relationships of the Board and Management shall be characterised by sincerity; their relationships with employees shall be characterised by fairness; their relationships with the communities in which they operate shall be characterised by good citizenship; and their relationships with Government shall be characterised by a commitment to compliance. | ||
| Your Company has always practiced Corporate Governance of the highest standards. This part, alongwith the chapters on Management Discussion & Analysis shows the compliance standard of your Company with respect to disclosures mandated under both Indian as well as the U.S. law. | ||
| Your Company has also formally developed and adopted comprehensive guidelines on Corporate Governance in January 2004 and the same is posted on Company’s website at www.wipro.com. | ||
| Your Company has been given the highest Shareholder Value Creation and Governance rating of SVG1 by an independent rating agency, ICRA Limited. | ||
| Your Company has also been awarded the Golden Peacock award for Excellence in Corporate Governance by the Institute of Directors. | ||
II | BOARD OF DIRECTORS | |
A | Composition | |
| The details of the Directors on the Board of your Company for the year 2003-2004 are given below : |
| Name | Category | Designation | Date of | Directorship | Only | Only | ||||||||||||||
| appointment | in other | Chairmanship | Membership | |||||||||||||||||
| Companies | in Committees | in Committees | ||||||||||||||||||
| of Boards of | of Boards | |||||||||||||||||||
| other | of other | |||||||||||||||||||
| | | | | | companies | companies | ||||||||||||||
| Azim H. Premji | Promoter Director | Chairman & Managing Director | 01.09.1968 | 12* | Nil | Nil | ||||||||||||||
| Vivek Paul | Executive Director | Vice Chairman | 26.07.1999 | 3 | Nil | Nil | ||||||||||||||
| N. Vaghul | Independent Non-Executive Director | Director | 09.06.1997 | 14** | 3 | 3 | ||||||||||||||
| B.C. Prabhakar | Independent Non-Executive Director | Director | 20.02.1997 | Nil | Nil | Nil | ||||||||||||||
| Jagdish N. Sheth | Independent Non-Executive Director | Director | 01.01.1999 | 4 | Nil | 3 | ||||||||||||||
| Ashok Ganguly | Independent Non-Executive Director | Director | 01.01.1999 | 10 | 2 | 5 | ||||||||||||||
| Eisuke Sakakibara | Independent Non-Executive Director | Director | 01.01.2002 | Nil | Nil | Nil | ||||||||||||||
| P.M. Sinha | Independent Non-Executive Director | Director | 01.01.2002 | 5*** | Nil | 2 | ||||||||||||||
36
Table of Contents
WIPRO LIMITED
| * | Includes 1 Section 25 Company. | |||
| ** | Includes 4 Section 25 Companies. | |||
| *** | Includes 1 Section 25 Company. | |||
| The Chairman is an Executive Director and the number of Independent Non-Executive Directors on the Board is more than 50% of the Board strength at any point of time. All Independent Non-Executive Directors comply with the legal requirements for being “independent”. | ||||
| Lead Independent Director | ||||
| The Lead Independent Director is responsible for coordinating the activities of the other Independent Directors and to perform various other duties. The general authority and responsibility of the Lead Independent Director are decided by the group of Independent Directors. | ||||
| Currently, Mr. N.Vaghul has been designated as the Lead Independent Director. The basis for his selection is as laid down in our Corporate Governance guidelines. | ||||
| Board definition of Independent Directors under Clause 49 of the Listing Agreement with the Indian Stock Exchanges and NYSE Listing Standards. | ||||
| Your Company has adopted the following standards in determining the Independence of the Board of Directors. | ||||
| To be considered independent under the NYSE rules and Securities and Exchange Board of India requirements, the Board must determine that a Director does not have any direct or indirect material relationship with the Company. The Board has established the following guidelines to assist it in determining director independence : | ||||
| 1. | A Director is not considered to be independent if, within the preceding five years: | |||
| - | the Director was employed by Wipro or its subsidiaries; | |||
| - | an immediate family member of the Director was employed by Wipro as an officer; | |||
| - | the Director was employed by or affiliated with Wipro’s independent auditor; | |||
| - | an immediate family member of the Director was employed by Wipro’s independent auditor as a partner, principal or manager; or | |||
| - | Wipro’s executive officer was on the Board of Directors of a Company which employed the Wipro Director, or which employed an immediate family member of the Director as an officer; | |||
| 2. | Certain commercial or charitable relationships are not considered to be material relationships that would impair a Director’s Independence. Details of the same are available in the Corporate Governance guidelines of the Company. | |||
| 3. | For relationships not covered by the guidelines in sub-section (2) above, the determination of whether the relationship is material or not, and therefore whether the Director would be independent or not, shall be made by the Directors who satisfy the independence guidelines set forth in sub-sections (1) and (2) above. | |||
| 4. | In addition to the requirement that a majority of the Board satisfies the independence standards, members of the Audit Committee also satisfy an additional NYSE independence requirement. They do not directly or indirectly receive any compensation by way of commission from the Company other than their Directors’ compensation. | |||
| Board membership criteria | ||||
| The Nomination and Corporate Governance Committee comprise entirely of Independent Directors which works closely with the Board in identifying, screening, recruiting and recommending Directors for nomination by the Board for election as members of the Board. | ||||
| Board members are expected to possess strong management experience, ideally with major public companies with successful multinational operations, other areas of expertise or experience that are desirable, given the Company’s business and the current make-up of the Board, such as expertise or experience in Information Technology businesses, manufacturing, international, financial or investment banking, scientific research and development, senior level government experience and academic, administration, personal characteristics matching with the Company’s values, such as integrity, accountability, financial literacy, and high performance standards. | ||||
| Material relationships of the Non-Executive Directors in your Company | ||||
| None of the Non-Executive Directors have any pecuniary or material relationship or transaction with the Company and have given undertakings to that effect. | ||||
| B | Board Meetings | |||
| Under Indian law, the Board of Directors must meet at least four times a year, with a maximum time gap of four months between any two meetings. | ||||
37
Table of Contents
WIPRO LIMITED
| During the last financial year, our Board met four times, on April 16, 2003, July 17, 2003, October 16, 2003 and January 19, 2004. All the Board meetings were held at the Company’s registered office at Bangalore, India. | ||||
| The agenda for the Board meetings is always sent to the Directors at least two weeks prior to the Board meeting. | ||||
| Agenda papers alongwith all information relevant to the matters to be discussed at an upcoming Board meeting were circulated to the Board few days in advance for each of these meetings together with issues which are statutory in nature. | ||||
| The attendance of the Directors at the Board Meetings held during the year are given below : | ||||
| Director | Number of meetings held | Number of meetings attended | ||||||
| Azim H. Premji | 4 | 4 | ||||||
| Vivek Paul | 4 | 4 | ||||||
| N. Vaghul | 4 | 4 | ||||||
| B.C. Prabhakar | 4 | 4 | ||||||
| Jagdish N. Sheth | 4 | 4 | ||||||
| Ashok Ganguly | 4 | 3 | ||||||
| Eisuke Sakakibara | 4 | 1 | ||||||
| P.M. Sinha | 4 | 4 | ||||||
| C | Directors’ membership in Board committees | |||
| Under Indian law, no Director shall be a member in more than 10 committees or shall act as chairman of more than five committees across all companies in which he is a Director. | ||||
| None of the Directors of our Company were members in more than 10 committees or acted as Chairman of more than five committees across all companies in which they were Directors. | ||||
| D | Selection, Remuneration, and tenure of Directors | |||
| Selection | ||||
| The selection of new Directors is done by the Nomination & Corporate Governance Committee of the Board. Your Company has an elaborate process of nomination and selection of prospective Directors as detailed in the Charter of Nomination and Corporate Governance Committee. The charter is posted on Company’s website at www.wipro.com. No new directors were appointed during the year and two of the existing Directors, who retire by rotation and one Executive Director whose term is ending in the current year, are proposed to be re-appointed as Directors at the ensuing Annual General Meeting. | ||||
| The Board and the Nomination and Corporate Governance Committee are responsible for selecting members of the Board and in recommending them for election by the shareholders. The screening and selection process involved in selecting the new Directors is being done by the Nomination and Corporate Governance Committee. | ||||
| Remuneration | ||||
| Executive Directors are paid remuneration within the limits envisaged under Schedule XIII of the Companies Act, 1956. The remuneration payable is always recommended by the Compensation & Benefits Committee to the Board and is approved by the Board as well as the Shareholders of the Company. | ||||
| Non-Executive Independent Directors are paid remuneration by way of a commission as recommended by the Compensation & Benefits Committee and approved by the Board/Shareholders subject however to the condition that the commission shall not cumulatively exceed 1% of the net profits of the Company for all Independent Non-Executive Directors in aggregate in one financial year. In case of commission payable to the members of the Compensation & Benefits Committee, the same shall be decided and approved by the Board. | ||||
| Tenure | ||||
| The age limit for retirement of the Executive and Non-Executive Independent Directors is being decided by the Nominating and Corporate Governance Committee. | ||||
38
Table of Contents
WIPRO LIMITED
| III | BOARD COMMITTEES | |||
| Your Company has four Board Committees. These are : | ||||
| A. | Audit Committee | |||
| B. | Compensation & Benefits Committee | |||
| C. | Nomination & Corporate Governance Committee | |||
| D. | Shareholders/Investors Grievance & Administrative Committee | |||
| A | AUDIT COMMITTEE | |||
| 1 | Brief description of terms of reference of the Audit Committee | |||
| The Audit Committee reviews, acts and reports to the Board of Directors with respect to : | ||||
| - | auditing and accounting matters, including the recommendation for appointment of our independent auditors; | |||
| - | compliance with legal and statutory requirements; | |||
| - | integrity of the Company’s financial statements, the scope of the annual audits, and fees to be paid to the independent auditors; | |||
| - | performance of the Company’s Internal Audit function, independent auditors and accounting practices. | |||
| Though the financial results are sent to the Audit Committee and the Board at the same time, the Audit Committee reviews the audited quarterly, half-yearly and yearly financial results and places a report on the same to the Board for its consideration and approval. The Chairman of the Audit Committee is always present at the Annual General Meeting. | ||||
| The detailed charter of the Audit Committee is posted on the Company’s website at: www.wipro.com | ||||
| 2 | Composition & Qualifications | |||
| The Audit Committee comprises of three Independent Non-Executive Directors. All the members including the Chairman have adequate financial and accounting knowledge. None of the members receive directly or indirectly any consulting, advisory or compensatory fees from the Company other than their remuneration as a Director. | ||||
| Mr. N. Vaghul | - | Chairman | ||
| Mr. B.C. Prabhakar | - | Member | ||
| Mr. P.M. Sinha | - | Member |
| 3 | Meetings and attendance during the year | |||
| The Audit Committee met four times during the year, each time on the day preceding the Board Meetings. | ||||
| Name | Number of meetings held | Number of meetings | ||||||
| | during the year | attended during the year | ||||||
| N. Vaghul | 4 | 4 | ||||||
| B.C. Prabhakar | 4 | 4 | ||||||
| P.M. Sinha | 4 | 4 | ||||||
| B | COMPENSATION AND BENEFITS COMMITTEE | |||
| 1 | Brief description of terms of reference of the Compensation & Benefits Committee | |||
| The Compensation and Benefits Committee determines salaries, benefits and stock option grants to employees and Directors of your Company. The Committee also administers your Company’s ESOP plans. The detailed charter of the Committee is posted on the Company’s website at www.wipro.com | ||||
| 2 | Composition, name of members and the Chairperson | |||
| The Compensation & Benefits Committee comprises of the following three Independent Non-Executive Directors : | ||||
| Mr. N. Vaghul | - | Chairman | ||
| Mr. B.C. Prabhakar Mr. P.M. Sinha | - - - | Member Member |
39
Table of Contents
WIPRO LIMITED
| 3 | Meetings and attendance during the year | |||
| The Compensation & Benefits Committee met five times during the year. All the members were present at each of the meetings. | ||||
| Name | Number of meetings held | Number of meetings | ||
| | during the year | attended during the year | ||
| N. Vaghul | 5 | 5 | ||
| B.C. Prabhakar | 5 | 5 | ||
| P.M. Sinha | 5 | 5 |
| C | NOMINATION & CORPORATE GOVERNANCE COMMITTEE | |||
| 1 | Brief description of terms of reference | |||
| The Nomination and Corporate Governance Committee has the following key deliverables : | ||||
| • | develop and recommend to the Board corporate governance guidelines applicable to the Company | |||
| • | implement policies and processes relating to corporate governance principles | |||
| • | lay down policies and procedures to assess the requirements for induction of new members on the Board | |||
| 2 | Composition | |||
| The Nomination and Corporate Governance Committee comprise of the following three independent non-executive members of the Board. | ||||
| Mr. Ashok Ganguly | - | Chairman | ||
| Mr. N. Vaghul | - | Member | ||
| Mr. P.M. Sinha | - | Member* | ||
| Mr. B.C. Prabhakar | - | Member** |
* Mr. P.M. Sinha joined the Committee on and from January 19, 2004.
** Mr. B.C. Prabhakar was a member till January 19, 2004
| 3 | Meetings | |||
| The Nomination and Corporate Governance Committee met twice in the year. All the members were present at the meeting. | ||||
| Name | Number of meetings held | Number of meetings attended | ||||||
| | during the year | during the year | ||||||
| Ashok Ganguly | 2 | 2 | * | |||||
| N. Vaghul | 2 | 2 | ||||||
| P.M. Sinha | 2 | 1 | ** | |||||
| B.C. Prabhakar | 2 | 1 | *** | |||||
* One of the meetings, Dr. Ashok Ganguly attended through tele-conference.
** Mr. P.M. Sinha joined the Committee on and from January 19, 2004.
*** Mr. B.C. Prabhakar was a member till January 19, 2004.
| D | SHAREHOLDERS’/INVESTORS’ GRIEVANCE & ADMINISTRATIVE COMMITTEE | |||
| 1 | Brief description of terms of reference | |||
| The Shareholders’/Investors’ Grievance & Administrative Committee administers the following : | ||||
| - | Transfer of shares | |||
| - | Transmission of shares | |||
| - | Issuance of duplicate share certificates as and when required | |||
40
Table of Contents
WIPRO LIMITED
| - | Shareholders’/investors’ Grievance issues from time to time and redress the same | |||
| - | Opening/closure of Company’s Bank accounts | |||
| - | Grant, revocation and renewal of general, specific and banking powers of attorney | |||
| Apart from the above, the Committee is also delegated by the Board to : |
| 1. | consider and approve allotment of equity shares pursuant to exercise of stock options. | |||
| 2. | consider and approve opening of overseas branch offices, appointment of authorised representative for branch offices and issue of power of attorney thereto. | |||
| 3. | ratify an act which the person would otherwise have been authorised to carry out in the absence of a specific power of attorney issued in his favour. | |||
| 4. | administer such other activities resulting from statutory amendments/modifications from time to time. | |||
| 2 | Composition | |||
| The composition of the Shareholders’/Investors’ & Administrative Grievances Committee is as follows : | ||||
| Mr. B.C. Prabhakar | - | Chairman | ||
| Mr. Azim H. Premji | - | Member |
| All the members were present at each of the meetings. | ||||
| Details of queries/complaints received and resolved during the year 2003-04 | ||||
| COMPLAINTS : | ||||
| Sl. No. | Nature of Complaints | Received | Redressed | Pending | ||||||||||
| 1 | Non receipt of Share certificates lodged for transfer | 4 | 4 | 0 | ||||||||||
| 2 | Non receipt of Dividend Warrants | 13 | 13 | 0 | ||||||||||
| 3 | Non receipt of Dividend Warrant after revalidation | 0 | 0 | 0 | ||||||||||
| 4 | Non receipt of share certificates lodged for split | 1 | 1 | 0 | ||||||||||
| 5 | Non receipt of duplicate share certificates | 0 | 0 | 0 | ||||||||||
| 6 | Letters from SEBI/Stock Exchanges | 1 | 1 | 0 | ||||||||||
| Total | 19 | 19 | 0 | |||||||||||
| REQUESTS : |
| Sl. No. | Nature of Complaints | Received | Redressed | Pending | ||||||||||
| 1 | Receipt of Dividend Warrants for revalidation | 106 | 106 | 0 | ||||||||||
| 2 | Request for mandate correction on Dividend Warrants | 85 | 85 | 0 | ||||||||||
| 3 | Request for duplicate Dividend Warrant | 0 | 0 | 0 | ||||||||||
| 4 | Request for copy of Annual Report | 20 | 20 | 0 | ||||||||||
| 5 | Request for TDS certificate | 7 | 7 | 0 | ||||||||||
| 6 | Request for exchange of split Share Certificates | 18 | 18 | 0 | ||||||||||
| Total | 236 | 236 | 0 | |||||||||||
| * | The Company has complied with submission of its responses to the queries/clarifications sought by the Stock Exchanges on various market related information like clarifications on market rumours, etc. from time to time. These responses have not been included in the information furnished in the above table. |
41
Table of Contents
WIPRO LIMITED
| The Corporate Legal & Secretarial department of your Company is an ISO 9001:2000 certified function on the following : |
| a. | Ensuring compliance to Corporate Secretarial requirements | |||
| b. | Ensuring compliance to Corporate Governance Practices | |||
The above certification was awarded during the Financial Year 2003-2004.
| IV | DISCLOSURES ON THE REMUNERATION OF DIRECTORS | |||
| Given below are the details of remuneration paid for the financial year 2003-04 to the Directors of the Company. The remuneration of the Executive Directors which is approved by the Compensation & Benefits Committee consist of fixed pay and commission based on percentage of profits of the Company as approved by the shareholders. No stock options have been granted to any of the Directors during the Financial Year. | ||||
| Commission payable to each of the Independent Non-Executive Directors is limited to a fixed sum payable as approved by the Board subject to a maximum of 1% of the net profits of the Company, cumulatively for all the Directors. The commission payable to Independent Non Executive Directors was approved by the shareholders on July 18, 2002. | ||||
(Rs. 000s)
| Name | Salary | Commission/ | Other | Deferred | Notice | |||||||||||||||
| Incentives | annual | benefits | period and | |||||||||||||||||
| compensation * | Severance | |||||||||||||||||||
| | | | | | payment | |||||||||||||||
| Azim H. Premji | 2,100 | 11,185 | 2,811 | 2,035 | Up to 6 months | |||||||||||||||
| Vivek Paul** | 19,964 | 33,557 | 501 | 2,994 | Three months. For severance payment, see note below | |||||||||||||||
| Ashok Ganguly | — | 800 | — | — | — | |||||||||||||||
| B.C. Prabhakar | — | 400 | — | — | — | |||||||||||||||
| N. Vaghul | — | 800 | — | — | — | |||||||||||||||
| P.M. Sinha | — | 1,000 | — | — | — | |||||||||||||||
| Dr. Jagdish N. Sheth ** | — | 1,085 | — | — | ||||||||||||||||
| Prof. Eisuke Sakakibara *** | — | 1,736 | — | — | — | |||||||||||||||
| * | The above figure includes cost of rent free furnished residential accommodation or house rent allowance, leave travel concession, reimbursement of medical expenses, personal accident insurance, fully maintained Company car with driver, interest subsidy on housing finance, gardener, watchman, electricity, servant and gratuity as per Company policy. | |||
| Deferred benefits in the case of Mr. Vivek Paul were Company’s contribution to Deferred Compensation Plan. The Company has a Deferred Compensation Plan in place, and a Participation Agreement with Mr. Vivek Paul. Contributions made by the Company under this Deferred Compensation Plan are managed by an irrevocable Trust whose trustees are appointed by the Company under a Trust Agreement. Wells Fargo NA., has been appointed as a Trustee of the Trust. Company makes a contribution of 15% of the base salary to the Trust and the employee is also eligible to contribute upto 15% of the base salary and upto 100% of the commission under the Deferred Compensation Plan to the trust. The Trust will make payouts upon compliance with the conditions prescribed in the Plan and the relevant agreements. | ||||
| Severance payment is payable to Mr. Vivek Paul subject to fulfillment of certain conditions. For further details, please refer to our discussions in section titled “Employment and Indemnification contracts” in the Annual Report on Form 20-F filed with Securities and Exchange Commission (“SEC”) which is being circulated separately as an annexure to this Annual Report. | ||||
| ** | Figures mentioned are rupee equivalent as amounts payable in USD. | |||
| *** | Figures mentioned are rupee equivalent as amounts payable in Yen. | |||
| No stock options have been granted to any of the Directors during the year. | ||||
42
Table of Contents
WIPRO LIMITED
| V | DISCLOSURE REQUIREMENTS | |||
| A | Management Discussion and Analysis Report | |||
| The Company has provided a detailed Management Discussion and Analysis report in its Annual Report for the year 2003-04. Please refer pages 104 to 111 of the Annual Report. | ||||
| B | Disclosures relating to all material financial and commercial transactions having a potential conflict of interest | |||
| During the year 2003-04, no transactions of material nature had been entered into by the Company with the Management or their relatives that may have a potential conflict with interest of the Company. | ||||
| C | Particulars of Directors appointed/re-appointed | |||
| The notice for the Annual General Meeting held on July 17, 2003 complies with this requirement. The notice for the Annual General Meeting scheduled to be held on June 11, 2004 also complies with this requirement. | ||||
| D | Distribution of Shareholding as of March 31, 2004 | |||
| Category | No. of | % to | No. of | % to total | ||||||||||||
| | shareholders | shareholders | shares | equity | ||||||||||||
| 0-500 | 47,046 | 95.96 | 1,459,951 | 0.63 | ||||||||||||
| 501-1000 | 739 | 1.51 | 562,373 | 0.24 | ||||||||||||
| 1001-2000 | 471 | 0.96 | 682,984 | 0.29 | ||||||||||||
| 2001-3000 | 181 | 0.37 | 474,122 | 0.20 | ||||||||||||
| 3001-4000 | 80 | 0.16 | 286,936 | 0.12 | ||||||||||||
| 4001-5000 | 57 | 0.12 | 260,681 | 0.11 | ||||||||||||
| 5001-10000 | 131 | 0.27 | 946,412 | 0.41 | ||||||||||||
| 10001-50000 | 205 | 0.42 | 4,489,817 | 1.93 | ||||||||||||
| 50001-100000 | 39 | 0.07 | 2,827,997 | 1.21 | ||||||||||||
| 100001-5000000 | 69 | 0.14 | 26,094,269 | 11.22 | ||||||||||||
| 5000001-10000000 | 4 | 0.01 | 32,086,810 | 13.79 | ||||||||||||
| Above 10000001 | 3 | 0.01 | 162,586,800 | 69.85 | ||||||||||||
Total | 49,025 | 100 | 232,759,152 | 100 | ||||||||||||
| E | Categories of Shareholders |
| Category | No. of Shares held | % Shareholding | ||||||||
A | Promoters Holding | |||||||||
| Promoter in his capacity as partner of Partnership firms | 162,586,800 | 69.85 | ||||||||
| Promoter in his capacity as director of Private Limited companies | 22,746,300 | 9.77 | ||||||||
| Promoter in his individual capacity | 9,340,510 | 4.10 | ||||||||
| Promoter’s relatives | 239,100 | 0.01 | ||||||||
| Sub Total | 194,912,710 | 83.73 | ||||||||
43
Table of Contents
WIPRO LIMITED
| Category | No. of Shares held | % Shareholding | ||||||||
B | Non Promoter Holding | |||||||||
| Mutual Funds and UTI | 2,507,669 | 1.08 | ||||||||
| Banks, Financial Institutions, Insurance Companies (Central/State Government Institutions/Non-Government Institutions) | 2,521,761 | 1.08 | ||||||||
| FIIs | 9,097,816 | 3.91 | ||||||||
| Sub Total | 14,127,246 | 6.07 | ||||||||
C | Others | |||||||||
| Private Corporate Bodies | 4,135,547 | 1.78 | ||||||||
| Indian Public | 15,424,107 | 6.63 | ||||||||
| NRIs | 2,631,291 | 1.13 | ||||||||
| Directors & Relatives | 176,850 | 0.08 | ||||||||
| Trusts | 1,351,401 | 0.58 | ||||||||
| Sub Total | 23,719,196 | 10.20 | ||||||||
| TOTAL | 232,759,152 | 100 | ||||||||
F | Dematerialization of Shares and Liquidity | : | Over 96% of outstanding equity has been dematerialised upto March 31, 2004. | |||
G | Outstanding convertible instruments | : | As of March 31, 2004, there are no outstanding convertible instruments | |||
H | Outstanding ADRs as of March 31, 2004 | : | Outstanding ADRs as of March 31, 2004 is 3,208,113. Each ADR represents one underlying Equity Share. |
| I | Compliance Officer and address for correspondence | |||
| The name and designation of the Compliance Officer of the Company is Mr. V. Ramachandran, Company Secretary. | ||||
| In addition, shareholders/ADR holders can contact Mr. K.R. Lakshminarayana, Corporate Treasurer in India and Mr. R. Sridhar in USA on financial matters. | ||||
| Their contact details are given below : | ||||
| Name | Telephone Number | Email id | Fax No. | |||
| K.R. Lakshminarayana | 91-080-28440011-Extn. 6186 | |||||
| 91-080-28440079 (Direct) | lakshminarayana.lan@wipro.com | 91-080-28440051 | ||||
| V. Ramachandran | 91-080-28440011-Extn. 6185 | |||||
| 91-080-28440229 (Direct) | ramachandran.venkatesan@wipro.com | 91-080-28440051 | ||||
| R. Sridhar | 001 408 242 6285 | sridhar.ramasubbu@wipro.com | 001-650 316 3467 |
| VI | GENERAL MEETINGS | |||
| Annual General Meetings (AGM): | ||||
| The location and time of the last three AGMs are as follows : | ||||
| Year | Location | Date | Time | |||
| 2000-01 | Doddakannelli, Sarjapur Road, Bangalore | July 19, 2001 | 4.30 pm | |||
| 2001-02 | Doddakannelli, Sarjapur Road, Bangalore | July 18, 2002 | 4.30 pm | |||
| 2002-03 | Doddakannelli, Sarjapur Road, Bangalore | July 17, 2003 | 4.30 pm |
44
Table of Contents
WIPRO LIMITED
| Generally, all the resolutions in the AGM are passed by show of hands. | ||||
| Two Executive Directors and Five Independent Non-Executive Directors of the Company attended the Annual General Meeting held on July 17, 2003. | ||||
| Details on Extraordinary General Meetings (EGM) | ||||
| No EGMs were held during the year. The date, location and time, of the last three EGMs held are as follows : | ||||
| Year | Location | Date | Time | |||
| 1998-99 | Ganesha Complex, Madiavala, Hosur Main Bangalore | December 13, 1999 | 11.00 am | |||
| 1999-00 | Taj Residency, Bangalore | April 26, 2000 | 4.30 pm | |||
| 2000-01 | Doddakannelli, Sarjapur Road, Bangalore | July 19, 2001 | 5.30 pm |
| No special resolutions were put through postal ballot during the year. | ||||
| VII | DISCLOSURES | |||
| a. | Disclosures on materially significant related party transactions | |||
| There have been no significant material related party transactions. We have disclosed the related party transactions with the subsidiary companies in Note No. 16 at page No. 101 of Annual Report. | ||||
| b. | Details of non-compliance relating to Capital Market | |||
| The Company has complied with the requirements of the Stock Exchange or SEBI on any Capital Market related activities as applicable from time to time. | ||||
| VIII | MEANS OF COMMUNICATION — QUARTERLY/HALF YEARLY RESULTS, ETC. | |||
| The Company’s Quarterly, Half yearly and Annual results as well as copies of the Press Releases and Company Presentations are displayed on the Company’s web-sites at www.wiproindia.com and www.wipro.com | ||||
| The financial results are published in the following newspapers : | ||||
| • | The Business Standard | |||
| • | Kannada Prabha | |||
| IX | GENERAL INFORMATION | |||
| A | Forthcoming AGM | |||
| The next AGM of the Company will be held on June 11, 2004 at 4.30 pm at the registered office of the Company in Doddakannelli, Sarjapur Road, Bangalore 560 035. | ||||
| B | Financial Calendar for 2004-05 | |||
| Tentative schedule | ||||
| 1. | Financial reporting for the quarter ending June 30, 2004 | Third fortnight of July 2004 | ||
| 2. | Financial reporting for the half year ending September 30, 2004 | Second fortnight of October 2004 | ||
| 3. | Financial reporting for the quarter ending December 31, 2004 | Second fortnight of January 2005 | ||
| 4. | Financial reporting for the year ending March 31, 2005 | Second fortnight of April 2005 | ||
| 5. | Annual General Meeting for the year ending March 31, 2005 | Second fortnight of July 2005 | ||
45
Table of Contents
WIPRO LIMITED
| C | Listing | |||
| Your Company’s securities are listed on the following stock exchanges as of March 31, 2004 : | ||||
| Equity Shares | American Depository Receipts (ADRs) | |||||
| 1. | Bangalore Stock Exchange Limited No. 51, First Cross, J C Road, Bangalore 560 027 | 1. | New York Stock Exchange 60 Wall Street New York | |||
| 2. | The Stock Exchange, Mumbai Phiroze Jeejeebhoy Towers, Dalal Street Mumbai 400 023 | |||||
| 3. | National Stock Exchange of India Ltd. Exchange Plaza, 5th Floor, Plot No. C/1, G Block Bandra East, Mumbai 400 051 | |||||
| 4. | The Delhi Stock Exchange Association Ltd. 3/1, Asaf Ali Road, DSE House New Delhi 110 002 | |||||
| 5. | The Stock Exchange, Ahmedabad Opp. Sahajanand College Kamadhenu Complex Panjara Pole Ahmedabad 380 015 | |||||
| 6. | Calcutta Stock Exchange Association Ltd. 7, Lyons Range Kolkata 700 001 | |||||
| 7. | Cochin Stock Exchange Ltd. 36/165, 4th Floor, MES Building Judges Avenue, Kaloor, Cochin 682 017 | |||||
| Listing fees for the year 2003-04 has been paid to the Indian Stock Exchanges | ||||
| Listing fees to New York Stock Exchange for listing of ADRs has been paid for the calendar year 2004. | ||||
| The Board of Directors at their meeting held on April 16, 2004 approved the proposal for de-listing of Company’s equity shares from the following Stock Exchanges. | ||||
(a) Bangalore Stock Exchange Ltd., Bangalore
(b) Delhi Stock Exchange Association Ltd., New Delhi
(c) Stock Exchange — Ahmedabad, Ahmedabad
(d) Calcutta Stock Exchange Association Ltd., Kolkata
(e) Cochin Stock Exchange Ltd., Cochin
| The above proposal is subject to the approval of the shareholders at the ensuing Annual General Meeting scheduled to be held on June 11, 2004. | ||||
| D | Stock Code | |||
| Exchange | Code | |
| The Stock Exchange, Mumbai | Wipro | |
| National Stock Exchange of India Ltd. | Wipro | |
| New York Stock Exchange (ADRs) | WIT |
46
Table of Contents
WIPRO LIMITED
| E | Stock Market Data relating to equity shares listed in India | |||
| Table 1 | ||||
| Month | Price in NSE | S&P CNX Nifty Index | Wipro price | S &P CNX | ||||||||||||||||||||||||||||
| during each month | during each month | movement | Nifty Index | |||||||||||||||||||||||||||||
| | | | | movement | ||||||||||||||||||||||||||||
| High | Low | High | Low | High | Low | High | Low | |||||||||||||||||||||||||
| Rs. | Rs. | Rs. | Rs. | | | | | |||||||||||||||||||||||||
| April 2003 | 1,307 | 832 | 1,033 | 920 | ||||||||||||||||||||||||||||
| May 2003 | 949 | 797 | 1,014 | 931 | -10 | % | -2 | % | -27 | % | -4 | % | ||||||||||||||||||||
| June 2003 | 960 | 815 | 1,141 | 1,005 | -5 | % | -2 | % | 1 | % | 2 | % | ||||||||||||||||||||
| July 2003 | 1,021 | 841 | 1,199 | 1,089 | -6 | % | -25 | % | 6 | % | 3 | % | ||||||||||||||||||||
| August 2003 | 1,132 | 903 | 1,366 | 1,165 | -14 | % | -3 | % | 11 | % | 7 | % | ||||||||||||||||||||
| September 2003 | 1,333 | 1,066 | 1,431 | 1,285 | 18 | % | 12 | % | 17.8 | % | 18 | % | ||||||||||||||||||||
| October 2003 | 1,517 | 1,180 | 1,574 | 1,408 | -1 | % | 8 | % | 14 | % | 11 | % | ||||||||||||||||||||
| November 2003 | 1,548 | 1,336 | 1,630 | 1,509 | 14 | % | 5 | % | 2 | % | 13 | % | ||||||||||||||||||||
| December 2003 | 1,802 | 1,407 | 1,914 | 1,616 | 3 | % | 13 | % | 16 | % | 5 | % | ||||||||||||||||||||
| January 2004 | 1,870 | 1,540 | 2,015 | 1,756 | -4 | % | -11 | % | 4 | % | 9 | % | ||||||||||||||||||||
| February 2004 | 1,649 | 1,397 | 1,936 | 1,756 | -12 | % | -1 | % | -12 | % | -9 | % | ||||||||||||||||||||
| March 2004 | 1,535 | 1,351 | 1,899 | 1,670 | 1 | % | -10 | % | -7 | % | -3 | % | ||||||||||||||||||||

47
Table of Contents
WIPRO LIMITED
| F | Stock Market Data relating to American Depository Shares (ADSs) | |||
| Table 2 | ||||
| Month | Wipro ADS price in | NYSE TMT Index during | Wipro ADS price | NYSE TMT Index | ||||||||||||
| NYSE during each | each month closing ($) | movement (%) | movement(%) | |||||||||||||
| | Month closing ($) | | | | ||||||||||||
| April 2003 | 21.10 | 4089.91 | ||||||||||||||
| May 2003 | 19.54 | 4448.18 | -7 | 9 | ||||||||||||
| June 2003 | 23.05 | 4383.81 | 18 | -1 | ||||||||||||
| July 2003 | 23.30 | 4377.02 | 1 | 0 | ||||||||||||
| August 2003 | 26.05 | 4518.88 | 12 | 3 | ||||||||||||
| September 2003 | 29.05 | 4460.16 | 12 | -1 | ||||||||||||
| October 2003 | 36.30 | 4762.38 | 25 | 7 | ||||||||||||
| November 2003 | 38.65 | 4901.56 | 6 | 3 | ||||||||||||
| December 2003 | 48.20 | 5112.11 | 25 | 4 | ||||||||||||
| January 2004 | 50.70 | 5395.41 | 5 | 6 | ||||||||||||
| February 2004 | 41.21 | 5399.75 | -19 | 0 | ||||||||||||
| March 2004 | 42.14 | 5235.70 | 2 | -3 | ||||||||||||

48
Table of Contents
WIPRO LIMITED
| G | Registrar and Share Transfer Agents | |||
| The Board has delegated the power of share transfers to Registrar and Share Transfer Agents for processing of share transfers to Karvy Computer Share Pvt. Ltd. Their complete address is as follows : | ||||
Karvy Computer Share Pvt. Ltd.
51/2, Vanivilas Road
T. K. N. Complex
Basavangudi
Bangalore
Tel : 080 - 2661 3400
2662 1192/93
Fax : 080 - 2662 1169
| The turnaround time for completion of transfer of shares in physical form is generally less than 7 days from the date of receipt, if the documents are clear in all respects. | ||||
| We have internally fixed turnaround times for closing the queries/complaints received from the shareholders. | ||||
| H | ADS Depository & Custodian | |||
| The Depository for our ADS is JP Morgan Chase Bank, USA. Their complete address is : | ||||
JP Morgan Chase Bank
4 New York Plaza,
13th Floor,
New York, NY 10260
Tel : 001-(212) 623 0858
Fax : 001-(212) 623-0079
| The Custodian for our ADS in India is ICICI Bank Limited. Their complete address is : |
ICICI Bank Limited
Bandra-Kurla Complex
Bandra East
Mumbai 400 051
Tel : 91-22-26531414
Fax : 91-22-26531165
49
Table of Contents
WIPRO LIMITED
| I | Plant locations | |||
| a. | The addresses of the Company’s Software Development Facilities are located at : | |||
| Sl. | ||||
| No. | Address | City | ||
| 1 | S B Towers, 88, M G Road | Bangalore 560 001 | ||
| 2 | Information Technology Park, Whitefield | Bangalore 560 066 | ||
| 3 | 8, 7th Main Block, Koramangala | Bangalore 560 095 | ||
| 4 | K-312, Koramangala Industrial Layout, V Block, Koramangala | Bangalore 560 095 | ||
| 5 | 271-271A, Sri Ganesh Complex, Hosur Main Road, Madiwala I | Bangalore 560 068 | ||
| 6 | 26, Sri Chamundi Complex, Madiwala II, Bommanahalli, Hosur Main Road | Bangalore 560 068 | ||
| 7 | Madiwala Village, Bangalore-Hosur Road, Madiwala III | Bangalore 560 068 | ||
| 8 | Madiwala Village, Bangalore-House Road, Madiwala III (Research & Development) | Bangalore 560 068 | ||
| 9 | Madiwala Village, Bangalore-House Road, Madiwala IV, | Bangalore 560 068 | ||
| 10 | Sigma Infotech Park, Whitefield | Bangalore | ||
| 11 | Electronics City 1 — No. 72, Keonics Electronic City, Hosur Road | Bangalore 561 229 | ||
| 12 | Electronics City – II, Tower IV, No. 72, Keonics Electronic City, Hosur Road | Bangalore 561 229 | ||
| 13 | No. 92, 2nd Main Road, Keonics Electronic City | Bangalore 561 229 | ||
| 14 | 608-610, Carlton Towers, No. 1 Airport Road | Bangalore 560 001 | ||
| 15 | 111, Mount Road, Guindy | Chennai 600 032 | ||
| 16 | 138, Shollinganallur, Old Mahabalipuram Road | Chennai 600 019 | ||
| 17 | 1-8-448, Lakshmi Buildings, S P Road, Begumpet | Secunderabad 500 016 | ||
| 18 | Survey Nos. 64, Serilingampali Mandal, Madhapur | Hyderabad 500 033 | ||
| 19 | Queens Plaza, S P Road, | Hyderabad 500 033 | ||
| 20 | Plot No. 2, MIDC, Infotech Park, Hingewadi | Pune 411 027 | ||
| 21 | Plot No. 27/28, Phase IV, Udyog Vihar, | Gurgaon 122 016 | ||
| 22 | 146/147, Mettagalli Industrial Area, Mettagalli | Mysore | ||
| 23 | Top Floor, Kings Court, 185, Kings Road | Reading RG 14 EX | ||
| United Kingdom | ||||
| 24 | Chrysler Building, 6th Floor, 1 Riverside Drive West | Windsor ONN5A5K4, | ||
| Canada | ||||
| 25 | Web Campus, Kaistrasse, 101 Kiel 24114 | Germany | ||
| 26 | Haninge, Stockholm | Stockholm | ||
| 27 | Room No. 1064, Hatapankatu 1 (Kulma-Sarvis) Tampere | Finland |
| b. | The Company’s manufacturing facilities are located at : |
| Sl. | ||||
| No. | Address | City | ||
| 1 | P O Box No. 12, Dist. Jalgaon | Amalner 425 401 | ||
| 2 | L-8, MIDC, Waluj | Aurangabad 431 136 | ||
| 3 | 105, Hootagalli Industrial Area | Mysore 571 186 | ||
| 4 | A-28, Thattanchavady Industrial Estate | Pondicherry 560 058 | ||
| 5 | 120/1, Vellancheri, | Guduvanchery 603 202 | ||
| 6 | Plot No. 4, Anthrasanahalli Industrial Area | Tumkur 572 106 |
50
Table of Contents
WIPRO LIMITED
X | CONTACT DETAILS | |
| Members may contact us at the Company’s registered office at this address: | ||
| Wipro Limited | ||
| Doddakannelli | ||
| Sarjapur Road | ||
| Bangalore 560 035. | ||
| Tel : 91 080 2844 0011 | ||
| Fax : 91 080 2844 0051. | ||
XI | COMPLIANCE | |
| The certificate dated April 16, 2004 obtained from our statutory Auditors M/s. N M Raiji & Co. is given at page No. 51 of the Annual Report. | ||
XII | COMPLIANCE REPORT ON NON-MANDATORY REQUIREMENTS | |
A | Non-Executive Chairman of the Board | |
| Our Chairman is the Chief Executive of the Company and hence this provision is not applicable. | ||
B | Remuneration Committee | |
| All the requirements of Compensation & Benefits Committee have been complied with and the details are included in Item IV of this Report. | ||
C | Shareholder Rights | |
| Our Quarterly, Half-yearly and Annual results as well as copies of the Press Releases and Company Presentations were displayed on the Company’s web-sites i.e. www.wiproindia.com and www.wipro.com | ||
D | Postal Ballot | |
| There were no items for approval through Postal Ballot during the year and hence this item is not applicable. |
AUDITOR’S CERTIFICATE ON CORPORATE GOVERNANCE
To the Members of Wipro Limited
We have examined the compliance of conditions of Corporate Governance by Wipro Limited (the Company) for the year ended on 31st March 2004, as stipulated in Clause 49 of the Listing Agreements of the Company with the stock exchanges.
The compliance of conditions of Corporate Governance is the responsibility of the Management. Our examination was limited to procedures and implementation thereof, adopted by the Company for ensuring the compliance of the conditions of Corporate Governance. It is neither an audit nor an expression of opinion on the financial statement of the Company.
In our opinion and to the best of our information and according to the expxlanations given to us, we certify that the Company has complied with the conditions of Corporate Governance as stipulated in the above mentioned Listing Agreements.
We have been explained that no investor grievances are pending for a period exceeding one month against the Company as per the records maintained by the Company.
We further state the such compliance is neither an assurance as to the future viability of the Company nor the efficiency or effectiveness with which the Management has conducted the affairs of the Company.
| For N.M. Raiji & Co., | ||
| Chartered Accountants | ||
| J.M. Gandhi | ||
| Mumbai, April 16, 2004 | Partner |
51
Table of Contents
WIPRO LIMITED
COMPLIANCE REPORT WITH THE FINAL CORPORATE GOVERNANCE RULES OF THE NEW YORK STOCK EXCHANGE (NYSE) AS APPROVED BY THE SECURITIES & EXCHANGE COMMISSION ON NOVEMBER 4, 2003 AND CODIFIED IN SECTION 303A OF THE NYSE LISTED COMPANY MANUAL
The New York Stock Exchange’s Board of Directors approved significant changes in its listing standards in 2002, aimed at restoring investor confidence by strengthening corporate governance practices. Companies listed on the NYSE must comply with these standards which are codified in Section 303A of the NYSE Listed Companies Manual. Though some of the requirements are not applicable, the Company presently complies with all the practices.
A compliance report on the final recommendations of the committee is presented below :
| 1 | Listed companies must have a majority of independent directors | |||
| The Board of our Company comprises of six Independent Non-Executive Directors out of a total strength of eight Directors. | ||||
| 2(a) | No director qualifies as “independent” unless the board of directors affirmatively determines that the director has no material relationship with the listed Company (either directly or as a partner, shareholder or officer of an organization that has a relationship with the company). Companies must disclose these determinations. | |||
| Six directors on the board are independent directors and satisfy the category of ‘independent directors’ as per this clause. | ||||
2(b) | i. | A director who is an employee, or whose immediate family member is an executive officer, of the Company is not independent until three years after the end of such employment relationship. | ||
| None of our existing independent directors have held the office of employment in the Company at any point of time. | ||||
| ii. | A director who receives, or whose immediate family member receives, more than $100,000 per year in direct compensation from the listed Company, other than director and committee fees and pension or other forms of deferred compensation for prior service (provided such compensation is not contingent in any way on continued service), is not independent until three years after he or she ceases to receive more than $100,000 per year in such compensation. | |||
| None of our independent directors receive any other direct compensation apart from attendance fee for attending Board and Committee meetings. Additionally Independent Directors are also compensated by way of commission. | ||||
| iii. | A director who is affiliated with or employed by, or whose immediate family member is affiliated with or employed in a professional capacity by, a present or former internal or external auditor of the Company is not “independent” until three years after the end of the affiliation or the employment or auditing relationship. | |||
| None of our Directors or their immediate family members have ever been affiliated or employed in any capacity by a present or former internal or external auditor of the Company at any point of time. | ||||
| iv. | A director who is employed, or whose immediate family member is employed, as an executive officer of another Company where any of the listed company’s present executives serve on that company’s compensation committee is not “independent” until three years after the end of such service or the employment relationship. | |||
| None of our Directors or their immediate family members is employed as executive officers of another company where any of the company’s present executives serve on that company’s compensation committee at any point of time. | ||||
| v. | A director who is an executive officer or an employee, or whose immediate family member is an executive officer, of a company that makes payments to, or receives payments from, the listed company for property or services in an amount which, in any single fiscal year, exceeds the greater of $1 million, or 2% of such other company’s consolidated gross revenues, is not “independent” until three years after falling below such threshold. | |||
| None of our Directors or their immediate family members falls under the category referred to above. | ||||
| 3 | To empower non-management directors to serve as a more effective check on management, the non-management directors of each company must meet at regularly scheduled executive sessions without management. | |||
| Non management directors regularly meet at scheduled executive sessions without management prior to every Board meetings held during the year. The executive sessions were all presided by Mr. N. Vaghul, the lead independent director. | ||||
| 4(a) | Listed companies must have a Nominating/Corporate Governance Committee composed entirely of independent directors. | |||
52
Table of Contents
WIPRO LIMITED
| 4(b) | The Nominating/Corporate Governance Committee must have a written charter that addresses: | |||||||
| i. | the committee’s purpose and responsibilities — which, at minimum, must be to: identify individuals qualified to become board members, consistent with criteria approved by the board, and to select, or to recommend that the board select, the director nominees for the next annual meeting of shareholders; develop and recommend to the board a set of corporate governance principles applicable to the corporation; and oversee the evaluation of the board and management; and | |||||||
| ii. | an annual performance evaluation of the Committee. | |||||||
| These are complied with. The Nomination & Corporate Governance Committee, formed in October 2002, comprises of three entirely independent directors. The Nomination & Corporate Governance Committee has the following key deliverables: | ||||||||
| - | develop and recommend the Board a set of corporate governance guidelines applicable to the Company | |||||||
| - | implement policies and processes relating to corporate governance principles | |||||||
| - | to lay down policies and procedures to assess the requirements for induction of new members on the Board and recommendations for the same | |||||||
| The performance evaluation of the members of the Committee is done by the Nomination and Corporate Governance Committee of the Board on an annual basis. | ||||||||
| 5(a) | Listed companies must have a Compensation Committee composed entirely of independent directors. | |||||||
| 5(b) | The Compensation Committee must have a written charter that addresses : | |||||||
| (i) | the committee’s purpose — which, at minimum, must be to discharge the board’s responsibilities relating to compensation of the Company’s executives, and to produce an annual report on executive compensation for inclusion in the Company’s proxy statement, in accordance with applicable rules and regulations. | |||||||
| (ii) | the committee’s duties and responsibilities — which, at minimum, must be to : | |||||||
| (A) | review and approve corporate goals and objectives relevant to CEO compensation, evaluate the CEO’s performance in light of those goals and objectives, and set the CEO’s compensation level based on this evaluation. | |||||||
| (B) | make recommendations to the board with respect to incentive compensation plans and equity-based plans. | |||||||
| (iii) | an annual performance evaluation of the Compensation Committee. | |||||||
| These provisions are complied with. The charter of the Compensation & Benefits Committee of the Board is approved and modified from time to time by the Board. The performance evaluation of the members of the Committee is done by the Nomination and Corporate Governance Committee of the Board on an annual basis. | ||||||||
| The Board also gives appropriate directions to the Committee from time to time. | ||||||||
| 6 | Listed companies must have an Audit Committee that satisfies the requirements of Rule 10A-3 under the Exchange Act. Director’s fees must be the only compensation from the listed Company for the audit committee members. | |||||||
| (a) | the audit committee must have a minimum of three members. | |||||||
| (b) | in addition to any requirement of Rule 10A-3(b)(1), all audit committee members must satisfy the requirements for independence set out in Section 303A.02. | |||||||
| This is complied with. The Audit Committee comprises of three independent directors. The members satisfy all the requirements laid down above. | ||||||||
| (c) | The Audit Committee must have a written charter that addresses : | |||||||
| (i) | the committee’s purpose — which, at minimum, must be to : | |||||||
| (A) | assist board oversight of (1) the integrity of the Company’s financial statements, (2) the company’s compliance with legal and regulatory requirements, (3) the independent auditor’s qualifications and independence, and (4) the performance of the company’s internal audit function and independent auditors; and | |||||||
| (B) | prepare an audit committee report as required by the SEC to be included in the Company’s annual proxy statement. | |||||||
53
Table of Contents
WIPRO LIMITED
| (ii) | an annual performance evaluation of the Audit Committee; and | |||||||
| These are complied with. The reports of the Audit Committee, Management and Independent Auditors’ have been included in the Annual Report. The performance evaluation of the members of the Committee is done by the Nomination and Corporate Governance Committee of the Board on an annual basis. | ||||||||
| (iii) | the duties and responsibilities of the Audit Committee – which, at minimum, must include those set out in Rule 10A-3(b)(2), (3), (4) and (5) of the Exchange Act , as well as to: | |||||||
| (A) | at least annually, obtain and review a report by the independent auditor describing: the firm’s internal quality-control procedures; any material issues raised by the most recent internal quality-control review, or peer review, of the firm, or by any inquiry or investigation by governmental or professional authorities, within the preceding five years, respecting one or more independent audits carried out by the firm, and any steps taken to deal with any such issues; and (to assess the auditor’s independence) all relationships between the independent auditor and the Company. | |||||||
| The Audit Committee reviews the report of the independent auditors with respect to the above on a quarterly basis. | ||||||||
| (B) | discuss the annual audited financial statements and quarterly financial statements with management and the independent auditor, including the Company’s disclosures under “Management’s Discussion and Analysis of Financial Condition and Results of Operations.” | |||||||
| This is complied with. The disclosure under “Management’s Discussion and analysis of Financial Condition and Results of Operations” is provided in Item 5 on Form 20-F filed with Securities and Exchange Commission (“SEC”) which is being circulated separately as an annexure to this Annual Report. | ||||||||
| (C) | discuss earnings press releases, as well as financial information and earnings guidance provided to analysts and rating agencies. | |||||||
| This is complied with. The Audit Committee reviews and discusses the earnings press releases, financial information and earnings guidance on a quarterly basis. | ||||||||
| (D) | discuss policies with respect to risk assessment and risk management. | |||||||
| The policies with respect to risk assessment and risk management as adopted by the Company are presented to the Committee and the Board for their review, from time to time. | ||||||||
| (E) | meet separately, periodically, with management, with internal auditors (or other personnel responsible for the internal audit function) and with independent auditors. | |||||||
| The Audit Committee to perform its functions effectively, meets separately with the Management, the Company’s Head of Internal Audit and the independent auditors of the Company on a quarterly basis. | ||||||||
| (F) | review with the independent auditor any audit problems or difficulties and management’s response. | |||||||
| This is complied with. The Audit Committee reviews the independent auditor’s functions, problems or difficulties including discussions of the responsibilities, on a quarterly basis. | ||||||||
| (G) | set clear hiring policies for employees or former employees of the independent auditors. | |||||||
| This is complied with. The Company has not employed any of the employees or former employees of the independent auditors. | ||||||||
| (H) | report regularly to the Board of Directors. | |||||||
| This is complied with. The Audit Committee submits its report on a quarterly basis to the full Board with respect to the performance and independence of the Company’s independent auditors, the performance of the Company’s internal audit team, quality or integrity of the Company’s financial statements, compliance with legal or regulatory requirements. | ||||||||
| (d) | Each listed Company must have an internal audit function. | |||||||
| The Company’s Internal Audit is an ISO 9001:2000 certified function. The Audit Committee reviews the audit observations of the Company’s Internal Audit department pertaining to various Business Units and discusses the same with the Management. | ||||||||
54
Table of Contents
WIPRO LIMITED
7 | Shareholders must be given the opportunity to vote on all stock option plans, except employment inducement options, option plans acquired through mergers and tax qualified plans such as ESOPs and 401(k)s. | |
| As per Indian law, all the ESOP Plans have been approved by the shareholders in the General Meeting of the Company and as such, this is being complied with. | ||
8 | Listed companies must adopt and disclose corporate governance guidelines | |
| A detailed and comprehensive Corporate Governance Guidelines of the Company along with charters of the Committees of the Board is made available on our website (www.wipro.com). Brief terms and reference of each of the Committees of the Board is given as part of our Annual Report. | ||
9 | Listed companies must adopt and disclose a code of business conduct and ethics for directors, officers and employees and promptly disclose any waivers of the code for directors or executive officers. | |
| The Company has adopted the Code of Business Conduct and Ethics for its Directors, Officers and Employees and the same is available in Company’s website (www.wipro.com). | ||
10 | Listed foreign private issuers must disclose any significant ways in which their corporate governance practices differ from those followed by domestic companies under NYSE listing standards. | |
| Even though the Company’s corporate governance home-country requirements differ from the NYSE, the Company’s corporate governance practices are in compliance with the NYSE listing standards. | ||
11(a) | Each listed company CEO must certify to the NYSE each year that he or she is not aware of any violation by the company of NYSE corporate governance listing standards. | |
| This is complied with. The certificate from the CEO is reproduced at the end of this report. | ||
11(b) | Each listed company CEO must promptly notify the NYSE in writing after any executive officer of the listed company becomes aware of any material non-compliance with any applicable provisions of this Section 303A. | |
| Till date, such a situation has never occurred. However, this has been incorporated as Company policy and will be duly done in case the need arises. |
ANNUAL CERTIFICATION BY CEO PURSUANT TO SECTION 303A. 12(a) OF THE NEW YORK STOCK EXCHANGE LISTED COMPANY MANUAL
As the Chief Executive Officer of Wipro Limited and as required by Section 303A.12(a) of the New York Stock Exchange Listed Company Manual, I hereby certify that as of the date hereof I am not aware of any violation by the Company of NYSE’s Corporate Governance listing standards, other than has been notified to the Exchange pursuant to Section 303A.12(b) and disclosed as an attachment hereto.
| Sd/- | ||
| Azim H. Premji | ||
| Chief Executive Officer | ||
| Date : April 16, 2004 |
55
Table of Contents
WIPRO LIMITED
INDEX TO FINANCIAL STATEMENTS
| Pages | ||||
| Financial Statements — Wipro Limited | ||||
| Auditors’ Report | 57-59 | |||
| Financial Statements | 60-84 | |||
| Financial Statements — Wipro Limited Consolidated | ||||
| Auditors’ Report | 85 | |||
| Financial Statements | 86-103 | |||
| Management Discussion & Analysis | 104-111 | |||
| Reconciliation of Profits between | ||||
| Indian GAAP and US GAAP | 112 | |||
56
Table of Contents
WIPRO LIMITED
AUDITORS’ REPORT
To the members of WIPRO LIMITED
We have audited the attached Balance Sheet of Wipro Limited, as at March 31, 2004 and also the Profit and Loss Account and the Cash Flow Statement for the year ended on that date annexed thereto. These financial statements are the responsibility of the Company’s management. Our responsibility is to express an opinion on these financial statements based on our audit.
We conducted our audit in accordance with auditing standards generally accepted in India. Those Standards require that we plan and perform the audit to obtain reasonable assurance about whether the financial statements are free of material misstatement. An audit includes examining, on a test basis, evidence supporting the amounts and disclosures in the financial statements. An audit also includes assessing the accounting principles used and significant estimates made by management, as well as evaluating the overall financial statement presentation. We believe that our audit provides a reasonable basis for our opinion.
As required by the Companies (Auditor’s Report) Order, 2003, (the Order) issued by the Central Government of India in terms of sub-section (4A) of Section 227 of the Companies Act, 1956, we enclose in the Annexure a statement on the matters specified in paragraphs 4 and 5 of the said Order.
Further to our comments in the Annexure referred to above, we report that :
| (i) | We have obtained all the information and explanations, which to the best of our knowledge and belief were necessary for the purposes of our audit; | |||
| (ii) | In our opinion, proper books of account as required by law have been kept by the Company so far as appears from our examination of those books; | |||
| (iii) | The Balance Sheet, Profit and Loss Account and Cash Flow Statement dealt with by this report are in agreement with the books of accounts; | |||
| (iv) | In our opinion, the Balance Sheet, Profit and Loss Account and Cash Flow Statement dealt with by this report comply with the accounting standards referred to in sub-section (3C) of Section 211 of the Companies Act, 1956; | |||
| (v) | On the basis of written representations received from the directors as on March 31, 2004 and taken on record by the Board of Directors, we report that none of the directors is disqualified as on March 31, 2004 from being appointed as a director in terms of Clause (g) of sub-section (1) of Section 274 of the Companies Act, 1956; | |||
| (vi) | In our opinion and to the best of our information and according to the explanations given to us, the said accounts give the information required by the Companies Act, 1956, in the manner so required and give a true and fair view in conformity with the accounting principles generally accepted in India : | |||
| (a) | In the case of the Balance Sheet, of the state of affairs of the Company as at 31st March, 2004; | |||
| (b) | In the case of Profit and Loss Account, of the Profit for the year ended on that date; and | |||
| (c) | In the case of Cash Flow Statement, of the cash flows for the year ended on that date. | |||
| for N.M. Raiji & Co., | ||
| Chartered Accountants | ||
| J.M. Gandhi | ||
| Partner | ||
| Mumbai, April 16, 2004. | Membership No.: 37924 |
57
Table of Contents
WIPRO LIMITED
Annexure to the Auditor’s report of even date to the Members of WIPRO LIMITED
| (i) | (a) | The Company has maintained proper records showing full particulars, including quantitative details and the situation of its fixed assets; | ||
| (b) | A major portion of fixed assets have been physically verified by the management during the year. In our opinion, the frequency of verification of the fixed assets by the management is reasonable having regard to the size of the Company and the nature of its assets. The discrepancies noticed have been properly dealt with in the books of account; | |||
| (c) | The assets disposed off during the year are not significant and therefore do not affect the going concern assumption; | |||
| (ii) | (a) | The inventory other than that with third parties have been physically verified by the management at reasonable intervals. There is a process of obtaining conformation in respect of inventory with the third parties; | ||
| (b) | In our opinion and according to the information and explanations given to us, the procedures for physical verification of inventory followed by the management were reasonable and adequate in relation to the size of the Company and the nature of its business; | |||
| (c) | In our opinion the Company has maintained proper records of inventory. The discrepancies between the physical stocks and the book stocks were not material and have been properly dealt with in the books of account; | |||
| (iii) | (a) | During the year, the Company has not granted any loans to parties listed in the register maintained under Section 301 of the Companies Act, 1956; | ||
| (b) | The Company had taken Intercorporate unsecured loans from one of its subsidiary Company during different time of the year aggregating Rs. 225,13 Million; | |||
| (c) | In our opinion, the rate of interest and other terms on which the said loan have been taken are not, prima facie, prejudicial to the interest of the Company; | |||
| (d) | The Company was regular in payment of principal amount and interest as per the terms of the said loan; | |||
| (e) | The amount of loan was fully repaid during the year; | |||
| (iv) | In our opinion and according to the information and explanations provided to us there are adequate internal control procedures commensurate with the size of the Company and the nature of its business with regard to purchase of inventory, fixed assets and for sale of goods. During the course of our audit, no major weakness has been noticed in the internal control; | |||
| (v) | (a) | Based on the audit procedures applied by us and according to the information and explanations provided by the management, we are of the opinion that the transactions that need to be entered into the register maintained under Section 301 have been properly entered in the said register; | ||
| (b) | In our opinion and according to the information and explanations given to us, the transactions entered in the registers maintained under Section 301 and exceeding during the year by Rupees five lakh in respect of each party have been made at prices which are reasonable having regard to prevailing market prices at the relevant time; | |||
| (vi) | The Company has not accepted any deposits from the public; | |||
| (vii) | The Company has a system of internal audit which, in our opinion, is commensurate with its size and nature of its business; | |||
| (viii) | We have broadly reviewed the books of accounts maintained by the Company pursuant to the rules made by the Central Government under Section 209(1) (d) of the Companies Act, 1956 for maintenance of Cost records in respect of Vanaspati, Soaps, Lighting and Electronic products and are of the opinion that, prima facie, the prescribed accounts and records have been made and maintained. We have not, however, made a detailed examination of the records with a view to determine whether they are accurate or complete; | |||
| (ix) | (a) | According to the records, information and explanations provided to us, the Company is generally regular in depositing with appropriate authorities undisputed amount of provident fund, investor education protection fund, employees’ state insurance, income-tax, sales-tax, wealth-tax, customs duty, excise duty, cess and other statutory dues applicable to it and no undisputed amounts payable were outstanding as at 31st March, 2004 for a period of more than six months from the date they became payable; | ||
| (b) | The following are the details of disputed Income Tax, Excise Duty, Customs Duty and Sales Tax that have not been paid to the concerned authorities; | |||
58
Table of Contents
WIPRO LIMITED
| NAME OF THE | UNPAID AMOUNT | |||||||
| STATUTORY DUES | FORUM WHERE DISPUTE IS PENDING | (Rs.'000s) | ||||||
| 01 | Income Tax | Commissioner of Income Tax (Appeals) | 266,207 | |||||
| The Company is in the process of filing | 2,314,568 | |||||||
| appeal. (As informed to us) | ||||||||
| 02 | Central Excise Duty | CESTAT (Tribunal) | 49,220 | |||||
| Commissioner of Central Excise (Appeals) | 28,510 | |||||||
| Assessing Officer/First Appellate Authority | 8,740 | |||||||
| 03 | Customs Duty | CESTAT (Tribunal) | 20,040 | |||||
| Assessing Officer/First Appellate Authority | 3,370 | |||||||
| 04 | Sales Tax | Supreme Court | 5,400 | |||||
| High Court | 820 | |||||||
| Sales Tax Tribunal | 61,290 | |||||||
| Assessing Officer/First Appellate Authority | 130,950 | |||||||
| (x) | The Company neither has accumulated losses at the end of the financial year nor has incurred cash losses during the year and in the immediately year preceding; | |
| (xi) | Based on our audit procedures and on the information and explanations given by the management, the Company has not defaulted in repayment of dues to any financial institution or bank; | |
| (xii) | Based on our examination and according to the information and explanations given to us, the Company has not granted loans and advances on the basis of security by way of pledge of shares, debentures and other securities; | |
| (xiii) | The Company is not a chit/nidhi/mutual benefit fund/society and clause xiii of the Order is not applicable. | |
| (xiv) | The Company is not dealing or trading in shares, securities, debentures and other investments; | |
| (xv) | On the basis of the information and explanations given to us the Company has not given any guarantee for loans taken by others from bank or financial institutions; | |
| (xvi) | There was no term loan outstanding during the year, except for intercorporate loans from one of its subsidiaries, which have been repaid before the year-end. The terms of the said intercorporate loans did not specify the purpose for which the loans were obtained. | |
| (xvii) | On the basis of our examination of the books of accounts and the information and explanation given to us, in our opinion, the funds raised on short-term basis have not been used for long-term investment and vice versa; | |
| (xviii) | During the year, the Company has not made any preferential allotment of shares to parties and companies covered in the Register maintained under Section 301 of the Act; | |
| (xix) | The Company did not have any outstanding debentures during the year; | |
| (xx) | The Company has not raised any money by public issues during the year; | |
| (xxi) | Based on the audit procedures performed and information and explanations given to us by the management, we report that no fraud on or by the Company has been noticed or reported during the course of our audit. |
| for N.M. Raiji & Co., | ||
| Chartered Accountants | ||
| J.M. Gandhi | ||
| Partner | ||
| Mumbai, April 16, 2004. | Membership No.: 37924 |
59
Table of Contents
WIPRO LIMITED
BALANCE SHEET
(Rs. in 000s)
| As of March 31, | ||||||||||
| Schedule | 2004 | 2003 | ||||||||
SOURCES OF FUNDS | ||||||||||
Shareholders’ funds | ||||||||||
| Share Capital | 1 | 465,519 | 465,128 | |||||||
| Share application money pending allotment | — | 1,222 | ||||||||
| Reserves and Surplus | 2 | 34,610,396 | 32,837,027 | |||||||
| 35,075,915 | 33,303,377 | |||||||||
Loan Funds | ||||||||||
| Secured loans | 3 | 947,466 | 525,562 | |||||||
| Unsecured loans | 4 | 59,408 | 171,885 | |||||||
| 1,006,874 | 697,447 | |||||||||
Total | 36,082,789 | 34,000,824 | ||||||||
APPLICATION OF FUNDS | ||||||||||
Fixed Assets | ||||||||||
| Goodwill | 85,542 | 85,263 | ||||||||
| Gross block | 5 | 13,251,222 | 11,531,835 | |||||||
| Less : Depreciation | 6,786,590 | 5,973,902 | ||||||||
Net Block | 6,550,174 | 5,643,196 | ||||||||
| Add : Capital work-in-progress and advances | 1,397,121 | 948,314 | ||||||||
| 7,947,295 | 6,591,510 | |||||||||
Investments | 6 | 24,560,332 | 14,407,161 | |||||||
Deferred tax assets(refer Note 14) | 315,533 | 303,004 | ||||||||
Current assets, loans and advances | ||||||||||
| Inventories | 7 | 1,020,791 | 773,718 | |||||||
| Sundry Debtors | 8 | 10,623,367 | 7,925,860 | |||||||
| Cash and Bank balances | 9 | 2,900,940 | 4,097,046 | |||||||
| Loans and advances | 10 | 5,523,442 | 6,576,774 | |||||||
| 20,068,540 | 19,373,398 | |||||||||
Current liabilities and provisions | ||||||||||
| Liabilities | 11 | 8,563,202 | 5,910,666 | |||||||
| Provisions | 12 | 8,245,709 | 763,583 | |||||||
| 16,808,911 | 6,674,249 | |||||||||
Net Current Assets | 3,259,629 | 12,699,149 | ||||||||
Total | 36,082,789 | 34,000,824 | ||||||||
| SIGNIFICANT ACCOUNTING POLICIES AND NOTES TO ACCOUNTS | 19 | |||||||||
| As per our Report attached | For and on behalf of the Board of Directors | |||||
for N.M. Raiji & Co., | Azim Hasham Premji | Vivek Paul | P. M. Sinha | |||
Chartered Accountants | Chairman and Managing Director | Vice Chairman and Executive Officer | Director | |||
J.M. Gandhi | Suresh C. Senapaty | V. Ramachandran | B. C. Prabhakar | |||
Partner | Corporate Executive Vice President – Finance | Company Secretary | Director | |||
| Mumbai, April 16, 2004 | Bangalore, April 16, 2004 | |||||
60
Table of Contents
WIPRO LIMITED
PROFIT AND LOSS ACCOUNT
(Rs. in 000s)
| Year ended March 31, | ||||||||||
| Schedule | 2004 | 2003 | ||||||||
INCOME | ||||||||||
| Gross Sales and Services | 51,881,933 | 40,402,929 | ||||||||
Less:Excise Duty | 555,128 | 554,755 | ||||||||
| Net Sales and Services | 51,326,805 | 39,848,174 | ||||||||
| Other Income | 13 | 1,269,922 | 1,184,237 | |||||||
| 52,596,727 | 41,032,411 | |||||||||
EXPENDITURE | ||||||||||
| Cost of goods sold | 14 | 34,200,968 | 25,523,282 | |||||||
| Selling, general and administrative expenses | 15 | 7,537,920 | 5,873,789 | |||||||
| Interest | 16 | 35,171 | 29,304 | |||||||
| 41,774,059 | 31,426,375 | |||||||||
PROFIT BEFORE TAXATION | ||||||||||
| Continuing Operations | 10,822,668 | 9,787,621 | ||||||||
| Discontinuing Operation | — | (181,585 | ) | |||||||
Total | 10,822,668 | 9,606,036 | ||||||||
PROVISION FOR TAXATION(refer Note 13) | ||||||||||
| Continuing Operations | 1,673,868 | 1,277,753 | ||||||||
| Discontinuing Operation | — | (66,733 | ) | |||||||
Total | 1,673,868 | 1,211,020 | ||||||||
PROFIT FOR THE PERIOD BEFORE | ||||||||||
EXTRA ORDINARY ITEMS | ||||||||||
| Continuing Operations | 9,148,800 | 8,509,868 | ||||||||
| Discontinuing Operation | — | (114,852 | ) | |||||||
Total | 9,148,800 | 8,395,016 | ||||||||
| Loss on discontinuance of ISP business | 18 | — | (352,195 | ) | ||||||
| Tax benefit on above | — | 89,503 | ||||||||
| Net loss on discontinuance of ISP business | — | (262,692 | ) | |||||||
PROFIT FOR THE PERIOD | 9,148,800 | 8,132,324 | ||||||||
Appropriations | ||||||||||
| Proposed Dividend | 931,039 | 232,564 | ||||||||
| Proposed One-Time Dividend | 5,818,979 | — | ||||||||
Total Dividend | 6,750,018 | 232,564 | ||||||||
| Tax on distribution of Dividend | 864,846 | 29,797 | ||||||||
| Transfer to general reserve | 1,533,936 | 7,869,963 | ||||||||
EARNINGS PER SHARE (EPS) — in Rs. | ||||||||||
Basic | ||||||||||
| On profit for the period from continuing operations | 39.56 | 36.81 | ||||||||
| On losses of discontinued ISP business | — | (0.50 | ) | |||||||
| On extraordinary items | — | (1.14 | ) | |||||||
| On profit for the period | 39.56 | 35.17 | ||||||||
Diluted | ||||||||||
| On profit for the period from continuing operations | 39.52 | 36.75 | ||||||||
| On losses of discontinued ISP business | — | (0.50 | ) | |||||||
| On extraordinary items | — | (1.13 | ) | |||||||
| On profit for the period | 39.52 | 35.12 | ||||||||
Number of shares for calculating EPS | ||||||||||
| Basic | 231,290,130 | 231,204,326 | ||||||||
| Diluted | 231,515,107 | 231,572,448 | ||||||||
| SIGNIFICANT ACCOUNTING POLICIES AND NOTES TO ACCOUNTS | 19 | |||||||||
| As per our Report attached | For and on behalf of the Board of Directors | |||||
for N.M. Raiji & Co., | Azim Hasham Premji | Vivek Paul | P. M. Sinha | |||
Chartered Accountants | Chairman and Managing Director | Vice Chairman and Executive Officer | Director | |||
J.M. Gandhi | Suresh C. Senapaty | V. Ramachandran | B. C. Prabhakar | |||
Partner | Corporate Executive Vice President – Finance | Company Secretary | Director | |||
| Mumbai, April 16, 2004 | Bangalore, April 16, 2004 | |||||
61
Table of Contents
WIPRO LIMITED
(Rs. in 000s, except share numbers)
| As of March 31, | ||||||||
| 2004 | 2003 | |||||||
SCHEDULE 1 SHARE CAPITAL | ||||||||
Authorised | ||||||||
| 375,000,000 (2003 : 375,000,000) equity shares of Rs. 2 each | 750,000 | 750,000 | ||||||
| 25,000,000 (2003 : 25,000,000) 10.25% Redeemable Cumulative Preference Shares of Rs. 10 each | 250,000 | 250,000 | ||||||
| 1,000,000 | 1,000,000 | |||||||
Issued, subscribed and paid-up | ||||||||
| 232,759,152 (2003 : 232,563,992) equity shares of Rs. 2 each | 465,519 | 465,128 | ||||||
| 465,519 | 465,128 | |||||||
Notes:
Of the above equity shares :
| i) | 226,905,825 equity shares (2003 : 226,905,825) have been allotted as fully paid bonus shares by capitalisation of Share Premium of Rs. 32,639 and General Reserves of Rs. 421,173. | |
| ii) | 1,325,525 equity shares (2003 : 1,325,525) have been allotted as fully paid-up, pursuant to a scheme of amalgamation, without payment being received in cash. | |
| iii) | 3,162,500 shares representing 3,162,500 American Depository Receipts issued during 2000-2001 pursuant to American Depository offering by the Company. | |
| iv) | 449,302 (2003 : 254,142) equity shares issued pursuant to Wipro Employee Stock Option Plan. |
SCHEDULE 2 RESERVES AND SURPLUS
| As of April | As of March | |||||||||||||||||
| 1, 2003 | Additions | Deductions | 31, 2004 | |||||||||||||||
Capital Reserves | 9,500 | — | — | 9,500 | ||||||||||||||
| 9,500 | — | — | 9,500 | |||||||||||||||
Capital Redemption Reserve | 250,038 | — | — | 250,038 | ||||||||||||||
| 250,038 | — | — | 250,038 | |||||||||||||||
Share Premium | 6,492,847 | 239,433 | (a) | — | 6,732,280 | |||||||||||||
| 6,386,235 | 106,612 | — | 6,492,847 | |||||||||||||||
General Reserve | 26,084,642 | 1,533,936 | (b) | — | 27,618,578 | |||||||||||||
| 18,214,678 | 7,869,964 | — | 26,084,642 | |||||||||||||||
| 32,837,027 | 1,773,369 | — | 34,610,396 | |||||||||||||||
| 24,860,451 | 7,976,576 | — | 32,837,027 | |||||||||||||||
| Corresponding figures for 2003 are given below current year’s figures | ||
| a) | Rs. 239,433 (2003 : 106,612) pursuant to issue of shares under Wipro Employee Stock Option Plan. | |
| b) | Transfer of profit from Profit and Loss account Rs. 1,533,936 (2003 : Rs. 7,869,963). | |
62
Table of Contents
WIPRO LIMITED
(Rs. in 000s)
| As of March 31, | ||||||||||
| Note | ||||||||||
| SCHEDULE 3 SECURED LOANS | Reference | 2004 | 2003 | |||||||
From Banks | ||||||||||
| Cash credit facility | (a) | 945,791 | 495,687 | |||||||
From Financial Institutions | ||||||||||
| Asset Credit Scheme | (b) | — | 28,200 | |||||||
Development loan from Karnataka Government | (c) | 1,675 | 1,675 | |||||||
| 947,466 | 254,872 | |||||||||
| Notes : | ||
| (a) | Secured by hypothecation of stock-in trade, book debts, stores and spares, and secured / to be secured by a second mortgage over certain immovable properties. | |
| (b) | Secured by hypothecation of specific machinery/assets. | |
| (c) | Secured by apari-passusecond mortgage over immovable properties at Mysore and hypothecation of movable properties other than inventories, book debts and specific equipments referred to in Note (a) above. | |
| As of March 31, | ||||||||
| SCHEDULE 4 UNSECURED LOANS | 2004 | 2003 | ||||||
| Loan from Subsidiary | — | 153,297 | ||||||
Other Loans and Advances | ||||||||
| Interest free loan from state government | 58,158 | 17,338 | ||||||
| Loans from state financial institutions | 1,250 | 1,250 | ||||||
| 59,408 | 171,885 | |||||||
63
Table of Contents
WIPRO LIMITED
| SCHEDULE 5 FIXED ASSETS | (Rs. in 000s) |
| Particulars | GROSS BLOCK | PROVISION FOR DEPRECIATION | NET BLOCK | |||||||||||||||||||||||||||||||||||||
| As on | As on | As on | Depreciation | As on | As on | As on | ||||||||||||||||||||||||||||||||||
| April 1, | Deductions/ | March 31, | April 1, | for the | Deductions/ | March 31, | March 31, | March 31, | ||||||||||||||||||||||||||||||||
| 2003 | Additions | adjustments | 2004 | 2003 | period | adjustments | 2004 | 2004 | 2003 | |||||||||||||||||||||||||||||||
| Land | 742,136 | 186,385 | 187,000 | 741,521 | 9,047 | 3,537 | — | 12,584 | 728,937 | 733,089 | ||||||||||||||||||||||||||||||
| Buildings | 1,883,998 | 669,996 | — | 2,553,994 | 118,416 | 40,949 | — | 159,365 | 2,394,629 | 1,765,582 | ||||||||||||||||||||||||||||||
| Railway siding | 12 | — | — | 12 | 12 | — | — | 12 | — | — | ||||||||||||||||||||||||||||||
| Plant and Machinery | 6,815,459 | 1,174,589 | 671,485 | 7,318,563 | 4,776,613 | 1,059,916 | 636,365 | 5,200,164 | 2,118,399 | 2,038,846 | ||||||||||||||||||||||||||||||
| Furniture, fixtures and equipment | 1,520,658 | 339,370 | 44,886 | 1,815,142 | 800,369 | 271,021 | 35,230 | 1,036,160 | 778,982 | 720,289 | ||||||||||||||||||||||||||||||
| Vehicles | 559,194 | 253,000 | 52,273 | 759,921 | 259,067 | 134,466 | 31,698 | 361,835 | 398,086 | 300,127 | ||||||||||||||||||||||||||||||
| Technical Know-how | 10,378 | — | — | 10,378 | 10,378 | — | — | 10,378 | — | — | ||||||||||||||||||||||||||||||
| Patent & Trademark | — | 51,691 | — | 51,691 | — | 6,092 | — | 6,092 | 45,599 | — | ||||||||||||||||||||||||||||||
| Total | 11,531,835 | 2,675,031 | 955,644 | 13,251,222 | 5,973,902 | 1,515,981 | 703,293 | 6,786,590 | 6,464,632 | 5,557,933 | ||||||||||||||||||||||||||||||
| March 31, 2003 | 9,615,514 | 2,234,762 | 318,441 | 11,531,835 | 4,503,870 | 1,683,527 | 213,495 | 5,973,902 | 5,557,933 | 5,111,644 | ||||||||||||||||||||||||||||||
| a. | Land includes leasehold land Rs. 9,978 (2003 : Rs. 9,978) | |||
| b. | Buildings : | |||
| i) | Includes shares worth Rs. 2 (2003 : Rs. 2), | |||
| ii) | Includes leasehold land/property Rs. 4,241 (2003 : Rs. 4,241) and | |||
| iii) | Is net of depreciation during construction period. | |||
64
Table of Contents
WIPRO LIMITED
SCHEDULE 6 INVESTMENTS
| (Rs. in 000s except share numbers and face value) | As of March 31, | |||||||||||||||
| All shares are fully paid up unless otherwise stated | Number | Face value | 2004 | 2003 | ||||||||||||
Investments — Long Term (at cost) | ||||||||||||||||
Investments in subsidiary companies | ||||||||||||||||
Unquoted | ||||||||||||||||
Equity Shares | ||||||||||||||||
| Wipro Consumer Care Ltd. | 50,000 | Rs. | 10 | 500 | — | |||||||||||
| Wipro Chandrika Ltd. | 50,000 | Rs. | 10 | 500 | 500 | |||||||||||
| Wipro Trademarks Holding Ltd. | 50,000 | Rs. | 10 | 500 | 500 | |||||||||||
| Wipro Travel Services Ltd. | 66,171 | Rs. | 10 | 662 | 662 | |||||||||||
| Wipro Healthcare IT Ltd. | 3,410,002 | Rs. | 10 | 243,878 | 243,878 | |||||||||||
| Wipro Spectramind Services Ltd. | 22,839,145 | Rs. | 10 | 1,234,640 | 1,234,640 | |||||||||||
| Wipro Fluid Power Ltd. | 9,047,600 | Rs. | 10 | 102,965 | 102,965 | |||||||||||
| Wipro Holding Mauritius Ltd. | 27,600,000 | $ | 0.01 | 1,040,890 | 132,440 | |||||||||||
| Wipro Inc., USA | 8,800 | $ | 2,500 | 796,613 | 1,040,890 | |||||||||||
| Wipro Japan KK, Japan | 650 | JPY | 50,000 | 9,738 | 9,738 | |||||||||||
| 2,766,713 | 2,766,213 | |||||||||||||||
Preference Shares | ||||||||||||||||
| 9% cumulative redeemable preference shares held in Wipro Trademarks Holding Ltd. | 1,800 | Rs. | 10 | 18 | 18 | |||||||||||
| Spectramind Ltd., Bermuda (zero coupon, non-redeemable convertible series A preferred shares) | 963,092,931 | $ | 0.01 | 3,384,172 | 3,384,172 | |||||||||||
| 1% cumulative redeemable preference shares in Wipro Fluid Power Ltd. | 3,600,000 | Rs. | 10 | 360,000 | 360,000 | |||||||||||
| 3,744,190 | 3,744,190 | |||||||||||||||
Investments in equity shares of other companies - - Unquoted | ||||||||||||||||
| Wipro GE Medical Systems Private Ltd. # | 4,900,000 | Rs. | 10 | 49,000 | 49,000 | |||||||||||
| WeP Peripherals Ltd. (1,600,000 shares acquired during the year on conversion of debentures) | 7,060,000 | Rs. | 10 | 94,600 | — | |||||||||||
| — | 94,600 | |||||||||||||||
| 143,600 | 143,600 | |||||||||||||||
Quoted | ||||||||||||||||
Trade Investments | ||||||||||||||||
| Dynamatic Technologies Ltd. | 100 | Rs. | 10 | 1 | 1 | |||||||||||
| HDFC Bank Ltd. | 100 | Rs. | 10 | 1 | 1 | |||||||||||
| 2 | 2 | |||||||||||||||
Other Investments (unquoted) | ||||||||||||||||
| Indira Vikas Patra (maturity value Rs. 66,003) | — | 47,952 | ||||||||||||||
Investments – short term: in money market mutual funds | ||||||||||||||||
| IL& FS (10,000,000 units purchased during the year) | 56,263,256 | 562,633 | — | |||||||||||||
| Alliance Capital Mutual Fund (7,647,786 units purchased/58,950,157 units redeemed during the year) | 50,518,508 | 505,185 | — | |||||||||||||
| Pioneer ITI Mutual Fund (1,780,269 units redeemed during the year) | — | — | 741,000 | |||||||||||||
| Prudential ICICI Mutual Fund (85,157,070 units purchased/116,005,739 units redeemed during the year) | 197,331,461 | 2,260,388 | 1,458,900 | |||||||||||||
| HDFC Mutual Fund (55,704,904 units purchased/43,791,944 units redeemed during the year) | 229,134,103 | 2,602,873 | 1,424,000 | |||||||||||||
| Standard Chartered Mutual Fund (60,983,216 units purchased/49,945,186 units redeemed during the year) | 199,548,451 | 2,066,527 | 1,007,400 | |||||||||||||
| Reliance Mutual Fund (57,400,291 units purchased/30,786,241 units redeemed during the year) | 142,912,339 | 1,765,375 | 626,100 | |||||||||||||
| Zurich India Mutual Fund (437,506,511 units redeemed during the year) | — | — | 515,900 | |||||||||||||
| Templeton TMA (271,953 units purchased/507,906 units redeemed during the year) | 1,315,500 | 1,576,416 | — | |||||||||||||
| Templeton Floating Fund (4,298,023 units purchased during the year) | 15,769,491 | 157,790 | — | |||||||||||||
| Franklin Templeton India Mutual Fund (9,371,984 units purchased during the year) | 9,572,369 | 100,846 | 252,800 | |||||||||||||
| Deutsche MF (22,784,585 units purchased/40,996,946 units redeemed during the year) | 57,186,134 | 577,797 | — | |||||||||||||
| ING (4,660,879 units purchased/5,106,683 units redeemed during the year) | 34,182,141 | 367,940 | — | |||||||||||||
| CAN MF Liquid (23,151,167 units purchased during the year) | 49,710,053 | 499,253 | — | |||||||||||||
| Sundaram (16,996,339 units purchased) | 17,079,320 | 172,337 | — | |||||||||||||
| Cholamandalam Mutual Fund (11,000,000 units purchased during the year) | 17,647,075 | 176,571 | — | |||||||||||||
| Kotak Mutual Fund (21,884,021 units purchased/13,422,231 units redeemed during the year) | 114,719,682 | 1,317,544 | 541,500 | |||||||||||||
| J M Mutual Fund (86,955,245 units purchased/102,748,768 units redeemed during the year) | 140,373,121 | 1,406,290 | 361,300 | |||||||||||||
65
Table of Contents
WIPRO LIMITED
(Rs. in 000s)
| As of March 31, | ||||||||||||||||
| Number | Face value | 2004 | 2003 | |||||||||||||
| DSP Merrill Lynch Mutual Fund (44,524,705 units purchased/62,922,332 units redeemed during the year) | 45,887,314 | 459,332 | 182,500 | |||||||||||||
| SBI Insta Cash (5,125,144 units purchased during the year) | — | 63,000 | ||||||||||||||
| Birla Mutual Fund (17,051,388 units purchased/10,245,680 units redeemed during the year) | 136,478,004 | 1,438,896 | 639,000 | |||||||||||||
| 18,014,023 | 7,813,400 | |||||||||||||||
Total | 24,668,528 | 14,515,357 | ||||||||||||||
| Less : Provision for diminution in value of long term investments | 108,196 | 108,196 | ||||||||||||||
Total | 24,560,332 | 14,407,161 | ||||||||||||||
| Aggregate book value of quoted investments | 2 | 2 | ||||||||||||||
| Aggregate book value of unquoted investments (net of provision) | 6,546,307 | 6,701,955 | ||||||||||||||
| Aggregate market value of quoted investments and investments in mutual funds | 18,038,438 | 7,821,830 | ||||||||||||||
Notes : | ||||||||||||||||
| # | Equity investments in this Company carry certain restrictions on transfer of shares that are normally provided for in joint venture Agreement. |
SCHEDULE 7 INVENTORIES | ||||||||||||||||
| Stores and Spares | 21,186 | 18,774 | ||||||||||||||
| Raw Materials | 458,352 | 331,572 | ||||||||||||||
| Stock-in-process | 38,009 | 14,921 | ||||||||||||||
| Finished goods | 503,244 | 408,451 | ||||||||||||||
| 1,020,791 | 773,718 | |||||||||||||||
| Basis of stock valuation : | ||||||||||||||||
| Raw materials, stock-in-process and stores and spares at or below cost. | ||||||||||||||||
| Finished products at cost or net realisable value, whichever is lower. | ||||||||||||||||
SCHEDULE 8 SUNDRY DEBTORS | ||||||||||||||||
(Unsecured) | ||||||||||||||||
Over Six Months | ||||||||||||||||
| Considered good | 480,670 | 624,773 | ||||||||||||||
| Considered doubtful | 687,038 | 624,854 | ||||||||||||||
| 1,167,708 | 1,249,627 | |||||||||||||||
Others | ||||||||||||||||
| Considered good | 10,142,697 | 7,301,087 | ||||||||||||||
| Considered doubtful | — | — | ||||||||||||||
| 10,142,697 | 7,301,087 | |||||||||||||||
| Less: Provision for doubtful debts | 687,038 | 624,854 | ||||||||||||||
| 10,623,367 | 7,925,860 | |||||||||||||||
66
Table of Contents
WIPRO LIMITED
(Rs. in 000s)
| As of March 31, | ||||||||
| 2004 | 2003 | |||||||
SCHEDULE 9 CASH AND BANK BALANCES | ||||||||
Cash and cheques on hand | 207,841 | 486,113 | ||||||
| Balances with scheduled banks | ||||||||
| On Current account | 539,412 | 144,833 | ||||||
| In Deposit account | 84 | 1,417,685 | ||||||
Balances with other banks in current account | ||||||||
| Midland Bank | 437,758 | 428,915 | ||||||
| Wells Fargo | 1,602,226 | 1,571,116 | ||||||
| Nations Bank | 5,653 | — | ||||||
| RABO Bank | 1,678 | — | ||||||
| Bank of Montreal | (3,812 | ) | — | |||||
| Standchart UAE | 969 | — | ||||||
| Saudi British Bank | 24,174 | — | ||||||
| Bank of America | 84,957 | 44,068 | ||||||
| Standard Chartered Bank | — | 312 | ||||||
| Shanghai Commercial and Savings Bank | — | 1,181 | ||||||
| Southtrust Bank | — | 2,800 | ||||||
| Great Western Bank | — | 23 | ||||||
| 2,900,940 | 4,097,046 | |||||||
| Maximum balances during the year | ||||||||
| Midland Bank | 437,758 | 780,682 | ||||||
| Wells Fargo | 3,567,801 | 2,396,512 | ||||||
| Nations Bank | 5,653 | 97,627 | ||||||
| Deutsche Bank | — | 487,942 | ||||||
| Societe General | — | 460,378 | ||||||
| Bank of America | 183,999 | 97,397 | ||||||
| Bank of Montreal | 39,177 | — | ||||||
| Standard Chartered Bank | — | 5,276 | ||||||
| Shanghai Commercial and Savings Bank | — | 3,655 | ||||||
| RABO Bank | 1,678 | — | ||||||
| Saudi British Bank | 24,174 | — | ||||||
| South trust Bank | — | 2,800 | ||||||
| First Chicago | — | 976 | ||||||
| Standchart UAE | 6,344 | — | ||||||
| Citibank | — | 1,952 | ||||||
| FCC National Bank | — | 976 | ||||||
| Chase Manhattan | — | 1,025 | ||||||
| Great Western Bank | — | 24 | ||||||
SCHEDULE 10 LOANS AND ADVANCES | ||||||||
| (Unsecured, considered good unless otherwise stated) | ||||||||
| Advances recoverable in cash or in kind or for value to be received | ||||||||
| Considered good | 2,680,880 | 1,516,880 | ||||||
| Considered doubtful | 74,819 | 71,236 | ||||||
| 2,755,699 | 1,588,116 | |||||||
| Less : Provision for doubtful advances | 74,819 | 71,236 | ||||||
| 2,680,880 | 1,516,880 | |||||||
| Certificate of deposits with foreign banks | — | 2,463,056 | ||||||
| Inter Corporate Deposits: GE Capital Services India | — | 214,300 | ||||||
| Other Deposits (refer Note below) | 683,033 | 540,492 | ||||||
| Advance income-tax (net of provision) | 587,742 | 753,072 | ||||||
| Balances with excise and customs | 25,247 | 10,402 | ||||||
| Unbilled Services | 1,546,540 | 1,078,572 | ||||||
| 5,523,442 | 6,576,774 | |||||||
Note :
Other Deposits include Rs. 25,000 (2003 : Rs. 25,000) security deposits for premises with a firm in which a director is interested.
67
Table of Contents
WIPRO LIMITED
(Rs. in 000s)
| As of March 31, | ||||||||
| SCHEDULE 11 LIABILITIES | 2004 | 2003 | ||||||
| Sundry Creditors | 2,525,662 | 1,982,509 | ||||||
| Unclaimed dividends | 1,491 | 1,588 | ||||||
| Advances from customers | 870,309 | 737,093 | ||||||
| Other liabilities | 4,461,427 | 2,488,415 | ||||||
| Unbilled services | 363,330 | 359,902 | ||||||
| Interest accrued but not due on loans | — | 176 | ||||||
| Other deposits | 340,983 | 340,983 | ||||||
| 8,563,202 | 5,910,666 | |||||||
SCHEDULE 12 PROVISIONS | ||||||||
| Employee retirement benefits | 630,845 | 501,222 | ||||||
| Proposed dividend | 931,039 | 232,564 | ||||||
| Proposed one-time dividend | 5,818,979 | — | ||||||
| Tax on proposed dividend | 864,846 | 29,797 | ||||||
| 8,245,709 | 763,583 | |||||||
| Year ended March 31, | ||||||||
| SCHEDULE 13 OTHER INCOME | 2004 | 2003 | ||||||
| Dividend from mutual funds | 783,129 | 69,737 | ||||||
| Interest on debt instruments and others | 20,300 | 168,127 | ||||||
| Interest on Income Tax refund | — | 54,120 | ||||||
| Rental Income | 45,030 | 25,266 | ||||||
| Profit on Sale of Investments | — | 413,247 | ||||||
| Profit on disposal of fixed assets (refer Note 7) | 108,246 | 7,121 | ||||||
| Difference in exchange (refer Note 10) | 229,004 | 273,135 | ||||||
| Brand fees | 22,050 | 53,016 | ||||||
| Royalty | — | 19,000 | ||||||
| Provision no longer required written back | 30,116 | 65,757 | ||||||
| Miscellaneous Income | 32,047 | 35,711 | ||||||
| 1,269,922 | 1,184,237 | |||||||
| Tax deducted at source Rs. 74,747 (2003 : Rs. 119,430) | ||||||||
SCHEDULE 14 COST OF GOODS SOLD | ||||||||
| Raw materials, Finished and Process Stocks (refer Schedule 17) | 8,208,673 | 7,243,025 | ||||||
| Stores and Spares | 159,304 | 136,405 | ||||||
| Power and Fuel | 359,061 | 288,409 | ||||||
| Salaries, wages and bonus | 6,439,010 | 4,795,355 | ||||||
| Contribution to provident and other funds | 253,177 | 173,360 | ||||||
| Gratuity and pension | 283,417 | 168,350 | ||||||
| Workmen and Staff welfare | 212,830 | 138,927 | ||||||
| Insurance | 74,402 | 20,308 | ||||||
| Repairs to factory buildings | 12,921 | 9,593 | ||||||
| Repairs to Plant & Machinery | 427,933 | 408,531 | ||||||
| Rent | 185,954 | 173,409 | ||||||
| Rates and Taxes | 11,533 | 25,801 | ||||||
| Packing | 94,805 | 82,661 | ||||||
| Travelling and allowances | 13,057,302 | 8,594,381 | ||||||
| Depreciation | 1,201,342 | 1,011,906 | ||||||
| Technical fees | 4,848 | 71,975 | ||||||
| Miscellaneous | 3,354,404 | 2,336,881 | ||||||
| Less: Capitalized (refer Note 12) | (139,948 | ) | (155,995 | ) | ||||
| 34,200,968 | 25,523,282 | |||||||
68
Table of Contents
WIPRO LIMITED
(Rs. in 000s)
| Year ended March 31, | ||||||||||||
| 2004 | 2003 | |||||||||||
| SCHEDULE 15 SELLING, GENERAL AND ADMINISTRATIVE EXPENSES | ||||||||||||
| Salaries, wages and bonus | 1,179,855 | 947,156 | ||||||||||
| Contribution to provident and other funds | 37,632 | 29,659 | ||||||||||
| Gratuity and pension | 49,169 | 31,093 | ||||||||||
| Workmen and Staff welfare | 189,317 | 140,801 | ||||||||||
| Insurance | 21,492 | 10,337 | ||||||||||
| Repairs to buildings | 5,555 | 3,943 | ||||||||||
| Rent | 104,686 | 117,496 | ||||||||||
| Rates and taxes | 54,552 | 64,624 | ||||||||||
| Carriage and freight | 114,164 | 85,893 | ||||||||||
| Commission on sales | 89,497 | 56,977 | ||||||||||
| Auditors’ remuneration and expenses | ||||||||||||
| Audit fees | 4,500 | 4,515 | ||||||||||
| For certification including tax audit | 900 | 1,297 | ||||||||||
| Reimbursement of expenses | 250 | 472 | ||||||||||
| Advertisement and sales promotion | 566,547 | 397,120 | ||||||||||
| Loss on sale of fixed assets | 6,791 | 6,335 | ||||||||||
| Directors’ fees | 188 | 128 | ||||||||||
| Depreciation | 314,639 | 367,543 | ||||||||||
| Travelling and allowances | 3,226,027 | 2,585,642 | ||||||||||
| Communication | 135,446 | 209,272 | ||||||||||
| Provision/write off of bad debts | 114,374 | 209,506 | ||||||||||
| Loss/Diminution in value of investments (mutual fund units) | 47,518 | — | ||||||||||
| Loss on sale of Investments | 244,277 | — | ||||||||||
| Miscellaneous | 1,030,544 | 603,980 | ||||||||||
| 7,537,920 | 5,873,789 | |||||||||||
| SCHEDULE 16 INTEREST | ||||||||||||
| On fixed loans | 8,767 | 6,022 | ||||||||||
| Other | 26,403 | 23,282 | ||||||||||
| 35,170 | 29,304 | |||||||||||
| SCHEDULE 17 RAW MATERIALS, FINISHED AND PROCESS STOCKS | ||||||||||||
| Consumption of raw materials and bought out components | ||||||||||||
| Opening stocks | 331,572 | 400,569 | ||||||||||
| Add : Purchases | 5,011,446 | 4,142,161 | ||||||||||
| Less : Closing stocks | 458,352 | 331,572 | ||||||||||
| 4,884,666 | 4,211,158 | |||||||||||
| Purchase of finished products for sale | 3,441,888 | 3,130,527 | ||||||||||
| (Increase)/decrease in finished and process stocks | ||||||||||||
| Opening stock | : In process | 14,921 | 21,344 | |||||||||
| : Finished products | 408,451 | 303,368 | ||||||||||
| Less : Closing stocks | : In process | 38,009 | 14,921 | |||||||||
| : Finished products | 503,244 | 408,451 | ||||||||||
| (117,881 | ) | (98,660 | ) | |||||||||
| 8,208,673 | 7,243,025 | |||||||||||
| SCHEDULE 18 NON-RECURRING/EXTRAORDINARY ITEMS | ||||||||||||
| Loss of discontinued ISP business | — | 352,195 | ||||||||||
| — | 352,195 | |||||||||||
69
Table of Contents
WIPRO LIMITED
SCHEDULE 19 SIGNIFICANT ACCOUNTING POLICIES
Accounting convention
Accounts are maintained on an accrual basis under the historical cost convention.
Revenue recognition
| • | Sales include applicable sales tax unless separately charged, and are net of discounts | |||
| • | Sales are recognized on despatch, except in the following cases : | |||
| – | Consignment sales are recognized on receipt of statement of account from the agent | |||
| – | Sales, which are subject to detailed acceptance tests, revenue is reckoned based on milestones for billing, as provided in the contracts | |||
| – | Revenue from software development services includes revenue from time and material and fixed price contracts. Revenue from time and material contracts are recognized as related services are performed. Revenue on fixed price contracts is recognized in accordance with percentage of completion method of accounting | |||
| • | Export incentives are accounted on accrual basis and include estimated realizable values/benefits from special import licenses and Advance licenses | |||
| • | Agency commission is accrued on shipment of consignment by principal | |||
| • | Maintenance revenue is considered on acceptance of the contract and is accrued over the period of the contract | |||
| • | Other income is recognized on accrual basis. | |||
Fixed Assets and Depreciation
Fixed assets were revalued in March 1997. In January 2002 the revaluation reserves were reversed against the carrying value of fixed assets. Consequently fixed assets are now stated at historical costs less depreciation.
Interest on borrowed money allocated to and utilized for fixed assets, pertaining to the period up to the date of capitalization and other revenue expenditure incurred on new projects is capitalized. Assets acquired on hire purchase are capitalized at the gross value and interest thereon is charged to Profit and Loss account. Renewals and replacement are either capitalized or charged to revenue as appropriate, depending upon their nature and long term utility.
In respect of leased assets, lease rentals payable during the year is charged to Profit and Loss account.
Depreciation is provided on straight line method at rates specified in Schedule XIV to the Companies Act, 1956, except on data processing equipment and software, furniture and fixture, office equipment, electrical installations (other than those at factories) and vehicles for which commercial rates are applied. Technical know-how is amortized over six years.
Intangible Assets
Intangible assets are stated at cost less accumulated amortization. Intangible assets are amortized over their estimated useful life ranging between 5 years and 20 years.
Goodwill
The goodwill arising on acquisition is not being amortised. It is tested for impairment on a periodic basis and written off if found impaired.
Investments
Long term Investments are stated at cost and short term investments are valued at lower of cost and net realizable value. Diminution in value is provided for where the management is of the opinion that the diminution is of permanent nature.
Inventories
Finished goods are valued at cost or net realizable value, whichever is lower. Other inventories are valued at cost less provision for obsolescence. Small value tools and consumables are charged to consumption on purchase.
Provision for retirement benefits
For employees covered under group gratuity scheme of LIC, gratuity charged to Profit and Loss account is on the basis of premium demanded by LIC. Provision for gratuity (for certain category of employees) and leave benefit for employee’s is determined as per actuarial valuation at the year-end. Defined contributions for provident fund and pension are charged to the Profit and Loss account based on contributions made in terms of applicable schemes, after netting off the amounts rendered surplus on account of employees separated from the Company. Certain categories of employees are entitled to pension benefits which are determined based on factors like years of services and cumulative basic salary. The Company has provided for the liability based on an actuarial valuation. The compensation paid if any, on voluntary retirement to the employees is charged off as an expense in the year of incurrence.
Deferred Tax
Tax expenses charged to Profit and Loss account is after considering deferred tax impact for the timing difference between accounting income and tax income. Deferred tax assets are recognized when there is a reasonable certainty that they will be realized. Deferred tax asset relating to unabsorbed business losses are recognized when there is a virtual certainty that there will be sufficient taxable profits to utilize them.
70
Table of Contents
WIPRO LIMITED
Foreign currency transactions
Foreign currency transactions are recorded at the spot rate at the beginning of the concerned month. Period-end balances of foreign currency assets and liabilities are restated at the closing rate/forward contract rate, as applicable. Resultant differences in respect of liabilities relating to acquisition of fixed assets are capitalized. Other differences on restatement or payment are adjusted to revenue account.
The forward premium/discount on forward contracts is recognized over the life of the contract. Forward premium is worked out based on the spot rate and contract rate on the date of transaction. Gain if any in respect of forward/options contract on account of movement in spot rate of the currency, is recognized only at the expiry of the contract.
In respect of non-integral operations assets and liabilities are translated at the exchange rate prevailing at the date of the balance sheet. The items in the profit & loss account are translated at the average exchange rate during the period. The differences arising out of the translation are included in translation reserve.
Research and Development
Revenue expenditure on research and development is charged to Profit and Loss account and capital expenditure is shown as addition to fixed assets.
NOTES TO ACCOUNTS
(All figures are reported in rupees thousands, except data relating to share or unless stated otherwise)
| 1. | i) | The Company has provided depreciation at the rates specified in Schedule XIV to the Companies Act, 1956, except in cases of the following assets, which are depreciated at commercial rates, which are higher than the rates specified in Schedule XIV. Depreciation over the years is provided up to total cost of assets. |
| Depreciation rate | Per Schedule | |||
| applied | XIV | |||
| Class of Asset | % | % | ||
| Data Processing equipment & Software | 50.00 | 16.21 | ||
| Plant & Machinery of ISP business | 20.00 | 16.21 | ||
| Furniture and fixtures | 19.00 | 6.33 | ||
| Electrical Installations | 19.00 | 4.75 | ||
| Office equipment | 19.00 | 4.75 | ||
| Vehicles | 24.00 | 9.50 | ||
| Plant and Machinery | 4.75 | 4.75 |
| ii) | Depreciation at 100% have been provided on assets costing less than Rs. 5. |
| 2. | Estimated amount of contracts remaining to be executed on Capital account and not provided for is Rs. 529,111. (2003 : Rs. 321,410) | |||
| 3. | Contingent liabilities in respect of : | |||
| i) | Disputed demands for excise duty, customs duty, income tax, sales tax and other matters Rs. 3,350,813 (2003: Rs. 1,013,180) | |||
| ii) | Guarantees given by Banks on behalf of the Company Rs. 1,073,154 (2003: Rs. 862,532) | |||
| 4. | In May 2003, the Company acquired Nervewire Inc. a Massachusetts based business and IT consulting company, serving customers in the financial services sector, for a consideration of Rs. 791,038. In addition to that, at the time of acquisition the company has decided to restructure certain lease agreement entered into by Nervewire and in the process has made a provision for the estimated liability of Rs. 86,953. The amount of this liability is also considered in cost of acquisition. | |||
| 5. | In April 2003, the Company acquired Glucovita brand from Hindustan Lever Limited at a cost of Rs. 26,690, and also paid further Rs. 25,000 for non-compete agreement. Based on the performance of various other established brands in the market of similar products, the company estimates that the useful life of the brand is 20 years and the cost of the brand is accordingly amortized over 20 years. Payment for non-compete agreement is amortized over the period of agreement. | |||
| 6. | The Company has re-estimated the economic life of moulds and dies to a lesser period and consequent to that with effect from 1st April 2003 moulds and dies are being depreciated at 25% instead of 11.31% followed hitherto. On account of the change in depreciation rate, profit for the period is lower by Rs. 7,608. | |||
| 7. | Profit on sale of assets includes Rs. 107,000 on account of consideration for transfer of rights in the land at the information technology park allotted to the company. | |||
| 8. | During the year the Company had transferred its investments in Wipro Nervewire to another US subsidiary Wipro Inc. The resultant loss of Rs. 244,277 has been recognized in the profit and loss account of the Company. After the transfer Wipro Nervewire and another US subsidiary Wipro Technology Inc. were merged with Wipro Inc. with effect from 31st March 2004. | |||
| 9. | During the year the Company received a demand from the income tax department of Rs. 2,614,568 (Including interest demand of Rs.764,485) for one of its assessment years. Un-provided liability on this account is Rs. 2,315,568. The tax demand is mainly on account of disallowance of deduction claimed by the Company under Section 10A of the Income Tax Act 1961, in respect of profits earned by its undertakings in software technology park at Bangalore. As per the opinion of the Company’s legal counsel | |||
71
Table of Contents
WIPRO LIMITED
| the said disallowance is not tenable. The management of the Company is in the process of filing an appeal challenging the disallowance within the time available under the Income Tax Act. Considering the facts and nature of disallowance, the management believes that there will be a positive final outcome and there is no material impact on the financial statement. | ||||
| 10. | As at the balance sheet date the group has forward/options contract for USD 853 Mn, out of which contracts which are not covered by underlying assets are USD 649 Mn. The Company has recognized proportionate premium on forward/option contracts to the extent Rs. 21,137 which has been included in difference in exchange in Schedule 13 to the financials. The balance premium to be recognized in future is Rs. 140,340. | |||
| 11. | Company has instituted various Employee Stock Option Plans. The compensation committee of the board evaluates the performance and other criteria of employees and approves the grant of options. These options vest with employees over a specified period subject to fulfillment of certain conditions. Upon vesting, employees are eligible to apply and secure allotment of Company’s shares at a price determined on the date of grant of options. The particulars of options granted under various plans are tabulated below. | |||
Stock option activity under the 1999 plan is as follows :
| Year ended March 31, 2004 | ||||||||||||||||
| Weighted | ||||||||||||||||
| Weighted | average | |||||||||||||||
| Range of | average | remaining | ||||||||||||||
| Shares arising | exercise prices | exercise price | contractual life | |||||||||||||
| out of options | Rs. | Rs. | (months) | |||||||||||||
| Outstanding at the beginning of the period | 1,411,358 | 1,024 to 1,086 | 1,085 | 30 | ||||||||||||
| 2,213,020 | 1,853 to 2,522 | 1,863 | 38 | |||||||||||||
| Forfeited during the period | (79,829 | ) | 1,086 | 1,086 | — | |||||||||||
| (113,650 | ) | 1,853 | 1,853 | — | ||||||||||||
| Exercised during the period | (145,752 | ) | 1,086 | 1,086 | — | |||||||||||
| Outstanding at the end of the period | 1,185,777 | 1,024 to 1,086 | 1,085 | 18 | ||||||||||||
| 2,099,370 | 1,853 to 2,522 | 1,863 | 26 | |||||||||||||
| Exercisable at the end of the period | 830,096 | 1,024 to 1,086 | 1,085 | 18 | ||||||||||||
| 944,967 | 1,853 to 2,522 | 1,863 | 26 | |||||||||||||
Stock option activity under the 2000 Plan is as follows:
| Year ended March 31, 2004 | ||||||||||||||||
| Weighted | ||||||||||||||||
| Weighted | average | |||||||||||||||
| Range of | average | remaining | ||||||||||||||
| Shares arising | exercise prices | exercise price | contractual life | |||||||||||||
| out of options | Rs. | Rs. | (months) | |||||||||||||
| Outstanding at the beginning of the period | 94,950 | 1,032 to 1,532 | 1,374 | 57 | ||||||||||||
| 5,519,481 | 1,586 to 2,375 | 1,596 | 59 | |||||||||||||
| 2,486,083 | 2,382 to 2,746 | 2,396 | 42 | |||||||||||||
| Forfeited during the period | (8,250 | ) | 1,032 to 1,532 | 1,325 | — | |||||||||||
| (327,760 | ) | 1,586 to 2,375 | 1,599 | — | ||||||||||||
| (214,900 | ) | 2,382 to 2,746 | 2,396 | — | ||||||||||||
| Exercised during the period | (900 | ) | 1,032 to 1,532 | 1,254 | — | |||||||||||
| (2,545 | ) | 1,586 to 2,375 | 1,586 | |||||||||||||
| Outstanding at the end of the period | 85,800 | 1,032 to 1,532 | 1,381 | 45 | ||||||||||||
| 5,189,176 | 1,586 to 2,375 | 1,596 | 47 | |||||||||||||
| 2,271,183 | 2,382 to 2,746 | 2,390 | 30 | |||||||||||||
| Exercisable at the end of the period | 19,459 | 1,032 to 1,532 | 1,376 | 45 | ||||||||||||
| 2,062,851 | 1,586 to 2,375 | 1,592 | 47 | |||||||||||||
| 1,021,732 | 2,382 to 2,746 | 2,390 | 30 | |||||||||||||
72
Table of Contents
WIPRO LIMITED
Stock option activity under the 2000 ADS Plan is as follows :
| Year ended March 31, 2004 | ||||||||||||||||
| Weighted | ||||||||||||||||
| Weighted | average | |||||||||||||||
| Range of | average | remaining | ||||||||||||||
| Shares arising | exercise prices | exercise price | contractual life | |||||||||||||
| out of options | $ | $ | (months) | |||||||||||||
| Outstanding at the beginning of the period | 83,800 | 20.75 to 30.050 | 25.98 | 54 | ||||||||||||
| 616,550 | 34.90 to 41.375 | 38.31 | 45 | |||||||||||||
| Forfeited during the period | (6,700 | ) | 25.90 to 29.030 | 27.63 | — | |||||||||||
| (10,800 | ) | 36.40 to 41.375 | 39.85 | — | ||||||||||||
| Exercised during the period | (5,550 | ) | 20.79 to 28.730 | 24.91 | — | |||||||||||
| (40,413 | ) | 34.97 to 36.400 | 38.14 | — | ||||||||||||
| Outstanding at the end of the period | 71,550 | 20.75 to 30.050 | 25.91 | 42 | ||||||||||||
| 565,337 | 34.90 to 41.375 | 38.30 | 33 | |||||||||||||
| Exercisable at the end of the period | 17,888 | 20.75 to 30.050 | 25.91 | 42 | ||||||||||||
| 270,588 | 34.90 to 41.375 | 38.18 | 33 | |||||||||||||
| 12. | Amount capitalized comprises of the following revenue expenditure incurred during the construction period. |
(Rs. in 000s)
| Year ended March 31, | ||||||||
| 2004 | 2003 | |||||||
| Raw material, finished goods (including manufactured products) and process stock | 139,948 | 155,995 | ||||||
| 139,948 | 155,995 | |||||||
| 13. | Provision for taxation comprises of the following : |
| (i) | Rs. 849,514 (2003 : Rs. 585,167) in respect of foreign taxes, net of deferred tax expense of Rs. 29,514 (2003 : Rs. Nil) and write back of provision of Rs. Nil (2003 : Rs. 27,643) in respect of earlier years. | |||
| (ii) | Rs. 821,354 (2003 : Rs. 533,850) in respect of Indian Income Tax, net of tax benefit from discontinued business of Rs. Nil (2003 : Rs. 156,236), net of deferred tax benefit of Rs. 42,043 (2003 : Expense of Rs. 45,050) and provision of Rs. 261,190 (2003 : write back of Rs. 200,850) in respect of earlier years. | |||
| (iii) | Rs. 3,000 (2003 : Rs. 2,500) in respect of Wealth Tax. | |||
| 14. | The breakup of accumulated net deferred tax asset is given below: |
| Deferred tax assets: | (Rs. in 000s) |
| March 31, 2004 | March 31, 2003 | |||||||
| Allowance for doubtful debts | 92,644 | 86,697 | ||||||
| Property plant and equipment – Depreciation differential | 46,693 | 74,272 | ||||||
| Employee stock incentive plan | 9,388 | 38,902 | ||||||
| Accrued expenses | 166,808 | 103,133 | ||||||
| 315,533 | 303,004 | |||||||
| 15. | Diluted EPS is calculated based on treasury stock method for ESOP outstanding. | |||
| 16. | Sundry creditors include an amount of Rs. 39,025 (2003 : Rs. 23,429) being amount payable to suppliers, who are Small Scale Industrial Undertakings (SSI) as defined under the Industrial (Development and Regulation) Act, 1951, outstanding for a period in excess of 30 days as at the date of Balance Sheet. The list of such SSI’s is attached. | |||
73
Table of Contents
WIPRO LIMITED
| 17. | Computation of net profit in accordance with Section 198 read with Section 349 of the Companies Act, 1956 |
(Rs. in 000s)
| March 31, 2004 | March 31, 2003 | |||||||||||||||||
| Profit before taxation | 10,822,668 | 9,606,036 | ||||||||||||||||
Add : | Depreciation as per accounts * | |||||||||||||||||
| Managerial Remuneration | 75,667 | 83,007 | ||||||||||||||||
| Provision for doubtful debts / Advances | 126,562 | 192,510 | ||||||||||||||||
| Loss on sale of Investments | 291,795 | 494,024 | 275,517 | |||||||||||||||
Less : | Bad debts written off | 23,723 | 76,733 | |||||||||||||||
| Gain on sale of real estate property | 107,000 | 130,723 | 413,247 | 489,980 | ||||||||||||||
| Net profit for Section 198 of the Companies Act, 1956 | 11,185,969 | 9,391,573 | ||||||||||||||||
| Commission payable : | ||||||||||||||||||
| @ 0.10% of the above profits to the Chairman & Managing Director | 11,186 | 9,392 | ||||||||||||||||
| @ 0.30% to Vice Chairman & Executive Officer | 33,558 | 28,175 | ||||||||||||||||
| @ 0.10% to Vice Chairman | — | 3,131 | ||||||||||||||||
| Total | 44,744 | 40,698 | ||||||||||||||||
| Managerial remuneration comprises : | ||||||||||||||||||
| Salaries and allowances | 21,940 | 32,652 | ||||||||||||||||
| Commission | 44,744 | 40,698 | ||||||||||||||||
| Pension Contribution | 6,069 | 6,002 | ||||||||||||||||
| Contribution to Provident Fund | 252 | 585 | ||||||||||||||||
| Perquisites | 2,662 | 3,070 | ||||||||||||||||
| Total | 75,667 | 83,007 | ||||||||||||||||
| * | For the year 2003-04, net profit is computed considering book depreciation, which is lower than depreciation computed under Section 350 of Companies Act, 1956. |
| 18. | Related Party Transactions | |||
| The following is the listing of related parties : | ||||
| Subsidiaries | Affiliates | Entities controlled by Directors | ||
| Wipro Japan KK | Wipro GE Medical Systems Private Ltd. | Azim Premji Foundation * | ||
| Enthink Inc. | WeP Peripherals Ltd. | Hasham Premji (Partnership firm) * | ||
| Wipro Inc. | ||||
| Wipro Chandrika Ltd. | ||||
| Wipro Trademarks Holding Ltd. | ||||
| Wipro Travel Services Ltd. | ||||
| Wipro Fluid Power Ltd. | ||||
| Wipro Healthcare IT Ltd. | ||||
| Wipro Spectramind Services Ltd. | ||||
| Wipro Holdings Mauritius Ltd. | ||||
| Wipro Holdings UK Ltd. | ||||
| Wipro Technologies UK Ltd. | ||||
| * | Major shareholder or director has control over these entities. |
74
Table of Contents
WIPRO LIMITED
| The Company has the following transactions with related parties. | (Rs. in 000s) |
| As of March 31, | ||||||||
| 2004 | 2003 | |||||||
| Wipro GE Medical Systems Private Ltd. : | ||||||||
| Revenues from sale of computer equipment and administrative and management support services | 116,490 | 33,121 | ||||||
| Fees for usage of trade mark | — | 19,000 | ||||||
| WeP Peripherals Ltd. : | ||||||||
| Revenues from sale of computer equipment and services | 8,002 | 6,163 | ||||||
| Fees for usage of Brand/trade mark | 22,040 | 53,016 | ||||||
| Payments for services | 4,047 | 14,131 | ||||||
| Purchase of printers | 79,892 | 85,531 | ||||||
| Azim Premji Foundation : | ||||||||
| Revenues from sale of computer equipment and services | 1,966 | 2,029 | ||||||
| Wipro Japan KK : | ||||||||
| Software development services provided | 21,187 | 44,075 | ||||||
| Remuneration paid for marketing services received | 97,490 | 88,821 | ||||||
| Wipro Travel Services : | ||||||||
| Travel tickets purchased | 228,653 | — | ||||||
| Wipro Inc. : | ||||||||
| Software development services provided | 436,004 | 115,229 | ||||||
| Services received | 8,610 | 8,549 | ||||||
| Sale of equity shares to Wipro Inc. | 618,126 | — | ||||||
| Wipro HealthCare IT Ltd. : | ||||||||
| Management support services provided | 8,284 | — | ||||||
| Other services | 3,433 | — | ||||||
| Wipro Fluid Power Ltd. : | ||||||||
| Management support services provided | 3,106 | — | ||||||
| Interest paid on Interest Corporate Deposits | 4,553 | 3,341 | ||||||
| Sale of computers | 3,356 | 1,012 | ||||||
| Fees for technical and infrastructure support services | — | 7,530 | ||||||
| Dividend received | — | 3,600 | ||||||
| Wipro Spectramind Services Ltd. : | ||||||||
| Management support services provided | 105,532 | 19,368 | ||||||
| Fees for technical and infrastructure support services | — | 13,947 | ||||||
| Received for services | — | 30,009 | ||||||
| Chairman and Managing Director : | ||||||||
| Payment of lease rentals | 1,425 | 1,200 | ||||||
| Payment to Non-Executive Directors : | ||||||||
| Dr. Ashok Ganguly | 800 | 800 | ||||||
| Narayan Vaghul | 800 | 800 | ||||||
| Prof. Eisuke Sakakibara | Yen | 4,800 | Yen | 4,800 | ||||
| Dr. Jagdish N. Sheth | $ | 25 | $ | 33.5 | ||||
| P. M. Sinha | 1,000 | 1,000 | ||||||
| B. C. Prabhakar | 400 | 400 | ||||||
75
Table of Contents
WIPRO LIMITED
(Rs. in 000s)
| As of March 31, | ||||||||
| 2004 | 2003 | |||||||
| The following is the listing of receivables from and payables to related party as on the balance sheet date | ||||||||
| Receivables : | ||||||||
| WeP Peripherals Ltd. | 3,043 | 13,941 | ||||||
| Wipro GE Medical Systems Private Ltd. | 31,321 | 87,410 | ||||||
| Azim Premji Foundation | 43 | 158 | ||||||
| Hasham Premji | 25,000 | 25,000 | ||||||
| Wipro HealthCare IT | 11,719 | — | ||||||
| Wipro Fluid Power Ltd. | 6,656 | — | ||||||
| Wipro Spectramind | 64,155 | 49,424 | ||||||
| Wipro Japan KK | 13,402 | 6,847 | ||||||
| Wipro Travel Services | 15,666 | — | ||||||
| Wipro Inc. | 723,958 | 23,528 | ||||||
| Enthink Inc. | — | 39,320 | ||||||
| Payables : | ||||||||
| WeP Peripherals Ltd. | 34,459 | 20,098 | ||||||
| Wipro Inc. | 153,463 | — | ||||||
| Wipro Mauritius | 532 | — | ||||||
| Wipro UK Holdings | 10,860 | — | ||||||
| Wipro Japan KK | 5,531 | — | ||||||
| Enthink Inc. | 39,975 | — | ||||||
| Wipro HealthCare IT | 5,436 | 432 | ||||||
| Wipro Travel Services | 3,609 | — | ||||||
| Wipro Fluid Power | — | 153,500 | ||||||
| 19. | Corresponding figures for previous periods presented have been regrouped, where necessary, to confirm to this year classification. |
76
Table of Contents
WIPRO LIMITED
ADDITIONAL INFORMATION PURSUANT TO THE PROVISIONS OF PART II OF SCHEDULE VI TO THE COMPANIES ACT, 1956
i) Licensed/registered/installed capacities
| Registered Capacity | Installed Capacity @ | |||||||||||||||||||
| Unit | March 31, 2004 | March 31, 2003 | March 31, 2004 | March 31, 2003 | ||||||||||||||||
| Vanaspati/Hydrogenated oils | TPA * | 144,000 | 144,000 | 45,000 | 56,250 | |||||||||||||||
| Hydraulic and pneumatic equipment | NPA # | |||||||||||||||||||
| Tipping gear systems | NPA # | |||||||||||||||||||
| Toilet Soaps | TPA * | 48,000 | 42,750 | 28,000 | 28,000 | |||||||||||||||
| Leather shoe uppers, leather shoes and allied articles | Pairs/Nos (1000's) p.a in lakhs | 750 | 750 | 750 | 750 | |||||||||||||||
| Fatty acids | TPA * | 20,000 | 20,000 | 20,000 | 20,000 | |||||||||||||||
| Glycerine | TPA * | 2,000 | 2,000 | 1,800 | 1,800 | |||||||||||||||
| GLS lamps | 000s | 50,000 | 50,000 | 50,000 | 50,000 | |||||||||||||||
| TL Shells | 000s | 12,694 | 12,694 | 12,694 | 12,694 | |||||||||||||||
| Fluorescent tube lights | 000s | 10,694 | 10,694 | 10,694 | 10,694 | |||||||||||||||
| Mini computers/micro processor based systems and data communication systems | N PA # | 180,000 | 244,000 | 180,000 | 244,000 | |||||||||||||||
| Micro processor based computers and peripherals and communication boards | N PA # | 72,500 | 72,500 | |||||||||||||||||
| * | TPA indicates tons per annum | |
| # | NPA indicates nos. per annum | |
| @ | Installed capacities are as per certificate given by management on which auditors have relied. |
ii) Production and Sales
| Production # | Sales | |||||||||||||||||||||||||||
| March 31, 2004 | March 31, 2003 | March 31, 2004 | March 31, 2003 | |||||||||||||||||||||||||
| Unit | Quantity | Quantity | Quantity | Rs. in 000s | Quantity | Rs. in 000s | ||||||||||||||||||||||
| Software services | 37,785,735 | 28,243,635 | ||||||||||||||||||||||||||
| Mini computers/micro processor based | ||||||||||||||||||||||||||||
| Systems and data communication systems | Nos. | 69,508 | 68,322 | 78,662 | 7,215,018 | 67,882 | 5,864,578 | |||||||||||||||||||||
| Toilet soaps | Tons | 23,288 | 19,512 | 23,056 | 2,093,690 | 19,430 | 1,613,610 | |||||||||||||||||||||
| Toiletries | 258,164 | 196,137 | ||||||||||||||||||||||||||
| Post sales support and related IT services | 1,812,798 | |||||||||||||||||||||||||||
| Corporate ISP services | 38,496 | |||||||||||||||||||||||||||
| Vanaspati/hydrogenated oils | Tons | 5,666 | 7,566 | 5677 | 269,574 | 7,571 | 329,483 | |||||||||||||||||||||
| Lighting products (Note & below) | 31,251 | 1,306,750 | — | 1,010,190 | ||||||||||||||||||||||||
| Hydraulic and pneumatic equipment | Nos. | — | — | |||||||||||||||||||||||||
| Tipping gear systems | Nos. | — | — | |||||||||||||||||||||||||
| Shoe uppers and full shoes (pairs) | 000s | 123 | 457 | 131 | 36,290 | 464 | 111,334 | |||||||||||||||||||||
| Fluorescent tube lights | 11,022 | |||||||||||||||||||||||||||
| Fatty acids (refer * below for quantity) | Tons | 15,727 | 13,257 | 7,194 | ||||||||||||||||||||||||
| Glycerine | Tons | 519 | 311 | 526 | 29,889 | 318 | 19,295 | |||||||||||||||||||||
| Reagent kits/spares of analytical instruments | Nos. | 3,518 | 4,270 | 49,652 | 458,646 | 80,382 | 440,951 | |||||||||||||||||||||
| Spares/components for cylinders/tippers (Note & below) | ||||||||||||||||||||||||||||
| Processing and service charges | 22,249 | |||||||||||||||||||||||||||
| Agency commission | 233,259 | 221,876 | ||||||||||||||||||||||||||
| Miscellaneous Sales | 2,127,572 | |||||||||||||||||||||||||||
| Software products | 45,097 | 493,352 | ||||||||||||||||||||||||||
| Total | 51,881,933 | 40,402,929 | ||||||||||||||||||||||||||
| Less: Excise Duty | 555,128 | 554,755 | ||||||||||||||||||||||||||
| Total | 51,326,805 | 39,848,174 | ||||||||||||||||||||||||||
| # | Includes samples and shortages | |
| * | Includes 15,702 (2003 : 13,253) used for own consumption | |
| & | It is not practicable to give quantitative information in the absence of common expressible unit. |
77
Table of Contents
WIPRO LIMITED
iii) Closing Stocks
| March 31, 2004 | March 31, 2003 | |||||||||||||||||||
| Unit | Quantity | Rs. 000s | Quantity | Rs. 000s | ||||||||||||||||
| Mini computers/micro processor based systems and data communication systems* | Nos. | 2,911 | 76,993 | 1,575 | 160,507 | |||||||||||||||
| Toilet Soaps | Tons | 846 | 52,309 | 614 | 31,506 | |||||||||||||||
| Vanaspati/hydrogenated oils | Tons | 456 | 22,691 | 467 | 21,465 | |||||||||||||||
| Lighting Products* | 68,029 | 72,606 | ||||||||||||||||||
| Shoe Uppers and full shoes (pairs) | 000s | 2 | 508 | 10 | 263 | |||||||||||||||
| Fatty acids | Tons | 134 | 2,152 | 109 | 3,309 | |||||||||||||||
| Glycerine | Tons | 23 | 924 | 30 | 1,500 | |||||||||||||||
| Others | 111 | 285 | ||||||||||||||||||
| 223,717 | 291,441 | |||||||||||||||||||
Closing Stock of traded goods | ||||||||||||||||||||
| Reagent Kits/Spares of Analytical instruments | Nos. | 12,478 | 82,992 | 23,739 | 91,337 | |||||||||||||||
| Others | 196,535 | 25,673 | ||||||||||||||||||
| 503,244 | 408,451 | |||||||||||||||||||
| * | Includes traded products; bifurcation between manufactured and traded products not practicable. |
iv) Purchases for trading
| March 31, 2004 | March 31, 2003 | |||||||||||||||||||
| Unit | Quantity | Rs. 000s | Quantity | Rs. 000s | ||||||||||||||||
| Computer units/printers | Nos. | 10,490 | 2,126,473 | 26,266 | 2,221,293 | |||||||||||||||
| Lighting Products* | 616,647 | 454,949 | ||||||||||||||||||
| Reagent kits/Spares of analytical instruments | Nos. | 34,873 | 51,676 | 83,505 | 322,054 | |||||||||||||||
| Others* | 647,092 | 132,231 | ||||||||||||||||||
| 3,441,888 | 3,130,527 | |||||||||||||||||||
| * | It is not practicable to give quantitative information in the absence of common expressible unit. |
v) Raw materials consumed
| March 31, 2004 | March 31, 2003 | |||||||||||||||||||
| Unit | Quantity | Rs. 000s | Quantity | Rs. 000s | ||||||||||||||||
| Peripherals/Components for computers | # | 3,730,257 | 3,179,090 | |||||||||||||||||
| Oils and fats | Tons | 20,553 | 643,293 | 14,847 | 432,890 | |||||||||||||||
| Components for lighting products | # | 212,262 | 206,891 | |||||||||||||||||
| Leather | Sq.ft. (000s) | 303 | 23,557 | 594 | 53,431 | |||||||||||||||
| Others | # | 275,297 | 338,856 | |||||||||||||||||
| 4,884,666 | 4,211,158 | |||||||||||||||||||
| # | It is not practicable to give quantitative information in the absence of common expressible unit. |
78
Table of Contents
WIPRO LIMITED
vi) Value of imported and indigenous materials consumed
| March 31, 2004 | March 31, 2003 | |||||||||||||||
| % | Rs. 000s | % | Rs. 000s | |||||||||||||
| Raw Materials | ||||||||||||||||
| Imported | 58 | 2,844,790 | 43 | 1,817,343 | ||||||||||||
| Indigenous | 42 | 2,039,876 | 57 | 2,393,815 | ||||||||||||
| 4,884,666 | 4,211,158 | |||||||||||||||
| Stores and Spares | ||||||||||||||||
| Imported | 1 | 537 | 1 | 857 | ||||||||||||
| Indigenous | 99 | 158,767 | 99 | 135,548 | ||||||||||||
| 159,304 | 136,405 | |||||||||||||||
vii) Value of imports on CIF basis
(Does not include value of imported items locally purchased)
(Rs. in 000s)
| March 31, 2004 | March 31, 2003 | |||||||
| Raw materials, components and peripherals | 2,706,478 | 1,972,192 | ||||||
| Stores and spares | 833 | 833 | ||||||
| Capital goods | — | 9,301 | ||||||
| 2,707,311 | 1,982,326 | |||||||
viii) Expenditure in foreign currency
(Rs. in 000s)
| March 31, 2004 | March 31, 2003 | |||||||
| Travelling | 12,447,622 | 8,132,938 | ||||||
| Interest | 4,648 | 2,263 | ||||||
| Royalty | 168,397 | 144,845 | ||||||
| Professional fees | 1,094,858 | 1,000,777 | ||||||
| Dividend* | 2,688 | 2,300 | ||||||
| Others | 7,507,693 | 3,627,786 | ||||||
| 21,223,218 | 12,908,609 | |||||||
| * | Amount remitted in foreign currency on account of payment of dividend |
(Rs. in 000s)
| March 31, 2004 | March 31, 2003 | |||||||
| Net amount remitted | 2,688 | 2,300 | ||||||
| Number of shares held by non-resident shareholders | 2,864,294 | 2,598,080 | ||||||
| Year to which dividend relates | 2002-2003 | 2001-2002 | ||||||
ix) Earnings in foreign exchange
(Rs. in 000s)
| March 31, 2004 | March 31, 2003 | |||||||
| Export of goods on F.O.B. basis | 40,878 | 110,761 | ||||||
| Services | 38,083,355 | 28,484,394 | ||||||
| Interest on deposits/investments outside India | — | 48,772 | ||||||
| Agency commission | 233,259 | 221,876 | ||||||
| 38,357,492 | 28,865,803 | |||||||
79
Table of Contents
WIPRO LIMITED
SSI dues outstanding for a period in excess of 30 days as on March 31, 2004 is given below :
| Total Dues | ||||
| Supplier | Rs. in 000s | |||
| Atco Controls (I) Pvt. Ltd. | 3,573 | |||
| Everlite Industries | 2,902 | |||
| Everlite Corporation | 3,232 | |||
| Fabionix (India) Pvt. Ltd. | 156 | |||
| Glostar Electricals Pvt. Ltd. | 2 | |||
| Har-Hal Plastic Engineering Pvt. Ltd. | 31 | |||
| Infocontrol Systems Inc. | 2,397 | |||
| Kay Pee Industries | 2,050 | |||
| Litex Electricals Pvt. Ltd. | 13 | |||
| Maharashtra Industries | 4,295 | |||
| Prospect Industries | 3,558 | |||
| R.C. Industries | 5,263 | |||
| Regal Luminaires | 454 | |||
| Superstars | 5,383 | |||
| Sandesh Electrical Industries | 367 | |||
| Unilux | 4,095 | |||
| Ujas Elect. Pvt. Ltd. | 1,090 | |||
| Ujas Electricals Pvt. Ltd. | 163 | |||
| 39,025 | ||||
80
Table of Contents
WIPRO LIMITED
ADDITIONAL INFORMATION PURSUANT TO THE PROVISIONS OF PART IV OF SCHEDULE VI TO THE COMPANIES ACT, 1956
BALANCE SHEET ABSTRACT AND THE COMPANY’S GENERAL BUSINESS PROFILE
I | Registration Details | |||||||||||
| Registration No. | 20800 | State Code | 08 | |||||||||
| Balance Sheet Date | 31st March 2004 | |||||||||||
II | Capital raised during the year | (Rs. in 000s) | ||||||||||
| Public issue | Nil | |||||||||||
| Rights issue | Nil | |||||||||||
| Bonus issue | Nil | |||||||||||
| Issue of shares on exercise of Employee Stock Options | 163,501 | |||||||||||
| American Depository Offering | 72,901 | |||||||||||
| Position of mobilisation of and deployment of funds | (Rs. in 000s) | |||||||||||
| Total Liabilities | 36,082,789 | Total Assets | 36,082,789 | |||||||||
| Sources of funds | Application of Funds | |||||||||||
| Paid-up capital | 465,519 | Goodwill | 85,542 | |||||||||
| Reserves and Surplus | 34,610,396 | Net Fixed Assets | 7,861,753 | |||||||||
| Secured Loans | 947,466 | Investments | 24,560,332 | |||||||||
| Unsecured Loans | 59,408 | Deferred Tax Assets | 315,533 | |||||||||
| Net Current Assets | 3,259,629 | |||||||||||
IV | Performance of the Company | (Rs. in 000s) | ||||||||||
| Turnover | 52,596,727 | |||||||||||
| Total Expenditure | 41,774,059 | |||||||||||
| Profit before Tax | 10,822,668 | |||||||||||
| Profit after Tax | 9,148,800 | |||||||||||
| Earnings per share (basic) | 39.56 | |||||||||||
| Dividend | 200 | % | ||||||||||
| One-time Dividend | 1250 | % | ||||||||||
| V | Generic names of three principal products/services of the Company (as per monetary terms) | |||||
| i) | Item code no (ITC Code) | 84713010 | ||||
| Product description | Personal Computer | |||||
| ii) | Item code no (ITC Code) | 85249113 | ||||
| Product description | I.T. Software | |||||
| iii) | Item code no (ITC Code) | 15162011 | ||||
| Product description | Vegetable fats and oils (Edible Grade) | |||||
| For and on behalf of the Board of Directors | ||||||
| Azim Hasham Premji Chairman and Managing Director | Vivek Paul Vice Chairman and Executive Officer | P. M. Sinha Director | ||||
| Suresh C. Senapaty Corporate Executive Vice President – Finance | V. Ramachandran Company Secretary | B. C. Prabhakar Director | ||||
| Bangalore, April 16, 2004 | ||||||
81
Table of Contents
WIPRO LIMITED
CASH FLOW STATEMENT
(Rs. in 000s)
| Year ended March 31, | ||||||||
| 2004 | 2003 | |||||||
Cash flows from operating activities: | ||||||||
| Net profit before tax and non recurring items | 10,822,668 | 9,787,621 | ||||||
| Adjustments to reconcile Net profit before tax and non recurring items to net cash provided by operating activities: | ||||||||
| Depreciation and amortization | 1,515,981 | 1,375,698 | ||||||
| Foreign currency translation gains | (132,771 | ) | (273,135 | ) | ||||
| Retirement benefits provision | 161,596 | 102,735 | ||||||
| Interest accrued on discount bonds | — | — | ||||||
| Interest on borrowings | (735,611 | ) | 29,304 | |||||
| Loss on sale of investment in Wipro Nervewire | 244,277 | — | ||||||
| Dividend/interest | — | (291,984 | ) | |||||
| Loss/(Gain) on sale of short-term investments | — | (413,247 | ) | |||||
| Loss/(Gain) on sale of property, plant and equipment | (107,000 | ) | (786 | ) | ||||
Operating cash flow before changes in working capital | 11,769,140 | 10,316,206 | ||||||
| Changes in operating assets and liabilities | ||||||||
| Trade and other receivable | (3,032,704 | ) | (1,446,294 | ) | ||||
| Loans and advances | (449,770 | ) | (181,234 | ) | ||||
| Inventories | (247,073 | ) | (25,354 | ) | ||||
| Trade and other payables | 2,620,563 | 506,547 | ||||||
Net cash provided by operations | 10,660,156 | 9,169,871 | ||||||
| Direct taxes paid | (1,521,067 | ) | (1,830,549 | ) | ||||
| Net Cash provided by discontinuing operations | — | 27,274 | ||||||
Net cash provided by operating activities | 9,139,089 | 7,366,596 | ||||||
Cash flows from investing activities: | ||||||||
| Expenditure on property, plant and equipment (including advances) | (3,124,117 | ) | (2,019,948 | ) | ||||
| Proceeds from sale of property, plant and equipment | 119,351 | 105,734 | ||||||
| Purchase of investments | (10,200,623 | ) | (41,178,935 | ) | ||||
| Inter Corporate deposits placed | 214,300 | 1,801,000 | ||||||
| Certificate of Deposits with foreign banks | 2,463,056 | 2,824,164 | ||||||
| Proceeds from sales and maturities of investments | 47,952 | 37,907,324 | ||||||
| Payment for acquisition | (876,393 | ) | (6,055,788 | ) | ||||
| Dividends received | 735,611 | 69,737 | ||||||
| Interest paid | — | 192,943 | ||||||
Net cash used in investing activities | (10,620,863 | ) | (6,353,769 | ) | ||||
Cash flows from financing activities: | ||||||||
| Proceeds from exercise of Stock Option Plan grants | 238,602 | 106,809 | ||||||
| Share application monies received pending allotment | — | (1,177 | ) | |||||
| Proceeds from issuance/(repayment) of borrowings | 309,427 | 275,619 | ||||||
| Payment of cash dividends | (262,361 | ) | (232,466 | ) | ||||
Net cash provided by/(used in) financing activities | 285,668 | 148,785 | ||||||
Net increase/(decrease) in cash and cash equivalents during the year | (1,196,106 | ) | 1,161,612 | |||||
Cash and cash equivalents at the beginning of the period | 4,097,046 | 2,935,434 | ||||||
Cash and cash equivalents at the end of the period | 2,900,940 | 4,097,046 | ||||||
Note:
Figures for previous periods presented, have been regrouped wherever necessary, to confirm to this period classification.
82
Table of Contents
WIPRO LIMITED
| For and on behalf of the Board of Directors | ||||||
| Azim Hasham Premji Chairman and Managing Director | Vivek Paul Vice Chairman and Executive Officer | P. M. Sinha Director | ||||
| Suresh C. Senapaty Corporate Executive Vice President – Finance | V. Ramachandran Company Secretary | B. C. Prabhakar Director | ||||
| Bangalore, April 16, 2004 | ||||||
AUDITOR’S CERTIFICATE
We have examined the above cash flow statement of Wipro Limited for the year ended March 31, 2004. This statement has been prepared by the Company in accordance with the requirement under clause 32 of the listing Agreement with the Stock Exchanges and is based on and in agreement with the corresponding Profit and Loss Account and Balance Sheet of the Company for the year ended March 31, 2004.
| for N.M. Raiji & Co., Chartered Accountants | ||
| Mumbai, April 16, 2004. | J.M. Gandhi Partner Membership No.: 37924 |
83
Table of Contents
WIPRO LIMITED
ANNEXURE TO THE DIRECTORS’ REPORT
FORM A
DISCLOSURE OF PARTICULARS WITH RESPECT
TO CONSERVATION OF ENERGY
A. DISCLOSURE OF PARTICULARS WITH RESPECT TO CONSERVATION OF ENERGY
| 2003-2004 | 2002-2003 | |||||||||||||||
| 1 | Electricity | |||||||||||||||
| a. | Purchased | |||||||||||||||
| Unit | KWH | 8,470,899 | 8,154,075 | |||||||||||||
| Total amount | Rs. | 35,298,553.4 | 34,560,452 | |||||||||||||
| Rate/Unit | Rs. | 4.17 | 4.24 | |||||||||||||
| b. | Own generation | |||||||||||||||
| Through diesel generator | ||||||||||||||||
| Unit | KWH | 135.196 | 149,612 | |||||||||||||
| Unit/litre of diesel | Units | 1.969 | 1.9724 | |||||||||||||
| Cost per unit | Rs. | 9.09 | 8.70 | |||||||||||||
| 2 | Coal (including coconut shells) | |||||||||||||||
| Quantity | Tonnes | 6,563.21 | 7,221.2 | |||||||||||||
| Total cost | Rs. | 12,212,542 | 12,672,001 | |||||||||||||
| Average rate | Rs. | 1,860.76 | 1,754.97 | |||||||||||||
| 3 | Furnace oil | |||||||||||||||
| Quantity – LDO | Ltrs. | 589,797.24 | 533,224 | |||||||||||||
| Total cost | Rs. | 8,253,738 | 7,980,305 | |||||||||||||
| Average rate | Rs. | 13.99 | 14.97 | |||||||||||||
| 4 | Furnace oil | |||||||||||||||
| Quantity – HSD | Ltrs. | 547,895 | 312,562 | |||||||||||||
| Total cost | Rs. | 6,613,482 | 3,937,646 | |||||||||||||
| Average rate | Rs. | 12.07 | 12.60 | |||||||||||||
| 5 | LPG | |||||||||||||||
| Quantity kgs | kgs. | 507,894 | 575,964 | |||||||||||||
| Total cost | Rs. | 9,636,616.14 | 9,801,824 | |||||||||||||
| Average rate | Rs. | 18.97 | 17.02 | |||||||||||||
B. CONSUMPTION PER UNIT PRODUCTION
| Electricity | Liquid diesel oil | Coal | ||||||||||
| Vanaspati | (KWH/Tonne) | (Litres/Tonne) | (Tonnes/Tonne) | |||||||||
| 2003-04 | 119.92 | 16.12 | 0.153 | |||||||||
| 2002-03 | 125.44 | 15.51 | 0.665 | |||||||||
84
Table of Contents
WIPRO LIMITED — CONSOLIDATED
AUDITORS’ REPORT TO THE BOARD OF DIRECTORS ON CONSOLIDATED FINANCIAL STATEMENTS
We have examined the attached Consolidated Balance Sheet of Wipro Limited (the parent), its subsidiaries and its associates (entities together termed as the Wipro Group) as at March 31, 2004, the Consolidated Profit and Loss Account and Consolidated Cash Flow Statement of the Wipro Group for the year ended on that date.
These financial statements are the responsibility of the management of Wipro Limited. Our responsibility is to express an opinion on these financial statements based on our audit. We conducted our audit in accordance with generally accepted auditing standards in India. These standards require that we plan and perform the audit to obtain reasonable assurance whether the financial statements are prepared, in all material respects, in accordance with an identified financial reporting framework and are free of material misstatements. An audit includes, examining on a test basis, evidence supporting the amounts and disclosures in the financial statements. An audit also includes assessing the accounting principles used and significant estimates made by management, as well as evaluating the overall financial statements. We believe that our audit provides a reasonable basis for our opinion.
We report that :
| 1. | We have obtained all the information and explanations, which to the best of our knowledge and belief were necessary for the purpose of our audit. |
| 2. | a) | Financial statements of certain subsidiaries with parent’s share in net worth of Rs. 2,298 Million as on March 31, 2004 and the parent’s share in net profit of Rs. 961 Million for the year ended have been audited by other auditors whose reports have been furnished to us. We have placed reliance on the said reports for the purpose of our opinion on the consolidated financial statements. | ||
| b) | The financial statement of one of the associates for the year ended March 31, 2004 have been audited by other auditors whose report has been furnished to us. The parent’s share of such associate in its net worth as on March 31, 2004, and in its net Loss is for the year then ended is Rs. 617 Million and Rs. 18 Million respectively. We have placed reliance on the said report for the purpose of our opinion on the consolidated financial statements. | |||
| 3. | The consolidated financial statements have been prepared by the Company in accordance with the requirements of Accounting Standard – 21, 23 and 27, in respect of consolidation of financial statements, issued by the Institute of Chartered Accountants of India and is based on the separate financial statements of Wipro Limited, its subsidiaries and its associates. | |||
| 4. | In our opinion and to the best of our information and according to the explanations given to us, the said consolidated accounts, give a true and fair view in conformity with the accounting principles generally accepted in India : | |||
| a) | in the case of the Balance Sheet, of the state of affairs of the Wipro Group as at March 31, 2004. | |||
| b) | in the case of the Profit and Loss Account, of the profit of the Wipro Group for the year ended on that date. | |||
| c) | in the case of Cash Flow Statement, of the cash flows of the Wipro Group for the year ended on that date. | |||
| for N.M. Raiji & Co., Chartered Accountants | ||
| Mumbai, April 16, 2004. | J.M. Gandhi Partner Membership No.: 37924 |
85
Table of Contents
WIPRO LIMITED — CONSOLIDATED
CONSOLIDATED BALANCE SHEET
(Rs. in 000s)
| As of March 31, | ||||||||||||
| SOURCES OF FUNDS | Schedule | 2004 | 2003 | |||||||||
Shareholders’ funds | ||||||||||||
| Share Capital | 1 | 465,519 | 465,128 | |||||||||
| Share application money pending allotment | — | 1,222 | ||||||||||
| Reserves and Surplus | 2 | 37,083,973 | 34,307,985 | |||||||||
| 37,549,492 | 34,774,335 | |||||||||||
Loan Funds | ||||||||||||
| Secured Loans | 3 | 947,466 | 525,562 | |||||||||
| Unsecured Loans | 4 | 106,565 | 65,449 | |||||||||
Minority Interest | 163,847 | 2,229 | ||||||||||
| 1,217,878 | 593,240 | |||||||||||
TOTAL | 38,767,370 | 35,367,575 | ||||||||||
APPLICATION OF FUNDS | ||||||||||||
Fixed Assets | ||||||||||||
| Goodwill on consolidation (refer Note 1) | 5,252,357 | 5,007,243 | ||||||||||
| Gross block | 5 | 15,607,108 | 12,853,110 | |||||||||
| Less: Depreciation | 7,599,478 | 6,330,715 | ||||||||||
Net Block | 13,259,987 | 11,529,638 | ||||||||||
| Add: Capital work-in-progress and advances | 1,427,285 | 1,011,471 | ||||||||||
| 14,687,272 | 12,541,109 | |||||||||||
Investments | 6 | 19,059,572 | 8,396,102 | |||||||||
Deferred tax assets(refer Note 11) | 486,298 | 465,909 | ||||||||||
Current assets, loans and advances | ||||||||||||
| Inventories | 7 | 1,292,022 | 1,010,527 | |||||||||
| Sundry Debtors | 8 | 11,896,319 | 8,602,642 | |||||||||
| Cash and Bank balances | 9 | 3,242,698 | 4,210,079 | |||||||||
| Loans and advances | 10 | 5,683,729 | 7,257,622 | |||||||||
| 22,114,768 | 21,080,870 | |||||||||||
Current liabilities and provisions | ||||||||||||
| Liabilities | 11 | 9,282,317 | 6,333,268 | |||||||||
| Provisions | 12 | 8,298,223 | 784,124 | |||||||||
| 17,580,540 | 7,117,392 | |||||||||||
| �� | ||||||||||||
Net Current Assets | 4,534,228 | 13,963,478 | ||||||||||
Miscellaneous expenditure(to the extent not written off or adjusted) | — | 977 | ||||||||||
TOTAL | 38,767,370 | 35,367,575 | ||||||||||
SIGNIFICANT ACCOUNTING POLICIES AND NOTES TO ACCOUNTS19
| As per our Report attached | For and on behalf of the Board of Directors | |||||
for N.M. Raiji & Co., | Azim Hasham Premji | Vivek Paul | P. M. Sinha | |||
Chartered Accountants | Chairman and Managing Director | Vice Chairman and Executive Officer | Director | |||
J.M. Gandhi Partner | Suresh C. Senapaty Corporate Executive Vice President – Finance | V. Ramachandran Company Secretary | B. C. Prabhakar Director | |||
| Mumbai, April 16, 2004 | Bangalore, April 16, 2004 | |||||
86
Table of Contents
WIPRO LIMITED — CONSOLIDATED
CONSOLIDATED PROFIT AND LOSS ACCOUNT
(Rs. in 000s)
| Year ended March 31, | ||||||||||
| INCOME | Schedule | 2004 | 2003 | |||||||
| Gross Sales and Services | 59,111,069 | 43,572,657 | ||||||||
| Less : Excise Duty | 760,842 | 707,169 | ||||||||
| Net Sales and Services | 58,350,227 | 42,865,488 | ||||||||
| Other Income | 13 | 1,365,995 | 1,181,962 | |||||||
| 59,716,222 | 44,047,450 | |||||||||
EXPENDITURE | ||||||||||
| Cost of goods sold | 14 | 39,091,056 | 27,438,729 | |||||||
| Selling, general and administrative expenses | 15 | 8,558,276 | 6,442,577 | |||||||
| Interest | 16 | 35,067 | 30,245 | |||||||
| 47,684,399 | 33,911,551 | |||||||||
PROFIT BEFORE TAXATION | ||||||||||
| Continuing Operations | 12,031,823 | 10,317,484 | ||||||||
| Discontinuing Operations | — | (181,585 | ) | |||||||
Total | 12,031,823 | 10,135,899 | ||||||||
PROVISION FOR TAXATION(refer note 12) | ||||||||||
| Continuing Operations | 1,680,557 | 1,342,752 | ||||||||
| Discontinuing Operations | — | (66,733 | ) | |||||||
Total | 1,680,557 | 1,276,019 | ||||||||
PROFIT FOR THE PERIOD BEFORE EXTRAORDINARY ITEMS | ||||||||||
| Continuing Operations | 10,351,266 | 8,974,732 | ||||||||
| Discontinuing Operations | — | (114,852 | ) | |||||||
Total | 10,351,266 | 8,859,880 | ||||||||
| Loss on discontinuance of ISP business | 18 | — | (352,195 | ) | ||||||
| Tax benefit on above | — | 89,503 | ||||||||
| Net loss on discontinuance of ISP business | — | (262,692 | ) | |||||||
PROFIT FOR THE PERIOD BEFORE MINORITY INTEREST/EQUITY IN EARNINGS OF AFFILIATES | 10,351,266 | 8,597,188 | ||||||||
| Minority Interest | (59,191 | ) | (36,908 | ) | ||||||
| Equity in earnings/(losses) of affiliates | 22,921 | (355,260 | ) | |||||||
PROFIT FOR THE PERIOD | 10,314,996 | 8,205,020 | ||||||||
Appropriations | ||||||||||
| Proposed Dividend | 931,039 | 232,564 | ||||||||
| Proposed One-Time Dividend | 5,818,979 | — | ||||||||
| Total Dividend | 6,750,018 | 232,564 | ||||||||
| Tax on distribution of Dividend | 864,846 | 29,797 | ||||||||
Transfer to general reserve | 2,700,132 | 7,942,659 | ||||||||
EARNINGS PER SHARE (EPS) — in Rs. | ||||||||||
Basic | ||||||||||
| On profit for the period from continuing operations | 44.76 | 38.83 | ||||||||
| On losses of discontinued ISP business | — | (0.50 | ) | |||||||
| On extraordinary items | — | (1.14 | ) | |||||||
| On equity in earnings of affiliates/minority interest | (0.16 | ) | (1.70 | ) | ||||||
| On profit for the period | 44.60 | 35.49 | ||||||||
Diluted | ||||||||||
| On profit for the period from continuing operations | 44.71 | 38.75 | ||||||||
| On losses of discontinued ISP business | — | (0.50 | ) | |||||||
| On extraordinary items | — | (1.13 | ) | |||||||
| On equity in earnings of affiliates/minority interest | (0.16 | ) | (1.69 | ) | ||||||
| On profit for the period | 44.55 | 35.43 | ||||||||
Number of shares for calculating EPS | ||||||||||
| Basic | 231,290,130 | 231,204,325 | ||||||||
| Diluted | 231,515,107 | 231,572,448 | ||||||||
| SIGNIFICANT ACCOUNTING POLICIES AND NOTES TO ACCOUNTS | 19 | |||||||||
| As per our Report attached | For and on behalf of the Board of Directors | |||||
for N.M. Raiji & Co., | Azim Hasham Premji | Vivek Paul | P. M. Sinha | |||
Chartered Accountants | Chairman and Managing Director | Vice Chairman and | Director | |||
| Executive Officer | ||||||
J.M. Gandhi | Suresh C. Senapaty | V. Ramachandran | B. C. Prabhakar | |||
Partner | Corporate Executive | Company Secretary | Director | |||
| Vice President — Finance | ||||||
| Mumbai, April 16, 2004 | Bangalore, April 16, 2004 | |||||
87
Table of Contents
WIPRO LIMITED — CONSOLIDATED
(Rs. in 000s except share numbers)
| As of March 31, | ||||||||
| 2004 | 2003 | |||||||
SCHEDULE 1 SHARE CAPITAL | ||||||||
Authorised | ||||||||
| 375,000,000 (2003 : 375,000,000) Equity shares of Rs. 2 each | 750,000 | 750,000 | ||||||
| 25,000,000 (2003 : 25,000,000) 10.25% Redeemable Cumulative | ||||||||
| Preference Shares of Rs. 10 each | 250,000 | 250,000 | ||||||
| 1,000,000 | 1,000,000 | |||||||
Issued, subscribed and paid-up | ||||||||
| 232,759,152 (2003 : 232,563,992) equity shares of Rs. 2 each | 465,519 | 465,128 | ||||||
| 465,519 | 465,128 | |||||||
Notes :
Of the above equity shares :
| i) | 226,905,825 equity shares (2003 : 226,905,825), have been allotted as fully paid bonus shares by capitalization of share premium of Rs. 32,639 and General Reserves of Rs. 421,173. | |||
| ii) | 1,325,525 equity shares (2003 : 1,325,525) have been allotted as fully paid-up, pursuant to a scheme of amalgamation, without payment being received in cash. | |||
| iii) | 3,162,500 shares representing 3,162,500 American Depository Receipts issued during 2000-2001 pursuant to American Depository offering by the Company. | |||
| iv) | 449,302 (2003 : 254,142) equity share issued pursuant to Wipro Employee Stock Option Plan. | |||
SCHEDULE 2 RESERVES AND SURPLUS
| As of | As of | |||||||||||||||
| April 1, 2003 | Additions | Deductions | March 31, 2004 | |||||||||||||
Capital Reserves | 9,500 | — | — | 9,500 | ||||||||||||
| 9,500 | — | — | 9,500 | |||||||||||||
Capital Redemption Reserve | 250,038 | — | — | 250,038 | ||||||||||||
| 250,038 | — | — | 250,038 | |||||||||||||
Share Premium | 6,492,847 | 239,431 | (a) | — | 6,732,278 | |||||||||||
| 6,386,235 | 106,612 | — | 6,492,847 | |||||||||||||
Translation Reserve | (568 | ) | — | 159,174 | (159,742 | ) | ||||||||||
| — | — | 568 | (568 | ) | ||||||||||||
Deferred Stock Compensation | 4,401 | — | 4,401 | — | ||||||||||||
| — | 4,401 | — | 4,401 | |||||||||||||
General Reserve | 27,551,767 | 2,700,132 | (b) | — | 30,251,899 | |||||||||||
| 18,814,390 | 8,737,377 | — | 27,551,767 | |||||||||||||
| 34,307,985 | 2,939,563 | 163,575 | 37,083,973 | |||||||||||||
| 25,460,163 | 8,848,390 | 568 | 34,307,985 | |||||||||||||
Corresponding figures for 2003 are given below current year’s figures
| a) | Rs. 239,431 (2003 : 106,612) pursuant to issue of shares under Wipro Employee Stock Option Plan. | |||
| b) | Additions to General Reserves includes : | |||
| March 31, 2004 | March 31, 2003 | |||||||
| Transfer from Profit and Loss account | 2,700,132 | 7,942,659 | ||||||
| Equity in earnings of affiliates as of March 31, 2003 : | ||||||||
| Wipro GE Medicals Systems Private Limited | — | 771,849 | ||||||
| WeP Peripherals Ltd. | — | 22,869 | ||||||
Total | 2,700,132 | 8,737,377 | ||||||
88
Table of Contents
WIPRO LIMITED — CONSOLIDATED
(Rs. in 000s)
| As of March 31, | ||||||||||
| Note Reference | 2004 | 2003 | ||||||||
SCHEDULE 3 SECURED LOANS | ||||||||||
From Banks | ||||||||||
| Cash credit facility | (a) | 945,791 | 495,687 | |||||||
From Financial Institutions | ||||||||||
| Asset Credit Scheme | (b) | — | 28,200 | |||||||
Development loan from Karnataka Government | (c) | 1,675 | 1,675 | |||||||
| 947,466 | 525,562 | |||||||||
Notes :
| (a) | Secured by hypothecation of stock-in-trade, book debts, stores and spares, and secured/to be secured by a second mortgage over certain immovable properties. | |||
| (b) | Secured by hypothecation of specific machinery/assets. | |||
| (c) | Secured by a pari-passu second mortgage over immovable properties at Mysore and hypothecation of movable properties other than inventories, book debts and specific equipments referred to in Note (a) above. | |||
| As of March 31, | ||||||||
| 2004 | 2003 | |||||||
SCHEDULE 4 UNSECURED LOANS | ||||||||
| Interest free loan from State Government | 104,625 | 64,199 | ||||||
| Loans from state financial institutions | 1,940 | 1,250 | ||||||
| 106,565 | 65,449 | |||||||
89
Table of Contents
WIPRO LIMITED — CONSOLIDATED
SCHEDULE 5 FIXED ASSETS
| (Rs. in 000s) |
| Particulars | GROSS BLOCK | PROVISION FOR DEPRECIATION | NET BLOCK | |||||||||||||||||||||||||||||||||||||
| As of | As of | As of | Depreciation | As of | As of | As of | ||||||||||||||||||||||||||||||||||
| April 1, | Deductions/ | March 31, | April 1, | for the | Deductions/ | March 31, | March 31, | March 31, | ||||||||||||||||||||||||||||||||
| 2003 | Additions | adjustments | 2004 | 2003 | period | adjustments | 2004 | 2004 | 2003 | |||||||||||||||||||||||||||||||
| Land | 744,874 | 186,385 | 187,000 | 744,259 | 9,047 | 3,537 | — | 12,584 | 731,675 | 735,827 | ||||||||||||||||||||||||||||||
| Buildings | 2,123,840 | 910,594 | — | 3,034,434 | 173,707 | 99,370 | — | 273,077 | 2,761,357 | 1,950,133 | ||||||||||||||||||||||||||||||
| Railway siding | 12 | — | — | 12 | 12 | — | — | 12 | — | — | ||||||||||||||||||||||||||||||
| Plant and Machinery | 7,834,170 | 1,925,749 | 671,126 | 9,088,793 | 5,055,817 | 1,429,776 | 635,122 | 5,850,471 | 3,238,322 | 2,778,353 | ||||||||||||||||||||||||||||||
| Furniture, fixtures and equipment | 1,571,088 | 368,758 | 44,238 | 1,895,608 | 820,979 | 294,616 | 35,700 | 1,079,895 | 815,713 | 750,109 | ||||||||||||||||||||||||||||||
| Vehicles | 566,714 | 268,768 | 53,549 | 781,933 | 259,616 | 138,456 | 31,103 | 366,969 | 414,964 | 307,098 | ||||||||||||||||||||||||||||||
| Technical Know-how | 10,378 | — | — | 10,378 | 10,378 | — | — | 10,378 | — | — | ||||||||||||||||||||||||||||||
| Patents and trademark | 2,034 | 51,691 | 2,034 | 51,691 | 1,159 | 6,092 | 1,159 | 6,092 | 45,599 | 875 | ||||||||||||||||||||||||||||||
Total | 12,853,110 | 3,711,945 | 957,947 | 15,607,108 | 6,330,715 | 1,971,847 | 703,084 | 7,599,478 | 8,007,630 | 6,522,395 | ||||||||||||||||||||||||||||||
| a. | Land includes leasehold land Rs. 9,978 (2003 : Rs. 9,978), | |||
| b. | Buildings : | |||
| i) | Includes shares worth Rs. 2 (2003 : Rs. 2), | |||
| ii) | Includes leasehold land/property Rs. 4,241 (2003 : Rs. 4,241) and | |||
| iii) | Is net of depreciation during construction period. | |||
90
Table of Contents
WIPRO LIMITED — CONSOLIDATED
SCHEDULE 6 INVESTMENTS
| (Rs. in 000s except share numbers and face value) | As of March 31, | |||||||||||
| All shares are fully paid up unless otherwise stated | Number | 2004 | 2003 | |||||||||
Investments — Long Term (at cost) | ||||||||||||
Investment in Affiliates | ||||||||||||
| Wipro GE Medical Systems Private Ltd. (refer Note below) | 380,799 | 400,599 | ||||||||||
| WeP Peripherals Ltd. | 160,740 | 133,460 | ||||||||||
| 541,539 | 534,059 | |||||||||||
Investments in equity shares of other companies | ||||||||||||
Quoted | — | 208 | ||||||||||
Unquoted | 745 | 477 | ||||||||||
Other Investments Unquoted | — | 47,958 | ||||||||||
Investments — short term: | ||||||||||||
In money market mutual funds | ||||||||||||
| IL & FS (10,000,000 units purchased during the year) | 56,263,256 | 562,633 | — | |||||||||
| Alliance Capital Mutual Fund (7,647,786 units purchased during the year) | 50,518,508 | 505,185 | — | |||||||||
| Pioneer ITI Mutual Fund (1,780,269 units redeemed during the year) | — | — | 741,000 | |||||||||
| Prudential ICICI Mutual Fund (85,157,070 units purchased/116,005,739 units redeemed during the year) | 207,587,735 | 2,371,522 | 1,458,900 | |||||||||
| HDFC Mutual Fund (55,704,904 units purchased/43,791,944 units redeemed during the year) | 229,134,103 | 2,602,873 | 1,424,000 | |||||||||
| Standard Chartered Mutual Fund (60,983,216 units purchased 49,945,186 units redeemed during the year) | 199,548,451 | 2,066,527 | 1,007,400 | |||||||||
| Reliance Mutual Fund (57,400,291 units purchased/30,786,241 units redeemed during the year) | 143,112,339 | 1,785,397 | 626,100 | |||||||||
| Zurich India Mutual Fund (437,506,511 units redeemed during the year) | — | — | 515,900 | |||||||||
| Templeton India (36,156 units redeemed during the year) | 128,406 | 163,337 | — | |||||||||
| Templeton TMA (271,953 units purchased/507,906 units redeemed during the year) | 1,315,500 | 1,576,416 | — | |||||||||
| Templeton Floating Fund (4,298,023 units purchased during the year) | 15,769,491 | 157,790 | — | |||||||||
| Franklin Templeton India Mutual Fund (9,371,984 units purchased during the year) | 9,573,977 | 102,869 | 252,800 | |||||||||
| Deutsche MF (22,784,585 units purchased/40,996,946 units redeemed during the year) | 57,186,134 | 577,797 | — | |||||||||
| ING MF (4,660,879 units purchased/5,106,683 units redeemed during the year) | 34,182,141 | 367,940 | — | |||||||||
| Can Liquid MF (23,151,167 units purchased during the year) | 49,710,053 | 499,253 | — | |||||||||
| Sundaram MF (16,996,339 units purchased) | 17,079,320 | 172,337 | — | |||||||||
| Cholamandalam Mutual Fund (11,000,000 units purchased during the year) | 17,647,075 | 176,571 | — | |||||||||
| Kotak Mutual Fund (21,884,021 units purchased/13,422,231 units redeemed during the year) | 114,719,682 | 1,317,544 | 541,500 | |||||||||
| J M Mutual Fund (86,955,245 units purchased/102,748,768 units redeemed during the year) | 140,373,121 | 1,406,312 | 361,300 | |||||||||
| DSP Merrill Lynch Mutual Fund (44,524,705 units purchased/62,922,332 units redeemed during the year) | 45,887,314 | 459,332 | 182,500 | |||||||||
| SBI Insta Cash (5,125,144 units purchased during the year) | — | — | 63,000 | |||||||||
| HSBC Cash fund (11,295,862 units redeemed during the year) | 20,221,296 | 206,757 | — | |||||||||
| Birla Mutual Fund (17,051,388 units purchased/10,245,680 units redeemed during the year) | 136,478,004 | 1,438,896 | 639,000 | |||||||||
| 18,517,288 | 7,813,400 | |||||||||||
| Total | 19,059,572 | 8,396,102 | ||||||||||
Note : Equity investments in this company carry certain restrictions on transfer of shares that is normally provided for in joint venture/venture funding Agreement.
91
Table of Contents
WIPRO LIMITED — CONSOLIDATED
(Rs. in 000s)
| As of March 31, | ||||||||
| 2004 | 2003 | |||||||
SCHEDULE 7 INVENTORIES | ||||||||
| Stores and Spares | 31,509 | 25,952 | ||||||
| Raw Materials | 551,403 | 398,216 | ||||||
| Stock-in-process | 159,523 | 119,028 | ||||||
| Finished goods | 549,587 | 467,331 | ||||||
| 1,292,022 | 1,010,527 | |||||||
| Basis of stock valuation : | ||||||||
| Raw materials, stock-in-process and stores and spares at or below cost. | ||||||||
| Finished products at cost or net realisable value, whichever is lower. | ||||||||
SCHEDULE 8 SUNDRY DEBTORS | ||||||||
(Unsecured) | ||||||||
Over Six Months | ||||||||
| Considered good | 459,409 | 694,372 | ||||||
| Considered doubtful | 720,024 | 643,921 | ||||||
| 1,179,433 | 1,338,293 | |||||||
Others | ||||||||
| Considered good | 11,436,910 | 7,908,270 | ||||||
| Considered doubtful | — | 17,648 | ||||||
| 11,436,910 | 7,925,918 | |||||||
| Less : Provision for doubtful debts | 720,024 | 661,569 | ||||||
| 11,896,319 | 8,602,642 | |||||||
SCHEDULE 9 CASH AND BANK BALANCES | ||||||||
Cash and cheques on hand | 220,173 | 498,387 | ||||||
Balances with scheduled banks | ||||||||
| On Current account | 690,518 | 169,506 | ||||||
| In Deposit account | 51,012 | 1,468,034 | ||||||
Balances with other banks in current account | ||||||||
| Midland Bank, UK | 437,758 | 428,915 | ||||||
| Wells Fargo, USA | 1,612,528 | 1,575,159 | ||||||
| Nations Bank | 5,653 | — | ||||||
| Bank of America, USA | 183,999 | 44,068 | ||||||
| Standard Chartered Bank | — | 312 | ||||||
| Shanghai C&S Bank | — | 1,181 | ||||||
| South Trust Bank | — | 2,800 | ||||||
| Hongkong & Shanghai Bank | 13,745 | 13,462 | ||||||
| Bank of Tokyo | — | 8,230 | ||||||
| Bank of Montreal | 1,678 | — | ||||||
| Citibank | 98 | — | ||||||
| Saudi British Bank | 24,567 | — | ||||||
| Standchart UAE | 969 | — | ||||||
| Great Western Bank | — | 25 | ||||||
| 3,242,698 | 4,210,079 | |||||||
| Maximum balances during the year | ||||||||
| Midland Bank, UK | 437,758 | 780,682 | ||||||
| Wells Fargo, USA | 3,567,801 | 2,396,512 | ||||||
| Nations Bank | 5,653 | 97,627 | ||||||
| Deutsche Bank | — | 487,942 | ||||||
| Societe General | — | 460,378 | ||||||
| Bank of America | 183,999 | 97,397 | ||||||
| Standard Chartered Bank | — | 5,276 | ||||||
| Shanghai C&S Bank | — | 3,655 | ||||||
| South Trust Bank | — | 2,800 | ||||||
| Hongkong & Shanghai Bank | 325,130 | 13,462 | ||||||
| Bank of Tokyo | — | 8,230 | ||||||
| Saudi British Bank | 24,567 | — | ||||||
| First Chicago | — | 979 | ||||||
| Citibank | 98 | 1,949 | ||||||
| FCC National Bank | — | 976 | ||||||
| Standchart UAE | 6,344 | — | ||||||
| Chase Manhattan | — | 1,025 | ||||||
| Great Western Bank | — | 25 | ||||||
| Bank of Montreal | 39,177 | — | ||||||
92
Table of Contents
WIPRO LIMITED — CONSOLIDATED
(Rs. in 000s)
| As of March 31, | ||||||||
| 2004 | 2003 | |||||||
SCHEDULE 10 LOANS AND ADVANCES | ||||||||
| (Unsecured, considered good unless otherwise stated) | ||||||||
| Advances recoverable in cash or in kind or for value to be received | ||||||||
| Considered good | 2,126,969 | 1,726,893 | ||||||
| Considered doubtful | 77,359 | 72,694 | ||||||
| 2,204,328 | 1,799,587 | |||||||
| Less : Provision for doubtful advances | 77,359 | 72,694 | ||||||
| 2,126,969 | 1,726,893 | |||||||
| Certificate of deposits with foreign banks | — | 2,463,056 | ||||||
| Inter Corporate Deposits : | ||||||||
| GE Capital Services India | — | 258,803 | ||||||
| Citicorp Financial Services Limited | — | 27,000 | ||||||
| — | 285,803 | |||||||
| Other Deposits (refer Note below) | 854,028 | 637,206 | ||||||
| Advance income-tax (net of provision) | 587,657 | 747,021 | ||||||
| Balances with excise and customs | 29,672 | 16,699 | ||||||
| Unbilled Services | 2,085,403 | 1,380,944 | ||||||
| 5,683,729 | 7,257,622 | |||||||
| Note : | ||||||||
| Other Deposits include Rs. 25,000 (2003 : Rs. 25,000) security deposits for premises with a firm in which a director is interested. | ||||||||
SCHEDULE 11 LIABILITIES | ||||||||
| Sundry Creditors | 3,153,471 | 2,295,755 | ||||||
| Unclaimed dividends | 1,491 | 1,588 | ||||||
| Advances from customers | 874,078 | 755,942 | ||||||
| Other liabilities | 4,889,947 | 2,919,905 | ||||||
| Unbilled Services | 363,330 | 359,902 | ||||||
| Interest accrued but not due on loans | — | 176 | ||||||
| 9,282,317 | 6,333,268 | |||||||
SCHEDULE 12 PROVISIONS | ||||||||
| Employee retirement benefits | 683,359 | 521,763 | ||||||
| Proposed dividend | 931,039 | 232,564 | ||||||
| Proposed one-time dividend | 5,818,979 | — | ||||||
| Tax on proposed dividend | 864,846 | 29,797 | ||||||
| 8,298,223 | 784,124 | |||||||
93
Table of Contents
WIPRO LIMITED — CONSOLIDATED
(Rs. in 000s)
| Year ended March 31, | ||||||||
| 2004 | 2003 | |||||||
SCHEDULE 13 OTHER INCOME | ||||||||
| Dividend from Mutual Funds | 779,983 | 26,560 | ||||||
| Interest on debt instruments and others | 25,978 | 172,603 | ||||||
| Interest on Income tax refund | — | 54,120 | ||||||
| Rental Income | 45,030 | 25,266 | ||||||
| Profit on Sale of Investments | (43,553 | ) | 410,360 | |||||
| Profit on disposal of fixed assets (refer Note 7) | 108,344 | 7,243 | ||||||
| Difference in exchange — Net (refer Note 10) | 297,325 | 297,085 | ||||||
| Brand fees | 22,050 | 53,016 | ||||||
| Royalty | — | 19,000 | ||||||
| Provision no longer required written back | 33,652 | 69,687 | ||||||
| Miscellaneous Income | 97,186 | 47,022 | ||||||
| 1,365,995 | 1,181,962 | |||||||
| Tax deducted at source Rs. 74,747 (2003 : Rs. 119,430) | ||||||||
SCHEDULE 14 COST OF GOODS SOLD | ||||||||
Raw materials, Finished and Process Stocks(refer Schedule 17) | 8,945,721 | 7,767,033 | ||||||
| Stores and Spares | 200,224 | 172,383 | ||||||
| Power and Fuel | 461,642 | 336,840 | ||||||
| Salaries, wages and bonus | 8,439,366 | 5,288,348 | ||||||
| Contribution to provident and other funds | 300,185 | 191,756 | ||||||
| Gratuity and pension | 306,504 | 173,594 | ||||||
| Workmen and Staff welfare | 239,620 | 148,538 | ||||||
| Insurance | 86,092 | 25,423 | ||||||
| Repairs to factory buildings | 14,719 | 11,986 | ||||||
| Repairs to Plant & Machinery | 474,543 | 421,170 | ||||||
| Rent | 307,489 | 217,650 | ||||||
| Rates and Taxes | 11,533 | 30,746 | ||||||
| Packing | 94,805 | 82,661 | ||||||
| Travelling and allowances | 12,693,303 | 8,472,040 | ||||||
| Depreciation | 1,607,901 | 1,180,833 | ||||||
| Technical fees | 329,503 | 207,290 | ||||||
| Miscellaneous | 4,717,854 | 2,866,433 | ||||||
| Less: Capitalized | (139,948 | ) | (155,995 | ) | ||||
| 39,091,056 | 27,438,729 | |||||||
94
Table of Contents
WIPRO LIMITED — CONSOLIDATED
(Rs. in 000s)
| Year ended March 31, | ||||||||
| 2004 | 2003 | |||||||
SCHEDULE 15 SELLING, GENERAL AND ADMINISTRATIVE EXPENSES | ||||||||
| Salaries, wages and bonus | 1,879,444 | 1,294,086 | ||||||
| Contribution to provident and other funds | 47,695 | 38,629 | ||||||
| Gratuity and pension | 61,249 | 38,876 | ||||||
| Workmen and Staff welfare | 206,710 | 146,407 | ||||||
| Insurance | 52,087 | 10,385 | ||||||
| Repairs to buildings | 14,591 | 3,943 | ||||||
| Rent | 154,654 | 128,248 | ||||||
| Rates and taxes | 57,372 | 66,624 | ||||||
| Carriage and freight | 155,107 | 116,466 | ||||||
| Commission on sales | 98,879 | 67,756 | ||||||
| Auditors’ remuneration and expenses | ||||||||
| Audit fees | 7,077 | 6,567 | ||||||
| For certification including tax audit | 1,029 | 1,410 | ||||||
| Reimbursement of expenses | 282 | 505 | ||||||
| Advertisement and sales promotion | 571,640 | 405,804 | ||||||
| Loss on sale of fixed assets | 6,917 | 6,470 | ||||||
| Directors’ fees | 188 | 128 | ||||||
| Depreciation | 363,946 | 391,417 | ||||||
| Travelling and allowances | 3,252,952 | 2,554,828 | ||||||
| Communication | 185,481 | 221,399 | ||||||
| Provision/write off of bad debts | 131,940 | 180,046 | ||||||
| Miscellaneous | 1,309,036 | 762,583 | ||||||
| 8,558,276 | 6,442,577 | |||||||
SCHEDULE 16 INTEREST | ||||||||
| On fixed loans | 8,768 | 6,022 | ||||||
| Other | 26,299 | 24,223 | ||||||
| 35,067 | 30,245 | |||||||
SCHEDULE 17 RAW MATERIALS, FINISHED AND PROCESS STOCKS | ||||||||
Consumption of raw materials and bought out components | ||||||||
| Opening stocks | 398,216 | 439,930 | ||||||
| Add : Purchases | 5,728,829 | 4,688,657 | ||||||
| Less : Closing stocks | 551,403 | 398,216 | ||||||
| 5,575,642 | 4,730,371 | |||||||
Purchase of finished products for sale | 3,492,830 | 3,172,864 | ||||||
(Increase)/decrease in finished and process stocks | ||||||||
| Opening stock | : | In process | 119,028 | 84,722 | ||||||||
| : | Finished products | 467,331 | 365,435 | |||||||||
| Less : Closing stocks | : | In process | 159,523 | 119,028 | ||||||||
| : | Finished products | 549,587 | 467,331 | |||||||||
| (122,751 | ) | (136,202 | ) | |||||||||
| 8,945,721 | 7,767,033 | |||||||||||
| SCHEDULE 18 NON-RECURRING/EXTRAORDINARY ITEMS | ||||||||||||
| Loss of discontinued ISP business | — | 352,195 | ||||||||||
| — | 352,195 | |||||||||||
95
Table of Contents
WIPRO LIMITED — CONSOLIDATED
SCHEDULE 19 SIGNIFICANT ACCOUNTING POLICIES
Accounting convention
The preparation of consolidated financial statements in conformity with Indian generally accepted accounting principles requires management to make estimates and assumptions that affect the reported amounts of assets and liabilities, revenues and expenses and disclosure of contingent assets and liabilities. Actual results could differ from these estimates.
Basis of preparation of financial statements :
The accompanying consolidated financial statements have been prepared in accordance with Accounting Standard 21 ‘Consolidated Financial Statements’ and Accounting Standard 23 ‘Accounting for Investments in Associates in Consolidated Financial Statements.
Principles of consolidation :
The consolidated financial statements include the financial statements of Wipro and all of its subsidiaries, which are more than 50% owned and controlled and its affiliates where the group holds more than 20% of voting power and has significant influence. All material inter-company accounts and transactions are eliminated on consolidation. The group, accounts for investments in affiliates by the equity method.
Revenue recognition
| • | Sales include applicable sales tax unless separately charged, export incentives, and are net of discounts | |||
| • | Sales are recognized on despatch, except in the following cases : | |||
| - | Consignment sales are recognized on receipt of statement of account from the agent | |||
| - | Sales, which are subject to detailed acceptance tests, revenue is reckoned based on milestones for billing, as provided in the contracts | |||
| - | Revenue from software development services includes revenue from time and material and fixed price contracts. Revenue from time and material contracts are recognized as related services are performed. With reference to fixed price contracts revenue is recognized in accordance with percentage of completion method of accounting | |||
| • | Export incentives are accounted on accrual basis and include estimated realizable values/benefits from special import licenses and Advance licenses | |||
| • | Agency commission is accrued on shipment of consignment by principal | |||
| • | Maintenance revenue is considered on acceptance of the contract and is accrued over the period of the contract | |||
| • | Other income is recognized on accrual basis. | |||
Fixed Assets and Depreciation
Fixed assets are stated at historical cost less depreciation.
Interest on borrowed money allocated to and utilized for fixed assets, pertaining to the period up to the date of capitalization is capitalized. Assets acquired on hire purchase are capitalized at the gross value and interest thereon is charged to Profit and Loss account. Renewals and replacement are either capitalized or charged to revenue as appropriate, depending upon their nature and long-term utility.
In respect of leased assets, lease rentals payable during the year is charged to Profit and Loss account.
Depreciation is provided on straight line method at rates specified in Schedule XIV to the Companies Act, 1956, except on computers, furniture and fixture, office equipment, electrical installations (other than those at factories) and vehicles for which commercial rates are applied. In Wipro Inc., Enthink Inc. and Wipro Japan KK depreciation is provided on Written Down Value method.
Intangible Assets
Intangible assets are stated at cost less accumulated amortization. Intangible assets are amortized over their estimated useful life ranging between 5 years and 20 years.
Goodwill
The goodwill arising on consolidation/acquisition is not being amortised. It is tested for impairment on a periodic basis and written off if found impaired.
Investments
Long term Investments are stated at cost and short term investments are valued at lower of cost and net realizable value. Diminution in value is provided for where the management is of the opinion that the diminution is of permanent nature.
96
Table of Contents
WIPRO LIMITED — CONSOLIDATED
Inventories
Finished goods are valued at cost or net realizable value, whichever is lower. Other inventories are valued at cost less provision for obsolescence. Indigenously developed software products are valued at cost, which reflects their remaining economic life. Small value tools and consumables are charged to consumption on purchase. Cost is computed on weighted average basis.
Provision for retirement benefits
For employees covered under group gratuity scheme of LIC, gratuity charged to Profit and Loss account is on the basis of premium demanded by LIC. Provision for gratuity (for certain category of employees) and leave benefit for employee’s is determined as per actuarial valuation at the year-end. Defined contributions for provident fund and pension are charged to the Profit and Loss account based on contributions made in terms of applicable schemes, after netting off the amounts rendered surplus on account of employees separated from the Company. Certain categories of employees are entitled to pension benefits which are determined based on factors like years of services and cumulative basic salary. The Company has provided for the liability based on an actuarial valuation. The compensation paid if any, on voluntary retirement to the employees is charged off as an expense in the year of incurrence.
Deferred Tax
Tax expenses charged to Profit and Loss account is after considering deferred tax impact for the timing difference between accounting income and tax income. Deferred tax assets are recognized when there is a reasonable certainty that they will be realized. Deferred tax asset relating to unabsorbed business losses are recognized when there is a virtual certainty that there will be sufficient taxable profits to utilize them.
Foreign currency transactions
Foreign currency transactions are recorded at the spot rate at the beginning of the concerned month. Period-end balances of foreign currency assets and liabilities are restated at the closing rate/forward contract rate, as applicable. Resultant differences in respect of liabilities relating to acquisition of fixed assets are capitalized. Other differences on restatement or payment are adjusted to revenue account.
The forward premium/discount on forward contracts is recognized over the life of the contract. Forward premium is worked out based on the spot rate and contract rate on the date of transaction. Gain if any in respect of forward/options contract on account of movement in spot rate of the currency, is recognized only at the expiry of the contract.
In respect of non-integral operations assets and liabilities are translated at the exchange rate prevailing at the date of the balance sheet. The items in the profit & loss account are translated at the average exchange rate during the period. The differences arising out of the translation are included in translation reserve.
Research and Development
Revenue expenditure on research and development is charged to Profit and Loss account and capital expenditure is shown as addition to fixed assets.
NOTES TO ACCOUNTS
| 1. | Goodwill on consolidation as on the balance sheet date comprises of the following: : |
| (Rs. in 000s) | ||||
| Wipro Fluid Power Limited | 18,271 | |||
| Wipro Spectramind Services Limited | 3,726,185 | |||
| Wipro Healthcare IT Limited | 175,012 | |||
| Global energy practice of AMS Inc. | 950,165 | |||
| Wipro Nervewire | 382,724 | |||
| Total | 5,252,357 | |||
| In addition to the above, goodwill arising on account of the acquisition of subsidiaries/affiliates is shown under fixed assets which amounts to Rs. 85,542 as on the balance sheet date. | ||||
| 2. | In May 2003, the Company acquired Nervewire Inc. a Massachusetts based business and IT consulting company, serving customers in the financial services sector, for a consideration of Rs. 791,038. In addition to that, at the time of acquisition the Company has decided to restructure certain lease agreement entered into by Nervewire and in the process has made a provision for the estimated liability of Rs. 86,953. The amount of this liability is also considered in cost of acquisition. | |||
| 3. | In April 2003, the Company acquired Glucovita brand from Hindustan Lever Limited at a cost of Rs. 26,690, and also paid further Rs. 25,000 for non-compete agreement. Based on the performance of various other established brands in the market of similar products, the Company estimates that the useful life of the brand is 20 years and the cost of the brand is accordingly amortized over 20 years. Payment for non-compete agreement is amortized over the period of agreement. | |||
97
Table of Contents
WIPRO LIMITED — CONSOLIDATED
| 4. | In the year ended March 31, 2004 Wipro Spectramind Services Limited allotted 4,164,505 shares to its employees on the exercise of their right under employee stock options. On account of this, the ownership of Wipro Spectramind by the Company stand reduced to 93% from earlier 100%. As the exercise price paid was higher than their proportionate share in the net assets of Wipro Spectramind, the excess of Rs. 49,355 has been adjusted from the Goodwill on consolidation. | |||
| 5. | The Company has re-estimated the economic life of moulds and dies to a lesser period and consequent to that with effect from 1st April 2003 moulds and dies are being depreciated at 25% instead of 11.31% followed hitherto. On account of the change in depreciation rate, profit for the year is lower by Rs. 8,002. | |||
| 6. | The Company has a 49% equity interest in Wipro GE Medical Systems Private Limited (WGE), a joint venture with General Electric, USA. The joint venture agreement provides specific rights to the joint venture partners. The rights conferred to Wipro are primarily protective in nature and the Management believes that these specific rights do not confer joint control as defined in Accounting Standard 27 “Financial Reporting of Interest in Joint Venture”. Consequently, WGE is not considered as a joint venture and consolidation of financial statements are carried out as per equity method in terms of Accounting Standard 23 “Accounting for Investments in Associates in Consolidated Financial Statements”. | |||
| Investments in WeP Peripherals Ltd. have been accounted for by equity method. | ||||
| 7. | Profit on sale of assets includes Rs. 107,000 on account of consideration received for transfer of rights in the land allotted to the Company at the information technology park. | |||
| 8. | During the year the Company had transferred its investments in Wipro Nervewire to another US subsidiary Wipro Inc. After the transfer Wipro Nervewire and another US subsidiary Wipro Technology Inc. were merged with Wipro Inc. with effect from 31st March 2004. The transfer and merger mentioned above have no impact on the consolidated profit and loss account. | |||
| 9. | During the year the Company received a demand from the income tax department of Rs. 2,614,568 (Including interest demand of Rs. 764,485) for one of its assessment years. Un-provided liability on this account is Rs. 2,315,568. The tax demand is mainly on account of disallowance of deduction claimed by the company under Section 10A of the Income Tax Act, 1961, in respect of profits earned by its undertakings in software technology park at Bangalore. As per the opinion of the Company’s legal counsel the said disallowance is not tenable. The management of the Company is in the process of filing an appeal challenging the disallowance within the time available under the Income Tax Act. Considering the facts and nature of disallowance, the management believes that there will be a positive final outcome and there is no material impact on the financial statement. | |||
| 10. | As at the balance sheet date the group has forward/options contract for USD 948 Mn, out of which contracts which are not covered by underlying assets are USD 721 Mn. The Company has recognized proportionate premium on forward/option contracts to the extent Rs. 21,998 which has been included in difference in exchange in Schedule 13 to financials. The balance premium to be recognized in future is Rs. 152,692. | |||
| 11. | The breakup of accumulated net deferred tax asset is given below : | |||
| (Rs. in 000s) | ||||||||
| March 31, 2004 | March 31, 2003 | |||||||
| Deferred tax assets : | ||||||||
| Allowance for doubtful debts | 92,644 | 87,070 | ||||||
| Property plant and equipment – | ||||||||
| Depreciation differential | 49,115 | 74,272 | ||||||
| Employee stock incentive plan | 9,388 | 38,902 | ||||||
| Accrued expenses | 166,272 | 103,133 | ||||||
| Business losses carried forward | 168,879 | 162,532 | ||||||
| 486,298 | 465,909 | |||||||
| 12. | Provision for taxation comprises of following : |
| (i) | Rs. 758,929 (2003 : Rs. 556,117) in respect of foreign taxes, net of deferred tax benefit of Rs. 61,314 (2003 : Rs. 29,050) and write back of provision of Rs. Nil (2003 : Rs. 27,643) in respect of earlier years. | |||
| (ii) | Rs. 918,628 (2003 : Rs. 627,899) in respect of Indian Income Tax, which includes tax benefit from discontinued business of Rs. Nil (2003 : Rs. 156,236) deferred tax charge of Rs. 40,925 (2003 : Rs. 101,443) and provision of Rs. 251,390 (2003 : Rs. 200,850) in respect of earlier years. | |||
| (iii) | Rs. 3,000 (2003 : Rs. 2,500) in respect of Wealth Tax. | |||
| 13. | Company has instituted various Employee Stock Option Plans. The compensation committee of the board evaluates the performance and other criteria of employees and approves the grant of options. These options vest with employees over a specified period subject to fulfillment of certain conditions. Upon vesting, employees are eligible to apply and secure allotment |
98
Table of Contents
WIPRO LIMITED — CONSOLIDATED
of Company’s shares at a price determined on the date of grant of options. The particulars of options granted under various plans are tabulated below.
Stock option activity under the 1999 Plan is as follows :
| Year ended March 31, 2004 | ||||||||||||||||
| Weighted- | ||||||||||||||||
| Weighted- | average | |||||||||||||||
| Range of | average | remaining | ||||||||||||||
| Shares arising | exercise prices | exercise price | contractual life | |||||||||||||
| out of options | Rs. | Rs. | (months) | |||||||||||||
| Outstanding at the beginning of the period | 1,411,358 | 1,024 to 1,086 | 1,085 | 30 | ||||||||||||
| 2,213,020 | 1,853 to 2,522 | 1,863 | 38 | |||||||||||||
| Forfeited during the period | (79,829 | ) | 1,086 | 1,086 | — | |||||||||||
| (113,650 | ) | 1,853 | 1,853 | — | ||||||||||||
| Exercised during the period | (145,752 | ) | 1,086 | 1,086 | — | |||||||||||
| Outstanding at the end of the period | 1,185,777 | 1,024 to 1,086 | 1,085 | 18 | ||||||||||||
| 2,099,370 | 1,853 to 2,522 | 1,863 | 26 | |||||||||||||
| Exercisable at the end of the period | 830,096 | 1,024 to 1,086 | 1,085 | 18 | ||||||||||||
| 944,967 | 1,853 to 2,522 | 1,863 | 26 | |||||||||||||
Stock option activity under the 2000 Plan is as follows :
| Year ended March 31, 2004 | ||||||||||||||||
| Weighted- | ||||||||||||||||
| Weighted- | average | |||||||||||||||
| Range of | average | remaining | ||||||||||||||
| Shares arising | exercise prices | exercise price | contractual life | |||||||||||||
| out of options | Rs. | Rs. | (months) | |||||||||||||
| Outstanding at the beginning of the period | 94,950 | 1,032 to 1,532 | 1,374 | 57 | ||||||||||||
| 5,519,481 | 1,586 to 2,375 | 1,596 | 59 | |||||||||||||
| 2,486,083 | 2,382 to 2,746 | 2,396 | 42 | |||||||||||||
| Forfeited during the period | (8,250 | ) | 1,032 to 1,532 | 1,325 | — | |||||||||||
| (327,760 | ) | 1,586 to 2,375 | 1,599 | — | ||||||||||||
| (214,900 | ) | 2,382 to 2,746 | 2,396 | — | ||||||||||||
| Exercised during the period | (900 | ) | 1,032 to 1,532 | 1,254 | — | |||||||||||
| (2,545 | ) | 1,586 to 2,375 | 1,586 | — | ||||||||||||
| Outstanding at the end of the period | 85,800 | 1,032 to 1,532 | 1,381 | 45 | ||||||||||||
| 5,189,176 | 1,586 to 2,375 | 1,596 | 47 | |||||||||||||
| 2,271,183 | 2,382 to 2,746 | 2,390 | 30 | |||||||||||||
| Exercisable at the end of the period | 19,459 | 1,032 to 1,532 | 1,376 | 45 | ||||||||||||
| 2,062,851 | 1,586 to 2,375 | 1,592 | 47 | |||||||||||||
| 1,021,732 | 2,382 to 2,746 | 2,390 | 30 | |||||||||||||
99
Table of Contents
WIPRO LIMITED — CONSOLIDATED
Stock option activity under the 2000 ADS Plan is as follows:
| Year ended March 31, 2004 | ||||||||||||||
| Weighted- | ||||||||||||||
| Weighted- | average | |||||||||||||
| Range of | average | remaining | ||||||||||||
| Shares arising | exercise prices | exercise price | contractual life | |||||||||||
| out of options | $ | $ | (months) | |||||||||||
| Outstanding at the beginning of the period | 83,800 | 20.75 to 30.050 | 25.98 | 54 | ||||||||||
| 616,550 | 34.90 to 41.375 | 38.31 | 45 | |||||||||||
| Forfeited during the period | (6,700 | ) | 25.90 to 29.030 | 27.63 | — | |||||||||
| (10,800 | ) | 36.40 to 41.375 | 39.85 | — | ||||||||||
| Exercised during the period | (5,550 | ) | 20.79 to 28.730 | 24.91 | — | |||||||||
| (40,413 | ) | 34.97 to 36.400 | 38.14 | — | ||||||||||
| Outstanding at the end of the period | 71,550 | 20.75 to 30.050 | 25.91 | 42 | ||||||||||
| 565,337 | 34.90 to 41.375 | 38.30 | 33 | |||||||||||
| Exercisable at the end of the period | 17,888 | 20.75 to 30.050 | 25.91 | 42 | ||||||||||
| 270,588 | 34.90 to 41.375 | 38.18 | 33 | |||||||||||
| 14. | The details of subsidiaries and affiliates are as follows : |
| Country of Incorporation | % Holding | |||||
a) | Name of the subsidiary | |||||
| Wipro Fluid Power Limited | India | 98% | ||||
| Wipro Inc. | USA | 100% | ||||
| Enthink Inc. | USA | — * | ||||
| Wipro Spectramind Inc. | Bermuda | 100% | ||||
| Wipro Japan KK | Japan | 100% | ||||
| Wipro Chandrika Limited | India | 100% | ||||
| Wipro Trademarks Holding Limited | India | 100% | ||||
| Wipro Travel Services Limited | India | 100% | ||||
| Wipro HealthCare IT Limited | India | 100% | ||||
| Wipro Spectramind Services Limited | India | 93% | ||||
| Wipro Holdings Mauritius Limited | Mauritius | 100% | ||||
| Wipro Holdings UK Limited | UK | — # | ||||
| Wipro Technology UK Limited | UK | — @ | ||||
| Wipro Consumer Care Limited | India | 100% | ||||
b) | Wipro Equity Reward Trust | India | Fully controlled trust | |||
c) | Grantor Trust | USA | Fully controlled trust | |||
d) | Name of the affiliates | |||||
| Wipro GE Medical Systems Private Limited | India | 49% | ||||
| WeP Peripherals Limited | India | 40% |
| * | 98% owned by Wipro Inc. | |
| # | Fully owned by Wipro Holdings Mauritius Limited | |
| @ | Fully owned by Wipro Holdings UK Limited |
100
Table of Contents
WIPRO LIMITED — CONSOLIDATED
| 15. | Diluted EPS is calculated based on treasury stock method for ESOP outstanding. | |||
| 16. | The Company has the following transactions with related parties : | |||
(Rs. in 000s)
| As of March 31, | ||||||||
| 2004 | 2003 | |||||||
Wipro GE Medical Systems Private Ltd. : | ||||||||
| Revenues from sale of computer equipment and administrative and management support services | 116,490 | 33,121 | ||||||
| Fees for usage of trade mark | — | 19,000 | ||||||
WeP Peripherals Ltd. : | ||||||||
| Revenues from sale of computer equipment and services | 8,002 | 6,163 | ||||||
| Fees for usage of Brand/trade mark | 22,040 | 53,016 | ||||||
| Interest received on debentures | — | — | ||||||
| Payments for services | 4,047 | 14,131 | ||||||
| Purchase of printers | 79,892 | 85,531 | ||||||
Azim Premji Foundation : | ||||||||
| Revenues from sale of computer equipment and services | 1,966 | 2,029 | ||||||
Chairman and Managing Director : | ||||||||
| Payment of lease rentals | 1,425 | 1,200 | ||||||
Payment to Non-Executive Directors : | ||||||||
| Dr. Ashok Ganguly | 800 | 800 | ||||||
| Narayan Vaghul | 800 | 800 | ||||||
| Prof. Eisuke Sakakibara | Yen 4,800 | Yen 4,800 | ||||||
| Dr. Jagdish N. Sheth | $ | 25 | $ | 33.5 | ||||
| P. M. Sinha | 1,000 | 1,000 | ||||||
| B. C. Prabhakar | 400 | 400 | ||||||
(Rs. in 000s)
| As of March 31, | ||||||||
| 2004 | 2003 | |||||||
| The following is the listing of receivables from and payables to related party as on the balance sheet date : | ||||||||
Receivables : | ||||||||
| Wipro GE Medical Systems Private Limited | 31,321 | 87,410 | ||||||
| WeP Peripherals Limited | 3,043 | 13,941 | ||||||
| Azim Premji Foundation | 43 | 158 | ||||||
| Hasham Premji | 25,000 | 25,000 | ||||||
Payables : | ||||||||
| WeP Peripherals Ltd. | 34,459 | 20,098 | ||||||
| 17. | Corresponding figures for previous periods presented have been regrouped, where necessary, to confirm to this period classification. Current period figures are not comparable with the previous period figures on account of acquisition of various business/subsidiaries in last two year i.e., Wipro Spectramind Services Limited (BPO business) in July 2002; Wipro Healthcare IT Limited with effect from August 2002; Energy & Utilities Practice with effect from January 2003 and Wipro Nervewire (IT consulting business) with effect from May 2003 and also on account of discontinuation/sale of business relating to ISP. | |||
| 18. | Pursuant to the exemption granted by the Department of Company Affairs, Government of India, the Company is publishing only the consolidated financial statement of Wipro Limited including all its subsidiaries and the stand-alone financial statements of Wipro Limited. Item No. V G of Corporate Governance Report lists out the contacts for investors seeking financial statements and auditors’ report of the individual subsidiaries. | |||
101
Table of Contents
WIPRO LIMITED — CONSOLIDATED
CASH FLOW STATEMENT
(Rs. in 000s)
| Year ended March 31, | ||||||||
| 2004 | 2003 | |||||||
Cash flows from operating activities : | ||||||||
| Profit before tax from continuing operations | 12,031,823 | 10,317,484 | ||||||
| Adjustments to reconcile Net profit before tax and non recurring items to net cash provided by operating activities: | ||||||||
| Depreciation and amortization | 1,971,847 | 1,568,487 | ||||||
| Foreign currency translation gains | (132,771 | ) | (297,085 | ) | ||||
| Retirement benefits provision | 161,596 | 112,773 | ||||||
| Interest on borrowings | — | 30,245 | ||||||
| Dividend/interest | (762,408 | ) | (633,398 | ) | ||||
| Loss/(Gain) on sale of property, plant and equipment | (107,000 | ) | 6,470 | |||||
| Trade and other receivable | (3,670,414 | ) | (1,919,285 | ) | ||||
| Loans and advances | (359,890 | ) | (729,342 | ) | ||||
| Inventories (other than stock-in-trade land) | (281,495 | ) | (75,927 | ) | ||||
| Trade and other payables | 2,748,125 | 803,940 | ||||||
Net cash provided by operations | 11,599,409 | 9,184,362 | ||||||
| Direct taxes paid | (1,568,359 | ) | (1,848,699 | ) | ||||
Net cash provided by continuing operations | 10,031,050 | 7,335,663 | ||||||
Net cash provided by discontinuing operations | — | 27,284 | ||||||
Net cash provided by operations | 10,031,050 | 7,362,947 | ||||||
Cash flows from investing activities : | ||||||||
| Expenditure on property, plant and equipment (including advances) | (4,100,966 | ) | (2,523,048 | ) | ||||
| Proceeds from sale of property, plant and equipment | 121,863 | 103,530 | ||||||
| Purchase of investments | (10,706,517 | ) | (41,182,961 | ) | ||||
| Inter Corporate deposits placed/matured | 285,303 | 1,779,288 | ||||||
| Certificate of Deposits with foreign banks | 2,463,056 | 2,824,163 | ||||||
| Sale/maturities on Investments | 48,060 | 37,904,824 | ||||||
| Payment for acquisition, net of cash acquired | (465,267 | ) | (5,484,793 | ) | ||||
| Dividend/interest received | 777,850 | 245,478 | ||||||
Net cash used in investing activities | (11,576,618 | ) | (6,333,519 | ) | ||||
Cash flows from financing activities : | ||||||||
| Proceeds from exercise of Stock Option Plan grants | 238,600 | 106,809 | ||||||
| Share application money pending allotment | — | (1,177 | ) | |||||
| Dividends paid | (262,361 | ) | (232,466 | ) | ||||
| Proceeds from issuance/(repayment) of borrowings | 463,020 | — | ||||||
| Proceeds from issuance shares by subsidiary | 147,533 | 275,576 | ||||||
Net cash provided by/(used in) financing activities | 586,792 | 148,742 | ||||||
| Net increase/(decrease) in cash and cash equivalents during the year | (958,776 | ) | 1,178,170 | |||||
Cash and cash equivalents at the beginning of the period | 4,210,079 | 3,031,909 | ||||||
| Effect of Translation on cash balance | (8,605 | ) | — | |||||
Cash and cash equivalents at the end of the period | 3,242,698 | 4,210,079 | ||||||
Note :
Figures for previous periods presented, have been regrouped wherever necessary, to confirm to this period classification.
102
Table of Contents
WIPRO LIMITED – CONSOLIDATED
| For and on behalf of the Board of Directors | ||||||
| Azim Hasham Premji | Vivek Paul | P. M. Sinha | ||||
| Chairman and Managing Director | Vice Chairman and Executive Officer | Director | ||||
| Suresh C. Senapaty | V. Ramachandran | B. C. Prabhakar | ||||
| Corporate Executive | Company Secretary | Director | ||||
| Vice President – Finance | ||||||
| Bangalore, April 16, 2004 | ||||||
AUDITOR’S CERTIFICATE
We have examined the above cash flow statement of Wipro Limited – consolidated for the year ended March 31, 2004. This statement is based on and in agreement with the corresponding Profit and Loss Account and Balance Sheet of the Company for the year ended March 31, 2004, covered by our report of even dated.
| for N.M. Raiji & Co., | ||
| Chartered Accountants | ||
| J.M. Gandhi | ||
| Partner | ||
| Membership No.: 37924 | ||
| Mumbai, April 16, 2004. |
103
Table of Contents
WIPRO LIMITED — CONSOLIDATED
Management Discussion and Analysis of Results for the year ended March 31, 2004 based on Consolidated Financial Statements
1.0 | Industry Structure and Developments | |
| Please refer to our discussions in the section titled“Operating and Financial Review and Prospects”in the Annual Report on Form 20-F filed with Securities and Exchange Commission (SEC) which is being circulated separately as an annexure to this Annual Report. | ||
1.1 | Opportunities and Threats | |
| Please refer to our discussions in the sections titled“Operating and Financial Review and Prospects”and“Risk Factors”in the Annual Report on Form 20-F filed with SEC which is being circulated separately as an annexure to this Annual Report. | ||
1.2 | Segment-wise or product-wise performance | |
| Please refer the“Segment-wise Business performance". | ||
1.3 | Outlook | |
| Please refer to our discussions in the section titled“Operating and Financial Review and Prospects”in the Annual Report on Form 20-F filed with SEC which is being circulated separately as an annexure to this Annual Report. | ||
1.4 | Risk and Concerns | |
| Please refer to our discussions in the section titled“Risk Factors”in the Annual Report on Form 20-F filed with SEC which is being circulated separately as an annexure to this Annual Report. | ||
2.0 | Internal Control | |
| Management maintains internal control systems designed to provide reasonable assurance that assets are safeguarded, transactions are executed in accordance with management’s authorisation and properly recorded, and accounting records are adequate for preparation of financial statements and other financial information. The internal audit function performs internal audit periodically to ascertain their adequacy and effectiveness. The internal audit function also carries out Operations Review Audits. The “Quality System” of the audit function has also been certified under ISO 9001:2000. It has also been accredited with “Commitment to Quality Improvement Award” by the Institute of Internal Auditors, USA. The audit committee periodically reviews the functions of internal audit. Further, pursuant to the requirements of Sarbanes Oxley Act, the CEO/CFO review and certify the disclosure controls and procedures on a quarterly basis. | ||
3.0 | Discussion on financial performance | |
3.1 | The financial statements are prepared in compliance with the requirements of Companies Act, 1956, and Generally Accepted Accounting Principles in India. The management of Wipro accepts the responsibility for the integrity and objectivity of these financial statements and the basis for various estimates and the judgement used in preparing the financial statements. | |
3.2 | Balance Sheet as on March 31, 2004 | |
3.2.1 | Share Capital | |
| The Company has an authorised share capital of Rs. 1,000 million comprising of 375 million equity shares of Rs. 2 each and 25 million redeemable preference shares of Rs. 10 each as of March 31, 2004. | ||
| Paid up Capital | ||
| The Company has a paid up capital of Rs. 466 million comprising of 232,759,152 equity shares of Rs. 2 each as of March 31, 2004. | ||
| Equity Shares | ||
| The Company has instituted various Employee Stock Option Plans (ESOP), these options vest with the employees over a specified period subject to employee fulfilling certain conditions. Upon vesting, the employees are eligible to apply and secure allotment of the Company’s shares at a price determined on the date of grant of options. During the year, 195,160 shares were allotted on exercise of the options under varius Employee Stock Option Plans instituted by the Company. | ||
| The Board of Directors have recommended issue of bonus shares to shareholders (including ADS holders) in the ratio of two additional shares for every one share held subject to shareholder approval in the Annual General Meeting scheduled in June 2004. | ||
3.2.2 | Reserves and Surplus | |
| Share Premium Account | ||
| Addition to Share premium comprises of premium received on exercise of stock options, amounting to Rs. 239 million. | ||
3.2.3 | Secured Loans | |
| The Company utilizes cash credit facilities under a multiple banking arrangement to for an effective cash management. The Company has availed cash credit facilities of Rs. 946 million as on March 31, 2004. |
104
Table of Contents
WIPRO LIMITED – CONSOLIDATED
3.2.4 | Unsecured Loans | |
| The Company has availed certain incentives provided by State Governments. The Sales Tax collection on sales is required to be remitted after a specified time period. Further, the Company has also received certain interest free loans from State Government. | ||
3.2.5 | Minority Interest | |
| Minority interest of Rs. 164 million as at the balance sheet represents share of minority shareholders in the assets of Wipro Spectramind Services Limited (93%) and Wipro Fluid Power Limited (98%). | ||
| As of March 31, 2003, the Company held 100% of the outstanding equity shares of Wipro Spectramind. As of March 31, 2003, Wipro Spectramind had 9,329,762 employee stock options outstanding under the Wipro Spectramind option plan. During the year ended March 31, 2004, 4,178,294 options vested were exercised. As a result of the option exercise, the Company’s ownership interest in Wipro Spectramind reduced to 93%. Of the 4,178,294 shares arising out of these option exercises, 3,996,387 shares are covered by a share purchase feature that entitles the Company to repurchase these shares at fair value and also gives the employee the right to sell the shares back to the Company at fair value. The Company and the employee can exercise this repurchase right after six months from the date of the option exercise. | ||
3.2.6 | Fixed Assets | |
| Goodwill on consolidation | ||
| The excess of consideration paid over the book value of assets acquired has been recognised as goodwill in accordance with Accounting Standard 21 on Consolidated Financial Statements. Goodwill arising on account of acquisition of subsidiaries and affiliates is not being amortized but is reviewed periodically for impairment, impairment (if any) is charged to the income statement for the year. Goodwill in the balance sheet represents goodwill arising on acquisition of the following: |
| (Rs. in millions) | ||||
| Wipro Fluid Power Limited | 18 | |||
| Wipro Spectramind Services Limited | 3,726 | |||
| Wipro Healthcare IT Limited | 175 | |||
| Global energy practice of AMS Inc. | 950 | |||
| Wipro Nervewire | 383 | |||
| 5,252 | ||||
Please refer notes 1, 2, and 4 in the section – Notes to Accounts of the Consolidated Financials.
During the year ended March 31, 2004 the Company has carried out impairment review for goodwill of Wipro Fluid Power Limited, Wipro Spectramind Services Limited, Wipro Healthcare IT Limited and Global energy practice. The fair value of the business was found to exceed its carrying value indicating no impairment.
Additions to Fixed Assets
During the year, the Company invested Rs. 4,101 million on Fixed Assets. The unit-wise spends are outlined below :
| (Rs. in millions) | ||||||||
| Business Unit | 2004 | 2003 | ||||||
| Global IT Services and Products | 3,470 | 2,253 | ||||||
| India and AsiaPac IT Services and Products | 97 | 147 | ||||||
| Consumer Care and Lighting | 103 | 14 | ||||||
| Others | 431 | 109 | ||||||
Total | 4,101 | 2,523 | ||||||
The Company enhanced its capacity in development centres from 12,773 seats in fiscal 2003 to 17,893 seats in fiscal 2004. In BPO services, the number of seats available for call centre agents increased from 3,257 in fiscal 2003 to 7,441 in fiscal 2004.
105
Table of Contents
WIPRO LIMITED — CONSOLIDATED
The above investments in capital assets resulted in the following additions to the gross block in Global IT Services and Products business segment.
| (Rs. in millions) | ||||||||
| Asset Category | 2004 | 2003 | ||||||
| Land — Freehold | 71 | 154 | ||||||
| — Leasehold | 10 | 57 | ||||||
| Building | 892 | 252 | ||||||
| Electricals | 211 | 76 | ||||||
| Plant & Machinery | 595 | 278 | ||||||
| Computers | 993 | 948 | ||||||
| Others | 698 | 475 | ||||||
Total | 3,470 | 2,240 | ||||||
| Depreciation | ||||
| The Company has provided depreciation either at the rates specified in Schedule XIV of the Companies Act, 1956, or at commercial rates which are higher than the rates specified in Schedule XIV, as detailed in Notes to Accounts in page no. 71. | ||||
| 3.2.7 | Investments | |||
| Purchase of Investments during the year | ||||
| Surplus cash generated by operations are invested in short term money market instruments. The Company follows a policy of investing in Bank FDs, Triple A rated ICDs and Mutual Funds. Investments are made in specific plan of Mutual Funds having a minimum corpus of Rs. 3,000 million with an overall ceiling to ensure that the Company’s investment is not more than 10% of the corpus of the fund. Investments in units of liquid mutual funds have increased from Rs. 7,813 million in fiscal 2003 to Rs. 18,517 million in fiscal 2004. | ||||
| 3.2.8 | Inventories | |||
| Inventories mainly comprise of computers, upgrades and spares of India and AsiaPac IT Services and Products and raw material and finished stocks of Wipro Consumer Care and Lighting and Wipro Fluid Power. Stock of inventory has increased from Rs. 1,011 million as on March 31, 2003 to Rs. 1,292 million as on March 31, 2004. Inventory of India and AsiaPac IT Services and Products comprises of 54% of the total inventory. The increase in inventory in India and AsiaPac IT Services and Products is mainly due to increased procurement of components and finished goods towards the end of the period to meet certain specific pending orders for execution in April 2004. In terms of number of days, inventory has declined from 26 days in fiscal 2003 to 23 days in fiscal 2004. | ||||
| 3.2.9 | Sundry Debtors | |||
| Sundry Debtors (net of provision) for the current year is at Rs. 11,896 million against 8,603 million in the previous year. Segment-wise break-up of sundry debtors is outlined below : | ||||
| (Rs. in millions) | ||||||||||||
| Business Unit | 2004 | 2003 | Increase (%) | |||||||||
| Global IT Services and Products | 8,101 | 5,955 | 36 | % | ||||||||
| India and AsiaPac IT Services and Products | 3,169 | 2,122 | 49 | % | ||||||||
| Consumer Care and Lighting | 227 | 197 | 15 | % | ||||||||
| Others | 398 | 329 | 21 | % | ||||||||
Total | 11,896 | 8,603 | 38 | % | ||||||||
In Global IT Services and Products, revenues have increased by 43% in fiscal 2004 as compared with fiscal 2003, days of sales outstanding for IT Services and Products have declined from 63 days in fiscal 2003 to 57 days in fiscal 2004. In India and AsiaPac IT Services and Products, increase in sundry debtors is on account of peaking of product sales towards the period end
106
Table of Contents
WIPRO LIMITED — CONSOLIDATED
| as well as growth in revenues of Products and Services by 16%. Days of sales outstanding have increased from 73 days in fiscal 2003 to 82 days in fiscal 2004 mainly due to peaking of sales in period end. | ||||
| Debtors outstanding for more than six months have declined from 3% of revenues in fiscal 2003 to 2% of revenues in fiscal 2004. Provision for doubtful debts has declined from 1.5% of sales in fiscal 2003 to 1.2% of sales in fiscal 2004. In absolute terms provision for doubtful debts has increased from Rs. 662 million to Rs. 720 million in fiscal 2004. | ||||
| 3.2.10 | Cash and Bank Balances | |||
| Cash and cheques in hand of Rs. 220 million have been banked in April 2004. | ||||
| 3.2.11 | Loans and advances | |||
| (Rs. in millions) | ||||||||||||
| Particulars | 2004 | 2003 | Increase (%) | |||||||||
| Advances recoverable in cash or in kind | 2,127 | 1,727 | 23 | % | ||||||||
| Certificate of deposits with foreign banks | — | 2,463 | — | |||||||||
| Unbilled Services | 2,085 | 1,381 | 51 | % | ||||||||
| Others | 1,472 | 1,687 | (13 | %) | ||||||||
Total | 5,684 | 7,258 | (22 | %) | ||||||||
| • | Loans and advances have declined from Rs. 7,258 million in the fiscal 2003 to Rs. 5,684 million in the fiscal 2004 principally on account of encashing certificate of deposits with foreign banks partially offset by the increase in advances recoverable in cash or kind and unbilled services. | |||
| • | In the fiscal 2001, the Company made equity offering in overseas capital markets. The proceeds of the offering were invested in certificate of deposits in foreign banks. In the fiscal 2004, the Company has repatriated these deposits back to India and invested in short term money market instruments and units of mutual funds. | |||
| • | Advances recoverable in cash or in kind have increased from Rs. 1,727 million to Rs. 2,127 million. This increase is mainly due to increase in Employee Advances. The number of onsite employees has increased by 64% from 3,156 as on March 31, 2003 to 5,185 as on March 31, 2004. | |||
| • | Unbilled services have increased on account of three factors. First, 15% increase in revenues from Fixed Price Projects in IT Services. Second, mismatch in the billing cycle of the customer in BPO Services and increase in revenues from BPO services by 130%. Third, increase in revenues from services by 39% in fiscal 2004 in India and AsiaPac IT Services and Products. | |||
| 3.2.12 | Current Liabilities and Provisions | |||
| Current Liabilities | ||||
| (Rs. in millions) | ||||||||||||
| Particulars | 2004 | 2003 | Increase (%) | |||||||||
| Sundry Creditors | 3,153 | 2,296 | 37 | % | ||||||||
| Advances from customers | 874 | 756 | 16 | % | ||||||||
| Unbilled Services | 363 | 360 | 1 | % | ||||||||
| Other Liabilities | 4,891 | 2,922 | 67 | % | ||||||||
Total | 9,282 | 6,333 | 47 | % | ||||||||
Sundry Creditors represent the amount payable to vendors for supply of goods and services. Sundry creditors have increased to Rs. 3,153 million from Rs. 2,296 million. Sundry creditors of India and AsiaPac IT Services and Products comprise of 54% of the total sundry creditors. The increase in sundry creditors is mainly on account of increase in consumption of raw material and finished goods in the last quarter of the year consequent to growth in product sales.
Other liabilities comprise of amounts due for operational expenses. Other liabilities have increased by Rs. 1,969 million from Rs. 2,922 million to Rs. 4,891 million. Other liabilities of Global IT Services and Products constitute to 78% of the total other
107
Table of Contents
WIPRO LIMITED — CONSOLIDATED
liabilities. The increase in other liabilities is mainly on account of retention of Rs. 459 million towards payments to overseas subcontractors for completion of work. The balance increase is represented by increase in employee dues payable on account of incentives, onsite salaries and withholding taxes payable thereon.
Provisions
| (Rs. in millions) | ||||||||||||
| Particulars | 2004 | 2003 | Increase | |||||||||
| Employee retirement benefits | 683 | 522 | 161 | |||||||||
| Proposed Dividend | 6,750 | 233 | 6,517 | |||||||||
| Tax on proposed dividend | 865 | 30 | 835 | |||||||||
Total | 8,298 | 784 | 7,514 | |||||||||
| • | Provisions of Rs. 683 million for employee retirement benefit represents Company’s liability towards employee leave encashment and gratuity, valued on actuarial basis. The Company provides a contribution defined pension scheme. The contribution is funded into a pension scheme administered by Life Insurance Corporation of India (LIC). For certain category of employees gratuity entitlement is funded through a fund managed by LIC. | |||
| • | For fiscal 2004, the Directors of the Company have proposed a cash dividend of Rs. 4/- per share on equity shares and one time cash dividend of Rs. 25/- per share. Provisions include Rs. 6,750 million towards proposed dividend and Rs. 865 million towards tax payable on distribution of dividends. | |||
| 3.3 | Result of Operations | |||
| 3.3.1 | Income from Sales and Services | |||
| (Rs. in millions) | ||||||||||||
| Revenues by Business Unit | 2004 | 2003 | Increase (%) | |||||||||
| Global IT Services and Products | 43,575 | 30,487 | 43 | % | ||||||||
| India and AsiaPac IT Services and Products | 9,762 | 8,395 | 16 | % | ||||||||
| Consumer Care and Lighting | 3,649 | 2,991 | 22 | % | ||||||||
| Others | 1,826 | 1,468 | — | |||||||||
Total | 58,812 | 43,341 | 36 | % | ||||||||
Global IT Services and Products
Global IT Services and Products accounts for 74% of the revenues of Wipro Limited consolidated. During the year, revenues grew by 43% from Rs. 30,487 million to Rs. 43,575 million.
This increase is attributable mainly to two factors. First, a 49% increase in revenue from Enterprise Services, a 36% increase in revenue from Technology Services and a 173% increase from BPO Services. Second, acquisition of Global Energy Practice in January 2003 and Wipro Nervewire in May 2003. The increase in revenue from Enterprise Services was principally driven by increased revenues from services provided to financial, retail and utility companies. The increase in revenues from Technology Services was primarily due to a 53% increase in revenues from Telecom and Internetworking division and a 35% increase in revenue from services provided in the areas of design and development of embedded software solutions to consumer electronics, automotive and computer hardware manufacturing companies. Revenue from BPO services increased mainly due to increase in the number of clients and increase in the scope and volume of services provided to the clients.
| Billed Man months by location - IT Services | 2004 | 2003 | Increase (%) | |||||||||
| Onsite | 46,192 | 30,138 | 53 | % | ||||||||
| Offshore | 85,001 | 64,384 | 32 | % | ||||||||
Total | 131,193 | 94,522 | 39 | % | ||||||||
108
Table of Contents
WIPRO LIMITED — CONSOLIDATED
| (Rs. in million) | ||||||||||||
| Revenue by location - IT Services | 2004 | 2003 | Increase (%) | |||||||||
| Onsite | 22,737 | 15,575 | 46 | % | ||||||||
| Offshore | 16,464 | 13,267 | 24 | % | ||||||||
Total | 39,201 | 28,842 | 36 | % | ||||||||
| Revenue by Project type - IT Services | 2004 | 2003 | ||||||
| Time & Material | 73 | % | 66 | % | ||||
| Fixed Price | 27 | % | 34 | % | ||||
Total | 100 | % | 100 | % | ||||
In IT Services, the volumes in terms of man months billed increased by 39% in fiscal 2004. The proportion of Time and Material contracts increased from 66% in fiscal 2003 to 73% in fiscal 2004. The proportion of revenues from onsite projects increased from 53% of total revenues in fiscal 2003 to 58% of total revenues in fiscal 2004.
IT Services added over 115 new customers during the year, new clients accounted for over 5% of the total revenues from IT Services. Customers with an annual Revenue of $5 million and above in IT Services increased to 39 in the year ended March 31, 2004, up from 27 in the year ended March 31, 2003.
India and AsiaPac IT Services and Products
India and AsiaPac IT Services and Products accounted for 17% of the total consolidated revenues of Wipro Limited. The increase in revenue has been mainly on account of 8% growth in revenues of manufactured and traded products and a growth of 39% in revenues from Services. The growth in services was driven by growth in Professional services, Solutions and Consulting businesses, both in India and Middle East & AsiaPac geographies.
Consumer Care and Lighting
Consumer Care and lighting accounts for 6% of total consolidated revenue of Wipro Limited. Sales of Consumer Care and Lighting increased by 22%. This was primarily attributable to increase in revenues from Toilet Soaps. Revenue from toilet soaps increased by 32.4% for fiscal 2004 as compared with the industry decline of 3.6% in toilet soaps for the year January to December 2003 (source: ORG data).
| 3.3.2 | Other Income | |||
| Other income of Rs. 1,366 million has increased by 16% as compared to last year : | ||||
| (Rs. in millions) | ||||||||||||
| Amount | ||||||||||||
| Particulars | March 31, 2004 | March 31, 2003 | Inc./(Dec.) | |||||||||
| Interest, Dividend and Profit on sales of Investments | 763 | 610 | 25 | % | ||||||||
| Profit on Sale of fixed assets | 108 | 7 | 1,443 | % | ||||||||
| Difference in exchange | 297 | 297 | — | |||||||||
| Others | 198 | 268 | (26 | %) | ||||||||
Total | 1,366 | 1,182 | 16 | % | ||||||||
| • | The surplus generated by operations is invested in short term money market instruments like units of mutual funds, deposits with Banks and Corporates. The return on investments is realised through dividends on mutual fund units, gain on sale of mutual fund units, interest on deposits with Banks, Corporates and other short term money market instruments. The total return on investments has increased from Rs. 610 million in the year ended March 31, 2003 to Rs. 763 million in the year ended March 31, 2004. The increase is on account of increase in average quantum of funds invested is partially offset by decline in the average yields. The average funds invested during the fiscal 2004 were Rs. 18,330 million compared |
109
Table of Contents
WIPRO LIMITED — CONSOLIDATED
to Rs. 14,877 million during fiscal 2003. The yield on investments declined from 4.3% in fiscal 2003 to 4.2% in fiscal 2004. This decline was mainly on account of the decline in the prevailing interest rates in the market partially offset by the increase in yield on account of repatriation of proceeds from the overseas equity offering in fiscal 2004. Funds invested overseas typically earn a lower yield than funds invested in India.
| • | Profit on sale of assets includes Rs. 107 million on account of consideration received for transfer of rights in the land allotted to the Company at the information technology park. |
| 3.3.3 | Cost of Goods Sold |
| (Rs. in millions) | ||||||||||||||||||||
| Particulars | March 31, 2004 | March 31, 2003 | ||||||||||||||||||
| Amount | % to sales | Amount | % to sales | Increase | ||||||||||||||||
| Raw materials, Finished and Process Stocks | 8,946 | 15.3 | % | 7,767 | 18.1 | % | 15 | % | ||||||||||||
| Salaries and manpower related costs | 9,286 | 15.9 | % | 5,802 | 13.5 | % | 60 | % | ||||||||||||
| Travelling and allowances | 12,693 | 21.8 | % | 8,472 | 19.8 | % | 50 | % | ||||||||||||
| Miscellaneous | 4,716 | 8.1 | % | 2,866 | 6.7 | % | 65 | % | ||||||||||||
| Others | 3,450 | 5.9 | % | 2,531 | 5.9 | % | 36 | % | ||||||||||||
Total | 39,091 | 67.0 | % | 27,438 | 64.0 | % | 42 | % | ||||||||||||
Income from sales and services | 58,350 | 100.00 | % | 42,865 | 100.00 | % | 36 | % | ||||||||||||
| Consumption of raw materials, finished and process stocks | ||||
| Consumption of raw materials, finished and process stocks comprise mainly consumption of raw materials and finished goods for trading in India and AsiaPac IT Services and Products and Wipro Consumer Care and Lighting and Wipro Fluid Power. Consumption of raw materials, finished and process stocks increased by 15% to Rs. 8,946 million in the year ended March 31, 2004. The increase was mainly on account of increase in revenues from products component in India and AsiaPac IT Services and Products by 9%, Consumer Care and Lighting by 22% and Wipro Fluid Power by 34%. | ||||
| Salaries and other manpower related costs | ||||
| Salaries and other manpower related costs increased by 60% to Rs. 9,286 million in the year ended March 31, 2004. This increase was mainly due to a 51% increase in the number of employees in Global IT Services from 18,829 employees as on March 31, 2003 to 28,502 employees as on March 31, 2004 and compensation review in October 2003 and March 2004. | ||||
| Travelling and other allowances | ||||
| Travelling and Other Allowances comprise of travel costs incurred and allowances and taxes paid for employees deployed onsite. Travel and other allowances have increased by 50% to Rs. 12,693 million in the year ended March 31, 2004. The increase is due to higher number of people deployed onsite. Onsite billable man months increased by 60% from 30,138 in fiscal 2003 to 48,145 in fiscal 2004. The proportion of onsite revenues in revenues from IT Services has increased from 54% of the revenues of IT Services in fiscal 2003 to 58% of the revenues from IT Services in fiscal 2004. | ||||
| Miscellaneous expenses | ||||
| Miscellaneous expenditure has increased by 65% to Rs. 4,716 million for year ended 2004. This is principally due to increase in overseas subcontracting in certain large deals in Global IT Services and Products and increase in technology operating expenses in the BPO services in line with growth of business. | ||||
| 3.3.4 | Selling, General and Administrative Expenses | |||
| (Rs. in millions) | ||||||||||||||||||||
| Particulars | March 31, 2004 | March 31, 2003 | ||||||||||||||||||
| Amount | % to sales | Amount | % to sales | Increase | ||||||||||||||||
| Salaries, and manpower related costs | 2,195 | 3.8 | % | 1,518 | 3.5 | % | 45 | % | ||||||||||||
| Travelling and allowances | 3,253 | 5.6 | % | 2,555 | 6.0 | % | 27 | % | ||||||||||||
| Advertisement and sales promotion | 572 | 1.0 | % | 406 | 0.9 | % | 41 | % | ||||||||||||
| Provision/write off of bad debts | 132 | 0.2 | % | 180 | 0.4 | % | (27 | %) | ||||||||||||
| Miscellaneous | 1,310 | 2.2 | % | 764 | 1.8 | % | 71 | % | ||||||||||||
| Others | 1,140 | 1.9 | % | 1,020 | 2.4 | % | 12 | % | ||||||||||||
Total | 8,602 | 14.7 | % | 6,443 | 15.0 | % | 33 | % | ||||||||||||
Income from sales and services | 58,350 | 100 | % | 42,865 | 100 | % | 36 | % | ||||||||||||
110
Table of Contents
WIPRO LIMITED — CONSOLIDATED
| Salaries and other manpower related costs | ||||
| Salaries and manpower related costs have increased by 45% to Rs. 2,195 million in the year ended March 31, 2004. This is mainly due to recruitment of sales and marketing personnel and increase in support staff headcount in Global IT Services and Products in addition to compensation review in October 2003 and March 2004. The support staff headcount in IT Services has increased by 21% from 1,289 in March 2003 to 1,565 in March 2004. | ||||
| Travelling and other allowances | ||||
| Expenses of overseas sales and marketing team are included in travel and allowances. Travelling and allowances have increased by 27% during the year to Rs. 3,253 million. This is mainly due to increase in the Global IT Services and Products Sales and Marketing Team from average headcount of 139 in fiscal 2003 to 170 in fiscal 2004. A significant portion of the recruits to the Sales and Marketing team are local hires in respective countries. Typically local hires have a higher remuneration package. | ||||
| Advertisement and sales promotion | ||||
| Advertisement and sales promotion have increased by 41% to Rs. 572 million in the year ended March 31, 2004. The increase is mainly in Wipro Consumer Care and Lighting business segment where the Company is strategically investing in existing brands for increasing penetration and enhancing its product offering by building new products. This strategy has given good dividends during the year. | ||||
| Provision / write off of bad debts | ||||
| Provision for write off of bad debts has declined by 27% from Rs. 180 million in fiscal 2003 to Rs. 132 million in fiscal 2004. As a percentage to sales, provision for write off of bad debts have declined from 0.4% of sales in fiscal 2003 to 0.2% of sales in fiscal 2004. | ||||
| Miscellaneous Expenses | ||||
| Miscellaneous expenses have increased by 71% during the year from Rs. 764 million in 2003 to Rs. 1,310 million in 2004.This increase is mainly due to increase in Legal and professional charges incurred on participating in certain large bids and expenditure on recruiting local hires in respective geographies in Global IT Services and Products. | ||||
| 3.3.5 | Interest | |||
| Interest expense for fiscal 2004 is 35 million. (Rs. 30 million for fiscal 2003). | ||||
| 3.3.6 | Income taxes | |||
| Effective tax rate has increased to 14% from 12.4% in the previous year. The higher effective tax rate was due to higher proportion of income subject to foreign taxes and provision of Rs. 251 million in respect of earlier years. | ||||
| During the year the Company received a demand from the income tax department of Rs. 2,614 million (Including interest demand of Rs.764 million) for one of its assessment years. The tax demand is mainly on account of disallowance of deduction claimed by the Company under Section 10A of the Income Tax Act, 1961, in respect of profits earned by its undertakings in software technology park at Bangalore. As per the opinion of the Company’s legal counsel the said disallowance is not tenable. The management of the Company has filed an appeal challenging the disallowance. Considering the facts and nature of disallowance, the management believes that there will be no material impact on the financial statement. | ||||
| 3.3.7 | Discontinuing Operations | |||
| The operations of the ISP division qualified as a component of an entity, being an asset group. In June 2002, the Company decided to exit this division, as a result, the operations and cash flows of the Corporate ISP business were eliminated from the ongoing operations. The Company did not have any significant continuing involvement in the operations of the component after the disposal, the results of operations of the ISP division were reported in discontinued operations during the year ended March 31, 2003. | ||||
| 3.3.8 | Appropriation from profit | |||
| The Profit after tax of Rs. 10,315 million is appropriated as follows: | ||||
| • | Proposed dividend on equity shares Rs. 931 million and one time cash dividend of Rs. 5,819 million. Tax on distribution of dividend Rs. 865 million. | |||
| • | Transfer to general reserve Rs. 2,700 million. | |||
| 4.0 | Material developments in Human resources | |||
| Please refer to our discussions in the sub section titled“Employees”in the Annual Report on Form 20-F filed with SEC which is being circulated separately as an annexure to this Annual Report. | ||||
| 5.0 | Transactions in which the management is interested in their personal capacity | |||
| Refer note 18 in notes to Accounts in page no. 74. | ||||
111
Table of Contents
WIPRO LIMITED — CONSOLIDATED
Reconciliation of Profits between Indian GAAP and US GAAP
| (Rs. in millions) | ||||||||||||
| Particulars | Notes | March 31, 2004 | March 31, 2003 | |||||||||
Profit for the year as per Indian GAAP | 10,315 | 8,205 | ||||||||||
Adjustments | ||||||||||||
| Stock compensation expense | A | (45 | ) | (52 | ) | |||||||
| Difference in revenue recognition norms | B, C | 2 | 46 | |||||||||
| Intangible asset amortisation | D | (194 | ) | (166 | ) | |||||||
| Loss on direct issue of shares by Wipro Spectramind | E | (206 | ) | — | ||||||||
| Mark to market gain on forward contracts | F | 85 | — | |||||||||
| Unrealised restatement gains | G | — | 52 | |||||||||
| Others | 35 | 14 | ||||||||||
Total | (323 | ) | (106 | ) | ||||||||
Net Income as per US GAAP | 9,992 | 8,099 | ||||||||||
Notes :
| A. | Under US GAAP, compensation cost is recognised for shares granted to employees as the excess of the quoted market price of the stock at the date of grant over the amount to be paid by the employee. Such compensation cost is amortised over the vesting period. Accordingly, Wipro has recorded compensation cost for shares granted to employees from the Wipro Equity Reward Trust set up in 1984. No such accounting is required under Indian GAAP. | |||
| B. | The Company had adopted the provisions of the Staff Accounting Bulletin No. 101 (SAB 101) issued by the Securities Exchange Commission. Accordingly, revenues from sale of goods, where a customer is not obligated to pay a portion of contract price until the completion of installation, is recognised only on completion of installation. Effective July 1, 2003 the Company has adopted the new revenue recognition guidance, Emerging Issues Task Force (EITF) EITF Issue No. 00-21. Under EITF Issue No. 00-21, revenue is recognized upon dispatch. However, where installation is a condition to the contract, the portion of revenue linked to installation and the cost of delivered item in excess of revenue recogniszed are deferred and recognized upon completion of installation. | |||
| C. | Additionally, there were certain other differences in the norms for recognising revenues between Indian GAAP and US GAAP. Consequently revenues relating to certain contracts which were recognised in Indian GAAP in the year ended March 31, 2003 was recognized in US GAAP only in 2004. | |||
| D. | In US GAAP, a portion of the purchase consideration in a business acquisition will be allocated to intangible assets meeting the criteria for being recognised as an asset apart from goodwill. The value assigned to the intangible assets will be amortised, net of tax benefits, over the useful life of the intangible asset in proportion to the economic benefits consumed during each reporting period. | |||
| E. | Wipro Spectramind has issued 4,178,294 shares to employees upon exercise of employee stock options. As a result of the option exercise, the Company’s ownership interest in Wipro Spectramind reduced to 93%. As the exercise price per option was less than the Company’s carrying value per share, the exercise resulted in a decline in the carrying value of the Company’s ownership interest by Rs. 206 million. In accordance with the accounting policy adopted by the Company, this decline in carrying value has been included in the statement of income as a loss on direct issue of stock by subsidiary. In Indian GAAP, the consideration paid by the employees has been compared with the share of the minority interest in the net assets of Wipro Spectramind. In Indian GAAP, the carrying value of investments in the books of Wipro has no relevance from the perspective of computing the minority interest. The excess of consideration paid upon exercise of stock options over the share in the assets of Wipro Spectramind has been offset against the goodwill arising from the Wipro Spectramind acquisition. | |||
| F. | Under Indian GAAP, the forward premium/discount on forward contracts is recognised over the life of the contract. In US GAAP, foreign currency monetary assets are recorded at the spot rate. The forward contracts are marked to market at the end of each reporting period. As of March 31, 2004, the Company had certain zero cost currency options. In US GAAP these options are marked to market with gains/losses being recognised in profit and loss account. For the year ended March 31, 2004, profits under US GAAP were higher by Rs. 85 million due to recording of gains on forward contracts and zero cost options on a marked to market basis. | |||
| G. | Under US GAAP unrealised foreign exchange restatement gains on foreign currency denominated assets is not recognised as income. Consequently in US GAAP certain unrealised gains were not recognised in profit and loss account for the year ended March 31, 2002. These gains have been realised in the year ended March 31, 2003. | |||
112
Table of Contents
SIGNATURES
Pursuant to the requirements of the Securities Exchange Act of 1934, the registrant has duly caused this report to be signed on its behalf by the undersigned, thereunto duly organized.
| /s/ Suresh C. Senapaty | ||||
| Suresh C. Senapaty | ||||
| Executive Vice President, Finance | ||||
Date: May 25, 2004
Table of Contents
EXHIBIT INDEX
| Exhibit No. | Description | |
| 99.1 | Proxy Information Statement to holders of American Depository Shares | |
| 99.2 | Proxy Information Statement and Proxy Form to holders of Equity Shares | |
| 99.3 | Proxy Form to holders of American Depository Shares | |
| 99.4 | Salary Statement | |
| *99.5 | Annual Report on Form 20-F pursuant to Section 13 or 15(d) of the Securities Exchange Act of 1934 |
_____________________
| * | Incorporated by reference to the Registrant’s Annual Report on Form 20-F filed on May 17, 2004. |