Exhibit 99.3
WIPRO
Applying Thought
.BG-X BANGALORE THE HINDU • BUSINESS LINE THURSDAY, _6 JULY 21, 2011 BL Bangalore/ 1 AdPage_01 User: cci 07-20-2011 20:36 Color: CMYK
WIPRO
Applying Thought
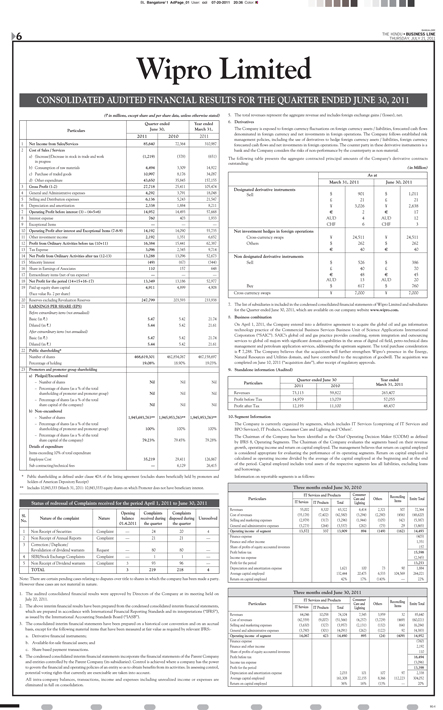
.BG-X INFORMATION TECHNOLOGY Our Bureau Bangalore, July 20 With the product engineering services business ‘returning to growth mode’, IT solutions company Mind- Tree Ltd posted a 117 per cent year-on-year growth in its net profit at Rs 34.5 crore (Rs 15.90 crore) during the first quarter of fiscal 2011-12. The company’s IT services business posted 41.8 per cent year-on-year growth. Mr Krishnakumar Natarajan, CEO and Managing Director, MindTree, said, “Q1 has been a robust quarter in terms of revenue growth and margin performance.” In the quarter gone by, and the company’s sales grew by 18.5 per cent year-on-year to Rs 413 crore (Rs 348.7 crore). Its product engineering services business has returned to a growth mode with 1.7 per cent growth on a sequential basis. Increased focus on operational efficiency and the revenue momentum helped the company offset the impact of the wage revisions during the quarter and enabled it to largely maintain the same EBITDA as the previous quarter, Mr Natarajan added. During the first quarter, MindTree added one to the $10-million client pool, taking the count to seven. As on June 30, the company had 283 active customers. On future outlook, Mr Natarajan said, “Momentum in both our businesses is expected to continue and we are confident of delivering higher than industry average growth in FY12.” MindTree Q1 profit doubles to Rs 34 cr Balaji Narasimhan Bangalore, July 20 Though Wipro reported only a marginal increase in its net profit during the quarter, its CEO for IT Businesses, Mr T.K. Kurien, sees a lot of potential and wants to mine the company’s customers deeper. In an interview with Business Line, he speaks about the importance of analytics and the strategy that Wipro uses for acquisitions. Excerpts: You talk of offering services to fewer clients, but you are rapidly expanding your customer base. Please comment. These are two different things. We want to mine our existing customers deeper; but in parallel, we want to get more real estate. We have identified customers who we feel we should have as logos within Wipro. That is why we are rapidly expanding our client base. What will be the long-term impact of the H-1B visa case? Will the industry stop relying on them because of all the hassles involved? I don’t think this will ever happen. Architecture will happen onsite, while development will happen in factories in low-cost countries. There will have to be mobility — maybe not in thousands, but at least in hundreds. You talked of three engines of growth for Wipro, namely consumerisation of IT, variabilisation of IT and analytics for a constrained world. How long will these focus areas sustain Wipro? Let me answer this question differently. By 2050, the estimate is that oil consumption will touch 100 million barrels per day from the current amount, which is hovering in the mid-80s. Over the next 30-40 years, oil fields in places like Saudi Arabia will dry up, while ones in Africa and Brazil will start producing. Therefore, the people in places where oil is scarce will have to rely more and more on analytics to get every drop. That is why we are hiring more and more people who are different from the type of people who are traditionally hired in an IT services company. For example, we now have anthropologists and statisticians working for Wipro. We even have a five-star hotel chef cooking food on microwave ovens that Wipro has worked on, so that we can test the quality of the food cooked. This is because usability is as important as technology. The man-machine interface is a critical component of the future. One of the analysts we spoke to said that Wipro should possibly look at an acquisition in the BPO space. Is this something you are in agreement with? I believe that you should do acquisitions in areas where the acquisition can take you to a better place than where you can get to organically. Otherwise, it is a bit like tying two donkeys together and then pretending that you have a horse. We should be shedding assets that we are not scaling. Your restructuring is over, but there are always bound to be some loose ends. What are they? There are no loose ends from a strategic perspective. Everything is in place. We have a portfolio and some of them perform well in certain quarters and others in other quarters. The question that we are interested in is with respect to our leaders; are they there for the short term or the long term? We want long-term leaders. The IT services industry is a marathon. In fact, to drive this image, we are having a marathon in the US during the end of this month. We want to mine customers deeper, says Wipro CEO Mr T.K. Kurien, CEO, Wipro, at a press conference in Bangalore on Wednesday.- G.R.N. Somashekar _”We have identified customers who we feel we should have as logos within Wipro. That is why we are rapidly expanding our client base.” K.Venkatasubramanian BL Research Bureau The pecking order in the ‘hierarchy’ of IT companies in terms of performance across metrics remains intact with the June quarter numbers of Wipro failing to throw up any positive surprises. If anything, a tepid guidance of 2-4 per cent for the September quarter has acted as an added dampener, even as the company seeks to restructure its operations over the next couple of quarters and return to industry growth levels. During the June quarter, IT services’ revenues, which constitutes three-fourths of Wipro’s total pie, grew just 1.8 per cent sequentially to Rs 6,405 crore, while EBIT (earnings before interest and tax) inched up 1.3 per cent to Rs 1,407 crore. Lower volume growth, pricing cuts, and marginal growth in key segments have all weighed on the division’s performance. However, the (hardware intensive) IT products division, which accounts for 12 per cent of revenues, has fared much better, reporting over 10 per cent growth in revenues to Rs 1006 crore, while EBIT expanded by over 27 per cent to Rs 42.3 crore. Annual wage hikes to the tune of 10-12 per cent and increase in effective tax rates have dragged overall profitability. Attrition, at 22.6 per cent, is the highest among peers. The silver lining though is a reasonable addition of large-sized clients, which could prop up volumes in the quarters ahead. Wipro had a volume (person- months billed) growth of just 1.7 per cent sequentially, much lower than the 4—7.5 per cent levels reported by Infosys and TCS. This apart, the company also had a dip in realisations, suggesting that pricing pressure may still not have abated for the company. This, at a time when peers registered steady realisations or even had a marginal uptick. KEY VERTICALS In terms of verticals, financial solutions and manufacturing expanded by just 0.5 per cent, when competitors witnessed superior traction in these segments. Key verticals such as telecom, retail and healthcare witnessed 1.8-3.6 per cent dip in revenues. However, going forward, there are some factors that could help the company record higher growth. There have been a couple of clients added in the $50 million category and another in the $100 million band. The number of active clients too has gone up significantly. The company’s revenues from Asia-Pacific and other emerging markets have grown 11.3 per cent sequentially suggesting that it has been able to tap growth markets well. The relatively high-margin analytics and information management service has grown 7.6 per cent. The deal pipeline for the hardware division, especially domestically, continues to be robust. But it would need a spectacular performance in the latter half of the year for Wipro to achieve even the 16-18 per cent growth that industry body Nasscom expects the Indian IT services sector to achieve this fiscal. Wipro lags peers in key parameters Volumes, important segments tepid _ MICROSCOPE Press Trust of India New Delhi, July 20 Eighteen former employees of Molina Healthcare, a client of Cognizant Technologies, have filed a lawsuit against the American healthcare services firm for allegedly replacing them with professionals from India. Going by reports, the lawsuit filed in a US court contends that many American workers at Molina were replaced by people from Cognizant. Stressing that the lawsuit was without merit, Cognizant said it would “vigorously contest” the same by pursuing all legal remedies. “Cognizant takes legal and regulatory compliance very seriously. It is Cognizant’s view that this lawsuit is without merit, and we will vigorously contest it and pursue all legal remedies that may be available to us,” a Cognizant spokesperson said. The lawsuit comes amid high unemployment levels in the US and rising apprehensions over outsourcing activities to countries such as India, where the cost of labour is cheap. Cognizant, headquartered in the US, has strong presence in India, where the entity has over one lakh employees. The firm is also fiercely competing with Indian software majors, including TCS and Infosys. Infosys, too, is facing a lawsuit by a former employee, who has accused the software exporter of misusing short term B—1 visas to bring Indian workers to the US. The US accounts for over 60 per cent revenues of India’s $60-billion IT industry. 18 former employees file suit against Molina Healthcare _Cognizant said it would “vigorously contest” the same by pursuing all legal remedies. More IT reports on Page 15 BANGALORE THE HINDU • BUSINESS LINE THURSDAY, JULY 21, 2011 7_ BL Bangalore/ 1 Infotech_01 User: cci 07-20-2011 21:41 Color: CMYK

WIPRO
Applying Thought
Size: 50cm (H) x 33cm (W) Samyukta Karnataka Size: 50cm (H) x 16cm (W) Samyukta Karnataka (` in millions, except share and per share data, unless otherwise stated) WIPRO LIMITED Regd. Office: Doddakannelli, Sarjapur Road, Bangalore – 560 035. www.wipro.com Place: Bangalore Date: July 20, 2011 By Order of the Board, for Wipro Ltd. Azim H Premji Chairman Wipro Limited RK SWAMY/BBDO 2273 The following table presents the aggregate contracted principal amounts of the Company’s derivative contracts outstanding: 1 Net Income from Sales/Services 85,640 72,364 310,987 2 Cost of Sales / Services a) (Increase)/Decrease in stock in trade and work (1,219) (378) (651) in progress b) Consumption of raw materials 4,494 3,309 14,922 c) Purchase of traded goods 10,997 8,176 34,087 d) Other expenditure 43,650 35,845 157,155 3 Gross Profit (1-2) 27,718 25,411 105,474 4 General and Administrative expenses 4,292 3,791 18,048 5 Selling and Distribution expenses 6,136 5,243 21,547 6 Depreciation and amortization 2,338 1,884 8,211 7 Operating Profit before interest (3) – (4+5+6) 14,952 14,493 57,668 8 Interest expense 760 403 1,933 9 Exceptional Items — — — 10 Operating Profit after interest and Exceptional Items (7-8-9) 14,192 14,090 55,735 11 Other investment income 2,192 1,351 6,652 12 Profit from Ordinary Activities before tax (10+11) 16,384 15,441 62,387 13 Tax Expense 3,096 2,345 9,714 14 Net Profit from Ordinary Activities after tax (12-13) 13,288 13,096 52,673 15 Minority Interest (49) (67) (344) 16 Share in Earnings of Associates 110 157 648 17 Extraordinary items (net of tax expense) — — — 18 Net Profit for the period (14+15+16-17) 13,349 13,186 52,977 19 Paid up equity share capital 4,911 4,899 4,908 (Face value Rs. 2 per share) 20 Reserves excluding Revaluation Reserves 247,799 203,593 233,938 21 EARNINGS PER SHARE (EPS) Before extraordinary items (not annualised) Basic (in `.) 5.47 5.42 21.74 Diluted (in `.) 5.44 5.42 21.61 After extraordinary items (not annualised) Basic (in `.) 5.47 5.42 21.74 Diluted (in `.) 5.44 5.42 21.61 22 Public shareholding* Number of shares 468,619,301 462,854,067 467,158,697 Percentage of holding 19.08% 18.90% 19.03% 23 Promoters and promoter group shareholding a) Pledged/Encumbered – Number of shares Nil Nil Nil – Percentage of shares (as a % of the total shareholding of promoter and promoter group) Nil Nil Nil – Percentage of shares (as a % of the total share capital of the company) Nil Nil Nil b) Non–encumbered – Number of shares 1,945,693,763** 1,945,953,763** 1,945,953,763** – Percentage of shares (as a % of the total shareholding of promoter and promoter group) 100% 100% 100% – Percentage of shares (as a % of the total share capital of the company) 79.23% 79.45% 79.28% Details of expenditure Items exceeding 10% of total expenditure Employee Cost 35,219 29,411 126,867 Sub contracting/technical fees — 6,129 26,415 Particulars Quarter ended June 30, Year ended March 31, * Public shareholding as defined under clause 40A of the listing agreement (excludes shares beneficially held by promoters and holders of American Depository Receipt) ** Includes 10,843,333 (March 31, 2011: 10,843,333) equity shares on which Promoter does not have beneficiary interest. 2011 2010 2011 1. The audited consolidated financial results were approved by Directors of the Company at its meeting held on July 20, 2011. 2. The above interim financial results have been prepared from the condensed consolidated interim financial statements, which are prepared in accordance with International Financial Reporting Standards and its interpretations (“IFRS”), as issued by the International Accounting Standards Board (“IASB”). 3. The consolidated interim financial statements have been prepared on a historical cost convention and on an accrual basis, except for the following material items that have been measured at fair value as required by relevant IFRS:- a. Derivative financial instruments; b. Available-for-sale financial assets; and c. Share based payment transactions. 4. The condensed consolidated interim financial statements incorporate the financial statements of the Parent Company and entities controlled by the Parent Company (its subsidiaries). Control is achieved where a company has the power to govern the financial and operating policies of an entity so as to obtain benefits from its activities. In assessing control, potential voting rights that currently are exercisable are taken into account. All intra-company balances, transactions, income and expenses including unrealized income or expenses are eliminated in full on consolidation. Note: There are certain pending cases relating to disputes over title to shares in which the company has been made a party. However these cases are not material in nature. Status of redressal of Complaints received for the period April 1, 2011 to June 30, 2011 Sl. No. 1 Non Receipt of Securities Complaint — 24 20 4 2 Non Receipt of Annual Reports Complaint — 21 21 — 3 Correction / Duplicate/ Revalidation of dividend warrants Request — 80 80 — 4 SEBI/Stock Exchange Complaints Complaint — 1 1 — 5 Non Receipt of Dividend warrants Complaint 3 93 96 — TOTAL 3 219 218 4 Nature of the complaint Nature Opening balance 01.4.2011 Complaints received during the quarter Complaints disposed during the quarter Unresolved 7. The list of subsidiaries is included in the condensed consolidated financial statements of Wipro Limited and subsidiaries for the Quarter ended June 30, 2011, which are available on our company website www.wipro.com. 8. Business combination On April 1, 2011, the Company entered into a definitive agreement to acquire the global oil and gas information technology practice of the Commercial Business Services Business Unit of Science Applications International Corporation (“SAIC”). SAIC’s global oil and gas practice provides consulting, system integration and outsourcing services to global oil majors with significant domain capabilities in the areas of digital oil field, petro-technical data management and petroleum application services, addressing the upstream segment. The total purchase consideration is ` 7,288. The Company believes that the acquisition will further strengthen Wipro’s presence in the Energy, Natural Resources and Utilities domain, and have contributed to the recognition of goodwill. The acquisition was completed on June 10, 2011 (“acquisition date”), after receipt of regulatory approvals. 9. Standalone information (Audited) Particulars IT Services and Products Consumer Care and Lighting Reconciling Items Entity Total Revenues 55,002 8,320 63,322 6,414 2,321 307 72,364 Cost of revenues (35,178) (7,402) (42,580) (3,294) (2,290) (456) (48,620) Selling and marketing expenses (2,979) (317) (3,296) (1,944) (105) (42) (5,387) General and administrative expenses (3,273) (264) (3,537) (282) (75) 29 (3,865) Operating income of segment 13,572 337 13,909 894 (149) (162) 14,493 Finance expense (403) Finance and other income 1,351 Share of profits of equity accounted investees 157 Profit before tax 15,598 Income tax expense (2,345) Profit for the period 13,253 Depreciation and amortization expense 1,621 100 73 90 1,884 Average capital employed 132,444 20,475 6,533 104,569 264,021 Return on capital employed 42% 17% (14)% — 22% Others IT Services IT Products Total Three months ended June 30, 2010 Particulars IT Services and Products Consumer Care and Lighting Reconciling Items Entity Total Revenues 64,046 10,058 74,104 7,545 3,959 32 85,640 Cost of revenues (42,559) (9,007) (51,566) (4,257) (3,729) (469) (60,021) Selling and marketing expenses (3,630) (327) (3,957) (2,131) (132) (64) (6,284) General and administrative expenses (3,790) (301) (4,091) (262) (122) 92 (4,383) Operating income of segment 14,067 423 14,490 895 (24) (409) 14,952 Finance expense (760) Finance and other income 2,192 Share of profits of equity accounted investees 110 Profit before tax 16,494 Income tax expense (3,096) Profit for the period 13,398 Depreciation and amortization expense 2,033 101 107 97 2,338 Average capital employed 161,308 22,155 8,366 112,223 304,052 Return on capital employed 36% 16% (1)% — 20% Others IT Services IT Products Total Three months ended June 30, 2011 The Company has four geographic segments: India, the United States, Europe and Rest of the world. Revenues from the geographic segments based on domicile of the customer are as follows: No customer individually accounted for more than 10% of the revenues during the three months ended June 30, 2010 and 2011. Notes: a) The company has the following reportable segments: i) IT Services: The IT Services segment provides IT and IT enabled services to customers. Key service offering includes software application development, application maintenance, research and development services for hardware and software design, data center outsourcing services and business process outsourcing services. ii) IT Products: The IT Products segment sells a range of Wipro personal desktop computers, Wipro servers and Wipro notebooks. The Company is also a value added reseller of desktops, servers, notebooks, storage products, networking solutions and packaged software for leading international brands. In certain total outsourcing contracts of the IT Services segment, the Company delivers hardware, software products and other related deliverables. Revenue relating to these items is reported as revenue from the sale of IT Products. iii) Consumer Care and Lighting: The Consumer Care and Lighting segment manufactures, distributes and sells personal care products, baby care products, lighting products and hydrogenated cooking oils in the Indian and Asian markets. iv) The Others’ segment consists of business segments that do not meet the requirements individually for a reportable segment as defined in IFRS 8. v) Corporate activities such as treasury, legal and accounting, which do not qualify as operating segments under IFRS 8, and elimination of inter-segment transactions have been considered as ‘reconciling items’. b) Revenues include excise duty of ` 240 and ` 256 for the three months ended June 30, 2010 and 2011, respectively. For the purpose of segment reporting, the segment revenues are net of excise duty. Excise duty is reported in reconciling items. c) For evaluating performance of the individual business segments, stock compensation expense is allocated on the basis of straight line amortization. The incremental impact of accelerated amortization of stock compensation expense over stock compensation expense allocated to the individual business segments is reported in reconciling items. d) For evaluating the performance of the individual business segments, amortization of intangibles acquired through business combinations are reported in reconciling items. Accordingly, comparative period information has been reclassified. e) The Company generally offers multi-year payment terms in certain total outsourcing contracts. These payment terms primarily relate to IT hardware, software and certain transformation services in outsourcing contracts. Corporate treasury provides internal financing to the business units offering multi-year payments terms. Accordingly, such receivables are reflected in capital employed in reconciling items. As of June 30, 2010 and 2011, capital employed in reconciling items includes ` 9,595 and ` 13,544 respectively, of such receivables on extended collection terms. The finance income on deferred consideration earned under these contract is included in the revenue of the respective segment and is eliminated under reconciling items. f) Operating income of segments is after recognition of stock compensation expense arising from the grant of options: Management believes that it is currently not practicable to provide disclosure of geographical location wise assets, since the meaningful segregation of the available information is onerous. 11. The Company has granted Nil and 30,000 options under RSU Options Plan during the three months ended June 30, 2010 and 2011, respectively. Three months ended June 30 2010 2011 India `. 14,682 `. 19,194 United States 29,138 31,220 Europe 14,018 18,858 Rest of the world 14,526 16,368 `. 72,364 `. 85,640 Revenues 73,113 59,822 263,407 Profit before Tax 14,979 13,079 57,055 Profit after Tax 12,193 11,100 48,437 Particulars Quarter ended June 30 2011 2010 Year ended March 31, 2011 CONSOLIDATED AUDITED FINANCIAL RESULTS FOR THE QUARTER ENDED JUNE 30, 2011 As at March 31, 2011 June 30, 2011 Designated derivative instruments Sell $ 901 $ 1,011 £ 21 £ 21 ¥ 3,026 ¥ 2,638 _ 2 _ 17 AUD 4 AUD 12 CHF 6 CHF 3 Net investment hedges in foreign operations Cross-currency swaps ¥ 24,511 ¥ 24,511 Others $ 262 $ 262 _ 40 _ 40 Non designated derivative instruments Sell $ 526 $ 386 £ 40 £ 70 _ 48 _ 45 AUD 13 AUD 20 Buy $ 617 $ 760 Cross currency swaps ¥ 7,000 ¥ 7,000 ( in Million) 10. Segment Information The Company is currently organized by segments, which includes IT Services (comprising of IT Services and BPO Services), IT Products, Consumer Care and Lighting and ‘Others’. The Chairman of the Company has been identified as the Chief Operating Decision Maker (CODM) as defined by IFRS 8, Operating Segments. The Chairman of the Company evaluates the segments based on their revenue growth, operating income and return on capital employed. The management believes that return on capital employed is considered appropriate for evaluating the performance of its operating segments. Return on capital employed is calculated as operating income divided by the average of the capital employed at the beginning and at the end of the period. Capital employed includes total assets of the respective segments less all liabilities, excluding loans and borrowings. Information on reportable segments is as follows: 5. The total revenues represent the aggregate revenue and includes foreign exchange gains / (losses), net. 6. Derivatives The Company is exposed to foreign currency fluctuations on foreign currency assets / liabilities, forecasted cash flows denominated in foreign currency and net investments in foreign operations. The Company follows established risk management policies, including the use of derivatives to hedge foreign currency assets / liabilities, foreign currency forecasted cash flows and net investments in foreign operations. The counter party in these derivative instruments is a bank and the Company considers the risks of non-performance by the counterparty as non-material. Three months ended June 30 2010 2011 IT Services `. 256 `. 306 IT Products 21 22 Consumer Care and Lighting 20 26 Others 6 8 Reconciling items (119) (165) Total `. 184 `. 197 Segments WIPRO Applying Thought