Exhibit 99.2

WIPRO
Applying Thought
WIPRO
Applying Thought
Performance of Wipro
Limited for Quarter ended
September 30, 2011
Suresh Senapaty
Executive Director and Chief Financial Officer
October 31, 2011
© 2011 Wipro Ltd - Confidential
WIPRO
Applying Thought
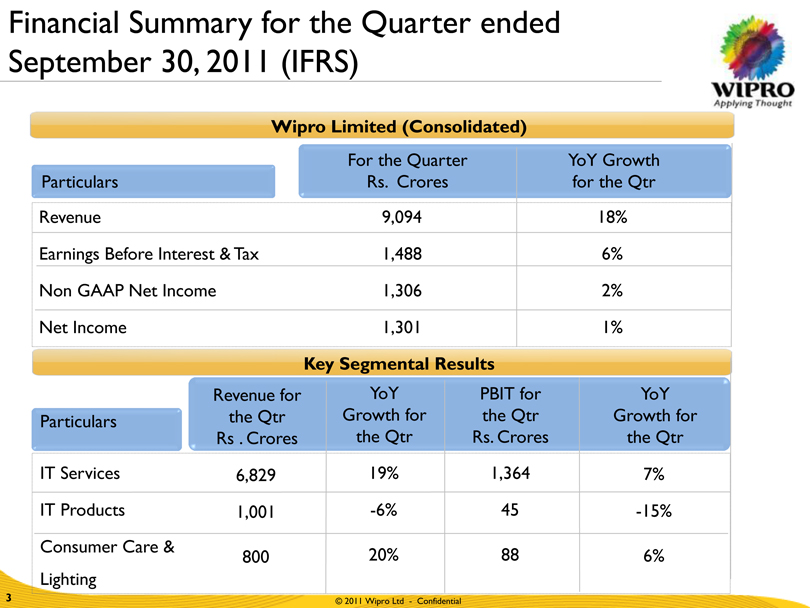
Financial Summary for the Quarter ended September 30, 2011 (IFRS)
Wipro Limited (Consolidated)
Particulars For the Quarter Rs. Crores YoY Growth for the Qtr
Revenue 9,094 18%
Earnings Before Interest & Tax 1,488 6%
Non GAAP Net Income 1,306 2%
Net Income 1,301 1%
Key Segmental Results
Particulars Revenue for the Qtr Rs . Crores YoY Growth for the Qtr PBIT for the Qtr Rs. Crores YoY Growth for the Qtr
IT Services 6,829 19% 1,364 7%
IT Products 1,001 -6% 45 -15%
Consumer Care & Lighting 800 20% 88 6%
© 2011 Wipro Ltd - Confidential
3
WIPRO
Applying Thought
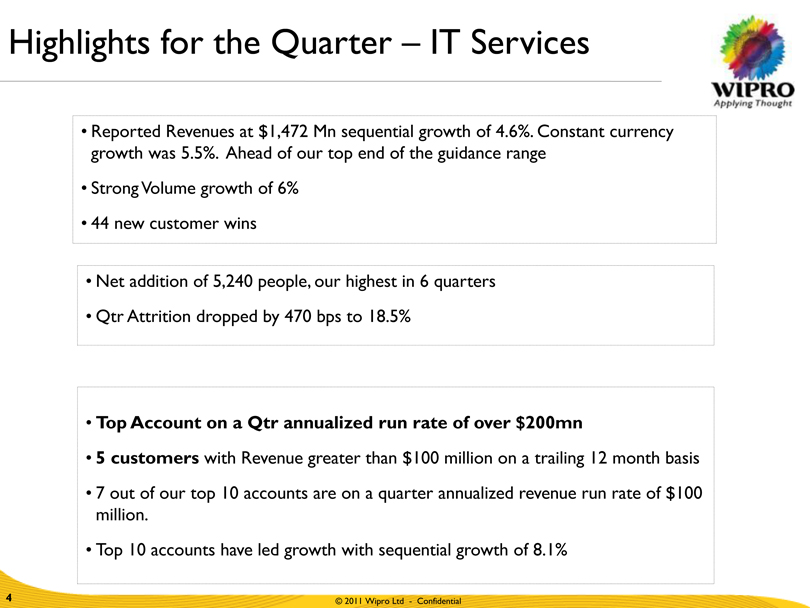
Highlights for the Quarter — IT Services
Reported Revenues at $1,472 Mn sequential growth of 4.6%. Constant currency growth was 5.5%. Ahead of our top end of the guidance range
Strong Volume growth of 6%
44 new customer wins
Net addition of 5,240 people, our highest in 6 quarters
Qtr Attrition dropped by 470 bps to 18.5%
Top Account on a Qtr annualized run rate of over $200mn
5 customers with Revenue greater than $100 million on a trailing 12 month basis
7 out of our top 10 accounts are on a quarter annualized revenue run rate of $100 million.
Top 10 accounts have led growth with sequential growth of 8.1%
© 2011 Wipro Ltd - Confidential
4
WIPRO
Applying Thought
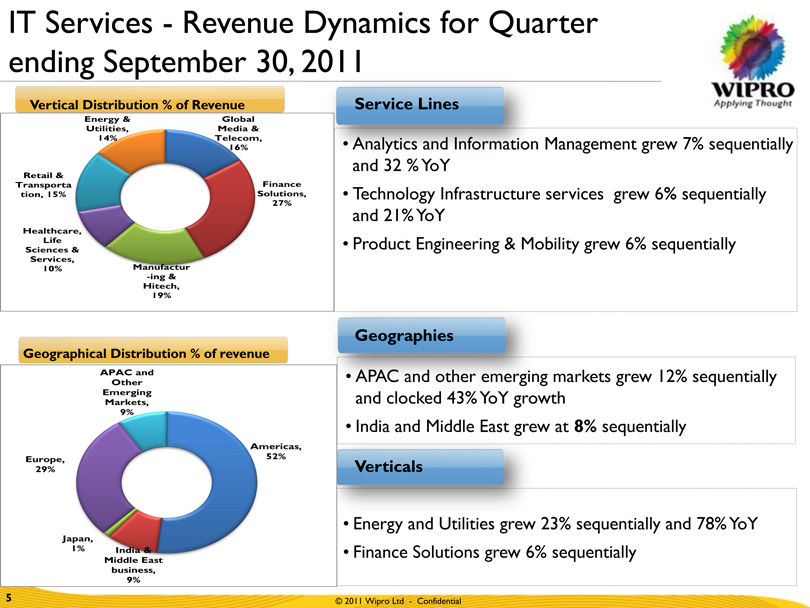
IT Services - Revenue Dynamics for Quarter ending September 30, 2011
Vertical Distribution % of Revenue
Energy & Utilities, 14% Global Media & Telecom, 16%
Retail & Transportation, 15% Finance Solutions, 27%
Healthcare, Life Sciences & Services, 10%
Manufactur-ing & Hitech, 19%
Geographical Distribution % of revenue
APAC and
Other
Emerging
Markets,
9%
Americas, 52%
Europe,
29%
Japan,
1% India &
Middle East
business,
9%
5
Service Lines
Analytics and Information Management grew 7% sequentially and 32 % YoY
Technology Infrastructure services grew 6% sequentially and 21% YoY
Product Engineering & Mobility grew 6% sequentially
Geographies
APAC and other emerging markets grew 12% sequentially and clocked 43% YoY growth
India and Middle East grew at 8% sequentially
Verticals
Energy and Utilities grew 23% sequentially and 78% YoY
Finance Solutions grew 6% sequentially
© 2011 Wipro Ltd - Confidential
5
WIPRO
Applying Thought
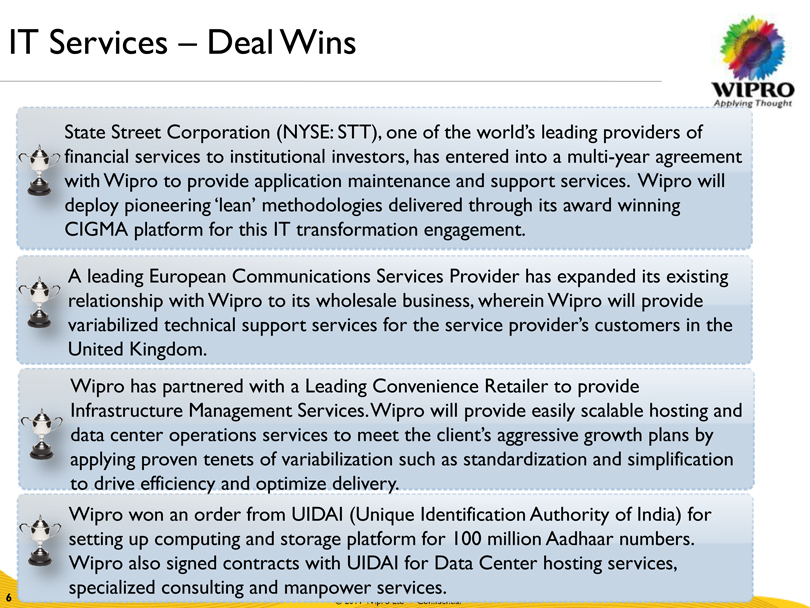
IT Services — Deal Wins
State Street Corporation (NYSE: STT), one of the world’s leading providers of financial services to institutional investors, has entered into a multi-year agreement with Wipro to provide application maintenance and support services. Wipro will deploy pioneering ‘lean’ methodologies delivered through its award winning
CIGMA platform for this IT transformation engagement.
A leading European Communications Services Provider has expanded its existing relationship with Wipro to its wholesale business, wherein Wipro will provide variabilized technical support services for the service provider’s customers in the United Kingdom.
Wipro has partnered with a Leading Convenience Retailer to provide
Infrastructure Management Services. Wipro will provide easily scalable hosting and data center operations services to meet the client’s aggressive growth plans by applying proven tenets of variabilization such as standardization and simplification to drive efficiency and optimize delivery.
Wipro won an order from UIDAI (Unique Identification Authority of India) for setting up computing and storage platform for 100 million Aadhaar numbers. Wipro also signed contracts with UIDAI for Data Center hosting services, specialized consulting and manpower services.
© 2011 Wipro Ltd - Confidential
6
Other Highlights
Wipro Consumer Care and Lighting (WCCL)
1. Revenue growth of 20% yoy
2. Continue to see strong growth across all key segments
3. Unza and Yardley are performing very well - Key markets for Unza continue to be Malaysia, China and Middle East
4. Domestic Lighting segment is growing ahead of industry, with high contribution from CFL.
5. LED thrust in Commercial Lighting Business – have a large range.
Wipro Infrastructure Engineering (WIN)
1. We continue to experience the benefit of strong growth specifically in the Asia segment of our business (peak quarterly revenue), driven by renewed focus on infrastructure development.
2. We have entered the Brazilian markets through the acquisition of RKM
3. In our new investments in emerging growth geographies, we experience some moderation, but outlook is stronger than sentiment. In September, we expanded our manufacturing base and inaugurated a new Front end Tipping Plant in China
Wipro Eco Energy
1. WEE will manage Direct & Indirect energy spend through a combination of levers
2. We are seeing traction globally as as customers become increasingly aware of the importance of ecological sustainability.
© 2011 Wipro Ltd - Confidential
7
WIPRO
Applying Thought
Looking ahead
Looking ahead For the quarter ending December 31, 2011
We expect the Revenue from our IT Services business to be in the range $1,500 Mn* to $1,530 Mn*
* Guidance is based on the following currency exchange rates: GBP/USD at 1.60 Euro/USD at 1.40, AUD/USD at 1.04, USD/INR at 46.42
© 2011 Wipro Ltd - Confidential
8
|
WIPRO
Applying Thought
Supplemental Data
Key Operating Metrics of IT Services
© 2011 Wipro Ltd - Confidential
9
WIPRO
Applying Thought
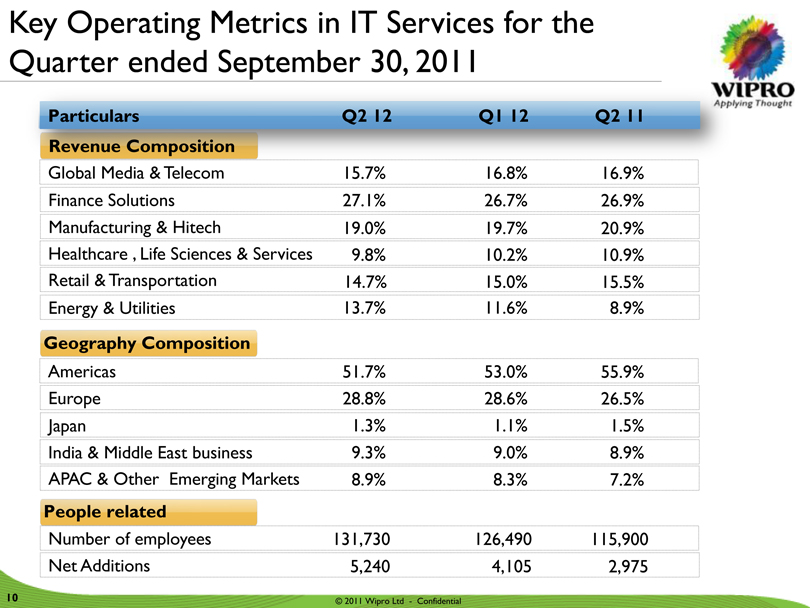
Key Operating Metrics in IT Services for the Quarter ended September 30, 2011
Particulars Q2 12 Q1 12 Q2 11
Revenue Composition
Global Media & Telecom 15.7% 16.8% 16.9%
Finance Solutions 27.1% 26.7% 26.9%
Manufacturing & Hitech 19.0% 19.7% 20.9%
Healthcare , Life Sciences & Services 9.8% 10.2% 10.9%
Retail & Transportation 14.7% 15.0% 15.5%
Energy & Utilities 13.7% 11.6% 8.9%
Geography Composition
Americas 51.7% 53.0% 55.9%
Europe 28.8% 28.6% 26.5%
Japan 1.3% 1.1% 1.5%
India & Middle East business 9.3% 9.0% 8.9%
APAC & Other Emerging Markets 8.9% 8.3% 7.2%
People related
Number of employees 131,730 126,490 115,900
Net Additions 5,240 4,105 2,975
© 2011 Wipro Ltd - Confidential
10
WIPRO
Applying Thought
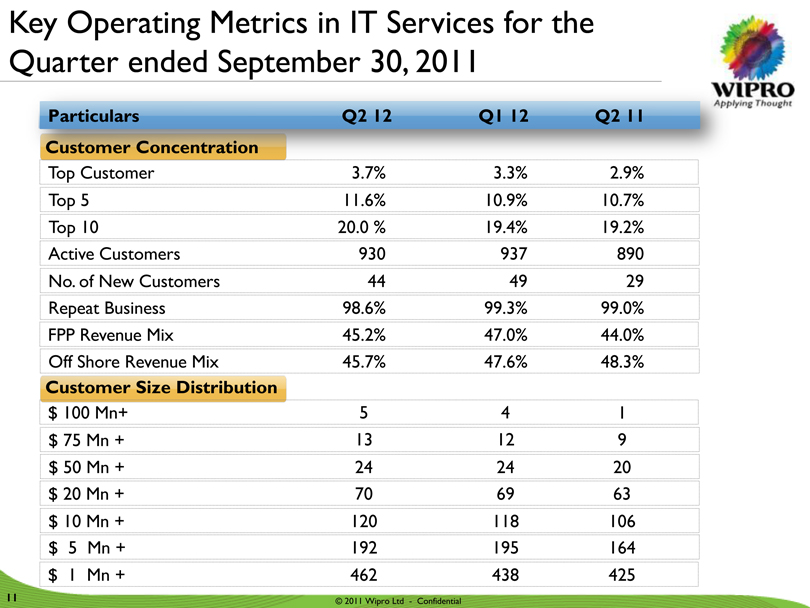
Key Operating Metrics in IT Services for the Quarter ended September 30, 2011
Particulars Q2 12 Q1 12 Q2 11
Customer Concentration
Top Customer 3.7% 3.3% 2.9%
Top 5 11.6% 10.9% 10.7%
Top 10 20.0 % 19.4% 19.2%
Active Customers 930 937 890
No. of New Customers 44 49 29
Repeat Business & Utilities 98.6% 99.3% 99.0%
FPP Revenue Mix 45.2% 47.0% 44.0%
Off Shore Revenue Mix 45.7% 47.6% 48.3%
Customer Size Distribution
$ 100 Mn+ 5 4 1
$ 75 Mn + 13 12 9
$ 50 Mn + 24 24 20
$ 20 Mn + 70 69 63
$ 10 Mn + 120 118 106
$ 5 Mn + 192 195 164
$ 1 Mn + 462 438 425
© 2011 Wipro Ltd - Confidential
11
|
WIPRO
Applying Thought
Thank You
Suresh Senapaty
Executive Director and CFO
suresh.senapaty@wipro.com
© 2011 Wipro Ltd - Confidential
 |
WIPRO
Applying Thought