Exhibit 99.2
 | Performance of Wipro Limited for Quarter and Year ended - March 31, 2012
Suresh Senapaty Executive Director and Chief Financial Officer April 25, 2012 |

| 1 | © 2012 WIPRO LTD | WWW.WIPRO.COM |
Financial Summary for the Year Ended March 31, 2012 (IFRS)
Wipro Limited (Consolidated)
Particulars | For the Year. (Rs. Cr) | YoY Growth for the Year. | ||||||
Revenue | 37,525 | 21 | % | |||||
Earnings Before Interest & Tax | 6,401 | 11 | % | |||||
Non GAAP Net Income | 5,561 | 6 | % | |||||
Net Income | 5,573 | 5 | % | |||||
Key Segmental Results
Particulars | Revenue for the Year. (Rs. Cr) | YoY Growth for the Year. | PBIT for the Year. (Rs. Cr) | YoY Growth for the Year. | ||||||||||||
IT Services | 28,431 | 21 | % | 5,927 | 11 | % | ||||||||||
IT Products | 3,844 | 4 | % | 179 | 11 | % | ||||||||||
Consumer Care & Lighting | 3,340 | 23 | % | 396 | 15 | % | ||||||||||
Final Dividend of Rs.4 per share – Total dividend for the year at Rs.6 per share
| 2 | © 2012 WIPRO LTD | WWW.WIPRO.COM |
Financial Summary for the Quarter Ended March 31, 2012 (IFRS)
Wipro Limited (Consolidated)
Particulars | For the Qtr. (Rs. Cr) | YoY Growth for the Qtr. | ||||||
Revenue | 9,869 | 19 | % | |||||
Earnings Before Interest & Tax | 1,694 | 15 | % | |||||
Non GAAP Net Income | 1,481 | 8 | % | |||||
Net Income | 1,481 | 8 | % | |||||
Key Segmental Results
Particulars | Revenue for the Qtr. (Rs. Cr) | YoY Growth for the Qtr. | PBIT for the Qtr. (Rs. Cr) | YoY Growth for the Qtr. | ||||||||||||
IT Services | 7,590 | 21 | % | 1,573 | 13 | % | ||||||||||
IT Products | 937 | 3 | % | 44 | 32 | % | ||||||||||
Consumer Care & Lighting | 907 | 25 | % | 113 | 30 | % | ||||||||||
| 3 | © 2012 WIPRO LTD | WWW.WIPRO.COM |
Highlights for the Quarter – IT Services
| • | Reported Revenues at $1,536 Mn sequential growth of 2%. |
| • | Operating margins drop of only 10 basis points despite sharp Rupee appreciation |
| • | Continued improvement in Revenue productivity – Offshore realizations up by 1.4% and onsite realizations up by 0.4% |
| • | Attrition stable at 14.4% – employees settled into the new structure |
| • | Customer metrics shows further improvement – 7 customers with Revenue greater than $100 million on a trailing 12 month basis, up from 3 last year |
| • | Strong cash flow generation – Both free cash flow and operating cash more than 100% of PAT |
| • | 41 new clients added during the quarter |
| 4 | © 2012 WIPRO LTD | WWW.WIPRO.COM |
IT Services – Revenue Dynamics for Quarter Ended March 31, 2012
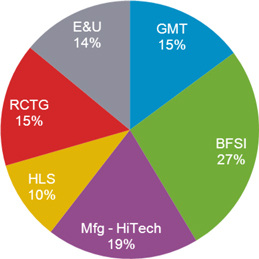
Vertical Distribution % of Revenue
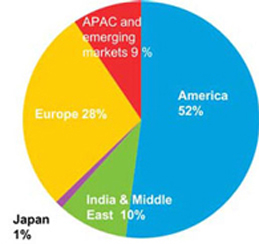
Geographical Distribution % of Revenue
| Vertical
• Energy and Utilities grew 6.8%, Retail grew 5.9%
• Healthcare and Manufacturing grew 2.4% sequentially
Geographies
• Americas grew 1.1% sequentially
• India and Middle East grew 7.6% sequentially
• Emerging markets continued to show strong growth clocking a sequential growth of 10.5%.
Service Lines
• TIS grew 6.4% sequentially
• Analytics and Information Management grew 5.4% sequentially
• Business Application Services grew 1.3% sequentially |
| 5 | © 2012 WIPRO LTD | WWW.WIPRO.COM |
IT Services – Deal Wins
• The National University of Singapore, the largest university in Singapore and one of the most reputed in the APAC region, has chosen Wipro as a partner for a multi-million dollar IT Infrastructure Services engagement. This partnership constitutes one of the largest IT outsourcing engagements by the Singapore Government in the Higher Education sector.
• Wipro has signed a multi-year deal with a large financial institution to provide development and operational support services. The scale and scope of this project will improve information lifecycle management, regulatory compliance and enhance data quality. This will help our customer achieve a leadership position in the market and help integrate acquisitions faster.
• A leading global computing peripherals provider has selected Wipro to reduce the total cost of ownership of R&D for its legacy product portfolio. Wipro will be responsible for sustenance and enhancement of firmware for a large family of devices for the next 5 years.
• Wipro has won a multi-year engagement with a leading communication service provider in North America, to provide technical support services and in future enable a set of IT and Operations transformation initiatives.
|
| |||
• Wipro won a large contract facilitated by NABARD to provide the total solution and implement CBS in the identified State Co-operative Banks and Central Co-operative Banks including providing the required database, middleware, network, project implementation and project management. |  | |||
| 6 | © 2012 WIPRO LTD | WWW.WIPRO.COM |
Awards and Accolades
| • | Wipro was recognized by the Ethisphere Institute, the leading business ethics think-tank, as one of the 2012 World’s Most Ethical (WME) Companies. This recognition is for a select number of companies from around the world who demonstrate consistently high levels of transparency, ethics and corporate responsibility. |
| • | Wipro won the prestigious Managed Services Vendor of the year 2011 from Corporate Publishing International (CPI), Dubai. The CNME awards are an annual event that recognizes both End Users and Vendors across 20 categories and this year the winners were chosen from 210 nominations. |
| • | Standard & Poor’s Ratings Services raised its long-term corporate credit rating on Wipro to ‘BBB+’ from ‘BBB’. The outlook is stable. |
| 7 | © 2012 WIPRO LTD | WWW.WIPRO.COM |
Non IT Business Highlights
| Wipro Consumer Care and Lighting (WCCL) | • | Revenue growth in Q4 of 25% yoy and EBIT growth of 30% yoy | ||
• |
Santoor No 1 Brand in combined South + West regions at 13.8% share | |||
• |
Major businesses Santoor, Yardley and UNZA drove the Q4 growth | |||
• |
International business Brands Enchanteur, Safi, Male Toiletries (Romano and Dashing) grew ahead of our expectations | |||
• |
Leaders in functional LED lighting, growth upwards of 100%
| |||
| Wipro Infrastructure Engineering (WIN) | • | In FY12, we saw good growth in key geographies of our business, driven by renewed focus on infrastructure development, recovery of demand and OEM competitive interplay. | ||
• |
Though we experienced some blips in the short term in Q4 (due to softening of demand), long term fundamentals remain strong | |||
• |
We are progressing well on the JV agreement with Kawasaki Precision Machines Ltd signed in December and our agreement with EADS subsidiary CESA
| |||
| Wipro Eco Energy | • | Our energy management business is showing positive momentum in market place. We are able to excite customer by demonstrating analytics driven energy savings | ||
| 8 | © 2012 WIPRO LTD | WWW.WIPRO.COM |
Looking ahead
Looking ahead For the quarter ending June 30, 2012
|
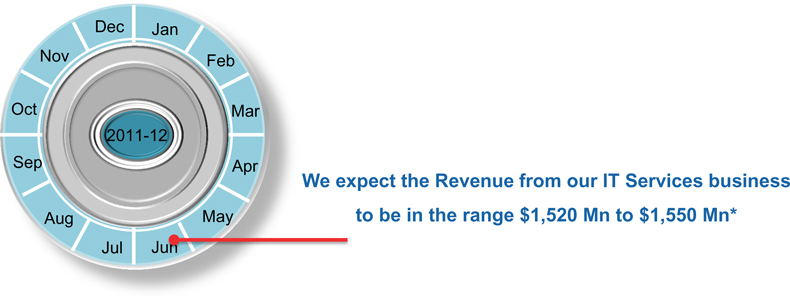
| * | Guidance is based on the following currency exchange rates: GBP/USD at 1.58 Euro/USD at 1.31, AUD/USD at 1.07, USD/INR at 50.07 |
| 9 | © 2012 WIPRO LTD | WWW.WIPRO.COM |
 |
Supplemental Data
Key Operating Metrics of IT Services
 |
| 10 | © 2012 WIPRO LTD | WWW.WIPRO.COM |
Key Operating Metrics in IT Services for the Quarter ended March 31, 2012
Particulars | Q4’12 | Q3’12 | Q4’11 | |||||||||
Revenue Composition | ||||||||||||
Global Media & Telecom | 14.9 | % | 15.4 | % | 17.2 | % | ||||||
Finance Solutions | 26.6 | % | 27.3 | % | 26.7 | % | ||||||
Manufacturing & Hitech | 19.1 | % | 19.0 | % | 19.7 | % | ||||||
Healthcare, Life Sciences & Services | 10.0 | % | 10.0 | % | 10.5 | % | ||||||
Retail & Transportation | 15.4 | % | 14.9 | % | 15.7 | % | ||||||
Energy & Utilities | 14.0 | % | 13.4 | % | 10.2 | % | ||||||
Geography Composition | ||||||||||||
Americas | 52.1 | % | 52.5 | % | 53.9 | % | ||||||
Europe | 27.7 | % | 28.2 | % | 28.0 | % | ||||||
Japan | 1.1 | % | 1.3 | % | 1.5 | % | ||||||
India & Middle East Business | 9.6 | % | 9.1 | % | 9.1 | % | ||||||
APAC & Other Emerging Markets | 9.5 | % | 8.9 | % | 7.5 | % | ||||||
People related | ||||||||||||
Number of employees | 135,920 | 136,734 | 122,385 | |||||||||
Net Additions | (814 | ) | 5,004 | 2,894 | ||||||||
| 11 | © 2012 WIPRO LTD | WWW.WIPRO.COM |
Key Operating Metrics in IT Services for the Quarter ended March 31, 2012
Particulars | Q4’12 | Q3’12 | Q4’11 | |||||||||
Customer Concentration | ||||||||||||
Top Customer | 3.5 | % | 3.9 | % | 3.1 | % | ||||||
Top 5 | 11.5 | % | 11.8 | % | 11.4 | % | ||||||
Top 10 | 20.0 | % | 19.9 | % | 19.7 | % | ||||||
Active Customers | 943 | 953 | 904 | |||||||||
No. of New Customers | 41 | 39 | 68 | |||||||||
Repeat Business | 96.7 | % | 97.9 | % | 96.9 | % | ||||||
FPP Revenue Mix | 45.2 | % | 45.5 | % | 47.8 | % | ||||||
Off Shore Revenue Mix | 46.1 | % | 45.6 | % | 48.8 | % | ||||||
Customer Size Distribution | ||||||||||||
$ 100 Mn+ | 7 | 6 | 3 | |||||||||
$ 75 Mn+ | 16 | 14 | 12 | |||||||||
$ 50 Mn+ | 25 | 25 | 22 | |||||||||
$ 20 Mn+ | 75 | 73 | 68 | |||||||||
$ 10 Mn+ | 121 | 121 | 117 | |||||||||
$ 5 Mn+ | 208 | 197 | 180 | |||||||||
$ 1 Mn+ | 475 | 462 | 429 | |||||||||
| 12 | © 2012 WIPRO LTD | WWW.WIPRO.COM |
| Thank You
Suresh Senapaty Executive Director and CFO
suresh.senapaty@wipro.com |

| 13 | © 2012 WIPRO LTD | WWW.WIPRO.COM |