Exhibit 99.2

Performance of Wipro Limited for Quarter ended – June 30, 2013
Suresh Senapaty
Executive Director and Chief Financial Officer July 26, 2013
1 © 2012 WIPRO LTD | WWW.WIPRO.COM
Financial Summary for the Quarter Ended June 30, 2013 (IFRS)
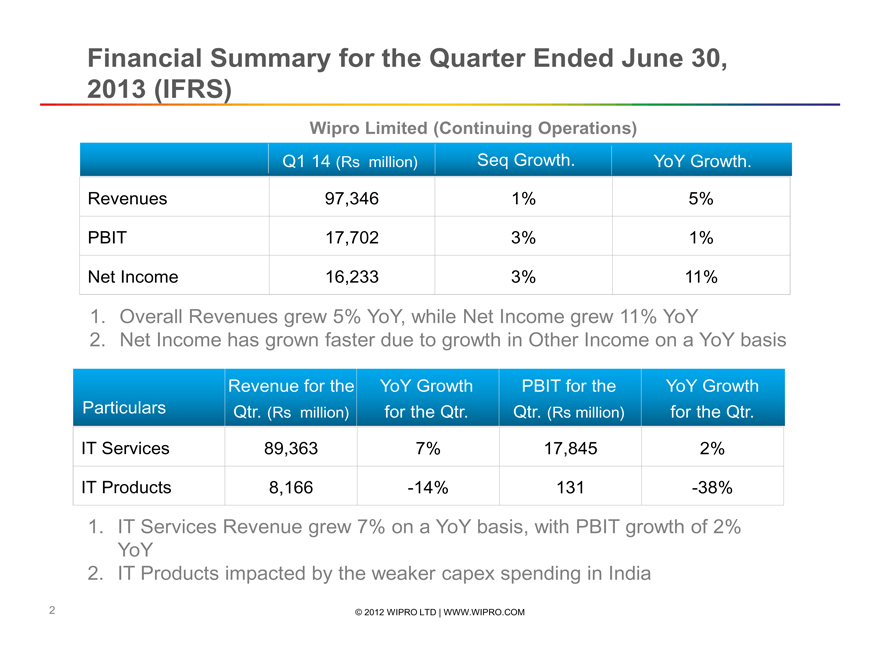
Wipro Limited (Continuing Operations)
Q1 14 (Rs million) Seq Growth. YoY Growth.
Revenues 97,346 1% 5%
PBIT 17,702 3% 1%
Net Income 16,233 3% 11%
1. Overall Revenues grew 5% YoY, while Net Income grew 11% YoY
2. Net Income has grown faster due to growth in Other Income on a YoY basis
Particulars Revenue for the Qtr. (Rs million) YoY Growth for the Qtr. PBIT for the Qtr. (Rs million) YoY Growth for the Qtr.
IT Services 89,363 7% 17,845 2%
IT Products 8,166 -14% 131 -38%
1. IT Services Revenue grew 7% on a YoY basis, with PBIT growth of 2% YoY
2. IT Products impacted by the weaker capex spending in India
2 © 2012 WIPRO LTD | WWW.WIPRO.COM
Highlights for the Quarter
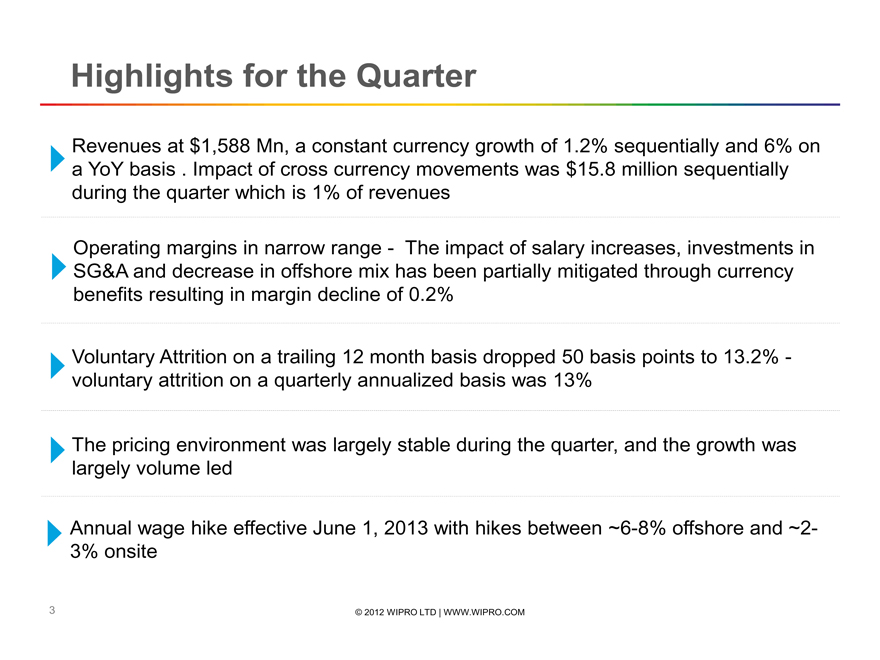
Revenues at $1,588 Mn, a constant currency growth of 1.2% sequentially and 6% on a YoY basis . Impact of cross currency movements was $15.8 million sequentially during the quarter which is 1% of revenues
Operating margins in narrow range - The impact of salary increases, investments in SG&A and decrease in offshore mix has been partially mitigated through currency benefits resulting in margin decline of 0.2%
Voluntary Attrition on a trailing 12 month basis dropped 50 basis points to 13.2% - voluntary attrition on a quarterly annualized basis was 13%
The pricing environment was largely stable during the quarter, and the growth was largely volume led
Annual wage hike effective June 1, 2013 with hikes between ~6-8% offshore and ~2-3% onsite
3 © 2012 WIPRO LTD | WWW.WIPRO.COM
IT Services - Revenue Dynamics for Quarter Ended June 30, 2013
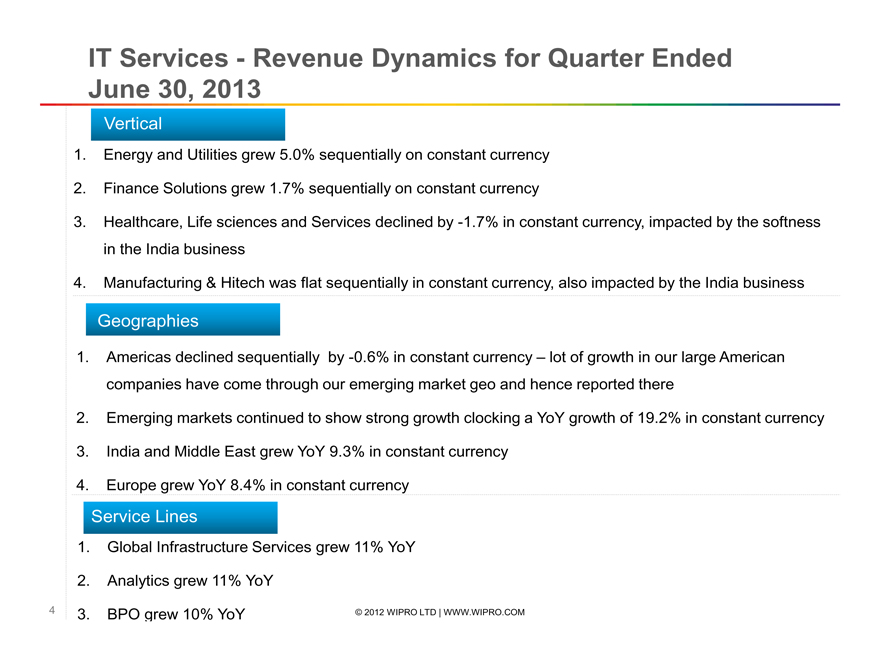
Vertical
1. Energy and Utilities grew 5.0% sequentially on constant currency
2. Finance Solutions grew 1.7% sequentially on constant currency
3. Healthcare, Life sciences and Services declined by -1.7% in constant currency, impacted by the softness in the India business
4. Manufacturing & Hitech was flat sequentially in constant currency, also impacted by the India business
Geographies
1. Americas declined sequentially by -0.6% in constant currency - lot of growth in our large American companies have come through our emerging market geo and hence reported there
2. Emerging markets continued to show strong growth clocking a YoY growth of 19.2% in constant currency
3. India and Middle East grew YoY 9.3% in constant currency
4. Europe grew YoY 8.4% in constant currency
Service Lines
1. Global Infrastructure Services grew 11% YoY
2. Analytics grew 11% YoY
3. BPO grew 10% YoY
4 © 2012 WIPRO LTD | WWW.WIPRO.COM
Industry Segment Reporting
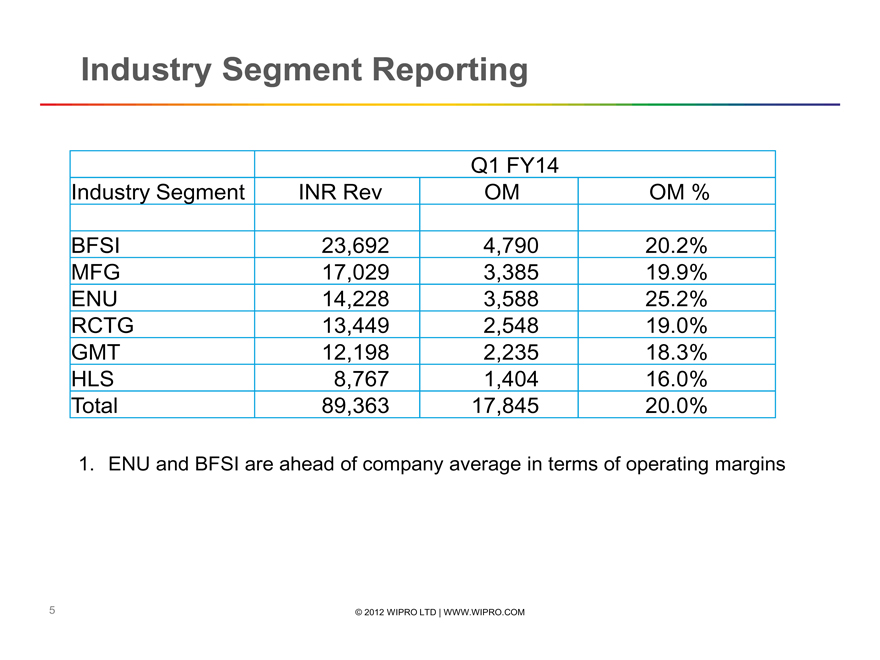
Q1 FY14
Industry Segment
BFSI
MFG
ENU
RCTG
GMT
HLS
Total
INR Rev
23,692
17,029
14,228
13,449
12,198
8,767
89,363
OM
4,790
3,385
3,588
2,548
2,235
1,404
17,845
OM %
20.2%
19.9%
25.2%
19.0%
18.3%
16.0%
20.0%
1. ENU and BFSI are ahead of company average in terms of operating margins
5 © 2012 WIPRO LTD | WWW.WIPRO.COM
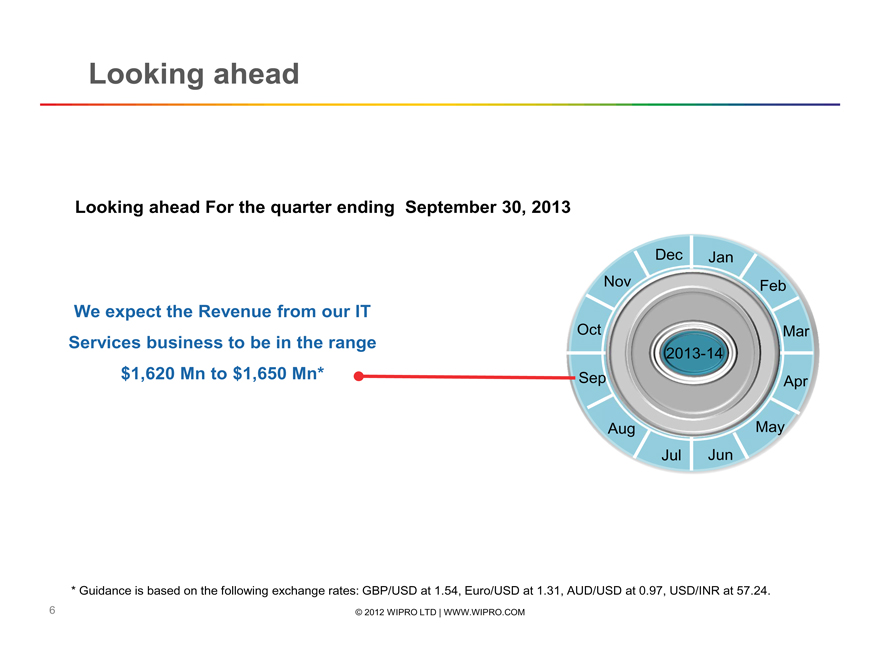
Looking ahead
Looking ahead For the quarter ending September 30, 2013
We expect the Revenue from our IT Services business to be in the range $1,620 Mn to $1,650 Mn*
Dec
Jan
Nov
Feb
Oct
Mar
2013-14
Sep
Apr
Aug
May
Jul
Jun
* Guidance is based on the following exchange rates: GBP/USD at 1.54, Euro/USD at 1.31, AUD/USD at 0.97, USD/INR at 57.24.
6 © 2012 WIPRO LTD | WWW.WIPRO.COM
Supplemental Data
Key Operating Metrics of IT Services
7 © 2012 WIPRO LTD | WWW.WIPRO.COM
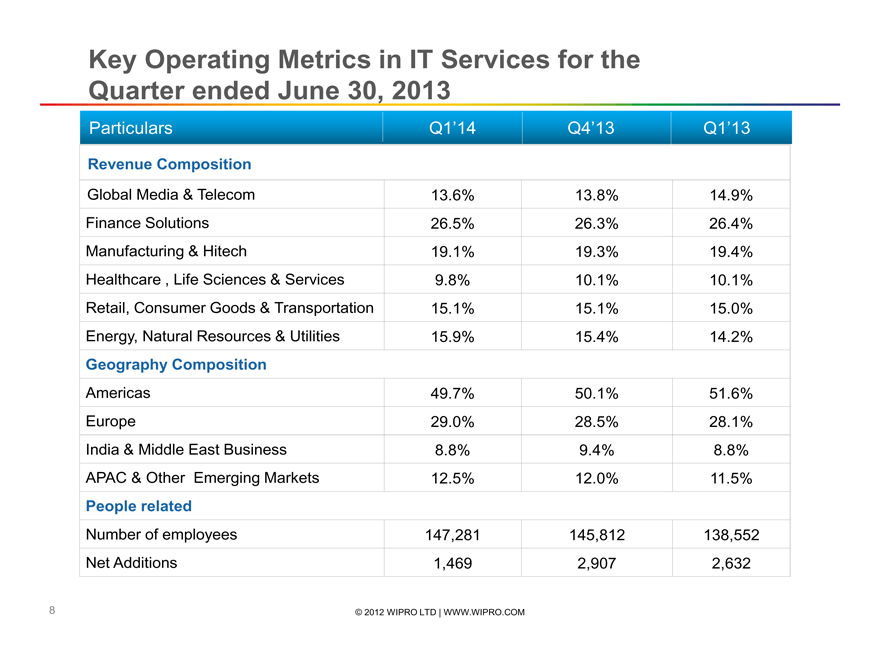
Key Operating Metrics in IT Services for the Quarter ended June 30, 2013
Particulars
Revenue Composition
Global Media & Telecom
Finance Solutions
Manufacturing & Hitech
Healthcare , Life Sciences & Services
Retail, Consumer Goods & Transportation
Energy, Natural Resources & Utilities
Geography Composition
Americas
Europe
India & Middle East Business
APAC & Other Emerging Markets
People related
Number of employees
Net Additions
Q1’14
13.6%
26.5%
19.1%
9.8%
15.1%
15.9%
49.7%
29.0%
8.8%
12.5%
147,281
1,469
Q4’13
13.8%
26.3%
19.3%
10.1%
15.1%
15.4%
50.1%
28.5%
9.4%
12.0%
145,812
2,907
Q1’13
14.9%
26.4%
19.4%
10.1%
15.0%
14.2%
51.6%
28.1%
8.8%
11.5%
138,552
2,632
8 © 2012 WIPRO LTD | WWW.WIPRO.COM

Thank You
Suresh Senapaty
Executive Director and CFO
suresh.senapaty@wipro.com
9 © 2012 WIPRO LTD | WWW.WIPRO.COM