Exhibit 99.2

Performance of Wipro Limited for Quarter ended ?December 31, 2013 Suresh Senapaty Executive Director and Chief Financial Officer January 17, 2014 1 2012 WIPRO LTD | WWW.WIPRO.COM
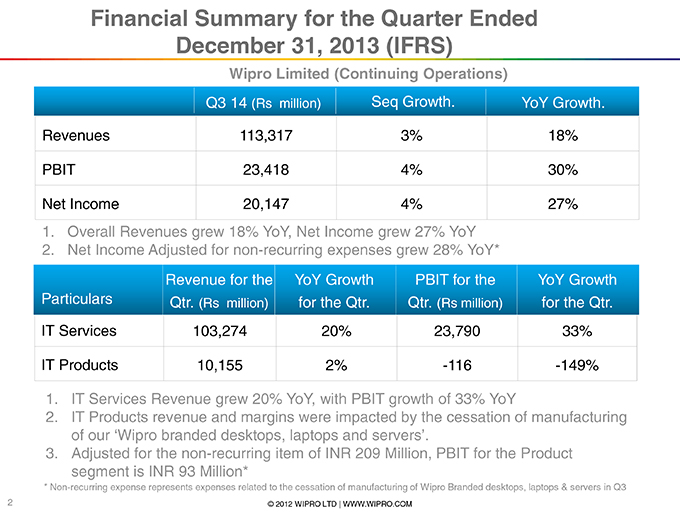
Financial Summary for the Quarter Ended December 31, 2013 (IFRS) Wipro Limited (Continuing Operations) Q3 14 (Rs million) Seq Growth. YoY Growth. Revenues 113,317 3% 18% PBIT 23,418 4% 30% Net Income 20,147 4% 27% 1. Overall Revenues grew 18% YoY, Net Income grew 27% YoY 2. Net Income Adjusted for non-recurring expenses grew 28% YoY* Revenue for the YoY Growth PBIT for the YoY Growth Particulars Qtr. (Rs million) for the Qtr. Qtr. (Rs million) for the Qtr. IT Services 103,274 20% 23,790 33% IT Products 10,155 2% -116 -149% 1. IT Services Revenue grew 20% YoY, with PBIT growth of 33% YoY 2. IT Products revenue and margins were impacted by the cessation of manufacturing of our ?Wipro branded desktops, laptops and servers?. 3. Adjusted for the non-recurring item of INR 209 Million, PBIT for the Product segment is INR 93 Million* * Non-recurring expense represents expenses related to the cessation of manufacturing of Wipro Branded desktops, laptops & servers in Q3 2 2012 WIPRO LTD | WWW.WIPRO.COM
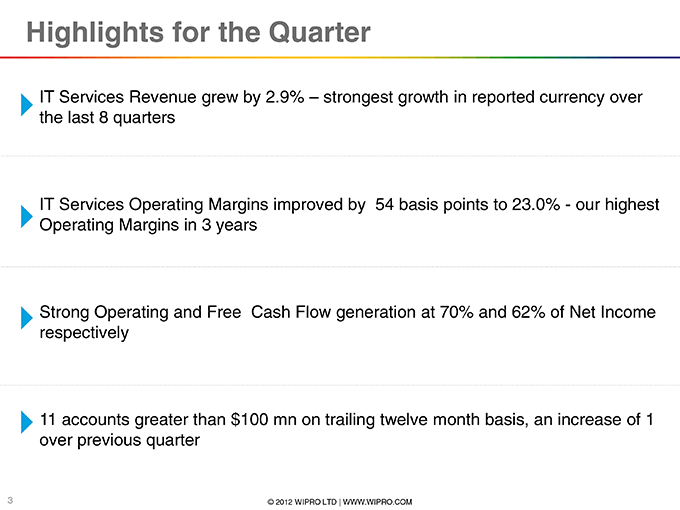
Highlights for the Quarter IT Services Revenue grew by 2.9% ? strongest growth in reported currency over the last 8 quarters IT Services Operating Margins improved by 54 basis points to 23.0%—our highest Operating Margins in 3 years Strong Operating and Free Cash Flow generation at 70% and 62% of Net Income respectively 11 accounts greater than $100 mn on trailing twelve month basis, an increase of 1 over previous quarter 3 2012 WIPRO LTD | WWW.WIPRO.COM
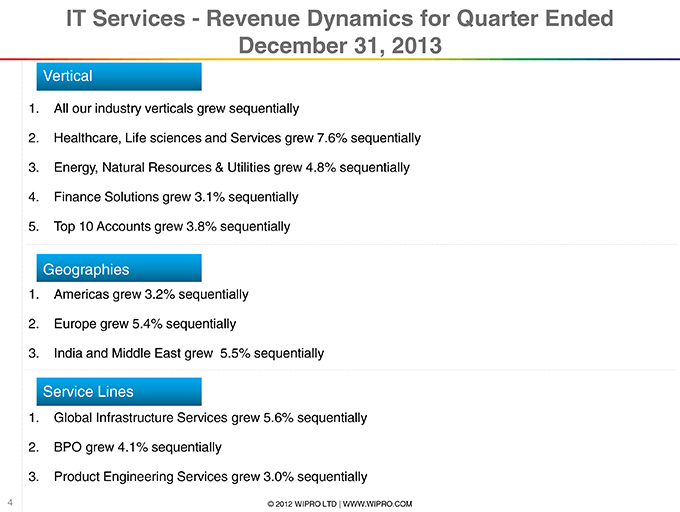
IT Services—Revenue Dynamics for Quarter Ended December 31, 2013 Vertical 1. All our industry verticals grew sequentially 2. Healthcare, Life sciences and Services grew 7.6% sequentially 3. Energy, Natural Resources & Utilities grew 4.8% sequentially 4. Finance Solutions grew 3.1% sequentially 5. Top 10 Accounts grew 3.8% sequentially Geographies 1. Americas grew 3.2% sequentially 2. Europe grew 5.4% sequentially 3. India and Middle East grew 5.5% sequentially Service Lines 1. Global Infrastructure Services grew 5.6% sequentially 2. BPO grew 4.1% sequentially 3. Product Engineering Services grew 3.0% sequentially 4 2012 WIPRO LTD | WWW.WIPRO.COM
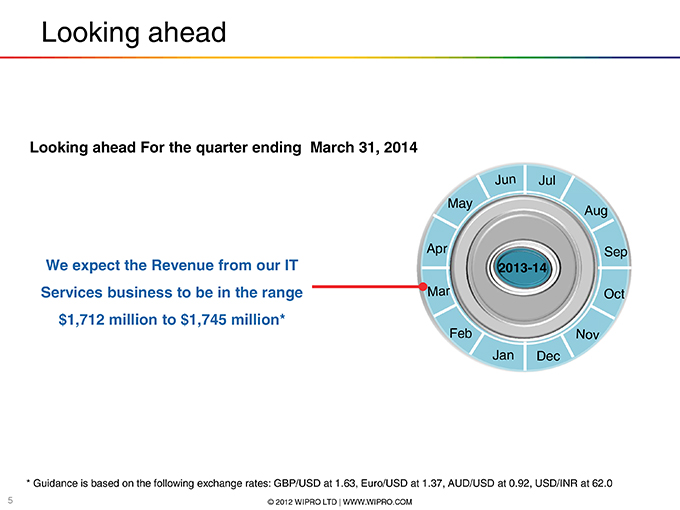
Looking ahead Looking ahead For the quarter ending March 31, 2014 Jul May Aug Apr Sep We expect the Revenue from our IT 2013-14 Services business to be in the range Oct $1,712 million to $1,745 million* Feb Jan Dec * Guidance is based on the following exchange rates: GBP/USD at 1.63, Euro/USD at 1.37, AUD/USD at 0.92, USD/INR at 62.0 5 2012 WIPRO LTD | WWW.WIPRO.COM
Supplemental Data Key Operating Metrics of IT Services 6 2012 WIPRO LTD | WWW.WIPRO.COM

Key Operating Metrics in IT Services for the Quarter ended December 31, 2013 Particulars Q3?14 Q2?14 Q3?13 Revenue Composition Global Media & Telecom 13.7% 13.9% 14.3% Finance Solutions 26.4% 26.4% 26.9% Manufacturing & Hitech 18.6% 19.0% 18.7% Healthcare , Life Sciences & Services 10.6% 10.1% 9.9% Retail, Consumer Goods & Transportation 14.6% 14.8% 15.1% Energy, Natural Resources & Utilities 16.1% 15.8% 15.1% Geography Composition Americas 49.9% 49.8% 49.9% Europe 29.6% 28.9% 29.6% India & Middle East Business 8.5% 8.3% 8.8% APAC & Other Emerging Markets 12.0% 13.0% 11.7% People related Number of employees 146,402 147,216 142,905 7 2012 WIPRO LTD | WWW.WIPRO.COM
Thank You Suresh Senapaty Executive Director and CFO suresh.senapaty@wipro.com 8 2012 WIPRO LTD | WWW.WIPRO.COM