Exhibit 99.2
|

Exhibit 99.2
Performance of Wipro Limited for Quarter ended –June 30, 2014
Suresh Senapaty
Executive Director and Chief Financial Officer July 24, 2014
© 2014 WIPRO LTD | WWW.WIPRO.COM
1 |
|
|
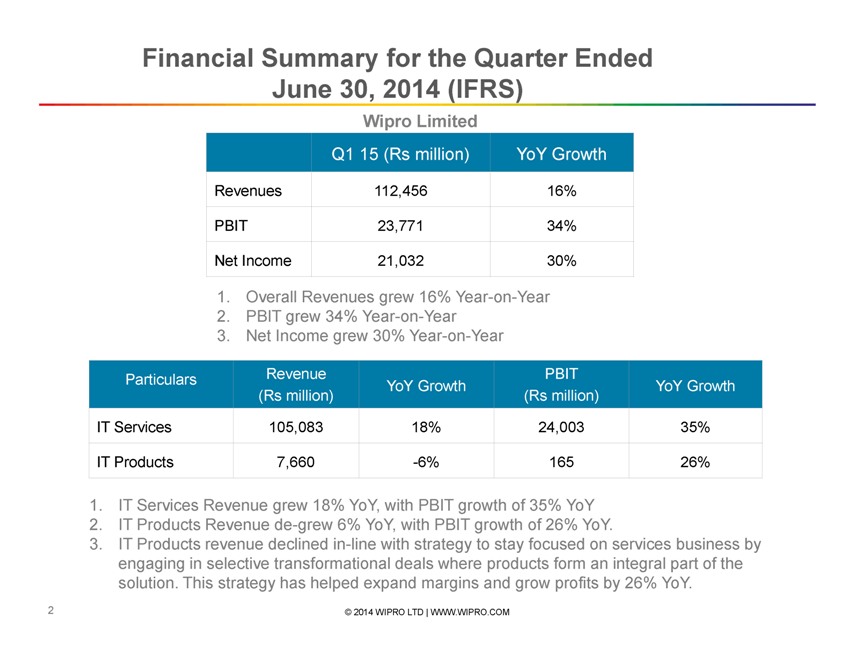
Financial Summary for the Quarter Ended June 30, 2014 (IFRS)
Wipro Limited
Q1 15 (Rs million) YoY Growth
Revenues 112,456 16%
PBIT 23,771 34%
Net Income 21,032 30%
1. |
| Overall Revenues grew 16% Year-on-Year |
2. |
| PBIT grew 34% Year-on-Year |
3. |
| Net Income grew 30% Year-on-Year |
Particulars Revenue PBIT
YoY Growth YoY Growth
(Rs million)(Rs million)
IT Services 105,083 18% 24,003 35%
IT Products 7,660 -6% 165 26%
1. IT Services Revenue grew 18% YoY, with PBIT growth of 35% YoY
2. IT Products Revenue de-grew 6% YoY, with PBIT growth of 26% YoY.
3. IT Products revenue declined in-line with strategy to stay focused on services business by engaging in selective transformational deals where products form an integral part of the solution. This strategy has helped expand margins and grow profits by 26% YoY.
© 2014 WIPRO LTD | WWW.WIPRO.COM
2 |
|
|
Highlights for the Quarter
IT Services USD Revenue grew by 1.2% sequentially and 9.6% on a YoY basis
IT Services Operating margins was on expected lines at 22.8%, 169 basis points lower largely due to wage hikes
Net Income Grew 30% YoY in the quarter while IT Services EBIT grew 35% YoY
Strong Operating and Free Cash Flow generation at 103% and 88% of Net Income respectively
© 2014 WIPRO LTD | WWW.WIPRO.COM
3 |
|
|
IT Services—Revenue Dynamics for Quarter Ended June 30, 2014
Vertical
1. Healthcare, Life sciences and Services grew 20.0% on a YoY basis
2. Global Media and Telecom grew 15.4% on a YoY basis
3. Finance Solutions grew 10.3% on a YoY basis
Geographies
1. Americas grew 9.9% on a YoY basis
2. Europe grew 11.8% on a YoY basis
3. India and Middle East grew 13.8% on a YoY basis
Service Lines
1. Global Infrastructure Services grew 16.7% on a YoY basis
2. BPO grew 20.9% on a YoY basis
3. Business Application Services grew 11.1% on a YoY basis
© 2014 WIPRO LTD | WWW.WIPRO.COM
4 |
|
|
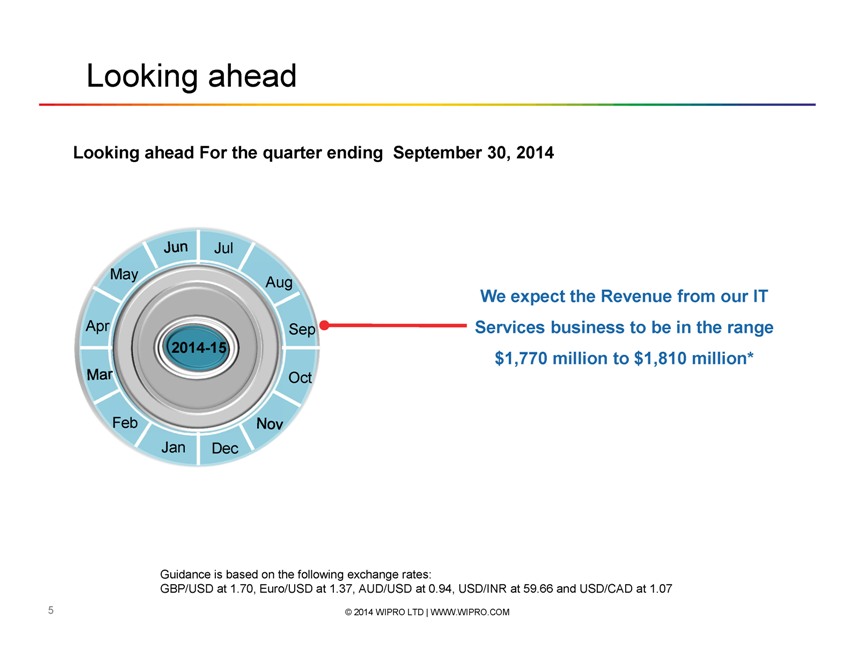
Looking ahead
Looking ahead For the quarter ending September 30, 2014
We expect the Revenue from our IT Services business to be in the range $1,770 million to $1,810 million*
Guidance is based on the following exchange rates:
GBP/USD at 1.70, Euro/USD at 1.37, AUD/USD at 0.94, USD/INR at 59.66 and USD/CAD at 1.07
© 2014 WIPRO LTD | WWW.WIPRO.COM
5 |
|
|
Supplemental Data
Key Operating Metrics of IT Services
© 2014 WIPRO LTD | WWW.WIPRO.COM
6 |
|
|
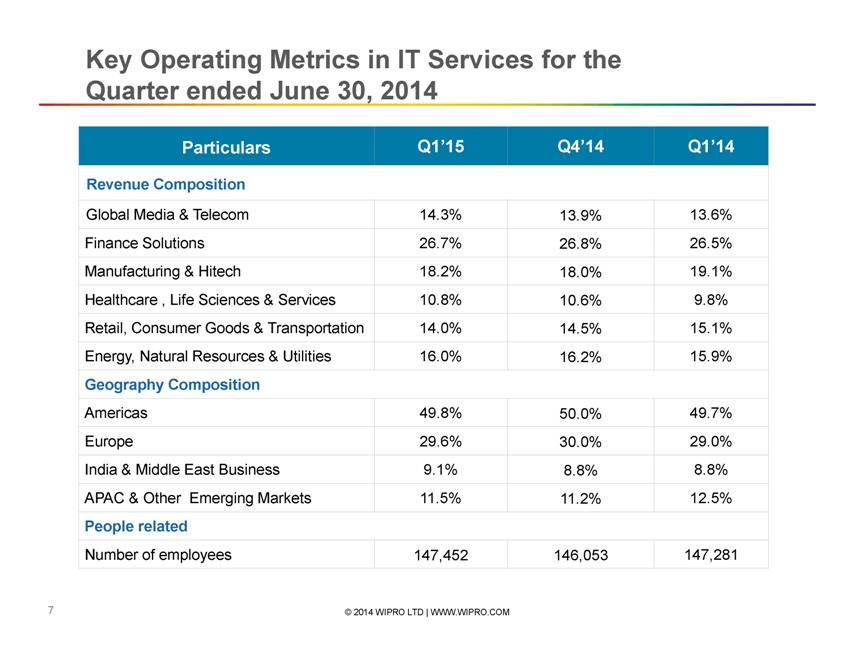
Key Operating Metrics in IT Services for the Quarter ended June 30, 2014
Particulars Q1’15 Q4’14 Q1’14
Revenue Composition
Global Media & Telecom 14.3% 13.9% 13.6%
Finance Solutions 26.7% 26.8% 26.5%
Manufacturing & Hitech 18.2% 18.0% 19.1%
Healthcare, Life Sciences & Services 10.8% 10.6% 9.8%
Retail, Consumer Goods & Transportation 14.0% 14.5% 15.1%
Energy, Natural Resources & Utilities 16.0% 16.2% 15.9%
Geography Composition
Americas 49.8% 50.0% 49.7%
Europe 29.6% 30.0% 29.0%
India & Middle East Business 9.1% 8.8% 8.8%
APAC & Other Emerging Markets 11.5% 11.2% 12.5%
People related
Number of employees 147,452 146,053 147,281
© 2014 WIPRO LTD | WWW.WIPRO.COM
7 |
|
|

Thank You
Suresh Senapaty
Executive Director and CFO
suresh.senapaty@wipro.com
© 2014 WIPRO LTD | WWW.WIPRO.COM
8 |
|