 © 2015 WIPRO LTD | WWW.WIPRO.COM 1 Performance of Wipro Limited for Quarter ended – December 31, 2014 Suresh Senapaty Executive Director and Chief Financial Officer January 16, 2015 Exhibit 99.2 |
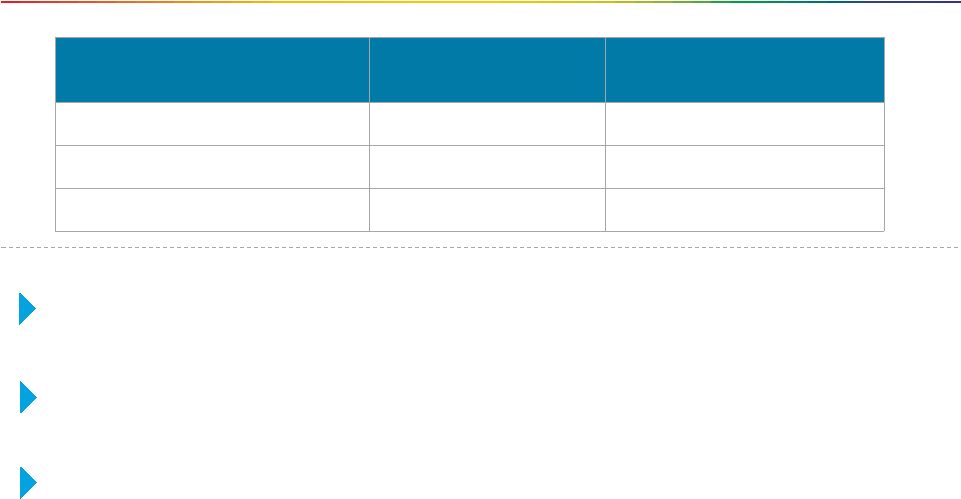 © 2015 WIPRO LTD | WWW.WIPRO.COM 2 Financial Summary for the Quarter Ended December 31, 2014 (IFRS) Wipro Limited Q3 15 (Rs million) YoY Growth Revenues 119,929 6% Results from Operating Activities 24,034 3% Net Income 21,928 9% Revenue of the Company grew 6% YoY in the quarter. Net Income grew 9% YoY. Robust Operating & Free Cash Flow generation at 79% & 73% of Net Income respectively Gross Cash position of INR 231,598 million Net Income refers to ‘Profit for the period attributable to equity shareholders of the company’ Operating Cash Flow refers to ‘Net Cash generated from Operating Activities as presented in consolidated interim statements of Cash Flows We define Gross Cash as the sum of (i) cash and cash equivalents plus (ii) Available for Sale Investments – current, and (iii) Interest bearing deposits with corporates - current. Free Cash Flow is defined as Net cash generated from operating activities plus (i) Cash outflows on Purchase of property, plant and equipment and (ii) Proceeds from Sale of property, plant and equipment as presented in consolidated interim statements of Cash Flows. For detailed reconciliations, please refer slide 10 in appendix |
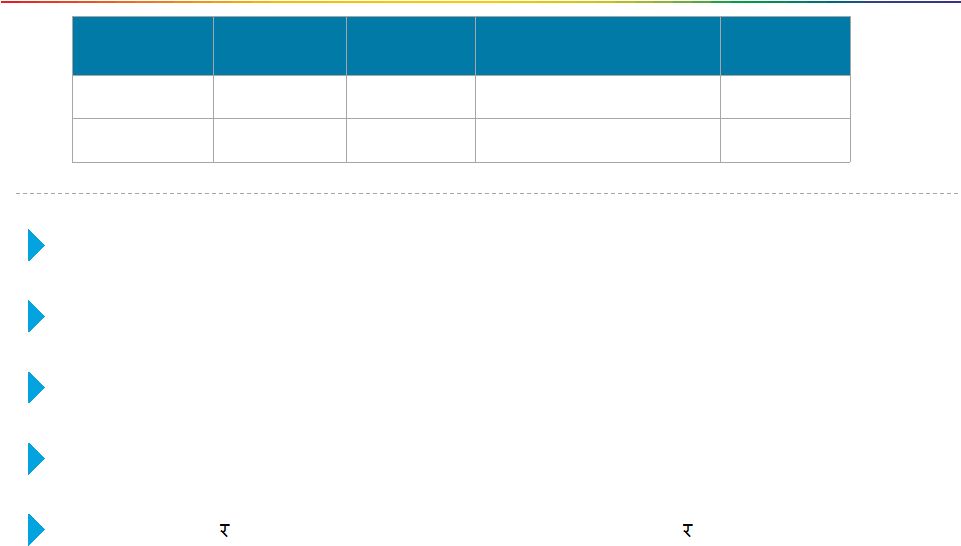 © 2015 WIPRO LTD | WWW.WIPRO.COM 3 Highlights of the results Segments Revenue (Rs million) YoY Growth Segment Results (margin) (Rs million) YoY Growth IT Services 113,445 10% 24,741 4% IT Products 7,740 -24% 89 NA IT Services USD Revenue grew by 1.3% sequentially and 7.0% on a YoY basis IT Services USD Revenue grew by 3.7% sequentially on constant currency basis $50 million+ accounts increased by 1 to 31 IT Services Margins was 21.8%. Interim Dividend of 5 ($0.08) per share/ ADS was declared, compared to 3 in FY14 Segment results of IT Products for QE 31 December 2013 was Rs -116 Million . Hence YoY growth % is not applicable. For reconciliation of non-GAAP constant currency IT Services USD revenues please refer to slide 7 |
 © 2015 WIPRO LTD | WWW.WIPRO.COM 4 IT Services - Revenue Dynamics for Quarter Ended December 31, 2014 1. Healthcare, Life sciences and Services grew 20.3% on a constant currency YoY basis 2. Energy and Utilities grew 13.4% on a constant currency YoY basis 3. Global Media and Telecom grew 11.7% on a constant currency YoY basis 1. India and Middle East grew 21.1% on a constant currency YoY basis 2. Americas grew 11.0% on a constant currency YoY basis 3. APAC and Other Emerging Markets grew 8.1% on a constant currency YoY basis Geographies 1. Global Infrastructure Services grew 20.5% on a YoY basis 2. Business Process Outsourcing grew 16.8% on a YoY basis 3. Business Application Services grew 8.9% on a YoY basis Business units Service Lines The growth percentages have been calculated based on USD revenues for the Business Unit/ Service line/ Geography |
 © 2015 WIPRO LTD | WWW.WIPRO.COM 5 Looking ahead * Guidance is based on the following exchange rates: GBP/USD at 1.56, Euro/USD at 1.23, AUD/USD at 0.84, USD/INR at 62.90 and USD/CAD at 1.15 Looking ahead for the quarter ending March 31, 2015 We expect the Revenue from our IT Services business to be in the range $1,814 million to $1,850 million* Jan Feb Apr May Jun Jul Aug Sep Oct Nov Dec 2014-15 Mar |
 © 2015 WIPRO LTD | WWW.WIPRO.COM 6 Supplemental Data Key Operating Metrics of IT Services |
 © 2015 WIPRO LTD | WWW.WIPRO.COM 7 Key Operating Metrics in IT Services for the Quarter ended December 31, 2014 Particulars Q3’15 Q2’15 Q3’14 Revenue Composition Global Media & Telecom 13.8% 13.9% 13.7% Finance Solutions 25.7% 26.0% 26.4% Manufacturing & Hitech 18.3% 18.2% 18.6% Healthcare , Life Sciences & Services 11.7% 11.2% 10.6% Retail, Consumer Goods & Transportation 14.1% 13.9% 14.6% Energy, Natural Resources & Utilities 16.4% 16.8% 16.1% Geography Composition Americas 51.4% 51.0% 49.9% Europe 27.6% 27.8% 29.6% India & Middle East Business 9.6% 9.2% 8.5% APAC & Other Emerging Markets 11.4% 12.0% 12.0% People related Number of employees 156,866 154,297 146,402 |
 © 2015 WIPRO LTD | WWW.WIPRO.COM 8 Thank You suresh.senapaty@wipro.com Suresh Senapaty Executive Director and CFO |
 © 2015 WIPRO LTD | WWW.WIPRO.COM 9 Appendix |
 © 2015 WIPRO LTD | WWW.WIPRO.COM 10 Reconciliation of Selected GAAP measures to Non-GAAP measures Reconciliation of Gross Cash WIPRO LIMITED AND SUBSIDIARIES (Amounts in INR millions) As of Dec 31, 2014 Computation of Gross cash position Cash and cash equivalents 122,113 Available for sale investments - current 82,985 Interest bearing deposits with corporates - current 26,500 Total 231,598 WIPRO LIMITED AND SUBSIDIARIES (Amounts in INR millions) Three months ended Dec 31, 2014 22,031 (1,408) 230 16,062 73% Reconciliation of Non-GAAP Constant Currency IT Services Revenue to IT Services Revenue as per IFRS ($MN) IT Services Revenue as per IFRS IT Services Revenue as per IFRS $ 1,795 Effect of Foreign currency exchange movement Effect of Foreign currency exchange movement $ 47 Non-GAAP Constant Currency IT Services Revenue based on previous quarter exchange rates Non-GAAP Constant Currency IT Services Revenue based on previous year exchange rates $ 1,842 Reconciliation of Free Cash Flow Reconciliation of Non-GAAP constant currency Revenue 17,240 $ 1,795 $ 41 $ 1,836 Profit for the period [A] Computation of Free cash flow Net cash generated from operating activities Add/(deduct) cash inflow/(outflow) on : Purchase of Property,plant and equipment Proceeds from sale of Property,plant and equipment Free cash flow attributable to equity holders of the company [B] Free cash flow as a percentage of Net income [B/A] |