Exhibit 99.6
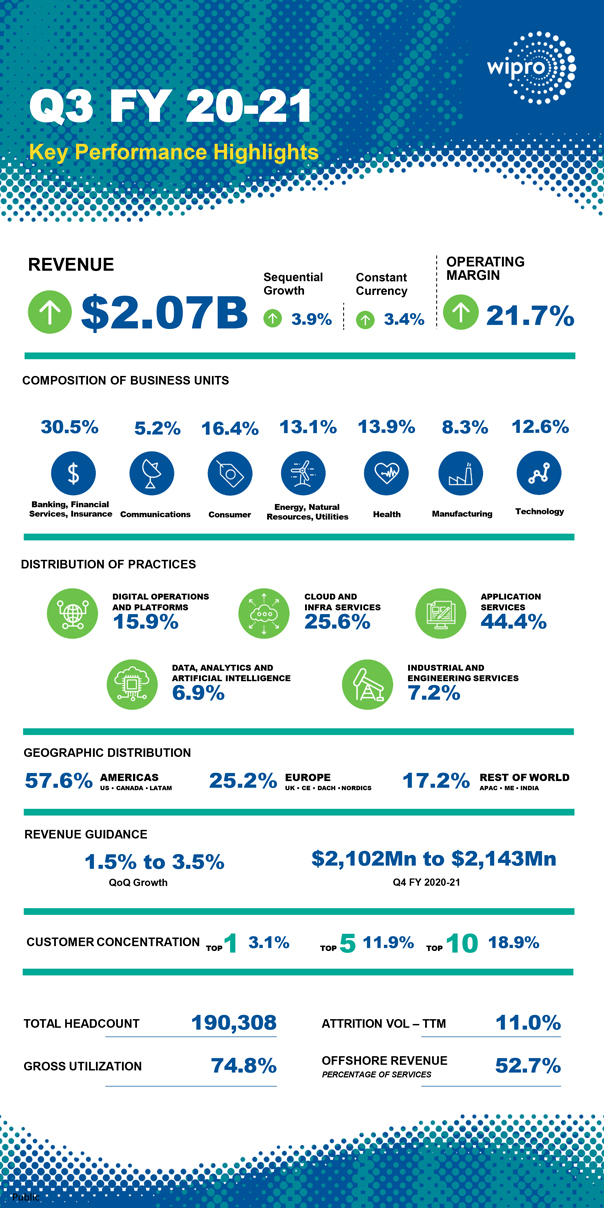
Q3 FY 20-21 Key Performance Highlights REVENUE OPERATING Sequential Constant MARGIN Growth Currency $2.07B 3.9% 3.4% 21.7% COMPOSITION OF BUSINESS UNITS 30.5% 5.2% 16.4% 13.1% 13.9% 8.3% 12.6% Banking, Financial Energy, Natural Services, Insurance Communications Consumer Health Manufacturing Technology Resources, Utilities DISTRIBUTION OF PRACTICES DIGITAL OPERATIONS CLOUD AND APPLICATION AND PLATFORMS INFRA SERVICES SERVICES 15.9% 25.6% 44.4% DATA, ANALYTICS AND INDUSTRIAL AND ARTIFICIAL INTELLIGENCE ENGINEERING SERVICES 6.9% 7.2% GEOGRAPHIC DISTRIBUTION 57.6% AMERICAS 25.2% EUROPE 17.2% REST OF WORLD US • CANADA LATAM UK CE DACH •NORDICS APAC ME INDIA REVENUE GUIDANCE 1.5% to 3.5% $2,102Mn to $2,143Mn QoQ Growth Q4 FY 2020-21 CUSTOMER CONCENTRATION 3.1% 11.9% 18.9% TOP1 TOP 5 TOP 10 TOTAL HEADCOUNT 190,308 ATTRITION VOL – TTM 11.0% OFFSHORE REVENUE GROSS UTILIZATION 74.8% PERCENTAGE OF SERVICES 52.7%
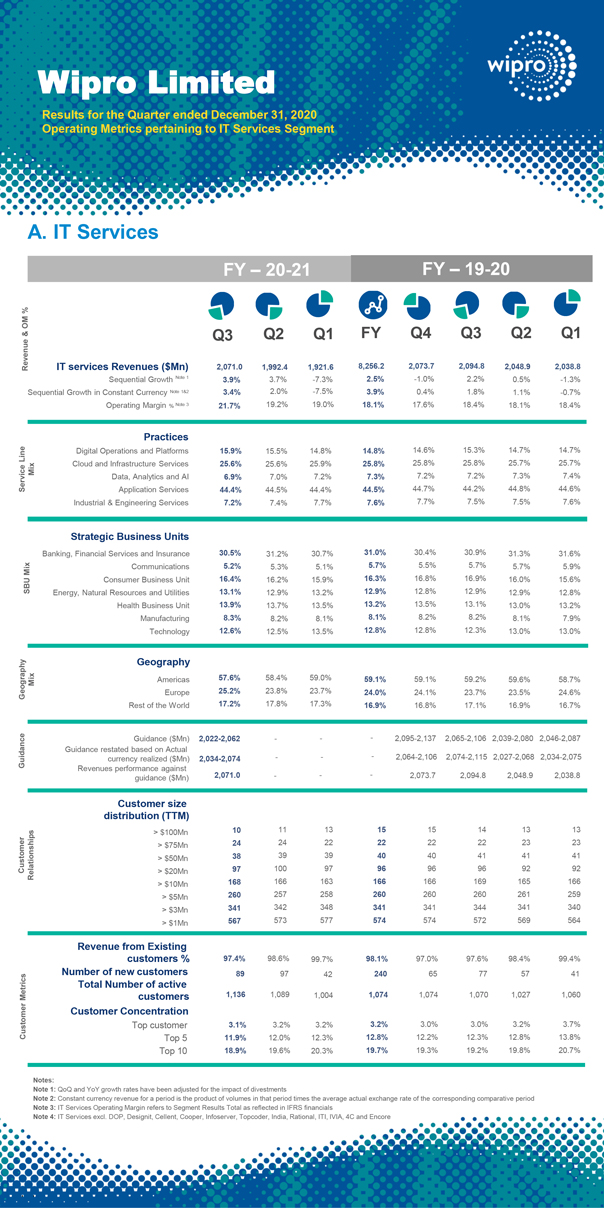
Wipro Limited Results for the Quarter ended December 31, 2020 Operating Metrics pertaining to IT Services Segment A. IT Services FY – 20-21 FY – 19-20 % OM & Q3 Q2 Q1 FY Q4 Q3 Q2 Q1 Revenue IT services Revenues ($Mn) 2,071.0 1,992.4 1,921.6 8,256.2 2,073.7 2,094.8 2,048.9 2,038.8 Sequential Growth Note 1 3.9% 3.7% -7.3% 2.5% -1.0% 2.2% 0.5% -1.3% Sequential Growth in Constant Currency Note 1&2 3.4% 2.0% -7.5% 3.9% 0.4% 1.8% 1.1% -0.7% Operating Margin % Note 3 21.7% 19.2% 19.0% 18.1% 17.6% 18.4% 18.1% 18.4% Practices Line Digital Operations and Platforms 15.9% 15.5% 14.8% 14.8% 14.6% 15.3% 14.7% 14.7% Mix Cloud and Infrastructure Services 25.6% 25.6% 25.9% 25.8% 25.8% 25.8% 25.7% 25.7% Data, Analytics and AI 6.9% 7.0% 7.2% 7.3% 7.2% 7.2% 7.3% 7.4% Service Application Services 44.4% 44.5% 44.4% 44.5% 44.7% 44.2% 44.8% 44.6% Industrial & Engineering Services 7.2% 7.4% 7.7% 7.6% 7.7% 7.5% 7.5% 7.6% Strategic Business Units Banking, Financial Services and Insurance 30.5% 31.2% 30.7% 31.0% 30.4% 30.9% 31.3% 31.6% Mix Communications 5.2% 5.3% 5.1% 5.7% 5.5% 5.7% 5.7% 5.9% Consumer Business Unit 16.4% 16.2% 15.9% 16.3% 16.8% 16.9% 16.0% 15.6% SBU Energy, Natural Resources and Utilities 13.1% 12.9% 13.2% 12.9% 12.8% 12.9% 12.9% 12.8% Health Business Unit 13.9% 13.7% 13.5% 13.2% 13.5% 13.1% 13.0% 13.2% Manufacturing 8.3% 8.2% 8.1% 8.1% 8.2% 8.2% 8.1% 7.9% Technology 12.6% 12.5% 13.5% 12.8% 12.8% 12.3% 13.0% 13.0% Geography Mix Americas 57.6% 58.4% 59.0% 59.1% 59.1% 59.2% 59.6% 58.7% Geography Europe 25.2% 23.8% 23.7% 24.0% 24.1% 23.7% 23.5% 24.6% Rest of the World 17.2% 17.8% 17.3% 16.9% 16.8% 17.1% 16.9% 16.7% Guidance ($Mn) 2,022-2,062 ——2,095-2,137 2,065-2,106 2,039-2,080 2,046-2,087 Guidance restated based on Actual —Guidance currency realized ($Mn) 2,034-2,074 - 2,064-2,106 2,074-2,115 2,027-2,068 2,034-2,075 Revenues performance against 2,071.0 ——2,073.7 2,094.8 2,048.9 2,038.8 guidance ($Mn) Customer size distribution (TTM) > $100Mn 10 11 13 15 15 14 13 13 > $75Mn 24 24 22 22 22 22 23 23 > $50Mn 38 39 39 40 40 41 41 41 Customer Relationships > $20Mn 97 100 97 96 96 96 92 92 > $10Mn 168 166 163 166 166 169 165 166 > $5Mn 260 257 258 260 260 260 261 259 > $3Mn 341 342 348 341 341 344 341 340 > $1Mn 567 573 577 574 574 572 569 564 Revenue from Existing customers % 97.4% 98.6% 99.7% 98.1% 97.0% 97.6% 98.4% 99.4% Number of new customers 89 97 42 240 65 77 57 41 Total Number of active Metrics customers 1,136 1,089 1,004 1,074 1,074 1,070 1,027 1,060 Customer Concentration Customer Top customer 3.1% 3.2% 3.2% 3.2% 3.0% 3.0% 3.2% 3.7% Top 5 11.9% 12.0% 12.3% 12.8% 12.2% 12.3% 12.8% 13.8% Top 10 18.9% 19.6% 20.3% 19.7% 19.3% 19.2% 19.8% 20.7% Notes: Note 1: QoQ and YoY growth rates have been adjusted for the impact of divestments Note 2: Constant currency revenue for a period is the product of volumes in that period times the average actual exchange rate of the corresponding comparative period Note 3: IT Services Operating Margin refers to Segment Results Total as reflected in IFRS financials Note 4: IT Services excl. DOP, Designit, Cellent, Cooper, Infoserver, Topcoder, India, Rational, ITI, IVIA, 4C and Encore
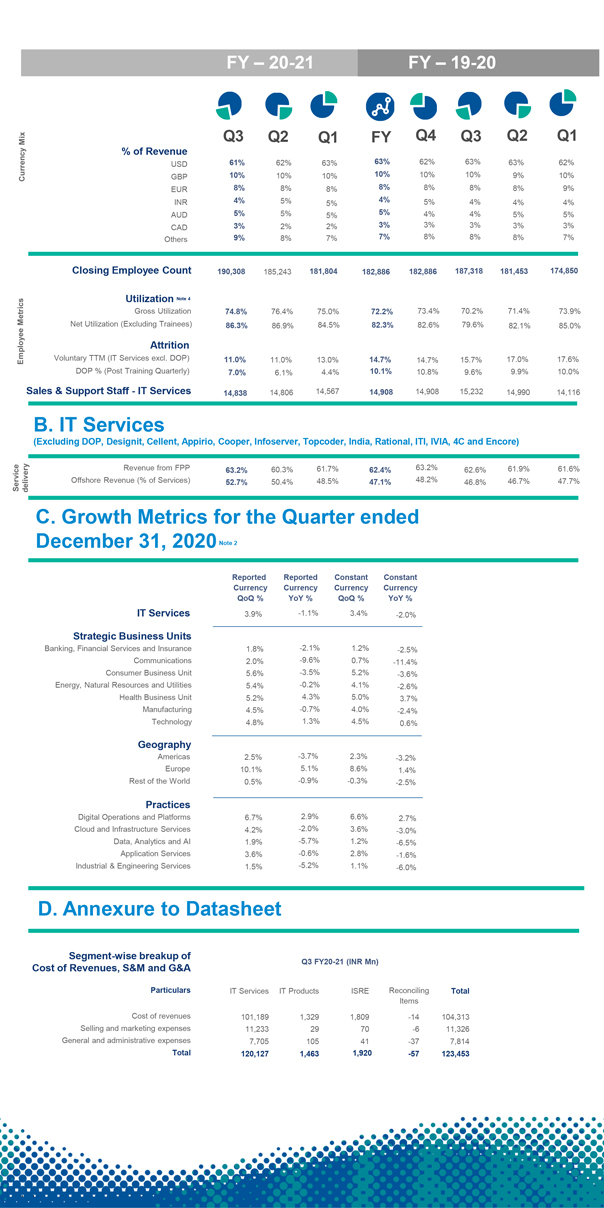
FY – 20-21 FY – 19-20 Mix Q3 Q2 Q1 FY Q4 Q3 Q2 Q1 % of Revenue USD 61% 62% 63% 63% 62% 63% 63% 62% Currency GBP 10% 10% 10% 10% 10% 10% 9% 10% EUR 8% 8% 8% 8% 8% 8% 8% 9% INR 4% 5% 4% 5% 4% 4% 4% 5% AUD 5% 5% 5% 5% 4% 4% 5% 5% CAD 3% 2% 2% 3% 3% 3% 3% 3% Others 9% 8% 7% 7% 8% 8% 8% 7% Closing Employee Count 190,308 185,243 181,804 182,886 182,886 187,318 181,453 174,850 Utilization Note 4 Metrics Gross Utilization 74.8% 76.4% 75.0% 72.2% 73.4% 70.2% 71.4% 73.9% Net Utilization (Excluding Trainees) 86.3% 86.9% 84.5% 82.3% 82.6% 79.6% 82.1% 85.0% Attrition Employee Voluntary TTM (IT Services excl. DOP) 11.0% 11.0% 13.0% 14.7% 14.7% 15.7% 17.0% 17.6% DOP % (Post Training Quarterly) 7.0% 6.1% 4.4% 10.1% 10.8% 9.6% 9.9% 10.0% Sales & Support Staff—IT Services 14,838 14,806 14,567 14,908 14,908 15,232 14,990 14,116 B. IT Services (Excluding DOP, Designit, Cellent, Appirio, Cooper, Infoserver, Topcoder, India, Rational, ITI, IVIA, 4C and Encore) Revenue from FPP 63.2% 60.3% 61.7% 62.4% 63.2% 62.6% 61.9% 61.6% Service elivery Offshore Revenue (% of Services) 52.7% 50.4% 48.5% 47.1% 48.2% 46.8% 46.7% 47.7% d C. Growth Metrics for the Quarter ended December 31, 2020Note 2 Reported Reported Constant Constant Currency Currency Currency Currency QoQ % YoY % QoQ % YoY % IT Services 3.9% -1.1% 3.4% -2.0% Strategic Business Units Banking, Financial Services and Insurance 1.8% -2.1% 1.2% -2.5% Communications 2.0% -9.6% 0.7% -11.4% Consumer Business Unit 5.6% -3.5% 5.2% -3.6% Energy, Natural Resources and Utilities 5.4% -0.2% 4.1% -2.6% Health Business Unit 5.2% 4.3% 5.0% 3.7% Manufacturing 4.5% -0.7% 4.0% -2.4% Technology 4.8% 1.3% 4.5% 0.6% Geography Americas 2.5% -3.7% 2.3% -3.2% Europe 10.1% 5.1% 8.6% 1.4% Rest of the World 0.5% -0.9% -0.3% -2.5% Practices Digital Operations and Platforms 6.7% 2.9% 6.6% 2.7% Cloud and Infrastructure Services 4.2% -2.0% 3.6% -3.0% Data, Analytics and AI 1.9% -5.7% 1.2% -6.5% Application Services 3.6% -0.6% 2.8% -1.6% Industrial & Engineering Services 1.5% -5.2% 1.1% -6.0% D. Annexure to Datasheet Segment-wise breakup of Q3 FY20-21 (INR Mn) Cost of Revenues, S&M and G&A Particulars IT Services IT Products ISRE Reconciling Total Items Cost of revenues 101,189 1,329 1,809 -14 104,313 Selling and marketing expenses 11,233 29 70 -6 11,326 General and administrative expenses 7,705 105 41 -37 7,814 Total 120,127 1,463 1,920 -57 123,453