Exhibit 99.6
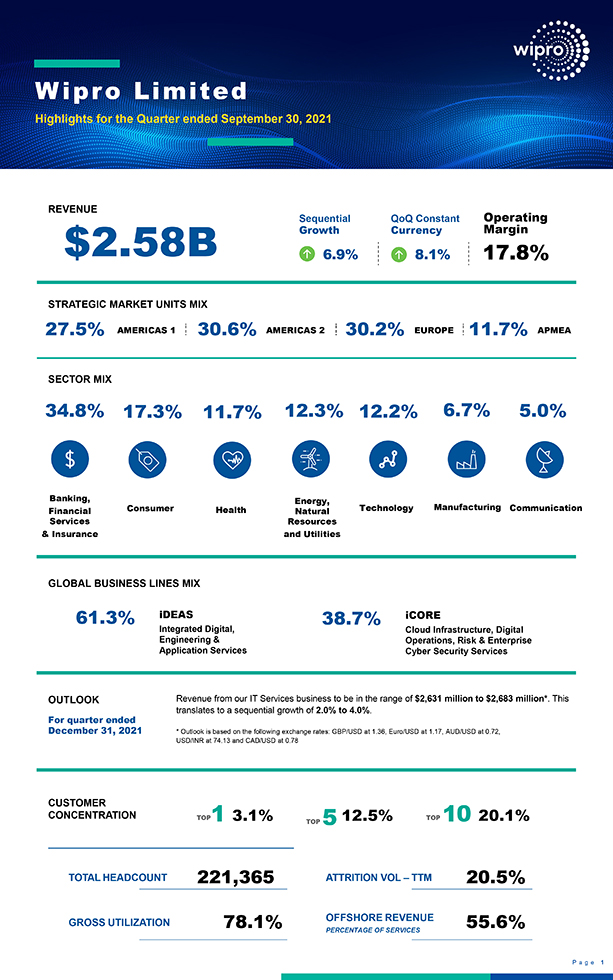
Wipro Limited Highlights for the Quarter ended September 30, 2021 REVENUE Sequential QoQ Constant Operating $2.58B Growth Currency Margin 6.9% 8.1% 17.8% STRATEGIC MARKET UNITS MIX 27.5% AMERICAS 1 30.6% AMERICAS 2 30.2% EUROPE 11.7% APMEA SECTOR MIX 34.8% 17.3% 11.7% 12.3% 12.2% 6.7% 5.0% Banking, Energy, Manufacturing Financial Consumer Health Natural Technology Communication Services Resources & Insurance and Utilities GLOBAL BUSINESS LINES MIX 61.3% iDEAS 38.7% iCORE Integrated Digital, Cloud Infrastructure, Digital Engineering & Operations, Risk & Enterprise Application Services Cyber Security Services OUTLOOK Revenue from our IT Services business to be in the range of $2,631 million to $2,683 million*. This For quarter ended translates to a sequential growth of 2.0% to 4.0%. December 31, 2021 * Outlook is based on the following exchange rates: GBP/USD at 1.36, Euro/USD at 1.17, AUD/USD at 0.72, USD/INR at 74.13 and CAD/USD at 0.78 CUSTOMER CONCENTRATION TOP1 3.1% 12.5% TOP 10 20.1% TOP 5 TOTAL HEADCOUNT 221,365 ATTRITION VOL – TTM 20.5% GROSS UTILIZATION 78.1% OFFSHORE REVENUE 55.6% PERCENTAGE OF SERVICES Page 1 Public
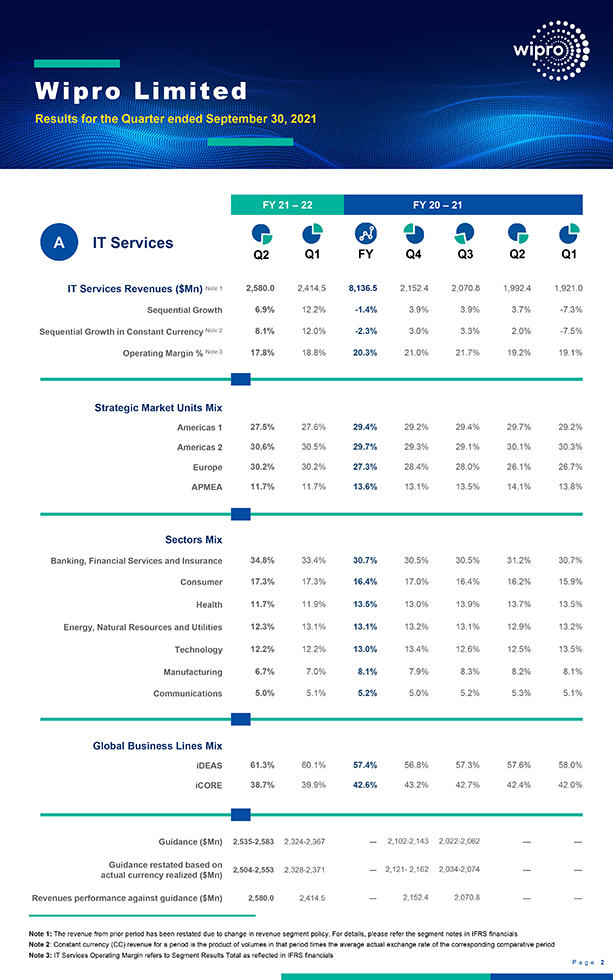
Wipro Limited Results for the Quarter ended September 30, 2021 FY 21 – 22 FY 20 – 21 A IT Services Q2 Q1 FY Q4 Q3 Q2 Q1 IT Services Revenues ($Mn) Note 1 2,580.0 2,414.5 8,136.5 2,152.4 2,070.8 1,992.4 1,921.0 Sequential Growth 6.9% 12.2% -1.4% 3.9% 3.9% 3.7% -7.3% Sequential Growth in Constant Currency Note 2 8.1% 12.0% -2.3% 3.0% 3.3% 2.0% -7.5% Operating Margin % Note 3 17.8% 18.8% 20.3% 21.0% 21.7% 19.2% 19.1% Strategic Market Units Mix Americas 1 27.5% 27.6% 29.4% 29.2% 29.4% 29.7% 29.2% Americas 2 30.6% 30.5% 29.7% 29.3% 29.1% 30.1% 30.3% Europe 30.2% 30.2% 27.3% 28.4% 28.0% 26.1% 26.7% APMEA 11.7% 11.7% 13.6% 13.1% 13.5% 14.1% 13.8% Sectors Mix Banking, Financial Services and Insurance 34.8% 33.4% 30.7% 30.5% 30.5% 31.2% 30.7% Consumer 17.3% 17.3% 16.4% 17.0% 16.4% 16.2% 15.9% Health 11.7% 11.9% 13.5% 13.0% 13.9% 13.7% 13.5% Energy, Natural Resources and Utilities 12.3% 13.1% 13.1% 13.2% 13.1% 12.9% 13.2% Technology 12.2% 12.2% 13.0% 13.4% 12.6% 12.5% 13.5% Manufacturing 6.7% 7.0% 8.1% 7.9% 8.3% 8.2% 8.1% Communications 5.0% 5.1% 5.2% 5.0% 5.2% 5.3% 5.1% Global Business Lines Mix iDEAS 61.3% 60.1% 57.4% 56.8% 57.3% 57.6% 58.0% iCORE 38.7% 39.9% 42.6% 43.2% 42.7% 42.4% 42.0% Guidance ($Mn) 2,535-2,583 2,324-2,367 — 2,102-2,143 2,022-2,062 — — Guidance restated based on 2,504-2,553 2,328-2,371 — 2,121- 2,162 2,034-2,074 — —actual currency realized ($Mn) Revenues performance against guidance ($Mn) 2,580.0 2,414.5 — 2,152.4 2,070.8 — — Note 1: The revenue from prior period has been restated due to change in revenue segment policy. For details, please refer the segment notes in IFRS financials Note 2: Constant currency (CC) revenue for a period is the product of volumes in that period times the average actual exchange rate of the corresponding comparative period Note 3: IT Services Operating Margin refers to Segment Results Total as reflected in IFRS financials 2 Page Public
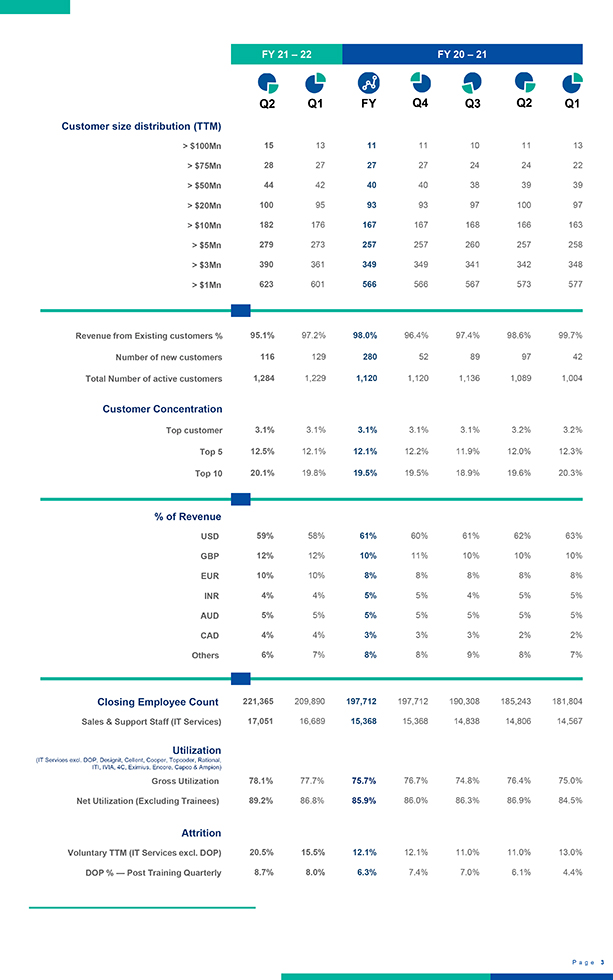
FY 21 – 22 FY 20 – 21 Q2 Q1 FY Q4 Q3 Q2 Q1 Customer size distribution (TTM) > $100Mn 15 13 11 11 10 11 13 > $75Mn 28 27 27 27 24 24 22 > $50Mn 44 42 40 40 38 39 39 > $20Mn 100 95 93 93 97 100 97 > $10Mn 182 176 167 167 168 166 163 > $5Mn 279 273 257 257 260 257 258 > $3Mn 390 361 349 349 341 342 348 > $1Mn 623 601 566 566 567 573 577 Revenue from Existing customers % 95.1% 97.2% 98.0% 96.4% 97.4% 98.6% 99.7% Number of new customers 116 129 280 52 89 97 42 Total Number of active customers 1,284 1,229 1,120 1,120 1,136 1,089 1,004 Customer Concentration Top customer 3.1% 3.1% 3.1% 3.1% 3.1% 3.2% 3.2% Top 5 12.5% 12.1% 12.1% 12.2% 11.9% 12.0% 12.3% Top 10 20.1% 19.8% 19.5% 19.5% 18.9% 19.6% 20.3% % of Revenue USD 59% 58% 61% 60% 61% 62% 63% GBP 12% 12% 10% 11% 10% 10% 10% EUR 10% 10% 8% 8% 8% 8% 8% INR 4% 4% 5% 5% 4% 5% 5% AUD 5% 5% 5% 5% 5% 5% 5% CAD 4% 4% 3% 3% 3% 2% 2% Others 6% 7% 8% 8% 9% 8% 7% Closing Employee Count 221,365 209,890 197,712 197,712 190,308 185,243 181,804 Sales & Support Staff (IT Services) 17,051 16,689 15,368 15,368 14,838 14,806 14,567 Utilization (IT Services excl. DOP, Designit, Cellent, Cooper, Topcoder, Rational, ITI, IVIA, 4C, Eximius, Encore, Capco & Ampion) Gross Utilization 78.1% 77.7% 75.7% 76.7% 74.8% 76.4% 75.0% Net Utilization (Excluding Trainees) 89.2% 86.8% 85.9% 86.0% 86.3% 86.9% 84.5% Attrition Voluntary TTM (IT Services excl. DOP) 20.5% 15.5% 12.1% 12.1% 11.0% 11.0% 13.0% DOP % — Post Training Quarterly 8.7% 8.0% 6.3% 7.4% 7.0% 6.1% 4.4% Page 3 Public
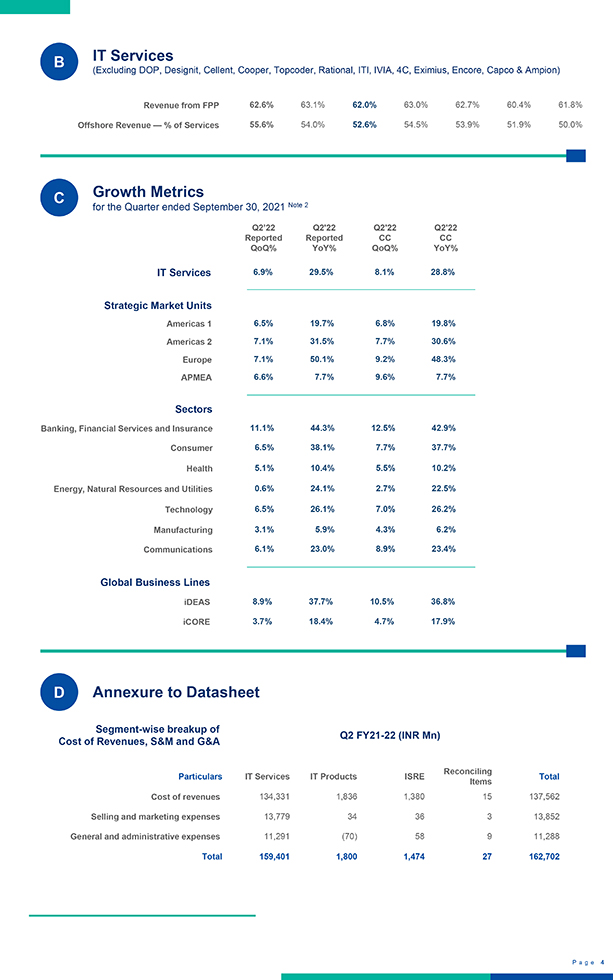
B IT Services (Excluding DOP, Designit, Cellent, Cooper, Topcoder, Rational, ITI, IVIA, 4C, Eximius, Encore, Capco & Ampion) Revenue from FPP 62.6% 63.1% 62.0% 63.0% 62.7% 60.4% 61.8% Offshore Revenue — % of Services 55.6% 54.0% 52.6% 54.5% 53.9% 51.9% 50.0% C Growth Metrics for the Quarter ended September 30, 2021 Note 2 Q2’22 Q2’22 Q2’22 Q2’22 Reported Reported CC CC QoQ% YoY% QoQ% YoY% IT Services 6.9% 29.5% 8.1% 28.8% Strategic Market Units Americas 1 6.5% 19.7% 6.8% 19.8% Americas 2 7.1% 31.5% 7.7% 30.6% Europe 7.1% 50.1% 9.2% 48.3% APMEA 6.6% 7.7% 9.6% 7.7% Sectors Banking, Financial Services and Insurance 11.1% 44.3% 12.5% 42.9% Consumer 6.5% 38.1% 7.7% 37.7% Health 5.1% 10.4% 5.5% 10.2% Energy, Natural Resources and Utilities 0.6% 24.1% 2.7% 22.5% Technology 6.5% 26.1% 7.0% 26.2% Manufacturing 3.1% 5.9% 4.3% 6.2% Communications 6.1% 23.0% 8.9% 23.4% Global Business Lines iDEAS 8.9% 37.7% 10.5% 36.8% iCORE 3.7% 18.4% 4.7% 17.9% D Annexure to Datasheet Segment-wise breakup of Q2 FY21-22 (INR Mn) Cost of Revenues, S&M and G&A Reconciling Particulars IT Services IT Products ISRE Total Items Cost of revenues 134,331 1,836 1,380 15 137,562 Selling and marketing expenses 13,779 34 36 3 13,852 General and administrative expenses 11,291 (70) 58 9 11,288 Total 159,401 1,800 1,474 27 162,702 P a g e 4 Public