Exhibit 99.6
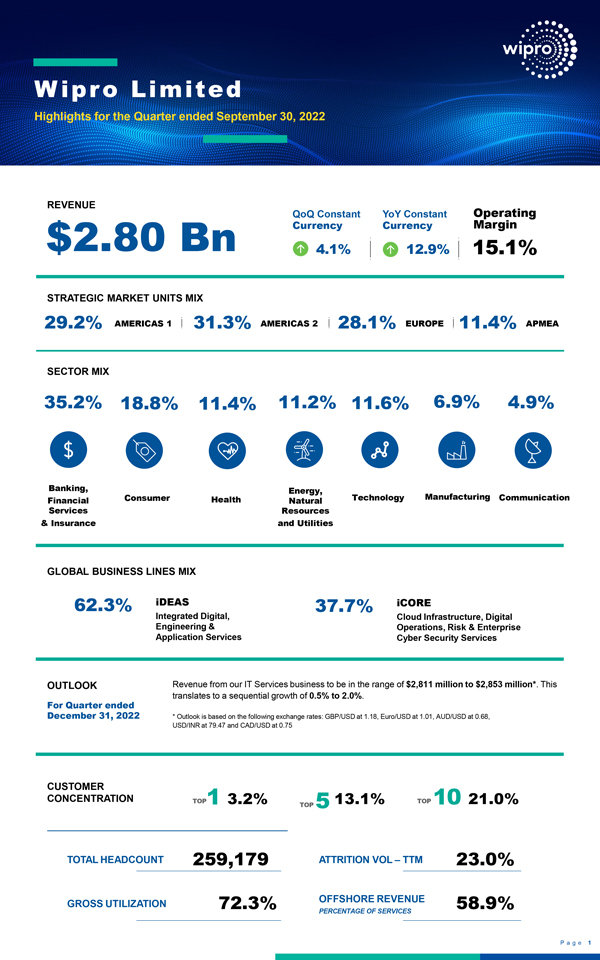
Exhibit 99.6 Wipro Limited Highlights for the Quarter ended September 30, 2022 REVENUE QoQ Constant YoY Constant Operating $2.80 Bn Currency Currency Margin 4.1% 12.9% 15.1% STRATEGIC MARKET UNITS MIX 29.2% AMERICAS 1 31.3% AMERICAS 2 28.1% EUROPE 11.4% APMEA SECTOR MIX 35.2% 18.8% 11.4% 11.2% 11.6% 6.9% 4.9% Banking, Energy, Manufacturing Financial Consumer Health Natural Technology Communication Services Resources & Insurance and Utilities GLOBAL BUSINESS LINES MIX 62.3% iDEAS 37.7% iCORE Integrated Digital, Cloud Infrastructure, Digital Engineering & Operations, Risk & Enterprise Application Services Cyber Security Services OUTLOOK Revenue from our IT Services business to be in the range of $2,811 million to $2,853 million*. This For Quarter ended translates to a sequential growth of 0.5% to 2.0%. December 31, 2022 * Outlook is based on the following exchange rates: GBP/USD at 1.18, Euro/USD at 1.01, AUD/USD at 0.68, USD/INR at 79.47 and CAD/USD at 0.75 CUSTOMER CONCENTRATION TOP 1 3.2% 13.1% TOP 10 21.0% TOP 5 TOTAL HEADCOUNT 259,179 ATTRITION VOL – TTM 23.0% GROSS UTILIZATION 72.3% OFFSHORE REVENUE 58.9% PERCENTAGE OF SERVICES Page 1
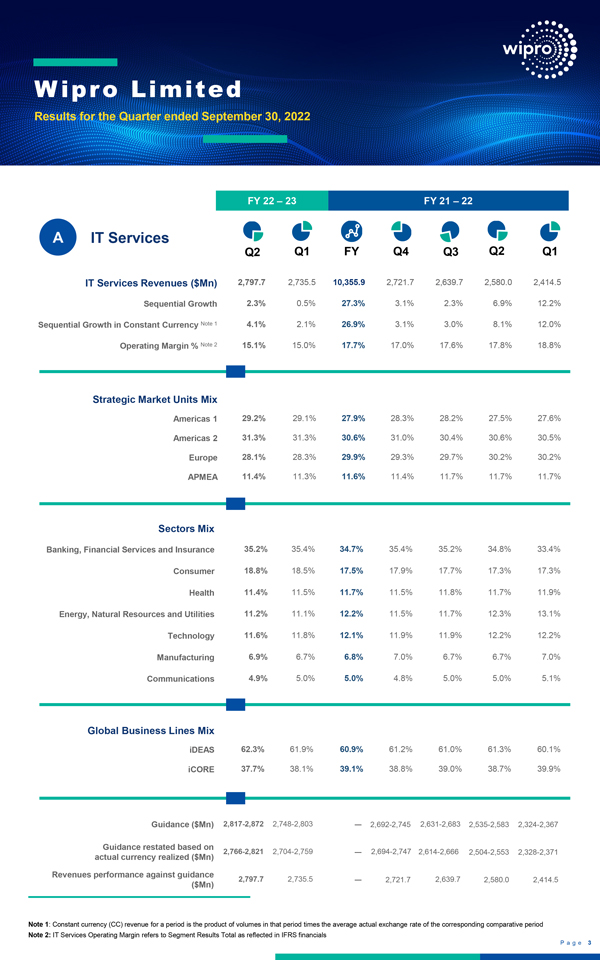
Wipro Limited Results for the Quarter ended September 30, 2022 FY 22 – 23 FY 21 – 22 A IT Services Q2 Q1 FY Q4 Q3 Q2 Q1 IT Services Revenues ($Mn) 2,797.7 2,735.5 10,355.9 2,721.7 2,639.7 2,580.0 2,414.5 Sequential Growth 2.3% 0.5% 27.3% 3.1% 2.3% 6.9% 12.2% Sequential Growth in Constant Currency Note 1 4.1% 2.1% 26.9% 3.1% 3.0% 8.1% 12.0% Operating Margin % Note 2 15.1% 15.0% 17.7% 17.0% 17.6% 17.8% 18.8% Strategic Market Units Mix Americas 1 29.2% 29.1% 27.9% 28.3% 28.2% 27.5% 27.6% Americas 2 31.3% 31.3% 30.6% 31.0% 30.4% 30.6% 30.5% Europe 28.1% 28.3% 29.9% 29.3% 29.7% 30.2% 30.2% APMEA 11.4% 11.3% 11.6% 11.4% 11.7% 11.7% 11.7% Sectors Mix Banking, Financial Services and Insurance 35.2% 35.4% 34.7% 35.4% 35.2% 34.8% 33.4% Consumer 18.8% 18.5% 17.5% 17.9% 17.7% 17.3% 17.3% Health 11.4% 11.5% 11.7% 11.5% 11.8% 11.7% 11.9% Energy, Natural Resources and Utilities 11.2% 11.1% 12.2% 11.5% 11.7% 12.3% 13.1% Technology 11.6% 11.8% 12.1% 11.9% 11.9% 12.2% 12.2% Manufacturing 6.9% 6.7% 6.8% 7.0% 6.7% 6.7% 7.0% Communications 4.9% 5.0% 5.0% 4.8% 5.0% 5.0% 5.1% Global Business Lines Mix iDEAS 62.3% 61.9% 60.9% 61.2% 61.0% 61.3% 60.1% iCORE 37.7% 38.1% 39.1% 38.8% 39.0% 38.7% 39.9% Guidance ($Mn) 2,817-2,872 2,748-2,803 — 2,692-2,745 2,631-2,683 2,535-2,583 2,324-2,367 Guidance restated based on actual currency realized ($Mn) 2,766-2,821 2,704-2,759 — 2,694-2,747 2,614-2,666 2,504-2,553 2,328-2,371 Revenues performance against guidance ($Mn) 2,797.7 2,735.5 — 2,721.7 2,639.7 2,580.0 2,414.5 Note 1: Constant currency (CC) revenue for a period is the product of volumes in that period times the average actual exchange rate of the corresponding comparative period Note 2: IT Services Operating Margin refers to Segment Results Total as reflected in IFRS financials Page 3
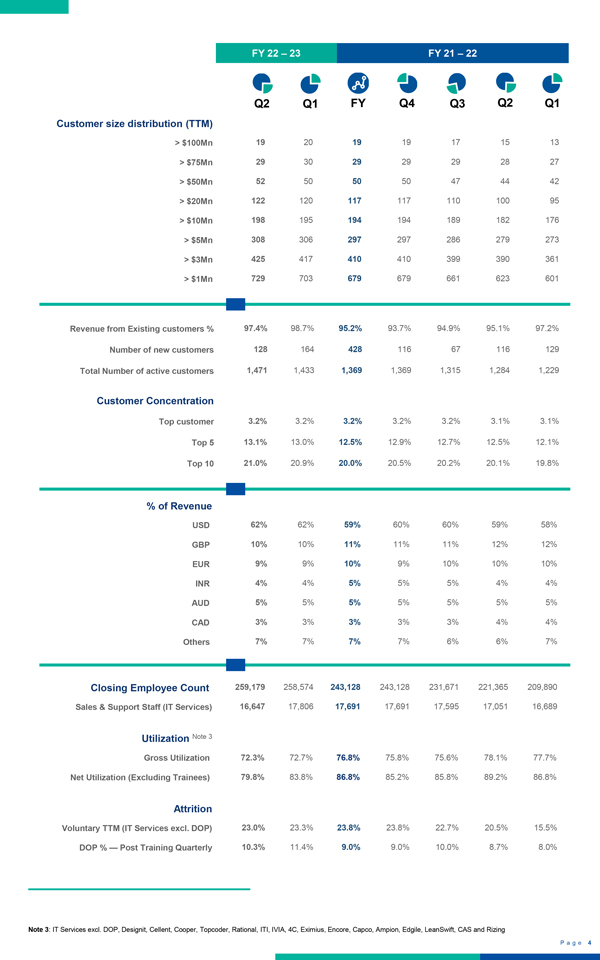
FY 22 – 23 FY 21 – 22 Q2 Q1 FY Q4 Q3 Q2 Q1 Customer size distribution (TTM) > $100Mn 19 20 19 19 17 15 13 > $75Mn 29 30 29 29 29 28 27 > $50Mn 52 50 50 50 47 44 42 > $20Mn 122 120 117 117 110 100 95 > $10Mn 198 195 194 194 189 182 176 > $5Mn 308 306 297 297 286 279 273 > $3Mn 425 417 410 410 399 390 361 > $1Mn 729 703 679 679 661 623 601 Revenue from Existing customers % 97.4% 98.7% 95.2% 93.7% 94.9% 95.1% 97.2% Number of new customers 128 164 428 116 67 116 129 Total Number of active customers 1,471 1,433 1,369 1,369 1,315 1,284 1,229 Customer Concentration Top customer 3.2% 3.2% 3.2% 3.2% 3.2% 3.1% 3.1% Top 5 13.1% 13.0% 12.5% 12.9% 12.7% 12.5% 12.1% Top 10 21.0% 20.9% 20.0% 20.5% 20.2% 20.1% 19.8% % of Revenue USD 62% 62% 59% 60% 60% 59% 58% GBP 10% 10% 11% 11% 11% 12% 12% EUR 9% 9% 10% 9% 10% 10% 10% INR 4% 4% 5% 5% 5% 4% 4% AUD 5% 5% 5% 5% 5% 5% 5% CAD 3% 3% 3% 3% 3% 4% 4% Others 7% 7% 7% 7% 6% 6% 7% Closing Employee Count 259,179 258,574 243,128 243,128 231,671 221,365 209,890 Sales & Support Staff (IT Services) 16,647 17,806 17,691 17,691 17,595 17,051 16,689 Utilization Note 3 Gross Utilization 72.3% 72.7% 76.8% 75.8% 75.6% 78.1% 77.7% Net Utilization (Excluding Trainees) 79.8% 83.8% 86.8% 85.2% 85.8% 89.2% 86.8% Attrition Voluntary TTM (IT Services excl. DOP) 23.0% 23.3% 23.8% 23.8% 22.7% 20.5% 15.5% DOP % — Post Training Quarterly 10.3% 11.4% 9.0% 9.0% 10.0% 8.7% 8.0% Note 3: IT Services excl. DOP, Designit, Cellent, Cooper, Topcoder, Rational, ITI, IVIA, 4C, Eximius, Encore, Capco, Ampion, Edgile, LeanSwift, CAS and Rizing Page 4
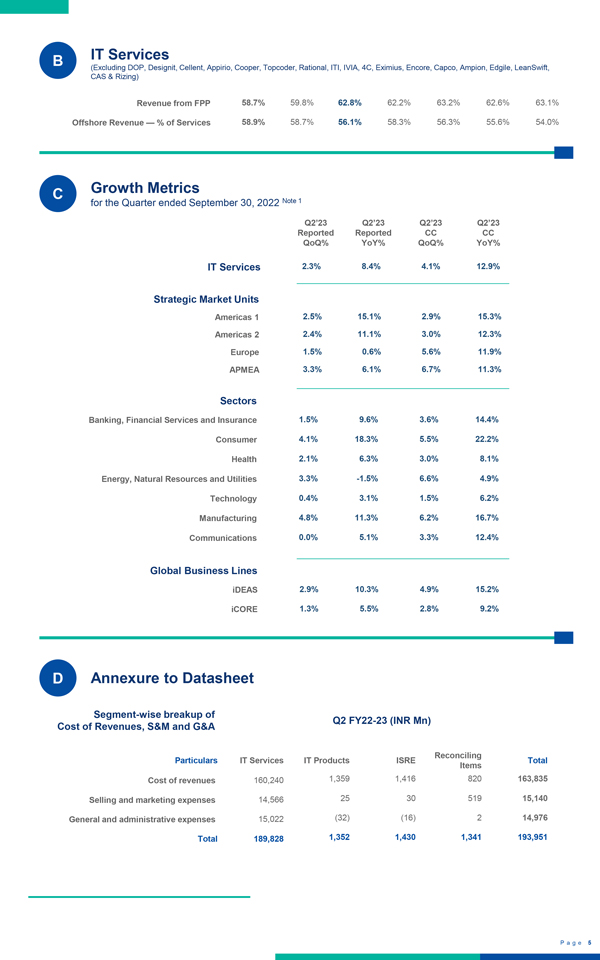
B IT Services (Excluding DOP, Designit, Cellent, Appirio, Cooper, Topcoder, Rational, ITI, IVIA, 4C, Eximius, Encore, Capco, Ampion, Edgile, LeanSwift, CAS & Rizing Revenue from FPP 58.7% 59.8% 62.8% 62.2% 63.2% 62.6% 63.1%Offshore Revenue —% of Services 58.9% 58.7% 56.1% 58.3% 56.3% 55.6% 54.0% C Growth Metrics for the Quarter ended September 30, 2022Note 1 Q2’23 Reported QoQ% Q2’23 Reported YoY% Q2’23 CC QoQ% Q2’23 CC YoY% IT Services 2.3% 8.4% 4.1% 12.9% Strategic Market Units Americas 1 2.5% 15.1% 2.9% 15.3% Americas 2 2.4% 11.1% 3.0% 12.3% Europe 1.5% 0.6% 5.6% 11.9% APMEA 3.3% 6.1% 6.7% 11.3% Sectors Banking, Financial Services and Insurance 1.5% 9.6% 3.6% 14.4% Consumer 4.1% 18.3% 5.5% 22.2% Health 2.1% 6.3% 3.0% 8.1% Energy, Natural Resources and Utilities 3.3% -1.5% 6.6% 4.9% Technology 0.4% 3.1% 1.5% 6.2% Manufacturing 4.8% 11.3% 6.2% 16.7% Communications 0.0% 5.1% 3.3% 12.4% Global Business Lines iDEAS 2.9% 10.3% 4.9% 15.2% iCORE 1.3% 5.5% 2.8% 9.2% D Annexure to Datasheet Segment-wise breakup of Cost of Revenues, S&M and G&A Q2 FY22-23 (INR Mn) Particulars IT Services IT Products ISRE Reconciling Items Total Cost of revenues 160,240 1,359 1,416 820 163,835 Selling and marketing expenses 14,566 25 30 519 15,140 General and administrative expenses 15,022 (32) (16) 2 14,976 Total 189,828 1,352 1,430 1,341 193,951 Page 5