Exhibit 99.5
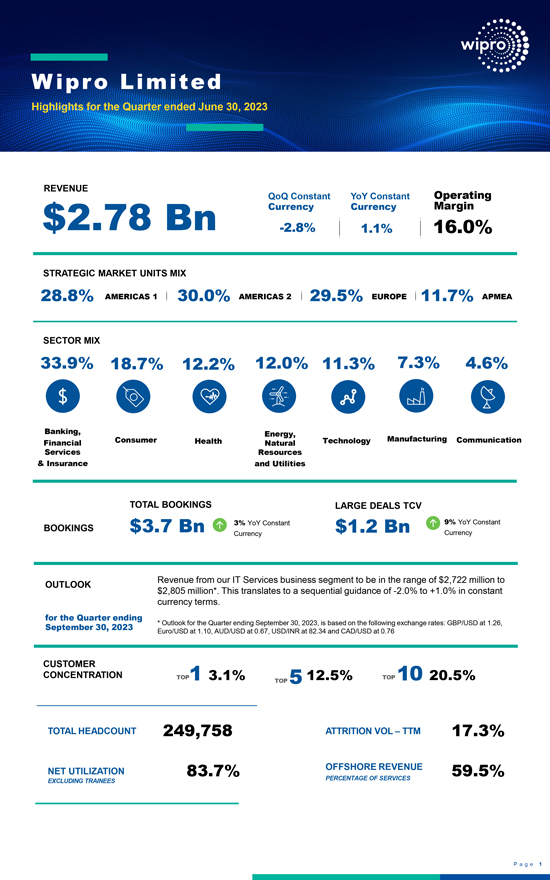
Wipro Limited Highlights for the Quarter ended June 30, 2023 REVENUE QoQ Constant YoY Constant Operating $2.78 Bn Currency Currency Margin -2.8% 1.1% 16.0% STRATEGIC MARKET UNITS MIX 28.8% AMERICAS 1 30.0% AMERICAS 2 29.5% EUROPE 11.7% APMEA SECTOR MIX 33.9% 18.7% 12.2% 12.0% 11.3% 7.3% 4.6% Banking, Energy, Financial Consumer Health Technology Manufacturing Communication Natural Services Resources & Insurance and Utilities TOTAL BOOKINGS LARGE DEALS TCV 3% YoY Constant 9% YoY Constant BOOKINGS $3.7 Bn $1.2 Bn Currency Currency OUTLOOK Revenue from our IT Services business segment to be in the range of $2,722 million to $2,805 million*. This translates to a sequential guidance of -2.0% to +1.0% in constant currency terms. for the Quarter ending September 30, 2023 * Outlook for the Quarter ending September 30, 2023, is based on the following exchange rates: GBP/USD at 1.26, Euro/USD at 1.10, AUD/USD at 0.67, USD/INR at 82.34 and CAD/USD at 0.76 CUSTOMER CONCENTRATION TOP1 3.1% 12.5% TOP 10 20.5% TOP 5 TOTAL HEADCOUNT 249,758 ATTRITION VOL – TTM 17.3% NET UTILIZATION 83.7% OFFSHORE REVENUE 59.5% EXCLUDING TRAINEES PERCENTAGE OF SERVICES P age 1
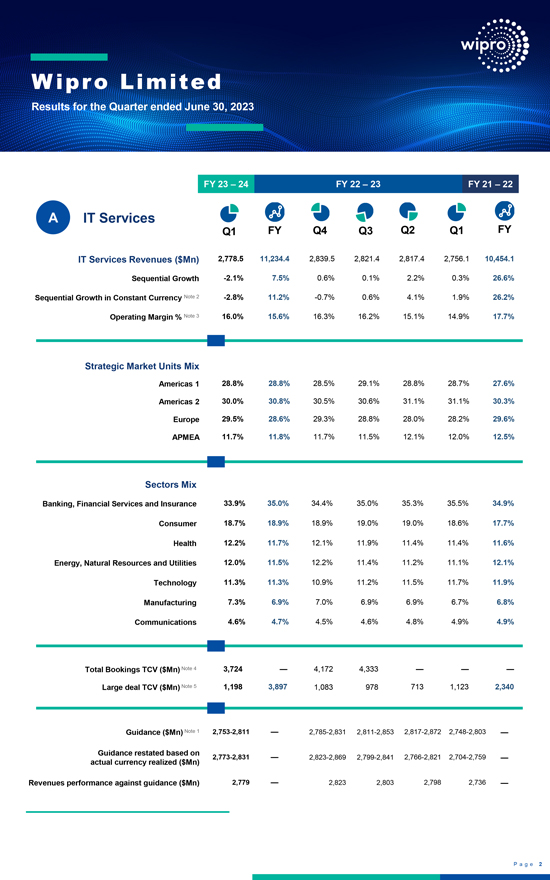
Wipro Limited Results for the Quarter ended June 30, 2023 FY 23 – 24 FY 22 – 23 FY 21 – 22 A IT Services Q1 FY Q4 Q3 Q2 Q1 FY IT Services Revenues ($Mn) 2,778.5 11,234.4 2,839.5 2,821.4 2,817.4 2,756.1 10,454.1 Sequential Growth -2.1% 7.5% 0.6% 0.1% 2.2% 0.3% 26.6% Sequential Growth in Constant Currency Note 2 -2.8% 11.2% -0.7% 0.6% 4.1% 1.9% 26.2% Operating Margin % Note 3 16.0% 15.6% 16.3% 16.2% 15.1% 14.9% 17.7% Strategic Market Units Mix Americas 1 28.8% 28.8% 28.5% 29.1% 28.8% 28.7% 27.6% Americas 2 30.0% 30.8% 30.5% 30.6% 31.1% 31.1% 30.3% Europe 29.5% 28.6% 29.3% 28.8% 28.0% 28.2% 29.6% APMEA 11.7% 11.8% 11.7% 11.5% 12.1% 12.0% 12.5% Sectors Mix Banking, Financial Services and Insurance 33.9% 35.0% 34.4% 35.0% 35.3% 35.5% 34.9% Consumer 18.7% 18.9% 18.9% 19.0% 19.0% 18.6% 17.7% Health 12.2% 11.7% 12.1% 11.9% 11.4% 11.4% 11.6% Energy, Natural Resources and Utilities 12.0% 11.5% 12.2% 11.4% 11.2% 11.1% 12.1% Technology 11.3% 11.3% 10.9% 11.2% 11.5% 11.7% 11.9% Manufacturing 7.3% 6.9% 7.0% 6.9% 6.9% 6.7% 6.8% Communications 4.6% 4.7% 4.5% 4.6% 4.8% 4.9% 4.9% Total Bookings TCV ($Mn) Note 4 3,724 — 4,172 4,333 — — —Large deal TCV ($Mn) Note 5 1,198 3,897 1,083 978 713 1,123 2,340 Guidance ($Mn) Note 1 2,753-2,811 — 2,785-2,831 2,811-2,853 2,817-2,872 2,748-2,803 — Guidance restated based on 2,773-2,831 — 2,823-2,869 2,799-2,841 2,766-2,821 2,704-2,759 —actual currency realized ($Mn) Revenues performance against guidance ($Mn) 2,779 — 2,823 2,803 2,798 2,736 — P age 2 Public

FY 23 – 24 FY 22 – 23 FY 21 – 22 Q1 FY Q4 Q3 Q2 Q1 FY Customer size distribution (TTM) > $100Mn 21 19 19 19 19 20 19 > $75Mn 28 29 29 29 29 30 29 > $50Mn 51 53 53 52 52 50 50 > $20Mn 123 117 117 119 122 120 117 > $10Mn 207 210 210 204 199 196 195 > $5Mn 319 315 315 312 314 313 304 > $3Mn 444 436 436 440 434 427 418 > $1Mn 769 766 766 755 745 719 696 Revenue from Existing customers % 99.6% 97.4% 96.6% 96.9% 97.4% 98.7% 95.3% Number of new customers 65 437 63 82 128 164 429 Total Number of active customers 1,444 1,479 1,479 1,530 1,514 1,475 1,415 Customer Concentration Top customer 3.1% 3.2% 3.2% 3.2% 3.2% 3.2% 3.1% Top 5 12.5% 12.9% 12.5% 13.3% 13.0% 12.9% 12.4% Top 10 20.5% 20.7% 20.2% 21.2% 20.8% 20.8% 19.9% % of Revenue USD 59% 61% 60% 62% 61% 61% 59% GBP 11% 10% 11% 10% 10% 10% 11% EUR 11% 10% 11% 9% 9% 9% 10% INR 5% 5% 5% 5% 5% 5% 6% AUD 4% 4% 4% 4% 5% 5% 5% CAD 3% 3% 3% 3% 3% 3% 3% Others 7% 7% 6% 7% 7% 7% 6% Closing Employee Count 249,758 258,570 258,570 262,109 262,626 262,049 246,743 Sales & Support Staff (IT Services) 16,942 16,999 16,999 17,089 16,664 17,831 17,716 Utilization Note 1 & 6 Net Utilization (Excluding Trainees) 83.7% 81.2% 81.7% 79.7% 79.8% 83.8% 86.8% Attrition Voluntary TTM (IT Services excl. DOP) 17.3% 19.4% 19.4% 21.2% 22.9% 23.0% 23.3% DOP % — Post Training Quarterly 9.2% 9.9% 9.0% 8.7% 10.3% 11.4% 9.0% P age 3
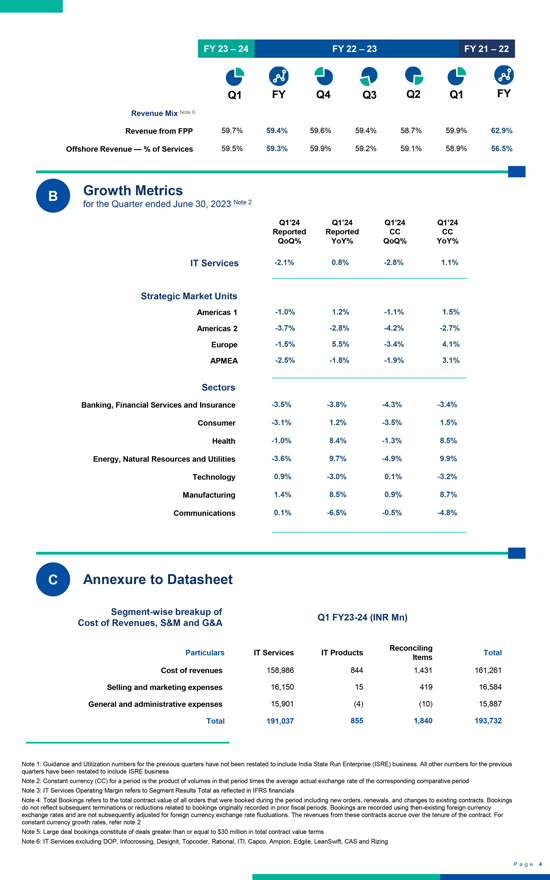
FY 23 – 24 FY 22 – 23 FY 21 – 22 Q1 FY Q4 Q3 Q2 Q1 FY Revenue Mix Note 6 Revenue from FPP 59.7% 59.4% 59.6% 59.4% 58.7% 59.9% 62.9% Offshore Revenue — % of Services 59.5% 59.3% 59.9% 59.2% 59.1% 58.9% 56.5% B Growth Metrics for the Quarter ended June 30, 2023 Note 2 Q1’24 Q1’24 Q1’24 Q1’24 Reported Reported CC CC QoQ% YoY% QoQ% YoY% IT Services -2.1% 0.8% -2.8% 1.1% Strategic Market Units Americas 1 -1.0% 1.2% -1.1% 1.5% Americas 2 -3.7% -2.8% -4.2% -2.7% Europe -1.5% 5.5% -3.4% 4.1% APMEA -2.5% -1.8% -1.9% 3.1% Sectors Banking, Financial Services and Insurance -3.5% -3.8% -4.3% -3.4% Consumer -3.1% 1.2% -3.5% 1.5% Health -1.0% 8.4% -1.3% 8.5% Energy, Natural Resources and Utilities -3.6% 9.7% -4.9% 9.9% Technology 0.9% -3.0% 0.1% -3.2% Manufacturing 1.4% 8.5% 0.9% 8.7% Communications 0.1% -6.5% -0.5% -4.8% C Annexure to Datasheet Segment-wise breakup of Q1 FY23-24 (INR Mn) Cost of Revenues, S&M and G&A Reconciling Particulars IT Services IT Products Total Items Cost of revenues 158,986 844 1,431 161,261 Selling and marketing expenses 16,150 15 419 16,584 General and administrative expenses 15,901 (4) (10) 15,887 Total 191,037 855 1,840 193,732 Note 1: Guidance and Utilization numbers for the previous quarters have not been restated to include India State Run Enterprise (ISRE) business. All other numbers for the previous quarters have been restated to include ISRE business Note 2: Constant currency (CC) for a period is the product of volumes in that period times the average actual exchange rate of the corresponding comparative period Note 3: IT Services Operating Margin refers to Segment Results Total as reflected in IFRS financials Note 4: Total Bookings refers to the total contract value of all orders that were booked during the period including new orders, renewals, and changes to existing contracts. Bookings do not reflect subsequent terminations or reductions related to bookings originally recorded in prior fiscal periods. Bookings are recorded using then-existing foreign currency exchange rates and are not subsequently adjusted for foreign currency exchange rate fluctuations. The revenues from these contracts accrue over the tenure of the contract. For constant currency growth rates, refer note 2 Note 5: Large deal bookings constitute of deals greater than or equal to $30 million in total contract value terms Note 6: IT Services excluding DOP, Info crossing, Designit, Topcoder, Rational, ITI, Capco, Ampion, Edgile, LeaSwift, CAS and Rizing Page 4