0001123852 us-gaap:CashAndCashEquivalentsMember us-gaap:FairValueInputsLevel2Member us-gaap:OtherPostretirementBenefitPlansDefinedBenefitMember 2019-12-31
UNITED STATES
SECURITIES AND EXCHANGE COMMISSION
Washington, D.C. 20549
FORM 10-K
(Mark One)
|
| |
| ☒ | ANNUAL REPORT PURSUANT TO SECTION 13 OR 15(d) OF THE SECURITIES EXCHANGE ACT OF 1934 |
For the fiscal year ended December 31, 2019 or
|
| |
| ☐ | TRANSITION REPORT PURSUANT TO SECTION 13 OR 15(d) OF THE SECURITIES EXCHANGE ACT OF 1934 |
|
|
| 001-31387 |
| (Commission File Number) |
|
|
| Northern States Power Company |
| (Exact name of registrant as specificed in its charter) |
|
| | | |
| Minnesota | 41-1967505 |
| (State or other jurisdiction of incorporation or organization) | (I.R.S. Employer Identification No.) |
| 414 Nicollet Mall | Minneapolis | Minnesota | 55401 |
| (Address of principal executive offices) | (Zip Code) |
|
| |
| (612) | 330-5500 |
| (Registrant’s telephone number, including area code) |
Securities registered pursuant to Section 12(b) of the Act:
|
| | | | |
| Title of each class | | Trading Symbol | | Name of each exchange on which registered |
| N/A | | N/A | | N/A |
Securities registered pursuant to section 12(g) of the Act: None
Indicate by check mark if the registrant is a well-known seasoned issuer, as defined in Rule 405 of the Securities Act. ☒ Yes ☐ No
Indicate by check mark if the registrant is not required to file reports pursuant to Section 13 or Section 15(d) of the Act. ☐ Yes ☒ No
Indicate by check mark whether the registrant (1) has filed all reports required to be filed by Section 13 or 15(d) of the Securities Exchange Act of 1934 during the preceding 12 months (or for such shorter period that the registrant was required to file such reports), and (2) has been subject to such filing requirements for the past 90 days. ☒ Yes ☐ No
Indicate by check mark whether the registrant has submitted electronically every Interactive Data File required to be submitted pursuant to Rule 405 of Regulation S-T (§232.405 of this chapter) during the preceding 12 months (or for such shorter period that the registrant was required to submit such files). ☒ Yes ☐ No
Indicate by check mark whether the registrant is a large accelerated filer, an accelerated filer, a non-accelerated filer, a smaller reporting company, or an emerging growth company. See the definitions of “large accelerated filer”, “accelerated filer”, “smaller reporting company”, and “emerging growth company” in Rule 12b-2 of the Exchange Act. ☐ Large accelerated filer ☐ Accelerated filer ☒ Non-accelerated filer ☐ Smaller reporting company ☐ Emerging growth company
If an emerging growth company, indicate by check mark if the registrant has elected not to use the extended transition period for complying with any new or revised financial accounting standards provided pursuant to Section 13(a) of the Exchange Act. ☐
Indicate by check mark whether the registrant is a shell company (as defined in Rule 12b-2 of the Act). ☐ Yes ☒ No
As of Feb. 21, 2020, 1,000,000 shares of common stock, par value $0.01 per share, were outstanding, all of which were held by Xcel Energy Inc., a Minnesota corporation.
DOCUMENTS INCORPORATED BY REFERENCE
The information required by Item 14 of Form 10-K is set forth under the heading “Independent Registered Public Accounting Firm – Audit and Non-Audit Fees” in Xcel Energy Inc.’s definitive Proxy Statement for the 2020 Annual Meeting of Shareholders which definitive Proxy Statement is expected to be filed with the SEC on or about April 6, 2020. Such information set forth under such heading is incorporated herein by this reference hereto.
Northern States Power Company meets the conditions set forth in General Instructions I(1)(a) and (b) of Form 10-K and is therefore filing this form with the reduced disclosure format permitted by General Instruction I(2).
TABLE OF CONTENTS
|
| | |
| PART I | | |
| Item 1 — | | |
| | | |
| | | |
| | | |
| | | |
| | | |
| | | |
| | | |
| | | |
| | | |
| Item 1A — | | |
| Item 1B — | | |
| Item 2 — | | |
| Item 3 — | | |
| Item 4 — | | |
| | | |
PART II
| | |
| Item 5 — | | |
| Item 6 — | | |
| Item 7 — | | |
| Item 7A — | | |
| Item 8 — | | |
| Item 9 — | | |
| Item 9A — | | |
| Item 9B — | | |
| | | |
PART III
| | |
| Item 10 — | | |
| Item 11 — | | |
| Item 12 — | | |
| Item 13 — | | |
| Item 14 — | | |
| | | |
PART IV
| | |
| Item 15 — | | |
| Item 16 — | | |
| | | |
| |
This Form 10-K is filed by NSP-Minnesota. NSP-Minnesota is a wholly owned subsidiary of Xcel Energy Inc. Additional information on Xcel Energy is available in various filings with the SEC. This report should be read in its entirety.
PART I
Definitions of Abbreviations
|
| |
| Xcel Energy Inc.’s Subsidiaries and Affiliates (current and former) |
| NSPM | NSP-Minnesota |
| NSP-Minnesota | Northern States Power Company, a Minnesota corporation |
| NSP System | The electric production and transmission system of NSP-Minnesota and NSP-Wisconsin operated on an integrated basis and managed by NSP-Minnesota |
| NSP-Wisconsin | Northern States Power Company, a Wisconsin corporation |
| PSCo | Public Service Company of Colorado |
| SPS | Southwestern Public Service Company |
| Utility subsidiaries | NSP-Minnesota, NSP-Wisconsin, PSCo and SPS |
| Xcel Energy | Xcel Energy Inc. and its subsidiaries |
|
| |
| Federal and State Regulatory Agencies |
| D.C. Circuit | United States Court of Appeals for the District of Columbia Circuit |
| DOC | Minnesota Department of Commerce |
| DOE | United States Department of Energy |
| DOT | United States Department of Transportation |
| EPA | United States Environmental Protection Agency |
| FERC | Federal Energy Regulatory Commission |
| IRS | Internal Revenue Service |
| MPUC | Minnesota Public Utilities Commission |
| NDPSC | North Dakota Public Service Commission |
| NERC | North American Electric Reliability Corporation |
| NRC | Nuclear Regulatory Commission |
| OAG | Minnesota Office of the Attorney General |
| PHMSA | Pipeline and Hazardous Materials Safety Administration |
| SDPUC | South Dakota Public Utilities Commission |
| SEC | Securities and Exchange Commission |
|
| |
| Electric, Purchased Gas and Resource Adjustment Clauses |
| CIP | Conservation improvement program |
| DSM | Demand side management |
| EIR | Environmental improvement rider |
| FCA | Fuel clause adjustment |
| GUIC | Gas utility infrastructure cost rider |
| PGA | Purchased gas adjustment |
| RDF | Renewable development fund |
| RER | Renewable energy rider |
| RES | Renewable energy standard |
| SEP | State energy policy rider |
| TCR | Transmission cost recovery adjustment |
|
| |
| Other |
| ADIT | Accumulated deferred income taxes |
| AFUDC | Allowance for funds used during construction |
| ALJ | Administrative law judge |
| ARO | Asset retirement obligation |
| ASC | FASB Accounting Standards Codification |
| ASU | FASB Accounting Standards Update |
| C&I | Commercial and Industrial |
| CAPM | Capital Asset Pricing Model |
| CapX2020 | Alliance of electric cooperatives, municipals and investor-owned utilities in the upper Midwest involved in a joint transmission line planning and construction effort |
| CC | Combined cycle |
| CCR | Coal combustion residuals |
| CCR Rule | Final rule (40 CFR 257.50 - 257.107) published by the EPA regulating the management, storage and disposal of CCRs as a nonhazardous waste |
| CEO | Chief executive officer |
| CFO | Chief financial officer |
CO2 | Carbon dioxide |
|
| |
| Corps | U.S. Army Corps of Engineers |
| CT | Combustion turbine |
| CWA | Clean Water Act |
| CWIP | Construction work in progress |
| DCF | Discounted Cash Flows |
| DR | Demand response |
| ELG | Effluent limitations guidelines |
| EMANI | European Mutual Association for Nuclear Insurance |
| ETR | Effective tax rate |
| FASB | Financial Accounting Standards Board |
| FTR | Financial transmission right |
| GAAP | Generally accepted accounting principles |
| GE | General Electric |
| GHG | Greenhouse gas |
| IPP | Independent power producing entity |
| IRP | Integrated Resource Plan |
| ISFSI | Independent spent fuel storage installation |
| ITC | Investment tax credit |
| JOA | Joint operating agreement |
| LNG | Liquefied natural gas |
| MEC | Mankato Energy Center |
| MGP | Manufactured gas plant |
| MISO | Midcontinent Independent System Operator, Inc. |
| Moody’s | Moody’s Investor Services |
| Native load | Customer demand of retail and wholesale customers that a utility has an obligation to serve under statute or long-term contract. |
| NAV | Net asset value |
| NEIL | Nuclear Electric Insurance Ltd. |
| NETO | New England Transmission Owners |
| NOL | Net operating loss |
| O&M | Operating and maintenance |
| Paris Agreement | Establishes a framework for GHG mitigation actions by all countries (“nationally determined contributions”) |
| PI | Prairie Island nuclear generating plant |
| Pipeline Safety Act | Pipeline Safety, Regulatory Certainty, and Job Creation Act |
| PPA | Purchased power agreement |
| PTC | Production tax credit |
| REC | Renewable energy credit |
| ROE | Return on equity |
| ROFR | Right-of-first-refusal |
| RTO | Regional Transmission Organization |
| SAB | Staff Accounting Bulletin |
| SERP | Supplemental executive retirement plan |
| SMMPA | Southern Minnesota Municipal Power Agency |
| Standard & Poor’s | Standard & Poor’s Ratings Services |
| TCJA | 2017 federal tax reform enacted as Public Law No: 115-97, commonly referred to as the Tax Cuts and Jobs Act |
| TO | Transmission owner |
| VaR | Value at Risk |
| VIE | Variable interest entity |
| Westinghouse | Westinghouse Electric Corporation |
|
| |
| Measurements |
| Bcf | Billion cubic feet |
| KV | Kilovolts |
| KWh | Kilowatt hours |
| MMBtu | Million British thermal units |
| MW | Megawatts |
| MWh | Megawatt hours |
|
|
Forward-Looking Statements
|
Except for the historical statements contained in this report, the matters discussed herein are forward-looking statements that are subject to certain risks, uncertainties and assumptions. Such forward-looking statements, assumptions and other statements are intended to be identified in this document by the words “anticipate,” “believe,” “could,” “estimate,” “expect,” “intend,” “may,” “objective,” “outlook,” “plan,” “project,” “possible,” “potential,” “should,” “will,” “would” and similar expressions. Actual results may vary materially. Forward-looking statements speak only as of the date they are made, and we expressly disclaim any obligation to update any forward-looking information. The following factors, in addition to those discussed elsewhere in this Annual Report on Form 10-K for the fiscal year ended Dec. 31, 2019 (including risk factors listed from time to time by NSP-Minnesota in reports filed with the SEC, including “Risk Factors” in Item 1A of this Annual Report on Form 10-K hereto), could cause actual results to differ materially from management expectations as suggested by such forward-looking information: operational safety, including our nuclear generation facilities; successful long-term operational planning; commodity risks associated with energy markets and production; rising energy prices and fuel costs; qualified employee work force and third-party contractor factors; ability to recover costs, changes in regulation and subsidiaries’ ability to recover costs from customers; reductions in our credit ratings and the cost of maintaining certain contractual relationships; general economic conditions, including inflation rates, monetary fluctuations and their impact on capital expenditures and the ability of NSP-Minnesota and its subsidiaries to obtain financing on favorable terms; availability or cost of capital; our customers’ and counterparties’ ability to pay their debts to us; assumptions and costs relating to funding our employee benefit plans and health care benefits; our subsidiaries’ ability to make dividend payments; tax laws; effects of geopolitical events, including war and acts of terrorism; cyber security threats and data security breaches; seasonal weather patterns; changes in environmental laws and regulations; climate change and other weather; natural disaster and resource depletion, including compliance with any accompanying legislative and regulatory changes; and costs of potential regulatory penalties.
|
|
Where to Find More Information
|
NSP-Minnesota is a wholly owned subsidiary of Xcel Energy Inc., and Xcel Energy’s website address is www.xcelenergy.com. Xcel Energy makes available, free of charge through its website, its annual report on Form 10-K, quarterly reports on Form 10-Q, current reports on Form 8-K and all amendments to those reports filed or furnished pursuant to Section 13(a) or 15(d) of the Securities Exchange Act of 1934 as soon as reasonably practicable after the reports are electronically filed with or furnished to the SEC. The SEC maintains an internet site that contains reports, proxy and information statements, and other information regarding issuers that file electronically at http://www.sec.gov.
|
| | | | | |
| |
| | | | | | |
| Electric customers | 1.5 million | | | NSP-Minnesota was incorporated in 2000 under the laws of Minnesota. NSP-Minnesota conducts business in Minnesota, North Dakota and South Dakota and has electric operations in all three states including the generation, purchase, transmission, distribution and sale of electricity. NSP-Minnesota and NSP-Wisconsin electric operations are managed on the NSP System. NSP-Minnesota also purchases, transports, distributes and sells natural gas to retail customers and transports customer-owned natural gas in Minnesota and North Dakota.
|
| Natural gas customers | 0.5 million | | |
| Total assets | $19.9 billion | | |
| Rate Base | $11.2 billion | | |
| ROE | 9.31% | | |
| Electric generating capacity | 7,712 MW | | |
| Gas storage capacity | 17.1 Bcf | | |
Electric transmission lines (conductor miles)
| 33,528 miles | | |
Electric distribution lines (conductor miles)
| 80,186 miles | | |
| Natural gas transmission lines | 86 miles | | |
| Natural gas distribution lines | 10,518 miles | | |
| | | | | |
NSP-Minnesota had electric sales volume of 41,298 (millions of KWh), 1,497,043 customers and electric revenues of $4,506.6 (millions of dollars) for 2019.
Sales/Revenue Statistics
|
| | | | | | | | |
| | | 2019 | | 2018 |
| KWH sales per retail customer | | 22,405 |
| | 23,511 |
|
| Revenue per retail customer | | $2,368 |
| | $2,414 |
|
| Residential revenue per KWh | |
| 13.22 | ¢ | |
| 13.03 | ¢ |
| Large C&I revenue per KWh | |
| 7.96 | ¢ | |
| 7.69 | ¢ |
| Small C&I revenue per KWh | |
| 10.15 | ¢ | |
| 9.79 | ¢ |
| Total retail revenue per KWh | |
| 10.57 | ¢ | |
| 10.27 | ¢ |
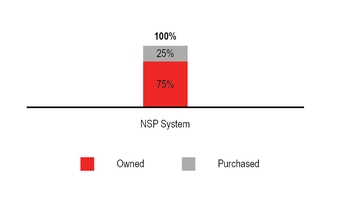
Owned and Purchased Energy Generation — 2019
Electric Energy Sources
Total electric generation by source (including energy market purchases) for the year ended Dec. 31, 2019:
*Distributed generation from the Solar*Rewards® program is not included (approximately 12.3 million KWh for 2019).
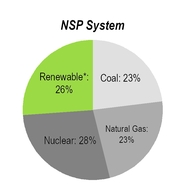
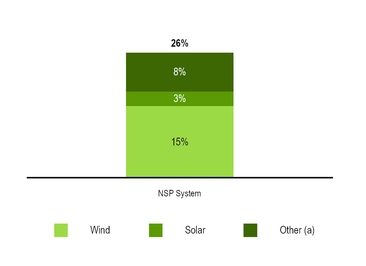
Renewable Energy Sources — NSP System
The NSP System’s renewable energy portfolio includes wind, hydroelectric, biomass and solar power from both owned generating facilities and PPAs. Renewable percentages will vary year over year based on system additions, weather, system demand and transmission constraints.
See Item 2 — Properties for further information.
Renewable energy as a percentage of total energy for 2019:
| |
(a) | Includes biomass and hydroelectric |
Wind Energy Sources
Owned — Owned and operated wind farms with corresponding capacity:
|
| | | | | | |
| 2019 | | 2018 |
| Wind Farms | | Capacity | | Wind Farms | | Capacity |
| 7 | | 1090 MW | | 5 | | 840 MW |
PPAs — Number of PPAs with range: |
| | | | | | |
| 2019 | | 2018 |
| PPAs | | Range | | PPAs | | Range |
| 131 | | 0.7 MW - 205.5 MW | | 132 | | 0.7 MW - 205.5 MW |
Capacity — Wind capacity:
|
| | |
| 2019 | | 2018 |
| 2,780 MW | | 2,550 MW |
Average Cost (Owned) — Average cost per MWh of wind energy from owned generation:
Average Cost (PPAs) — Average cost per MWh of wind energy under existing PPAs:
Wind Energy Development
NSP-Minnesota placed approximately 250 MW of wind into service during 2019:
|
| | |
| Project | | Capacity |
| Foxtail | | 150 MW |
| Lake Benton | | 99 MW |
NSP-Minnesota currently has approximately 1,170 MW of owned wind under development or construction and approximately 450 MW of planned PPAs with an estimated completion date of 2021 or earlier:
|
| | | | |
| Project | | Capacity | | Estimated Completion |
| Freeborn | | 200 MW | | 2020 |
| Blazing Star 1 | | 200 MW | | 2020 |
| Blazing Star 2 | | 200 MW | | 2020 |
Crowned Ridge (a) | | 200 MW | | 2020 |
Jeffers (b) | | 44 MW | | 2020 |
CWN (b) | | 26 MW | | 2020 |
| Dakota Range | | 300 MW | | 2021 |
| Various PPAs | | ~450 MW | | 2020-2021 |
| |
(a) | Build-own-transfer project. |
Solar Energy Sources
Solar energy PPAs: |
| | |
| Type | | Capacity |
| Distributed Generation | | 736 MW |
| Utility-Scale | | 266 MW |
Other Carbon-Free Energy Sources — NSP System
The NSP System’s other carbon-free energy portfolio includes nuclear from owned generating facilities.
See Item 2 — Properties for further information.
Nuclear Energy Sources
The NSP System has two nuclear plants (owned by NSP-Minnesota) with approximately 1,700 MW of total 2019 net summer dependable capacity.
NSP-Minnesota secures contracts for uranium concentrates, uranium conversion, uranium enrichment and fuel fabrication to operate its nuclear plants. The contract strategy involves a portfolio of spot purchases and medium and long-term contracts for uranium concentrates, conversion services and enrichment services with multiple producers and with a focus on diversification and alternate sources to minimize potential impacts caused by supply interruptions due to geographical and world political issues.
Nuclear Fuel Cost
Delivered cost per MMBtu of nuclear fuel consumed for owned electric generation and the percentage of total fuel requirements:
|
| | | | | | | |
| | | Nuclear |
| | | Cost | | Percent |
| 2019 | | $ | 0.81 |
| | 45 | % |
| 2018 | | 0.80 |
| | 45 |
|
Fossil Fuel Energy Sources — NSP System
The NSP System’s fossil fuel energy portfolio includes coal and natural gas power from both owned generating facilities and PPAs.
See Item 2 — Properties for further information.
Coal Energy Sources
NSP System has three coal plants with approximately 2,400 MW of total 2019 net summer dependable capacity.
Approved and proposed coal plant retirements: |
| | | | |
| Approved (2019 to 2027) |
| Year | | Plant | | Capacity |
| 2023 | | Sherco Unit 2 | | 682 MW |
| 2026 | | Sherco Unit 1 | | 680 MW |
|
| | | | |
| Proposed (2028 to 2030) |
| Year | | Plant | | Capacity |
| 2028 | | A.S King | | 511 MW |
| 2030 | | Sherco Unit 3 | | 517 MW |
Coal Fuel Cost
Delivered cost per MMBtu of coal consumed for owned electric generation and the percentage of total fuel requirements:
|
| | | | | | | |
| | | Coal (a) |
| | | Cost | | Percent |
| 2019 | | $ | 2.02 |
| | 36 | % |
| 2018 | | 2.13 |
| | 42 |
|
| |
(a) | Includes refuse-derived fuel and wood for the NSP System. |
Natural Gas Energy Sources
The NSP System has eight natural gas plants with approximately 2,800 MW of total 2019 net summer dependable capacity.
Natural gas supplies, transportation and storage services for power plants are procured to provide an adequate supply of fuel. Remaining requirements are procured through a liquid spot market. Generally, natural gas supply contracts have variable pricing that is tied to natural gas indices. Natural gas supply and transportation agreements include obligations for the purchase and/or delivery of specified volumes or payments in lieu of delivery.
Natural Gas Cost
Delivered cost per MMBtu of natural gas consumed for owned electric generation and the percentage of total fuel requirements:
|
| | | | | | | |
| | | Natural Gas |
| | | Cost | | Percent |
| 2019 | | $ | 3.09 |
| | 19 | % |
| 2018 | | 3.87 |
| | 13 |
|
Capacity and Demand
Uninterrupted system peak demand and occurrence date:
|
| | | | | | | | |
| System Peak Demand (in MW) |
| 2019 | | 2018 |
| 8,774 |
| | July 19 | | 8,927 |
| | June 29 |
Transmission
Transmission lines deliver electricity over long distances from power sources to transmission substations closer to homes and businesses. A strong transmission system ensures continued reliable and affordable service, ability to meet state and regional energy policy goals, and support a diverse generation mix, including renewable energy. NSP-Minnesota owns more than 33,500 conductor miles of transmission lines across its service territory.
During 2019, NSP-Minnesota completed the following transmission projects:
|
| | | | | |
| Project | | Miles | | Size |
| Maple River-Red River | | 5 |
| | 115 KV |
Upcoming transmission projects:
|
| | | | | | | |
| Project | | Miles | | Size | | Completion Date |
| Huntley-Wilmarth | | 50 |
| | 345 KV | | 2021 |
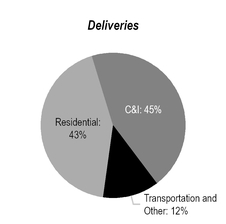
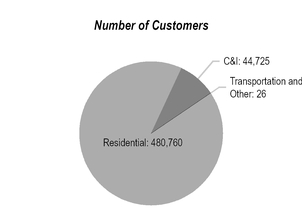
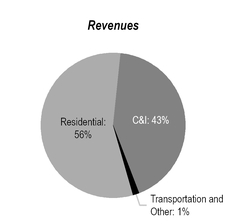
Natural gas operations consist of purchase, transportation and distribution of natural gas to end use residential, C&I and transport customers. NSP-Minnesota had natural gas deliveries of 106,292 (thousands of MMBtu), 525,511 customers and natural gas revenues of $571.3 (millions of dollars) for 2019.
Sales/Revenue Statistics
|
| | | | | | | | |
| | | 2019 | | 2018 |
| MMBtu sales per retail customer | | 176.96 |
| | 172.78 |
|
| Revenue per retail customer | | $ | 1,072.29 |
| | $ | 1,094.53 |
|
| Residential revenue per MMBtu | | 7.04 |
| | 7.29 |
|
| C&I revenue per MMBtu | | 5.12 |
| | 5.42 |
|
| Transportation and other revenue per MMBtu | | 0.59 |
| | 1.09 |
|
Capability and Demand
Natural gas supply requirements are categorized as firm or interruptible (customers with an alternate energy supply).
Maximum daily output (firm and interruptible) and occurrence date:
|
| | | | | | | | |
| 2019 | | 2018 |
| MMBtu | | Date | | MMBtu | | Date |
| 897,615 |
| (a) | Feb. 25 | | 786,751 |
| | Jan. 12 |
| |
(a) | Increase in maximum MMBtu output due to colder winter temperatures in 2019. |
Natural Gas Supply and Costs
NSP-Minnesota actively seeks natural gas supply, transportation and storage alternatives to yield a diversified portfolio, which provides increased flexibility, decreased interruption and financial risk and economical rates. In addition, NSP-Minnesota conducts natural gas price hedging activities approved by its state commissions.
Average delivered cost per MMBtu of natural gas for regulated retail distribution:
NSP-Minnesota has natural gas supply transportation and storage agreements that include obligations for purchase and/or delivery of specified volumes or to make payments in lieu of delivery.
See Item 2 - Properties for further information.
Seasonality
Demand for electric power and natural gas is affected by seasonal differences in the weather. In general, peak sales of electricity occur in the summer months and peak sales of natural gas occur in the winter months. As a result, the overall operating results may fluctuate substantially on a seasonal basis. Additionally, NSP-Minnesota’s operations have historically generated less revenues and income when weather conditions are milder in the winter and cooler in the summer.
Competition
NSP-Minnesota is subject to public policies that promote competition and development of energy markets. NSP-Minnesota’s industrial and large commercial customers have the ability to generate their own electricity. In addition, customers may have the option of substituting other fuels or relocating their facilities to a lower cost region.
Customers have the opportunity to supply their own power with distributed generation including solar generation and in most jurisdictions can currently avoid paying for most of the fixed production, transmission and distribution costs incurred to serve them.
Several states, including Minnesota, have incentives for the development of rooftop solar, community solar gardens and other distributed energy resources. Distributed generating resources are potential competitors to NSP-Minnesota’s electric service business with these incentives and federal tax subsidies.
The FERC has continued to promote competitive wholesale markets through open access transmission and other means. NSP-Minnesota’s wholesale customers can purchase their output from generation resources of competing suppliers or non-contracted quantities and use the transmission systems of Xcel Energy Inc.’s utility subsidiaries on a comparable basis to serve their native load.
FERC Order No. 1000 established competition for construction and operation of certain new electric transmission facilities. State utilities commissions have also created resource planning programs that promote competition for electricity generation resources used to provide service to retail customers.
NSP-Minnesota has franchise agreements with cities subject to periodic renewal; however, a city could seek alternative means to access electric power or gas, such as municipalization. No municipalization activities are occurring presently.
While facing these challenges, NSP-Minnesota believes its rates and services are competitive with alternatives currently available.
|
|
| Public Utility Regulation |
See Item 7 for discussion of public utility regulation.
Environmental Regulation
Our facilities are regulated by federal and state environmental agencies that have jurisdiction over air emissions, water quality, wastewater discharges, solid wastes and hazardous substances. Various company activities require registrations, permits, licenses, inspections and approvals from these agencies. NSP-Minnesota has received necessary authorizations for the construction and continued operation of its generation, transmission and distribution systems. Our facilities have been designed and constructed to operate in compliance with applicable environmental standards and related monitoring and reporting requirements. However, it is not possible to determine when or to what extent additional facilities or modifications of existing or planned facilities will be required as a result of changes to regulations, interpretations or enforcement policies or what effect future laws or regulations may have.
We may be required to incur expenditures in the future for remediation of MGP and other sites if it is determined that prior compliance efforts are not sufficient.
NSP-Minnesota must comply with emission budgets that require the purchase of emission allowances from other utilities.
There are significant present and future environmental regulations to encourage use of clean energy technologies and regulate emissions of GHGs. NSP-Minnesota has undertaken numerous initiatives to meet current requirements and prepare for potential future regulations, reduce GHG emissions and respond to state renewable and energy efficiency goals. If future environmental regulations do not take into consideration investments already made or if additional initiatives or emission reductions are required, substantial costs may be incurred.
In July 2019, the EPA adopted the Affordable Clean Energy rule, which requires states to develop plans for GHG reductions from coal-fired power plants. The state plans, due to the EPA in July 2022, will evaluate and potentially require heat rate improvements at existing coal-fired plants. It is not yet known how these state plans will affect NSP-Minnesota’s existing coal plants, but they could require substantial additional investment, even in plants slated for retirement. NSP-Minnesota believes, based on prior state commission practice, the cost of these initiatives or replacement generation would be recoverable through rates.
NSP-Minnesota seeks to address climate change and potential climate change regulation through efforts to reduce its GHG emissions in a balanced, cost-effective manner.
As of Dec. 31, 2019, NSP-Minnesota had 3,195 full-time employees and eight part-time employees, of which 2,036 were covered under collective-bargaining agreements.
Xcel Energy, which includes NSP-Minnesota, is subject to a variety of risks, many of which are beyond our control. Risks that may adversely affect the business, financial condition, results of operations or cash flows are described below. These risks should be carefully considered together with the other information set forth in this report and future reports that Xcel Energy files with the SEC.
Oversight of Risk and Related Processes
The Board of Directors is responsible for the oversight of material risk and maintaining an effective risk monitoring process. Management and the Board of Directors have responsibility for overseeing the identification and mitigation of key risks.
At a threshold level, NSP-Minnesota maintains a robust compliance program and promotes a culture of compliance beginning with the tone at the top. The risk mitigation process includes adherence to our code of conduct and compliance policies, operation of formal risk management structures and overall business management. NSP-Minnesota further mitigates inherent risks through formal risk committees and corporate functions such as internal audit, and internal controls over financial reporting and legal.
Management identifies and analyzes risks to determine materiality and other attributes such as timing, probability and controllability. Identification and risk analysis occurs formally through risk assessment conducted by senior management, the financial disclosure process, hazard risk procedures, internal audit and compliance with financial and operational controls. Management also identifies and analyzes risk through the business planning process, development of goals and establishment of key performance indicators, including identification of barriers to implementing our strategy. The business planning process also identifies likelihood and mitigating factors to prevent the assumption of inappropriate risk to meet goals.
Management communicates regularly with the Board of Directors and its sole stockholder regarding risk. Senior management presents and communicates a periodic risk assessment to the Board of Directors, providing information on the risks that management believes are material, including financial impact, timing, likelihood and mitigating factors. The Board of Directors regularly reviews management’s key risk assessments, which includes areas of existing and future macroeconomic, financial, operational, policy, environmental and security risks.
Overall, oversight, management and mitigation of risk is an integral and continuous part of the Board of Directors’ governance of NSP-Minnesota. Processes are in place to ensure appropriate risk oversight, as well as identification and consideration of new risks.
Risks Associated with Our Business
Operational Risks
Our natural gas and electric transmission and distribution operations involve numerous risks that may result in accidents and other operating risks and costs.
Our natural gas transmission and distribution activities include inherent hazards and operating risks, such as leaks, explosions, outages and mechanical problems. Our electric generation, transmission and distribution activities include inherent hazards and operating risks such as contact, fire and outages. These risks could result in loss of life, significant property damage, environmental pollution, impairment of our operations and substantial financial losses. We maintain insurance against most, but not all, of these risks and losses. The occurrence of these events, if not fully covered by insurance, could have a material effect on our financial condition, results of operations and cash flows.
Additionally, compliance with existing and potential new regulations related to the operation and maintenance of our natural gas infrastructure could result in significant costs. The PHMSA is responsible for administering the DOT’s national regulatory program to assure the safe transportation of natural gas, petroleum and other hazardous materials by pipelines. The PHMSA continues to develop regulations and other approaches to risk management to assure safety in design, construction, testing, operation, maintenance and emergency response of natural gas pipeline infrastructure. We have programs in place to comply with the PHMSA regulations and systematically monitor and renew infrastructure over time, however, a significant incident or material finding of non-compliance could result in penalties and higher costs of operations.
Our natural gas and electric transmission and distribution operations are dependent upon complex information technology systems and network infrastructure, the failure of which could disrupt our normal business operations, which could have a material adverse effect on our ability to process transactions and provide services.
Our utility operations are subject to long-term planning and project risks.
Most electric utility investments are planned to be used for decades. Transmission and generation investments typically have long lead times and are planned well in advance of when they are brought in-service subject to long-term resource plans. These plans are based on numerous assumptions such as: sales growth, customer usage, commodity prices, economic activity, costs, regulatory mechanisms, customer behavior, available technology and public policy. Our long-term resource plan is dependent on our ability to obtain required approvals, develop necessary technical expertise, allocate and coordinate sufficient resources and adhere to budgets and timelines.
In addition, the long-term nature of both our planning and our asset lives are subject to risk. The electric utility sector is undergoing a period of significant change. For example, increases in energy efficiency, wider adoption of lower cost renewable generation, distributed generation and shifts away from coal generation to decrease carbon emissions and increasing use of natural gas in electric generation driven by lower natural gas prices. Customer adoption of these technologies and increased energy efficiency could result in excess transmission and generation resources, downward pressure on sales growth, as well as stranded costs if NSP-Minnesota is not able to fully recover costs and investments.
Changing customer expectations and technologies are requiring significant investments in advanced grid infrastructure, which increases exposure to technology obsolescence.
Evolving stakeholder preference for lower emission generation sources may pressure our investments in natural gas generation and delivery. The magnitude and timing of resource additions and changes in customer demand may not coincide while customer preference for resource generation may change, which introduces further uncertainty into long-term planning. Additionally, multiple states may not agree as to the appropriate resource mix, which may lead to costs to comply with one jurisdiction that are not recoverable across all jurisdictions served by the same assets.
We are subject to longer-term availability of inputs such as coal, natural gas, uranium and water to cool our facilities. Lack of availability of these resources could jeopardize long-term operations of our facilities or make them uneconomic to operate.
We are subject to commodity risks and other risks associated with energy markets and energy production.
In the event fuel costs increase, customer demand could decline and bad debt expense may rise, which may have a material impact on our results of operations. Despite existing fuel recovery mechanisms, higher fuel costs could significantly impact our results of operations if costs are not recovered. Delays in the timing of the collection of fuel cost recoveries could impact our cash flows.
A significant disruption in supply could cause us to seek alternative supply services at potentially higher costs and supply shortages may not be fully resolved, which could cause disruptions in our ability to provide services to our customers. Failure to provide service due to disruptions may also result in fines, penalties or cost disallowances through the regulatory process. Also, significantly higher energy or fuel costs relative to sales commitments could negatively impact our cash flows and results of operations.
We also engage in wholesale sales and purchases of electric capacity, energy and energy-related products as well as natural gas. In many markets, emission allowances and/or RECs are also needed to comply with various statutes and commission rulings. As a result, we are subject to market supply and commodity price risk. Commodity price changes can affect the value of our commodity trading derivatives. We mark certain derivatives to estimated fair market value on a daily basis. Settlements can vary significantly from estimated fair values recorded and significant changes from the assumptions underlying our fair value estimates could cause earnings variability.
Failure to attract and retain a qualified workforce could have an adverse effect on operations.
Certain specialized knowledge is required of our technical employees for construction and operation of transmission, generation, and distribution assets. Our business strategy is dependent on our ability to recruit, retain and motivate employees. Competition for skilled employees is high in the areas of business operations. Failure to hire and adequately train replacement employees, including the transfer of significant internal historical knowledge and expertise to new employees, or future availability and cost of contract labor may adversely affect the ability to manage and operate our business. We have seen a tightening of supply for engineers and skilled laborers in certain markets and are implementing plans to retain these employees. Inability to attract and retain these employees could adversely impact our results of operations, financial condition or cash flows.
Our operations use third-party contractors in addition to employees to perform periodic and ongoing work.
We rely on third-party contractors to perform operations, maintenance and construction work. Our contractual arrangements with these contractors typically include performance standards, progress payments, insurance requirements and security for performance. Poor vendor performance could impact ongoing operations, restoration operations, our reputation and could introduce financial risk or risks of fines.
We are subject to the risks of nuclear generation.
NSP-Minnesota has two nuclear generation plants, PI and Monticello. Risks of nuclear generation include:
| |
| • | Hazards associated with the use of radioactive material in energy production, including management, handling, storage and disposal; |
| |
| • | Limitations on insurance available to cover losses that may arise in connection with nuclear operations, as well as obligations to contribute to an insurance pool in the event of damages at a covered U.S. reactor; and |
| |
| • | Technological and financial uncertainties related to the costs of decommissioning nuclear plants may cause our funding obligations to change. |
The NRC has authority to impose licensing and safety-related requirements for the operation of nuclear generation facilities, including the ability to impose fines and/or shut down a unit until compliance is achieved. Revised NRC safety requirements could necessitate substantial capital expenditures or an increase in operating expenses. In addition, the Institute for Nuclear Power Operations reviews our nuclear operations and nuclear generation facilities. Compliance with the Institute for Nuclear Power Operations’ recommendations could result in substantial capital expenditures or a substantial increase in operating expenses.
If an incident did occur, it could have a material impact on our results of operations, financial condition or cash flows. Furthermore, non-compliance or the occurrence of a serious incident at other nuclear facilities could result in increased industry regulation, which may increase our compliance costs.
NSP-Wisconsin’s production and transmission system is operated on an integrated basis with our production and transmission system, and NSP-Wisconsin may be subject to risks associated with our nuclear generation.
We are a wholly owned subsidiary of Xcel Energy Inc. Xcel Energy Inc. can exercise substantial control over our dividend policy and business and operations and may exercise that control in a manner that may be perceived to be adverse to our interests.
All of the members of our Board of Directors, as well as many of our executive officers, are officers of Xcel Energy Inc. Our Board of Directors makes determinations with respect to a number of significant corporate events, including the payment of our dividends.
We have historically paid quarterly dividends to Xcel Energy Inc. In 2019, 2018 and 2017 we paid $466.6 million, $456.3 million and $506.6 million of dividends to Xcel Energy Inc., respectively. If Xcel Energy Inc.’s cash requirements increase, our Board of Directors could decide to increase the dividends we pay to Xcel Energy Inc. to help support Xcel Energy Inc.’s cash needs. This could adversely affect our liquidity. The most restrictive dividend limitation for NSP-Minnesota is imposed by our state regulatory commissions. State regulatory commissions indirectly limit the amount of dividends NSP-Minnesota can pay to Xcel Energy Inc., by requiring a minimum equity-to-total capitalization ratio.
See Note 5 to the consolidated financial statements for further information.
Financial Risks
Our profitability depends on our ability to recover costs from our customers and changes in regulation may impair our ability to recover costs from our customers.
We are subject to comprehensive regulation by federal and state utility regulatory agencies, including siting and construction of facilities, customer service and the rates that we can charge customers.
The profitability of our operations is dependent on our ability to recover the costs of providing energy and utility services and earn a return on our capital investment. Our rates are generally regulated and based on an analysis of our costs incurred in a test year. We are subject to both future and historical test years depending upon the regulatory jurisdiction. Thus, the rates we are allowed to charge may or may not match our costs at any given time. Rate regulation is premised on providing an opportunity to earn a reasonable rate of return on invested capital.
There can also be no assurance that our regulatory commissions will judge all our costs to be prudent, which could result in disallowances, or that the regulatory process will always result in rates that will produce full recovery. Overall, management believes prudently incurred costs are recoverable given the existing regulatory framework. However, there may be changes in the regulatory environment that could impair our ability to recover costs historically collected from customers, or we could exceed caps on capital costs (e.g., wind projects) required by commissions and result in less than full recovery.
Changes in the long-term cost-effectiveness or to the operating conditions of our assets may result in early retirements of utility facilities. While regulation typically provides relief for these types of changes, there is no assurance that regulators would allow full recovery of all remaining costs.
In a continued low interest rate environment there has been increased downward pressure on allowed ROE. Conversely, higher than expected inflation or tariffs may increase costs of construction and operations. Also, rising fuel costs could increase the risk that we will not be able to fully recover our fuel costs from our customers.
Adverse regulatory rulings or the imposition of additional regulations could have an adverse impact on our results of operations and materially affect our ability to meet our financial obligations, including debt payments.
Any reductions in our credit ratings could increase our financing costs and the cost of maintaining certain contractual relationships.
We cannot be assured that our current ratings will remain in effect, or that a rating will not be lowered or withdrawn by a rating agency. Significant events including disallowance of costs, significantly lower returns on equity, changes to equity ratios and impacts of tax policy may impact our cash flows and credit metrics, potentially resulting in a change in our credit ratings. In addition, our credit ratings may change as a result of the differing methodologies or change in the methodologies used by the various rating agencies. Any downgrade could lead to higher borrowing costs and could impact our ability to access capital markets. Also, we may enter into contracts that require posting of collateral or settlement of applicable contracts if credit ratings fall below investment grade.
We are subject to capital market and interest rate risks.
Utility operations require significant capital investment. As a result, we frequently need to access capital markets. Capital markets are global and impacted by issues and events throughout the world. Any disruption in capital markets could have a material impact on our ability to fund our operations. Capital market disruption and financial market distress could prevent us from issuing short-term commercial paper, issuing new securities or cause us to issue securities with unfavorable terms and conditions, such as higher interest rates.
Higher interest rates on short-term borrowings with variable interest rates could also have an adverse effect on our operating results. The performance of capital markets impacts the value of assets held in trusts to satisfy future obligations to decommission our nuclear plants and satisfy our defined benefit pension and postretirement benefit plan obligations. These assets are subject to market fluctuations and yield uncertain returns, which may fall below expected returns. A decline in the market value of these assets may increase funding requirements. Additionally, the fair value of the debt securities held in the nuclear decommissioning and/or pension trusts may be impacted by changes in interest rates.
We are subject to credit risks.
Credit risk includes the risk that our customers will not pay their bills, which may lead to a reduction in liquidity and an increase in bad debt expense. Credit risk is comprised of numerous factors including the price of products and services provided, the overall economy and local economies in the geographic areas we serve, including local unemployment rates.
Credit risk also includes the risk that various counterparties that owe us money or product will become insolvent and may breach their obligations. Should the counterparties fail to perform, we may be forced to enter into alternative arrangements. In that event, our financial results could be adversely affected and incur losses.
We may at times have direct credit exposure in our short-term wholesale and commodity trading activity to financial institutions trading for their own accounts or issuing collateral support on behalf of other counterparties. We may also have some indirect credit exposure due to participation in organized markets, such as Southwest Power Pool, Inc., PJM Interconnection, LLC, MISO and Electric Reliability Council of Texas, in which any credit losses are socialized to all market participants.
We have additional indirect credit exposure to financial institutions in the form of letters of credit provided as security by power suppliers under various purchased power contracts. If any of the credit ratings of the letter of credit issuers were to drop below investment grade, the supplier would need to replace that security with an acceptable substitute. If the security were not replaced, the party could be in default under the contract.
As we are a subsidiary of Xcel Energy Inc., we may be negatively affected by events impacting the credit or liquidity of Xcel Energy Inc. and its affiliates.
If either Standard & Poor’s or Moody’s were to downgrade Xcel Energy Inc.’s debt securities below investment grade, it would increase Xcel Energy Inc.’s cost of capital and restrict its access to the capital markets. This could limit Xcel Energy Inc.’s ability to contribute equity or make loans to us, or may cause Xcel Energy Inc. to seek additional or accelerated funding from us in the form of dividends. If such event were to occur, we may need to seek alternative sources of funds to meet our cash needs.
As of Dec. 31, 2019, Xcel Energy Inc. and its utility subsidiaries had approximately $17.4 billion of long-term debt and $1.3 billion of short-term debt and current maturities. Xcel Energy Inc. provides various guarantees and bond indemnities supporting some of its subsidiaries by guaranteeing the payment or performance by these subsidiaries for specified agreements or transactions.
Xcel Energy also has other contingent liabilities resulting from various tax disputes and other matters. Xcel Energy Inc.’s exposure under the guarantees is based upon the net liability of the relevant subsidiary under the specified agreements or transactions. The majority of Xcel Energy Inc.’s guarantees limit its exposure to a maximum amount that is stated in the guarantees.
As of Dec. 31, 2019, Xcel Energy had guarantees outstanding with a maximum stated amount of approximately $2.0 million and immaterial exposure. Xcel Energy also had additional guarantees of $60.4 million at Dec. 31, 2019 for performance and payment of surety bonds for the benefit of itself and its subsidiaries, with total exposure that cannot be estimated at this time. If Xcel Energy Inc. were to become obligated to make payments under these guarantees and bond indemnities or become obligated to fund other contingent liabilities, it could limit Xcel Energy Inc.’s ability to contribute equity or make loans to us, or may cause Xcel Energy Inc. to seek additional or accelerated funding from us in the form of dividends. If such event were to occur, we may need to seek alternative sources of funds to meet our cash needs.
Increasing costs of our defined benefit retirement plans and employee benefits may adversely affect our results of operations, financial condition or cash flows.
We have defined benefit pension and postretirement plans that cover most of our employees. Assumptions related to future costs, return on investments, interest rates and other actuarial assumptions have a significant impact on our funding requirements related to these plans. Estimates and assumptions may change. In addition, the Pension Protection Act changed the minimum funding requirements for defined benefit pension plans. Therefore, our funding requirements and related contributions may change in the future. Also, the payout of a significant percentage of pension plan liabilities in a single year due to high numbers of retirements or employees leaving NSP-Minnesota could trigger settlement accounting and could require NSP-Minnesota to recognize incremental pension expense related to unrecognized plan losses in the year liabilities are paid. Changes in industry standards utilized in key assumptions (e.g., mortality tables) could have a significant impact on future liabilities and benefit costs.
Increasing costs associated with health care plans may adversely affect our results of operations.
Increasing levels of large individual health care claims and overall health care claims could have an adverse impact on our results of operations, financial condition or cash flows. Health care legislation could also significantly impact our benefit programs and costs.
Federal tax law may significantly impact our business.
NSP-Minnesota collects through regulated rates estimated federal, state and local tax payments. Changes to federal tax law may benefit or adversely affect our earnings and customer costs. Tax depreciable lives and the value of various tax credits or the timeliness of their utilization may impact the economics or selection of resources. There could be timing delays before regulated rates provide for realization of tax changes in revenues. In addition, certain IRS tax policies such as tax normalization may impact our ability to economically deliver certain types of resources relative to market prices.
Macroeconomic Risks
Economic conditions impact our business.
Our operations are affected by local, national and worldwide economic conditions, which correlates to customers/sales growth (decline). Economic conditions may be impacted by insufficient financial sector liquidity leading to potential increased unemployment, which may impact customers’ ability to pay their bills which could lead to additional bad debt expense.
Additionally, NSP-Minnesota faces competitive factors, which could have an adverse impact on our financial condition, results of operations and cash flows. Further, worldwide economic activity impacts the demand for basic commodities necessary for utility infrastructure, which may inhibit our ability to acquire sufficient supplies. We operate in a capital intensive industry and federal trade policy could significantly impact the cost of materials we use. There may be delays before these additional material costs can be recovered in rates.
Operations could be impacted by war, terrorism or other events.
Our generation plants, fuel storage facilities, transmission and distribution facilities and information and control systems may be targets of terrorist activities. Any disruption could impact operations or result in a decrease in revenues and additional costs to repair and insure our assets. These disruptions could have a material impact on our financial condition, results of operations or cash flows. The potential for terrorism has subjected our operations to increased risks and could have a material effect on our business. We have already incurred increased costs for security and capital expenditures in response to these risks. The insurance industry has also been affected by these events and the availability of insurance may decrease. In addition, insurance may have higher deductibles, higher premiums and more restrictive policy terms.
A disruption of the regional electric transmission grid, interstate natural gas pipeline infrastructure or other fuel sources, could negatively impact our business, our brand and reputation. Because our facilities are part of an interconnected system, we face the risk of possible loss of business due to a disruption caused by the actions of a neighboring utility.
We also face the risks of possible loss of business due to significant events such as severe storm, severe temperature extremes, wildfires, widespread pandemic, generator or transmission facility outage, pipeline rupture, railroad disruption, operator error, sudden and significant increase or decrease in wind generation or a disruption of work force within our operating systems (or on a neighboring system).
The recent coronavirus outbreak in China is an example of how major catastrophic events throughout the world may disrupt our business. While we are a domestic company, the Company participates in a global supply chain, which includes materials and components that are sourced from China. A prolonged disruption could result in the delay of equipment and materials that may impact our ability to reliably serve our customers.
Disruption due to events such as those noted above could result in a significant decrease in revenues and significant additional costs to repair assets, which could have a material impact on our results of operations, financial condition or cash flows.
NSP-Minnesota participates in biennial grid security and emergency response exercises (GridEx). These efforts, led by the NERC, test and further develop the coordination, threat sharing, and interaction between utilities and various government agencies relative to potential cyber and physical threats against the nation’s electric grid.
A cyber incident or security breach could have a material effect on our business.
We operate in an industry that requires the continued operation of sophisticated information technology, control systems and network infrastructure. In addition, we use our systems and infrastructure to create, collect, use, disclose, store, dispose of and otherwise process sensitive information, including company data, customer energy usage data, and personal information regarding customers, employees and their dependents, contractors and other individuals.
Our generation, transmission, distribution and fuel storage facilities, information technology systems and other infrastructure or physical assets, as well as information processed in our systems (e.g., information regarding our customers, employees, operations, infrastructure and assets) could be affected by cyber security incidents, including those caused by human error. Our industry has been the target of several attacks on operational systems and has seen an increased volume and sophistication of cyber security incidents from international activist organizations, Nation States and individuals. Cyber security incidents could harm our businesses by limiting our generating, transmitting and distributing capabilities, delaying our development and construction of new facilities or capital improvement projects to existing facilities, disrupting our customer operations or causing the release of customer information, all of which would likely receive state and federal regulatory scrutiny and could expose us to liability.
Our generation, transmission systems and natural gas pipelines are part of an interconnected system. Therefore, a disruption caused by the impact of a cyber security incident of the regional electric transmission grid, natural gas pipeline infrastructure or other fuel sources of our third-party service providers’ operations, could also negatively impact our business.
Our supply chain for procurement of digital equipment may expose software or hardware to these risks and could result in a breach or significant costs of remediation. We are unable to quantify the potential impact of cyber security threats or subsequent related actions. Cyber security incidents and regulatory action could result in a material decrease in revenues and may cause significant additional costs (e.g., penalties, third-party claims, repairs, insurance or compliance) and potentially disrupt our supply and markets for natural gas, oil and other fuels.
We maintain security measures to protect our information technology and control systems, network infrastructure and other assets. However, these assets and the information they process may be vulnerable to cyber security incidents, including asset failure or unauthorized access to assets or information. A failure or breach of our technology systems or those of our third-party service providers could disrupt critical business functions and may negatively impact our business, our brand, and our reputation. The cyber security threat is dynamic and evolves continually, and our efforts to prioritize network protection may not be effective given the constant changes to threat vulnerability.
Our operating results may fluctuate on a seasonal and quarterly basis and can be adversely affected by milder weather.
Our electric and natural gas utility businesses are seasonal and weather patterns can have a material impact on our operating performance. Demand for electricity is often greater in the summer and winter months associated with cooling and heating. Because natural gas is heavily used for residential and commercial heating, the demand depends heavily upon weather patterns. A significant amount of natural gas revenues are recognized in the first and fourth quarters related to the heating season. Accordingly, our operations have historically generated less revenues and income when weather conditions are milder in the winter and cooler in the summer. Unusually mild winters and summers could have an adverse effect on our financial condition, results of operations or cash flows.
Public Policy Risks
We may be subject to legislative and regulatory responses to climate change, with which compliance could be difficult and costly.
Legislative and regulatory responses related to climate change and new interpretations of existing laws create financial risk as our facilities may be subject to additional regulation at either the state or federal level in the future. Such regulations could impose substantial costs on our system.
We may be subject to climate change lawsuits. An adverse outcome could require substantial capital expenditures and possibly require payment of substantial penalties or damages. Defense costs associated with such litigation can also be significant and could affect results of operations, financial condition or cash flows if such costs are not recovered through regulated rates.
Although the United States has not adopted any international or federal GHG emission reduction targets, many states and localities may continue to pursue climate policies in the absence of federal mandates. The steps that NSP-Minnesota has taken to date to reduce GHG emissions, including energy efficiency measures, adding renewable generation or retiring or converting coal plants to natural gas, occurred under state-endorsed resource plans, renewable energy standards and other state policies. While those actions likely would have put NSP-Minnesota in a good position to meet federal or international standards being discussed, the lack of federal action does not adversely impact these state-endorsed actions and plans.
If our regulators do not allow us to recover all or a part of the cost of capital investment or the O&M costs incurred to comply with the mandates, it could have a material effect on our results of operations, financial condition or cash flows.
Increased risks of regulatory penalties could negatively impact our business.
The Energy Act increased civil penalty authority for violation of FERC statutes, rules and orders. The FERC can impose penalties of up to $1.3 million per violation per day, particularly as it relates to energy trading activities for both electricity and natural gas. In addition, NERC electric reliability standards and critical infrastructure protection requirements are mandatory and subject to potential financial penalties. Also, the PHMSA, Occupational Safety and Health Administration and other federal agencies have the authority to assess penalties. In the event of serious incidents, these agencies have become more active in pursuing penalties. Some states additionally have the authority to impose substantial penalties. If a serious reliability, cyber or safety incident did occur, it could have a material effect on our results of operations, financial condition or cash flows.
Environmental Risks
We are subject to environmental laws and regulations, with which compliance could be difficult and costly.
We are subject to environmental laws and regulations that affect many aspects of our operations, including air emissions, water quality, wastewater discharges and the generation, transport and disposal of solid wastes and hazardous substances. Laws and regulations require us to obtain permits, licenses, and approvals and to comply with a variety of environmental requirements.
Environmental laws and regulations can also require us to restrict or limit the output of facilities or the use of certain fuels, shift generation to lower-emitting facilities, install pollution control equipment, clean up spills and other contamination and correct environmental hazards. Environmental regulations may also lead to shutdown of existing facilities. Failure to meet requirements of environmental mandates may result in fines or penalties. We may be required to pay all or a portion of the cost to remediate (i.e., clean-up) sites where our past activities, or the activities of other parties, caused environmental contamination.
We are subject to mandates to provide customers with clean energy, renewable energy and energy conservation offerings. It could have a material effect on our results of operations, financial condition or cash flows if our regulators do not allow us to recover the cost of capital investment or the O&M costs incurred to comply with the requirements.
In addition, existing environmental laws or regulations may be revised, and new laws or regulations may be adopted. We may also incur additional unanticipated obligations or liabilities under existing environmental laws and regulations.
We are subject to physical and financial risks associated with climate change and other weather, natural disaster and resource depletion impacts.
Climate change can create physical and financial risk. Physical risks include changes in weather conditions and extreme weather events.
Our customers’ energy needs vary with weather. To the extent weather conditions are affected by climate change, customers’ energy use could increase or decrease. Increased energy use due to weather changes may require us to invest in generating assets, transmission and infrastructure. Decreased energy use due to weather changes may result in decreased revenues.
Climate change may impact a region’s economy, which could impact our sales and revenues. The price of energy has an impact on the economic health of our communities. The cost of additional regulatory requirements, such as regulation of GHG, could impact the availability of goods and prices charged by our suppliers which would normally be borne by consumers through higher prices for energy and purchased goods. To the extent financial markets view climate change and emissions of GHGs as a financial risk, this could negatively affect our ability to access capital markets or cause us to receive less than ideal terms and conditions.
Severe weather impacts our service territories, primarily when thunderstorms, flooding, tornadoes, wildfires and snow or ice storms occur. Extreme weather conditions in general require system backup and can contribute to increased system stress, including service interruptions. Extreme weather conditions creating high energy demand may raise electricity prices, increasing the cost of energy we provide to our customers.
To the extent the frequency of extreme weather events increases, this could increase our cost of providing service. Periods of extreme temperatures could impact our ability to meet demand. Changes in precipitation resulting in droughts or water shortages could adversely affect our operations. Drought conditions also contribute to the increase in wildfire risk from our electric generation facilities. While we carry liability insurance, given an extreme event, if NSP-Minnesota was found to be liable for wildfire damages, amounts that potentially exceed our coverage could negatively impact our results of operations, financial condition or cash flows. Drought or water depletion could adversely impact our ability to provide electricity to customers, cause early retirement of units and increase the price paid for energy. We may not recover all costs related to mitigating these physical and financial risks.
|
|
| ITEM 1B — UNRESOLVED STAFF COMMENTS |
None.
Virtually all of the utility plant property of NSP-Minnesota is subject to the lien of its first mortgage bond indenture.
|
| | | | | | | | |
NSP-Minnesota
Station, Location and Unit | | Fuel | | Installed | | MW (a) | |
| Steam: | | | | | | | |
| A.S. King-Bayport, MN, 1 Unit | | Coal | | 1968 | | 511 |
| |
| Sherco-Becker, MN | | | | | | | |
| Unit 1 | | Coal | | 1976 | | 680 |
| |
| Unit 2 | | Coal | | 1977 | | 682 |
| |
| Unit 3 | | Coal | | 1987 | | 517 |
| (b) |
| Monticello MN, 1 Unit | | Nuclear | | 1971 | | 617 |
| |
| PI-Welch, MN | | | | | | | |
| Unit 1 | | Nuclear | | 1973 | | 521 |
| |
| Unit 2 | | Nuclear | | 1974 | | 519 |
| |
| Various locations, 4 Units | | Wood/Refuse | | Various | | 36 |
| (c) |
| Combustion Turbine: | | | | | | | |
| Angus Anson-Sioux Falls, SD, 3 Units | | Natural Gas | | 1994 - 2005 | | 327 |
| |
| Black Dog-Burnsville, MN, 3 Units | | Natural Gas | | 1987 - 2018 | | 494 |
| |
| Blue Lake-Shakopee, MN, 6 Units | | Natural Gas | | 1974 - 2005 | | 453 |
| |
| High Bridge-St. Paul, MN, 3 Units | | Natural Gas | | 2008 | | 530 |
| |
| Inver Hills-Inver Grove Heights, MN, 6 Units | | Natural Gas | | 1972 | | 282 |
| |
| Riverside-Minneapolis, MN, 3 Units | | Natural Gas | | 2009 | | 454 |
| |
| Various locations, 7 Units | | Natural Gas | | Various | | 10 |
| |
| Wind: | | | | | | | |
| Border-Rolette County, ND, 75 Units | | Wind | | 2015 | | 148 |
| (d) |
| Courtenay Wind-Stutsman County, ND, 100 Units | | Wind | | 2016 | | 190 |
| (d) |
| Foxtail-Dickey County, ND, 75 Units | | Wind | | 2019 | | 150 |
| (d) |
| Grand Meadow-Mower County, MN, 67 Units | | Wind | | 2008 | | 99 |
| (d) |
| Lake Benton-Pipestone County, MN, 44 Units | | Wind | | 2019 | | 99 |
| (d) |
| Nobles-Nobles County, MN, 134 Units | | Wind | | 2010 | | 197 |
| (d) |
| Pleasant Valley-Mower County, MN, 100 Units | | Wind | | 2015 | | 196 |
| (d) |
| | | | | Total | | 7,712 |
| |
| |
(a) | Summer 2019 net dependable capacity. |
| |
(b) | Based on NSP-Minnesota’s ownership of 59%. |
| |
(c) | Refuse-derived fuel is made from municipal solid waste. |
| |
(d) | Values disclosed are the maximum generation levels for these wind units. Capacity is attainable only when wind conditions are sufficiently available (on-demand net dependable capacity is zero). |
Electric utility overhead and underground transmission and distribution lines (measured in conductor miles) at Dec. 31, 2019:
|
| | |
| Conductor Miles | |
| 500 KV | 2,917 |
|
| 345 KV | 13,133 |
|
| 230 KV | 2,203 |
|
| 161 KV | 673 |
|
| 115 KV | 8,045 |
|
| Less than 115 KV | 86,743 |
|
NSP-Minnesota had 346 electric utility transmission and distribution substations at Dec. 31, 2019.
Natural gas utility mains at Dec. 31, 2019:
|
| | |
| Miles | |
| Transmission | 86 |
|
| Distribution | 10,518 |
|
|
|
| ITEM 3 — LEGAL PROCEEDINGS |
NSP-Minnesota is involved in various litigation matters in the ordinary course of business. The assessment of whether a loss is probable or is a reasonable possibility, and whether the loss or a range of loss is estimable, often involves a series of complex judgments about future events. Management maintains accruals for losses probable of being incurred and subject to reasonable estimation. Management is sometimes unable to estimate an amount or range of a reasonably possible loss in certain situations, including but not limited to when (1) the damages sought are indeterminate, (2) the proceedings are in the early stages, or (3) the matters involve novel or unsettled legal theories. In such cases, there is considerable uncertainty regarding the timing or ultimate resolution of such matters, including a possible eventual loss. For current proceedings not specifically reported herein, management does not anticipate that the ultimate liabilities, if any, would have a material effect on NSP-Minnesota’s financial statements. Unless otherwise required by GAAP, legal fees are expensed as incurred.
See Note 10 to the consolidated financial statements, Item 1 and Item 7 for further information.
|
|
ITEM 4 — MINE SAFETY DISCLOSURES
|
None.
PART II
|
|
| ITEM 5 — MARKET FOR REGISTRANT’S COMMON EQUITY, RELATED STOCKHOLDER MATTERS AND ISSUER PURCHASES OF EQUITY SECURITIES |
NSP-Minnesota is a wholly owned subsidiary of Xcel Energy Inc. and there is no market for its common equity securities.
The dividends declared during 2019 and 2018 were as follows:
|
| | | | | | | | |
| (Millions of Dollars) | | 2019 | | 2018 |
| First quarter | | $ | 94.6 |
| | $ | 84.6 |
|
| Second quarter | | 95.3 |
| | 88.7 |
|
| Third quarter | | 94.0 |
| | 184.2 |
|
| Fourth quarter | | 194.3 |
| | 82.7 |
|
|
|
| ITEM 6 — SELECTED FINANCIAL DATA |
This is omitted per conditions set forth in general instructions I(1)(a) and (b) of Form 10-K for wholly owned subsidiaries (reduced disclosure format).
|
|
| ITEM 7 — MANAGEMENT’S DISCUSSION AND ANALYSIS OF FINANCIAL CONDITION AND RESULTS OF OPERATIONS |
Discussion of financial condition and liquidity for NSP-Minnesota is omitted per conditions set forth in general instructions I(1)(a) and (b) of Form 10-K for wholly owned subsidiaries. It is replaced with management’s narrative analysis and the results of operations for the current year as set forth in general instructions I(2)(a) of Form 10-K for wholly owned subsidiaries (reduced disclosure format).
Non-GAAP Financial Measures
The following discussion includes financial information prepared in accordance with GAAP, as well as certain non-GAAP financial measures such as, electric margin, natural gas margin, and ongoing earnings. Generally, a non-GAAP financial measure is a measure of a company’s financial performance, financial position or cash flows that excludes (or includes) amounts that are adjusted from measures calculated and presented in accordance with GAAP. NSP-Minnesota’s management uses non-GAAP measures for financial planning and analysis, for reporting of results to the Board of Directors, in determining performance-based compensation and communicating its earnings outlook to analysts and investors. Non-GAAP financial measures are intended to supplement investors’ understanding of our performance and should not be considered alternatives for financial measures presented in accordance with GAAP. These measures are discussed in more detail below and may not be comparable to other companies’ similarly titled non-GAAP financial measures.
Electric and Natural Gas Margins
Electric margin is presented as electric revenues less electric fuel and purchased power expenses. Natural gas margin is presented as natural gas revenues less the cost of natural gas sold and transported. Expenses incurred for electric fuel and purchased power and the cost of natural gas are generally recovered through various regulatory recovery mechanisms. As a result, changes in these expenses are generally offset in operating revenues.
Management believes electric and natural gas margins provide the most meaningful basis for evaluating our operations because they exclude the revenue impact of fluctuations in these expenses. These margins can be reconciled to operating income, a GAAP measure, by including other operating revenues, cost of sales-other, O&M expenses, conservation and DSM expenses, depreciation and amortization and taxes (other than income taxes).
Earnings Adjusted for Certain Items (Ongoing Earnings)
Ongoing earnings reflect adjustments to GAAP earnings (net income) for certain items.
We use these non-GAAP financial measures to evaluate and provide details of NSP-Minnesota’s core earnings and underlying performance. We believe these measurements are useful to investors to evaluate the actual and projected financial performance and contribution of NSP-Minnesota. For the years ended Dec. 31, 2019 and Dec. 31, 2018, there were no adjustments to GAAP earnings and therefore GAAP earnings equal ongoing earnings.
2019 Comparison with 2018
NSP-Minnesota’s net income was approximately $542.6 million for 2019, compared with approximately $492.3 million for 2018. The increase in earnings was driven by a higher electric margin resulting from regulatory rate outcomes and capital riders and lower O&M, partially offset by increased depreciation.
Electric Margin
Electric revenues and fuel and purchased power expenses are impacted by fluctuation in the price of natural gas, coal and uranium used in the generation of electricity. However, these price fluctuations have minimal impact on electric margin due to fuel recovery mechanisms that recover fuel expenses. In addition, electric customers receive a credit for PTCs that are generated in a particular period.
Electric Revenues and Margin:
|
| | | | | | | | |
| (Millions of Dollars) | | 2019 | | 2018 |
| Electric revenues | | $ | 4,506.6 |
| | $ | 4,508.0 |
|
| Electric fuel and purchased power | | (1,600.3 | ) | | (1,701.1 | ) |
| Electric margin | | $ | 2,906.3 |
| | $ | 2,806.9 |
|
Changes in Electric Margin:
|
| | | | |
| (Millions of Dollars) | | 2019 vs. 2018 |
| Regulatory rate outcomes (Minnesota, North and South Dakota) | | $ | 70.7 |
|
| Non-fuel riders | | 37.2 |
|
| Interchange agreement billings with NSP-Wisconsin | | 7.1 |
|
| Conservation program revenue (offset by expenses) | | 7.0 |
|
| Retail sales decline, net of MN decoupling and sales true-up (excluding weather impact) | | (21.1 | ) |
| Purchased capacity costs | | (12.3 | ) |
| Estimated impact of weather, net of Minnesota decoupling | | (10.8 | ) |
| Other (net) | | 21.6 |
|
| Total increase in electric margin | | $ | 99.4 |
|
Natural Gas Margin
Total natural gas expense varies with changing sales and the cost of natural gas. However, fluctuations in the cost of natural gas have minimal impact on natural gas margin due to natural gas cost recovery mechanisms.
Natural Gas Revenues and Margin:
|
| | | | | | | | |
| (Millions of Dollars) | | 2019 | | 2018 |
| Natural gas revenues | | $ | 571.3 |
| | $ | 583.1 |
|
| Cost of natural gas sold and transported | | (327.2 | ) | | (345.1 | ) |
| Natural gas margin | | $ | 244.1 |
| | $ | 238.0 |
|
Changes in Natural Gas Margin:
|
| | | | |
| (Millions of Dollars) | | 2019 vs. 2018 |
| Infrastructure rider | | $ | 2.9 |
|
| Estimated impact of weather | | 2.7 |
|
| Sales growth (excluding weather impact) | | 1.3 |
|
| Conservation program revenue (offset by expenses) | | (2.2 | ) |
| Other (net) | | 1.4 |
|
| Total increase in natural gas margin | | $ | 6.1 |
|
Non-Fuel Operating Expenses and Other Items
O&M Expenses — O&M expenses decreased $20.2 million, or 1.7%, for 2019. Decrease was driven by lower plant generation expense, primarily due to timing of planned maintenance and overhauls and reduced nuclear plant operation expenses. The decrease was partially offset by higher distribution storm expenses.
Depreciation and Amortization — Depreciation and amortization expense increased $49.7 million, or 6.7%, for 2019. Increase was primarily due to higher non-fuel rider amortization, increased capital investments including Monticello's dry fuel storage, Prairie Island and Sherco generator replacements and various software solutions. Additionally, Foxtail and Lake Benton wind farms were placed into service. The increase was partially offset by decreased depreciation due to the impact of life extensions approved by the MPUC at various electric plants.
Income Taxes — Income tax expense increased $20.2 million for 2019 compared with the same period in 2018. The ETR was 8.0% for 2019 compared with 5.2% for 2018. These increases were primarily due to 2019 higher pretax income.
2018 Comparison with 2017
A discussion of changes in NSP-Minnesota’s results of operations and liquidity and capital resources from the year ended Dec. 31, 2017 to Dec. 31, 2018 can be found in Part II, “Item 7, Management’s Discussion and Analysis of Financial Condition and Results of Operations” of our Annual Report on Form 10-K for the fiscal year 2018, which was filed with the SEC on Feb. 22, 2019. However, such discussion is not incorporated by reference into, and does not constitute a part of, this Annual Report on Form 10-K. |
|
| Public Utility Regulation |
The FERC has jurisdiction over rates for electric transmission service in interstate commerce and electricity sold at wholesale, hydro facility licensing, natural gas transportation, asset transactions and mergers, accounting practices and certain other activities of NSP-Minnesota, including enforcement of North American Electric Reliability Corporation mandatory electric reliability standards. State and local agencies have jurisdiction over many of NSP-Minnesota’s activities, including regulation of retail rates and environmental matters.
Xcel Energy, which includes NSP-Minnesota, attempts to mitigate the risk of regulatory penalties through formal training on prohibited practices and a compliance function that reviews interaction with the markets under FERC and Commodity Futures Trading Commission jurisdictions. Public campaigns are conducted to raise awareness of public safety issues of interacting with our electric systems. While programs to comply with regulatory requirements are in place, there is no guarantee compliance programs or other measures will be sufficient to ensure against violations. Decisions by these regulators can significantly impact NSP-Minnesota’s results of operations.
See Rate Matters within Note 10 to the consolidated financial statements for further information.
Summary of Regulatory Agencies and Areas of Jurisdiction |
| | |
| Regulatory Body | | Additional Information on Regulatory Authority |
MPUC (a) | | Retail rates, services, security issuances, property transfers, mergers, disposition of assets, affiliate transactions, and other aspects of electric and natural gas operations. Reviews and approves IRPs for meeting future energy needs. Certifies the need and siting for generating plants greater than 50 MW and transmission lines greater than 100 KV in Minnesota. Reviews and approves natural gas supply plans. Pipeline safety compliance. |
NDPSC (a) | | Retail rates, services and other aspects of electric and natural gas operations. Regulatory authority over generation and transmission facilities, along with the siting and routing of new generation and transmission facilities in North Dakota. Pipeline safety compliance. |
| SDPUC | | Retail rates, services and other aspects of electric operations. Regulatory authority over generation and transmission facilities, along with the siting and routing of new generation and transmission facilities in South Dakota. Pipeline safety compliance. |
| FERC | | Wholesale electric operations, hydroelectric licensing, accounting practices, wholesale sales for resale, transmission of electricity in interstate commerce, compliance with NERC electric reliability standards, asset transfers and mergers, and natural gas transactions in interstate commerce. |
| MISO | | NSP-Minnesota is a transmission owning member of the MISO RTO and operates within the MISO RTO and wholesale markets. NSP-Minnesota makes wholesale sales in other RTO markets at market-based rates. NSP-Minnesota and NSP-Wisconsin also make wholesale electric sales at market-based prices to customers outside of their balancing authority as jointly authorized by the FERC. |
| DOT | | Pipeline safety compliance. |
| Minnesota Office of Pipeline Safety | | Pipeline safety compliance. |
| |
(a) | Jurisdictional Cost Recovery Allocation — In December 2016, NSP-Minnesota filed a resource treatment framework with the NDPSC and MPUC to allow NSP-Minnesota’s operations in North Dakota and Minnesota to gradually become more independent of one another. The filing identified two options: a legal separation, creating a separate North Dakota operating company; or a pseudo-separation, which maintains the current corporate structure but directly assigns costs and benefits of each resource to the jurisdiction that supports it. Docket remains under consideration by the NDPSC. |
Recovery Mechanisms |
| | |
| Mechanism | | Additional Information |
CIP Rider (a) | | Recovers costs of conservation and demand-side management programs. |
| EIR | | Recovers costs of environmental improvement projects. |
| RDF | | Allocates money collected from customers to support research and development of emerging renewable energy projects and technologies. |
| RES | | Recovers cost of renewable generation in Minnesota. |
| RER | | Recovers the cost of renewable generation in North Dakota. |
| SEP | | Recovers costs related to various energy policies approved by the Minnesota legislature. |
| TCR | | Recovers costs for investments in electric transmission and distribution grid modernization. |
| Infrastructure Rider | | Recovers costs for investments in generation and incremental property taxes in South Dakota. |
FCA (b) | | Minnesota, North Dakota and South Dakota include a FCA for monthly billing adjustments to recover changes in prudently incurred costs of fuel related items and purchased energy. Capacity costs are recovered through base rates and are not recovered through the FCA. MISO costs are generally recovered through either the FCA or base rates. |
| PGA | | Provides for prospective monthly rate adjustments for costs of purchased natural gas, transportation and storage service. Includes a true-up process for difference between projected and actual costs. |
| GUIC Rider | | Recovers costs for transmission and distribution pipeline integrity management programs, including: funding for pipeline assessments, deferred costs for sewer separation and pipeline integrity management programs. |
| |
(a) | Minnesota state law requires NSP-Minnesota to invest 2% of its state electric revenues and 0.5% of its state gas revenues in CIP. These costs are recovered through an annual cost-recovery mechanism. |
| |
(b) | In 2017, the MPUC changed the FCA process in Minnesota, which will implemented in 2020. Under the new process, each month utilities would collect amounts equal to the baseline cost of energy set at the start of the plan year (base would be reset annually). Monthly variations to the baseline costs would be tracked and netted over a 12-month period. Utilities would issue refunds above the baseline costs and could seek recovery of any overage. |
Pending and Recently Concluded Regulatory Proceedings |
| | | | | | | | | | |
| Mechanism | | Utility Service | | Amount Requested (in millions) | | Filing Date | | Approval | | Additional Information |
| 2018 TCR | | Electric | | $98 | | November 2017 | | Received | | In November 2019, the MPUC issued an order setting an ROE of 9.06% and recovery of 2017-2018 expenses related to advanced grid investments. |
| 2020 TCR | | Electric | | $82 | | November 2019 | | Pending | | In November 2019, NSP-Minnesota filed the 2020 TCR Rider. The filing included an ROE of 9.06%. Timing of an MPUC ruling is uncertain. |
| 2019 GUIC | | Natural Gas | | $29 | | November 2018 | | Pending | | In November 2018, NSP-Minnesota filed the 2019 GUIC Rider with the MPUC. The filing included an ROE of 10.25%. Timing of an MPUC ruling is uncertain. |
| 2020 GUIC | | Natural Gas | | $21 | | November 2019 | | Pending | | In November 2019, NSP-Minnesota filed the 2020 GUIC Rider with the MPUC. The filing included an ROE of 9.04%. Timing of an MPUC ruling is uncertain. |
| 2018 RES | | Electric | | $23 | | November 2017 | | Received | | In November 2019, the MPUC approved an order setting an ROE of 9.06%. |
| 2020 RES | | Electric | | $102 | | November 2019 | | Pending | | In November 2019, NSP-Minnesota filed the 2020 RES Rider with the MPUC. The requested amount includes a true-up for the 2019 rider of $38 million and the 2020 requested amount of $64 million. The filing included an ROE of 9.06%. Timing of an MPUC ruling is uncertain. |
Minnesota Electric Rate Case and Alternative Petition — In November 2019, NSP-Minnesota filed a three-year electric rate case with the MPUC. The proposed electric rates reflect a three-year increase in revenues of approximately $201.4 million (6.5%) in 2020, with subsequent incremental increases of $146.4 million (4.8%) in 2021 and $118.3 million (3.9%) in 2022. The rate case is based on a requested ROE of 10.2%, a 52.5% equity ratio, an average electric rate base of $9.0 billion for 2020, $9.3 billion for 2021 and $9.8 billion for 2022. In addition, NSP-Minnesota requested interim rates, subject to refund, of $122.0 million to be implemented in January 2020 and an incremental $144.0 million to be implemented in January 2021.
NSP-Minnesota also filed a stay-out petition, in which NSP-Minnesota would withdraw its electric rate case and refrain from filing another rate case for one year if the MPUC were to approve an extension of true-up mechanisms for sales, capital and property taxes. NSP-Minnesota also requested that the MPUC delay any increase to the Nuclear Decommissioning Trust annual accrual until 2021.
In December 2019, the MPUC verbally approved the stay-out petition including extension of the sales, capital and property tax true-up mechanisms and the delay of any increase to the Nuclear Decommissioning Trust annual accrual until Jan. 1, 2021.
MEC Acquisition — In November 2018, NSP-Minnesota reached an agreement with Southern Power Company (a subsidiary of Southern Company) to purchase MEC, a 760 MW natural gas combined cycle facility, for approximately $650 million.
In September 2019, the MPUC denied NSP-Minnesota's request to purchase MEC as a rate base asset. In January 2020, the MPUC approved Xcel Energy’s plan to acquire MEC as a non-regulated investment and step into the terms of the existing PPAs with NSP-Minnesota. A newly formed non-regulated subsidiary of Xcel Energy completed the transaction to purchase MEC on Jan. 17, 2020.
Minnesota Resource Plan — In July 2019, NSP-Minnesota filed its Minnesota resource plan, which runs through 2034. The plan would result in an 80% carbon reduction by 2030 (from 2005) and puts NSP-Minnesota on a path to achieving its vision of being 100% carbon-free by 2050. The preferred plan includes the following:
| |
| • | Extends the life of the Monticello nuclear plant from 2030 to 2040; |
| |
| • | Continues to run the Prairie Island nuclear plant through current end of life (2033 and 2034); |
| |
| • | Includes the MEC acquisition and construction of the Sherco CC natural gas plant; |
| |
| • | Includes the early retirement of the King coal plant (511 MW) in 2028 and the Sherco 3 coal plant (517 MW) in 2030; |
| |
| • | Adds approximately 1,700 MW of firm peaking (CT, pumped hydro, battery storage, DR, etc.); |
| |
| • | Adds approximately 1,200 MW of wind replacement; and |
| |
| • | Adds approximately 4,000 MW of solar. |
Intervening parties will provide recommendations and comments on the resource plan. Following the MPUC’s denial of its request to purchase MEC, NSP-Minnesota will provide updates to remove its ownership of MEC from the preferred plan. The MPUC required NSP-Minnesota to update its filing to address issues related to its decision on MEC, including certain new modeling scenarios. An updated filing is required by April 1, 2020. The MPUC is anticipated to make a final decision on the resource plan in the first half of 2021.
Jeffers Wind and Community Wind North Repowering Acquisition — In October 2019, the MPUC approved NSP-Minnesota’s request to acquire the Jeffers and Community Wind North wind facilities in western Minnesota from Longroad Energy. The wind farms will have approximately 70 MW of capacity after being repowered. The repowering is expected to be completed by December 2020 and qualify for the full PTC. The $135 million asset acquisition is projected to provide customer savings of approximately $7 million over the life of the facilities.
NSP-Minnesota — Mower Wind Facility — In August 2019, NSP-Minnesota filed a petition with the MPUC to acquire the Mower wind facility from affiliates of NextEra Energy, Inc. for an undisclosed amount. The Mower facility is located in southeastern Minnesota and is currently contracted under a PPA with NSP-Minnesota through 2026. Mower is expected to continue to have approximately 99 MW of capacity following a planned repowering. The acquisition would occur after repowering, which is expected to be complete in 2020 and qualify for the full PTC. NSP-Minnesota will need approval from both the MPUC and FERC to complete the transaction. NSP-Minnesota filed reply comments addressing the DOC’s concerns with the transaction in February 2020.Timing of MPUC and FERC decisions are uncertain.
Purchased Power Arrangements and Transmission Service Provider
NSP-Minnesota expects to use power plants, power purchases, CIP/DSM options, new generation facilities and expansion of power plants to meet its system capacity requirements.
Purchased Power — NSP-Minnesota has contracts to purchase power from other utilities and IPPs. Long-term purchased power contracts for dispatchable resources typically require a capacity and an energy charge. NSP-Minnesota makes short-term purchases to meet system requirements, replace company owned generation, meet operating reserve obligations or obtain energy at a lower cost.
PPA Terminations and Amendments — In June 2018, NSP-Minnesota terminated the Benson and Laurentian PPAs, and purchased the Benson biomass facility. As a result, a $103 million regulatory asset was recognized for the costs of the Benson transaction. For Laurentian, a regulatory asset of $109 million was recognized for annual termination payments/obligations. Regulatory approvals provide for recovery of the Benson regulatory asset over 10 years and Laurentian termination payments as they occur (over six years). Termination of the PPAs is expected to save customers over $600 million throughout the next 10 years.
Purchased Transmission Services — NSP-Minnesota and NSP-Wisconsin have contracts with MISO and other regional transmission service providers to deliver power and energy to their customers.
Minnesota State ROFR Statute Complaint — In September 2017, LSP Transmission filed a complaint in the Minnesota District Court against the Minnesota Attorney General, MPUC and DOC. The complaint was in response to MISO assigning NSP-Minnesota and ITC Midwest, LLC to jointly own a new 345 KV transmission line from Mankato to Winnebago, Minnesota. The project was estimated to cost $108 million and projected to be in-service by the end of 2021. It was assigned to NSP-Minnesota and ITC Midwest as the incumbent utilities, consistent with a Minnesota state ROFR statute. The complaint challenged the constitutionality of the statute and is seeking declaratory judgment that the statute violates the Commerce Clause of the U.S. Constitution and should not be enforced. The Minnesota state agencies and NSP-Minnesota filed motions to dismiss. In June 2018, the Minnesota District Court granted the defendants’ motions to dismiss with prejudice. LSP Transmission filed an appeal in July 2018. In September 2019, the estimate was updated to approximately $140 million, due to various changes in build plans. In October 2019, oral arguments were held with the Eighth Circuit Court of Appeals. A decision is expected in the first or second quarter of 2020.
Nuclear Power Operations and Waste Disposal
Nuclear power plant operations produce gaseous, liquid and solid radioactive wastes, which are covered by federal regulation. High-level radioactive wastes primarily include used nuclear fuel. Low-level waste consists primarily of demineralizer resins, paper, protective clothing, rags, tools and equipment contaminated through use.
NRC Regulation — The NRC regulates nuclear operations. Costs of complying with NRC requirements can affect both operating expenses and capital investments of the plants. NSP-Minnesota has obtained recovery of these compliance costs and expects to recover future compliance costs.
Low-Level Waste Disposal — Low level waste disposal from Monticello and PI is disposed at the Clive facility located in Utah and the Waste Control Specialists facility in Texas. NSP-Minnesota has storage capacity available on-site at PI and Monticello which would allow both plants to continue to operate until the end of their current licensed lives if of-site low-level waste disposal facilities become unavailable.
High-Level Radioactive Waste Disposal — The federal government has responsibility to permanently dispose domestic spent nuclear fuel and other high-level radioactive wastes. The Nuclear Waste Policy Act requires the DOE to implement a program for nuclear high-level waste management. This includes the siting, licensing, construction and operation of a repository for spent nuclear fuel from civilian nuclear power reactors and other high-level radioactive wastes at a permanent federal storage or disposal facility. The federal government has been evaluating a nuclear geologic repository at Yucca Mountain, Nevada for many years. Currently, there are no definitive plans for a permanent federal storage facility at Yucca Mountain or any other site.
Nuclear Spent Fuel Storage — NSP-Minnesota has interim on-site storage for spent nuclear fuel at its Monticello and PI nuclear generating plants. Authorized storage capacity is sufficient to allow NSP-Minnesota to operate until the end of the operating licenses in 2030 for Monticello, 2033 for PI Unit 1, and 2034 for PI Unit 2. Authorizations for additional spent fuel storage capacity may be required at each site to support either continued operation or decommissioning if the federal government does not commence storage operations.
See Note 12 to the consolidated financial statements for further information.
Wholesale and Commodity Marketing Operations
NSP-Minnesota conducts various wholesale marketing operations, including the purchase and sale of electric capacity, energy, ancillary services and energy-related products. NSP-Minnesota uses physical and financial instruments to minimize commodity price and credit risk and hedge sales and purchases. NSP-Minnesota also engages in trading activity unrelated to hedging. Sharing of any margins is determined through state regulatory proceedings as well as the operation of the FERC approved JOA. NSP-Minnesota does not serve any wholesale requirements customers at cost-based regulated rates.
|
|
ITEM 7A — QUANTITATIVE AND QUALITATIVE DISCLOSURES ABOUT MARKET RISK |
Derivatives, Risk Management and Market Risk
NSP-Minnesota is exposed to a variety of market risks in the normal course of business. Market risk is the potential loss that may occur as a result of adverse changes in the market or fair value of a particular instrument or commodity. All financial and commodity-related instruments, including derivatives, are subject to market risk.
See Note 8 to the consolidated financial statements for further information.
NSP-Minnesota is exposed to the impact of adverse changes in price for energy and energy related products, which is partially mitigated by the use of commodity derivatives. In addition to ongoing monitoring and maintaining credit policies intended to minimize overall credit risk, management takes steps to mitigate changes in credit and concentration risks associated with its derivatives and other contracts, including parental guarantees and requests of collateral.
While NSP-Minnesota expects that the counterparties will perform under the contracts underlying its derivatives, the contracts expose NSP-Minnesota to some credit and non-performance risk. Distress in the financial markets may impact counterparty risk, the fair value of the securities in the nuclear decommissioning fund and pension fund and NSP-Minnesota’s ability to earn a return on short-term investments.
Commodity Price Risk — NSP-Minnesota is exposed to commodity price risk in its electric and natural gas operations. Commodity price risk is managed by entering into long- and short-term physical purchase and sales contracts for electric capacity, energy and energy-related products and fuels used in generation and distribution activities. Commodity price risk is also managed through the use of financial derivative instruments. NSP-Minnesota’s risk management policy allows it to manage commodity price risk within each rate-regulated operation per commission approved hedge plans.
Wholesale and Commodity Trading Risk — NSP-Minnesota conducts various wholesale and commodity trading activities, including the purchase and sale of electric capacity, energy, energy-related instruments and natural gas-related instruments, including derivatives. NSP-Minnesota’s risk management policy allows management to conduct these activities within guidelines and limitations as approved by its risk management committee.
At Dec. 31, 2019, fair values by source for net commodity trading contract assets were as follows:
|
| | | | | | | | | | | | | | | | | | | | |
| | Futures/ Forwards Maturity |
| (Millions of Dollars) | | Maturity
Less Than 1 Year | | Maturity 1 to 3 Years | | Maturity 4 to 5 Years | | Maturity
Greater Than 5 Years | | Total Futures/
Forwards Fair Value |
NSP-Minnesota (a) | | $ | (0.5 | ) | | $ | 1.9 |
| | $ | 1.5 |
| | $ | 3.1 |
| | $ | 6.0 |
|
NSP-Minnesota (b) | | 2.2 |
| | (2.3 | ) | | (2.1 | ) | | (10.3 | ) | | (12.5 | ) |
| | | $ | 1.7 |
| | $ | (0.4 | ) | | $ | (0.6 | ) | | $ | (7.2 | ) | | $ | (6.5 | ) |
| |
(a) | Prices actively quoted or based on actively quoted prices. |
| |
(b) | Prices based on models and other valuation methods. |
|
| | | | | | | | | | | | | | | | | | | | |
| | Options Maturity |
| (Millions of Dollars) | | Maturity
Less Than 1 Year | | Maturity 1 to 3 Years | | Maturity 4 to 5 Years | | Maturity
Greater Than 5 Years | | Total Futures/
Forwards Fair Value |
NSP-Minnesota (a) | | $ | 3.6 |
| | $ | 0.9 |
| | $ | — |
| | $ | — |
| | $ | 4.5 |
|
| |
(a) | Prices based on models and other valuation methods. |
Changes in the fair value of commodity trading contracts before the impacts of margin-sharing for the years ended Dec. 31, were as follows:
|
| | | | | | | | |
| (Millions of Dollars) | | 2019 | | 2018 |
| Fair value of commodity trading net contract assets outstanding at Jan. 1 | | $ | 16.0 |
| | $ | 15.7 |
|
| Contracts realized or settled during the period | | (10.8 | ) | | (2.0 | ) |
| Commodity trading contract additions and changes during the period | | (7.2 | ) | | 2.3 |
|
| Fair value of commodity trading net contract assets outstanding at Dec. 31 | | $ | (2.0 | ) | | $ | 16.0 |
|
At Dec. 31, 2019, a 10% increase in market prices for commodity trading contracts would increase pretax income by approximately $6.4 million, whereas a 10% decrease would decrease pretax income by approximately $6.3 million. At Dec. 31, 2018, a 10% increase in market prices for commodity trading contracts would increase pretax income by approximately $16.6 million, whereas a 10% decrease would decrease pretax income by approximately $16.5 million.
NSP-Minnesota’s wholesale and commodity trading operations measure the outstanding risk exposure to price changes on transactions, contracts and obligations using VaR. VaR expresses the potential change in fair value on the outstanding transactions, contracts and obligations over a particular period of time under normal market conditions.
VaRs for the NSP-Minnesota and PSCo commodity trading operations, calculated on a consolidated basis using a Monte Carlo simulation with a 95% confidence level and a one-day holding period:
|
| | | | | | | | | | | | | | | | | | | | |
| (Millions of Dollars) | | Year Ended Dec. 31 | | VaR Limit | | Average | | High | | Low |
| 2019 | | $ | 0.4 |
| | $ | 3.0 |
| | $ | 0.6 |
| | $ | 0.8 |
| | $ | 0.3 |
|
| 2018 | | 4.8 |
| | 6.0 |
| | 0.6 |
| | 5.6 |
| | 0.1 |
|
In November 2018, management temporarily increased the VaR limit to accommodate a 10-year transaction. NSP-Minnesota has been systematically hedging the transaction and the consolidated VaR returned below $3 million in January 2019.
Nuclear Fuel Supply — NSP-Minnesota has received all enriched nuclear material for 2019 and has contracted for approximately 51% of its 2020 enriched nuclear material requirements from sources that could be impacted by sanctions against entities doing business with Iran. Those sanctions may impact the supply of enriched nuclear material supplied from Russia. Long-term, through 2030, NSP-Minnesota is scheduled to take delivery of approximately 29% of its average enriched nuclear material requirements from these sources. Alternate potential sources provide the flexibility to manage NSP-Minnesota’s nuclear fuel supply. NSP-Minnesota periodically assesses if further actions are required to assure a secure supply of enriched nuclear material.
Interest Rate Risk — NSP-Minnesota is subject to interest rate risk. NSP-Minnesota’s risk management policy allows interest rate risk to be managed through the use of fixed rate debt, floating rate debt and interest rate derivatives such as swaps, caps, collars and put or call options.
A 100-basis-point change in the benchmark rate on NSP-Minnesota’s variable rate debt would impact annual pretax interest expense by approximately $0.3 million in 2019 and $1.5 million in 2018.
NSP-Minnesota maintains a nuclear decommissioning fund, as required by the NRC. The nuclear decommissioning fund is subject to interest rate risk and equity price risk. The fund is invested in a diversified portfolio of cash equivalents, debt securities, equity securities and other investments. These investments may be used only for the purpose of decommissioning NSP-Minnesota’s nuclear generating plants. Realized and unrealized gains on the decommissioning fund investments are deferred as an offset of NSP-Minnesota’s regulatory asset for nuclear decommissioning costs. Fluctuations in equity prices or interest rates affecting the nuclear decommissioning fund do not have a direct impact on earnings due to the application of regulatory accounting.
See Note 8 to the consolidated financial statements for further information.
Credit Risk — NSP-Minnesota is also exposed to credit risk. Credit risk relates to the risk of loss resulting from counterparties’ nonperformance on their contractual obligations. NSP-Minnesota maintains credit policies intended to minimize overall credit risk and actively monitor these policies to reflect changes and scope of operations.
At Dec. 31, 2019, a 10% increase in commodity prices would have resulted in an increase in credit exposure of $20.6 million, while a decrease in prices of 10% would have resulted in an increase in credit exposure of $8.1 million. At Dec. 31, 2018, a 10% increase in commodity prices would have resulted in an increase in credit exposure of $1.4 million, while a decrease in prices of 10% would have resulted in an increase in credit exposure of $12.5 million.
NSP-Minnesota conducts credit reviews for all counterparties. NSP-Minnesota employs credit risk controls, such as letters of credit, parental guarantees, master netting agreements and termination provisions. Credit exposure is monitored and, when necessary, the activity with a specific counterparty is limited until credit enhancement is provided. Distress in the financial markets could increase NSP-Minnesota’s credit risk.
Fair Value Measurements
NSP-Minnesota uses derivative contracts such as futures, forwards, interest rate swaps, options and FTRs to manage commodity price and interest rate risk. Derivative contracts, with the exception of those designated as normal purchase-normal sale contracts, are reported at fair value. NSP-Minnesota’s investments held in the nuclear decommissioning fund, rabbi trusts, pension and other postretirement funds are also subject to fair value accounting.
See Notes 8 and 9 to the consolidated financial statements for further information.
Commodity Derivatives — NSP-Minnesota continuously monitors the creditworthiness of the counterparties to its commodity derivative contracts and assesses each counterparty’s ability to perform on the transactions. Given the typically short duration of these contracts, the impact of discounting commodity derivative assets for counterparty credit risk was not material to the fair value of commodity derivative assets at Dec. 31, 2019.
Adjustments to fair value for credit risk of commodity trading instruments are recorded in electric revenues. Credit risk adjustments for other commodity derivative instruments are recorded as other comprehensive income or deferred as regulatory assets and liabilities. Classification as a regulatory asset or liability is based on commission approved regulatory recovery mechanisms. The impact of discounting commodity derivative liabilities for credit risk was immaterial at Dec. 31, 2019.
|
|
ITEM 8 — FINANCIAL STATEMENTS AND SUPPLEMENTARY DATA |
See Item 15-1 for an index of financial statements included herein.
See Note 14 to the consolidated financial statements for further information.
Management Report on Internal Control Over Financial Reporting
The management of NSP-Minnesota is responsible for establishing and maintaining adequate internal control over financial reporting. NSP-Minnesota’s internal control system was designed to provide reasonable assurance to Xcel Energy Inc.’s and NSP-Minnesota’s management and board of directors regarding the preparation and fair presentation of published financial statements.
All internal control systems, no matter how well designed, have inherent limitations. Therefore, even those systems determined to be effective can provide only reasonable assurance with respect to financial statement preparation and presentation.
NSP-Minnesota management assessed the effectiveness of NSP-Minnesota’s internal control over financial reporting as of Dec. 31, 2019. In making this assessment, it used the criteria set forth by the Committee of Sponsoring Organizations of the Treadway Commission (COSO) in Internal Control — Integrated Framework (2013). Based on our assessment, we believe that, as of Dec. 31, 2019, NSP-Minnesota’s internal control over financial reporting is effective at the reasonable assurance level based on those criteria.
|
| | |
| /s/ BEN FOWKE | | /s/ ROBERT C. FRENZEL |
| Ben Fowke | | Robert C. Frenzel |
| Chairman, Chief Executive Officer and Director | | Executive Vice President, Chief Financial Officer and Director |
| Feb. 21, 2020 | | Feb. 21, 2020 |
REPORT OF INDEPENDENT REGISTERED PUBLIC ACCOUNTING FIRM
To the stockholder and Board of Directors of Northern States Power Company, a Minnesota corporation
Opinion on the Financial Statements
We have audited the accompanying consolidated balance sheets of Northern States Power Company, a Minnesota corporation and subsidiaries (the "Company") as of December 31, 2019 and 2018, the related consolidated statements of income, comprehensive income, cash flows and common stockholder’s equity, for each of the three years in the period ended December 31, 2019, and the related notes and the schedule listed in the Index at Item 15 (collectively referred to as the "financial statements"). In our opinion, the financial statements present fairly, in all material respects, the financial position of the Company as of December 31, 2019 and 2018, and the results of its operations and its cash flows for each of the three years in the period ended December 31, 2019, in conformity with accounting principles generally accepted in the United States of America.
Basis for Opinion
These financial statements are the responsibility of the Company's management. Our responsibility is to express an opinion on the Company's financial statements based on our audits. We are a public accounting firm registered with the Public Company Accounting Oversight Board (United States) (PCAOB) and are required to be independent with respect to the Company in accordance with the U.S. federal securities laws and the applicable rules and regulations of the Securities and Exchange Commission and the PCAOB.
We conducted our audits in accordance with the standards of the PCAOB. Those standards require that we plan and perform the audit to obtain reasonable assurance about whether the financial statements are free of material misstatement, whether due to error or fraud. The Company is not required to have, nor were we engaged to perform, an audit of its internal control over financial reporting. As part of our audits, we are required to obtain an understanding of internal control over financial reporting but not for the purpose of expressing an opinion on the effectiveness of the Company’s internal control over financial reporting. Accordingly, we express no such opinion.
Our audits included performing procedures to assess the risks of material misstatement of the financial statements, whether due to error or fraud, and performing procedures that respond to those risks. Such procedures included examining, on a test basis, evidence regarding the amounts and disclosures in the financial statements. Our audits also included evaluating the accounting principles used and significant estimates made by management, as well as evaluating the overall presentation of the financial statements. We believe that our audits provide a reasonable basis for our opinion.
|
|
| /s/ DELOITTE & TOUCHE LLP |
| Minneapolis, Minnesota |
| February 21, 2020 |
| |
| We have served as the Company’s auditor since 2002. |
NSP-MINNESOTA AND SUBSIDIARIES CONSOLIDATED STATEMENTS OF INCOME (amounts in millions)
|
| | | | | | | | | | | |
| | Year Ended Dec. 31 |
| | 2019 | | 2018 | | 2017 |
| Operating revenues | | | | | |
| Electric, non-affiliates | $ | 4,049.2 |
| | $ | 4,034.3 |
| | $ | 4,051.5 |
|
| Electric, affiliates | 457.4 |
| | 473.7 |
| | 490.2 |
|
| Natural gas | 571.3 |
| | 583.1 |
| | 531.9 |
|
| Other | 33.9 |
| | 30.8 |
| | 28.4 |
|
| Total operating revenues | 5,111.8 |
| | 5,121.9 |
| | 5,102.0 |
|
| | | | | | |
| Operating expenses | | | | | |
| Electric fuel and purchased power | 1,600.3 |
| | 1,701.1 |
| | 1,626.9 |
|
| Cost of natural gas sold and transported | 327.2 |
| | 345.1 |
| | 301.8 |
|
| Cost of sales — other | 23.2 |
| | 19.7 |
| | 18.1 |
|
| Operating and maintenance expenses | 1,203.1 |
| | 1,223.3 |
| | 1,198.3 |
|
| Conservation program expenses | 119.7 |
| | 118.0 |
| | 120.1 |
|
| Depreciation and amortization | 791.3 |
| | 741.6 |
| | 700.6 |
|
| Taxes (other than income taxes) | 260.1 |
| | 256.6 |
| | 253.5 |
|
| Total operating expenses | 4,324.9 |
| | 4,405.4 |
| | 4,219.3 |
|
| | | | | | |
| Operating income | 786.9 |
| | 716.5 |
| | 882.7 |
|
| | | | | | |
| Other expense, net | (0.8 | ) | | (6.5 | ) | | (9.1 | ) |
| Allowance for funds used during construction — equity | 24.8 |
| | 23.8 |
| | 29.5 |
|
| | | | | | |
| Interest charges and financing costs | | | | | |
Interest charges — includes other financing costs of $7.4, $7.4 and $7.3 respectively | 233.3 |
| | 226.8 |
| | 228.4 |
|
| Allowance for funds used during construction — debt | (12.4 | ) | | (12.5 | ) | | (15.1 | ) |
| Total interest charges and financing costs | 220.9 |
| | 214.3 |
| | 213.3 |
|
| | | | | | |
| Income before income taxes | 590.0 |
| | 519.5 |
| | 689.8 |
|
| Income taxes | 47.4 |
| | 27.2 |
| | 199.7 |
|
| Net income | $ | 542.6 |
| | $ | 492.3 |
| | $ | 490.1 |
|
| | | | | | |
| See Notes to Consolidated Financial Statements |
NSP-MINNESOTA AND SUBSIDIARIES CONSOLIDATED STATEMENTS OF COMPREHENSIVE INCOME (amounts in millions)
|
| | | | | | | | | | | |
| | Year Ended Dec. 31 |
| | 2019 | | 2018 | | 2017 |
| Net income | $ | 542.6 |
| | $ | 492.3 |
| | $ | 490.1 |
|
| | | | | | |
| Other comprehensive income | | | | | |
| | | | | | |
| Defined pension and other postretirement benefits: | | | | | |
| Net pension and retiree medical (loss) gain arising during the period, net of tax of $(0.1), $0.3 and $(0.4), respectively | (0.4 | ) | | 0.6 |
| | (0.5 | ) |
| Reclassification of loss to net income, net of tax of $0.1, $0.1 and $0.1, respectively | 0.2 |
| | 0.2 |
| | 0.1 |
|
| Derivative instruments: | | | | | |
| Net fair value increase, net of tax of $0 | — |
| | — |
| | 0.1 |
|
| Reclassification of loss to net income, net of tax of $0.3, $0.3 and $0.6, respectively | 0.8 |
| | 0.7 |
| | 0.9 |
|
| Marketable securities: | | | | | |
| Net fair value decrease, net of tax of $0 | — |
| | (0.1 | ) | | — |
|
| | | | | | |
| Other comprehensive income | 0.6 |
| | 1.4 |
| | 0.6 |
|
| Comprehensive income | $ | 543.2 |
| | $ | 493.7 |
| | $ | 490.7 |
|
| | | | | | |
| See Notes to Consolidated Financial Statements |
NSP-MINNESOTA AND SUBSIDIARIES CONSOLIDATED STATEMENTS OF CASH FLOWS (amounts in millions)
|
| | | | | | | | | | | |
| | Year Ended Dec. 31 |
| | 2019 | | 2018 | | 2017 |
| Operating activities | | | | | |
| Net income | $ | 542.6 |
| | $ | 492.3 |
| | $ | 490.1 |
|
| Adjustments to reconcile net income to cash provided by operating activities: | | | | | |
| Depreciation and amortization | 798.3 |
| | 748.1 |
| | 707.0 |
|
| Nuclear fuel amortization | 119.0 |
| | 121.9 |
| | 114.4 |
|
| Deferred income taxes | (39.0 | ) | | 41.3 |
| | 193.2 |
|
| Allowance for equity funds used during construction | (24.8 | ) | | (23.8 | ) | | (29.5 | ) |
| Provision for bad debts | 13.0 |
| | 16.2 |
| | 15.7 |
|
| Net realized and unrealized hedging and derivative transactions | 18.5 |
| | 27.0 |
| | (2.8 | ) |
| Changes in operating assets and liabilities: | | | | | |
| Accounts receivable | 15.0 |
| | (42.7 | ) | | (29.8 | ) |
| Accrued unbilled revenues | 19.6 |
| | 7.4 |
| | (18.1 | ) |
| Inventories | (28.7 | ) | | (21.4 | ) | | 7.6 |
|
| Other current assets | (3.3 | ) | | 94.4 |
| | (25.3 | ) |
| Accounts payable | (12.5 | ) | | 10.5 |
| | 46.5 |
|
| Net regulatory assets and liabilities | (139.7 | ) | | 182.3 |
| | (36.4 | ) |
| Other current liabilities | (11.7 | ) | | (64.0 | ) | | (71.8 | ) |
| Pension and other employee benefit obligations | (48.5 | ) | | (75.8 | ) | | (56.7 | ) |
| Other, net | (48.9 | ) | | (31.5 | ) | | (31.3 | ) |
| Net cash provided by operating activities | 1,168.9 |
| | 1,482.2 |
| | 1,272.8 |
|
| | | | | | |
| Investing activities | | | | | |
| Utility capital/construction expenditures | (1,416.9 | ) | | (1,149.7 | ) | | (987.2 | ) |
| Purchases of investment securities | (995.1 | ) | | (852.9 | ) | | (1,690.5 | ) |
| Proceeds from the sale of investment securities | 975.0 |
| | 832.6 |
| | 1,668.9 |
|
| Investments in utility money pool arrangement | (219.0 | ) | | (805.0 | ) | | (122.0 | ) |
| Repayments from utility money pool arrangement | 219.0 |
| | 805.0 |
| | 122.0 |
|
| Other, net | (3.1 | ) | | (3.5 | ) | | (3.5 | ) |
| Net cash used in investing activities | (1,440.1 | ) | | (1,173.5 | ) | | (1,012.3 | ) |
| | | | | | |
| Financing activities | | | | | |
| (Repayments of) proceeds from short-term borrowings, net | (120.0 | ) | | 130.0 |
| | (65.0 | ) |
| Borrowings under utility money pool arrangement | 696.0 |
| | 479.0 |
| | 838.0 |
|
| Repayments under utility money pool arrangement | (696.0 | ) | | (564.0 | ) | | (753.0 | ) |
| Proceeds from issuance of long-term debt | 579.8 |
| | — |
| | 585.2 |
|
| Repayments of long-term debt, including reacquisition premiums | — |
| | — |
| | (507.9 | ) |
| Capital contributions from parent | 354.3 |
| | 108.8 |
| | 145.0 |
|
| Dividends paid to parent | (466.6 | ) | | (456.3 | ) | | (506.6 | ) |
| Net cash provided by (used in) financing activities | 347.5 |
| | (302.5 | ) | | (264.3 | ) |
| | | | | | |
| Net change in cash, cash equivalents and restricted cash | 76.3 |
| | 6.2 |
| | (3.8 | ) |
| Cash, cash equivalents and restricted cash at beginning of period | 50.0 |
| | 43.8 |
| | 47.6 |
|
| Cash, cash equivalents and restricted cash at end of period | $ | 126.3 |
| | $ | 50.0 |
| | $ | 43.8 |
|
| | | | | | |
| Supplemental disclosure of cash flow information: | | | | | |
| Cash paid for interest (net of amounts capitalized) | $ | (208.9 | ) | | $ | (207.4 | ) | | $ | (214.2 | ) |
| Cash (paid) received for income taxes, net | (104.5 | ) | | 89.0 |
| | (70.9 | ) |
| Supplemental disclosure of non-cash investing transactions: | | | | | �� |
| Accrued property, plant and equipment additions | $ | 94.5 |
| | $ | 92.5 |
| | $ | 93.1 |
|
| Inventory transfers to property, plant and equipment | 23.5 |
| | 60.8 |
| | 17.3 |
|
| Operating lease right-of-use assets | 628.5 |
| | — |
| | — |
|
| Allowances for equity funds used during construction | 24.8 |
| | 23.8 |
| | 29.5 |
|
| | | | | | |
| See Notes to Consolidated Financial Statements |
NSP-MINNESOTA AND SUBSIDIARIES CONSOLIDATED BALANCE SHEETS (amounts in millions, except share and per share data)
|
| | | | | | | |
| | Dec. 31 |
| | 2019 | | 2018 |
| Assets | | | |
| Current assets | | | |
| Cash and cash equivalents | $ | 126.3 |
| | $ | 50.0 |
|
| Accounts receivable, net | 359.8 |
| | 380.9 |
|
| Accounts receivable from affiliates | 43.8 |
| | 11.0 |
|
| Accrued unbilled revenues | 250.7 |
| | 270.3 |
|
| Inventories | 304.8 |
| | 299.4 |
|
| Regulatory assets | 320.1 |
| | 280.3 |
|
| Derivative instruments | 32.5 |
| | 25.8 |
|
| Prepayments and other | 31.5 |
| | 28.9 |
|
| Total current assets | 1,469.5 |
| | 1,346.6 |
|
| | | | |
| Property, plant and equipment | 14,244.0 |
| | 13,541.7 |
|
| | | | |
| Other assets | | | |
| Nuclear decommissioning fund and other investments | 2,495.2 |
| | 2,107.2 |
|
| Regulatory assets | 1,125.0 |
| | 1,454.1 |
|
| Derivative instruments | 9.2 |
| | 17.0 |
|
| Operating lease right-of-use assets | 563.8 |
| | — |
|
| Other | 9.7 |
| | 3.3 |
|
| Total other assets | 4,202.9 |
| | 3,581.6 |
|
| Total assets | $ | 19,916.4 |
| | $ | 18,469.9 |
|
| | | | |
| Liabilities and Equity | | | |
| Current liabilities | | | |
| Current portion of long-term debt | $ | 300.0 |
| | $ | — |
|
| Short-term debt | 30.0 |
| | 150.0 |
|
| Accounts payable | 388.0 |
| | 393.6 |
|
| Accounts payable to affiliates | 76.0 |
| | 109.7 |
|
| Regulatory liabilities | 141.0 |
| | 262.4 |
|
| Taxes accrued | 232.1 |
| | 230.1 |
|
| Accrued interest | 72.2 |
| | 67.2 |
|
| Dividends payable to parent | 94.3 |
| | 82.7 |
|
| Derivative instruments | 25.0 |
| | 16.5 |
|
| Customer deposits | 46.4 |
| | 53.7 |
|
| Operating lease liabilities | 79.9 |
| | — |
|
| Other | 154.9 |
| | 154.8 |
|
| Total current liabilities | 1,639.8 |
| | 1,520.7 |
|
| | | | |
| Deferred credits and other liabilities | | | |
| Deferred income taxes | 1,779.1 |
| | 1,682.4 |
|
| Deferred investment tax credits | 19.7 |
| | 21.1 |
|
| Regulatory liabilities | 1,937.1 |
| | 1,984.7 |
|
| Asset retirement obligations | 2,280.3 |
| | 2,177.9 |
|
| Derivative instruments | 110.2 |
| | 112.2 |
|
| Pension and employee benefit obligations | 235.9 |
| | 305.1 |
|
| Operating lease liabilities | 525.7 |
| | — |
|
| Other | 85.5 |
| | 155.5 |
|
| Total deferred credits and other liabilities | 6,973.5 |
| | 6,438.9 |
|
| | | | |
| Commitments and contingencies | | |
|
|
| Capitalization | | | |
| Long-term debt | 5,221.3 |
| | 4,937.2 |
|
Common stock — 5,000,000 shares authorized of $0.01 par value; 1,000,000 shares outstanding at Dec. 31, 2019 and 2018, respectively | — |
| | — |
|
| Additional paid in capital | 4,067.9 |
| | 3,624.2 |
|
| Retained earnings | 2,036.4 |
| | 1,972.0 |
|
| Accumulated other comprehensive loss | (22.5 | ) | | (23.1 | ) |
| Total common stockholder’s equity | 6,081.8 |
| | 5,573.1 |
|
| Total liabilities and equity | $ | 19,916.4 |
| | $ | 18,469.9 |
|
| | | | |
| See Notes to Consolidated Financial Statements |
NSP-MINNESOTA AND SUBSIDIARIES CONSOLIDATED STATEMENTS OF COMMON STOCKHOLDER’S EQUITY (amounts in millions, except share data) |
| | | | | | | | | | | | | | | | | | | | | | |
| | Common Stock | | | | Accumulated Other
Comprehensive
Income (Loss) | | Total Common
Stockholder’s
Equity |
| | Shares | | Par Value | | Additional Paid In Capital | | Retained Earnings | | |
| | | | | | | | | | | | |
| Balance at Dec. 31, 2016 | 1,000,000 |
| | $ | — |
| | $ | 3,435.1 |
| | $ | 1,941.3 |
| | $ | (20.8 | ) | | $ | 5,355.6 |
|
| | | | | | | | | | | | |
| Net income | | | | | | | 490.1 |
| | | | 490.1 |
|
| Other comprehensive income | | | | | | | | | 0.6 |
| | 0.6 |
|
| Dividends declared to parent | | | | | | | (515.8 | ) | | | | (515.8 | ) |
| Contribution of capital by parent | | | | | 145.1 |
| | | | | | 145.1 |
|
| Adoption of ASU No. 2018-02 | | | | | | | 4.3 |
| | (4.3 | ) | | — |
|
| Balance at Dec. 31, 2017 | 1,000,000 |
| | $ | — |
| | $ | 3,580.2 |
| | $ | 1,919.9 |
| | $ | (24.5 | ) | | $ | 5,475.6 |
|
| | | | | | | | | | | | |
| Net income | | | | | | | 492.3 |
| | | | 492.3 |
|
| Other comprehensive income | | | | | | | | | 1.4 |
| | 1.4 |
|
| Dividends declared to parent | | | | | | | (440.2 | ) | | | | (440.2 | ) |
| Contribution of capital by parent | | | | | 44.0 |
| | | | | | 44.0 |
|
| Balance at Dec. 31, 2018 | 1,000,000 |
| | $ | — |
| | $ | 3,624.2 |
| | $ | 1,972.0 |
| | $ | (23.1 | ) | | $ | 5,573.1 |
|
| | | | | | | | | | | | |
| Net income | | | | | | | 542.6 |
| | | | 542.6 |
|
| Other comprehensive income | | | | | | | | | 0.6 |
| | 0.6 |
|
| Dividends declared to parent | | | | | | | (478.2 | ) | | | | (478.2 | ) |
| Contribution of capital by parent | | | | | 443.7 |
| | | | | | 443.7 |
|
| Balance at Dec. 31, 2019 | 1,000,000 |
| | $ | — |
| | $ | 4,067.9 |
| | $ | 2,036.4 |
| | $ | (22.5 | ) | | $ | 6,081.8 |
|
| | | | | | | | | | | | |
| See Notes to Consolidated Financial Statements |
Notes to Consolidated Financial Statements
|
|
| 1. Summary of Significant Accounting Policies |
General — NSP-Minnesota is engaged in the regulated generation, purchase, transmission, distribution and sale of electricity and in the regulated purchase, transportation, distribution and sale of natural gas.
NSP-Minnesota’s consolidated financial statements include its wholly-owned subsidiaries. In the consolidation process, all intercompany transactions and balances are eliminated. NSP-Minnesota has investments in certain plants and transmission facilities jointly owned with nonaffiliated utilities.
NSP-Minnesota’s proportionate share of jointly owned facilities is recorded as property, plant and equipment on the consolidated balance sheets and NSP-Minnesota’s proportionate share of the operating costs associated with these facilities is included in its consolidated statements of income.
NSP-Minnesota’s consolidated financial statements are presented in accordance with GAAP. All of NSP-Minnesota’s underlying accounting records also conform to the FERC uniform system of accounts or to systems required by various state regulatory commissions. Certain amounts in the 2018 and 2017 consolidated financial statements or notes have been reclassified to conform to the 2019 presentation for comparative purposes; however, such reclassifications did not affect net income, total assets, liabilities, equity or cash flows.
NSP-Minnesota has evaluated events occurring after Dec. 31, 2019 up to the date of issuance of these consolidated financial statements. These statements contain all necessary adjustments and disclosures resulting from that evaluation.
Use of Estimates — NSP-Minnesota uses estimates based on the best information available in recording transactions and balances resulting from business operations. Estimates are used on items such as plant depreciable lives or potential disallowances, AROs, certain regulatory assets and liabilities, tax provisions, uncollectible amounts, environmental costs, unbilled revenues, jurisdictional fuel and energy cost allocations and actuarially determined benefit costs. Recorded estimates are revised when better information becomes available or actual amounts can be determined. Revisions can affect operating results.
Regulatory Accounting — NSP-Minnesota accounts for income and expense items in accordance with accounting guidance for regulated operations. Under this guidance:
| |
| • | Certain costs, which would otherwise be charged to expense or other comprehensive income, are deferred as regulatory assets based on the expected ability to recover the costs in future rates; and |
| |
| • | Certain credits, which would otherwise be reflected as income or other comprehensive income, are deferred as regulatory liabilities based on the expectation the amounts will be returned to customers in future rates, or because the amounts were collected in rates prior to the costs being incurred. |
Estimates of recovering deferred costs and returning deferred credits are based on specific ratemaking decisions or precedent for each item. Regulatory assets and liabilities are amortized consistent with the treatment in the rate setting process. If changes in the regulatory environment occur, NSP-Minnesota may no longer be eligible to apply this accounting treatment, and may be required to eliminate regulatory assets and liabilities from its balance sheet. Such changes could have a material effect on NSP-Minnesota’s results of operations, financial condition and cash flows.
See Note 4 for further information.
Income Taxes — NSP-Minnesota accounts for income taxes using the asset and liability method, which requires recognition of deferred tax assets and liabilities for the expected future tax consequences of events that have been included in the financial statements. NSP-Minnesota defers income taxes for all temporary differences between pretax financial and taxable income and between the book and tax bases of assets and liabilities. NSP-Minnesota uses rates that are scheduled to be in effect when the temporary differences are expected to reverse. The effect of a change in tax rates on deferred tax assets and liabilities is recognized in the period that includes the enactment date.
The effects of NSP-Minnesota’s tax rate changes are generally subject to a normalization method of accounting. Therefore, the revaluation of most of its net deferred taxes upon a tax rate reduction results in the establishment of a net regulatory liability, which will be refundable to utility customers over the remaining life of the related assets. A tax rate increase would result in the establishment of a similar regulatory asset.
Reversal of certain temporary differences are accounted for as current income tax expense due to the effects of past regulatory practices, when deferred taxes were not required to be recorded due to the use of flow through accounting for ratemaking purposes. Tax credits are recorded when earned unless there is a requirement to defer the benefit and amortize it over the book depreciable lives of the related property. The requirement to defer and amortize tax credits only applies to federal ITCs related to public utility property. Utility rate regulation also has resulted in the recognition of regulatory assets and liabilities related to income taxes. Deferred tax assets are reduced by a valuation allowance if it is more likely than not that some portion or all of the deferred tax asset will not be realized.
NSP-Minnesota follows the applicable accounting guidance to measure and disclose uncertain tax positions that it has taken or expects to take in its income tax returns. NSP-Minnesota recognizes a tax position in its consolidated financial statements when it is more likely than not that the position will be sustained upon examination based on the technical merits of the position. Recognition of changes in uncertain tax positions are reflected as a component of income tax expense.
NSP-Minnesota reports interest and penalties related to income taxes within the other income and interest charges in the consolidated statements of income.
Xcel Energy Inc. and its subsidiaries, including NSP-Minnesota, file consolidated federal income tax returns as well as consolidated or separate state income tax returns. Federal income taxes paid by Xcel Energy Inc. are allocated to its subsidiaries based on separate company computations. A similar allocation is made for state income taxes paid by Xcel Energy Inc. in connection with consolidated state filings. Xcel Energy Inc. also allocates its own income tax benefits to its direct subsidiaries.
See Note 7 for further information.
Property, Plant and Equipment and Depreciation in Regulated Operations — Property, plant and equipment is stated at original cost. The cost of plant includes direct labor and materials, contracted work, overhead costs and AFUDC. The cost of plant retired is charged to accumulated depreciation and amortization. Amounts recovered in rates for future removal costs are recorded as regulatory liabilities. Significant additions or improvements extending asset lives are capitalized, while repairs and maintenance costs are charged to expense as incurred.
Maintenance and replacement of items determined to be less than a unit of property are charged to operating expenses as incurred. Planned maintenance activities are charged to operating expense unless the cost represents the acquisition of an additional unit of property or the replacement of an existing unit of property.
Property, plant and equipment is tested for impairment when it is determined that the carrying value of the assets may not be recoverable. A loss is recognized in the current period if it becomes probable that part of a cost of a plant under construction or recently completed plant will be disallowed for recovery from customers and a reasonable estimate of the disallowance can be made.
For investments in property, plant and equipment that are abandoned and not expected to go into service, incurred costs and related deferred tax amounts are compared to the discounted estimated future rate recovery, and a loss is recognized, if necessary.
NSP-Minnesota records depreciation expense using the straight-line method over the plant’s useful life. Actuarial life studies are performed and submitted to the state and federal commissions for review. Upon acceptance by the various commissions, the resulting lives and net salvage rates are used to calculate depreciation. Depreciation expense, expressed as a percentage of average depreciable property, was approximately 3.7% for 2019, 3.6% for 2018 and 3.6% for 2017.
See Note 3 for further information.
AROs — NSP-Minnesota accounts for AROs under accounting guidance that requires a liability for the fair value of an ARO to be recognized in the period in which it is incurred if it can be reasonably estimated, with the offsetting associated asset retirement costs capitalized as a long-lived asset. The liability is generally increased over time by applying the effective interest method of accretion, and the capitalized costs are depreciated over the useful life of the long-lived asset.
Changes resulting from revisions to the timing or amount of expected asset retirement cash flows are recognized as an increase or a decrease in the ARO. NSP-Minnesota also recovers through rates certain future plant removal costs in addition to AROs. The accumulated removal costs for these obligations are reflected in the consolidated balance sheets as a regulatory liability.
See Note 10 for further information.
Nuclear Decommissioning — Nuclear decommissioning studies that estimate NSP-Minnesota’s costs of decommissioning its nuclear power plants are performed at least every three years and submitted to the state commissions for approval.
For ratemaking purposes, NSP-Minnesota recovers regulator-approved decommissioning costs of its nuclear power plants over each facility’s expected service life, typically based on the triennial decommissioning studies. The studies consider estimated future costs of decommissioning and the market value of investments in trust funds and recommend annual funding amounts. Amounts collected in rates are deposited in the trust funds. For financial reporting purposes, NSP-Minnesota accounts for nuclear decommissioning as an ARO.
Restricted funds for the payment of future decommissioning expenditures for NSP-Minnesota’s nuclear facilities are included in nuclear decommissioning fund and other assets on the consolidated balance sheets.
See Notes 8 and 10 for further information.
Benefit Plans and Other Postretirement Benefits — NSP-Minnesota maintains pension and postretirement benefit plans for eligible employees. Recognizing the cost of providing benefits and measuring the projected benefit obligation of these plans requires management to make various assumptions and estimates.
Certain unrecognized actuarial gains and losses and unrecognized prior service costs or credits are deferred as regulatory assets and liabilities, rather than recorded as other comprehensive income, based on regulatory recovery mechanisms.
See Note 9 for further information.
Environmental Costs — Environmental costs are recorded when it is probable NSP-Minnesota is liable for remediation costs and the liability can be reasonably estimated. Costs are deferred as a regulatory asset if it is probable that the costs will be recovered from customers in future rates. Otherwise, the costs are expensed. If an environmental expense is related to facilities currently in use, such as emission-control equipment, the cost is capitalized and depreciated over the life of the plant.
Estimated remediation costs are regularly adjusted as estimates are revised and remediation proceeds. If other participating potentially responsible parties exist and acknowledge their potential involvement with a site, costs are estimated and recorded only for NSP-Minnesota’s expected share of the cost.
Future costs of restoring sites are treated as a capitalized cost of plant retirement. The depreciation expense levels recoverable in rates include a provision for removal expenses. Removal costs recovered in rates before the related costs are incurred are classified as a regulatory liability.
See Note 10 for further information.
Revenue from Contracts with Customers — Performance obligations related to the sale of energy are satisfied as energy is delivered to customers. NSP-Minnesota recognizes revenue that corresponds to the price of the energy delivered to the customer. The measurement of energy sales to customers is generally based on the reading of their meters, which occurs on a systematic basis throughout the month. At the end of each month, amounts of energy delivered to customers since the date of the last meter reading are estimated, and the corresponding unbilled revenue is recognized.
NSP-Minnesota does not recognize a separate financing component of its collections from customers as contract terms are short-term in nature. NSP-Minnesota presents its revenues net of any excise or sales taxes or fees.
NSP-Minnesota recognizes sales to both native load and other end use customers on a gross basis in electric revenues and cost of sales. Revenues and charges for short term wholesale sales of excess energy transacted through RTOs are also recorded on a gross basis. Other RTO revenues and charges are recorded on a net basis in cost of sales.
NSP-Minnesota has various rate-adjustment mechanisms that provide for the recovery of natural gas, electric fuel and purchased energy costs. Cost-adjustment tariffs may increase or decrease the level of revenue collected from customers and are revised periodically for differences between the total amount collected under the clauses and the costs incurred.
When applicable, fuel cost over-recoveries (the excess of fuel revenue billed to customers over fuel costs incurred) are deferred as regulatory liabilities and under-recoveries (the excess of fuel costs incurred over fuel revenues billed to customers) are deferred as regulatory assets.
See Note 6 for further information.
Cash and Cash Equivalents — NSP-Minnesota considers investments in instruments with a remaining maturity of three months or less at the time of purchase to be cash equivalents.
Accounts Receivable and Allowance for Bad Debts — Accounts receivable are stated at the actual billed amount net of an allowance for bad debts. NSP-Minnesota establishes an allowance for uncollectible receivables based on a policy that reflects its expected exposure to the credit risk of customers.
As of Dec. 31, 2019 and 2018, the allowance for bad debts was $23.0 million and $23.5 million, respectively.
Inventory — Inventory is recorded at average cost and consisted of the following: |
| | | | | | | | |
| (Millions of Dollars) | | Dec. 31, 2019 | | Dec. 31, 2018 |
| Inventories | | | | |
| Materials and supplies | | $ | 175.6 |
| | $ | 176.3 |
|
| Fuel | | 103.2 |
| | 88.5 |
|
| Natural gas | | 26.0 |
| | 34.6 |
|
| Total inventories | | $ | 304.8 |
| | $ | 299.4 |
|
Fair Value Measurements — NSP-Minnesota presents cash equivalents, interest rate derivatives, commodity derivatives and nuclear decommissioning fund assets at estimated fair values in its consolidated financial statements. Cash equivalents are recorded at cost plus accrued interest; money market funds are measured using quoted NAVs.
For interest rate derivatives, quoted prices based primarily on observable market interest rate curves are used to establish fair value. For commodity derivatives, the most observable inputs available are generally used to determine the fair value of each contract. In the absence of a quoted price, NSP-Minnesota may use quoted prices for similar contracts or internally prepared valuation models to determine fair value.
For the pension and postretirement plan assets and nuclear decommissioning fund, published trading data and pricing models, generally using the most observable inputs available, are utilized to estimate fair value for each security.
See Notes 8 and 9 for further information.
Derivative Instruments — NSP-Minnesota uses derivative instruments in connection with its interest rate, utility commodity price, vehicle fuel price and commodity trading activities, including forward contracts, futures, swaps and options. Any derivative instruments not qualifying for the normal purchases and normal sales exception are recorded on the consolidated balance sheets at fair value as derivative instruments. Classification of changes in fair value for those derivative instruments is dependent on the designation of a qualifying hedging relationship.
Changes in fair value of derivative instruments not designated in a qualifying hedging relationship are reflected in current earnings or as a regulatory asset or liability. Classification as a regulatory asset or liability is based on commission approved regulatory recovery mechanisms.
Gains or losses on commodity trading transactions are recorded as a component of electric operating revenues; hedging transactions for vehicle fuel costs are recorded as a component of capital projects and O&M costs; and interest rate hedging transactions are recorded as a component of interest expense.
Normal Purchases and Normal Sales — NSP-Minnesota enters into contracts for purchases and sales of commodities for use in its operations. At inception, contracts are evaluated to determine whether a derivative exists and/or whether an instrument may be exempted from derivative accounting if designated as a normal purchase or normal sale.
See Note 8 for further information.
Commodity Trading Operations — All applicable gains and losses related to commodity trading activities are shown on a net basis in electric operating revenues in the consolidated statements of income.
Commodity trading activities are not associated with energy produced from NSP-Minnesota’s generation assets or energy and capacity purchased to serve native load. Commodity trading contracts are recorded at fair market value and commodity trading results include the impact of all margin-sharing mechanisms.
See Note 8 for further information.
Other Utility Items
AFUDC — AFUDC represents the cost of capital used to finance utility construction activity. AFUDC is computed by applying a composite financing rate to qualified CWIP. The amount of AFUDC capitalized as a utility construction cost is credited to other nonoperating income (for equity capital) and interest charges (for debt capital). AFUDC amounts capitalized are included in NSP-Minnesota’s rate base for establishing utility rates.
Alternative Revenue — Certain rate rider mechanisms (including decoupling and CIP programs) qualify as alternative revenue programs. These mechanisms arise from costs imposed upon the utility by action of a regulator or legislative body related to an environmental, public safety or other mandate. When certain criteria are met, including expected collection within 24 months, revenue is recognized equal to the revenue requirement, which may include incentives and return on rate base items.
Billing amounts are revised periodically for differences between total amount collected and revenue earned, which may increase or decrease the level of revenue collected from customers. Alternative revenues arising from these programs are presented on a gross basis and disclosed separately from revenue from contracts with customers.
See Note 6 for further information.
Conservation Programs — Costs incurred for CIP programs are deferred if it is probable future revenue will recover the incurred cost. Revenues recognized for incentive programs for the recovery of lost margins and/or conservation performance incentives are limited to amounts expected to be collected within 24 months from the year they are earned. Regulatory assets are recognized to reflect the amount of costs or earned incentives that have not yet been collected from customers.
Emission Allowances — Emission allowances are recorded at cost, including broker commission fees. The inventory accounting model is utilized for all emission allowances and sales of these allowances are included in electric revenues.
Nuclear Refueling Outage Costs — NSP-Minnesota uses a deferral and amortization method for nuclear refueling costs. This method amortizes costs over the period between refueling outages consistent with rate recovery.
RECs — Cost of RECs that are utilized for compliance is recorded as electric fuel and purchased power expense. Sales of RECs are recorded in electric revenues on a gross basis. The cost of these RECs and amounts credited to customers under margin-sharing mechanisms are recorded in electric fuel and purchased power expense.
Cost of RECs that are utilized to support commodity trading activities are recorded in a similar manner as the associated commodities and are shown on a net basis in electric operating revenues in the consolidated statements of income.
|
|
| 2. Accounting Pronouncements |
Recently Issued
Credit Losses — In 2016, the FASB issued Financial Instruments - Credit Losses, Topic 326 (ASC Topic 326), which changes how entities account for losses on receivables and certain other assets. The guidance requires use of a current expected credit loss model, which may result in earlier recognition of credit losses than under previous accounting standards. ASC Topic 326 is effective for interim and annual periods beginning on or after Dec. 15, 2019, and will be applied using a modified-retrospective approach, with a cumulative-effect adjustment to retained earnings as of Jan. 1, 2020. NSP-Minnesota expects the impact of adoption of the new standard to include first-time recognition of expected credit losses (i.e., bad debt expense) on unbilled revenues, with the initial allowance established at Jan. 1, 2020 charged to retained earnings. Recognition of this allowance and other impacts of adoption are expected to be immaterial to the consolidated financial statements.
Recently Adopted
Leases — In 2016, the FASB issued Leases, Topic 842 (ASC Topic 842), which provides new accounting and disclosure guidance for leasing activities, most significantly requiring that operating leases be recognized on the balance sheet. NSP-Minnesota adopted the guidance on Jan. 1, 2019 utilizing the package of transition practical expedients provided by the new standard, including carrying forward prior conclusions on whether agreements existing before the adoption date contain leases and whether existing leases are operating or finance leases; ASC Topic 842 refers to capital leases as finance leases.
Specifically for land easement contracts, NSP-Minnesota has elected the practical expedient provided by ASU No. 2018-01 Leases: Land Easement Practical Expedient for Transition to Topic 842, and as a result, only those easement contracts entered on or after Jan. 1, 2019 will be evaluated to determine if lease treatment is appropriate.
NSP-Minnesota also utilized the transition practical expedient offered by ASU No. 2018-11 Leases: Targeted Improvements to implement the standard on a prospective basis. As a result, reporting periods in the consolidated financial statements beginning Jan. 1, 2019 reflect the implementation of ASC Topic 842, while prior periods continue to be reported in accordance with Leases, Topic 840 (ASC Topic 840). Other than first-time recognition of operating leases on its consolidated balance sheet, the implementation of ASC Topic 842 did not have a significant impact on NSP-Minnesota’s consolidated financial statements. Adoption resulted in recognition of approximately $0.5 billion of operating lease ROU assets and current/noncurrent operating lease liabilities.
See Note 10 for leasing disclosures.
|
|
| 3. Property, Plant and Equipment |
Major classes of property, plant and equipment
|
| | | | | | | | |
| (Millions of Dollars) | | Dec. 31, 2019 | | Dec. 31, 2018 |
| Property, plant and equipment | | | | |
| Electric plant | | $ | 18,519.5 |
| | $ | 17,749.3 |
|
| Natural gas plant | | 1,562.9 |
| | 1,475.5 |
|
| Common and other property | | 886.7 |
| | 803.1 |
|
| CWIP | | 846.3 |
| | 615.1 |
|
| Total property, plant and equipment | | 21,815.4 |
| | 20,643.0 |
|
| Less accumulated depreciation | | (7,945.3 | ) | | (7,454.8 | ) |
| Nuclear fuel | | 2,909.8 |
| | 2,770.4 |
|
| Less accumulated amortization | | (2,535.9 | ) | | (2,416.9 | ) |
| Property, plant and equipment, net | | $ | 14,244.0 |
| | $ | 13,541.7 |
|
Joint Ownership of Generation and Transmission Facilities
Jointly owned assets as of Dec. 31, 2019:
|
| | | | | | | | | | | | | | | |
| (Millions of Dollars) | | Plant in Service | | Accumulated Depreciation | | CWIP | | Percent Owned |
| Electric generation: | | | | | | | | |
| Sherco Unit 3 | | $ | 603.0 |
| | $ | 426.3 |
| | $ | 3.8 |
| | 59 | % |
| Sherco common facilities | | 144.7 |
| | 102.7 |
| | 1.9 |
| | 80 |
|
| Sherco substation | | 4.8 |
| | 3.5 |
| | — |
| | 59 |
|
| Electric transmission: | | | | | | | | |
| CapX2020 | | 972.5 |
| | 91.6 |
| | 2.2 |
| | 51 |
|
| Grand Meadow | | 10.7 |
| | 2.6 |
| | — |
| | 50 |
|
| Total | | $ | 1,735.7 |
| | $ | 626.7 |
| | $ | 7.9 |
| | |
NSP-Minnesota’s share of operating expenses and construction expenditures is included in the applicable utility accounts. Respective owners are responsible for providing their own financing.
|
|
| 4. Regulatory Assets and Liabilities |
Regulatory assets and liabilities are created for amounts that regulators may allow to be collected or may require to be paid back to customers in future electric and natural gas rates. NSP-Minnesota would be required to recognize the write-off of regulatory assets and liabilities in net income or other comprehensive income if changes in the utility industry no longer allow for the application of regulatory accounting guidance under GAAP.
Components of regulatory assets:
|
| | | | | | | | | | | | | | | | | | | | | |
| (Millions of Dollars) | | See Note(s) | | Remaining Amortization Period | | Dec. 31, 2019 | | Dec. 31, 2018 |
| Regulatory Assets | | | | | | Current | | Noncurrent | | Current | | Noncurrent |
| Pension and retiree medical obligations | | 9 |
| | Various | | $ | 27.5 |
| | $ | 377.7 |
| | $ | 28.1 |
| | $ | 424.3 |
|
| Excess deferred taxes — TCJA | | 7 |
| | Various | | 10.4 |
| | 132.2 |
| | — |
| | 153.3 |
|
Net AROs (a) | | 1, 10 |
| | Plant lives | | — |
| | 117.9 |
| | — |
| | 323.4 |
|
| Recoverable deferred taxes on AFUDC recorded in plant | | | | Plant lives | | — |
| | 114.8 |
| | — |
| | 117.6 |
|
| Benson biomass PPA termination and asset purchase | | | | Ten years | | 9.4 |
| | 72.7 |
| | 9.8 |
| | 85.8 |
|
Contract valuation adjustments (b) | | 1, 8 |
| | Term of related contract | | 15.5 |
| | 62.1 |
| | 14.1 |
| | 76.0 |
|
| Laurentian biomass PPA termination | | | | Five years | | 19.2 |
| | 53.9 |
| | 18.1 |
| | 73.3 |
|
| PI extended power update | | | | Sixteen years | | 3.1 |
| | 52.6 |
| | 3.1 |
| | 55.8 |
|
| Purchased power contracts costs | | | | Term of related contract | | 2.7 |
| | 36.5 |
| | 2.8 |
| | 36.6 |
|
| Nuclear refueling outage costs | | 1 |
| | One to two years | | 43.3 |
| | 16.9 |
| | 36.3 |
| | 13.5 |
|
| Sales true-up and revenue decoupling | | | | One to two years | | 53.8 |
| | 16.3 |
| | 38.3 |
| | 6.7 |
|
| Losses on reacquired debt | | | | Term of related debt | | 1.7 |
| | 13.8 |
| | 2.1 |
| | 15.5 |
|
Conservation programs (c) | | 1 |
| | One to two years | | 18.1 |
| | 13.5 |
| | 34.5 |
| | 21.1 |
|
| Environmental remediation costs | | 1, 10 |
| | Pending future rate cases | | 1.3 |
| | 11.8 |
| | 1.3 |
| | 14.3 |
|
| Deferred purchased natural gas and electric energy costs | | | | One to three years | | 6.2 |
| | 5.7 |
| | 5.6 |
| | 12.6 |
|
| State commission adjustments | | | | Plant lives | | — |
| | 3.4 |
| | — |
| | 3.4 |
|
| Renewable resources and environmental initiatives | | | | One to two years | | 72.2 |
| | 0.6 |
| | 39.2 |
| | 0.4 |
|
| Gas pipeline inspection and remediation costs | | | | Less than one year | | 26.2 |
| | — |
| | 27.4 |
| | — |
|
| Other | | | | Various | | 9.5 |
| | 22.6 |
| | 19.6 |
| | 20.5 |
|
| Total regulatory assets | | | | | | $ | 320.1 |
| | $ | 1,125.0 |
| | $ | 280.3 |
| | $ | 1,454.1 |
|
| |
(a) | Includes amounts recorded for future recovery of AROs, less amounts recovered through nuclear decommissioning accruals and gains from decommissioning investments. |
| |
(b) | Includes the fair value of certain long-term PPAs used to meet energy capacity requirements and valuation adjustments on natural gas commodity purchases. |
| |
(c) | Includes costs for conservation programs, as well as incentives allowed in certain jurisdictions. |
Components of regulatory liabilities:
|
| | | | | | | | | | | | | | | | | | | | |
| (Millions of Dollars) | | See Note(s) | | Remaining Amortization Period | | Dec. 31, 2019 | | Dec. 31, 2018 |
| Regulatory Liabilities | | | | | | Current | | Noncurrent | | Current | | Noncurrent |
Deferred income tax adjustments and TCJA refunds (a) | | 7 | | Various | | $ | 12.8 |
| | $ | 1,388.9 |
| | $ | 153.7 |
| | $ | 1,465.1 |
|
| Plant removal costs | | 1, 10 | | Plant lives | | — |
| | 520.3 |
| | — |
| | 484.6 |
|
ITC deferrals (b) | | 1 | | Various | | — |
| | 8.3 |
| | — |
| | 8.9 |
|
| DOE Settlement | | | | Less than one year | | 27.0 |
| | — |
| | 13.0 |
| | — |
|
| Deferred electric energy costs | | | | Less than one year | | 24.2 |
| | — |
| | 22.8 |
| | — |
|
Contract valuation adjustments (c) | | 1, 8 | | Less than one year | | 7.8 |
| | — |
| | 10.4 |
| | — |
|
| Renewable resources and environmental initiatives | | | | Less than one year | | — |
| | — |
| | 8.8 |
| | — |
|
| Other | | | | Various | | 69.2 |
| | 19.6 |
| | 53.7 |
| | 26.1 |
|
Total regulatory liabilities (d) | | | | | | $ | 141.0 |
| | $ | 1,937.1 |
| | $ | 262.4 |
| | $ | 1,984.7 |
|
| |
(a) | Includes the revaluation of recoverable/regulated plant ADIT and revaluation impact of non-plant ADIT due to the TCJA. |
| |
(b) | Includes impact of lower federal tax rate due to the TCJA. |
| |
(c) | Includes the fair value of certain long-term PPAs used to meet energy capacity requirements and valuation adjustments on natural gas commodity purchases. |
| |
(d) | Revenue subject for refund of $23.8 million and $12.5 million for 2019 and 2018, respectively, is included in other current liabilities. |
At Dec. 31, 2019 and 2018, NSP-Minnesota’s regulatory assets not earning a return primarily included the unfunded portion of pension and retiree medical obligations, net AROs and Laurentian biomass PPA termination costs/obligations. In addition, regulatory assets included $235.1 million and $190.2 million at Dec. 31, 2019 and 2018, respectively, of past expenditures not earning a return. Amounts primarily related to sales true-up and revenue decoupling, purchased natural gas and electric energy costs, various renewable resources and certain environmental initiatives.
|
|
| 5. Borrowings and Other Financing Instruments |
Short-Term Borrowings
NSP-Minnesota meets its short-term liquidity requirements primarily through the issuance of commercial paper and borrowings under its credit facility and the money pool.
Money Pool — Xcel Energy Inc. and its utility subsidiaries have established a money pool arrangement that allows for short-term investments in and borrowings between the utility subsidiaries. Xcel Energy Inc. may make investments in the utility subsidiaries at market-based interest rates; however, the money pool arrangement does not allow the utility subsidiaries to make investments in Xcel Energy Inc.
Money pool borrowings for NSP-Minnesota were as follows:
|
| | | | | | | | | | | | | | | | |
| (Millions of Dollars, Except Interest Rates) | | Three Months Ended Dec. 31, 2019 | | Year Ended Dec. 31 |
| | | 2019 | | 2018 | | 2017 |
| Borrowing limit | | $ | 250 |
| | $ | 250 |
| | $ | 250 |
| | $ | 250 |
|
| Amount outstanding at period end | | — |
| | — |
| | — |
| | 85 |
|
| Average amount outstanding | | 34 |
| | 32 |
| | 17 |
| | 25 |
|
| Maximum amount outstanding | | 119 |
| | 250 |
| | 143 |
| | 142 |
|
| Weighted average interest rate, computed on a daily basis | | 1.67 | % | | 2.05 | % | | 1.96 | % | | 1.14 | % |
| Weighted average interest rate at period end | | N/A |
| | N/A |
| | N/A |
| | 1.18 |
|
Commercial Paper — Commercial paper outstanding for NSP-Minnesota was as follows:
|
| | | | | | | | | | | | | | | | |
| (Millions of Dollars, Except Interest Rates) | | Three Months Ended Dec. 31, 2019 | | Year Ended Dec. 31 |
| | | 2019 | | 2018 | | 2017 |
| Borrowing limit | | $ | 500 |
| | $ | 500 |
| | $ | 500 |
| | $ | 500 |
|
| Amount outstanding at period end | | 30 |
| | 30 |
| | 150 |
| | 20 |
|
| Average amount outstanding | | 2 |
| | 71 |
| | 38 |
| | 62 |
|
| Maximum amount outstanding | | 30 |
| | 317 |
| | 198 |
| | 237 |
|
| Weighted average interest rate, computed on a daily basis | | 2.05 | % | | 2.59 | % | | 2.08 | % | | 1.10 | % |
| Weighted average interest rate at end of period | | 2.05 |
| | 2.05 |
| | 2.97 |
| | 1.93 |
|
Letters of Credit — NSP-Minnesota uses letters of credit, typically with terms of one year, to provide financial guarantees for certain operating obligations. At Dec. 31, 2019 and 2018, there were $10 million and $37 million of letters of credit outstanding, respectively, under the credit facility. The contract amounts of these letters of credit approximate their fair value and are subject to fees.
Credit Facility — In order to use its commercial paper program to fulfill short-term funding needs, NSP-Minnesota must have a revolving credit facility in place at least equal to the amount of its commercial paper borrowing limit and cannot issue commercial paper in an amount exceeding available capacity under this credit facility. The line of credit provides short-term financing in the form of notes payable to banks, letters of credit and back-up support for commercial paper borrowings.
Amended Credit Agreement — In June 2019, NSP-Minnesota entered into an amended five-year credit agreement with a syndicate of banks. The amended credit agreements have substantially the same terms and conditions as the prior credit agreements with the exception of the maturity, which was extended from June 2021 to June 2024.
Features of NSP-Minnesota’s credit facility:
|
| | | | | | | | | | | |
Debt-to-Total Capitalization Ratio (a) | | Amount Facility May Be Increased (millions) | | Additional Periods for Which a One-Year Extension May Be Requested (b) |
| 2019 | | 2018 | | | | |
| 48 | % | | 48 | % | | $ | 100 |
| | 2 |
|
| |
(a) | The credit facility has a financial covenant requiring that the debt-to-total capitalization ratio be less than or equal to 65%. |
| |
(b) | All extension requests are subject to majority bank group approval. |
The credit facility has a cross-default provision that NSP-Minnesota will be in default on its borrowings under the facility if it or any of its subsidiaries whose total assets exceed 15% of NSP-Minnesota’s consolidated total assets, default on indebtedness in an aggregate principal amount exceeding $75 million.
If NSP-Minnesota does not comply with the covenant, an event of default may be declared, and if not remedied, any outstanding amounts due under the facility can be declared due by the lender. As of Dec. 31, 2019, NSP-Minnesota was in compliance with all financial covenants on its debt agreements.
NSP-Minnesota had the following committed credit facilities available as of Dec. 31, 2019 (in millions):
|
| | | | | | | | | | |
Credit Facility (a) | | Drawn (b) | | Available |
| $ | 500 |
| | $ | 40 |
| | $ | 460 |
|
| |
(a) | This credit facility matures in June 2024 . |
| |
(b) | Includes outstanding commercial paper and letters of credit. |
All credit facility bank borrowings, outstanding letters of credit and outstanding commercial paper reduce the available capacity under the credit facility. NSP-Minnesota had 0 direct advances on the facility outstanding at Dec. 31, 2019 and 2018.
Bilateral Credit Agreement
In March 2019, NSP-Minnesota entered into a one-year uncommitted bilateral credit agreement. This facility is limited in use to support letters of credit.
As of Dec. 31, 2019, NSP-Minnesota’s outstanding letters of credit under the Bilateral Credit Agreement were as follows (in millions):
|
| | | | | | | | | | |
| Limit | | Amount Used | | Available |
| $ | 75 |
| | $ | 22 |
| | $ | 53 |
|
Long-Term Borrowings and Other Financing Instruments
Generally, all property of NSP-Minnesota is subject to the lien of its first mortgage indenture. Debt premiums, discounts and expenses are amortized over the life of the related debt. The premiums, discounts and expenses for refinanced debt are deferred and amortized over the life of the new issuance.
Long term debt obligations for NSP-Minnesota as of Dec. 31 (millions of dollars):
|
| | | | | | | | | | | | | |
| Financing Instrument | | Interest Rate | | Maturity Date | | 2019 | | 2018 |
| First mortgage bonds | | 2.20 | % | | Aug. 15, 2020 | | $ | 300 |
| | $ | 300 |
|
| First mortgage bonds | | 2.15 | % | | Aug. 15, 2022 | | 300 |
| | 300 |
|
| First mortgage bonds | | 2.60 | % | | May 15, 2023 | | 400 |
| | 400 |
|
| First mortgage bonds | | 7.13 | % | | July 1, 2025 | | 250 |
| | 250 |
|
| First mortgage bonds | | 6.50 | % | | March 1, 2028 | | 150 |
| | 150 |
|
| First mortgage bonds | | 5.25 | % | | July 15, 2035 | | 250 |
| | 250 |
|
| First mortgage bonds | | 6.25 | % | | June 1, 2036 | | 400 |
| | 400 |
|
| First mortgage bonds | | 6.20 | % | | July 1, 2037 | | 350 |
| | 350 |
|
| First mortgage bonds | | 5.35 | % | | Nov. 1, 2039 | | 300 |
| | 300 |
|
| First mortgage bonds | | 4.85 | % | | Aug. 15, 2040 | | 250 |
| | 250 |
|
| First mortgage bonds | | 3.40 | % | | Aug. 15, 2042 | | 500 |
| | 500 |
|
| First mortgage bonds | | 4.13 | % | | May 15, 2044 | | 300 |
| | 300 |
|
| First mortgage bonds | | 4.00 | % | | Aug. 15, 2045 | | 300 |
| | 300 |
|
| First mortgage bonds | | 3.60 | % | | May 15, 2046 | | 350 |
| | 350 |
|
| First mortgage bonds | | 3.60 | % | | Sept. 15, 2047 | | 600 |
| | 600 |
|
First mortgage bonds (a) | | 2.90 | % | | March 1, 2050 | | 600 |
| | — |
|
| Unamortized discount | | | | | | (31 | ) | | (21 | ) |
| Unamortized debt issuance cost | | | | | | (48 | ) | | (42 | ) |
| Current maturities | | | | | | (300 | ) | | — |
|
| Total long-term debt | | | | | | $ | 5,221 |
| | $ | 4,937 |
|
Maturities of long-term debt are as follows:
|
| | | | |
| (Millions of Dollars) | | |
| 2020 | | $ | 300 |
|
| 2021 | | — |
|
| 2022 | | 300 |
|
| 2023 | | 400 |
|
| 2024 | | — |
|
Deferred Financing Costs — Deferred financing costs of approximately $48 million and $42 million, net of amortization, are presented as a deduction from the carrying amount of long-term debt at Dec. 31, 2019 and 2018, respectively.
Dividend Restrictions — NSP-Minnesota’s dividends are subject to the FERC’s jurisdiction, which prohibits the payment of dividends out of capital accounts. Dividend payments are solely to be paid from retained earnings.
NSP-Minnesota’s state regulatory commissions additionally impose dividend limitations, which are more restrictive than those imposed by the FERC.
Requirements and actuals as of Dec. 31, 2019:
|
| | | | | | | |
| Equity to Total Capitalization Ratio - Required Range | | Equity to Total Capitalization Ratio - Actual |
| Low | | High | | 2019 |
| 47.1 | % | | 57.5 | % | | 52.3 | % |
|
| | | | | | | | | | |
| Unrestricted Retained Earnings | | Total Capitalization | | Limit on Total Capitalization |
| $ | 1.1 | billion | | $ | 11.6 | billion | | $ | 12.7 | billion |
Revenue is classified by the type of goods/services rendered and market/customer type. NSP-Minnesota’s operating revenues consisted of the following:
|
| | | | | | | | | | | | | | | | |
| | | Year Ended Dec. 31, 2019 |
| (Millions of Dollars) | | Electric | | Natural Gas | | All Other | | Total |
| Major revenue types | | | | | | | | |
| Revenue from contracts with customers: |
| Residential | | $ | 1,280.2 |
| | $ | 303.0 |
| | $ | 30.1 |
| | $ | 1,613.3 |
|
| C&I | | 2,054.3 |
| | 228.6 |
| | — |
| | 2,282.9 |
|
| Other | | 32.9 |
| | — |
| | 3.8 |
| | 36.7 |
|
| Total retail | | 3,367.4 |
| | 531.6 |
| | 33.9 |
| | 3,932.9 |
|
| Wholesale | | 210.1 |
| | — |
| | — |
| | 210.1 |
|
| Transmission | | 216.0 |
| | — |
| | — |
| | 216.0 |
|
| Interchange | | 458.7 |
| | — |
| | — |
| | 458.7 |
|
| Other | | 11.9 |
| | 9.8 |
| | — |
| | 21.7 |
|
| Total revenue from contracts with customers | | 4,264.1 |
| | 541.4 |
| | 33.9 |
| | 4,839.4 |
|
| Alternative revenue and other | | 242.5 |
| | 29.9 |
| | — |
| | 272.4 |
|
| Total revenues | | $ | 4,506.6 |
| | $ | 571.3 |
| | $ | 33.9 |
| | $ | 5,111.8 |
|
|
| | | | | | | | | | | | | | | | |
| | | Year Ended Dec. 31, 2018 |
| (Millions of Dollars) | | Electric | | Natural Gas | | All Other | | Total |
| Major revenue types | | | | | | | | |
| Revenue from contracts with customers: |
| Residential | | $ | 1,308.4 |
| | $ | 308.8 |
| | $ | 27.2 |
| | $ | 1,644.4 |
|
| C&I | | 2,052.1 |
| | 239.3 |
| | 0.2 |
| | 2,291.6 |
|
| Other | | 36.5 |
| | — |
| | 3.4 |
| | 39.9 |
|
| Total retail | | 3,397.0 |
| | 548.1 |
| | 30.8 |
| | 3,975.9 |
|
| Wholesale | | 189.2 |
| | — |
| | — |
| | 189.2 |
|
| Transmission | | 238.1 |
| | — |
| | — |
| | 238.1 |
|
| Interchange | | 473.7 |
| | — |
| | — |
| | 473.7 |
|
| Other | | 28.3 |
| | 11.7 |
| | — |
| | 40.0 |
|
| Total revenue from contracts with customers | | 4,326.3 |
| | 559.8 |
| | 30.8 |
| | 4,916.9 |
|
| Alternative revenue and other | | 181.7 |
| | 23.3 |
| | — |
| | 205.0 |
|
| Total revenues | | $ | 4,508.0 |
| | $ | 583.1 |
| | $ | 30.8 |
| | $ | 5,121.9 |
|
Federal Tax Reform — In 2017, the TCJA was signed into law. The key provisions impacting Xcel Energy (which includes NSP-Minnesota), generally beginning in 2018, included:
| |
| • | Corporate federal tax rate reduction from 35% to 21%; |
| |
| • | Normalization of resulting plant-related excess deferred taxes; |
| |
| • | Elimination of the corporate alternative minimum tax; |
| |
| • | Continued interest expense deductibility and discontinued bonus depreciation for regulated public utilities; |
| |
| • | Limitations on certain executive compensation deductions; |
| |
| • | Limitations on certain deductions for NOLs arising after Dec. 31, 2017 (limited to 80% of taxable income); |
| |
| • | Repeal of the section 199 manufacturing deduction; and |
| |
| • | Reduced deductions for meals and entertainment as well as state and local lobbying. |
Xcel Energy estimated the effects of the TCJA, which have been reflected in the consolidated financial statements.
Reductions in deferred tax assets and liabilities due to a decrease in corporate federal tax rates typically result in a net tax benefit. However, the impacts are primarily recognized as regulatory liabilities refundable to utility customers as a result of IRS requirements and past regulatory treatment.
Estimated impacts of the new tax law for NSP-Minnesota in December 2017 included:
| |
| • | $1.1 billion ($1.5 billion grossed-up for tax) of reclassifications of plant-related excess deferred taxes to regulatory liabilities upon valuation at the new 21% federal rate. The regulatory liabilities will be amortized consistent with IRS normalization requirements, resulting in customer refunds over the average remaining life of the related property; |
| |
| • | $133 million and $56 million of reclassifications (grossed-up for tax) of excess deferred taxes for non-plant related deferred tax assets and liabilities, respectively, to regulatory assets and liabilities; and |
| |
| • | $19 million of total estimated income tax expense related to the federal tax reform implementation, and a $5 million reduction to net income related to the allocation of Xcel Energy Services Inc.’s tax rate change on its deferred taxes. |
Xcel Energy accounted for the state tax impacts of federal tax reform based on enacted state tax laws. Any future state tax law changes related to the TCJA will be accounted for in the periods state laws are enacted.
Federal Audit — NSP-Minnesota is a member of the Xcel Energy affiliated group that files a consolidated federal income tax return. Statute of limitations applicable to Xcel Energy’s consolidated federal income tax returns expire as follows:
|
| | |
| Tax Year(s) | | Expiration |
| 2009 - 2013 | | June 2020 |
| 2014 - 2016 | | September 2020 |
In 2015, the IRS commenced an examination of tax years 2012 and 2013. In 2017, the IRS concluded the audit of tax years 2012 and 2013 and proposed an adjustment that would impact Xcel Energy’s NOL and ETR. Xcel Energy filed a protest with the IRS. As of Dec. 31, 2019, the case has been forwarded to the Office of Appeals and Xcel Energy has recognized its best estimate of income tax expense that will result from a final resolution of this issue; however, the outcome and timing of a resolution is unknown.
In 2018, the IRS began an audit of tax years 2014 - 2016. As of Dec. 31, 2019 0 adjustments have been proposed.
State Audits — NSP-Minnesota is a member of the Xcel Energy affiliated group that files consolidated state income tax returns. As of Dec. 31, 2019, NSP-Minnesota’s earliest open tax year subject to examination by state taxing authorities under applicable statutes of limitations is 2009. There are currently no state income tax audits in progress.
Unrecognized Tax Benefits — Unrecognized tax benefit balance includes permanent tax positions, which if recognized would affect the annual ETR. In addition, the unrecognized tax benefit balance includes temporary tax positions for which the ultimate deductibility is highly certain, but for which there is uncertainty about the timing of such deductibility. A change in the period of deductibility would not affect the ETR but would accelerate the payment to the taxing authority to an earlier period.
Unrecognized tax benefits - permanent vs temporary: |
| | | | | | | | |
| (Millions of Dollars) | | Dec. 31, 2019 | | Dec. 31, 2018 |
| Unrecognized tax benefit — Permanent tax positions | | $ | 14.8 |
| | $ | 11.6 |
|
| Unrecognized tax benefit — Temporary tax positions | | 4.9 |
| | 5.3 |
|
| Total unrecognized tax benefit | | $ | 19.7 |
| | $ | 16.9 |
|
Changes in unrecognized tax benefits:
|
| | | | | | | | | | | | |
| (Millions of Dollars) | | 2019 | | 2018 | | 2017 |
| Balance at Jan. 1 | | $ | 16.9 |
| | $ | 18.1 |
| | $ | 60.8 |
|
| Additions based on tax positions related to the current year | | 2.6 |
| | 2.0 |
| | 2.7 |
|
| Reductions based on tax positions related to the current year | | (0.5 | ) | | (0.3 | ) | | (1.7 | ) |
| Additions for tax positions of prior years | | 0.7 |
| | 0.6 |
| | 5.7 |
|
| Reductions for tax positions of prior years | | — |
| | (1.1 | ) | | (49.4 | ) |
| Settlements with taxing authorities | | — |
| | (2.4 | ) | | — |
|
| Balance at Dec. 31 | | $ | 19.7 |
| | $ | 16.9 |
| | $ | 18.1 |
|
Unrecognized tax benefits were reduced by tax benefits associated with NOL and tax credit carryforwards: |
| | | | | | | | |
| (Millions of Dollars) | | Dec. 31, 2019 | | Dec. 31, 2018 |
| NOL and tax credit carryforwards | | $ | (16.3 | ) | | $ | (12.7 | ) |
Net deferred tax liability associated with the unrecognized tax benefit amounts and related NOLs and tax credits carryforwards were $11.3 million and $7.3 million at Dec. 31, 2019 and Dec. 31, 2018, respectively.
As the IRS Appeals and federal audit progress and state audits resume, it is reasonably possible that the amount of unrecognized tax benefit could decrease up to approximately $13.7 million in the next 12 months.
Payable for interest related to unrecognized tax benefits is partially offset by the interest benefit associated with NOL and tax credit carryforwards.
Interest payable related to unrecognized tax benefits:
|
| | | | | | | | | | | | |
| (Millions of Dollars) | | 2019 | | 2018 | | 2017 |
| Payable for interest related to unrecognized tax benefits at Jan. 1 | | $ | (1.2 | ) | | $ | (0.9 | ) | | $ | (2.0 | ) |
| Interest (expense) income related to unrecognized tax benefits | | (0.4 | ) | | (0.3 | ) | | 1.1 |
|
| Payable for interest related to unrecognized tax benefits at Dec. 31 | | $ | (1.6 | ) | | $ | (1.2 | ) | | $ | (0.9 | ) |
No amounts were accrued for penalties related to unrecognized tax benefits as of Dec. 31, 2019, 2018, or 2017.
Other Income Tax Matters — NOL amounts represent the tax loss that is carried forward and tax credits represent the deferred tax asset. NOL and tax credit carryforwards as of Dec. 31 were as follows:
|
| | | | | | | | |
| (Millions of Dollars) | | 2019 | | 2018 |
| Federal tax credit carryforwards | | $ | 449.0 |
| | $ | 379.4 |
|
| State NOL carryforwards | | 133.0 |
| | 221.2 |
|
| Valuation allowances for state NOL carryforwards | | (0.5 | ) | | (0.8 | ) |
State tax credit carryforwards, net of federal detriment (a) | | 77.5 |
| | 87.9 |
|
Valuation allowances for state credit carryforwards, net of federal benefit (b) | | (65.9 | ) | | (78.5 | ) |
| |
(a) | State tax credit carryforwards are net of federal detriment of $20.6 million and $23.4 million as of Dec. 31, 2019 and 2018, respectively. |
| |
(b) | Valuation allowances for state tax credit carryforwards were net of federal benefit of $17.5 million and $20.9 million as of Dec. 31, 2019 and 2018, respectively. |
Federal carryforward periods expire between 2023 and 2039 and state carryforward periods expire between 2020 and 2035.
Total income tax expense from operations differs from the amount computed by applying the statutory federal income tax rate to income before income tax expense.
Effective income tax rate for years ended Dec. 31:
|
| | | | | | | | |
| | 2019 | | 2018 (a) | | 2017 (a) |
| Federal statutory rate | 21.0 | % | | 21.0 | % | | 35.0 | % |
| State income tax on pretax income, net of federal tax effect | 7.1 |
| | 7.1 |
| | 5.8 |
|
| Increases (decreases) in tax from: |
|
| |
|
| |
|
|
| Wind PTCs | (11.8 | ) | | (13.6 | ) | | (11.4 | ) |
Plant regulatory differences (b) | (7.4 | ) | | (8.8 | ) | | (0.3 | ) |
| Other tax credits, net of NOL & tax credit allowances | (1.5 | ) | | (1.1 | ) | | (1.0 | ) |
| Change in unrecognized tax benefits | 0.5 |
| | 0.1 |
| | (1.6 | ) |
| Tax reform | — |
| | — |
| | 2.7 |
|
| Other, net | 0.1 |
| | 0.5 |
| | (0.2 | ) |
| Effective income tax rate | 8.0 | % | | 5.2 | % | | 29.0 | % |
| |
(a) | Prior periods have been reclassified to conform to current year presentation. |
| |
(b) | Regulatory differences for income tax primarily relate to the credit of excess deferred taxes to customers through the average rate assumption method. Income tax benefits associated with the credit of excess deferred credits are offset by corresponding revenue reductions. |
Components of income tax expense for years ended Dec. 31:
|
| | | | | | | | | | | | |
| (Millions of Dollars) | | 2019 | | 2018 | | 2017 |
| Current federal tax expense (benefit) | | $ | 80.7 |
| | $ | (16.8 | ) | | $ | 29.6 |
|
| Current state tax expense | | 7.9 |
| | 5.2 |
| | 14.7 |
|
| Current change in unrecognized tax benefit | | (0.8 | ) | | (1.1 | ) | | (36.2 | ) |
| Deferred federal tax (benefit) expense | | (86.2 | ) | | (2.4 | ) | | 121.6 |
|
| Deferred state tax expense | | 43.2 |
| | 42.1 |
| | 46.7 |
|
| Deferred change in unrecognized tax expense | | 4.0 |
| | 1.6 |
| | 24.9 |
|
| Deferred ITCs | | (1.4 | ) | | (1.4 | ) | | (1.6 | ) |
| Total income tax expense | | $ | 47.4 |
| | $ | 27.2 |
| | $ | 199.7 |
|
Components of deferred income tax expense as of Dec. 31:
|
| | | | | | | | | | | | |
| (Millions of Dollars) | | 2019 | | 2018 | | 2017 |
| Deferred tax expense (benefit) excluding items below | | $ | 96.7 |
| | $ | 70.1 |
| | (1,176.4 | ) |
| Amortization and adjustments to deferred income taxes on income tax regulatory assets and liabilities | | (135.4 | ) | | (28.2 | ) | | 1,369.9 |
|
| Tax expense allocated to other comprehensive income, net of adoption of ASU No. 2018-02, and other | | (0.3 | ) | | (0.6 | ) | | (0.3 | ) |
| Deferred tax expense | | $ | (39.0 | ) | | $ | 41.3 |
| | $ | 193.2 |
|
Components of the net deferred tax liability as of Dec. 31:
|
| | | | | | | | |
| (Millions of Dollars) | | 2019 | | 2018 (a) |
| Deferred tax liabilities: | | | | |
| Differences between book and tax bases of property | | $ | 2,361.0 |
| | $ | 2,257.6 |
|
| Regulatory assets | | 257.4 |
| | 260.8 |
|
| Operating lease assets | | 169.6 |
| | — |
|
| Pension expense | | 68.4 |
| | 64.7 |
|
| Other | | 10.2 |
| | 9.1 |
|
| Total deferred tax liabilities | | $ | 2,866.6 |
| | $ | 2,592.2 |
|
| | | | | |
| Deferred tax assets: | | | | |
| Tax credit carryforward | | $ | 526.5 |
| | $ | 467.3 |
|
| Regulatory Liabilities | | 364.9 |
| | 380.5 |
|
| Operating lease liabilities | | 169.6 |
| | — |
|
| NOL and tax credit valuation allowances | | (66.0 | ) | | (78.6 | ) |
| Other employee benefits | | 37.5 |
| | 38.6 |
|
| Rate refund | | 11.0 |
| | 49.7 |
|
| NOL carryforward | | 10.4 |
| | 17.9 |
|
| Deferred investment tax credits | | 5.9 |
| | 6.4 |
|
| Other | | 27.7 |
| | 28.0 |
|
| Total deferred tax assets | | $ | 1,087.5 |
| | $ | 909.8 |
|
| Net deferred tax liability | | $ | 1,779.1 |
| | $ | 1,682.4 |
|
| |
(a) | Prior periods have been reclassified to conform to current year presentation. |
|
|
| 8. Fair Value of Financial Assets and Liabilities |
Fair Value Measurements
The accounting guidance for fair value measurements and disclosures provides a single definition of fair value and requires disclosures about assets and liabilities measured at fair value. A hierarchical framework for disclosing the observability of the inputs utilized in measuring assets and liabilities at fair value is established by this guidance.
| |
| • | Level 1 — Quoted prices are available in active markets for identical assets or liabilities as of the reporting date. The types of assets and liabilities included in Level 1 are highly liquid and actively traded instruments with quoted prices; |
| |
| • | Level 2 — Pricing inputs are other than quoted prices in active markets, but are either directly or indirectly observable as of the reporting date. The types of assets and liabilities included in Level 2 are typically either comparable to actively traded securities or contracts, or priced with models using highly observable inputs; and |
| |
| • | Level 3 — Significant inputs to pricing have little or no observability as of the reporting date. The types of assets and liabilities included in Level 3 are those valued with models requiring significant management judgment or estimation. |
Specific valuation methods include:
Cash equivalents — The fair values of cash equivalents are generally based on cost plus accrued interest; money market funds are measured using quoted NAV.
Investments in equity securities and other funds — Equity securities are valued using quoted prices in active markets. The fair values for commingled funds are measured using NAVs. The investments in commingled funds may be redeemed for NAV with proper notice. Private equity commingled fund investments require approval of the fund for any unscheduled redemption, and such redemptions may be approved or denied by the fund at its sole discretion.
Unscheduled distributions from real estate commingled funds investments may be redeemed with proper notice, however, may be delayed or discounted as a result of fund illiquidity.
Investments in debt securities — Fair values for debt securities are determined by a third-party pricing service using recent trades and observable spreads from benchmark interest rates for similar securities.
Interest rate derivatives — The fair values of interest rate derivatives are based on broker quotes that utilize current market interest rate forecasts.
Commodity derivatives — The methods used to measure the fair value of commodity derivative forwards and options utilize forward prices and volatilities, as well as pricing adjustments for specific delivery locations, and are generally assigned a Level 2 classification. When contractual settlements relate to inactive delivery locations or extend to periods beyond those readily observable on active exchanges or quoted by brokers, the significance of the use of less observable forecasts of forward prices and volatilities on a valuation is evaluated, and may result in Level 3 classification.
Electric commodity derivatives held by NSP-Minnesota include transmission congestion instruments, generally referred to as FTRs. FTRs purchased from a RTO are financial instruments that entitle or obligate the holder to monthly revenues or charges based on transmission congestion across a given transmission path. The value of an FTR is derived from, and designed to offset, the cost of transmission congestion. In addition to overall transmission load, congestion is also influenced by the operating schedules of power plants and the consumption of electricity pertinent to a given transmission path. Unplanned plant outages, scheduled plant maintenance, changes in the relative costs of fuels used in generation, weather and overall changes in demand for electricity can each impact the operating schedules of the power plants on the transmission grid and the value of an FTR.
If forecasted costs of electric transmission congestion increase or decrease for a given FTR path, the value of that particular FTR instrument will likewise increase or decrease. Given the limited observability of important inputs to the value of FTRs between auction processes, including expected plant operating schedules and retail and wholesale demand, fair value measurements for FTRs have been assigned a Level 3.
Non-trading monthly FTR settlements are included in fuel and purchased energy cost recovery mechanisms, and therefore changes in the fair value of the yet to be settled portions of most FTRs are deferred as a regulatory asset or liability. Given this regulatory treatment and the limited magnitude of NSP-Minnesota’s FTRs relative to its electric utility operations, the numerous unobservable quantitative inputs pertinent to the value of FTRs are immaterial to the consolidated financial statements of NSP-Minnesota.
Non-Derivative Fair Value Measurements
Nuclear Decommissioning Fund — The NRC requires NSP-Minnesota to maintain a portfolio of investments to fund the costs of decommissioning its nuclear generating plants. Assets of the nuclear decommissioning fund are legally restricted for the purpose of decommissioning these facilities. The fund contains cash equivalents, debt securities, equity securities and other investments. NSP-Minnesota uses the MPUC approved asset allocation for the escrow and investment targets by asset class for both the escrow and qualified trust.
NSP-Minnesota recognizes the costs of funding the decommissioning over the lives of the nuclear plants, assuming rate recovery of all costs. Realized and unrealized gains on fund investments over the life of the fund are deferred as an offset of NSP-Minnesota’s regulatory asset for nuclear decommissioning costs. Consequently, any realized and unrealized gains and losses on securities in the nuclear decommissioning fund are deferred as a component of the regulatory asset.
Unrealized gains for the nuclear decommissioning fund were $705.5 million and $450.1 million as of Dec. 31, 2019 and 2018, respectively, and unrealized losses were $5.9 million and $44.8 million as of Dec. 31, 2019 and 2018, respectively.
Non-derivative instruments with recurring fair value measurements in the nuclear decommissioning fund:
|
| | | | | | | | | | | | | | | | | | | | | | | | |
| | | Dec. 31, 2019 |
| | | | | Fair Value |
| (Millions of Dollars) | | Cost | | Level 1 | | Level 2 | | Level 3 | | NAV | | Total |
Nuclear decommissioning fund (a) | | | | | | | | | | | | |
| Cash equivalents | | $ | 33.4 |
| | $ | 33.4 |
| | $ | — |
| | $ | — |
| | $ | — |
| | $ | 33.4 |
|
| Commingled funds | | 732.8 |
| | — |
| | — |
| | — |
| | 934.9 |
| | 934.9 |
|
| Debt securities | | 489.2 |
| | — |
| | 495.2 |
| | 12.7 |
| | — |
| | 507.9 |
|
| Equity securities | | 484.6 |
| | 962.0 |
| | 1.4 |
| | — |
| | — |
| | 963.4 |
|
| Total | | $ | 1,740.0 |
| | $ | 995.4 |
| | $ | 496.6 |
| | $ | 12.7 |
| | $ | 934.9 |
| | $ | 2,439.6 |
|
| |
(a) | Reported in nuclear decommissioning fund and other investments on the consolidated balance sheet, which also includes $55.6 million of rabbi trust assets and miscellaneous investments. |
|
| | | | | | | | | | | | | | | | | | | | | | | | |
| | | Dec. 31, 2018 |
| | | | | Fair Value |
| (Millions of Dollars) | | Cost | | Level 1 | | Level 2 | | Level 3 | | NAV | | Total |
Nuclear decommissioning fund (a) | | | | | | | | | | | | |
| Cash equivalents | | $ | 24.3 |
| | $ | 24.3 |
| | $ | — |
| | $ | — |
| | $ | — |
| | $ | 24.3 |
|
| Commingled funds | | 758.1 |
| | 79.2 |
| | — |
| | — |
| | 819.1 |
| | 898.3 |
|
| Debt securities | | 465.6 |
| | — |
| | 435.6 |
| | — |
| | — |
| | 435.6 |
|
| Equity securities | | 401.4 |
| | 696.5 |
| | — |
| | — |
| | — |
| | 696.5 |
|
| Total | | $ | 1,649.4 |
| | $ | 800.0 |
| | $ | 435.6 |
| | $ | — |
| | $ | 819.1 |
| | $ | 2,054.7 |
|
| |
(a) | Reported in nuclear decommissioning fund and other investments on the consolidated balance sheet, which also includes $52.5 million of rabbi trust assets and miscellaneous investments. |
For the years ended Dec. 31, 2019 and 2018, there were immaterial Level 3 nuclear decommissioning fund investments or transfer of amounts between levels.
Contractual maturity dates of debt securities in the nuclear decommissioning fund as of Dec. 31, 2019:
|
| | | | | | | | | | | | | | | | | | | | |
| | | Final Contractual Maturity |
| (Millions of Dollars) | | Due in 1 Year or Less | | Due in 1 to 5 Years | | Due in 5 to 10 Years | | Due after 10 Years | | Total |
| Debt securities | | $ | (6.8 | ) | | $ | 110.5 |
| | $ | 246.1 |
| | $ | 158.1 |
| | $ | 507.9 |
|
Rabbi Trusts
NSP-Minnesota has established a rabbi trust to provide partial funding for future deferred compensation plan distributions.
Cost and fair value of assets held in rabbi trusts:
|
| | | | | | | | | | | | | | | | | | | | |
| | | Dec. 31, 2019 |
| | | | | Fair Value |
| (Millions of Dollars) | | Cost | | Level 1 | | Level 2 | | Level 3 | | Total |
Rabbi Trusts (a) | | | | | | | | | | |
| Cash equivalents | | $ | 1.2 |
| | $ | 1.2 |
| | $ | — |
| | $ | — |
| | $ | 1.2 |
|
| Mutual funds | | 11.4 |
| | 13.1 |
| | — |
| | — |
| | 13.1 |
|
| Total | | $ | 12.6 |
| | $ | 14.3 |
| | $ | — |
| | $ | — |
| | $ | 14.3 |
|
| |
(a) | Reported in nuclear decommissioning fund and other investments on the consolidated balance sheet. |
|
| | | | | | | | | | | | | | | | | | | | |
| | | Dec. 31, 2018 |
| | | | | Fair Value |
| (Millions of Dollars) | | Cost | | Level 1 | | Level 2 | | Level 3 | | Total |
Rabbi Trusts (a) | | | | | | | | | | |
| Cash equivalents | | $ | 0.4 |
| | $ | 0.4 |
| | $ | — |
| | $ | — |
| | $ | 0.4 |
|
| Mutual funds | | 10.8 |
| | 10.7 |
| | — |
| | — |
| | 10.7 |
|
| Total | | $ | 11.2 |
| | $ | 11.1 |
| | $ | — |
| | $ | — |
| | $ | 11.1 |
|
| |
(a) | Reported in nuclear decommissioning fund and other investments on the consolidated balance sheet. |
Derivative Fair Value Measurements
NSP-Minnesota enters into derivative instruments, including forward contracts, futures, swaps and options, for trading purposes and to manage risk in connection with changes in interest rates, utility commodity prices and vehicle fuel prices.
Interest Rate Derivatives — NSP-Minnesota enters into various instruments that effectively fix the interest payments on certain floating rate debt obligations or effectively fix the yield or price on a specified benchmark interest rate for an anticipated debt issuance for a specific period. These derivative instruments are generally designated as cash flow hedges for accounting purposes.
As of Dec. 31, 2019, accumulated other comprehensive losses related to interest rate derivatives included $0.8 million of net losses expected to be reclassified into earnings during the next 12 months as the related hedged interest rate transactions impact earnings.
Wholesale and Commodity Trading Risk — NSP-Minnesota conducts various wholesale and commodity trading activities, including the purchase and sale of electric capacity, energy, energy-related instruments and natural gas-related instruments, including derivatives. NSP-Minnesota is allowed to conduct these activities within guidelines and limitations as approved by its risk management committee, comprised of management personnel not directly involved in activities governed by this policy.
Commodity Derivatives — NSP-Minnesota enters into derivative instruments to manage variability of future cash flows from changes in commodity prices in its electric and natural gas operations, as well as for trading purposes. This could include the purchase or sale of energy or energy-related products, natural gas to generate electric energy, natural gas for resale, FTRs, vehicle fuel, and weather derivatives.
As of Dec. 31, 2019, NSP-Minnesota had 0 commodity derivative contracts designated as cash flow hedges. NSP-Minnesota may enter into derivative instruments that mitigate commodity price risk on behalf of electric and natural gas customers, but may not be designated as qualifying hedging transactions. Changes in the fair value of non-trading commodity derivative instruments are recorded in other comprehensive income or deferred as a regulatory asset or liability. The classification as a regulatory asset or liability is based on commission approved regulatory recovery mechanisms. Immaterial amounts to income related to the ineffectiveness of cash flow hedges were recorded for the years ended Dec. 31, 2019 and 2018.
As of Dec. 31, 2019, there were immaterial net gains related to commodity derivative cash flow hedges recorded as a component of accumulated other comprehensive losses or related amounts expected to be reclassified into earnings during the next 12 months.
NSP-Minnesota enters into commodity derivative instruments for trading purposes not directly related to commodity price risks associated with serving its electric and natural gas customers. Changes in the fair value of these commodity derivatives are recorded in electric operating revenues, net of amounts credited to customers under margin-sharing mechanisms.
Gross notional amounts of commodity forwards, options and FTRs at Dec. 31:
|
| | | | | | |
(Amounts in Millions) (a) (b) | | 2019 | | 2018 |
| MWh of electricity | | 79.1 |
| | 56.8 |
|
| MMBtu of natural gas | | 77.8 |
| | 42.7 |
|
| |
(a) | Amounts are not reflective of net positions in the underlying commodities. |
| |
(b) | Notional amounts for options are included on a gross basis, but are weighted for the probability of exercise. |
Consideration of Credit Risk and Concentrations — NSP-Minnesota continuously monitors the creditworthiness of counterparties to its interest rate derivatives and commodity derivative contracts prior to settlement, and assesses each counterparty’s ability to perform on the transactions set forth in the contracts. Impact of credit risk was immaterial to the fair value of unsettled commodity derivatives presented in the consolidated balance sheets.
NSP-Minnesota employs additional credit risk control mechanisms when appropriate, such as letters of credit, parental guarantees, standardized master netting agreements and termination provisions that allow for offsetting of positive and negative exposures. Credit exposure is monitored and, when necessary, the activity with a specific counterparty is limited until credit enhancement is provided.
NSP-Minnesota’s most significant concentrations of credit risk with particular entities or industries are contracts with counterparties to its wholesale, trading and non-trading commodity activities. As of Dec. 31, 2019, 8 of NSP-Minnesota’s 10 most significant counterparties for these activities, comprising $54.2 million or 68% of this credit exposure, had investment grade credit ratings from Standard & Poor’s, Moody’s or Fitch Ratings.
NaN of the 10 most significant counterparties, comprising $15.8 million or 20% of this credit exposure, were not rated by these external agencies, but based on NSP-Minnesota’s internal analysis, had credit quality consistent with investment grade. NaN of these significant counterparties are municipal or cooperative electric entities, RTOs or other utilities.
Qualifying Cash Flow Hedges — Financial impact of qualifying interest rate and vehicle fuel cash flow hedges on NSP-Minnesota’s accumulated other comprehensive loss, included in the consolidated statements of common stockholder’s equity and in the consolidated statements of comprehensive income:
|
| | | | | | | | | | | | |
| (Millions of Dollars) | | 2019 | | 2018 | | 2017 |
| Accumulated other comprehensive loss related to cash flow hedges at Jan. 1 | | $ | (20.2 | ) | | $ | (20.9 | ) | | $ | (18.2 | ) |
| After-tax net unrealized gains related to derivatives accounted for as hedges | | — |
| | — |
| | 0.1 |
|
| After-tax net realized losses on derivative transactions reclassified into earnings | | 0.8 |
| | 0.7 |
| | 0.9 |
|
Adoption of ASU. 2018-02 (a) | | — |
| | — |
| | (3.7 | ) |
| Accumulated other comprehensive loss related to cash flow hedges at Dec. 31 | | $ | (19.4 | ) | | $ | (20.2 | ) | | $ | (20.9 | ) |
| |
(a) | In 2017, NSP-Minnesota implemented ASU No. 2018-02 related to TCJA, which resulted in reclassification of certain credit balances within net accumulated other comprehensive loss to retained earnings. |
Impact of derivative activity:
|
| | | | | | | | |
| | | Pre-Tax Fair Value
Gains (Losses) Recognized
During the Period in: |
| (Millions of Dollars) | | Accumulated Other Comprehensive Loss | | Regulatory (Assets) and Liabilities |
| Year Ended Dec. 31, 2019 | | | | |
| Other derivative instruments | | | | |
| Electric commodity | | $ | — |
| | $ | 1.5 |
|
| Natural gas commodity | | — |
| | (2.9 | ) |
| Total | | $ | — |
| | $ | (1.4 | ) |
| | | | | |
| Year Ended Dec. 31, 2018 | | | | |
| Other derivative instruments | | | | |
| Electric commodity | | $ | — |
| | $ | (5.5 | ) |
| Natural gas commodity | | — |
| | 1.8 |
|
| Total | | $ | — |
| | $ | (3.7 | ) |
| | | | | |
| Year Ended Dec. 31, 2017 | | | | |
| Derivatives designated as cash flow hedges | | | | |
| Vehicle fuel and other commodity | | $ | 0.1 |
| | $ | — |
|
| Total | | $ | 0.1 |
| | $ | — |
|
| Other derivative instruments | | | | |
| Electric commodity | | — |
| | 9.3 |
|
| Natural gas commodity | | — |
| | (1.9 | ) |
| Total | | $ | — |
| | $ | 7.4 |
|
|
| | | | | | | | | | | | |
| | Pre-Tax (Gains) Losses
Reclassified into Income
During the Period from: | | Pre-Tax Gains (Losses)
Recognized
During the Period in Income | |
| (Millions of Dollars) | Accumulated Other Comprehensive Loss | | Regulatory
Assets and (Liabilities) | | |
| Year Ended Dec. 31, 2019 | | | | | | |
| Derivatives designated as cash flow hedges | | | | | | |
| Interest rate | $ | 1.1 |
| (a) | $ | — |
| | $ | — |
| |
| Total | $ | 1.1 |
| | $ | — |
| | $ | — |
| |
| Other derivative instruments | | | | | | |
| Commodity trading | $ | — |
| | $ | — |
| | $ | (0.7 | ) | (c) |
| Electric commodity | — |
| | 0.8 |
| (d) | — |
| |
| Natural gas commodity | — |
| | 0.9 |
| (e) | (2.5 | ) | (e) |
| Total | $ | — |
| | $ | 1.7 |
| | $ | (3.2 | ) | |
| | | | | | | |
| Year Ended Dec. 31, 2018 | | | | | | |
| Derivatives designated as cash flow hedges | | | | | | |
| Interest rate | $ | 1.1 |
| (a) | $ | — |
| | $ | — |
| |
| Vehicle fuel and other commodity | (0.1 | ) | (b) | — |
| | — |
| |
| Total | $ | 1.0 |
| | $ | — |
| | $ | — |
| |
| Other derivative instruments | | | | | | |
| Commodity trading | $ | — |
| | $ | — |
| | $ | 10.9 |
| (c) |
| Electric commodity | — |
| | 3.3 |
| (d) | — |
| |
| Natural gas commodity | — |
| | (1.9 | ) | (e) | (1.3 | ) | (e) |
| Total | $ | — |
| | $ | 1.4 |
| | $ | 9.6 |
| |
| | | | | | | |
| Year Ended Dec. 31, 2017 | | | | | | |
| Derivatives designated as cash flow hedges | | | | | | |
| Interest rate | $ | 1.5 |
| (a) | $ | — |
| | $ | — |
| |
| Total | $ | 1.5 |
| | $ | — |
| | $ | — |
| |
| Other derivative instruments | | | | | | |
| Commodity trading | $ | — |
| | $ | — |
| | $ | 9.4 |
| (c) |
| Electric commodity | — |
| | (13.8 | ) | (d) | — |
| |
| Natural gas commodity | — |
| | 1.0 |
| (e) | (1.2 | ) | (e) |
| Total | $ | — |
| | $ | (12.8 | ) | | $ | 8.2 |
| |
| |
(a) | Amounts are recorded to interest charges. |
| |
(b) | Amounts are recorded to O&M expenses. |
| |
(c) | Amounts are recorded to electric operating revenues. Portions of these gains and losses are subject to sharing with electric customers through margin-sharing mechanisms and deducted from gross revenue, as appropriate. |
| |
(d) | Amounts are recorded to electric fuel and purchased power. These derivative settlement gains and losses are shared with electric customers through fuel and purchased energy cost-recovery mechanisms, and reclassified out of income as regulatory assets or liabilities, as appropriate. |
| |
(e) | Amounts are recorded to cost of natural gas sold and transported. These derivative settlement gains and losses are shared with natural gas customers through purchased natural gas cost-recovery mechanisms, and reclassified out of income as regulatory assets and liabilities, as appropriate. |
NSP-Minnesota had 0 derivative instruments designated as fair value hedges during the years ended Dec. 31, 2019, 2018 and 2017.
Credit Related Contingent Features — Contract provisions for derivative instruments that NSP-Minnesota enters into, including those accounted for as normal purchase-normal sale contracts and therefore not reflected on the consolidated balance sheets, may require the posting of collateral or settlement of the contracts for various reasons, including if NSP-Minnesota’s credit ratings are downgraded below its investment grade credit rating by any of the major credit rating agencies, or for cross-default contractual provisions if there was a failure under other financing arrangements related to payment terms or other covenants. As of Dec. 31, 2019 and 2018, there were $7.1 million and 0 derivative instruments in a liability position with such underlying contract provisions, respectfully.
Certain derivative instruments are also subject to contract provisions that contain adequate assurance clauses. These provisions allow counterparties to seek performance assurance, including cash collateral, in the event that NSP-Minnesota’s ability to fulfill its contractual obligations is reasonably expected to be impaired. NSP-Minnesota had 0 collateral posted related to adequate assurance clauses in derivative contracts as of Dec. 31, 2019 and 2018.
Recurring Fair Value Measurements — The following table presents for each of the fair value hierarchy levels, NSP-Minnesota’s derivative assets and liabilities measured at fair value on a recurring basis at Dec. 31, 2019 and 2018:
|
| | | | | | | | | | | | | | | | | | | | | | | | | | | | | | | | | | | | | | | | | | | | | | | | |
| | | Dec. 31, 2019 | | Dec. 31, 2018 |
| | | Fair Value | | Fair Value
Total | | Netting (a) | | | | Fair Value | | Fair Value
Total | | Netting (a) | | |
| (Millions of Dollars) | | Level 1 | | Level 2 | | Level 3 | | | | Total | | Level 1 | | Level 2 | | Level 3 | | | | Total |
| Current derivative assets | | | | | | | | | | | | | | | | | | | | | | | | |
| Other derivative instruments: | | | | | | | | | | | | | | | | | | | | | | | | |
| Commodity trading | | $ | 1.6 |
| | $ | 39.5 |
| | $ | 23.6 |
| | $ | 64.7 |
| | $ | (42.1 | ) | | $ | 22.6 |
| | $ | 1.1 |
| | $ | 27.1 |
| | $ | 2.2 |
| | $ | 30.4 |
| | $ | (16.0 | ) | | $ | 14.4 |
|
| Electric commodity | | — |
| | — |
| | 8.7 |
| | 8.7 |
| | (0.9 | ) | | 7.8 |
| | — |
| | — |
| | 10.5 |
| | 10.5 |
| | (0.1 | ) | | 10.4 |
|
| Natural gas commodity | | — |
| | 2.1 |
| | — |
| | 2.1 |
| | — |
| | 2.1 |
| | — |
| | 1.0 |
| | — |
| | 1.0 |
| | — |
| | 1.0 |
|
| Total current derivative assets | | $ | 1.6 |
| | $ | 41.6 |
| | $ | 32.3 |
| | $ | 75.5 |
| | $ | (43.0 | ) | | 32.5 |
| | $ | 1.1 |
| | $ | 28.1 |
| | $ | 12.7 |
| | $ | 41.9 |
| | $ | (16.1 | ) | | 25.8 |
|
PPAs (b) | | | | | | | | | | | | — |
| | | | | | | | | | | | — |
|
| Current derivative instruments | | | | | | | | | | | | $ | 32.5 |
| | | | | | | | | | | | $ | 25.8 |
|
| Noncurrent derivative assets | | | | | | | | | | | | | | | | | | | | | | | | |
| Other derivative instruments: | | | | | | | | | | | | | | | | | | | | | | | | |
| Commodity trading | | $ | 8.5 |
| | $ | 29.4 |
| | $ | 6.0 |
| | $ | 43.9 |
| | $ | (34.8 | ) | | $ | 9.1 |
| | $ | — |
| | $ | 25.3 |
| | $ | 5.0 |
| | $ | 30.3 |
| | $ | (13.4 | ) | | $ | 16.9 |
|
| Total noncurrent derivative assets | | $ | 8.5 |
| | $ | 29.4 |
| | $ | 6.0 |
| | $ | 43.9 |
| | $ | (34.8 | ) | | 9.1 |
| | $ | — |
| | $ | 25.3 |
| | $ | 5.0 |
| | $ | 30.3 |
| | $ | (13.4 | ) | | 16.9 |
|
PPAs (b) | | | | | | | | | | | | 0.1 |
| | | | | | | | | | | | 0.1 |
|
| Noncurrent derivative instruments | | | | | | | | | | | | $ | 9.2 |
| | | | | | | | | | | | $ | 17.0 |
|
|
| | | | | | | | | | | | | | | | | | | | | | | | | | | | | | | | | | | | | | | | | | | | | | | | |
| | | Dec. 31, 2019 | | Dec. 31, 2018 |
| | | Fair Value | | Fair Value
Total | | Netting (a) | | | | Fair Value | | Fair Value
Total | | Netting (a) | | |
| (Millions of Dollars) | | Level 1 | | Level 2 | | Level 3 | | | | Total | | Level 1 | | Level 2 | | Level 3 | | | | Total |
| Current derivative liabilities | | | | | | | | | | | | | | | | | | | | | | | | |
| Other derivative instruments: | | | | | | | | | | | | | | | | | | | | | | | | |
| Commodity trading | | $ | 2.2 |
| | $ | 42.1 |
| | $ | 15.0 |
| | $ | 59.3 |
| | $ | (49.8 | ) | | $ | 9.5 |
| | $ | 1.4 |
| | $ | 23.9 |
| | $ | 1.7 |
| | $ | 27.0 |
| | $ | (24.5 | ) | | $ | 2.5 |
|
| Electric commodity | | — |
| | — |
| | 1.0 |
| | 1.0 |
| | (1.0 | ) | | — |
| | — |
| | — |
| | 0.1 |
| | 0.1 |
| | (0.1 | ) | | — |
|
| Natural gas commodity | | — |
| | 1.7 |
| | — |
| | 1.7 |
| | — |
| | 1.7 |
| | — |
| | — |
| | — |
| | — |
| | — |
| | — |
|
| Total current derivative liabilities | | $ | 2.2 |
| | $ | 43.8 |
| | $ | 16.0 |
| | $ | 62.0 |
| | $ | (50.8 | ) | | 11.2 |
| | $ | 1.4 |
| | $ | 23.9 |
| | $ | 1.8 |
| | $ | 27.1 |
| | $ | (24.6 | ) | | 2.5 |
|
PPAs (b) | | | | | | | | | | | | 13.8 |
| | | | | | | | | | | | 14.0 |
|
| Current derivative instruments | | | | | | | | | | | | $ | 25.0 |
| | | | | | | | | | | | $ | 16.5 |
|
| Noncurrent derivative liabilities | | | | | | | | | | | | | | | | | | | | | | | | |
| Other derivative instruments: | | | | | | | | | | | | | | | | | | | | | | | | |
| Commodity trading | | $ | 2.0 |
| | $ | 32.3 |
| | $ | 17.0 |
| | $ | 51.3 |
| | $ | (3.3 | ) | | $ | 48.0 |
| | $ | 0.1 |
| | $ | 16.0 |
| | $ | 1.6 |
| | $ | 17.7 |
| | $ | 17.9 |
| | $ | 35.6 |
|
| Total noncurrent derivative liabilities | | $ | 2.0 |
| | $ | 32.3 |
| | $ | 17.0 |
| | $ | 51.3 |
| | $ | (3.3 | ) | | 48.0 |
| | $ | 0.1 |
| | $ | 16.0 |
| | $ | 1.6 |
| | $ | 17.7 |
| | $ | 17.9 |
| | 35.6 |
|
PPAs (b) | | | | | | | | | | | | 62.2 |
| | | | | | | | | | | | 76.6 |
|
| Noncurrent derivative instruments | | | | | | | | | | | | $ | 110.2 |
| | | | | | | | | | | | $ | 112.2 |
|
| |
(a) | NSP-Minnesota nets derivative instruments and related collateral in its consolidated balance sheet when supported by a legally enforceable master netting agreement, and all derivative instruments and related collateral amounts were subject to master netting agreements at Dec. 31, 2019 and 2018. At both Dec. 31, 2019 and 2018, derivative assets and liabilities include $31.5 million of obligations to return cash collateral, respectively. At Dec. 31, 2019 and 2018, derivative assets and liabilities include the rights to reclaim cash collateral of $7.9 million and $8.7 million, respectively. The counterparty netting excludes settlement receivables and payables and non-derivative amounts that may be subject to the same master netting agreements. |
| |
(b) | During 2006, Xcel Energy qualified these contracts under the normal purchase exception. Based on this qualification, the contracts are no longer adjusted to fair value and the previous carrying value of these contracts will be amortized over the remaining contract lives along with the offsetting regulatory assets and liabilities. |
Changes in Level 3 commodity derivatives for the years ended Dec. 31, 2019, 2018 and 2017: |
| | | | | | | | | | | | |
| | | Year Ended Dec. 31 |
| (Millions of Dollars) | | 2019 | | 2018 | | 2017 |
| Balance at Jan. 1 | | $ | 14.3 |
| | $ | 22.6 |
| | $ | 15.3 |
|
| Purchases | | 16.7 |
| | 26.4 |
| | 40.6 |
|
| Settlements | | (27.5 | ) | | (17.2 | ) | | (41.7 | ) |
| Net transactions recorded during the period: | | | | | | |
Gains (losses) recognized in earnings (a) | | 3.2 |
| | (1.5 | ) | | 5.5 |
|
| Net (losses) gains recognized as regulatory assets and liabilities | | (1.4 | ) | | (16.0 | ) | | 2.9 |
|
| Balance at Dec. 31 | | $ | 5.3 |
| | $ | 14.3 |
| | $ | 22.6 |
|
| |
(a) | Amounts relate to commodity derivatives held at the end of the period. |
NSP-Minnesota recognizes transfers between levels as of the beginning of each period. There were 0 transfers of amounts between levels for derivative instruments for the years ended 2017 - 2019.
Fair Value of Long-Term Debt
As of Dec. 31, other financial instruments for which the carrying amount did not equal fair value:
|
| | | | | | | | | | | | | | | | |
| | | 2019 | | 2018 |
| (Millions of Dollars) | | Carrying
Amount | | Fair Value | | Carrying
Amount | | Fair Value |
| Long-term debt, including current portion | | $ | 5,521.3 |
| | $ | 6,296.5 |
| | $ | 4,937.2 |
| | $ | 5,230.9 |
|
Fair value of NSP-Minnesota’s long-term debt is estimated based on recent trades and observable spreads from benchmark interest rates for similar securities. Fair value estimates are based on information available to management as of Dec. 31, 2019 and 2018, and given the observability of the inputs, fair values presented for long-term debt were assigned as Level 2.
|
|
| 9. Benefit Plans and Other Postretirement Benefits |
Pension and Postretirement Health Care Benefits
Xcel Energy, which includes NSP-Minnesota, has several noncontributory, defined benefit pension plans that cover almost all employees. Generally, benefits are based on a combination of years of service and average pay. Xcel Energy’s and NSP-Minnesota’s policy is to fully fund into an external trust the actuarially determined pension costs subject to the limitations of applicable employee benefit and tax laws.
In addition to the qualified pension plans, Xcel Energy maintains a SERP and a nonqualified pension plan. The SERP is maintained for certain executives that were participants in the plan in 2008, when the SERP was closed to new participants. The nonqualified pension plan provides benefits for compensation that is in excess of the limits applicable to the qualified pension plans, with distributions funded by Xcel Energy’s consolidated operating cash flows. Obligations of the SERP and nonqualified plan as of Dec. 31, 2019 and 2018 were $39 million and $33 million, respectively, of which $4 million was attributable to NSP-Minnesota in both years. In 2019 and 2018, Xcel Energy recognized net benefit cost for the SERP and nonqualified plans of $4 million , of which $1 million was attributable to NSP-Minnesota in both years.
Xcel Energy and NSP-Minnesota base the investment-return assumption on expected long-term performance for each of the asset classes in its pension and postretirement health care portfolios.
For pension assets, Xcel Energy and NSP-Minnesota consider the historical returns achieved by their asset portfolio over the past 20 years or longer period, as well as the long-term projected return levels. Xcel Energy and NSP-Minnesota continually review their pension assumptions.
Pension cost determination assumes a forecasted mix of investment types over the long-term.
| |
| • | Investment returns in 2019 were above the assumed level of 7.10%; |
| |
| • | Investment returns in 2018 were below the assumed level of 7.10%; |
| |
| • | Investment returns in 2017 were above the assumed level of 7.10%; and |
| |
| • | In 2020, NSP-Minnesota’s expected investment-return assumption is 7.10%. |
Pension plan and postretirement benefit assets are invested in a portfolio according to Xcel Energy’s and NSP-Minnesota’s return, liquidity and diversification objectives to provide a source of funding for plan obligations and minimize contributions to the plan, within appropriate levels of risk. The principal mechanism for achieving these objectives is the asset allocation given the long-term risk, return, correlation and liquidity characteristics of each particular asset class.
There were no significant concentrations of risk in any industry, index, or entity. Market volatility can impact even well-diversified portfolios and significantly affect the return levels achieved by the assets in any year.
State agencies also have issued guidelines to the funding of postretirement benefit costs.
Xcel Energy’s ongoing investment strategy is based on plan-specific investment recommendations that seek to minimize potential investment and interest rate risk as a plan’s funded status increases over time. The investment recommendations result in a greater percentage of long-duration fixed income securities being allocated to specific plans having relatively higher funded status ratios and a greater percentage of growth assets being allocated to plans having relatively lower funded status ratios.
Plan Assets
For each of the fair value hierarchy levels, NSP-Minnesota’s pension plan assets measured at fair value:
|
| | | | | | | | | | | | | | | | | | | | | | | | | | | | | | | | | | | | | | | | |
| | | Dec. 31, 2019 (a) | | Dec. 31, 2018 (a) |
| (Millions of Dollars) | | Level 1 | | Level 2 | | Level 3 | | Measured at NAV | | Total | | Level 1 | | Level 2 | | Level 3 | | Measured at NAV | | Total |
| Cash equivalents | | $ | 40.9 |
| | $ | — |
| | $ | — |
| | $ | — |
| | $ | 40.9 |
| | $ | 31.8 |
| | $ | — |
| | $ | — |
| | $ | — |
| | $ | 31.8 |
|
| Commingled funds | | 360.3 |
| | — |
| | — |
| | 270.3 |
| | 630.6 |
| | 241.0 |
| | — |
| | — |
| | 271.2 |
| | 512.2 |
|
| Debt securities | | — |
| | 155.5 |
| | 1.1 |
| | — |
| | 156.6 |
| | — |
| | 143.7 |
| | — |
| | — |
| | 143.7 |
|
| Equity securities | | 22.6 |
| | — |
| | — |
| | — |
| | 22.6 |
| | 29.3 |
| | — |
| | — |
| | — |
| | 29.3 |
|
| Other | | (31.5 | ) | | 1.2 |
| | — |
| | (5.2 | ) | | (35.5 | ) | | 0.5 |
| | 1.3 |
| | — |
| | (8.2 | ) | | (6.4 | ) |
| Total | | $ | 392.3 |
| | $ | 156.7 |
| | $ | 1.1 |
| | $ | 265.1 |
| | $ | 815.2 |
| | $ | 302.6 |
| | $ | 145.0 |
| | $ | — |
| | $ | 263.0 |
| | $ | 710.6 |
|
| |
(a) | See Note 8 for further information on fair value measurement inputs and methods. |
For each of the fair value hierarchy levels, NSP-Minnesota’s postretirement benefit plan assets that were measured at fair value:
|
| | | | | | | | | | | | | | | | | | | | | | | | | | | | | | | | | | | | | | | | |
| | | Dec. 31, 2019 (a) | | Dec. 31, 2018 (a) |
| (Millions of Dollars) | | Level 1 | | Level 2 | | Level 3 | | Measured at NAV | | Total | | Level 1 | | Level 2 | | Level 3 | | Measured at NAV | | Total |
| Cash equivalents | | $ | 0.1 |
| | $ | — |
| | $ | — |
| | $ | — |
| | $ | 0.1 |
| | $ | 0.1 |
| | $ | — |
| | $ | — |
| | $ | — |
| | $ | 0.1 |
|
| Insurance contracts | | — |
| | 0.3 |
| | — |
| | — |
| | 0.3 |
| | — |
| | 0.3 |
| | — |
| | — |
| | 0.3 |
|
| Commingled funds | | 0.4 |
| | — |
| | — |
| | 0.5 |
| | 0.9 |
| | 0.8 |
| | — |
| | — |
| | 0.2 |
| | 1.0 |
|
| Debt securities | | — |
| | 1.3 |
| | — |
| | — |
| | 1.3 |
| | — |
| | 1.0 |
| | — |
| | — |
| | 1.0 |
|
| Equity securities | | — |
| | — |
| | — |
| | — |
| | — |
| | — |
| | — |
| | — |
| | — |
| | — |
|
| Total | | $ | 0.5 |
| | $ | 1.6 |
| | $ | — |
| | $ | 0.5 |
| | $ | 2.6 |
| | $ | 0.9 |
| | $ | 1.3 |
| | $ | — |
| | $ | 0.2 |
| | $ | 2.4 |
|
| |
(a) | See Note 8 for further information on fair value measurement inputs and methods. |
Immaterial assets were transferred in or out of Level 3 for 2019. No assets were transferred in or out of Level 3 for 2018.
Funded Status — Comparisons of the actuarially computed benefit obligation, changes in plan assets and funded status of the pension and postretirement health care plans for NSP-Minnesota are as follows:
|
| | | | | | | | | | | | | | | | |
| | | Pension Benefits | | Postretirement Benefits |
| (Millions of Dollars) | | 2019 | | 2018 | | 2019 | | 2018 |
| Change in Benefit Obligation: | | | | | | | | |
| Obligation at Jan. 1 | | $ | 907.0 |
| | $ | 1,035.1 |
| | $ | 76.0 |
| | $ | 88.8 |
|
| Service cost | | 25.4 |
| | 28.0 |
| | 0.1 |
| | 0.2 |
|
| Interest cost | | 37.1 |
| | 35.2 |
| | 3.2 |
| | 3.1 |
|
| Plan amendments | | 1.0 |
| | — |
| | — |
| | — |
|
| Actuarial loss (gain) | | 61.7 |
| | (50.8 | ) | | 3.8 |
| | (9.0 | ) |
| Plan participants’ contributions | | — |
| | — |
| | 0.3 |
| | 0.4 |
|
Benefit payments (a) | | (90.0 | ) | | (140.5 | ) | | (7.9 | ) | | (7.5 | ) |
| Obligation at Dec. 31 | | $ | 942.2 |
| | $ | 907.0 |
| | $ | 75.5 |
| | $ | 76.0 |
|
| Change in Fair Value of Plan Assets: | | | | | | | | |
| Fair value of plan assets at Jan. 1 | | $ | 710.6 |
| | $ | 824.5 |
| | $ | 2.4 |
| | $ | 6.5 |
|
| Actual return on plan assets | | 147.8 |
| | (36.5 | ) | | — |
| | — |
|
| Employer contributions | | 46.8 |
| | 63.1 |
| | 7.7 |
| | 3.0 |
|
| Plan participants’ contributions | | — |
| | — |
| | 0.3 |
| | 0.4 |
|
| Benefit payments | | (90.0 | ) | | (140.5 | ) | | (7.8 | ) | | (7.5 | ) |
| Fair value of plan assets at Dec. 31 | | $ | 815.2 |
| | $ | 710.6 |
| | $ | 2.6 |
| | $ | 2.4 |
|
| Funded status of plans at Dec. 31 | | $ | (127.0 | ) | | $ | (196.4 | ) | | $ | (72.9 | ) | | $ | (73.6 | ) |
| Amounts recognized in the Consolidated Balance Sheet at Dec. 31: | | | | | | | | |
| Current assets (liabilities) | | $ | — |
| | $ | — |
| | $ | (4.3 | ) | | $ | (4.8 | ) |
| Noncurrent assets (liabilities) | | (127.0 | ) | | (196.4 | ) | | (68.6 | ) | | (68.8 | ) |
| Net amounts recognized | | $ | (127.0 | ) | | $ | (196.4 | ) | | $ | (72.9 | ) | | $ | (73.6 | ) |
| |
(a) | Includes approximately $105 million of lump-sum benefit payments used in the determination of a settlement charge in 2018. |
|
| | | | | | | | | | | | |
| Significant Assumptions Used to Measure Benefit Obligations: | | | | | | | | |
| Discount rate for year-end valuation | | 3.49 | % | | 4.31 | % | | 3.47 | % | | 4.32 | % |
| Expected average long-term increase in compensation level | | 3.75 | % | | 3.75 | % | | N/A |
| | N/A |
|
| Mortality table | | Pri-2012 |
| | RP-2014 |
| | Pri-2012 |
| | RP-2014 |
|
Health care costs trend rate — initial: Pre-65 | | N/A |
| | N/A |
| | 6.00 | % | | 6.50 | % |
Health care costs trend rate — initial: Post-65 | | N/A |
| | N/A |
| | 5.10 | % | | 5.30 | % |
Ultimate trend assumption — initial: Pre-65 | | N/A |
| | N/A |
| | 4.50 | % | | 4.50 | % |
Ultimate trend assumption — initial: Post-65 | | N/A |
| | N/A |
| | 4.50 | % | | 4.50 | % |
| Years until ultimate trend is reached | | N/A |
| | N/A |
| | 3 |
| | 4 |
|
The accumulated benefit obligation for the pension plan was $872 million and $845 million as of Dec. 31, 2019 and 2018, respectively.
Net Periodic Benefit Cost — Net periodic benefit cost other than the service cost component is included in other income in the consolidated statement of income.
Components of net periodic benefit cost and the amounts recognized in other comprehensive income and regulatory assets and liabilities are as follows:
|
| | | | | | | | | | | | | | | | | | | | | | | | |
| | | Pension Benefits | | Postretirement Benefits |
| (Millions of Dollars) | | 2019 | | 2018 | | 2017 | | 2019 | | 2018 | | 2017 |
| Service cost | | $ | 25.4 |
| | $ | 28.0 |
| | $ | 27.8 |
| | $ | 0.1 |
| | $ | 0.2 |
| | $ | 0.1 |
|
| Interest cost | | 37.1 |
| | 35.2 |
| | 40.7 |
| | 3.2 |
| | 3.1 |
| | 3.4 |
|
| Expected return on plan assets | | (54.3 | ) | | (58.2 | ) | | (60.1 | ) | | (0.1 | ) | | (0.4 | ) | | (0.2 | ) |
| Amortization of prior service cost | | (0.1 | ) | | (0.1 | ) | | 1.1 |
| | (3.0 | ) | | (3.0 | ) | | (3.0 | ) |
| Amortization of net loss | | 30.2 |
| | 38.5 |
| | 39.6 |
| | 1.5 |
| | 2.4 |
| | 2.0 |
|
Settlement charge (a) | | — |
| | 48.8 |
| | 48.2 |
| | — |
| | — |
| | — |
|
| Net periodic pension cost | | 38.3 |
| | 92.2 |
| | 97.3 |
| | 1.7 |
| | 2.3 |
| | 2.3 |
|
| Costs not recognized due to effects of regulation | | (5.2 | ) | | (66.0 | ) | | (72.2 | ) | | — |
| | — |
| | — |
|
| Net benefit cost recognized for financial reporting | | $ | 33.1 |
| | $ | 26.2 |
| | $ | 25.1 |
| | $ | 1.7 |
| | $ | 2.3 |
| | $ | 2.3 |
|
| Significant Assumptions Used to Measure Costs: | | | | | | | | | | | | |
| Discount rate | | 4.31 | % | | 3.63 | % | | 4.13 | % | | 4.32 | % | | 3.62 | % | | 4.13 | % |
| Expected average long-term increase in compensation level | | 3.75 |
| | 3.75 |
| | 3.75 |
| | — |
| | — |
| | — |
|
| Expected average long-term rate of return on assets | | 7.10 |
| | 7.10 |
| | 7.10 |
| | 4.50 |
| | 5.30 |
| | 5.80 |
|
| |
(a) | A settlement charge is required when the amount of lump-sum distributions during the year is greater than the sum of the service and interest cost components of the annual net periodic pension cost. In 2018 and 2017, as a result of lump-sum distributions during the 2018 and 2017 plan years, NSP-Minnesota recorded a total pension settlement charge of $48.8 million in 2018 and $48.2 million in 2017 , which was not recognized due to the effects of regulation. |
|
| | | | | | | | | | | | | | | | |
| | | Pension Benefits | | Postretirement Benefits |
| (Millions of Dollars) | | 2019 | | 2018 | | 2019 | | 2018 |
| Amounts Not Yet Recognized as Components of Net Periodic Benefit Cost: | | | | | | | | |
| Net loss | | $ | 440.0 |
| | $ | 502.0 |
| | $ | 36.8 |
| | $ | 34.3 |
|
| Prior service credit | | (0.2 | ) | | (1.2 | ) | | (9.4 | ) | | (12.4 | ) |
| Total | | $ | 439.8 |
| | $ | 500.8 |
| | $ | 27.4 |
| | $ | 21.9 |
|
| Amounts Not Yet Recognized as Components of Net Periodic Benefit Cost Have Been Recorded as Follows Based Upon Expected Recovery in Rates: | | | | | | | | |
| Current regulatory assets | | $ | 29.3 |
| | $ | 35.5 |
| | $ | — |
| | $ | — |
|
| Noncurrent regulatory assets | | 410.5 |
| | 465.3 |
| | 25.6 |
| | 20.5 |
|
| Deferred income taxes | | — |
| | — |
| | 0.5 |
| | 0.4 |
|
| Net-of-tax accumulated other comprehensive income | | — |
| | — |
| | 1.3 |
| | 1.0 |
|
| Total | | $ | 439.8 |
| | $ | 500.8 |
| | $ | 27.4 |
| | $ | 21.9 |
|
| | | | | | | | | |
| Measurement date | | Dec. 31, 2019 |
| | Dec. 31, 2018 |
| | Dec. 31, 2019 |
| | Dec. 31, 2018 |
|
Cash Flows — Cash funding requirements can be impacted by changes to actuarial assumptions, actual asset levels and other calculations prescribed by the funding requirements of income tax and other pension-related regulations. Required contributions were made in 2017 - 2020 to meet minimum funding requirements. Total voluntary and required pension funding contributions across all 4 of Xcel Energy’s pension plans were as follows:
| |
| • | $150 million in January 2020, of which $44 million is attributable to NSP-Minnesota; |
| |
| • | $154 million in 2019, of which $47 million was attributable to NSP-Minnesota; |
| |
| • | $150 million in 2018, of which $63 million was attributable to NSP-Minnesota; and |
| |
| • | $162 million in 2017, of which $61 million was attributable to NSP-Minnesota. |
The postretirement health care plans have no funding requirements other than fulfilling benefit payment obligations, when claims are presented and approved. Additional cash funding requirements are prescribed by certain state and federal rate regulatory authorities. Voluntary postretirement funding contributions:
| |
| • | $10 million in January 2020, of which $7 million is attributable to NSP-Minnesota; |
| |
| • | $15 million in 2019, of which $8 million, was attributable to NSP-Minnesota; |
| |
| • | $11 million in 2018, of which $3 million was attributable to NSP-Minnesota; and |
| |
| • | $20 million in 2017, of which $10 million was attributable to NSP-Minnesota. |
Target asset allocations:
|
| | | | | | | | | | | | |
| | | Pension Benefits | | Postretirement Benefits |
| | | 2019 | | 2018 | | 2019 | | 2018 |
| Domestic and international equity securities | | 37 | % | | 37 | % | | 15 | % | | 18 | % |
| Long-duration fixed income and interest rate swap securities | | 30 |
| | 28 |
| | — |
| | — |
|
| Short-to-intermediate fixed income securities | | 14 |
| | 18 |
| | 72 |
| | 70 |
|
| Alternative investments | | 17 |
| | 15 |
| | 9 |
| | 8 |
|
| Cash | | 2 |
| | 2 |
| | 4 |
| | 4 |
|
| Total | | 100 | % | | 100 | % | | 100 | % | | 100 | % |
Plan Amendments —The Xcel Energy Pension Plan, which includes NSP-Minnesota, and Xcel Energy Inc. Nonbargaining Pension Plan (South) were amended in 2017 to reduce supplemental benefits for non-bargaining participants as well as to allow the transfer of a portion of non-qualified pension obligations into the qualified plans.
In 2019, the Pension Protection Act measurement concept was extended beyond 2019 for NSP bargaining terminations and retirements to Dec. 31, 2022.
In 2019, there were no plan amendments made which affected the postretirement benefit obligation.
Projected Benefit Payments
NSP-Minnesota’s projected benefit payments:
|
| | | | | | | | | | | | | | | | |
(Millions of Dollars) | | Projected Pension Benefit Payments | | Gross Projected Postretirement Health Care Benefit Payments | | Expected Medicare Part D Subsidies | | Net Projected Postretirement Health Care Benefit Payments |
| 2020 | | $ | 89.9 |
| | $ | 6.9 |
| | $ | — |
| | $ | 6.9 |
|
| 2021 | | 82.4 |
| | 6.6 |
| | — |
| | 6.6 |
|
| 2022 | | 80.8 |
| | 6.2 |
| | — |
| | 6.2 |
|
| 2023 | | 78.5 |
| | 5.9 |
| | — |
| | 5.9 |
|
| 2024 | | 74.1 |
| | 5.6 |
| | — |
| | 5.6 |
|
| 2025-2029 | | 326.7 |
| | 23.6 |
| | — |
| | 23.6 |
|
Defined Contribution Plans
Xcel Energy, which includes NSP-Minnesota, maintains 401(k) and other defined contribution plans that cover most employees. The expense to these plans for NSP-Minnesota was approximately $12 million in 2019, 2018 and in 2017, respectively.
Multiemployer Plans
NSP-Minnesota contributes to several union multiemployer pension and other postretirement benefit plans, none of which are individually significant. These plans provide pension and postretirement health care benefits to certain union employees who may perform services for multiple employers and do not participate in the NSP-Minnesota sponsored pension and postretirement health care plans. Contributing to these types of plans creates risk that differs from providing benefits under NSP-Minnesota sponsored plans, in that if another participating employer ceases to contribute to a multiemployer plan, additional unfunded obligations may need to be funded over time by remaining participating employers.
|
|
| 10. Commitments and Contingencies |
Legal
NSP-Minnesota is involved in various litigation matters that are being defended and handled in the ordinary course of business. Assessing whether a loss is probable or a reasonable possibility, and whether the loss or a range of loss is estimable, often involves complex judgments regarding future events. Management maintains accruals for losses that are probable of being incurred and subject to reasonable estimation.
Management may be unable to estimate an amount or range of a reasonably possible loss in certain situations, including when (1) the damages sought are indeterminate, (2) the proceedings are in the early stages, or (3) the matters involve novel or unsettled legal theories. In such cases, there is considerable uncertainty regarding the timing or ultimate resolution of such matters, including a possible eventual loss. For current proceedings not specifically reported herein, management does not anticipate the ultimate liabilities, if any, arising from such current proceedings would have a material effect on NSP-Minnesota’s financial statements. Unless otherwise required by GAAP, legal fees are expensed as incurred.
Rate Matters
MEC Acquisition — In November 2018, NSP-Minnesota reached an agreement with Southern Power Company (a subsidiary of Southern Company) to purchase MEC, a 760 MW natural gas combined cycle facility, with capacity and energy historically sold to NSP-Minnesota under PPAs expiring in 2026 and 2039, for approximately $650 million.
In September 2019, the MPUC denied NSP-Minnesota's request to purchase MEC as a rate base asset. In January 2020, the MPUC approved Xcel Energy’s plan to acquire MEC as a non-regulated investment and step into the terms of the existing PPAs with NSP-Minnesota. A newly formed non-regulated subsidiary of Xcel Energy completed the transaction to purchase MEC on Jan. 17, 2020.
Sherco — In NSP-Minnesota’s 2013 fuel reconciliation filing, the MPUC made recovery of replacement power costs associated with the 2011 incident at its Sherco Unit 3 plant provisional and subject to further review following conclusion of litigation commenced by NSP-Minnesota, SMMPA (Co-owner of Sherco Unit 3) and insurance companies against GE.
In 2018, NSP-Minnesota and SMMPA reached a settlement with GE. NSP-Minnesota notified the MPUC of its proposal to refund the GE settlement proceeds back to customers through the FCA. The insurance providers continued their litigation against GE and the case went to trial.
In 2018, GE prevailed in the lawsuit with the insurance companies, however, the jury found comparable fault, finding that GE was 52% and NSP-Minnesota was 48% at fault. At that point in the litigation, NSP-Minnesota was no longer involved in the case and was not present to make arguments about its role in the event. The specific issue leading to the fault apportionment was also not before the jury and not relevant to the outcome of the trial.
In January 2019, the DOC recommended that NSP-Minnesota refund $20 million of previously recovered purchased power costs to its customers, based on the jury’s apportionment of fault. The OAG recommended the MPUC withhold any decision until the underlying litigation by the insurance providers (currently under appeal) is concluded. The DOC subsequently filed comments agreeing with the OAG’s recommendation to withhold a decision pending the outcome of any appeals. NSP-Minnesota filed reply comments arguing that the DOC recommendations are without merit and that it acted prudently in operating the plant and its settlement with GE was reasonable.
In March 2019, MPUC approved NSP-Minnesota’s proposal to refund the GE settlement proceeds back to customers through the FCA. It also decided to withhold any decision as to NSP-Minnesota’s prudence in connection with the incident at Sherco Unit 3 until after conclusion of the pending litigation between GE and NSP-Minnesota’s insurers.
MISO ROE Complaints — In November 2013 and February 2015, customers filed complaints against MISO TOs including NSP-Minnesota and NSP-Wisconsin. The first complaint argued for a reduction in the base ROE in MISO transmission formula rates from 12.38% to 9.15%, and removal of ROE adders (including those for RTO membership). The second complaint sought to reduce base ROE from 12.38% to 8.67%. In September 2016, the FERC issued an order granting a 10.32% base ROE (10.82% with the RTO adder) effective for the first complaint period of Nov. 12, 2013 to Feb. 11, 2015 and subsequent to the date of the order. The D.C. Circuit subsequently vacated and remanded FERC Opinion No. 531, which had established the ROE methodology on which the September 2016 FERC order was based.
On March 21, 2019, FERC announced a NOI seeking public comments on whether, and if so how, to revise ROE policies in light of the D.C. Circuit Court decision. FERC also initiated a NOI on whether to revise its policies on incentives for electric transmission investments, including the RTO membership incentive. In November 2019, the FERC issued an order adopting a new ROE methodology and settling the MISO base ROE at 9.88% (10.38% with the RTO adder), effective Sept. 28, 2016 and for the Nov. 12, 2013 to Feb. 11, 2015 refund period. The FERC also dismissed the second complaint. In December 2019, MISO TOs filed a request for rehearing. Customers also filed requests for rehearing claiming, among other points, that the FERC erred by dismissing the second complaint without refunds. NSP-Minnesota has recognized a liability for its best estimate of final refunds to customers. It is uncertain when the FERC will act on the requests for rehearing or any other pending matters related to the 2019 NOIs.
Environmental
New and changing federal and state environmental mandates can create financial liabilities for NSP-Minnesota, which are normally recovered through the regulated rate process.
Site Remediation — Various federal and state environmental laws impose liability where hazardous substances or other regulated materials have been released to the environment. NSP-Minnesota may sometimes pay all or a portion of the cost to remediate sites where past activities of NSP-Minnesota’s predecessors or other parties have caused environmental contamination. Environmental contingencies could arise from various situations, including sites of former MGPs; and third-party sites, such as landfills, for which NSP-Minnesota is alleged to have sent wastes to that site.
MGP, Landfill or Disposal Sites — NSP-Minnesota is currently investigating or remediating 7 MGP, landfill or other disposal sites across its service territories. NSP-Minnesota has recognized its best estimate of costs/liabilities that will result from final resolution of these issues, however, the outcome and timing is unknown. In addition, there may be insurance recovery and/or recovery from other potentially responsible parties, offsetting a portion of costs incurred.
Environmental Requirements — Water and Waste
Coal Ash Regulation — NSP-Minnesota’s operations are subject to federal and state laws that impose requirements for handling, storage, treatment and disposal of solid waste. Under the CCR Rule, utilities are required to complete groundwater sampling around their CCR landfills and surface impoundments. Currently, NSP-Minnesota has 3 regulated ash units in operation.
NSP-Minnesota is conducting groundwater sampling and, where appropriate, initiating the assessment of corrective measures and evaluating whether corrective action is required at any CCR landfills or surface impoundments. To date, groundwater monitoring consistent with the CCR Rule has not identified results above the groundwater protection standards in the rule. Therefore, at this time no corrective action requirements have been triggered for these units under the rule.
In August 2018, the D.C. Circuit ruled that the EPA cannot allow utilities to continue to use unlined impoundments (including clay lined impoundments) for the storage or disposal of coal ash. In November 2019, the EPA proposed rules in response to this decision. If finalized in their current form, these rules would require NSP-Minnesota to expedite closure plans for 1 impoundment at an estimated cost of $2 million, and the construction of a new impoundment at an estimated cost of $8.6 million. In 2019, NSP-Minnesota initiated the construction of this new impoundment, an ash pond, expected to be in service in 2020. Upon placing the new ash pond in service, the existing ash pond will be taken out of service, and closure activities as prescribed by the CCR Rule and the facility’s National Pollutant Discharge Elimination System permit will be initiated.
Closure costs for existing impoundments are included in the calculation of the ARO liability. See ARO section of Note 10 for further information.
Federal CWA WOTUS Rule — In 2015, the EPA and Corps published a final rule that significantly broadened the scope of waters under the CWA that are subject to federal jurisdiction, referred to as “WOTUS”. In 2019, the EPA repealed the 2015 rule and published a draft replacement rule. Until a final rule is issued, NSP-Minnesota cannot estimate potential impacts, but anticipates costs will be recoverable through regulatory mechanisms.
Federal CWA ELG — In 2015, the EPA issued a final ELG rule for power plants that discharge treated effluent to surface waters as well as utility-owned landfills that receive CCRs. In 2017, the EPA delayed the compliance date for flue gas desulfurization wastewater and bottom ash transport until November 2020. After 2020, NSP-Minnesota estimates that ELG compliance will cost approximately $10.0 million to complete. The EPA, however, is conducting a rulemaking process to revise certain effluent limitations and pretreatment standards, which may impact compliance costs. NSP-Minnesota anticipates these costs will be fully recoverable through regulatory mechanisms.
Federal CWA Section 316(b) — The federal CWA requires the EPA to regulate cooling water intake structures to assure that these structures reflect the best technology available for minimizing impingement and entrainment of aquatic species. NSP-Minnesota estimates the likely cost for complying with impingement and entrainment requirements is approximately $35.6 million, to be incurred between 2020 and 2028. NSP-Minnesota believes 6 plants could be required by state regulators to make improvements to reduce impingement and entrainment. The exact total cost of the impingement and entrainment improvements is uncertain, but could be up to $191.6 million. NSP-Minnesota anticipates these costs will be fully recoverable through regulatory mechanisms.
Environmental Requirements — Air
Regional Haze Rules — The regional haze program requires sulfur dioxide, nitrogen oxide and particulate matter emission controls at power plants to reduce visibility impairment in national parks and wilderness areas. The program includes reasonable further progress. The requirements of the first regional haze plans developed by Minnesota have been approved and implemented.
AROs — AROs have been recorded for NSP-Minnesota’s assets. For nuclear assets, the ARO is associated with the decommissioning of NSP-Minnesota nuclear generating plants.
Aggregate fair value of NSP-Minnesota’s legally restricted assets, for funding future nuclear decommissioning, was $2.4 billion and $2.1 billion for 2019 and 2018, respectively.
NSP-Minnesota’s AROs were as follows:
|
| | | | | | | | | | | | | | | | | | | | | | | | |
| | | 2019 |
(Millions of Dollars) | | Jan. 1, 2019 | | Amounts Incurred (a) | | Amounts Settled (b) | | Accretion | | Cash Flow Revisions (c) | | Dec. 31, 2019 |
| Electric | | | | | | | | | | | | |
| Nuclear | | $ | 1,968.3 |
| | $ | — |
| | $ | — |
| | $ | 99.5 |
| | $ | — |
| | $ | 2,067.8 |
|
| Wind | | 104.9 |
| | 10.3 |
| | — |
| | 4.8 |
| | (6.9 | ) | | 113.1 |
|
| Steam and other production | | 49.2 |
| | — |
| | (3.2 | ) | | 1.8 |
| | (1.0 | ) | | 46.8 |
|
| Distribution | | 14.5 |
| | — |
| | — |
| | 0.6 |
| | — |
| | 15.1 |
|
| Miscellaneous | | 1.8 |
| | — |
| | — |
| | — |
| | (1.6 | ) | | 0.2 |
|
| Natural gas | | | | | | | | | | | | |
| Transmission and distribution | | 38.2 |
| | — |
| | — |
| | 1.6 |
| | (3.6 | ) | | 36.2 |
|
| Miscellaneous | | 0.2 |
| | — |
| | — |
| | 0.1 |
| | — |
| | 0.3 |
|
| Common | | | | | | | | | | | | |
| Miscellaneous | | 0.8 |
| | — |
| | — |
| | — |
| | — |
| | 0.8 |
|
| Total liability | | $ | 2,177.9 |
| | $ | 10.3 |
| | $ | (3.2 | ) | | $ | 108.4 |
| | $ | (13.1 | ) | | $ | 2,280.3 |
|
| |
(a) | Amounts incurred relate to the wind farms placed in service in 2019 (Lake Benton and Foxtail). |
| |
(b) | Amounts settled related to closure of certain ash containment facilities. |
| |
(c) | In 2019, AROs were revised for changes in timing and estimates of cash flows. Changes in wind AROs were driven by new dismantling studies. Changes in gas transmission and distribution AROs were primarily related to increased gas line mileage and number of services, which were more than offset by decreased inflation rates. Changes in steam and other production AROs primarily related to the cost estimates to remediate ponds at production facilities. |
|
| | | | | | | | | | | | | | | | | | | | |
| | | 2018 |
(Millions of Dollars) | | Jan. 1, 2018 | | Amounts Settled (a) | | Accretion | | Cash Flow Revisions (b) | | Dec. 31, 2018 (c) |
| Electric | | | | | | | | | | |
| Nuclear | | $ | 1,873.6 |
| | $ | — |
| | $ | 94.7 |
| | $ | — |
| | $ | 1,968.3 |
|
| Wind | | 94.1 |
| | — |
| | 4.3 |
| | 6.5 |
| | 104.9 |
|
Steam and other production | | 64.0 |
| | (6.6 | ) | | 2.1 |
| | (10.3 | ) | | 49.2 |
|
| Distribution | | 5.8 |
| | — |
| | 0.2 |
| | 8.5 |
| | 14.5 |
|
| Miscellaneous | | 1.9 |
| | — |
| | — |
| | (0.1 | ) | | 1.8 |
|
| Natural gas | | | | | | | | | | |
Transmission and distribution | | 43.6 |
| | — |
| | 1.8 |
| | (7.2 | ) | | 38.2 |
|
| Miscellaneous | | 0.2 |
| | — |
| | — |
| | — |
| | 0.2 |
|
| Common | | | | | | | | | | |
| Miscellaneous | | 0.7 |
| | — |
| | 0.1 |
| | — |
| | 0.8 |
|
| Total liability | | $ | 2,083.9 |
| | $ | (6.6 | ) | | $ | 103.2 |
| | $ | (2.6 | ) | | $ | 2,177.9 |
|
| |
(a) | Amounts settled related to asbestos abatement projects and closure of certain ash containment facilities. |
| |
(b) | In 2018, AROs were revised for changes in timing and estimates of cash flows. Changes in gas transmission and distribution AROs were mainly related to increased gas line mileage and number of services, which were more than offset by increased discount rates. Changes in electric distribution AROs primarily related to increased labor costs. |
| |
(c) | There were 0 ARO amounts incurred in 2018. |
Indeterminate AROs — Outside of the recorded asbestos AROs, other plants or buildings may contain asbestos due to the age of many of NSP-Minnesota’s facilities, but no confirmation or measurement of the cost of removal could be determined as of Dec. 31, 2019. Therefore, an ARO has not been recorded for these facilities.
Removal Costs — NSP-Minnesota records a regulatory liability for the plant removal costs that are recovered currently in rates. Removal costs have accumulated based on varying rates as authorized by the appropriate regulatory entities. NSP-Minnesota has estimated the amount of removal costs accumulated through historic depreciation expense based on current factors used in the existing depreciation rates. Removal costs as of Dec. 31, 2019 and 2018 were $520.3 million and $484.6 million, respectively.
Nuclear Related
Nuclear Insurance — NSP-Minnesota’s public liability for claims from any nuclear incident is limited to $13.9 billion under the Price-Anderson amendment to the Atomic Energy Act. NSP-Minnesota has secured $450.0 million of coverage for its public liability exposure with a pool of insurance companies. The remaining $13.5 billion of exposure is funded by the Secondary Financial Protection Program, available from assessments by the federal government.
NSP-Minnesota is subject to assessments of up to $137.6 million per reactor-incident for each of its 3 licensed reactors, for public liability arising from a nuclear incident at any licensed nuclear facility in the United States. The maximum funding requirement is $20.5 million per reactor-incident during any one year. Maximum assessments are subject to inflation adjustments by the NRC and state premium taxes. The NRC’s last adjustment was effective November 2018.
NSP-Minnesota purchases insurance for property damage and site decontamination cleanup costs from NEIL and EMANI. The coverage limits are $2.7 billion for each of NSP-Minnesota’s 2 nuclear plant sites. NEIL also provides business interruption insurance coverage up to $350.0 million, including the cost of replacement power during prolonged accidental outages of nuclear generating units. Premiums are expensed over the policy term.
All companies insured with NEIL are subject to retroactive premium adjustments if losses exceed accumulated reserve funds. Capital has been accumulated in the reserve funds of NEIL and EMANI to the extent that NSP-Minnesota would have no exposure for retroactive premium assessments in case of a single incident under the business interruption and the property damage insurance coverage. NSP-Minnesota could be subject to annual maximum assessments of approximately $12.0 million for business interruption insurance and $35.1 million for property damage insurance if losses exceed accumulated reserve funds.
Nuclear Fuel Disposal — NSP-Minnesota is responsible for temporarily storing spent nuclear fuel from its nuclear plants. The DOE is responsible for permanently storing spent fuel from U.S. nuclear plants, but no such facility is yet available.
NSP-Minnesota owns temporary on-site storage facilities for spent fuel at its Monticello and PI nuclear plants, which consist of storage pools and dry cask facilities. The Monticello dry-cask storage facility currently stores all 30 of the authorized canisters. The PI dry-cask storage facility currently stores 44 of the 64 authorized casks. Monticello’s future spent fuel will continue to be placed in its spent fuel pool. The decommissioning plan addresses the disposition of spent fuel at the end of the licensed life.
Regulatory Plant Decommissioning Recovery — Decommissioning activities for NSP-Minnesota’s nuclear facilities are planned to begin at the end of each unit’s operating license and be completed by 2091. NSP-Minnesota’s current operating licenses allow continued use of its Monticello nuclear plant until 2030 and its PI nuclear plant until 2033 for Unit 1 and 2034 for Unit 2.
Future decommissioning costs of nuclear facilities are estimated through triennial periodic studies that assess the costs and timing of planned nuclear decommissioning activities for each unit.
Obligations for decommissioning are expected to be funded 100% by the external decommissioning trust fund. The cost study assumes the external decommissioning fund will earn an after-tax return between 5.23% and 6.30%. Realized and unrealized gains on fund investments are deferred as an offset of NSP-Minnesota’s regulatory asset for nuclear decommissioning costs. Decommissioning costs are quantified in 2014 dollars. Escalation rates are 4.36% for plant removal activities and 3.36% for fuel management and site restoration activities.
NSP-Minnesota had $2.4 billion of assets held in external decommissioning trusts at Dec. 31, 2019. The following table summarizes the funded status of NSP-Minnesota’s decommissioning obligation. Xcel Energy believes future decommissioning costs will continue to be recovered in customer rates. The following amounts were prepared on a regulatory basis and not directly recorded in the financial statements as an ARO.
|
| | | | | | | | |
| | | Regulatory Basis |
| (Millions of Dollars) | | 2019 | | 2018 |
| Estimated decommissioning cost obligation from most recently approved study (in 2014 dollars) | | $ | 3,012.3 |
| | $ | 3,012.3 |
|
| Effect of escalating costs | | 688.2 |
| | 538.9 |
|
| Estimated decommissioning cost obligation (in current dollars) | | 3,700.5 |
| | 3,551.2 |
|
| Effect of escalating costs to payment date | | 7,505.0 |
| | 7,654.3 |
|
| Estimated future decommissioning costs (undiscounted) | | 11,205.5 |
| | 11,205.5 |
|
| Effect of discounting obligation (using average risk-free interest rate of 2.39% and 3.33% for 2019 and 2018, respectively) | | (5,562.2 | ) | | (6,911.5 | ) |
| Discounted decommissioning cost obligation | | $ | 5,643.3 |
| | $ | 4,294.0 |
|
| Assets held in external decommissioning trust | | $ | 2,439.6 |
| | $ | 2,054.7 |
|
| Underfunding of external decommissioning fund compared to the discounted decommissioning obligation | | 3,203.7 |
| | 2,239.3 |
|
Calculations and data used by the regulator in approving NSP-Minnesota’s rates are useful in assessing future cash flows. Regulatory basis information is a means to reconcile amounts previously provided to the MPUC and utilized for regulatory purposes to amounts used for financial reporting.
Reconciliation of the discounted decommissioning cost obligation - regulated basis to the ARO recorded in accordance with GAAP:
|
| | | | | | | | |
| (Millions of Dollars) | | 2019 | | 2018 |
| Discounted decommissioning cost obligation - regulated basis | | $ | 5,643.3 |
| | $ | 4,294.0 |
|
| Differences in discount rate and market risk premium | | (2,295.2 | ) | | (1,446.4 | ) |
| O&M costs not included for GAAP | | (1,280.3 | ) | | (879.3 | ) |
| Nuclear production decommissioning ARO - GAAP | | $ | 2,067.8 |
| | $ | 1,968.3 |
|
Decommissioning expenses recognized as a result of regulation: |
| | | | | | | | | | | | |
| (Millions of Dollars) | | 2019 | | 2018 | | 2017 |
Annual decommissioning recorded as depreciation expense: (a) (b) | | $ | 20.4 |
| | $ | 20.4 |
| | $ | 20.4 |
|
| |
(a) | Decommissioning expense does not include depreciation of the capitalized nuclear asset retirement costs. |
| |
(b) | Decommissioning expenses in 2019, 2018 and 2017 include Minnesota’s retail jurisdiction annual funding requirement of approximately $14.0 million. |
The 2014 nuclear decommissioning filing, approved in 2015, was used for regulatory presentation in 2019, 2018 and 2017. The 2017 filing, effective Jan. 1, 2019, has been approved by the MPUC. In December 2019, the MPUC verbally approved for NSP-Minnesota to delay any increase to the annual funding requirement until 2021.
Leases
NSP-Minnesota evaluates contracts that may contain leases, including PPAs and arrangements for the use of office space and other facilities, vehicles and equipment. Under ASC Topic 842, adopted by NSP-Minnesota on Jan. 1, 2019, a contract contains a lease if it conveys the exclusive right to control the use of a specific asset. A contract determined to contain a lease is evaluated further to determine if the arrangement is a finance lease.
ROU assets represent NSP-Minnesota's rights to use leased assets. Starting in 2019, the present value of future operating lease payments are recognized in current and noncurrent operating lease liabilities. These amounts, adjusted for any prepayments or incentives, are recognized as operating lease ROU assets.
Most of NSP-Minnesota’s leases do not contain a readily determinable discount rate. Therefore, the present value of future lease payments is generally calculated using the estimated incremental borrowing rate (weighted-average of 3.8%).
NSP-Minnesota has elected to utilize the practical expedient under which non-lease components, such as asset maintenance costs included in payments, are not deducted from minimum lease payments for the purposes of lease accounting and disclosure.
Leases with an initial term of 12 months or less are classified as short-term leases and are not recognized on the consolidated balance sheet.
Operating lease ROU assets:
|
| | | | |
| (Millions of Dollars) | | Dec. 31, 2019 |
| PPAs | | $ | 556.3 |
|
| Other | | 72.2 |
|
| Gross operating lease ROU assets | | 628.5 |
|
| Accumulated amortization | | (64.7 | ) |
| Net operating lease ROU assets | | $ | 563.8 |
|
Components of lease expense:
|
| | | | | | | | | | | | |
| (Millions of Dollars) | | 2019 | | 2018 | | 2017 |
| Operating leases | | | | | | |
| PPA capacity payments | | $ | 75.9 |
| | $ | 62.5 |
| | $ | 62.7 |
|
Other operating leases (a) | | 9.1 |
| | 13.7 |
| | 14.2 |
|
Total operating lease expense (b) | | $ | 85.0 |
| | $ | 76.2 |
| | $ | 76.9 |
|
| |
(a) | Includes short-term lease expense of $1.4 million, $2.0 million and $2.7 million for 2019, 2018 and 2017, respectively. |
| |
(b) | PPA capacity payments are included in electric fuel and purchased power on the consolidated statements of income. Expense for other operating leases is included in O&M expense and electric fuel and purchased power. |
Commitments under operating leases as of Dec. 31, 2019:
|
| | | | | | | | | | | | |
| (Millions of Dollars) | | PPA (a) (b) Operating Leases | | Other Operating Leases | | Total
Operating Leases |
| 2020 | | $ | 93.5 |
| | $ | 7.9 |
| | $ | 101.4 |
|
| 2021 | | 94.9 |
| | 8.0 |
| | 102.9 |
|
| 2022 | | 96.4 |
| | 11.9 |
| | 108.3 |
|
| 2023 | | 97.9 |
| | 7.0 |
| | 104.9 |
|
| 2024 | | 99.5 |
| | 6.8 |
| | 106.3 |
|
| Thereafter | | 119.8 |
| | 44.9 |
| | 164.7 |
|
| Total minimum obligation | | 602.0 |
| | 86.5 |
| | 688.5 |
|
| Interest component of obligation | | (66.2 | ) | | (16.7 | ) | | (82.9 | ) |
| Present value of minimum obligation | | $ | 535.8 |
| | $ | 69.8 |
| | 605.6 |
|
| Less current portion | | | | | | (79.9 | ) |
| Noncurrent operating lease liabilities | | | | | | $ | 525.7 |
|
| | | | | | | |
| Weighted-average remaining lease term in years | | | | | | 6.7 |
|
| |
(a) | Amounts do not include PPAs accounted for as executory contracts and/or contingent payments, such as energy payments on renewable PPAs. |
| |
(b) | PPA operating leases contractually expire at various dates through 2026. |
Commitments under operating leases as of Dec. 31, 2018:
|
| | | | | | | | | | | | |
| (Millions of Dollars) | | PPA (a) (b)
Operating
Leases | | Other Operating Leases | | Total
Operating Leases |
| 2019 | | $ | 65.0 |
| | $ | 13.5 |
| | $ | 78.5 |
|
| 2020 | | 66.1 |
| | 8.4 |
| | 74.5 |
|
| 2021 | | 67.1 |
| | 8.4 |
| | 75.5 |
|
| 2022 | | 68.2 |
| | 8.1 |
| | 76.3 |
|
| 2023 | | 69.3 |
| | 7.3 |
| | 76.6 |
|
| Thereafter | | 143.5 |
| | 36.0 |
| | 179.5 |
|
| |
(a) | Amounts do not include PPAs accounted for as executory contracts and/or contingent payments, such as energy payments on renewable PPAs. |
| |
(b) | PPA operating leases contractually expire at various dates through 2026. |
PPAs and Fuel Contracts
Non-Lease PPAs — NSP-Minnesota has entered into PPAs with other utilities and energy suppliers with various expiration dates through 2033 for purchased power to meet system load and energy requirements, operating reserve obligations and as part of wholesale and commodity trading activities. In general, these agreements provide for energy payments, based on actual energy delivered and capacity payments. Certain PPAs accounted for as executory contracts contain minimum energy purchase commitments, and total energy payments on those contracts were $102.4 million, $104.7 million and $96.7 million in 2019, 2018 and 2017, respectively.
Included in electric fuel and purchased power expenses for PPAs accounted for as executory contracts were payments for capacity of $53.8 million, $52.7 million and $84.1 million in 2019, 2018 and 2017, respectively.
Capacity and energy payments are contingent on the IPPs meeting contract obligations, including plant availability requirements. Certain contractual payments are adjusted based on market indices. The effects of price adjustments on financial results are mitigated through purchased energy cost recovery mechanisms.
At Dec. 31, 2019, the estimated future payments for capacity and energy that NSP-Minnesota is obligated to purchase pursuant to these executory contracts, subject to availability, were as follows:
|
| | | | | | | | |
| (Millions of Dollars) | | Capacity | | Energy (a) |
| 2020 | | $ | 54.5 |
| | $ | 109.4 |
|
| 2021 | | 62.2 |
| | 157.3 |
|
| 2022 | | 61.3 |
| | 172.9 |
|
| 2023 | | 62.8 |
| | 176.9 |
|
| 2024 | | 64.5 |
| | 181.8 |
|
| Thereafter | | 45.4 |
| | 146.3 |
|
Total (b) | | $ | 350.7 |
| | $ | 944.6 |
|
| |
(a) | Excludes contingent energy payments for renewable energy PPAs. |
| |
(b) | Includes amounts allocated to NSP-Wisconsin through intercompany charges. |
Fuel Contracts — NSP-Minnesota has entered into various long-term commitments for the purchase and delivery of a significant portion of its coal, nuclear fuel and natural gas requirements. These contracts expire in various years between 2020 and 2037. NSP-Minnesota is required to pay additional amounts depending on actual quantities shipped under these agreements.
Estimated minimum purchases for these contracts as of Dec. 31, 2019: |
| | | | | | | | | | | | | | | | |
| (Millions of Dollars) | | Coal | | Nuclear fuel | | Natural gas
supply | | Natural gas
storage and
transportation |
| 2020 | | $ | 171.3 |
| | $ | 53.8 |
| | $ | 36.8 |
| | $ | 133.0 |
|
| 2021 | | 85.2 |
| | 102.5 |
| | 1.4 |
| | 129.8 |
|
| 2022 | | 51.9 |
| | 85.3 |
| | 0.8 |
| | 124.3 |
|
| 2023 | | 35.1 |
| | 103.0 |
| | — |
| | 107.8 |
|
| 2024 | | 0.9 |
| | 74.5 |
| | — |
| | 101.1 |
|
| Thereafter | | 2.6 |
| | 275.1 |
| | — |
| | 273.6 |
|
Total (a) | | $ | 347.0 |
| | $ | 694.2 |
| | $ | 39.0 |
| | $ | 869.6 |
|
| |
(a) | Includes amounts allocated to NSP-Wisconsin through intercompany charges. |
VIEs
Under certain PPAs, NSP-Minnesota purchases power from IPPs for which NSP-Minnesota is required to reimburse fuel costs, or to participate in tolling arrangements under which NSP-Minnesota procures the natural gas required to produce the energy that it purchases. NSP-Minnesota has determined that certain IPPs are VIEs. NSP-Minnesota is not subject to risk of loss from the operations of these entities, and no significant financial support is required other than contractual payments for energy and capacity. NSP-Minnesota evaluated each of these VIEs for possible consolidation, including review of qualitative factors such as the length and terms of the contract, control over O&M, control over dispatch of electricity, historical and estimated future fuel and electricity prices, and financing activities.
NSP-Minnesota concluded that these entities are not required to be consolidated in its consolidated financial statements because it does not have the power to direct the activities that most significantly impact the entities’ economic performance. NSP-Minnesota had approximately 1,347 MW and 1,002 MW of capacity under long-term PPAs at Dec. 31, 2019 and 2018, respectively, with entities that have been determined to be VIEs. These agreements have expiration dates through 2039.
|
|
| 11. Other Comprehensive Income |
Changes in accumulated other comprehensive loss, net of tax, for the years ended Dec. 31: |
| | | | | | | | | | | | |
| | | 2019 |
| (Millions of Dollars) | | Gains and Losses on Cash Flow Hedges | | Defined Benefit Pension and Postretirement Items | | Total |
| Accumulated other comprehensive loss at Jan. 1 | | $ | (20.2 | ) | | $ | (2.9 | ) | | $ | (23.1 | ) |
| Other comprehensive loss before reclassifications (net of taxes of $0 and $(0.1) respectively) | | — |
| | (0.4 | ) | | (0.4 | ) |
| Losses reclassified from net accumulated other comprehensive loss: | | | | | | |
Interest rate derivatives (net of taxes of $0.3 and $0, respectively) (a) | | 0.8 |
| (a) | — |
| | 0.8 |
|
| Amortization of net actuarial loss (net of taxes of $0 and $0.1, respectively) | | — |
| | 0.2 |
| (b) | 0.2 |
|
| Net current period other comprehensive income (loss) | | 0.8 |
| | (0.2 | ) | | 0.6 |
|
| Accumulated other comprehensive loss at Dec. 31 | | $ | (19.4 | ) | | $ | (3.1 | ) | | $ | (22.5 | ) |
| |
(a) | Included in interest charges. |
| |
(b) | Included in the computation of net periodic pension and postretirement benefit costs. See Note 9 for further information. |
|
| | | | | | | | | | | | | | | | |
| | | 2018 |
| (Millions of Dollars) | | Gains and Losses on Cash Flow Hedges | | Unrealized Gains and Losses on Marketable Securities | | Defined Benefit Pension and Postretirement Items | | Total |
| Accumulated other comprehensive (loss) income at Jan. 1 | | $ | (20.9 | ) | | $ | 0.1 |
| | $ | (3.7 | ) | | $ | (24.5 | ) |
| Other comprehensive (loss) income before reclassifications (net of taxes of $0, $0 and $0.3, respectively) | | — |
| | (0.1 | ) | | 0.6 |
| | 0.5 |
|
| Losses reclassified from net accumulated other comprehensive loss: | | | | | | | | |
| Interest rate derivatives (net of taxes of $0.3, $0 and $0, respectively) | | 0.7 |
| (a) | — |
| | — |
| | 0.7 |
|
| Amortization of net actuarial loss (net of taxes of $0, $0 and $0.1, respectively) | | — |
| | — |
| | 0.2 |
| (b) | 0.2 |
|
| Net current period other comprehensive income (loss) | | 0.7 |
| | (0.1 | ) | | 0.8 |
| | 1.4 |
|
| Accumulated other comprehensive loss at Dec. 31 | | $ | (20.2 | ) | | $ | — |
| | $ | (2.9 | ) | | $ | (23.1 | ) |
| |
(a) | Included in interest charges. |
| |
(b) | Included in the computation of net periodic pension and postretirement benefit costs. See Note 9 for further information. |
|
|
| 12. Segments and Related Information |
NSP-Minnesota evaluates performance based on profit or loss generated from the product or service provided. These segments are managed separately because the revenue streams are dependent upon regulated rate recovery, which is separately determined for each segment.
NSP-Minnesota has the following reportable segments:
| |
| • | Regulated Electric — The regulated electric utility segment generates electricity which is transmitted and distributed in Minnesota, North Dakota and South Dakota. In addition, this segment includes sales for resale and provides wholesale transmission service to various entities in the United States. The regulated electric utility segment also includes NSP-Minnesota’s wholesale commodity and trading operations; and |
| |
| • | Regulated Natural Gas — The regulated natural gas utility segment transports, stores and distributes natural gas in portions of Minnesota and North Dakota. |
NSP-Minnesota presents Other, which includes operating segments, with revenues below the necessary quantitative thresholds. Those operating segments primarily include appliance repair services, non-utility real estate activities and revenues associated with processing solid waste into refuse-derived fuel.
Asset and capital expenditure information is not provided for NSP-Minnesota’s reportable segments because as an integrated electric and natural gas utility, NSP-Minnesota operates significant assets that are not dedicated to a specific business segment, and reporting assets and capital expenditures by business segment would require arbitrary and potentially misleading allocations, which may not necessarily reflect the assets that would be required for the operation of the business segments on a stand-alone basis.
To report income from operations for regulated electric and regulated natural gas utility segments, the majority of costs are directly assigned to each segment. However, some costs, such as common depreciation, common O&M expenses and interest expense are allocated based on cost causation allocators. A general allocator is used for certain general and administrative expenses, including office supplies, rent, property insurance and general advertising.
NSP-Minnesota’s segment information is as follows:
|
| | | | | | | | | | | | |
| (Millions of Dollars) | | 2019 | | 2018 | | 2017 |
| Regulated Electric | | | | | | |
Operating revenues (a) | | $ | 4,506.6 |
| | $ | 4,508.0 |
| | $ | 4,541.7 |
|
| Intersegment revenues | | 0.6 |
| | 0.8 |
| | 0.6 |
|
| Total operating revenue | | $ | 4,507.2 |
| | $ | 4,508.8 |
| | $ | 4,542.3 |
|
| Depreciation and amortization | | 742.1 |
| | 697.8 |
| | 661.3 |
|
| Interest charges and financing costs | | 205.3 |
| | 199.5 |
| | 199.8 |
|
| Income tax expense | | 36.1 |
| | 16.4 |
| | 179.9 |
|
| Net income | | 491.0 |
| | 450.4 |
| | 462.5 |
|
| Regulated Natural Gas | | | | | | |
Operating revenues (a) | | $ | 571.3 |
| | $ | 583.1 |
| | $ | 531.9 |
|
| Intersegment revenues | | 0.8 |
| | 0.5 |
| | 0.5 |
|
| Total operating revenue | | $ | 572.1 |
| | $ | 583.6 |
| | $ | 532.4 |
|
| Depreciation and amortization | | 48.8 |
| | 43.3 |
| | 38.7 |
|
| Interest charges and financing costs | | 15.6 |
| | 14.8 |
| | 13.5 |
|
| Income tax expense | | 12.4 |
| | 10.2 |
| | 10.0 |
|
| Net income | | 40.0 |
| | 34.2 |
| | 28.4 |
|
| Other | | | | | | |
Operating revenues (a) | | $ | 33.9 |
| | $ | 30.8 |
| | $ | 28.4 |
|
| Depreciation and amortization | | 0.4 |
| | 0.5 |
| | 0.6 |
|
| Interest charges and financing costs | | — |
| | — |
| | — |
|
| Income tax expense | | (1.1 | ) | | 0.6 |
| | 9.8 |
|
| Net income (loss) | | 11.6 |
| | 7.7 |
| | (0.8 | ) |
| | | | | | | |
| Consolidated Total | | | | | | |
Total operating revenue (a) | | $ | 5,113.2 |
| | $ | 5,123.2 |
| | $ | 5,103.1 |
|
| Reconciling eliminations | | (1.4 | ) | | (1.3 | ) | | (1.1 | ) |
| Consolidated total revenue | | $ | 5,111.8 |
| | $ | 5,121.9 |
| | $ | 5,102.0 |
|
| Depreciation and amortization | | 791.3 |
| | 741.6 |
| | 700.6 |
|
| Interest charges and financing costs | | 220.9 |
| | 214.3 |
| | 213.3 |
|
| Income tax expense | | 47.4 |
| | 27.2 |
| | 199.7 |
|
| Net income | | 542.6 |
| | 492.3 |
| | 490.1 |
|
| |
(a) | Operating revenues include $457.4 million, $473.7 million, and $490.2 million of intercompany revenue for the years ended Dec. 31, 2019, 2018 and 2017, respectively. See Note 13 for further information. |
|
|
| 13. Related Party Transactions |
Xcel Energy Services Inc. provides management, administrative and other services for the subsidiaries of Xcel Energy Inc., including NSP-Minnesota. The services are provided and billed to each subsidiary in accordance with service agreements executed by each subsidiary. NSP-Minnesota uses the services provided by Xcel Energy Services Inc. whenever possible. Costs are charged directly to the subsidiary and are allocated if they cannot be directly assigned.
Xcel Energy Inc., NSP-Minnesota, PSCo and SPS have established a utility money pool arrangement.
See Note 5 for further information.
The electric production and transmission costs of the entire NSP System are shared by NSP-Minnesota and NSP-Wisconsin. The Interchange Agreement provides for the sharing of all costs of generation and transmission facilities of the system, including capital costs.
Significant affiliate transactions among the companies and related parties including billings under the Interchange Agreement for the years ended Dec. 31:
|
| | | | | | | | | | | | |
| (Millions of Dollars) | | 2019 | | 2018 | | 2017 |
| Operating revenues: | | | | | | |
| Electric | | $ | 457.4 |
| | $ | 473.7 |
| | $ | 490.2 |
|
| Gas | | 0.5 |
| | — |
| | — |
|
| Operating expenses: | | | | | | |
| Purchased power | | 60.5 |
| | 61.1 |
| | 66.8 |
|
| Transmission expense | | 116.2 |
| | 96.8 |
| | 110.5 |
|
| Other operating expenses — paid to Xcel Energy Services Inc. | | 533.2 |
| | 534.8 |
| | 539.4 |
|
| Interest expense | | 0.7 |
| | 0.3 |
| | — |
|
Accounts receivable and payable with affiliates at Dec. 31 were:
|
| | | | | | | | | | | | | | | | |
| | | 2019 | | 2018 |
| (Millions of Dollars) | | Accounts Receivable | | Accounts Payable | | Accounts Receivable | | Accounts Payable |
| NSP-Wisconsin | | $ | 7.9 |
| | $ | — |
| | $ | 11.0 |
| | $ | — |
|
| PSCo | | — |
| | 18.8 |
| | — |
| | 17.9 |
|
| SPS | | — |
| | 4.2 |
| | — |
| | 4.7 |
|
| Other subsidiaries of Xcel Energy Inc. | | 35.9 |
| | 53.0 |
| | — |
| | 87.1 |
|
| | | $ | 43.8 |
| | $ | 76.0 |
| | $ | 11.0 |
| | $ | 109.7 |
|
|
|
| 14. Summarized Quarterly Financial Data (Unaudited) |
|
| | | | | | | | | | | | | | | | |
| | | Quarter Ended |
| (Millions of Dollars) | | March 31, 2019 | | June 30, 2019 | | Sept. 30, 2019 | | Dec. 31, 2019 |
| Operating revenues | | $ | 1,350.5 |
| | $ | 1,185.0 |
| | $ | 1,344.6 |
| | $ | 1,231.7 |
|
| Operating income | | 167.3 |
| | 147.3 |
| | 291.0 |
| | 181.3 |
|
| Net income | | 113.2 |
| | 95.9 |
| | 208.6 |
| | 124.9 |
|
|
| | | | | | | | | | | | | | | | |
| | | Quarter Ended |
| (Millions of Dollars) | | March 31, 2018 | | June 30, 2018 | | Sept. 30, 2018 | | Dec. 31, 2018 |
| Operating revenues | | $ | 1,310.8 |
| | $ | 1,187.7 |
| | $ | 1,351.8 |
| | $ | 1,271.6 |
|
Operating income (a) | | 171.4 |
| | 150.1 |
| | 259.5 |
| | 135.5 |
|
| Net income | | 111.7 |
| | 92.4 |
| | 201.2 |
| | 87.0 |
|
| |
| (a) | In 2018, NSP-Minnesota implemented ASU No. 2017-07 related to net periodic benefit cost, which resulted in retrospective reclassification of pension costs from O&M expense to other income. |
|
|
ITEM 9 — CHANGES IN AND DISAGREEMENTS IN AND DISAGREEMENTS WITH ACCOUNTANTS ON ACCOUNTING AND FINANCIAL DISCLOSURE |
None.
|
|
ITEM 9A — CONTROLS AND PROCEDURES |
Disclosure Controls and Procedures
NSP-Minnesota maintains a set of disclosure controls and procedures designed to ensure that information required to be disclosed in reports that it files or submits under the Securities Exchange Act of 1934 is recorded, processed, summarized, and reported within the time periods specified in SEC rules and forms.
In addition, the disclosure controls and procedures ensure that information required to be disclosed is accumulated and communicated to management, including the CEO and CFO, allowing timely decisions regarding required disclosure. As of Dec. 31, 2019, based on an evaluation carried out under the supervision and with the participation of NSP-Minnesota’s management, including the CEO and CFO, of the effectiveness of its disclosure controls and procedures, the CEO and CFO have concluded that NSP-Minnesota’s disclosure controls and procedures were effective.
Internal Control Over Financial Reporting
No changes in NSP-Minnesota’s internal control over financial reporting occurred during the most recent fiscal quarter that materially affected, or are reasonably likely to materially affect, NSP-Minnesota’s internal control over financial reporting. NSP-Minnesota maintains internal control over financial reporting to provide reasonable assurance regarding the reliability of the financial reporting. NSP-Minnesota has evaluated and documented its controls in process activities, general computer activities, and on an entity-wide level.
During the year and in preparation for issuing its report for the year ended Dec. 31, 2019 on internal controls under section 404 of the Sarbanes-Oxley Act of 2002, NSP-Minnesota conducted testing and monitoring of its internal control over financial reporting. Based on the control evaluation, testing and remediation performed, NSP-Minnesota did not identify any material control weaknesses, as defined under the standards and rules issued by the Public Company Accounting Oversight Board, as approved by the SEC and as indicated in NSP-Minnesota’s Management Report on Internal Controls over Financial Reporting, which is contained in Item 8 herein.
This annual report does not include an attestation report of NSP-Minnesota’s independent registered public accounting firm regarding internal control over financial reporting. Management’s report was not subject to attestation by NSP-Minnesota’s independent registered public accounting firm pursuant to the rules of the SEC that permit NSP-Minnesota to provide only management’s report in this annual report.
|
|
ITEM 9B — OTHER INFORMATION |
None.
PART III
Items 10, 11, 12 and 13 of Part III of Form 10-K have been omitted from this report for NSP-Minnesota in accordance with conditions set forth in general instructions I(1)(a) and (b) of Form 10-K for wholly-owned subsidiaries.
|
|
ITEM 10 — DIRECTORS, EXECUTIVE OFFICERS AND CORPORATE GOVERNANCE |
|
|
ITEM 11 — EXECUTIVE COMPENSATION |
|
|
ITEM 12 — SECURITY OWNERSHIP OF CERTAIN BENEFICIAL OWNERS AND MANAGEMENT AND RELATED STOCKHOLDER MATTERS |
|
|
ITEM 13 — CERTAIN RELATIONSHIP AND RELATED TRANSACTIONS, AND DIRECTOR INDEPENDENCE |
Information required under this Item is contained in Xcel Energy Inc.’s definitive Proxy Statement for its 2020 Annual Meeting of Shareholders, which is incorporated by reference.
|
|
ITEM 14 — PRINCIPAL ACCOUNTANT FEES AND SERVICES |
The information required by Item 14 of Form 10-K is set forth under the heading “Independent Registered Public Accounting Firm - Audit and Non-Audit Fees” in Xcel Energy Inc.’s definitive Proxy Statement for the 2020 Annual Meeting of Shareholders which definitive Proxy Statement is expected to be filed with the SEC on or about April 6, 2020. Such information set forth under such heading is incorporated herein by this reference hereto.
|
|
ITEM 15 — EXHIBITS, FINANCIAL STATEMENT SCHEDULES |
|
| |
| 1 | Consolidated Financial Statements: |
| | |
| | Management Report on Internal Controls Over Financial Reporting — For the year ended Dec. 31, 2019. |
| | Report of Independent Registered Public Accounting Firm — Financial Statements |
| | Consolidated Statements of Income — For the three years ended Dec. 31, 2019, 2018 and 2017. |
| | Consolidated Statements of Comprehensive Income — For the three years ended Dec. 31, 2019, 2018 and 2017. |
| | Consolidated Statements of Cash Flows — For the three years ended Dec. 31, 2019, 2018 and 2017. |
| | Consolidated Balance Sheets — As of Dec. 31, 2019 and 2018. |
| | Consolidated Statements of Common Stockholder’s Equity — For the three years ended Dec. 31, 2019, 2018 and 2017. |
| | |
| 2 | Schedule II — Valuation and Qualifying Accounts and Reserves for the years ended Dec. 31, 2019, 2018 and 2017. |
| | |
| 3 | Exhibits |
| | |
| * | Indicates incorporation by reference |
| + | Executive Compensation Arrangements and Benefit Plans Covering Executive Officers and Directors |
|
| | | | |
| Exhibit Number | Description | Report or Registration Statement | SEC File or Registration Number | Exhibit Reference |
| | NSP-Minnesota Form 10-12G dated Oct. 5, 2000 | 000-31709 | 3.01 |
| | NSP-Minnesota Form 10-K for the year ended Dec. 31, 2018 | 001-31387 | 3.02 |
| | Xcel Energy Inc. Form S-3 dated April 18, 2018 | 001-03034 | 4(b)(3) |
| | Xcel Energy Inc. Form 10-K for the year ended Dec. 31, 2017 | 001-03034 | 4.11 |
| | Xcel Energy Inc. Form 10-K for the year ended Dec. 31, 2017 | 001-03034 | 4.12 |
| | NSP-Minnesota Form 10-12G dated Oct. 5, 2000 | 000-31709 | 4.51 |
| | Xcel Energy Inc. Form S-3 dated April 18, 2018 | 001-03034 | 4(b)(7) |
| | NSP-Minnesota Form 10-12G dated Oct. 5, 2000 | 000-31709 | 4.63 |
| | NSP-Minnesota Form 8-K dated July 14, 2005 | 001-31387 | 4.01 |
| | NSP-Minnesota Form 8-K dated May 18, 2006 | 001-31387 | 4.01 |
| | NSP-Minnesota Form 8-K dated June 19, 2007 | 001-31387 | 4.01 |
| | NSP-Minnesota Form 8-K dated Nov. 16, 2009 | 001-31387 | 4.01 |
| | NSP-Minnesota Form 8-K dated Aug. 4, 2010 | 001-31387 | 4.01 |
| | NSP-Minnesota Form 8-K dated Aug. 13, 2012 | 001-31387 | 4.01 |
| | NSP-Minnesota Form 8-K dated May 20, 2013 | 001-31387 | 4.01 |
|
| | | | |
| | NSP-Minnesota Form 8-K dated May 13, 2014 | 001-31387 | 4.01 |
| | NSP-Minnesota Form 8-K dated Aug. 11, 2015 | 001-31387 | 4.01 |
| | NSP-Minnesota Form 8-K dated May 31, 2016 | 001-31387 | 4.01 |
| | NSP-Minnesota Form 8-K dated Sept. 13, 2017 | 001-31387 | 4.01 |
| | NSP-Minnesota Form 8-K dated Sept. 10, 2019 | 001-31387 | 4.01 |
| | Xcel Energy Inc. Form 10-K for the year ended Dec. 31, 2008 | 001-03034 | 10.02 |
| | Xcel Energy Inc. Form 10-K for the year ended Dec. 31, 2008 | 001-03034 | 10.05 |
| | Xcel Energy Inc. Form 10-K for the year ended Dec. 31, 2008 | 001-03034 | 10.08 |
| | Xcel Energy Inc. Form U5B dated Nov. 16, 2000 | 001-03034 | H-1 |
| | Xcel Energy Inc. Form 10-K for the year ended Dec. 31, 2008 | 001-03034 | 10.17 |
| | NSP-Wisconsin Form S-4 dated Jan. 21, 2004 | 333-112033 | 10.01 |
| | Xcel Energy Inc. Form 10-Q for the quarter ended Sept. 30, 2009 | 001-03034 | 10.06 |
| | Xcel Energy Inc. Form 10-Q for the quarter ended Sept. 30, 2009 | 001-03034 | 10.08 |
| | Xcel Energy Inc. Definitive Proxy Statement dated April 6, 2010 | 001-03034 | Schedule 14A |
| | Xcel Energy Inc. Definitive Proxy Statement dated April 5, 2011 | 001-03034 | Schedule 14A |
| | Xcel Energy Inc. Form 10-K for the year ended Dec. 31, 2008 | 001-03034 | 10.07 |
| | Xcel Energy Inc. Form 10-K for the year ended Dec. 31, 2011 | 001-03034 | 10.17 |
| | Xcel Energy Inc. Form 10-K for the year ended Dec. 31, 2011 | 001-03034 | 10.18 |
| | Xcel Energy Inc. Form 10-Q for the quarter ended March 31, 2013 | 001-03034 | 10.01 |
| | Xcel Energy Inc. Form 10-Q for the quarter ended March 31, 2013 | 001-03034 | 10.02 |
| | Xcel Energy Inc. Form 10-K for the year ended Dec. 31, 2013 | 001-03034 | 10.22 |
| | Xcel Energy Inc. Form 8-K dated May 20, 2015 | 001-03034 | 10.02 |
| | Xcel Energy Inc. Form 10-Q for the quarter ended June 30, 2016 | 001-03034 | 10.01 |
| | Xcel Energy Inc. Form 10-Q for the quarter ended Sept. 30, 2016 | 001-03034 | 10.01 |
| | Xcel Energy Inc. Form 10-Q for the quarter ended Sept. 30, 2017 | 001-03034 | 10.1 |
| | Xcel Energy Inc. Form 10-K for the year ended Dec. 31, 2017 | 001-03034 | 10.30 |
| | Xcel Energy Inc. Form 10-Q for the quarter ended June 30, 2018 | 001-03034 | 10.01 |
| | Xcel Energy Inc. Form 10-K for the year ended Dec. 31, 2018 | 001-03034 | 10.34 |
| | Xcel Energy Inc. Form 10-K for the year ended Dec. 31, 2018 | 001-03034 | 10.35 |
| | Xcel Energy Inc. Form 10-K for the year ended Dec. 31, 2018 | 001-03034 | 10.36 |
| Third Amended and Restated Credit Agreement, dated as of June 7, 2019 among NSP-Minnesota, as Borrower, the several lenders from time to time parties thereto, JPMorgan Chase Bank, N.A., as Administrative Agent, Bank of America, N.A. and Barclays Bank Plc, as Syndication Agents, Wells Fargo Bank, National Association, MUFG Bank, Ltd., and Citibank, N.A., as Documentation Agents | Xcel Energy Inc. Form 8-K dated June 7, 2019 | 001-03034 | 99.02 |
|
| | | | |
| | Xcel Energy Inc. Form 10-K for the year ended Dec. 31, 2019 | 001-03034 | 10.33 |
| |
| |
| |
| |
| 101.INS | XBRL Instance Document - the instance document does not appear in the Interactive Data File because its XBRL tags are embedded within the Inline XBRL document |
| 101.SCH | XBRL Schema |
| 101.CAL | XBRL Calculation |
| 101.DEF | XBRL Definition |
| 101.LAB | XBRL Label |
| 101.PRE | XBRL Presentation |
| 104 | Cover Page Interactive Data File (formatted as Inline XBRL and contained in Exhibit 101) |
SCHEDULE II
NSP-Minnesota and Subsidiaries Valuation and Qualifying Accounts Years Ended Dec. 31 |
| | | | | | | | | | | | |
| | | Allowance for bad debts |
| (Millions of Dollars) | | 2019 | | 2018 | | 2017 |
| Balance at Jan. 1 | | $ | 23.5 |
| | $ | 21.3 |
| | $ | 20.0 |
|
| Additions charged to costs and expenses | | 13.0 |
| | 16.2 |
| | 15.7 |
|
Additions charged to other accounts (a) | | 6.5 |
| | 4.1 |
| | 3.8 |
|
Deductions from reserves (b) | | (20.0 | ) | | (18.1 | ) | | (18.2 | ) |
| Balance at Dec. 31 | | $ | 23.0 |
| | $ | 23.5 |
| | $ | 21.3 |
|
| |
(a) | Recovery of amounts previously written off. |
| |
(b) | Deductions related primarily to bad debt write-offs. |
|
|
ITEM 16 — FORM 10-K SUMMARY |
None.
Signatures
Pursuant to the requirements of Section 13 or 15(d) of the Securities Exchange Act of 1934, the registrant has duly caused this annual report to be signed on its behalf by the undersigned thereunto duly authorized.
|
| | |
| | NORTHERN STATES POWER COMPANY (A MINNESOTA CORPORATION) |
| | | |
| Feb. 21, 2020 | | /s/ ROBERT C. FRENZEL |
| | | Robert C. Frenzel |
| | | Executive Vice President, Chief Financial Officer and Director |
| | | (Principal Financial Officer) |
Pursuant to the requirements of the Securities Exchange Act of 1934, this report has been signed below by the following persons on behalf of the registrant and in the capacities on the date indicated above.
|
| | |
| /s/ BEN FOWKE | | /s/ CHRISTOPHER B. CLARK |
| Ben Fowke | | Christopher B. Clark |
| Chairman, Chief Executive Officer and Director | | President and Director |
| (Principal Executive Officer) | | |
| | | |
| /s/ ROBERT C. FRENZEL | | /s/ JEFFREY S. SAVAGE |
| Robert C. Frenzel | | Jeffrey S. Savage |
| Executive Vice President, Chief Financial Officer and Director | | Senior Vice President, Controller |
| (Principal Financial Officer) | | (Principal Accounting Officer) |
| | | |
| /s/ DAVID L. EVES | | |
| David L. Eves | | |
| Executive Vice President, Group President, Utilities and Director | | |
SUPPLEMENTAL INFORMATION TO BE FURNISHED WITH REPORTS FILED PURSUANT TO SECTION 15(D) OF THE ACT BY REGISTRANTS WHICH HAVE NOT REGISTERED SECURITIES PURSUANT TO SECTION 12 OF THE ACT
NSP-Minnesota has not sent, and does not expect to send, an annual report or proxy statement to its security holder.