| | |
| UNITED STATES |
| SECURITIES AND EXCHANGE COMMISSION |
| Washington, D.C. 20549 |
| |
| FORM N-CSR |
| |
| CERTIFIED SHAREHOLDER REPORT OF REGISTERED |
| MANAGEMENT INVESTMENT COMPANIES |
| | |
| Investment Company Act file number | 811-10155 |
| |
| AMERICAN CENTURY VARIABLE PORTFOLIOS II, INC. |
| (Exact name of registrant as specified in charter) |
| |
| 4500 MAIN STREET, KANSAS CITY, MISSOURI | 64111 |
| (Address of principal executive offices) | (Zip Code) |
| |
| CHARLES A. ETHERINGTON |
| 4500 MAIN STREET, KANSAS CITY, MISSOURI 64111 |
| (Name and address of agent for service) |
| |
| Registrant’s telephone number, including area code: | 816-531-5575 |
| | |
| Date of fiscal year end: | 12-31 |
| | |
| Date of reporting period: | 12-31-2009 |
| | |
| | |
| |
| ITEM 1. REPORTS TO STOCKHOLDERS. |
|
| Annual Report | |
| December 31, 2009 | |

|
| American Century Variable Portfolios II |
VP Inflation Protection Fund
| |
| Market Perspective | 2 |
| U.S. Fixed-Income Total Returns | 2 |
| |
| VP Inflation Protection | |
| |
| Performance | 3 |
| Portfolio Commentary | 5 |
| Asset Allocation | 7 |
| Portfolio at a Glance | 7 |
| |
| Shareholder Fee Example | 8 |
| |
| Financial Statements | |
| |
| Schedule of Investments | 9 |
| Statement of Assets and Liabilities | 17 |
| Statement of Operations | 18 |
| Statement of Changes in Net Assets | 19 |
| Notes to Financial Statements | 20 |
| Financial Highlights | 28 |
| Report of Independent Registered Public Accounting Firm | 30 |
| |
| Other Information | |
| |
| Management | 31 |
| Additional Information | 34 |
| Index Definitions | 35 |
The opinions expressed in the Market Perspective and the Portfolio Commentary reflect those of the portfolio management team as of the date of the report, and do not necessarily represent the opinions of American Century Investments or any other person in the American Century Investments organization. Any such opinions are subject to change at any time based upon market or other conditions and American Century Investments disclaims any responsibility to update such opinions. These opinions may not be relied upon as investment advice and, because investment decisions made by American Century Investments funds are based on numerous factors, may not be relied upon as an indication of trading intent on behalf of any American Century Investments fund. Security examples are used for representational purposes only and are not intended as recommendations to purchase or sell securities. Performance information for comparative indices and securities is provided to American Century Investments by third party vendors. To the best of American Century Investments’ knowledge, such information is accurate at the time of printing.

By David MacEwen, Chief Investment Officer, Fixed Income
Riskier Assets Rebounded
The “flight to quality” that characterized most of the “Great Recession” reversed course in 2009. After outperforming in the previous two years, “safe-haven” assets took a back seat to riskier asset classes. For 2009, traditional Treasuries were the poorest-performing asset class, while high-yield corporate bonds were the best.
Supply and demand factors, rather than solid economic fundamentals, set the rally in motion. By early 2009, yields among the highest-quality securities had reached record lows, while yield spreads (the yield differences between Treasuries and non-Treasury securities) had expanded to historically wide levels. It only took minimal evidence of economic stabilization to lure recession-weary investors off the sidelines and take advantage of the attractive yield spreads. Growing demand for yield, combined with a tight supply of bonds, caused spreads to tighten and total returns to soar in the corporate bond sectors.
The rally continued throughout the rest of the year, despite generally uninspiring economic data. U.S. economic growth turned positive in the third quarter, primarily due to government incentive programs and business inventory rebuilding, and the housing market showed signs of stabilizing. But, overall consumer spending and sentiment remained tepid, and unemployment finished the year at 10%. While it appeared the U.S. economy had stumbled out of the recession, most measures of economic activity pointed to a weak, and perhaps jobless, recovery.
Inflation Outlook Boosted TIPS
Concerns surrounding the U.S. government’s unprecedented fiscal and financial stimulus programs, combined with fears that recent economic improvements would cause the Federal Reserve to hike interest rates sooner than expected, led to negative 12-month returns for nominal Treasuries. On the other hand, the market’s mounting inflation expectations along with a limited supply of inflation-linked securities helped generate double-digit gains for TIPS (Treasury inflation-protected securities).
Reflecting the impact of soaring commodity prices, headline inflation, as measured by the 12-month change in the Consumer Price Index (CPI), was up 2.7% as of December 31, 2009. This compares with a headline inflation rate of 0.1% for all of 2008.
| | | | |
| U.S. Fixed-Income Total Returns | | | | |
| For the 12 months ended December 31, 2009 | | | |
| Citigroup U.S. Bond Market Indices | | | Treasury Bellwethers | |
| High-Yield Market (corporate) | 55.19% | | 3-Month Treasury Bill | 0.16% |
| Credit (investment-grade corporate) | 16.14% | | 10-Year Treasury Note | -9.92% |
| Inflation-Linked Securities | 10.12% | | | |
| Mortgage | 5.76% | | | |
| Agency | 0.74% | | | |
| Treasury | -3.69% | | | |
2
| | | | | |
| VP Inflation Protection | | | | |
| |
| Total Returns as of December 31, 2009 | | | | |
| | | | Average Annual Returns | |
| | Ticker | | | Since | Inception |
| | Symbol | 1 year | 5 years | Inception | Date |
| Class II | APTIX | 10.22% | 4.15% | 4.59% | 12/31/02 |
| Citigroup US Inflation-Linked | | | | | |
| Securities Index(1) | — | 10.12% | 4.64% | 5.68% | — |
| Class I | AIPTX | 10.43% | 4.40% | 5.20% | 5/7/04 |
| (1) The Citigroup US Inflation-Linked Securities Index is not subject to the tax code diversification and other regulatory requirements |
| limiting the type and amount of securities that the fund may own. | | | |
The performance information presented does not include charges and deductions imposed by the insurance company separate account under the variable annuity or variable life insurance contracts. The inclusion of such charges could significantly lower performance. Please refer to the insurance company separate account prospectus for a discussion of the charges related to insurance contracts.
Data presented reflect past performance. Past performance is no guarantee of future results. Current performance may be higher or lower than the performance shown. Investment return and principal value will fluctuate, and redemption value may be more or less than original cost. To obtain performance data current to the most recent month end, please call 1-800-345-6488. As interest rates rise, bond values will decline.
Unless otherwise indicated, performance reflects Class II shares; performance for other share classes will vary due to differences in fee structure. For information about other share classes available, please consult the prospectus. Data assumes reinvestment of dividends and capital gains, and none of the charts reflect the deduction of taxes that a shareholder would pay on fund distributions or the redemption of fund shares. Returns for the index are provided for comparison. The fund’s total returns include operating expenses (such as transaction costs and management fees) that reduce returns, while the total returns of the index do not.
3
VP Inflation Protection
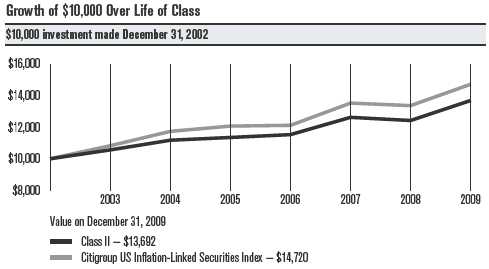
| | | | | | | |
| One-Year Returns Over Life of Class | | | | | | |
| Periods ended December 31 | | | | | | | |
| | 2003 | 2004 | 2005 | 2006 | 2007 | 2008 | 2009 |
| Class II | 5.61%* | 5.81% | 1.56% | 1.59% | 9.49% | -1.59% | 10.22% |
| Citigroup US Inflation-Linked | | | | | | | |
| Securities Index | 8.26% | 8.40% | 2.86% | 0.40% | 11.61% | -1.17% | 10.12% |
| *Returns would have been lower, along with ending value, if distribution fees had not been waived from 12/31/02 to 3/31/03. | |
| |
| Total Annual Fund Operating Expenses | |
| Class I | Class II |
| 0.49% | 0.74% |
The total annual fund operating expenses shown is as stated in the fund’s prospectus current as of the date of this report. The prospectus may vary from the expense ratio shown elsewhere in this report because it is based on a different time period, includes acquired fund fees and expenses, and, if applicable, does not include fee waivers or expense reimbursements.
Data presented reflect past performance. Past performance is no guarantee of future results. Current performance may be higher or lower than the performance shown. Investment return and principal value will fluctuate, and redemption value may be more or less than original cost. To obtain performance data current to the most recent month end, please call 1-800-345-6488. As interest rates rise, bond values will decline.
Unless otherwise indicated, performance reflects Class II shares; performance for other share classes will vary due to differences in fee structure. For information about other share classes available, please consult the prospectus. Data assumes reinvestment of dividends and capital gains, and none of the charts reflect the deduction of taxes that a shareholder would pay on fund distributions or the redemption of fund shares. Returns for the index are provided for comparison. The fund’s total returns include operating expenses (such as transaction costs and management fees) that reduce returns, while the total returns of the index do not.
4
VP Inflation Protection
Portfolio Managers: Bob Gahagan, Brian Howell, and Jim Platz
Performance Summary
VP Inflation Protection returned 10.43%* for the 12 months ended December 31, 2009. The portfolio’s benchmark, the Citigroup US Inflation-Linked Securities Index, returned 10.12% for the same time period. Portfolio returns reflect operating expenses, while benchmark returns do not.
The Portfolio’s performance benefited from the generally favorable climate for TIPS (Treasury inflation-protected securities), which were among the top-performing investment-grade sectors of the U.S. bond market in 2009. Our strategy of investing more than 40% of the Portfolio’s assets in out-of-benchmark, high-quality “spread sectors” (non-Treasury sectors) accounted for the slight performance advantage relative to the benchmark. In general, the portfolio’s investment-grade corporate and municipal securities outperformed TIPS during the 12 months and offset the lagging results from its mortgage and agency securities.
Market Backdrop
Oil prices plunged early in 2009, but they quickly reversed course in early March, when the period’s economic optimism was starting to blossom. Investors took comfort in data suggesting the economic downturn was stabilizing, which led to expectations for growing worldwide demand for commodities. Oil prices started the period at $45 a barrel, dropped to $34 in mid-February, and climbed to $79 by the end of the year, for a one-year gain of 76%. Other commodity prices also advanced during the year, as indicated by the 12-month gain of 34% for the Rogers International Commodities Index, a measure of energy, agriculture and metals products.
Rising prices for oil and other commodities helped trigger higher inflation for the period. Headline inflation, as measured by the 12-month change in the Consumer Price Index (CPI), was up 2.7% as of December 31, 2009. This compares with a headline inflation rate of 0.1% for all of 2008. Core inflation, which does not include food and energy prices, increased 1.8% for 2009.
The rising inflation rate drove up the market’s longer-term inflation outlook, as measured by the Treasury breakeven rate, or yield difference between 10-year TIPS and traditional Treasuries, which is a gauge of the market’s inflation expectation for the next 10 years. That rate began the period at 0.09 percentage point, an unusually low reading that indicated a market perception of virtually no inflation for the next 10 years. From there, it steadily increased, finishing the year at 2.41 percentage points. The growing breakeven rate suggested longer-term inflationary pressures were building.
*All fund returns referenced in this commentary are for Class I shares.
5
VP Inflation Protection
Portfolio Positioning
The Portfolio was as fully invested in TIPS as allowed by IRS portfolio diversification regulations for insurance products (55% of the portfolio). The remainder of the Portfolio included non-dollar inflation-linked bonds and investment-grade spread sectors.
In an effort to maintain maximum portfolio inflation protection and provide TIPS-like performance without investing further in TIPS, the investment team used inflation “swaps” to create an inflation-linked “overlay” for the non-inflation-linked spread securities. Inflation swaps are fixed-maturity instruments, negotiated through a counterparty (investment bank), that return the rate of inflation, as measured by CPI, throughout the life of the swap. All swaps bear counterparty credit risk, but American Century Investments applies the same stringent controls and oversight with regard to counterparty credit risk as it applies to all its corporate and municipal credit portfolios.
Outlook
Leading economic indicators, such as growth stock performance and a steep Treasury yield curve (when the graphed line of Treasury yields on a particular date shows short-maturity yields much lower than longer-maturity yields), suggest better economic—and potentially more inflationary—times ahead. In addition, the unprecedented steps the government took to avoid a severe economic downturn eventually may lead to significantly higher inflation and a weaker dollar than are currently priced into the market. These factors, combined with a still-reasonable breakeven rate, suggest TIPS may represent good long-term value.
We believe the combination of TIPS, inflation swaps, global inflation-linked securities, and spread securities will enhance the portfolio’s yield and outperform Treasury inflation-linked securities over time.
6
| | |
| VP Inflation Protection | | |
| |
| Asset Allocation | | |
| | % of net assets | % of net assets |
| | as of 12/31/09 | as of 6/30/09 |
| U.S. Treasury Securities and Equivalents | 54.3% | 56.6% |
| Sovereign Governments & Agencies | 17.5% | 14.1% |
| U.S. Government Agency Securities and Equivalents | 12.1% | 10.0% |
| Corporate Bonds | 8.9% | 6.5% |
| Commercial Mortgage-Backed Securities | 1.8% | 2.9% |
| Municipal Securities | 1.1% | 3.0% |
| U.S. Government Agency Mortgage-Backed Securities | 1.0% | 3.5% |
| Asset-Backed Securities | 0.4% | —(1) |
| Short-Term Investments | 0.3% | — |
| Collateralized Mortgage Obligations | 0.2% | 0.5% |
| Temporary Cash Investments | 1.0% | 3.1% |
| Other Assets and Liabilities | 1.4% | (0.2)% |
| (1) Category is less than 0.05% of total net assets. | | |
| |
| Portfolio at a Glance | | |
| | As of 12/31/09 | As of 6/30/09 |
| 30-Day SEC Yield | | |
| Class I | 2.04% | 3.85% |
| Class II | 1.79% | 3.60% |
| Weighted Average Life | 9.0 years | 9.5 years |
| Average Duration (static real yield beta) | 5.8 years | 6.0 years(2) |
| (2) The calculation as of June 30, 2009, was based on effective average duration. | | |
7
|
| Shareholder Fee Example (Unaudited) |
Fund shareholders may incur two types of costs: (1) transaction costs, including sales charges (loads) on purchase payments and redemption/ exchange fees; and (2) ongoing costs, including management fees; distribution and service (12b-1) fees; and other fund expenses. This example is intended to help you understand your ongoing costs (in dollars) of investing in your fund and to compare these costs with the ongoing cost of investing in other mutual funds.
The example is based on an investment of $1,000 made at the beginning of the period and held for the entire period from July 1, 2009 to December 31, 2009.
Actual Expenses
The table provides information about actual account values and actual expenses for each class. You may use the information, together with the amount you invested, to estimate the expenses that you paid over the period. First, identify the share class you own. Then simply divide your account value by $1,000 (for example, an $8,600 account value divided by $1,000 = 8.6), then multiply the result by the number under the heading “Expenses Paid During Period” to estimate the expenses you paid on your account during this period.
Hypothetical Example for Comparison Purposes
The table also provides information about hypothetical account values and hypothetical expenses based on the actual expense ratio of each class of your fund and an assumed rate of return of 5% per year before expenses, which is not the actual return of a fund’s share class. The hypothetical account values and expenses may not be used to estimate the actual ending account balance or expenses you paid for the period. You may use this information to compare the ongoing costs of investing in your fund and other funds. To do so, compare this 5% hypothetical example with the 5% hypothetical examples that appear in the shareholder reports of the other funds.
Please note that the expenses shown in the table are meant to highlight your ongoing costs only and do not reflect any transactional costs, such as sales charges (loads) or redemption/exchange fees. Therefore, the table is useful in comparing ongoing costs only, and will not help you determine the relative total costs of owning different funds. In addition, if these transactional costs were included, your costs would have been higher.
| | | | |
| | | | Expenses Paid | |
| | Beginning Account | Ending Account | During Period* | Annualized |
| | Value 7/1/09 | Value 12/31/09 | 7/1/09 - 12/31/09 | Expense Ratio* |
| Actual | | | | |
| Class I | $1,000 | $1,053.30 | $2.54 | 0.49% |
| Class II | $1,000 | $1,051.90 | $3.83 | 0.74% |
| Hypothetical | | | | |
| Class I | $1,000 | $1,022.74 | $2.50 | 0.49% |
| Class II | $1,000 | $1,021.48 | $3.77 | 0.74% |
| *Expenses are equal to the class’s annualized expense ratio listed in the table above, multiplied by the average account value over the period, |
| multiplied by 184, the number of days in the most recent fiscal half-year, divided by 365, to reflect the one-half year period. |
8
| | | | | | |
| VP Inflation Protection | | | | | |
| |
| DECEMBER 31, 2009 | | | | | | |
| | Principal | | | | Principal | |
| | Amount | Value | | | Amount | Value |
| U.S. Treasury Securities and | | | U.S. Treasury Inflation | | |
| | | | | Indexed Notes, | | |
| Equivalents — 54.3% | | | | 1.875%, 7/15/13(1) | $ 4,708,080 | $ 4,964,449 |
| FIXED-RATE U.S. TREASURY SECURITIES | | | U.S. Treasury Inflation | | |
| AND EQUIVALENTS — 53.9% | | | | Indexed Notes, | | |
| AID (Egypt), | | | | 2.00%, 1/15/14(1) | 4,012,929 | 4,248,688 |
| 4.45%, 9/15/15(1) | $ 1,500,000 | $ 1,575,657 | | U.S. Treasury Inflation | | |
| U.S. Treasury Inflation | | | | Indexed Notes, | | |
| Indexed Bonds, | | | | 2.00%, 7/15/14(1) | 9,289,485 | 9,852,660 |
| 2.375%, 1/15/25(1) | 43,236,245 | 45,729,074 | | U.S. Treasury Inflation | | |
| U.S. Treasury Inflation | | | | Indexed Notes, | | |
| Indexed Bonds, | | | | 1.625%, 1/15/15(1) | 50,153,802 | 52,222,646 |
| 2.00%, 1/15/26(1) | 49,230,936 | 49,565,559 | | U.S. Treasury Inflation | | |
| U.S. Treasury Inflation | | | | Indexed Notes, | | |
| Indexed Bonds, | | | | 1.875%, 7/15/15(1) | 25,561,970 | 26,965,885 |
| 2.375%, 1/15/27(1) | 37,411,404 | 39,463,195 | | U.S. Treasury Inflation | | |
| U.S. Treasury Inflation | | | | Indexed Notes, | | |
| Indexed Bonds, | | | | 2.00%, 1/15/16(1) | 32,838,777 | 34,719,322 |
| 1.75%, 1/15/28(1) | 30,265,334 | 29,097,273 | | U.S. Treasury Inflation | | |
| U.S. Treasury Inflation | | | | Indexed Notes, | | |
| Indexed Bonds, | | | | 2.50%, 7/15/16(1) | 29,437,100 | 32,093,327 |
| 3.625%, 4/15/28(1) | 22,855,347 | 28,306,713 | | U.S. Treasury Inflation | | |
| U.S. Treasury Inflation | | | | Indexed Notes, | | |
| Indexed Bonds, | | | | 2.375%, 1/15/17(1) | 21,332,004 | 23,066,893 |
| 2.50%, 1/15/29(1) | 26,480,944 | 28,469,080 | | U.S. Treasury Inflation | | |
| U.S. Treasury Inflation | | | | Indexed Notes, | | |
| Indexed Bonds, | | | | 2.625%, 7/15/17(1) | 15,155,371 | 16,686,306 |
| 3.875%, 4/15/29(1) | 14,879,225 | 19,193,040 | | U.S. Treasury Inflation | | |
| U.S. Treasury Inflation | | | | Indexed Notes, | | |
| Indexed Bonds, 3.375%, | | | | 1.625%, 1/15/18(1) | 20,070,261 | 20,576,714 |
| 4/15/32(1) | 27,688,957 | 34,317,001 | | U.S. Treasury Inflation | | |
| U.S. Treasury Inflation | | | | Indexed Notes, | | |
| Indexed Notes, | | | | 1.375%, 7/15/18(1) | 5,012,450 | 5,030,465 |
| 4.25%, 1/15/10(1) | 5,974,739 | 5,989,209 | | U.S. Treasury Inflation | | |
| U.S. Treasury Inflation | | | | Indexed Notes, | | |
| Indexed Notes, | | | | 2.125%, 1/15/19(1) | 1,762,040 | 1,871,341 |
| 0.875%, 4/15/10(1) | 32,378,996 | 32,528,231 | | U.S. Treasury Inflation | | |
| U.S. Treasury Inflation | | | | Indexed Notes, | | |
| Indexed Notes, | | | | 1.875%, 7/15/19(1) | 7,087,150 | 7,367,312 |
| 3.50%, 1/15/11(1) | 7,700,834 | 7,997,439 | | | | 625,226,714 |
| U.S. Treasury Inflation | | | | ZERO-COUPON U.S. TREASURY SECURITIES |
| Indexed Notes, | | | | AND EQUIVALENTS — 0.4% | | |
| 2.375%, 4/15/11(1) | 40,896,832 | 42,155,677 | | AID (Israel), | | |
| U.S. Treasury Inflation | | | | 4.70%, 5/1/15(1)(2) | 5,000,000 | 4,209,355 |
| Indexed Notes, | | | | TOTAL U.S. TREASURY SECURITIES | |
| 3.375%, 1/15/12(1) | 3,743,690 | 4,008,672 | | AND EQUIVALENTS | | |
| U.S. Treasury Inflation | | | | (Cost $598,321,757) | | 629,436,069 |
| Indexed Notes, | | | | | | |
| 2.00%, 4/15/12(1) | 5,273,334 | 5,517,226 | | | | |
| U.S. Treasury Inflation | | | | | | |
| Indexed Notes, | | | | | | |
| 3.00%, 7/15/12(1) | 10,820,880 | 11,647,660 | | | | |
9
| | | | | | | |
| VP Inflation Protection | | | | | |
| |
| | | Principal | | | | Principal | |
| | | Amount | Value | | | Amount | Value |
| Sovereign Governments | | | U.S. Government Agency Securities |
| & Agencies — 17.5% | | | | and Equivalents — 12.1% | |
| FRANCE — 2.8% | | | | | FIXED-RATE U.S. GOVERNMENT | |
| Government of | | | | | AGENCY SECURITIES — 7.9% | | |
| France, 2.25%, | | | | | FAMCA, 5.50%, 7/15/11(1)(3) | $ 3,750,000 | $ 3,961,226 |
| 7/25/20(1) | EUR | 21,050,216 | $ 32,649,655 | | | | |
| | | | | | FAMCA, 5.40%, 10/14/11(1) | 1,000,000 | 1,073,238 |
| GERMANY — 2.5% | | | | | FAMCA, 6.71%, 7/28/14(1) | 3,974,000 | 4,642,069 |
| German Federal | | | | | FFCB, 4.875%, 12/16/15(1) | 2,000,000 | 2,157,934 |
| Republic Inflation | | | | | | | |
| Linked, 2.25%, | | | | | FFCB, 4.875%, 1/17/17(1) | 5,000,000 | 5,328,570 |
| 4/15/13(1) | EUR | 19,326,318 | 29,372,378 | | FHLB, 4.875%, 5/17/17(1) | 1,030,000 | 1,103,094 |
| ITALY — 2.7% | | | | | FHLMC, 4.875%, 6/13/18(1) | 11,000,000 | 11,786,654 |
| Republic of Italy, | | | | | FNMA, 3.00%, 9/16/14(1) | 23,000,000 | 23,316,986 |
| 2.35%, 9/15/19(1) | EUR | 20,689,309 | 30,998,478 | | | | |
| | | | | | FNMA, 6.625%, 11/15/30(1) | 18,244,000 | 21,992,358 |
| JAPAN — 1.9% | | | | | | | |
| | | | | | FNMA, 5.625%, 7/15/37(1) | 3,410,000 | 3,602,344 |
| Government of Japan | | | | | | | |
| CPI Linked Bond, | | | | | PEFCO, 4.97%, 8/15/13(1) | 2,845,000 | 3,107,702 |
| 1.10%, 12/10/16(1) | JPY | 2,093,700,000 | 21,741,142 | | PEFCO, 4.55%, 5/15/15(1) | 4,000,000 | 4,279,944 |
| NORWAY — 0.2% | | | | | TVA Inflation Index Notes, | | |
| Government | | | | | 4.875%, 12/15/16(1) | 1,750,000 | 1,828,162 |
| of Norway, | | | | | TVA Inflation Index Notes, | | |
| 6.00%, 5/16/11(1) | NOK | 12,170,000 | 2,202,445 | | 4.50%, 4/1/18(1) | 3,550,000 | 3,618,838 |
| UNITED KINGDOM — 7.4% | | | | | | 91,799,119 |
| Government of | | | | | GOVERNMENT-BACKED CORPORATE | |
| United Kingdom | | | | | BONDS(4) — 4.2% | | |
| Inflation Linked, | | | | | | | |
| 2.50%, 8/16/13(1) | GBP | 9,015,000 | 37,989,023 | | Bank of America Corp., | | |
| | | | | | 3.125%, 6/15/12(1) | 8,500,000 | 8,812,859 |
| Government of | | | | | | | |
| United Kingdom | | | | | Citigroup Funding, Inc., | | |
| Inflation Linked, | | | | | 1.875%, 10/22/12 | 16,000,000 | 15,950,352 |
| 2.50%, 7/26/16(1) | GBP | 5,200,000 | 24,491,399 | | General Electric Capital | | |
| | | | | | Corp., 2.20%, 6/8/12(1) | 8,300,000 | 8,421,363 |
| Government of | | | | | | | |
| United Kingdom | | | | | GMAC, Inc., | | |
| Inflation Linked, | | | | | 1.75%, 10/30/12(1) | 10,000,000 | 9,941,700 |
| 1.25%, 11/22/17(1) | GBP | 13,935,875 | 23,505,686 | | Goldman Sachs Group, Inc. | | |
| | | | 85,986,108 | | (The), 3.25%, 6/15/12(1) | 5,200,000 | 5,405,629 |
| TOTAL SOVEREIGN GOVERNMENTS | | | | | 48,531,903 |
| & AGENCIES | | | | | TOTAL U.S. GOVERNMENT AGENCY | |
| (Cost $190,492,129) | | | 202,950,206 | | SECURITIES AND EQUIVALENTS | |
| | | | | | (Cost $138,466,342) | | 140,331,022 |
10
| | | | | | |
| VP Inflation Protection | | | | | |
| |
| | Principal | | | | Principal | |
| | Amount | Value | | | Amount | Value |
| Corporate Bonds — 8.9% | | | CONSUMER FINANCE — 1.3% | |
| AEROSPACE & DEFENSE(5) | | | | General Electric Capital | | |
| | | | | Corp., 3.75%, 11/14/14(1) | $ 1,790,000 | $ 1,788,842 |
| L-3 Communications Corp., | | | | General Electric Capital | | |
| 5.20%, 10/15/19(1)(3) | $ 500,000 | $ 495,505 | | | | |
| | | | | Corp., 6.00%, 8/7/19(1) | 1,000,000 | 1,039,911 |
| BEVERAGES — 0.5% | | | | SLM Corp., VRN, 0.86%, | | |
| Anheuser-Busch InBev | | | | 1/4/10, resets monthly off | | |
| Worldwide, Inc., | | | | the Consumer Price Index | | |
| 6.875%, 11/15/19(3) | 1,430,000 | 1,599,339 | | Year over Year plus 2.15% | | |
| Coca-Cola Co. (The), | | | | with no caps, Final | | |
| 3.625%, 3/15/14(1) | 1,220,000 | 1,258,778 | | Maturity 2/1/14(1) | 490,000 | 371,616 |
| Coca-Cola Enterprises, Inc., | | | | SLM Corp., | | |
| 4.25%, 3/1/15(1) | 1,150,000 | 1,209,376 | | 1.32%, 1/25/10(1) | 11,320,500 | 11,341,573 |
| Dr Pepper Snapple Group, | | | | | | 14,541,942 |
| Inc., 6.82%, 5/1/18(1) | 1,450,000 | 1,629,259 | | DIVERSIFIED FINANCIAL SERVICES — 0.2% | |
| | | 5,696,752 | | Bank of America Corp., | | |
| BIOTECHNOLOGY — 0.1% | | | | 6.50%, 8/1/16(1) | 1,780,000 | 1,916,640 |
| Amgen, Inc., | | | | BP Capital Markets plc, | | |
| 5.85%, 6/1/17(1) | 1,020,000 | 1,116,293 | | 3.125%, 3/10/12(1) | 860,000 | 886,307 |
| CAPITAL MARKETS — 0.7% | | | | | | 2,802,947 |
| Credit Suisse (New York), | | | | DIVERSIFIED TELECOMMUNICATION | |
| 5.50%, 5/1/14(1) | 1,720,000 | 1,868,348 | | SERVICES — 0.6% | | |
| Credit Suisse (New York), | | | | AT&T, Inc., | | |
| 5.30%, 8/13/19(1) | 1,370,000 | 1,409,594 | | 6.70%, 11/15/13(1) | 1,000,000 | 1,129,217 |
| Goldman Sachs Group, Inc. | | | | AT&T, Inc., 5.10%, | | |
| (The), 7.50%, 2/15/19(1) | 1,610,000 | 1,880,128 | | 9/15/14(1) | 770,000 | 829,125 |
| Morgan Stanley, | | | | AT&T, Inc., | | |
| 4.20%, 11/20/14(1) | 1,250,000 | 1,252,240 | | 6.55%, 2/15/39(1) | 1,220,000 | 1,289,757 |
| Morgan Stanley, | | | | Cellco Partnership/Verizon | | |
| 7.30%, 5/13/19(1) | 1,360,000 | 1,529,822 | | Wireless Capital LLC, | | |
| | | | | 5.55%, 2/1/14(1) | 1,160,000 | 1,260,073 |
| | | 7,940,132 | | | | |
| CHEMICALS — 0.1% | | | | Cellco Partnership/Verizon | | |
| | | | | Wireless Capital LLC, | | |
| Dow Chemical Co. (The), | | | | 8.50%, 11/15/18(1) | 720,000 | 894,531 |
| 8.55%, 5/15/19(1) | 720,000 | 860,503 | | | | |
| | | | | Telecom Italia Capital SA, | | |
| COMMERCIAL BANKS — 1.6% | | | 6.18%, 6/18/14(1) | 1,800,000 | 1,952,912 |
| KfW, 4.75%, 5/15/12(1) | 5,000,000 | 5,360,350 | | | | 7,355,615 |
| International Bank | | | | ELECTRIC UTILITIES — 0.2% | | |
| for Reconstruction | | | | | | |
| & Development, | | | | Duke Energy Ohio, Inc., | | |
| | | | | 2.10%, 6/15/13(1) | 730,000 | 721,374 |
| 7.625%, 1/19/23(1) | 9,500,000 | 12,142,425 | | | | |
| Westpac Banking Corp., | | | | FirstEnergy Solutions Corp., | | |
| | | | | 6.05%, 8/15/21(1) | 1,000,000 | 1,010,896 |
| 4.875%, 11/19/19(1) | 630,000 | 623,018 | | | | |
| | | 18,125,793 | | | | 1,732,270 |
| COMMUNICATIONS EQUIPMENT — 0.2% | | | FOOD & STAPLES RETAILING — 0.1% | |
| | | | | CVS Caremark Corp., | | |
| Cisco Systems, Inc., | | | | 6.60%, 3/15/19(1) | 1,230,000 | 1,348,321 |
| 2.90%, 11/17/14(1) | 1,200,000 | 1,199,165 | | | | |
| Cisco Systems, Inc., | | | | | | |
| 5.90%, 2/15/39(1) | 1,350,000 | 1,369,726 | | | | |
| | | 2,568,891 | | | | |
11
| | | | | | |
| VP Inflation Protection | | | | | |
| |
| | Principal | | | | Principal | |
| | Amount | Value | | | Amount | Value |
| HOTELS, RESTAURANTS & LEISURE — 0.1% | | | METALS & MINING — 0.4% | | |
| Yum! Brands, Inc., | | | | Barrick Gold Corp., | | |
| 5.30%, 9/15/19(1) | $ 1,300,000 | $ 1,308,181 | | 6.95%, 4/1/19 | $ 1,770,000 | $ 1,996,380 |
| INDUSTRIAL CONGLOMERATES — 0.1% | | | Newmont Mining Corp., | | |
| General Electric Co., | | | | 6.25%, 10/1/39(1) | 2,000,000 | 2,009,140 |
| 5.25%, 12/6/17(1) | 700,000 | 716,458 | | Rio Tinto Finance USA Ltd., | | |
| INSURANCE — 0.1% | | | | 5.875%, 7/15/13(1) | 750,000 | 809,924 |
| John Hancock Life | | | | | | 4,815,444 |
| Insurance Co., VRN, 0.95%, | | | MULTI-UTILITIES — 0.4% | | |
| 1/15/10, resets monthly off | | | Dominion Resources, Inc., | | |
| the Consumer Price Index | | | | 6.40%, 6/15/18(1) | 1,200,000 | 1,312,940 |
| Year over Year plus 1.13% | | | | | | |
| with no caps, Final | | | | Pacific Gas & Electric Co., | | |
| | | | | 6.25%, 12/1/13(1) | 1,000,000 | 1,114,217 |
| Maturity 6/15/10(1) | 40,000 | 39,998 | | | | |
| John Hancock Life | | | | PG&E Corp., | | |
| | | | | 5.75%, 4/1/14(1) | 1,440,000 | 1,553,616 |
| Insurance Co., VRN, 1.44%, | | | | | |
| 1/15/10, resets monthly off | | | Sempra Energy, | | |
| the Consumer Price Index | | | | 6.50%, 6/1/16(1) | 570,000 | 618,984 |
| Year over Year plus 1.62% | | | | | | 4,599,757 |
| with no caps, Final | | | | OIL, GAS & CONSUMABLE FUELS — 0.8% | |
| Maturity 11/15/10(1) | 179,000 | 179,895 | | | | |
| | | | | Chevron Corp., | | |
| Prudential Financial, Inc., | | | | 3.95%, 3/3/14 | 1,220,000 | 1,274,921 |
| VRN, 0.71%, 1/4/10, resets | | | | | | |
| monthly off the Consumer | | | | ConocoPhillips, | | |
| Price Index Year over Year | | | | 4.75%, 2/1/14(1) | 3,060,000 | 3,288,545 |
| plus 2.00% with no caps, | | | | Enterprise Products | | |
| Final Maturity 11/2/20(1) | 303,000 | 258,141 | | Operating LLC, | | |
| Teachers Insurance | | | | 4.60%, 8/1/12(1) | 2,170,000 | 2,293,091 |
| & Annuity Association | | | | Shell International Finance | | |
| of America, 6.85%, | | | | BV, 4.30%, 9/22/19(1) | 1,260,000 | 1,247,309 |
| 12/16/39(1)(3) | 500,000 | 518,542 | | Talisman Energy, Inc., | | |
| | | 996,576 | | 7.75%, 6/1/19(1) | 500,000 | 588,216 |
| MACHINERY — 0.1% | | | | XTO Energy, Inc., | | |
| Deere & Co., | | | | 6.50%, 12/15/18(1) | 860,000 | 984,422 |
| 5.375%, 10/16/29(1) | 750,000 | 750,842 | | | | 9,676,504 |
| MEDIA — 0.4% | | | | PAPER & FOREST PRODUCTS — 0.1% | |
| Comcast Corp., | | | | International Paper Co., | | |
| 5.90%, 3/15/16(1) | 800,000 | 862,656 | | 7.30%, 11/15/39(1) | 750,000 | 798,146 |
| DirecTV Holdings LLC/ | | | | PERSONAL PRODUCTS(5) | | |
| DirecTV Financing Co., Inc., | | | Mead Johnson Nutrition Co., | | |
| 5.875%, 10/1/19(1)(3) | 620,000 | 631,762 | | 5.90%, 11/1/39(1)(3) | 500,000 | 494,078 |
| News America, Inc., | | | | PHARMACEUTICALS — 0.3% | | |
| 6.90%, 8/15/39(1)(3) | 610,000 | 667,635 | | | | |
| | | | | Pfizer, Inc., | | |
| Time Warner Cable, Inc., | | | | 6.20%, 3/15/19(1) | 1,220,000 | 1,358,588 |
| 8.25%, 2/14/14(1) | 670,000 | 783,754 | | | | |
| | | | | Pfizer, Inc., | | |
| Time Warner Cable, Inc., | | | | 7.20%, 3/15/39(1) | 1,000,000 | 1,226,104 |
| 6.75%, 7/1/18(1) | 1,700,000 | 1,870,607 | | | | |
| | | | | Roche Holdings, Inc., | | |
| | | 4,816,414 | | 6.00%, 3/1/19(1)(3) | 1,070,000 | 1,177,865 |
| | | | | | | 3,762,557 |
12
| | | | | | | |
| VP Inflation Protection | | | | | | |
| |
| | Principal | | | | | Principal | |
| | Amount | Value | | | | Amount | Value |
| REAL ESTATE INVESTMENT TRUSTS (REITs)(5) | | Municipal Securities — 1.1% | |
| ProLogis, 7.375%, | | | | California GO, (Building | | |
| 10/30/19(1) | $ 500,000 | $ 494,051 | | | | | |
| | | | | Bonds), 7.55%, 4/1/39(1) | $ 700,000 | $ 690,137 |
| THRIFTS & MORTGAGE FINANCE — 0.3% | | | Massachusetts Bay | | | |
| HSBC Finance Corp., VRN, | | | | Transportation Auth. Sales | | |
| 0.93%, 1/11/10, resets | | | | Tax. Rev., Series 2006 A, | | |
| monthly off the Consumer | | | | 5.25%, 7/1/33(1) | | 4,000,000 | 4,616,920 |
| Price Index Year over Year | | | | Massachusetts Bay | | | |
| plus 1.11% with no caps, | | | | Transportation Auth. Sales | | |
| Final Maturity 2/10/10(1) | 3,000,000 | 3,010,080 | | | | | |
| | | | | Tax. Rev., Series 2006 A, | | |
| TOBACCO — 0.2% | | | | 5.25%, 7/1/34(1) | | 5,000,000 | 5,756,600 |
| Altria Group, Inc., | | | | New York State Dormitory | | |
| 9.25%, 8/6/19(1) | 2,190,000 | 2,673,245 | | Auth. Rev., (Building Bonds), | | |
| TOTAL CORPORATE BONDS | | | | 5.63%, 3/15/39(1) | | 690,000 | 662,186 |
| (Cost $99,131,342) | | 103,497,297 | | Texas GO, (Building Bonds), | | |
| | | | | 5.52%, 4/1/39(1) | | 690,000 | 675,910 |
| Commercial Mortgage-Backed | | | | | | |
| Securities(6) — 1.8% | | | | TOTAL MUNICIPAL SECURITIES | |
| | | | | (Cost $10,914,952) | | | 12,401,753 |
| Credit Suisse Mortgage | | | | | | | |
| Capital Certificates, Series | | | | U.S. Government Agency | |
| 2007 TF2A, Class A1, VRN, | | | | Mortgage-Backed Securities(6) — 1.0% |
| 0.41%, 1/15/10, resets | | | | FHLMC, 4.50%, 5/1/19(1) | 557,807 | 579,659 |
| monthly off the 1-month | | | | | | | |
| LIBOR plus 0.18% | | | | FHLMC, 5.00%, 4/1/21(1) | 2,493,036 | 2,621,500 |
| with no caps, Final | | | | FHLMC, 5.50%, 12/1/33(1) | 276,649 | 291,159 |
| Maturity 4/15/22(1)(3) | 5,813,751 | 4,992,204 | | | | | |
| | | | | FHLMC, 5.50%, 1/1/38(1) | 1,472,728 | 1,545,828 |
| GMAC Commercial | | | | | | | |
| Mortgage Securities, Inc., | | | | FNMA, 5.00%, 9/1/20(1) | 748,822 | 787,175 |
| Series 2005 C1, Class A2 | | | | FNMA, 6.00%, 6/1/38(1) | 2,998,895 | 3,179,766 |
| SEQ, 4.47%, 5/10/43(1) | 1,295,394 | 1,296,699 | | GNMA, 6.00%, 6/20/17(1) | 87,966 | 93,797 |
| LB-UBS Commercial | | | | GNMA, 6.00%, 7/20/17(1) | 83,366 | 88,891 |
| Mortgage Trust, Series 2003 | | | | | | | |
| C3, Class A3 SEQ, | | | | GNMA, 6.00%, 5/15/24(1) | 570,418 | 607,911 |
| 3.85%, 5/15/27(1) | 4,679,143 | 4,673,781 | | GNMA, 5.50%, 9/20/34(1) | 1,877,057 | 1,977,015 |
| LB-UBS Commercial | | | | TOTAL U.S. GOVERNMENT AGENCY | |
| Mortgage Trust, Series 2005 | | | | MORTGAGE-BACKED SECURITIES | |
| C2, Class A2 SEQ, | | | | (Cost $11,122,504) | | | 11,772,701 |
| 4.82%, 4/15/30(1) | 3,368,974 | 3,374,222 | | | | | |
| | | | | Asset-Backed Securities(6) — 0.4% | |
| LB-UBS Commercial | | | | | | | |
| Mortgage Trust, Series 2005 | | | | CenterPoint Energy | | | |
| C3, Class A3 SEQ, | | | | Transition Bond Co. LLC, | | |
| 4.65%, 7/15/30(1) | 2,590,000 | 2,603,251 | | Series 2009-1, Class A1 | | |
| Lehman Brothers Floating | | | | SEQ, 1.83%, 2/15/16 | | |
| Rate Commercial Mortgage | | | | (Cost $4,499,880) | | 4,500,000 | 4,439,637 |
| Trust, Series 2007 LLFA, | | | | Short-Term Investments(7) — 0.3% | |
| Class A1, VRN, 0.53%, | | | | | | | |
| 1/15/10, resets monthly off | | | | Government of Canada | | |
| the 1-month LIBOR plus | | | | Treasury Bill, | | | |
| 0.30% with no caps, Final | | | | 0.26%, 4/1/10 | | | |
| Maturity 6/15/22(1)(3) | 5,207,605 | 4,522,979 | | (Cost $3,067,291) | CAD | 3,300,000 | 3,153,845 |
| TOTAL COMMERCIAL MORTGAGE- | | | | | | |
| BACKED SECURITIES | | | | | | | |
| (Cost $22,712,093) | | 21,463,136 | | | | | |
13
| | | | | | |
| VP Inflation Protection | | | | | |
| |
| | Principal | | | | Principal | |
| | Amount | Value | | | Amount/ | |
| Collateralized Mortgage | | | | Shares | Value |
| Obligations(6) — 0.2% | | | | Temporary Cash Investments — 1.0% |
| FHLMC, Series 2508, Class | | | | BNP Paribas Finance, Inc., | | |
| | | | | 0.01%, 1/4/10(7) | $12,100,000 | $ 12,099,879 |
| UL SEQ, 5.00%, 12/15/16(1) | $ 549,716 | $ 563,425 | | | | |
| GNMA, Series 2003-46, | | | | JPMorgan U.S. Treasury | | |
| Class PA, 5.00%, 5/20/29(1) | 246,589 | 249,140 | | Plus Money Market Fund | | |
| | | | | Agency Shares(1) | 85,981 | 85,981 |
| GNMA, Series 2005-24, | | | | | | |
| Class UB SEQ, | | | | TOTAL TEMPORARY | | |
| 5.00%, 1/20/31(1) | 2,000,000 | 2,047,073 | | CASH INVESTMENTS | | |
| | | | | (Cost $12,185,971) | | 12,185,860 |
| TOTAL COLLATERALIZED | | | | | | |
| MORTGAGE OBLIGATIONS | | | | TOTAL INVESTMENT | | |
| (Cost $2,787,751) | | 2,859,638 | | SECURITIES — 98.6% | | |
| | | | | (Cost $1,093,702,012) | | 1,144,491,164 |
| | | | | OTHER ASSETS | | |
| | | | | AND LIABILITIES — 1.4% | | 15,750,533 |
| | | | | TOTAL NET ASSETS — 100.0% | | $1,160,241,697 |
| | | | |
| Forward Foreign Currency Exchange Contracts | | |
| Contracts to Sell | Settlement Date | Value | Unrealized Gain (Loss) |
| 64,471,203 | EUR for USD | 1/29/10 | $ 92,422,693 | $2,921,513 |
| 15,761,250 | GBP for USD | 1/29/10 | 25,455,049 | (315,855) |
| 36,747,753 | GBP for USD | 1/29/10 | 59,349,091 | 585,024 |
| 1,966,158,768 | JPY for USD | 1/29/10 | 21,113,568 | 487,231 |
| | | | $198,340,401 | $3,677,913 |
| (Value on Settlement Date $202,018,314) | | | |
| |
| Contracts to Buy | Settlement Date | Value | Unrealized Gain (Loss) |
| 1,000,000 | EUR for USD | 1/29/10 | $1,433,550 | $(60,900) |
| (Value on Settlement Date $1,494,450) | | | |
14
| | | |
| VP Inflation Protection | | |
| |
| Swap Agreements | | |
| Notional Amount | Description of Agreement | Premiums Paid (Received) | Value |
| CREDIT DEFAULT - BUY PROTECTION | | |
| $ 4,750,000 | Pay quarterly a fixed rate equal to 0.20% | — | $ 7,005 |
| | multiplied by the notional amount and receive | | |
| | from Merrill Lynch International upon each | | |
| | default event of HSBC Finance Corp., par | | |
| | value of the proportional notional amount | | |
| | of HSBC Finance Corp., 7.00%, 5/15/12. | | |
| | Expires June 2010. | | |
| TOTAL RETURN | | | |
| 44,000,000 | Pay a fixed rate equal to 1.08% and receive the | — | (1,193,252) |
| | return of the U.S. CPI Urban Consumers NSA | | |
| | Index upon the termination date with Barclays | | |
| | Bank plc. Expires July 2010. | | |
| 20,000,000 | Pay a fixed rate equal to 1.13% and receive the | — | (498,808) |
| | return of the U.S. CPI Urban Consumers NSA | | |
| | Index upon the termination date with Barclays | | |
| | Bank plc. Expires January 2012. | | |
| 35,000,000 | Pay a fixed rate equal to 1.14% and receive the | — | (1,241,948) |
| | return of the U.S. CPI Urban Consumers NSA | | |
| | Index upon the termination date with Barclays | | |
| | Bank plc. Expires March 2012. | | |
| 33,275,000 | Pay a fixed rate equal to 0.16% and receive the | — | (2,736,663) |
| | return of the U.S. CPI Urban Consumers NSA | | |
| | Index upon the termination date with Bank of | | |
| | America N.A. Expires July 2013. | | |
| 13,000,000 | Pay a fixed rate equal to 0.08% and receive the | — | (125,283) |
| | return of the U.S. CPI Urban Consumers NSA | | |
| | Index upon the termination date with UBS AG. | | |
| | Expires November 2013. | | |
| 20,000,000 | Pay a fixed rate equal to 1.21% and receive the | — | (972,774) |
| | return of the U.S. CPI Urban Consumers NSA | | |
| | Index upon the termination date with Barclays | | |
| | Bank plc. Expires June 2014. | | |
| 20,000,000 | Pay a fixed rate equal to 1.31% and receive the | — | (448,027) |
| | return of the U.S. CPI Urban Consumers NSA | | |
| | Index upon the termination date with Barclays | | |
| | Bank plc. Expires April 2017. | | |
| 40,000,000 | Pay a fixed rate equal to 1.31% and receive the | — | (1,183,121) |
| | return of the U.S. CPI Urban Consumers NSA | | |
| | Index upon the termination date with Barclays | | |
| | Bank plc. Expires April 2018. | | |
| 55,000,000 | Pay a fixed rate equal to 0.30% and receive the | — | 715,962 |
| | return of the U.S. CPI Urban Consumers NSA | | |
| | Index upon the termination date with Bank of | | |
| | America N.A. Expires December 2019. | | |
| 30,100,000 | Pay a fixed rate equal to 1.77% and receive the | — | (178,019) |
| | return of the U.S. CPI Urban Consumers NSA | | |
| | Index upon the termination date with Barclays | | |
| | Bank plc. Expires December 2027. | | |
| | | — | (7,861,933) |
| | | — | $(7,854,928) |
15
| | |
| VP Inflation Protection | | |
| |
| Notes to Schedule of Investments | | |
| AID = Agency for International Development | (1) | Security, or a portion thereof, has been segregated for swap |
| CAD = Canadian Dollar | | agreements. At the period end, the aggregate value of securities |
| | | pledged was $9,301,000. |
| CPI = Consumer Price Index | | |
| | (2) | The rate indicated is the yield to maturity at purchase. These |
| Equivalent = Security whose principal payments are secured by U.S. | | securities are issued at a substantial discount from their value |
| Treasuries or backed by the full faith and credit of the United States. | | at maturity. |
| EUR = Euro | (3) | Security was purchased under Rule 144A of the Securities Act of |
| FAMCA = Federal Agricultural Mortgage Corporation | | 1933 or is a private placement and, unless registered under the |
| FFCB = Federal Farm Credit Bank | | Act or exempted from registration, may only be sold to qualified |
| FHLB = Federal Home Loan Bank | | institutional investors. The aggregate value of these securities at |
| | | the period end was $19,061,135, which represented 1.6% of total |
| FHLMC = Federal Home Loan Mortgage Corporation | | net assets. |
| FNMA = Federal National Mortgage Association | (4) | The debt is guaranteed under the Federal Deposit Insurance |
| GBP = British Pound | | Corporation’s (FDIC) Temporary Liquidity Guarantee Program and |
| GMAC = General Motors Acceptance Corporation | | is backed by the full faith and credit of the United States. The |
| | | expiration date of the FDIC’s guarantee is the earlier of the maturity |
| GNMA = Government National Mortgage Association | | date of the debt or December 31, 2012. |
| GO = General Obligation | (5) | Category is less than 0.05% of total net assets. |
| JPY = Japanese Yen | (6) | Final maturity indicated, unless otherwise noted. |
| LB-UBS = Lehman Brothers, Inc. — UBS AG | (7) | The rate indicated is the yield to maturity at purchase. |
| LIBOR = London Interbank Offered Rate | | |
| NOK = Norwegian Krone | Industry and geographic classifications are unaudited. |
| NSA = Not Seasonally Adjusted | | |
| PEFCO = Private Export Funding Corporation | | |
| resets = The frequency with which a security’s coupon changes, | See Notes to Financial Statements. |
| based on current market conditions or an underlying index. The more | | |
| frequently a security resets, the less risk the investor is taking that the | | |
| coupon will vary significantly from current market rates. | | |
| SEQ = Sequential Payer | | |
| TVA = Tennessee Valley Authority | | |
| USD = United States Dollar | | |
| VRN = Variable Rate Note. Interest reset date is indicated. Rate | | |
| shown is effective at the period end. | | |
16
|
| Statement of Assets and Liabilities |
| |
| DECEMBER 31, 2009 | |
| Assets | |
| Investment securities, at value (cost of $1,093,702,012) | $1,144,491,164 |
| Receivable for investments sold | 8,590,724 |
| Receivable for capital shares sold | 2,977,085 |
| Receivable for forward foreign currency exchange contracts | 3,993,768 |
| Swap agreements, at value | 722,967 |
| Interest receivable | 9,800,981 |
| | 1,170,576,689 |
| | |
| Liabilities | |
| Foreign currency overdraft payable, at value (cost of $138,349) | 140,060 |
| Payable for capital shares redeemed | 547,337 |
| Payable for forward foreign currency exchange contracts | 376,755 |
| Accrued management fees | 468,735 |
| Distribution fees payable | 224,210 |
| Swap agreements, at value | 8,577,895 |
| | 10,334,992 |
| | |
| Net Assets | $1,160,241,697 |
| | |
| Net Assets Consist of: | |
| Capital (par value and paid-in surplus) | $1,128,277,973 |
| Undistributed net investment income | 1,284,521 |
| Accumulated net realized loss on investment and foreign currency transactions | (15,861,631) |
| Net unrealized appreciation on investments and translation of assets | |
| and liabilities in foreign currencies | 46,540,834 |
| | $1,160,241,697 |
| | |
| Class I, $0.01 Par Value | |
| Net assets | $101,956,091 |
| Shares outstanding | 9,493,111 |
| Net asset value per share | $10.74 |
| | |
| Class II, $0.01 Par Value | |
| Net assets | $1,058,285,606 |
| Shares outstanding | 98,640,643 |
| Net asset value per share | $10.73 |
| |
| |
| See Notes to Financial Statements. | |
17
| |
| YEAR ENDED DECEMBER 31, 2009 | |
| Investment Income (Loss) | |
| Income: | |
| Interest | $30,080,128 |
| | |
| Expenses: | |
| Management fees | 4,673,825 |
| Distribution fees | 2,200,248 |
| Directors’ fees and expenses | 75,797 |
| Other expenses | 1,229 |
| | 6,951,099 |
| | |
| Net investment income (loss) | 23,129,029 |
| | |
| Realized and Unrealized Gain (Loss) | |
| Net realized gain (loss) on: | |
| Investment transactions | 11,077,967 |
| Futures contract transactions | (2,285,080) |
| Swaps agreement transactions | (9,605) |
| Foreign currency transactions | (9,906,847) |
| | (1,123,565) |
| | |
| Change in net unrealized appreciation (depreciation) on: | |
| Investments | 44,754,342 |
| Futures contracts | 1,704,251 |
| Swap agreements | 21,571,504 |
| Translation of assets and liabilities in foreign currencies | 3,606,610 |
| | 71,636,707 |
| | |
| Net realized and unrealized gain (loss) | 70,513,142 |
| | |
| Net Increase (Decrease) in Net Assets Resulting from Operations | $93,642,171 |
| |
| |
| See Notes to Financial Statements. | |
18
|
| Statement of Changes in Net Assets |
| | |
| YEARS ENDED DECEMBER 31, 2009 AND DECEMBER 31, 2008 | | |
| Increase (Decrease) in Net Assets | 2009 | 2008 |
| Operations | | |
| Net investment income (loss) | $ 23,129,029 | $ 34,802,277 |
| Net realized gain (loss) | (1,123,565) | (9,111,059) |
| Change in net unrealized appreciation (depreciation) | 71,636,707 | (46,984,435) |
| Net increase (decrease) in net assets resulting from operations | 93,642,171 | (21,293,217) |
| | | |
| Distributions to Shareholders | | |
| From net investment income: | | |
| Class I | (1,742,731) | (4,545,420) |
| Class II | (15,959,329) | (30,440,780) |
| From return of capital: | | |
| Class I | — | (319,743) |
| Class II | — | (2,141,327) |
| Decrease in net assets from distributions | (17,702,060) | (37,447,270) |
| | | |
| Capital Share Transactions | | |
| Net increase (decrease) in net assets from capital share transactions | 236,955,503 | 299,743,448 |
| | | |
| Net increase (decrease) in net assets | 312,895,614 | 241,002,961 |
| | | |
| Net Assets | | |
| Beginning of period | 847,346,083 | 606,343,122 |
| End of period | $1,160,241,697 | $847,346,083 |
| | | |
| Accumulated undistributed net investment income (loss) | $1,284,521 | $(143,058) |
| |
| |
| See Notes to Financial Statements. | | |
19
|
| Notes to Financial Statements |
DECEMBER 31, 2009
1. Organization and Summary of Significant Accounting Policies
Organization — American Century Variable Portfolios II, Inc. (the corporation) is registered under the Investment Company Act of 1940 (the 1940 Act) as an open-end management investment company. VP Inflation Protection Fund (the fund) is one fund in a series issued by the corporation. The fund is diversified under the 1940 Act. The fund’s investment objective is to pursue long-term total return using a strategy that seeks to protect against U.S. inflation. The fund pursues its investment objective by investing substantially all of its assets in investment-grade debt securities. The fund normally invests over 50% of its assets in inflation-adjusted debt securities that are designed to protect the future purchasing power of the money invested in them. The following is a summary of the fund’s significant accounting pol icies.
Multiple Class — The fund is authorized to issue Class I and Class II. The share classes differ principally in their respective distribution and shareholder servicing expenses and arrangements. All shares of the fund represent an equal pro rata interest in the net assets of the class to which such shares belong, and have identical voting, dividend, liquidation and other rights and the same terms and conditions, except for class specific expenses and exclusive rights to vote on matters affecting only individual classes. Income, non-class specific expenses, and realized and unrealized capital gains and losses of the fund are allocated to each class of shares based on their relative net assets.
Security Valuations — Debt securities maturing in greater than 60 days at the time of purchase are valued at current market value as provided by a commercial pricing service or at the mean of the most recent bid and asked prices. Debt securities maturing within 60 days at the time of purchase may be valued at cost, plus or minus any amortized discount or premium. Investments in open-end management investment companies are valued at the reported net asset value. Securities traded on foreign securities exchanges and over-the-counter markets are normally completed before the close of business on days that the New York Stock Exchange (the Exchange) is open and may also take place on days when the Exchange is not open. If an event occurs after the value of a security was established but before the net asset value per share was det ermined that was likely to materially change the net asset value, that security would be valued as determined in accordance with procedures adopted by the Board of Directors. If the fund determines that the market price of a portfolio security is not readily available, or that the valuation methods mentioned above do not reflect the security’s fair value, such security is valued as determined by the Board of Directors or its designee, in accordance with procedures adopted by the Board of Directors, if such determination would materially impact a fund’s net asset value. Certain other circumstances may cause the fund to use alternative procedures to value a security such as: a security has been declared in default; trading in a security has been halted during the trading day; or there is a foreign market holiday and no trading will commence.
Security Transactions — For financial reporting purposes, security transactions are accounted for as of the trade date. Net realized gains and losses are determined on the identified cost basis, which is also used for federal income tax purposes.
Investment Income — Interest income is recorded on the accrual basis and includes paydown gain (loss) and accretion of discounts and amortization of premiums. Inflation adjustments related to inflation-linked debt securities are reflected as interest income.
Foreign Currency Translations — All assets and liabilities initially expressed in foreign currencies are translated into U.S. dollars at prevailing exchange rates at period end. The fund may enter into spot foreign currency exchange contracts to facilitate transactions denominated in a foreign currency. Purchases and sales of investment securities, dividend and interest income, spot foreign currency exchange contracts, and certain expenses are translated at the rates of exchange prevailing on the respective dates of such transactions. For assets and liabilities, other than investments in securities, net realized and unrealized gains and losses from foreign currency translations arise from changes in currency exchange rates.
20
Net realized and unrealized foreign currency exchange gains or losses occurring during the holding period of investment securities are a component of net realized gain (loss) on investment transactions and net unrealized appreciation (depreciation) on investments, respectively. Certain countries may impose taxes on the contract amount of purchases and sales of foreign currency contracts in their currency. The fund records the foreign tax expense, if any, as a reduction to the net realized gain (loss) on foreign currency transactions.
Repurchase Agreements — The fund may enter into repurchase agreements with institutions that American Century Investment Management, Inc. (ACIM) (the investment advisor) has determined are creditworthy pursuant to criteria adopted by the Board of Directors. Each repurchase agreement is recorded at cost. The fund requires that the collateral, represented by securities, received in a repurchase transaction be transferred to the custodian in a manner sufficient to enable the fund to obtain those securities in the event of a default under the repurchase agreement. ACIM monitors, on a daily basis, the securities transferred to ensure the value, including accrued interest, of the securities under each repurchase agreement is equal to or greater than amounts owed to the fund under each repurchase agreement.
Joint Trading Account — Pursuant to an Exemptive Order issued by the Securities and Exchange Commission, the fund, along with certain other funds in the American Century Investments family of funds, may transfer uninvested cash balances into a joint trading account. These balances are invested in one or more repurchase agreements that are collateralized by U.S. Treasury or Agency obligations.
Income Tax Status — It is the fund’s policy to distribute substantially all net investment income and net realized gains to shareholders and to otherwise qualify as a regulated investment company under provisions of the Internal Revenue Code. The fund is no longer subject to examination by tax authorities for years prior to 2006. At this time, management believes there are no uncertain tax positions which, based on their technical merit, would not be sustained upon examination and for which it is reasonably possible that the total amounts of unrecognized tax benefits will significantly change in the next twelve months. Accordingly, no provision has been made for federal or state income taxes. Interest and penalties associated with any federal or state income tax obligations, if any, are recorded as interest expense.
Distributions to Shareholders — Distributions to shareholders are recorded on the ex-dividend date. Distributions from net investment income are declared daily and paid monthly. Distributions from net realized gains, if any, are generally declared and paid annually.
The book-basis character of distributions made during the year from net investment income or net realized gains may differ from their ultimate characterization for federal income tax purposes. These differences reflect the differing character of paydown losses, interest on swap agreements, certain income items and net realized gains and losses for financial statement and tax purposes, and may result in reclassification among certain capital accounts on the financial statements.
As of December 31, 2009, the fund has accumulated net realized capital loss carryovers for federal income tax purposes of $(7,743,486), which may be used to offset future taxable gains. Future capital loss carryover utilization in any given year may be subject to Internal Revenue Code limitations. Capital loss carryovers of $(1,436,199), $(3,811,535) and $(2,495,752) expire in 2014, 2015 and 2016, respectively.
Indemnifications — Under the corporation’s organizational documents, its officers and directors are indemnified against certain liabilities arising out of the performance of their duties to the fund. In addition, in the normal course of business, the fund enters into contracts that provide general indemnifications. The maximum exposure under these arrangements is unknown as this would involve future claims that may be made against a fund. The risk of material loss from such claims is considered by management to be remote.
21
Use of Estimates — The financial statements are prepared in conformity with accounting principles generally accepted in the United States of America, which may require management to make certain estimates and assumptions at the date of the financial statements. Actual results could differ from these estimates.
Subsequent Events — Management has evaluated events or transactions that may have occurred since December 31, 2009 that would merit recognition or disclosure in the financial statements. This evaluation was completed through February 12, 2010, the date the financial statements were issued.
2. Fees and Transactions with Related Parties
Management Fees — The corporation has entered into a Management Agreement with ACIM, under which ACIM provides the fund with investment advisory and management services in exchange for a single, unified management fee (the fee) per class. The Agreement provides that all expenses of managing and operating the fund, except brokerage expenses, taxes, interest, fees and expenses of the independent directors (including legal counsel fees), and extraordinary expenses, will be paid by ACIM. The fee is computed and accrued daily based on the daily net assets of the specific class of shares of the fund and paid monthly in arrears. The fee consists of (1) an Investment Category Fee based on the daily net assets of the fund and certain other accounts managed by the investment advisor that are in the same broad investment category as the fund and (2) a Complex Fee based on the assets of all the funds in the American Century Investments family of funds. The rates for the Investment Category Fee range from 0.1625% to 0.2800%. The rates for the Complex Fee range from 0.2500% to 0.3100%. The effective annual management fee for each class of the fund for the year ended December 31, 2009 was 0.48%.
Distribution Fees — The Board of Directors has adopted the Master Distribution Plan (the plan) for Class II, pursuant to Rule 12b-1 of the 1940 Act. The plan provides that Class II will pay American Century Investment Services, Inc. (ACIS) an annual distribution fee equal to 0.25%. The fee is computed and accrued daily based on the Class II daily net assets and paid monthly in arrears. The distribution fee provides compensation for expenses incurred in connection with distributing shares of Class II including, but not limited to, payments to brokers, dealers, and financial institutions that have entered into sales agreements with respect to shares of the fund. Fees incurred under the plan during the year ended December 31, 2009, are detailed in the Statement of Operations.
Related Parties — Certain officers and directors of the corporation are also officers and/ or directors of American Century Companies, Inc. (ACC), the parent of the corporation’s investment advisor, ACIM, the distributor of the corporation, ACIS, and the corporation’s transfer agent, American Century Services, LLC.
The fund is eligible to invest in a money market fund for temporary purposes, which is managed by J.P. Morgan Investment Management, Inc. (JPMIM). The fund has a Mutual Funds Services Agreement with J.P. Morgan Investor Services Co. (JPMIS). JPMorgan Chase Bank (JPMCB) is a custodian of the fund. JPMIM, JPMIS and JPMCB are wholly owned subsidiaries of JPMorgan Chase & Co. (JPM). JPM is an equity investor in ACC.
3. Investment Transactions
Purchases of investment securities, excluding short-term investments, for the year ended December 31, 2009, totaled $628,163,851, of which $357,154,839 represented U.S. Treasury and Agency obligations.
Sales of investment securities, excluding short-term investments, for the year ended December 31, 2009, totaled $407,028,961, of which $335,204,486 represented U.S. Treasury and Agency obligations.
22
As of December 31, 2009, the composition of unrealized appreciation and depreciation of investment securities based on the aggregate cost of investments for federal income tax purposes was as follows:
| | |
| Federal tax cost of investments | $1,098,525,494 |
| Gross tax appreciation of investments | $48,833,423 |
| Gross tax depreciation of investments | (2,867,753) |
| Net tax appreciation (depreciation) of investments | $45,965,670 |
The difference between book-basis and tax-basis cost and unrealized appreciation (depreciation) is attributable primarily to the tax deferral of losses on wash sales and straddle positions.
| | | | |
| 4. Capital Share Transactions | | | | |
| |
| Transactions in shares of the fund were as follows: | | |
| | Year ended December 31, 2009 | Year ended December 31, 2008 |
| | Shares | Amount | Shares | Amount |
| Class I/Shares Authorized | 250,000,000 | | 250,000,000 | |
| Sold | 2,563,052 | $26,789,214 | 8,387,913 | $89,512,577 |
| Issued in reinvestment of distributions | 164,965 | 1,742,731 | 462,552 | 4,865,163 |
| Redeemed | (2,400,396) | (24,485,157) | (4,924,432) | (48,906,593) |
| | 327,621 | 4,046,788 | 3,926,033 | 45,471,147 |
| Class II/Shares Authorized | 250,000,000 | | 250,000,000 | |
| Sold | 32,069,029 | 332,796,504 | 43,783,025 | 453,101,513 |
| Issued in reinvestment of distributions | 1,510,903 | 15,959,329 | 3,090,387 | 32,582,107 |
| Redeemed | (11,314,307) | (115,847,118) | (22,753,017) | (231,411,319) |
| | 22,265,625 | 232,908,715 | 24,120,395 | 254,272,301 |
| Net increase (decrease) | 22,593,246 | $236,955,503 | 28,046,428 | $299,743,448 |
5. Fair Value Measurements
The fund’s securities valuation process is based on several considerations and may use multiple inputs to determine the fair value of the positions held by the fund. In conformity with accounting principles generally accepted in the United States of America, the inputs used to determine a valuation are classified into three broad levels as follows:
• Level 1 valuation inputs consist of actual quoted prices in an active market for identical securities;
• Level 2 valuation inputs consist of significant direct or indirect observable market data (including quoted prices for similar securities, evaluations of subsequent market events, interest rates, prepayment speeds, credit risk, etc.); or
• Level 3 valuation inputs consist of significant unobservable inputs (including a fund’s own assumptions).
The level classification is based on the lowest level input that is significant to the fair valuation measurement. The valuation inputs are not an indication of the risks associated with investing in these securities or other financial instruments.
23
The following is a summary of the valuation inputs used to determine the fair value of the fund’s securities and other financial instruments as of December 31, 2009:
| | | |
| | Level 1 | Level 2 | Level 3 |
| Investment Securities | | | |
| U.S. Treasury Securities and Equivalents | — | $ 629,436,069 | — |
| Sovereign Governments & Agencies | — | 202,950,206 | — |
| U.S. Government Agency Securities and Equivalents | — | 140,331,022 | — |
| Corporate Bonds | — | 103,497,297 | — |
| Commercial Mortgage-Backed Securities | — | 21,463,136 | — |
| Municipal Securities | — | 12,401,753 | — |
| U.S. Government Agency Mortgage-Backed Securities | — | 11,772,701 | — |
| Asset-Backed Securities | — | 4,439,637 | — |
| Short-Term Investments | — | 3,153,845 | — |
| Collateralized Mortgage Obligations | — | 2,859,638 | — |
| Temporary Cash Investments | $85,981 | 12,099,879 | — |
| Total Value of Investment Securities | $85,981 | $1,144,405,183 | — |
| | | | |
| Other Financial Instruments | | | |
| Forward Foreign Currency Exchange Contracts | — | $ 3,617,013 | — |
| Swap Agreements | — | (7,854,928) | — |
| Total Unrealized Gain (Loss) on | | | |
| Other Financial Instruments | — | $(4,237,915) | — |
6. Derivative Instruments
Credit Risk — The fund is subject to credit risk in the normal course of pursuing its investment objectives. The value of a bond generally declines as the credit quality of its issuer declines. Credit default swaps enable a fund to buy/sell protection against a credit event of a specific issuer or index. A fund may attempt to enhance returns by selling protection or attempt to mitigate credit risk by buying protection. The buyer/seller of credit protection against a security or basket of securities may pay/receive an up-front or periodic payment to compensate for/against potential default events. A fund will segregate cash, cash equivalents or other appropriate liquid securities on its records in amounts sufficient to meet requirements. Swap agreements are valued daily at current market value as provided by a commercial prici ng service and/or independent brokers. Changes in value, including the periodic amounts of interest to be paid or received on swaps, are recorded as unrealized appreciation (depreciation) on swap agreements. Realized gain or loss is recorded upon receipt or payment of a periodic settlement or termination of swap agreements. Net realized and unrealized gains or losses occurring during the holding period of swap agreements are a component of net realized gain (loss) on swap agreement transactions and change in net unrealized appreciation (depreciation) on swap agreements, respectively. The risks of entering into swap agreements include the possible lack of liquidity, failure of the counterparty to meet its obligations, and that there may be unfavorable changes in the underlying investments or instruments. The credit risk derivative instruments held at period end as disclosed on the Schedule of Investments are indicative of the fund’s typical volume during the period.
24
Foreign Currency Risk — The fund is subject to foreign currency exchange rate risk in the normal course of pursuing its investment objectives. The value of foreign investments held by a fund may be significantly affected by changes in foreign currency exchange rates. The dollar value of a foreign security generally decreases when the value of the dollar rises against the foreign currency in which the security is denominated and tends to increase when the value of the dollar declines against such foreign currency. A fund may enter into forward foreign currency exchange contracts to reduce a fund’s exposure to foreign currency exchange rate fluctuations. The net U.S. dollar value of foreign currency underlying all contractual commitments held by a fund and the resulting unrealized appreciation or depreciation are deter mined daily using prevailing exchange rates. Realized gain or loss is recorded upon the termination of the contract. Net realized and unrealized gains or losses occurring during the holding period of forward foreign currency exchange contracts are a component of net realized gain (loss) on foreign currency transactions and change in net unrealized appreciation (depreciation) on translation of assets and liabilities in foreign currencies, respectively. A fund bears the risk of an unfavorable change in the foreign currency exchange rate underlying the forward contract. Additionally, losses, up to the fair value, may arise if the counterparties do not perform under the contract terms. The foreign currency risk derivative instruments held at period end as disclosed on the Schedule of Investments are indicative of the fund’s typical volume during the period.
Interest Rate Risk — The fund is subject to interest rate risk in the normal course of pursuing its investment objectives. The value of bonds generally declines as interest rates rise. A fund may enter into futures contracts based on a bond index or a specific underlying security. A fund may purchase futures contracts to gain exposure to increases in market value or sell futures contracts to protect against a decline in market value. Upon entering into a futures contract, a fund will segregate cash, cash equivalents or other appropriate liquid securities on its records in amounts sufficient to meet requirements. Subsequent payments (variation margin) are made or received daily, in cash, by a fund. The variation margin is equal to the daily change in the contract value and is recorded as unrealized gains and losses. A fund recognizes a realized gain or loss when the futures contract is closed or expires. Net realized and unrealized gains or losses occurring during the holding period of futures contracts are a component of net realized gain (loss) on futures contract transactions and change in net unrealized appreciation (depreciation) on futures contracts, respectively. One of the risks of entering into futures contracts is the possibility that the change in value of the contract may not correlate with the changes in value of the underlying securities. The fund held no interest rate risk instruments at period end. The fund regularly participated in interest rate risk derivative instruments during the first six months of the period.
Other Contracts — A fund may enter into total return swap agreements in order to attempt to obtain or preserve a particular return or spread at a lower cost than obtaining a return or spread through purchases and/or sales of instruments in other markets or gain exposure to certain markets in the most economical way possible. A fund will segregate cash, cash equivalents or other appropriate liquid securities on its records in amounts sufficient to meet requirements. Swap agreements are valued daily at current market value as provided by a commercial pricing service and/or independent brokers. Changes in value, including the periodic amounts of interest to be paid or received on swap agreements, are recorded as unrealized appreciation (depreciation) on swap agreements. Realized gain or loss is recorded upon receipt or payme nt of a periodic settlement or termination of swap agreements. Net realized and unrealized gains or losses occurring during the holding period of swap agreements are a component of net realized gain (loss) on swap agreement transactions and change in net unrealized appreciation (depreciation) on swap agreements, respectively. The risks of entering into swap agreements include the possible lack of liquidity, failure of the counterparty to meet its obligations, and that there may be unfavorable changes in the underlying investments or instruments. The total return swap agreements held at period end as disclosed on the Schedule of Investments are indicative of the fund’s typical volume during the period.
25
| | | | |
| Value of Derivative Instruments as of December 31, 2009 | |
| |
| | Asset Derivatives | | Liability Derivatives |
| | Location on Statement | | Location on Statement | |
| Type of Derivative | of Assets and Liabilities | Value | of Assets and Liabilities | Value |
| Credit Risk | Swap agreements | $ 7,005 | Swap agreements | — |
| Foreign Currency Risk | Receivable for forward foreign | | Payable for forward foreign | |
| | currency exchange contracts | 3,993,768 | currency exchange contracts | $ 376,755 |
| Other Contracts | Swap agreements | 715,962 | Swap agreements | 8,577,895 |
| | | $4,716,735 | | $8,954,650 |
Effect of Derivative Instruments on the Statement of Operations for the Year Ended December 31, 2009
| | | | |
| | | | Change in Net Unrealized Appreciation |
| | Net Realized Gain (Loss) | (Depreciation) |
| | Location on Statement | | Location on Statement | |
| Type of Derivative | of Operations | | of Operations | |
| Credit Risk | Net realized gain (loss) | | Change in net unrealized | |
| | on swap agreement | | appreciation (depreciation) on | |
| | transactions | $ (9,605) | swap agreements | $ (417,306) |
| Foreign Currency Risk | Net realized gain (loss) | | Change in net unrealized | |
| | on foreign currency | | appreciation (depreciation) | |
| | transactions | | on translation of assets and | |
| | | (9,932,991) | liabilities in foreign currencies | 3,617,013 |
| Interest Rate Risk | Net realized gain (loss) | | Change in net unrealized | |
| | on futures contract | | appreciation (depreciation) on | |
| | transactions | (2,285,080) | futures contracts | 1,704,251 |
| Other Contracts | Net realized gain (loss) | | Change in net unrealized | |
| | on swap agreement | | appreciation (depreciation) on | |
| | transactions | — | swap agreements | 21,988,810 |
| | | $(12,227,676) | | $26,892,768 |
7. Interfund Lending
The fund, along with certain other funds in the American Century Investments family of funds, may participate in an interfund lending program, pursuant to an Exemptive Order issued by the Securities and Exchange Commission (SEC). This program provides an alternative credit facility allowing the fund to borrow from or lend to other funds in the American Century Investments family of funds that permit such transactions. Interfund lending transactions are subject to each fund’s investment policies and borrowing and lending limits. The interfund loan rate earned/paid on interfund lending transactions is determined daily based on the average of certain current market rates. Interfund lending transactions normally extend only overnight, but can have a maximum duration of seven days. The program is subject to annual approval by the Board of Directors. During the year ended December 31, 2009, the fund did not utilize the program.
26
8. Recently Issued Accounting Standards
In March 2008, the Financial Accounting Standards Board (FASB) issued Accounting Standards Codification (ASC) Section 815-10 (formerly Statement of Financial Accounting Standards No. 161, “Disclosures about Derivative Instruments and Hedging Activities —an amendment of FASB Statement No. 133”). ASC Section 815-10 is effective for interim periods beginning after November 15, 2008 and has been adopted by the fund. ASC Section 815-10 amends and expands disclosures about derivative instruments and hedging activities. ASC Section 815-10 requires qualitative disclosures about the objectives and strategies of derivative instruments, quantitative disclosures about the fair value amounts of and gains and losses on derivative instruments, and disclosures of credit-risk-related contingent features in hedging activities.
27
| | | | | | |
| VP Inflation Protection | | | | |
| |
| Class I | | | | | |
| For a Share Outstanding Throughout the Years Ended December 31 | | | |
| | | 2009 | 2008 | 2007 | 2006 | 2005 |
| Per-Share Data | | | | | |
| Net Asset Value, Beginning of Period | $9.91 | $10.55 | $10.09 | $10.26 | $10.55 |
| Income From Investment Operations | | | | | |
| Net Investment Income (Loss) | 0.26(1) | 0.49(1) | 0.49 | 0.34(1) | 0.47 |
| Net Realized and Unrealized Gain (Loss) | 0.77 | (0.60) | 0.46 | (0.15) | (0.28) |
| Total From Investment Operations | 1.03 | (0.11) | 0.95 | 0.19 | 0.19 |
| Distributions | | | | | |
| From Net Investment Income | (0.20) | (0.50) | (0.49) | (0.36) | (0.47) |
| From Net Realized Gains | — | — | — | — | (0.01) |
| From Return of Capital | — | (0.03) | — | — | — |
| Total Distributions | (0.20) | (0.53) | (0.49) | (0.36) | (0.48) |
| Net Asset Value, End of Period | $10.74 | $9.91 | $10.55 | $10.09 | $10.26 |
| |
| Total Return(2) | 10.43% | (1.26)% | 9.66% | 1.90% | 1.81% |
| | | | | | |
| Ratios/Supplemental Data | | | | | |
| Ratio of Operating Expenses | | | | | |
| to Average Net Assets | 0.49% | 0.49% | 0.50% | 0.50% | 0.50% |
| Ratio of Net Investment Income (Loss) | | | | | |
| to Average Net Assets | 2.61% | 4.62% | 4.75% | 3.37% | 4.85% |
| Portfolio Turnover Rate | 43% | 49% | 109% | 96% | 82% |
| Net Assets, End of Period (in thousands) | $101,956 | $90,845 | $55,277 | $39,096 | $29,040 |
| (1) | Computed using average shares outstanding throughout the period. | | | | |
| (2) | Total return assumes reinvestment of net investment income and capital gains distributions, if any. The total return of the classes may not |
| | precisely reflect the class expense differences because of the impact of calculating the net asset values to two decimal places. If net asset |
| | values were calculated to three decimal places, the total return differences would more closely reflect the class expense differences. The |
| | calculation of net asset values to two decimal places is made in accordance with SEC guidelines and does not result in any gain or loss of value |
| | between one class and another. | | | | | |
See Notes to Financial Statements.
28
| | | | | | |
| VP Inflation Protection | | | | |
| |
| Class II | | | | | |
| For a Share Outstanding Throughout the Years Ended December 31 | | | |
| | | 2009 | 2008 | 2007 | 2006 | 2005 |
| Per-Share Data | | | | | |
| Net Asset Value, Beginning of Period | $9.91 | $10.55 | $10.08 | $10.26 | $10.55 |
| Income From Investment Operations | | | | | |
| Net Investment Income (Loss) | 0.25(1) | 0.45(1) | 0.46 | 0.32(1) | 0.45 |
| Net Realized and Unrealized Gain (Loss) | 0.75 | (0.59) | 0.47 | (0.16) | (0.28) |
| Total From Investment Operations | 1.00 | (0.14) | 0.93 | 0.16 | 0.17 |
| Distributions | | | | | |
| From Net Investment Income | (0.18) | (0.47) | (0.46) | (0.34) | (0.45) |
| From Net Realized Gains | — | — | — | — | (0.01) |
| From Return of Capital | — | (0.03) | — | — | — |
| Total Distributions | (0.18) | (0.50) | (0.46) | (0.34) | (0.46) |
| Net Asset Value, End of Period | $10.73 | $9.91 | $10.55 | $10.08 | $10.26 |
| |
| Total Return(2) | 10.22% | (1.59)% | 9.49% | 1.59% | 1.56% |
| | | | | | |
| Ratios/Supplemental Data | | | | | |
| Ratio of Operating Expenses to Average | | | | | |
| Net Assets | 0.74% | 0.74% | 0.75% | 0.75% | 0.75% |
| Ratio of Net Investment Income (Loss) to | | | | | |
| Average Net Assets | 2.36% | 4.37% | 4.50% | 3.12% | 4.60% |
| Portfolio Turnover Rate | 43% | 49% | 109% | 96% | 82% |
| Net Assets, End of Period (in thousands) | $1,058,286 | $756,501 | $551,066 | $483,692 | $418,424 |
| (1) | Computed using average shares outstanding throughout the period. | | | | |
| (2) | Total return assumes reinvestment of net investment income and capital gains distributions, if any. The total return of the classes may not |
| | precisely reflect the class expense differences because of the impact of calculating the net asset values to two decimal places. If net asset |
| | values were calculated to three decimal places, the total return differences would more closely reflect the class expense differences. The |
| | calculation of net asset values to two decimal places is made in accordance with SEC guidelines and does not result in any gain or loss of value |
| | between one class and another. | | | | | |
See Notes to Financial Statements.
29
|
| Report of Independent Registered Public Accounting Firm |
To the Directors of the American Century Variable Portfolios II, Inc.
and Shareholders of the VP Inflation Protection Fund:
In our opinion, the accompanying statement of assets and liabilities, including the schedule of investments, and the related statements of operations and of changes in net assets and the financial highlights present fairly, in all material respects, the financial position of the VP Inflation Protection Fund (the sole fund comprising the American Century Variable Portfolios II, Inc. hereafter referred to as the “Fund”) at December 31, 2009, the results of its operations for the year then ended, the changes in its net assets for each of the two years in the period then ended and the financial highlights for each of the five years in the period then ended, in conformity with accounting principles generally accepted in the United States of America. These financial statements and financial highlights (hereafter referred to as “financial statements”) are the responsibility of the Fund’s manageme nt; our responsibility is to express an opinion on these financial statements based on our audits. We conducted our audits of these financial statements in accordance with the standards of the Public Company Accounting Oversight Board (United States). Those standards require that we plan and perform the audit to obtain reasonable assurance about whether the financial statements are free of material misstatement. An audit includes examining, on a test basis, evidence supporting the amounts and disclosures in the financial statements, assessing the accounting principles used and significant estimates made by management, and evaluating the overall financial statement presentation. We believe that our audits, which included confirmation of securities at December 31, 2009 by correspondence with the custodian and brokers, provide a reasonable basis for our opinion.
PricewaterhouseCoopers LLP
Kansas City, Missouri
February 12, 2010
30
The individuals listed below serve as directors or officers of the fund. Each director serves until his or her successor is duly elected and qualified or until he or she retires. Effective March 2004, mandatory retirement age for independent directors is 73. However, the mandatory retirement age may be extended for a period not to exceed two years with the approval of the remaining independent directors. Those listed as interested directors are “interested” primarily by virtue of their engagement as directors and/or officers of, or ownership interest in, American Century Companies, Inc. (ACC) or its wholly owned, direct or indirect, subsidiaries, including the fund’s investment advisor, American Century Investment Management, Inc. (ACIM or the advisor); the fund’s principal underwriter, American Century Investment Services, Inc. (ACIS); and the fund’s transfer agent, American Century Servi ces, LLC (ACS).
The other directors (more than three-fourths of the total number) are independent; that is, they have never been employees, directors or officers of, and have no financial interest in, ACC or any of its wholly owned, direct or indirect, subsidiaries, including ACIM, ACIS and ACS. The directors serve in this capacity for eight registered investment companies in the American Century Investments family of funds.
All persons named as officers of the fund also serve in similar capacities for the other 14 registered investment companies in the American Century Investments family of funds advised by ACIM or American Century Global Investment Management, Inc. (ACGIM), a wholly owned subsidiary of ACIM, unless otherwise noted. No officer is compensated for his or her service as an officer of the fund. The listed officers are interested persons of the fund and are appointed or re-appointed on an annual basis.
Interested Director
Jonathan S. Thomas, 4500 Main Street, Kansas City, MO 64111
Year of Birth: 1963
Position(s) Held with Fund: Director and President (since 2007)
Principal Occupation(s) During Past 5 Years: President and Chief Executive Officer, ACC
(March 2007 to present); Chief Administrative Officer, ACC (February 2006 to
February 2007); Executive Vice President, ACC (November 2005 to February 2007).
Also serves as: President, Chief Executive Officer and Director, ACS; Executive
Vice President, ACIM and ACGIM; Director, ACIM, ACGIM, ACIS and other ACC
subsidiaries. Managing Director, Morgan Stanley (March 2000 to November 2005)
Number of Portfolios in Fund Complex Overseen by Director: 103
Other Directorships Held by Director: None
Independent Directors
John Freidenrich, 1665 Charleston Road, Mountain View, CA 94043
Year of Birth: 1937
Position(s) Held with Fund: Director (since 2005)
Principal Occupation(s) During Past 5 Years: Member and Manager, Regis Management
Company, LLC (money management firm) (April 2004 to present); Partner and
Founder, Bay Partners (venture capital firm) (1976 to 2006)
Number of Portfolios in Fund Complex Overseen by Director: 40
Other Directorships Held by Director: None
31
Ronald J. Gilson, 1665 Charleston Road, Mountain View, CA 94043
Year of Birth: 1946
Position(s) Held with Fund: Director (since 1995) and Chairman of the Board (since 2005)
Principal Occupation(s) During Past 5 Years: Charles J. Meyers Professor of Law and Business,
Stanford Law School (1979 to present); Marc and Eva Stern Professor of Law and
Business, Columbia University School of Law (1992 to present)
Number of Portfolios in Fund Complex Overseen by Director: 40
Other Directorships Held by Director: None
Frederick L.A. Grauer, 1665 Charleston Road, Mountain View, CA 94043
Year of Birth: 1946
Position(s) Held with Fund: Director (since 2008)
Principal Occupation(s) During Past 5 Years: Senior Advisor, Barclays Global Investors (asset
manager) (2003 to present)
Number of Portfolios in Fund Complex Overseen by Director: 40
Other Directorships Held by Director: None
Peter F. Pervere, 1665 Charleston Road, Mountain View, CA 94043
Year of Birth: 1947
Position(s) Held with Fund: Director (since 2007)
Principal Occupation(s) During Past 5 Years: Retired, formerly Vice President and Chief
Financial Officer, Commerce One, Inc. (software and services provider)
Number of Portfolios in Fund Complex Overseen by Director: 40
Other Directorships Held by Director: None
Myron S. Scholes, 1665 Charleston Road, Mountain View, CA 94043
Year of Birth: 1941
Position(s) Held with Fund: Director (since 1980)
Principal Occupation(s) During Past 5 Years: Chairman, Platinum Grove Asset Management,
L.P. (asset manager) (1999 to present); Frank E. Buck Professor of Finance-Emeritus,
Stanford Graduate School of Business (1996 to present)
Number of Portfolios in Fund Complex Overseen by Director: 40
Other Directorships Held by Director: Dimensional Fund Advisors
John B. Shoven, 1665 Charleston Road, Mountain View, CA 94043
Year of Birth: 1947
Position(s) Held with Fund: Director (since 2002)
Principal Occupation(s) During Past 5 Years: Professor of Economics, Stanford University
(1973 to present)
Number of Portfolios in Fund Complex Overseen by Director: 40
Other Directorships Held by Director: Cadence Design Systems; E×ponent
Jeanne D. Wohlers, 1665 Charleston Road, Mountain View, CA 94043
Year of Birth: 1945
Position(s) Held with Fund: Director (since 1984)
Principal Occupation(s) During Past 5 Years: Retired
Number of Portfolios in Fund Complex Overseen by Director: 40
Other Directorships Held by Director: None
32
Officers
Barry Fink, 4500 Main Street, Kansas City, MO 64111
Year of Birth: 1955
Position(s) Held with Fund: Executive Vice President (since 2007)
Principal Occupation(s) During Past 5 Years: Chief Operating Officer and Executive Vice
President, ACC (September 2007 to present); President, ACS (October 2007 to
present); Managing Director, Morgan Stanley (2000 to 2007); Global General
Counsel, Morgan Stanley (2000 to 2006). Also serves as: Director, ACC, ACS, ACIS
and other ACC subsidiaries
Maryanne Roepke, 4500 Main Street, Kansas City, MO 64111
Year of Birth: 1956
Position(s) Held with Fund: Chief Compliance Officer (since 2006) and Senior Vice
President (since 2000)
Principal Occupation(s) During Past 5 Years: Chief Compliance Officer, ACIM, ACGIM and ACS
(August 2006 to present); Assistant Treasurer, ACC (January 1995 to August 2006);
and Treasurer and Chief Financial Officer, various American Century Investments
funds (July 2000 to August 2006). Also serves as: Senior Vice President, ACS
Charles A. Etherington, 4500 Main Street, Kansas City, MO 64111
Year of Birth: 1957
Position(s) Held with Fund: General Counsel (since 2007) and Senior Vice President
(since 2006)
Principal Occupation(s) During Past 5 Years: Attorney, ACC (February 1994 to present); Vice
President, ACC (November 2005 to present); General Counsel, ACC (March 2007
to present). Also serves as: General Counsel, ACIM, ACGIM, ACS, ACIS and other
ACC subsidiaries; and Senior Vice President, ACIM, ACGIM and ACS
Robert Leach, 4500 Main Street, Kansas City, MO 64111
Year of Birth: 1966
Position(s) Held with Fund: Vice President, Treasurer and Chief Financial Officer (all
since 2006)
Principal Occupation(s) During Past 5 Years: Vice President, ACS (February 2000 to present); and
Controller, various American Century Investments funds (1997 to September 2006)
David H. Reinmiller, 4500 Main Street, Kansas City, MO 64111
Year of Birth: 1963
Position(s) Held with Fund: Vice President (since September 2001)
Principal Occupation(s) During Past 5 Years: Attorney, ACC (January 1994 to present);
Associate General Counsel, ACC (January 2001 to present); Chief Compliance
Officer, American Century Investments funds, ACIM and ACGIM (January 2001 to
February 2005). Also serves as: Associate General Counsel, ACIM, ACGIM, ACS,
ACIS and other ACC subsidiaries; and Vice President, ACIM, ACGIM and ACS
Ward Stauffer, 4500 Main Street, Kansas City, MO 64111
Year of Birth: 1960
Position(s) Held with Fund: Secretary (since March 2005)
Principal Occupation(s) During Past 5 Years: Attorney, ACC (June 2003 to present)
The SAI has additional information about the fund’s directors and is available without charge, upon request, by calling 1-800-378-9878.
33
Proxy Voting Guidelines
American Century Investment Management, Inc., the fund’s investment advisor, is responsible for exercising the voting rights associated with the securities purchased and/or held by the fund. A description of the policies and procedures the advisor uses in fulfilling this responsibility is available without charge, upon request, by calling 1-800-378-9878. It is also available on American Century Investments’ website at americancentury.com and on the Securities and Exchange Commission’s website at sec.gov. Information regarding how the investment advisor voted proxies relating to portfolio securities during the most recent 12-month period ended June 30 is available on the “About Us” page at americancentury.com. It is also available at sec.gov.
Quarterly Portfolio Disclosure
The fund files its complete schedule of portfolio holdings with the Securities and Exchange Commission (SEC) for the first and third quarters of each fiscal year on Form N-Q. The fund’s Form N-Q is available on the SEC’s website at sec.gov, and may be reviewed and copied at the SEC’s Public Reference Room in Washington, DC. Information on the operation of the Public Reference Room may be obtained by calling 1-800-SEC-0330. The fund also makes its complete schedule of portfolio holdings for the most recent quarter of its fiscal year available on its website at ipro.americancentury.com (for Investment Professionals) and, upon request, by calling 1-800-378-9878.
34
The following indices are used to illustrate investment market, sector, or style performance or to serve as fund performance comparisons. They are not investment products available for purchase.
The Citigroup Agency Index is a market-capitalization-weighted index that includes US government sponsored agencies with a remaining maturity of at least one year.
The Citigroup Credit Index includes US and non-US corporate securities and non-US sovereign and provincial securities.
The Citigroup High-Yield Market Index captures the performance of below-investment-grade debt issued by corporations. This index includes cash-pay and deferred-interest securities that are publicly placed, have a fixed coupon, and are nonconvertible.
The Citigroup Mortgage Index measures the mortgage component of the US BIG Bond Index, comprising 15- and 30-year GNMA, FNMA, and FHLMC pass-throughs and FNMA and FHLMC balloon mortgages.
The Citigroup Treasury Index is comprised of US Treasury securities with an amount outstanding of at least $5 billion and a remaining maturity of at least one year.
The Citigroup US Inflation-Linked Securities Index (ILSI)SM measures the return of bonds with fixed-rate coupon payments that adjust for inflation as measured by the Consumer Price Index (CPI).
The Rogers International Commodities Index (RICI) was developed by Jim Rogers in 1998. It represents the value of a basket of 35 commodities used in the global economy, including agricultural and energy products, metals, and minerals.
35
36

| |
| |
| Contact Us | |
| americancentury.com | |
| Automated Information Line | 1-800-345-8765 |
| Investment Professional Service Representatives | 1-800-345-6488 |
| Telecommunications Device for the Deaf | 1-800-634-4113 |
| American Century Variable Portfolios II, Inc. | |
| Investment Advisor: | |
| American Century Investment Management, Inc. | |
| Kansas City, Missouri | |
This report and the statements it contains are submitted for the general
information of our shareholders. The report is not authorized for distribution to
prospective investors unless preceded or accompanied by an effective prospectus.
American Century Investment Services, Inc., Distributor
©2010 American Century Proprietary Holdings, Inc. All rights reserved.
1002
CL-ANN-67565
| | |
| ITEM 2. CODE OF ETHICS. |
| (a) | The registrant has adopted a Code of Ethics for Senior Financial Officers that applies to the |
| | registrant’s principal executive officer, principal financial officer, principal accounting officer, |
| | and persons performing similar functions. |
| (b) | No response required. |
| (c) | None. | |
| (d) | None. | |
| (e) | Not applicable. |
| (f) | The registrant’s Code of Ethics for Senior Financial Officers was filed as Exhibit 12 (a)(1) to |
| | American Century Asset Allocation Portfolios, Inc.’s Annual Certified Shareholder Report on |
| | Form N-CSR, File No. 811-21591, on September 29, 2005, and is incorporated herein by |
| | reference. | |
|
| ITEM 3. AUDIT COMMITTEE FINANCIAL EXPERT. |
| (a)(1) | The registrant's board has determined that the registrant has at least one audit committee |
| | financial expert serving on its audit committee. |
| (a)(2) | Peter F. Pervere, Jeanne D. Wohlers and Ronald J. Gilson are the registrant's designated audit |
| | committee financial experts. They are "independent" as defined in Item 3 of Form N-CSR. |
| (a)(3) | Not applicable. |
| (b) | No response required. |
| (c) | No response required. |
| (d) | No response required. |
|
| ITEM 4. PRINCIPAL ACCOUNTANT FEES AND SERVICES. |
| (a) | Audit Fees. | |
| The aggregate fees billed for each of the last two fiscal years for professional services rendered by the |
| principal accountant for the audit of the registrant’s annual financial statements or services that are |
| normally provided by the accountant in connection with statutory and regulatory filings or engagements |
| for those fiscal years were as follows: |
| | FY 2008: | $32,476 |
| | FY 2009: | $27,524 |
| (b) | Audit-Related Fees. |
| The aggregate fees billed in each of the last two fiscal years for assurance and related services by the |
| principal accountant that are reasonably related to the performance of the audit of the registrant’s |
| financial statements and are not reported under paragraph (a) of this Item were as follows: |
| | |
| | For services rendered to the registrant: |
| |
| | FY 2008: | $0 |
| | FY 2009: | $0 |
| |
| | Fees required to be approved pursuant to paragraph (c)(7)(ii) of Rule 2-01 of Regulation S-X |
| | (relating to certain engagements for non-audit services with the registrant’s investment adviser |
| | and its affiliates): |
| |
| | FY 2008: | $0 |
| | FY 2009: | $0 |
| |
| (c) | Tax Fees. | |
| |
| The aggregate fees billed in each of the last two fiscal years for professional services rendered by the |
| principal accountant for tax compliance, tax advice, and tax planning were as follows: |
| |
| | For services rendered to the registrant: |
| |
| | FY 2008: | $0 |
| | FY 2009: | $0 |
| |
| | Fees required to be approved pursuant to paragraph (c)(7)(ii) of Rule 2-01 of Regulation S-X |
| | (relating to certain engagements for non-audit services with the registrant’s investment adviser |
| | and its affiliates): |
| |
| | FY 2008: | $0 |
| | FY 2009: | $0 |
| |
| (d) | All Other Fees. |
| |
| The aggregate fees billed in each of the last two fiscal years for products and services provided by the |
| principal accountant, other than the services reported in paragraphs (a) through (c) of this Item were as |
| follows: | | |
| |
| | For services rendered to the registrant: |
| |
| | FY 2008: | $0 |
| | FY 2009: | $0 |
| |
| | Fees required to be approved pursuant to paragraph (c)(7)(ii) of Rule 2-01 of Regulation S-X |
| | (relating to certain engagements for non-audit services with the registrant’s investment adviser |
| | and its affiliates): |
| |
| | FY 2008: | $0 |
| | FY 2009: | $0 |
| |
| (e)(1) | In accordance with paragraph (c)(7)(i)(A) of Rule 2-01 of Regulation S-X, before the |
| | accountant is engaged by the registrant to render audit or non-audit services, the engagement is |
| | |
| | approved by the registrant’s audit committee. Pursuant to paragraph (c)(7)(ii) of Rule 2-01 of |
| | Regulation S-X, the registrant’s audit committee also pre-approves its accountant’s |
| | engagements for non-audit services with the registrant’s investment adviser, its parent company, |
| | and any entity controlled by, or under common control with the investment adviser that |
| | provides ongoing services to the registrant, if the engagement relates directly to the operations |
| | and financial reporting of the registrant. |
| |
| (e)(2) | All services described in each of paragraphs (b) through (d) of this Item were pre-approved |
| | before the engagement by the registrant’s audit committee pursuant to paragraph (c)(7)(i)(A) |
| | Rule 2-01 of Regulation S-X. Consequently, none of such services were required to be |
| | approved by the audit committee pursuant to paragraph (c)(7)(i)(C). |
| |
| (f) | The percentage of hours expended on the principal accountant’s engagement to audit the |
| | registrant’s financial statements for the most recent fiscal year that were attributed to work |
| | performed by persons other than the principal accountant’s full-time, permanent employees |
| | less than 50%. | |
| |
| (g) | The aggregate non-audit fees billed by the registrant’s accountant for services rendered to the |
| | registrant, and rendered to the registrant’s investment adviser (not including any sub-adviser |
| | whose role is primarily portfolio management and is subcontracted with or overseen by another |
| | investment adviser), and any entity controlling, controlled by, or under common control with |
| | the adviser that provides ongoing services to the registrant for each of the last two fiscal years |
| | of the registrant were as follows: |
| |
| | FY 2008: | $100,922 |
| | FY 2009: | $185,315 |
| |
| (h) | The registrant’s investment adviser and accountant have notified the registrant’s audit |
| | committee of all non-audit services that were rendered by the registrant’s accountant to the |
| | registrant’s investment adviser, its parent company, and any entity controlled by, or under |
| | common control with the investment adviser that provides services to the registrant, which |
| | services were not required to be pre-approved pursuant to paragraph (c)(7)(ii) of Rule 2-01 of |
| | Regulation S-X. The notification provided to the registrant’s audit committee included |
| | sufficient details regarding such services to allow the registrant’s audit committee to consider |
| | the continuing independence of its principal accountant. |
| |
| ITEM 5. AUDIT COMMITTEE OF LISTED REGISTRANTS. |
| |
| Not applicable. | |
| |
| ITEM 6. INVESTMENTS. |
| |
| (a) | The schedule of investments is included as part of the report to stockholders filed under Item |
| | of this Form. | |
| |
| (b) | Not applicable. |
| |
| ITEM 7. DISCLOSURE OF PROXY VOTING POLICIES AND PROCEDURES FOR |
| CLOSED-END MANAGEMENT INVESTMENT COMPANIES. |
| |
| Not applicable. | |
| |
| ITEM 8. PORTFOLIO MANAGERS OF CLOSED-END MANAGEMENT |
| INVESTMENT COMPANIES. |
| |
| Not applicable. |
| |
| ITEM 9. PURCHASES OF EQUITY SECURITIES BY CLOSED-END MANAGEMENT |
| INVESTMENT COMPANY AND AFFILIATED PURCHASERS. |
| |
| Not applicable. |
| |
| ITEM 10. SUBMISSION OF MATTERS TO A VOTE OF SECURITY HOLDERS. |
| |
| During the reporting period, there were no material changes to the procedures by which shareholders may |
| recommend nominees to the registrant’s board. |
| |
| ITEM 11. CONTROLS AND PROCEDURES. |
| |
| (a) | The registrant's principal executive officer and principal financial officer have concluded that |
| | the registrant's disclosure controls and procedures (as defined in Rule 30a-3(c) under the |
| | Investment Company Act of 1940) are effective based on their evaluation of these controls and |
| | procedures as of a date within 90 days of the filing date of this report. |
| |
| (b) | There were no changes in the registrant's internal control over financial reporting (as defined in |
| | Rule 30a-3(d) under the Investment Company Act of 1940) that occurred during the registrant's |
| | second fiscal quarter of the period covered by this report that have materially affected, or are |
| | reasonably likely to materially affect, the registrant's internal control over financial reporting. |
| |
| ITEM 12. EXHIBITS. |
| |
| (a)(1) | Registrant’s Code of Ethics for Senior Financial Officers, which is the subject of the disclosure |
| | required by Item 2 of Form N-CSR, was filed as Exhibit 12(a)(1) to American Century Asset |
| | Allocation Portfolios, Inc.’s Certified Shareholder Report on Form N-CSR, File No. 811-21591, |
| | on September 29, 2005. |
| |
| (a)(2) | Separate certifications by the registrant’s principal executive officer and principal financial |
| | officer, pursuant to Section 302 of the Sarbanes-Oxley Act of 2002 and Rule 30a-2(a) under the |
| | Investment Company Act of 1940, are filed and attached hereto as EX-99.CERT. |
| |
| (a)(3) | Not applicable. |
| |
| (b) | A certification by the registrant’s chief executive officer and chief financial officer, pursuant to |
| | Section 906 of the Sarbanes-Oxley Act of 2002, is furnished and attached hereto as EX- |
| | 99.906CERT. |
SIGNATURES
Pursuant to the requirements of the Securities Exchange Act of 1934 and the Investment Company Act of 1940, the registrant has duly caused this report to be signed on its behalf by the undersigned, thereunto duly authorized.
| | |
| Registrant: | American Century Variable Portfolios II, Inc. |
| |
| By: | /s/ Jonathan S. Thomas |
| | Name: | Jonathan S. Thomas |
| | Title: | President |
| |
| Date: | February 15, 2010 |
Pursuant to the requirements of the Securities Exchange Act of 1934 and the Investment Company Act of 1940, this report has been signed below by the following persons on behalf of the registrant and in the capacities and on the dates indicated.
| | |
| By: | /s/ Jonathan S. Thomas |
| | Name: | Jonathan S. Thomas |
| | Title: | President |
| | | (principal executive officer) |
| |
| Date: | February 15, 2010 |
| | |
| By: | /s/ Robert J. Leach |
| | Name: | Robert J. Leach |
| | Title: | Vice President, Treasurer, and |
| | | Chief Financial Officer |
| | | (principal financial officer) |
| |
| Date: | February 15, 2010 |