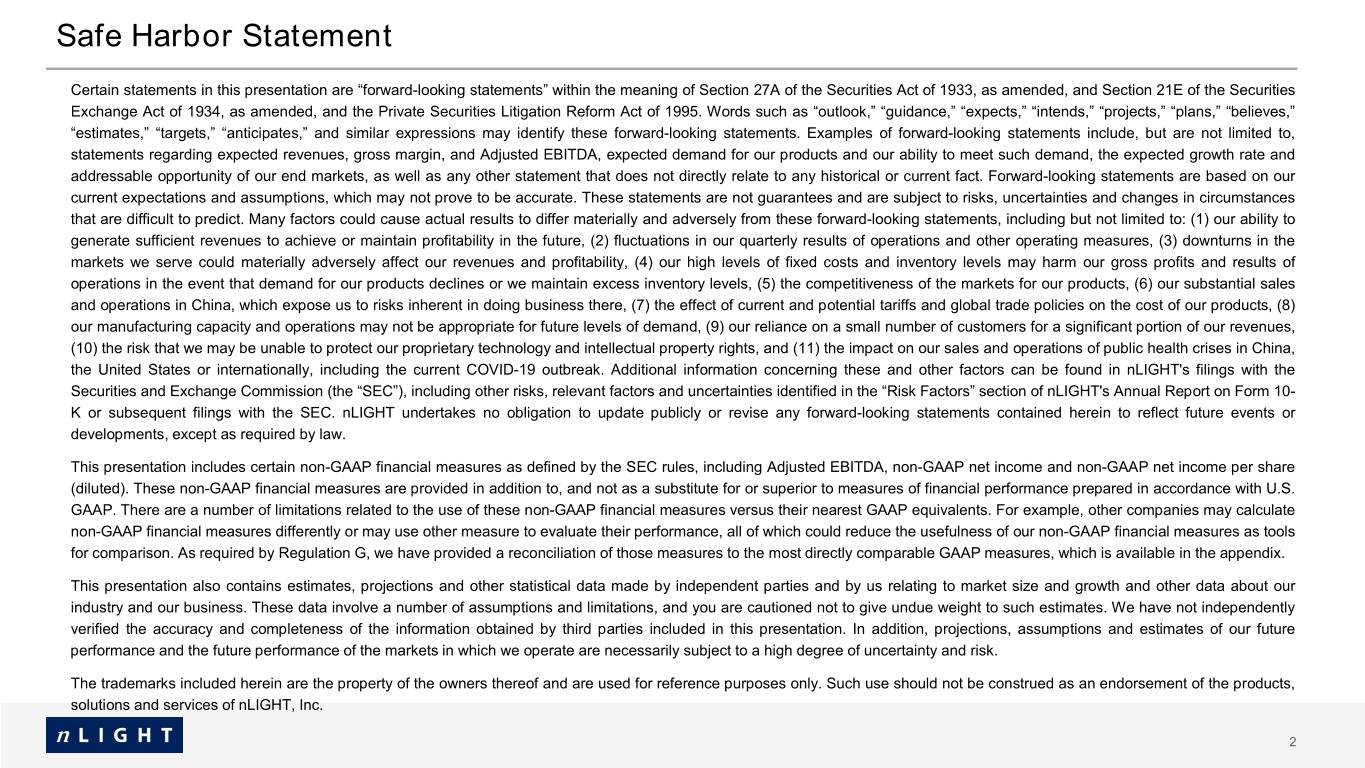
Safe Harbor Statement Certain statements in this presentation are “forward-looking statements” within the meaning of Section 27A of the Securities Act of 1933, as amended, and Section 21E of the Securities Exchange Act of 1934, as amended, and the Private Securities Litigation Reform Act of 1995. Words such as “outlook,” “guidance,” “expects,” “intends,” “projects,” “plans,” “believes,” “estimates,” “targets,” “anticipates,” and similar expressions may identify these forward-looking statements. Examples of forward-looking statements include, but are not limited to, statements regarding expected revenues, gross margin, and Adjusted EBITDA, expected demand for our products and our ability to meet such demand, the expected growth rate and addressable opportunity of our end markets, as well as any other statement that does not directly relate to any historical or current fact. Forward-looking statements are based on our current expectations and assumptions, which may not prove to be accurate. These statements are not guarantees and are subject to risks, uncertainties and changes in circumstances that are difficult to predict. Many factors could cause actual results to differ materially and adversely from these forward-looking statements, including but not limited to: (1) our ability to generate sufficient revenues to achieve or maintain profitability in the future, (2) fluctuations in our quarterly results of operations and other operating measures, (3) downturns in the markets we serve could materially adversely affect our revenues and profitability, (4) our high levels of fixed costs and inventory levels may harm our gross profits and results of operations in the event that demand for our products declines or we maintain excess inventory levels, (5) the competitiveness of the markets for our products, (6) our substantial sales and operations in China, which expose us to risks inherent in doing business there, (7) the effect of current and potential tariffs and global trade policies on the cost of our products, (8) our manufacturing capacity and operations may not be appropriate for future levels of demand, (9) our reliance on a small number of customers for a significant portion of our revenues, (10) the risk that we may be unable to protect our proprietary technology and intellectual property rights, and (11) the impact on our sales and operations of public health crises in China, the United States or internationally, including the current COVID-19 outbreak. Additional information concerning these and other factors can be found in nLIGHT's filings with the Securities and Exchange Commission (the “SEC”), including other risks, relevant factors and uncertainties identified in the “Risk Factors” section of nLIGHT's Annual Report on Form 10- K or subsequent filings with the SEC. nLIGHT undertakes no obligation to update publicly or revise any forward-looking statements contained herein to reflect future events or developments, except as required by law. This presentation includes certain non-GAAP financial measures as defined by the SEC rules, including Adjusted EBITDA, non-GAAP net income and non-GAAP net income per share (diluted). These non-GAAP financial measures are provided in addition to, and not as a substitute for or superior to measures of financial performance prepared in accordance with U.S. GAAP. There are a number of limitations related to the use of these non-GAAP financial measures versus their nearest GAAP equivalents. For example, other companies may calculate non-GAAP financial measures differently or may use other measure to evaluate their performance, all of which could reduce the usefulness of our non-GAAP financial measures as tools for comparison. As required by Regulation G, we have provided a reconciliation of those measures to the most directly comparable GAAP measures, which is available in the appendix. This presentation also contains estimates, projections and other statistical data made by independent parties and by us relating to market size and growth and other data about our industry and our business. These data involve a number of assumptions and limitations, and you are cautioned not to give undue weight to such estimates. We have not independently verified the accuracy and completeness of the information obtained by third parties included in this presentation. In addition, projections, assumptions and estimates of our future performance and the future performance of the markets in which we operate are necessarily subject to a high degree of uncertainty and risk. The trademarks included herein are the property of the owners thereof and are used for reference purposes only. Such use should not be construed as an endorsement of the products, solutions and services of nLIGHT, Inc. 2

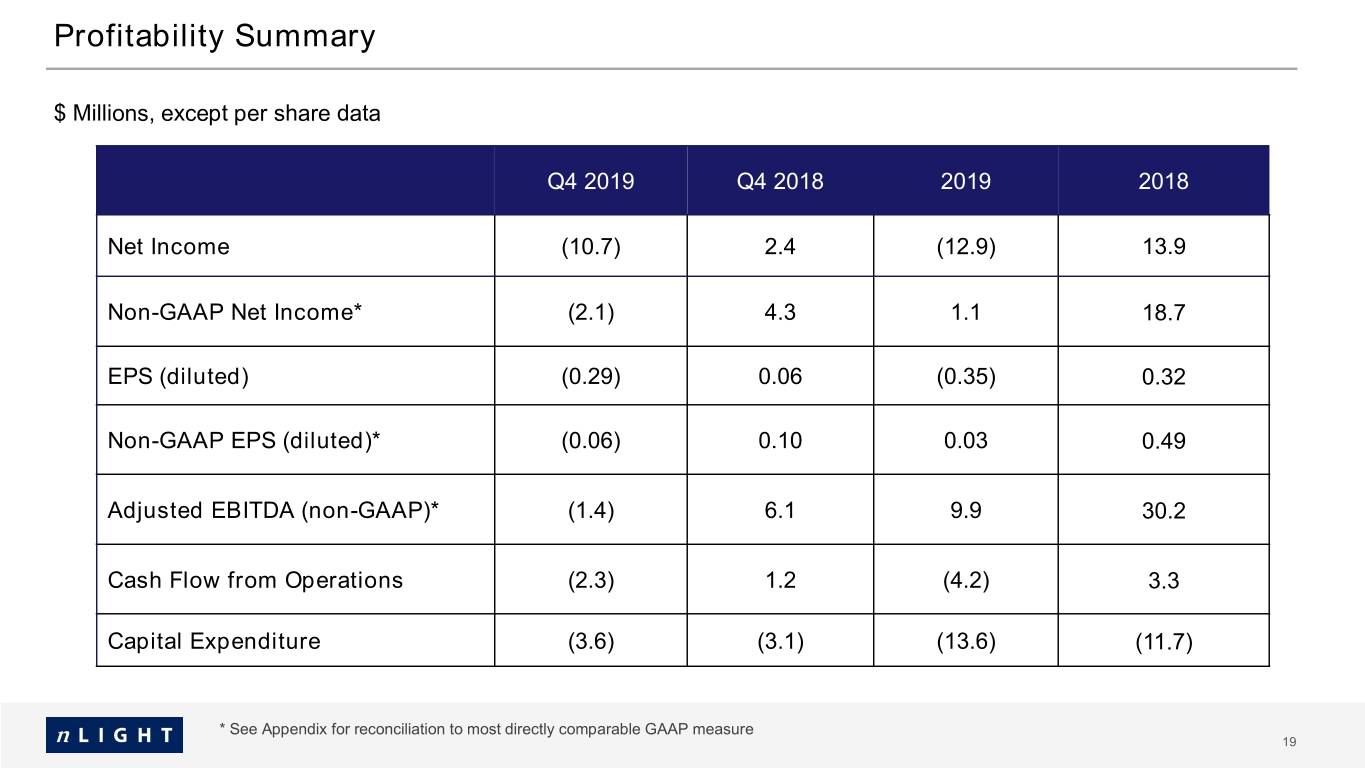
GAAP to Non-GAAP Reconciliation (unaudited, in thousands, except per share data) FY 2016 Q117 Q217 Q317 Q417 FY 2017 Q118 Q218 Q318 Q418 FY 2018 Q119 Q219 Q319 Q419 FY 2019 Stock-based compensation included in following: Cost of revenues 9 6 15 16 46 22 62 183 189 456 209 267 340 385 1,201 Research and development 14 14 18 20 66 25 200 513 555 1,293 558 711 424 1,606 3,299 Sales, general, and administrative 50 55 76 76 257 115 544 1,207 1,190 3,056 1,142 1,403 315 2,370 5,230 Total stock-based compensation 308 73 75 109 112 369 162 806 1,903 1,934 4,805 1,909 2,381 1,079 4,361 9,730 Net income (loss) (14,202) (1,213) (287) 2,244 1,093 1,837 2,916 4,653 4,009 2,360 13,938 (1,235) (155) (778) (10,716) (12,884) Income tax expense 1,882 1,156 1,084 1,236 1,382 4,858 1,149 848 839 764 3,600 1,753 793 837 2,736 6,119 Other (income) expense 753 167 630 1,043 (6) 1,834 (76) 42 537 (250) 253 (820) 907 (90) (532) (535) Interest expense, net 2,229 502 469 76 222 1,269 219 6 (298) (655) (728) (750) (740) (665) (454) (2,609) Depreciation and amortization 8,099 1,950 1,959 1,890 2,123 7,922 1,946 2,172 2,194 1,976 8,288 2,212 2,269 2,313 2,770 9,564 Stock-based compensation 308 73 75 109 112 369 162 806 1,903 1,934 4,805 1,909 2,381 1,079 4,361 9,730 Acquisition and integration-related costs 0 0 0 0 0 0 0 0 0 0 0 0 0 0 470 470 Adjusted EBITDA (931) 2,635 3,930 6,598 4,926 18,089 6,316 8,527 9,184 6,129 30,156 3,069 5,455 2,696 (1,365) 9,855 Net income (loss) (1,213) (287) 2,244 1,093 1,837 2,916 4,653 4,009 2,360 13,938 (1,235) (155) (778) (10,716) (12,884) Add back Stock-based compensation (1) 73 75 109 112 369 162 806 1,903 1,934 4,805 1,909 2,381 1,079 4,361 9,730 Valuation allowance on foreign deferred tax assets 0 0 0 0 0 0 0 0 0 0 0 0 0 3,423 3,423 Acquisition and integration-related costs 0 0 0 0 0 0 0 0 0 0 0 0 0 470 470 Amortization of purchased intangibles 0 0 0 0 0 0 0 0 0 0 0 0 0 328 328 Non-GAAP net income (1,140) (212) 2,353 1,205 2,206 3,078 5,459 5,912 4,294 18,743 674 2,226 301 (2,134) 1,067 GAAP weighted average shares outstanding 2,600 2,626 2,751 2,954 2,735 3,031 24,491 35,007 36,441 24,862 36,694 37,065 37,262 37,463 37,119 Assumed conversion of convertible preferred stock to common stock 19,837 23,044 24,642 24,642 23,095 24,642 7,940 0 0 8,056 0 0 0 0 0 Participating securities 0 0 0 0 0 0 0 0 0 0 0 0 444 0 319 Non-GAAP weighted average number of shares, basic 22,437 25,670 27,393 27,596 25,830 27,673 32,431 35,007 36,441 32,918 36,694 37,065 37,706 37,463 37,438 Dilutive effect of common stock equivalents 0 0 3,115 4,285 3,294 4,492 5,265 5,325 4,798 5,097 4,585 4,391 4,016 0 4,360 Non-GAAP weighted average number of shares, diluted 22,437 25,670 30,508 31,881 29,124 32,165 37,696 40,332 41,239 38,015 41,279 41,456 41,722 37,463 41,798 Non-GAAP net income per share, basic (0.05) (0.01) 0.09 0.04 0.09 0.11 0.17 0.17 0.12 0.57 0.02 0.06 0.01 (0.06) 0.03 Non-GAAP net income per share, diluted (0.05) (0.01) 0.08 0.04 0.08 0.10 0.14 0.15 0.10 0.49 0.02 0.05 0.01 (0.06) 0.03 (1) There is no income tax effect related to the stock-based compensation adjustment due to the full valuation allowance in the U.S. 24


